How block density and typology affect urban vitality: an ...
23
Full Terms & Conditions of access and use can be found at http://www.tandfonline.com/action/journalInformation?journalCode=rurb20 Download by: [University of Hong Kong Libraries] Date: 26 September 2017, At: 04:35 Urban Geography ISSN: 0272-3638 (Print) 1938-2847 (Online) Journal homepage: http://www.tandfonline.com/loi/rurb20 How block density and typology affect urban vitality: an exploratory analysis in Shenzhen, China Yu Ye, Dong Li & Xingjian Liu To cite this article: Yu Ye, Dong Li & Xingjian Liu (2017): How block density and typology affect urban vitality: an exploratory analysis in Shenzhen, China, Urban Geography, DOI: 10.1080/02723638.2017.1381536 To link to this article: http://dx.doi.org/10.1080/02723638.2017.1381536 Published online: 26 Sep 2017. Submit your article to this journal View related articles View Crossmark data
Transcript of How block density and typology affect urban vitality: an ...

Full Terms & Conditions of access and use can be found athttp://www.tandfonline.com/action/journalInformation?journalCode=rurb20
Download by: [University of Hong Kong Libraries] Date: 26 September 2017, At: 04:35
Urban Geography
ISSN: 0272-3638 (Print) 1938-2847 (Online) Journal homepage: http://www.tandfonline.com/loi/rurb20
How block density and typology affect urbanvitality: an exploratory analysis in Shenzhen, China
Yu Ye, Dong Li & Xingjian Liu
To cite this article: Yu Ye, Dong Li & Xingjian Liu (2017): How block density and typologyaffect urban vitality: an exploratory analysis in Shenzhen, China, Urban Geography, DOI:10.1080/02723638.2017.1381536
To link to this article: http://dx.doi.org/10.1080/02723638.2017.1381536
Published online: 26 Sep 2017.
Submit your article to this journal
View related articles
View Crossmark data

How block density and typology affect urban vitality: anexploratory analysis in Shenzhen, ChinaYu Yea, Dong Lib and Xingjian Liuc
aDepartment of Architecture, College of Architecture and Urban Planning, Tongji University, Shanghai,China; bTsinghua Tongheng Urban Planning & Design Institute, Beijing, China; cDepartment of UrbanPlanning & Design, Faculty of Architecture, The University of Hong Kong, Hong Kong SAR, China
ABSTRACTRecent urban transformations in China have led to critical reflec-tions on the low-quality urban expansion in the previous decadesand called for the making of vital and lively urban places. To date,limited research has been devoted to empirically testing the rela-tionship between urban design, urban morphology, and urbanvitality in Chinese cities. This paper employs new urban data andanalytical methods and explores the relationship between urbanmorphology and urban vitality using regression models. Shenzhen,one of the largest and fastest growing cities in China, is selected asthe case study. The regression analysis focuses on two morpholo-gical factors, density and typology, while controlling for the acces-sibility, functional mix, and size of individual blocks. The presenceof small catering businesses is used as a proxy for urban vitality.The analysis suggests that both typology and density matter forurban vitality, with typology playing a more important role. Morespecifically, “block” and “strip” types tend to show significantpositive effects on urban vitality. The implications for urban plan-ning and design practices are discussed.
ARTICLE HISTORYReceived 30 December 2016Accepted 5 September 2017
KEYWORDSMorphological categories;urban vitality; urban design;open data; China
1. Introduction
Jane Jacobs’s (1961) notions about urban vitality and diversity were less of a concern forurban planning and design in China before the 2000s, as the country’s urbanization waslargely characterized by rapid and oftentimes low-quality urban expansion. Recentchanges have led to critical reflections on the urban expansion in the previous decadesand called for the making of vital and lively urban places (Den Hartog, 2010). Forexample, with rising income levels and increasing demands for liveability, the publicstarts to pay more attention to the quality of urban space. Place-making thereforebecomes a hotly debated issue in China (Campanella, 2012; Ye & Zhuang, 2017).Still, the needs for revitalizing old neighborhoods, factories, and villages becomeapparent (Lin, 2015), driven by government policies targeting at stricter land usecontrols, increasing land-related disputes, as well as the restructuring of the Chineseeconomy. Relatedly, the latest National New-Type Urbanization Plan of China
CONTACT Xingjian Liu [email protected] Department of Urban Planning and Design, The University of Hong Kong,Hong Kong SAR
URBAN GEOGRAPHY, 2017https://doi.org/10.1080/02723638.2017.1381536
© 2017 Informa UK Limited, trading as Taylor & Francis Group
Dow
nloa
ded
by [
Uni
vers
ity o
f H
ong
Kon
g L
ibra
ries
] at
04:
35 2
6 Se
ptem
ber
2017

emphasizes the “people-oriented approach”, quality of life, and urban sustainability(Wang, Hui, Choguill, & Jia, 2015). This transformation requires planners anddesigners to play a more active role in improving the quality of the built environmentand inducing urban vitality. Urban design needs to assure that urban composition notonly functions properly but is also pleasing in its appearance (Buchanan, 1988;Madanipour, 1996). In other words, for designers and planners, life in a diverse andmulti-functional city should be considered a fundamental requirement rather than aluxury.
This increasing interest in urban design requires a deeper understanding of urbanmorphology. While the conventional approach to analyzing urban morphology is usefulfor in-depth studies of individual sites, collecting city-wide information about urbanmorphology and related urban vitality measures is usually difficult. Many existingattempts to connect urban analytics and design have been less well-received bydesigners (Ye, Yeh, Zhuang, Van Nes, & Liu, 2017), while Stanilov (2010) and Karimi(2012) have called for new analytical processes that bring together the art and science inurban design. More efforts are therefore needed to empirically explore the link betweenurban morphology and urban design (Marshall & Caliskan, 2011). Last but not the least,existing studies have largely been developed in cities in traditional market economies,entailing different dynamics between the state, market, and society (De Nadai et al.,2016; Sung, Lee, & Cheon, 2015). A case study in China would not only test designtheories developed in other contexts, but may also serve as a “laboratory” to providenuanced understandings of urbanization in emerging economies (Bertaud, 2012; Wu,2016).
This study therefore aims to (1) identify typical morphological categories of buildingdensity and typology through a city-wide analysis, and subsequently (2) explore therelationship between these morphological categories (e.g., building typology and den-sity) and urban vitality. More specifically, we develop a quantitative approach to urbanmorphology using open geospatial data and new morphological analytics. Urban vitalityis measured based on the presence of small catering businesses. The study focuses onShenzhen, one of the largest and fastest growing cities in China. This paper hopes toclose a gap in the literature and provide useful information for urban design andplanning practice in China. Relevant studies are reviewed in the next section, whichis followed by a summary of data and methods. The result section identifies morpho-logical categories of building density and typology, and presents a regression analysis ofthe relationship between morphological categories and the distribution of small cateringvenues. The paper concludes with implications for planning and design practice as wellas avenues for future research.
2. A review of relevant concepts and studies
2.1. Urban morphology, design, and vitality
Urban morphology concerns the physical aspects of the built environment, i.e., keyelements such as streets, blocks, plots and buildings as well as the transformativeprocesses that shape these key elements (Larkham & Jones, 1991; Oliveira, 2016). Inother words, urban morphology can be regarded as an analytical abstraction of the
2 Y. YE ET AL.
Dow
nloa
ded
by [
Uni
vers
ity o
f H
ong
Kon
g L
ibra
ries
] at
04:
35 2
6 Se
ptem
ber
2017
form, structure, and evolution of the built environment (Kropf, 2017). As a design effortto analyze, organize, and shape urban form and related functions for lively urban places,urban design is closely related to urban morphology (Rowley, 1994). Although urbandesign concerns more than morphological aspects, these two fields speak the samelanguage about the essential components of desirable urban form (Hall, 2013). In thisregard, an incisive understanding of urban morphology will help producing good urbandesign (Marshall & Caliskan, 2011).
Urban vitality usually refers to the capacity of a place to induce lively social andeconomic activities (Jacobs, 1961). We note that it is difficult to capture the rich meaningsof urban vitality in specific measures. On the one hand, Wirth’s (1938, p. 9) deemedurbanism a social life supported by the gathering of “size, density and heterogeneity ofpeople”. Urban vitality is socially constructed in the sense that it depends on thegathering of people. On the other hand, as Lefebvre (1968) claimed, the “urban” is theimmaterial city life of diversity, vitality and attractiveness, which are in turn dependent onphysical entities of urban form, i.e., the built environment. Put differently, urban vitalityis a social process that has strong ties with urban form (Lees, 2010; Marcus, 2010;Oliveira, 2013). Therefore, our analysis focuses on how morphological features helpcreating this kind of diverse and vibrant urban lives.
As an essential goal of urban design, promoting urban vitality from a morphologicalperspective has been discussed in many design theories. In these discussions, streetaccessibility, building density and typology, and diversity are frequently highlighted asimportant physical underpinnings of urban vitality. The density dimension focuses onthe compactness and concentration in urban form, such as plot ratio. The typologydimension is related to building coverage and footprints within individual blocks, e.g.,point, strip, and block types.
Taking Jacobs’ (1961) view as an example, “the dense concentration of people”requires both street accessibility and building density. “Short blocks” help creating apermeable public realm, improving accessibility, and providing space for interactionsand activities. “Mixed-uses” and “buildings of varied age and condition” reflect func-tional mixture within individual street blocks. Put differently, higher levels of streetaccessibility, building density, and functional mixture seem to be conducive to vibranturban lives. Montgomery (1998) emphasized the importance of “development intensity”as a driver of vibrant urban life. Still, highlighting adaptability, human scale, city blocksand permeability in his studies, Montgomery suggested that strip or block typologiestend to foster interactions between buildings and street activities. His other principlesregarding “fine grain”, “street contact”, and “mixed-use” also pointed to the importanceof accessibility and functional diversity. Similarly, Gehl (1971) argued for high levels ofaccessibility, density and building coverage in his Copenhagen study. Similar sugges-tions can be found in New Urbanism design guidelines beyond the European context,which highlight pedestrian-oriented streets, appropriate density, and mixed use (Katz,Scully, & Bressi, 1994). While these principles are intuitive and easy to be implementedin practice, there seems to be a lack of large-scale and quantitative evaluations regardingwhether and to what extend the identified factors contribute to urban vitality (Sunget al., 2015). Existing approaches to evaluating these principles are oftentimes qualita-tive and limited to small scale. This may be due to the difficulty of collecting detailed
URBAN GEOGRAPHY 3
Dow
nloa
ded
by [
Uni
vers
ity o
f H
ong
Kon
g L
ibra
ries
] at
04:
35 2
6 Se
ptem
ber
2017
quantitative information about urban morphology and related urban vitality measuresat the city-scale.
2.2. Small catering businesses as an indicator of urban vitality
Small catering businesses can be reasonably deemed “indicator businesses” for vibranturban places, although they do not in and by themselves reflect all dimensions of urbanvitality. In other words, urban places tend to be more vibrant where small cateringbusinesses flourish. Just as the vitality of a habitat can be evaluated based on “indicatorspecies”, the vitality of an urban place can be gauged via “indicator businesses”. In herwork on local streets and urbanism, Zukin (2010) highlighted small catering businesses’role as an essential element of “authentic” urban life and an indicator of a place’sattractiveness. On the one hand, the survival of small catering businesses depends onpedestrian flows and intensive urban activities, and therefore small catering businessestend to locate in accessible places with dense and diverse gatherings of people (Philipsen,2015). On the other hand, places that satisfy small catering services’ locational needs tendto promote encountering, walking, resting, and other leisure activities. Furthermore,unlike fine dining restaurants and department stores that become attraction points,small catering businesses are often too small to (re)shape their surrounding built envir-onment and thus reflect existing urban vitality. By contrast, the locational choices of largecatering enterprises are often affected by market and symbolic reasons, making them lessappropriate to serve as an indicator of urban vitality. Still, the turnover rate of smallcatering services is usually higher than their larger counterparts. The distribution of smallcatering businesses may therefore be seen as an up-to-date reflection of urban vitality. Putdifferently, the distribution of small catering businesses can be valuable for understandingthe social performance of urban form, as the pattern emerges through the actions of self-motivated people, i.e., business owners and the public.
Empirically, several studies have compared urban vitality and the distribution ofsmall catering businesses, suggesting that the latter can used as a proxy for the former(Joosten & Van Nes, 2005; Van Nes, 2005). However, these studies are often done in aqualitative, manual manner. There still lacks large-scale and systematic studies toquantitatively reveal the relationships between urban vitality and the physical aspectsof the built environment. City-wide mapping is usually time-consuming and difficult tobe applied extensively. The emergence of new urban data opens new opportunities ofgathering large-scale and fine-grained datasets. This transformation contributes alter-native data sources for exploring the social performance of urban form and providingrecommendations for urban design.
2.3. New urban data for morphological analysis
Many conventional urban morphological analyses focus on small-scale (historical)districts and traditional architecture typologies (Jin, 1993; Whitehand & Gu, 2006;Whitehand, Gu, Whitehand, & Zhang, 2011). Several typo-morphological studies link-ing urban morphology with urban design are qualitative in general (Chen & Thwaites,2013; Samuels, 1999). Attempts have also been made from a geographical modellingperspective (Chen & Wang, 2013). However, there still lack actionable and quantitative
4 Y. YE ET AL.
Dow
nloa
ded
by [
Uni
vers
ity o
f H
ong
Kon
g L
ibra
ries
] at
04:
35 2
6 Se
ptem
ber
2017

insights for urban design practices, thus calling for the introduction of new techniquesand methods in urban morphology (Samuels, 2013).
The emerging urban data environment opens new possibilities of quantitative andsystematic studies of urban morphology (Liu et al., 2015). With the rapid developmentin information and communication technologies (ICTs), volunteered geographic dataabout urban form and function are generated at high spatial and temporal resolutions(Liu et al., 2015). For instance, OpenStreetMap (OSM) provides open informationabout buildings and street blocks for large geographic areas and with high spatialaccuracy (Haklay, 2010). In addition, Points of Interest (PoIs) and check-in data fromsocial media platforms provide new ways of gauging how people feel, like, and useurban places (Cheng, Caverlee, Lee, & Sui, 2011). The new data environment helps togather information about urban form and function in a relatively automatic, accurateand consistent manner (Batty, 2013). Meanwhile, new morphological tools emerge withthe use of GIS in urban design. For example, the combination of GIS and new tools inurban morphology, such as Space Syntax and Spacematrix, helps quantifying designconcepts such as accessibility, density, and typology (Berghauser-Pont & Haupt, 2010;Hillier, Penn, Hanson, Grajewski, & Xu, 1993). The integration of new datasets andtools provides a solid foundation for large-scale, in-depth morphological studies(Oliveira & Medeiros, 2016). In addition, there is an increasing scholarly interest inintroducing new quantitative thinking into the studies of urban form and urban design.This is reflected in a series of recent studies that apply geo-referenced big data to verifyclassical urban design theories (De Nadai et al., 2016; Sung et al., 2015). These newmethods are design-oriented and thus able to analyze urban form from designers’viewpoints. This paper therefore can be seen as a response to this rising trend ofquantitative analyses in urban design.
3. Data and methods
3.1. Study area
Our analysis focuses on Shenzhen, one of the largest and fastest growing cities in China.When Shenzhen was established as a special economic zone (SEZ) to attract foreigninvestments in the late 1970s, it was a border town with a small population (Hao,Sliuzas, & Geertman, 2011). The number of residents has since increased by more thanforty times, and Shenzhen has become a megacity of 14 million residents (Zacharias &Tang, 2010). Shenzhen is a good window on contemporary urban form in China, as theentire city was built from scratch in the past four decades (Figure 1). The city hasaccumulated various urban forms that are typical in post-reform China, e.g., urbanvillages and gated residential neighborhoods (Den Hartog, 2010; Gu, 2001; Keeton,2011; Liu, He, Wu, & Webster, 2010). This echoes Zhong’s (2013, p. 216) observationthat “Shenzhen, as a vanguard in reform and opening up, epitomizes the present andfuture of the whole country, as vividly articulated in the popular saying, ‘Shenzhentoday is the inland areas tomorrow’”.
The urban built-up area has expanded significantly to accommodate the rapidpopulation growth (Figure 1). Shenzhen consists of four inner-city (Luohu, Futian,Yantian, and Nanshan) and two outlying districts (Baoan and Longgang). Luohu and
URBAN GEOGRAPHY 5
Dow
nloa
ded
by [
Uni
vers
ity o
f H
ong
Kon
g L
ibra
ries
] at
04:
35 2
6 Se
ptem
ber
2017

Futian districts are selected as the sites of analysis for the following reasons. First, thesetwo districts were part of the initial special economic zone and have undergone thelongest development process, thus containing most urban morphological categories.Second, geospatial data such as Points of Interest are more readily available in inner-city districts, such as Luohu and Futian, at higher geographical and thematic resolu-tions. The total size of these two districts is 157 km2, which is well beyond the scope ofconventional urban morphological studies.
3.2. Methodology
This study develops a large-scale, quantitative approach to understanding the relation-ship between urban form and vitality. Our approach involves the following major steps(Figure 2). We will firstly identify typical morphological categories of buildings and
Figure 1. Shenzhen and its rapid urban growth in the past four decades.
6 Y. YE ET AL.
Dow
nloa
ded
by [
Uni
vers
ity o
f H
ong
Kon
g L
ibra
ries
] at
04:
35 2
6 Se
ptem
ber
2017

blocks, which are the key independent variables in our analysis. A second step willproduce additional urban form measures, such as street accessibility and functionalmixture, which will be used as control variables. We then perform a regression analysiswith the distribution of small catering businesses as the dependent variable. The unitsof our analysis are individual street blocks.
3.2.1. Identifying typical morphological categories of buildingsWe employ Spacematrix (Berghauser-Pont & Haupt, 2010; Steadman, 2014) to identifytypical morphological categories of buildings and blocks. The categorization processfocuses on the density and typology of individual blocks, and as discussed, the units ofanalysis are individual street blocks. The categorization in Spacematrix considers bothbuilding density and typology, while many previous studies only reveal one of these twodimensions (Berghauser-Pont & Haupt, 2007; Lozano, 1990). Our analysis uses threeSpacematrix measures: floor space index (FSI), ground space index (GSI) and height(L). FSI, more commonly known as floor area ratio or plot ratio, reflects the buildingdensity of a block. FSI is calculated as the ratio of gross floor area to building footprint.
FSIX ¼ Fx=Ax
Where Fx and Ax denote the gross floor area (m2) and gross area (m2) of individualstreet blocks, respectively
GSI concersn about building typology and reflects the relationship between built andnon-built area within individual blocks. GSI is calculated as follows.
GSIX ¼ Bx=Ax
Where Bx and Ax denote the gross building footprint (m2) and gross area (m2) ofindividual street blocks, respectively.
L is calculated as the ratio of FSI to GSI and indicates the average height of buildingswithin a block. We note that L is different from a simple average of individual buildings’number of floors, as it is weighted based on the footprints of individual buildings. Along thedensity dimension, we classify individual blocks into low-rise, medium-rise, or high-risebased on their L values. Individual blocks with an L value greater than 7 are classified as
Figure 2. The analytical framework.
URBAN GEOGRAPHY 7
Dow
nloa
ded
by [
Uni
vers
ity o
f H
ong
Kon
g L
ibra
ries
] at
04:
35 2
6 Se
ptem
ber
2017

high-rise, those with an L-value lower than 3 as low-rise, and the rest asmedium-rise. High-rise blocks are usually associated with office buildings and apartment towers, while blockswith low L-values are often characterized by single/two-storey apartments, villas, andprimary/secondary schools. This classification of high-, medium-, and low- rise is basedon current building regulations in China.
As for building typology, a street block can be categorized as having point, strip, orblock buildings based on the corresponding GSI values. More specifically, blocks withGSI scores smaller than 0.2 are categorized as “point”-type, those with a GSI between0.2 and 0.36 as “strip”-type, and the remaining as “block”-type. While these empiricalvalues are derived based on urban form mapping in the European context (Berghauser-Pont & Haupt, 2010), they are applied here as the definitions of point, strip, and blocktypes are similar in Europe and China (Ye & Zhuang, 2017). “Point”-type blocks oftenrepresent large parcels with scattered buildings, such as an urban park with severalservice and utility buildings. “Strip”-type blocks are usually characterized by rows ofapartment buildings as well as other slab-shaped buildings. Built-up areas occupy asignificant portion in “block”-type blocks, which can be commonly seen in stadium,exhibition centers, urban villages, and office complexes (See Figure 3 for more examplesof individual types in the study area).
Putting the density and building typology dimensions together, we arrive at a three-by-three categorization of street blocks, i.e., a total of nine categories. We note thatconventional urban morphological studies may or may not adopt similar definitions, asthe morphological classification of building types used in our study is relatively new (Ye& Zhuang, 2017).
3.2.2. Calculating other related morphological elements as control variablesOur analysis will control for street accessibility and functional mixture, which havebeen highlighted in existing urban design theories as important physical underpinningsof urban vitality (Ye & Van Nes, 2013). In addition, the size of individual blocksincluded as a control variable.
We employ Space Syntax to assess the accessibility of individual blocks (Griffiths,Jones, Vaughan, & Haklay, 2010; Hillier et al., 1993). More specifically, we use thespatial design network analysis (sDNA) tool to operationalize the Choice concept inSpace Syntax. Choice reflects the potentials of “through-movements”, i.e., the poten-tial of individual street segments to be selected by pedestrians or drivers as the path(Al_Sayed, Turner, Hillier, Iida, & Penn, 2014). Following previous empirical studies(Cooper, 2013), the analytical radius in sDNA is set as 800 meters, corresponding tothe normal walking distance. The sDNA measure of Choice, or “betweenness” insDNA’s term, is used to characterize the accessibility of individual streets. As sDNAmeasures are for individual streets, the accessibility of individual blocks is calculatedas the weighted sum of the accessibility of nearby streets. The weights are deter-mined based on three factors: the length of individual street segments (Li), theEuclidian distance between street segments and the block under investigation(Di), and the distance decay factor (α).
8 Y. YE ET AL.
Dow
nloa
ded
by [
Uni
vers
ity o
f H
ong
Kon
g L
ibra
ries
] at
04:
35 2
6 Se
ptem
ber
2017

ACb ¼Xn
i¼1
ACsLi=Dα
iPni¼1 Li =D
αi
Where ACb denotes the accessibility of a block, ACs is the measure of “Choice” forindividual streets that are within 800 meters of the block under investigation,Li represents the length of individual streets, Di is the Euclidian distance from streetcentral lines to the block’s edge, and α indicates the distance decay parameter, which isset to 2 according to Ye (2015). Streets with higher ACb scores are more accessible andtend to be more frequently used by pedestrians, while dead end streets and cul-de-secsare usually associated with lower ACb scores (Ye & Van Nes, 2013).
Functional mixture or diversity (Van Den Hoek, 2009) is measured as the composi-tion of urban functions within individual blocks. This composition is approximatedbased on the floor area of individual functions. Our analysis accounts for four majoruses of the urban space, i.e., housing, office, commercial, and public space. Housing
Figure 3. Datasets used in this study
URBAN GEOGRAPHY 9
Dow
nloa
ded
by [
Uni
vers
ity o
f H
ong
Kon
g L
ibra
ries
] at
04:
35 2
6 Se
ptem
ber
2017

space includes various buildings for residential use, such as apartments, condominiums,and townhouses. Office space includes offices, workshops, and laboratories. Space forpublic use covers hospitals, concert halls, museums, and schools. Commercial space inour study mainly includes shopping centers and retail facilities. Our measure offunctional mixture applies the Shannon entropy function (Shannon, 1948) and iscalculated as follows.
MIX ¼ �Xn
i¼1
Pi lnPi
Where Pi is the proportion of the ith functional type, i.e., Phousing, Poffice, Ppublic andPcommerical within the total gross floor area of a street block. A larger MIX value suggestshigher level of mixed use, and vice versa.
3.2.3. A statistical analysis of the relationship between morphological categoriesand urban vitalityWe measure urban vitality based on the number of small catering businesses withinindividual blocks. A regression model is subsequently constructed to explore therelationship between morphological categories and urban vitality. The regressionmodel helps to assess the extent to which the dependent variable, i.e., the number ofsmall catering businesses, is associated with independent variables, i.e. morphologicalcategories (Neter, Kutner, Nachtsheim, & Wasserman, 1996). A conventional linearregression assumes the dependent variable to be normally distributed. However, thismight not be the case for our analysis. The dependent variable, the number of smallcatering businesses, is count data. As count data can only take non-negative values, theydo not necessarily follow a normal distribution. In such case, linear regression cannotbe applied (Cameron & Trivedi, 2013). Descriptive statistics also confirm that thedependent variable is over-dispersed as the conditional variance exceeds the conditionalmean. We therefore employ a negative binomial regression which is suitable for theanalysis of count data (Hilbe, 2011). FSI, GSI, block size, street accessibility, andfunctional mixture are included as independent variables. A second regression modelis performed with FSI and GSI replaced by individual morphological categories. In thissecond regression, the high-rise block is used as the dropped variable, and the remain-ing eight morphological categories are represented by dummy variables.
3.3. Data
Our analysis synthesizes information from a variety of sources (Figure 4). First, basicdatasets regarding building functions, floor area, and footprints are gathered fromShenzhen Planning Bureau. Street networks are obtained from OpenStreetNetwork(OSM) and official road network survey. The quality of OSM data for major cities inChina is relatively robust and the dataset has been applied to characterize urban formand function (e.g., Liu & Long, 2016). Second, street blocks are the units of analysis andgenerated based on street network and land use plans. Due to the tradition of func-tionalism planning in China, certain street blocks are large “superblocks” containingmultiple functions and different morphologies. Therefore, a pre-processing is
10 Y. YE ET AL.
Dow
nloa
ded
by [
Uni
vers
ity o
f H
ong
Kon
g L
ibra
ries
] at
04:
35 2
6 Se
ptem
ber
2017

performed to divide “superblocks” into individual parcels with similar function andmorphological categories (Figure 4). Third, Points-of-Interest data are crawled from theDianping website, which is the largest Chinese online catalogue for restaurants (i.e., theChinese equivalent of Yelp). Dianping has categorized all PoIs into twenty-two cate-gories. Our analysis adopts Dianping’s categorization and focuses on four main cate-gories of small catering venues: snack store, fast food, tea house/cafe, and bakery. Whilewe acknowledge that Dianping data do not necessarily account for all existing smallcatering venues and that there might be mis-categorization of certain businesses, PoIsfrom Dianping have been proved useful in understanding urban geography of Chinesecities (Yuan et al., 2013). After excluding large catering chains and PoIs located outsidethe study area, we include 15,532 geotagged PoIs in subsequent analysis.
4. Results
4.1. Overview
The analysis identifies nine typical morphological categories, ranging from low-risepoint to high-rise block types (Figure 5). In the upper half of Figure 5, individualblocks are color-coded according to their morphological categories. In the lowerhalf of Figure 5, each point represents a street block, with the same color schemeas the upper half of the figure. Individual points are plotted with their FSI and GSIas coordinates. We also plot the “mean centers” of individual morphologicalcategories by averaging the FSI and GSI measures of all blocks of the samemorphological categories. The “mean centers” of individual categories are markedby their corresponding letter codes. Type A (low-rise point), type B (low-risestrip), and type D (mid-rise point) are less common, with 3.8%, 1.1%, and 1.3%of the blocks classified as these categories, respectively. Due to the planning anddevelopment policies that favor high density, it is hard to find either low-densityor point building types in the centers of Chinese cities. Most type A and type Dblocks are urban parks. The other six types are more commonly seen. Morespecifically, most type C (low-rise block) blocks are exhibition centers and malls.
Figure 4. A pre-processing of the street block dataset to divide superblocks into parcels.
URBAN GEOGRAPHY 11
Dow
nloa
ded
by [
Uni
vers
ity o
f H
ong
Kon
g L
ibra
ries
] at
04:
35 2
6 Se
ptem
ber
2017

Street blocks that are classified as type E (mid-rise strip) and type H (high-risestrip) are mostly residential neighborhoods. Type I (high-rise blocks) are usuallyfound in large urban complexes with integrated residential and commercial devel-opment. Figure 6 presents specific examples of individual types in the study area.
Our analysis suggests a sizeable presence of category F (mid-rise block), whichaccounts for 13.2% of all blocks (Figure 6). Under the current building regulations ofChina, this morphological category of “mid-rise block” cannot be built in the first placeand is technically “illegal”, due to sun rights and building interval considerations. Mosttype F blocks are associated with urban villages (i.e., villages-in-the-city or chengzhong-cun), which emerged when rural villages are spatially encompassed by the expandingurban areas (Hao et al., 2011). The mid-rise block type is widely used in urban villagesto increase total floor space. The administrative status and land use rights of thesevillages often remain ambiguous, thus allowing for constructions that do not necessarilyfollow building regulations.
Figure 5. Identified morphological categories for individual blocks (Blocks with no buildings aremarked as grey).
12 Y. YE ET AL.
Dow
nloa
ded
by [
Uni
vers
ity o
f H
ong
Kon
g L
ibra
ries
] at
04:
35 2
6 Se
ptem
ber
2017

4.2. Evaluating the impacts of building density and typology on the distributionof small catering venues
In the upper half of Figure 7, individual blocks are color-coded based on the number ofsmall catering business therein. In the lower half of Figure 7, each point represents astreet block, with the same color scheme as the upper half of the figure. Individual
Figure 6. Nine typical morphological categories in the study area (The bar chart represents theproportion of street blocks classified with individual morphological categories).
URBAN GEOGRAPHY 13
Dow
nloa
ded
by [
Uni
vers
ity o
f H
ong
Kon
g L
ibra
ries
] at
04:
35 2
6 Se
ptem
ber
2017

points are plotted with their FSI and GSI as coordinates. We can see that urban vitalitytends to increase along with the increases in FSI and GSI. In other words, blocks withmore small catering businesses tend to be found in the upper-right corner of thisscatterplot.
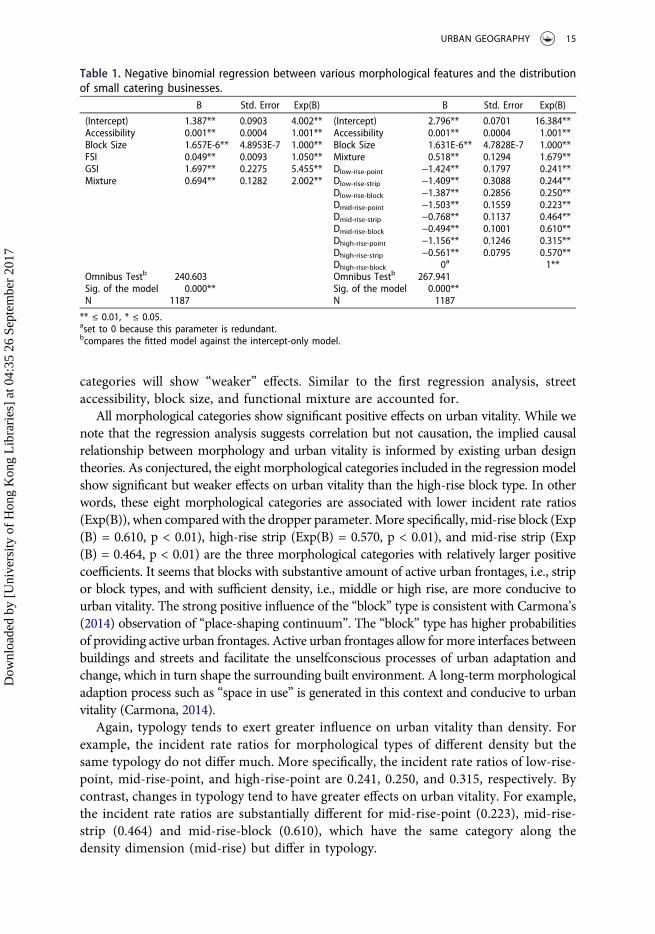
Our regression results are reported in Table 1. We use regression coefficients (B) andincident rate ratio (Exp(B)) to measure the relative impacts of density (FSI) andtypology (GSI) on urban vitality. A larger coefficient or incident rate ratios implies astronger impact, and vice versa. Our model controls for street accessibility, block sizeand functional mixture. The coefficients for all independent variables are statisticallysignificant at the 0.01 level. The incident rate ratios of FSI and GSI are 1.050 and 5.455,respectively. In other words, building typology tends to exert greater influence on urbanvitality than building density, ceteris paribus. Meanwhile, functional mixture is asso-ciated with a larger regression coefficient than street accessibility and block size.
Table 1 also summarizes the association between various morphological categoriesand urban vitality. As mentioned, the high-rise block is set as the dropped parameter inthe second regression. Considering that the high-rise block category is associated withhigh urban vitality in existing urban design theories, we conjecture that the remaining
Figure 7. Typical morphological categories containing different building density and typology andcorresponding degrees of urban vitality.
14 Y. YE ET AL.
Dow
nloa
ded
by [
Uni
vers
ity o
f H
ong
Kon
g L
ibra
ries
] at
04:
35 2
6 Se
ptem
ber
2017
categories will show “weaker” effects. Similar to the first regression analysis, streetaccessibility, block size, and functional mixture are accounted for.
All morphological categories show significant positive effects on urban vitality. While wenote that the regression analysis suggests correlation but not causation, the implied causalrelationship between morphology and urban vitality is informed by existing urban designtheories. As conjectured, the eight morphological categories included in the regressionmodelshow significant but weaker effects on urban vitality than the high-rise block type. In otherwords, these eight morphological categories are associated with lower incident rate ratios(Exp(B)), when comparedwith the dropper parameter.More specifically, mid-rise block (Exp(B) = 0.610, p < 0.01), high-rise strip (Exp(B) = 0.570, p < 0.01), and mid-rise strip (Exp(B) = 0.464, p < 0.01) are the three morphological categories with relatively larger positivecoefficients. It seems that blocks with substantive amount of active urban frontages, i.e., stripor block types, and with sufficient density, i.e., middle or high rise, are more conducive tourban vitality. The strong positive influence of the “block” type is consistent with Carmona’s(2014) observation of “place-shaping continuum”. The “block” type has higher probabilitiesof providing active urban frontages. Active urban frontages allow formore interfaces betweenbuildings and streets and facilitate the unselfconscious processes of urban adaptation andchange, which in turn shape the surrounding built environment. A long-termmorphologicaladaption process such as “space in use” is generated in this context and conducive to urbanvitality (Carmona, 2014).
Again, typology tends to exert greater influence on urban vitality than density. Forexample, the incident rate ratios for morphological types of different density but thesame typology do not differ much. More specifically, the incident rate ratios of low-rise-point, mid-rise-point, and high-rise-point are 0.241, 0.250, and 0.315, respectively. Bycontrast, changes in typology tend to have greater effects on urban vitality. For example,the incident rate ratios are substantially different for mid-rise-point (0.223), mid-rise-strip (0.464) and mid-rise-block (0.610), which have the same category along thedensity dimension (mid-rise) but differ in typology.
Table 1. Negative binomial regression between various morphological features and the distributionof small catering businesses.
B Std. Error Exp(B) B Std. Error Exp(B)
(Intercept) 1.387** 0.0903 4.002** (Intercept) 2.796** 0.0701 16.384**Accessibility 0.001** 0.0004 1.001** Accessibility 0.001** 0.0004 1.001**Block Size 1.657E-6** 4.8953E-7 1.000** Block Size 1.631E-6** 4.7828E-7 1.000**FSI 0.049** 0.0093 1.050** Mixture 0.518** 0.1294 1.679**GSI 1.697** 0.2275 5.455** Dlow-rise-point −1.424** 0.1797 0.241**Mixture 0.694** 0.1282 2.002** Dlow-rise-strip −1.409** 0.3088 0.244**
Dlow-rise-block −1.387** 0.2856 0.250**Dmid-rise-point −1.503** 0.1559 0.223**Dmid-rise-strip −0.768** 0.1137 0.464**Dmid-rise-block −0.494** 0.1001 0.610**Dhigh-rise-point −1.156** 0.1246 0.315**Dhigh-rise-strip −0.561** 0.0795 0.570**Dhigh-rise-block 0a 1**
Omnibus Testb 240.603 Omnibus Testb 267.941Sig. of the model 0.000** Sig. of the model 0.000**N 1187 N 1187
** ≤ 0.01, * ≤ 0.05.aset to 0 because this parameter is redundant.bcompares the fitted model against the intercept-only model.
URBAN GEOGRAPHY 15
Dow
nloa
ded
by [
Uni
vers
ity o
f H
ong
Kon
g L
ibra
ries
] at
04:
35 2
6 Se
ptem
ber
2017

4.3. Detailed analyses of morphological categories
To enrich our understanding of the relationship between building density, typology,and the distribution of PoIs, we have a closer look at the four morphological categorieswith higher incident rate ratios (i.e., with Exp(B) values greater than 0.4). Morespecifically, we further examine urban vitality in street blocks of high-rise block, mid-rise block, high-rise strip, and mid-rise strip types (Table 2). Blocks of the high-riseblock type are usually characterized by large indoor shopping malls as well as officialand residential towers. This morphological type often has limited entrances, and
Table 2. Four morphological types with relatively stronger influence on urban vitality (Red dotsrepresent individual PoIs, and black polygons represent individual buildings).Building types influences Examples
high-rise block type quite high(Exp(B) set as 1)
mid-rise block type relatively high(Exp(B) = 0.610)
high-rise strip type medium(Exp(B) = 0.570)
mid-rise strip type relatively low(Exp(B) = 0.464)
16 Y. YE ET AL.
Dow
nloa
ded
by [
Uni
vers
ity o
f H
ong
Kon
g L
ibra
ries
] at
04:
35 2
6 Se
ptem
ber
2017
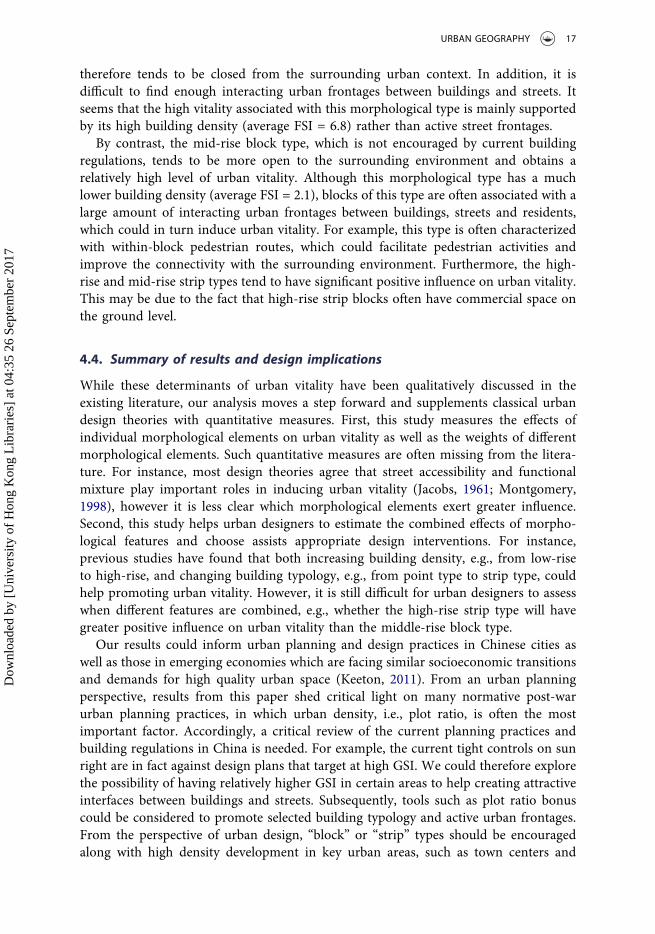
therefore tends to be closed from the surrounding urban context. In addition, it isdifficult to find enough interacting urban frontages between buildings and streets. Itseems that the high vitality associated with this morphological type is mainly supportedby its high building density (average FSI = 6.8) rather than active street frontages.
By contrast, the mid-rise block type, which is not encouraged by current buildingregulations, tends to be more open to the surrounding environment and obtains arelatively high level of urban vitality. Although this morphological type has a muchlower building density (average FSI = 2.1), blocks of this type are often associated with alarge amount of interacting urban frontages between buildings, streets and residents,which could in turn induce urban vitality. For example, this type is often characterizedwith within-block pedestrian routes, which could facilitate pedestrian activities andimprove the connectivity with the surrounding environment. Furthermore, the high-rise and mid-rise strip types tend to have significant positive influence on urban vitality.This may be due to the fact that high-rise strip blocks often have commercial space onthe ground level.
4.4. Summary of results and design implications
While these determinants of urban vitality have been qualitatively discussed in theexisting literature, our analysis moves a step forward and supplements classical urbandesign theories with quantitative measures. First, this study measures the effects ofindividual morphological elements on urban vitality as well as the weights of differentmorphological elements. Such quantitative measures are often missing from the litera-ture. For instance, most design theories agree that street accessibility and functionalmixture play important roles in inducing urban vitality (Jacobs, 1961; Montgomery,1998), however it is less clear which morphological elements exert greater influence.Second, this study helps urban designers to estimate the combined effects of morpho-logical features and choose assists appropriate design interventions. For instance,previous studies have found that both increasing building density, e.g., from low-riseto high-rise, and changing building typology, e.g., from point type to strip type, couldhelp promoting urban vitality. However, it is still difficult for urban designers to assesswhen different features are combined, e.g., whether the high-rise strip type will havegreater positive influence on urban vitality than the middle-rise block type.
Our results could inform urban planning and design practices in Chinese cities aswell as those in emerging economies which are facing similar socioeconomic transitionsand demands for high quality urban space (Keeton, 2011). From an urban planningperspective, results from this paper shed critical light on many normative post-warurban planning practices, in which urban density, i.e., plot ratio, is often the mostimportant factor. Accordingly, a critical review of the current planning practices andbuilding regulations in China is needed. For example, the current tight controls on sunright are in fact against design plans that target at high GSI. We could therefore explorethe possibility of having relatively higher GSI in certain areas to help creating attractiveinterfaces between buildings and streets. Subsequently, tools such as plot ratio bonuscould be considered to promote selected building typology and active urban frontages.From the perspective of urban design, “block” or “strip” types should be encouragedalong with high density development in key urban areas, such as town centers and
URBAN GEOGRAPHY 17
Dow
nloa
ded
by [
Uni
vers
ity o
f H
ong
Kon
g L
ibra
ries
] at
04:
35 2
6 Se
ptem
ber
2017

urban regeneration sites. By the same token, the high-rise point building type may needto be avoided in these areas. Empirical analyses of key morphological elements suggestthat it could be necessary to arrange designs carefully to allow for synergies between thepositive effects of street accessibility, building types and density, and functional mixture.
5. Conclusions
This paper advances our understanding of the relationship between urban morphology andurban vitality based on emerging urban data and new analytical methods (Liu et al., 2015).This study is a response to the increasing academic interest in introducing new quantitativethinking into urban design. Using Shenzhen as the case study, our study identifies typicalmorphological categories of building density and typology, and explores the relationshipbetween these morphological categories and urban vitality. The overall interpretation of ourregression models is in line with theoretical predictions made by Jacobs (1961) andMontgomery (1998). Although our analysis is exploratory, it moves a step forward andsupplements classical urban design theories with quantitative measures. The results suggestthat building typology tends to play a more important role than building density in inducingurban vitality. More specifically, “block” and “strip” typologies are associated with significantpositive effects on urban vitality, even when the effects of building density are accounted for.Substantive insights from this study can be used for urban planning and design in China andother emerging economies. Moreover, the quantitative weighting of key morphologicalfeatures could be used to evaluate urban vitality of individual sites and identify appropriatedesign interventions in an evidence-based manner. For example, a GIS tool can be developedto calculate the morphological features of individual designs and “convert” these featuresback to a score of “vitality” using the corresponding quantitative weighting.
Our approach has several limitations. First, small catering businesses only representone specific dimension of urban vitality. Other analyses using different proxies may ormay not generate similar results. Further analyses are required to benchmark ouranalysis with alternative measures of urban vitality. Second, while urban vitality is areflection, in part, of the intended uses in different times of the day, the current POIdataset lacks a temporal dimension. Information about human-behaviors throughoutthe day should be included to increase the robustness of the analysis. However, manypotential datasets, such as cell phone data, are hard to collect due to privacy issues andmay not have the high spatial resolution required in urban morphology and urbandesign. Third, our analysis does not include information about building age, although(the mixture of) buildings of different ages were highlighted in existing theories.Nevertheless, Shenzhen does not have many “old buildings” as the entire city wasbuilt from scratch since the 1980s, and therefore the influence of building age may beless significant than that in Western cities where Jane Jacob developed her theories.
Acknowledgment
The authors would like to thank the editor and anonymous reviewers for their valuable insightsand suggestions. This study is supported by National Natural Science Foundation of China(51708410), Hui Oi Chow Trust Fund (201502172005), Hong Kong Research Grant Council(ECS 27604016; CRF C7028-16G), a seed grant from HKU-The Belt and Road Urban
18 Y. YE ET AL.
Dow
nloa
ded
by [
Uni
vers
ity o
f H
ong
Kon
g L
ibra
ries
] at
04:
35 2
6 Se
ptem
ber
2017

Observatory, and Shanghai Pujiang Program (17PJC107). We thank Xinggang Zhou andShenzhen Planning Bureau for the GIS data and insightful suggestions. Any remaining errorsare our own.
Disclosure statement
No potential conflict of interest was reported by the authors.
Funding
This work was supported by the National Natural Science Foundation of China [51708410];Shanghai Pujiang Program [17PJC107];Hui Oi Chow Trust Fund [201502172005];ResearchGrants Council, University Grants Committee [27604016];Research Grants Council, UniversityGrants Committee [C7028-16G].
References
Al_Sayed, Kinda, Turner, Alasdair, Hillier, Bill, Iida, Shinichi, & Penn, Alan. (2014). Space syntaxmethodology: A teaching textbook for the MSc Spatial Design. London: Bartlett School ofArchitecture, UCL: London. Retrieved from: http://discovery.ucl.ac.uk/1415080/1/SpaceSyntax-fulltextbook_HigherRe.pdf.
Batty, Michael. (2013). Big data, smart cities and city planning. Dialogues in Human Geography, 3(3), 274–279.
Bertaud, Alain. (2012). Government intervention and urban land markets: The case of China.Journal of Architectural and Planning Research, 29, 335–346.
Berghauser-Pont, Meta, & Haupt, Per. (2007). The relation between urban form and density.Urban Morphology, 11(1), 62–63.
Berghauser-Pont, Meta, & Haupt, Per. (2010). Spacematrix: Space, density and urban form.Amsterdam: NAI.
Buchanan, Peter. (1988). What city? A plea for place in the public realm. The ArchitecturalReview, 184(1101), 31–41.
Cameron, A. Colin, & Trivedi, Pravin K. (2013). Regression analysis of count data (2nd ed.).Cambridge: Cambridge university press.
Campanella, Thomas, J. (2012). The concrete dragon: China’s urban revolution and what it meansfor the world. San Francisco, CA: Chronicle Books.
Carmona, Matthew. (2014). The place-shaping continuum: A theory of urban design process.Journal of Urban Design, 19(1), 2–36.
Chen, Fei, & Thwaites, Kevin. (2013). Chinese urban design: The typomorphological approach.Farnham: Ashgate.
Chen, Yanguang, & Wang, Jiejing. (2013). Multifractal characterization of urban form and growth:The case of Beijing. Environment and Planning B: Planning and Design, 40(5), 884–904.
Cheng, Zhiyuan, Caverlee, James, Lee, Kyumin, & Sui, Daniel Z. (2011). Exploring millions offootprints in location sharing services. In Lada Adamic, Ricardo Baeza-Yates, & Scott Counts(Eds.), Proceedings of the Fifth International AAAI Conference on Weblogs and Social Media(pp. 81–88). San Francisco, CA: AAAI Press.
Cooper, Crispin (2013). Detailed measure descriptions of sDNA. Retrieved from http://www.cardiff.ac.uk/sdna/wp-content/downloads/documentation/Detailed%20sDNA%20measure%20descriptions.pdf
De Nadai, Marco, Staiano, Jacopo, Larcher, Roberto, Sebe, Nicu, Quercia, Daniele, & Lepri,Bruno. (2016). The death and life of great Italian cities: A mobile phone data perspective. InRick Barrett, Rick Cummings, Eugene Agichtein, & Evgeniy Gabrilovich (Eds.) Proceedings ofthe 25th International Conference on World Wide Web (pp. 413–423). Montréal: IW3C2.
URBAN GEOGRAPHY 19
Dow
nloa
ded
by [
Uni
vers
ity o
f H
ong
Kon
g L
ibra
ries
] at
04:
35 2
6 Se
ptem
ber
2017

Den Hartog, Harry. (2010). Shanghai new towns: Searching for community and identity in asprawling metropolis. Rotterdam: 010 Publishers.
Gehl, Jan. (1971). Life between buildings: Using public space. New York: Van Nostrand Reinhold.Griffiths, Sam, Jones, Catherine Emma, Vaughan, Laura, & Haklay, Muki. (2010). The persis-
tence of suburban centres in Greater London: Combining Conzenian and space syntaxapproaches. Urban Morphology, 14(2), 85–99.
Gu, Kai. (2001). Urban morphology of China in the post-socialist age: Towards a framework foranalysis. Urban Design International, 6(3), 125–142.
Haklay, Muki. (2010). How good is volunteered geographical information? A comparative studyof Open Street Map and Ordnance Survey datasets. Environment and Planning B: Planningand Design, 37(4), 682–703.
Hall, Tony. (2013). The potential influence of urban morphology on planning practice. UrbanMorphology, 17(1), 54–55.
Hao, Pu, Sliuzas, Richard, & Geertman, Stan. (2011). The development and redevelopment ofurban villages in Shenzhen. Habitat International, 35(2), 214–224.
Hilbe, Joseph M. (2011). Negative binomial regression (2nd ed.). UK: Cambridge University Press.Hillier, Bill, Penn, Alan, Hanson, Joanna, Grajewski, Tadeusz, & Xu, Jin. (1993). Natural move-
ment: Or, configuration and attraction in urban pedestrian movement. Environment andPlanning B: Planning and Design, 20(1), 29–66.
Jacobs, Jane. (1961). The life and death of great American cities. New York, NY: Random House.Jin, Wu. (1993). The historical development of Chinese urban morphology. Planning Perspective,
8(1), 20–52.Joosten, Victor, & Van Nes, Akkelies. (2005). How block types influences the natural movement
economic process: Micro-spatial conditions on the dispersal of shops and Café in Berlin. InAkkelies Van Nes (Ed.), Proceedings of the Fifth International Space Syntax Symposium (pp.225). Delft, the Netherlands: Techne Press.
Karimi, Kayan. (2012). A configurational approach to analytical urban design: ‘Space syntax’smethodology. URBAN DESIGN International, 17(4), 297–318.
Katz, Peter, Scully, Vincent, & Bressi, Todd W. (1994). The new urbanism: Toward an archi-tecture of community. New York, NY: McGraw-Hill.
Keeton, Rachel. (2011). Rising in the East: Contemporary new towns in asia. Amsterdam: SUNArchitecture.
Kropf, Karl. (2017). The handbook of urban morphology. New Jersey, NJ: Wiley.Larkham, Peter, & Jones, Andrew. (1991). A glossary of urban form. London: Institute of British
Geographers.Lees, Loretta. (2010). Planning urbanity? Environment and Planning A, 42(10), 2302–2308.Lefebvre, Henri. (1968). Writings on Cities. Oxford: Blackwell Publishing.Lin, George C.S. (2015). Redevelopment of China’s construction land: Practicing property rights
in Chinese cities through renewals. The China Quarterly, 224, 865–871.Liu, Xingjian, & Long, Ying. (2016). Automated identification and characterization of parcels
with Openstreetmap and points of interest. Environment And Planning B, 43, 341-360.doi:10.1177/0265813515604767
Liu, Xingjian, Song, Yan, Wu, Kang, Wang, Jianghao, Li, Dong, & Long, Y. (2015).Understanding urban China with open data. Cities, 47, 53–61.
Liu, Yuting, He, Shenjing, Wu, Fulong, & Webster, Chris. (2010). Urban villages under China’srapid urbanization: Unregulated assets and transitional neighbourhoods. HabitatInternational, 34(2), 135–144.
Lozano, Eduardo. (1990). Density in communities, or the most important factor in buildingurbanity. In Michael Larice & Elizabeth Macdonald (Eds.), The urban design reader (pp. 312–327). Oxon: Routledge.
Madanipour, Ali. (1996). Design of urban space: An inquiry into a socio-spatial process. NewYork, NY: Wiley Chichester.
Marcus, Lars. (2010). Spatial Capital. The Journal of Space Syntax, 1(1), 30–40.
20 Y. YE ET AL.
Dow
nloa
ded
by [
Uni
vers
ity o
f H
ong
Kon
g L
ibra
ries
] at
04:
35 2
6 Se
ptem
ber
2017

Marshall, Stephen, & Caliskan, Olgu. (2011). A joint framework for urban morphology anddesign. Built Environment, 37(4), 409–426.
Montgomery, John. (1998). Making a city: Urbanity, vitality and urban design. Journal of UrbanDesign, 3(1), 93–116.
Neter, John, Kutner, Michael H., Nachtsheim, Christopher J., & Wasserman, William. (1996).Applied linear statistical models (4th ed.). Chicago, IL: Irwin.
Oliveira, Victor. (2013). Morpho: A methodology for assessing urban form. Urban Morphology,17(1), 21–33.
Oliveira, Victor. (2016). Urban morphology: An introduction to the study of the physical form ofcities. Switzerland: Springer International Publishing.
Oliveira, Victor, & Medeiros, Vale´rio. (2016). Morpho: Combining morphological measures.Environment and Planning B: Planning and Design, 43(5), 805–825.
Philipsen, Klaus (2015). How food became the ferment of urbanity. Community ArchitectureWebsite. Retrieved from http://archplanbaltimore.blogspot.sg/2015/10/how-food-became-ferment-of-urbanity.html
Rowley, Alan. (1994). Definitions of urban design: The nature and concerns of urban design.Planning Practice and Research, 9(3), 179–197.
Samuels, Ivor. (2013). ISUF task force on research and practice in urban morphology: An interimreport. Urban Morphology, 17(1), 40–43.
Samuels, Ivor. (1999). Architectural practice and urban morphology. In R. Slater Terry (Ed.), Thebuilt form of western cities: Essays for M.R.G. conzen on the occasion of his eightieth birthday(pp. 415–435). London: Leicester University Press.
Shannon, Claude. (1948). A mathematical theory of communication. The Bell System TechnicalJournal, 27, 379–423, 623–656.
Stanilov, Kiril. (2010). Bridging the gap between urban morphology and urban modelling. UrbanMorphology, 14(2), 123–124.
Steadman, Phillip. (2014). Density and built form: Integrating ‘Spacemate’ with the work ofMartin and March. Environment and Planning B: Planning and Design, 41(2), 341–358.
Sung, Hyungun, Lee, Sugie, & Cheon, SangHyun. (2015). Operationalizing Jane Jacobs’s urbandesign theory: Empirical verification from the great city of Seoul, Korea. Journal of PlanningEducation and Research, 35(2), 117–130.
Van Den Hoek, Joost. (2009). The MXI (Mixed-use Index) as planning tool for (new) towns inthe 21st century. In Michelle Provoost (Ed.), New towns for the 21st Century: The planned vs.the unplanned city (pp. 198–207). Amsterdam: SUN Architecture.
Van Nes, Akkelies. (2005). Typology of shopping areas in Amsterdam. In Akkelies Van Nes(Ed.), Proceedings of the Fifth International Space Syntax Symposium (pp. 175–186). Delf:Techne Press.
Wang, Xin-Rui, Hui, Eddie Chi-Man, Choguill, Charles, & Jia, Sheng-Hua. (2015). The newurbanization policy in China: Which way forward? Habitat International, 47, 279–284.
Whitehand, Jeremey, Gu, K., Whitehand, Susan M., & Zhang, Jian. (2011). Urban morphologyand conservation in China. Cities, 28(2), 171–185.
Whitehand, Jeremey, & Gu, Kai. (2006). Research on Chinese urban form: Retrospect andprospect. Progress in Human Geography, 30(3), 337–355.
Wirth, Louis. (1938). Urbanism as a way of life. American Journal Of Sociology, 44(1), 1-24.doi:10.1086/217913
Wu, F. (2016). Emerging Chinese cities: Implications for global urban studies. The ProfessionalGeographer, 68(2), 338–348.
Ye, Yu (2015). Urban form index for quantitative urban morphology and urban design analyses(Unpublished doctoral dissertation). The University of Hong Kong, Hong Kong.
Ye, Yu, & Van Nes, Akkelies. (2013). Measuring urban maturation processes in Dutch andChinese new towns: Combining street network configuration with building density and degreeof land use diversification through GIS. Journal of Space Syntax, 4(1), 17–37.
URBAN GEOGRAPHY 21
Dow
nloa
ded
by [
Uni
vers
ity o
f H
ong
Kon
g L
ibra
ries
] at
04:
35 2
6 Se
ptem
ber
2017

Ye, Yu, Yeh, Anthony, Zhuang, Yu, Van Nes, Akkelies, & Liu, Jianzheng. (2017). “Form Syntax”as a contribution to geodesign: A morphological tool for urbanity-making in urban design.URBAN DESIGN International, 22(1), 73–90.
Ye, Yu, & Zhuang, Yu. (2017). The urban morphogenesis and urban vitality in newly built-upareas: Analyses based on street accessibility, building density and functional mixture. UrbanPlanning International (In Chinese), 32(2), 43–49.
Yuan, Nicholas Jing, Zhang, Fuzheng, Lian, Defu, Zheng, Kai, Yu, Siyu, & Xie, Xing. (2013). Weknow how you live: Exploring the spectrum of urban lifestyles. In M. Muthukrishnan (Ed.),Proceedings of the first ACM conference on Online Social Networks (pp. 3–14). Boston, MA:ACM.
Zacharias, John, & Tang, Yuanzhou. (2010). Restructuring and repositioning Shenzhen, China’snew mega city. Progress in Planning, 73(4), 209–249.
Zhong, Lena. (2013). Communities, crime and social capital in contemporary China. London:Routledge.
Zukin, Sharon. (2010). Naked city: The death and life of authentic urban places. New York, NY:Oxford University Press.
22 Y. YE ET AL.
Dow
nloa
ded
by [
Uni
vers
ity o
f H
ong
Kon
g L
ibra
ries
] at
04:
35 2
6 Se
ptem
ber
2017