How Automated T&E Expense Management Removes Barriers to Company Growth
46
How Automated T&E Expense Management Removes Barriers to Company Growth July 20, 2016
-
Upload
ashley-emery -
Category
Business
-
view
221 -
download
1
Transcript of How Automated T&E Expense Management Removes Barriers to Company Growth

How Automated T&E Expense Management Removes Barriers to Company Growth
July 20, 2016

Agenda
Today’s presentation will cover:
Learning Objectives
• Calculating the return on investment of business travel
• Expense reporting challenges that erode productivity and profits
• The hidden and average expense report processing costs by system
• Spending, travel and expense technology trends
• Five T&E strategies to remove friction and foster growth

AgendaWebinar Notes
• Today’s event will be recorded and all attendees will be kept in listen-only mode to eliminate excessive background noise
• Links to today’s presentation and the recording of this webinar will be sent out to all attendees within 24 hours of the event
• Please ask questions on today’s topic via the “Questions” box in your control panel at any time during the event. We will do our best to answer all questions during the Q&A session at the end of the event; if we do not get to your question, we will follow up with you directly

Mark BrousseauPresident and Owner
Brousseau & Associates
Today’s Presenter

Robert NeveuPresident and Co-Founder
5
Stephen ShodrockAccounting Manager
Featured Speakers

AgendaAbout Certify
• Industry-leading, first fully automated travel and expense management system
• 64 languages, 140+ currencies, clients in 80 countries
• #1 highest rated expense management software for user satisfaction on G2 Crowd
• PC Magazine Editors’ Choice for best expense management software of 2016
• Processing over 30 million expense transactions and $10+ billion in expense reports for 2015

Click to add text
Click to add title
#SageSummit |@TwitterHandle (Optional) 7
Calculating the ROI of Business Travel

AgendaThe ROI of Business Travel
• For every dollar invested in business travel, U.S. companies generated $9.50 in revenue and $2.90 in profit
• Comprehensive 18-year econometric analysis across 14 industries by Oxford Economics and U.S. Travel Association

21%
15%
13%11%
8%
7%
7%
6%5%
4%3%
AgendaTop Reasons for Travel and Outcomes
The Value of Business Travel: The travelers’ perspective, Carlson Wagonlit Travel, 2014t
Reported outcomes:Purpose of business travel:
Series131%
21%13%
11%
10%
7%7% Client/Prospect
Meeting
Team-relatedMeetingTraining & Development
EventConferences
& Fairs
Operations &Quality Control
Innovation and R&D
Supplier MeetingBusinessDevelopment
Client ServiceDelivery
Increased Collaboration
Strategic Alignment
Innovation
QualityControl
PeopleDevelopment
EmployeeEngagement
Self-development
NetworkingOther

AgendaExecutive Perspective on ROI
The Return on Investment of U.S. Business Travel, Oxford Economics/U.S. Travel Association, 2009
What does business travel mean for your bottom line?
Trip Type % Of Travel Budget(Average)
Return on $1 of Investment(Median of Responses)
Customer Meetings 34% $15 - 19.99
Conferences 10% $4 – 5.99
Trade Shows 10% $4 – 5.99
Incentives 5% $4+
All Other 42% N/A

AgendaPOLLING QUESTION 1
a) Under $10 b) Between $10 and $15 c) $20 or mored) Not applicable
For every dollar your company spends on T&E, what is your estimated ROI?
Click to add text
Click to add title
#SageSummit |@TwitterHandle (Optional) 12
Why T&E Expense Matters
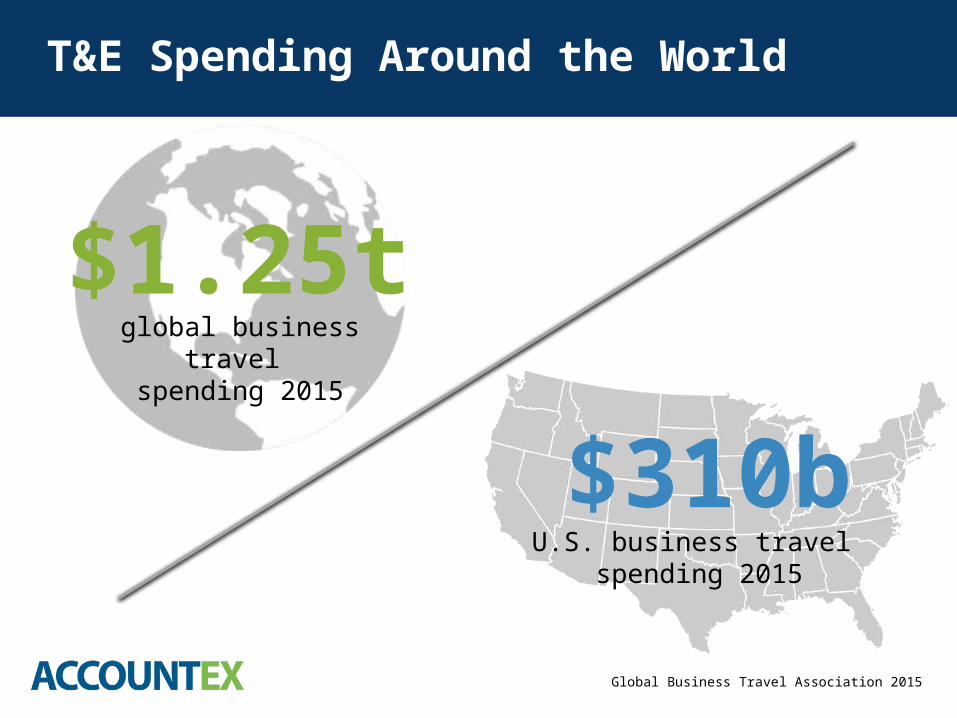
$310b
AgendaT&E Spending Around the World
$1.25tglobal business travel
spending 2015
Global Business Travel Association 2015
U.S. business travel spending 2015

AgendaAverage Base Cost Per Trip
Travel Leaders Corporate 2015
Average business trip cost for air, hotel and car rental:
INTERNATIONAL DOMESTIC
$2,502 $1,002
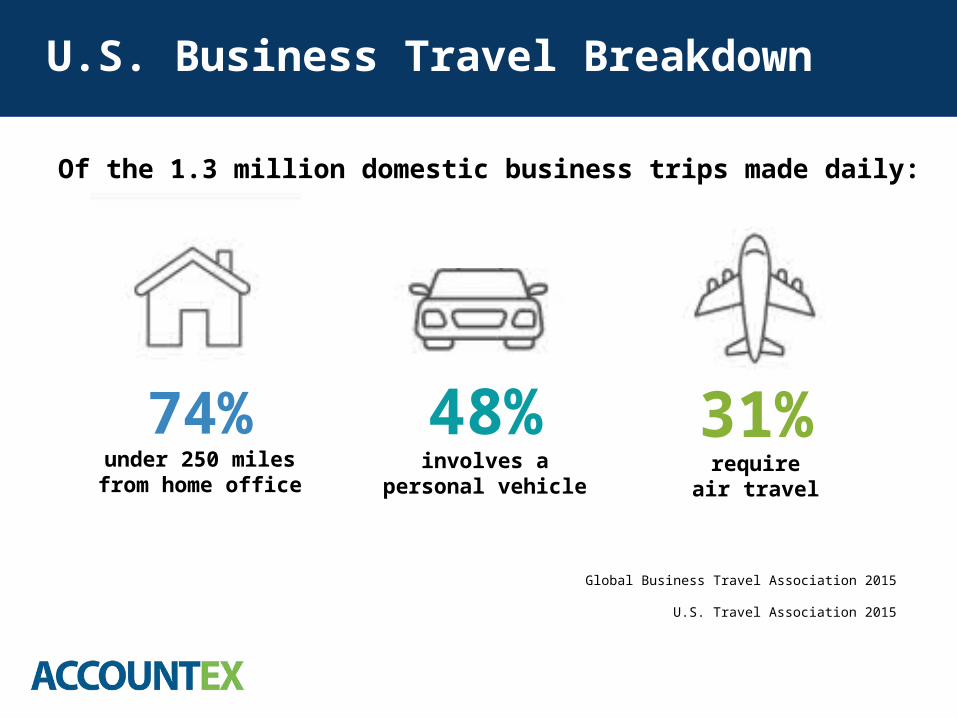
AgendaU.S. Business Travel Breakdown
74%under 250 miles
from home office
48%involves a
personal vehicle
31%require
air travel
Global Business Travel Association 2015
U.S. Travel Association 2015
Of the 1.3 million domestic business trips made daily:

AgendaBusiness Investment in T&E
8-12%total annual budget
for T&E expenses(Aberdeen Group 2015)
PayStream Advisors 2016
Company Revenue Average Annual Travel Spend
Less than $100 million ~ $700,000
$100 million to $500 million ~ $1,500,00
$501 million to $2 billion ~ $7,400,000
Greater than $2 billion ~ $58,000,000

AgendaHow the Expense Budget is Spent
1. Meals 19%
2. Airfare 17%
3. Misc. 17%
4. Lodging 14%
5. Gas 11%
6. Cell phone 5%
7. Car rental 5%
8. Groceries 5%
9. Supplies 5%
10. Taxi 3%
11. Shipping 2%
12. Tolls 1%
13. Parking 1%
Certify SpendSmart Report, Q4 2015

$98.75DAILYMEAL COST
2016
AgendaHow the Expense Budget is Spent
1. Meals 19%
2. Airfare 17%
3. Misc. 17%
4. Lodging 14%
5. Gas 11%
6. Cell phone 5%
7. Car rental 5%
8. Groceries 5%
9. Supplies 5%
10. Taxi 3%
11. Shipping 2%
12. Tolls 1%
13. Parking 1%
Certify SpendSmart Report, Q4 2015
2016 Business Travel News Corporate Travel Index

AgendaBenchmark Spending by Category
Category 2014 2015 Difference
Gas $40.41 $30.32 –24.96%
Airfare $345.21 $274.00 –20.62%
Lodging $213.90 $223.45 +4.64%
Car Rental $193.58 $186.45 –3.68%
Cell Phone $89.30 $92.24 +3.29%
Meals $25.67 $26.06 +1.52%
Parking $32.70 $32.23 –1.43%
Taxi $31.81 $31.82 +0.03%
Certify SpendSmart Report, Q4 2015

T&E spending ranks as the 2nd most difficult operating expense category to control Forrester Research 2015

Click to add text
Click to add title
#SageSummit |@TwitterHandle (Optional) 21
Expense Management Trendsand Technological Barriers

AgendaPOLLING QUESTION 2
a) Paper-based/spreadsheetsb) ERP system (Oracle, Microsoft Dynamics, etc.)c) Web-based expense software (Certify, Concur, etc.)d) Not applicable
How does your organization currently manage T&E expense spending?

AgendaT&E Expense Systems Used
Consistent mix of expense management systems in use over time:
Certify Annual Travel & Expense Management Survey 2013-2016

AgendaExpense Reporting’s Hidden Costs
$6.85fully automated
$17.31 semi-automated
$26.63 manual
PayStream Advisors 2015
• Man hours to create, review and approve reports
• Hard costs for paper, printing and postage
• Time required for reconciliation and reimbursement • Storage fees to archive expense reports • Lost productivity and lost opportunity

AgendaCalculating Cost and Lost Opportunity
Time spentper reportXHourly wage
or salary
Individual Employee:
Sales Representative:
= Overhead costper report
Time spentper report÷Total available
selling time = Lost sellingopportunity (%)

AgendaCurrent Systems by Company Size
Web-based solution (Concur, IBM, etc.)Microsoft Excel/spreadsheetsPen and paperHomegrown solutionERP/accounting package (Oracle, SAP, etc.)
MANUAL SYSTEMS: 70% small businesses, 26% enterprise
22%
55%
10%
5%8%
37%
37%
9%
4%
13%
46%
16%
4%
6%
28%
SMALLBUSINESS
MID-SIZEBUSINESS ENTERPRISE
Certify Annual Travel & Expense Management Survey 2016

AgendaExpense Technology Migration
37%SMALL
BUSINESS
46%MIDSIZED
COMPANIES
53%ENTERPRISE
Certify Annual Travel & Expense Management Survey 2016
62% of all companies planning to make the switch will do so in the next 12 months

AgendaTop Goals for Improving T&E
Certify Annual Travel & Expense Management Survey 2016
Reimburse employees faster
Improve employee compliance rates to corporate policy
Gain reporting and analytics around T&E spend
Provide system accessibly from anywhere (online, mobile)
Simplify process for employees and managers
25%
28%
32%
40%
66%

AgendaT&E Policy Compliance
73%85%of all companies report having a
written T&E policy in place
of those companies are manually reviewing
for policy violations
Manual policy review is inefficient, prone to error and fraud
Certify Annual Travel & Expense Management Survey 2016

For the average company, an estimated 20% of a total T&E spend is considered out of policy
Aberdeen Group 2014
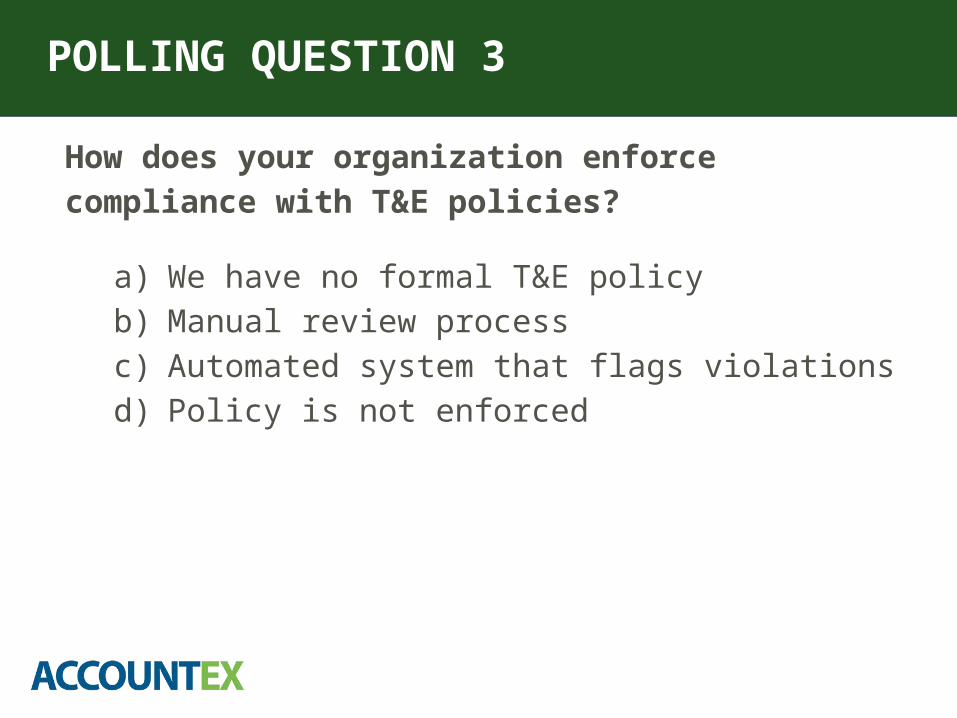
AgendaPOLLING QUESTION 3
a) We have no formal T&E policy b) Manual review processc) Automated system that flags violationsd) Policy is not enforced
How does your organization enforce compliance with T&E policies?

Click to add text
Click to add title
#SageSummit |@TwitterHandle (Optional) 32
Five T&E Strategies to Remove Friction and Foster Growth

AgendaMobile: Make it Easy for Employees
• Optical character recognition/auto-fill: snap photos of receipts, automatically parse data into reports
• Mobile report creation: build expense reports from the road as receipts are captured and saved
• Remote approvals: managers can review and approve reports from any location to reduce delays
Top features for mobile T&E reporting:

Mobile expense reporting reduces processing costs by 65%, delivers quicker report approval and reimbursement times
Aberdeen Group 2014

AgendaT&E Policy: Make Enforcement Automatic
• Set hard/soft policy controls: apply spending caps, reporting requirements (meal attendees, receipts, etc.), vendor preferences, and more
• Eliminate duplicate receipts/expenses: automatic system reviews identify duplicate expenses, flag out-of-policy expenses, reduce fraud, and save money
• Manage expense reporting on time: set a schedule to automatically build reports, notify employees and managers, and submit expenses (specific to Certify)
Flagged violation, notifying manager amount exceeded policy limit

Businesses under 100 employees have a 28% higher median fraud loss than those with >100
Association of Certified Fraud Examiners 2015

AgendaTravel : Control Cost Before It’s Expensed
Pre-Trip Approval:Requires authorization prior to booking;
configured by employee, policy, etc.
Lowest Logical Fare:Automatically identifies best available
rates for proposed itinerary
$
• Category spending limits (i.e. amount not to exceed)
• Preferred travel vendors for air, hotel and car rental
• Acceptable classes of service for flights
Controllable costs via integrated travel booking:• Advance purchase and connecting flight
requirements
• Ancillary fees (upgrades, boarding, airline clubs, etc.)
• Changing or cancelling flights

Companies that track and apply unused tickets can save 5-8% of total annual travel budget
2015 GBTA Ancillary Fee Handbook

AgendaIntegrations: the Key to Efficiency
• Accounting systems: automate key accounting functions and streamline workflow
• Corporate credit cards: direct control over employee spending, faster reconciliation
• Corporate systems: reduce data entry and errors across multiple redundant systems
• ACH reimbursement: direct deposit for more efficient reimbursement, simplified accounting

T&E automation increases employee productivity 29% via reduced data entry, mobile tools and other timesaving efficiencies
Aberdeen Group 2014

AgendaReporting: Can’t Control What You Can’t See
• Spending: analyze company spend by expense category, department, individual employee, monthly reimbursements, etc.
• Compliance: review processed and in-progress reports, policy violations, identify risk and offenders, and improve company compliance rates
• Workflow: monitor people and process; documented path of approvals ensure expenses are reviewed and approved according to guidelines
Actionable analytics and insights into key spending and performance metrics:

Lack of visibility into spending is the top T&E area of improvement for 51% of all companies
Aberdeen Group 2014

AgendaAutomation Gets Results

Click to add text
Click to add title
#SageSummit |@TwitterHandle (Optional) 44
Questions?

AgendaOur Sponsor

Click to add text
Click to add title
#SageSummit |@TwitterHandle (Optional) 46
Thank You!