How America Pays for College 2009
70
HOW AMERICA PAYS FOR COLLEGE Sallie Mae’s National Study of College Students and Parents Conducted by Gallup 2009
Transcript of How America Pays for College 2009

How AmericA PAys for collegeSallie Mae’s National Study of College Students and Parents
Conducted by Gallup
2009
Sallie Mae is the nation’s leading provider of saving, planning and paying for education programs. Since its founding more than 35 years ago, the company has invested in more than 31 million people to help them realize their dreams of higher education. Through its subsidiaries, the company manages $188 billion in education loans and serves 10 million student and parent customers. Through its Upromise® affiliates, the company also manages more than $19 billion in 529 college-savings plans, and is a major, private source of college funding contributions in America with 11 million members and more than $475 million in member rewards. More information is available at www.SallieMae.com.
Sallie Mae 12061 Bluemont Way Reston, VA 20190 703-810-3000
Gallup has studied human nature and behavior for more than 70 years. Gallup’s reputation for delivering relevant, timely, and visionary research on what people around the world think and feel is the cornerstone of the organization. Gallup employs many of the world’s leading scientists in management, economics, psychology, and sociology, and our consultants assist leaders in identifying and monitoring behavioral economic indicators worldwide. Gallup consultants also help organizations boost organic growth by increasing customer engagement and maximizing employee productivity through measurement tools, coursework, and strategic advisory services. Gallup’s 2,000 professionals deliver services at client organizations, through the Web, at Gallup University’s campuses, and in 40 offices around the world. For more information, go to www.Gallup.com.
For more information about this study and other research from Sallie Mae, please visit www.SallieMae.com/research.
About sallie mae® About gallup®
AuguSt 2009
Gallup 901 F Street, NW Washington, DC 20004 202-705-3030
sallie mae is a registered service mark and Dream. invest. succeed. is a service mark of sallie mae, inc. Upromise is a registered service mark of Upromise, inc. slm corporation and its subsidiaries, including sallie mae, inc. and Upromise, inc., are not sponsored by or agencies of the United states of America. copyright 2009 sallie mae, inc. and gallup, inc. All rights reserved. gcr1979 08/09
�
composite View of funding sources . . . . . . . . . . . . . . . . . . . . . . . . . . . . . . 3
impact of family income on Paying for college . . . . . . . . . . . . . . . . . . . . . . . . . 5
Differences in Paying for college among racial or ethnic groups . . . . . . . . . . . . . . . . . 10
effect of school choice on How American families Pay for college . . . . . . . . . . . . . . . . . 11
Differences in meeting cost between families who Borrow and families who Don’t Borrow . . . . . . . . 13
The role of Various funding sources to Pay for college . . . . . . . . . . . . . . . . . . . . . . 14
5 DeTAileD finDings 19
cost of Attendance . . . . . . . . . . . . . . . . . . . . . . . . . . . . . . . . . . . 19
cost of Attendance . . . . . . . . . . . . . . . . . . . . . . . . . . . . . . . . . 19school Type enrollment. . . . . . . . . . . . . . . . . . . . . . . . . . . . . . . . 21
funding sources . . . . . . . . . . . . . . . . . . . . . . . . . . . . . . . . . . . . 23
Use of non-borrowed funds . . . . . . . . . . . . . . . . . . . . . . . . . . . . . 24Use of Personal contributions . . . . . . . . . . . . . . . . . . . . . . . . . . . . . . . 24
Parent Personal contributions . . . . . . . . . . . . . . . . . . . . . . . . . . . . . 25
student Personal contributions . . . . . . . . . . . . . . . . . . . . . . . . . . . . 25
Use of grants and scholarships . . . . . . . . . . . . . . . . . . . . . . . . . . . . . . 26
Allocation of grants and scholarships . . . . . . . . . . . . . . . . . . . . . . . . . . . . 27
relatives and friends . . . . . . . . . . . . . . . . . . . . . . . . . . . . . . . . 28Use of Borrowed funds. . . . . . . . . . . . . . . . . . . . . . . . . . . . . . . . 29who contributed Borrowed funds. . . . . . . . . . . . . . . . . . . . . . . . . . . . 31sources of Borrowed funds . . . . . . . . . . . . . . . . . . . . . . . . . . . . . . 32
Parent Borrowing. . . . . . . . . . . . . . . . . . . . . . . . . . . . . . . . . . . . 32
student Borrowing . . . . . . . . . . . . . . . . . . . . . . . . . . . . . . . . . . . 32
TABle of conTenTs
4 How AmericAn fAmilies PAy for college 3
1 foreworD v
2 HigHligHTs of finDings vii
3 meTHoDology 1
composite funding sources . . . . . . . . . . . . . . . . . . . . . . . . . . . . . . . . . 2
5 DeTAileD finDings 19

ii GallupSall�eMae
cost considerations . . . . . . . . . . . . . . . . . . . . . . . . . . . . . . . . . . . 34
elimination of colleges Based on cost . . . . . . . . . . . . . . . . . . . . . . . . . . 34completion of fAfsA . . . . . . . . . . . . . . . . . . . . . . . . . . . . . . . . . 36Primary reasons for not completing fAfsA . . . . . . . . . . . . . . . . . . . . . . . . 37more Affordable options . . . . . . . . . . . . . . . . . . . . . . . . . . . . . . . 38estimation of monthly loan repayment Amount . . . . . . . . . . . . . . . . . . . . . . 39consideration of income . . . . . . . . . . . . . . . . . . . . . . . . . . . . . . . 40Primary reasons for Using education loan . . . . . . . . . . . . . . . . . . . . . . . . 41Primary reasons for Using credit card . . . . . . . . . . . . . . . . . . . . . . . . . 42
Attitudes and Perceptions . . . . . . . . . . . . . . . . . . . . . . . . . . . . . . . . . 43
course of Action without student loans . . . . . . . . . . . . . . . . . . . . . . . . . 43reasons students Borrow . . . . . . . . . . . . . . . . . . . . . . . . . . . . . . . 44reasons for continuing education . . . . . . . . . . . . . . . . . . . . . . . . . . . 45Perceptions of college Value . . . . . . . . . . . . . . . . . . . . . . . . . . . . . 47confidence to Pay for college . . . . . . . . . . . . . . . . . . . . . . . . . . . . . 50Parent economic concerns . . . . . . . . . . . . . . . . . . . . . . . . . . . . . . 51Perceived Helpfulness of organizations . . . . . . . . . . . . . . . . . . . . . . . . . 54
6 TecHnicAl APPenDix 56

���
figUres Page
figure 1 How the Average family Pays for college: Average Percent of Total cost of Attendance Paid from each source 3
figure 2 Parent contributions from income and savings 3
figure 3 Parent contributions from Borrowed sources 4
figure 4 student contributions from Borrowed sources 4
figure 5 student contributions from income and savings 4
figure 6 How the Average family Pays for college, by income level 5
figure 7 How the Average family Pays for college, funding source share, by income level 5
figure 8 Parent contributions from income and savings sources, Average Amounts by income level 6
figure 9 sources for Parent Borrowing, Average Amounts by income level 7
figure 10 funding from grants and scholarships, by income level 8
figure 11 student contributions from income and savings sources, Average Amounts by income level 8
figure 12 sources for student Borrowing, Average Amounts by income level 9
figure 13 How the Average family Pays for college, by race or ethnicity 10
figure 14 How the Average family Pays for college, by school Type 11
figure 15 How the Average family Pays for college, by Borrowing status 13
figure 16 cost of Attendance, year-over-year, by school Type 19
figure 17 cost of Attendance, year-over-year, by income level 20
figure 18 Type of college Attended, year-over-year 21
figure 19 Type of college Attended, year-over-year, by income 22
figure 20 sources of funding 23
figure 21 Use of Personal contributions 24
figure 22 Use of Personal contributions, by income 24
figure 23 Use of grants and scholarships 26
figure 24 Use of grants and scholarships, by income and by school Type 26
figure 25 Percent receiving grants or scholarships, by income 27
figure 26 Average grant and scholarship Amounts, by income 28
figure 27 Use of Borrowed funds, year-over-year, by race or ethnicity 29
figure 28 Use of Borrowed funds, year-over-year, by income 30
figure 29 who Borrowed 31
figure 30 elimination of schools Based on cost, year-over-year 34
figure 31 cumulative elimination of schools Based on cost, year-over-year 35
figure 32 completion of fAfsA, year-over-year, by race or ethnicity and income level 36
figure 33 completion of fAfsA, year-over-year, by grade level 36
figure 34 Primary reasons for not completing fAfsA 37
figure 35 Primary reasons for not completing fAfsA, by student and Parent 37
figure 36 cost-saving measures Taken During the Application Process 38
figure 37 student estimates of monthly loan Payment Amount 39
figure 38 effect of student Post-graduation income on Borrowing Decision 40
figure 39 Primary reasons for Using education loan, year-over-year 41
figure 40 Primary reasons for Using credit card, year-over-year 42
figure 41 course of Action without loans among students with education loans, year-over-year 43
figure 42 Primary reasons students Borrow 44
figure 43 reasons for continuing education, strongly Agree, year-over-year, by Parents and students 46
figUres AnD TABles

iv GallupSall�eMae
Table 1 The role of Various funding sources Used to Pay for college, frequency of sources and Average Amounts Used 14
Table 2a composite of college funding sources: Average Value contributed from each source, by income level 15
Table 2b composite of college funding sources: Average Value contributed from each source, by race or ethnicity 15
Table 2c composite of college funding sources: Average Value contributed from each source, by school Type 16
Table 2d composite of college funding sources: Average Value contributed from each source, by Borrowing status 16
Table 3a composite of college funding sources: Average Percent of Total cost of Attendance met by each source, by income level 17
Table 3b composite of college funding sources: Average Percent of Total cost of Attendance met by each source, by race or ethnicity 17
Table 3c composite of college funding sources: Average Percent of Total cost of Attendance met by each source, by school Type 18
Table 3d composite of college funding sources: Average Percent of Total cost of Attendance met by each source, by Borrowing status 18
Table 4 Total cost of Attendance 20
Table 5 enrollment by Type of school 22
Table 6 Used Personal contributions for current school year 25
Table 7 sources of Personal contributions 26
Table 8 Used grants or scholarships for current school year 27
Table 9 Average grant and scholarship Amounts 28
Table 10 contributions from relatives or friends 29
Table 11 Borrowed for current school year 30
Table 12 who contributed Borrowed funds 31
Table 13 sources of Borrowed funds, year-over-year 33
Table 14 elimination of colleges Based on cost 35
Table 15 completed fAfsA Application 37
Table 16 reasons for not completing the fAfsA Application 38
Table 17 more Affordable options Taken During the Application Process 39
Table 18 students expected Post-graduation income effect on Borrowing Decision 41
Table 19 Primary reasons for Using education loan 42
Table 20 Primary reasons for Using credit card 42
Table 21 course of Action without student loans 44
Table 22 Primary reasons students Borrow 45
Table 23 reasons for continuing education, rated strongly Agree 47
Table 24 reasons for continuing education, scale 1-5 47
Table 25 Attitudes toward college, rated strongly Agree 49
Table 26 Attitudes toward college, scale 1-5 49
Table 27 confidence in Ability to Pay for college, scale 1-5 51
Table 28 Parent economic concerns, scale 1-5 53
Table 29 Parent economic concerns, rated extremely worried 53
Table 30 Perceived Helpfulness of organizations, scale 1-5 55
figure 45 Attitudes toward college, strongly Agree, year-over-year, by Parents and students 48
figure 46 Attitudes toward college, scale 1-5 48
figure 47 confidence in Ability to Pay for college 50
figure 48 confidence in Ability to Pay for college, by student grade level 50
figure 49 Parent economic concerns, scale 1-5 52
figure 50 Parent economic concerns, extremely worried, year-over-year 52
figure 51 Perceived Helpfulness of organizations, combined extremely Helpful and Helpful responses, year-over-year 55
TABles Page

�
foreworD
In 2008, Sallie Mae partnered with Gallup to conduct the first national study on How America Pays for College to provide a clear picture of how families make the investment in college. While there had been many authoritative studies that detail discrete resources such as savings, institutional aid, federal financial aid and loans, no comprehensive assessment brought together each of these resources and examined how families draw upon all the various sources to pay for college. While last year’s report captured that clear picture for the first time, it is equally important to watch that picture change over time to determine what is improving and what must still be improved. Sallie Mae’s 2009 report of How America Pays for College, also conducted by Gallup, does just that.
FOR
EW
OR
D
TABles Page

vi
This year’s study reveals how record numbers of American parents and students are investing in college even as major economic challenges are fully taking hold. As this year’s study was fielded, unemployment was on the rise, the banking system was facing enormous stress, and the broader economy was experiencing nothing short of a crisis. Nevertheless, the research shows that families continue to see college as a critical investment in the future and are surprisingly confident in their ability to meet the cost. The study demonstrates how resourceful families are in drawing upon a variety of sources to make a higher education possible.
A projected 16 million undergraduates will head to college in fall 2009. How they respond to the economic crisis may have dramatic effects on the financing of higher education for many years to come. The study raises important questions for the future that bear consideration.
Is the apparent increased consciousness of college cost a permanent change in families’ approach to college?
Given that the loss of home equity and rising unemployment were just taking hold as this year’s study was conducted, what will happen to school choice when those economic circumstances are more fully embedded in a family’s decisions about college?
How will the sharp increase in families’ worries about the value of their savings and investments affect the financing choices for this upcoming academic year? Although the data shows only hints of changes in enrollment by school type compared to 2007-08, will families approach college decisions with more cost-consciousness in the upcoming year as they seek more value for their school choice?
While many campuses may have increased institutional aid in the form of grants and other assistance, is that increase sustainable or does it set the stage for emergent shortfalls in years to come?
Since middle-income families receive less federal financial aid than lower-income families but also aren’t able to make up the difference by applying more of their own resources towards college costs as wealthier families do, will the middle class increasingly need to borrow more if college costs continue to rise and federal aid increases are targeted only at families of more modest means?
While both African-Americans and Hispanics borrow more than the national average, African- Americans receive more grants and scholarships while choosing more expensive schools, and Hispanics receive less grants and scholarships while choosing less expensive institutions. Are Hispanics missing out on opportunities for free money and therefore not accessing more expensive schools, while African-Americans are able to stretch into more premium-priced institutions?
Sallie Mae is committed to continuing to explore these in-depth findings next year to help answer these questions and those yet unasked. We again hope that How America Pays for College will help demonstrate how public policy, economic conditions, and attitudes about the pursuit of higher education evolve over time, and measure how this evolution affects the American family’s ability to pay for college. With major changes to higher education financing, grant programs, and state funding under debate by policymakers and stakeholders, we hope this study will help focus those conversations on implementing changes that will improve the way families make the investment in education, and provide valuable individual and societal returns in the years to come.
��

���
H o w A m e r i c A P A y s f o r c o l l e g e2 0 0 9
HigHligHTs of finDingsSallie Mae’s study, How America Pays for College 2009, conducted by Gallup, provides a picture of how families made the investment in higher education last academic year and how they are beginning to meet the challenges of the economic recession. Based on a nationally repre-sentative survey of college-going students and parents of undergraduates, the study found that, despite the country’s economic challenges, American families expressed unexpected confidence in their ability to continue to pay for their son’s or daughter’s education. They reported that parents continue to be the largest source of funding for college costs. Families indicated that their total cost of attendance increased by 9 percent over the previous year’s survey with no appreciable change in the type of colleges and universities attended.
The report is the second annual Sallie Mae national study conducted by Gallup that examines how families of undergraduate students aged 18 to 24 finance the expenses associated with a higher education. To capture a complete picture of how families meet the costs of college, Sallie Mae and Gallup designed this study to gather data directly from families of the college-going population on their attitudes, aptitudes and actual experiences regarding paying for college. For this year’s study, Gallup surveyed 800 college-going students and 804 parents of such students in March and April 2009 on a series of questions that gauged Americans’ willing-ness and ability to pay for postsecondary education.
The timing of this survey came after the onset of the most severe economic recession in decades. However, families made most of their financial decisions for the 2008-09 school year in the spring and summer of 2008, and selected their institutions even earlier. As a result, the survey is likely to capture only the beginnings of the impact of the economic uncertainty on college choices. However, families’ attitudes about how they can continue to meet college costs would be strongly reflected in this survey.
Borrowing To finAnce HigHer eDUcATionOne of the most significant findings of this report is to put in perspective the role of borrowing in financing higher education. The study finds that borrowing is an important source of funding, but not the most important source. In fact, despite the economy, 58 percent of families accessed college in academic year 2008-09 without borrowing at all. The remaining 42 percent of families who borrowed spent, on average, 30 percent more on their education than those who did not, suggesting that many appeared to use borrowed funds to reach for a desired school of their choice.
How THe AVerAge fAmily PAys for collegeAs with last year’s study, Gallup used the data on funding sources to develop a composite picture of how the average American family pays for college. This year’s composite improves upon last year’s study through adjustments in the survey to better capture contributions from income and other non-borrowed sources as well as better reporting of private education loans.
With these improvements, the composite shows that, on average, parents funded 45 percent of the cost of their daughter’s or son’s college education, either directly from their own resources (36% from income and other savings) or borrowing (9%). The second largest funding source was grants and scholarships which funded, on average, 25 percent of all college costs. Students paid for 24 percent of their education, either through borrowing (14%) or from their own income and savings (10%). In addition, friends and relatives helped with 6 percent of the costs.
Differences By HoUseHolD income, rAce or eTHniciTy, AnD TyPe of insTiTUTionThe composite shows important differences in how families across income levels and racial/ethnic back-grounds pay for college. In addition, the type of institu-tion attended can also make a difference.
Middle-income families attained far less grant and scholarship aid than those with lower incomes, and appear to supplement the difference with parental personal assets and a slightly larger share of borrowed funds.
ParentBorrowing
9%
Student Borrowing14%
Parent Income & Savings36%
Student Income& Savings
10%
Grants& Scholarships
25%
Relatives& Friends
6%
Fig. 1 How the Average Family Pays for College: Average Percent of Total Cost of Attendance Paid from Each Source
HIG
HLIG
HTS
OF
FIN
DIN
GS
viii
gAllUPsAllie mAe
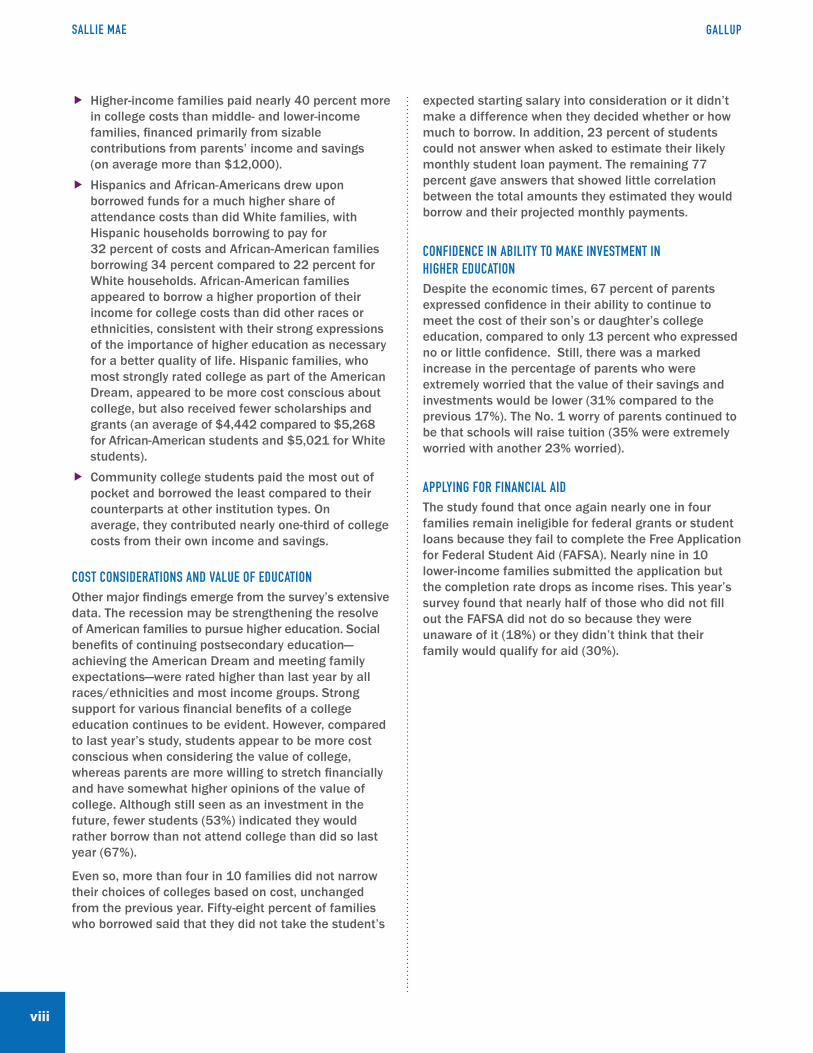
Higher-income families paid nearly 40 percent more in college costs than middle- and lower-income families, financed primarily from sizable contributions from parents’ income and savings (on average more than $12,000).
Hispanics and African-Americans drew upon borrowed funds for a much higher share of attendance costs than did White families, with Hispanic households borrowing to pay for 32 percent of costs and African-American families borrowing 34 percent compared to 22 percent for White households. African-American families appeared to borrow a higher proportion of their income for college costs than did other races or ethnicities, consistent with their strong expressions of the importance of higher education as necessary for a better quality of life. Hispanic families, who most strongly rated college as part of the American Dream, appeared to be more cost conscious about college, but also received fewer scholarships and grants (an average of $4,442 compared to $5,268 for African-American students and $5,021 for White students).
Community college students paid the most out of pocket and borrowed the least compared to their counterparts at other institution types. On average, they contributed nearly one-third of college costs from their own income and savings.
cosT consiDerATions AnD VAlUe of eDUcATionOther major findings emerge from the survey’s extensive data. The recession may be strengthening the resolve of American families to pursue higher education. Social benefits of continuing postsecondary education—achieving the American Dream and meeting family expectations—were rated higher than last year by all races/ethnicities and most income groups. Strong support for various financial benefits of a college education continues to be evident. However, compared to last year’s study, students appear to be more cost conscious when considering the value of college, whereas parents are more willing to stretch financially and have somewhat higher opinions of the value of college. Although still seen as an investment in the future, fewer students (53%) indicated they would rather borrow than not attend college than did so last year (67%).
Even so, more than four in 10 families did not narrow their choices of colleges based on cost, unchanged from the previous year. Fifty-eight percent of families who borrowed said that they did not take the student’s
expected starting salary into consideration or it didn’t make a difference when they decided whether or how much to borrow. In addition, 23 percent of students could not answer when asked to estimate their likely monthly student loan payment. The remaining 77 percent gave answers that showed little correlation between the total amounts they estimated they would borrow and their projected monthly payments.
confiDence in ABiliTy To mAke inVesTmenT in HigHer eDUcATionDespite the economic times, 67 percent of parents expressed confidence in their ability to continue to meet the cost of their son’s or daughter’s college education, compared to only 13 percent who expressed no or little confidence. Still, there was a marked increase in the percentage of parents who were extremely worried that the value of their savings and investments would be lower (31% compared to the previous 17%). The No. 1 worry of parents continued to be that schools will raise tuition (35% were extremely worried with another 23% worried).
APPlying for finAnciAl AiD The study found that once again nearly one in four families remain ineligible for federal grants or student loans because they fail to complete the Free Application for Federal Student Aid (FAFSA). Nearly nine in 10 lower-income families submitted the application but the completion rate drops as income rises. This year’s survey found that nearly half of those who did not fill out the FAFSA did not do so because they were unaware of it (18%) or they didn’t think that their family would qualify for aid (30%).
�
The following report presents the findings of a quantitative survey research program conducted by Gallup, Inc. on behalf of Sallie Mae. The overall objective of the study was to determine how American families are paying for higher education. The study also measures public attitudes toward college and various topics related to funding college. To achieve this goal, Gallup, Inc. conducted over 1,600 interviews with adults residing in telephone households in the United States. The study included a national survey of 800 undergraduate students and 804 parents of undergraduates aged 18-24 who had been enrolled in an institution of higher learning in academic year 2008-09.
meTHoDology
ME
TH
OD
OLO
GY

�
gAllUPsAllie mAe
The surveys were conducted from March 20 through April 17, 2009. Up to five calls were made to each household to reach an eligible respondent, that is, one initial call plus four additional calls if necessary. The sampling frames used for this study included (1) a national sample of adults from the Gallup Panel who indicated they had a child attending college in a previ-ous panel survey in Fall 2008, (2) a national sample of adults aged 18-24 from the Gallup Panel who had at least a high school degree, (3) a national listed sample of current college students, (4) a national listed sample of Hispanic college students, and (5) a national listed sample of African-American college students. The par-ent data set was statistically adjusted (weighted) using the following variables: race/ethnicity, region, gender, education and age as defined by the most recent data from the Current Population Survey (CPS), conducted by the U.S. Census Bureau. The student data set was statistically adjusted (weighted) using age and gender to match the proportions for college students from the most recent CPS data. The final results of the parent population survey are representative of adults age 18 and over residing in households with telephones. The final results of the student population survey are representative of college students.
The questionnaire was developed in consultation with representatives from Sallie Mae and Gallup, Inc. All interviewing was supervised and conducted by Gallup, Inc.’s full-time interviewing staff. For results based on the total sample size of 1,604, one can say with 95 percent confidence that the error attributable to sampling and other random effects could be plus or minus 3 percentage points. For results based on student-only or parent-only responses the overall sampling error based on approximately 800 interviews each is plus or minus 5 percentage points. For sub-groups within these populations, e.g. race, income, etc. the sampling error would be greater. In addition to sampling error, question wording and practical difficulties in conducting surveys can introduce error or bias into the finding of opinion polls. The profile of the respondents interviewed and tables of recommended sampling tolerances are located in the Technical Appendix to this report. The following presents key findings of the survey. Included in the detailed findings are the results of all items queried. The base population for each question is all respondents (college students and parents of college students) unless otherwise noted. Reported frequencies may not add up to 100 percent due to rounding.
comPosiTe fUnDing soUrcesThe How America Pays for College study endeavors to illustrate how the “typical American family” is paying for an undergraduate’s college. To create this illustration, Gallup has created mathematically representative composites from answers to the survey questions related to how and how much respondents paid for college. The result is a series of composite pictures of how the “average American family” pays for college: first, total population including all subgroups of the college-going population and their families, and, second, by several subgroups including by type of institution, by race or ethnicity, across income groups, and by families who borrowed vs. families who did not borrow to pay for college this year.
To create these composites, Gallup used two sources of information from the survey about the cost of tuition. First, respondents were asked the unaided total cost of school including tuition, room and board, and other miscellaneous expenses (see “Total Cost of Attendance” in Detailed Findings). Then respondents were asked about specific listed sources such as: parent current income, scholarships received, parent savings, and federal student loans (see “Funding Sources” in Detailed Findings). When aided with itemized queries in this way, respondents often recalled costs for which they hadn’t accounted in their original unaided responses.
Gallup scientists gave precedence to these itemized responses for computing the total cost of college. In those cases where the respondents could not remember from where some or all of the money used to pay for college actually came, Gallup scientists created a category to account for costs from “unknown” sources. However, for purposes of reporting the cost components, Gallup scientists made the simplifying assumption that the unknowns would resemble the knowns and removed them from the percentages to make the estimates clearer and more useful. This practice is called “percentaging,” and is a common practice for reporting data.
Results of Gallup’s computations can be found in Tables 2a, 2b, 2c, 2d, 3a, 3b, 3c and 3d. Using the data from these tables, Sallie Mae representatives composed and Gallup reviewed the narrative text in Section 4, “How American Families Pay for College.”

�
H o w A m e r i c A P A y s f o r c o l l e g e2 0 0 9
How AmericAn fAmilies PAy for college
The How America Pays for College study, based on a nationally representative survey of 1,604 college students and parents, provides great insight into how American families pay for the significant investment in an undergraduate college education. By combining the information about funding used from various sources, the study reveals the importance of each of these sources and how families differ in their approach to paying college costs.
Gallup initially created a series of mathematically repre-sentative composites1 for the 2008 study by aggregat-ing the information families provided on the amounts of money paid from each of the various sources they used to pay the total cost of attendance. This year’s survey improved the reporting of income, savings, scholarships and other non-borrowed funding sources, resulting in an improved picture of the many resources families tap to pay for college.
The average American family continued to rely heavily on parent contributions to pay for the cost of college. Parents, through income, savings, and borrowing, paid 45 percent of the total costs of college in academic year 2008-09, similar to the level reported for the 2007-08 school year. Parents paid 36 percent of college costs from current income and savings and an additional 9 percent of college costs from their own borrowing.
In combination, grants and scholarships followed parent contributions as the second largest source of funding for families paying for college, covering 25 percent of total costs.
Students contributed a sizable portion of their cost of attendance with approximately one-quarter of total costs coming from either student personal assets (com-bined savings and income earned while in school) or borrowed funds. Specifically, student borrowing paid for 14 percent of college costs. Combined with parent borrowing, total borrowing covered 23 percent of college costs in academic year 2008-09.
Finally, families reported that relatives and friends paid for a relatively small but significant share of college costs, 6 percent, in academic year 2008-09.
Parents paid nearly one-fourth of all college costs on a pay-as-you-earn basis, from their current income. Parent current income was the largest single source of all identified financial sources used to pay for college in 2008-09, contributing 23 percent of total costs.
The combined contribution of all parent savings vehicles—529 college savings plans, retirement savings, and other savings and investments—was 13 percent of total costs. College savings plans funded, on average, 5 percent of college costs with other savings and investments providing 7 percent. Families paid only 1 percent of college costs, on average, through IRA or other retirement savings withdrawals.
1 See composite funding sources explanation in the Methodology section, page 2.
ParentBorrowing
9%
Student Borrowing14%
Parent Income & Savings36%
Student Income& Savings
10%
Grants& Scholarships
25%
Relatives& Friends
6%Parent
Borrowing
StudentBorrowing
Grants &Scholarships
StudentIncome &
Savings
Friends &Relatives
Parent Income& Savings
Current Income23%
College Savings Plan 5 %
Other Savings & Investments7%
Retirement Withdrawal 1%
Fig. 1 How the Average Family Pays for College: Average Percent of Total Cost of Attendance Paid from Each Source
Fig. 2 Parent Contributions from Income & Savings
composite View of funding sources
HO
W A
ME
RIC
AN
FA
MIL
IES
PAY
FO
R C
OLLE
GE
�
gAllUPsAllie mAe
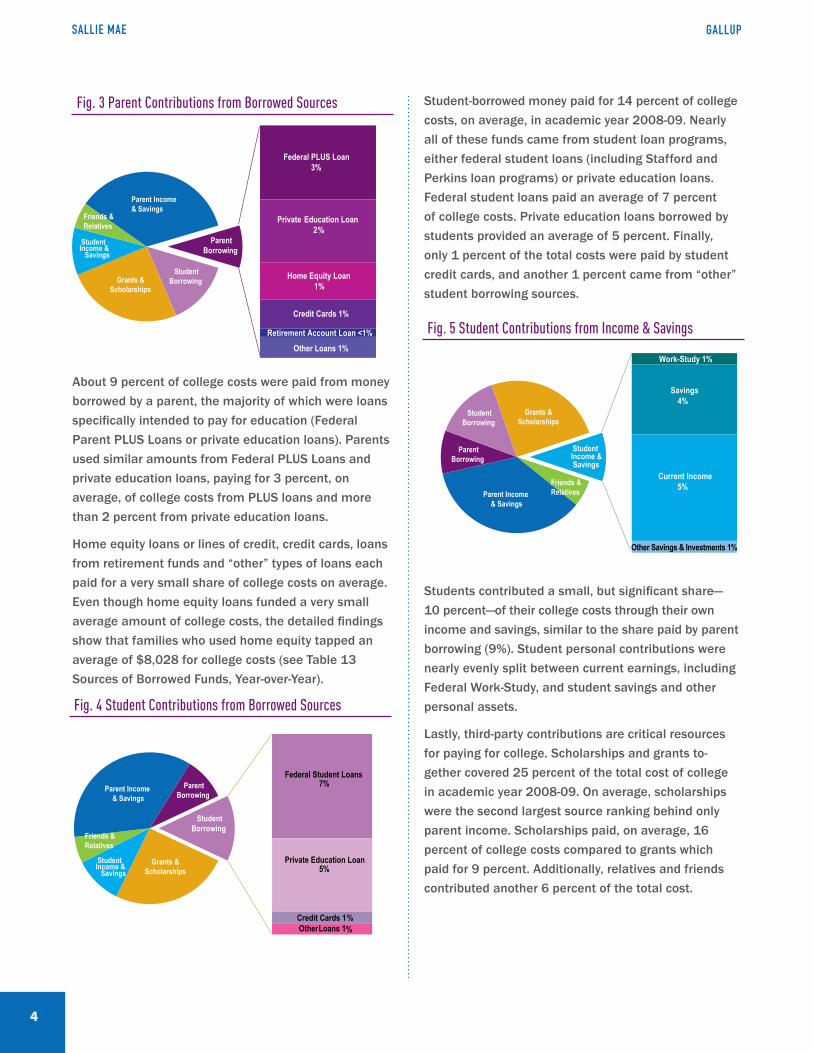
About 9 percent of college costs were paid from money borrowed by a parent, the majority of which were loans specifically intended to pay for education (Federal Parent PLUS Loans or private education loans). Parents used similar amounts from Federal PLUS Loans and private education loans, paying for 3 percent, on average, of college costs from PLUS loans and more than 2 percent from private education loans.
Home equity loans or lines of credit, credit cards, loans from retirement funds and “other” types of loans each paid for a very small share of college costs on average. Even though home equity loans funded a very small average amount of college costs, the detailed findings show that families who used home equity tapped an average of $8,028 for college costs (see Table 13 Sources of Borrowed Funds, Year-over-Year).
Student-borrowed money paid for 14 percent of college costs, on average, in academic year 2008-09. Nearly all of these funds came from student loan programs, either federal student loans (including Stafford and Perkins loan programs) or private education loans. Federal student loans paid an average of 7 percent of college costs. Private education loans borrowed by students provided an average of 5 percent. Finally, only 1 percent of the total costs were paid by student credit cards, and another 1 percent came from “other” student borrowing sources.
Students contributed a small, but significant share— 10 percent—of their college costs through their own income and savings, similar to the share paid by parent borrowing (9%). Student personal contributions were nearly evenly split between current earnings, including Federal Work-Study, and student savings and other personal assets.
Lastly, third-party contributions are critical resources for paying for college. Scholarships and grants to-gether covered 25 percent of the total cost of college in academic year 2008-09. On average, scholarships were the second largest source ranking behind only parent income. Scholarships paid, on average, 16 percent of college costs compared to grants which paid for 9 percent. Additionally, relatives and friends contributed another 6 percent of the total cost.
Student
Private
Parent Income & Savings
Friends &Relatives
ParentBorrowing
StudentBorrowingGrants &
Scholarships
StudentIncome &
Savings
Federal PLUS 3%
Private2%
1%
Private
Federal PLUS Loan 3%
Private Education Loan 2%
Home Equity Loan1%
Credit Cards 1%
Other Loans 1%Retirement Account Loan <1%
Student
ParentBorrowing
Parent Income & Savings
StudentBorrowing
Grants &Scholarships
StudentIncome &
Savings
Friends &Relatives
Federal Student Loans7%
Private Education Loan5%
Credit Cards 1%OtherLoans 1%
Student
ParentBorrowing
Parent Income & Savings
StudentBorrowing
Grants &Scholarships
StudentIncome & Savings
Friends &Relatives
Work-Study 1%
Savings4%
Current Income5%
Other Savings & Investments 1%
Fig. 3 Parent Contributions from Borrowed Sources
Fig. 4 Student Contributions from Borrowed Sources
Fig. 5 Student Contributions from Income & Savings

�
H o w A m e r i c A P A y s f o r c o l l e g e2 0 0 9
impact of family income on Paying for college
2Methodology change from 2008 to 2009. Middle income in our 2008 study encompassed families earning $50,000 to up to $100,000 per year and the lower-income group included families earning less than $50,000. To align more closely with income breaks used by the U.S. Department of Education’s quadrennial National Postsecondary Student Aid Study (NPSAS), middle-income in this 2009 report represents families with income between $35,000 and up to $100,000 per year, and lower-income represents families earning less than $35,000 per year.
Fig. 7 How the Average Family Pays for College, Funding Source Share, by Income Level
Fig. 6 How the Average Family Pays for College, by Income Level
$23,817
$17,383
$7,150$4,417 $4,642
$1,222
$885 $1,276
$2,173
$2,101 $1,453
$2,332$5,319
$12,092$847 $1,695
$2,497
$3,231 $2,966
$1,857
0
$5,000
$10,000
$15,000
$20,000
$25,000
0 - <$35k $35k - <$100k $100k and above
$16,955
Parent Borrowing Student BorrowingParent Income and SavingsStudent Income and SavingsGrants and Scholarships Relatives and Friends
14%
10%
25%
42%25% 20%
7%
5%5%
13%
12%6%
14%
31% 51%
5% 10%10%19% 17%8%
0
10%
20%
30%
40%
50%
60%
70%
80%
90%
100%
0 - <$35k $35k - <$100k $100k and above
Parent Borrowing Student BorrowingParent Income and SavingsStudent Income and SavingsGrants and Scholarships Relatives and Friends
Income affects choices families make about how much to pay for college, as well as the sources of funding they draw upon to cover the costs. Higher-income families paid much more for college in academic year 2008-09 than did families in the lower and middle-income2 groups. Those with annual earnings of $100,000 or
more per year paid, on average, $23,817 for the total cost of college. This amount was 40 percent higher than the $16,955 average total cost paid by families earning less than $35,000 per year and 37 percent higher than the $17,383 paid by middle-income families.
HO
W A
ME
RIC
AN
FA
MIL
IES
PAY
FO
R C
OLLE
GE
�
gAllUPsAllie mAe
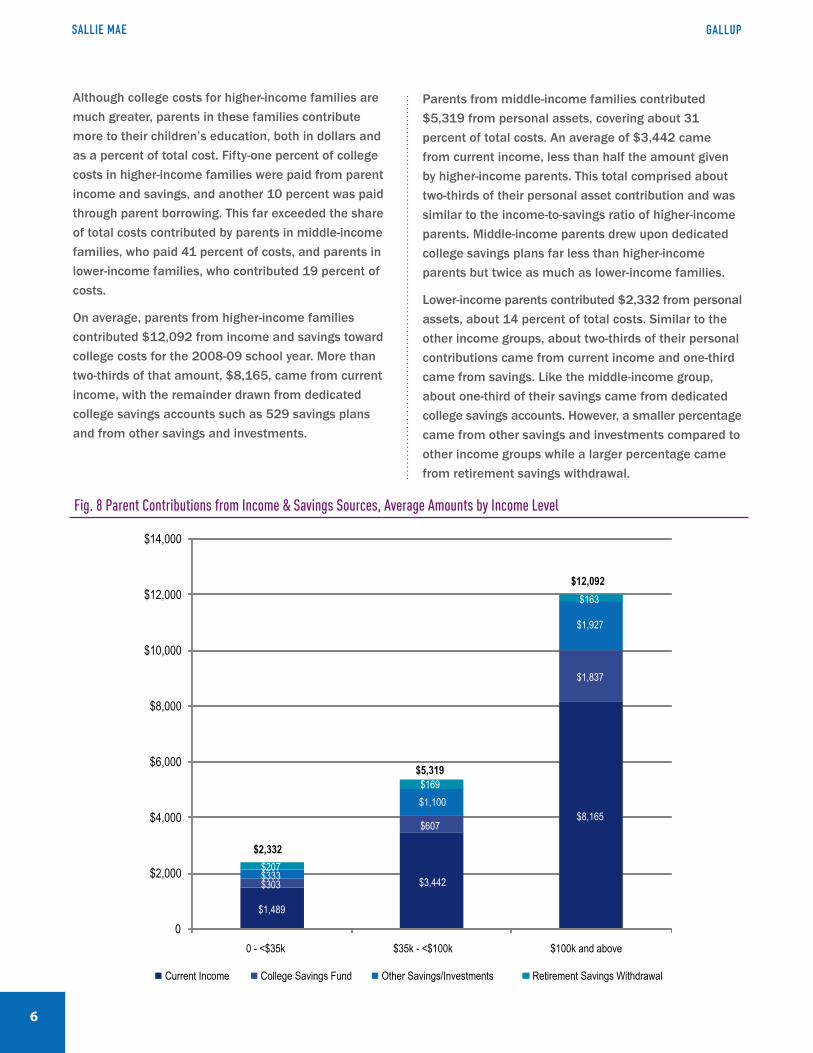
Although college costs for higher-income families are much greater, parents in these families contribute more to their children’s education, both in dollars and as a percent of total cost. Fifty-one percent of college costs in higher-income families were paid from parent income and savings, and another 10 percent was paid through parent borrowing. This far exceeded the share of total costs contributed by parents in middle-income families, who paid 41 percent of costs, and parents in lower-income families, who contributed 19 percent of costs.
On average, parents from higher-income families contributed $12,092 from income and savings toward college costs for the 2008-09 school year. More than two-thirds of that amount, $8,165, came from current income, with the remainder drawn from dedicated college savings accounts such as 529 savings plans and from other savings and investments.
Parents from middle-income families contributed $5,319 from personal assets, covering about 31 percent of total costs. An average of $3,442 came from current income, less than half the amount given by higher-income parents. This total comprised about two-thirds of their personal asset contribution and was similar to the income-to-savings ratio of higher-income parents. Middle-income parents drew upon dedicated college savings plans far less than higher-income parents but twice as much as lower-income families.
Lower-income parents contributed $2,332 from personal assets, about 14 percent of total costs. Similar to the other income groups, about two-thirds of their personal contributions came from current income and one-third came from savings. Like the middle-income group, about one-third of their savings came from dedicated college savings accounts. However, a smaller percentage came from other savings and investments compared to other income groups while a larger percentage came from retirement savings withdrawal.
Fig. 8 Parent Contributions from Income & Savings Sources, Average Amounts by Income Level
$1,489
$3,442
$8,165
$303
$607
$1,837
$333
$1,100
$1,927
$207
$169
$163
0
$2,000
$4,000
$6,000
$8,000
$10,000
$12,000
$14,000
0 - <$35k $35k - <$100k $100k and above
Current Income College Savings Fund Other Savings/Investments Retirement Savings Withdrawal
$2,332
$5,319
$12,092
�
H o w A m e r i c A P A y s f o r c o l l e g e2 0 0 9
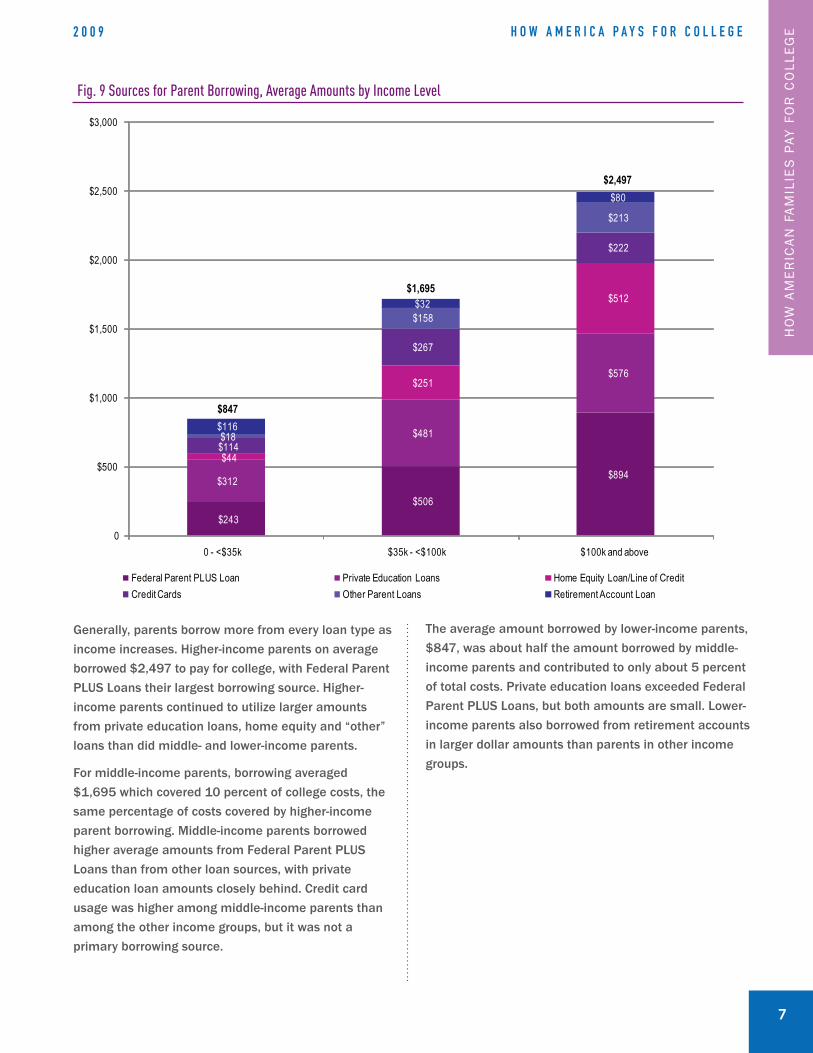
Generally, parents borrow more from every loan type as income increases. Higher-income parents on average borrowed $2,497 to pay for college, with Federal Parent PLUS Loans their largest borrowing source. Higher- income parents continued to utilize larger amounts from private education loans, home equity and “other” loans than did middle- and lower-income parents.
For middle-income parents, borrowing averaged $1,695 which covered 10 percent of college costs, the same percentage of costs covered by higher-income parent borrowing. Middle-income parents borrowed higher average amounts from Federal Parent PLUS Loans than from other loan sources, with private education loan amounts closely behind. Credit card usage was higher among middle-income parents than among the other income groups, but it was not a primary borrowing source.
The average amount borrowed by lower-income parents, $847, was about half the amount borrowed by middle-income parents and contributed to only about 5 percent of total costs. Private education loans exceeded Federal Parent PLUS Loans, but both amounts are small. Lower-income parents also borrowed from retirement accounts in larger dollar amounts than parents in other income groups.
Fig. 9 Sources for Parent Borrowing, Average Amounts by Income Level
$243$506
$894$312
$481
$576
$44
$251
$512
$114
$267
$222
$18
$158
$213
$116
$32
$80
0
$500
$1,000
$1,500
$2,000
$2,500
$3,000
0 - <$35k $35k - <$100k $100k and above
Federal Parent PLUS Loan Private Education Loans Home Equity Loan/Line of CreditCredit Cards Other Parent Loans Retirement Account Loan
$847
$1,695
$2,497
HO
W A
ME
RIC
AN
FA
MIL
IES
PAY
FO
R C
OLLE
GE

�
gAllUPsAllie mAe
Scholarships and grants account for the largest source of funding for lower-income families. The average combined scholarship and grant amount for lower-income students is $7,150, or 42 percent of college costs, with about three-fifths given as grants and two-fifths given as scholarships. Students from middle-income families received $4,417 in grants and scholarships, covering 25 percent of their college costs. The ratio of grants to scholarships is the inverse of that for lower-income students. Students from higher-income families received grant and scholarship aid
similar to that of middle-income students, $4,642, but mostly from scholarships. In fact, higher-income families received substantially more in scholarships, but less in grants, to pay for college costs than either lower- or middle-income families. This is most likely the result of a greater percentage of students from higher-income families attending more expensive, four-year private schools (see Table 5, Enrollment by Type of School).
Fig. 10 Funding from Grants & Scholarships, by Income Level
Fig. 11 Student Contributions from Income & Savings Sources, Average Amounts by Income Level
$4,338
$1,614$516
$2,812
$2,803$4,126
0
$1,000
$2,000
$3,000
$4,000
$5,000
$6,000
$7,000
$8,000
0 - <$35k $35k - <$100k $100k and aboveGrants Scholarships
$4,642$4,417
$7,150
$977 $1,229
$567
$627$724
$679
$347$84
$34
$222 $64
$173
0
$500
$1,000
$1,500
$2,000
$2,500
0 - <$35k $35k - <$100k $100k and above
Student Current Income Student Savings Federal Work Study Other Student Personal Assets
$1,453
$2,101$2,173

�
H o w A m e r i c A P A y s f o r c o l l e g e2 0 0 9
Looking at all student contributions—from borrowing, income and savings—the student’s responsibility for college costs decreases as family income increases, the inverse of parent contributions. Students from lower-income families shoulder more of the cost of college, measured both by dollars and percentage of total costs, from personal assets and borrowed money. Students from lower-income families contributed an average amount of $2,173 from income and savings and another $3,231 from borrowed money; com-bined, this paid for 32 percent of their college costs. Students from middle-income families contributed a similar amount, $2,101 from income and savings and $2,966 from borrowed money, which covered about 29 percent of their total cost of attendance. Students from the highest income group contributed about one-third fewer dollars from their own income and sav-ings and about two-fifths fewer dollars from borrowed sources than students from the lowest income group; combined personal contributions and borrowing covered about 14 percent of higher-income students’ total costs.
As with personal contributions, borrowing levels among lower-income students and middle-income
Fig. 12 Sources for Student Borrowing, Average Amounts by Income Level
$2,047
$1,489
$960
$897
$1,087
$766
$210
$178
$70
$77
$210
$61
0
$500
$1,000
$1,500
$2,000
$2,500
$3,000
$3,500
0 - <$35k $35k - <$100k $100k and above
Federal Student Loans Private Education Loans Student Credit Cards Other Student Loans
$1,857
$2,966$3,231
students were similar, while students from higher- income families borrowed far less ($1,857). In all in-come groups, education loans provided the bulk of bor-rowed funds, with federal student loan programs drawn upon the most, followed by private education loans. For lower-income families, nearly two-thirds of the funds from students’ borrowing came from federal student loan programs, an average of $2,047. For middle- and higher- income families, half of the funds from student borrowing came from federal student loan programs. Middle-income families used an average of $1,087 from private education loans, more than lower- or higher-income students. Borrowing from credit cards combined with other loans was minimal, about one-tenth of borrowed funds.
Contributions from relatives and friends play a similar role across income groups. Friends and relatives of lower-income students contributed an average of $1,222 which covered 7 percent of total costs. Friends and relatives of middle-income students contributed an average of $885, or 5 percent of total costs, and friends and relatives of higher-income students contributed an average of $1,276, also covering 5 percent of total costs.
HO
W A
ME
RIC
AN
FA
MIL
IES
PAY
FO
R C
OLLE
GE

10
gAllUPsAllie mAe
In academic year 2008-09, African-American and White families paid about the same total cost of attendance, averaging just under $20,000. Conversely, Hispanic families paid nearly 20 percent less, averaging $16,206.
African-American parents and students contributed less from their own personal income and savings and, on average, borrowed substantially more. Hispanic families spent significantly less on college. Differences in their funding composite most notably were lower amounts from income and savings and lower amounts from grants and scholarships.
The parents’ share of total costs (payment contributed from income, savings and borrowed money) was similar between African-American and White families. However, Hispanic parents contributed substantially less, particularly lower amounts of income and savings contributions.
African-American families reported paying $2,922 of college costs from money borrowed by a parent, sub-stantially more than the amounts borrowed by parents in Hispanic ($1,925) and White ($1,696) families. Of personal assets used, White parents contributed on average $4,810 from current income, African-American
parents $3,988 and Hispanic parents $3,295. Savings used by White parents amounted to $2,672, twice the savings contributions of African-American and Hispanic parents. Among the savings sources used, White parents paid a higher percentage of costs from dedicated college savings plans and other savings and investments than African-American or Hispanic parents, while Hispanic parents paid a higher percentage of costs from retirement savings than African-American or White parents.
In total, African-American and White families used similar amounts from grants and scholarships ($5,268 and $5,021, respectively), with Hispanic families using less ($4,442). For all three racial/ethnic groups, grants and scholarships combined covered about one-quarter of the total costs of college, but the ratio of grants to scholarships was very different. In both African-American and Hispanic families, more than half of this aid was allocated as grants. White students, on the other hand, received more than two-thirds of their gift aid as schol-arships.
For both African-American and Hispanic students, more of their share of college costs was paid through borrowing. African-American students borrowed, on average, $3,715, compared with $3,275 by Hispanic
Fig. 13 How the Average Family Pays for College, by Race or Ethnicity
10%
25%
$5,021 $5,268 $4,442
$1,191 $866$481
$1,949 $1,475$1,470
$7,482$5,357
$4,613
$1,696
$2,922
$1,925
$2,617$3,715
$3,275
0
$5,000
$10,000
$15,000
$20,000
$25,000
White African-American Hispanic
$16,206
$19,603$19,956
Parent Borrowing Student BorrowingParent Income and SavingsStudent Income and SavingsGrants and Scholarships Relatives and Friends
Differences in Paying for college among racial or ethnic groups
��
H o w A m e r i c A P A y s f o r c o l l e g e2 0 0 9
students and $2,617 for White students. Among all groups, federal student loans were the primary source of borrowed funds, followed by private education loans. Students borrowed between 89 and 94 percent of their loans from these two sources. Credit cards combined with other non-education-specific loans comprise the remaining borrowing sources, with Hispanic students putting more on credit cards than African-American or White students.
Personal assets contributed by African-American and Hispanic students were very similar, just under $1,500, and less than White student contributions of $1,949. Contributions sourced from current student income were similar across all three groups in dollar terms, while White students contributed about twice the amount from combined savings and other personal assets ($891) than did African-American and Hispanic stu-dents.
Relatives and friends helped modestly in defraying college costs across these three racial/ethnic groups, contributing 6 percent of total costs for White students, 4 percent of costs for African-American students and 3 percent of costs for Hispanic students.
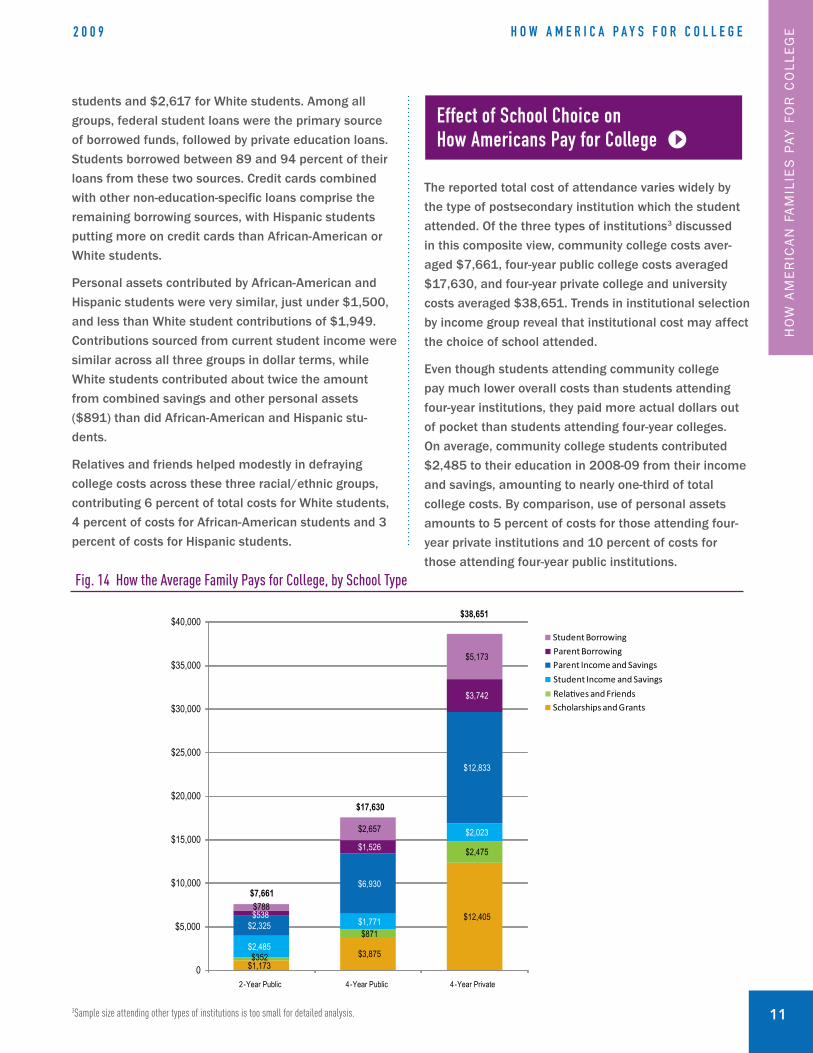
The reported total cost of attendance varies widely by the type of postsecondary institution which the student attended. Of the three types of institutions3 discussed in this composite view, community college costs aver-aged $7,661, four-year public college costs averaged $17,630, and four-year private college and university costs averaged $38,651. Trends in institutional selection by income group reveal that institutional cost may affect the choice of school attended.
Even though students attending community college pay much lower overall costs than students attending four-year institutions, they paid more actual dollars out of pocket than students attending four-year colleges. On average, community college students contributed $2,485 to their education in 2008-09 from their income and savings, amounting to nearly one-third of total college costs. By comparison, use of personal assets amounts to 5 percent of costs for those attending four-year private institutions and 10 percent of costs for those attending four-year public institutions.
3Sample size attending other types of institutions is too small for detailed analysis.
Fig. 14 How the Average Family Pays for College, by School Type
Relatives and FriendsScholarships and Grants
Student Income and Savings
Parent Income and Savings
Student Borrowing
Parent Borrowing
$1,173$3,875
$12,405
$352
$871
$2,475
$2,485
$1,771
$2,023
$2,325
$6,930
$12,833
$538
$1,526
$3,742
$788
$2,657
$5,173
0
$5,000
$10,000
$15,000
$20,000
$25,000
$30,000
$35,000
$40,000
2-Year Public 4-Year Public 4-Year Private
$38,651
$17,630
$7,661
effect of school choice on How Americans Pay for college
HO
W A
ME
RIC
AN
FA
MIL
IES
PAY
FO
R C
OLLE
GE

1�
gAllUPsAllie mAe
Dollars used from all other financial source categories are lowest among community college students and highest among those attending four-year private col-leges. Using borrowed funds as an example, parents on average borrowed $538 for community college students, $1,526 for four-year public college students and $3,742 for four-year private college students. Community college students borrowed an average of $788 while students attending four-year public institu-tions borrowed an average of $2,657 and those attend-ing four-year private institutions borrowed an average of $5,173. The shares of college cost borne by relatives/friends, parent borrowing and student borrowing were not vastly different across institutional types.
Contributions from parent income and savings were actually lower in dollar terms than similar personal contributions made by students attending community college. Conversely, parent personal assets at four-year institutions averaged four to six times the amount from student personal assets. The share of total cost financed by parent savings and income ranged between 30 and 39 percent at all three institutional types.
Significantly, the utilization of grants and scholarships is much lower among community college students than among those attending four-year institutions. Community college students received grants and scholarships covering approximately 15 percent of total college cost in 2008-09, with grants providing two-thirds of this aid. Students attending four-year public institutions received grants and scholarships at an average of 22 percent of total cost, which in dollar terms more than tripled the amount that community college students received, with scholarships comprising nearly three-fifths of this aid. Students attending four-year private colleges received 33 percent of total cost in grants and scholarships, more than twice the share of cost covered by grants and scholarships at community colleges, and, given the high expense of these private institutions, the dollar value of aid exceeded more than tenfold that of community college aid recipients. Nearly three-fourths of grant and scholarship aid at four-year private institutions came in the form of scholarships.

��
H o w A m e r i c A P A y s f o r c o l l e g e2 0 0 9
The How America Pays for College composites show that the average total cost paid by families who borrowed to pay for college in 2008-09, $22,821, was 33 percent more than the total cost paid by families who did not borrow, $17,143.
In families who borrowed, approximately 60 percent of the money was borrowed by students and 40 percent by parents. The average borrowed amount of $10,779 was close to half the total cost of attendance. Average personal assets and grants and scholarships equaled $12,042, far less than the combined personal assets and aid paid among families that didn’t borrow. Among families who took out loans, the borrowed amount not only covered the difference of $5,102 between the total cost paid by borrowers and non-borrowers—rather, it paid for approximately twice the cost difference.
Both groups received a similar amount of grant and scholarship aid in dollar terms, and students in both groups contributed nearly equal dollar amounts from their income and savings. Relatives and friends contributed somewhat more to students in non-borrowing families than to those in families who borrow, but the significant difference in source of contributions between these two groups was parent personal assets.
Contributions from parent income and savings toward costs of students in families who borrowed averaged $4,362, less than half the $8,870 contributed by parent personal assets in non-borrowing families. Parents in families who didn’t borrow paid 71 percent more from their own personal income, $5,500, compared to the amount contributed by parents in families who borrowed, $3,211. Further, the parent savings and investments by families who did not borrow was well more than three times the amount used by families who borrowed, $3,211 compared to $953. Parent personal assets covered about 19 percent of the total cost of attendance of students in families that borrowed but 52 percent of total cost in non-borrowing families.
25%
$5,073 $4,806
$698 $1,403$1,909 $2,064
$4,362
$8,870$4,232
$6,547
0
$5,000
$10,000
$15,000
$20,000
$25,000
Borrowers Non-borrowers
Scholarships and Grants Relatives and Friends Student Income and Savings
Parent Income and Savings Parent Borrowing Student Borrowing
$17,143
$22,821
Fig. 15 How the Average Family Pays for College, by Borrowing Status
Differences in meeting cost between families who Borrow and families who Don’t Borrow
HO
W A
ME
RIC
AN
FA
MIL
IES
PAY
FO
R C
OLLE
GE

1�
gAllUPsAllie mAe
Table 1 The Role of Various Funding Sources to Pay for College
Frequency of Sources and Average Amounts Used
% of Total Families
Average Amount
Non-borrowed Sources
Parent Income and Savings
Current Income 55% $7,175
College Savings Fund 11% $7,312
Retirement Savings Withdrawal 3% $5,318
Other Savings/Investments 14% $7,776
Student Income and Savings
Student Current Income 26% $2,369
Student Savings 25% $3,791
Federal Work Study 5% $1,893
Other Student Savings/Investments 2% $5,749
Scholarships and Grants
Scholarships 40% $6,907
Grants 30% $5,109
Relatives and Friends 17% $5,496
Borrowed Sources
Parent Borrowing
Federal Parent PLUS Loan 8% $7,664
Private Education Loans 5% $8,401
Home Equity Loan/Line of Credit 3% $8,028
Credit Cards 5% $3,886
Retirement Account Loan 1% $5,471
Other Parent Loans 3% $5,762
Student Borrowing
Federal Student Loans 25% $5,327
Private Education Loans 12% $7,516
Student Credit Cards 5% $2,812
Other Student Loans 2% $5,819
The composite views are an excellent way to examine which sources of funds and associated amounts, when spread across all families, contribute most to paying the total cost of college. However, as resourceful as many families are in building a college funding plan from a wide variety of payment sources, any given family is unlikely to use all of the identified sources in a given academic year to pay for college costs.
Table 1 identifies the percentage of families who actually used each source in academic year 2008-09, and the average amount paid among those who used the source. Important information can be gleaned about the roles these individual sources play for the families who use them, which may be more prominent than they appear in the composite views.
For example, the composite tells us that, with 9 percent of the total costs of college being paid through parent borrowing and 36 percent paid through parent personal assets, borrowing is less important in total than parent personal assets. However, for those families that do borrow, the borrowed amounts are significant in paying for college.
Although usage rates may be low for some sources, the average amounts drawn from these sources are significant. For a detailed examination of the use of the various funding sources, please see Funding Sources, page 23 in the Detailed Findings.
The role of Various funding sources to Pay for college

��
H o w A m e r i c A P A y s f o r c o l l e g e2 0 0 9
Table 2b Composite of College Funding Sources:
Average Value Contributed from Each Source, by Race/Ethnicity
Race/Ethnicity
Total White Black Hispanic
Borrowed Parents Federal Parent PLUS Loan $565 $508 $1,282 $482
Private Education Loans $481 $421 $948 $642
Home Equity Loan/Line of Credit $285 $337 $208 $189
Credit Cards $221 $195 $302 $326
Other Parent Loans $159 $195 $80 $69
Retirement Account Loan $65 $40 $102 $217
Student Federal Student Loans $1,424 $1,274 $2,447 $1,740
Private Education Loans $995 $1,038 $1,032 $1,163
Student Credit Cards $153 $134 $93 $306
Other Student Loans $149 $171 $143 $66
Non-Borrowed Parents Current Income $4,522 $4,810 $3,988 $3,295
College Savings Fund $950 $1,147 $211 $475
Other Savings/Investments $1,286 $1,420 $896 $475
Retirement Savings Withdrawal $176 $105 $262 $368
Student Student Current Income $1,062 $958 $887 $837
Student Savings $702 $767 $399 $437
Federal Work Study $115 $100 $126 $190
Other Student Personal Assets $117 $124 $63 $6
Other Scholarships $3,156 $3,560 $2,203 $1,980
Grants $1,751 $1,461 $3,065 $2,462
Relatives or Friends $1,099 $1,191 $866 $481
Table 2a Composite of College Funding Sources:
Average Value Contributed from Each Source, by Income Level
Income
Total <$35k $35k - <$100k $100k+
Borrowed Parents Federal Parent PLUS Loan $565 $243 $506 $894
Private Education Loans $481 $312 $481 $576
Home Equity Loan/Line of Credit $285 $44 $251 $512
Credit Cards $221 $114 $267 $222
Other Parent Loans $159 $18 $158 $213
Retirement Account Loan $65 $116 $32 $80
Student Federal Student Loans $1,424 $2,047 $1,490 $960
Private Education Loans $995 $897 $1,087 $766
Student Credit Cards $153 $210 $179 $70
Other Student Loans $149 $77 $210 $61
Non-Borrowed Parents Current Income $4,522 $1,489 $3,442 $8,165
College Savings Fund $950 $303 $607 $1,837
Other Savings/Investments $1,286 $333 $1,100 $1,927
Retirement Savings Withdrawal $176 $207 $169 $163
Student Student Current Income $1,062 $977 $1,229 $567
Student Savings $702 $627 $724 $679
Federal Work Study $115 $347 $84 $34
Other Student Personal Assets $117 $222 $64 $173
Other Scholarships $3,156 $2,812 $2,803 $4,126
Grants $1,751 $4,338 $1,614 $516
Relatives or Friends $1,099 $1,222 $885 $1,276
HO
W A
ME
RIC
AN
FA
MIL
IES
PAY
FO
R C
OLLE
GE

1�
gAllUPsAllie mAe
Table 2d Composite of College Funding Sources:
Average Value Contributed from Each Source, by Borrowing Status
Borrowing Status
Total Borrowed Did Not Borrow
Borrowed Parents Federal Parent PLUS Loan $565 $1,376 n/a
Private Education Loans $481 $1,138 n/a
Home Equity Loan/Line of Credit $285 $671 n/a
Credit Cards $221 $519 n/a
Other Parent Loans $159 $376 n/a
Retirement Account Loan $65 $152 n/a
Student Federal Student Loans $1,424 $3,445 n/a
Private Education Loans $995 $2,394 n/a
Student Credit Cards $153 $357 n/a
Other Student Loans $149 $351 n/a
Non-Borrowed Parents Current Income $4,522 $3,211 $5,500
College Savings Fund $950 $451 $1,330
Other Savings/Investments $1,286 $502 $1,881
Retirement Savings Withdrawal $176 $198 $159
Student Student Current Income $1,062 $1,212 $954
Student Savings $702 $500 $852
Federal Work Study $115 $149 $90
Other Student Personal Assets $117 $48 $168
Other Scholarships $3,156 $2,737 $3,474
Grants $1,751 $2,336 $1,332
Relatives or Friends $1,099 $698 $1,403
Table 2c Composite of College Funding Sources:
Average Value Contributed from Each Source, by School Type
Type of School
Total 2-Year Public 4-Year Public 4-Year Private
Borrowed Parents Federal Parent PLUS Loan $565 $118 $494 $1,229
Private Education Loans $481 $41 $354 $1,229
Home Equity Loan/Line of Credit $285 $113 $265 $496
Credit Cards $221 $209 $224 $254
Other Parent Loans $159 $17 $107 $468
Retirement Account Loan $65 $40 $82 $66
Student Federal Student Loans $1,424 $328 $1,507 $2,389
Private Education Loans $995 $380 $809 $2,311
Student Credit Cards $153 $46 $194 $168
Other Student Loans $149 $34 $147 $305
Non-Borrowed Parents Current Income $4,522 $1,626 $4,472 $8,373
College Savings Fund $950 $247 $890 $1,965
Other Savings/Investments $1,286 $402 $1,328 $2,378
Retirement Savings Withdrawal $176 $50 $240 $117
Student Student Current Income $1,062 $1,876 $739 $971
Student Savings $702 $500 $742 $809
Federal Work Study $115 $53 $103 $239
Other Student Personal Assets $117 $56 $187 $4
Other Scholarships $3,156 $393 $2,255 $9,132
Grants $1,751 $780 $1,620 $3,273
Relatives or Friends $1,099 $352 $871 $2,475

��
H o w A m e r i c A P A y s f o r c o l l e g e2 0 0 9
Table 3b Composite of College Funding Sources:
Average Percent of Total Cost of Attendance met by Each Source, by Race/Ethnicity
Race/Ethnicity
Total White Black Hispanic
Borrowed Parents Federal Parent PLUS Loan 3% 3% 7% 3%
Private Education Loans 2% 2% 5% 4%
Home Equity Loan/Line of Credit 1% 2% 1% 1%
Credit Cards 1% 1% 2% 2%
Other Parent Loans 1% 1% 0% 1%
Retirement Account Loan 0% 0% 0.5% 1%
Student Federal Student Loans 7% 6% 12% 11%
Private Education Loans 5% 5% 5% 7%
Student Credit Cards 1% 1% 0.5% 2%
Other Student Loans 1% 1% 1% 0.5%
Non-Borrowed Parents Current Income 23% 24% 20% 20%
College Savings Fund 5% 6% 1% 3%
Other Savings/Investments 7% 7% 5% 3%
Retirement Savings Withdrawal 1% 1% 1% 2%
Student Student Current Income 5% 5% 5% 5%
Student Savings 4% 4% 2% 3%
Federal Work Study 1% 0% 1% 1%
Other Student Personal Assets 1% 0% 0% 0%
Other Scholarships 16% 18% 11% 12%
Grants 9% 7% 16% 15%
Relatives or Friends 6% 6% 4% 3%
Table 3a Composite of College Funding Sources:
Average Percent of Total Cost of Attendance Met by Each Source, by Income Level
Income
Total <$35k $35k
- <$100k
$100k+
Borrowed Parents Federal Parent PLUS Loan 3% 1% 3% 4%
Private Education Loans 2% 2% 3% 2%
Home Equity Loan/Line of Credit 1% 0% 1% 2%
Credit Cards 1% 1% 2% 1%
Other Parent Loans 1% 0% 1% 1%
Retirement Account Loan 0% 1% 0% 0.5%
Student Federal Student Loans 7% 12% 9% 4%
Private Education Loans 5% 5% 6% 3%
Student Credit Cards 1% 1% 1% 0.5%
Other Student Loans 1% 0% 1% 0.5%
Non-Borrowed Parents Current Income 23% 9% 20% 34%
College Savings Fund 5% 2% 3% 8%
Other Savings/Investments 7% 2% 6% 8%
Retirement Savings Withdrawal 1% 1% 1% 1%
Student Student Current Income 5% 6% 7% 2%
Student Savings 4% 4% 4% 3%
Federal Work Study 1% 2% 0% 0%
Other Student Personal Assets 1% 1% 0% 1%
Other Scholarships 16% 17% 16% 17%
Grants 9% 26% 9% 2%
Relatives or Friends 6% 7% 5% 5%
HO
W A
ME
RIC
AN
FA
MIL
IES
PAY
FO
R C
OLLE
GE

1�
gAllUPsAllie mAe
Table 3d Composite of College Funding Sources:
Average Percent of Total Cost of Attendance Met by Each Source, by Borrowing Status
Borrowing Status
Total Borrowed Did Not Borrow
Borrowed Parents Federal Parent PLUS Loan 3% 6% n/a
Private Education Loans 2% 5% n/a
Home Equity Loan/Line of Credit 1% 3% n/a
Credit Cards 1% 2% n/a
Other Parent Loans 1% 2% n/a
Retirement Account Loan 0% 1% n/a
Student Federal Student Loans 7% 15% n/a
Private Education Loans 5% 10% n/a
Student Credit Cards 1% 2% n/a
Other Student Loans 1% 2% n/a
Non-Borrowed Parents Current Income 23% 14% 32%
College Savings Fund 5% 2% 8%
Other Savings/Investments 7% 2% 11%
Retirement Savings Withdrawal 1% 1% 1%
Student Student Current Income 5% 5% 6%
Student Savings 4% 2% 5%
Federal Work Study 1% 1% 0%
Other Student Personal Assets 1% 0% 1%
Other Scholarships 16% 12% 20%
Grants 9% 10% 8%
Relatives or Friends 6% 3% 8%
Table 3c Composite of College Funding Sources:
Average Percent of Total Cost of Attendance Met by Each Source, by School Type
Type of School
Total 2-Year Public 4-Year Public 4-Year Private
Borrowed Parents Federal Parent PLUS Loan 3% 2% 3% 3%
Private Education Loans 2% 1% 2% 3%
Home Equity Loan/Line of Credit 1% 1% 2% 1%
Credit Cards 1% 3% 1% 1%
Other Parent Loans 1% 0% 1% 1%
Retirement Account Loan 0% 1% 0% 0%
Student Federal Student Loans 7% 4% 9% 6%
Private Education Loans 5% 5% 5% 6%
Student Credit Cards 1% 1% 1% 0.5%
Other Student Loans 1% 0% 1% 1%
Non-Borrowed Parents Current Income 23% 21% 25% 22%
College Savings Fund 5% 3% 5% 5%
Other Savings/Investments 7% 5% 8% 6%
Retirement Savings Withdrawal 1% 1% 1% 0%
Student Student Current Income 5% 24% 4% 3%
Student Savings 4% 6% 4% 2%
Federal Work Study 1% 1% 0% 1%
Other Student Personal Assets 1% 1% 1% 0%
Other Scholarships 16% 5% 13% 24%
Grants 9% 10% 9% 8%
Relatives or Friends 6% 5% 5% 6%

��
H o w A m e r i c A P A y s f o r c o l l e g e2 0 0 9
COST OF ATTENDANCE
For the 2008-2009 school year, what is the total cost of attendance per year, including tuition, room and board, and any other school costs, for enrolled students at your/your child’s school, without any financial aid?
Families reported that their average cost of attendance for the 2008-09 school year was $15,931, a 9 percent increase from the self-reported cost of attendance in 2007-08. Two-year community colleges had the lowest average cost at $5,608 per year, a 7 percent increase from their reported cost the previous year. Four-year state colleges and universities ($14,122) experienced a 3 percent increase from 2007-08. Four-year private colleges and universities were more than twice the aver-age yearly cost for all students at $32,454 per year, an increase of 17 percent from reported cost in 2007-08.
DeTAileD finDings
Fig. 16 Cost of Attendance, Year-over-Year, by School Type
cost of Attendance
4When estimating the amount spent from itemized sources, combined amounts exceed the initial cost of attendance reported by participants. The overall average cost of attendance reported initially was $15,931 while the average overall total cost calculated on itemized sources was $19,433.
$5,608
$14,122
$32,454
$15,931
$5,263
$13,706
$27,679
$14,628
$0 $5,000 $10,000 $15,000 $20,000 $25,000 $30,000 $35,000
2-Year Public or Community
4-Year State
4-Year Private
Total
2008 2009
Cost of attendance, driven primarily by school type, has a direct impact on how much families pay for college, thus on how they pay as well. The average reported costs of attendance in this section were provided by respondents prior to questions about amounts paid by each source of funds.4
The yearly cost of attendance was similar for respondents earning less than $100,000 per year. Families earning less than $35,000 per year reported costs averaging $14,588 while families earning from $50,000 up to $100,000 reported average costs of $14,264. Fami-lies earning between $35,000 and less than $50,000 annually reported costs of $13,511, a total cost of attendance 31 percent higher than what was reported by this income group in 2008, bringing them to similar cost levels as respondents with income categories just below and above them. Respondents earning between $100,000 and less than $150,000 per year attended institutions with an average total cost of attendance of $16,670. High-income respondents reported costs that were 64 percent more than the overall average. The highest-income households, those earning more than
DE
TAIL
ED
FIN
DIN
GS

�0
gAllUPsAllie mAe
$14,559
$10,338
$13,772
$17,449
$20,785
$14,588$13,511 $14,264
$16,670
$25,072
$0
$5,000
$10,000
$15,000
$20,000
$25,000
$30,000
<$35k $35k - <$50k $50k - <$100k $100k - <$150k $150k+
Total
Cos
t of A
ttend
ance
Annual Household Income
2008 2009
Fig. 17 Cost of Attendance, Year-over-Year, by Income Level
Table 4 Total Cost of Attendance
N Mean
Total 1401 $15,931
Income
<$35k 221 $14,588
$35-$50k 158 $13,511
$50-$100k 489 $14,264
$100-$150k 262 $16,670
$150k+ 175 $25,072
Race/Ethnicity
White 906 $16,367
Black 198 $16,021
Hispanic 183 $13,206
Type of School
4-Year State College/University 848 $14,122
4-Year Private College/University 253 $32,454
2-Year Public/Community College 278 $5,608
2-Year Private College 6 *
<2-Year Private Technical 12 *
Full-Time/Part-Time
Full-Time 1276 $16,927
Part-Time 116 $8,422
*Note: Small sample sizes. Please refer to Sampling Tolerance in Technical Appendix.
$150,000 per year, reported the highest cost of attendance: $25,072 per year. This group also experienced a dramatic increase (21%) in average cost of attendance from 2007-08 to 2008-09.
Students attending two-year or less than two-year institutions were more likely to attend part-time than students attending four-year institutions. The aver-age yearly cost of attendance for part-time study was $8,422 compared to $16,927 for full-time study.
Hispanics attended institutions that cost less ($13,206) than the institutions Whites ($16,367) or African-Americans ($16,021) attended.
2�
H o w A m e r i c A P A y s f o r c o l l e g e2 0 0 9
SCHOOL TYPE ENROLLMENT
Please tell me what type of college or university your child is/you are currently attending...
A 4-year state college or university
A 4-year private college or university
A 2-year public or community college
A 2-year private college
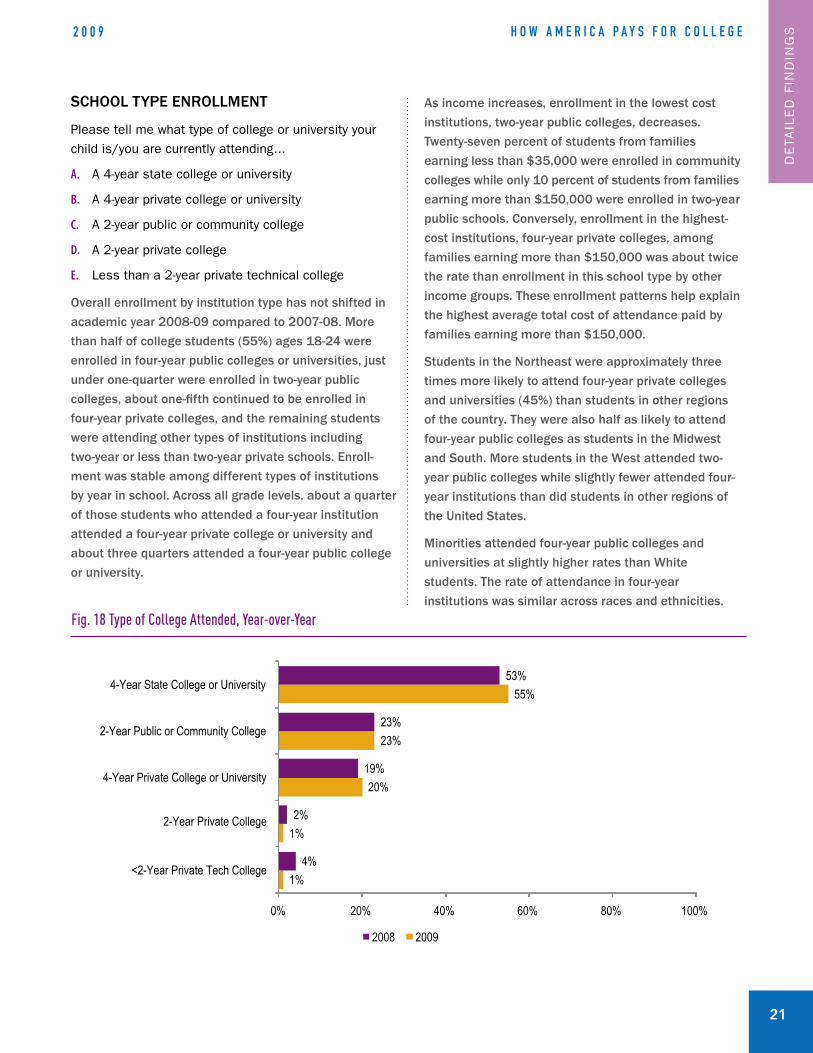
Less than a 2-year private technical college
Overall enrollment by institution type has not shifted in academic year 2008-09 compared to 2007-08. More than half of college students (55%) ages 18-24 were enrolled in four-year public colleges or universities, just under one-quarter were enrolled in two-year public colleges, about one-fifth continued to be enrolled in four-year private colleges, and the remaining students were attending other types of institutions including two-year or less than two-year private schools. Enroll-ment was stable among different types of institutions by year in school. Across all grade levels, about a quarter of those students who attended a four-year institution attended a four-year private college or university and about three quarters attended a four-year public college or university.
A.
B.
C.
D.
E.
Fig. 18 Type of College Attended, Year-over-Year
1%
1%
20%
23%
55%
4%
2%
19%
23%
53%
<2-Year Private Tech College
2-Year Private College
4-Year Private College or University
2-Year Public or Community College
4-Year State College or University
0% 20% 40% 60% 80% 100%
2008 2009
As income increases, enrollment in the lowest cost institutions, two-year public colleges, decreases. Twenty-seven percent of students from families earning less than $35,000 were enrolled in community colleges while only 10 percent of students from families earning more than $150,000 were enrolled in two-year public schools. Conversely, enrollment in the highest-cost institutions, four-year private colleges, among families earning more than $150,000 was about twice the rate than enrollment in this school type by other income groups. These enrollment patterns help explain the highest average total cost of attendance paid by families earning more than $150,000.
Students in the Northeast were approximately three times more likely to attend four-year private colleges and universities (45%) than students in other regions of the country. They were also half as likely to attend four-year public colleges as students in the Midwest and South. More students in the West attended two-year public colleges while slightly fewer attended four-year institutions than did students in other regions of the United States.
Minorities attended four-year public colleges and universities at slightly higher rates than White students. The rate of attendance in four-year institutions was similar across races and ethnicities.
DE
TAIL
ED
FIN
DIN
GS
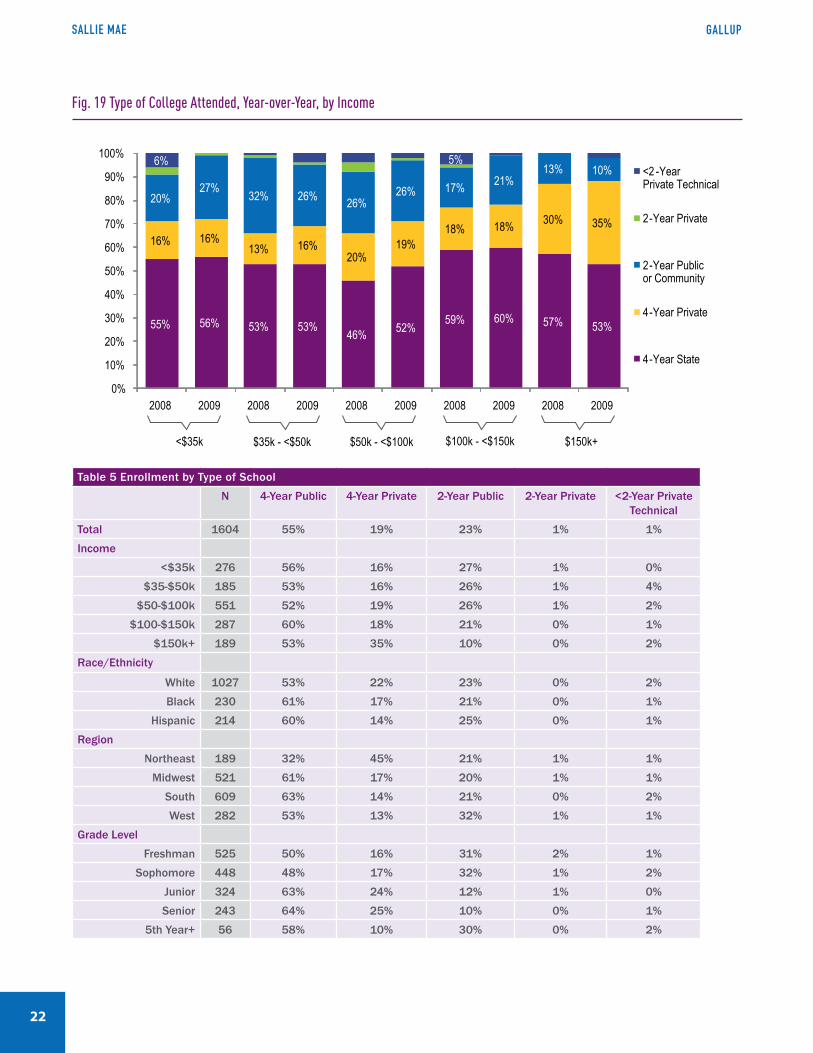
��
gAllUPsAllie mAe
Fig. 19 Type of College Attended, Year-over-Year, by Income
Table 5 Enrollment by Type of School
N 4-Year Public 4-Year Private 2-Year Public 2-Year Private <2-Year Private Technical
Total 1604 55% 19% 23% 1% 1%
Income
<$35k 276 56% 16% 27% 1% 0%
$35-$50k 185 53% 16% 26% 1% 4%
$50-$100k 551 52% 19% 26% 1% 2%
$100-$150k 287 60% 18% 21% 0% 1%
$150k+ 189 53% 35% 10% 0% 2%
Race/Ethnicity
White 1027 53% 22% 23% 0% 2%
Black 230 61% 17% 21% 0% 1%
Hispanic 214 60% 14% 25% 0% 1%
Region
Northeast 189 32% 45% 21% 1% 1%
Midwest 521 61% 17% 20% 1% 1%
South 609 63% 14% 21% 0% 2%
West 282 53% 13% 32% 1% 1%
Grade Level
Freshman 525 50% 16% 31% 2% 1%
Sophomore 448 48% 17% 32% 1% 2%
Junior 324 63% 24% 12% 1% 0%
Senior 243 64% 25% 10% 0% 1%
5th Year+ 56 58% 10% 30% 0% 2%
55% 56% 53% 53% 46% 52% 59% 60% 57% 53%
16% 16%13% 16%
20%19%
18% 18% 30% 35%
20%27% 32% 26% 26%
26% 17% 21%13% 10%
6% 5%
0%
10%
20%
30%
40%
50%
60%
70%
80%
90%
100%
2008 2009 2008 2009 2008 2009 2008 2009 2008 2009
<2 -YearPrivate Technical
2-Year Private
2-Year Public or Community
4-Year Private
4-Year State
<$35k $35k - <$50k $50k - <$100k $100k - <$150k $150k+

2�
H o w A m e r i c A P A y s f o r c o l l e g e2 0 0 9
The composite5 representation of how families of traditional undergraduate students paid for college in academic year 2008-09 typifies usage of all financial resources used across all families. Although most families rely on multiple funding sources, realistically, all families don’t access all sources identified. Family circumstances— economic, attitudinal and experiential—all contribute to how a funding package is assembled for an individual student. This section highlights detail around the percentage of families that utilize a given funding source and the average amounts used by participating families.
The categories of sources of funding have been grouped into six areas: parent personal contributions (comprised of parent income and savings), student personal contributions (comprised of student income and savings), scholarships and grants, contributions from relatives and friends, money borrowed by the student, and money borrowed by the parent.
Of all sources of funding used to pay college costs, parent personal contributions were the most frequently utilized. Fifty-nine percent of all families used some funds from parent income and savings. Over half of families (51%) reported using grants and/or scholarships to pay for college. More students used their own income and/or savings to pay for a portion of their college costs than borrowed. Four out of 10 students paid some of their college costs from personal contributions while three out of 10 reported that they paid for college through student borrowing. Contributions from relatives and friends were used by 17 percent of families. Fifteen percent of families reported using money borrowed by the parent to pay for college in 2008-09.6
Following are detailed breakouts of these funding categories, including itemized sources within each category specified in the survey questions.
funding sources
59%
51%
42%
29%
17% 15%
0%
10%
20%
30%
40%
50%
60%
70%
Parent Personal Contributions
Grants/Scholarships
Student Personal Contributions
StudentBorrowing
Relatives/Friends
ParentBorrowing
Percent of Total Families Using Each Type of Funding Source
Fig. 20 Sources of Funding
DE
TAIL
ED
FIN
DIN
GS
5Please refer to page 3, “Composite View of Funding Sources,” for a discussion of composite amounts used by source for the total costs of attendance across the entire respondent population.6When estimating the amount spent from itemized sources, some respondents who had previously stated that a parent, student or both had borrowed, could not name the source of borrowing or did not know the amount borrowed. Only responses with an amount greater than zero for a specific borrowing source were included here, thus the percentage stated here of families that used some funding borrowed by a student or parent is lower than the initial response given in “Who borrowed the money used to pay for college this year.”

��
gAllUPsAllie mAe
7In 2008, only families who previously said they used non-borrowed funds contributed by parents (49% of respondents) were asked about these itemized sources. In 2009, all respondents were asked about these sources.8In 2008, only families who previously said they used non-borrowed funds contributed by the student (34% of respondents) were asked about these itemized sources. In 2009, all respondents were asked about these sources.
USE OF NON-BORROWED FUNDS
Of the $[Dollar Value] total cost of attendance, how much money did your parents/you use to pay for college this year from each of the following non- borrowed sources?7
Parent current income
College savings fund, such as a 529 plan
Retirement savings withdrawal (including 401k, Roth IRA, or other IRA)
Other parent savings or investments
Of the $[Dollar Value] total cost of attendance, how much money did you/your child use to pay for college this year from each of the following sources?8
Grants (federal, state or school based)
Scholarships (received from the school or outside organizations or businesses)
Federal Work-Study
Your/Your child’s savings
Your/Your child’s current income
Other student savings or investments
A.
B.
C.
D.
A.
B.
C.
D.
E.
F.
Over three-quarters (76%) of respondents used either parent or student personal contributions, including in-come, savings, and other investments, to pay for college. The percentage of people using personal contributions increased with income, with nearly nine out of 10 of the wealthiest families contributing personal income,
Yes76%
No16%
Don’tKnow
8%
Fig. 22 Use of Personal Contributions, by Income
Fig. 21 Use of Personal Contributions
67% 65%80% 81% 87%
24% 23%
15% 13% 6%9% 12%
5% 6% 7%
0%
10%
20%
30%
40%
50%
60%
70%
80%
90%
100%
<$35k $35k - <$50k $50k - <$100k $100k - <$150k $150k+
Don't Know/Refused
No
Yes
Use of Personal Contributions
savings and investments to pay for college. More than two-thirds of families earning less than $35,000 per year and 65 percent of families earning between $35,000 and less than $50,000 per year used personal contributions to pay for college.

2�
H o w A m e r i c A P A y s f o r c o l l e g e2 0 0 9
Sixteen percent of families used no personal contribu-tions to pay for college. Nearly a quarter (24%) of fami-lies earning less than $35,000 per year did not use any personal contributions to pay for college, while only 6 percent of families earning more than $150,000 did not use any personal contributions.
Thirty percent of total families used both personal contributions and borrowed sources to pay for college. Families who used borrowed funds to pay for college were less likely to use personal contributions to pay for college (69%) compared to families who did not use any borrowed funds to pay for college (81%).
Parent Personal Contributions: Overall, 59 percent of families used some type of parent personal contribu-tion to fund college during the 2008-09 school year.
Parent income was the most common source of all resources used to pay for college with 55 percent of all families paying some college costs from the parents’ current income. The average amount contributed from parents’ current income was $7,175 among those families who used this source.
Slightly more than one out of every 10 families used college savings plans to fund college in 2008-09. For these families, the average amount used from these plans was significant ($7,312).
Fourteen percent of families spent an average of $7,776 from other savings and investments to pay for college.
Only 3 percent of families used money withdrawn from retirement accounts. Among those who did, the average amount used from retirement withdrawals to pay for college was $5,318.
Student Personal Contributions: Forty-two percent of all families used some type of student personal contribu-tion to pay for college this year.
One in four families—26 percent—reported that the student contributed an average $2,369 from his/ her savings to help pay for college.
A similar percentage—25 percent—reported that the student used his/her current income to help pay college costs. When student current income was used, the average amount contributed from that source was $3,791.
In 5 percent of families, students contributed funds from a Federal Work-Study program. Among these families, the average amount used from Federal Work-Study was $1,893.
Very few families used other student assets (2%), though those who did contributed an average of $5,749 from these sources.
Table 6 Used Personal Contributions for Current School Year
N Yes % No % DK/Refused %
Total 1604 76% 16% 8%
Income
<$35k 276 67% 24% 9%
$35-$50k 185 65% 23% 12%
$50-$100k 551 80% 15% 5%
$100-$150k 287 81% 13% 6%
$150k+ 189 87% 6% 7%
Race/Ethnicity
White 1034 75% 16% 9%
Black 231 71% 22% 7%
Hispanic 214 83% 12% 5%
Type of School
4-Year State College/ University
959 78% 15% 7%
4-Year Private College/University
273 73% 17% 10%
2-Year Public/ Community College
341 75% 17% 8%
2-Year Private College 10 * * *
<2-Year Private Technical 17 * * *
Borrowing
Borrowed 703 69% 22% 9%
Did Not Borrow 892 81% 13% 6%
Grants & Scholarships
Used Grants/ Scholarships
849 76% 20% 4%
Did Not Use Grants/Scholarships
652 81% 12% 7%
DE
TAIL
ED
FIN
DIN
GS

��
gAllUPsAllie mAe
Table 7 Sources of Personal Contributions
% of Total Families Average Amount**
Any Parent Sources 59% $9,581
Current Income 55% $7,175
College Savings Plan (529)
11% $7,312
Retirement Savings Withdrawal
3% $5,318
Other Savings or Investments
14% $7,776
Any Student Sources
42% $3,708
Savings 26% $2,369
Current Income 25% $3,791
Federal Work-Study 5% $1,893
Other Savings or Investments
2% $5,749
** Among those who used each source
Use of Grants and Scholarships
Fifty-one percent of families used grants or scholar-ships to pay an average of more than $8,000 of their college costs. Families in the lowest income group were much more likely to use grants or scholarships (68%). Families earning between $35,000 and less than $150,000 had similar rates of using grants and scholar-ships, with roughly half of these families receiving
Yes51%No
42%
Don’tKnow
7%
Fig. 23 Use of Grants & Scholarships
Fig. 24 Use of Grants & Scholarships, by Income and by School Type
grants and/or scholarships. The wealthiest families were least likely to use grants and scholarships (43%).
Families in which the student attended a four-year private college or university were much more likely to use grants or scholarships (68%) to pay for college compared to those in which the student attended a four-year public college or university (54%). Families of students who attended two-year community colleges were least likely to use grants and scholarships; only 33 percent reported using grants or scholarships to pay for college.
Families who did not use any personal contributions to pay for college were more likely to have used grants or scholarships (62%) than families who did use personal contributions (52%).
68%
51% 50% 48% 43%54%
68%
33%
23%
35%44% 51% 55% 38%
29%
59%
9% 14%6% 1% 2% 8% 3% 8%
0%
20%
40%
60%
80%
100%
<$35k $35 -$50k $50 -$100k $100 -$150k $150k+ 4-Year PublicCollege/University
4-Year Private College/University
2-YearPublic/Community
College
Yes No Don't Know/RefusedIncome School Type
Yes No Don't Know/Refused

2�
H o w A m e r i c A P A y s f o r c o l l e g e2 0 0 9
Table 8 Used Grants or Scholarships for Current School Year
N Yes % No % DK/ Refused %
Total 1604 51% 42% 7%
Income
<$35k 276 68% 23% 9%
$35-$50k 185 51% 35% 14%
$50-$100k 551 50% 44% 6%
$100-$150k 287 48% 51% 1%
$150k+ 189 43% 55% 2%
Race/Ethnicity
White 1034 51% 43% 6%
Black 231 51% 36% 13%
Hispanic 214 57% 38% 5%
Type of School
4-Year State College/ University
959 54% 38% 8%
4-Year Private College/University
273 68% 29% 3%
2-Year Public/ Community College
341 33% 59% 8%
2-Year Private College 10 * * *
<2-Year Private Technical
17 * * *
Borrowing
Borrowed 703 54% 38% 8%
Did Not Borrow 892 50% 45% 5%
Personal Contributions
Used Personal Contributions
1212 52% 44% 4%
Did Not Use Personal Contributions
255 62% 32% 6%
DE
TAIL
ED
FIN
DIN
GS
Allocation of Grants and Scholarships
Forty percent of families reported receiving scholarships to pay for college. Among those families who used schol-arships, the average amount funded from scholarships was $6,907. Thirty percent of families used grants to pay for college. Families who used grants reported lower average amounts from that source, $5,109, than the average amount attributed to scholarships.
Not surprisingly, the use of grants bore a strong relation-ship to family income, with nearly two-thirds of families earning less than $35,000 annually receiving grants and only 10 percent of families earning more than $150,000 receiving grants. In contrast, the use of scholarships does not appear to bear much relation to income with approximately four of ten families in every income group reporting using scholarships.
Among those families who used scholarships to pay for college, the average value of scholarships rose sharply with income, from an average of $5,398 among those families earning less than $35,000 per year to an aver-age of $11,003 among those families earning more than $150,000 per year.
White families receiving scholarships used a higher aver-age amount from scholarships ($7,640) than African-American ($5,297) or Hispanic ($4,461) families who utilized scholarships. African-American families who received grants to pay for college had higher average grant amounts ($6,688) than either White ($4,783) or Hispanic ($4,783) families who used grants.
Fig. 25 Percent Receiving Grants or Scholarships, by Income
30%
65%
40%
27%
12% 10%
40%43%
36%39%
42%38%
0%
10%
20%
30%
40%
50%
60%
70%
Total <$35k $35k - <$50k $50k - <$100k $100k - <$150k $150k+
% Receiving Grants % Receiving Scholarships
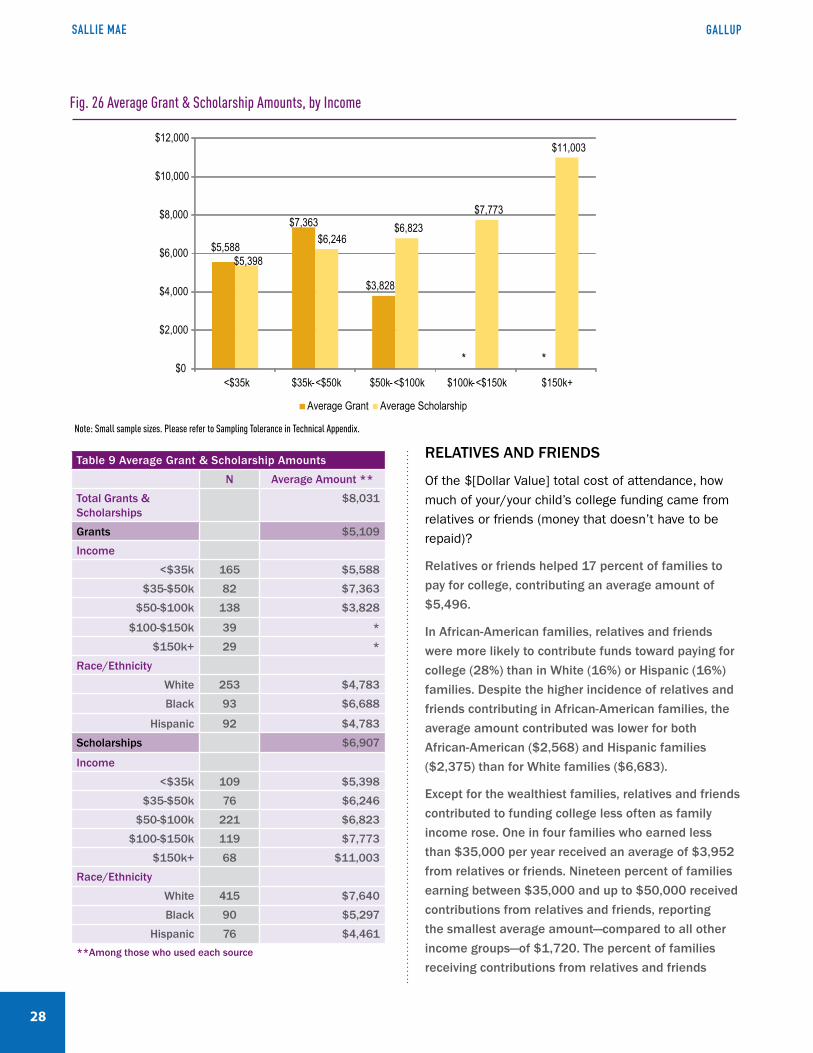
��
gAllUPsAllie mAe
RELATIVES AND FRIENDS
Of the $[Dollar Value] total cost of attendance, how much of your/your child’s college funding came from relatives or friends (money that doesn’t have to be repaid)?
Relatives or friends helped 17 percent of families to pay for college, contributing an average amount of $5,496.
In African-American families, relatives and friends were more likely to contribute funds toward paying for college (28%) than in White (16%) or Hispanic (16%) families. Despite the higher incidence of relatives and friends contributing in African-American families, the average amount contributed was lower for both African-American ($2,568) and Hispanic families ($2,375) than for White families ($6,683).
Except for the wealthiest families, relatives and friends contributed to funding college less often as family income rose. One in four families who earned less than $35,000 per year received an average of $3,952 from relatives or friends. Nineteen percent of families earning between $35,000 and up to $50,000 received contributions from relatives and friends, reporting the smallest average amount—compared to all other income groups—of $1,720. The percent of families receiving contributions from relatives and friends
$5,588
$7,363
$3,828
* *
$5,398
$6,246$6,823
$7,773
$11,003
$0
$2,000
$4,000
$6,000
$8,000
$10,000
$12,000
<$35k $35k-<$50k $50k-<$100k $100k-<$150k $150k+
Average Grant Average Scholarship
Fig. 26 Average Grant & Scholarship Amounts, by Income
Table 9 Average Grant & Scholarship Amounts
N Average Amount **
Total Grants & Scholarships
$8,031
Grants $5,109
Income
<$35k 165 $5,588
$35-$50k 82 $7,363
$50-$100k 138 $3,828
$100-$150k 39 *
$150k+ 29 *
Race/Ethnicity
White 253 $4,783
Black 93 $6,688
Hispanic 92 $4,783
Scholarships $6,907
Income
<$35k 109 $5,398
$35-$50k 76 $6,246
$50-$100k 221 $6,823
$100-$150k 119 $7,773
$150k+ 68 $11,003
Race/Ethnicity
White 415 $7,640
Black 90 $5,297
Hispanic 76 $4,461**Among those who used each source
Note: Small sample sizes. Please refer to Sampling Tolerance in Technical Appendix.

2�
H o w A m e r i c A P A y s f o r c o l l e g e2 0 0 9
47% 47%
58%
34%42% 41%
53% 50%
0%
10%
20%
30%
40%
50%
60%
70%
Total White Hispanic
2008 2009
African-American
falls off among families earning from $50,000 to up to $150,000 but the average amount contributed is higher than among those earning less than $50,000 per year. Sixteen percent of families who earned more than $150,000 per year received contributions from relatives or friends. Relatives and friends of the wealthiest families contributed the highest average amount toward college ($11,481).
Fig. 27 Use of Borrowed Funds, Year-over-Year, by Race or Ethnicity
Table 10 Contributions from Relatives or Friends
N % of Total Families Average Amount**
Total 1604 17% $5,496
Income
<$35k 276 25% $3,952
$35-$50k 185 19% $1,720
$50-$100k 551 17% $5,654
$100-$150k 287 9% $6,946
$150k+ 189 16% $11,481
Race/Ethnicity
White 1028 16% $6,683
Black 230 28% $2,568
Hispanic 214 16% $2,375 **Among those who used each source
USE OF BORROWED FUNDS
Were any types of loans, or other types of credit or bor-rowed money used to pay for college this year? Some examples may include student or private loans, home equity, or credit cards.
Despite the increase in average cost of attendance in academic year 2008-09 compared to 2007-08, 58 percent of families paid for college without borrowing for any portion of the cost. Forty-two percent of families reported that they borrowed to pay for college in 2008-09, compared to 47 percent of families in 2007-08.
By race, fewer African-American and White families reported borrowing in the 2008-09 study compared to 2007-08. Directionally, it appears that Hispanic borrowing increased from the previous year, though Hispanic sample sizes in the 2008 study were too small for reliable analysis.
DE
TAIL
ED
FIN
DIN
GS
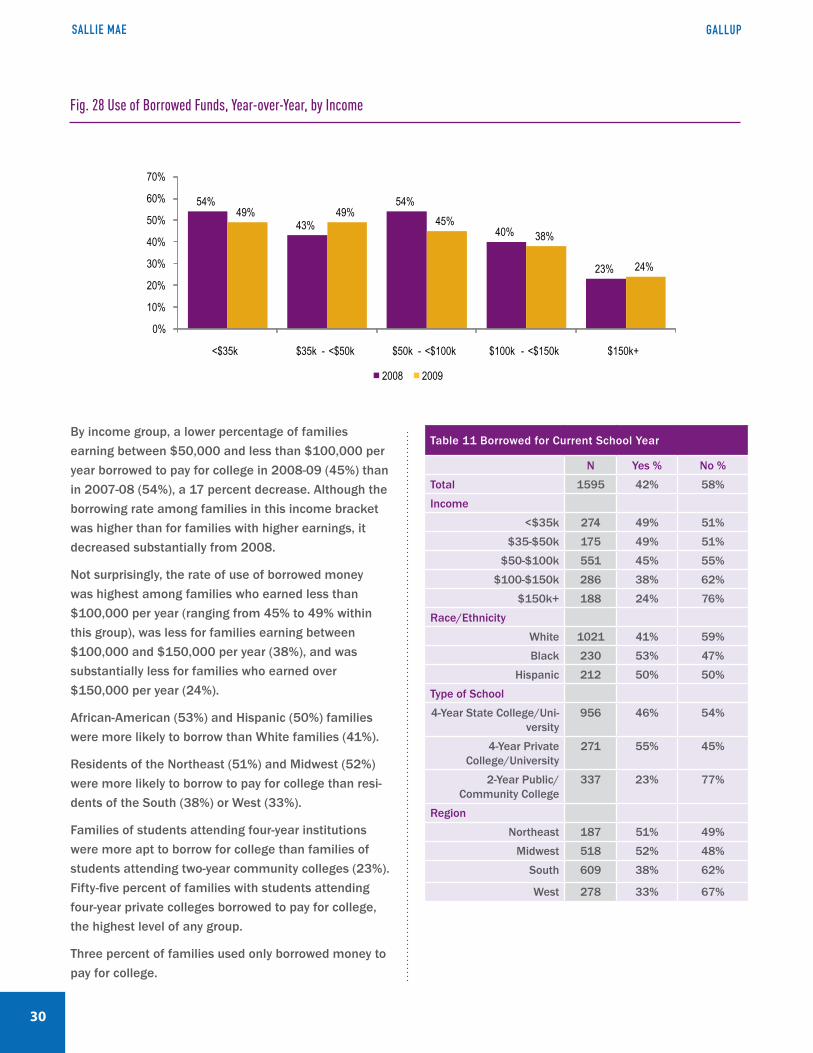
30
gAllUPsAllie mAe
54%
43%
54%
40%
23%
49% 49%45%
38%
24%
0%
10%
20%
30%
40%
50%
60%
70%
<$35k $35k - <$50k $50k - <$100k $100k - <$150k $150k+
2008 2009
By income group, a lower percentage of families earning between $50,000 and less than $100,000 per year borrowed to pay for college in 2008-09 (45%) than in 2007-08 (54%), a 17 percent decrease. Although the borrowing rate among families in this income bracket was higher than for families with higher earnings, it decreased substantially from 2008.
Not surprisingly, the rate of use of borrowed money was highest among families who earned less than $100,000 per year (ranging from 45% to 49% within this group), was less for families earning between $100,000 and $150,000 per year (38%), and was substantially less for families who earned over $150,000 per year (24%).
African-American (53%) and Hispanic (50%) families were more likely to borrow than White families (41%).
Residents of the Northeast (51%) and Midwest (52%) were more likely to borrow to pay for college than resi-dents of the South (38%) or West (33%).
Families of students attending four-year institutions were more apt to borrow for college than families of students attending two-year community colleges (23%). Fifty-five percent of families with students attending four-year private colleges borrowed to pay for college, the highest level of any group.
Three percent of families used only borrowed money to pay for college.
Fig. 28 Use of Borrowed Funds, Year-over-Year, by Income
Table 11 Borrowed for Current School Year
N Yes % No %
Total 1595 42% 58%
Income
<$35k 274 49% 51%
$35-$50k 175 49% 51%
$50-$100k 551 45% 55%
$100-$150k 286 38% 62%
$150k+ 188 24% 76%
Race/Ethnicity
White 1021 41% 59%
Black 230 53% 47%
Hispanic 212 50% 50%
Type of School
4-Year State College/Uni-versity
956 46% 54%
4-Year Private College/University
271 55% 45%
2-Year Public/ Community College
337 23% 77%
Region
Northeast 187 51% 49%
Midwest 518 52% 48%
South 609 38% 62%
West 278 33% 67%

WHO CONTRIBUTED BORROWED FUNDSWho borrowed the money used to pay for college this year?
A. Student B. Parents C. Both
A lower percentage of students borrowed to pay their college costs in 2008-09 than in 2007-08. Overall, 34 percent of families reported that the student borrowed, compared to 39 percent the previous year. This decline is reflected in the percent of students who acted as sole borrowers. The percentage of students who were the sole borrowers in 2008-09 (23%) decreased compared to 2007-08 (31%), a decline of 26 percent. Families with the parent as sole borrower (8%) and percent of families where both the parent and student borrowed (11%) were similar to the prior year.
The student was most likely to borrow, either solely or along with parents, in African-American families (46%) and among those attending a four-year private institution (45%).
Students were most likely to borrow on their own in families whose annual household income was less than $50,000 (ranging from 34% to 30%). The percentage of families in which the student borrowed, both alone and in combination with parents, decreased as income increased.
The groups that were most likely to have both the student and the parent borrow to pay for college were African-Americans (19%), those attending four-year private institutions (17%), and residents of the Northeast (15%).
Parents in one in four African-American and Hispanic families (26%) borrowed to pay for college compared to 17 percent of White families. The parents were most likely to borrow in those families where the student at-tended a four-year private institution (27%), in the North-east (26%) and among African-American and Hispanic families.
Table 12 Who Contributed Borrowed Funds
N Student Only %* Parent Only %* Both %* Total Student Total Parent
Total 698 23% 8% 11% 34% 19%
Income
<$35k 129 34% 6% 9% 43% 15%
$35-$50k 93 30% 7% 12% 42% 19%
$50-$100k 272 23% 10% 11% 34% 21%
$100-$150k 113 17% 10% 11% 28% 21%
$150k+ 49 8% 3% 12% 20% 15%
Race/Ethnicity
White 439 24% 7% 10% 34% 17%
Black 130 27% 7% 19% 46% 26%
Hispanic 92 24% 12% 14% 38% 26%
Type of School
4-Year State College/University 448 27% 8% 11% 38% 19%
4-Year Private College/University 150 28% 10% 17% 45% 27%
2-Year Public/Community College 85 12% 7% 4% 16% 11%
Region
Northeast 99 25% 11% 15% 40% 26%
Midwest 253 28% 10% 14% 42% 24%
South 243 22% 7% 9% 31% 16%
West 102 20% 6% 7% 27% 13%*Categories are mutually exclusive. All are percent of total families.
��
H o w A m e r i c A P A y s f o r c o l l e g e2 0 0 9
31%
23%
8%
11%
9%
8%
0%
5%
10%
15%
20%
25%
30%
35%
40%
45%
50%
2008 2009
ParentsBothStudents
}
Totalstudent34%
}
Totalparent19%
Fig. 29 Who Borrowed
DE
TAIL
ED
FIN
DIN
GS
3�
gAllUPsAllie mAe
SOURCES OF BORROWED FUNDS
Of the $[Dollar Value] total cost of attendance, how much money did your parents/you use to pay for college this year from each of the following borrowed sources?9
Federal Parent PLUS Loan
Private education loans in your parents’/your name
Home equity loan or line of credit
Credit cards in your parents’/your name
Retirement account loan (including 401k, Roth IRA, or other IRA)
Other loans in your parents’/your name10
Of the $[Dollar Value] total cost of attendance, how much money did you/your child use to pay for college this year from each of the following borrowed sources?
Federal student loans, such as Stafford or Perkins loans
Private education loans in your/your child’s name
Credit cards in your/your child’s name
Other loans in your/your child’s name10
Parent Borrowing
Overall, the percent of families using some parent borrowing to pay for college did not change year over year. However, the survey found that, in some areas, the average amount that parents borrowed decreased from the 2007-08 school year.
Federal PLUS Loans continued to be the most com-monly used source of parent-borrowed money, used by 8 percent of all families. Families who used PLUS loans to finance college used an average of $7,664 from this source to pay for college, a sharp decrease from the average $10,701 reported the previous year.
Five percent of families used private education loans borrowed by a parent at an average amount of $8,401, an increase from the average amount reported for 2007-08 of $6,910. Three percent of families used some other type of loan to pay for college this year. The average amount reported, $5,762, was much lower than the previous year’s average of $9,894. The change
A.
B.
C.
D.
E.
F.
A.
B.
C.
D.
in methodology to identify more specific sources attrib-uted to “other loans” in the 2009 study has likely had an impact on the percent reporting use of private edu-cation loans vs. other loans and the average amounts reported for both, making year-over-year comparisons of these categories less precise.
Five percent of families used parent credit cards to pay for college. These families charged an average of $3,886 on credit cards to pay college costs, a decrease from the $5,822 reported in 2008.
Three percent of families used a home equity loan or line of credit to pay for college during the 2008-09 school year, paying an average of $8,028 from this credit source. This, too, was a decrease from the aver-age amount reported the previous year of $10,853.
Very few families (1%) borrowed money from a re-tirement account to pay for college. Those who did, borrowed, on average, $5,471 from their retirement account, not a significant decrease from the amount reported the previous year of $6,299.
Student Borrowing
Federal student loans remained the most commonly used source of all borrowed money in academic year 2008-09. Compared to the previous year, families used federal student loans in 2008-09 (25%) at a slightly lower rate than in 2007-08 (28%). The average amount used to pay for college from federal student loans was $5,327, similar to the average amount reported last year of $5,075.
Twelve percent of families used student-borrowed private education loans to pay for college, and con-tributed an average of $7,516 from these loans. This is a slight increase in usage from 2007-08 when 8 percent reported they used private education loans at an average amount of $7,694. This may be a result of better reporting of the type of loan, as evidenced by the decrease in the percent of families citing Other Loans in 2008-09 (2%) compared to 2007-08 (8%). The com-bined use of loans from these two categories (private education loans and “other” loans) in 2008-09 was 13 percent, a statistically similar rate to the
9When estimating the amount spent from itemized sources, some respondents who had previously stated that a parent, student or both had borrowed, could not name the source of borrowing or did not know the amount borrowed. Only responses with an amount greater than zero for a specific borrowing source were included here. 102009 methodology change. Those respondents reporting “Other” were asked to specify other aggregated in listed responses where appropriate.

��
H o w A m e r i c A P A y s f o r c o l l e g e2 0 0 9
2007-08 usage rate of 14.5 percent. The amounts bor-rowed from each student source were similar in value to the amounts borrowed from each source one year earlier.
Few families (5%) reported using student credit cards to pay for college, placing an average of $2,812 on these student-held cards.
Table 13 Sources of Borrowed Funds, Year-over-Year
2009 2008
% of Total Families
Average Amount**
% of Total Families
Average Amount**
Parent Sources
Federal PLUS Loans 8% $7,664 6% $10,701
Private Education Loan 5% $8,401 4% $6,910
Home Equity Loan or HELOC
3% $8,028 3% $10,853
Credit Cards 5% $3,886 3% $5,822
Retirement Account Loan 1% $5,471 1% $6,299
Other Loans 3% $5,762 5% $9,894
Student Sources
Federal Student Loan (Staf-ford or Perkins)
25% $5,327 28% $5,075
Private Education Loan 12% $7,516 8% $7,694
Credit Cards 5% $2,812 3% $2,542
Other Loans 2% $5,819 8% $7,922 ** Among those who used each source
DE
TAIL
ED
FIN
DIN
GS
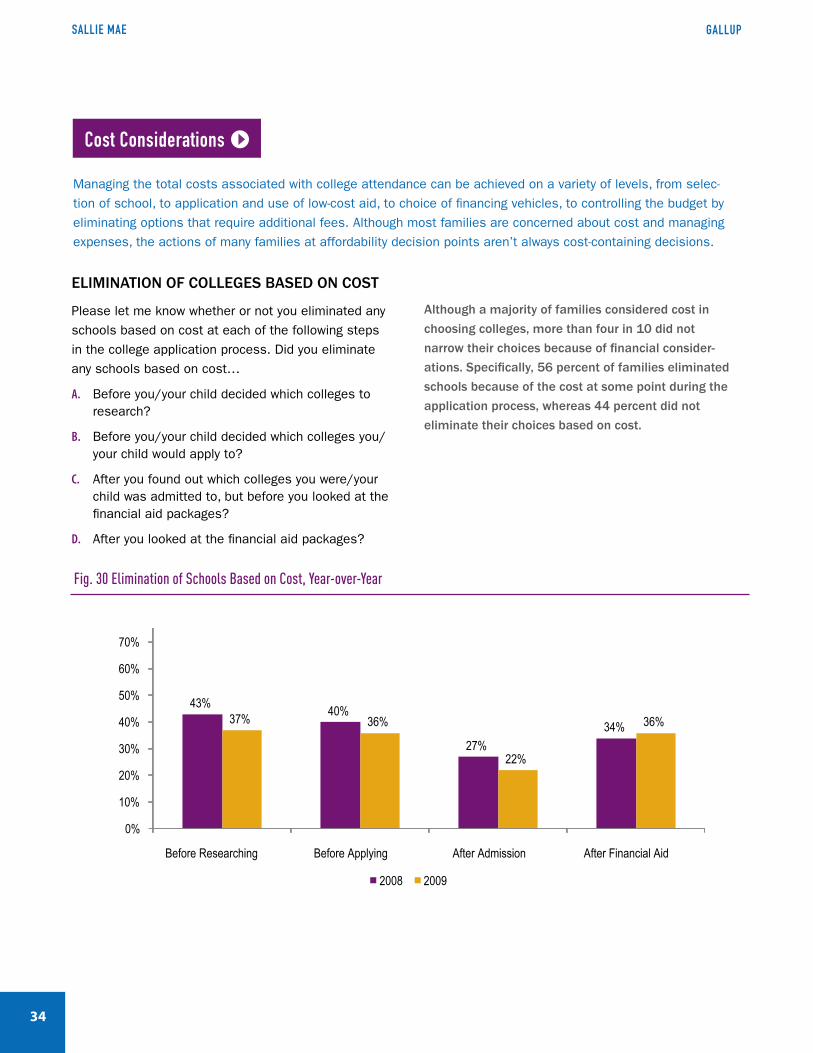
3�
gAllUPsAllie mAe
Managing the total costs associated with college attendance can be achieved on a variety of levels, from selec-tion of school, to application and use of low-cost aid, to choice of financing vehicles, to controlling the budget by eliminating options that require additional fees. Although most families are concerned about cost and managing expenses, the actions of many families at affordability decision points aren’t always cost-containing decisions.
cost considerations
ELIMINATION OF COLLEGES BASED ON COST
Please let me know whether or not you eliminated any schools based on cost at each of the following steps in the college application process. Did you eliminate any schools based on cost…
Before you/your child decided which colleges to research?
Before you/your child decided which colleges you/your child would apply to?
After you found out which colleges you were/your child was admitted to, but before you looked at the financial aid packages?
After you looked at the financial aid packages?
A.
B.
C.
D.
Although a majority of families considered cost in choosing colleges, more than four in 10 did not narrow their choices because of financial consider-ations. Specifically, 56 percent of families eliminated schools because of the cost at some point during the application process, whereas 44 percent did not eliminate their choices based on cost.
43% 40%
27%34%37% 36%
22%
36%
0%
10%
20%
30%
40%
50%
60%
70%
80%
90%
100%
Before Researching Before Applying After Admission After Financial Aid
2008 2009
Fig. 30 Elimination of Schools Based on Cost, Year-over-Year

��
H o w A m e r i c A P A y s f o r c o l l e g e2 0 0 9
It appears that families were less likely to narrow their choices based on cost early in the process of researching and applying for colleges in 2009 than in 2008. However, the 2009 study shows that a similar percentage of families eliminated schools based on cost after finding out financial aid packages in both years.
Directionally, it seems students were slightly more cost conscious during all steps of the application and decision process than were parents.
43%49%
53%58%
37%43%
48%56%
0%
10%
20%
30%
40%
50%
60%
70%
80%
90%
100%
Before Researching Before Applying After Admission After Financial Aid
Total 2008 Total 2009
Table 14 Elimination of Colleges Based on Cost
% Saying Yes at Each Point
N Before Researching Before Applying After Admission After Financial Aid
Total 1603 37% 36% 22% 36%
Students 800 38% 37% 24% 39%
Parents 803 36% 34% 20% 32%
Income
<$35k 275 46% 43% 32% 45%
$35-$50k 185 39% 36% 28% 41%
$50-$100k 551 39% 37% 22% 37%
$100-$150k 287 34% 33% 14% 32%
$150k+ 189 23% 22% 14% 20%
Race/Ethnicity
White 1027 36% 33% 19% 31%
Black 230 37% 36% 33% 48%
Hispanic 214 46% 50% 35% 49%
At all stages, the percentage of families who eliminated schools based on cost decreased as income increased.
Hispanics were more likely than Whites or African-Ameri-cans to eliminate schools based on cost in the early stages of the college application process, both before researching schools and before deciding where to apply. African- American and Hispanic families were more likely than White families to eliminate colleges based on cost after admission and after finding out the financial aid package.
Fig. 31 Cumulative Elimination of Schools Based on Cost, Year-over-Year
DE
TAIL
ED
FIN
DIN
GS
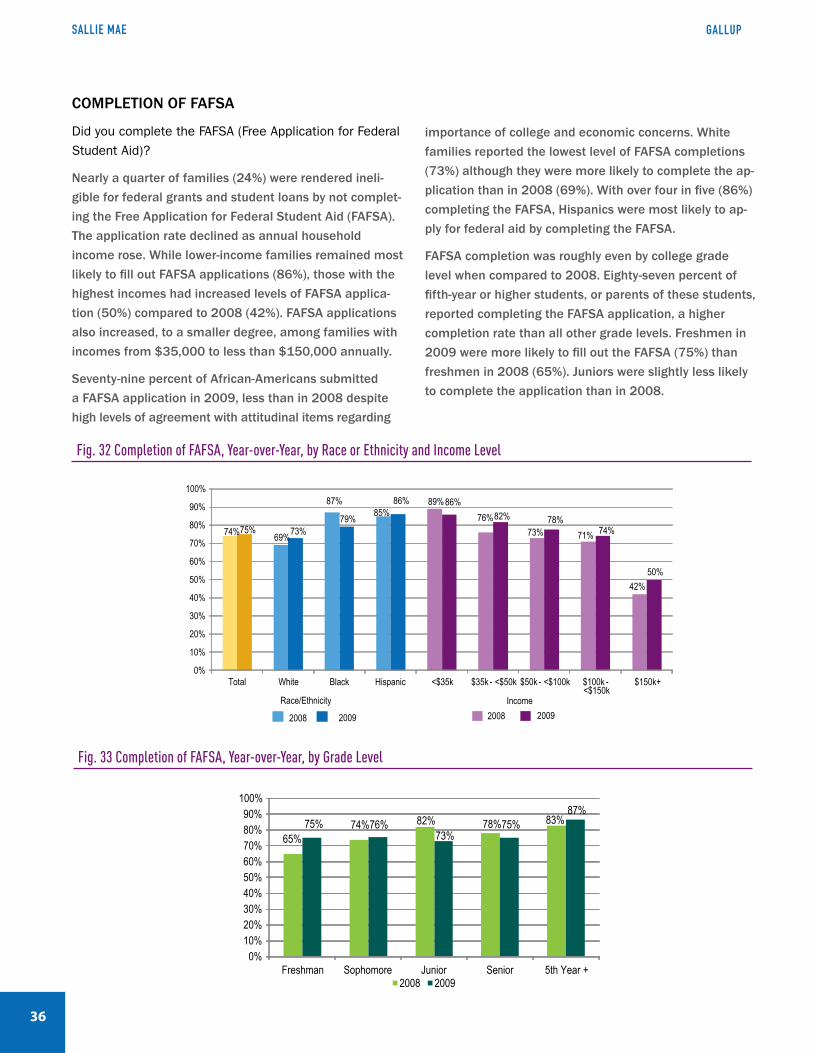
3�
gAllUPsAllie mAe
COMPLETION OF FAFSA
Did you complete the FAFSA (Free Application for Federal Student Aid)?
Nearly a quarter of families (24%) were rendered ineli-gible for federal grants and student loans by not complet-ing the Free Application for Federal Student Aid (FAFSA). The application rate declined as annual household income rose. While lower-income families remained most likely to fill out FAFSA applications (86%), those with the highest incomes had increased levels of FAFSA applica-tion (50%) compared to 2008 (42%). FAFSA applications also increased, to a smaller degree, among families with incomes from $35,000 to less than $150,000 annually.
Seventy-nine percent of African-Americans submitted a FAFSA application in 2009, less than in 2008 despite high levels of agreement with attitudinal items regarding
importance of college and economic concerns. White families reported the lowest level of FAFSA completions (73%) although they were more likely to complete the ap-plication than in 2008 (69%). With over four in five (86%) completing the FAFSA, Hispanics were most likely to ap-ply for federal aid by completing the FAFSA.
FAFSA completion was roughly even by college grade level when compared to 2008. Eighty-seven percent of fifth-year or higher students, or parents of these students, reported completing the FAFSA application, a higher completion rate than all other grade levels. Freshmen in 2009 were more likely to fill out the FAFSA (75%) than freshmen in 2008 (65%). Juniors were slightly less likely to complete the application than in 2008.
Fig. 32 Completion of FAFSA, Year-over-Year, by Race or Ethnicity and Income Level
74% 69%
87%85%
89%76%
73% 71%
42%
75% 73%79%
86% 86%82% 78%
74%
50%
0%
10%
20%
30%
40%
50%
60%
70%
80%
90%
100%
Total White Black Hispanic <$35k $35k - <$50k $50k - <$100k $100k -<$150k
$150k+
Race/Ethnicity Income2008 20092008 2009
65%74% 82% 78% 83%75% 76%
73%75%
87%
0%10%20%30%40%50%60%70%80%90%
100%
Freshman Sophomore Junior Senior 5th Year +2008 2009
Fig. 33 Completion of FAFSA, Year-over-Year, by Grade Level

��
H o w A m e r i c A P A y s f o r c o l l e g e2 0 0 9
PRIMARY REASONS FOR NOT COMPLETING FAFSA
(If did not complete FAFSA) Why didn’t you complete the FAFSA (Free Application for Federal Student Aid)? (open ended)
Nearly half of families that did not fill out the FAFSA application either believed that they would not be eligible for financial aid (30%) or were unaware of the application (18%). Parents (20%) were somewhat more likely than students (15%) to be unaware of the FAFSA. The most common reason why students didn’t complete the FAFSA was because they didn’t believe their family would qualify (33%). Thirty-nine percent of families who did not fill out the FAFSA application indicated that they did not need financial aid. Nearly half (47%) of parents did not fill out the application due to no need for financial aid compared to 29 percent of students.
39%
30%
18%
3%3% 7%
Family Doesn't Need Financial AidDidn't Think Family Would QualifyWasn't Aware of FAFSAWaiting on Tax InformationNo ReasonOther
Base: Parents of college students and college students who did not complete a FAFSA application.
Base: Parents of college students and college students who did not complete a FAFSA application.
29%
47%
33%
27%
15%
20%6%
1%
2%
3%15%
2%
0%
10%
20%
30%
40%
50%
60%
70%
80%
90%
100%
Students Parents
Other
No Reason
Waiting on Tax Information
Wasn't Aware of FAFSA
Didn't Think Family Would Qualify
Family Doesn't Need Financial Aid
Fig. 35 Primary Reasons for Not Completing FAFSA, by Student and Parent
Fig. 34 Primary Reasons for Not Completing FAFSA
Table 15 Completed FAFSA Application
N % Yes % No % DK/ Refused
Total 1587 75% 24% 1%
Students 800 77% 23% 0%
Parents 787 73% 25% 2%
Income
<$35k 272 86% 12% 2%
$35k - <$50k 184 82% 17% 1%
$50k - <$100k 545 78% 21% 1%
$100k - <$150k 284 74% 25% 1%
$150k+ 186 50% 48% 2%
Race/Ethnicity
White 1015 73% 26% 1%
Black 228 79% 20% 1%
Hispanic 212 86% 11% 3%
Grade Level
Freshman 519 75% 23% 2%
Sophomore 445 76% 24% 0%
Junior 319 73% 25% 2%
Senior 241 75% 24% 1%
5th Year + 56 87% 13% 0%
Region
Northeast 188 80% 19% 1%
Midwest 516 79% 19% 2%
South 605 74% 26% 0%
West 275 68% 29% 3%Note: Small sample sizes. Please refer to Sampling Tolerance in Technical Appendix.
DE
TAIL
ED
FIN
DIN
GS
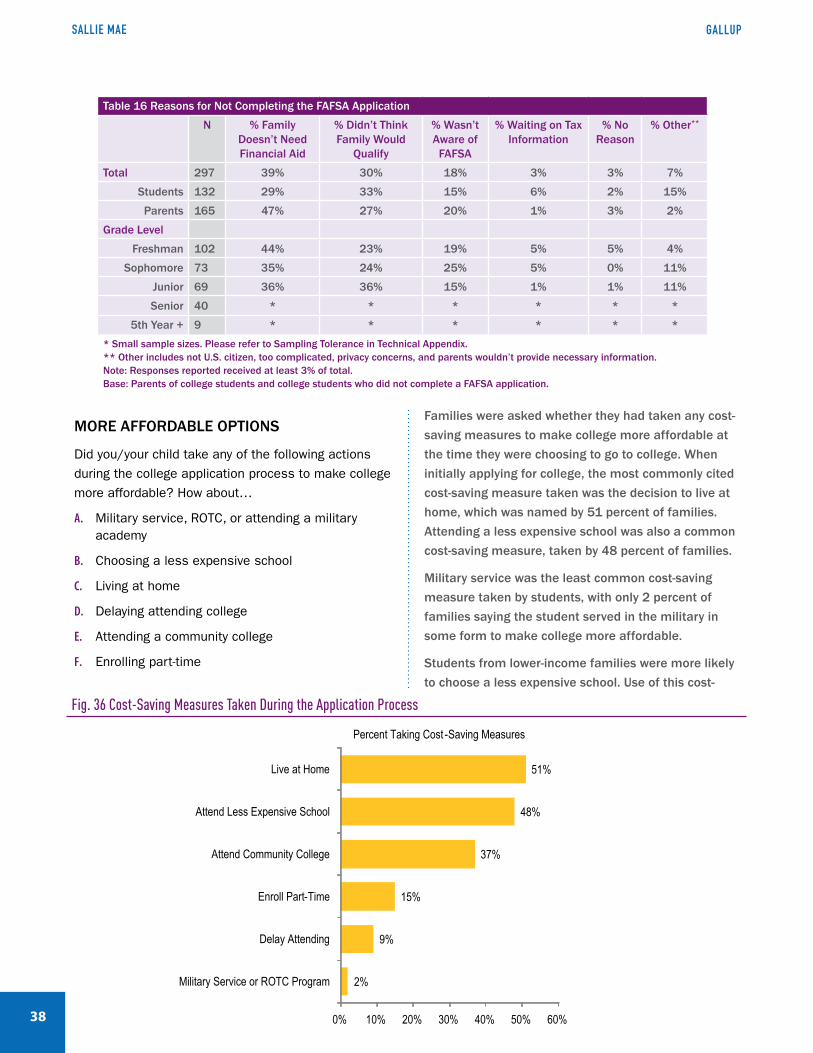
Table 16 Reasons for Not Completing the FAFSA Application
N % Family Doesn’t Need Financial Aid
% Didn’t Think Family Would
Qualify
% Wasn’t Aware of
FAFSA
% Waiting on Tax Information
% No Reason
% Other**
Total 297 39% 30% 18% 3% 3% 7%
Students 132 29% 33% 15% 6% 2% 15%
Parents 165 47% 27% 20% 1% 3% 2%
Grade Level
Freshman 102 44% 23% 19% 5% 5% 4%
Sophomore 73 35% 24% 25% 5% 0% 11%
Junior 69 36% 36% 15% 1% 1% 11%
Senior 40 * * * * * *
5th Year + 9 * * * * * ** Small sample sizes. Please refer to Sampling Tolerance in Technical Appendix. ** Other includes not U.S. citizen, too complicated, privacy concerns, and parents wouldn’t provide necessary information. Note: Responses reported received at least 3% of total. Base: Parents of college students and college students who did not complete a FAFSA application.
3�
gAllUPsAllie mAe
MORE AFFORDABLE OPTIONS
Did you/your child take any of the following actions during the college application process to make college more affordable? How about…
Military service, ROTC, or attending a military academy
Choosing a less expensive school
Living at home
Delaying attending college
Attending a community college
Enrolling part-time
A.
B.
C.
D.
E.
F.
Families were asked whether they had taken any cost-saving measures to make college more affordable at the time they were choosing to go to college. When initially applying for college, the most commonly cited cost-saving measure taken was the decision to live at home, which was named by 51 percent of families. Attending a less expensive school was also a common cost-saving measure, taken by 48 percent of families.
Military service was the least common cost-saving measure taken by students, with only 2 percent of families saying the student served in the military in some form to make college more affordable.
Students from lower-income families were more likely to choose a less expensive school. Use of this cost-
2%
9%
15%
37%
48%
51%
0% 10% 20% 30% 40% 50% 60%
Military Service or ROTC Program
Delay Attending
Enroll Part-Time
Attend Community College
Attend Less Expensive School
Live at Home
Percent Taking Cost -Saving Measures
Fig. 36 Cost-Saving Measures Taken During the Application Process
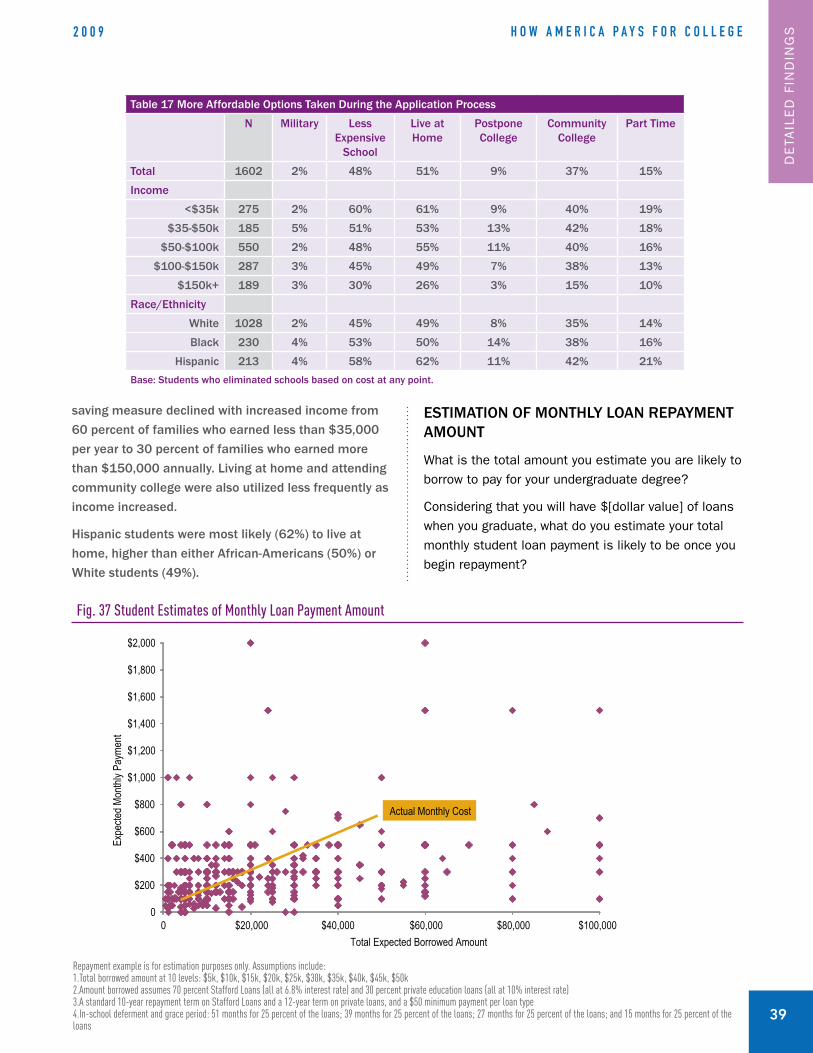
��
H o w A m e r i c A P A y s f o r c o l l e g e2 0 0 9
Table 17 More Affordable Options Taken During the Application Process
N Military Less Expensive
School
Live at Home
Postpone College
Community College
Part Time
Total 1602 2% 48% 51% 9% 37% 15%
Income
<$35k 275 2% 60% 61% 9% 40% 19%
$35-$50k 185 5% 51% 53% 13% 42% 18%
$50-$100k 550 2% 48% 55% 11% 40% 16%
$100-$150k 287 3% 45% 49% 7% 38% 13%
$150k+ 189 3% 30% 26% 3% 15% 10%
Race/Ethnicity
White 1028 2% 45% 49% 8% 35% 14%
Black 230 4% 53% 50% 14% 38% 16%
Hispanic 213 4% 58% 62% 11% 42% 21%Base: Students who eliminated schools based on cost at any point.
saving measure declined with increased income from 60 percent of families who earned less than $35,000 per year to 30 percent of families who earned more than $150,000 annually. Living at home and attending community college were also utilized less frequently as income increased.
Hispanic students were most likely (62%) to live at home, higher than either African-Americans (50%) or White students (49%).
ESTIMATION OF MONTHLY LOAN REPAYMENT AMOUNT
What is the total amount you estimate you are likely to borrow to pay for your undergraduate degree?
Considering that you will have $[dollar value] of loans when you graduate, what do you estimate your total monthly student loan payment is likely to be once you begin repayment?
0
$200
$400
$600
$800
$1,000
$1,200
$1,400
$1,600
$1,800
$2,000
0 $20,000 $40,000 $60,000 $80,000 $100,000
Expe
cted M
onthl
y Pay
ment
Total Expected Borrowed Amount
Actual Monthly Cost
Repayment example is for estimation purposes only. Assumptions include:1.Total borrowed amount at 10 levels: $5k, $10k, $15k, $20k, $25k, $30k, $35k, $40k, $45k, $50k2.Amount borrowed assumes 70 percent Stafford Loans (all at 6.8% interest rate) and 30 percent private education loans (all at 10% interest rate)3.A standard 10-year repayment term on Stafford Loans and a 12-year term on private loans, and a $50 minimum payment per loan type4.In-school deferment and grace period: 51 months for 25 percent of the loans; 39 months for 25 percent of the loans; 27 months for 25 percent of the loans; and 15 months for 25 percent of the loans
Fig. 37 Student Estimates of Monthly Loan Payment Amount
DE
TAIL
ED
FIN
DIN
GS

�0
gAllUPsAllie mAe
MoreLikely to Borrow
38%
LessLikely to Borrow
4%
Didn'tMake a
Difference30%
Didn'tConsider
It28%
Didn'tConsider
It28%
11 Methodology change from 2008 to 2009. In 2008, this question was asked of all respondents. In 2009, this question was asked only of respondents who reported that the student did borrow.
Among those students who are likely to borrow some amount, the median amount students estimated that they would borrow to pay for their undergraduate degrees was $18,000. Estimates ranged from $300 to more than $100,000.
Based on the total estimated amount they would borrow, students were asked to estimate what their monthly student loan payment would be once they began to repay their loans. Twenty-three percent of students could not even venture to guess a monthly repayment amount. Among those who did, the median estimated monthly repayment was $265. Estimates ranged from $2 to $80,000 per month.
When looked at in aggregate, these estimates are not far off actual loan payment estimates; however, a scatter plot of responses indicated little correlation between the total amounts students estimated they would borrow and their estimated monthly repayment amounts.
CONSIDERATION OF INCOME
How did your/your child’s expected income after grad-uation impact the decision to borrow money to finance your/your child’s education? Did it make you…11
More likely to borrow
Less likely to borrow
It didn’t make a difference, OR
You didn’t consider it?
For most families in which the student borrowed, students’ expected post-graduation income had little impact on the decision to borrow. Twenty-eight percent of families in which the student borrowed did not con-sider their student’s expected income when making the decision to borrow a student loan. An additional 30 percent considered it, but it did not make a difference in their decisions. In total, 58 percent of students and parents who said they used a student loan said post-graduation income either was not considered or it did not make a difference in their decision to borrow.
Four percent of families in which the student borrowed said that the student’s expected post-graduation income made them less likely to borrow. It is impor-tant to note that this is among those who ultimately did decide to borrow.
A.
B.
C.
D.
Thirty-eight percent of families who used a student loan to pay for college reported that considering the student’s expected income made them more likely to borrow a student loan.
Responses did not vary significantly by income or race and ethnicity. Directionally, it seems that lower-income families are more likely to have the student borrow when they consider the student’s post-graduation income, and that middle- to high-income families are more likely to say the student’s expected income did not make a difference.
Fig. 38 Effect of Student Post-Graduation Income on Borrowing Decision
Base: Students who borrowed and parents of students who borrowed.

4�
H o w A m e r i c A P A y s f o r c o l l e g e2 0 0 9
Table 18 Students Expected Post-Graduation Income Effect on Borrowing Decision
N More Likely
Less Likely
Didn’t Make a Difference
Didn’t Consider It
Total 461 38% 4% 30% 28%
Students 254 39% 6% 30% 25%
Parents 207 36% 2% 31% 31%
Income
<$35k 94 43% 7% 23% 27%
$35-$50k 71 47% 5% 22% 26%
$50-$100k 177 31% 3% 39% 27%
$100-$150k 68 37% 0% 30% 33%
$150k+ 30 * * * *
Race/Ethnicity
White 295 37% 4% 31% 29%
Black 83 41% 4% 24% 32%
Hispanic 63 41% 6% 29% 23%
Note: Small sample sizes. Please refer to Sampling Tolerance in Technical Appendix.Base: Students who borrowed and parents of students who borrowed.
PRIMARY REASONS FOR USING EDUCATION LOAN
(If parent or student borrowed education loan) What is the primary reason you chose to borrow an education loan to pay for college as opposed to another source of borrowing? (open ended)12
Eight percent of families stated that a parent had bor-rowed a federal education loan and in 5 percent of families a parent borrowed a private education loan, whereas students continued to borrow education loans in higher proportions. In one out of four families, the student borrowed a federal education loan, down slightly from 28 percent in 2008. The student borrowed a private education loan in 12 percent of families.
One-in-five parent or student borrowers of education loans reported that a preferable interest rate was their primary reason for choosing an education loan over another form of borrowing. Convenience (17%) and availability (13%) were also frequently reported, and convenience was more commonly reported than in 2008. Parents were somewhat more likely than students to state convenience as their motivating factor, while students were slightly more likely than parents to have chosen an education loan due to a preferable interest rate or their perception that they couldn’t secure other types of loans.
12Methodology Change: Italicized wording added to question in 2009. “What is the primary reason you chose to borrow an education loan to pay for college as opposed to another source of borrowing?”
3%
3%
4%
5%
6%
7%
10%
12%
13%
17%
20%
4%
3%
20%
10%
51%
6%
6%
0% 20% 40% 60%
For Child, Relative, or Spouse
Long Repayment Period*
Recommended by Financial Aid Office*
Most Comfortable With This Type of Financing*
Loan Deferment Option
Other
Didn't Think Could BorrowOther Types of Loans
To Pay for School
Easily Available*
Convenience
Preferable Interest Rate
20082009
Fig. 39 Primary Reasons for Using Education Loan, Year-over-Year
*Not reported in 2008. Base: Parents and students who borrowed education loans.
DE
TAIL
ED
FIN
DIN
GS

��
gAllUPsAllie mAe
Table 19 Primary Reasons for Using Education Loan
% Total % Student % Parent
N 332 234 98
Preferable Interest Rate 20% 21% 18%
Convenience 17% 16% 21%
Easily Available 13% 13% 14%
To Pay for School 12% 11% 13%
Didn’t Think Could Borrow Other Types of Loans 10% 12% 5%
Loan Deferment Option 6% 5% 5%
Most Comfortable With This Type of Financing 5% 5% 6%
Recommended by Financial Aid Office 4% 5% 2%
For Child, Relative, or Spouse 3% 2% 6%
Long Repayment Period 3% 2% 4%
Other 7% 8% 6%Responses reported received at least 3% of total. Base: Parents and students who borrowed education loans.
PRIMARY REASONS FOR USING CREDIT CARD
(Student or parent used credit card) What was the pri-mary reason you chose to use a credit card to pay for college as opposed to another source of borrowing? (open ended)13
Note: Sample sizes for this question are extremely small. Findings are directional only.
A small share of parents and students continued to rely on credit cards for education funds. Five percent of families reported a parent had used a credit card to pay education expenses, and 5 percent reported a student had used a credit card, both up slightly from 3 percent in 2008.
Table 20 Primary Reasons for Using Credit Card
% Total
N 93
Convenience 65%
Emergency or Unplanned Expenses 11%
Preferable Interest Rate 4%
Felt Most Comfortable With This Type of Financing 4%
Thought I Would be Unable to Qualify for Other Types of Financing
4%
Didn’t Think I Was Eligible for Financial Aid 3%
Other 9%Base: Parents who used a parent credit card and students who used a student credit card.
Among those families using credit cards for education expenses, over two-thirds did so out of convenience, up from 15 percent in 2008. Interestingly, those using credit cards for emergencies or unplanned expenses dropped from 46 percent in 2008 to 11 percent in 2009.
15%
46%
7%
32%
65%
11%4%
20%
0%10%20%30%40%50%60%70%80%90%
100%
Convenience Had No Money or Emergency
PreferableInterest
Rate
Other*
20082009
*Other includes most comfortable type of financing, thought couldn’t qualify for other types of financing, didn’t think eligible for financial aid, build credit, rewards programs, defer costs and “bridge financing”. Base: Parents who used a parent credit card and students who used a student credit card.
Fig. 40 Primary Reasons for Using Credit Card, Year-over-Year
13Methodology Change: Italicized wording added to question in 2009. “What was the primary reason you chose to use a credit card to pay for college as opposed to another source of borrow-ing?”

4�
H o w A m e r i c A P A y s f o r c o l l e g e2 0 0 9
Although families are concerned about college costs, especially as they contend with added financial con-straints in today’s economic environment, those currently enrolled, not surprisingly, continue to place a high value on higher education. College is an “investment” in the student’s future in which the student and parents both expect to see returns and for which they are still willing to stretch financially.
COURSE OF ACTION WITHOUT STUDENT LOANS
Attitudes and Perceptions
(Student using education loans) Suppose you did not have access to the education loans you are using to pay for college this year. Would you have delayed attending or not have attended college this year, or would you still have found a way to pay for college?
Among students who used some type of federal or private education loans to pay for the cost of college attendance in the 2008-09 school year, one-third would have had to delay or not attend college this year without student loans. Not surprisingly, as income rose, reli-ance on student loans to pay for college, among those who used them, became less critical. Forty-four percent
of students from families earning less than $35,000 per year who used student loans would have delayed attendance or not attended without education loans compared to 22 percent from families earning from $50,000 to less than $100,000.
Freshmen, sophomores and juniors were roughly equally likely (25-30%) to have had to delay attendance without student loans. Seniors were more likely (45%) to say they would have delayed a year than the lower grade levels. Among all grade levels, only sophomore respondents (12%) said they were unsure what they would have done.
68% 64%
31% 33%
1% 3%
0%
10%
20%
30%
40%
50%
60%
70%
80%
90%
100%
2008 2009
Not Sure
Would Have Delayed or Not Attended This Year
Would Have Found a Way to Pay for This Year
Fig. 41 Course of Action without Loans among Students with Education Loans, Year-over-Year
Base: Students with federal or private education loans.
DE
TAIL
ED
FIN
DIN
GS

��
gAllUPsAllie mAe
REASONS STUDENTS BORROW
(Students using education loans) Some families decide to have students borrow some or all of the cost of attending college instead of the parent borrowing all of the funds. In your family, why did you/your child borrow rather than your parents/you borrowing the full amount needed? (open ended)
Among respondents where the student used education loans, reasons why the student borrowed as opposed to the parent centered on student responsibility and loan considerations. Over one-third of respondents cited a responsibility-based reason for student borrowing, including: student should take some responsibility (19%), student chose not to rely on parents (12%), or parents shouldn’t have to pay for student (6%). Loan-based reasons for student borrowing included parent couldn’t qualify for loans (7%) and students received a lower inter-est rate (6%).
Only 9 percent of students stated they borrowed because their parent wanted them to take some responsibility for paying for college compared to 30 percent of parents saying they wanted students to take some responsibil-ity. Students were three times as likely as parents to cite the student’s preference not to rely on the parent as the reason for student borrowing. Only 4 percent of parents and 2 percent of students claimed the primary reason
Table 21 Course of Action without Student Loans
N % Would Have Found a Way to Pay for This Year
% Would Have Delayed or Not Attended This Year
% Not Sure
Students 249 64% 33% 3%
Income
<$35k 69 56% 44% 0%
$35k - <$50k 41 * * *
$50k - <$100k 92 78% 22% 0%
$100k - <$150k 24 * * *
$150k+ 7 * * *
Grade Level
Freshman 60 70% 30% 0%
Sophomore 63 62% 26% 12%
Junior 63 75% 25% 0%
Senior 50 55% 45% 0%
5th Year + 12 * * *
Base: Students with federal or private education loans. Note: Small sample sizes. Please refer to Sampling Tolerance in Technical Appendix.
the student borrowed was due to insufficient savings, financial aid, or available funds.
White families (20%) were more likely than Hispanic families (13%) to feel the student should take responsibility for college costs, and White families (7%) were more likely than Hispanic (3%) and African-American (3%) families to respond that parents shouldn’t have to pay for college. For nearly one-third (31%) of Hispanic families, the primary reason the student borrowed was because the student preferred not to rely on his/her parents.
Not Enough Available Funds
3%Parent Couldn't Qualify for Loans
7%
Student Should Take
Responsibility19%
ParentShouldn't
Have to Pay6%Student Prefers
Not to Rely on Parent12%
Lower Interest Rate than Parent
Loans6%
Parent Unwilling to Help Pay
3%
Other44%
Fig. 42 Primary Reasons Students Borrow
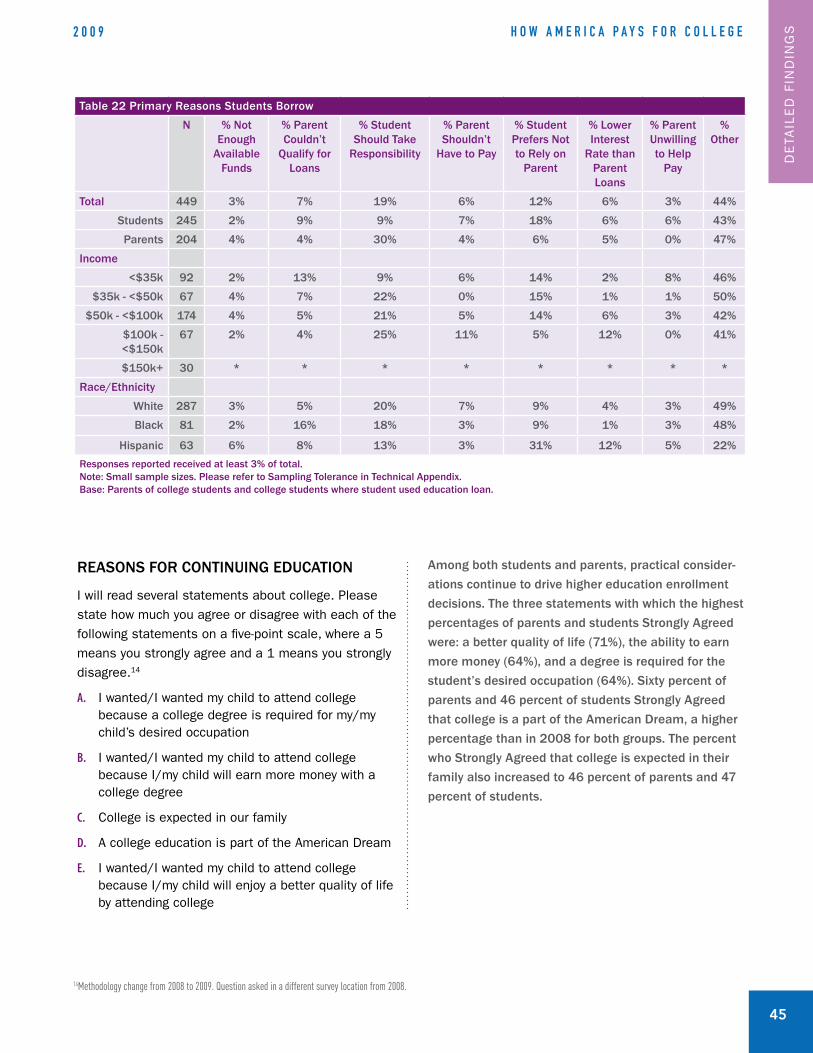
4�
H o w A m e r i c A P A y s f o r c o l l e g e2 0 0 9
REASONS FOR CONTINUING EDUCATION
I will read several statements about college. Please state how much you agree or disagree with each of the following statements on a five-point scale, where a 5 means you strongly agree and a 1 means you strongly disagree.14
I wanted/I wanted my child to attend college because a college degree is required for my/my child’s desired occupation
I wanted/I wanted my child to attend college because I/my child will earn more money with a college degree
College is expected in our family
A college education is part of the American Dream
I wanted/I wanted my child to attend college because I/my child will enjoy a better quality of life by attending college
A.
B.
C.
D.
E.
Table 22 Primary Reasons Students Borrow
N % Not Enough
Available Funds
% Parent Couldn’t
Qualify for Loans
% Student Should Take
Responsibility
% Parent Shouldn’t
Have to Pay
% Student Prefers Not to Rely on
Parent
% Lower Interest
Rate than Parent Loans
% Parent Unwilling to Help
Pay
% Other
Total 449 3% 7% 19% 6% 12% 6% 3% 44%
Students 245 2% 9% 9% 7% 18% 6% 6% 43%
Parents 204 4% 4% 30% 4% 6% 5% 0% 47%
Income
<$35k 92 2% 13% 9% 6% 14% 2% 8% 46%
$35k - <$50k 67 4% 7% 22% 0% 15% 1% 1% 50%
$50k - <$100k 174 4% 5% 21% 5% 14% 6% 3% 42%
$100k - <$150k
67 2% 4% 25% 11% 5% 12% 0% 41%
$150k+ 30 * * * * * * * *
Race/Ethnicity
White 287 3% 5% 20% 7% 9% 4% 3% 49%
Black 81 2% 16% 18% 3% 9% 1% 3% 48%
Hispanic 63 6% 8% 13% 3% 31% 12% 5% 22%Responses reported received at least 3% of total.Note: Small sample sizes. Please refer to Sampling Tolerance in Technical Appendix. Base: Parents of college students and college students where student used education loan.
Among both students and parents, practical consider-ations continue to drive higher education enrollment decisions. The three statements with which the highest percentages of parents and students Strongly Agreed were: a better quality of life (71%), the ability to earn more money (64%), and a degree is required for the student’s desired occupation (64%). Sixty percent of parents and 46 percent of students Strongly Agreed that college is a part of the American Dream, a higher percentage than in 2008 for both groups. The percent who Strongly Agreed that college is expected in their family also increased to 46 percent of parents and 47 percent of students.
14Methodology change from 2008 to 2009. Question asked in a different survey location from 2008.
DE
TAIL
ED
FIN
DIN
GS
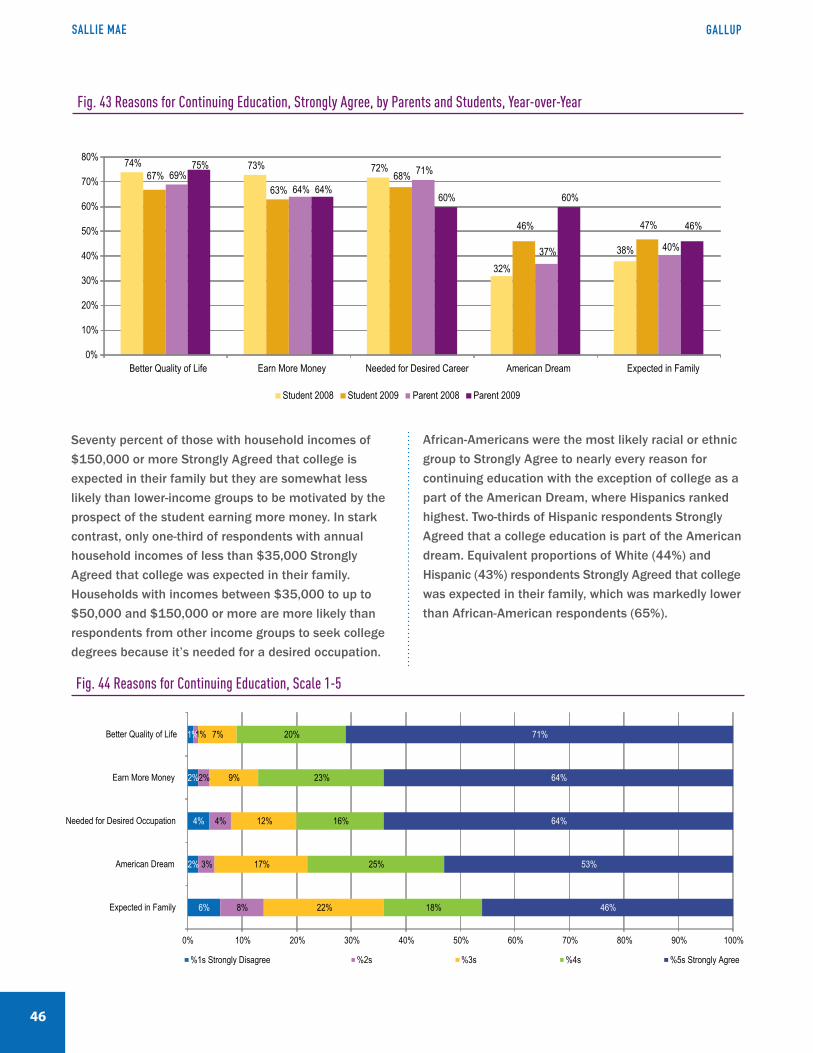
��
gAllUPsAllie mAe
Seventy percent of those with household incomes of $150,000 or more Strongly Agreed that college is expected in their family but they are somewhat less likely than lower-income groups to be motivated by the prospect of the student earning more money. In stark contrast, only one-third of respondents with annual household incomes of less than $35,000 Strongly Agreed that college was expected in their family. Households with incomes between $35,000 to up to $50,000 and $150,000 or more are more likely than respondents from other income groups to seek college degrees because it’s needed for a desired occupation.
African-Americans were the most likely racial or ethnic group to Strongly Agree to nearly every reason for continuing education with the exception of college as a part of the American Dream, where Hispanics ranked highest. Two-thirds of Hispanic respondents Strongly Agreed that a college education is part of the American dream. Equivalent proportions of White (44%) and Hispanic (43%) respondents Strongly Agreed that college was expected in their family, which was markedly lower than African-American respondents (65%).
6%
2%
4%
2%
1%
8%
3%
4%
2%
1%
22%
17%
12%
9%
7%
18%
25%
16%
23%
20%
46%
53%
64%
64%
71%
0% 10% 20% 30% 40% 50% 60% 70% 80% 90% 100%
Expected in Family
American Dream
Needed for Desired Occupation
Earn More Money
Better Quality of Life
%1s Strongly Disagree %2s %3s %4s %5s Strongly Agree
Fig. 43 Reasons for Continuing Education, Strongly Agree, by Parents and Students, Year-over-Year
Fig. 44 Reasons for Continuing Education, Scale 1-5
Student 2008 Student 2009 Parent 2008 Parent 2009
74% 73% 72%
32%
38%
67%63%
68%
46% 47%
69%64%
71%
37% 40%
75%
64%60% 60%
46%
0%
10%
20%
30%
40%
50%
60%
70%
80%
Better Quality of Life Earn More Money Needed for Desired Career American Dream Expected in Family

4�
H o w A m e r i c A P A y s f o r c o l l e g e2 0 0 9
PERCEPTIONS OF COLLEGE VALUE
I will read several statements about college. Please state how much you agree or disagree with each of the following statements on a five-point scale, where a 5 means you strongly agree and a 1 means you strongly disagree.15
I am willing to stretch myself financially to obtain the best opportunity for my/my child’s future.
I would rather borrow to pay for college than not/have my child not be able to go at all.
College is definitely worth the cost.
College is an investment in my/my child’s future.
College is not affordable for my family.
F.
G.
H.
I.
J.
Table 23 Reasons for Continuing Education, Rated Strongly Agree
% Strongly Agree
Total Students Parents White Black Hispanic
N 1604 800 804 1028 203 214
Needed for Desired Occupation 64% 68% 60% 61% 76% 73%
Earn More Money 64% 63% 64% 60% 80% 74%
Expected in Family 46% 47% 46% 44% 65% 43%
American Dream 53% 46% 60% 51% 59% 66%
Better Quality of Life 71% 67% 75% 68% 81% 79%
<$35k $35k - <$50k $50k - <$100k $100k - <$150k $150k+
N 276 185 551 287 189
Needed for Desired Occupation 63% 71% 63% 60% 70%
Earn More Money 66% 69% 63% 60% 56%
Expected in Family 33% 48% 42% 49% 70%
American Dream 49% 54% 51% 57% 55%
Better Quality of Life 63% 71% 71% 73% 73%
Table 24 Reasons for Continuing Education, Scale 1-5
N %1s Strongly Disagree
%2s %3s %4s %5s Strongly Agree
Needed for Desired Occupation 1603 4% 4% 12% 16% 64%
Earn More Money 1603 2% 2% 9% 23% 64%
Expected in Family 1604 6% 8% 22% 18% 46%
American Dream 1602 2% 3% 17% 25% 53%
Better Quality of Life 1602 1% 1% 7% 20% 71%
Compared to 2008, students appear to be more cost conscious when considering the value of college whereas parents are more willing to stretch financially and have somewhat higher opinions of the value of college. Although still seen as an investment in the future, fewer students this year indicated they would rather borrow than not attend than did so last year (down from 67% in 2008 to 53% in 2009). In addition, fewer students felt college is definitely worth the cost.
Although student respondents who were willing to stretch themselves financially also declined from 2008, the increase among parents who Strongly Agreed with this statement was the largest increase among all responses. Sixty-two percent of parents Strongly Agreed with this statement compared to 51 percent of parents in 2008.
15Methodology change from 2008 to 2009. Question asked in a different survey location from 2008.
DE
TAIL
ED
FIN
DIN
GS
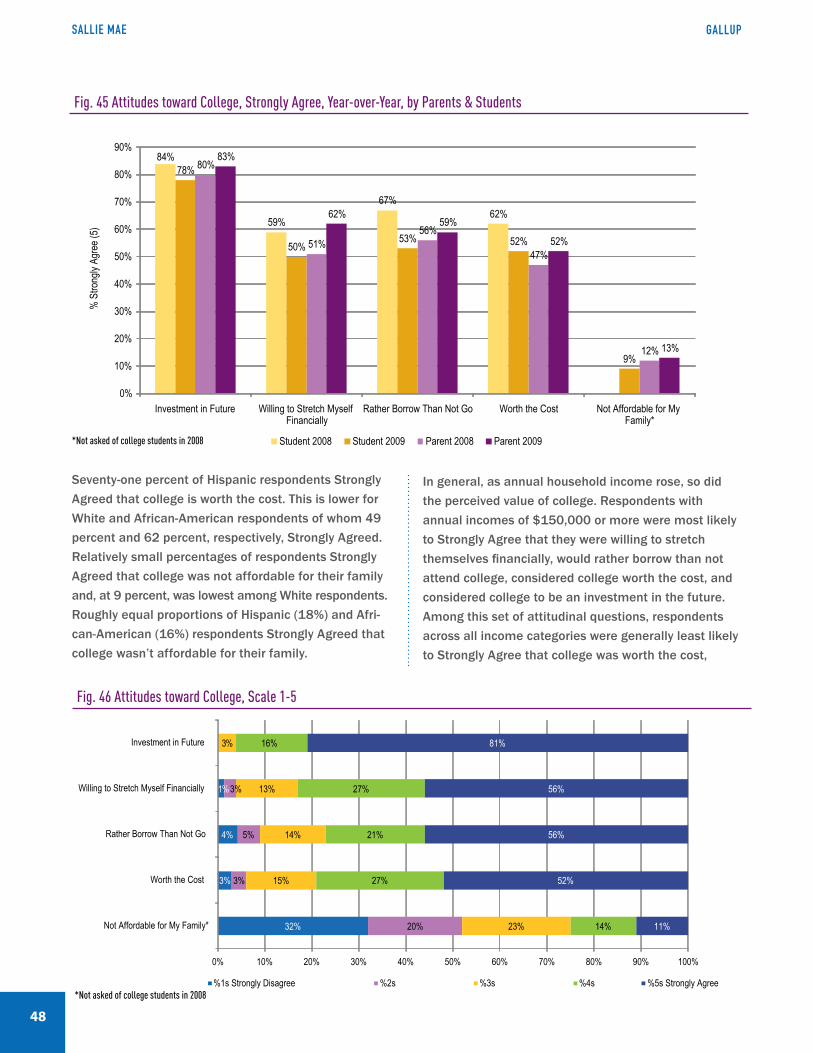
��
gAllUPsAllie mAe
Seventy-one percent of Hispanic respondents Strongly Agreed that college is worth the cost. This is lower for White and African-American respondents of whom 49 percent and 62 percent, respectively, Strongly Agreed. Relatively small percentages of respondents Strongly Agreed that college was not affordable for their family and, at 9 percent, was lowest among White respondents. Roughly equal proportions of Hispanic (18%) and Afri-can-American (16%) respondents Strongly Agreed that college wasn’t affordable for their family.
In general, as annual household income rose, so did the perceived value of college. Respondents with annual incomes of $150,000 or more were most likely to Strongly Agree that they were willing to stretch themselves financially, would rather borrow than not attend college, considered college worth the cost, and considered college to be an investment in the future. Among this set of attitudinal questions, respondents across all income categories were generally least likely to Strongly Agree that college was worth the cost,
Fig. 45 Attitudes toward College, Strongly Agree, Year-over-Year, by Parents & Students
Fig. 46 Attitudes toward College, Scale 1-5
11%
52%
56%
56%
32%
3%
4%
1%
20%
3%
5%
3%
23%
15%
14%
13%
3%
14%
27%
21%
27%
16%
11%
52%
56%
56%
81%
0% 10% 20% 30% 40% 50% 60% 70% 80% 90% 100%
Not Affordable for My Family*
Worth the Cost
Rather Borrow Than Not Go
Willing to Stretch Myself Financially
Investment in Future
%1s Strongly Disagree %2s %3s %4s %5s Strongly Agree
% S
trong
ly Ag
ree (
5)
84%
59%
67%62%
78%
50%53% 52%
9%
80%
51%56%
47%
12%
83%
62%59%
52%
13%
0%
10%
20%
30%
40%
50%
60%
70%
80%
90%
Investment in Future Willing to Stretch Myself Financially
Rather Borrow Than Not Go Worth the Cost Not Affordable for My Family*
Student 2008 Student 2009 Parent 2008 Parent 2009*Not asked of college students in 2008
*Not asked of college students in 2008

4�
H o w A m e r i c A P A y s f o r c o l l e g e2 0 0 9
Table 25 Attitudes Toward College, Rated Strongly Agree
% Strongly Agree
Total Students Parents White Black Hispanic
N 1604 800 804 1028 230 214
Willing to Stretch Myself Financially 56% 50% 62% 54% 68% 62%
Rather Borrow Than Not Go 56% 53% 59% 55% 63% 65%
Worth the Cost 52% 52% 52% 49% 62% 71%
Investment in Future 81% 78% 83% 79% 88% 85%
Not Affordable for My Family* 11% 9% 13% 9% 16% 18%
<$35k $35k - <$50k $50k - <$100k $100k - <$150k $150k+
N 276 185 551 287 189
Willing to Stretch Myself Financially 49% 57% 55% 54% 71%
Rather Borrow Than Not Go 52% 53% 53% 61% 71%
Worth the Cost 50% 53% 50% 53% 61%
Investment in Future 74% 82% 77% 89% 91%
Not Affordable for My Family* 27% 11% 10% 2% 3%*Not asked of college students in 2008.
Table 26 Attitudes Towards College, Scale 1-5
N %1s Strongly Disagree
%2s %3s %4s %5s Strongly Agree
Willing to Stretch Myself Financially 1603 1% 3% 13% 27% 56%
Rather Borrow Than Not Go 1598 4% 5% 14% 21% 56%
Worth the Cost 1602 3% 3% 15% 27% 52%
Investment in Future 1603 0% 0% 3% 16% 81%
Not Affordable for My Family* 1604 32% 20% 23% 14% 11%*Not asked of college students in 2008.
but most likely to Strongly Agree that college was an investment in the future. As expected, respondents who Strongly Agree that college is not affordable for their family rose as household income levels declined. Those with household incomes of $35,000 or less were over nine times more likely than those in the highest income category to Strongly Agree that college was not affordable.
DE
TAIL
ED
FIN
DIN
GS
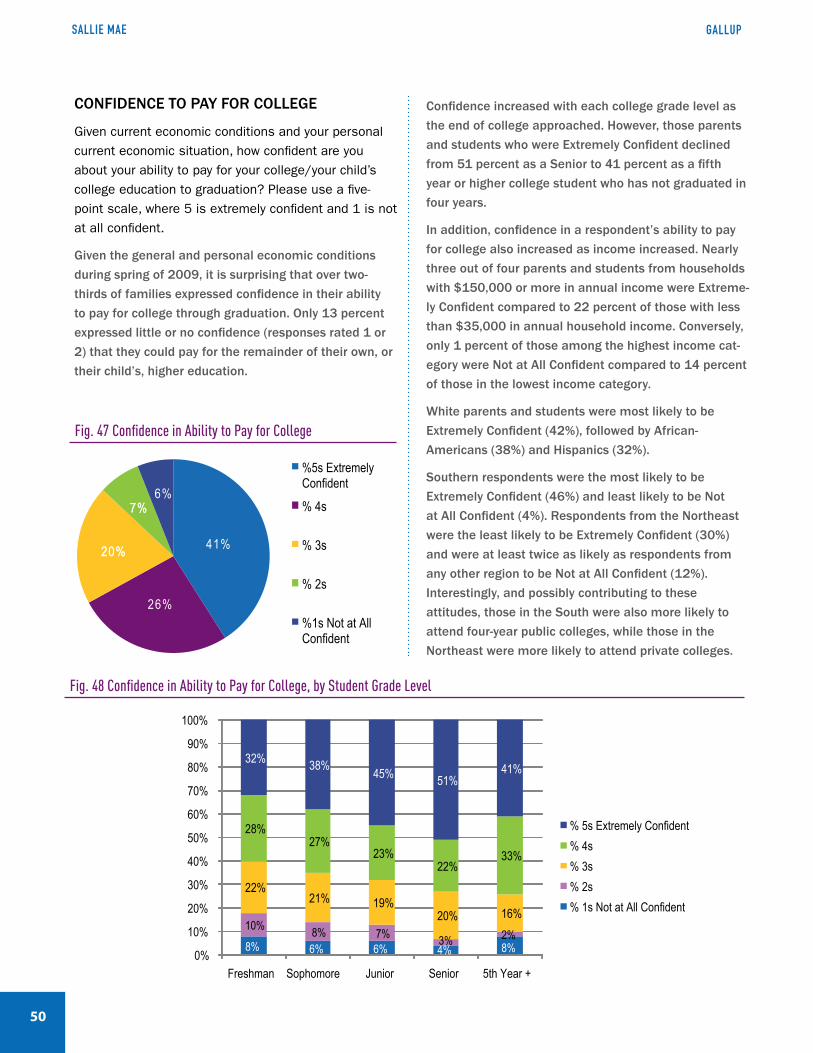
50
gAllUPsAllie mAe
CONFIDENCE TO PAY FOR COLLEGE
Given current economic conditions and your personal current economic situation, how confident are you about your ability to pay for your college/your child’s college education to graduation? Please use a five-point scale, where 5 is extremely confident and 1 is not at all confident.
Given the general and personal economic conditions during spring of 2009, it is surprising that over two-thirds of families expressed confidence in their ability to pay for college through graduation. Only 13 percent expressed little or no confidence (responses rated 1 or 2) that they could pay for the remainder of their own, or their child’s, higher education.
Confidence increased with each college grade level as the end of college approached. However, those parents and students who were Extremely Confident declined from 51 percent as a Senior to 41 percent as a fifth year or higher college student who has not graduated in four years.
In addition, confidence in a respondent’s ability to pay for college also increased as income increased. Nearly three out of four parents and students from households with $150,000 or more in annual income were Extreme-ly Confident compared to 22 percent of those with less than $35,000 in annual household income. Conversely, only 1 percent of those among the highest income cat-egory were Not at All Confident compared to 14 percent of those in the lowest income category.
White parents and students were most likely to be Extremely Confident (42%), followed by African- Americans (38%) and Hispanics (32%).
Southern respondents were the most likely to be Extremely Confident (46%) and least likely to be Not at All Confident (4%). Respondents from the Northeast were the least likely to be Extremely Confident (30%) and were at least twice as likely as respondents from any other region to be Not at All Confident (12%). Interestingly, and possibly contributing to these attitudes, those in the South were also more likely to attend four-year public colleges, while those in the Northeast were more likely to attend private colleges.
Fig. 48 Confidence in Ability to Pay for College, by Student Grade Level
Fig. 47 Confidence in Ability to Pay for College
41%
26%
20%20%
7%7%6%
%5s Extremely Confident
% 4s
% 3s
% 2s
%1s Not at All Confident
8% 6% 6% 4% 8%
10% 8% 7% 3% 2%
22%21% 19%
20% 16%
28%27%
23%22%
33%
32% 38% 45% 51%41%
0%
10%
20%
30%
40%
50%
60%
70%
80%
90%
100%
Freshman Sophomore Junior Senior 5th Year +
% 5s Extremely Confident% 4s% 3s% 2s% 1s Not at All Confident

��
H o w A m e r i c A P A y s f o r c o l l e g e2 0 0 9
Table 27 Confidence in Ability to Pay For College, Scale 1-5
N %1s Not at All Confident
%2s %3s %4s %5s Extremely Confident
Total 1602 6% 7% 20% 26% 41%
Students 800 1% 7% 20% 30% 42%
Parents 802 11% 8% 21% 21% 39%
Income
<$35k 275 14% 14% 27% 23% 22%
$35k - <$50k 185 7% 5% 31% 25% 32%
$50k - <$100k 550 5% 9% 20% 24% 42%
$100k - <$150k 287 1% 3% 16% 39% 41%
$150k+ 189 1% 2% 6% 19% 72%
Race/Ethnicity
White 1027 5% 7% 20% 26% 42%
Black 230 9% 8% 22% 23% 38%
Hispanic 214 5% 14% 21% 28% 32%
Grade Level
Freshman 524 8% 10% 22% 28% 32%
Sophomore 448 6% 8% 21% 27% 38%
Junior 323 6% 7% 19% 23% 45%
Senior 243 4% 3% 20% 22% 51%
5th Year + 56 8% 2% 16% 33% 41%
Region
Northeast 189 12% 9% 21% 28% 30%
Midwest 520 5% 9% 19% 26% 41%
South 608 4% 4% 21% 25% 46%
West 282 6% 10% 20% 26% 38%
PARENT ECONOMIC CONCERNS
When thinking about paying for college, to what extent are you worried about each of the following economic factors? Please use a scale from one to five, where 5 is extremely worried and 1 is not at all worried. How worried are you about paying for college in today’s economy because:
The value of your home will go down
The value of your savings or investments will be lower than you expected
Loan rates will go up
Student loan money will be less available
Your child won’t be able to find a summer job to earn money for next semester/employment after graduation
A.
B.
C.
D.
E.
Schools will have to raise tuition to cover in-creased costs
My student loan provider will go out of business
Earned income will go down due to job loss
Despite the findings that families are relatively confident that they will be able to pay for college costs, current economic conditions increased worries among parents of college students regarding their ability to pay for college. Thirty-five percent of parents were Extremely Worried that schools will raise tuition, marking this as the top economic concern, consistent with last year’s findings.
Parents showed markedly increased anxiety over the value of savings and investments with 31 percent of parents Extremely Worried compared to 17 percent last
F.
G.
H.
DE
TAIL
ED
FIN
DIN
GS

5�
gAllUPsAllie mAe
year. Nearly one-quarter (23%) of parents were also Extremely Worried about lower income due to job loss.
African-American parents were more likely than White or Hispanic parents to be Extremely Worried about all economic factors and the impact on their ability to pay for college. Job loss was the largest concern for African-American parents (52%), while reduction in savings value (44%) was the top concern among Hispanic parents. In general, the percent of parents who were Extremely Worried about specific economic
factors increased as income decreased. Lower-income families were much more concerned about loan availability (50%) and loan rates increasing (41%) than higher-income families. Concern that savings values will be lower was high among all income groups. Levels of concern by region were relatively consistent but parents in the Northeast (33%) were the most concerned about income declines due to job loss.
Fig. 49 Parent Economic Concerns, Scale 1-5
Fig. 50 Parent Economic Concerns, Extremely Worried, Year-over-Year
Base: Parents of college students.
38%
21%
29%
32%
35%
14%
58%
28%
11%
13%
11%
9%
15%
7%
13%
13%
19%
19%
21%
21%
18%
21%
12%
21%
11%
16%
17%
16%
14%
23%
8%
15%
21%
31%
22%
22%
18%
35%
9%
23%
0% 20% 40% 60% 80% 100%
Home Value Will Decrease
Value of Savings Will Be Lower
Loan Rates Will Increase
Student Loan Money Will Be Less Available
Student Won't Find Summer Job/Job After Graduation
Schools Will Raise Tuition
Student Loan Provider Will Go Out of Business
Income Will Decrease Due to Job Loss
%1s Extremely Worried %2s %3s %4s %5s Not at all Worried
Base: Parents of college students. *Not asked in 2008
9%
18%
21%
22%
22%
23%
31%
35%
8%
10%
20%
18%
29%
17%
32%
0% 10% 20% 30% 40%
Student Loan Provider Will Go Out of Business
Student Won’t Find Summer Job/Job After Graduation
Home Value Will Decrease
Student Loan Money Will Be Less Available
Loan Rates Will Increase
Income Will Decrease Due to Job Loss*
Value of Savings Will Be Lower
Schools Will Raise Tuition
2008
2009

��
H o w A m e r i c A P A y s f o r c o l l e g e2 0 0 9
Table 28 Parent Economic Concerns, Scale 1-5N %1s Not at all
Worried%2s %3s %4s %5s Extremely
Worried
Home Value Will Decrease 789 38% 11% 19% 11% 21%
Value of Savings Will Be Lower 800 21% 13% 19% 16% 31%
Loan Rates Will Increase 769 29% 11% 21% 17% 22%
Student Loan Money Will Be Less Available 800 32% 9% 21% 16% 22%
Student Won’t Be Able to Find Summer Job/ Employment After Graduation
801 35% 15% 18% 14% 18%
Schools Will Raise Tuition 803 14% 7% 21% 23% 35%
Student Loan Provider Will Go Out of Business 791 58% 13% 12% 8% 9%
Income Will Decrease Due to Job Loss 802 28% 13% 21% 15% 23%Base: Parents of college students.
Table 29 Parent Economic Concerns, Rated Extremely Worried
N Home Value Will Decrease
Value of Savings Will Be Lower
Loan Rates Will
Increase
Student Loan Money Will Be Less
Available
Student Won’t Be
Able to Find Summer
Job/ Employment
After Graduation
Schools Will
Raise Tuition
Student Loan
Provider Will Go Out of Business
Income Will
Decrease Due to
Job Loss
Total Parents 804 21% 31% 22% 22% 18% 35% 9% 23%
Income
<$35k 88 28% 33% 41% 50% 31% 48% 18% 43%
$35k - <$50k 68 24% 35% 25% 23% 13% 37% 8% 31%
$50k - <$100k 282 25% 34% 25% 21% 19% 36% 9% 21%
$100k - <$150k 196 13% 22% 13% 11% 10% 32% 6% 13%
$150k+ 140 7% 24% 7% 6% 13% 17% 3% 9%
Race/Ethnicity
White 577 17% 26% 20% 20% 16% 33% 8% 18%
Black 104 35% 48% 44% 40% 33% 50% 13% 52%
Hispanic 81 29% 44% 21% 24% 21% 29% 6% 21%
Region
Northeast 135 20% 33% 28% 26% 25% 37% 8% 33%
Midwest 197 22% 32% 19% 18% 18% 34% 12% 21%
South 275 19% 32% 23% 26% 17% 33% 7% 25%
West 197 22% 26% 20% 19% 13% 38% 9% 14%Base: Parents of college students.
DE
TAIL
ED
FIN
DIN
GS

5�
gAllUPsAllie mAe
PERCEIVED HELPFULNESS OF ORGANIzATIONS
Now I am going to read a list of different groups that play a part in providing financing for college. How helpful are each of the following groups in providing financial access to college? Please use a five-point scale, where 5 is extremely helpful and 1 is extremely unhelpful. (A to L Rotated)
Student loan companies
The federal government
Your state government
Public colleges and universities
Private colleges and universities
The financial aid office at your/your child’s college
Your local high school or guidance office
College savings plan companies
Family and friends
Church or religious organizations
Foundations and scholarship organizations
Congress
Family and friends (23%) were most commonly rated as Extremely Helpful in providing financial access to college, followed by the financial aid office at their in-stitution of higher learning (22%), and foundations and scholarship organizations (19%). Fourteen percent of respondents considered public colleges and universities Extremely Helpful in this regard, compared to only 9 percent of private colleges and universities. Among government institutions, 14 percent of respondents perceived the federal government as Extremely Helpful followed by the state government (10%). Student loan companies were considered Extremely Helpful by 12 percent of respondents, slightly less than the federal government and slightly above state government. College savings plan companies (7%), church or religious organizations (6%), and Congress (3%) were perceived as the least helpful of organizations.
When Extremely Helpful (5) and Helpful (4) responses were combined to gauge perceived helpfulness, the financial aid office at their institution of higher learning
A.
B.
C.
D.
E.
F.
G.
H.
I.
J.
K.
L.
(53%) outranked family and friends (41%) as the most helpful organization. In addition, student loan companies (36%) rose above the federal government (33%) into the top five organizations to be perceived most helpful in providing financial access to college.
Compared to 2008, respondents were less likely to rank each organization as being Extremely Helpful in provid-ing financial access to college. Although still perceived as being among the top five most helpful organizations, public colleges and universities and foundations and scholarship organizations each experienced the largest decline of seven percentage points among respondents who view them as Extremely Helpful. High school guidance offices were considered Extremely Helpful by 10 percent of respondents and were the only organizations which did not decline from 2008.

��
H o w A m e r i c A P A y s f o r c o l l e g e2 0 0 9
Fig. 51 Perceived Helpfulness of Organizations, Combined Extremely Helpful and Helpful Responses, Year-over-Year
12%
14%
22%
23%
28%
29%
33%
36%
41%
47%
48%
Percent Rating Helpfulness 4 or 5
11%
21%
25%
31%
35%
35%
43%
46%
45%
51%
59%
53%62%
0% 10% 20% 30% 40% 50% 60% 70%
Congress
Church or Religious Organizations
College Savings Plan Companies
Your Local High School or Guidance Office
Private Colleges and Universities
Your State Government
The Federal Government
Student Loan Companies
Family and Friends
Public Colleges and Universities
Foundations and Scholarship Organizations
The Financial Aid Office at Your Child's College
20082009
Table 30 Perceived Helpfulness of Organizations, Scale 1-5
N %1s Extremely Unhelpful
%2s %3s %4s %5s Extremely Helpful
Congress 1552 40% 21% 27% 9% 3%Church or Religious Organizations 1574 42% 21% 23% 8% 6%College Savings Plan Companies 1544 29% 16% 33% 15% 7%Private Colleges and Universities 1549 25% 20% 27% 19% 9%Your Local High School or Guidance Office 1589 32% 20% 25% 13% 10%Your State Government 1572 25% 20% 26% 19% 10%Student Loan Companies 1567 19% 13% 32% 24% 12%The Federal Government 1583 23% 17% 27% 19% 14%Public Colleges and Universities 1578 12% 10% 31% 33% 14%Foundations and Scholarship Organizations 1585 13% 12% 27% 29% 19%The Financial Aid Office at Your Child’s College 1578 12% 11% 24% 31% 22%Family and Friends 1593 24% 13% 22% 18% 23%
DE
TAIL
ED
FIN
DIN
GS
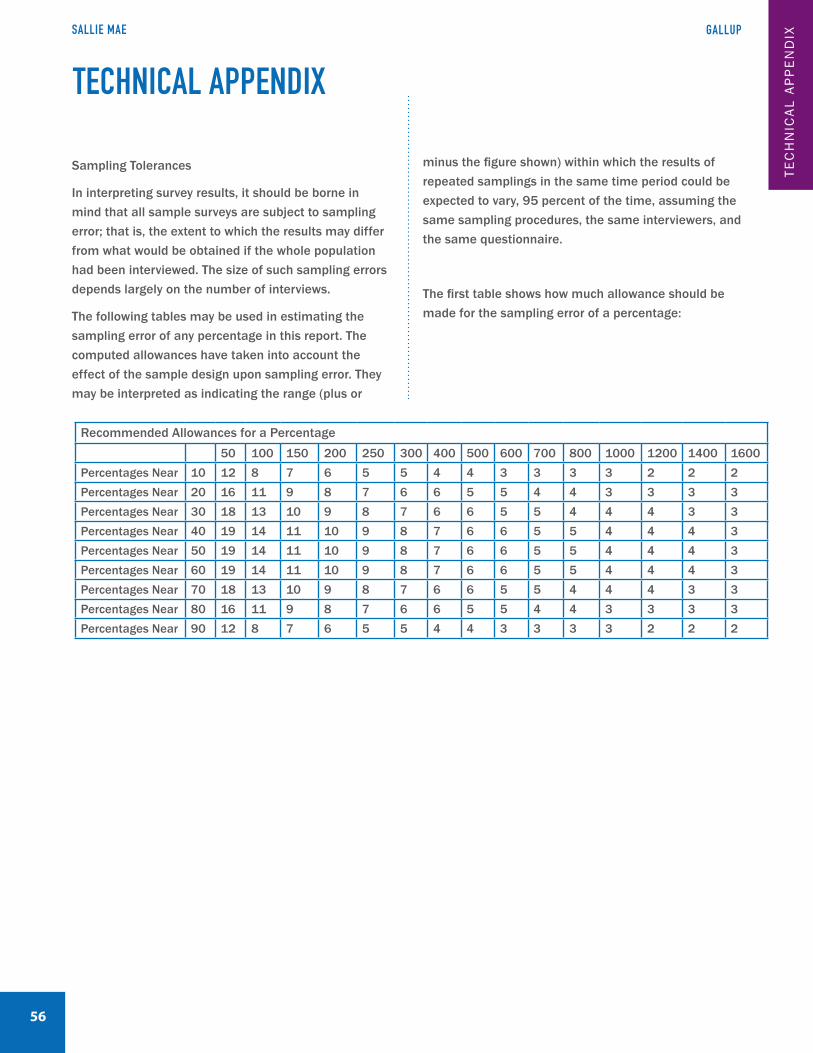
5�
gAllUPsAllie mAe
TecHnicAl APPenDix
Sampling Tolerances
In interpreting survey results, it should be borne in mind that all sample surveys are subject to sampling error; that is, the extent to which the results may differ from what would be obtained if the whole population had been interviewed. The size of such sampling errors depends largely on the number of interviews.
The following tables may be used in estimating the sampling error of any percentage in this report. The computed allowances have taken into account the effect of the sample design upon sampling error. They may be interpreted as indicating the range (plus or
Recommended Allowances for a Percentage50 100 150 200 250 300 400 500 600 700 800 1000 1200 1400 1600
Percentages Near 10 12 8 7 6 5 5 4 4 3 3 3 3 2 2 2Percentages Near 20 16 11 9 8 7 6 6 5 5 4 4 3 3 3 3Percentages Near 30 18 13 10 9 8 7 6 6 5 5 4 4 4 3 3Percentages Near 40 19 14 11 10 9 8 7 6 6 5 5 4 4 4 3Percentages Near 50 19 14 11 10 9 8 7 6 6 5 5 4 4 4 3Percentages Near 60 19 14 11 10 9 8 7 6 6 5 5 4 4 4 3Percentages Near 70 18 13 10 9 8 7 6 6 5 5 4 4 4 3 3Percentages Near 80 16 11 9 8 7 6 6 5 5 4 4 3 3 3 3Percentages Near 90 12 8 7 6 5 5 4 4 3 3 3 3 2 2 2
minus the figure shown) within which the results of repeated samplings in the same time period could be expected to vary, 95 percent of the time, assuming the same sampling procedures, the same interviewers, and the same questionnaire.
The first table shows how much allowance should be made for the sampling error of a percentage:
TE
CH
NIC
AL A
PP
EN
DIX

��
H o w A m e r i c A P A y s f o r c o l l e g e2 0 0 9
The table would be used in the following manner: Let us say a reported percentage is 33 for a group which includes 700 respondents. Then we go to row “percent-ages near 30” in the table and go across to the column headed “700”. The number at this point is 5, which means that the 33 percent obtained in the sample is subject to a sampling error of plus or minus 5 points. Another way of saying it is that very probably (95 chances of 100) the true figure would be somewhere between 28 and 38, with the most likely figure the 33 obtained.
Recommended Allowances for Percentages Near 80 or 2050 100 150 200 250 300 400 500 600 700 800 1000 1200 1400 1600
50 22 19 18 17 17 17 17 16 16 16 16 16 16 16 16100 16 14 14 13 13 12 12 12 12 12 12 11 11 11150 13 12 11 11 11 10 10 10 10 10 10 9 9200 11 10 10 10 9 9 9 9 9 8 8 8250 10 9 9 9 8 8 8 8 8 8 8300 9 8 8 8 8 7 7 7 7 7400 8 7 7 7 7 7 6 6 6500 7 7 6 6 6 6 6 6600 6 6 6 6 6 5 5700 6 6 5 5 5 5800 6 5 5 5 51000 5 5 5 41200 5 4 41400 4 4
1600 4
Recommended Allowances for Percentages Near 5050 100 150 200 250 300 400 500 600 700 800 1000 1200 1400 1600
50 28 24 23 22 21 21 21 20 20 20 20 20 20 20 20100 19 18 17 16 16 15 15 15 15 15 14 14 14 14150 16 15 14 14 13 13 13 12 12 12 12 12 12200 14 13 13 12 12 11 11 11 11 11 10 10250 12 12 11 11 10 10 10 10 10 9 9300 11 11 10 10 10 9 9 9 9 9400 10 9 9 9 8 8 8 8 8500 9 8 8 8 8 7 7 7600 8 8 7 7 7 7 7700 7 7 7 7 6 6800 7 7 6 6 61000 6 6 6 61200 6 5 51400 5 51600 5
In comparing survey results in two samples, such as, for example, students and parents, the question arises as to how large a difference between them must be before one can be reasonably sure that it reflects a real difference. In the tables below, the number of points which must be allowed for in such comparisons is indicated.
Two tables are provided. One is for percentages near 20 or 80; the other for percentages near 50. For percentages in between, the error to be allowed for is between those shown in the two tables.
* The Chances Are 95 In 100 That The Sampling Error Is Not Larger Than The Figure Shown.

5�
gAllUPsAllie mAe
AD
DE
ND
A
Table 7a Sources of Parent Personal Contributions
% of Total Families Average Amount**
Any Parent Sources 59% $9,581
Current Income 55% $7,175
Any Parent Savings 23% $8,724
College Savings Plan (529) 11% $7,312
Retirement Savings Withdrawal 3% $5,318
Other Savings or Investments 14% $7,776 **Among those who used each source
Table 13a Percent Who Borrowed to Pay for College Costs by Amount of Savings Used to Pay College Costs
Amount of Savings Used N Percent Who Borrowed
Total 1419
$0 790 48%
$1-999 109 43%
$1,000-1,999 105 40%
$2,000-4,999 163 38%
$5,000-9,999 113 35%
$10,000+ 139 21%
48%43%
40% 38%35%
21%
0%
10%
20%
30%
40%
50%
60%
$0 $1 - <$1k $1k - <$2k $2k - <$5k $5k - <$10k $10k+
Amount of Savings Used
Fig. 52 Percent Who Borrowed by Amount of Savings Used
ADDenDA

��
H o w A m e r i c A P A y s f o r c o l l e g e2 0 0 9

www.SallieMae.com/HowAmericaPays