

How America Eats
58
How America Eats: What Impact the Choices? Sally Lyons Wyatt Executive Vice President & Practice Leader April 21, 2016
Transcript of How America Eats
How America Eats: What Impact the Choices?
Sally Lyons Wyatt
Executive Vice President & Practice Leader
April 21, 2016
THE GAME PLAN
The Field (Industry Trends)
Past and Present Teams (Consumer Eating Trends) Plays of the Day (Millennials, Hispanics, H&W, & Claims)
How to Win Going Forward (The Strategy)
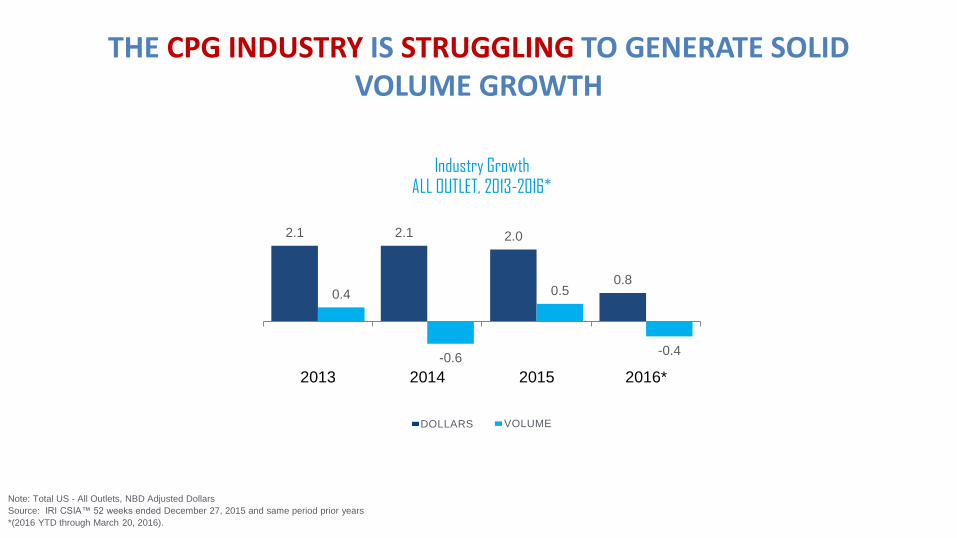
THE CPG INDUSTRY IS STRUGGLING TO GENERATE SOLID VOLUME GROWTH
ALL OUTLET, 2013-2016*
DOLLARS VOLUME
Note: Total US - All Outlets, NBD Adjusted Dollars
Source: IRI CSIA™ 52 weeks ended December 27, 2015 and same period prior years
*(2016 YTD through March 20, 2016).
Industry Growth
2.1 2.1 2.0
0.8 0.4
-0.6
0.5
-0.4
2013 2014 2015 2016*
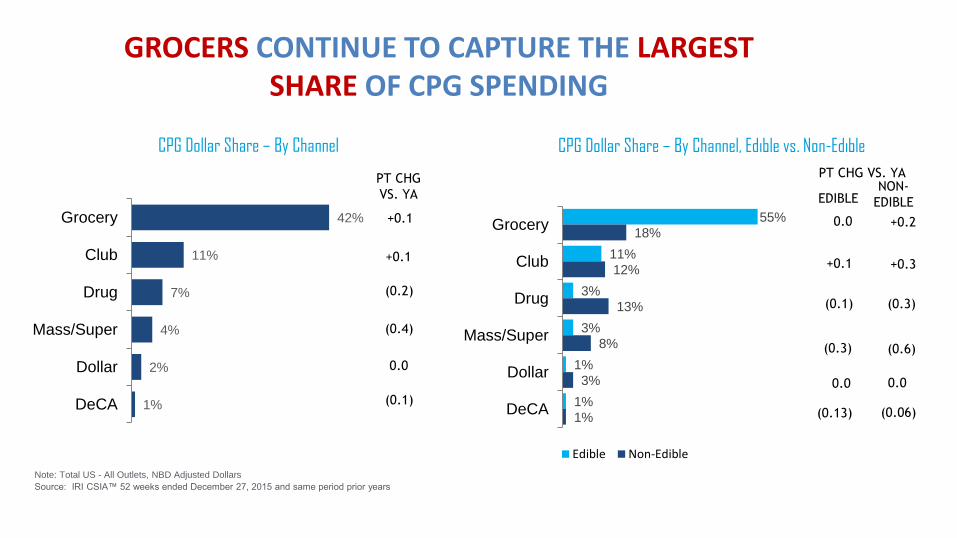
GROCERS CONTINUE TO CAPTURE THE LARGEST SHARE OF CPG SPENDING
Note: Total US - All Outlets, NBD Adjusted Dollars
Source: IRI CSIA™ 52 weeks ended December 27, 2015 and same period prior years
CPG Dollar Share – By Channel CPG Dollar Share – By Channel, Edible vs. Non-Edible
PT CHG
VS. YA
0.0
0.0
(0.3)
(0.1)
+0.1
EDIBLE
+0.2
0.0
(0.6)
(0.3)
+0.3
NON-
EDIBLE
PT CHG VS. YA
42%
11%
7%
4%
2%
1%
Grocery
Club
Drug
Mass/Super
Dollar
DeCA
+0.1
0.0
(0.4)
(0.2)
+0.1
(0.1)
55%
11%
3%
3%
1%
1%
18%
12%
13%
8%
3%
1%
Grocery
Club
Drug
Mass/Super
Dollar
DeCA
Edible Non-Edible
(0.13) (0.06)

VARIETY OF TRENDS IMPACTING CATEGORIES ACROSS THE STORE
CPG Sales % Chg. vs. YA, by Department, MULOC
3.2%
5.4% 5.3% 5.1% 4.7%
2.9% 2.5%
2.0% 2.0% 2.0% 1.3%
0.90%
3.2% 3.1% 3.6%
1.6% 1.0%
1.3%
0.1% 0.2%
-0.4%
-1.2% TOTAL
STORE
BEVERAGES LIQUOR TOBACCO HEALTH GENERAL
MERCH
REFRIG. BEAUTY HOME
CARE
GENERAL
FOOD
FROZEN
Source: IRI Market Advantage™ 52 weeks ended December 27, 2015, and same period prior year
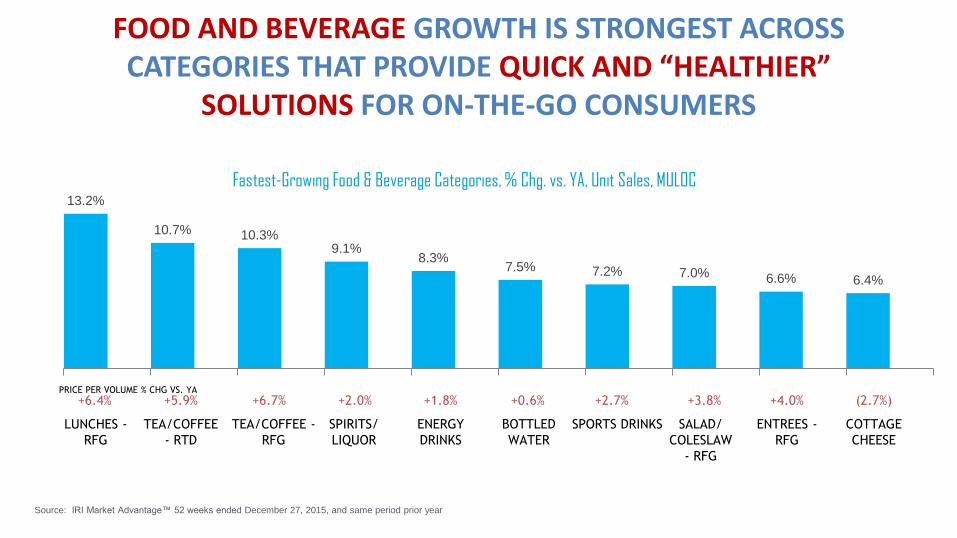
13.2%
10.7% 10.3% 9.1%
8.3% 7.5% 7.2% 7.0% 6.6% 6.4%
FOOD AND BEVERAGE GROWTH IS STRONGEST ACROSS CATEGORIES THAT PROVIDE QUICK AND “HEALTHIER”
SOLUTIONS FOR ON-THE-GO CONSUMERS
Fastest-Growing Food & Beverage Categories, % Chg. vs. YA, Unit Sales, MULOC
Source: IRI Market Advantage™ 52 weeks ended December 27, 2015, and same period prior year
+6.4% +5.9% +6.7% +2.0% +1.8% +0.6% +2.7% +3.8% +4.0% (2.7%)
LUNCHES -
RFG
TEA/COFFEE
- RTD
TEA/COFFEE -
RFG
SPIRITS/
LIQUOR
ENERGY
DRINKS
BOTTLED
WATER
SPORTS DRINKS SALAD/
COLESLAW
- RFG
ENTREES -
RFG
COTTAGE
CHEESE
PRICE PER VOLUME % CHG VS. YA
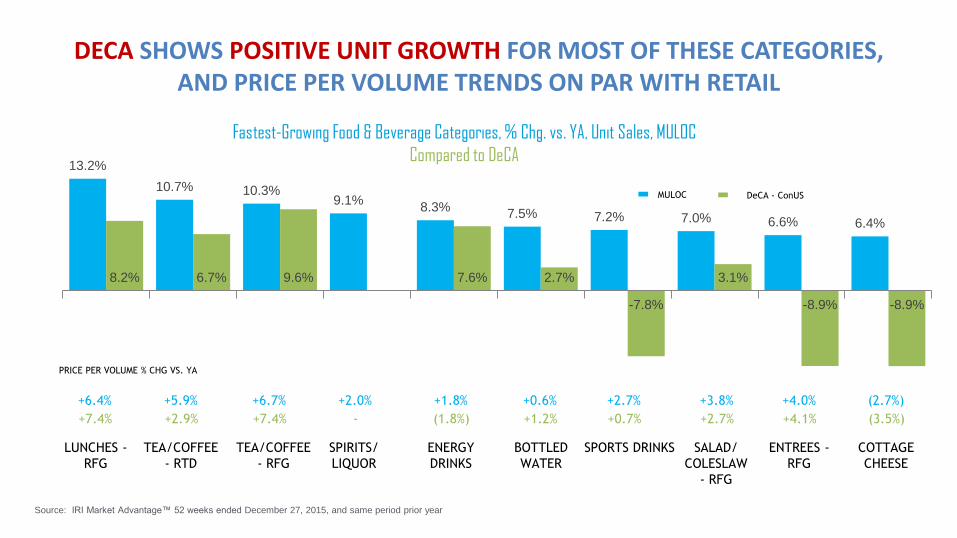
13.2%
10.7% 10.3% 9.1%
8.3% 7.5% 7.2% 7.0% 6.6% 6.4%
8.2% 6.7% 9.6% 7.6% 2.7%
-7.8%
3.1%
-8.9% -8.9%
DECA SHOWS POSITIVE UNIT GROWTH FOR MOST OF THESE CATEGORIES, AND PRICE PER VOLUME TRENDS ON PAR WITH RETAIL
Fastest-Growing Food & Beverage Categories, % Chg. vs. YA, Unit Sales, MULOC
Compared to DeCA
Source: IRI Market Advantage™ 52 weeks ended December 27, 2015, and same period prior year
+6.4% +5.9% +6.7% +2.0% +1.8% +0.6% +2.7% +3.8% +4.0% (2.7%)
LUNCHES -
RFG
TEA/COFFEE
- RTD
TEA/COFFEE
- RFG
SPIRITS/
LIQUOR
ENERGY
DRINKS
BOTTLED
WATER
SPORTS DRINKS SALAD/
COLESLAW
- RFG
ENTREES -
RFG
COTTAGE
CHEESE
MULOC DeCA - ConUS
PRICE PER VOLUME % CHG VS. YA
+7.4% +2.9% +7.4% - (1.8%) +1.2% +0.7% +2.7% +4.1% (3.5%)
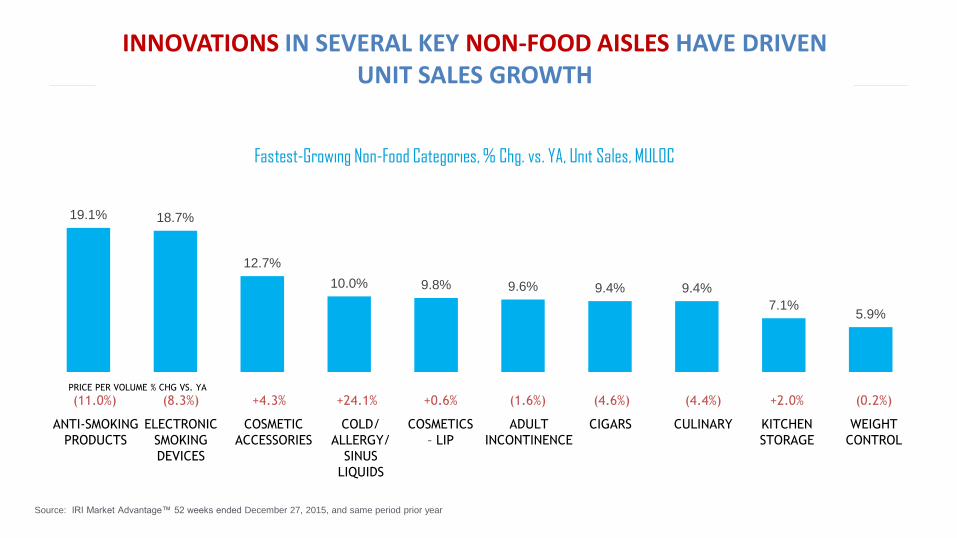
19.1% 18.7%
12.7%
10.0% 9.8% 9.6% 9.4% 9.4%
7.1% 5.9%
INNOVATIONS IN SEVERAL KEY NON-FOOD AISLES HAVE DRIVEN UNIT SALES GROWTH
Fastest-Growing Non-Food Categories, % Chg. vs. YA, Unit Sales, MULOC
Source: IRI Market Advantage™ 52 weeks ended December 27, 2015, and same period prior year
(11.0%) (8.3%) +4.3% +24.1% +0.6% (1.6%) (4.6%) (4.4%) +2.0% (0.2%)
ANTI-SMOKING
PRODUCTS
ELECTRONIC
SMOKING
DEVICES
COSMETIC
ACCESSORIES
COLD/
ALLERGY/
SINUS
LIQUIDS
COSMETICS
– LIP
ADULT
INCONTINENCE
CIGARS CULINARY KITCHEN
STORAGE
WEIGHT
CONTROL
PRICE PER VOLUME % CHG VS. YA
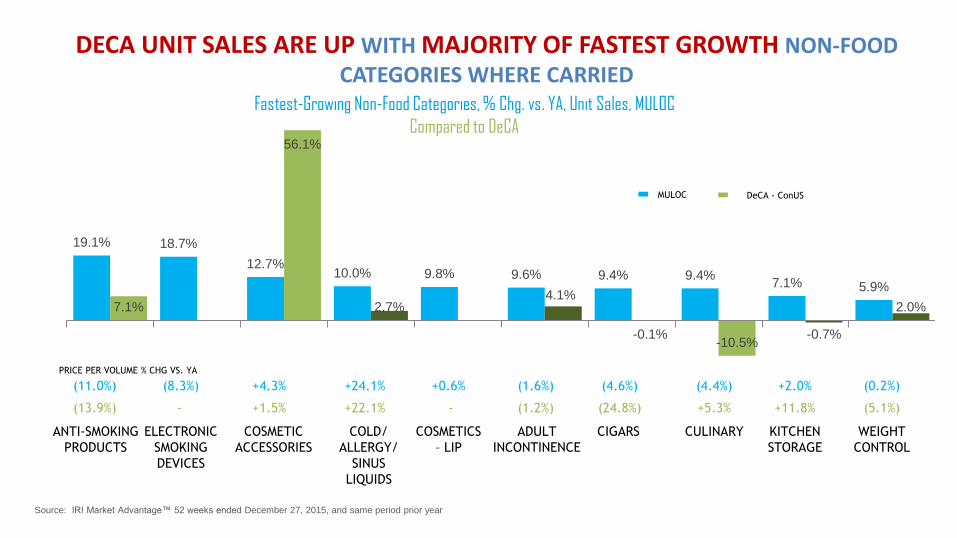
19.1% 18.7%
12.7% 10.0% 9.8% 9.6% 9.4% 9.4%
7.1% 5.9%
7.1%
56.1%
2.7% 4.1%
-0.1% -10.5%
-0.7%
2.0%
DECA UNIT SALES ARE UP WITH MAJORITY OF FASTEST GROWTH NON-FOOD CATEGORIES WHERE CARRIED
Fastest-Growing Non-Food Categories, % Chg. vs. YA, Unit Sales, MULOC
Compared to DeCA
Source: IRI Market Advantage™ 52 weeks ended December 27, 2015, and same period prior year
(11.0%) (8.3%) +4.3% +24.1% +0.6% (1.6%) (4.6%) (4.4%) +2.0% (0.2%)
ANTI-SMOKING
PRODUCTS
ELECTRONIC
SMOKING
DEVICES
COSMETIC
ACCESSORIES
COLD/
ALLERGY/
SINUS
LIQUIDS
COSMETICS
– LIP
ADULT
INCONTINENCE
CIGARS CULINARY KITCHEN
STORAGE
WEIGHT
CONTROL
MULOC DeCA - ConUS
PRICE PER VOLUME % CHG VS. YA
(13.9%) +1.5% +22.1% (1.2%) (24.8%) +5.3% +11.8% (5.1%) - -
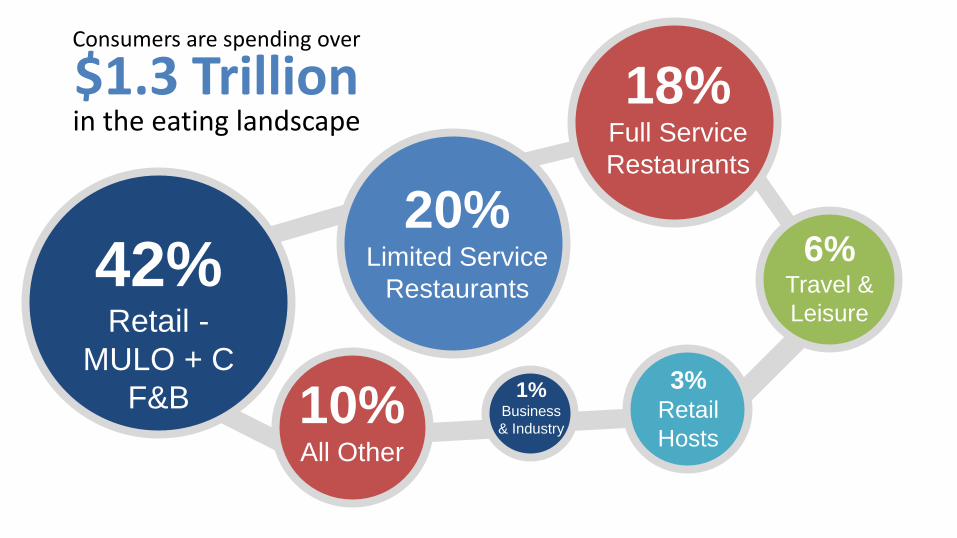
Consumers are spending over
$1.3 Trillion in the eating landscape
42% Retail -
MULO + C
F&B
20% Limited Service
Restaurants
6% Travel &
Leisure
3% Retail
Hosts
1% Business
& Industry
18% Full Service
Restaurants
10% All Other

THE EATING LANDSCAPE IS DIVERSE
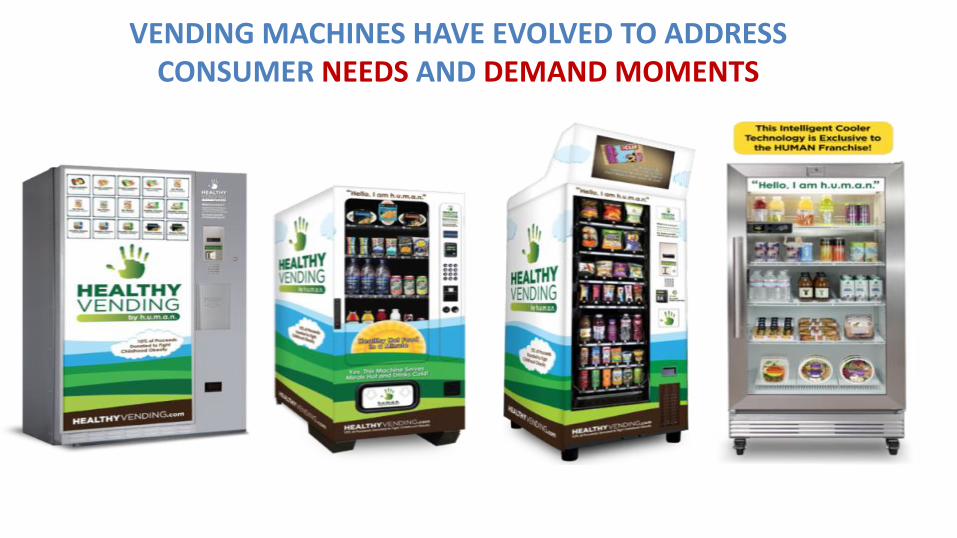
VENDING MACHINES HAVE EVOLVED TO ADDRESS CONSUMER NEEDS AND DEMAND MOMENTS
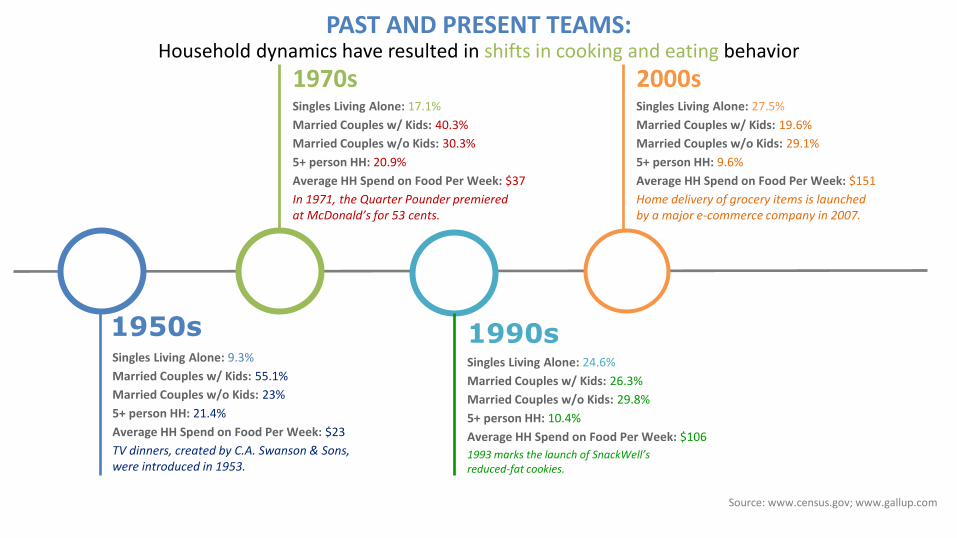
PAST AND PRESENT TEAMS: Household dynamics have resulted in shifts in cooking and eating behavior
1950s Singles Living Alone: 9.3%
Married Couples w/ Kids: 55.1%
Married Couples w/o Kids: 23%
5+ person HH: 21.4%
Average HH Spend on Food Per Week: $23
TV dinners, created by C.A. Swanson & Sons, were introduced in 1953.
1970s Singles Living Alone: 17.1%
Married Couples w/ Kids: 40.3%
Married Couples w/o Kids: 30.3%
5+ person HH: 20.9%
Average HH Spend on Food Per Week: $37
In 1971, the Quarter Pounder premiered at McDonald’s for 53 cents.
1990s Singles Living Alone: 24.6%
Married Couples w/ Kids: 26.3%
Married Couples w/o Kids: 29.8%
5+ person HH: 10.4%
Average HH Spend on Food Per Week: $106
1993 marks the launch of SnackWell’s reduced-fat cookies.
2000s Singles Living Alone: 27.5%
Married Couples w/ Kids: 19.6%
Married Couples w/o Kids: 29.1%
5+ person HH: 9.6%
Average HH Spend on Food Per Week: $151
Home delivery of grocery items is launched by a major e-commerce company in 2007.
Source: www.census.gov; www.gallup.com
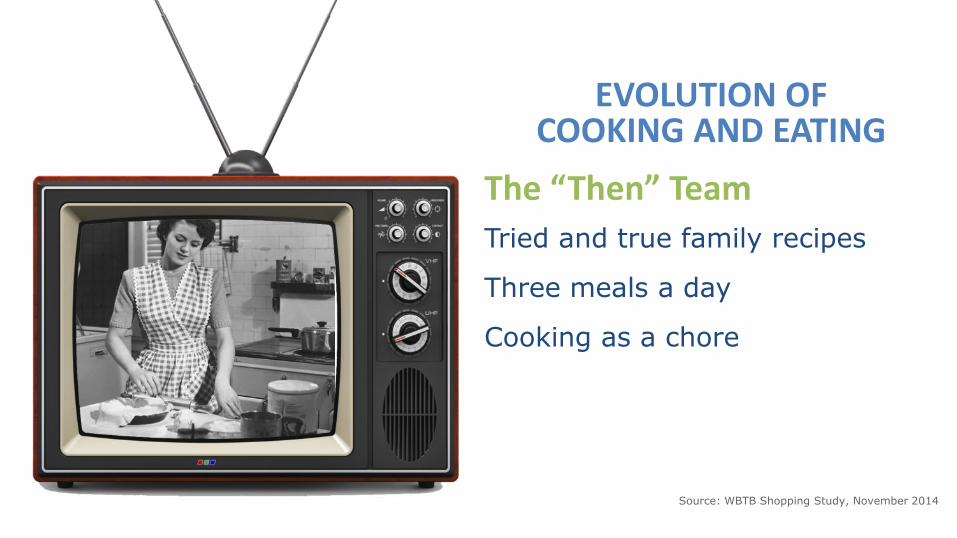
EVOLUTION OF COOKING AND EATING
The “Then” Team
Tried and true family recipes
Three meals a day
Cooking as a chore
Source: WBTB Shopping Study, November 2014
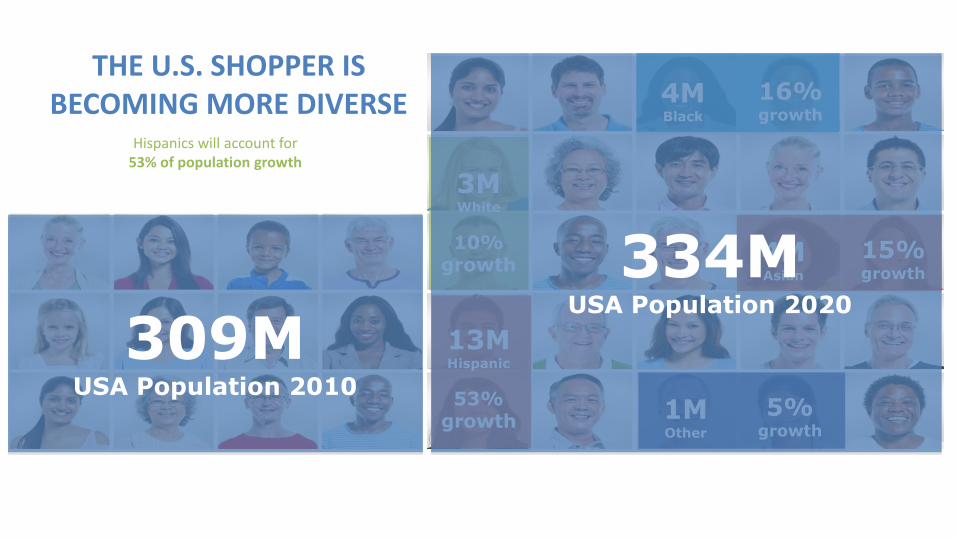
THE U.S. SHOPPER IS BECOMING MORE DIVERSE
309M USA Population 2010
3M White
10% growth
13M Hispanic
53% growth
4M Black
16% growth
4M Asian
15% growth
1M Other
5% growth
Hispanics will account for 53% of population growth
334M USA Population 2020

PLAYERS HAVE CHANGED - More people working and not retiring at 65
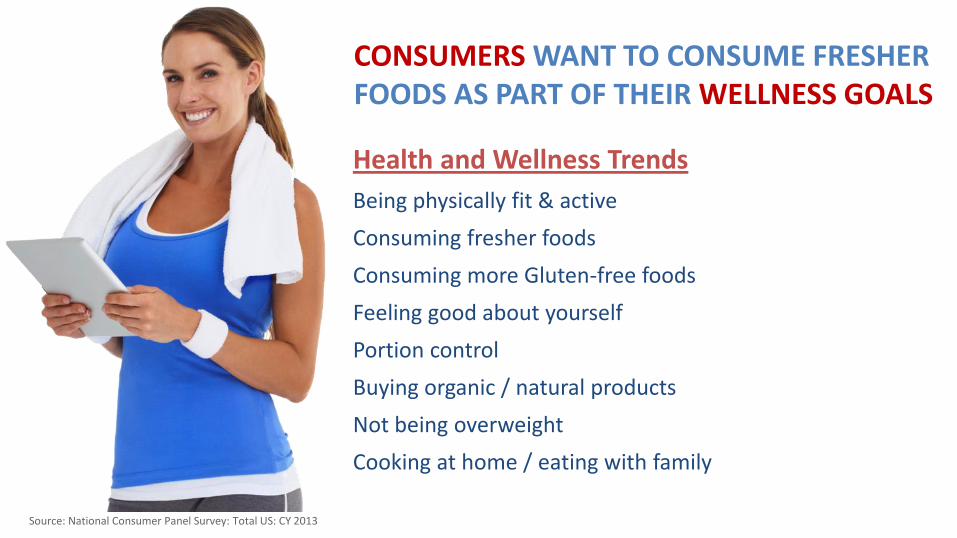
CONSUMERS WANT TO CONSUME FRESHER FOODS AS PART OF THEIR WELLNESS GOALS
Source: National Consumer Panel Survey: Total US: CY 2013
Health and Wellness Trends
Being physically fit & active
Consuming fresher foods
Consuming more Gluten-free foods
Feeling good about yourself
Portion control
Buying organic / natural products
Not being overweight
Cooking at home / eating with family

EATING OCCASIONS HAVE CHANGED
“I eat 3 square meals a day and no snacks”
“I eat 3 square meals and several snacks”
“I eat 4-5 mini meals”
“I eat on the run and grab food when I have a chance”
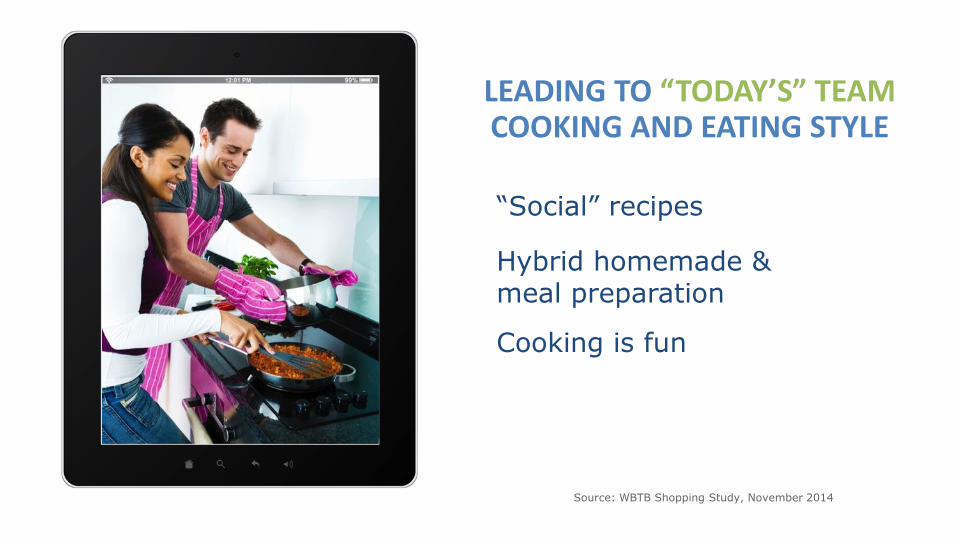
LEADING TO “TODAY’S” TEAM COOKING AND EATING STYLE
“Social” recipes
Hybrid homemade & meal preparation
Cooking is fun
Source: WBTB Shopping Study, November 2014

We are obsessed with food
10.9% 9.6%
5.0% 3.6% 3.3% 2.7%
1.5% 1.3% 0.7%
-7.1%
3.2% 0.1%
-7.7% -3.7% -3.6% -4.8% -4.5% -7.0% -4.8% -12.8%
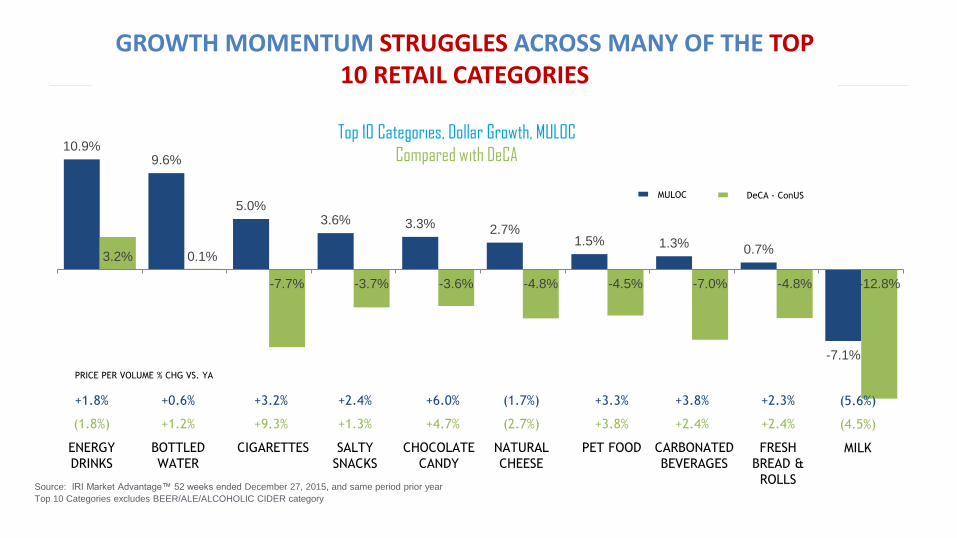
GROWTH MOMENTUM STRUGGLES ACROSS MANY OF THE TOP 10 RETAIL CATEGORIES
Top 10 Categories, Dollar Growth, MULOC
Compared with DeCA
Source: IRI Market Advantage™ 52 weeks ended December 27, 2015, and same period prior year
Top 10 Categories excludes BEER/ALE/ALCOHOLIC CIDER category
+1.8% +0.6% +3.2% +2.4% +6.0% (1.7%) +3.3% +3.8% +2.3% (5.6%)
ENERGY
DRINKS
BOTTLED
WATER
CIGARETTES SALTY
SNACKS
CHOCOLATE
CANDY
NATURAL
CHEESE
PET FOOD CARBONATED
BEVERAGES
FRESH
BREAD &
ROLLS
MILK
(1.8%) +1.2% +9.3% +1.3% +4.7% (2.7%) +3.8% +2.4% +2.4% (4.5%)
MULOC DeCA - ConUS
PRICE PER VOLUME % CHG VS. YA
1.9%
-3.7% -4.5% -4.8% -4.8%
-6.0% -6.2% -7.0%
-8.4%
-12.8%
7.2%
3.6%
1.5% 0.7%
2.7%
0.1%
-0.2%
1.3%
-1.1%
-7.1%
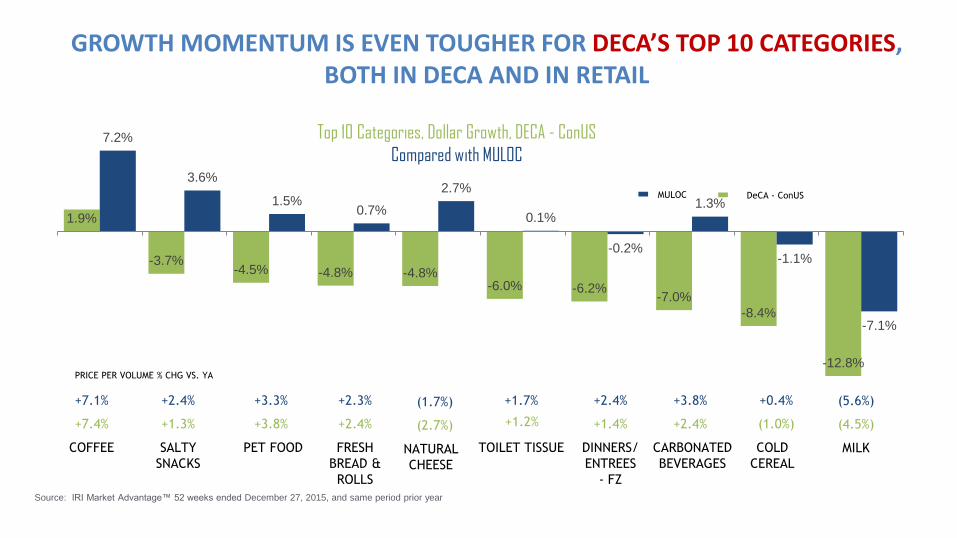
GROWTH MOMENTUM IS EVEN TOUGHER FOR DECA’S TOP 10 CATEGORIES, BOTH IN DECA AND IN RETAIL
Top 10 Categories, Dollar Growth, DECA - ConUS
Compared with MULOC
Source: IRI Market Advantage™ 52 weeks ended December 27, 2015, and same period prior year
+7.1% +2.4% +3.3% +2.3% (1.7%) +1.7% +2.4% +3.8% +0.4% (5.6%)
COFFEE SALTY
SNACKS
PET FOOD FRESH
BREAD &
ROLLS
NATURAL
CHEESE
TOILET TISSUE DINNERS/
ENTREES
- FZ
CARBONATED
BEVERAGES
COLD
CEREAL
MILK
+7.4% +1.3% +3.8% +2.4% (2.7%) +1.2% +1.4% +2.4% (1.0%) (4.5%)
MULOC DeCA - ConUS
PRICE PER VOLUME % CHG VS. YA
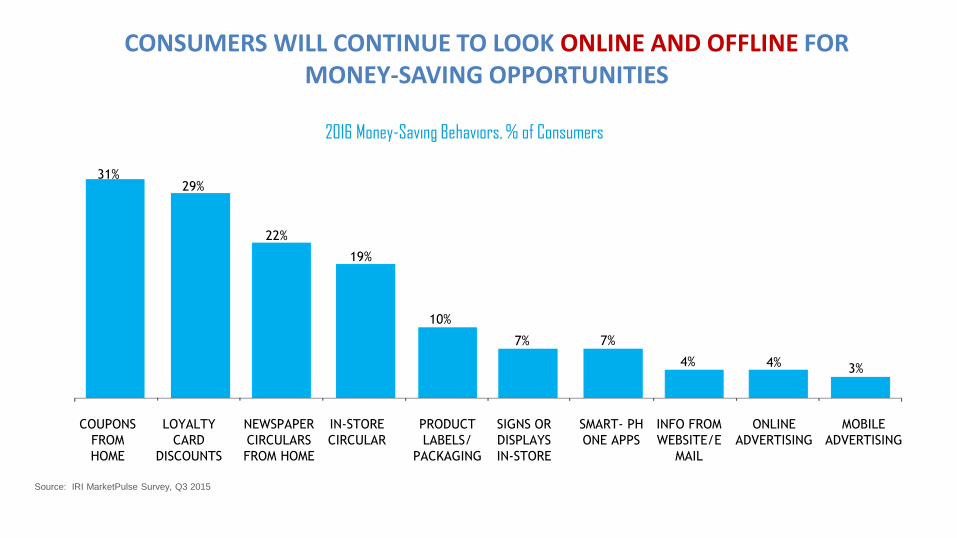
CONSUMERS WILL CONTINUE TO LOOK ONLINE AND OFFLINE FOR MONEY-SAVING OPPORTUNITIES
2016 Money-Saving Behaviors, % of Consumers
Source: IRI MarketPulse Survey, Q3 2015
31% 29%
22%
19%
10%
7% 7%
4% 4% 3%
COUPONS
FROM
HOME
LOYALTY
CARD
DISCOUNTS
NEWSPAPER
CIRCULARS
FROM HOME
IN-STORE
CIRCULAR
PRODUCT
LABELS/
PACKAGING
SIGNS OR
DISPLAYS
IN-STORE
SMART- PH
ONE APPS
INFO FROM
WEBSITE/E
ONLINE
ADVERTISING
MOBILE
ADVERTISING

COMPLICATING THE PATH-TO-PURCHASE
0% 10% 20% 30% 40% 50% 60%
Personal Care
Frozen Food
OTC Medications
Non-Alcoholic Beverages
Meat or Poultry
Snacks
Dairy
Beer, Wine, Spirits
% Past Week Category Buyers Who Did ANY Pre-Store Activity Online
Q18. Before buying category from S.2, which, if any, of the following things did you do? Where/how did you do them?
81% Used a laptop or desktop computer
40% Used a smart phone
24% Used a digital tablet
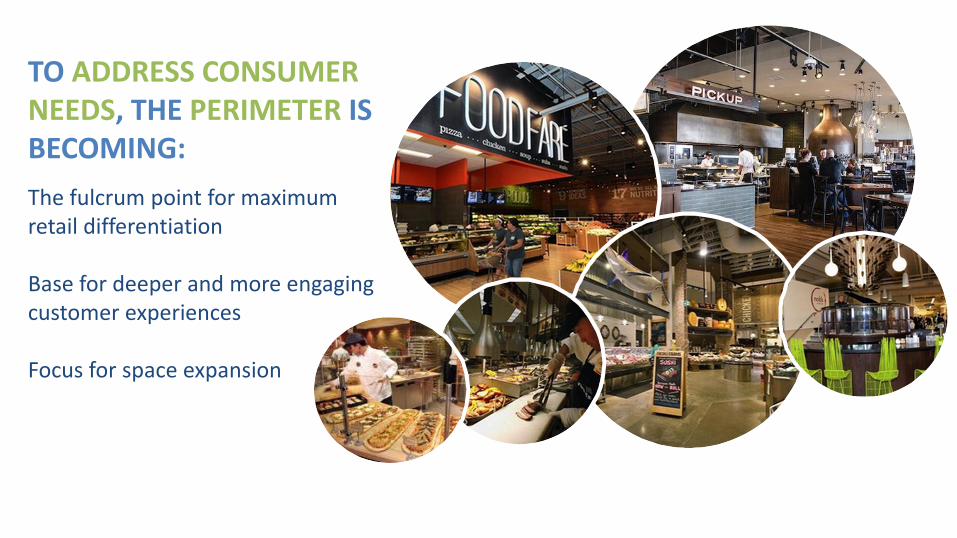
TO ADDRESS CONSUMER NEEDS, THE PERIMETER IS BECOMING:
The fulcrum point for maximum retail differentiation Base for deeper and more engaging customer experiences Focus for space expansion
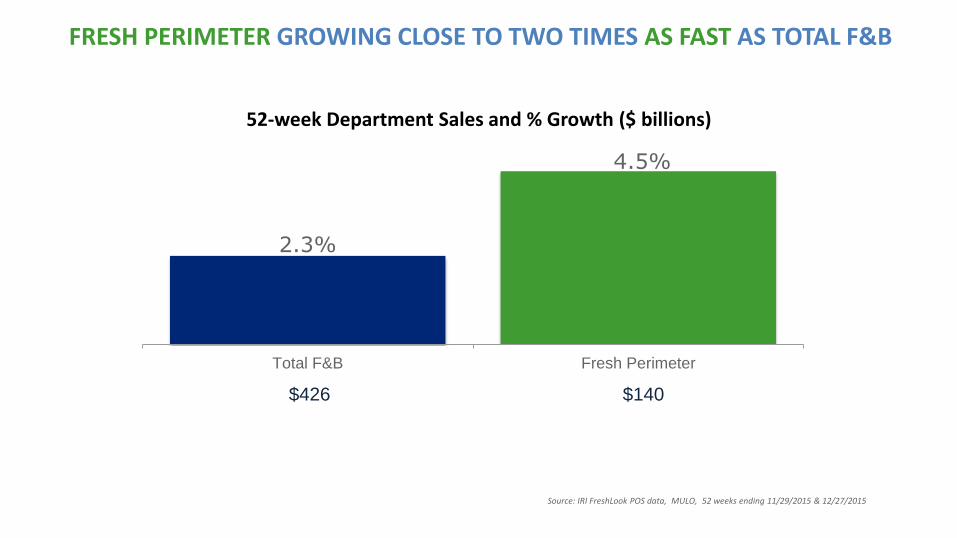
FRESH PERIMETER GROWING CLOSE TO TWO TIMES AS FAST AS TOTAL F&B
2.3%
4.5%
Total F&B Fresh Perimeter
$426 $140
52-week Department Sales and % Growth ($ billions)
Source: IRI FreshLook POS data, MULO, 52 weeks ending 11/29/2015 & 12/27/2015
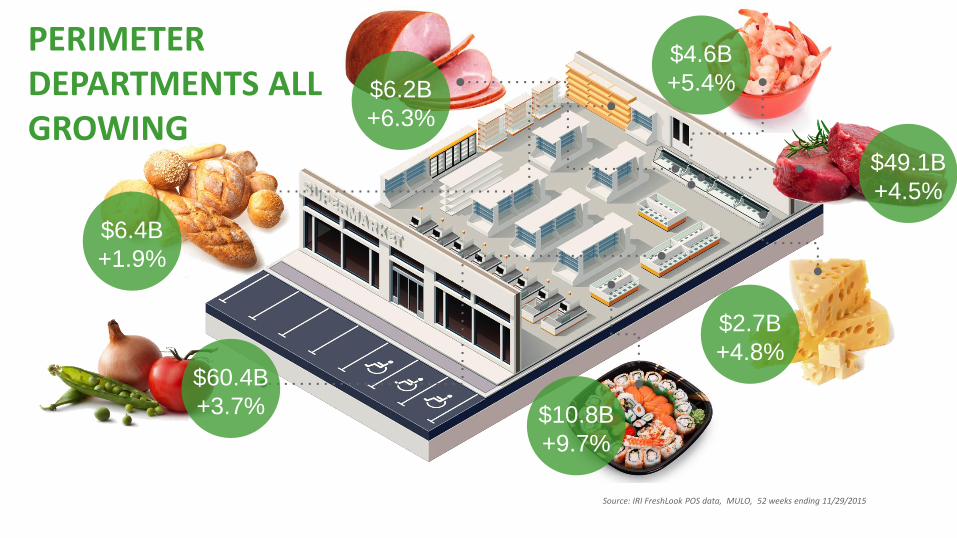
PERIMETER DEPARTMENTS ALL GROWING
$6.4B
+1.9%
$2.7B
+4.8%
$6.2B
+6.3%
$10.8B
+9.7%
$49.1B
+4.5%
$60.4B
+3.7%
$4.6B
+5.4%
Source: IRI FreshLook POS data, MULO, 52 weeks ending 11/29/2015

Consumer Demands
Industry Response 5
Trends
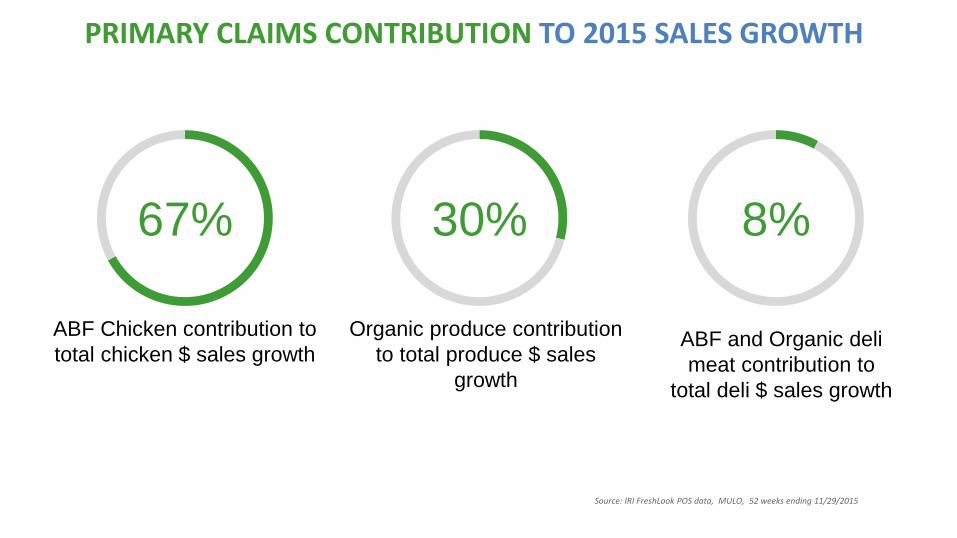
PRIMARY CLAIMS CONTRIBUTION TO 2015 SALES GROWTH
67% 30% 8%
ABF Chicken contribution to
total chicken $ sales growth
Organic produce contribution
to total produce $ sales
growth
ABF and Organic deli
meat contribution to
total deli $ sales growth
Source: IRI FreshLook POS data, MULO, 52 weeks ending 11/29/2015
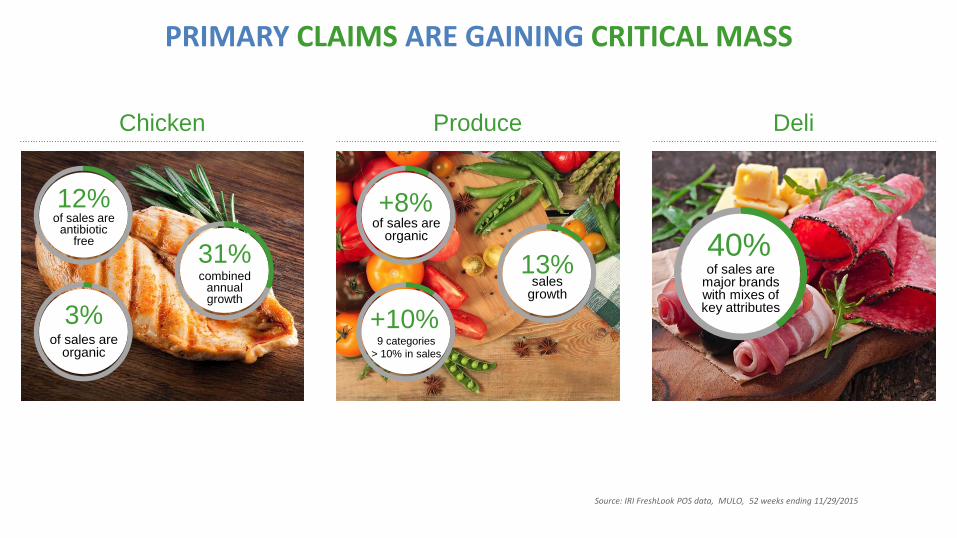
PRIMARY CLAIMS ARE GAINING CRITICAL MASS
Chicken Produce Deli
12% of sales are
antibiotic free
3% of sales are
organic
31% combined
annual growth
+8% of sales are
organic
+10% 9 categories
> 10% in sales
13% sales
growth
40% of sales are
major brands with mixes of key attributes
Source: IRI FreshLook POS data, MULO, 52 weeks ending 11/29/2015
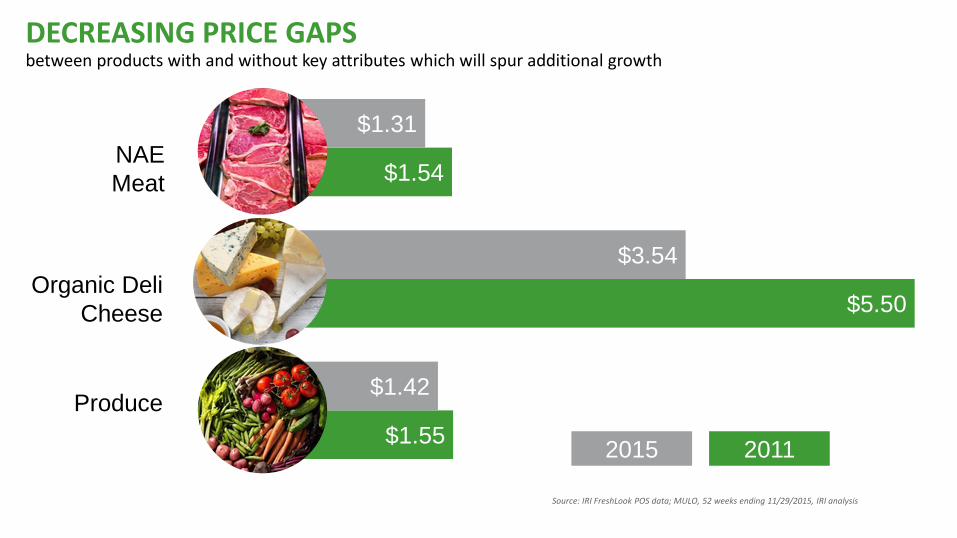
$1.55
$5.50
$1.54
$1.42
$3.54
$1.31
DECREASING PRICE GAPS between products with and without key attributes which will spur additional growth
2015 2011
NAE
Meat
Organic Deli
Cheese
Produce
Source: IRI FreshLook POS data; MULO, 52 weeks ending 11/29/2015, IRI analysis
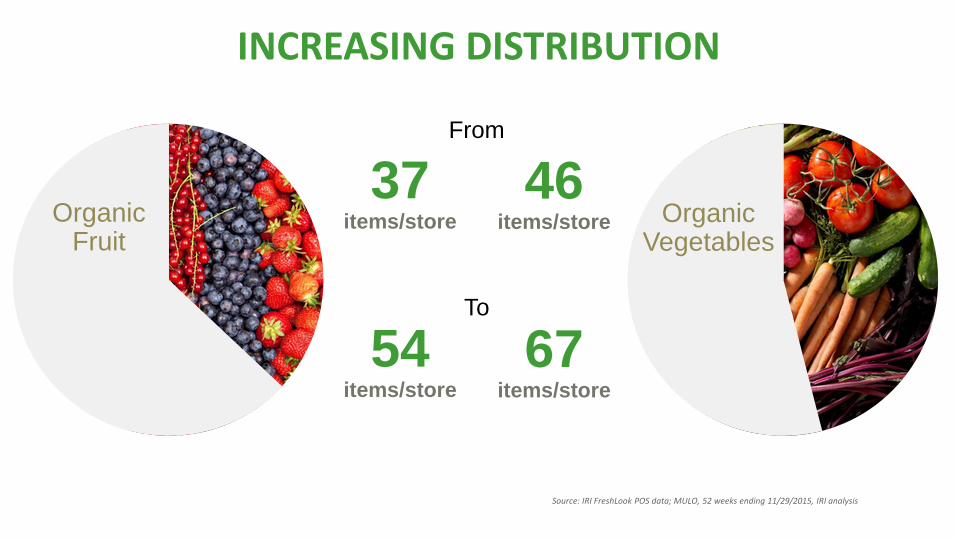
INCREASING DISTRIBUTION
37 items/store Organic
Fruit
54 items/store
46 items/store Organic
Vegetables
67 items/store
From
To
Source: IRI FreshLook POS data; MULO, 52 weeks ending 11/29/2015, IRI analysis
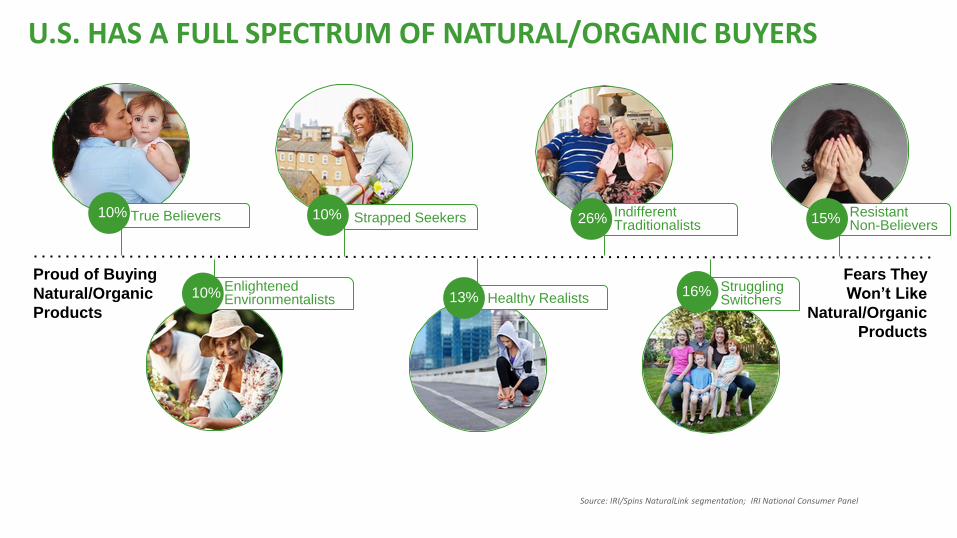
U.S. HAS A FULL SPECTRUM OF NATURAL/ORGANIC BUYERS
Fears They
Won’t Like
Natural/Organic
Products
Proud of Buying
Natural/Organic
Products
True Believers
Enlightened Environmentalists
Strapped Seekers Indifferent Traditionalists
Healthy Realists
Resistant Non-Believers
Struggling Switchers
10% 10% 26% 15%
16% 13% 10%
Source: IRI/Spins NaturalLink segmentation; IRI National Consumer Panel
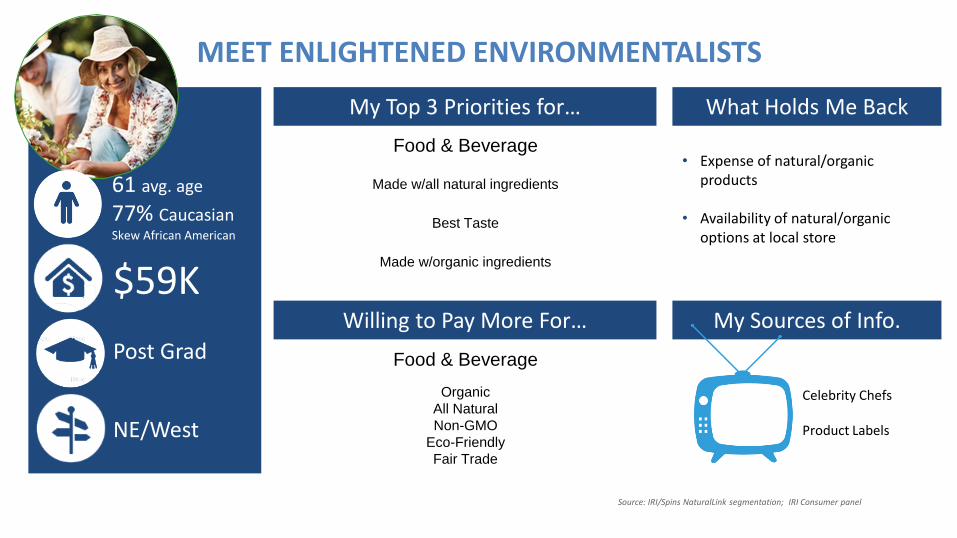
MEET ENLIGHTENED ENVIRONMENTALISTS
$59K
Post Grad
NE/West
61 avg. age
77% Caucasian Skew African American
My Top 3 Priorities for…
Willing to Pay More For…
What Holds Me Back
My Sources of Info.
Food & Beverage
Made w/all natural ingredients
Best Taste
Made w/organic ingredients
Food & Beverage
Organic
All Natural
Non-GMO
Eco-Friendly
Fair Trade
• Expense of natural/organic products
• Availability of natural/organic options at local store
Celebrity Chefs Product Labels
Source: IRI/Spins NaturalLink segmentation; IRI Consumer panel
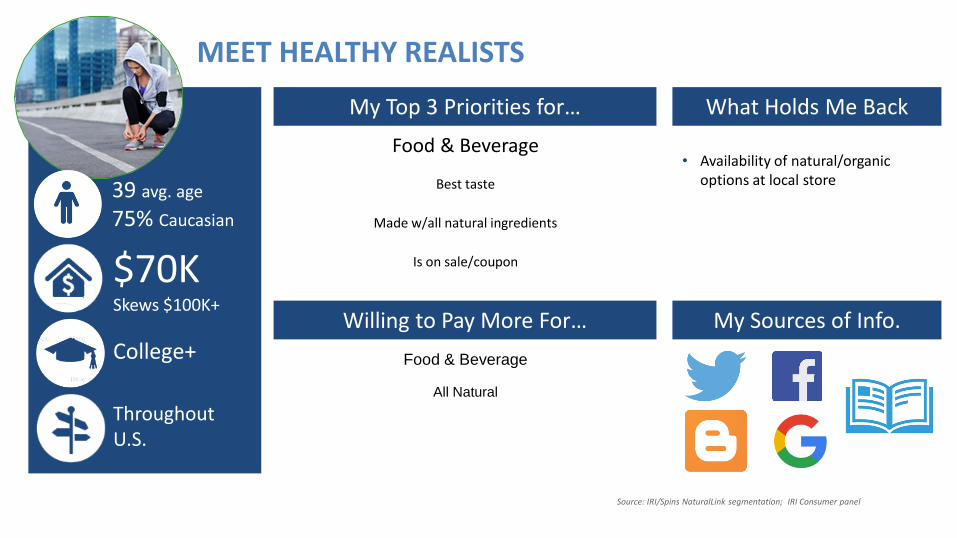
MEET HEALTHY REALISTS
$70K Skews $100K+
College+
Throughout U.S.
39 avg. age
75% Caucasian
My Top 3 Priorities for…
Willing to Pay More For…
What Holds Me Back
My Sources of Info.
Food & Beverage
Best taste
Made w/all natural ingredients
Is on sale/coupon
Food & Beverage
All Natural
• Availability of natural/organic options at local store
Source: IRI/Spins NaturalLink segmentation; IRI Consumer panel
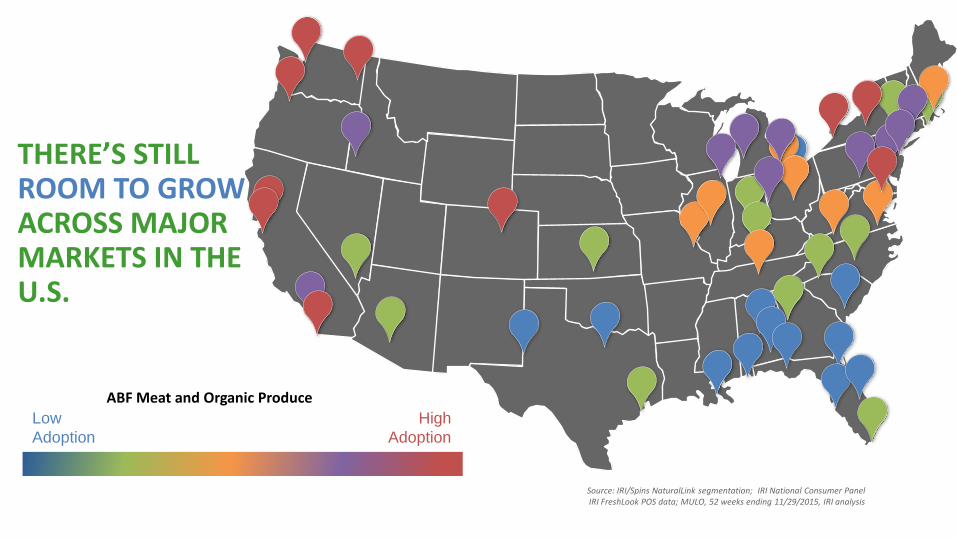
THERE’S STILL ROOM TO GROW ACROSS MAJOR MARKETS IN THE U.S.
Low
Adoption
High
Adoption
Source: IRI/Spins NaturalLink segmentation; IRI National Consumer Panel IRI FreshLook POS data; MULO, 52 weeks ending 11/29/2015, IRI analysis
ABF Meat and Organic Produce
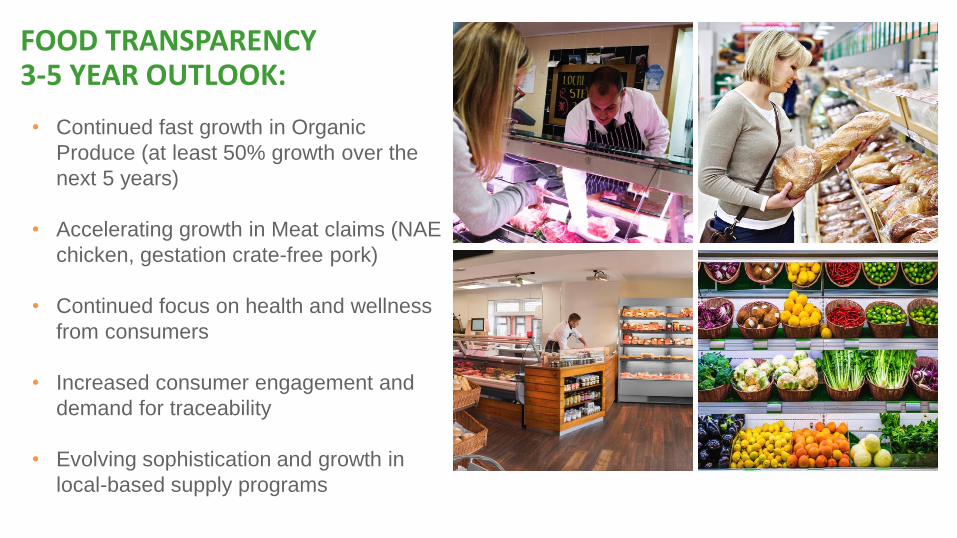
FOOD TRANSPARENCY 3-5 YEAR OUTLOOK:
• Continued fast growth in Organic
Produce (at least 50% growth over the
next 5 years)
• Accelerating growth in Meat claims (NAE
chicken, gestation crate-free pork)
• Continued focus on health and wellness
from consumers
• Increased consumer engagement and
demand for traceability
• Evolving sophistication and growth in
local-based supply programs
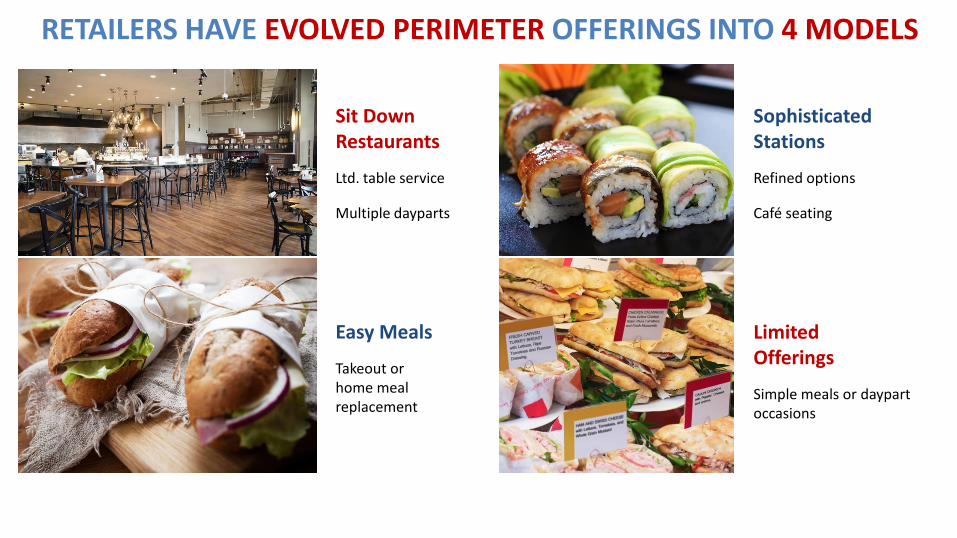
RETAILERS HAVE EVOLVED PERIMETER OFFERINGS INTO 4 MODELS
Sit Down Restaurants
Ltd. table service
Multiple dayparts
Sophisticated Stations
Refined options
Café seating
Easy Meals
Takeout or home meal replacement
Limited Offerings
Simple meals or daypart occasions
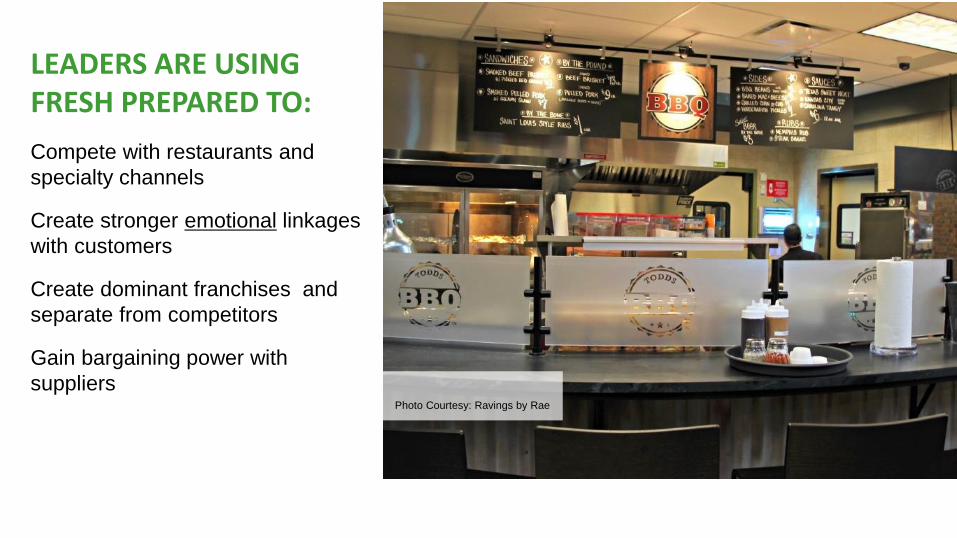
LEADERS ARE USING FRESH PREPARED TO:
Compete with restaurants and
specialty channels
Create stronger emotional linkages
with customers
Create dominant franchises and
separate from competitors
Gain bargaining power with
suppliers
Photo Courtesy: Ravings by Rae
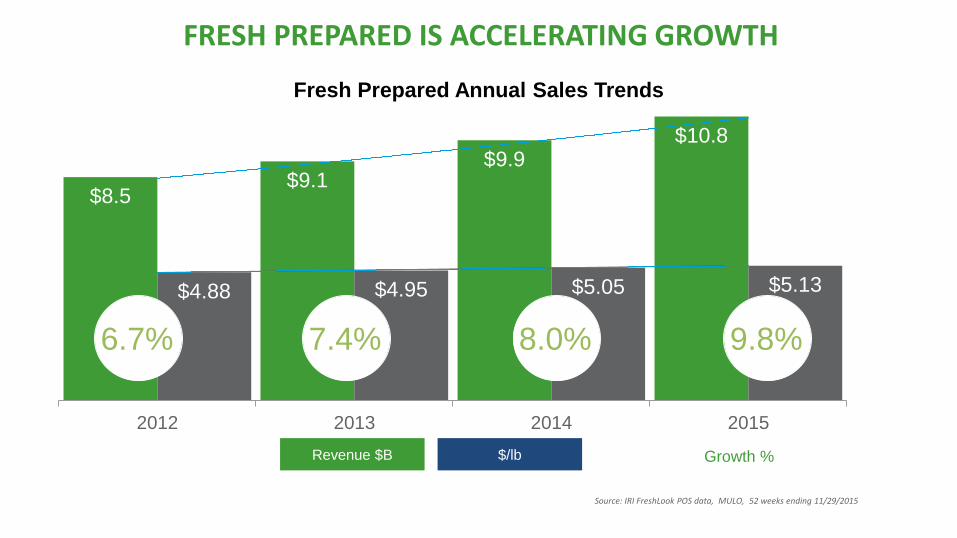
FRESH PREPARED IS ACCELERATING GROWTH
$8.5 $9.1
$9.9 $10.8
$4.88 $4.95 $5.05 $5.13
2012 2013 2014 2015
Revenue $B $/lb Growth %
Source: IRI FreshLook POS data, MULO, 52 weeks ending 11/29/2015
6.7% 7.4% 8.0% 9.8%
Fresh Prepared Annual Sales Trends
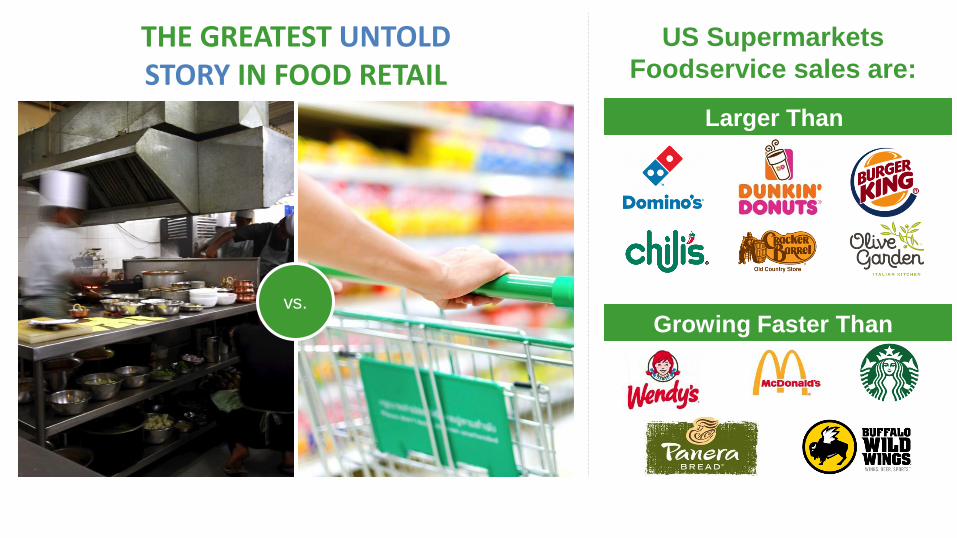
THE GREATEST UNTOLD STORY IN FOOD RETAIL
Larger Than
Growing Faster Than
US Supermarkets
Foodservice sales are:
vs.
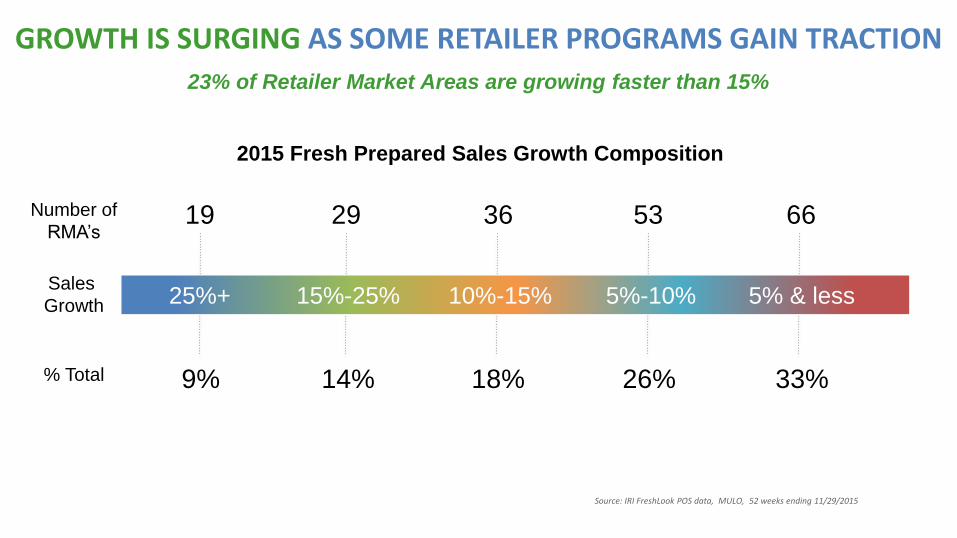
19 29 36 53 66
9% 14% 18% 26% 33%
23% of Retailer Market Areas are growing faster than 15%
2015 Fresh Prepared Sales Growth Composition
25%+ 15%-25% 10%-15% 5%-10% 5% & less
GROWTH IS SURGING AS SOME RETAILER PROGRAMS GAIN TRACTION
Sales
Growth
Number of
RMA’s
Source: IRI FreshLook POS data, MULO, 52 weeks ending 11/29/2015
% Total
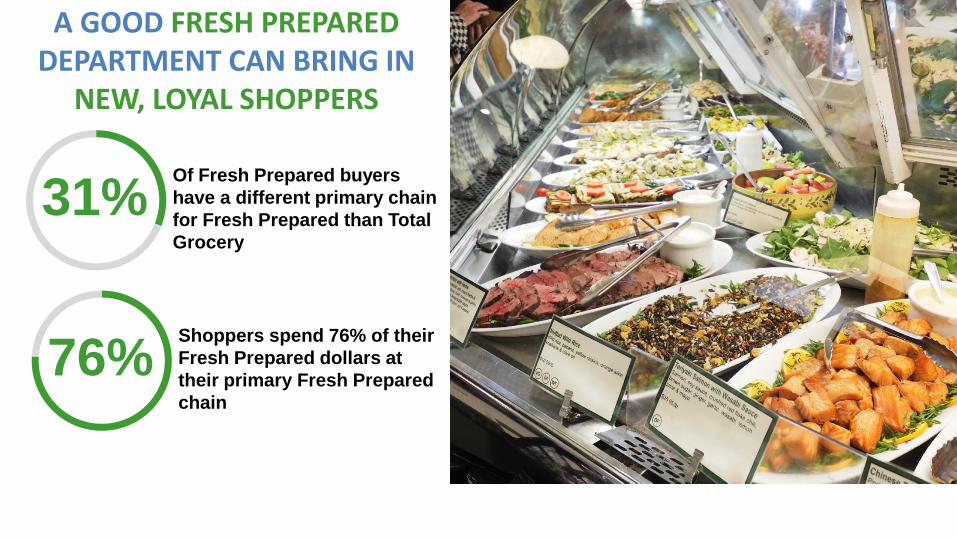
A GOOD FRESH PREPARED DEPARTMENT CAN BRING IN
NEW, LOYAL SHOPPERS
31% Of Fresh Prepared buyers
have a different primary chain
for Fresh Prepared than Total
Grocery
76% Shoppers spend 76% of their
Fresh Prepared dollars at
their primary Fresh Prepared
chain
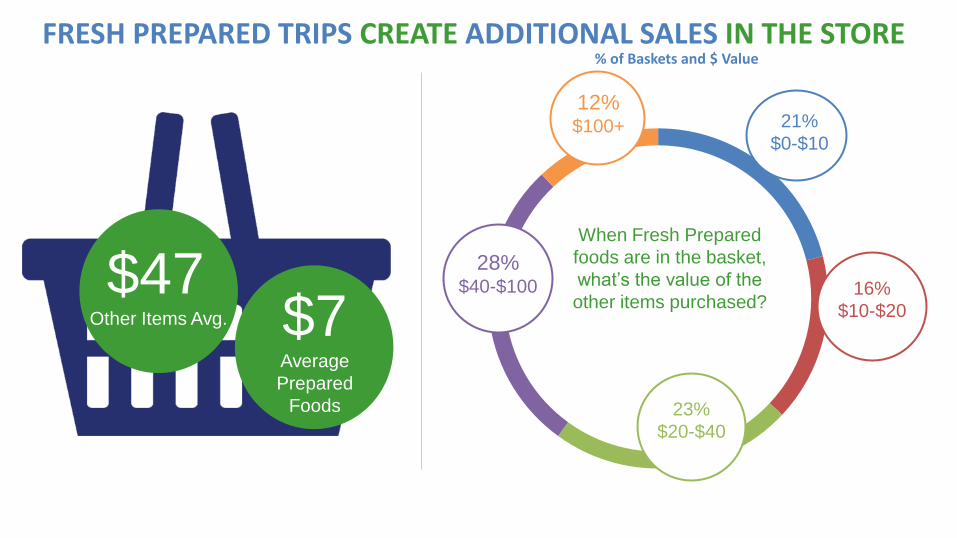
FRESH PREPARED TRIPS CREATE ADDITIONAL SALES IN THE STORE
$47 Other Items Avg. $7
Average
Prepared
Foods
When Fresh Prepared
foods are in the basket,
what’s the value of the
other items purchased?
21%
$0-$10
16%
$10-$20
23%
$20-$40
28% $40-$100
12% $100+
% of Baskets and $ Value
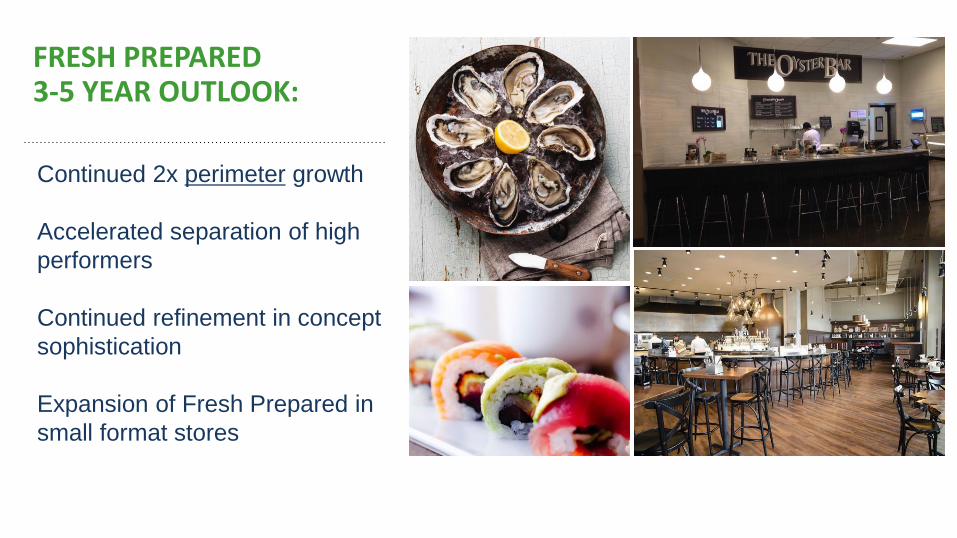
FRESH PREPARED 3-5 YEAR OUTLOOK:
Continued 2x perimeter growth
Accelerated separation of high
performers
Continued refinement in concept
sophistication
Expansion of Fresh Prepared in
small format stores
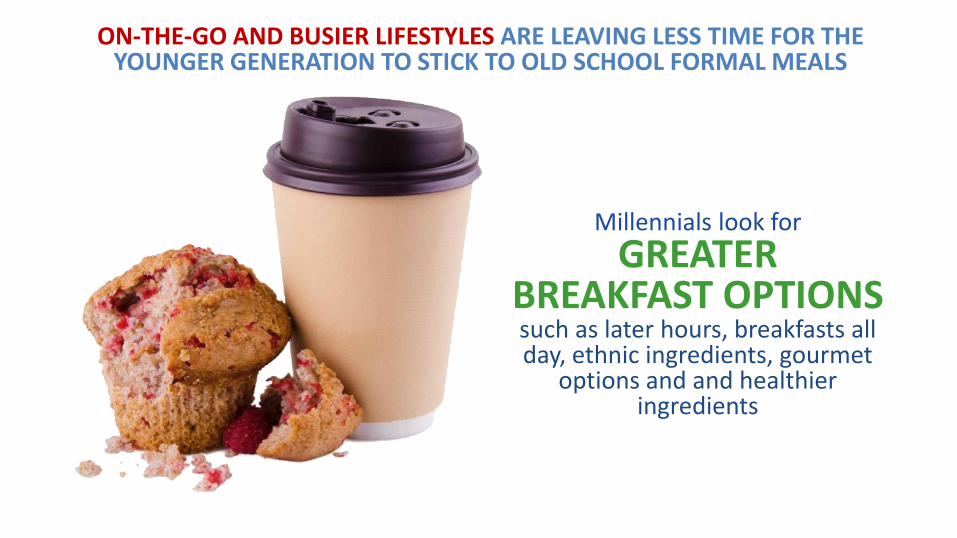
ON-THE-GO AND BUSIER LIFESTYLES ARE LEAVING LESS TIME FOR THE YOUNGER GENERATION TO STICK TO OLD SCHOOL FORMAL MEALS
Millennials look for
GREATER BREAKFAST OPTIONS such as later hours, breakfasts all day, ethnic ingredients, gourmet
options and and healthier ingredients
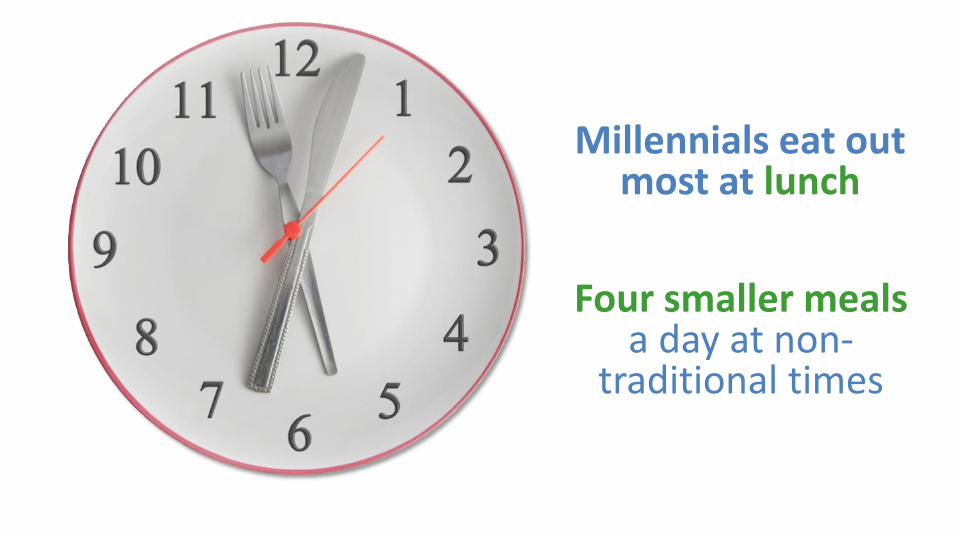
Millennials eat out most at lunch
Four smaller meals a day at non-
traditional times
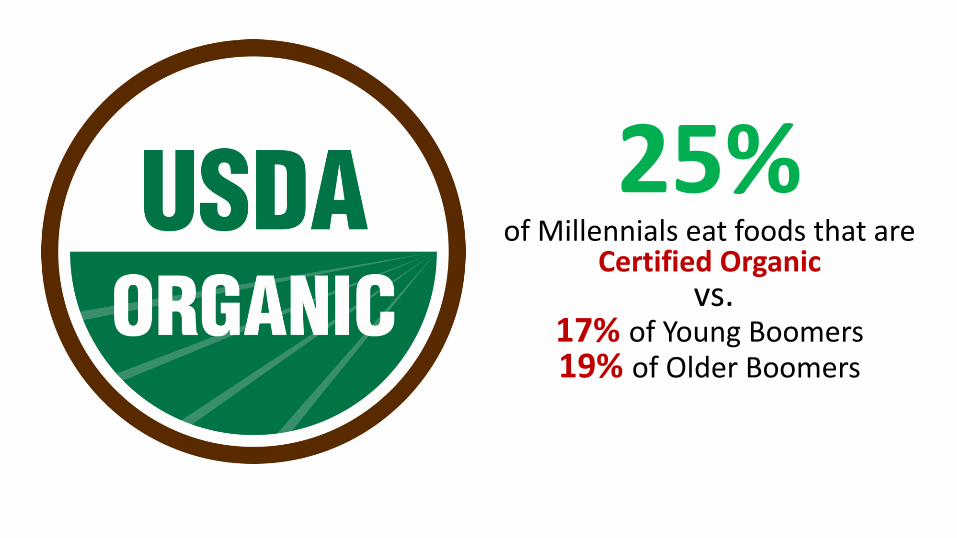
25% of Millennials eat foods that are
Certified Organic vs.
17% of Young Boomers 19% of Older Boomers

Source: ILD National Consumer Panel, Total US-MULO, Rolling 52 wks ending Mar 22, 2015, NBD Aligned
more dollars per trip vs. Younger & Older Boomers $10.67 vs. $9.94 vs. $8.91
Millennials
less deal reliant vs. Younger & Older Boomers 34.0% vs. 35.9% vs. 35.3%
NOT ONLY ARE THEIR EATING HABITS DIFFERENT, THE WAY THEY SHOP AT THE SUPERMARKETS IS ALSO NOTE WORTHY

Source: ILD National Consumer Panel, Total US-MULO, Rolling 52 wks ending Mar 22, 2015, NBD Aligned
NOT ONLY ARE THEIR EATING HABITS DIFFERENT, THE WAY
THEY SHOP AT THE SUPERMARKETS IS ALSO NOTE
WORTHY
larger basket size $65.27 vs. $62.26
more dollars per trip $10.03 vs. $9.54
less deal reliant 33.7% vs. 35.5%
Hispanics
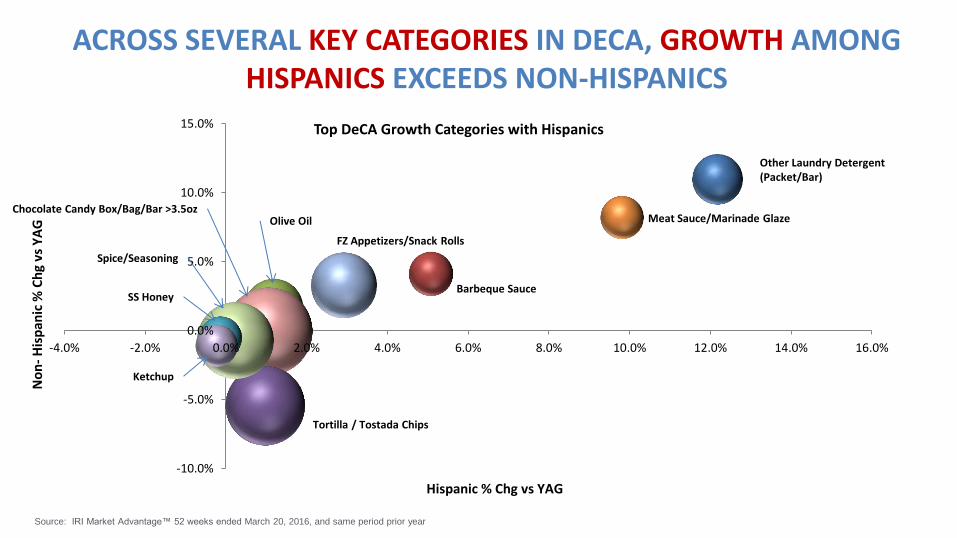
ACROSS SEVERAL KEY CATEGORIES IN DECA, GROWTH AMONG HISPANICS EXCEEDS NON-HISPANICS
-10.0%
-5.0%
0.0%
5.0%
10.0%
15.0%
-4.0% -2.0% 0.0% 2.0% 4.0% 6.0% 8.0% 10.0% 12.0% 14.0% 16.0%
Top DeCA Growth Categories with Hispanics
Hispanic % Chg vs YAG
No
n-
His
pan
ic %
Ch
g vs
YA
G
Source: IRI Market Advantage™ 52 weeks ended March 20, 2016, and same period prior year
FZ Appetizers/Snack Rolls
Meat Sauce/Marinade Glaze
Barbeque Sauce
Other Laundry Detergent (Packet/Bar)
Tortilla / Tostada Chips
Ketchup
SS Honey
Spice/Seasoning
Chocolate Candy Box/Bag/Bar >3.5oz Olive Oil
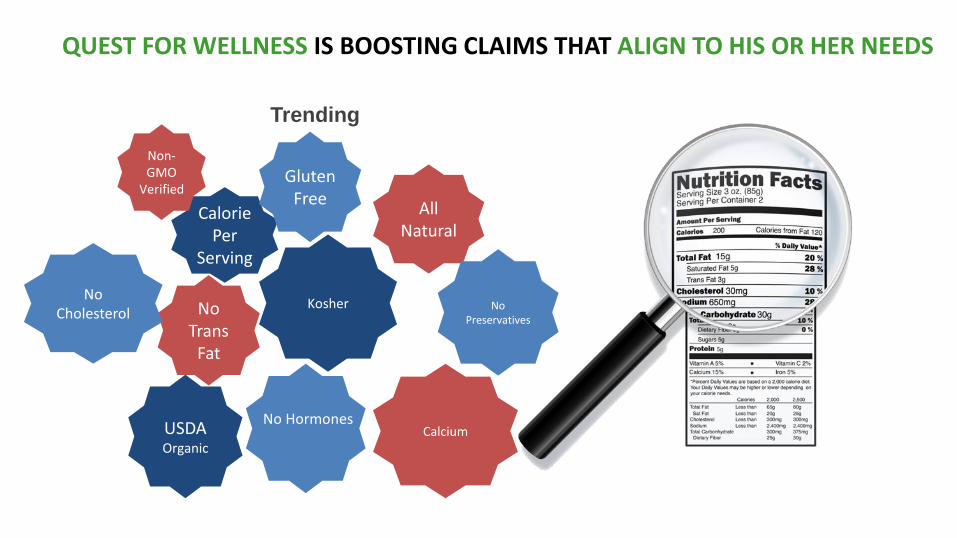
Trending
QUEST FOR WELLNESS IS BOOSTING CLAIMS THAT ALIGN TO HIS OR HER NEEDS
Calorie Per
Serving
No Trans
Fat
Gluten Free
Kosher
USDA Organic
All Natural
No Hormones
No Preservatives
Non-GMO
Verified
Calcium
No Cholesterol
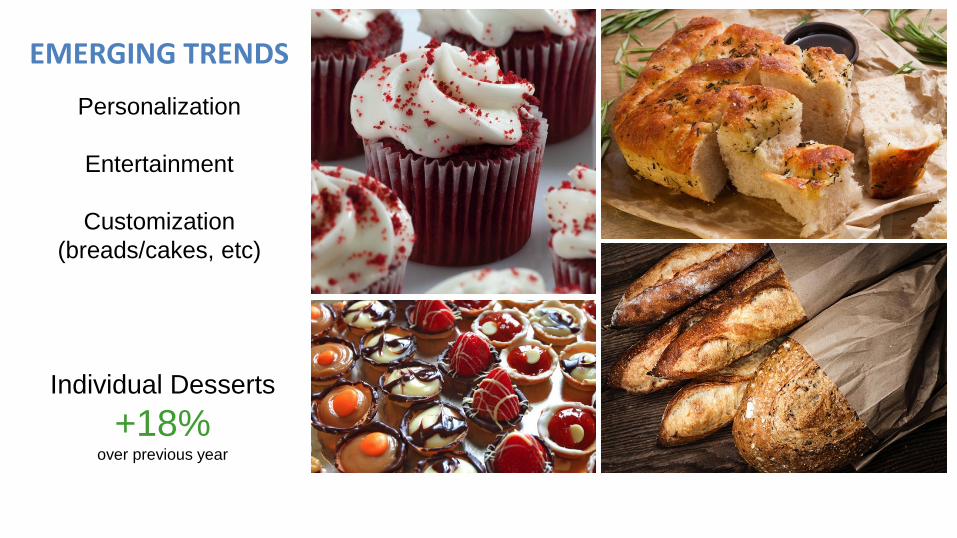
Individual Desserts
+18% over previous year
EMERGING TRENDS
Personalization
Entertainment
Customization
(breads/cakes, etc)
1 Nutrition and Wellness
Consumers want cleaner eating and smarter food & beverage choices and are drawn to the perimeter
• Highlight how your products fit into a healthy lifestyle • Use store-level insight into current and potential
shoppers to identify customize by store • Drive major programs using strategically selected
claims and attributes
HOW TO WIN GOING FORWARD
2 Convenient and Simple
• Consumers are food-savvy but time-starved
• Strive for the ‘easy button’ of meal solutions – convenient and simple
• Let shoppers quickly assemble meals and clearly demonstrate the time savings
• Understand which stores may have more opportunities for convenience trips vs. stock-up
HOW TO WIN GOING FORWARD
3 Tailor Made Innovation & Messaging
• Leverage personalization, entertainment and customization to target different consumer segments
• Foster and broaden the relationship with Millennial consumers and their very diverse flavor profiles
• Engage shoppers by keeping things interesting and new
• Understand price gaps to ROM, especially with Private Label
HOW TO WIN GOING FORWARD
4 Identify Ways To Reach Each Generation
• Inform Millennials about the exciting flavors and different food combination ideas with baking items
• Significant cross-selling benefits by utilizing in-store demonstrations and cooking classes in-store
• Merchandise to the type of households to which each store caters
• Know where DeCA’s shoppers buy products when not shopping at DeCA, and understand competitive assortment
HOW TO WIN GOING FORWARD