hovnanian enterprises ar2004
108
Hovnanian Enterprises, Inc. 2004 ANNUAL REPORT
-
Upload
finance49 -
Category
Economy & Finance
-
view
365 -
download
4
Transcript of hovnanian enterprises ar2004

Hovnanian Enterprises, Inc.2004 ANNUAL REPORT

Founded in 1959, Hovnanian Enterprises, Inc., designs, constructs and markets a variety of for-sale housing in 275 residential communities in 13 states. Hovnanianranks among the largest homebuilding companies in the U.S., with total revenues of $4.2 billion on 14,586 home deliveries in fiscal 2004.
REVENUES AND INCOME Dollars in Millions
2004 2003 2002 2001 2000
Total Revenues $4,160.4 $ 3,201.9 $ 2,551.1 $ 1,742.0 $ 1,135.6
Pre-tax Earnings $ 549.8 $ 411.5 $ 225.7 $ 106.4 $ 51.8
Net Income $ 348.7 $ 257.4 $ 137.7 $ 63.7 $ 33.2
EBITDA(1) $ 677.8 $ 500.6 $ 311.0 $ 170.7 $ 96.4
Return on Average Stockholders’ Equity 35.3% 38.1% 29.3% 19.3% 13.5%
ASSETS, DEBT AND EQUITY Dollars in Millions
Total Assets $3,156.3 $ 2,332.4 $ 1,678.1 $ 1,064.3 $ 873.5
Total Recourse Debt $1,017.7 $ 802.2 $ 661.4 $ 396.5 $ 396.4
Stockholders’ Equity $1,192.4 $ 819.7 $ 562.5 $ 375.6 $ 263.4
EARNINGS PER SHARE Shares in Thousands
Fully Diluted Earnings Per Share $ 5.35 $ 3.93 $ 2.14 $ 1.15 $ 0.75
Fully Diluted Weighted Average Shares Outstanding 65,133 65,538 64,310 55,584 44,086
(1)See description of EBITDA in footnote (1) on page 18.
Hovnanian Enterprises, Inc.FINANCIAL HIGHLIGHTS
STOCKHOLDERS’ EQUITY
Dollars in Billions
EARNINGS PERSHARE
Fully Diluted
TOTALREVENUES
Dollars in Billions
00 01 02 03 04 00 01 02 03 04 00 01 02 03 04
$4.2
$3.2
$2.6
$1.7
$1.1
$5.35
$3.93
$2.14
$1.15$0.75
$1.2
$0.8
$0.6
$0.4$0.3

Over the past 45 years, we’ve grown from a two-person construction firm headquartered in an oldtrailer into one of the world’s largest and mostrespected homebuilders. Today, more than 185,000families in 13 states from coast to coast enjoy ourhomes. Within the large and stable homebuildingmarket, our commitment to maintaining financialstrength, offering high-quality homes, and recruiting anddeveloping the best team of associates in our industryhas enabled us to deliver consistently strong results.
WH
AT
WE
’VE
BU
ILT

Through good economic times and bad, for youngsingles, newly married couples, growing familiesand active adults, owning a home is fundamentalto the American dream.
In Hemet, California, 85 milessoutheast of Los Angeles,Bonnie Glover Samson andRodney Samson enjoy life atHovnanian’s Four Seasons atHemet, a 1,100-home activeadult community.

DEMANDDemand for housing is driven by household formation and population growth. Over the past 10
years, while interest rates have fluctuated, the rate of home ownership in the United States has
risen steadily, from 64% in 1994 to 69% in 2004. The addition of new households over the coming
decade is projected to exceed 1.3 million per year, an increase above the recent pace. This fact,
combined with the need for replacement of demolitions and the growing demand for second homes,
bodes well for the future of our industry.
STABILITYOver the past 30 years, total U.S. housing starts have averaged 1.6 million homes per year.
The Joint Center for Housing Study at Harvard University projects that the total number of
homes built will average 1.9 million homes per year over the coming decade based on projected
household growth, demand for second homes and the likely replacement of older existing homes.
The Brookings Institution estimates annual demand at approximately 2.0 million housing starts
for the next three decades. These figures represent a powerful story of long-term demand.
CONSOLIDATIONThe top 20 homebuilders’ share of the U.S. housing market has more than doubled since 1993.
Today, experienced management teams, better access to capital, lower material costs and market
diversity give larger homebuilders a strong competitive advantage. With the top 20 homebuilders
still controlling only 25% of the domestic housing market, there is ample opportunity for continued
growth in market share through further consolidation.

We have been outperforming our peer group inearnings growth and return on capital, capturingan increasing share of the large and steadyhomebuilding market.
Ken and Holly Harris, withtheir children Kennedy andKendall, live in Lakeville, acommunity of 740 single-familyhomes built by Parkside Homes,our division in Houston, Texas.
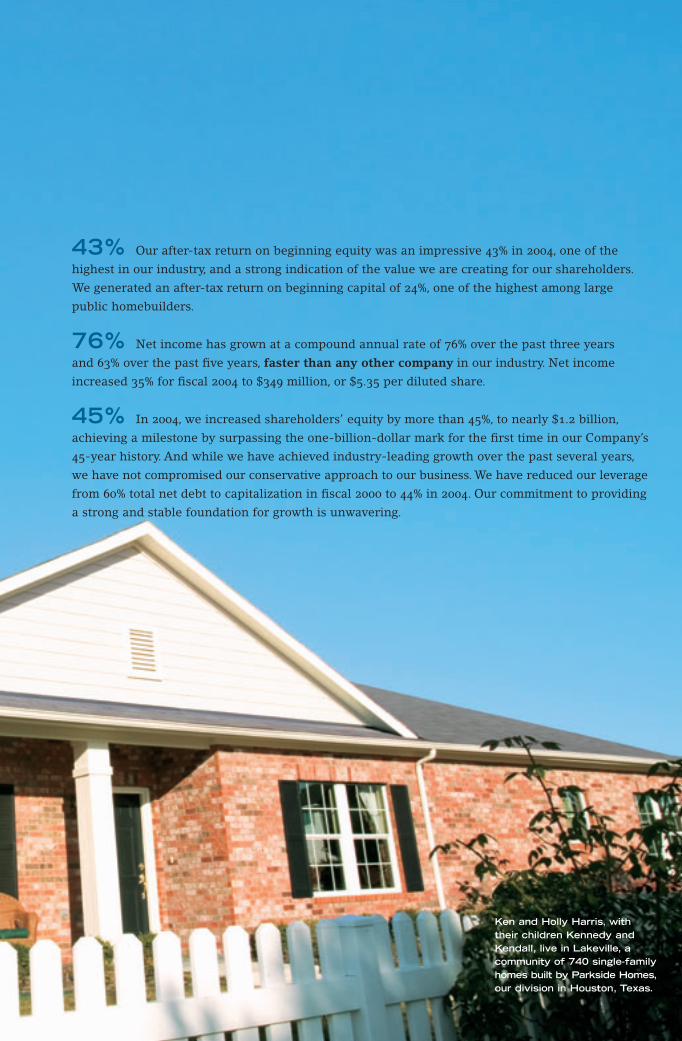
43% Our after-tax return on beginning equity was an impressive 43% in 2004, one of the
highest in our industry, and a strong indication of the value we are creating for our shareholders.
We generated an after-tax return on beginning capital of 24%, one of the highest among large
public homebuilders.
76% Net income has grown at a compound annual rate of 76% over the past three years
and 63% over the past five years, faster than any other company in our industry. Net income
increased 35% for fiscal 2004 to $349 million, or $5.35 per diluted share.
45% In 2004, we increased shareholders’ equity by more than 45%, to nearly $1.2 billion,
achieving a milestone by surpassing the one-billion-dollar mark for the first time in our Company’s
45-year history. And while we have achieved industry-leading growth over the past several years,
we have not compromised our conservative approach to our business. We have reduced our leverage
from 60% total net debt to capitalization in fiscal 2000 to 44% in 2004. Our commitment to providing
a strong and stable foundation for growth is unwavering.


As proud as we are of what we have built,we’re even more excited about what we’re building.
Our past success has enabled us to build a strongfoundation for continued growth. More importantly,we have a clear strategic vision for capitalizing on this foundation; maintaining leadership in anexpanding number of dynamic markets; offeringconsumers a broad array of high-quality, attractivelypriced homes; and continually improving our processesto make us even more productive and efficient.
Building for the future is an essential commitment of our Company.
WH
AT
WE
’RE
BU
ILD
ING

8
We will continue to build a leadership position in an expandingnumber of attractive markets.
COMMUNITIES ACTIVE PROPOSED
ARIZONA 9 7
CALIFORNIA 49 48
DELAWARE 0 8
FLORIDA 16 13
MARYLAND 13 47
MICHIGAN “On-Your-Lot” Operation
MINNESOTA 0 5
NEW JERSEY 23 95
NEW YORK 1 3
NORTH CAROLINA 50 21
OHIO “On-Your-Lot” Operation
PENNSYLVANIA 4 14
SOUTH CAROLINA 6 0
TEXAS 76 62
VIRGINIA 25 49
WEST VIRGINIA 3 2
TOTAL 275 374

9
We market and build homes in geographically diverse
markets. We command a leadership position as one of
the largest homebuilders in each of those markets,
thereby leveraging powers and economies of scale. The
competitive advantages afforded to large homebuilders
are leading to increased consolidation and further
concentration of market powers.
GEOGRAPHIC DIVERSITY. Our presence in multiple
housing markets is a core strength of our Company,
reducing our dependence on any single housing market.
Different markets in the U.S. respond at different times
to varying employment rates, immigration trends, supply
factors and demographic changes. Doing business in
a variety of markets helps to insulate us from these
regional cycles. Today, we are building homes in 13 states,
from New Jersey to Florida to California. As of October
31, 2004, we are selling homes in 275 communities
nationwide with 374 more in various stages of develop-
ment and planning. Our strategic focus on geographic
expansion means that we will continue to look at new
markets in new states, applying the strict criteria that
have enabled us to expand prudently in the past.
MARKET LEADERSHIP. In each of our markets we
have built a strong competitive position with key land
developer and subcontractor relationships, scale
efficiencies and strong, experienced local management.
Establishing and maintaining market leadership is a
core strategy for us because market leadership brings
important advantages. Leaders enjoy the best opportu-
nities to acquire land. Local trade partners typically
provide their best pricing for market leaders, and offer
better service and higher quality workmanship. Market
leaders have a higher level of name recognition and
command the most desirable placements in local real
estate listings. Finally, market leaders are perceived as
the employers of choice, offering more opportunities
and greater job security.

We will continue to focus on developing and marketing a broad product array.
David and Elizabeth Wyblelive at Riverview at CityPlace, a 130-home mid-risecommunity in Edgewater,New Jersey.

We offer one of the most diversified product portfolios
in the industry. Our broad product array allows us to
meet the diverse and ever-changing needs of the
American homebuyer. We build a wide variety of single-
family attached and detached homes, townhomes, and
mid-rise and high-rise condominiums. We are an indus-
try leader in urban infill locations, with more than 20
years of experience in redeveloping older residential
areas and sites previously unsuitable for housing. We
design and market our homes for a variety of buyer
profiles and situations, including first-time homebuyers;
homeowners with growing families; luxury residences
for move-up buyers as they become more affluent;
homes in or near cities for people desiring the excite-
ment and amenities of urban areas; and adult lifestyle
communities to meet the needs of our aging population.
At a time when the supply of available land is diminishing,
our diversity of product enables us to take advantage of
virtually every land opportunity.
BENEFITS OF DIVERSITY. Offering a broad range of
products supports our strategy of market dominance,
as our diverse range of products allows us to serve more
customers. It helps us stay current with the changing
demographics of the American population. Having a broad
product offering also allows us to exploit more opportuni-
ties for available land, whether it’s zoned for active adult,
single family or multi-family. As the supply of available
land continues to shrink in some markets, our focus on
product diversity will enable us to build and meet the
demand for housing in a greater number of locations.
As competition among the largest homebuilders
intensifies in the nation’s top 50 housing markets, we
continue to explore new opportunities for growth in
secondary markets. One such opportunity came to us
through our acquisition of an Ohio-based homebuilder.
Through its “Build on Your Lot” program, our Ohio
division builds homes for first-time and move-up
homebuyers who already own a home site. We believe
our “Build on Your Lot” program offers expansion
opportunities into new markets as well as further
penetration in our existing markets.
11

Innovative process improvements and a strong commitment to associate development will continue to drive operationalimprovements and build competitive advantages.
Lexington Estates is asingle-family detachedcommunity of 82 homeslocated in Marlboro, NewJersey. Pictured are home-owners Michael and CindyRingel with their son, Sam.

Our industry is consolidating with significant market
share gains occurring among a small group of large public
homebuilders each with equity in excess of a billion
dollars. We intend to remain at the forefront of this
group by identifying and implementing new methods
for achieving enhanced operational performance and
building competitive advantages.
CONTINUOUS IMPROVEMENT. Our passion is finding
innovative ways to improve operational performance
and new methods that lead to sustainable competitive
advantages. We have senior professionals devoted to
process improvement, covering such areas as customer
relations, home production and quality assurance. Their
mission is to work with our team of operating managers
to identify and analyze the best ways to run our busi-
ness and then adopt these practices across our
Company. This will enable us to benefit from even
greater economies of scale as we consolidate past
acquisitions and expand into new regions.
One potential opportunity is the vertical integration
of selected subcontractors. By incorporating certain
construction trades into our existing operations, we can
increase profitability, make the production of our homes
faster and more efficient and improve the quality of
the homes we deliver. Consistent with our conservative
operating strategy, such initiatives will be carefully tested
and gradually implemented throughout our Company
only when proven successful. Selective vertical integra-
tion requires minimal investment, and allows us to
achieve high returns on capital.
DEVELOPING OUR PEOPLE. We are committed to
leading our industry in the areas of recruitment and
associate training and development. We attract the
best people through coordinated recruitment programs
on college campuses, ongoing recruiting efforts for
new positions and by positioning our Company as the
best homebuilder for which to work. Once associates
are on board, we have a wide range of programs to
train and motivate them to achieve excellence.
Currently, we offer more than 70 courses to associates,
ranging from job specific skills to management
development and construction technology.
13
14
We are very pleased to report that 2004 was another
very successful year for our Company. We continued to
achieve significant growth in both revenues and earn-
ings, and we generated an after-tax return on beginning
equity of 43% and an after-tax return on beginning
capital of 24%, which is a good indication that we are
continuing to create significant value for our share-
holders. We are indebted to our 3,837
talented and dedicated associates for
their hard work in making this perform-
ance possible, as well as the thousands
of homeowners who continue to place
their trust in our Company and
our products.
In fiscal 2004, our net income
increased 35% to $349 million, or $5.35
per diluted share, after growing 87% in
fiscal 2003. Net earnings per diluted
share have grown at a compound annual rate of 67% over
the past three years and at a rate of 50% over the past
five years. Our revenues grew 30% to $4.2 billion in fiscal
2004. In March we announced a two-for-one stock split.
Our strong track record was acknowledged by
Fortune magazine, which ranked us 14th on their
annual list of 100 fastest-growing companies in the
U.S. based on total return to shareholders. This is our
third consecutive year on the list.
Our recent performance is the result of strategies
that we have put in place over the past several years.
While we continue to benefit from a strong housing
market, our success in outpacing the earnings growth
rates of our peers is testament to our strategies to
achieve growth while maintaining high returns on
invested capital. At the same time, these strong results
are a foundation for the future, provid-
ing us with the financial strength and
the operational excellence needed to
continue to grow profitably. As the
preceding pages illustrate, we are proud
of what we’ve built...and even more
excited about what lies ahead.
Residential for-sale housing remains
one of the most stable and healthy
industries in the nation. A long-term
view of our industry shows that housing
starts have been remarkably consistent over time, and
that demand is more sensitive to demographic trends
than interest rates. These demographic trends—birth
rates, immigration, household formation and the aging
of our population—all point to continued strength in the
overall housing market. In fact, the most recent study
by The Joint Center for Housing Studies at Harvard
University suggests that the industry will need to build
at least 1.9 million new homes per year over the coming
decade, up from 1.6 million over the last decade. This
TO OUR SHAREHOLDERS AND ASSOCIATES
Our strong track record
was acknowledged byFORTUNE magazine,
which ranked usas one of the
100 fastest-growing companies in theU.S. for the thirdconsecutive year.
15
projection is based on the current rate of household
formation and includes the growing demand for second
homes and the replacement of older existing housing.
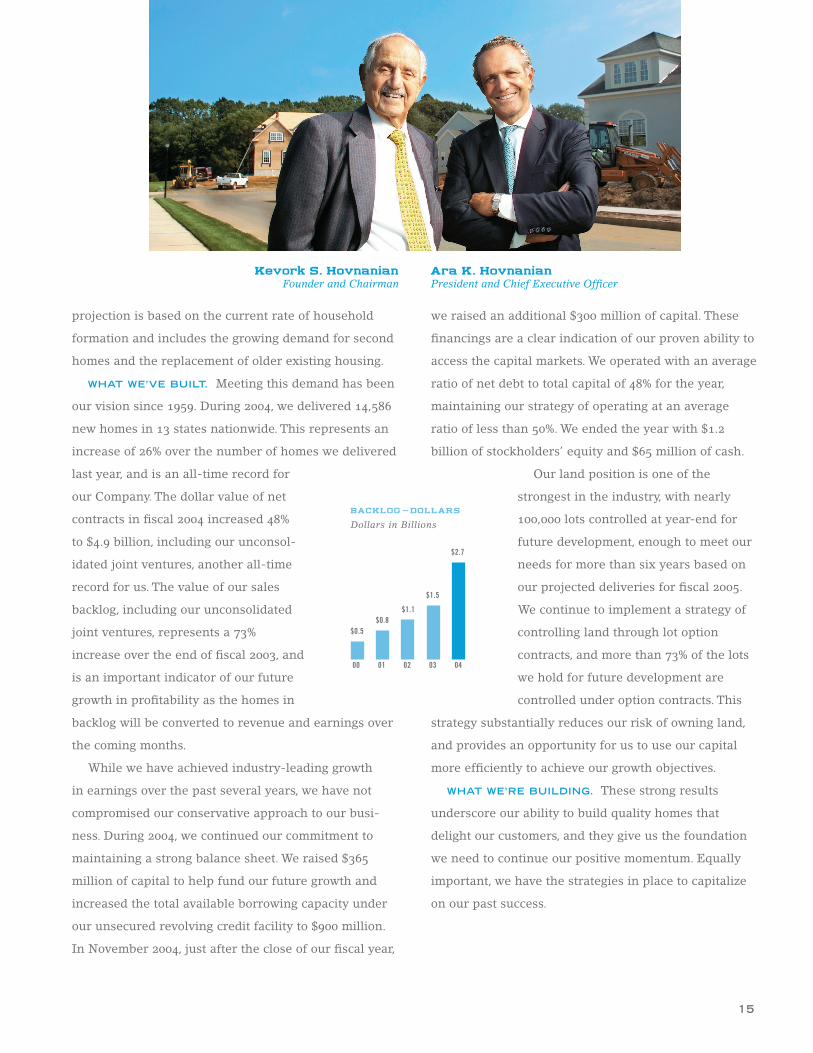
WHAT WE’VE BUILT. Meeting this demand has been
our vision since 1959. During 2004, we delivered 14,586
new homes in 13 states nationwide. This represents an
increase of 26% over the number of homes we delivered
last year, and is an all-time record for
our Company. The dollar value of net
contracts in fiscal 2004 increased 48%
to $4.9 billion, including our unconsol-
idated joint ventures, another all-time
record for us. The value of our sales
backlog, including our unconsolidated
joint ventures, represents a 73%
increase over the end of fiscal 2003, and
is an important indicator of our future
growth in profitability as the homes in
backlog will be converted to revenue and earnings over
the coming months.
While we have achieved industry-leading growth
in earnings over the past several years, we have not
compromised our conservative approach to our busi-
ness. During 2004, we continued our commitment to
maintaining a strong balance sheet. We raised $365
million of capital to help fund our future growth and
increased the total available borrowing capacity under
our unsecured revolving credit facility to $900 million.
In November 2004, just after the close of our fiscal year,
we raised an additional $300 million of capital. These
financings are a clear indication of our proven ability to
access the capital markets. We operated with an average
ratio of net debt to total capital of 48% for the year,
maintaining our strategy of operating at an average
ratio of less than 50%. We ended the year with $1.2
billion of stockholders’ equity and $65 million of cash.
Our land position is one of the
strongest in the industry, with nearly
100,000 lots controlled at year-end for
future development, enough to meet our
needs for more than six years based on
our projected deliveries for fiscal 2005.
We continue to implement a strategy of
controlling land through lot option
contracts, and more than 73% of the lots
we hold for future development are
controlled under option contracts. This
strategy substantially reduces our risk of owning land,
and provides an opportunity for us to use our capital
more efficiently to achieve our growth objectives.
WHAT WE’RE BUILDING. These strong results
underscore our ability to build quality homes that
delight our customers, and they give us the foundation
we need to continue our positive momentum. Equally
important, we have the strategies in place to capitalize
on our past success.
Kevork S. HovnanianFounder and Chairman
Ara K. HovnanianPresident and Chief Executive Officer
BACKLOG -- DOLLARS
Dollars in Billions
00 01 02 03 04
$2.7
$1.5
$1.1$0.8
$0.5
16
In 2004, we continued to deploy our two-pronged
strategy of growth through selected company acquisitions
and through expansion in our existing markets by
deploying our broad array of products and increasing the
number of our active selling communities. We entered
Minneapolis/St. Paul, a vibrant housing market generat-
ing more than 18,000 permits annually and one of the
top ten housing markets in the U.S.
Looking forward, we will continue
to expand into new markets that offer
attractive opportunities for us to grow
and extend our successful business
model and we will continue to offer
and expand our diverse product mix
to meet the changing needs of
American homeowners. In response
to recent demographic trends, and to
the shrinking availability of vacant
land, we will focus increasingly on active adult commu-
nities, urban and suburban infill development, mid-rise
and high-rise development, and expanding our “Build
on Your Lot” business model.
We remain committed to improving our operational
efficiency as the homebuilding industry continues to
transform itself over the coming years. Recognizing that
industry consolidation will result in increased competi-
tion, we have placed greater emphasis on efficiency,
process improvements and competitive differentiation.
We are at the forefront of this transformation, and stand
to continue to gain market share as the larger home-
builders increasingly dominate what was once a very
fragmented industry. We are implementing new
programs that standardize best practices across the
Company, making us more cost-effective as well as
more responsive to our customers’ needs.
Finally, we continue to invest in recruitment and
training programs to attract, retain
and motivate the best associates in
the business. Since our past success
rests on the shoulders of our
associates, our future growth in an
increasingly competitive market will
depend even more on their creativity,
entrepreneurial spirit and dedication.
Again, we thank our associates,
shareholders and customers for
their continued loyalty, and look
forward to keeping them informed of our progress
in the coming year.
Kevork S. Hovnanian
Founder and Chairman
Ara K. Hovnanian
President and Chief Executive Officer
We are implementingprograms that
standardize best practices
across the Company,making us
more cost-effectiveas well as
more responsive to ourcustomers’ needs.

17
GEATON A. DECESARIS, JR. (49) Mr. DeCesaris has served as
President of the Hovnanian Land Investment Group since July 2003.
Prior to this position, Mr. DeCesaris was President of Homebuilding
Operations and Chief Operating Officer since January 2001. Prior to
joining the Company in 2001, Mr. DeCesaris served as Chairman,
President and Chief Executive Officer of Washington Homes, Inc.
Mr. Decesaris was honored as the Washington, D.C. area’s Entrepreneur
of the Year in the real estate category in 1994, sponsored by Inc. magazine
and Ernst and Young. Mr. DeCesaris was elected as a Director of the
Company in January 2001.
ARTHUR M. GREENBAUM, ESQ. (79) Mr. Greenbaum has been a
senior partner of Greenbaum, Rowe, Smith & Davis, a legal firm, since
1950. Mr. Greenbaum has been a Director since 1992.
EDWARD A. KANGAS*• (60) Mr. Kangas was Chairman and
Chief Executive Officer of Deloitte Touche Tohmatsu from December,
1989 to May, 2000, when he retired. He also serves on the Boards of
Electronic Data Systems, Inc. (NYSE), Eclipsys, Inc. (NASDAQ), and
Tenet Healthcare Corporation, Inc. (NYSE) and is Chairman of the
Board of the National Multiple Sclerosis Society. Mr. Kangas was
elected as a Director of the Company in September 2002.
JOHN J. ROBBINS* (65) Mr. Robbins was a managing partner
of the New York Office of Kenneth Leventhal & Company and executive
committee partner, retiring from the firm in 1992. He was made a
partner of Kenneth Leventhal & Company in 1973. Mr. Robbins has been
a Trustee of Keene Creditors Trust since 1996. He is also Director and
Chairman of the Audit Committee of Raytech Corporation since May 2003.
Mr. Robbins was elected as a Director of the Company in January 2001.
ARA K. HOVNANIAN (47) Mr. Hovnanian has been Chief Executive
Officer since 1997 after being appointed President in 1988 and
Executive Vice President in 1983. Mr. Hovnanian joined the Company
in 1979. In 1985, Governor Kean appointed Mr. Hovnanian to The
Council on Affordable Housing and he was reappointed to the Council
in 1990 by Governor Florio. In 1994, Governor Whitman appointed him
as a member of the Governor’s Economic Master Plan Commission.
Mr. Hovnanian serves as Member of the Advisory Council of PNC Bank
and the Monmouth Real Estate Investment Corporation, and he is on
the Boards of a variety of charitable organizations.
KEVORK S. HOVNANIAN (81) Mr. Hovnanian is the founder of the
Company and has served as Chairman of the Board since its original
incorporation in 1967. He served as Chief Executive Officer from 1967
through July 1997. In 1996, the New Jersey Institute of Technology
awarded Mr. Hovnanian a President’s Medal for Distinguished
Achievement to an Outstanding Entrepreneur. In 1992, Mr. Hovnanian
was granted one of five nationwide Harvard Dively Awards for
Leadership in Corporate Public Initiatives.
J. LARRY SORSBY (49) Mr. Sorsby has been Chief Financial Officer
of the Company since 1996 and Executive Vice President since
November 2000. From March 1991 to November 2000, he was Senior
Vice President, and from March 1991 to July 2000, he was Treasurer.
Mr. Sorsby was elected as a Director of the Company in 1997.
DESMOND P. MCDONALD* (77) Mr. McDonald was a Director of
Midlantic Bank, N.A. from 1976 to December 1995, Executive Committee
Chairman of Midlantic Bank, N.A. from August 1992 to December 1995
and President of Midlantic Bank, N.A. from 1976 to June 1992. He was
also a Director of Midlantic Corporation to December 1995 and Vice
Chairman from June 1990 to July 1992. Mr. McDonald has been a
Director of the Company since 1982.
STEPHEN D. WEINROTH*• (66) Mr. Weinroth is a Managing Partner
of Hudson Capital Advisors, LLC, a merchant banking firm, and is a
Managing Director and Board Member of Kline Hawkes & Co., a manager
of private equity funds. He is Chairman of the Board Emeritus of Core
Laboratories, N.V. (NYSE), a global oil field services company where
he was Chairman of the Board. He is Vice Chair of the Central Asian
American Enterprise Fund. Mr. Weinroth has been a Director of the
Company since 1982.
* Member of the Audit Committee• Member of the Compensation Committee
BOARD OF DIRECTORS(left to right)
18
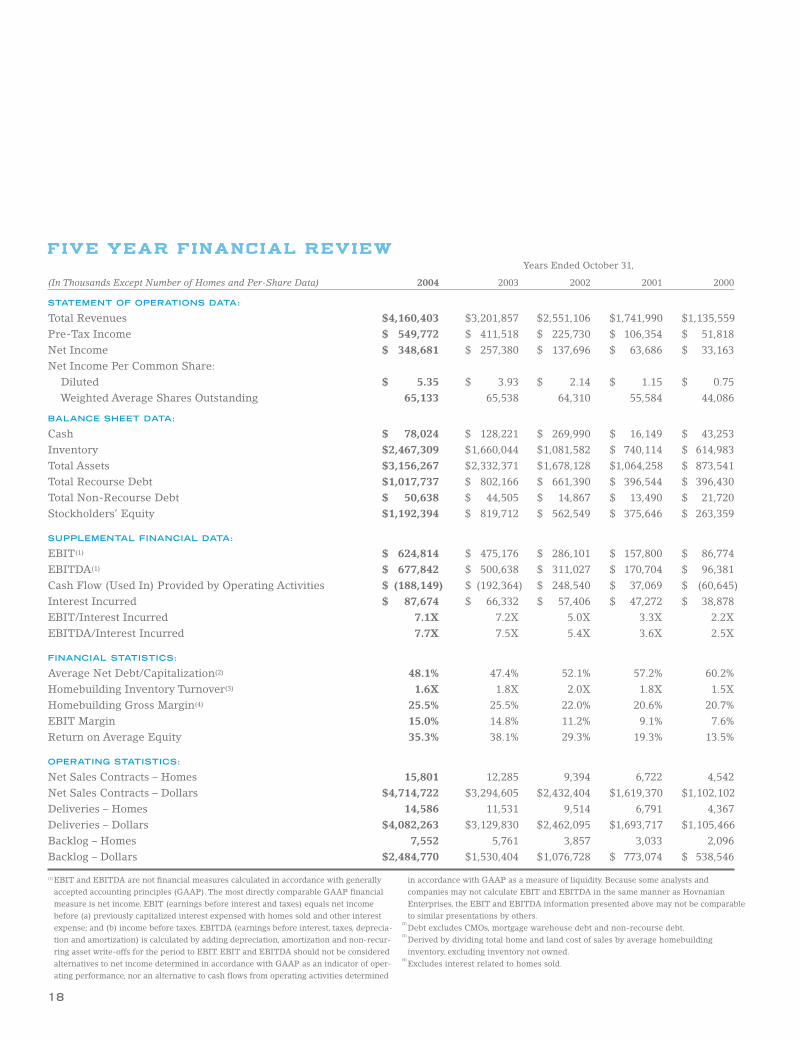
Years Ended October 31,
(In Thousands Except Number of Homes and Per-Share Data) 2004 2003 2002 2001 2000
STATEMENT OF OPERATIONS DATA:
Total Revenues $4,160,403 $3,201,857 $2,551,106 $1,741,990 $1,135,559Pre-Tax Income $ 549,772 $ 411,518 $ 225,730 $ 106,354 $ 51,818Net Income $ 348,681 $ 257,380 $ 137,696 $ 63,686 $ 33,163Net Income Per Common Share:
Diluted $ 5.35 $ 3.93 $ 2.14 $ 1.15 $ 0.75Weighted Average Shares Outstanding 65,133 65,538 64,310 55,584 44,086
BALANCE SHEET DATA:
Cash $ 78,024 $ 128,221 $ 269,990 $ 16,149 $ 43,253Inventory $2,467,309 $1,660,044 $1,081,582 $ 740,114 $ 614,983Total Assets $3,156,267 $2,332,371 $1,678,128 $1,064,258 $ 873,541Total Recourse Debt $1,017,737 $ 802,166 $ 661,390 $ 396,544 $ 396,430Total Non-Recourse Debt $ 50,638 $ 44,505 $ 14,867 $ 13,490 $ 21,720Stockholders’ Equity $1,192,394 $ 819,712 $ 562,549 $ 375,646 $ 263,359
SUPPLEMENTAL FINANCIAL DATA:
EBIT(1) $ 624,814 $ 475,176 $ 286,101 $ 157,800 $ 86,774EBITDA(1) $ 677,842 $ 500,638 $ 311,027 $ 170,704 $ 96,381Cash Flow (Used In) Provided by Operating Activities $ (188,149) $ (192,364) $ 248,540 $ 37,069 $ (60,645)Interest Incurred $ 87,674 $ 66,332 $ 57,406 $ 47,272 $ 38,878EBIT/Interest Incurred 7.1X 7.2X 5.0X 3.3X 2.2XEBITDA/Interest Incurred 7.7X 7.5X 5.4X 3.6X 2.5X
FINANCIAL STATISTICS:
Average Net Debt/Capitalization(2) 48.1% 47.4% 52.1% 57.2% 60.2%Homebuilding Inventory Turnover(3) 1.6X 1.8X 2.0X 1.8X 1.5XHomebuilding Gross Margin(4) 25.5% 25.5% 22.0% 20.6% 20.7%EBIT Margin 15.0% 14.8% 11.2% 9.1% 7.6%Return on Average Equity 35.3% 38.1% 29.3% 19.3% 13.5%
OPERATING STATISTICS:
Net Sales Contracts – Homes 15,801 12,285 9,394 6,722 4,542Net Sales Contracts – Dollars $4,714,722 $3,294,605 $2,432,404 $1,619,370 $1,102,102Deliveries – Homes 14,586 11,531 9,514 6,791 4,367Deliveries – Dollars $4,082,263 $3,129,830 $2,462,095 $1,693,717 $1,105,466Backlog – Homes 7,552 5,761 3,857 3,033 2,096Backlog – Dollars $2,484,770 $1,530,404 $1,076,728 $ 773,074 $ 538,546
FIVE YEAR FINANCIAL REVIEW
(1)EBIT and EBITDA are not financial measures calculated in accordance with generallyaccepted accounting principles (GAAP). The most directly comparable GAAP financialmeasure is net income. EBIT (earnings before interest and taxes) equals net incomebefore (a) previously capitalized interest expensed with homes sold and other interestexpense; and (b) income before taxes. EBITDA (earnings before interest, taxes, deprecia-tion and amortization) is calculated by adding depreciation, amortization and non-recur-ring asset write-offs for the period to EBIT. EBIT and EBITDA should not be consideredalternatives to net income determined in accordance with GAAP as an indicator of oper-ating performance, nor an alternative to cash flows from operating activities determined
in accordance with GAAP as a measure of liquidity. Because some analysts and companies may not calculate EBIT and EBITDA in the same manner as HovnanianEnterprises, the EBIT and EBITDA information presented above may not be comparableto similar presentations by others.
(2)Debt excludes CMOs, mortgage warehouse debt and non-recourse debt.
(3)Derived by dividing total home and land cost of sales by average homebuilding inventory, excluding inventory not owned.
(4)Excludes interest related to homes sold.

19
Compound Annual Growth Rate (CAGR).(1)Excludes interest related to homes sold.(2)See description of EBIT and EBITDA in footnote (1) on page 18.(3)
Debt excludes CMOs, mortgage warehouse debt and non-recourse debt.
DELIVERIES--HOMES
00 01 02 03 04
14,586
11,531
9,514
6,791
4,367
FINANCIAL HIGHLIGHTS
HOMEBUILDING GROSS MARGIN(1)
00 01 02 03 04
25.5%25.5%
22.0%20.6%20.7%
STOCKHOLDERS’ EQUITY
Dollars in Billions
00 01 02 03 04
$1.2
$0.8
$0.6
$0.4
$0.3
PRE-TAX INCOME
Dollars in Millions
00 01 02 03 04
$549.8
$411.5
$225.7
$106.4$51.8
RETURN ON BEGINNING CAPITAL
00 01 02 03 04
24.4%24.3%22.6%
14.3%
10.0%
DEBT TO CAPITAL(3)
00 01 02 03 04
48.1%47.4%52.1%
57.2%60.2%
TOTAL REVENUES
Dollars in Billions
00 01 02 03 04
$4.2
$3.2
$2.6
$1.7
$1.1
EBIT MARGIN(2)
00 01 02 03 04
15.0%14.8%
11.2%
9.1%7.6%
EBITDA/INTERESTINCURRED(2)
00 01 02 03 04
7.7X7.5X
5.4X
3.6X
2.5X
35% CAGR
46% CAGR
38% CAGR
80% CAGR

20
NET CONTRACTS Homes Dollars in Thousands
October 31, October 31, Percent October 31, October 31, Percent2004 2003 Change 2004 2003 Change
Northeast Region 3,282 2,695 21.8% $1,112,264 $ 801,117 38.8%Southeast Region 4,038 3,241 24.6% 1,161,514 867,984 33.8%Southwest Region 3,810 2,525 50.9% 674,115 480,609 40.3%West Region 4,671 3,822 22.2% 1,766,829 1,144,582 54.4%Other – 2 N/M – 313 N/MConsolidated Total 15,801 12,285 28.6% $4,714,722 $ 3,294,605 43.1%Unconsolidated Joint Ventures 347 67 N/M 204,897 22,272 N/M
Total 16,148 12,352 30.7% $4,919,619 $ 3,316,877 48.3%
CONTRACT BACKLOG Homes Dollars in Thousands
October 31, October 31, Percent October 31, October 31, Percent2004 2003 Change 2004 2003 Change
Northeast Region 2,312 2,218 4.2% $ 774,016 $ 581,865 33.0%Southeast Region 2,399 1,761 36.2% 770,804 526,348 46.4%Southwest Region 924 989 (6.6%) 164,655 157,655 4.4%West Region 1,917 793 141.7% 775,295 264,536 193.1%Other – – N/M – – N/MConsolidated Total 7,552 5,761 31.1% $2,484,770 $1,530,404 62.4%Unconsolidated Joint Ventures 299 36 N/M 184,220 15,878 N/M
Total 7,851 5,797 35.4% $2,668,990 $1,546,282 72.6%
DELIVERIES Homes Dollars in Thousands
October 31, October 31, Percent October 31, October 31, Percent2004 2003 Change 2004 2003 Change
Northeast Region 3,188 2,387 33.6% $1,027,356 $ 774,209 32.7%Southeast Region 3,976 2,720 46.2% 1,066,474 682,210 56.3%Southwest Region 3,875 2,431 59.4% 681,083 481,634 41.4%West Region 3,547 3,984 (11.0%) 1,307,350 1,190,516 9.8%Other – 9 N/M – 1,261 N/MConsolidated Total 14,586 11,531 26.5% $4,082,263 $3,129,830 30.4%Unconsolidated Joint Ventures 84 54 N/M 36,555 11,034 N/M
Total 14,670 11,585 26.6% $4,118,818 $3,140,864 31.1%
All statements in this Annual Report that are not historical facts should be considered as ”forward-looking statements” within the meaning of the Private Securities Litigation ReformAct of 1995. Such statements involve known and unknown risks, uncertainties and other factors that may cause actual results, performance or achievements of the Company to bematerially different from any future results, performance or achievements expressed or implied by the forward-looking statements. Such risks, uncertainties and other factors include,but are not limited to, (1) changes in general and local economic and business conditions, (2) weather conditions, (3) changes in market conditions, (4) changes in home prices andsales activity in the markets where the Company builds homes, (5) government regulation, including regulations concerning development of land, the homebuilding process and theenvironment, (6) fluctuations in interest rates and the availability of mortgage financing, (7) shortages in and price fluctuations of raw materials and labor, (8) the availability and costof suitable land and improved lots, (9) levels of competition, (10) availability of financing to the Company, (11) utility shortages and outages or rate fluctuations, (12) geopolitical risks,terrorist acts and other acts of war and (13) other factors described in detail in the Company’s Form 10-K for the year ended October 31, 2004, which is included in this Annual Report.
COMMUNITIES UNDER DEVELOPMENT

HOVNANIAN ENTERPRISES, INC.
FORM 10-K


UNITED STATESSECURITIES AND EXCHANGE COMMISSION
Washington, D.C. 20549
Form 10-K� ANNUAL REPORT PURSUANT TO SECTION 13 OR 15(d) OF
THE SECURITIES EXCHANGE ACT OF 1934For the fiscal year ended OCTOBER 31, 2004
� TRANSITION REPORT PURSUANT TO SECTION 13 OR 15(d)OF THE SECURITIES EXCHANGE ACT OF 1934 (NO FEEREQUIRED)
Commission file number: 1-8551
Hovnanian Enterprises, Inc.(Exact Name of Registrant as Specified in Its Charter)
Delaware 22-1851059(State or Other Jurisdiction of (I.R.S. EmployerIncorporation or Organization) Identification No.)
10 Highway 35, P.O. Box 500, Red Bank, N.J. 07701(Address of Principal Executive Offices) (Zip Code)
732-747-7800(Registrant’s Telephone Number, Including Area Code)
Securities registered pursuant to Section 12(b) of the Act:
Name of Each Exchange on WhichTitle of Each Class Registered
Class A Common Stock, $.01 par value per share New York Stock ExchangeSecurities registered pursuant to Section 12(g) of the Act:
Class B Common Stock, $.01 par value per share(Title of Class)
Indicate by check mark whether the registrant (1) has filed all reports required to be filed bySection 13 or 15(d) of the Securities Exchange Act of 1934 during the preceding 12 months (or forsuch shorter period that the registrant was required to file such reports), and (2) has been subject tosuch filing requirements for the past 90 days. Yes � No �
Indicate by check mark if disclosure of delinquent filers pursuant to Item 405 of Regulation S-K is notcontained herein, and will not be contained, to the best of registrant’s knowledge, in definitive proxyor information statements incorporated by reference in Part III of this Form 10-K or any amendmentto this Form 10-K. �
Indicate by check mark whether the registrant is an accelerated filer (as defined in Exchange ActRule 12b-2). Yes � No �
State the aggregate market value of the voting and non-voting common equity held by non-affiliatescomputed by reference to the price at which the common equity was last sold, or the average bid andasked price of such common equity as of April 30, 2004 was $1,248,371,115.
As of the close of business on January 3, 2005, there were outstanding 46,560,192 shares of theRegistrant’s Class A Common Stock and 14,683,524 shares of its Class B Common Stock.

HOVNANIAN ENTERPRISES, INC. AND SUBSIDIARIES
Documents Incorporated by Reference:Part III—Those portions of registrant’s definitive proxy statement to be filed pursuant to Regulation 14A in
connection with registrant’s annual meeting of shareholders to be held on March 8, 2005 which are responsive toItems 10, 11, 12, 13 and 14.

HOVNANIAN ENTERPRISES, INC. AND SUBSIDIARIES
FORM 10-KTABLE OF CONTENTS
Item Page
PART I
1 and 2 Business and Properties 2
3 Legal Proceedings 10
4 Submission of Matters to a Vote of Security Holders 11
PART II
5 Market for the Registrant’s Common Equity, Related Stockholder Matters and Issuer Purchasesof Equity Securities 11
6 Selected Consolidated Financial Data 12
7 Management’s Discussion and Analysis of Financial Condition and Results of Operations 13
7A Quantitative and Qualitative Disclosures About Market Risk 28
8 Financial Statements and Supplementary Data 29
9 Changes in and Disagreements with Accountants on Accounting and Financial Disclosure 29
9A Controls and Procedures 29
9B Other Information 29
PART III
10 Directors and Executive Officers of the Registrant 30
11 Executive Compensation 31
12 Security Ownership of Certain Beneficial Owners and Management and Related StockholderMatters 31
13 Certain Relationships and Related Transactions 32
14 Principal Accountant Fees and Services 32
PART IV
15 Exhibits and Financial Statement Schedules 33
Signatures 36

HOVNANIAN ENTERPRISES, INC. AND SUBSIDIARIES
PART I
Items 1 and 2 - Business and Properties
BUSINESS OVERVIEWWe design, construct, market and sell single-family detached homes, attached townhomes and condominiums,mid-rise and high-rise condominiums, urban infill and active adult homes in planned residential developmentsand are one of the nation’s largest builders of residential homes. Originally founded in 1959 by KevorkHovnanian, Hovnanian Enterprises, Inc. was incorporated in New Jersey in 1967 and reincorporated in Delawarein 1982. Since the incorporation of our predecessor company, we have delivered in excess of 185,000 homes,including 14,586 homes in fiscal 2004. The Company consists of two operating groups: homebuilding andfinancial services. Our financial services group provides mortgage loans and title services to our homebuildingcustomers.
We are currently offering homes for sale in 275 communities in 24 markets in 13 states throughout the UnitedStates. We primarily market and build homes for first-time buyers, first-time and second-time move-up buyers,luxury buyers, active adult buyers and empty nesters. We offer a variety of home styles at base prices rangingfrom $46,000 to $1,350,000 with an average sales price, including options, of $280,000 in fiscal 2004.
Our operations span all significant aspects of the home-buying process—from design, construction and sale, tomortgage origination and title services.
The following is a summary of our growth history:
1959—Founded by Kevork Hovnanian as a New Jersey homebuilder.
1983—Completed initial public offering.
1986—Entered the North Carolina market through the investment in New Fortis Homes.
1992—Entered the greater Washington D.C. market.
1994—Entered the Coastal Southern California market.
1998—Expanded in the greater Washington D.C. market through the acquisition of P.C. Homes.
1999—Entered the Dallas, Texas market through our acquisition of Goodman Homes. Further diversified andstrengthened our position as New Jersey’s largest homebuilder through the acquisition of Matzel & Mumford.
2001—Continued expansion in the greater Washington D.C. and North Carolina markets through the acquisitionof Washington Homes. This acquisition further strengthened our operations in each of these markets.
2002—Entered the Central Valley market in Northern California and Inland Empire region of Southern Californiathrough the acquisition of Forecast Homes.
2003—Expanded operations in Texas and entered the Houston market through the acquisition of Parkside Homesand Brighton Homes. Entered the greater Ohio market through our acquisition of Summit Homes and entered thegreater metro Phoenix market through our acquisition of Great Western Homes.
2004—In November 2003, we entered the greater Tampa, Florida market through the acquisition of WindwardHomes, and in March 2004, we started a new division in the Minneapolis/St. Paul, Minnesota market.
Hovnanian markets and builds homes that are constructed on-site in four regions which include 19 of thenation’s top 50 housing markets. These four regions are the Northeast, Southeast, Southwest, and West.
2

HOVNANIAN ENTERPRISES, INC. AND SUBSIDIARIES
GEOGRAPHIC BREAKDOWN OF MARKETS BY REGIONNortheast: New Jersey, Southern New York, Pennsylvania, Ohio, Michigan and MinnesotaSoutheast: Delaware, Maryland, North Carolina, South Carolina, Virginia, Washington D.C., West Virginia, and FloridaSouthwest: Arizona and TexasWest: California
We employed approximately 3,837 full-time associates as of October 31, 2004.
Our Corporate offices are located at 10 Highway 35, P. O. Box 500, Red Bank, New Jersey 07701, our telephonenumber is (732)747-7800, and our Internet website address is www.khov.com. We make available through ourwebsite our annual report on Form 10-K, quarterly reports on Form 10-Q, current reports on Form 8-K, andamendments to these reports as soon as reasonably practicable after they are filed with the SEC. Copies of theCompany’s Form 10-K, quarterly reports on Form 10-Q, current reports on Form 8-K, and amendments to thesereports are available free of charge upon request.
BUSINESS STRATEGIESThe following is a summary of our key business strategies. We believe that these strategies separate us from ourcompetitors in the residential homebuilding industry and the adoption, implementation, and adherence to theseprinciples will continue to improve our business, lead to higher profitability for our shareholders and give us aclear advantage over our competitors.
Our market concentration strategy is a key factor that enables us to achieve powers of scale and economies ofscale and differentiate ourselves from most of our competitors. Our goal is to become a significant builder in eachof the selected markets in which we operate.
We offer a broad product array to provide housing to a wide range of customers. Our customers consist offirst-time buyers, first and second-time move-up buyers, luxury buyers, active adult buyers and empty nesters.Our diverse product array includes single family detached homes, attached townhomes and condominiums,mid-rise and high-rise condominiums, urban infill and active adult homes.
We are committed to customer satisfaction and quality in the homes that we build. We recognize that our futuresuccess rests in the ability to deliver quality homes to satisfied customers. We seek to expand our commitment tocustomer service through a variety of quality initiatives. In addition, our focus remains on attracting anddeveloping quality associates. We use several leadership development and mentoring programs to identify keyindividuals and prepare them for positions of greater responsibility within our Company.
We focus on achieving high return on invested capital. Each new community, whether through organic growth oracquisition, is evaluated based on its ability to meet or exceed internal rate of return requirements. Incentives forboth local and senior management are based, primarily, on the ability to generate returns on capital deployed.Our belief is that the best way to create lasting value for our shareholders is through a strong focus on return oninvested capital.
We adhere to a strategy of achieving growth through expansion of our organic operations and through theselected acquisition of other homebuilders with excellent management teams interested in continuing with ourCompany. In our existing markets, we continue to introduce a broader product array to gain market share andreach a more diverse group of customers. Selective acquisitions have expanded our geographic footprint,strengthened our market share in existing markets and further diversified our product offerings. Integration ofacquired companies is a core strength and organic growth after an acquisition is boosted by deployment of ourbroad product array. To enhance our pattern of geographic diversification, we may also choose to start up newhomebuilding operations in selected markets that allow our Company to employ our broad product array toachieve growth and market penetration. Through our presence in multiple geographic markets, our goal is toreduce the effects that housing industry cycles, seasonality and local conditions in any one area may have on ourbusiness.
3

HOVNANIAN ENTERPRISES, INC. AND SUBSIDIARIES
We utilize a risk averse land strategy. We attempt to acquire land with a minimum cash investment and negotiatetakedown options, thereby limiting the financial exposure to the amounts invested in property andpredevelopment costs. This policy significantly reduces our risk and generally allows us to obtain necessarydevelopment approvals before acquisition of the land.
We enter into homebuilding and land development joint ventures from time to time as a means of increasing lotpositions, expanding our market opportunities, establishing strategic alliances, reducing our risk profile,leveraging our capital base and enhancing our returns on capital. Our homebuilding joint ventures are generallyentered into with third party investors to develop land and construct homes that are sold directly to third partyhomebuyers. Our land development joint ventures include those with developers and other homebuilders as wellas financial investors to develop finished lots for sale to the joint venture’s members or other third parties.
We are committed to becoming a better and more efficient homebuilding company. Over the past few years, ourstrategies have included several initiatives to fundamentally transform our traditional practices used to design,build and sell homes and focus on ‘‘building better.’’ These performance enhancing initiatives, processes andsystems have been successfully used in other manufacturing industries and include implementation ofstandardized ‘‘best practice processes’’, rapid cycle times, vendor consolidation, vendor partnering, co-operativepurchasing, distribution, fabrication and installation, and just-in-time material procurement. Other initiativesinclude standardized home designs that can be deployed in multiple geographic markets with minimalarchitectural modification.
We seek to expand our financial services operations to better serve all of our homebuyers. Our current mortgagefinancing and title service operations enhance the profitability and growth of our company.
OPERATING POLICIES AND PROCEDURESWe attempt to reduce the effect of certain risks inherent in the housing industry through the following policiesand procedures:
Training—Our training is designed to provide our associates with the knowledge, attitudes, skills and habitsnecessary to succeed at their jobs. Our Training Department regularly conducts training classes in sales,construction, administration, and managerial skills.
Land Acquisition, Planning and Development—Before entering into a contract to acquire land, we completeextensive comparative studies and analyses which assist us in evaluating the economic feasibility of such landacquisition. We generally follow a policy of acquiring options to purchase land for future communitydevelopments.
• We typically acquire land for future development principally through the use of land options which need not beexercised before the completion of the regulatory approval process. We attempt to structure these options withflexible take down schedules rather than with an obligation to take down the entire parcel upon receivingregulatory approval. Additionally, we purchase improved lots in certain markets by acquiring a small number ofimproved lots with an option on additional lots. This allows us to minimize the economic costs and risks ofcarrying a large land inventory, while maintaining our ability to commence new developments during favorablemarket periods.
• Our option and purchase agreements are typically subject to numerous conditions, including, but not limited to,our ability to obtain necessary governmental approvals for the proposed community. Generally, the deposit onthe agreement will be returned to us if all approvals are not obtained, although predevelopment costs may notbe recoverable. By paying an additional, nonrefundable deposit, we have the right to extend a significantnumber of our options for varying periods of time. In most instances, we have the right to cancel any of ourland option agreements by forfeiture of our deposit on the agreement. In such instances, we generally are notable to recover any predevelopment costs. As land becomes more scarce, the conditions required by sellers arebecoming more stringent.
4

HOVNANIAN ENTERPRISES, INC. AND SUBSIDIARIES
Design—Our residential communities are generally located in suburban areas easily accessible through publicand personal transportation. Our communities are designed as neighborhoods that fit existing landcharacteristics. We strive to create diversity within the overall planned community by offering a mix of homeswith differing architecture, textures and colors. Recreational amenities such as swimming pools, tennis courts,club houses and tot lots are frequently included.
Construction—We design and supervise the development and building of our communities. Our homes areconstructed according to standardized prototypes which are designed and engineered to provide innovativeproduct design while attempting to minimize costs of construction. We generally employ subcontractors for theinstallation of site improvements and construction of homes. Agreements with subcontractors are generally shortterm and provide for a fixed price for labor and materials. We rigorously control costs through the use ofcomputerized monitoring systems. Because of the risks involved in speculative building, our general policy is toconstruct an attached condominium or townhouse building only after signing contracts for the sale of at least 50%of the homes in that building. For our mid-rise and high-rise buildings our general policy is to begin buildingafter signing contracts for the sale of at least 40% of the homes in that building. A majority of our single familydetached homes are constructed after the signing of a sales contract and mortgage approval has been obtained.This limits the build-up of inventory of unsold homes and the costs of maintaining and carrying that inventory.
Materials and Subcontractors—We attempt to maintain efficient operations by utilizing standardized materialsavailable from a variety of sources. In addition, we generally contract with subcontractors to construct our homes.We have reduced construction and administrative costs by consolidating the number of vendors serving certainmarkets and by executing national purchasing contracts with select vendors. In most instances, we use generalcontractors for high-rise construction. In recent years, we have experienced no significant construction delaysdue to shortages of materials or labor. We cannot predict, however, the extent to which shortages in necessarymaterials or labor may occur in the future.
Marketing and Sales—Our residential communities are sold principally through on-site sales offices. In order torespond to our customers’ needs and trends in housing design, we rely upon our internal market research groupto analyze information gathered from, among other sources, buyer profiles, exit interviews at model sites, focusgroups and demographic data bases. We make use of newspaper, radio, magazine, our website, billboard, videoand direct mail advertising, special promotional events, illustrated brochures, full-sized and scale model homes inour comprehensive marketing program. In addition, we have opened home design galleries in our New Jersey,Virginia, Maryland, Texas, North Carolina, and portions of our California markets, which offer a wide range ofcustomer options to satisfy individual customer tastes, and which have increased option sales and profitability inthese markets.
Customer Service and Quality Control—In many of our markets, associates are responsible for customer serviceand participate in pre-closing quality control inspections as well as responding to post-closing customer needs.Prior to closing, each home is inspected and any necessary completion work is undertaken by us. In some of ourmarkets, our homes are enrolled in a standard limited warranty program which, in general, provides ahomebuyer with a one-year warranty for the home’s materials and workmanship, a two-year warranty for thehome’s heating, cooling, ventilating, electrical and plumbing systems and a ten-year warranty for major structuraldefects. All of the warranties contain standard exceptions, including, but not limited to, damage caused by thecustomer.
Customer Financing—We sell our homes to customers who generally finance their purchases through mortgages.During the year ended October 31, 2004, for the markets in which our mortgage subsidiaries originated loans,8.8% of our homebuyers paid in cash and over 66.1% of our non-cash homebuyers obtained mortgages from oneof our wholly-owned mortgage banking subsidiaries or our mortgage joint venture in California. Mortgagesoriginated by our wholly-owned mortgage banking subsidiaries are sold in the secondary market.
5
HOVNANIAN ENTERPRISES, INC. AND SUBSIDIARIES
Code of Ethics—For more than 40 years of doing business, we have been committed to sustaining ourshareholders’ investment through conduct that is in accordance with the highest levels of integrity. Our Code ofEthics is a collection of guidelines and policies that govern broad principles of ethical conduct and integrityembraced by our Company. Our associates are required to comply with these standards when interacting witheach other, our business partners, our customers, our shareholders, and our competitors. The Company’s Code ofEthics is available on the Company’s website at www.khov.com under ‘‘Investor Relations/Governance/Code ofEthics’’.
We also remain committed to our shareholders in fostering sound corporate governance principles. The Companyhas adopted ‘‘Corporate Governance Guidelines’’ to assist the Board in fulfilling its responsibilities related tocorporate governance conduct. These guidelines serve as a framework, addressing the function, structure, andoperations of the Board, for purposes of promoting consistency of the Board’s role in overseeing the work ofmanagement.
RESIDENTIAL DEVELOPMENT ACTIVITIESOur residential development activities include evaluating and purchasing properties, master planning, obtaininggovernmental approvals and constructing, marketing and selling homes. A residential development generallyincludes single family detached homes and/or a number of residential buildings containing from two totwenty-four individual homes per building, together with amenities such as recreational buildings, swimmingpools, tennis courts and open areas. In a few cases, we are developing mid-rise and high-rise buildings includingsome that contain over 300 homes per building.
Our development activities include site planning and engineering, obtaining environmental and other regulatoryapprovals and constructing roads, sewer, water and drainage facilities, recreational facilities and other amenities.These activities are performed by our staff, together with independent architects, consultants and contractors.Our staff also carries out long-term planning of communities.
Current base prices for our homes in contract backlog at October 31, 2004 range from $46,000 to $1,350,000 in ourNortheast Region, from $96,000 to $986,000 in our Southeast Region, from $83,000 to $467,000 in our SouthwestRegion, and from $154,000 to $1,110,000 in our West Region. Closings generally occur and are typically reflectedin revenues up to twelve months after sales contracts are signed.
Information on homes delivered by Region for the year ended October 31, 2004 is set forth below:
(Housing Revenue in Thousands) Housing Revenues Homes Delivered Average Price
Northeast Region $1,027,356 3,188 $322,257
Southeast Region 1,066,474 3,976 $268,228
Southwest Region 681,083 3,875 $175,763
West Region 1,307,350 3,547 $368,579
Combined Total $4,082,263 14,586 $279,875
The value of our net sales contracts, including unconsolidated joint ventures, increased 48.3% to $4.9 billion forthe year ended October 31, 2004 from $3.3 billion for the year ended October 31, 2003. This increase was the netresult of a 30.7% increase in the number of homes contracted to 16,148 in 2004 from 12,352 in 2003. By region, ona dollar basis, the Northeast Region increased 33.7%, the Southeast Region increased 33.8%, the SouthwestRegion increased 40.3% and the West Region increased 54.4%. Excluding homebuidling acquisitions made in fiscal2004 and 2003, the value of our net contracts increased in all of our regions and we continue to experience soliddemand for new homes in all our markets. Increases were due to increased sales and increased sales prices in allof our regions except in our Southwest Region, where sales prices decreased slightly due to a shift in our mix ofcommunities to those with more entry level homes, and in our Southeast Region where the number of homescontracted decreased slightly due to timing of opening new communities.
6

HOVNANIAN ENTERPRISES, INC. AND SUBSIDIARIES
The following table summarizes our active selling communities under development as of October 31, 2004. Thecontracted not delivered and remaining home sites available in our active communities under development areincluded in the 99,940 total home sites under the total residential real estate chart in Item 7 ‘‘Management’sDiscussion and Analysis of Financial Condition and Results of Operations’’.
Active Selling Communities
Contracted RemainingApproved Homes Not Home Sites
Communities Home Sites Delivered Delivered(1) Available(2)
Northeast Region 28 12,529 5,366 1,799 5,364
Southeast Region 113 21,642 9,518 1,981 10,143
Southwest Region 85 17,211 6,352 924 9,935
West Region 49 18,590 7,313 1,917 9,360
Total 275 69,972 28,549 6,621 34,802
(1) Includes 887 home sites under option and excludes 931 contracts under our ‘‘build on your own lot’’program.
(2) Of the total remaining home sites available, 1,623 were under construction or completed (including 312models and sales offices), 19,823 were under option, and 415 were financed through purchase moneymortgages.
BACKLOGAt October 31, 2004 and October 31, 2003, including unconsolidated joint ventures, we had a backlog of signedcontracts for 7,851 homes and 5,797 homes, respectively, with sales values aggregating $2.7 billion and$1.5 billion, respectively. Substantially all of our backlog at October 31, 2004 is expected to be completed andclosed within the next twelve months. At November 30, 2004 and 2003, our backlog of signed contracts was 7,972homes and 6,598 homes, respectively, with sales values aggregating $2.8 billion and $1.8 billion, respectively.
Sales of our homes typically are made pursuant to a standard sales contract that provides the customer with astatutorily mandated right of rescission for a period ranging up to 15 days after execution. This contract requiresa nominal customer deposit at the time of signing. In addition, in the Northeast Region, excluding Ohio, and theSoutheast Region, excluding Florida, we typically obtain an additional 5% to 10% down payment due 30 to 60 daysafter signing. The contract may include a financing contingency, which permits the customer to cancel hisobligation in the event mortgage financing at prevailing interest rates (including financing arranged or providedby us) is unobtainable within the period specified in the contract. This contingency period typically is four toeight weeks following the date of execution. In markets with significant investor demand, our Company’s policystates that sales contracts include an investor restriction on resale of homes for a stipulated time period, if thehome is not occupied by the purchaser. Sales contracts are included in backlog once the sales contract is signedby the customer, which in some cases includes contracts that are in the rescission or cancellation periods.However, revenues from sales of homes are recognized in the income statement, in accordance with ouraccounting policies, when title to the home is conveyed to the buyer, adequate cash payment has been receivedand there is no continued involvement.
RESIDENTIAL LAND INVENTORYIt is our objective to control a supply of land, primarily through options, consistent with anticipated homebuildingrequirements in each of our housing markets. Controlled land as of October 31, 2004, exclusive of communitiesunder development described above under ‘‘Residential Development Activities’’, is summarized in the followingtable. The proposed developable lots in communities under development are included in the 99,940 total home
7
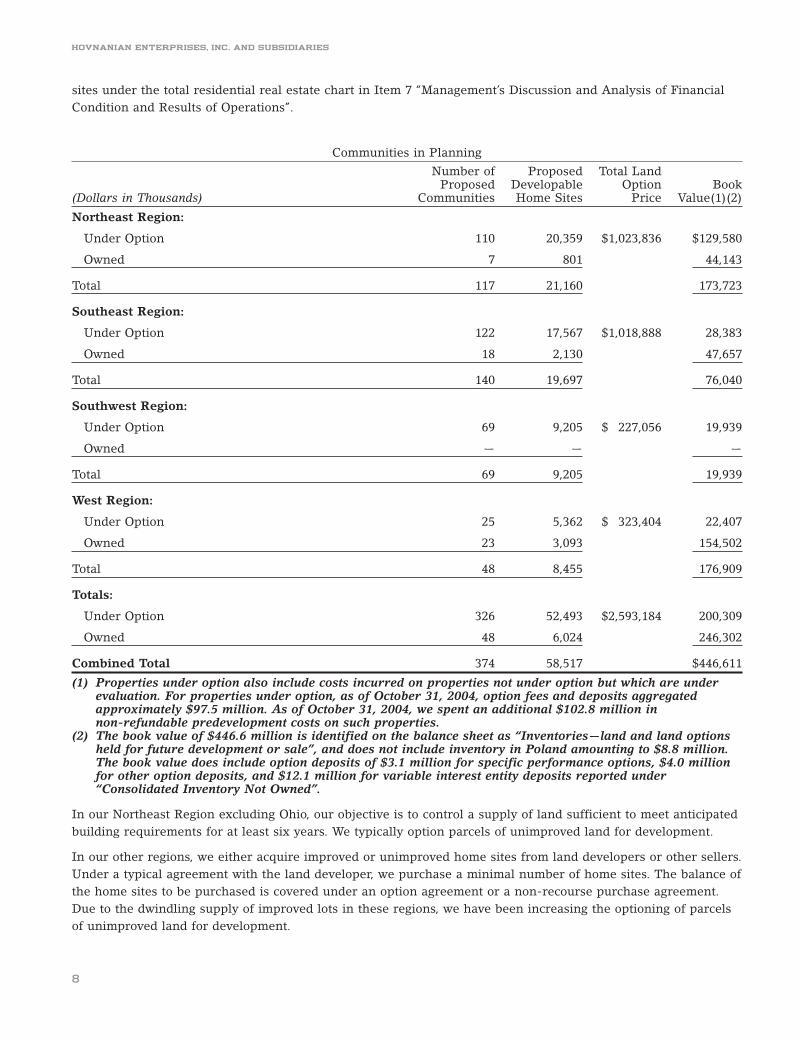
HOVNANIAN ENTERPRISES, INC. AND SUBSIDIARIES
sites under the total residential real estate chart in Item 7 ‘‘Management’s Discussion and Analysis of FinancialCondition and Results of Operations’’.
Communities in Planning
Number of Proposed Total LandProposed Developable Option Book
(Dollars in Thousands) Communities Home Sites Price Value(1)(2)
Northeast Region:
Under Option 110 20,359 $1,023,836 $129,580
Owned 7 801 44,143
Total 117 21,160 173,723
Southeast Region:
Under Option 122 17,567 $1,018,888 28,383
Owned 18 2,130 47,657
Total 140 19,697 76,040
Southwest Region:
Under Option 69 9,205 $ 227,056 19,939
Owned — — —
Total 69 9,205 19,939
West Region:
Under Option 25 5,362 $ 323,404 22,407
Owned 23 3,093 154,502
Total 48 8,455 176,909
Totals:
Under Option 326 52,493 $2,593,184 200,309
Owned 48 6,024 246,302
Combined Total 374 58,517 $446,611
(1) Properties under option also include costs incurred on properties not under option but which are underevaluation. For properties under option, as of October 31, 2004, option fees and deposits aggregatedapproximately $97.5 million. As of October 31, 2004, we spent an additional $102.8 million innon-refundable predevelopment costs on such properties.
(2) The book value of $446.6 million is identified on the balance sheet as ‘‘Inventories—land and land optionsheld for future development or sale’’, and does not include inventory in Poland amounting to $8.8 million.The book value does include option deposits of $3.1 million for specific performance options, $4.0 millionfor other option deposits, and $12.1 million for variable interest entity deposits reported under‘‘Consolidated Inventory Not Owned’’.
In our Northeast Region excluding Ohio, our objective is to control a supply of land sufficient to meet anticipatedbuilding requirements for at least six years. We typically option parcels of unimproved land for development.
In our other regions, we either acquire improved or unimproved home sites from land developers or other sellers.Under a typical agreement with the land developer, we purchase a minimal number of home sites. The balance ofthe home sites to be purchased is covered under an option agreement or a non-recourse purchase agreement.Due to the dwindling supply of improved lots in these regions, we have been increasing the optioning of parcelsof unimproved land for development.
8

HOVNANIAN ENTERPRISES, INC. AND SUBSIDIARIES
CUSTOMER FINANCINGAt our communities, on-site personnel facilitate sales by offering to arrange financing for prospective customersthrough our mortgage subsidiaries. We believe that our ability to offer financing to customers on competitiveterms as a part of the sales process is an important factor in completing sales.
Our financial services business consists of providing our customers with competitive financing and coordinatingand expediting the loan origination transaction through the steps of loan application, loan approval and closing.We originate loans in New Jersey, New York, Pennsylvania, Maryland, Washington D. C., Virginia, West Virginia,North Carolina, South Carolina, Texas, Ohio, and California. During the year ended October 31, 2004, for themarkets in which our mortgage subsidiaries originate loans, approximately 8.8% of our homebuyers paid in cashand over 66.1% of our non-cash homebuyers obtained mortgages from one of our wholly-owned mortgagebanking subsidiaries or our mortgage joint venture in California.
We customarily sell virtually all of the loans and loan servicing rights that we originate. Loans are sold eitherindividually or in pools to GNMA, FNMA, or FHLMC or against forward commitments to institutional investors,including banks, mortgage banking firms, and savings and loan associations.
COMPETITIONOur residential business is highly competitive. We are among the top ten homebuilders in the United States inboth homebuilding revenues and home deliveries. We compete with numerous real estate developers in each ofthe geographic areas in which we operate. Our competition ranges from small local builders to larger regionaland publicly owned builders and developers, some of which have greater sales and financial resources than us.Previously owned homes and the availability of rental housing provide additional competition. We competeprimarily on the basis of reputation, price, location, design, quality, service and amenities.
REGULATION AND ENVIRONMENTAL MATTERSGeneral. We are subject to various local, state and federal statutes, ordinances, rules and regulations concerningzoning, building design, construction and similar matters, including local regulations which impose restrictivezoning and density requirements in order to limit the number of homes that can eventually be built within theboundaries of a particular locality. In addition, we are subject to registration and filing requirements inconnection with the construction, advertisement and sale of our communities in certain states and localities inwhich we operate even if all necessary government approvals have been obtained. We may also be subject toperiodic delays or may be precluded entirely from developing communities due to building moratoriums thatcould be implemented in the future in the states in which we operate. Generally, such moratoriums relate toinsufficient water or sewerage facilities or inadequate road capacity.
Environmental. We are also subject to a variety of local, state and federal statutes, ordinances, rules andregulations concerning protection of health and the environment (‘‘environmental laws’’). The particularenvironmental laws which apply to any given community vary greatly according to the community site, the site’senvironmental conditions and the present and former uses of the site. These environmental laws may result indelays, may cause us to incur substantial compliance and other costs, and prohibit or severely restrictdevelopment in certain environmentally sensitive regions or areas.
Conclusion. Despite our past ability to obtain necessary permits and approvals for our communities, weanticipate that increasingly stringent requirements will be imposed on developers and homebuilders in thefuture. Although we cannot predict the effect of these requirements, they could result in time-consuming andexpensive compliance programs and substantial expenditures for pollution and water quality control, which couldhave a material adverse effect on our profitability. In addition, the continued effectiveness of permits alreadygranted or approvals already obtained is dependent upon many factors, some of which are beyond our control,such as changes in policies, rules and regulations and their interpretation and application.
9

HOVNANIAN ENTERPRISES, INC. AND SUBSIDIARIES
COMPANY OFFICESWe own a 24,000 square foot office complex located in the Northeast Region that serves as our corporateheadquarters. We are in the process of building a 69,000 square foot office complex near our currentheadquarters and anticipate moving in the Spring of 2005. We also own 224,405 square feet of office andwarehouse space throughout our Northeast Region and 6,846 square feet of office space in our Southeast Region.We lease approximately 443,382 square feet of space for our other operating divisions located in our NortheastRegion, Southeast Region, Southwest Region and West Region.
Item 3 - Legal Proceedings
We are involved in litigation arising in the ordinary course of business, none of which is expected to have amaterial adverse effect on us. Over the past several years, general liability insurance for homebuilding companiesand their suppliers and subcontractors has become very difficult to obtain. The availability of general liabilityinsurance has been limited due to a decreased number of insurance companies willing to write for the industry.In addition, those few insurers willing to write liability insurance have significantly increased the premium costs.We have been able to obtain general liability insurance but at higher premium costs with higher deductibles.While no assurance can be given, we believe that we will be able to continue to obtain coverage but at highertotal costs. Our suppliers and subcontractors have advised us that they have also had difficulty obtaininginsurance that also provides us coverage. As a result, we have introduced an owner controlled insurance programfor certain of our subcontractors, whereby the subcontractors pay us an insurance premium based on the value oftheir services, and we absorb the liability associated with their work on our homes. All such insurance premiumspaid by our subcontractors are included in our reserves.
10
HOVNANIAN ENTERPRISES, INC. AND SUBSIDIARIES
Item 4 - Submission of Matters to a Vote of Security HoldersDuring the fourth quarter of the fiscal year ended October 31, 2004, no matters were submitted to a vote ofsecurity holders.
PART II
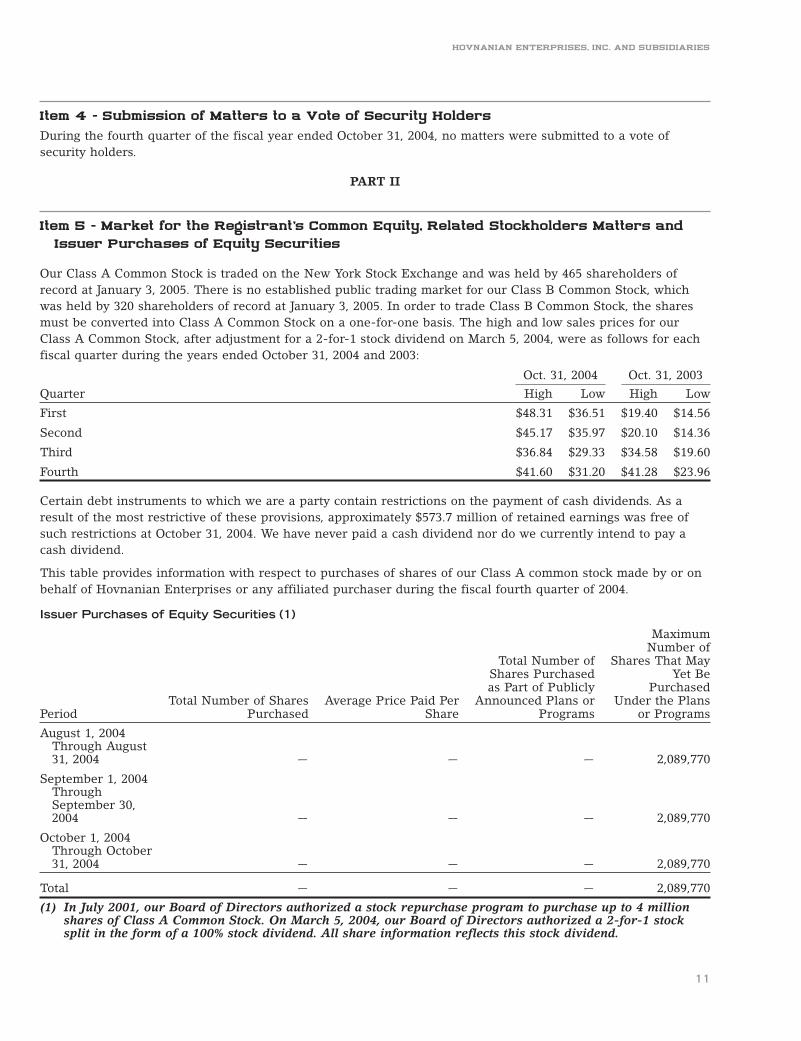
Item 5 - Market for the Registrant’s Common Equity, Related Stockholders Matters andIssuer Purchases of Equity Securities
Our Class A Common Stock is traded on the New York Stock Exchange and was held by 465 shareholders ofrecord at January 3, 2005. There is no established public trading market for our Class B Common Stock, whichwas held by 320 shareholders of record at January 3, 2005. In order to trade Class B Common Stock, the sharesmust be converted into Class A Common Stock on a one-for-one basis. The high and low sales prices for ourClass A Common Stock, after adjustment for a 2-for-1 stock dividend on March 5, 2004, were as follows for eachfiscal quarter during the years ended October 31, 2004 and 2003:
Oct. 31, 2004 Oct. 31, 2003
Quarter High Low High Low
First $48.31 $36.51 $19.40 $14.56
Second $45.17 $35.97 $20.10 $14.36
Third $36.84 $29.33 $34.58 $19.60
Fourth $41.60 $31.20 $41.28 $23.96
Certain debt instruments to which we are a party contain restrictions on the payment of cash dividends. As aresult of the most restrictive of these provisions, approximately $573.7 million of retained earnings was free ofsuch restrictions at October 31, 2004. We have never paid a cash dividend nor do we currently intend to pay acash dividend.
This table provides information with respect to purchases of shares of our Class A common stock made by or onbehalf of Hovnanian Enterprises or any affiliated purchaser during the fiscal fourth quarter of 2004.
Issuer Purchases of Equity Securities (1)
MaximumNumber of
Total Number of Shares That MayShares Purchased Yet Beas Part of Publicly Purchased
Total Number of Shares Average Price Paid Per Announced Plans or Under the PlansPeriod Purchased Share Programs or Programs
August 1, 2004Through August31, 2004 — — — 2,089,770
September 1, 2004ThroughSeptember 30,2004 — — — 2,089,770
October 1, 2004Through October31, 2004 — — — 2,089,770
Total — — — 2,089,770
(1) In July 2001, our Board of Directors authorized a stock repurchase program to purchase up to 4 millionshares of Class A Common Stock. On March 5, 2004, our Board of Directors authorized a 2-for-1 stocksplit in the form of a 100% stock dividend. All share information reflects this stock dividend.
11

HOVNANIAN ENTERPRISES, INC. AND SUBSIDIARIES
No shares of our Class B common stock were purchased by or on behalf of Hovnanian Enterprises or anyaffiliated purchaser during the fiscal fourth quarter of 2004.
Item 6 - Selected Consolidated Financial Data
The following table sets forth selected consolidated financial data and should be read in conjunction with thefinancial statements included elsewhere in this Form 10-K. Per common share data and weighted averagenumber of common shares outstanding reflect all stock splits.
Year EndedSummary ConsolidatedIncome Statement Data October October October October October(In Thousands, Except Per Share Data) 31, 2004 31, 2003 31, 2002 31, 2001 31, 2000
Revenues $4,160,403 $3,201,857 $2,551,106 $1,741,990 $1,135,559Expenses 3,610,631 2,790,339 2,325,376 1,635,636 1,083,741Income before income taxes 549,772 411,518 225,730 106,354 51,818State and Federal income taxes 201,091 154,138 88,034 42,668 18,655Net income $ 348,681 $ 257,380 $ 137,696 $ 63,686 $ 33,163
Per Share Data:Basic:
Net income $ 5.63 $ 4.16 $ 2.26 $ 1.19 $ 0.76Weighted average number of common
shares outstanding 61,892 61,920 60,810 53,620 43,866Assuming Dilution:
Net income $ 5.35 $ 3.93 $ 2.14 $ 1.15 $ 0.75Weighted average number of common
shares outstanding 65,133 65,538 64,310 55,584 44,086
Summary ConsolidatedBalance Sheet Data October October October October October(In Thousands) 31, 2004 31, 2003 31, 2002 31, 2001 31, 2000
Total assets $3,156,267 $2,332,371 $1,678,128 $1,064,258 $873,541Mortgages, term loans, revolving credit
agreements, and notes payable $ 354,055 $ 326,216 $ 215,365 $ 111,795 $ 78,206Senior notes, and senior subordinated
notes $ 902,737 $ 687,166 $ 546,390 $ 396,544 $396,430Stockholders’ equity $1,192,394 $ 819,712 $ 562,549 $ 375,646 $263,359
Ratios of Earnings to Fixed Charges
For purposes of computing the ratio of earnings to fixed charges, earnings consist of earnings from continuingoperations before income taxes, plus fixed charges, less interest capitalized. Fixed charges consist of all interestincurred plus the amortization of debt issuance costs and bond discount.
The following table sets forth the ratios of earnings to fixed charges for each of the periods indicated:
Years Ended October 31,
2004 2003 2002 2001 2000
Ratio of earnings to fixed charges 6.3 6.7 4.7 3.1 2.1
12
HOVNANIAN ENTERPRISES, INC. AND SUBSIDIARIES
Item 7 - Management’s Discussion and Analysis of Financial Condition and Results ofOperations
CRITICAL ACCOUNTING POLICIESManagement believes that the following critical accounting policies affect its more significant judgments andestimates used in the preparation of its Consolidated Financial Statements:
Business Combinations—When we make an acquisition of another company, we use the purchase method ofaccounting in accordance with the Statement of Financial Accounting Standards No. 141 ‘‘Business Combinations’’(‘‘SFAS 141’’). Under SFAS 141 (for acquisitions subsequent to June 30, 2001) and Accounting Principles Board(‘‘APB’’) Opinion 16 (for acquisitions prior to June 30, 2001), we record as our cost the estimated fair value of theacquired assets less liabilities assumed. Any difference between the cost of an acquired company and the sum ofthe fair values of tangible and intangible assets less liabilities is recorded as goodwill. The reported income of anacquired company includes the operations of the acquired company from the date of acquisition.
Income Recognition from Home and Land Sales—Income from home and land sales is recorded when title isconveyed to the home or land buyer, adequate cash payment has been received and there is no continuedinvolvement.
Income Recognition from Mortgage Loans—Profits and losses relating to the sale of mortgage loans are recognizedwhen legal control passes to the buyer of the mortgage and the sales price is collected.
Interest Income Recognition for Mortgage Loans Receivable and Recognition of Related Deferred Fees and Costs—Interest income is recognized as earned for each mortgage loan during the period from the loan closing date tothe sale date when legal contract passes to the buyer and the sale price is collected. All fees related to theorigination of mortgage loans and direct loan origination costs are deferred and recorded as either (a) anadjustment to the related mortgage loans upon the closing of a loan or (b) recognized as a deferred asset ordeferred revenue while the loan is in process. These fees and costs include loan origination fees, loan discount,and salaries and wages. Such deferred fees and costs relating to the closed loans are recognized over the life ofthe loans as an adjustment of yield or taken into operations under sale of the loan to a permanent investor.
Inventories—Inventories and long-lived assets held for sale are recorded at the lower of cost or fair value lessselling costs. Fair value is defined as the amount at which an asset could be bought or sold in a currenttransaction between willing parties, that is, other than in a forced or liquidation sale. Construction costs areaccumulated during the period of construction and charged to cost of sales under specific identification methods.Land, land development, and common facility costs are allocated based on buildable acres to product types withineach community, then charged to cost of sales equally based upon the number of homes to be constructed ineach product type. For inventories of communities under development, a loss is recorded when events andcircumstances indicate impairment and the undiscounted future cash flows generated are less than the relatedcarrying amounts. The impairment loss is based on discounted future cash flows generated from expectedrevenue, cost to complete including interest, and selling costs.
Insurance Deductible Reserves—Our deductible is $150,000 per occurrence for worker’s compensation and generalliability insurance. Reserves have been established based upon actuarial analysis of estimated future lossesduring 2004 and 2003. For fiscal 2005, our deductible increases to $5 million per occurrence for general liabilityinsurance and $500,000 per occurrence for worker’s compensation insurance.
Interest—Costs related to properties under development are capitalized during the land development and homeconstruction period and expensed as cost of sales interest as the related inventories are sold. Costs related toproperties not under development are charged to interest expense separately in the Consolidated Statements ofIncome.
13
HOVNANIAN ENTERPRISES, INC. AND SUBSIDIARIES
Land Options—Costs are capitalized when incurred and either included as part of the purchase price when theland is acquired or charged to operations when we determine we will not exercise the option. In accordance withFinancial Accounting Standards Board (‘‘FASB’’) Interpretation No. 46 (‘‘FIN 46’’) ‘‘Consolidation of VariableInterest Entities’’ an interpretation of Accounting Research Bulletin No. 51, SFAS No. 49 ‘‘Accounting for ProductFinancing Arrangements’’ (‘‘SFAS 49’’), SFAS No. 98 ‘‘Accounting for Leases’’ (‘‘SFAS 98’’), and Emerging IssuesTask Force (‘‘EITF’’) No. 97-10 ‘‘The Effects of Lessee Involvement in Asset Construction’’ (‘‘EITF 97-10’’), werecord on the Consolidated Balance Sheets specific performance options, options with variable interest entities,and other options under Consolidated inventory not owned with the offset to Liabilities from inventory notowned, Minority interest from inventory not owned and Minority interest from consolidated joint ventures.
Intangible Assets—The intangible assets recorded on our balance sheet are goodwill, tradenames, architecturaldesigns, distribution processes, and contractual agreements with both definite and indefinite lives resulting fromcompany acquisitions. We no longer amortize goodwill or indefinite life intangibles, but instead assess themperiodically for impairment. We performed such assessments utilizing a fair value approach as of October 31,2004 and 2003, and determined that no impairment of intangibles existed. We are amortizing the definite lifeintangibles over their expected useful life, ranging from three to seven years.
In May 2004, we made a decision to change our fiscal 2002 California acquisition brand name to K. HovnanianHomes. This resulted in a reclassification of $50 million from goodwill and indefinite life intangibles to definitelife intangibles less amortization reported on our October 31, 2004 Consolidated Balance Sheet. We areamortizing the definite life intangible as the homes in the communities still using the old California acquisitionbrand name are delivered to customers and the revenue on the sale of these homes is recognized. Using thismethodology, we expect this intangible to be substantially written off by our fourth quarter of 2008.
Post Development Completion Costs—In those instances where a development is substantially completed and soldand we have additional construction work to be incurred, an estimated liability is provided to cover the cost ofsuch work and is recorded in accounts payable and other liabilities in the Consolidated Balance Sheets.
Warranty Costs—Based upon historical experience, we accrue warranty costs as part of cost of sales for essentialrepair costs over $1,000 to homes, community amenities and land development infrastructure. In addition, weaccrue for warranty costs under our $150,000 per occurrence general liability insurance deductible as part ofselling, general and administrative costs.
CAPITAL RESOURCES AND LIQUIDITY
Our operations consist primarily of residential housing development and sales in our Northeast Region (NewJersey, southern New York, Pennsylvania, Ohio, Michigan, and Minnesota), our Southeast Region (WashingtonD.C., Delaware, Maryland, Virginia, West Virginia, North Carolina, South Carolina, and Florida), our SouthwestRegion (Texas and Arizona), and our West Region (California). During the year ended October 31, 2002, wesubstantially liquidated our operations in the Mid-South from our fiscal 2001 acquisition of Washington Homes.In addition, we provide financial services to our homebuilding customers.
Our cash uses during the twelve months ended October 31, 2004 were for operating expenses, increases inhousing inventories, construction, income taxes, interest, the payoff of our $115 million Term Loan, theredemption of Senior Notes due 2009, the repurchase of common stock, and the acquisition of a Floridahomebuilder. We provided for our cash requirements from housing and land sales, the revolving credit facility,non-recourse mortgage secured by operating property, the issuance of $365 million Senior Notes, financial servicerevenues, and other revenues. We believe that these sources of cash are sufficient to finance our working capitalrequirements and other needs.
Cash requirements for fiscal 2005 are projected to increase as we continue to open new communities and fundorganic growth. We anticipate moderate usage under the existing revolving credit facility to replenish inventoryassociated with the construction of new homes. On November 30, 2004, we issued $200 million of 61⁄4% SeniorNotes due 2015 and $100 million of 6% Senior Subordinated Notes due 2010 which generated proceeds of
14

HOVNANIAN ENTERPRISES, INC. AND SUBSIDIARIES
approximately $300 million. The purpose of these issuances was to repay amounts outstanding under ourrevolving credit facility, and for general corporate purposes.
Our net income historically does not approximate cash flow from operating activities. The difference between netincome and cash flow from operating activities is primarily caused by changes in receivables, prepaid and otherassets, interest and other accrued liabilities, accounts payable, inventory levels, mortgage loans and liabilities, andnon-cash charges relating to depreciation, the write-off of computer software costs, amortization of definite lifeintangibles and impairment losses. When we are expanding our operations, which was the case in fiscal 2004 and2003, inventory levels, receivables, prepaids and other assets increase causing cash flow from operating activitiesto decrease. Liabilities also increase as operations expand. The increase in liabilities partially offsets the negativeeffect on cash flow from operations caused by the increase in inventory levels, receivables, prepaids and otherassets. Similarly, as our mortgage operations expand, net income from these operations increase, but for cashflow purposes are offset by the net change in mortgage assets and liabilities.
On July 3, 2001, our Board of Directors authorized a stock repurchase program to purchase up to 4 million sharesof Class A Common Stock. As of October 31, 2004, 1.9 million shares have been purchased under this program, ofwhich 0.1 million and 0.6 million shares were repurchased during the twelve months ended October 31, 2004 and2003, respectively. In addition, in 2003, we retired at no cost 1.5 million shares that were held by a seller of aprevious acquisition. On March 5, 2004, our Board of Directors authorized a 2-for-1 stock split in the form of a100% stock dividend. All share information reflects this stock dividend.
Our homebuilding bank borrowings are made pursuant to an amended and restated unsecured revolving creditagreement (the ‘‘Agreement’’) that provides a revolving credit line and letter of credit line of $900 million throughJuly 2008. The facility contains an accordion feature under which the aggregate commitment can be increased to$1.0 billion subject to the availability of additional commitments. Interest is payable monthly at various rates ofeither the prime rate or a spread over LIBOR ranging from 1.10% to 2.00% per annum, depending on ourconsolidated Leverage Ratio, as defined in the Agreement. In addition, we pay a fee ranging from 0.20% to 0.40%per annum, depending on our consolidated Leverage Ratio and the weighted average unused portion of therevolving credit line. At October 31, 2004, there was $115 million drawn under this Agreement and we hadapproximately $65 million of homebuilding cash. At October 31, 2004, we had issued $180.6 million of letters ofcredit which reduces cash available under the Agreement. We believe that we will be able either to extend theAgreement beyond July 2008 or negotiate a replacement facility, but there can be no assurance of such extensionor replacement facility. We currently are in compliance and intend to maintain compliance with the covenantsunder the Agreement. Each of our significant subsidiaries, except for our title insurance and home mortgagesubsidiaries and joint ventures, is a guarantor under the Agreement.
At October 31, 2004, we had $605.3 million of outstanding senior debt ($602.7 million, net of discount), comprisedof $140.3 million 101⁄2% Senior Notes due 2007, $100 million 8% Senior Notes due 2012, $215 million 61⁄2% SeniorNotes due 2014, and $150 million 63⁄8% Senior Notes due 2014. At October 31, 2004, we had outstanding$300 million of senior subordinated debt comprised of $150 million 87⁄8% Senior Subordinated Notes due 2012,and $150 million 73⁄4% Senior Subordinated Notes due 2013. On November 30, 2004, we issued $200 million of61⁄4% Senior Notes due 2015 and $100 million of 6% Senior Subordinated Notes due 2010. Each of our whollyowned subsidiaries, except for K. Hovnanian Enterprises, Inc., the issuer of the senior and senior subordinatednotes, our title insurance and home mortgage subsidiaries, and joint ventures, is a guarantor of the senior notesand senior subordinated notes.
On May 3, 2004, we redeemed our 91⁄8% Senior Notes due 2009, and we recorded $8.7 million of expensesassociated with the extinguishment of this debt. On March 18, 2004, we paid off our $115 million Term Loan, andwe recorded $0.9 million of expenses associated with the extinguishment of the debt. In both cases, theseexpenses have been reported as ‘‘Expenses Related to Extinguishment of Debt’’ on the Consolidated Statementsof Income.
15

HOVNANIAN ENTERPRISES, INC. AND SUBSIDIARIES
Our mortgage banking subsidiary’s warehousing agreement was amended on August 3, 2004. Pursuant to theagreement, we may borrow up to $250 million. The agreement expires in July 2005 and interest is payablemonthly at the Eurodollar rate plus 1.25%. We believe that we will be able either to extend this agreementbeyond July 2005 or negotiate a replacement facility, but there can be no assurance of such extension orreplacement facility. As of October 31, 2004, the aggregate principal amount of all borrowings under thisagreement was $188.4 million.
Total inventory increased $766.5 million during the twelve months ended October 31, 2004. This increaseexcluded the change in Consolidated Inventory Not Owned of $40.8 million consisting of specific performanceoptions, options with variable interest entities, and other options that were added to our balance sheet inaccordance with SFAS 49, SFAS 98, and EITF 97-10, and Variable Interest Entities in accordance with FIN 46.See the ‘‘Recent Accounting Pronouncements’’ section of ‘‘Management’s Discussion and Analysis of FinancialCondition and Results of Operations’’ for additional explanation of FIN 46. Excluding the impact fromacquisitions of $43.5 million in our Southeast Region, total inventory in our Northeast Region increased$79.7 million, the Southeast Region increased $91.1 million, the Southwest Region increased $44.0 million, andour West Region increased $508.2 million. The increase in our existing regions was primarily the result ofplanned future organic growth. Substantially all homes under construction or completed and included ininventory at October 31, 2004 are expected to be closed during the next twelve months. Most inventory completedor under development is financed through our line of credit, and senior subordinated indebtedness.
We usually option property for development prior to acquisition. By optioning property, we limit our financialexposure to the amounts invested in the option deposits and predevelopment costs. This significantly reduces ourrisk and generally allows us to obtain necessary development approvals before acquisition of the land.
The following table summarizes home sites included in our total residential real estate:
Contracted RemainingTotal Not Home Sites
Home Sites Delivered Available
October 31, 2004:
Northeast Region 28,323 1,799 26,524Southeast Region 31,821 1,981 29,840Southwest Region 20,064 924 19,140West Region 19,732 1,917 17,815Total 99,940 6,621 93,319
Owned 26,737 5,734 21,003Optioned 73,203 887 72,316Total 99,940 6,621 93,319
October 31, 2003:
Northeast Region 24,280 1,477 22,803Southeast Region 22,508 1,761 20,747Southwest Region 13,940 989 12,951West Region 13,570 793 12,777Total 74,298 5,020 69,278
Owned 21,470 4,213 17,257Optioned 52,828 807 52,021Total 74,298 5,020 69,278
Housing under contract at October 31, 2004 and October 31, 2003 was 7,552 homes and 5,761 homes, respectively,including our ‘‘build on your own lot’’ contracts and excluding unconsolidated joint ventures not included in theabove home site table.
16

HOVNANIAN ENTERPRISES, INC. AND SUBSIDIARIES
The following table summarizes our started or completed unsold homes in active and substantially completedcommunities:
October 31, 2004 October 31, 2003Unsold Homes Models Total Unsold Homes Models Total
Northeast Region 77 39 116 130 44 174Southeast Region 222 35 257 207 32 239Southwest Region 683 78 761 557 94 651West Region 329 160 489 185 105 290Total 1,311 312 1,623 1,079 275 1,354
Receivables, deposits and notes increased $14.2 million to $56.8 million at October 31, 2004. The increase wasprimarily due to the timing of cash received from homes that closed during the last days of October. Receivablesfrom home revenues amounted to $17.6 million and $4.1 million at October 31, 2004 and 2003, respectively.
Prepaid expenses and other assets are as follows as of:
(In Thousands) October 31, 2004 October 31, 2003 Dollar Change
Prepaid project costs $ 48,695 $ 34,171 $14,524Investment in joint ventures 40,840 23,232 17,608Senior residential rental properties 8,830 9,118 (288)Other prepaids 16,632 15,985 647Other assets 19,459 24,019 (4,560)Total $134,456 $106,525 $27,931
Prepaid project costs consist of community specific expenditures that are used over the life of the community.Such prepaids are expensed as homes are delivered. The increase in prepaid project costs was primarily due tothe opening of new communities in all our regions. Investments in joint ventures increased as we entered intoseveral new joint ventures during the year ended October 31, 2004. Other than completion guarantees, no otherguarantees associated with unconsolidated joint ventures have been given. Also included in other prepaids andother assets are debt issuance fees, non-qualified associate benefit plan assets, and miscellaneous prepaids andassets.
At October 31, 2004, we had $32.7 million of goodwill. This amount resulted from company acquisitions prior tofiscal 2003. In May 2004, we made a decision to change our fiscal 2002 California acquisition brand name to K.Hovnanian Homes. This resulted in a reclassification of $50 million from goodwill and indefinite life intangiblesto definite life intangibles less amortization reported on our October 31, 2004 Consolidated Balance Sheet. We areamortizing the definite life intangible as the homes in the communities still using the old California acquisitionbrand name are delivered to customers and the revenue on the sale of these homes is recognized. Using thismethodology, we expect this intangible to be substantially written off by our fourth quarter of 2008.
Definite life intangibles increased $68.5 million to $125.5 million at October 31, 2004. This increase was the resultof our November 6, 2003 Florida acquisition, net of amortization expense, as well as the reclassification of$50 million related to the California acquisition brand name, net of amortization expense, as noted above. To theextent the acquisition price was greater than the book value of tangible assets which were stepped up to fairvalues, purchase price premiums were classified as intangibles. Professionals are hired to appraise all acquiredintangibles. Such appraisals resulted in all fiscal 2004 and 2003 acquisition premiums to be categorized asdefinite life intangibles. See the ‘‘Critical Accounting Policies’’ section of ‘‘Management’s Discussion and Analysisof Financial Condition and Results of Operations’’ for additional explanation of intangibles. For tax purposes allour intangibles, except those resulting from an acquisition classified as a tax free exchange, are being amortizedover 15 years.
Mortgage loans held for sale consist of residential mortgages receivable of which $209.2 million and$223.9 million at October 31, 2004 and October 31, 2003, respectively, are being temporarily warehoused and
17

HOVNANIAN ENTERPRISES, INC. AND SUBSIDIARIES
awaiting sale in the secondary mortgage market. The decrease in mortgage loans held for sale was due to theimprovement in the turnaround of mortgages sold. We may incur risk with respect to mortgages that becomedelinquent, but only to the extent the losses are not covered by mortgage insurance or resale value of the house.Historically, we have incurred minimal credit losses.
Accounts payable and other liabilities are as follows as of:
(In Thousands) October 31, 2004 October 31, 2003 Dollar Change
Accounts Payable $113,866 $ 68,935 $44,931Reserves 72,289 46,699 25,590Accrued expenses 28,016 27,064 952Accrued compensation 78,283 72,495 5,788Property secured by a mortgage 11,750 — 11,750Other liabilities 25,417 14,793 10,624Total $329,621 $229,986 $99,635
The increase in accounts payable and other liabilities was primarily due to increases in accounts payable,reserves, accrued compensation, property secured by a mortgage, and other liabilities. The increase in accountspayable was due to our November 2003 Florida acquisition as well as the opening of new communities in ourexisting markets. Our reserves increased in accordance with our general liability and workman’s compensationpolicies. The increase in accrued compensation was related to bonuses due to achieving higher profits. Propertysecured by a mortgage increased due to the consolidation of a property in our Northeast Region that was securedby a mortgage and subsequently replaced by a letter of credit and an increase in other liabilities was due to acash advance we received related to a structured lot option.
RESULTS OF OPERATIONSTOTAL REVENUES
Compared to the same prior period, revenues increased as follows:
Year Ended
(Dollars in Thousands) October 31, 2004 October 31, 2003 October 31, 2002
Homebuilding:Sale of homes $952,433 $667,735 $768,378Land sales and other revenues (2,890) (27,499) 31,396
Financial services 9,003 10,515 9,342Total change $958,546 $650,751 $809,116Total revenues percent change 29.9% 25.5% 46.4%
HOMEBUILDING
Compared to the same prior period, housing revenues increased $952.4 million or 30.4% for the year endedOctober 31, 2004, increased $667.7 million or 27.1% for the year ended October 31, 2003, and increased$768.4 million or 45.4% for the year ended October 31, 2002 as a result of both organic growth and through theacquisition of other homebuilders. Housing revenues are recorded at the time when title is conveyed to the buyer,adequate cash payment has been received and there is no continued involvement.
18

HOVNANIAN ENTERPRISES, INC. AND SUBSIDIARIES
Information on homes delivered by market area is set forth below:
Year Ended
(Housing Revenue in Thousands) October 31, 2004 October 31, 2003 October 31, 2002
Northeast Region(2):Housing Revenues $1,027,356 $ 774,209 $ 660,250Homes Delivered 3,188 2,387 2,144Average Price $ 322,257 $ 324,344 $ 307,952
Southeast Region(1):Housing Revenues $1,066,474 $ 682,210 $ 660,328Homes Delivered 3,976 2,720 2,806Average Price $ 268,228 $ 250,813 $ 235,327
Southwest Region(2):Housing Revenues $ 681,083 $ 481,634 $ 240,181Homes Delivered 3,875 2,431 1,033Average Price $ 175,763 $ 198,122 $ 232,508
West Region(3):Housing Revenues $1,307,350 $1,190,516 $ 852,373Homes Delivered 3,547 3,984 3,220Average Price $ 368,579 $ 298,824 $ 264,712
Other(4):Housing Revenues — $ 1,261 $ 48,963Homes Delivered — 9 311Average Price — $ 140,111 $ 157,437
Consolidated Total:Housing Revenues $4,082,263 $3,129,830 $2,462,095Homes Delivered 14,586 11,531 9,514Average Price $ 279,875 $ 271,427 $ 258,787
Unconsolidated Joint Ventures:Housing Revenues $ 36,555 $ 11,034 $ 9,384Homes Delivered 84 54 43Average Price $ 435,179 $ 204,340 $ 218,233
Total Including Unconsolidated Joint Ventures:Housing Revenues $4,118,818 $3,140,864 $2,471,479Homes Delivered 14,670 11,585 9,514Average Price $ 280,765 $ 271,115 $ 259,773
(1) October 31, 2004 includes deliveries from our Florida acquisition beginning on November 1, 2003.
(2) October 31, 2003 includes deliveries from our Texas, Ohio, and Arizona acquisitions beginning onNovember 1, 2002, January 1, 2003, April 1, 2003, and August 13, 2003, respectively.
(3) October 31, 2002 includes deliveries from our California acquisition beginning on January 10, 2002.
(4) Other includes operations from markets we have exited in recent years.
The increase in housing revenues during the year ended October 31, 2004 was primarily due to organic growthwithin our existing operations. Excluding acquisitions, housing revenues and average sales prices increased in allfour of our regions combined by 21.4% and 12.7%, respectively. Homes delivered, excluding acquisitions, increased14.1%, 20.5%, and 25.5% in our Northeast Region, Southeast Region, and Southwest Region, respectively. In ourWest Region, deliveries declined 11.0% due to severe weather conditions during 2004 in Southern California.
19

HOVNANIAN ENTERPRISES, INC. AND SUBSIDIARIES
Unaudited quarterly housing revenues and net sales contracts by region for the years ending October 31, 2004,2003, and 2002 are set forth below:
Quarter Ended
October July April January(In Thousands) 31, 2004 31, 2004 30, 2004 31, 2004
Housing Revenues:Northeast Region $ 365,358 $ 261,470 $ 208,620 $191,908Southeast Region 349,532 272,395 253,485 191,062Southwest Region 217,214 181,491 154,564 127,814West Region 447,333 329,254 284,274 246,489
Consolidated Total $1,379,437 $1,044,610 $ 900,943 $757,273
Sales Contracts (Net of Cancellations):Northeast Region $ 333,961 $ 267,692 $ 307,127 $203,484Southeast Region 274,818 293,707 351,922 241,067Southwest Region 170,958 179,232 202,748 121,177West Region 426,910 507,214 533,685 299,020
Consolidated Total $1,206,647 $1,247,845 $1,395,482 $864,748
Quarter Ended
October July April January(In Thousands) 31, 2003 31, 2003 30, 2003 31, 2003
Housing Revenues:Northeast Region $ 279,252 $210,039 $148,155 $136,763Southeast Region 202,345 165,583 156,162 158,120Southwest Region 151,406 129,907 106,767 72,662West Region 392,039 325,205 255,469 238,695Other — — — 1,261
Consolidated Total $1,025,042 $830,734 $666,553 $607,501
Sales Contracts (Net of Cancellations):Northeast Region $ 219,101 $261,625 $204,943 $115,447Southeast Region 230,807 239,817 248,324 149,037Southwest Region 112,487 125,292 143,979 68,927West Region 291,532 336,889 312,469 233,616Other — — — 313
Consolidated Total $ 853,927 $963,623 $909,715 $567,340
Quarter Ended
October July April January(In Thousands) 31, 2002 31, 2002 30, 2002 31, 2002
Housing Revenues:Northeast Region $205,079 $177,153 $145,249 $132,769Southeast Region 207,671 182,467 143,117 127,073Southwest Region 67,403 65,432 52,820 54,526West Region 316,412 242,631 178,688 114,642Other 8,717 13,646 12,512 14,088
Consolidated Total $805,282 $681,329 $532,386 $443,098
Sales Contracts (Net of Cancellations):Northeast Region $154,623 $148,390 $165,148 $109,689Southeast Region 138,802 154,488 253,492 132,787Southwest Region 55,893 54,437 73,145 43,827West Region 283,607 288,885 261,002 84,122Other 3,206 6,443 9,053 11,365
Consolidated Total $636,131 $652,643 $761,840 $381,790
20

HOVNANIAN ENTERPRISES, INC. AND SUBSIDIARIES
An important indicator of our future results are recently signed contracts and our home contract backlog forfuture deliveries. Our consolidated contract backlog using base sales prices by market area is set forth below:
(Dollars In Thousands) October 31, 2004 October 31, 2003 October 31, 2002
Northeast Region:Total Contract Backlog $ 774,016 $ 581,865 $ 416,264Number of Homes 2,312 2,218 1,397
Southeast Region:Total Contract Backlog $ 770,804 $ 526,348 $ 331,682Number of Homes 2,399 1,761 1,221
Southwest Region:Total Contract Backlog $ 164,655 $ 157,655 $ 60,532Number of Homes 924 989 277
West Region:Total Contract Backlog $ 775,295 $ 264,536 $ 267,305Number of Homes 1,917 793 955
Other:Total Contract Backlog — — $ 945Number of Homes — — 7
Totals:Total Consolidated Contract Backlog $2,484,770 $1,530,404 $1,076,728Number of Homes 7,552 5,761 3,857
In the month of November 2004, we signed an additional 971 net contracts amounting to $320.2 million. Betweenour October 31, 2004 contract backlog and November 2004 net contracts, we have sold approximately 53% of ourprojected deliveries for fiscal 2005.
Cost of sales includes expenses for housing and land and lot sales. A breakout of such expenses for housing salesand housing gross margin is set forth below:
Year Ended
(Dollars In Thousands) October 31, 2004 October 31, 2003 October 31, 2002
Sale of homes $4,082,263 $3,129,830 $2,462,095Cost of sales, excluding interest 3,042,057 2,331,393 1,919,941Homebuilding gross margin, before interest expense 1,040,206 798,437 542,154Cost of sales interest 54,985 44,069 49,424Homebuilding gross margin, after interest expense $ 985,221 $ 754,368 $ 492,730
Gross Margin Percentage, before interest expense 25.5% 25.5% 22.0%Gross Margin Percentage, after interest expense 24.1% 24.1% 20.0%
Cost of sales expenses as a percentage of home sales revenues are presented below:
Year Ended
(Dollars In Thousands) October 31, 2004 October 31, 2003 October 31, 2002
Sale of homes 100.0% 100.0% 100.0%Cost of sales, excluding interest:
Housing, land and development costs 66.5 67.1 70.6Commissions 2.2 2.1 2.2Financing concessions 1.0 0.9 1.0Overheads 4.8 4.4 4.2
Total cost of sales, before interest expense 74.5 74.5 78.0Gross margin percentage, before interest expense 25.5 25.5 22.0Cost of sales interest 1.4 1.4 2.0Gross Margin Percentage, after interest expense 24.1% 24.1% 20.0%
21
HOVNANIAN ENTERPRISES, INC. AND SUBSIDIARIES
We sell a variety of home types in various local communities, each yielding a different gross margin. As a result,depending on the mix of both the communities and of home types delivered, consolidated gross margin willfluctuate up or down. During 2004, we decided to add an additional line item to the income statement to showpreviously capitalized interest amortized through cost of sales. The consolidated gross margins, before interestexpense remained flat at 25.5% during the year ended October 31, 2004 compared to the same period last year,despite the fact that we believe gross margins were adversely impacted in 2004 due to the effect of priceincreases in lumber, concrete, and certain other building materials. In addition, gross margins were negativelyimpacted by our 2003 and 2004 acquisitions which have lower margins than our historical consolidated averagemargins, yet still achieve strong returns on investment due to higher than average inventory turns. During theyear ended October 31, 2003, our consolidated gross margin, before interest expense, increased 3.5% from theprevious year. This increase was primarily the result of increased sales prices. Also shown in the table are ourresults of gross margins, after interest expense. After deducting interest expense, which was previouslycapitalized and amortized through cost of sales, our homebuilding gross margin was 24.1% equal to the grossmargin achieved in the prior fiscal year. The dollar increases in gross margin, before interest expense for each ofthe three years ended October 31, 2004, 2003, and 2002 were attributed to increased sales, resulting from bothorganic growth in deliveries and our acquisitions of other homebuilders.
Homebuilding selling, general, and administrative expenses as a percentage of homebuilding revenues haveaveraged approximately 8.0% for the years ended October 31, 2004, 2003, and 2002. Such expenses increased to$332.3 million for the year ended October 31, 2004, and increased to $253.7 million for the year ended October 31,2003 from $194.9 million for the previous year. The increased spending year over year was primarily due to ouracquisition deliveries and increased deliveries in previously existing markets.
We have written-off or written-down certain inventories totaling $7.0, $5.2, and $8.2 million during the yearsended October 31, 2004, 2003, and 2002, respectively, to their estimated fair value. See ‘‘Notes to ConsolidatedFinancial Statements—Note 11’’ for additional explanation. These write-offs and write-downs were incurredprimarily because of the decision not to exercise certain options to purchase land, redesign of communities inplanning, a change in the marketing strategy to liquidate a particular property or lower property values.
During the years ended October 31, 2004, 2003, and 2002, we wrote-off residential land options and approval andengineering costs amounting to $5.4, $4.5, and $4.0 million, respectively, which are included in the total write-offsmentioned above. When a community is redesigned, abandoned engineering costs are written-off. Option andapproval and engineering costs are written-off when a community’s proforma profitability does not produceadequate returns on the investment commensurate with the risk and we cancel the option. Such write-offs werelocated in all our regions.
During the year ended October 31, 2004, we wrote-down a community $1.2 million in our Northeast Region,$0.1 million in our Southeast Region, and $0.3 million in our Southwest Region. The write-down in the NortheastRegion was attributed to a section of a community that was built in accordance with a low income housing clause.In preparation for selling this property, an outside appraisal was prepared resulting in a reduction in inventorycarrying amount to fair value. The write-downs in our Southeast Region and Southwest Region were attributed toproperty that was acquired as part of our acquisition in these Regions. A decision was made to liquidate thesetwo properties resulting in lower sales prices.
We wrote-down one community $0.7 million in our Southwest Region during the year ended October 31, 2003.This property was acquired as part of one of our acquisitions. A decision was made to liquidate this propertyresulting in lower sales prices.
The write-downs of residential inventory during the year ended October 31, 2002 were attributed to Poland andthe Mid-South. The write-down in Poland was based upon changes in market conditions. In the Mid-South, landwas written-down based on a purchase offer. We have made a decision to discontinue selling homes in these twomarkets and offer the remaining lots for sale. The result of the above decisions was a reduction in inventorycarrying amounts to fair value, resulting in a $4.2 million impairment loss.
22
HOVNANIAN ENTERPRISES, INC. AND SUBSIDIARIES
LAND SALES AND OTHER REVENUESLand sales and other revenues consist primarily of land and lot sales. A breakout of land and lot sales is set forthbelow:
Year Ended
(In Thousands) October 31, 2004 October 31, 2003 October 31, 2002
Land and lot sales $2,664 $14,205 $42,312Cost of sales 2,217 10,931 35,897Land and lot sales gross margin $ 447 $ 3,274 $ 6,415
Land and lot sales are incidental to our residential housing operations and are expected to continue in the futurebut may significantly fluctuate up or down.
FINANCIAL SERVICESFinancial services consists primarily of originating mortgages from our homebuyers, selling such mortgages in thesecondary market, and title insurance activities. During the years ended October 31, 2004, October 31, 2003, andOctober 31, 2002, financial services provided a $25.5, $22.9, and $18.2 million pretax profit, respectively. Theincrease in 2004 was primarily due to increased activity in our mortgage operations, along with our homebuildinggrowth. The increases in 2003 and 2002 were primarily due to reduced costs, increased mortgage loan amounts,and the addition of mortgage operations from our acquisitions. In addition to our wholly-owned mortgagesubsidiaries, customers obtained mortgages from our mortgage joint ventures in our Northeast Region (Ohio) andWest Region in 2004 and 2003, and our West Region in 2002. In the market areas served by our wholly-ownedmortgage banking subsidiaries, approximately 66%, 74%, and 71% of our non-cash homebuyers obtainedmortgages originated by these subsidiaries during the years ended October 31, 2004, 2003, and 2002, respectively.Servicing rights on new mortgages originated by us will be sold as the loans are closed.
CORPORATE GENERAL AND ADMINISTRATIVECorporate general and administrative expenses include the operations at our headquarters in Red Bank, NewJersey. Such expenses include our executive offices, information services, human resources, corporate accounting,training, treasury, process redesign, internal audit, construction services, and administration of insurance, quality,and safety. As a percentage of total revenues, such expenses were 1.5% for the year ended October 31, 2004 and2.0% for the years ended October 31, 2003 and 2002, respectively. The decrease in corporate general andadministrative expenses during the year ended October 31, 2004 compared to the same period last year was dueto reduced depreciation expense as certain assets are now fully depreciated and reduced consulting services ascertain non-recurring projects were completed last year. Increases in corporate general and administrative dollarexpenses comparing fiscal 2003 to 2002, are primarily attributed to higher employee incentives due to higherreturns on equity and an increase in the number of employees.
INTERESTInterest expense includes housing, and land and lot interest that is capitalized while the land and homes aredeveloped and expensed with the sold land and homes, as well as other interest. See Note 2 to the ConsolidatedFinancial Statements for detail on interest incurred, expensed, and capitalized.
Interest related to homes sold as a percentage of home revenues amounted to 1.3%, 1.4%, and 2.0% for the yearsended October 31, 2004, 2003, and 2002, respectively. These percentage decreases are due to our average debt asa percentage of average inventory decreasing and lower interest rates. These percentage decreases are primarilyattributed to a decrease in debt leverage of our Company due to growth in equity from earnings and lowerinterest rates.
OTHER OPERATIONSOther operations consist primarily of miscellaneous residential housing operations expenses, senior residentialproperty operations, amortization of senior and senior subordinated note issuance expenses, earnout paymentsfrom homebuilding company acquisitions, amortization of the consultant’s agreement and the right of first refusal
23

HOVNANIAN ENTERPRISES, INC. AND SUBSIDIARIES
agreement from our California acquisition in fiscal 2002, minority interest relating to consolidated joint ventures,corporate-owned life insurance, and certain contributions. Also reported in other operations are expensesassociated with exiting our Mid-South market in fiscal 2002, the write-off of an asset of a previous acquisition, aswell as the write-off of costs associated with our enterprise-wide operating software.
OFF BALANCE SHEET FINANCINGIn the ordinary course of business, we enter into land and lot option purchase contracts in order to procure landor lots for the construction of homes. Lot option contracts enable us to control significant lot positions with aminimal capital investment and substantially reduce the risks associated with land ownership and development.At October 31, 2004, we had $225.4 million options in cash and letters of credit to purchase land and lots with atotal purchase price of $3.4 billion. Only $12.7 million of the $3.4 billion in land and lot option purchase contractscontained specific performance clauses which require us to purchase the land or lots upon satisfaction of certainrequirements by both the sellers and the Company. Additionally, our liability is generally limited to forfeiture ofthe nonrefundable deposits, letters of credit and other nonrefundable amounts incurred. We have no materialthird party guarantees.
Pursuant to FASB Interpretation No. 46 (FIN 46), ‘‘Consolidation of Variable Interest Entities,’’ we consolidated$201.7 million of inventory not owned at October 31, 2004, representing the fair value of the optioned property.Additionally, to reflect the fair value of the inventory consolidated under FIN 46, we eliminated $18.0 million ofits related cash deposits for lot option contracts, which are included in consolidated inventory not owned.Because we are unable to get the selling entities to provide us with any financial information, the fair value ofthe optioned property less our cash deposits and liabilities from inventory not owned, was reported on thebalance sheet as minority interest from inventory not owned totaling $155.1 million. At October 31, 2004, we hadcash deposits and letters of credit totaling $27.4 million, representing our current maximum exposure associatedwith the consolidation of lot option contracts. Creditors of these VIE’s, if any, have no recourse against us.
CONTRACTUAL OBLIGATIONSThe following summarizes our aggregate contractual commitments at October 31, 2004:
Payments Due by Period (in Thousands)
Less than More thanContractual Obligations Total 1 year 1 – 3 years 3 – 5 years 5 years
Long Term Debt(1) $1,481,340 $74,152 $287,488 $117,762 $1,001,938Capital Lease Obligations — — — — —Operating Leases 31,344 9,974 13,235 4,954 3,181Purchase Obligations(2) 11,440 11,440 — — —Other Long Term Liabilities — — — — —Total $1,524,124 $95,566 $300,723 $122,716 $1,005,119
(1) Represents our Senior Notes and Other Notes Payable, and related interest payments. Interest on variablerate obligations is based on rates effective as of October 31, 2004.
(2) Represents obligations under option contracts with specific performance provisions, net of cash deposits.
We had outstanding letters of credit and performance bonds of approximately $180.6 million and $712.2 million,respectively, at October 31, 2004 related principally to our obligations to local governments to construct roads andother improvements in various developments. We do not believe that any such letters of credit or bonds are likelyto be drawn upon.
RECENT ACCOUNTING PRONOUNCEMENTSIn November 2002, the FASB issued Interpretation No. 45, ‘‘Guarantor’s Accounting and Disclosure Requirementsfor Guarantees, Including Indirect Guarantees of Indebtedness of Others’’ (‘‘FIN 45’’). FIN 45 elaborates on theexisting disclosure requirements for most guarantees, including loan guarantees such as standby letters of credit.It also clarifies that at the time a company issues a guarantee, the company must recognize an initial liability forthe fair value, or market value, of the obligations it assumes under the guarantee and must disclose thatinformation in its interim and annual financial statements. The provisions related to recognizing a liability at
24

HOVNANIAN ENTERPRISES, INC. AND SUBSIDIARIES
inception of the guarantee for the fair value of the guarantor’s obligations does not apply to product warranties.The initial recognition and initial measurement provisions apply on a prospective basis to guarantees issued ormodified after December 31, 2002. The adoption of the initial recognition and initial measurement provisions ofFIN 45 did not have a material effect on our financial position or results of operations. Our disclosure ofguarantees is included in Note 14 to the Consolidated Financial Statements.
In December 2002, the FASB issued SFAS No. 148, ‘‘Accounting for Stock-Based Compensation—Transition andDisclosure’’ (‘‘SFAS 148’’), which amends SFAS No. 123, ‘‘Accounting for Stock-Based Compensation’’,(‘‘SFAS 123’’). The new standard provides alternative methods of transition for a voluntary change to the fairvalue based method of accounting for stock-based employee compensation. It also requires prominent disclosuresin both annual and interim financial statements about the method of accounting for stock-based employeecompensation and the affect of the method used on reported results. We have not elected to change to the fairvalue based method of accounting for stock-based employee compensation. We adopted the disclosure provisionsof SFAS No. 148 in our second fiscal quarter ending April 30, 2003. Our disclosure of accounting for stock-basedcompensation is included in Notes 2 and 13 to the Consolidated Financial Statements.
In January 2003, the FASB issued FIN 46. A Variable Interest Entity (‘‘VIE’’) is created when (i) the equityinvestment at risk is not sufficient to permit the entity from financing its activities without additionalsubordinated financial support from other parties or (ii) equity holders either (a) lack direct or indirect ability tomake decisions about the entity, (b) are not obligated to absorb expected losses of the entity or (c) do not havethe right to receive expected residual returns of the entity if they occur. If an entity is deemed to be a VIE,pursuant to FIN 46, an enterprise that absorbs a majority of the expected losses of the VIE is considered theprimary beneficiary and must consolidate the VIE. FIN 46 was effective immediately for VIE’s created afterJanuary 31, 2003. Pursuant to FASB revision to FIN 46 R (‘‘FIN 46-R’’), issued in December 2003, our Companywas not required to apply the provisions of FIN 46 to an interest held in a variable interest entity or potentialvariable interest entity until the end of our quarter ended April 30, 2004 for VIE’s created before February 1,2003. In accordance with FIN 46R, we have fully implemented FIN 46 as of April 30, 2004.
Based on the provisions of FIN 46, we have concluded that whenever we option land or lots from an entity andpay a non-refundable deposit, a VIE is created under condition (ii) (b) and (c) of the previous paragraph. Wehave been deemed to have provided subordinated financial support, which refers to variable interests that willabsorb some or all of an entity’s expected theoretical losses if they occur. For each VIE created with a significantnonrefundable option fee, we will compute expected losses and residual returns based on the probability offuture cash flows as outlined in FIN 46. If we are deemed to be the primary beneficiary of the VIE we willconsolidate it on our balance sheet. The fair value of the VIE’s inventory will be reported as ‘‘ConsolidatedInventory Not Owned—Variable Interest Entities’’.
Management believes FIN 46 was not clearly thought out for application in the homebuilding industry for landand lot options. Under FIN 46, we can have an option and put down a small deposit as a percentage of thepurchase price and still have to consolidate the entity. Our exposure to loss as a result of our involvement withthe VIE is only the deposit, not it’s total assets consolidated on the balance sheet. In certain cases we will have toplace inventory on our balance sheet the VIE has optioned to other developers. In addition, if the VIE hascreditors, it’s debt will be placed on our balance sheet even though the creditors have no recourse against ourCompany. Based on these observations we believe consolidating VIE’s based on land and lot option deposits doesnot reflect the economic realities or risks of owning and developing land.
At October 31, 2004, all VIE’s we were required to consolidate were as a result of our options to purchase land orlots from the selling entities. We paid cash or issued letters of credit deposits to these thirty-one VIE’s totaling$27.4 million. Our option deposits represent our maximum exposure to loss. The fair value of the property ownedby the VIE’s was $201.7 million. Because we could not get the remainder of the selling entities to provide us withany financial information, the fair value of the optioned property less our cash deposits and liabilities frominventory not owned, which totaled $155.1 million, was reported on the balance sheet as ‘‘Minority interest frominventory not owned’’. Creditors of these VIE’s have no recourse against our Company.
25

HOVNANIAN ENTERPRISES, INC. AND SUBSIDIARIES
We will continue to secure land and lots using options. Including the deposits with the thirty-one VIE’s above, atOctober 31, 2004 we have total cash and letters of credit deposits amounting to approximately $225.4 million topurchase land and lots with a total purchase price of $3.4 billion. Not all our deposits are with VIE’s. Themaximum exposure to loss is limited to the deposits although some deposits are refundable at our request orrefundable if certain conditions are not met.
In April 2003, the FASB issued SFAS No. 149, ‘‘Amendment of Derivative Instruments and Hedging Activities’’(‘‘SFAS 149’’). SFAS 149 amends and clarifies financial accounting and reporting for derivative instruments,including certain derivative instruments embedded in other contracts and for hedging activities that fall withinthe scope of SFAS No. 133, ‘‘Accounting for Derivative Instruments and Hedging Activities’’. SFAS 149 alsoamends certain other existing pronouncements, which will result in more consistent reporting of contracts thatare derivatives in their entirety or that contain embedded derivatives that warrant separate accounting. SFAS 149is effective for contracts entered into or modified after June 30, 2003. The adoption of SFAS 149 did not have amaterial effect on our financial position or results of operations.
In May 2003, the FASB issued SFAS No. 150, ‘‘Accounting for Certain Financial Instruments with Characteristicsof both Liabilities and Equity’’ (‘‘SFAS 150’’). This statement establishes how an issuer classifies and measurescertain financial instruments that have characteristics of both liabilities and equity. It requires that an issuerclassify a financial instrument that is within the scope of SFAS 150 as a liability because that financial instrumentembodies an obligation of the issuer. For the Company, SFAS 150 was effective the beginning of the first interimperiod beginning after June 15, 2003. The Company currently controls several finite life partnerships which areincluded in the consolidated accounts of the Company. The application of SFAS 150 as it relates to finite lifeentities has been deferred indefinitely and therefore the Company has not applied SFAS 150 to the minorityinterest of these partnerships. Based on the estimated value of the assets owned by the partnerships atOctober 31, 2004, the Company estimates that the minority interest in these partnerships would be entitled toreceive approximately its current carrying value upon the dissolution of the partnership. The adoption ofSFAS 150 did not have a material effect on our financial position or results of operations.
In March 2004, the Securities and Exchange Commission staff issued Staff Accounting Bulletin 105 (‘‘SAB 105’’).Existing accounting guidance requires an entity to record on its balance sheet the fair value of any issued andoutstanding mortgage loan commitments. SAB 105 requires that the fair value measurement include onlydifferences between the guaranteed interest rate in the loan commitment and a market interest rate, excludingany future cash flows related to (i) expected fees to be received when the loan commitment becomes a loan,(ii) gains from selling the loan, or (iii) the servicing value created from the loan. The guidance in SAB 105 mustbe applied to mortgage loan commitments that are accounted for as derivatives and are entered into afterMarch 31, 2004. The adoption of the guidance in SAB 105 did not have a material adverse effect on our financialposition or results of operations.
In December 2004, the FASB issued SFAS No. 123 (Revised 2004) ‘‘Share Based Payment’’ (‘‘SFAS 123R’’), which isa revision to SFAS 123 and supersedes APB 25 and SFAS 148. This statement requires that the cost resultingfrom all share-based payment transactions be recognized in the financial statements. This statement establishesfair value as the measurement objective in accounting for share-based payment arrangements and requires allentities to apply a fair-value based measurement method in accounting for share-based payment transactionswith employees except for equity instruments held by employee share ownership plans.
SFAS 123R applies to all awards granted after the required effective date (the beginning of the first interim orannual reporting period that begins after June 15, 2005) and to awards modified, repurchased, or cancelled afterthat date. As of the required effective date, all public entities that used the fair-value-based method for eitherrecognition or disclosure under Statement 123 will apply this Statement using a modified version of prospectiveapplication. Under that transition method, compensation cost is recognized on or after the required effective datefor the portion of outstanding awards for which the requisite service has not yet been rendered, based on thegrant-date fair value of those awards calculated under Statement 123 for either recognition or pro formadisclosures. For periods before the required effective date, those entities may elect to apply a modified version of
26

HOVNANIAN ENTERPRISES, INC. AND SUBSIDIARIES
the retrospective application under which financial statements for prior periods are adjusted on a basisconsistent with the pro forma disclosures required for those periods by Statement 123. As a result, beginning inour fiscal fourth quarter of 2005, we will adopt SFAS 123R and begin reflecting the stock option expensedetermined under fair value based methods in our income statement rather than as pro-forma disclosure in thenotes to the financial statements. We expect the effect of adopting SFAS 123R to be similar to the effectpresented in our proforma disclosure related to SFAS 123.
TOTAL TAXESTotal taxes as a percentage of income before taxes amounted to approximately 36.6%, 37.5%, and 39.0% for theyears ended October 31, 2004, 2003, and 2002, respectively. The decrease in this percentage from 2003 to 2004 isprimarily attributed to lower state taxes. Annually we make an adjustment to the previous year’s estimatedfederal and state income taxes based on actual taxes per our filed income tax returns. This year’s net adjustmentfor 2003 state income taxes was made in the fourth quarter of 2004 and totaled $4.4 million, slightly higher thanwe have experienced in the past. This adjustment was primarily caused by lower than estimated state incometaxes in California and New Jersey. California, a unitary tax state, allows alternative methods of allocating incomebetween states. For the accrual we used the standard allocation method but in preparing the actual return wediscovered that an alternative allocation methodology resulted in lower income taxes. In addition, fiscal 2003 wasthe first year for a major change in New Jersey tax laws. Being the first year to estimate taxes under the new law,we felt that it would be prudent to conservatively estimate our state income taxes. In the fourth quarter of fiscal2004, we filed our actual New Jersey tax return for 2003 which yielded lower taxes than we accrued in fiscal 2003.Deferred federal and state income tax assets primarily represent the deferred tax benefits arising from temporarydifferences between book and tax income which will be recognized in future years as an offset against futuretaxable income. If for some reason the combination of future years income (or loss) combined with the reversalof the timing differences results in a loss, such losses can be carried back to prior years to recover the deferredtax assets. As a result, management is confident such deferred tax assets reflected in the balance sheet arerecoverable regardless of future income. See ‘‘Notes to Consolidated Financial Statements—Note 10’’ for anadditional explanation of taxes.
INFLATIONInflation has a long-term effect on us because increasing costs of land, materials, and labor result in increasingsale prices of our homes. In general, these price increases have been commensurate with the general rate ofinflation in our housing markets and have not had a significant adverse effect on the sale of our homes. Asignificant risk faced by the housing industry generally is that rising house costs, including land and interestcosts, will substantially outpace increases in the income of potential purchasers. In recent years, in the priceranges in which our homes sell, we have not found this risk to be a significant problem.
Inflation has a lesser short-term effect on us because we generally negotiate fixed price contracts with oursubcontractors and material suppliers for the construction of our homes. These prices usually are applicable for aspecified number of residential buildings or for a time period of between four to twelve months. Constructioncosts for residential buildings represent approximately 56% of our homebuilding cost of sales.
MERGERS AND ACQUISITIONSOn November 6, 2003 we acquired a Florida homebuilder for cash and 489,236 shares of our Class A CommonStock. This acquisition was accounted for as a purchase, with the results of operations of this entity included inour consolidated financial statements as of the date of acquisition. On November 1, 2002 and December 31, 2002,we acquired two Texas homebuilding companies. On April 9, 2003, we acquired a build-on-your-own lothomebuilder in Ohio, and on August 8, 2003, we acquired a homebuilder in Arizona. Our aggregate net cashpurchase price, including payment of third party debt, for fiscal year 2003 acquisitions was approximately$186.4 million. All fiscal 2004 and 2003 acquisitions provide for other payments to be made, generally dependantupon achievement of certain future operating and return objectives.
On January 10, 2002, we acquired a California homebuilder for a total purchase price of $196.5 million, of which$151.6 million was paid in cash and 4,417,476 shares of our Class A Common Stock were issued. At the date ofacquisition we also paid off approximately $88.0 million of their third party debt. During the second quarterended April 30, 2003, we exercised the right to retire at no cost 1,498,718 Class A Common Stock shares thatwere held by the selling principal under the terms of the acquisition.
27

HOVNANIAN ENTERPRISES, INC. AND SUBSIDIARIES
SAFE HARBOR STATEMENTAll statements in this Form 10-K that are not historical facts should be considered as ‘‘Forward-LookingStatements’’ within the meaning of the Private Securities Litigation Reform Act of 1995. Such statements involveknown and unknown risks, uncertainties and other factors that may cause actual results, performance orachievements of the Company to be materially different from any future results, performance or achievementsexpressed or implied by the forward looking statements. Although we believe that our plans, intentions andexpectations reflected in, or suggested by such forward-looking statements are reasonable, we can give noassurance that such plans, intentions, or expectations will be achieved. Such risks, uncertainties and other factorsinclude, but are not limited to:
• Changes in general and local economic and business conditions;
• Weather conditions;
• Changes in market conditions;
• Changes in home prices and sales activity in the markets where the Company builds homes;
• Government regulation, including regulations concerning development of land, the homebuilding process,and the environment;
• Fluctuations in interest rates and the availability of mortgage financing;
• Shortages in and price fluctuations of raw materials and labor;
• The availability and cost of suitable land and improved lots;
• Levels of competition;
• Availability of financing to the Company;
• Utility shortages and outages or rate fluctuations; and
• Geopolitical risks, terrorist acts and other acts of war.
Certain risks, uncertainties, and other factors are described in detail in Item 1 and 2 ‘‘Business and Properties’’ inthis Form 10-K.
Item 7A - Quantitative and Qualitative Disclosures About Market RiskThe primary market risk facing us is interest rate risk on our long term debt. In connection with our mortgageoperations, mortgage loans held for sale and the associated mortgage warehouse line of credit are subject tointerest rate risk; however, such obligations reprice frequently and are short-term in duration. In addition, wehedge the interest rate risk on mortgage loans by obtaining forward commitments from private investors.Accordingly the risk from mortgage loans is not material. We do not hedge interest rate risk other than onmortgage loans using financial instruments. We are also subject to foreign currency risk but this risk is notmaterial. The following tables set forth as of October 31, 2004 and 2003, our long term debt obligations, principalcash flows by scheduled maturity, weighted average interest rates and estimated fair market value (‘‘FMV’’).There have been no significant changes in our market risk from October 31, 2003 to October 31, 2004.
Long Term Debt as of October 31, 2004by Year of Debt Maturity FMV at
(Dollars in Thousands) 2005 2006 2007 2008 2009 Thereafter Total 10/31/04
Long Term Debt(1):Fixed Rate $26,300 $ 654 $140,949 $ 748 $ 800 $786,438 $955,889 $1,025,829
Average interest rate 7.10% 6.66% 10.48% 6.71% 6.73% 7.37% 7.82% —
Variable rate — — — — — — — —
Average interest rate — — — — — — — —
(1) Does not include bonds collateralized by mortgages receivable.
28

HOVNANIAN ENTERPRISES, INC. AND SUBSIDIARIES
Long Term Debt as of October 31, 2003by Year of Debt Maturity FMV at
(Dollars in Thousands) 2004 2005 2006 2007 2008 Thereafter Total 10/31/03
Long Term Debt(1):Fixed Rate $43,869 $ 81 $ 88 $140,346 $ 104 $550,253 $734,741 $798,347
Average interest rate 6.49% 8.38% 8.38% 10.50% 8.38% 8.48% 8.74% —
Variable rate — — — — $115,000 — $115,000 $115,000
Average interest rate — — — — (2) — — —
(1) Does not include bonds collateralized by mortgages receivable.
(2) LIBOR plus 2.5%.
In addition, we have reassessed the market risk for our variable rate debt, which is based upon the prime rate ora spread over LIBOR, and we believe that a one percent increase in the prime rate or LIBOR rate would have anapproximate $1.2 million increase in interest expense for the twelve months ended October 31, 2004, assuming$115 million of variable rate debt outstanding from November 1, 2003 to October 31, 2004.
Item 8 - Financial Statements and Supplementary Data
Financial statements of Hovnanian Enterprises, Inc. and its consolidated subsidiaries are set forth hereinbeginning on Page F-1.
Item 9 - Changes in and Disagreements with Accountants on Accounting and FinancialDisclosure
During the years ended October 31, 2004, 2003, and 2002, there have not been any changes in, or disagreementswith, accountants on accounting and financial disclosure.
Item 9A - Controls and Procedures
The Company maintains disclosure controls and procedures that are designed to ensure that informationrequired to be disclosed in the Company’s reports under the Securities Exchange Act of 1934 is recorded,processed, summarized and reported within the time periods specified in the Securities and ExchangeCommission’s rules and forms, and that such information is accumulated and communicated to the Company’smanagement, including its chief executive officer and chief financial officer, as appropriate, to allow timelydecisions regarding required disclosures. Any controls and procedures, no matter how well designed andoperated, can provide only reasonable assurance of achieving the desired control objectives. The Company’smanagement, with the participation of the Company’s chief executive officer and chief financial officer, hasevaluated the effectiveness of the design and operation of the Company’s disclosure controls and procedures asof October 31, 2004. Based upon that evaluation and subject to the foregoing, the Company’s chief executiveofficer and chief financial officer concluded that the design and operation of the Company’s disclosure controlsand procedures are effective to accomplish their objectives.
In addition, there was no change in the Company’s internal control over financial reporting that occurred duringthe quarter ended October 31, 2004 that has materially affected, or is reasonably likely to materially affect, theCompany’s internal control over financial reporting.
Item 9B - Other Information
None.
29

HOVNANIAN ENTERPRISES, INC. AND SUBSIDIARIES
PART III
Item 10 - Directors and Executive Officers of the Registrant
The information called for by Item 10, except as set forth below in this Item 10, is incorporated herein byreference to our definitive proxy statement to be filed pursuant to Regulation 14A, in connection with theCompany’s annual meeting of shareholders to be held on March 8, 2005, which will involve the election ofdirectors.
EXECUTIVE OFFICERS OF THE REGISTRANTOur executive officers are listed below and brief summaries of their business experience and certain otherinformation with respect to them are set forth following the table. Each executive officer holds such office for aone year term.
Year StartedName Age Position With Company
Kevork S. Hovnanian 81 Chairman of the Board and Director of the Company. l967
Ara K. Hovnanian 47 Chief Executive Officer, President and Director of the Company. 1979
Paul W. Buchanan 54 Senior Vice President—Corporate Controller. l981
Kevin C. Hake 45 Senior Vice President, Finance and Treasurer. 2000
Robyn T. Mingle 39 Senior Vice President, Human Resources 2003
Peter S. Reinhart 54 Senior Vice President and General Counsel. 1978
J. Larry Sorsby 49 Executive Vice President, Chief Financial Officer and Director of 1988the Company.
Mr. K. Hovnanian founded the predecessor of the Company in l959 (Hovnanian Brothers, Inc.) and has served asChairman of the Board of the Company since its incorporation in l967. Mr. K. Hovnanian was also ChiefExecutive Officer of the Company from 1967 to July 1997.
Mr. A. Hovnanian was appointed President in April 1988, after serving as Executive Vice President fromMarch 1983. He has also served as Chief Executive Officer since July 1997. Mr. A. Hovnanian was elected aDirector of the Company in December l98l. Mr. A. Hovnanian is the son of Mr. K. Hovnanian.
Mr. Buchanan has been Senior Vice President—Corporate Controller since May l990. Mr. Buchanan resigned as aDirector of the Company on September 13, 2002, a position in which he served since March 1982, for the purposeof reducing the number of non-independent board members.
Mr. Hake was appointed Senior Vice President, Finance and Treasurer in October 2004 after serving as VicePresident, Finance and Treasurer from July 2000. Mr. Hake was Director, Real Estate Finance at BankBostonCorporation from 1994 to June 2000.
Ms. Mingle joined the Company in October 2003 as Senior Vice President, Human Resources. Prior to joining theCompany, Ms. Mingle was the Vice President, Human Resources at Black and Decker, U. S., Inc. since 1999.
Mr. Reinhart has been Senior Vice President and General Counsel since April 1985. Mr. Reinhart resigned as aDirector of the Company on September 13, 2002, a position in which he served since December l98l, for thepurpose of reducing the number of non-independent board members.
Mr. Sorsby was appointed Executive Vice President and Chief Financial Officer of the Company in October 2000after serving as Senior Vice President, Treasurer, and Chief Financial Officer from February 1996 and as VicePresident—Finance/Treasurer of the Company since March 1991.
30

HOVNANIAN ENTERPRISES, INC. AND SUBSIDIARIES
CODE OF ETHICS AND CORPORATE GOVERNANCE GUIDELINESWe have adopted a Code of Ethics that applies to Hovnanian’s principal executive officer, principal financialofficer, controller, and all other associates of the Company, including its directors and other officers. We haveposted the text of this Code of Ethics on our website at www.khov.com under ‘‘Investor Relations/CorporateGovernance’’. We have also adopted Corporate Governance Guidelines and posted them on our website atwww.khov.com under ‘‘Investor Relations/Corporate Governance’’. A printed copy of the Code and Guidelines isalso available to the public at no charge by writing to: Hovnanian Enterprises, Inc., Attn: Human ResourcesDepartment, 10 Highway 35, P.O. Box 500, Red Bank, N.J. 07701 or calling Corporate headquarters at732-747-7800.
AUDIT COMMITTEE AND COMPENSATION COMMITTEE CHARTERSWe have adopted charters that apply to Hovnanian’s Audit Committee and Compensation Committee. We haveposted the text of these charters on our website at www.khov.com under ‘‘Investor Relations/CorporateGovernance’’. A printed copy of each charter is available to any shareholder who requests it by writing to:Hovnanian Enterprises, Inc., Attn: Human Resources Department, 10 Highway 35, P.O. Box 500, Red Bank, N.J.07701 or calling corporate headquarters at 732-747-7800.
Item 11 - Executive Compensation
The information called for by Item 11 is incorporated herein by reference to our definitive proxy statement to befiled pursuant to Regulation 14A, in connection with our annual meeting of shareholders to be held on March 8,2005, which will involve the election of directors.
Item 12 - Security Ownership of Certain Beneficial Owners and Management and RelatedStockholder Matters
The information called for by Item 12 is incorporated herein by reference to our definitive proxy statement to befiled pursuant to Regulation 14A, in connection with our annual meeting of shareholders to be held on March 8,2005, which will involve the election of directors.
The following table provides information as of October 31, 2004 with respect to compensation plans (includingindividual compensation arrangements) under which our equity securities are authorized for issuance.
EQUITY COMPENSATION PLAN INFORMATION
Number of securitiesremaining availablefor future issuance
Number of securities under equityto be issued upon Weighted average compensation plans
exercise of exercise price of (excluding securitiesoutstanding options, outstanding reflected inwarrants and rights options, warrants column (a) (in
Plan Category (in thousands) and rights thousands)(a) (b) (c)
Equity compensation plans approved bysecurity holders: 7,249 7.47 24,279
Equity compensation plans not approved bysecurity holders: — — —
Total 7,249 7.47 24,279
31

HOVNANIAN ENTERPRISES, INC. AND SUBSIDIARIES
Item 13 - Certain Relationships and Related Transactions
The information called for by Item 13 is incorporated herein by reference to our definitive proxy statement, withthe exception of the information regarding certain relationships, as described below, to be filed pursuant toRegulation 14A, in connection with our annual meeting of shareholders to be held on March 8, 2005, which willinvolve the election of directors.
At October 31, 2002, we stopped making loans to both Mr. K. Hovnanian and Mr. A. Hovnanian. The weightedaverage interest rate on Mr. K. Hovnanian and Mr. A. Hovnanian’s related party debt was 1.79% for the yearended October 31, 2002. The largest amount of debt outstanding held by Mr. K. Hovnanian for the year endingOctober 31, 2002 was $22,000. The largest amount of debt outstanding held by Mr. A. Hovnanian for the yearending October 31, 2002 was $1,729,000. The interest rate on six month Treasury bills at October 31, 2002 was1.55%. As of October 31, 2004, the outstanding loan balances were zero. We provided property managementservices to various limited partnerships including one partnership in which Mr. A. Hovnanian, our ChiefExecutive Officer, President and a Director, is a general partner, and members of his family and certain officersand directors are limited partners. We no longer provide such services. During the years ended October 31, 2004,2003, and 2002 we received $0.1 million in fees for such management services. At October 31, 2004 and 2003, noamounts were due us by these partnerships. During the years ended October 31, 2004, 2003, and 2002, wereceived $37,000, $62,000, and $62,000, respectively, from these partnerships.
Item 14 - Principal Accountant Fees and Services
The information called for by Item 14 is incorporated herein by reference to our definitive proxy statement to befiled pursuant to Regulation 14A, in connection with our annual meeting of shareholders to be held on March 8,2005, which will involve the election of directors.
32

HOVNANIAN ENTERPRISES, INC. AND SUBSIDIARIES
PART IV
Item 15 - Exhibits and Financial Statement Schedules
Page
Financial Statements:
Index to Consolidated Financial Statements F-1
Report of Independent Registered Public Accounting Firm F-2
Consolidated Balance Sheets at October 31, 2004 and 2003 F-3
Consolidated Statements of Income for the years ended October 31, 2004, 2003, and 2002 F-5
Consolidated Statements of Stockholders’ Equity for the years ended October 31, 2004, 2003, and 2002 F-6
Consolidated Statements of Cash Flows for the years ended October 31, 2004, 2003, and 2002 F-7
Notes to Consolidated Financial Statements F-8
No schedules have been prepared because the required information of such schedules is not present, is notpresent in amounts sufficient to require submission of the schedule or because the required information isincluded in the financial statements and notes thereto.
Exhibits:
3(a) Certificate of Incorporation of the Registrant.(1)
3(b) Certificate of Amendment of Certificate of Incorporation of the Registrant.(5)
3(c) Certificate of Amendment of Certificate of Incorporation of the Registrant.(14)
3(d) Restated Bylaws of the Registrant.(12)
4(a) Specimen Class A Common Stock Certificate.(13)
4(b) Specimen Class B Common Stock Certificate. (15)
4(c) Indenture dated as of October 2, 2000, relating to 101⁄2% Senior Notes, between the Registrant and FirstUnion National Bank, including form of 101⁄2% Senior Notes due October 1, 2007.(9)
4(d) Indenture dated March 26, 2002, relating to 8% Senior Notes, between the Registrant and First UnionNational Bank, including form of 8% Senior Notes due April 1, 2012.(10)
4(e) Indenture dated March 26, 2002, relating to 8.875% Senior Subordinated Notes, between the Registrantand First Union National Bank, including form of 8.875% Senior Subordinated Notes due April 1,2012.(10)
4(f) Indenture dated May 9, 2003, relating to 73⁄4% Senior Subordinated Notes, among K. HovnanianEnterprises, Inc., the Guarantors named therein and Wachovia Bank, National Association, as Trustee,including form of 73⁄4% Senior Subordinated Notes due May 15, 2013.(4)
4(g) Indenture dated as of November 3, 2003, relating to 61⁄2% Senior Notes, among K. Hovnanian Enterprises,Inc., Hovnanian Enterprises, Inc. and Wachovia Bank, National Association, as Trustee, as supplementedby the First Supplemental Indenture dated as of November 3, 2003 among K. Hovnanian Enterprises, Inc.,Hovnanian Enterprises, Inc., the other Guarantors named therein and Wachovia Bank, NationalAssociation, as Trustee, including form of 61⁄2% Senior Notes due January 15, 2014.(2)
4(h) Indenture dated as of March 18, 2004, relating to 63⁄8% Senior Notes, among K. Hovnanian Enterprises,Inc., the Guarantors named therein and Wachovia Bank, National Association, as Trustee, including formof 63⁄8% Senior Notes due 2014.(16)
4(i) Indenture dated as of November 30, 2004, relating to 61⁄4% Senior Notes, among K. HovnanianEnterprises, Inc., the Guarantors named therein and Wachovia Bank, National Association, as Trustee,including form of 61⁄4% Senior Notes due 2015.
33

HOVNANIAN ENTERPRISES, INC. AND SUBSIDIARIES
4(j) Indenture dated as of November 30, 2004, relating to 6% Senior Subordinated Notes, among K. HovnanianEnterprises, Inc., the Guarantors named therein and Wachovia Bank, National Association, as Trustee,including form of 6% Senior Notes due 2010.
10(a) Third Amendment to First Restated Revolving Credit Agreement dated as of August 3, 2004, among, K.Hovnanian Mortgage, Inc., and K. Hovnanian American Mortgage, LLC., Guaranty Bank, Bank of AmericaNA, J P Morgan Chase Bank, Comerica Bank, National City Bank of Kentucky, U S Bank N A, ColonialBank NA, and Washington Mutual Bank FA (Warehouse Agreement).(18)
10(b) Fourth Amended and Restated Credit Agreement dated as of June 18, 2004, among, K. HovnanianEnterprises, Inc., Hovnanian Enterprises, Inc., PNC Bank NA, Bank of America NA, Wachovia Bank NA,Bank One NA, Key Bank, National Association, and The Royal Bank of Scotland.(18)
10(c) Description of Management Bonus Arrangements.(15)
10(d) Description of Savings and Investment Retirement Plan.(1)
10(e) 1999 Stock Incentive Plan (as amended and restated).(17)
10(f) 1983 Stock Option Plan (as amended and restated March 8, 2002).(3)
10(g) Management Agreement dated August 12, 1983 for the management of properties by K. HovnanianInvestment Properties, Inc.(1)
10(h) Management Agreement dated December 15, 1985, for the management of properties by K. HovnanianInvestment Properties, Inc.(15)
10(i) Description of Deferred Compensation Plan.(15)
10(j) Senior Executive Short-Term Incentive Plan (as amended and restated).(8)
12 Ratio of Earnings to Fixed Charges.
21 Subsidiaries of the Registrant.
23 Consent of Independent Auditors.
31(a) Rule 13a-14(a)/15d-14(a) Certification of Chief Executive Officer.
31(b) Rule 13a-14(a)/15d-14(a) Certification of Chief Financial Officer.
32(a) Certification of Chief Executive Officer pursuant to 18 U.S.C. Section 1350.
32(b) Certification of Chief Financial Officer pursuant to 18 U.S.C. Section 1350.
(1) Incorporated by reference to Exhibits to Registration Statement (No. 2-85198) on Form S-1 of theRegistrant.
(2) Incorporated by reference to Exhibits to Current Report on Form 8-K filed on November 7, 2003.
(3) Incorporated by reference to Exhibits to Annual Report on Form 10-K for the year ended October 31,2002 of the Registrant.
(4) Incorporated by reference to Exhibits to Registration Statement (No. 333-107164-01) on Form S-4 of theRegistrant.
(5) Incorporated by reference to Exhibits to Registration Statement (No. 333-106761) on Form S-3 of theRegistrant.
(6) Incorporated by reference to Exhibits to Registration Statement (No. 333-75939) on Form S-3 of theRegistrant.
(7) Incorporated by reference to Exhibits to Quarterly Report on Form 10-Q for the quarter ended July 31,2002 of the Registrant.
(8) Incorporated by reference to Appendix A of the definitive Proxy Statement of the Registrant onSchedule 14A filed February 10, 2004.
(9) Incorporated by reference to Exhibits to Registration Statement (No. 333-52836-01) on Form S-4 of theRegistrant.
(10) Incorporated by reference to Exhibits to Registration Statement (No. 333-89976-01) on Form S-4 of theRegistrant.
34

HOVNANIAN ENTERPRISES, INC. AND SUBSIDIARIES
(11) Incorporated by reference to Exhibits to Quarterly Report on Form 10-Q for the quarter ended April 30,2002 of the Registrant.
(12) Incorporated by reference to Exhibits to Registration Statement (No. 1-08551) on Form 8-A of theRegistrant.
(13) Incorporated by reference to Exhibits to Registration Statement (No. 333-111231) on Form S-3 of theRegistrant.
(14) Incorporated by reference to Exhibits to Quarterly Report on Form 10-Q for the quarter endedJanuary 31, 2004 of the Registrant.
(15) Incorporated by reference to Exhibits to Annual Report on Form 10-K for the year ended October 31,2003 of the Registrant.
(16) Incorporated by reference to Exhibits to Registration Statement (No. 333-115742) on Form S-4 of theRegistrant.
(17) Incorporated by reference to Appendix B of the definitive Proxy Statement of the Registrant onSchedule 14A filed February 10, 2004.
(18) Incorporated by reference to Exhibits to Quarterly Report on Form 10-Q for the quarter ended July 31,2004 of the Registrant.
35

HOVNANIAN ENTERPRISES, INC. AND SUBSIDIARIES
SIGNATURES
Pursuant to the requirements of Section l3 or l5(d) of the Securities Exchange Act of l934, the registrant has dulycaused this report to be signed on its behalf by the undersigned, thereunto duly authorized.
HOVNANIAN ENTERPRISES, INC.
By: /s/ KEVORK S. HOVNANIAN
Kevork S. HovnanianChairman of the Board
Pursuant to the requirements of the Securities Exchange Act of l934, this report has been signed below by thefollowing persons on behalf of the registrant and in the capacities and on the dates indicated.
/s/ KEVORK S. HOVNANIAN
Kevork S. Hovnanian Chairman of The Board and Director 1/13/05
/s/ ARA K. HOVNANIAN
Ara K. Hovnanian Chief Executive Officer, President and Director 1/13/05
/s/ PAUL W. BUCHANAN
Paul W. Buchanan Senior Vice President-Corporate Controller 1/13/05
/s/ KEVIN C. HAKE
Kevin C. Hake Senior Vice President, Finance and Treasurer 1/13/05
/s/ DESMOND P. MCDONALD
Desmond P. McDonald Chairman of Audit Committee and Director 1/13/05
/s/ PETER S. REINHART
Peter S. Reinhart Senior Vice President and General Counsel 1/13/05
/s/ J. LARRY SORSBY
Executive Vice President, Chief FinancialJ. Larry Sorsby 1/13/05Officer and Director
/s/ STEPHEN D. WEINROTH
Chairman of Compensation Committee andStephen D. Weinroth 1/13/05Director
36

HOVNANIAN ENTERPRISES, INC. AND SUBSIDIARIES
HOVNANIAN ENTERPRISES, INC.Index to Consolidated Financial Statements
Page
Financial Statements:
Report of Independent Registered Public Accounting Firm F-2
Consolidated Balance Sheets as of October 31, 2004 and 2003 F-3
Consolidated Statements of Income for the Years Ended October 31, 2004, 2003, and 2002 F-5
Consolidated Statements of Stockholders’ Equity for the Years Ended October 31, 2004, 2003, and 2002 F-6
Consolidated Statements of Cash Flows for the Years Ended October 31, 2004, 2003, and 2002 F-7
Notes to Consolidated Financial Statements F-8
No schedules have been prepared because the required information of such schedules is not present, is notpresent in amounts sufficient to require submission of the schedule or because the required information isincluded in the financial statements and notes thereto.
F-1

(This page has been left blank intentionally.)

HOVNANIAN ENTERPRISES, INC. AND SUBSIDIARIES
Report of Independent Registered Public Accounting Firm
To the Stockholders andBoard of Directors ofHovnanian Enterprises, Inc.
We have audited the accompanying consolidated balance sheets of Hovnanian Enterprises, Inc. and subsidiariesas of October 31, 2004 and 2003, and the related consolidated statements of income, stockholders’ equity and cashflows for each of the three years in the period ended October 31, 2004. These financial statements are theresponsibility of the Company’s management. Our responsibility is to express an opinion on these financialstatements based on our audits.
We conducted our audits in accordance with the standards of the Public Company Accounting Oversight Board(United States). Those standards require that we plan and perform the audit to obtain reasonable assuranceabout whether the financial statements are free of material misstatement. An audit includes examining, on a testbasis, evidence supporting the amounts and disclosures in the financial statements. An audit also includesassessing the accounting principles used and significant estimates made by management, as well as evaluatingthe overall financial statement presentation. We believe that our audits provide a reasonable basis for ouropinion.
In our opinion, the financial statements referred to above present fairly, in all material respects, the consolidatedfinancial position of Hovnanian Enterprises, Inc. and subsidiaries at October 31, 2004 and 2003, and theconsolidated results of their operations and their cash flows for each of the three years in the period endedOctober 31, 2004 in conformity with U.S. generally accepted accounting principles.
As discussed in Notes 2 and 17 to the consolidated financial statements, in 2002 the Company changed its methodof accounting for goodwill, and in 2003, the Company adopted FASB Interpretation No. 46 ‘‘Consolidation ofVariable Interest Entities’’.
Ernst & Young LLP
New York, New YorkDecember 10, 2004
F-2
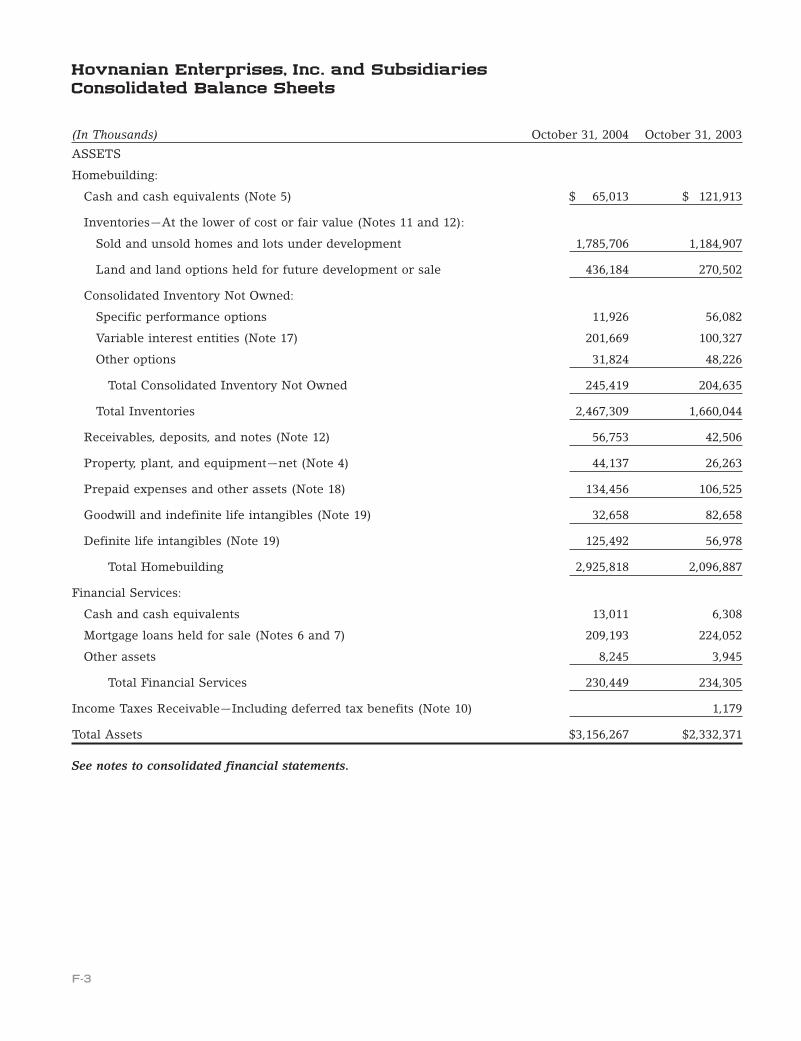
Hovnanian Enterprises, Inc. and SubsidiariesConsolidated Balance Sheets
(In Thousands) October 31, 2004 October 31, 2003
ASSETS
Homebuilding:
Cash and cash equivalents (Note 5) $ 65,013 $ 121,913
Inventories—At the lower of cost or fair value (Notes 11 and 12):
Sold and unsold homes and lots under development 1,785,706 1,184,907
Land and land options held for future development or sale 436,184 270,502
Consolidated Inventory Not Owned:
Specific performance options 11,926 56,082
Variable interest entities (Note 17) 201,669 100,327
Other options 31,824 48,226
Total Consolidated Inventory Not Owned 245,419 204,635
Total Inventories 2,467,309 1,660,044
Receivables, deposits, and notes (Note 12) 56,753 42,506
Property, plant, and equipment—net (Note 4) 44,137 26,263
Prepaid expenses and other assets (Note 18) 134,456 106,525
Goodwill and indefinite life intangibles (Note 19) 32,658 82,658
Definite life intangibles (Note 19) 125,492 56,978
Total Homebuilding 2,925,818 2,096,887
Financial Services:
Cash and cash equivalents 13,011 6,308
Mortgage loans held for sale (Notes 6 and 7) 209,193 224,052
Other assets 8,245 3,945
Total Financial Services 230,449 234,305
Income Taxes Receivable—Including deferred tax benefits (Note 10) 1,179
Total Assets $3,156,267 $2,332,371
See notes to consolidated financial statements.
F-3

Hovnanian Enterprises, Inc. and SubsidiariesConsolidated Balance Sheets
(In Thousands) October 31, 2004 October 31, 2003
LIABILITIES AND STOCKHOLDERS’ EQUITY
Homebuilding:
Nonrecourse land mortgages (Note 7) $ 25,687 $ 43,795
Accounts payable and other liabilities 329,621 229,986
Customers’ deposits (Note 5) 80,131 58,376
Nonrecourse mortgages secured by operating properties (Note 7) 24,951 710
Liabilities from inventory not owned 68,160 94,780
Total Homebuilding 528,550 427,647
Financial Services:
Accounts payable and other liabilities 6,080 5,917
Mortgage warehouse line of credit (Notes 6 and 7) 188,417 166,711
Total Financial Services 194,497 172,628
Notes Payable:
Revolving and term credit agreements (Note 7) 115,000 115,000
Senior notes (Note 8) 602,737 387,166
Senior subordinated notes (Note 8) 300,000 300,000
Accrued interest (Notes 7 and 8) 15,522 15,675
Total Notes Payable 1,033,259 817,841
Income Taxes Payable (Note 10) 48,999
Total Liabilities 1,805,305 1,418,116
Minority interest from inventory not owned (Note 17) 155,096 90,252
Minority interest from consolidated joint ventures 3,472 4,291
Stockholders’ Equity (Notes 13 and 19):
Preferred Stock, $.01 par value—authorized 100,000 shares; none issued
Common Stock, Class A, $.01 par value—authorized 200,000,000 shares;issued 56,797,313 shares in 2004 and 56,036,116 shares in 2003(including 10,395,656 shares in 2004 and 10,780,436 shares in 2003held in Treasury) 568 560
Common Stock, Class B, $.01 par value (convertible to Class A at time ofsale)—authorized 30,000,000 shares; issued 15,376,972 shares in 2004and 15,537,016 shares in 2003 (both years include 691,748 shares heldin Treasury) 154 155
Paid in Capital 199,643 163,355
Retained Earnings (Note 8) 1,053,863 705,182
Deferred Compensation (Note 13) (11,784)
Treasury Stock—at cost (50,050) (49,540)
Total Stockholders’ Equity 1,192,394 819,712
Total Liabilities and Stockholders’ Equity $3,156,267 $2,332,371
See notes to consolidated financial statements.
F-4

Hovnanian Enterprises, Inc. and SubsidiariesConsolidated Statements of Income
Year Ended
(In Thousands Except Per Share Data) October 31, 2004 October 31, 2003 October 31, 2002
Revenues:
Homebuilding:
Sale of homes $4,082,263 $3,129,830 $2,462,095
Land sales and other revenues (Note 12) 17,852 20,742 48,241
Total Homebuilding 4,100,115 3,150,572 2,510,336
Financial services 60,288 51,285 40,770
Total Revenues 4,160,403 3,201,857 2,551,106
Expenses:
Homebuilding:
Cost of sales, excluding interest 3,044,274 2,342,324 1,955,838
Cost of sales interest 54,985 44,069 49,424
Total Cost of Sales 3,099,259 2,386,393 2,005,262
Selling, general and administrative 332,305 253,724 194,903
Inventory impairment loss (Note 11) 6,990 5,150 8,199
Total Homebuilding 3,438,554 2,645,267 2,208,364
Financial services 34,782 28,415 22,543
Corporate general and administrative 63,423 66,008 51,974
Interest (Notes 7 and 8) 20,057 19,589 10,947
Expenses related to extinguishment of debt (Note 8) 9,597 1,619 895
Other operations 15,295 21,061 30,653
Intangible amortization (Note 19) 28,923 8,380
Total Expenses 3,610,631 2,790,339 2,325,376
Income Before Income Taxes 549,772 411,518 225,730
State and Federal Income Taxes:
State (Note 10) 21,595 17,458 8,993
Federal (Note 10) 179,496 136,680 79,041
Total Taxes 201,091 154,138 88,034
Net Income $ 348,681 $ 257,380 $ 137,696
Per Share Data:
Basic:
Income Per Common Share $ 5.63 $ 4.16 $ 2.26
Weighted Average Number of Common SharesOutstanding 61,892 61,920 60,810
Assuming Dilution:
Income Per Common Share $ 5.35 $ 3.93 $ 2.14
Weighted Average Number of Common SharesOutstanding 65,133 65,538 64,310
See notes to consolidated financial statements.
F-5

Hovnanian Enterprises, Inc. and SubsidiariesConsolidated Statements of Stockholders’ Equity
A Common Stock B Common Stock
Shares SharesIssued and Issued and Paid-In Retained Deferred Treasury
(Dollars In Thousands) Outstanding Amount Outstanding Amount Capital Earnings Comp Stock Total
Balance,October 31, 2001 40,807,516 $492 14,946,106 $155 $100,634 $ 310,106 $ (127) $(35,614) $ 375,646
Acquisitions 4,805,538 48 48,027 106 48,181Sale of common stock
under employeestock option plan 714,330 8 3,573 3,581
Stock Bonus issuances 127,630 2 391 393Conversion of Class B
to Class A commonstock 61,732 (61,732)
Treasury stockpurchases (295,238) (2,948) (2,948)
Net Income 137,696 137,696
Balance,October 31, 2002 46,221,508 550 14,884,374 155 152,625 447,802 (21) (38,562) 562,549
Acquisitions 101,644 3,713 21 3,734Shares returned in
connection withprior year acquisition (1,498,718)
Sale of common stockunder employeestock option plan 810,220 8 7,039 7,047
Stock Bonus issuances 177,158 2 (22) (20)Conversion of Class B
to Class A commonstock 39,106 (39,106)
Treasury stockpurchases (595,238) (10,978) (10,978)
Net Income 257,380 257,380
Balance,October 31, 2003 45,255,680 560 14,845,268 155 163,355 705,182 (49,540) 819,712
Acquisitions 489,236 16,311 2,512 18,823Sale of common stock
under employeestock option plan 334,166 4 1,742 1,746
Stock Bonus issuances 212,335 2 54,652 1 503 506Restricted Stock
granted 17,732 (11,867) 5,865Amortization of
Restricted Stock 83 83Conversion of Class B
to Class Acommon stock 214,696 2 (214,696) (2)
Treasury stockpurchases (104,456) (3,022) (3,022)
Net Income 348,681 348,681
Balance,October 31, 2004 46,401,657 $568 14,685,224 $154 $199,643 $1,053,863 $(11,784) $(50,050) $1,192,394
See notes to consolidated financial statements.
F-6
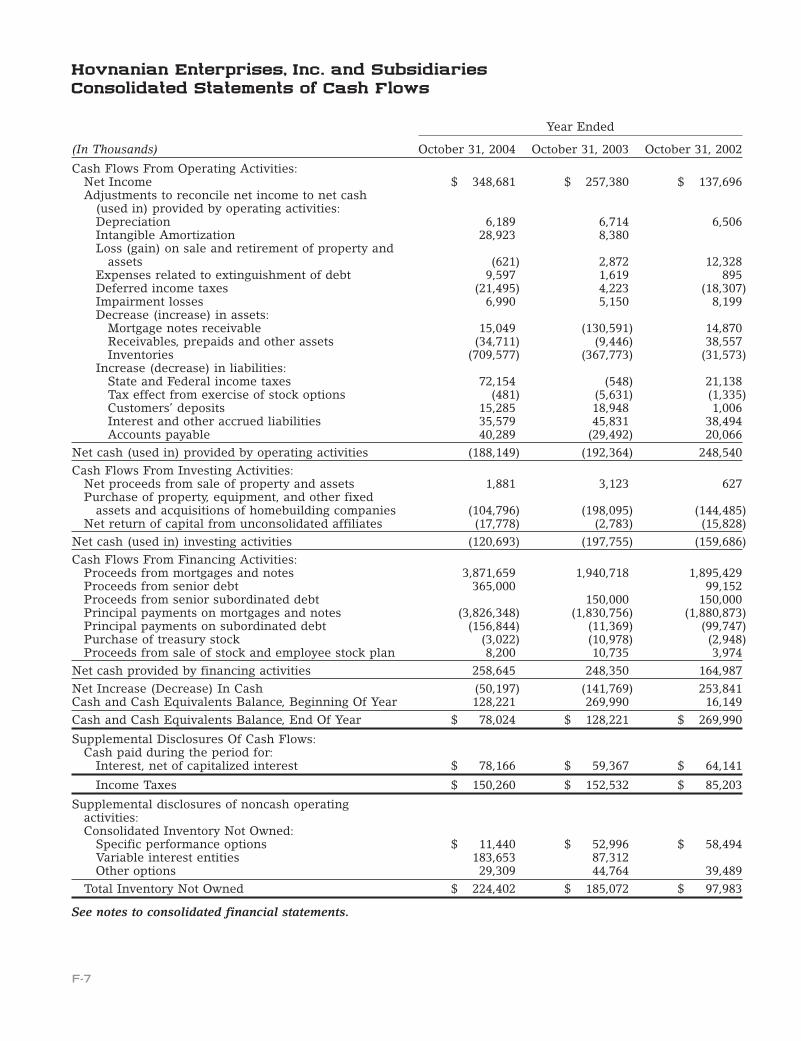
Hovnanian Enterprises, Inc. and SubsidiariesConsolidated Statements of Cash Flows
Year Ended
(In Thousands) October 31, 2004 October 31, 2003 October 31, 2002
Cash Flows From Operating Activities:Net Income $ 348,681 $ 257,380 $ 137,696Adjustments to reconcile net income to net cash
(used in) provided by operating activities:Depreciation 6,189 6,714 6,506Intangible Amortization 28,923 8,380Loss (gain) on sale and retirement of property and
assets (621) 2,872 12,328Expenses related to extinguishment of debt 9,597 1,619 895Deferred income taxes (21,495) 4,223 (18,307)Impairment losses 6,990 5,150 8,199Decrease (increase) in assets:
Mortgage notes receivable 15,049 (130,591) 14,870Receivables, prepaids and other assets (34,711) (9,446) 38,557Inventories (709,577) (367,773) (31,573)
Increase (decrease) in liabilities:State and Federal income taxes 72,154 (548) 21,138Tax effect from exercise of stock options (481) (5,631) (1,335)Customers’ deposits 15,285 18,948 1,006Interest and other accrued liabilities 35,579 45,831 38,494Accounts payable 40,289 (29,492) 20,066
Net cash (used in) provided by operating activities (188,149) (192,364) 248,540Cash Flows From Investing Activities:
Net proceeds from sale of property and assets 1,881 3,123 627Purchase of property, equipment, and other fixed
assets and acquisitions of homebuilding companies (104,796) (198,095) (144,485)Net return of capital from unconsolidated affiliates (17,778) (2,783) (15,828)
Net cash (used in) investing activities (120,693) (197,755) (159,686)Cash Flows From Financing Activities:
Proceeds from mortgages and notes 3,871,659 1,940,718 1,895,429Proceeds from senior debt 365,000 99,152Proceeds from senior subordinated debt 150,000 150,000Principal payments on mortgages and notes (3,826,348) (1,830,756) (1,880,873)Principal payments on subordinated debt (156,844) (11,369) (99,747)Purchase of treasury stock (3,022) (10,978) (2,948)Proceeds from sale of stock and employee stock plan 8,200 10,735 3,974
Net cash provided by financing activities 258,645 248,350 164,987Net Increase (Decrease) In Cash (50,197) (141,769) 253,841Cash and Cash Equivalents Balance, Beginning Of Year 128,221 269,990 16,149Cash and Cash Equivalents Balance, End Of Year $ 78,024 $ 128,221 $ 269,990
Supplemental Disclosures Of Cash Flows:Cash paid during the period for:
Interest, net of capitalized interest $ 78,166 $ 59,367 $ 64,141
Income Taxes $ 150,260 $ 152,532 $ 85,203
Supplemental disclosures of noncash operatingactivities:Consolidated Inventory Not Owned:
Specific performance options $ 11,440 $ 52,996 $ 58,494Variable interest entities 183,653 87,312Other options 29,309 44,764 39,489
Total Inventory Not Owned $ 224,402 $ 185,072 $ 97,983
See notes to consolidated financial statements.
F-7
HOVNANIAN ENTERPRISES, INC. AND SUBSIDIARIES
Notes to Consolidated Financial StatementsFor the Years Ended October 31, 2004, 2003, and 2002
1. Basis of Presentation and Segment Information
Basis of Presentation—The accompanying Consolidated Financial Statements include our accounts and all wholly-owned subsidiaries after elimination of all significant intercompany balances and transactions.
Segment Information—Statement of Financial Accounting Standards (SFAS) No. 131 ‘‘Disclosures About Segmentsof an Enterprise and Related Information’’ establishes standards for segment reporting based on the waymanagement organizes segments within a company for making operating decisions and assessing performance.Our financial reporting segments consist of homebuilding, financial services, and corporate. Our homebuildingoperations comprise the most substantial part of our business, with approximately 98% of consolidated revenuesin the years ended October 31, 2004, 2003, and 2002 contributed by the homebuilding operations. We are aDelaware corporation, currently building and selling homes in more than 275 new home communities in NewJersey, Pennsylvania, New York, Ohio, Virginia, West Virginia, Maryland, North Carolina, South Carolina, Florida,Texas, Arizona, and California. We have also begun planning for new communities in Minnesota and Delaware.We offer a wide variety of homes that are designed to appeal to first-time buyers, first and second-time move-upbuyers, luxury buyers, active adult buyers and empty nesters. Our financial services operations provide mortgagebanking and title services to the homebuilding operations’ customers. We do not retain or service the mortgagesthat we originate but rather, sell the mortgages and related servicing rights to investors. Corporate primarilyincludes the operations of our corporate office whose primary purpose is to provide executive services,accounting, information services, human resources, management reporting, training, cash management, internalaudit, risk management, and administration of process redesign, quality and safety. Assets, liabilities, revenuesand expenses of our reportable segments are separately included in the Consolidated Balance Sheets andConsolidated Statements of Income.
2. Summary of Significant Accounting Policies
Use of Estimates—The preparation of financial statements in conformity with U. S. generally accepted accountingprinciples requires management to make estimates and assumptions that affect the reported amounts of assetsand liabilities and disclosure of contingent assets and liabilities at the date of the financial statements and thereported amounts of revenues and expenses during the reporting period. Actual results could differ from thoseestimates and these differences could have a significant impact on the financial statements.
Business Combinations—When we make an acquisition of another company, we use the purchase method ofaccounting in accordance with the Statement of Financial Accounting Standards (‘‘SFAS’’) No. 141 ‘‘BusinessCombinations’’ (‘‘SFAS 141’’). Under SFAS No. 141 (for acquisitions subsequent to June 30, 2001) and AccountingPrinciples Board (‘‘APB’’) Opinion 16 (for acquisitions prior to June 30, 2001), we record as our cost the estimatedfair value of the acquired assets less liabilities assumed. Any difference between the cost of an acquired companyand the sum of the fair values of tangible and intangible assets less liabilities is recorded as goodwill. Thereported income of an acquired company includes the operations of the acquired company from the date ofacquisition.
Income Recognition from Home and Land Sales—Income from home and land sales are recorded when title isconveyed to the buyer, adequate cash payment has been received and there is no continued involvement.
Income Recognition from Mortgage Loans—Profits and losses relating to the sale of mortgage loans are recognizedwhen legal control passes to the buyer and the sales price is collected.
F-8

HOVNANIAN ENTERPRISES, INC. AND SUBSIDIARIES
Notes to Consolidated Financial StatementsFor the Years Ended October 31, 2004, 2003, and 2002
Interest Income Recognition for Mortgage Loans Receivable and Recognition of Related Deferred Fees and Costs—Interest income is recognized as earned for each mortgage loan during the period from the loan closing date tothe sale date when legal contract passes to the buyer and the sale price is collected. All fees related to theorigination of mortgage loans and direct loan origination costs are deferred and recorded as either (a) anadjustment to the related mortgage loans upon the closing of a loan or (b) recognized as a deferred asset ordeferred revenue while the loan is in process. These fees and costs include loan origination fees, loan discount,and salaries and wages. Such deferred fees and costs relating to the closed loans are recognized over the life ofthe loans as an adjustment of yield or taken into operations under sale of the loan to a permanent investor.
Cash and Cash Equivalents—Cash and cash equivalents include cash deposited in checking accounts, overnightrepurchase agreements, certificates of deposit, Treasury bills and government money market funds with originalmaturities of 90 days or less when purchased. The Company’s cash balances are held primarily at one financialinstitution and may, at times, exceed insurable amounts. The Company believes it mitigates its risk by investing inor through a major financial institution.
Fair Value of Financial Instruments—The fair value of financial instruments is determined by reference to variousmarket data and other valuation techniques as appropriate. Our financial instruments consist of cash equivalents,receivables, customer deposits and notes, accounts payable and other liabilities, mortgages and notes receivable,mortgages and notes payable, our revolving credit agreement, our term loan, and the senior and seniorsubordinated notes payable. The fair value of both the Senior Notes and Senior Subordinated Notes is estimatedbased on the quoted market prices for the same or similar issues or on the current rates offered to us for debt ofthe same remaining maturities. The fair value of the Senior Notes and Senior Subordinated Notes is estimated at$645.9 million and $329.3 million, respectively, as of October 31, 2004. Unless otherwise disclosed, the fair valueof financial instruments approximates their recorded values.
Inventories—Inventories and long-lived assets held for sale are recorded at the lower of cost or fair value lessselling costs. Fair value is defined as the amount at which an asset could be bought or sold in a currenttransaction between willing parties, that is, other than in a forced or liquidation sale. Construction costs areaccumulated during the period of construction and charged to cost of sales under specific identification methods.Land, land development, and common facility costs are allocated based on buildable acres to product types withineach community, then charged to cost of sales equally based upon the number of homes to be constructed ineach product type. For inventories of communities under development, a loss is recorded when events andcircumstances indicate impairment and the undiscounted future cash flows generated are less than the relatedcarrying amounts. The impairment loss is based on discounted future cash flows generated from expectedrevenue, cost to complete including interest, and selling costs.
Insurance Deductible Reserves—Our deductible is $150,000 per occurrence for worker’s compensation and generalliability insurance. Reserves have been established based upon actuarial analysis of estimated future lossesduring 2004 and 2003. For fiscal 2005, our deductible increases to $5 million per occurrence for general liabilityinsurance and $500,000 per occurrence for worker’s compensation insurance.
Interest—Costs related to properties under development are capitalized during the land development and homeconstruction period and expensed as cost of sales interest as the related inventories are sold. Costs related toproperties not under development are charged to interest expense separately in the Consolidated Statements ofIncome.
F-9
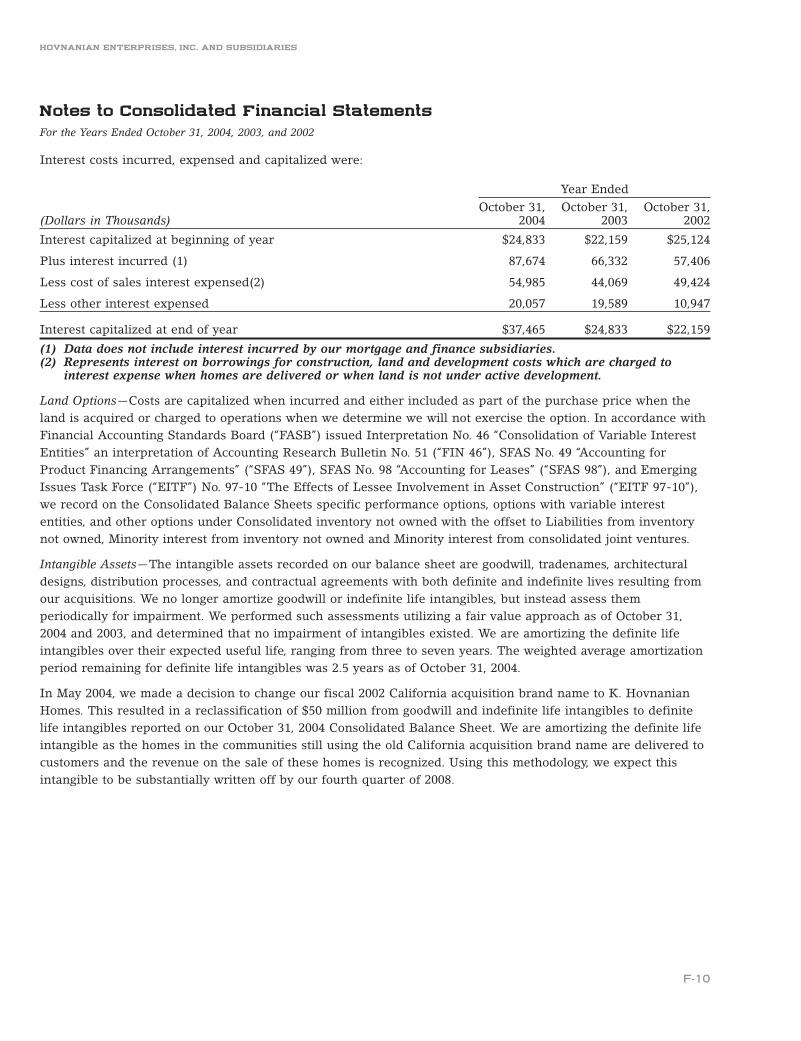
HOVNANIAN ENTERPRISES, INC. AND SUBSIDIARIES
Notes to Consolidated Financial StatementsFor the Years Ended October 31, 2004, 2003, and 2002
Interest costs incurred, expensed and capitalized were:
Year EndedOctober 31, October 31, October 31,
(Dollars in Thousands) 2004 2003 2002
Interest capitalized at beginning of year $24,833 $22,159 $25,124
Plus interest incurred (1) 87,674 66,332 57,406
Less cost of sales interest expensed(2) 54,985 44,069 49,424
Less other interest expensed 20,057 19,589 10,947
Interest capitalized at end of year $37,465 $24,833 $22,159
(1) Data does not include interest incurred by our mortgage and finance subsidiaries.(2) Represents interest on borrowings for construction, land and development costs which are charged to
interest expense when homes are delivered or when land is not under active development.
Land Options—Costs are capitalized when incurred and either included as part of the purchase price when theland is acquired or charged to operations when we determine we will not exercise the option. In accordance withFinancial Accounting Standards Board (‘‘FASB’’) issued Interpretation No. 46 ‘‘Consolidation of Variable InterestEntities’’ an interpretation of Accounting Research Bulletin No. 51 (‘‘FIN 46’’), SFAS No. 49 ‘‘Accounting forProduct Financing Arrangements’’ (‘‘SFAS 49’’), SFAS No. 98 ‘‘Accounting for Leases’’ (‘‘SFAS 98’’), and EmergingIssues Task Force (‘‘EITF’’) No. 97-10 ‘‘The Effects of Lessee Involvement in Asset Construction’’ (‘‘EITF 97-10’’),we record on the Consolidated Balance Sheets specific performance options, options with variable interestentities, and other options under Consolidated inventory not owned with the offset to Liabilities from inventorynot owned, Minority interest from inventory not owned and Minority interest from consolidated joint ventures.
Intangible Assets—The intangible assets recorded on our balance sheet are goodwill, tradenames, architecturaldesigns, distribution processes, and contractual agreements with both definite and indefinite lives resulting fromour acquisitions. We no longer amortize goodwill or indefinite life intangibles, but instead assess themperiodically for impairment. We performed such assessments utilizing a fair value approach as of October 31,2004 and 2003, and determined that no impairment of intangibles existed. We are amortizing the definite lifeintangibles over their expected useful life, ranging from three to seven years. The weighted average amortizationperiod remaining for definite life intangibles was 2.5 years as of October 31, 2004.
In May 2004, we made a decision to change our fiscal 2002 California acquisition brand name to K. HovnanianHomes. This resulted in a reclassification of $50 million from goodwill and indefinite life intangibles to definitelife intangibles reported on our October 31, 2004 Consolidated Balance Sheet. We are amortizing the definite lifeintangible as the homes in the communities still using the old California acquisition brand name are delivered tocustomers and the revenue on the sale of these homes is recognized. Using this methodology, we expect thisintangible to be substantially written off by our fourth quarter of 2008.
F-10
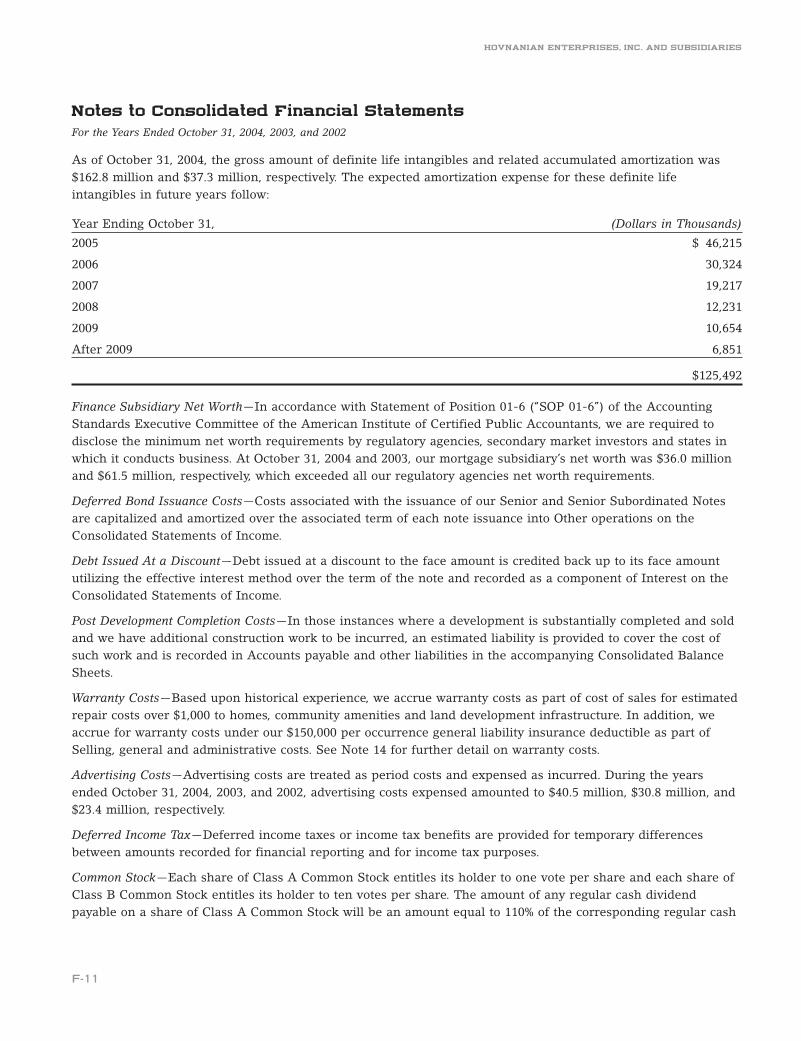
HOVNANIAN ENTERPRISES, INC. AND SUBSIDIARIES
Notes to Consolidated Financial StatementsFor the Years Ended October 31, 2004, 2003, and 2002
As of October 31, 2004, the gross amount of definite life intangibles and related accumulated amortization was$162.8 million and $37.3 million, respectively. The expected amortization expense for these definite lifeintangibles in future years follow:
Year Ending October 31, (Dollars in Thousands)
2005 $ 46,215
2006 30,324
2007 19,217
2008 12,231
2009 10,654
After 2009 6,851
$125,492
Finance Subsidiary Net Worth—In accordance with Statement of Position 01-6 (‘‘SOP 01-6’’) of the AccountingStandards Executive Committee of the American Institute of Certified Public Accountants, we are required todisclose the minimum net worth requirements by regulatory agencies, secondary market investors and states inwhich it conducts business. At October 31, 2004 and 2003, our mortgage subsidiary’s net worth was $36.0 millionand $61.5 million, respectively, which exceeded all our regulatory agencies net worth requirements.
Deferred Bond Issuance Costs—Costs associated with the issuance of our Senior and Senior Subordinated Notesare capitalized and amortized over the associated term of each note issuance into Other operations on theConsolidated Statements of Income.
Debt Issued At a Discount—Debt issued at a discount to the face amount is credited back up to its face amountutilizing the effective interest method over the term of the note and recorded as a component of Interest on theConsolidated Statements of Income.
Post Development Completion Costs—In those instances where a development is substantially completed and soldand we have additional construction work to be incurred, an estimated liability is provided to cover the cost ofsuch work and is recorded in Accounts payable and other liabilities in the accompanying Consolidated BalanceSheets.
Warranty Costs—Based upon historical experience, we accrue warranty costs as part of cost of sales for estimatedrepair costs over $1,000 to homes, community amenities and land development infrastructure. In addition, weaccrue for warranty costs under our $150,000 per occurrence general liability insurance deductible as part ofSelling, general and administrative costs. See Note 14 for further detail on warranty costs.
Advertising Costs—Advertising costs are treated as period costs and expensed as incurred. During the yearsended October 31, 2004, 2003, and 2002, advertising costs expensed amounted to $40.5 million, $30.8 million, and$23.4 million, respectively.
Deferred Income Tax—Deferred income taxes or income tax benefits are provided for temporary differencesbetween amounts recorded for financial reporting and for income tax purposes.
Common Stock—Each share of Class A Common Stock entitles its holder to one vote per share and each share ofClass B Common Stock entitles its holder to ten votes per share. The amount of any regular cash dividendpayable on a share of Class A Common Stock will be an amount equal to 110% of the corresponding regular cash
F-11
HOVNANIAN ENTERPRISES, INC. AND SUBSIDIARIES
Notes to Consolidated Financial StatementsFor the Years Ended October 31, 2004, 2003, and 2002
dividend payable on a share of Class B Common Stock. If a shareholder desires to sell shares of Class B CommonStock, such stock must be converted into shares of Class A Common Stock.
In March 2004, our Board of Directors authorized a 2-for-1 stock split in the form of a 100% stock dividend ofClass A and Class B Common Stock payable to stockholders of record on March 19, 2004. The additional shareswere distributed on March 26, 2004. All share and per share amounts (except par value) have been retroactivelyadjusted to reflect the stock split. There was no net affect on total stockholders’ equity as a result of the stocksplit.
In July 2001, our Board of Directors authorized a stock repurchase program to purchase up to 4 million shares ofClass A Common Stock. As of October 31, 2004, 1.9 million shares have been purchased under this program, ofwhich 0.1 million and 0.6 million were repurchased during the twelve months ended October 31, 2004 and 2003,respectively. In addition, during the twelve months ended October 31, 2003, we retired at no cost 1.5 millionshares that were held by a seller of a previous acquisition.
Depreciation—Property, plant and equipment are depreciated using the straight-line method over the estimateduseful life of the assets.
Prepaid Expenses—Prepaid expenses which relate to specific housing communities (model setup, architecturalfees, homeowner warranty program fees, etc.) are amortized to costs of sales as the applicable inventories aresold. All other prepaid expenses are amortized over a specific time period or as used and charged to overheadexpense.
Stock Options—SFAS No. 123 ‘‘Accounting for Stock-Based Compensation’’, (‘‘SFAS 123’’) establishes a fair value-based method of accounting for stock-based compensation plans, including stock options and non-vesting stock.Registrants may elect to continue accounting for stock option plans under APB Opinion No. 25 ‘‘Accounting forStock Issued to Employees’’ (‘‘APB 25’’), but are required to provide pro forma net income and earnings per shareinformation ‘‘as if’’ the new fair value approach had been adopted. Under APB 25, no compensation expense isrecognized when the exercise price of our employee stock options equals the market price of the underlyingstock on the date of grant (see Note 13). However, for non-vested stock, compensation expense equal to themarket price of the stock on the grant date is recognized ratably over the vesting period.
In December 2002, the FASB issued SFAS No. 148, ‘‘Accounting for Stock-Based Compensation—Transition andDisclosure’’ (‘‘SFAS 148’’). SFAS 148 amends SFAS 123 to provide alternative methods of transition for an entitythat voluntarily adopts the fair value recognition method of recording stock option expense. SFAS 148 alsoamends the disclosure provisions of SFAS 123 and APB Opinion No. 28, ‘‘Interim Financial Reporting’’ to requiredisclosure in the summary of significant accounting policies of the effects of an entity’s accounting policy withrespect to stock-based compensation on reported net income and earnings per share in annual and interimfinancial statements.
F-12

HOVNANIAN ENTERPRISES, INC. AND SUBSIDIARIES
Notes to Consolidated Financial StatementsFor the Years Ended October 31, 2004, 2003, and 2002
For purposes of pro forma disclosures, the estimated fair value of the options using Black-Scholes is amortized toexpense over the options’ vesting period. Our pro forma information follows (dollars in thousands except forearnings per share information):
Year EndedOctober 31, October 31, October 31,
2004 2003 2002
Net income to common shareholders; as reported $348,681 $257,380 $137,696
Deduct: total stock-based employee compensation expense determinedunder fair value based method for all awards, net of minority interest 4,477 2,075 560
Pro forma net income $344,204 $255,305 $137,136
Pro forma basic earnings per share $ 5.56 $ 4.12 $ 2.26
Basic earnings per share as reported $ 5.63 $ 4.16 $ 2.26
Pro forma diluted earnings per share $ 5.28 $ 3.90 $ 2.13
Diluted earnings per share as reported $ 5.35 $ 3.93 $ 2.14
Pro forma information regarding net income and earnings per share is calculated as if we had accounted for ourstock-based compensation under the fair value method of SFAS No. 123. The fair value for those options isestablished at the date of grant using a Black-Scholes option pricing model with the following weighted-averageassumptions for 2004, 2003, and 2002: risk-free interest rate of 4.2%, 4.3%, and 4.3%, respectively; dividend yieldof zero; volatility factor of the expected market price of our common stock of 0.48, 0.43, and 0.43, respectively;and a weighted-average expected life of the option of 5.0, 5.1, and 5.5 years, respectively.
The Black-Scholes option valuation model was developed for use in estimating the fair value of traded options,which have no vesting restrictions and are fully transferable. In addition, option valuation models require theinput of highly subjective assumptions including the expected stock price volatility. Because our employee stockoptions have characteristics significantly different from those of our traded options, and changes in the subjectiveinput assumptions can materially affect the fair value estimate, management believes the existing models do notnecessarily provide a reliable measure of the fair value of its employee stock options.
In December 2004, the FASB issued SFAS No. 123 (Revised 2004) ‘‘Share Based Payment’’ (‘‘SFAS 123R’’), which isa revision of SFAS 123 and supersedes APB 25 and SFAS 148. This statement requires that the cost resultingfrom all share-based payment transactions be recognized in the financial statements. This statement establishesfair value as the measurement objective in accounting for share-based payment arrangements and requires allentities to apply a fair value based measurement method in accounting for share-based payment transactionswith employees except for equity instruments held by employee share ownership plans.
SFAS 123R applies to all awards granted after the required effective date (the beginning of the first interim orannual reporting period that begins after June 15, 2005) and to awards modified, repurchased, or cancelled afterthat date. As of the required effective date, all public entities that used the fair value based method for eitherrecognition or disclosure under Statement 123 will apply this Statement using a modified version of prospectiveapplication. Under that transition method, compensation cost is recognized on or after the required effective datefor the portion of outstanding awards for which the requisite service has not yet been rendered, based on thegrant-date fair value of those awards calculated under Statement 123 for either recognition or pro formadisclosures. For periods before the required effective date, those entities may elect to apply a modified version of
F-13

HOVNANIAN ENTERPRISES, INC. AND SUBSIDIARIES
Notes to Consolidated Financial StatementsFor the Years Ended October 31, 2004, 2003, and 2002
the retrospective application under which financial statements for prior periods are adjusted on a basisconsistent with the pro forma disclosures required for those periods by Statement 123. As a result, beginning inour fiscal fourth quarter of 2005, we will adopt SFAS 123R and begin reflecting the stock option expensedetermined under fair value based methods in our income statement rather than as pro forma disclosure in thenotes to the financial statements. We expect the effect of adopting SFAS 123R to be similar to the effectrepresented in our proforma disclosure related to SFAS 123.
Per Share Calculations—Basic earnings per common share is computed using the weighted average number ofshares outstanding. Diluted earnings per common share is computed using the weighted average number ofshares outstanding adjusted for the incremental shares attributed to outstanding options to purchase commonstock shares and non-vested common stock of approximately 3.2 million, 3.6 million, and 3.5 million for the yearsended October 31, 2004, 2003, and 2002, respectively.
Computer Software Development—We capitalize certain costs incurred in connection with developing or obtainingsoftware for internal use. Upon entering the application and development phase, the capitalized costs areamortized over the systems estimated useful life. For the year ended October 31, 2002, we recorded amortizationexpense of the SAP system in the amount of approximately $2.0 million based on an estimated useful life of10 years. We also wrote off the majority of the capitalized costs associated with the development andimplementation of the SAP systems during the year ended October 31, 2002, totaling $12.4 million pretaxincluded in other operations in the accompanying Consolidated Statements of Income, or $7.6 million after taxesequal to $0.12 per fully diluted share. Such costs were written off as a result of the decision to not use the SAPsoftware after October 31, 2003. Certain costs in the amount of $2.0 million related to active communities usingthe SAP software were not written off in 2002, but were amortized over the life of these communities. As ofOctober 31, 2003, all costs associated with the SAP software had been expensed.
Accounting for Derivative Instruments and Hedging Activities—In April 2003, the Financial Accounting StandardsBoard issued (SFAS) No. 149, ‘‘Amendment of Derivative Instruments and Hedging Activities’’. SFAS 149 amendsand clarifies financial accounting and reporting for derivative instruments, including certain derivativeinstruments embedded in other contracts and for hedging activities that fall within the scope of SFAS 133,‘‘Accounting for Derivative Instruments and Hedging Activities.’’ SFAS 149 also amends certain other existingpronouncements, which will result in more consistent reporting of contracts that are derivatives in their entiretyor that contain embedded derivatives that warrant separate accounting. SFAS 149 is effective for contractsentered into or modified after June 30, 2003. The adoption of SFAS 149 did not have a material effect on ourfinancial position or results of operations.
In May 2003, the FASB issued SFAS No. 150, ‘‘Accounting for Certain Financial Instruments with Characteristicsof both Liabilities and Equity’’ (‘‘SFAS 150’’). This statement establishes how an issuer classifies and measurescertain financial instruments that have characteristics of both liabilities and equity. It requires that an issuerclassify a financial instrument that is within the scope of SFAS 150 as a liability because that financial instrumentembodies an obligation of the issuer. For the Company, SFAS 150 was effective the beginning of the first interimperiod beginning after June 15, 2003. The Company currently controls several finite life partnerships which areincluded in the consolidated accounts of the Company. The application of SFAS 150 as it relates to finite lifeentities has been deferred indefinitely and therefore the Company has not applied SFAS 150 to the minorityinterest of these partnerships. Based on the estimated value of the assets owned by the partnerships atOctober 31, 2004, the Company estimates that the minority interest in these partnerships would be entitled toreceive approximately its current carrying value upon the dissolution of the partnership. The adoption ofSFAS 150 did not have a material effect on our financial position or results of operations.
F-14

HOVNANIAN ENTERPRISES, INC. AND SUBSIDIARIES
Notes to Consolidated Financial StatementsFor the Years Ended October 31, 2004, 2003, and 2002
In March 2004, the Securities and Exchange Commission staff issued Staff Accounting Bulletin 105 (‘‘SAB 105’’).Existing accounting guidance requires an entity to record on its balance sheet the fair value of any issued andoutstanding mortgage loan commitments. SAB 105 requires that the fair value measurement include onlydifferences between the guaranteed interest rate in the loan commitment and a market interest rate, excludingany future cash flows related to (i) expected fees to be received when the loan commitment becomes a loan,(ii) gains from selling the loan, or (iii) the servicing value created from the loan. The guidance in SAB 105 mustbe applied to mortgage loan commitments that are accounted for as derivatives and are entered into afterMarch 31, 2004. The adoption of the guidance in SAB 105 did not have a material adverse effect on our financialposition or results of operations.
We manage our interest rate risk on mortgage loans held for sale and our estimated future commitments tooriginate and close mortgage loans at fixed prices through the use of best-efforts whole loan deliverycommitments. These instruments are classified as derivatives and generally have maturities of three months orless. Accordingly, gains and losses are recognized in current earnings during the period of change.
Reclassifications—Certain amounts in the 2003 and 2002 Consolidated Financial Statements have been reclassifiedto conform to the 2004 presentation.
3. Leases
We lease certain property under non-cancelable leases. Office leases are generally for terms of three to five yearsand generally provide renewal options. Model home leases are generally for shorter terms approximately one tothree years with renewal options on a month-to-month basis. In most cases, we expect that in the normal courseof business, leases that will expire will be renewed or replaced by other leases. The future lease paymentsrequired under operating leases that have initial or remaining non-cancelable terms in excess of one year are asfollows:
Years Ending October 31, (Dollars in Thousands)
2005 $ 9,974
2006 7,365
2007 5,870
2008 3,386
2009 1,568
After 2009 3,181
$31,344
4. Property
Homebuilding property, plant, and equipment consists of land, land improvements, buildings, buildingimprovements, furniture and equipment used to conduct day to day business and are recorded at cost lessaccumulated depreciation. Homebuilding accumulated depreciation related to these assets at October 31, 2004and October 31, 2003 amounted to $27.8 million and $23.9 million, respectively. In addition we have two seniorcitizen residential rental communities included in prepaid and other assets on the accompanying ConsolidatedBalance Sheets. Accumulated depreciation on senior residential rental properties at October 31, 2004 andOctober 31, 2003 amounted to $3.9 million and $3.5 million, respectively.
F-15

HOVNANIAN ENTERPRISES, INC. AND SUBSIDIARIES
Notes to Consolidated Financial StatementsFor the Years Ended October 31, 2004, 2003, and 2002
5. Deposits
We hold escrow cash, included in cash and cash equivalents on the Consolidated Balance Sheets, amounting to$17.1 million and $8.0 million at October 31, 2004 and October 31, 2003, respectively, which primarily representscustomers’ deposits which are restricted from use by us. We are able to release other escrow cash by pledgingletters of credit and surety bonds. Escrow cash accounts are substantially invested in short-term certificates ofdeposit, time deposits, or money market accounts. The remaining deposits are not restricted from use by us.
6. Mortgage Loans Held for Sale
Our wholly-owned mortgage banking subsidiary originates mortgage loans, primarily from the sale of our homes.Such mortgage loans are sold in the secondary mortgage market with servicing released. At October 31, 2004 and2003, respectively, $209.2 million and $223.9 million of such mortgages were pledged against our mortgagewarehouse line (see Note 7). We may incur risk with respect to mortgages that are delinquent, but only to theextent the losses are not covered by mortgage insurance or resale value of the home. Historically, we haveincurred minimal credit losses. The mortgage loans held for sale are carried at the lower of cost or market value,determined on an aggregate basis. There was no valuation adjustment at October 31, 2004 or 2003.
7. Mortgages and Notes Payable
The construction loans for our new Corporate Headquarters are secured by the real property and anyimprovements. The carrying value of these assets are $17.4 million at October 31, 2004. These loans haveinstallment obligations with annual principal maturities in the following years ending October 31, ofapproximately $0.6 million in 2005, $0.7 million in 2006, 2007, and 2008, $0.8 million in 2009, and $21.4 millionafter 2009. The interest rate on these obligations are 5.67% and 8.82%.
Our amended and restated unsecured Revolving Credit Agreement (‘‘Agreement’’) with a group of banks providesa revolving credit line of $900 million through July 2008. The facility contains an accordion feature under whichthe aggregate commitment can be increased to $1.0 billion subject to the availability of additional commitments.Interest is payable monthly at various rates of either the prime rate or a spread over LIBOR ranging from 1.10%to 2.00% per annum, depending on our consolidated Leverage Ratio, as defined in the Agreement. In addition, wepay a fee ranging from 0.20% to 0.40% per annum, depending on our consolidated Leverage Ratio and theweighted average unused portion of the revolving credit line. Each of our significant subsidiaries, except for ourtitle insurance and mortgage subsidiaries and joint ventures, is a guarantor under the Agreement. As ofOctober 31, 2004 and October 31, 2003, the outstanding balances under the Agreement were $115.0 million andzero, respectively.
Average interest rates and average balances outstanding under the Agreement are as follows:
Year Ended(Dollars in Thousands) October 31, 2004 October 31, 2003 October 31, 2002
Average monthly outstanding borrowings $114,846 $ 2,485 $10,717
Average interest rate during period 4.3% 4.5% 4.4%
Average interest rate at end of period(1) 3.6% 2.8% 3.6%
Maximum outstanding at any month end $335,650 $29,800 $36,425
(1) Average interest rate at the end of the period excludes any charges on unused loan balances.
F-16

HOVNANIAN ENTERPRISES, INC. AND SUBSIDIARIES
Notes to Consolidated Financial StatementsFor the Years Ended October 31, 2004, 2003, and 2002
On January 22, 2002, we issued a $165 million five year Term Loan. The Term Loan was scheduled to matureJanuary 22, 2007, and bore interest at either the prime rate plus 1.25% or LIBOR plus 2.5%. The proceeds fromthe issuance of the Term Loan were primarily used to partially fund our California acquisition on January 10,2002. Each of our significant subsidiaries, except for our title insurance and mortgage subsidiaries and jointventures, is a guarantor under the Term Loan. As of October 31, 2003, borrowings under the Term Loan were$115 million. On March 18, 2004, we paid off this Term Loan as discussed further in Note 8.
Our amended secured mortgage loan warehouse agreement with a group of banks, which is a short-termborrowing, provides up to $250 million through July 2005. Interest is payable monthly at the Eurodollar Rate plus1.25%. The loan is repaid when the underlying mortgage loans are sold to permanent investors by us. As ofOctober 31, 2004 and October 31, 2003, borrowings under the agreement were $188.4 million and $166.7 million,respectively.
8. Senior and Senior Subordinated Notes
Senior Notes and Senior Subordinated Notes balances as of October 31, 2004 and 2003 were as follows:
(In Thousands) October 31, 2004 October 31, 2003
Senior Notes:
101⁄2% Senior Notes due October 1, 2007 (net of discount) $138,428 $137,922
91⁄8% Senior Notes due May 1, 2009 — 150,000
8% Senior Notes due April 1, 2012 (net of discount) 99,309 99,244
61⁄2% Senior Notes due January 15, 2014 215,000 —
63⁄8% Senior Notes due December 15, 2014 150,000 —
Total Senior Notes $602,737 $387,166
Senior Subordinated Notes:
87⁄8% Senior Subordinated Notes due April 1, 2012 $150,000 $150,000
73⁄4% Senior Subordinated Notes due May 15, 2013 150,000 150,000
Total Senior Subordinated Notes $300,000 $300,000
On June 7, 1993, we issued $100 million principal amount of 93⁄4% Subordinated Notes due June 1, 2005. InApril 2001, we retired $0.3 million of these notes. Interest is payable semi-annually. The notes were redeemablein whole or in part at our option, initially at 104.875% of their principal amount on or after June 1, 1999 andreducing to 100% of their principal amount on or after June 1, 2002. On April 29, 2002, we used a portion of theproceeds from our March 2002 debt issuance (see below) to redeem the remainder of these notes. We recorded$0.9 million of expenses associated with the early extinguishment of this debt in ‘‘Expenses Related toExtinguishment of Debt’’ on the Consolidated Statement of Income in 2002.
On May 4, 1999, we issued $150 million principal amount of 91⁄8% Senior Notes due May 1, 2009. Interest waspayable semi-annually. The notes were redeemed on May 3, 2004 as discussed further below.
On October 2, 2000, we issued $150 million principal amount of 101⁄2% Senior Notes due October 1, 2007. Duringthe year ended October 31, 2003, we paid down $9.8 million of these notes. We recorded $1.6 million of expensesassociated with the early extinguishment of the debt in ‘‘Expenses Related to Extinguishment of Debt’’ on the
F-17

HOVNANIAN ENTERPRISES, INC. AND SUBSIDIARIES
Notes to Consolidated Financial StatementsFor the Years Ended October 31, 2004, 2003, and 2002
Consolidated Statement of Income in 2003. The 101⁄2% Senior Notes were issued at a discount to yield 11% andhave been reflected net of the unamortized discount in the accompanying Consolidated Balance Sheets. Interestis payable semi-annually. The notes are redeemable in whole or in part, at any time, at our option at 100% oftheir principal amount upon payment of a make-whole price.
On March 26, 2002, we issued $100 million 8% Senior Notes due 2012 and $150 million 87⁄8% Senior SubordinatedNotes due 2012. The 8% Senior Notes were issued at a discount to yield 8.125% and have been reflected net of theunamortized discount in the accompanying Consolidated Balance Sheets. Interest on both notes is paidsemi-annually. The notes are redeemable in whole or in part, at any time on or after April 1, 2007, at our optionat redemption prices expressed as percentages of principal amount that decline to 100% on April 1, 2010. Theproceeds were used to redeem the remaining 93⁄4% Subordinated Notes (see above), repay a portion of our TermLoan Facility (see Note 7), repay the current outstanding indebtedness under our Revolving Credit Agreement,and the remainder for general corporate purposes.
On May 9, 2003, we issued $150 million 73⁄4% Senior Subordinated Notes due 2013. The notes are redeemable inwhole or in part, at any time on or after May 15, 2008, at redemption prices expressed as percentages of principalamount that decline to 100% on May 15, 2011. The net proceeds of the note offering were used to repay thecurrent outstanding indebtedness under the Revolving Credit Agreement and the remainder for general corporatepurposes.
On November 3, 2003, we issued $215 million 61⁄2% Senior Notes due 2014. The notes are redeemable in whole orin part at our option at 100% of their principal amount upon payment of a make-whole price. The net proceeds ofthe issuance were used for general corporate purposes.
On March 18, 2004, we issued $150 million 63⁄8% Senior Notes due 2014. The notes are redeemable in whole or inpart at our option at 100% of their principal amount upon payment of a make-whole price. The net proceeds ofthe issuance were used to redeem all of our $150 million outstanding 91⁄8% Senior Notes due 2009, which occurredon May 3, 2004 and for general corporate purposes. Also on March 18, 2004, we paid off our $115 million TermLoan with available cash. The redemption of the Senior Notes and the payoff of the Term Loan resulted inexpenses due to the early extinguishment of debt of $8.7 million and $0.9 million, respectively, before taxes,which have been reported as ‘‘Expenses Related to Extinguishment of Debt’’ on our Consolidated Statements ofIncome.
As a subsequent event to our October 31, 2004 Consolidated Balance Sheet, on November 30, 2004, we issued$200 million 61⁄4% Senior Notes due 2015 and $100 million 6% Senior Subordinated Notes due 2010. The notes areredeemable in whole or in part at our option at 100% of their principal amount upon payment of a make-wholeprice. The net proceeds of the issuance were used to repay the outstanding balance on our Revolving CreditFacility and for general corporate purposes.
The indentures relating to the Senior and Subordinated Notes and the Revolving Credit Agreement contain aCompany guarantee (see Note 21) and restrictions on the payment of cash dividends. At October 31, 2004,$573.7 million of retained earnings were free of such restrictions.
At October 31, 2004, we had total issued and outstanding $905.2 million ($902.7 million, net of discount) Seniorand Senior Subordinated Notes. These notes plus the $200.0 million Senior Notes and $100.0 million SeniorSubordinated Notes issued November 30, 2004 have annual principal maturities in the following years endingOctober 31, of $140.2 million in 2007 and $1,065.0 million after 2008.
F-18

HOVNANIAN ENTERPRISES, INC. AND SUBSIDIARIES
Notes to Consolidated Financial StatementsFor the Years Ended October 31, 2004, 2003, and 2002
9. Retirement Plan
In December 1982, we established a defined contribution savings and investment retirement plan. Under suchplan there are no prior service costs. All associates are eligible to participate in the retirement plan and employercontributions are based on a percentage of associate contributions. Plan costs charged to operations amount to$9.2 million, $7.5 million, and $6.6 million for the years ended October 31, 2004, 2003, and 2002, respectively. Theyear over year increases are the result of increased number of participants from acquisitions and increased profitsharing contributions resulting from higher Company returns on equity.
10. Income Taxes
Income Taxes payable (receivable), including deferred benefits, consists of the following:
Year Ended
(Dollars In Thousands) October 31, 2004 October 31, 2003
State income taxes:
Current $ 13,420 $ 8,455
Deferred (11,077) (9,009)
Federal income taxes:
Current 88,775 19,999
Deferred (42,119) (20,624)
Total $ 48,999 $ (1,179)
The provision for income taxes is composed of the following charges (benefits):
Year Ended
(Dollars In Thousands) October 31, 2004 October 31, 2003 October 31, 2002
Current income tax expense:
Federal $200,857 $130,536 $ 97,347
State(1) 23,625 19,379 13,808
224,482 149,915 111,155
Deferred income tax (benefit) expense:
Federal (21,361) 6,144 (18,307)
State (2,030) (1,921) (4,814)
(23,391) 4,223 (23,121)
Total $201,091 $154,138 $ 88,034
(1) The current state income tax expense is net of the use of state loss carryforwards amounting to$32 million, $13.5 million, and $45.8 million for the years ended October 31, 2004, 2003, and 2002,respectively.
F-19

HOVNANIAN ENTERPRISES, INC. AND SUBSIDIARIES
Notes to Consolidated Financial StatementsFor the Years Ended October 31, 2004, 2003, and 2002
The deferred tax liabilities or assets have been recognized in the Consolidated Balance Sheets due to temporarydifferences as follows:
Year Ended
(Dollars In Thousands) October 31, 2004 October 31, 2003
Deferred tax assets:
Association subsidy reserves $ 570 $ 231
Inventory impairment loss 1,236 700
Uniform capitalization of overhead 14,683 5,980
Warranty, general liability and worker’s compensation reserves 8,874 7,989
Deferred Income 6,615
Acquisition intangibles 17,008 8,806
Restricted stock bonus 7,122 8,790
Provision for losses and reserves 22,829 8,952
State net operating loss carryforwards 37,438 24,816
Other 10,131 9,433
Total 126,506 75,697
Valuation allowance (37,438) (24,816)
Total deferred tax assets 89,068 50,881
Deferred tax liabilities:
Rebates and Discounts 23,745 13,437
Installment sales 1,897
Accelerated depreciation 3,620 2,816
Acquisition intangibles 5,550 4,735
Other 1,060 260
Total deferred tax liabilities 35,872 21,248
Net deferred tax assets $ 53,196 $ 29,633
The effective tax rates varied from the expected rate. The sources of these differences were as follows:
Year Ended
October 31, 2004 October 31, 2003 October 31, 2002
Computed ‘‘expected’’ tax rate 35.0% 35.0% 35.0%
State income taxes, net of Federal income tax benefit 2.4 2.7 2.6
Permanent differences (0.4) — 1.4
Low income housing tax credit (0.2) (0.3) (0.6)
Other (0.2) 0.1 0.6
Effective tax rate 36.6% 37.5% 39.0%
F-20
HOVNANIAN ENTERPRISES, INC. AND SUBSIDIARIES
Notes to Consolidated Financial StatementsFor the Years Ended October 31, 2004, 2003, and 2002
We have state net operating loss carryforwards of $458.7 million due to expire between the years October 31,2005 and October 31, 2024.
The company is currently under audit by the Internal Revenue Service for the year ended October 31, 2002.
11. Reduction of Inventory to Fair Value
We record impairment losses on inventories related to communities under development when events andcircumstances indicate that they may be impaired and the undiscounted cash flows estimated to be generated bythose assets are less than their related carrying amounts. During the year ended October 31, 2004, wewrote-down a community $1.2 million in our Northeast Region, $0.1 million in our Southeast Region, and$0.3 million in our Southwest Region. The write-down in the Northeast Region was attributed to a section of acommunity that was built in accordance with a low income housing clause. In preparation for selling thisproperty, an outside appraisal was prepared resulting in a reduction in inventory carrying amount to fair value.The write-down in our Southeast Region and Southwest Region was attributed to property that was acquired aspart of our acquisition in these Regions. A decision was made to liquidate these two properties resulting in lowersales prices.
As of October 31, 2003, inventory with a carrying amount of $3.1 million was written down by $0.7 million in ourSoutheast Region. This property was acquired as part of one of our acquisitions. In 2003, a decision was made toliquidate this property resulting in lower sales prices. As of October 31, 2002, inventory with a carrying amount of$9.4 million was written down by $4.2 million to its fair market value. This write-down was attributed to twoproperties in Poland and one community in the Mid-South. We have made a decision to discontinue sellinghomes in these two markets and offer the remaining lots for sale.
The total aggregate impairment losses, which are presented in the Consolidated Statements of Income anddeducted from inventory held for future development or sale were $1.6 million, $0.7 million, and $4.2 million forthe years ended October 31, 2004, 2003, and 2002, respectively.
On the Consolidated Statements of Income the line entitled ‘‘Homebuilding—Inventory impairment loss’’ alsoincludes write-offs of options, and approval, engineering, and capitalized interest costs. During the years endedOctober 31, 2004, 2003, and 2002 write-offs amounted to $5.4 million, $4.5 million, and $4.0 million, respectively.During the years ended October 31, 2004, 2003, and 2002 we redesigned communities, abandoning certainengineering costs, and we did not exercise options in various locations because the communities pro formaprofitability did not produce adequate returns on investment commensurate with the risk. Those communitieswere located in our Northeast Region, Southeast Region, West Region, and Poland.
12. Transactions with Related Parties
Prior to fiscal 2003, our Board of Directors had adopted a general policy providing that it would not make loansto our officers or directors or their relatives at an interest rate less than the interest rate at the date of the loanon six month U.S. Treasury Bills, that the aggregate of such loans will not exceed $3 million at any one time, andthat such loans will be made only with the approval of the members of our Board of Directors who have nointerest in the transaction. In 2003, in accordance with Sarbanes Oxley, we now prohibit any related party loans.At October 31, 2004 and 2003 related party receivables from officers and directors amounted to zero. Interestincome from these loans for the years ended October 31, 2004 and 2003, amounted to zero, and in 2002 amountedto $18,000, respectively.
F-21

HOVNANIAN ENTERPRISES, INC. AND SUBSIDIARIES
Notes to Consolidated Financial StatementsFor the Years Ended October 31, 2004, 2003, and 2002
We provided property management services to various limited partnerships including one partnership in whichMr. A. Hovnanian, our Chief Executive Officer, President and a Director, is a general partner, and members of hisfamily and certain officers and directors are limited partners. We no longer provide such services. During theyears ended October 31, 2004, 2003, and 2002 we received $0.1 million in fees for such management services. AtOctober 31, 2004 and 2003, no amounts were due us by these partnerships.
During the year ended October 31, 2003, we entered into an agreement to purchase land in California forapproximately $33.4 million from an entity that is owned by a family relative of our Chairman of the Board andour Chief Executive Officer. As of October 31, 2004, we have an option deposit of $3.0 million related to this landacquisition agreement. In connection with this agreement, we also have consolidated $30.4 million in accordancewith FIN 46 under ‘‘Consolidated Inventory Not Owned’’ in the Consolidated Balance Sheets (see Note 17).Neither the Company nor the Chairman of the Board and Chief Executive Officer has a financial interest in therelative’s company from whom the land was purchased.
During the year ended October 31, 2001, we entered into an agreement to purchase land from an entity that isowned by a family relative of our Chairman of the Board and our Chief Executive Officer, totaling $26.9 million.As of October 31, 2004 and 2003, land aggregating $22.1 million and $18.4 million, respectively, has beenpurchased. Neither the Company nor the Chairman of the Board and Chief Executive Officer has a financialinterest in the relative’s company from whom the land was purchased.
During the year ended October 31, 2001, we entered into an agreement to purchase land in Maryland forapproximately $3.0 million from a group that consists of relatives of Geaton Decesaris, Jr., a member of our Boardof Directors. We had posted a deposit of $100,000 and purchased the property when final approvals were in place.The property was purchased in November 2001 and there are 41 of an original 147 lots remaining in inventory asof October 31, 2004. Geaton Decesaris, Jr. has no financial interest in the relative’s ownership and sale of land tothe Company.
13. Stock Plans
We have a stock option plan for certain officers and key employees. Options are granted by a Committeeappointed by the Board of Directors. The exercise price of all stock options must be at least equal to the fairmarket value of the underlying shares on the date of the grant. Options granted prior to May 14, 1998 vest inthree equal installments on the first, second and third anniversaries of the date of the grant. Options granted onor after May 14, 1998 vest in four equal installments on the third, fourth, fifth and sixth anniversaries of the dateof the grant. Certain Southeast Region associates were granted and held options to purchase the stock from theacquired company prior to the January 23, 2001 acquisition. These options vest in three installments: 25% on thefirst and second anniversary, and 50% on the third anniversary of the date of the grant. In connection with theacquisition the options were exchanged for options to purchase the Company’s Class A Common Stock. Alloptions expire ten years after the date of the grant. During the year ended October 31, 2004 each of the fiveoutside directors of the Company were granted options to purchase 15,000 shares. All shares granted to the
F-22

HOVNANIAN ENTERPRISES, INC. AND SUBSIDIARIES
Notes to Consolidated Financial StatementsFor the Years Ended October 31, 2004, 2003, and 2002
outside directors were issued at the same price and terms as those granted to officers and key employees, exceptthe outside directors’ options vest evenly over three years. Stock option transactions are summarized as follows:
Weighted Weighted WeightedAverage Fair Average Fair Average Fair
October 31, Value(1) And October 31, Value(1) And October 31, Value(1) And2004 Exercise Price 2003 Exercise Price 2002 Exercise Price
Options outstandingat beginning ofperiod 4,913,582 $ 7.33 4,954,324 $ 4.84 4,561,314 $3.76
Granted 1,215,625 $39.73 991,000 $16.53 1,167,340 $7.51
Exercised 334,166 $ 4.26 1,027,992 $ 4.76 714,330 $3.14
Forfeited 20,500 $ 9.47 3,750 $ 3.75 60,000 $3.86
Options outstandingat end of period 5,774,541 $13.98 4,913,582 $ 7.33 4,954,324 $4.84
Options exercisableat end of period 1,758,165 1,645,998 3,179,026
Price range ofoptions outstanding $1.33–$44.13 $1.33–$31.50 $1.33–$17.38
Weighted-averageremaining contractuallife 6.5 years 6.4 years 6.0 years
(1) Fair value of options at grant date approximate exercise price.
The following table summarizes the exercise price range and related number of options outstanding atOctober 31, 2004:
Range of Exercise Prices Number Outstanding Weighted Average Price
$1.33–$5.00 2,052,750 $ 3.07
$5.00–$10.00 1,224,500 $ 5.98
$10.01–$15.00 230,666 $12.21
$15.01–$20.00 995,000 $16.22
$20.01–$25.00 — —
$25.01–$30.00 6,000 $25.31
$30.01–$44.13 1,265,625 $37.92
5,774,541 $13.98
F-23

HOVNANIAN ENTERPRISES, INC. AND SUBSIDIARIES
Notes to Consolidated Financial StatementsFor the Years Ended October 31, 2004, 2003, and 2002
The following table summarizes the exercise price range and related number of exercisable options atOctober 31, 2004:
Range of Exercise Prices Number Outstanding Weighted Average Price
$1.33–$5.00 1,557,665 $ 2.96
$5.00–$10.00 171,750 $ 6.17
$10.01–$15.00 — —
$15.01–$20.00 28,750 $15.95
$20.01–$25.00 — —
$25.01–$30.00 — —
$30.01–$44.13 — —
1,758,165 $ 3.48
During the year ended October 31, 1999, we modified our bonus plan for certain associates. A portion of theirbonus is paid by issuing a deferred right to receive our Class A Common Stock. The number of shares iscalculated for each bonus year by dividing the portion of the bonus subject to the deferred right award by ouraverage stock price for the year or the stock price at year end, whichever is lower. Twenty-five percent of thedeferred right award will vest and shares will be issued one year after the year end and then 25% a year for thenext three years. Participants with 20 years of service or over 58 years of age vest immediately. During the yearsended October 31, 2004 and 2003, we issued 209,975 and 177,158 shares under the plan. During the years endedOctober 31, 2004 and 2003, 23,122 and 20,068 shares were forfeited under this plan, respectively. For the yearsended October 31, 2004, 2003, and 2002, approximately 436,435, 411,273, and 555,000 rights were awarded in lieuof $15.8 million, $9.8 million, and $7.2 million of bonus payments, respectively. The deferred portion of theserights are recorded as deferred compensation in stockholders’ equity. For the years ended October 31, 2004, 2003and 2002, total compensation cost recognized in the income statement for stock based employee compensationawards was $5.9 million, $9.8 million and $7.2 million, respectively.
14. Warranty Costs
Over the past several years, general liability insurance for homebuilding companies and their suppliers andsubcontractors has become very difficult to obtain. The availability of general liability insurance has been limiteddue to a decreased number of insurance companies willing to write for the industry. In addition, those fewinsurers willing to write liability insurance have significantly increased the premium costs. We have been able toobtain general liability insurance but at higher premium costs with higher deductibles. We have been advisedthat a significant number of our subcontractors and suppliers have also had difficulty obtaining insurance thatalso provides us coverage. As a result, we have introduced an owner controlled insurance program for certain ofour subcontractors, whereby the subcontractors pay us an insurance premium based on the value of theirservices, and we absorb the liability associated with their work on our homes. All such insurance premiums paidby our subcontractors are included in our reserves.
We provide a warranty accrual for repair costs over $1,000 to homes, community amenities, and landdevelopment infrastructure. We accrue for warranty costs at the time each home is closed and title andpossession have been transferred to the homebuyer as part of cost of sales. In addition, we accrue for warrantycosts under our $150,000 per occurrence general liability insurance deductible and for our recently introducedowner controlled insurance program that we offer to certain subcontractors as part of selling, general and
F-24

HOVNANIAN ENTERPRISES, INC. AND SUBSIDIARIES
Notes to Consolidated Financial StatementsFor the Years Ended October 31, 2004, 2003, and 2002
administrative costs. Warranty accruals are based upon historical experience. Charges in the warranty accrualand general liability accrual for the years ended October 31, 2004 and 2003 are as follows:
Year Ended
October 31, 2004 October 31, 2003(Dollars In Thousands)
Balance, beginning of year $ 39,532 $22,392
Company acquisitions during year 2,524
Additions during year 43,835 24,336
Charges incurred during year (18,445) (9,720)
Balance, end of year $ 64,922 $39,532
15. Commitments and Contingent Liabilities
We are involved in litigation arising in the ordinary course of business, none of which is expected to have amaterial adverse effect on us.
16. Performance Letters of Credit
As of October 31, 2004 and 2003, respectively, we are obligated under various performance letters of creditamounting to $180.6 million and $130.3 million. (See Note 5).
17. Variable Interest Entities
In January 2003, the FASB issued FIN 46. A Variable Interest Entity (‘‘VIE’’) is created when (i) the equityinvestment at risk is not sufficient to permit the entity from financing its activities without additionalsubordinated financial support from other parties or (ii) equity holders either (a) lack direct or indirect ability tomake decisions about the entity, (b) are not obligated to absorb expected losses of the entity or (c) do not havethe right to receive expected residual returns of the entity if they occur. If an entity is deemed to be a VIE,pursuant to FIN 46, an enterprise that absorbs a majority of the expected losses of the VIE is considered theprimary beneficiary and must consolidate the VIE. FIN 46 was effective immediately for VIE’s created afterJanuary 31, 2003. Pursuant to FASB revision to FIN 46 (‘‘FIN 46-R’’), issued in December 2003, our Company wasnot required to apply the provisions of FIN 46 to an interest held in a variable interest entity or potential variableinterest entity until the end of our quarter ended April 30, 2004 for VIE’s created before February 1, 2003. Inaccordance with FIN 46R, we have fully implemented FIN 46 as of April 30, 2004.
Based on the provisions of FIN 46, we have concluded that whenever we option land or lots from an entity andpay a non-refundable deposit, a VIE is created under condition (ii) (b) and (c) of the previous paragraph. Wehave been deemed to have provided subordinated financial support, which refers to variable interests that willabsorb some or all of an entity’s expected theoretical losses if they occur. For each VIE created with a significantnonrefundable option fee, we will compute expected losses and residual returns based on the probability offuture cash flows as outlined in FIN 46. If we are deemed to be the primary beneficiary of the VIE we willconsolidate it on our balance sheet. The fair value of the VIE’s inventory will be reported as ‘‘ConsolidatedInventory Not Owned—Variable Interest Entities’’.
F-25

HOVNANIAN ENTERPRISES, INC. AND SUBSIDIARIES
Notes to Consolidated Financial StatementsFor the Years Ended October 31, 2004, 2003, and 2002
Management believes FIN 46 was not clearly thought out for application in the homebuilding industry for landand lot options. Under FIN 46, we can have an option and put down a small deposit as a percentage of thepurchase price and still have to consolidate the entity. Our exposure to loss as a result of our involvement withthe VIE is only the deposit, not it’s total assets consolidated on the balance sheet. In certain cases we will have toplace inventory on our balance sheet the VIE has optioned to other developers. In addition, if the VIE hascreditors, it’s debt will be placed on our balance sheet even though the creditors have no recourse against ourCompany. Based on these observations we believe consolidating VIE’s based on land and lot option deposits doesnot reflect the economic realities or risks of owning and developing land.
At October 31, 2004, all VIE’s we were required to consolidate were as a result of our options to purchase land orlots from the selling entities. We paid cash or issued letters of credit deposits to these thirty-one VIE’s totaling$27.4 million. Our option deposits represent our maximum exposure to loss. The fair value of the property ownedby the VIE’s was $201.7 million. Because we could not get the remainder of the selling entities to provide us withany financial information, the fair value of the optioned property less our cash deposits and liabilities frominventory not owned, which totaled $155.1 million, was reported on the balance sheet as ‘‘Minority interest frominventory not owned’’. Creditors of these VIE’s have no recourse against our Company.
We will continue to secure land and lots using options. Including the deposits with the thirty-one VIE’s above, atOctober 31, 2004, we have total cash and letters of credit deposits amounting to approximately $225.4 million topurchase land and lots with a total purchase price of $3.4 billion. Not all our deposits are with VIE’s. Themaximum exposure to loss is limited to the deposits although some deposits are refundable at our request orrefundable if certain conditions are not met.
18. Investments in Unconsolidated Homebuilding and Land Development Joint Ventures
We enter into homebuilding and land development joint ventures from time to time as a means of accessing lotpositions, expanding our market opportunities, establishing strategic alliances, managing our risk profile andleveraging our capital base. Our homebuilding joint ventures are generally entered into with third party investorsto develop land and construct homes that are sold directly to third party homebuyers. Our land development jointventures include those with developers and other homebuilders as well as financial investors to develop finishedlots for sale to the joint venture’s members or other third parties. The tables set forth below summarize the
F-26
HOVNANIAN ENTERPRISES, INC. AND SUBSIDIARIES
Notes to Consolidated Financial StatementsFor the Years Ended October 31, 2004, 2003, and 2002
combined financial information related to our unconsolidated homebuilding and land development joint venturesthat are accounted for under the equity method.
(In Thousands) October 31, 2004 October 31, 2003
Assets:
Cash $ 30,519 $ 5,225
Inventories 176,360 56,017
Other assets 5,477 619
Total assets $212,356 $61,861
Liabilities and Equity:
Accounts payable and accrued liabilities $ 39,065 $ 5,149
Notes payable 82,742 25,612
Equity 90,549 31,100
Total liabilities and equity $212,356 $61,861
Our share of equity related to these joint ventures, included in prepaids and other assets in our ConsolidatedBalance Sheets, was approximately $40.8 million and $23.1 million at October 31, 2004 and 2003, respectively.Additionally, as of October 31, 2004 and 2003, we had advances outstanding of approximately $12.7 and$1.7 million to these unconsolidated joint ventures, which were included in the accounts payable and accruedliabilities balances in the table above.
For the Year EndedOctober 31,
2004 2003 2002
Revenues $ 46,639 $ 9,608 $ 8,383
Cost of sales and expenses (40,862) (10,035) (11,006)
Net income (loss) $ 5,777 $ (427) $ (2,623)
Income (loss) from unconsolidated joint ventures are included in other revenue in the accompanyingConsolidated Financial Statements and reflects our proportionate share of the income of these unconsolidatedhomebuilding and land development joint ventures. Our ownership interests in the joint ventures vary but aregenerally less than or equal to 50 percent.
Typically, our unconsolidated joint ventures obtain separate project specific mortgage financing for each venture.Generally, the amount of such financing is limited to no more than 50% of the joint venture’s total assets, andsuch financing is obtained on a non-recourse basis, with guarantees from us limited only to completion ofdevelopment and environmental indemnification. In some instances, the joint venture entity is considered avariable interest entity (VIE) under FIN 46 due to the returns being capped to the equity holders; however, inthese instances, we are not the primary beneficiary, therefore we do not consolidate these entities. (See Note 17)
F-27

HOVNANIAN ENTERPRISES, INC. AND SUBSIDIARIES
Notes to Consolidated Financial StatementsFor the Years Ended October 31, 2004, 2003, and 2002
19. Acquisitions
On January 10, 2002, we acquired a California homebuilder for a total purchase price of $196.5 million, of which$151.6 million was paid in cash and 4,417,476 shares of Class A Common Stock were issued. At the date ofacquisition we also paid off approximately $88.0 million of their third party debt. During the second quarterended April 30, 2003, we exercised the right to retire at no cost 1,498,718 Class A Common Stock shares thatwere held by the selling principal under the terms of the acquisition. The total purchase price amounted to$90.4 million over book value, of which $22.8 million was added to inventory to reflect fair value, $18.5 millionwas paid for two option agreements, a two year consultant’s agreement, and a three year right of first refusalagreement, and the balance recorded as a tradename, which was initially recorded as an indefinite life intangibleasset. However, as discussed in Note 2, in May 2004 we made a decision to change this acquisition’s brand nameto K. Hovnanian Homes. As a result, we reclassified $50 million from goodwill and indefinite life intangibles todefinite life intangibles on our 2004 Consolidated Balance Sheet. We are amortizing the definite life intangible asthe homes in the communities still using the old California acquisition brand name are delivered to customersand the revenue on the sale of these homes is recognized. Using this methodology, we expect this intangible to besubstantially written off by our fourth quarter of 2008.
A condensed balance sheet (including the effects of purchase accounting adjustments) as of the acquisition dateis as follows (dollars in thousands):
(In Thousands Except Per Share) January 10, 2002
Cash and cash equivalents $ 10,209
Inventories 220,110
Tradename intangible 49,107
Prepaids and other assets 20,676
Total Assets $300,102
Accounts payable and other liabilities $ 35,028
Revolving credit agreement 219,574
Stockholders’ equity 45,500
Total Liabilities and Stockholders’ Equity $300,102
Our California acquisition was accounted for as a purchase with the results of operations of the entity included inour Consolidated Financial Statements as of the date of the acquisition. The purchase price was allocated basedon estimated fair value of the assets and liabilities at the date of the acquisition.
The following unaudited pro forma financial data for the year ended October 31, 2002 has been prepared as if theacquisition of a California homebuilder on January 10, 2002 had occurred on November 1, 2001. Unaudited pro
F-28

HOVNANIAN ENTERPRISES, INC. AND SUBSIDIARIES
Notes to Consolidated Financial StatementsFor the Years Ended October 31, 2004, 2003, and 2002
forma financial data is presented for information purposes only and may not be indicative of the actual amountshad the events occurred on the dates listed above, nor does it purport to represent future periods.
Year Ended(In Thousands Except Per Share) October 31, 2002
Revenues $2,615,455
Expenses 2,384,361
Income Taxes 90,132
Net Income $ 140,962
Diluted Net Income Per Common Share $ 2.19
On November 1, 2002, and December 31, 2002, we acquired two Houston homebuilding companies. On April 9,2003, we acquired a build-on-your-own lot homebuilder in Ohio, and on August 8, 2003, we acquired ahomebuilder in Phoenix, Arizona. Our aggregate net cash purchase price, including payment of third party debt,for our fiscal 2003 acquisitions was approximately $186.4 million. In connection with the December 31, 2002 andApril 9, 2003 acquisitions, we have definite life intangible assets equal to the excess purchase price over the fairvalue of the net assets of $65.4 million. It is our policy to obtain appraisals of acquisition intangibles. We havereceived the appraisals for the December 31, 2002 acquisition and the April 9, 2003 acquisition. We areamortizing our definite life intangibles over a period of three to seven years (See Note 2). All 2003 acquisitionsprovide for other payments to be made, generally dependent upon achievement of certain future operating andreturn objectives. These additional payments, if any, will be recorded as additional purchase price and allocatedto the acquired definite life intangible assets.
On November 6, 2003, we acquired a Florida homebuilder for cash and 489,236 shares of our Class A CommonStock. This acquisition was accounted for as a purchase, with the results of operations of this entity included inour Consolidated Financial Statements as of the date of acquisition. In connection with the acquisition, based onan appraisal of acquisition intangibles we have definite life intangible assets equal to the excess purchase priceover the fair value of the net assets of $33 million. We are amortizing the various definite life intangibles overtheir estimated lives. This acquisition provides for other payments to be made, generally dependent uponachievement of certain future operating and return objectives.
F-29
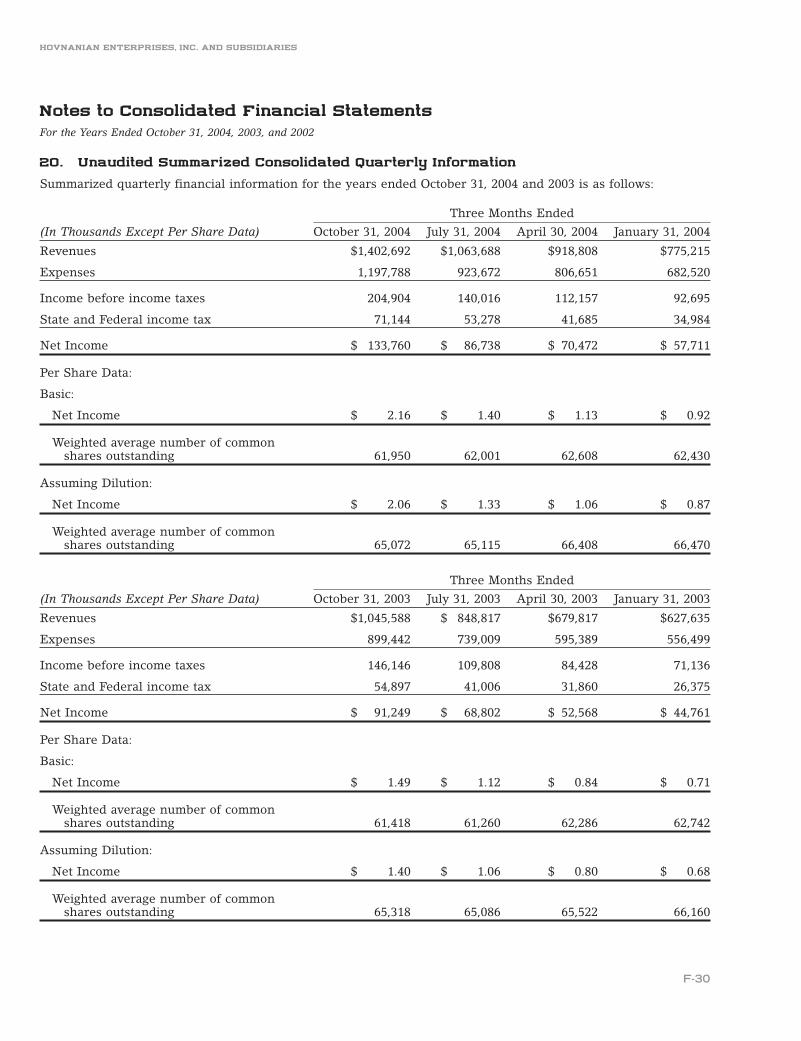
HOVNANIAN ENTERPRISES, INC. AND SUBSIDIARIES
Notes to Consolidated Financial StatementsFor the Years Ended October 31, 2004, 2003, and 2002
20. Unaudited Summarized Consolidated Quarterly Information
Summarized quarterly financial information for the years ended October 31, 2004 and 2003 is as follows:
Three Months Ended
(In Thousands Except Per Share Data) October 31, 2004 July 31, 2004 April 30, 2004 January 31, 2004
Revenues $1,402,692 $1,063,688 $918,808 $775,215
Expenses 1,197,788 923,672 806,651 682,520
Income before income taxes 204,904 140,016 112,157 92,695
State and Federal income tax 71,144 53,278 41,685 34,984
Net Income $ 133,760 $ 86,738 $ 70,472 $ 57,711
Per Share Data:
Basic:
Net Income $ 2.16 $ 1.40 $ 1.13 $ 0.92
Weighted average number of commonshares outstanding 61,950 62,001 62,608 62,430
Assuming Dilution:
Net Income $ 2.06 $ 1.33 $ 1.06 $ 0.87
Weighted average number of commonshares outstanding 65,072 65,115 66,408 66,470
Three Months Ended
(In Thousands Except Per Share Data) October 31, 2003 July 31, 2003 April 30, 2003 January 31, 2003
Revenues $1,045,588 $ 848,817 $679,817 $627,635
Expenses 899,442 739,009 595,389 556,499
Income before income taxes 146,146 109,808 84,428 71,136
State and Federal income tax 54,897 41,006 31,860 26,375
Net Income $ 91,249 $ 68,802 $ 52,568 $ 44,761
Per Share Data:
Basic:
Net Income $ 1.49 $ 1.12 $ 0.84 $ 0.71
Weighted average number of commonshares outstanding 61,418 61,260 62,286 62,742
Assuming Dilution:
Net Income $ 1.40 $ 1.06 $ 0.80 $ 0.68
Weighted average number of commonshares outstanding 65,318 65,086 65,522 66,160
F-30

HOVNANIAN ENTERPRISES, INC. AND SUBSIDIARIES
Notes to Consolidated Financial StatementsFor the Years Ended October 31, 2004, 2003, and 2002
21. Financial Information of Subsidiary Issuer and Subsidiary Guarantors
Hovnanian Enterprises, Inc., the parent company (the ‘‘Parent’’) is the issuer of publicly traded common stock.One of its wholly-owned subsidiaries, K. Hovnanian Enterprises, Inc., (the ‘‘Subsidiary Issuer’’), acts as a financeentity that as of October 31, 2004 had issued and outstanding approximately $300 million Senior SubordinatedNotes, $603 million face value Senior Notes, and $115 million drawn on a Revolving Credit Agreement. TheSenior Subordinated Notes, Senior Notes, and the Revolving Credit Agreement are fully and unconditionallyguaranteed by the Parent.
In addition to the Parent, each of the wholly-owned subsidiaries of the Parent other than the Subsidiary Issuer(collectively, the ‘‘Guarantor Subsidiaries’’), with the exception of various subsidiaries formerly engaged in theissuance of collateralized mortgage obligations, a mortgage lending subsidiary, a subsidiary engaged inhomebuilding activity in Poland, our Title Insurance subsidiaries, and joint ventures (collectively, the‘‘Non-guarantor Subsidiaries’’), have guaranteed fully and unconditionally, on a joint and several basis, theobligation of the Subsidiary Issuer to pay principal and interest under the Senior Notes, Senior SubordinatedNotes, and the Revolving Credit Agreement.
In lieu of providing separate audited financial statements for the Guarantor Subsidiaries we have included theaccompanying Consolidating Condensed Financial Statements. Management does not believe that separatefinancial statements of the Guarantor Subsidiaries are material to investors. Therefore, separate financialstatements and other disclosures concerning the Guarantor Subsidiaries are not presented.
The following consolidating condensed financial information presents the results of operations, financial positionand cash flows of (i) the Parent (ii) the Subsidiary Issuer (iii) the Guarantor Subsidiaries, (iv) the Non-guarantorSubsidiaries and (v) the eliminations to arrive at the information for Hovnanian Enterprises, Inc. on aconsolidated basis.
F-31

HOVNANIAN ENTERPRISES, INC. AND SUBSIDIARIES
Consolidating Condensed Balance SheetOctober 31, 2004
Non-Subsidiary Guarantor Guarantor
(Thousands of Dollars) Parent Issuer Subsidiaries Subsidiaries Eliminations Consolidated
AssetsHomebuilding $ (99) $ 51,441 $ 2,804,800 $ 69,676 $ $2,925,818Financial Services 149 230,300 230,449Investments in and amounts due to
and from consolidatedsubsidiaries 1,262,169 1,037,671 (1,319,839) (41,423) (938,578)
Total Assets $1,262,070 $1,089,112 $ 1,485,110 $258,553 $(938,578) $3,156,267
LiabilitiesHomebuilding $ $ 149 $ 526,278 $ 2,123 $ $ 528,550Financial Services (1) 194,498 194,497Notes Payable 1,032,259 (28,324) 29,324 1,033,259Income Taxes Payable (Receivable) 69,676 1,961 (23,579) 941 48,999Minority Interest 155,096 3,472 158,568Stockholders’ Equity 1,192,394 54,743 855,640 28,195 (938,578) 1,192,394
Total Liabilities and Stockholders’Equity $1,262,070 $1,089,112 $ 1,485,110 $258,553 $(938,578) $3,156,267
Consolidating Condensed Balance SheetOctober 31, 2003
Non-Subsidiary Guarantor Guarantor
(Thousands of Dollars) Parent Issuer Subsidiaries Subsidiaries Eliminations Consolidated
AssetsHomebuilding $ (279) $151,050 $1,910,484 $ 35,632 $ $2,096,887Financial Services (252) 234,557 234,305Income Taxes (Payable) Receivable 18,713 (1,241) (15,656) (637) 1,179Investments in and amounts due toand from consolidated subsidiaries 801,278 690,971 (851,398) (56,837) (584,014)
Total Assets $819,712 $840,780 $1,043,178 $212,715 $(584,014) $2,332,371
LiabilitiesHomebuilding $ $ $ 425,847 $ 1,800 $ $ 427,647Financial Services (35) 172,663 172,628Notes Payable 816,960 (2,984) 3,865 817,841Minority Interest 90,252 4,291 94,543Stockholders’ Equity 819,712 23,820 530,098 30,096 (584,014) 819,712
Total Liabilities and Stockholders’Equity $819,712 $840,780 $1,043,178 $212,715 $(584,014) $2,332,371
F-32
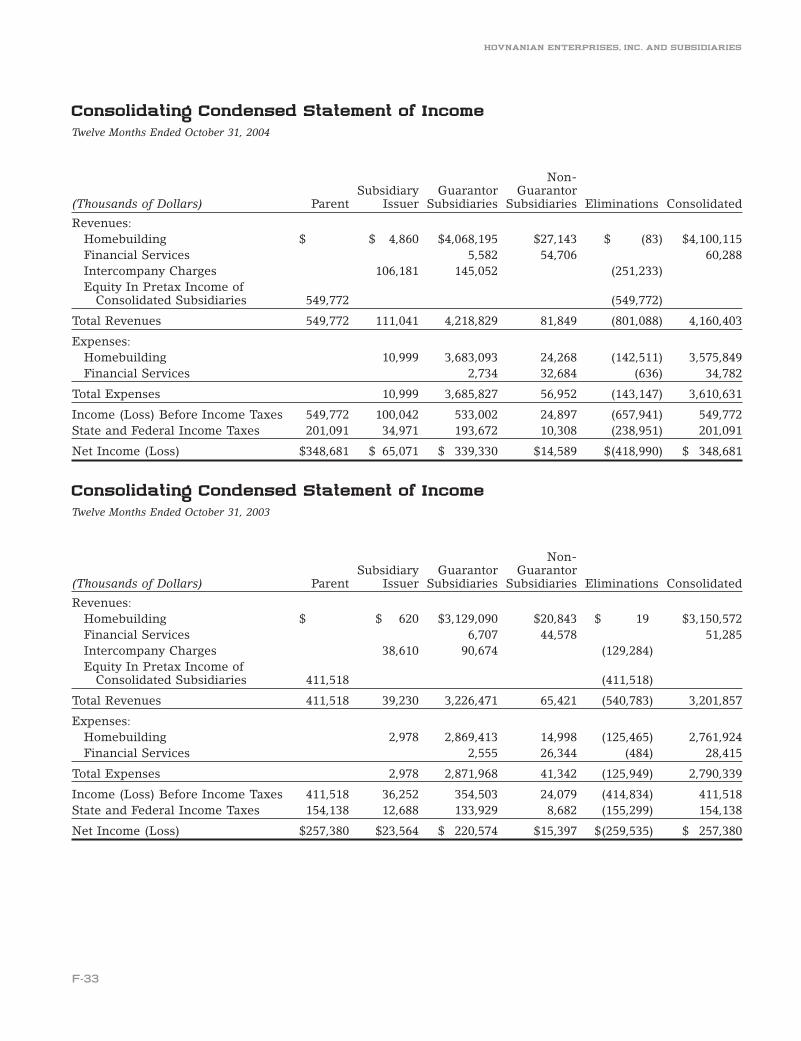
HOVNANIAN ENTERPRISES, INC. AND SUBSIDIARIES
Consolidating Condensed Statement of IncomeTwelve Months Ended October 31, 2004
Non-Subsidiary Guarantor Guarantor
(Thousands of Dollars) Parent Issuer Subsidiaries Subsidiaries Eliminations Consolidated
Revenues:Homebuilding $ $ 4,860 $4,068,195 $27,143 $ (83) $4,100,115Financial Services 5,582 54,706 60,288Intercompany Charges 106,181 145,052 (251,233)Equity In Pretax Income of
Consolidated Subsidiaries 549,772 (549,772)
Total Revenues 549,772 111,041 4,218,829 81,849 (801,088) 4,160,403
Expenses:Homebuilding 10,999 3,683,093 24,268 (142,511) 3,575,849Financial Services 2,734 32,684 (636) 34,782
Total Expenses 10,999 3,685,827 56,952 (143,147) 3,610,631
Income (Loss) Before Income Taxes 549,772 100,042 533,002 24,897 (657,941) 549,772State and Federal Income Taxes 201,091 34,971 193,672 10,308 (238,951) 201,091
Net Income (Loss) $348,681 $ 65,071 $ 339,330 $14,589 $(418,990) $ 348,681
Consolidating Condensed Statement of IncomeTwelve Months Ended October 31, 2003
Non-Subsidiary Guarantor Guarantor
(Thousands of Dollars) Parent Issuer Subsidiaries Subsidiaries Eliminations Consolidated
Revenues:Homebuilding $ $ 620 $3,129,090 $20,843 $ 19 $3,150,572Financial Services 6,707 44,578 51,285Intercompany Charges 38,610 90,674 (129,284)Equity In Pretax Income of
Consolidated Subsidiaries 411,518 (411,518)
Total Revenues 411,518 39,230 3,226,471 65,421 (540,783) 3,201,857
Expenses:Homebuilding 2,978 2,869,413 14,998 (125,465) 2,761,924Financial Services 2,555 26,344 (484) 28,415
Total Expenses 2,978 2,871,968 41,342 (125,949) 2,790,339
Income (Loss) Before Income Taxes 411,518 36,252 354,503 24,079 (414,834) 411,518State and Federal Income Taxes 154,138 12,688 133,929 8,682 (155,299) 154,138
Net Income (Loss) $257,380 $23,564 $ 220,574 $15,397 $(259,535) $ 257,380
F-33

HOVNANIAN ENTERPRISES, INC. AND SUBSIDIARIES
Consolidating Condensed Statement of IncomeTwelve Months Ended October 31, 2002
Non-Subsidiary Guarantor Guarantor
(Thousands of Dollars) Parent Issuer Subsidiaries Subsidiaries Eliminations Consolidated
Revenues:Homebuilding $ $ 1,059 $2,523,632 $14,093 $ (28,448) $2,510,336Financial Services 7,153 33,617 40,770Intercompany Charges 139,502 21,183 (160,685)Equity In Pretax Income of
Consolidated Subsidiaries 225,730 (225,730)
Total Revenues 225,730 140,561 2,551,968 47,710 (414,863) 2,551,106
Expenses:Homebuilding 140,561 2,313,094 18,165 (168,987) 2,302,833Financial Services 2,397 20,324 (178) 22,543
Total Expenses 140,561 2,315,491 38,489 (169,165) 2,325,376
Income (Loss) Before Income Taxes 225,730 236,477 9,221 (245,698) 225,730State and Federal Income Taxes 88,034 (195) 89,530 5,797 (95,132) 88,034
Net Income (Loss) $137,696 $ 195 $ 146,947 $ 3,424 $(150,566) $ 137,696
Consolidating Condensed Statement of Cash FlowsTwelve Months Ended October 31, 2004
Non-Subsidiary Guarantor Guarantor
(Thousands of Dollars) Parent Issuer Subsidiaries Subsidiaries Eliminations Consolidated
Cash Flows From OperatingActivities:Net Income $ 348,681 $ 65,071 $ 339,330 $ 14,589 $(418,990) $ 348,681Adjustments to reconcile net
income to net cash provided by(used in) operating activities 149,008 (39,848) (1,051,067) (13,913) 418,990 (536,830)
Net Cash Provided By (Used In)Operating Activities 497,689 25,223 (711,737) 676 (188,149)
Net Cash (Used In) InvestingActivities (36,288) (84,086) (319) (120,693)
Net Cash Provided By (Used In)Financing Activities (510) 215,000 22,631 21,524 258,645
Intercompany Investing andFinancing Activities—Net (460,891) (346,700) 823,005 (15,414)
Net Increase (Decrease) In Cash (106,477) 49,813 6,467 (50,197)Cash and Cash Equivalents Balance,
Beginning of Period 15 135,846 (14,372) 6,732 128,221Cash and Cash Equivalents Balance,
End of Period $ 15 $ 29,369 $ 35,441 $ 13,199 $ $ 78,024
F-34
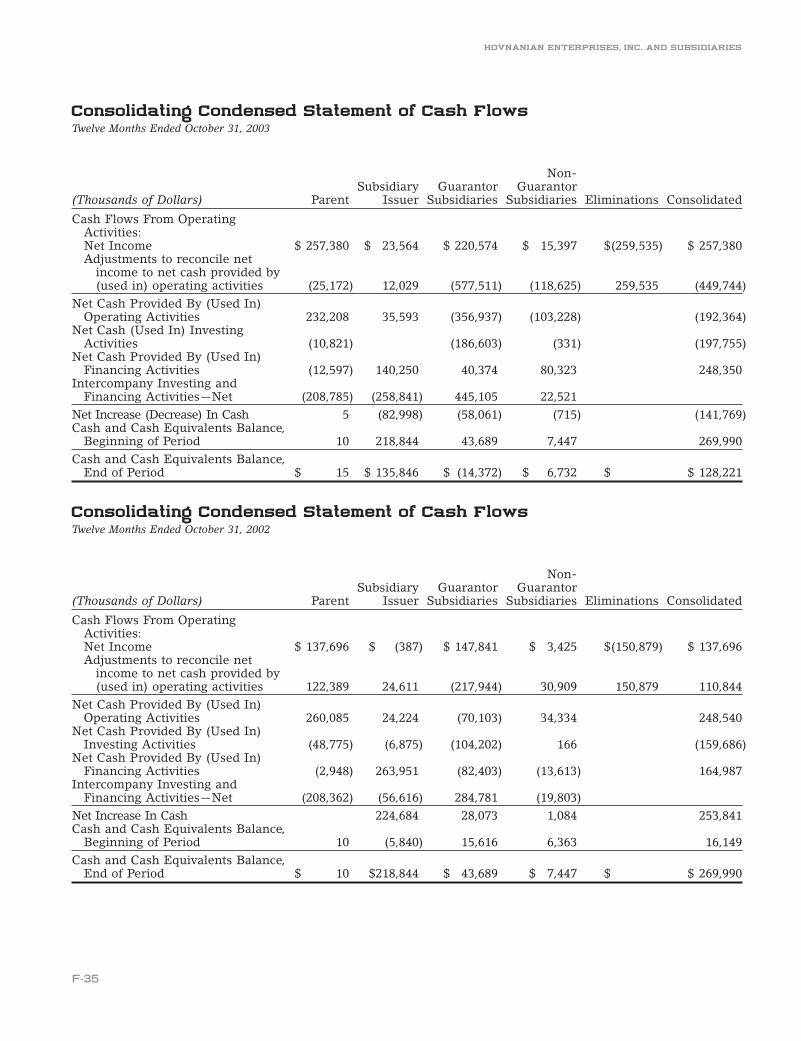
HOVNANIAN ENTERPRISES, INC. AND SUBSIDIARIES
Consolidating Condensed Statement of Cash FlowsTwelve Months Ended October 31, 2003
Non-Subsidiary Guarantor Guarantor
(Thousands of Dollars) Parent Issuer Subsidiaries Subsidiaries Eliminations Consolidated
Cash Flows From OperatingActivities:Net Income $ 257,380 $ 23,564 $ 220,574 $ 15,397 $(259,535) $ 257,380Adjustments to reconcile net
income to net cash provided by(used in) operating activities (25,172) 12,029 (577,511) (118,625) 259,535 (449,744)
Net Cash Provided By (Used In)Operating Activities 232,208 35,593 (356,937) (103,228) (192,364)
Net Cash (Used In) InvestingActivities (10,821) (186,603) (331) (197,755)
Net Cash Provided By (Used In)Financing Activities (12,597) 140,250 40,374 80,323 248,350
Intercompany Investing andFinancing Activities—Net (208,785) (258,841) 445,105 22,521
Net Increase (Decrease) In Cash 5 (82,998) (58,061) (715) (141,769)Cash and Cash Equivalents Balance,
Beginning of Period 10 218,844 43,689 7,447 269,990Cash and Cash Equivalents Balance,
End of Period $ 15 $ 135,846 $ (14,372) $ 6,732 $ $ 128,221
Consolidating Condensed Statement of Cash FlowsTwelve Months Ended October 31, 2002
Non-Subsidiary Guarantor Guarantor
(Thousands of Dollars) Parent Issuer Subsidiaries Subsidiaries Eliminations Consolidated
Cash Flows From OperatingActivities:Net Income $ 137,696 $ (387) $ 147,841 $ 3,425 $(150,879) $ 137,696Adjustments to reconcile net
income to net cash provided by(used in) operating activities 122,389 24,611 (217,944) 30,909 150,879 110,844
Net Cash Provided By (Used In)Operating Activities 260,085 24,224 (70,103) 34,334 248,540
Net Cash Provided By (Used In)Investing Activities (48,775) (6,875) (104,202) 166 (159,686)
Net Cash Provided By (Used In)Financing Activities (2,948) 263,951 (82,403) (13,613) 164,987
Intercompany Investing andFinancing Activities—Net (208,362) (56,616) 284,781 (19,803)
Net Increase In Cash 224,684 28,073 1,084 253,841Cash and Cash Equivalents Balance,
Beginning of Period 10 (5,840) 15,616 6,363 16,149Cash and Cash Equivalents Balance,
End of Period $ 10 $218,844 $ 43,689 $ 7,447 $ $ 269,990
F-35

HOVNANIAN ENTERPRISES, INC. AND SUBSIDIARIES
Notes to Consolidated Financial StatementsFor the Years Ended October 31, 2004, 2003, and 2002
22. Subsequent Event
On November 30, 2004, we issued $200 million of 61⁄4% Senior Notes due 2015 and $100 million of 6% SeniorSubordinated Notes due 2010. The notes are redeemable in whole or in part, at any time, at our option at 100% oftheir principal amount upon payment of a make-whole price. The net proceeds of the issuances were used torepay the outstanding balance on our Revolving Credit Facility and for general corporate purposes.
F-36

Exhibit 31(a)
CERTIFICATIONS
I, Ara K. Hovnanian, President & Chief Executive Officer of Hovnanian Enterprises, Inc., certify that:
1. I have reviewed this annual report on Form 10-K of Hovnanian Enterprises, Inc.;
2. Based on my knowledge, this report does not contain any untrue statement of a material fact or omit to statea material fact necessary to make the statements made, in light of the circumstances under which suchstatements were made, not misleading with respect to the period covered by this report;
3. Based on my knowledge, the financial statements, and other financial information included in this report,fairly present in all material respects the financial condition, results of operations and cash flows of theregistrant as of, and for, the periods presented in this report;
4. The registrant’s other certifying officer(s) and I are responsible for establishing and maintaining disclosurecontrols and procedures (as defined in Exchange Act Rules 13a-15(e) and 15d-15(e)) for the registrant andhave:
(a) Designed such disclosure controls and procedures, or caused such disclosure controls and procedures tobe designed under our supervision, to ensure that material information relating to the registrant,including its consolidated subsidiaries, is made known to us by others within those entities, particularlyduring the period in which this report is being prepared;
(b) Evaluated the effectiveness of the registrant’s disclosure controls and procedures and presented in thisreport our conclusions about the effectiveness of the disclosure controls and procedures, as of the end ofthe period covered by this report based on such evaluation; and
(c) Disclosed in this report any change in the registrant’s internal control over financial reporting thatoccurred during the registrant’s most recent fiscal quarter that has materially affected, or is reasonablylikely to materially affect, the registrant’s internal control over financial reporting; and
5. The registrant’s other certifying officer(s) and I have disclosed, based on our most recent evaluation ofinternal control over financial reporting, to the registrant’s auditors and the audit committee of theregistrant’s board of directors (or persons performing the equivalent functions):
(a) All significant deficiencies and material weaknesses in the design or operation of internal control overfinancial reporting which are reasonably likely to adversely affect the registrant’s ability to record,process, summarize and report financial information; and
(b) Any fraud, whether or not material, that involves management or other employees who have a significantrole in the registrant’s internal control over financial reporting.
Date: January 13, 2005
/s/ ARA K. HOVNANIAN
Ara K. HovnanianPresident and Chief Executive Officer

Exhibit 31(b)
CERTIFICATIONS
I, J. Larry Sorsby, Executive Vice President & Chief Financial Officer of Hovnanian Enterprises, Inc., certify that:
1. I have reviewed this annual report on Form 10-K of Hovnanian Enterprises, Inc.;
2. Based on my knowledge, this report does not contain any untrue statement of a material fact or omit to statea material fact necessary to make the statements made, in light of the circumstances under which suchstatements were made, not misleading with respect to the period covered by this report;
3. Based on my knowledge, the financial statements, and other financial information included in this report,fairly present in all material respects the financial condition, results of operations and cash flows of theregistrant as of, and for, the periods presented in this report;
4. The registrant’s other certifying officer(s) and I are responsible for establishing and maintaining disclosurecontrols and procedures (as defined in Exchange Act Rules 13a-15(e) and 15d-15(e)) for the registrant andhave:
(a) Designed such disclosure controls and procedures, or caused such disclosure controls and procedures tobe designed under our supervision, to ensure that material information relating to the registrant,including its consolidated subsidiaries, is made known to us by others within those entities, particularlyduring the period in which this report is being prepared;
(b) Evaluated the effectiveness of the registrant’s disclosure controls and procedures and presented in thisreport our conclusions about the effectiveness of the disclosure controls and procedures, as of the end ofthe period covered by this report based on such evaluation; and
(c) Disclosed in this report any change in the registrant’s internal control over financial reporting thatoccurred during the registrant’s most recent fiscal quarter that has materially affected, or is reasonablylikely to materially affect, the registrant’s internal control over financial reporting; and
5. The registrant’s other certifying officer(s) and I have disclosed, based on our most recent evaluation ofinternal control over financial reporting, to the registrant’s auditors and the audit committee of theregistrant’s board of directors (or persons performing the equivalent functions):
(a) All significant deficiencies and material weaknesses in the design or operation of internal control overfinancial reporting which are reasonably likely to adversely affect the registrant’s ability to record,process, summarize and report financial information; and
(b) Any fraud, whether or not material, that involves management or other employees who have a significantrole in the registrant’s internal control over financial reporting.
Date: January 13, 2005
/s/ J. LARRY SORSBY
J. Larry SorsbyExecutive Vice President and ChiefFinancial Officer

Exhibit 32(a)
CERTIFICATION PURSUANT TO18 U.S.C. SECTION 1350,
AS ADOPTED PURSUANT TOSECTION 906 OF THE SARBANES-OXLEY ACT OF 2002
In connection with the Annual Report of Hovnanian Enterprises, Inc. (the ‘‘Company’’) on Form 10-K for theperiod ended October 31, 2004 as filed with the Securities and Exchange Commission on the date hereof (the‘‘Report’’), I, Ara K. Hovnanian, President and Chief Executive Officer of the Company, certify, pursuant to 18U.S.C. Section 1350, as adopted pursuant to Section 906 of the Sarbanes-Oxley Act of 2002, that:
1. The Report fully complies with the requirements of Section 13(a) or 15(d) of the Securities Exchange Actof 1934; and
2. The information contained in the Report fairly presents, in all material respects, the financial conditionand results of operations of the Company.
Date: January 13, 2005
/s/ ARA K. HOVNANIAN
Ara K. HovnanianPresident and Chief Executive Officer

Exhibit 32(b)
CERTIFICATION PURSUANT TO18 U.S.C. SECTION 1350,
AS ADOPTED PURSUANT TOSECTION 906 OF THE SARBANES-OXLEY ACT OF 2002
In connection with the Annual Report of Hovnanian Enterprises, Inc. (the ‘‘Company’’) on Form 10-K for theperiod ended October 31, 2004 as filed with the Securities and Exchange Commission on the date hereof (the‘‘Report’’), I, J. Larry Sorsby, Executive Vice President and Chief Financial Officer of the Company, certify,pursuant to 18 U.S.C. Section 1350, as adopted pursuant to Section 906 of the Sarbanes-Oxley Act of 2002, that:
1. The Report fully complies with the requirements of Section 13(a) or 15(d) of the Securities Exchange Act of1934; and
2. The information contained in the Report fairly presents, in all material respects, the financial condition andresults of operations of the Company.
Date: January 13, 2005
/S/ J. LARRY SORSBYJ. Larry SorsbyExecutive Vice President and Chief Financial Officer


CORPORATE INFORMATION
KEVORK S. HOVNANIAN
Chairman of the Board and Director
ARA K. HOVNANIAN
President, Chief Executive Officer
and Director
GEATON A. DECESARIS, JR.
President
Hovnanian Land Investment Group
and Director
ARTHUR M. GREENBAUM, ESQ.
Director and Partner
Greenbaum, Rowe, Smith & Davis
EDWARD A. KANGAS
Director
DESMOND P. MCDONALD
Director
JOHN J. ROBBINS
Director
J. LARRY SORSBY
Executive Vice President
Chief Financial Officer and Director
STEPHEN D. WEINROTH
Director; Managing Partner, Hudson
Capital Advisors, LLC; and Managing Director
and Board Member, Kline Hawkes & Co.
PAUL W. BUCHANAN
Senior Vice President
Corporate Controller
KEVIN C. HAKE
Senior Vice President and Treasurer
MARK S. HODGES
Senior Vice President
Corporate Operations
ROBYN MINGLE
Senior Vice President
Human Resources
PETER S. REINHART
Senior Vice President
General Counsel, and Secretary
DONNA M. DORN
Vice President
Human Resources
DAVID FRIEND
Vice President
Risk Management
JANE M. HURD
Vice President
Audit Services
NANCY A. MARRAZZO
Assistant Vice President and
Assistant Treasurer
BILL MOORE
Vice President
Organizational Development
BRAD G. O’CONNOR
Vice President and
Associate Corporate Controller
MAVERICK W. SMOTHERS
Vice President
Training and Development
JOHN F. ULEN
Vice President and Chief Information Officer
BOARD OF DIRECTORS AND CORPORATE OFFICERS
ANNUAL MEETING
Annual Meeting
March 8, 2005, 5:00 p.m.
Simpson Thacher & Bartlett
425 Lexington Avenue
New York, New York 10017-3954
STOCK LISTING
Hovnanian Enterprises, Inc. Class A common
stock is traded on the New York Stock
Exchange under the symbol HOV.
On March 26, 2004, Ara K. Hovnanian, the
Chief Executive Officer of Hovnanian
Enterprises, Inc., certified to the New York
Stock Exchange (NYSE) that he was not aware
of any violation by Hovnanian Enterprises, Inc.
of the NYSE’s corporate governance listing
standards.
FORM 10-K
A copy of form 10-K, as filed with the
Securities and Exchange Commission, is
included herein. Additional copies are
available upon request to the
Office of the Controller
Hovnanian Enterprises, Inc.
10 Highway 35, P.O. Box 500
Red Bank, New Jersey 07701
732-747-7800
INVESTOR RELATIONS CONTACTS
Kevin C. Hake
Senior Vice President and Treasurer
732-747-7800
Jeffrey T. O’Keefe
Director of Investor Relations
732-747-7800
E-mail: [email protected]
AUDITORS
Ernst & Young LLP
5 Times Square
New York, New York 10036
COUNSEL
Simpson Thacher & Bartlett
425 Lexington Avenue
New York, New York 10017-3909
TRANSFER AGENT AND REGISTRAR
National City Bank
Corporate Trust Operations
Locator 5352
PO Box 92301
Cleveland, Ohio 44193-0900
TRUSTEE
Wachovia Bank, National Association
Corporate Trust Bond Administration
21 South Street
Morristown, New Jersey 07960
For additional information,
visit our website at khov.com

Hovnanian Enterprises, Inc.
10 Highway 35, PO Box 500
Red Bank, NJ 07701
(732) 747-7800
For additional information,
visit our website at khov.com