Housing Sales Slower Than Typical February – Calgary Real Estate Report
21
Calgary & Area Real Estate Statistics: February 2016 1 Request Your Free Home Evaluation Today!
-
Upload
coldwell-banker-compete-real-estate -
Category
Real Estate
-
view
86 -
download
1
Transcript of Housing Sales Slower Than Typical February – Calgary Real Estate Report

Calgary & Area Real Estate Statistics:
February 2016
1
Request Your Free Home Evaluation Today!

TABLE OF CONTENTS
3February Real Estate Summary
4 - 5City of Calgary Detached Homes Sales Data
6 - 7City of Calgary Semi-Detached Homes Sales Data
8 - 9City of Calgary Row Homes Sales Data
10 - 11City of Calgary Apartment Homes Sales Data
12 – 13Rural Rockyview Detached Sales Data
14Message From The Calgary Real Estate Board
15 – 16Rural Foothills Detached Sales Data
17 – 18Cochrane Detached Sales Data
19 - 20Okotoks Detached Sales Data
2

Housing Sales Slower Than Typical February
Monthly prices decline for fifth consecutive month
“February sales totaled 1,127 units in Calgary, a 6.63 per cent drop over last year and 37 per cent lower than long-term averages for the month.”(Source: CREB, Calgary Real Estate Board)
“Slow sales and elevated housing inventory has resulted in further price declines,” said CREB® chief economist Ann-Marie Lurie.
“The high volume of inventory that we’re seeing has pushed sellers to be more realistic about their pricing expectations and the amount of time their properties may be on the market,” said CREB® president Cliff Stevenson. “Buyers are less likely to submit an offer if there’s a big gap between the listing price and what they are willing to pay. A solid selling strategy can really make the difference in this market.”
For those who are selling, it is vital to know how the market is performing for your specific type of property! For those who are interested in investing in real estate, this is an ideal market! Interest rates continue to favourborrowers.
Hope this helps!
Susanita de Diego
3
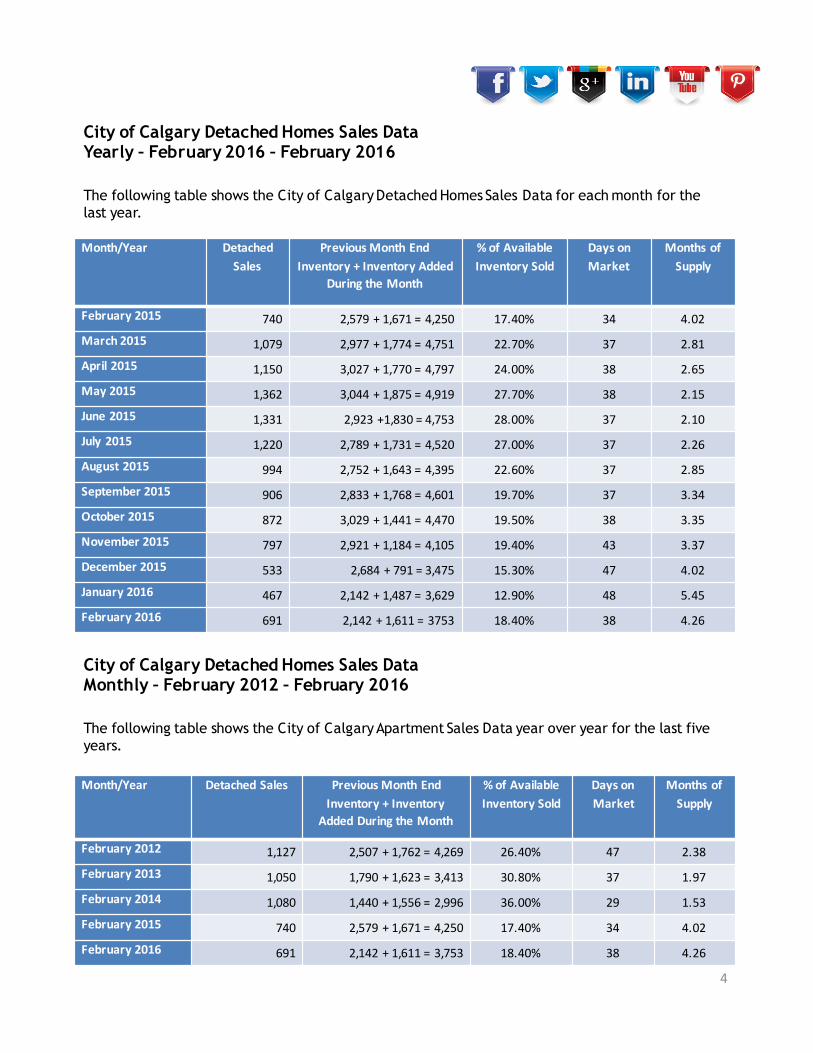
City of Calgary Detached Homes Sales DataYearly – February 2016 – February 2016
The following table shows the City of Calgary Detached Homes Sales Data for each month for the last year.
Month/Year DetachedSales
PreviousMonthEndInventory+InventoryAdded
DuringtheMonth
%ofAvailableInventorySold
DaysonMarket
MonthsofSupply
February2015 740 2,579+1,671=4,250 17.40% 34 4.02
March2015 1,079 2,977+1,774=4,751 22.70% 37 2.81
April2015 1,150 3,027+1,770=4,797 24.00% 38 2.65
May2015 1,362 3,044+1,875=4,919 27.70% 38 2.15
June2015 1,331 2,923+1,830=4,753 28.00% 37 2.10
July2015 1,220 2,789+1,731=4,520 27.00% 37 2.26
August2015 994 2,752+1,643=4,395 22.60% 37 2.85
September2015 906 2,833+1,768=4,601 19.70% 37 3.34
October2015 872 3,029+1,441=4,470 19.50% 38 3.35
November2015 797 2,921+1,184=4,105 19.40% 43 3.37
December2015 533 2,684+791=3,475 15.30% 47 4.02
January2016 467 2,142+1,487=3,629 12.90% 48 5.45
February2016 691 2,142+1,611=3753 18.40% 38 4.26
City of Calgary Detached Homes Sales DataMonthly – February 2012 – February 2016
The following table shows the City of Calgary Apartment Sales Data year over year for the last five years.
Month/Year DetachedSales PreviousMonthEndInventory+Inventory
AddedDuringtheMonth
%ofAvailableInventorySold
DaysonMarket
MonthsofSupply
February2012 1,127 2,507+1,762=4,269 26.40% 47 2.38
February2013 1,050 1,790+1,623=3,413 30.80% 37 1.97
February2014 1,080 1,440+1,556=2,996 36.00% 29 1.53
February2015 740 2,579+1,671=4,250 17.40% 34 4.02
February2016 691 2,142+1,611=3,753 18.40% 38 4.26
4

The MLS® Home Price Index (HPI)
The MLS® Home Price Index (HPI) was launched on February 6, 2012 as part of a nationwide rollout involving boards in Canada’s largest cities because average and median price changes can misrepresent changes in market price. We often refer to the median price as being immune from outliers. However, if there have been large movements in either the low end or high end of the price spectrum, the median is unable to reflect the price changes.
The MLS® Home Price Index (HPI) was introduced to provide a better measurement of price and price trends for residential properties. A benchmark home is one that is comprised of a set of specific attributes that is typical for the area where it is located.
The City of Calgary Detached Benchmark, Average and Median Prices have shown the following progression:
5

City of Calgary Semi-Detached Homes Sales DataYearly – February 2015 – February 2016
The following table shows the City of Calgary Semi-Detached Homes Sales Data for each month for the last year.
Month/Year Semi-DetachedSales
PreviousMonthEndInventory+InventoryAdded
DuringtheMonth
%ofAvailableInventorySold
DaysonMarket
MonthsofSupply
February2015 95 471+275=746 12.70% 35 5.73
March2015 160 544+308=852 18.80% 41 3.58
April2015 202 572+267=839 24.10% 39 2.49
May2015 192 502+300=802 23.90% 45 2.54
June2015 184 488+294=782 23.50% 43 2.67
July2015 191 491+282=773 24.70% 44 2.57
August2015 138 491+246=737 18.70% 41 3.67
September2015 103 506+268=774 13.30% 40 5.38
October2015 128 554+293=847 15.10% 41 4.58
November2015 108 586+200=786 13.70% 47 5.06
December2015 74 546+142=688 10.80% 53 6.07
January2016 71 449+270=719 9.90% 44 7.10
February2016 109 504+285=789 13.80% 47 5.10
City of Calgary Semi-Detached Homes Sales DataMonthly – February 2012 – February 2016
The following table shows the City of Calgary Semi-Detached Sales Data year over year for the last five years.
Month/Year AttachedSales PreviousMonthEndInventory+Inventory
AddedDuringtheMonth
%ofAvailableInventorySold
DaysonMarket
MonthsofSupply
February2012 154 384+250=634 24.30% 57 2.66
February2013 157 286+261=547 28.70% 37 2.10
February2014 173 268+244=512 23.80% 34 1.67
February2015 95 471+275=746 12.70% 35 5.73
February2016 109 504+285=789 13.80% 47 5.10
6

The following table shows the City of Calgary Semi-Detached Sales Data for each month since February of last year.
7

City of Calgary Row Homes Sales DataYearly – February 2015 – February 2016
The following table shows the City of Calgary Row Homes Sales Data for each month for the last year.
Month/Year RowSales PreviousMonthEndInventory+InventoryAdded
DuringtheMonth
%ofAvailableInventorySold
DaysonMarket
MonthsofSupply
February2015 156 544+396=940 16.60% 33 4.31
March2015 236 672+375=1,047 22.50% 38 2.88
April2015 259 679+419=1,098 23.60% 42 2.80
May2015 273 724+380=1,104 24.70% 41 2.46
June2015 268 672+385=1,057 25.40% 44 2.41
July2015 255 645+390=1,035 24.60% 44 2.53
August2015 227 644+339=983 23.10% 46 2.85
September2015 181 648+402=1,050 17.20% 41 3.99
October2015 184 722+369=1,091 16.90% 41 4.06
November2015 161 747+308=1,055 15.30% 50 4.60
December2015 120 740+215=955 12.60% 47 5.33
January2016 99 640+385=1,025 9.66% 51 7.37
February2016 159 730+373=1,103 14.42% 52 4.91
City of Calgary Row Homes Sales DataMonthly – February 2012 – February 2016
The following table shows the City of Calgary Row Home Sales Data year over year for the last five years.
Month/Year AttachedSales PreviousMonthEndInventory+Inventory
AddedDuringtheMonth
%ofAvailableInventorySold
DaysonMarket
MonthsofSupply
February2012 184 468+333=801 22.97% 52 2.96
February2013 207 334+317=651 31.80% 37 1.85
February2014 229 230+324=554 41.34% 27 1.25
February2015 156 544+396=940 16.60% 33 4.31
February2016 159 730+373=1,103 14.42% 52 4.91
8

The following table shows the City of Calgary Row Sales Data for each month since February of last year.
9
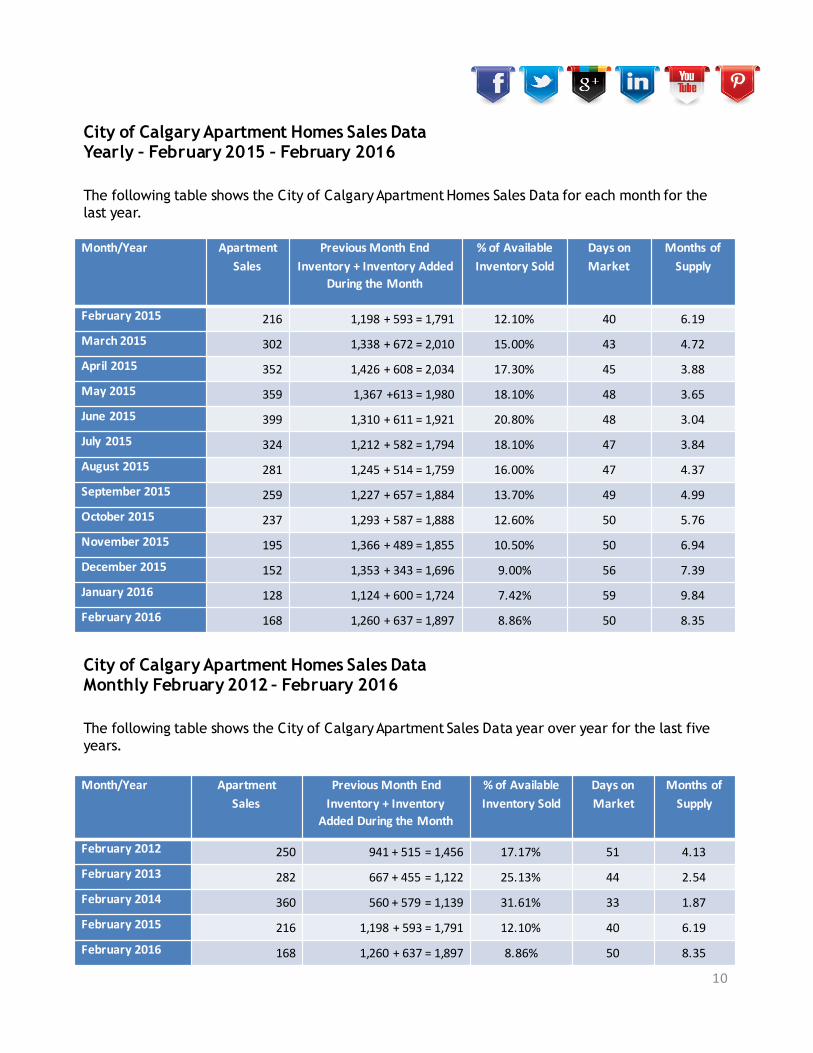
City of Calgary Apartment Homes Sales DataYearly – February 2015 – February 2016
The following table shows the City of Calgary Apartment Homes Sales Data for each month for the last year.
Month/Year ApartmentSales
PreviousMonthEndInventory+InventoryAdded
DuringtheMonth
%ofAvailableInventorySold
DaysonMarket
MonthsofSupply
February2015 216 1,198+593=1,791 12.10% 40 6.19
March2015 302 1,338+672=2,010 15.00% 43 4.72
April2015 352 1,426+608=2,034 17.30% 45 3.88
May2015 359 1,367+613=1,980 18.10% 48 3.65
June2015 399 1,310+611=1,921 20.80% 48 3.04
July2015 324 1,212+582=1,794 18.10% 47 3.84
August2015 281 1,245+514=1,759 16.00% 47 4.37
September2015 259 1,227+657=1,884 13.70% 49 4.99
October2015 237 1,293+587=1,888 12.60% 50 5.76
November2015 195 1,366+489=1,855 10.50% 50 6.94
December2015 152 1,353+343=1,696 9.00% 56 7.39
January2016 128 1,124+600=1,724 7.42% 59 9.84
February2016 168 1,260+637=1,897 8.86% 50 8.35
City of Calgary Apartment Homes Sales DataMonthly February 2012 – February 2016
The following table shows the City of Calgary Apartment Sales Data year over year for the last five years.
Month/Year ApartmentSales
PreviousMonthEndInventory+Inventory
AddedDuringtheMonth
%ofAvailableInventorySold
DaysonMarket
MonthsofSupply
February2012 250 941+515=1,456 17.17% 51 4.13
February2013 282 667+455=1,122 25.13% 44 2.54
February2014 360 560+579=1,139 31.61% 33 1.87
February2015 216 1,198+593=1,791 12.10% 40 6.19
February2016 168 1,260+637=1,897 8.86% 50 8.35
10

The City of Calgary Apartment Benchmark, Average and Median Prices have shown the following progression:
11

Rural Rockyview Detached Sales DataYearly – February 2015 – February 2016
The following table shows Rural Rockyview Detached Homes Sales Data for each month for the last year.
Month/Year DetachedSales
PreviousMonthEndInventory+InventoryAdded
DuringtheMonth
%ofAvailableInventorySold
DaysonMarket
MonthsofSupply
February2015 20 248+76=324 6.17% 74 13.85
March2015 23 277+82=345 6.67% 86 12.87
April2015 28 296+68=364 7.69% 71 10.89
May2015 35 305+87=392 8.93% 78 9.43
June2015 41 330+84=414 9.90% 97 7.93
July2015 29 325+62=387 7.49% 84 10.55
August2015 14 306+68=374 3.74% 73 23.62
September2015 15 314+66=380 3.95% 96 20.27
October2015 22 305+53=358 6.15% 104 13.00
November2015 19 287+41=328 5.80% 106 14.05
December2015 16 270+46=316 5.10% 136 13.38
January2016 5 213+65=278 1.80% 83 46.40
February2016 16 232+68=300 5.33% 59 16.06
Rural Rockyview Detached Sales DataMonthly – February 2012 – February 2016
The following table shows the Rural Rockyview Detached Homes Sales Data year over year for the last five years.
Month/Year DetachedSales PreviousMonthEndInventory+Inventory
AddedDuringtheMonth
%ofAvailableInventorySold
DaysonMarket
MonthsofSupply
February2012 32 312+89=401 7.98% 90 10.31
February2013 35 314+90=404 8.66% 83 10.00
February2014 28 268+95=363 7.71% 145 10.32
February2015 20 248+76=324 6.17% 74 13.85
February2016 16 232+68=300 5.33% 59 16.06
12

Rural Rockyview Detached Sales Data Benchmark, Average and Median Prices have shown the following progression:
13

“Slow sales and elevated housing inventory has resulted in further price declines” said CREB® chief economist Ann-Marie Lurie.
“”
14

Rural Foothills Detached Sales DataYearly – February 2015 – February 2016
The following table shows Rural Foothills Detached Homes Sales Data for each month for the last year.
Month/Year DetachedSales
PreviousMonthEndInventory+InventoryAdded
DuringtheMonth
%ofAvailableInventorySold
DaysonMarket
MonthsofSupply
February2015 17 124+40=164 10.37% 139 8.18
March2015 14 139+47=186 7.50% 139 12.00
April2015 14 156_54=210 6.67% 98 13.21
May2015 24 185+63=248 9.68% 102 8.38
June2015 17 201+51=252 6.75% 52 12.59
July2015 16 214+40=254 6.30% 86 13.25
August2015 10 212+39=251 3.98% 56 20.40
September2015 18 204+36=236 7.63% 130 9.89
October2015 15 178+36=214 7.01%% 123 10.47
November2015 14 157+23=180 7.78% 81 9.86
December2015 13 139+15=154 8.40% 98 8.31
January2016 6 109+33=142 4.23% 125 18.00
February2016 7 108+41=149 4.70% 64 17.14
Rural Foothills Detached Sales DataMonthly – February 2012 – February 2016
The following table shows the Rural Foothills Detached Sales Data year over year for the last five years.
Month/Year DetachedSales PreviousMonthEndInventory+Inventory
AddedDuringtheMonth
%ofAvailableInventorySold
DaysonMarket
MonthsofSupply
February2012 14 180+50=230 6.09% 90 14.14
February2013 15 160+47=207 7.25% 123 11.53
February2014 10 120+55=175 5.71% 114 14.80
February2015 17 124+40=164 10.37% 139 8.12
February2016 7 108+41=149 4.70% 64 17.14
15
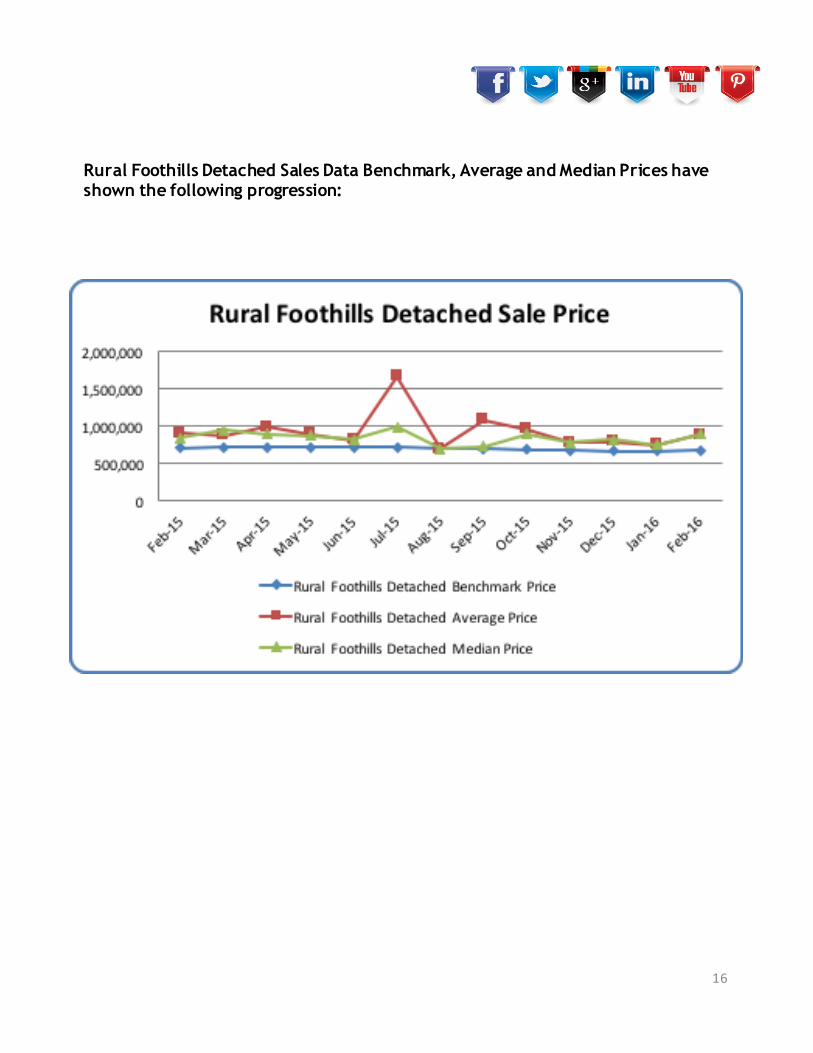
Rural Foothills Detached Sales Data Benchmark, Average and Median Prices have shown the following progression:
16

Cochrane Detached Sales DataYearly – February 2015 – February 2016
The following table shows Cochrane Detached Homes Sales Data for each month for the last year.
Month/Year DetachedSales
PreviousMonthEndInventory+InventoryAdded
DuringtheMonth
%ofAvailableInventorySold
DaysonMarket
MonthsofSupply
February2015 16 94+62=156 10.30% 36 7.44
March2015 33 119+73=192 17.20% 56 4.09
April2015 25 135+68=203 12.30% 47 6.24
May2015 41 156+71=227 18.10% 48 3.98
June2015 37 163+71=234 15.80% 58 4.49
July2015 35 166+60=226 15.50% 51 4.66
August2015 38 163+66=229 16.60% 58 3.89
September2015 30 148+74=222 13.50% 55 5.47
October2015 33 164+52=216 15.30% 44 4.52
November2015 27 149+54=203 13.30% 82 5.44
December2015 19 147+25=172 11.00% 76 6.42
January2016 26 122+65=187 13.90% 69 5.15
February2016 22 134+58=192 11.46% 76 6.59
Cochrane Detached Sales DataMonthly – February 2012 – February 2016
The following table shows Cochrane Sales Data year over year for the last five years.
Month/Year DetachedSales PreviousMonthEndInventory+Inventory
AddedDuringtheMonth
%ofAvailableInventorySold
DaysonMarket
MonthsofSupply
February2011 19 137+46=183 10.38% 90 7.58
February2012 16 93+62=155 10.32% 72 7.44
February2013 39 80+63=143 27.27% 50 2.15
February2014 16 94+62=156 10.30% 36 7.44
February2015 22 134+58=192 11.46% 76 6.59
17
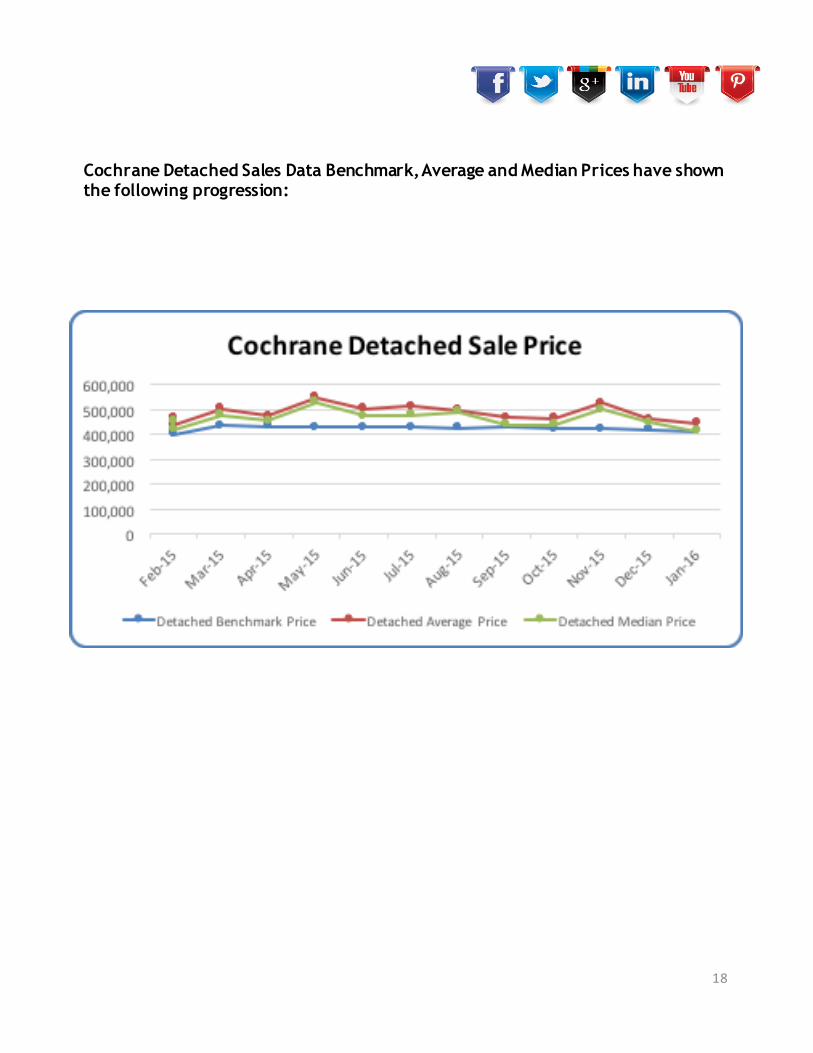
Cochrane Detached Sales Data Benchmark, Average and Median Prices have shown the following progression:
18

Okotoks Detached Sales DataYearly – February 2015 – February 2016
The following table shows the OkotoksDetached Sales Data for each month for the last year.
Month/Year DetachedSales
PreviousMonthEndInventory+InventoryAdded
DuringtheMonth
%ofAvailableInventorySold
DaysonMarket
MonthsofSupply
February2015 19 102+68=170 11.20% 27 7.05
March2015 45 134+80=214 21.00% 37 3.58
April2015 36 161+63=224 25.50% 39 4.47
May2015 43 161+91=252 17.10% 47 4.02
June2015 46 173+78=251 18.30% 56 3.57
July2015 50 164+79=243 20.60% 69 3.48
August2015 37 174+63=237 15.60% 45 4.68
September2015 37 173+5=232 15.90% 55 4.43
October2015 33 164+69=233 14.20% 62 4.88
November2015 33 161+42=203 16.30% 66 4.12
December2015 22 136+40=176 12.50% 65 5.59
January2016 24 124+84=208 11.54% 59 6.46
February2016 26 150+78=228 11.40% 59 7.27
Okotoks Detached Sales DataMonthly – February 2012 – February 2016
The following table shows Okotoks Sales Data year over year for the last five years.
Month/Year DetachedSales PreviousMonthEndInventory+Inventory
AddedDuringtheMonth
%ofAvailableInventorySold
DaysonMarket
MonthsofSupply
February2012 26 125+64=129 20.16% 65 5.42
February2013 29 97+63=160 18.13% 78 4.00
February2014 42 74+46=120 35.00% 36 1.64
February2015 19 102+68=170 11.20% 27 7.05
February2016 26 150+78=228 11.40% 59 7.27
19

Okotoks Detached Sales Data Benchmark, Average and Median Prices have shown the following progression:
20

Curious About theValue of Your Home?
As you can see, current market conditions play a critical role in determining the value of your home.
Equally important however, is having an experienced and knowledgeable professional Realtor® on your side.
Coldwell Banker Complete Real Estate would welcome the opportunity to discuss any of your Real Estate needs at your convenience.
#yesyoumatter
Request Your Free Home Evaluation Today!
Coldwell Banker Complete Real EstatePhone: 403-686-1455
21