
Housing Inequality An Intergenerational Perspective · Housing Inequality An Intergenerational...
43
Housing Inequality An Intergenerational Perspective February 1, 2018 Kyung-Hwan Kim Visiting Fellow, Perry World House University of Pennsylvania Professor of Economics, Sogang University
Transcript of Housing Inequality An Intergenerational Perspective · Housing Inequality An Intergenerational...
Housing InequalityAn Intergenerational Perspective
February 1, 2018
Kyung-Hwan KimVisiting Fellow, Perry World House
University of PennsylvaniaProfessor of Economics, Sogang University
Outline
What is the issue?
How relevant is it?
What are the problems?
What are the root causes?
What can be done?
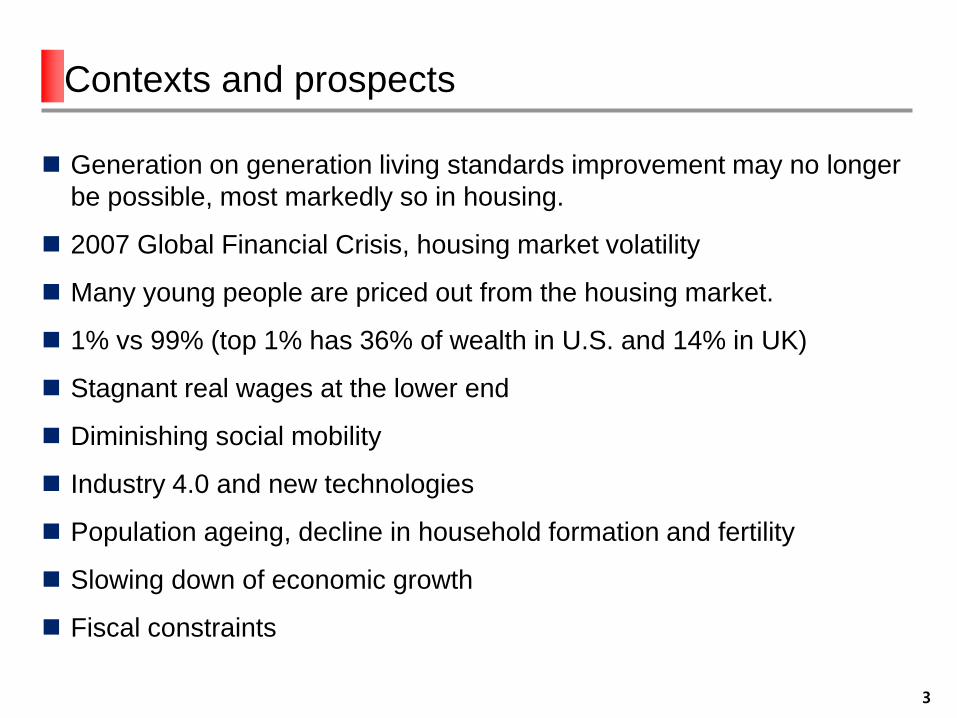
Contexts and prospects
Generation on generation living standards improvement may no longer
be possible, most markedly so in housing.
2007 Global Financial Crisis, housing market volatility
Many young people are priced out from the housing market.
1% vs 99% (top 1% has 36% of wealth in U.S. and 14% in UK)
Stagnant real wages at the lower end
Diminishing social mobility
Industry 4.0 and new technologies
Population ageing, decline in household formation and fertility
Slowing down of economic growth
Fiscal constraints
3
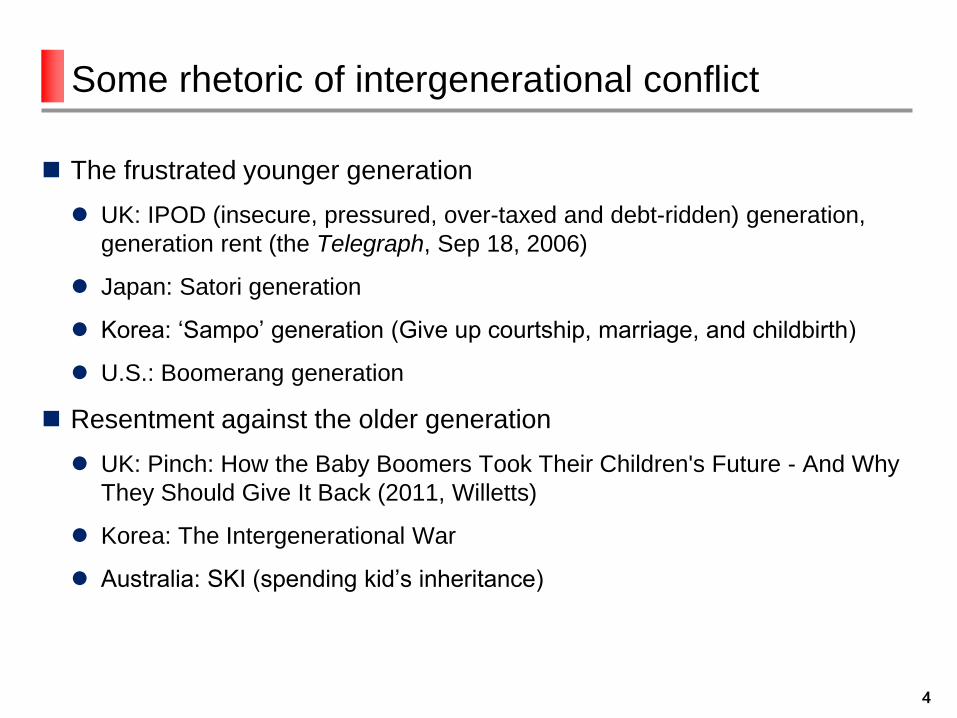
Some rhetoric of intergenerational conflict
The frustrated younger generation
UK: IPOD (insecure, pressured, over-taxed and debt-ridden) generation,
generation rent (the Telegraph, Sep 18, 2006)
Japan: Satori generation
Korea: ‘Sampo’ generation (Give up courtship, marriage, and childbirth)
U.S.: Boomerang generation
Resentment against the older generation
UK: Pinch: How the Baby Boomers Took Their Children's Future - And Why
They Should Give It Back (2011, Willetts)
Korea: The Intergenerational War
Australia: SKI (spending kid’s inheritance)
4

Housing inequality
Income inequality vs wealth inequality
Income inequality relates to labor market, human capital, technology (cost of living adjustment needed)
Wealth inequality relates to cumulated income, capital gains from assets
Housing has two dimensions, and so does housing inequality.
Shelter: Quantity, quality and affordable housing service
Asset: Wealth accumulation to homeowners due to appreciation
Why should we mind the housing gap?
Availability of affordable housing is a prerequisite for inclusive and diverse cities.
Housing comprises the largest share in the asset portfolio of a typical household in many countries.
Homeownership rate among the younger generation is falling.
Housing wealth can be passed onto the next generation.
Intergenerational transfers affect homeownership.
Homeownership affects education and therefore future income and living standards. (Boehm and Schlottmann 1999)
5
How relevant is it as a global issue?
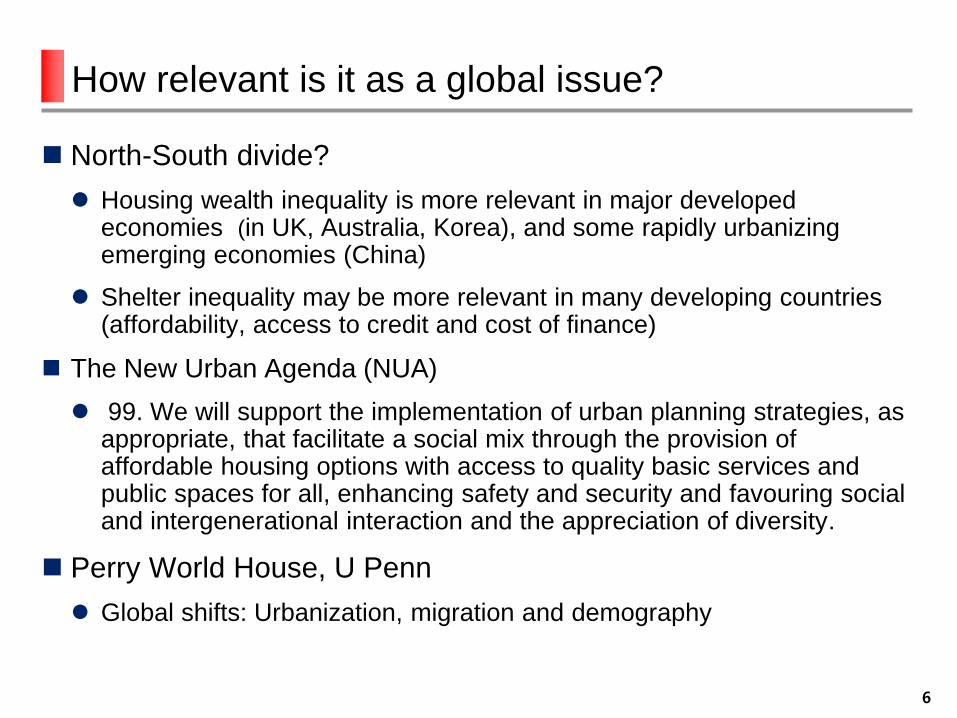
North-South divide?
Housing wealth inequality is more relevant in major developed economies (in UK, Australia, Korea), and some rapidly urbanizingemerging economies (China)
Shelter inequality may be more relevant in many developing countries (affordability, access to credit and cost of finance)
The New Urban Agenda (NUA)
99. We will support the implementation of urban planning strategies, as appropriate, that facilitate a social mix through the provision of affordable housing options with access to quality basic services and public spaces for all, enhancing safety and security and favouring social and intergenerational interaction and the appreciation of diversity.
Perry World House, U Penn
Global shifts: Urbanization, migration and demography
6
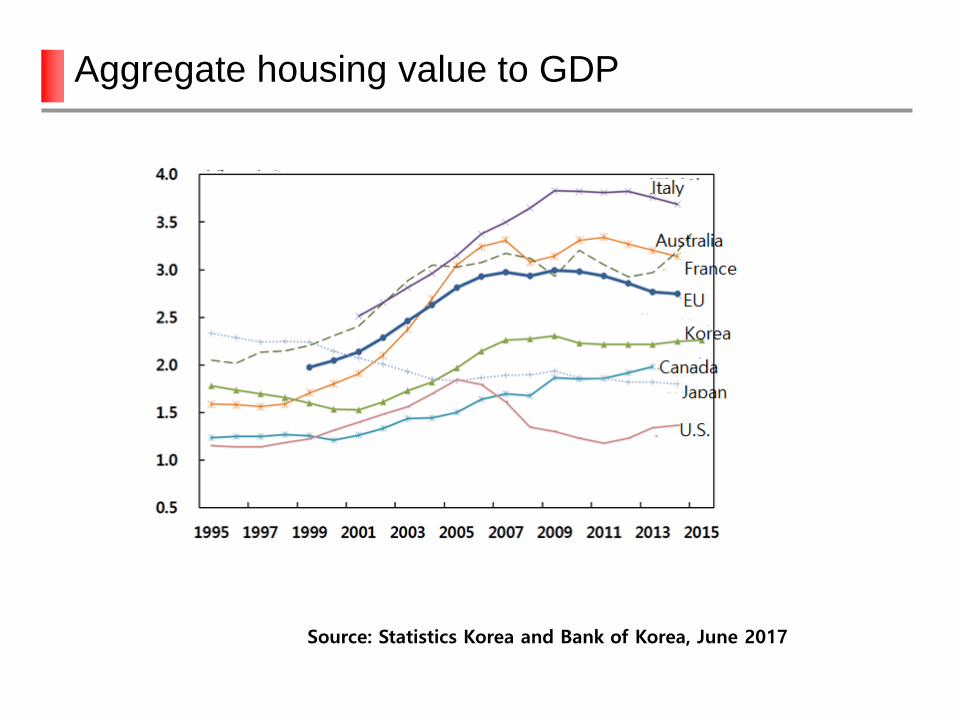
Aggregate housing value to GDP
Source: Statistics Korea and Bank of Korea, June 2017
The nature of housing inequality
Increases in real housing prices in major economies
Housing boom since late 1990s till mid 2000s
Driving forces: record low interest rate, liquidity, supply constraints
National average vs differences across cities
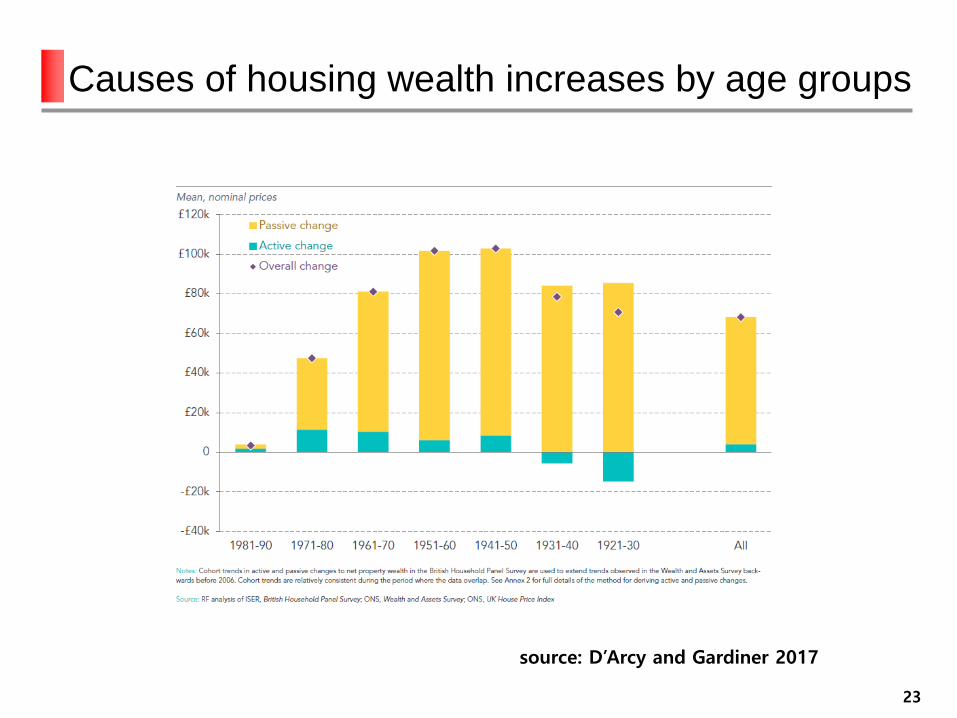
Windfall gains accruing to home owners
Passive gain due to housing price appreciation to the benefit of baby boomers
Members of younger generation could not participate in sharing the gain since their home ownership rate fell
Concentration of housing wealth and widening gap
Spatial
Across income groups
Across generations
8

Real house price appreciation 1996-2016
9
Source: The Economist
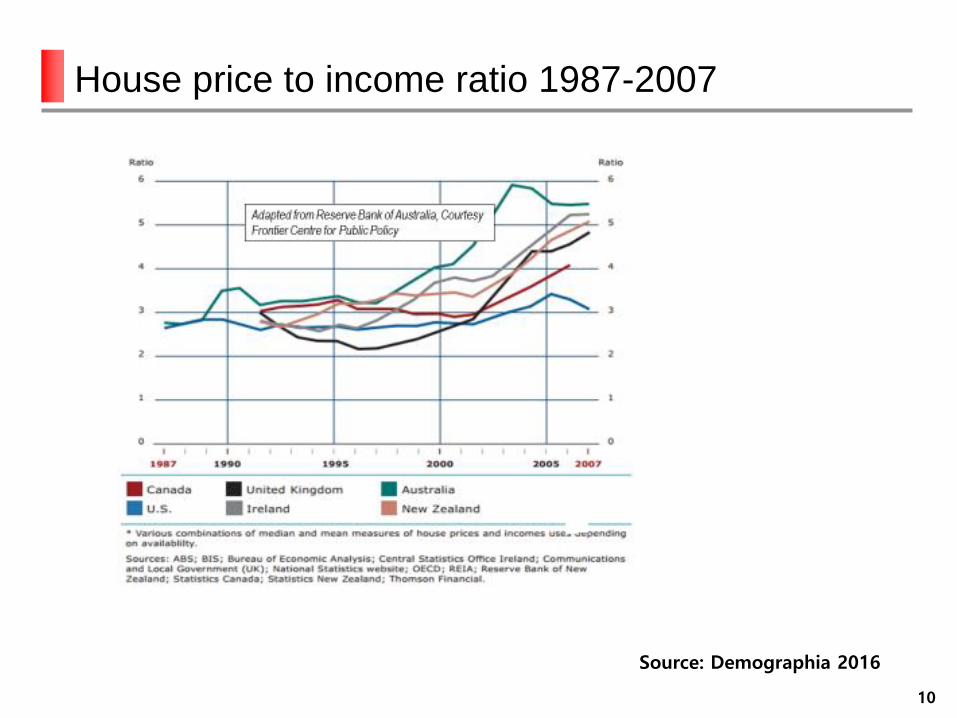
House price to income ratio 1987-2007
10
Source: Demographia 2016
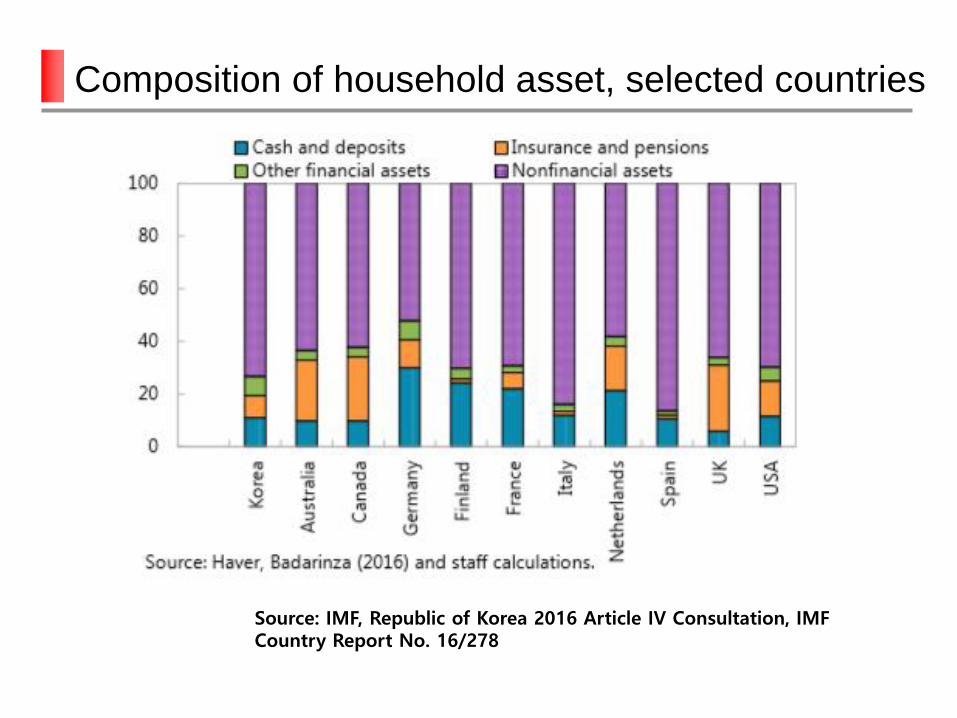
Source: IMF, Republic of Korea 2016 Article IV Consultation, IMF Country Report No. 16/278
Composition of household asset, selected countries
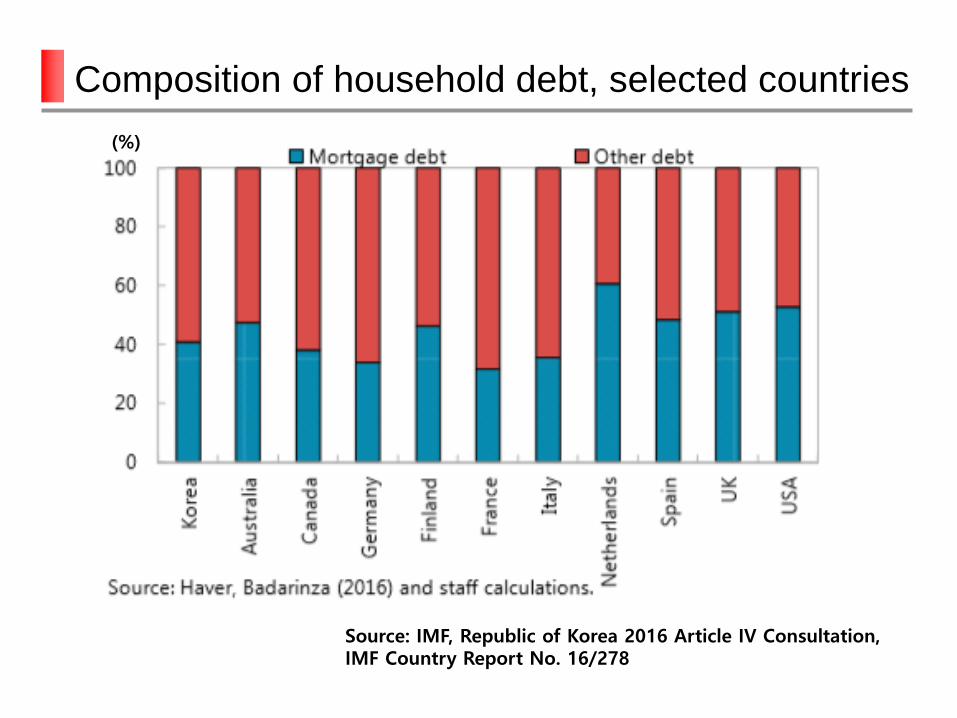
Composition of household debt, selected countries
Source: IMF, Republic of Korea 2016 Article IV Consultation, IMF Country Report No. 16/278
(%)
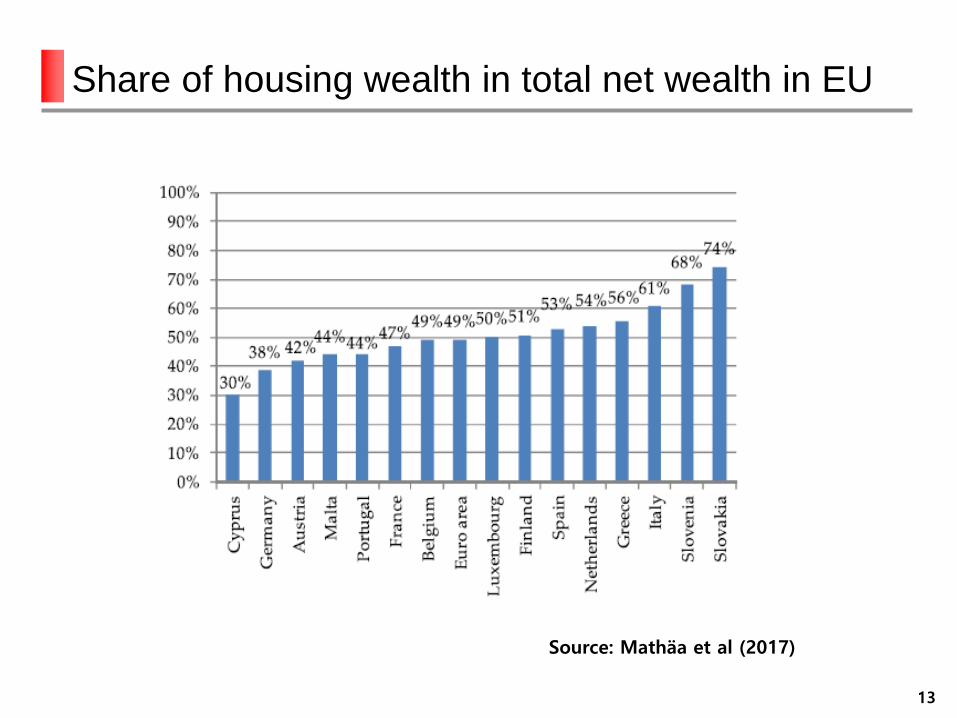
Share of housing wealth in total net wealth in EU
13
Source: Mathäa et al (2017)
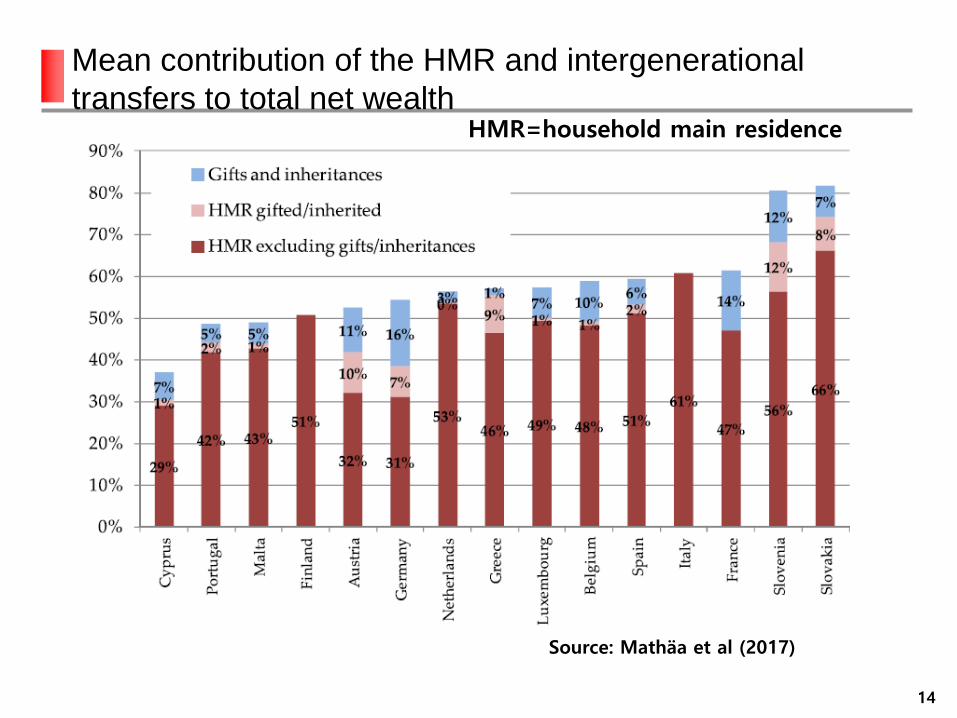
Mean contribution of the HMR and intergenerational
transfers to total net wealth
14
Source: Mathäa et al (2017)
HMR=household main residence
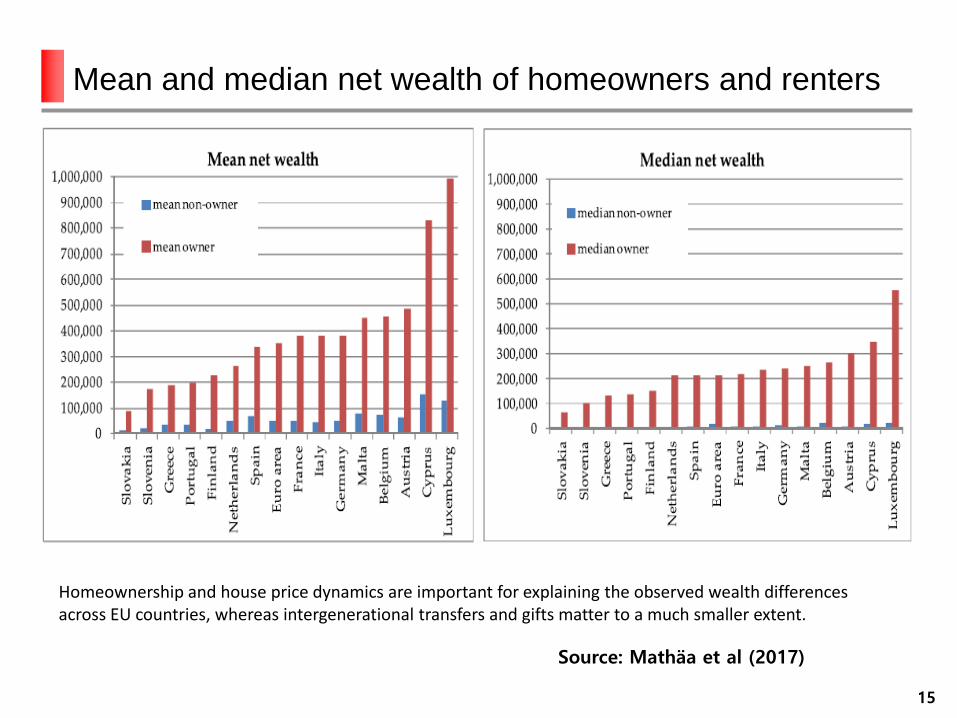
Mean and median net wealth of homeowners and renters
15
Source: Mathäa et al (2017)
Homeownership and house price dynamics are important for explaining the observed wealth differences across EU countries, whereas intergenerational transfers and gifts matter to a much smaller extent.
Housing and inequality: The Piketty thesis
Piketty (2014)
Capital income/GDP has been rising and worsening income distribution.
Rognlie (2015)
The net rate of return on capital other than housing has been stable since 1970s in seven major economies
Rate of return on housing has been rising due to the appreciation of housing price
Capital gains from housing accrue mainly to home owners
Piketty’s book should be entitled the theory of housing capital of the 21st
century.
La Cava (2016)
Capital gains from housing accrue to homeowners.
Supply elasticity matters.
Real interest rate matters.
16
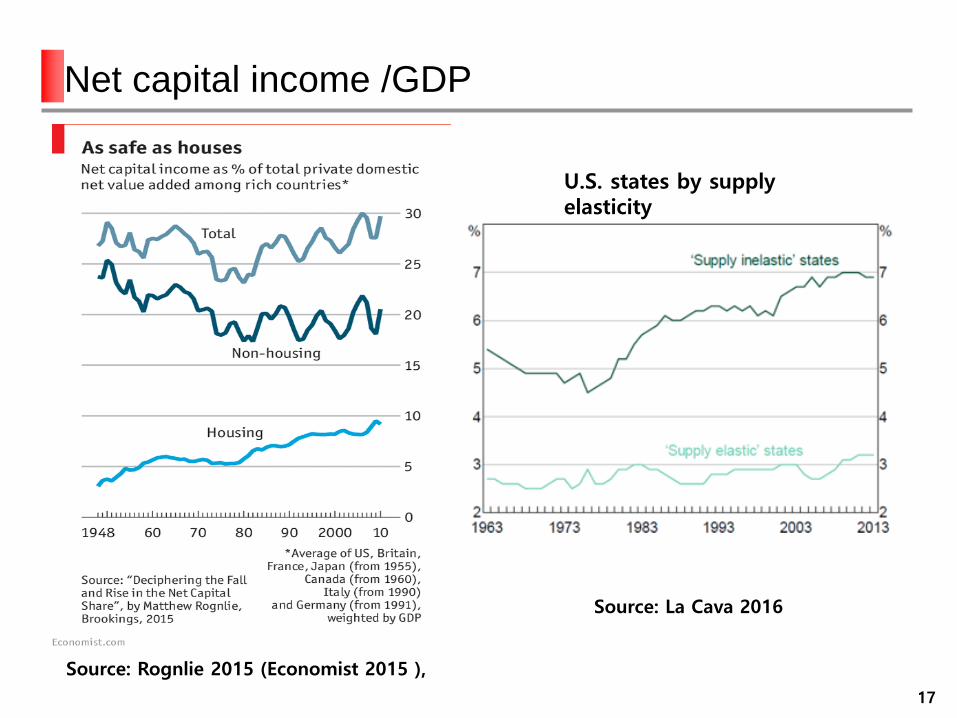
Net capital income /GDP
17
Source: Rognlie 2015 (Economist 2015 ),
U.S. states by supplyelasticity
Source: La Cava 2016
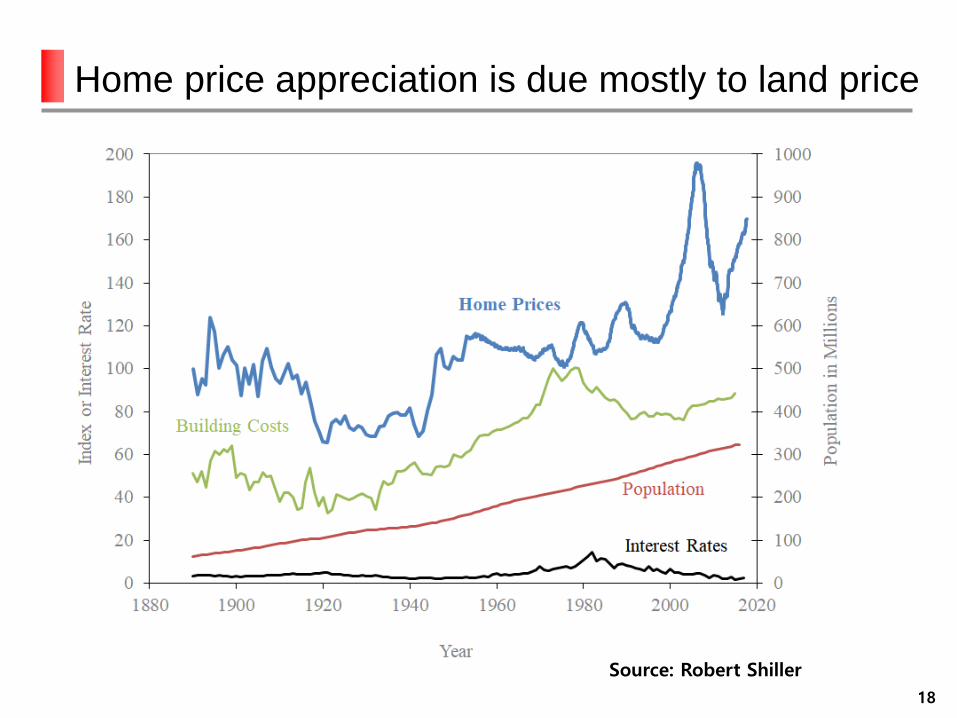
Home price appreciation is due mostly to land price
18
Source: Robert Shiller
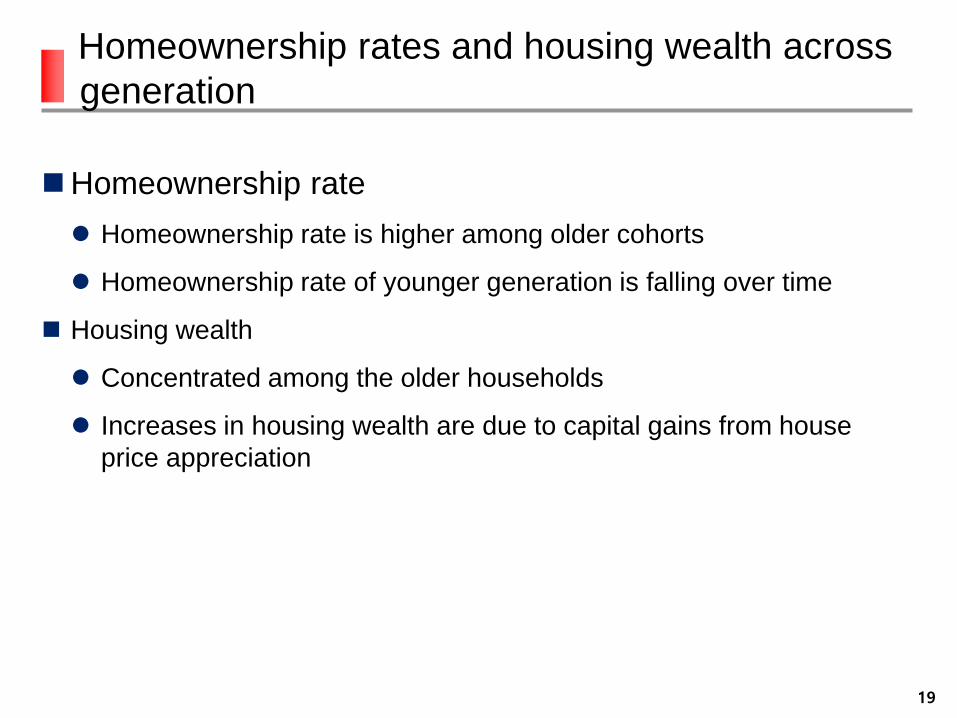
Homeownership rates and housing wealth across
generation
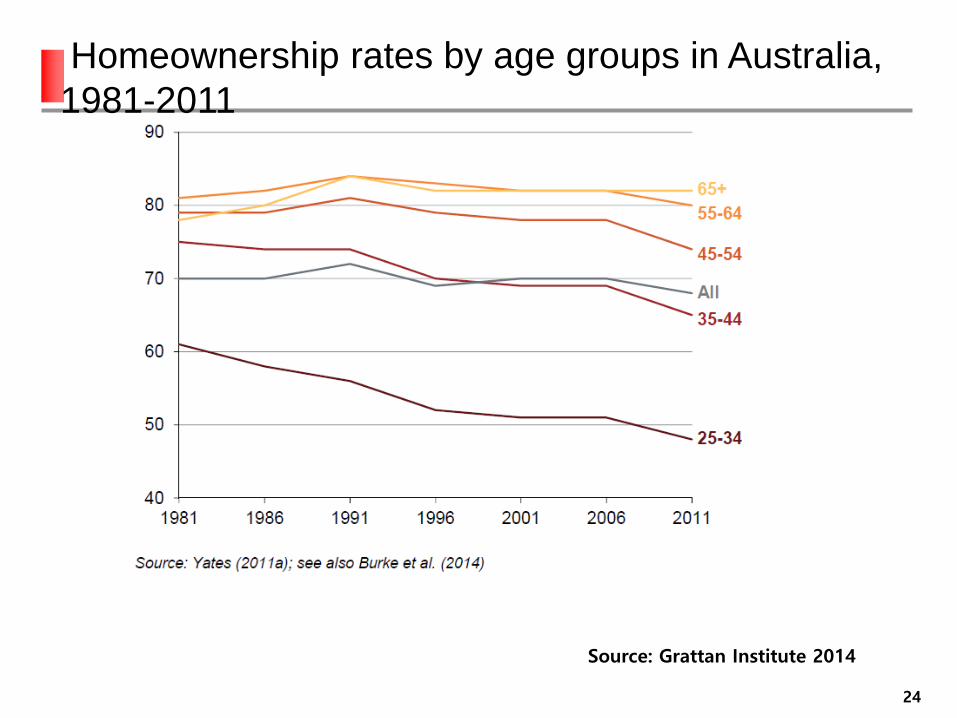
Homeownership rate
Homeownership rate is higher among older cohorts
Homeownership rate of younger generation is falling over time
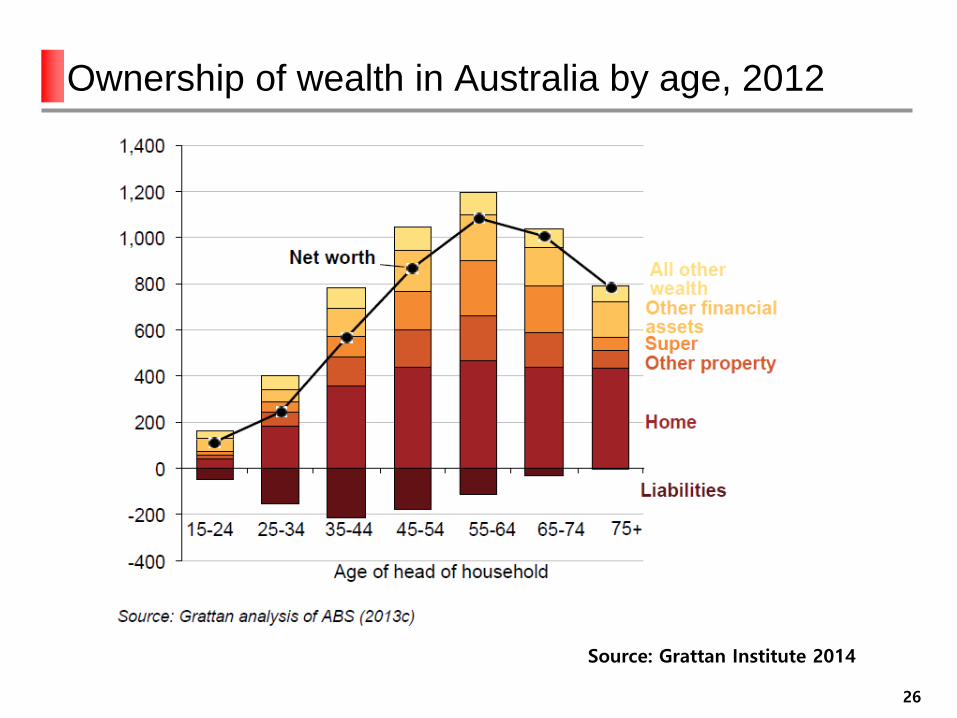
Housing wealth
Concentrated among the older households
Increases in housing wealth are due to capital gains from house
price appreciation
19
20
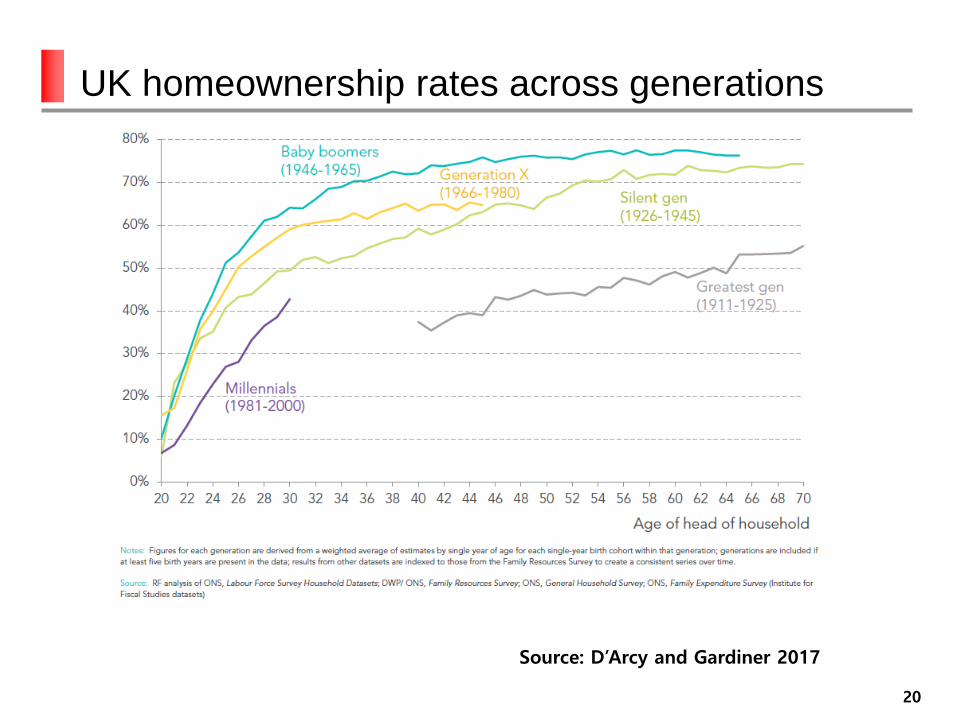
Source: D’Arcy and Gardiner 2017
UK homeownership rates across generations
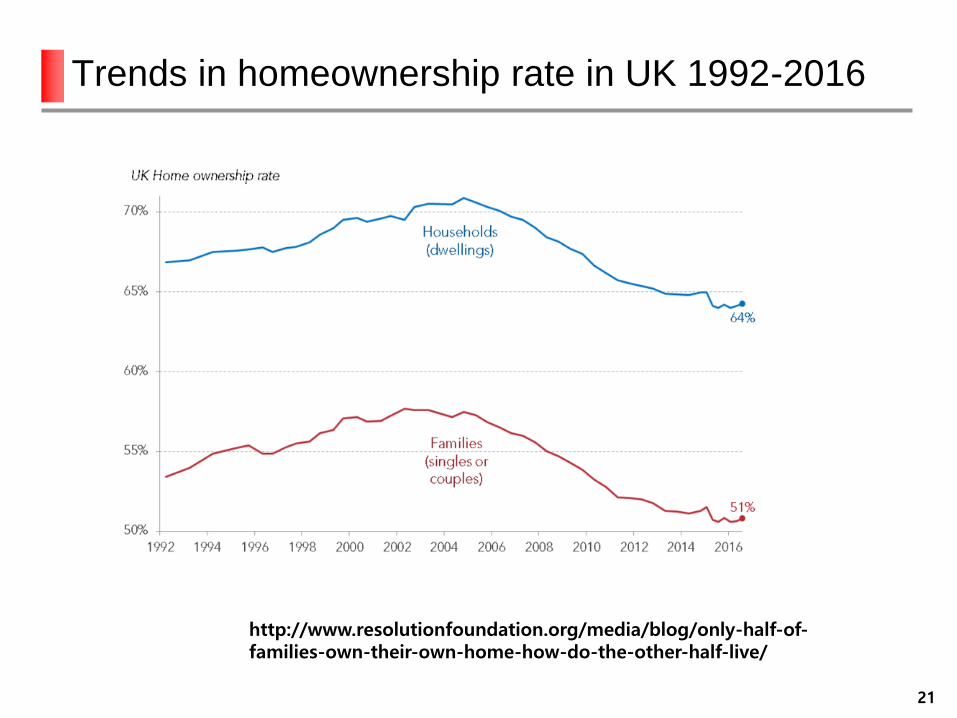
Trends in homeownership rate in UK 1992-2016
21
http://www.resolutionfoundation.org/media/blog/only-half-of-families-own-their-own-home-how-do-the-other-half-live/
22
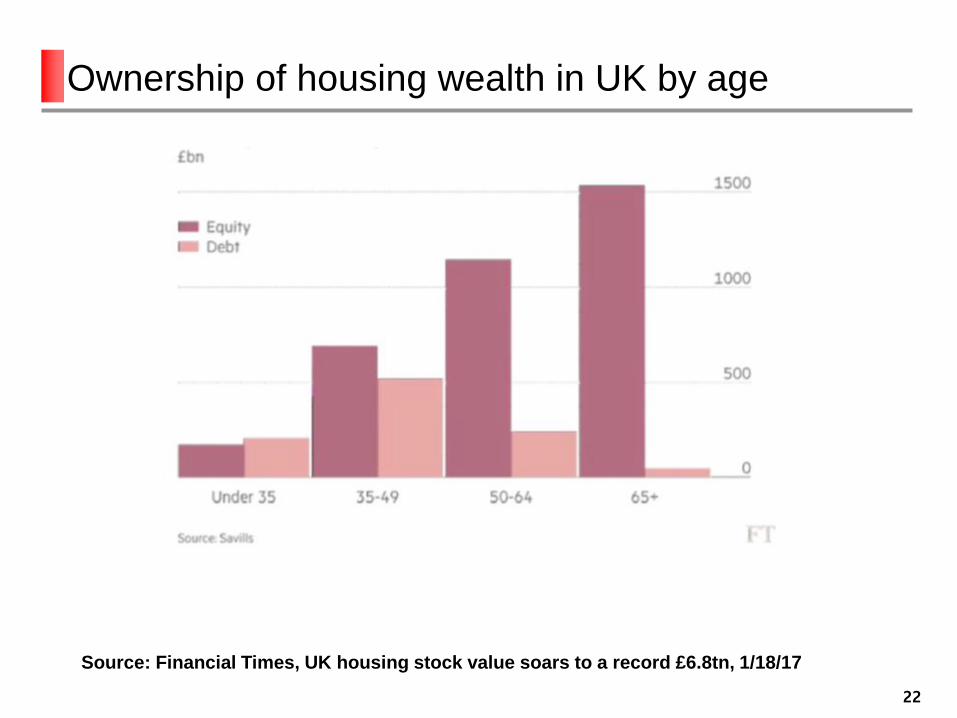
Source: Financial Times, UK housing stock value soars to a record £6.8tn, 1/18/17
Ownership of housing wealth in UK by age
23
source: D’Arcy and Gardiner 2017
Causes of housing wealth increases by age groups
24
Homeownership rates by age groups in Australia,
1981-2011
Source: Grattan Institute 2014
25
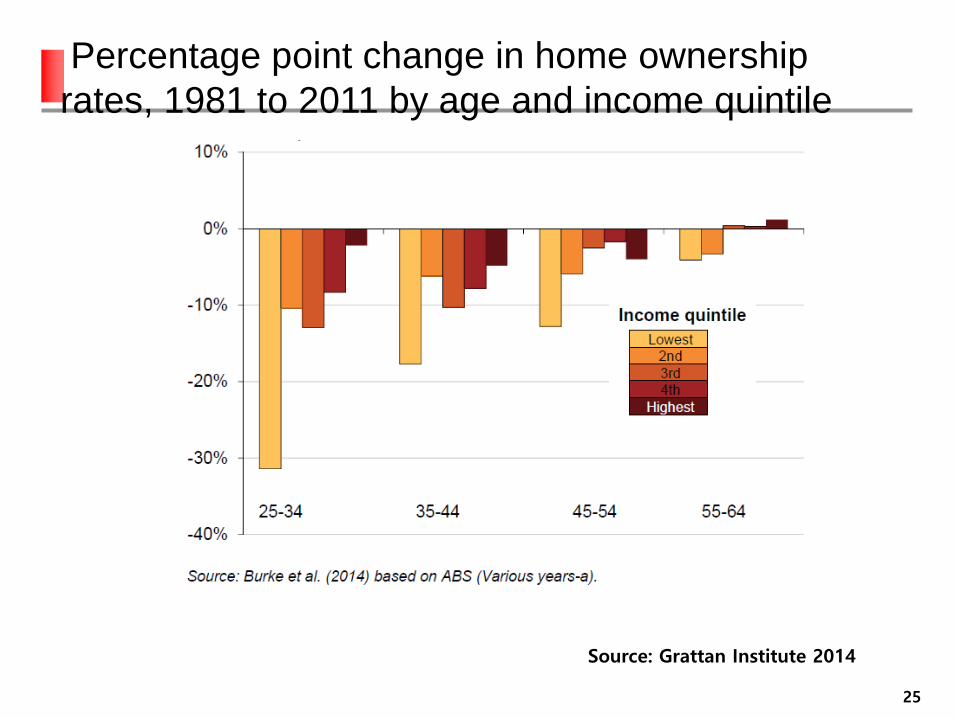
Percentage point change in home ownership
rates, 1981 to 2011 by age and income quintile
Source: Grattan Institute 2014
26
Ownership of wealth in Australia by age, 2012
Source: Grattan Institute 2014
27
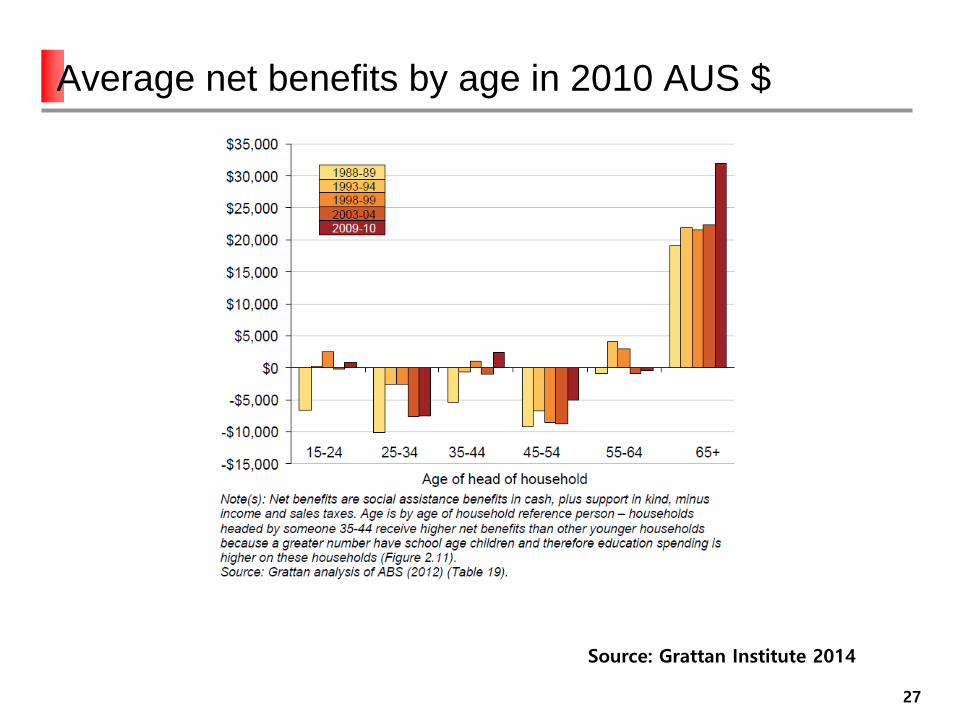
Source: Grattan Institute 2014
Average net benefits by age in 2010 AUS $
Intergenerational transfers and homeownership
Intergenerational transfers
Inter vivos gifts and bequests have different impacts
Australia (Barrett et al 2015)
A receipt of bequest increased the likelihood of homeownership by 2-
4 % points, and is positively related to the size of bequest.
Switzerland (Blickle and Brown 2016)
Wealth transfers increase the propensity of households to transition to
ownership by 15 to 20 percentage points, but do not increase the likelihood
that existing homeowners “trade-up” to larger homes in better locations.
Korea (Ma 2013)
Children of parents who are homeowners are more likely to become
homeowners, and they are likely to choose the same housing type.
28
29
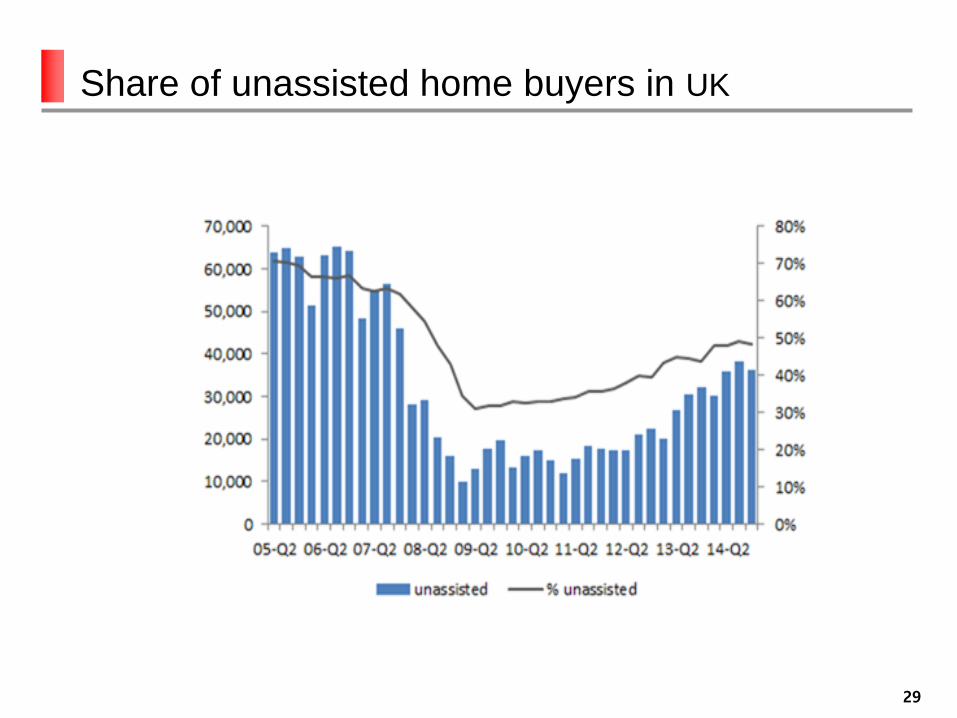
Share of unassisted home buyers in UK
30
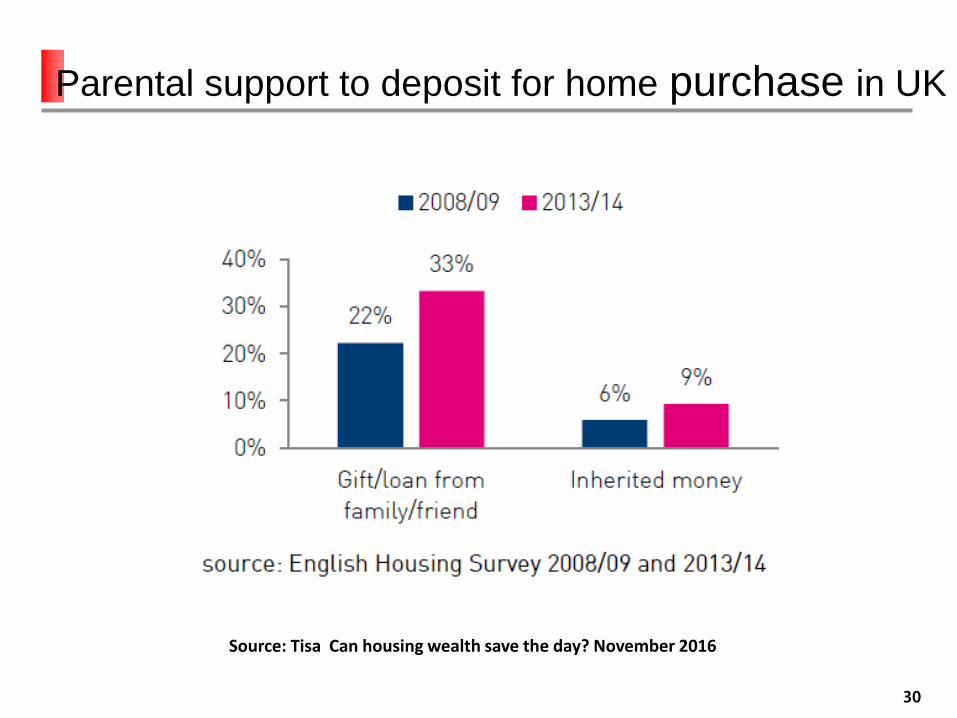
Source: Tisa Can housing wealth save the day? November 2016
Parental support to deposit for home purchase in UK
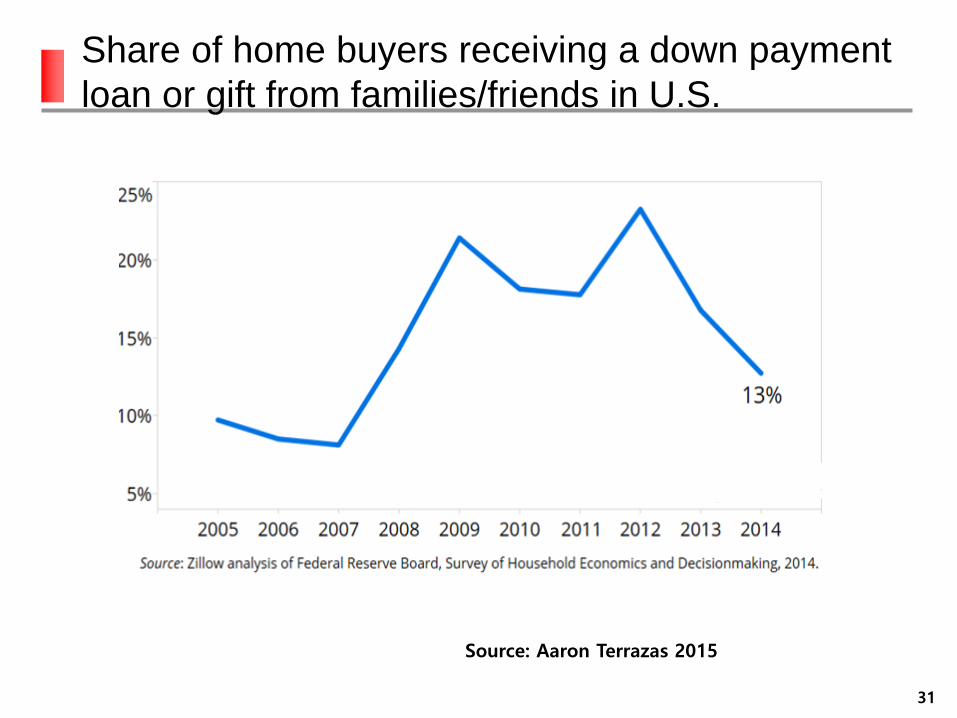
Share of home buyers receiving a down payment
loan or gift from families/friends in U.S.
31
The
Source: Aaron Terrazas 2015
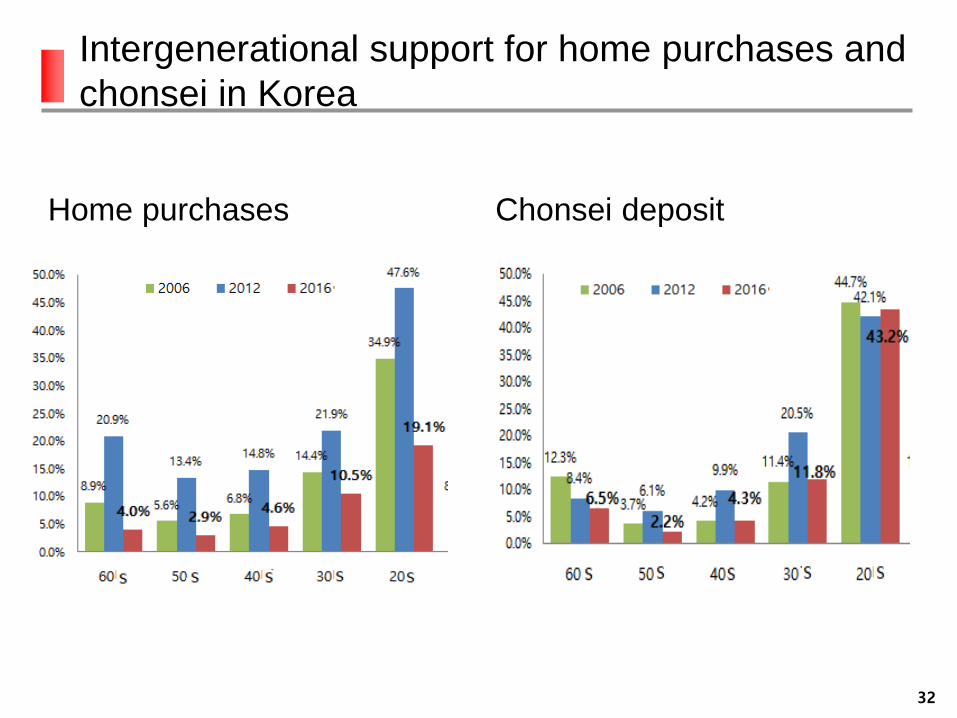
Intergenerational support for home purchases and
chonsei in Korea
Home purchases Chonsei deposit
32
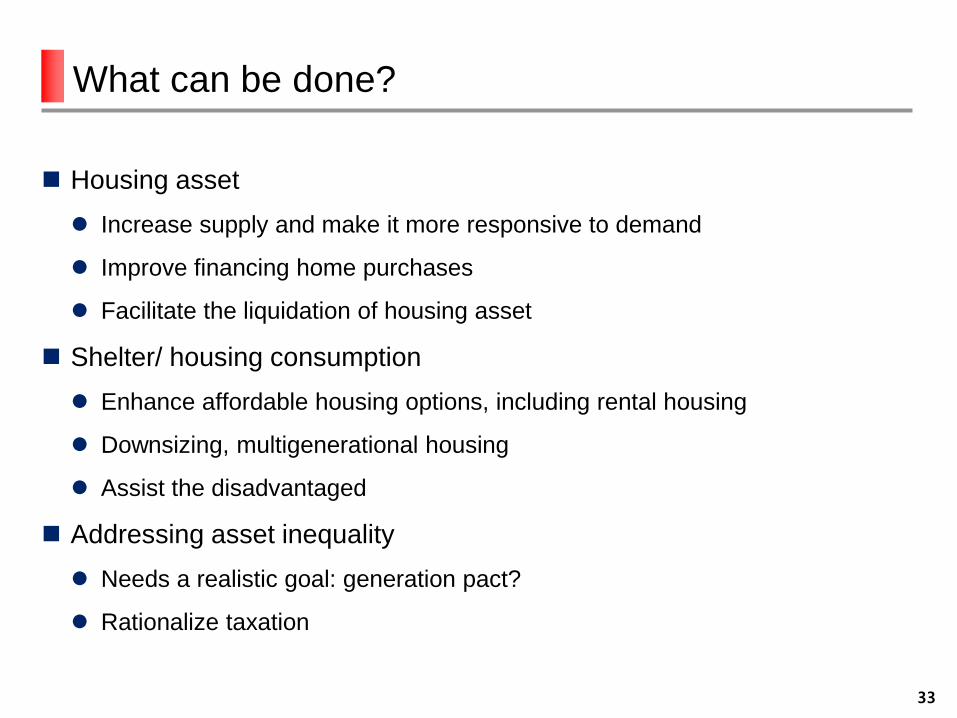
What can be done?
Housing asset
Increase supply and make it more responsive to demand
Improve financing home purchases
Facilitate the liquidation of housing asset
Shelter/ housing consumption
Enhance affordable housing options, including rental housing
Downsizing, multigenerational housing
Assist the disadvantaged
Addressing asset inequality
Needs a realistic goal: generation pact?
Rationalize taxation
33
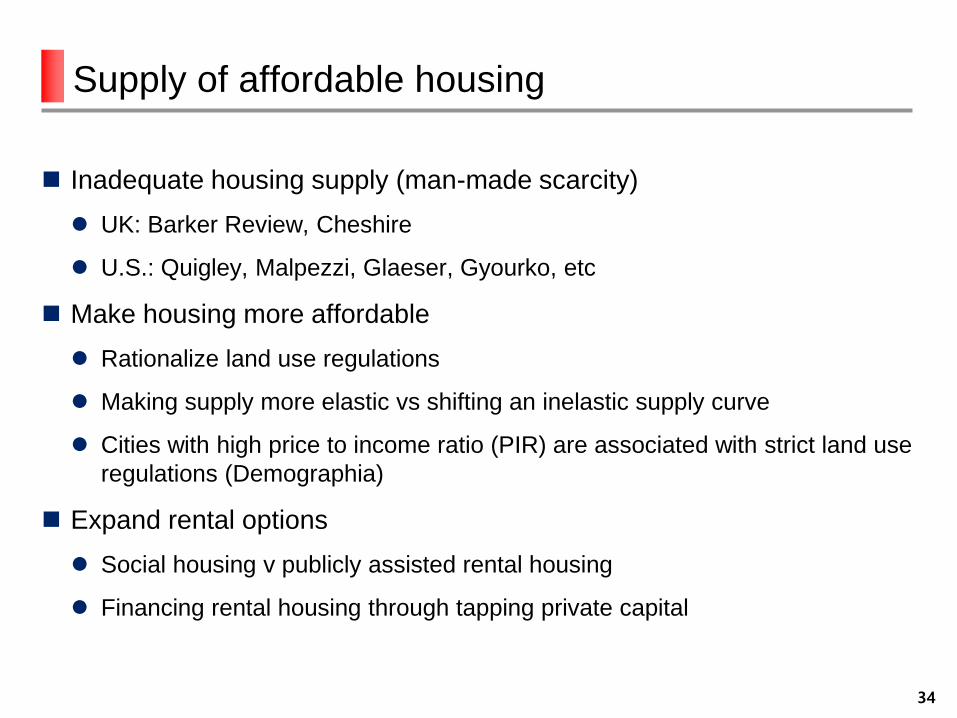
Supply of affordable housing
Inadequate housing supply (man-made scarcity)
UK: Barker Review, Cheshire
U.S.: Quigley, Malpezzi, Glaeser, Gyourko, etc
Make housing more affordable
Rationalize land use regulations
Making supply more elastic vs shifting an inelastic supply curve
Cities with high price to income ratio (PIR) are associated with strict land use
regulations (Demographia)
Expand rental options
Social housing v publicly assisted rental housing
Financing rental housing through tapping private capital
34
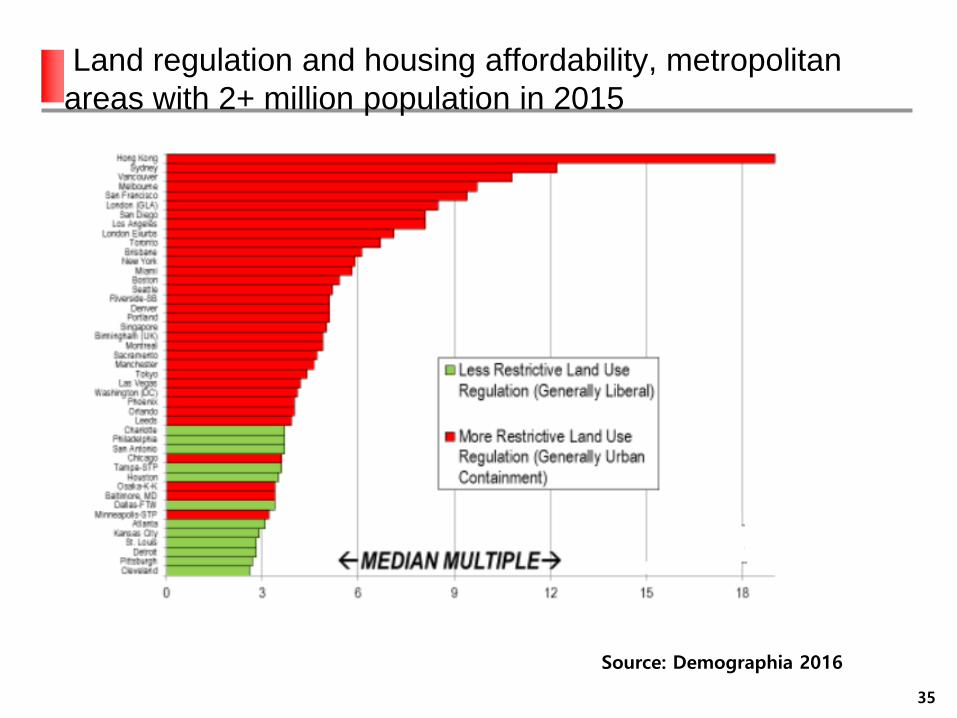
Land regulation and housing affordability, metropolitan
areas with 2+ million population in 2015
35
Source: Demographia 2016
Inclusive and affordable mortgages
Whither home ownership?
Ensuring sustainable home ownership
Do younger people have diminished aspirations for owning homes?
Innovative financing?
Contractual savings for home purchase linked with (subsidized) loans
Support asset accumulation by the younger generation
Graduated payment mortgages
Reverse mortgages (‘housing pension’ in Korea)
Limitations and conflicts
Housing finance cannot solve the problem of high price to income ratio
altogether
Increasing household debt and macroprudential measures to contain it
36
Taxation and housing inequality
Dilemma of inheritance on housing inequality
Inheritance enhances the chances that members of the younger generation
can purchase homes, mitigating the reversal of generational progress (albeit
in late stage of life, 60+ years old)
But inheritance is not evenly distributed among different income groups,
thereby worsening housing wealth inequality, and exacerbating
intragenerational inequity.
Estate tax (death tax) not popular in U.S. but some countries see its value.
Wealth tax, property tax, and land value tax
Calling for replacing domestic rates with a land value tax in U.K.
Considering an increase in property holding tax in Korea
(Net) wealth tax is levied in some European countries.
Issues: implementation, Incidence, long-run impact on housing market
37
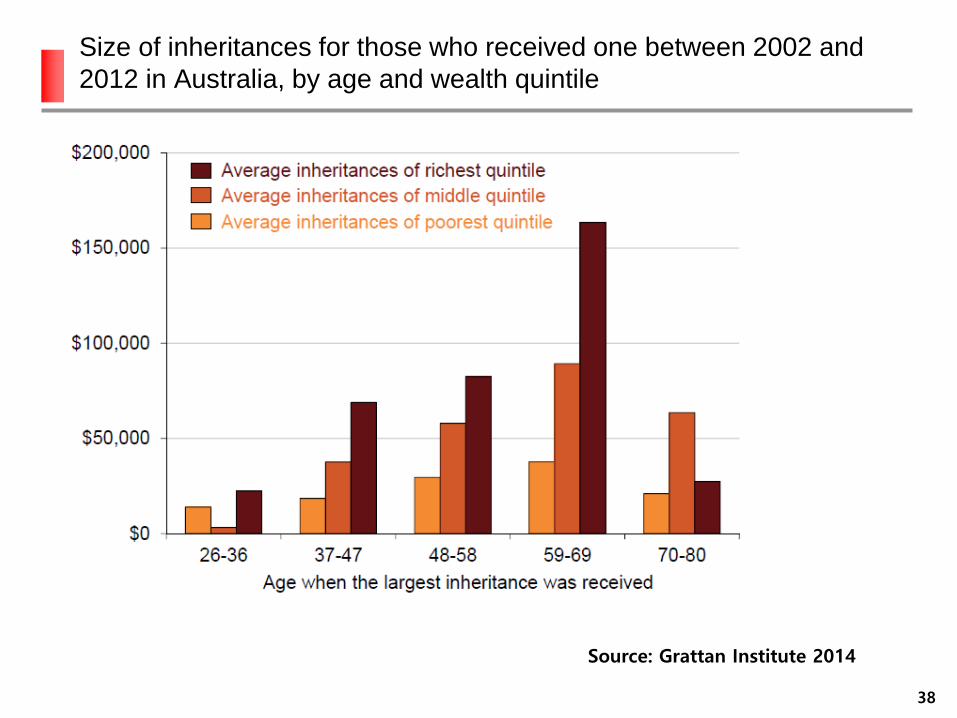
Size of inheritances for those who received one between 2002 and
2012 in Australia, by age and wealth quintile
38
Source: Grattan Institute 2014
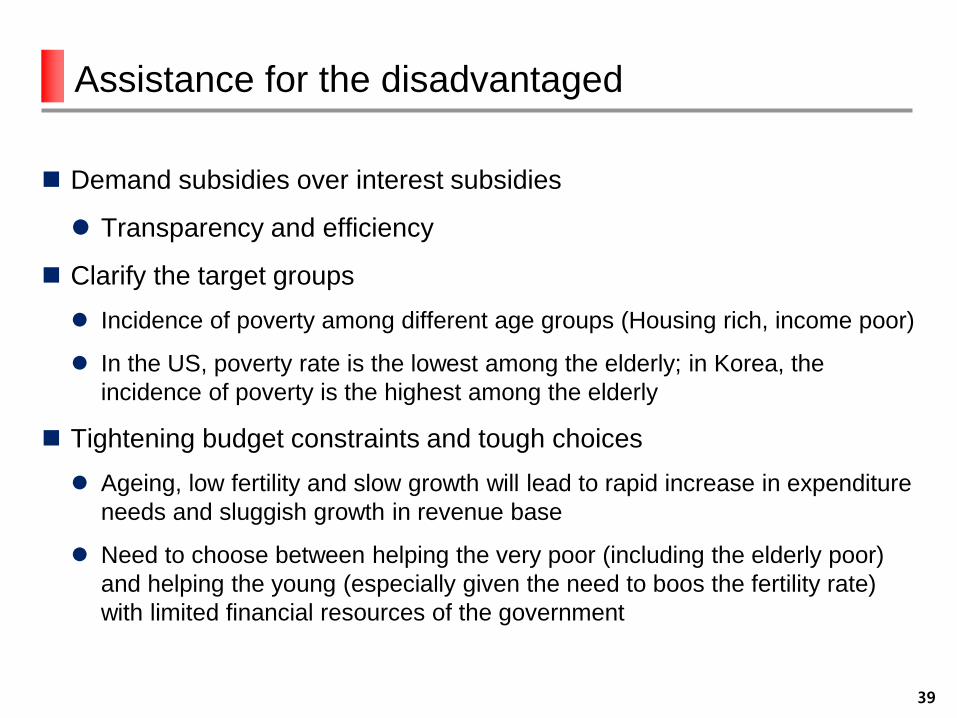
Assistance for the disadvantaged
Demand subsidies over interest subsidies
Transparency and efficiency
Clarify the target groups
Incidence of poverty among different age groups (Housing rich, income poor)
In the US, poverty rate is the lowest among the elderly; in Korea, the
incidence of poverty is the highest among the elderly
Tightening budget constraints and tough choices
Ageing, low fertility and slow growth will lead to rapid increase in expenditure
needs and sluggish growth in revenue base
Need to choose between helping the very poor (including the elderly poor)
and helping the young (especially given the need to boos the fertility rate)
with limited financial resources of the government
39

Multigenerational living
Concept
A household that includes two or more adult generations, or one that includes grandparents and grandchildren Sharing space among different age groups
Provides the elderly an alternative to living alone (or in facilities)
Contributes to alleviating the problems of high housing costs and low-fertility (?)
Some data (definitions might differ)
U.S. 19% (2014) (9% in three or more generations)
China 33% (2014) (all in three or more generations)
Policies and research
Japan gives subsidy to building houses that can be inhabited by 3 generations.
Korea tries to encourage splitting up large apartments into two through remodeling.
Research on design
40
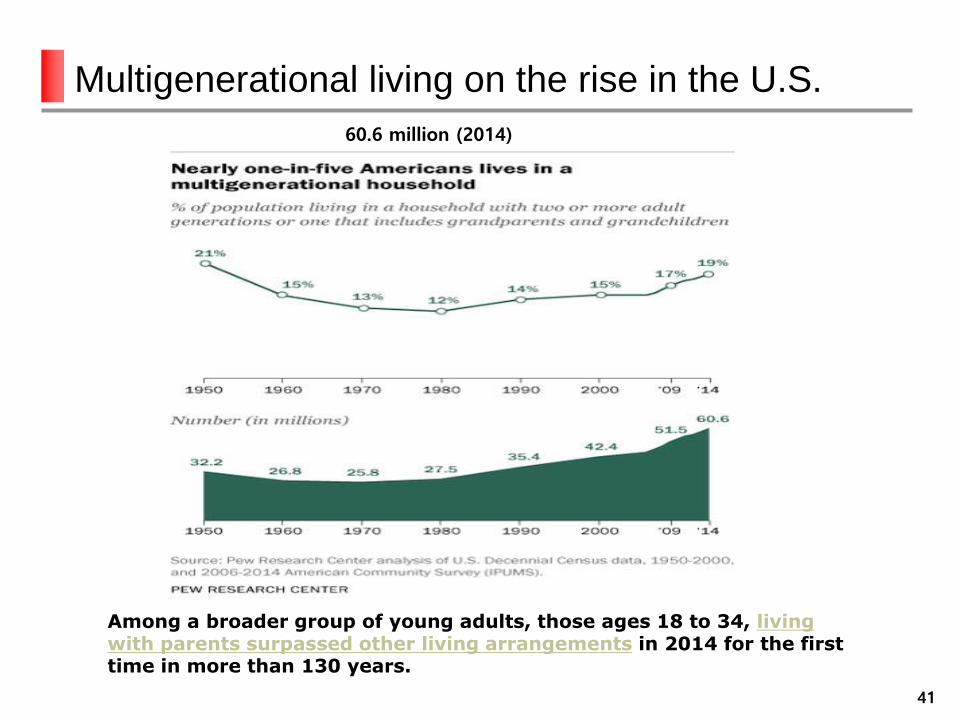
Multigenerational living on the rise in the U.S.
41
60.6 million (2014)
Among a broader group of young adults, those ages 18 to 34, living with parents surpassed other living arrangements in 2014 for the first time in more than 130 years.

Ageing in place and downsizing
Downsizing is not taking place on a large scale.
UK
Hoarding of bedrooms by the elderly. (Griffiths 2011)
Lack of adequate houses to move to discourages downsizing.
Australia
“Older people moved to larger houses between 1996 and 2006” (Judd et
al 2012)
Only 9% of old people downsized between 2006 and 2011 (Judd 2015?)
U.S.
Korea
Many people in their 60s do not sell their houses and downsize.
42
Housing inequality and the New Urban Agenda
Housing in the NUA
Integrated into urban planning
Finance and subsidies
Land and housing supply
Measuring progress
43


![Achievement and Inequality a Seasonal Perspective[1]](https://static.fdocuments.net/doc/165x107/577cd72b1a28ab9e789e3d6e/achievement-and-inequality-a-seasonal-perspective1.jpg)


