Housing Development Building Management System (HDBMS) …
8
Housing Development Building Management System (HDBMS) For Optimized Electricity Bills Weixian Li ∗ , Thillainathan Logenthiran † , Van-Tung Phan ¶ , and Wai Lok Woo ‖ School of Electrical and Electronic Engineering, Newcastle University, Singapore Campus ∗† ‡§¶ ‖ Email: ∗ [email protected], † [email protected], ¶ ,[email protected], ‖ [email protected] Abstract—Smart Buildings is a modern building that allows residents to have sustainable comfort with high efficiency of electricity usage. These objectives could be achieved by applying appropriate, capable optimization algorithms and techniques. This paper presents a Housing Development Building Manage- ment System (HDBMS) strategy inspired by Building Energy Management System (BEMS) concept that will integrate with smart buildings using Supply Side Management (SSM) and Demand Side Management (DSM) System. HDBMS is a Multi- Agent System (MAS) based decentralized decision making system proposed by various authors. MAS based HDBMS was created using JAVA on a IEEE FIPA compliant multi-agent platform named JADE. It allows agents to communicate, interact and negotiate with energy supply and demand of the smart buildings to provide the optimal energy usage and minimal electricity costs. This results in reducing the load of the power distribution system in smart buildings which simulation studies has shown the potential of proposed HDBMS strategy to provide the optimal solution for smart building energy management. Index Terms—Power distribution system, Smart Buildings, Multi-agent system, Demand side management, Supply side management, Building energy management system, Housing development building management system, Electricity bills I. I NTRODUCTION Electricity has become a basic necessity for modern soci- ety and is a vital part of a socio-economic development in the world. The common challenges faced by the electricity suppliers would be systems constraints and administrative issues while supplying electricity. Additionally, past studies had shown a steady increase in annual electricity demand through the past few years due to consumers needs with respect to comfort, convenience and flexibility. In order to meet the growing demand of electricity, solutions from grid distribution to end users are required [1]. Smart grid represents a innovative next generation of power system network that delivers power from supply to demand. It uses a two-way communications which leads to enhanced reli- ability and energy efficiency of the grid. It has the capabilities of sensing grid situations, measure power and control appli- ances to electricity generations, transmission and distribution of the power grid. This increased the number of decentralised renewable energy sources due to increasing electricity de- mand. These issues created challenges for a stable and secure operation of power grid. Major developments were based on traditional electrical system planning and operations with information and communications technology [2]. This concept of intelligent power grid performs independent adaptations of its elements for optimal electricity consumption [3]. Important elements of a smart grid includes demand re- sponse, load management and customer engagement. The accuracy of forecasting supply and demand depends on smart meters. The stability of grid in Singapore has one of the most reliable electricity networks in the world. Singapore grid has already deployed advanced Supervisory Control and Data Acquisition (SCADA) systems with two-way communication channels. This situation creates an ideal place to bring new technologies to enhance the capability of its power grid. With the help of advanced technologies, the grid was able to respond efficiently and effectively to power disruptions [4]. Building Energy Managements System is a part of a smart grid system that control, monitor and optimize energy for buildings. BEMS play a critical role in achieving overall energy efficiency by reducing carbon footprints. As it is a key requirement for designing modern buildings and industries. Technology improvement on control systems, energy manage- ments systems, distributed decision making and coordination for buildings contribute to better efficiency of energy usage [5]. In modern times, BEMS considered improvement on energy utilization efficiency, reduction of energy cost and integration of renewable energy technology. These improvements was meant to meet the energy demand of the buildings. To align with the zero-energy objectives and intelligent building con- cepts, BEMS aims to increase energy efficiency by integrating Demand Side Management and Supply Side Management. These functions decreases energy cost and sustain consumer comforts by optimizing buildings electrical distribution. It will solve complex issues through coordination and cooperation of the management systems. This is due to the system being flexible, reliable and efficient [6]. Supply Side Management (SSM) was identified as a method of optimizing the electrical supplies from various power sources. One of the key issues for future energy distribution systems, smart buildings and smart devices was the need of an intelligent management of energy distributions. The problem can be tackled from the supply sources on how electricity should be distributed. It helps to improve electrical efficiency by developing an optimal algorithm for the system. Thus, electricity can be used in an efficient manner [7], [8]. Demand Side Management (DSM) was identified as a method of optimizing energy demand consumption to achieve better efficiency and operations in an electrical system. DSM usually involves demand response and peak load scheduling. As electricity was cheaper during night time due to the whole- TRANSACTIONS ON ENVIRONMENT AND ELECTRICAL ENGINEERING ISSN 2450-5730 Vol 2, No 2 (2017) c Weixian Li, Thillainathan Logenthiran, Van-Tung Phan and Wai Lok Woo
Transcript of Housing Development Building Management System (HDBMS) …

Housing Development Building ManagementSystem (HDBMS) For Optimized Electricity Bills
Weixian Li∗, Thillainathan Logenthiran†, Van-Tung Phan¶, and Wai Lok Woo‖
School of Electrical and Electronic Engineering, Newcastle University, Singapore Campus∗† ‡§¶ ‖
Email: ∗[email protected], †[email protected], ¶,[email protected], ‖[email protected]
Abstract—Smart Buildings is a modern building that allowsresidents to have sustainable comfort with high efficiency ofelectricity usage. These objectives could be achieved by applyingappropriate, capable optimization algorithms and techniques.This paper presents a Housing Development Building Manage-ment System (HDBMS) strategy inspired by Building EnergyManagement System (BEMS) concept that will integrate withsmart buildings using Supply Side Management (SSM) andDemand Side Management (DSM) System. HDBMS is a Multi-Agent System (MAS) based decentralized decision making systemproposed by various authors. MAS based HDBMS was createdusing JAVA on a IEEE FIPA compliant multi-agent platformnamed JADE. It allows agents to communicate, interact andnegotiate with energy supply and demand of the smart buildingsto provide the optimal energy usage and minimal electricitycosts. This results in reducing the load of the power distributionsystem in smart buildings which simulation studies has shown thepotential of proposed HDBMS strategy to provide the optimalsolution for smart building energy management.
Index Terms—Power distribution system, Smart Buildings,Multi-agent system, Demand side management, Supply sidemanagement, Building energy management system, Housingdevelopment building management system, Electricity bills
I. INTRODUCTION
Electricity has become a basic necessity for modern soci-
ety and is a vital part of a socio-economic development in
the world. The common challenges faced by the electricity
suppliers would be systems constraints and administrative
issues while supplying electricity. Additionally, past studies
had shown a steady increase in annual electricity demand
through the past few years due to consumers needs with
respect to comfort, convenience and flexibility. In order to
meet the growing demand of electricity, solutions from grid
distribution to end users are required [1].Smart grid represents a innovative next generation of power
system network that delivers power from supply to demand. It
uses a two-way communications which leads to enhanced reli-
ability and energy efficiency of the grid. It has the capabilities
of sensing grid situations, measure power and control appli-
ances to electricity generations, transmission and distribution
of the power grid. This increased the number of decentralised
renewable energy sources due to increasing electricity de-
mand. These issues created challenges for a stable and secure
operation of power grid. Major developments were based
on traditional electrical system planning and operations with
information and communications technology [2]. This concept
of intelligent power grid performs independent adaptations of
its elements for optimal electricity consumption [3].
Important elements of a smart grid includes demand re-
sponse, load management and customer engagement. The
accuracy of forecasting supply and demand depends on smart
meters. The stability of grid in Singapore has one of the
most reliable electricity networks in the world. Singapore grid
has already deployed advanced Supervisory Control and Data
Acquisition (SCADA) systems with two-way communication
channels. This situation creates an ideal place to bring new
technologies to enhance the capability of its power grid. With
the help of advanced technologies, the grid was able to respond
efficiently and effectively to power disruptions [4].
Building Energy Managements System is a part of a smart
grid system that control, monitor and optimize energy for
buildings. BEMS play a critical role in achieving overall
energy efficiency by reducing carbon footprints. As it is a key
requirement for designing modern buildings and industries.
Technology improvement on control systems, energy manage-
ments systems, distributed decision making and coordination
for buildings contribute to better efficiency of energy usage
[5].
In modern times, BEMS considered improvement on energy
utilization efficiency, reduction of energy cost and integration
of renewable energy technology. These improvements was
meant to meet the energy demand of the buildings. To align
with the zero-energy objectives and intelligent building con-
cepts, BEMS aims to increase energy efficiency by integrating
Demand Side Management and Supply Side Management.
These functions decreases energy cost and sustain consumer
comforts by optimizing buildings electrical distribution. It will
solve complex issues through coordination and cooperation
of the management systems. This is due to the system being
flexible, reliable and efficient [6].
Supply Side Management (SSM) was identified as a method
of optimizing the electrical supplies from various power
sources. One of the key issues for future energy distribution
systems, smart buildings and smart devices was the need of an
intelligent management of energy distributions. The problem
can be tackled from the supply sources on how electricity
should be distributed. It helps to improve electrical efficiency
by developing an optimal algorithm for the system. Thus,
electricity can be used in an efficient manner [7], [8].
Demand Side Management (DSM) was identified as a
method of optimizing energy demand consumption to achieve
better efficiency and operations in an electrical system. DSM
usually involves demand response and peak load scheduling.
As electricity was cheaper during night time due to the whole-
TRANSACTIONS ON ENVIRONMENT AND ELECTRICAL ENGINEERING ISSN 2450-5730 Vol 2, No 2 (2017)c©Weixian Li, Thillainathan Logenthiran, Van-Tung Phan and Wai Lok Woo


monthly electricity consumption by public housing unit was
371 kWh [19].
Fig. 4. Residential Average Monthly Electricity Consumption in 2014
The power utilization of frameworks, for example, regular
territory lighting, lifts and water pumps of a normal HDB
residential building was estimated to be 75,000 kWh a year
[20].
According to a research done in 2015, the public housing
buildings known as Housing and Development Board (HDB)
blocks currently has 9503. This indicated that there were
980108 units of flats which averaged to 103 units per block
[21]. This information builds a realistic situation for the
experiment.
B. Singapore Electricity Prices
Following 2001, the Energy Market Authority (EMA)
opened a retail electricity market to give consumers options to
manage their energy cost through the competition of different
providers. Instead of buying at regulated electricity tariff which
is known as non-contestable price from SP Services Limited
(SPS). Consumers were able to purchase electricity from
electricity retailers or wholesale electricity market at prices
that varies every half-hour which is known as contestable
prices.
In order to switch to contestable prices, consumers with an
average electricity consumption of 2000 kWh per month were
eligible for the scheme [22].
The non-contestable consumers pricing will be 20.35 cents
per kWh (with effect from 1 Oct 15 to 31 Dec 15) regardless
of the time periods [23].
Data collected were used for accommodation of different
pricing that allows research on whether power delivered from
a contestable or non-contestable electricity source be more
economical for residential building in Singapore.
Fig.5 shows the price for a Contestable consumer in a 48
period format. It represents a day where each period is half an
hour from Energy Market Company (EMC) for 1 September
2015 [24].
Fig. 5. Wholesale Pricing used for 48 periods
C. Singapore Photovoltaics (PV) System
The capability of PV electricity generation in Singapore
depends essentially on the space and the efficiency of the
PV systems. The annual electricity demand in Singapore is
42 TWh in 2011; the total installed solar PV capacity was
4MWp for both residential and non-residential installation
which generates about 4.8GWh per annum [25]. The PV
system was able to yield 51kWh per day between 0700-1900
hours in Singapore.
D. Singapore Electric Vehicle (EV)
Table I shows the type of chargers available in Singapore.
Public Normal Chargers and Residential Normal chargers are
two types of commonly used chargers.
TABLE ISINGAPORE TYPES OF CHARGERS
Types of Charging Infrastructure Electrical Power Recharging Time
Public Normal Charger3 kW 7-8 hours
Residential Normal Charger
Quick Charger 30-50 kW 30-45 min
Public Normal Chargers are typically introduced or ac-
cessible at shopping centers, HDB car parks, and charging
stations while Residential Normal Chargers were found in
private properties. Both sorts of chargers have a more extended
charging time of 7 to 8 hours in contrast to quick chargers.
The quick chargers are typically introduced or accessible
at certain shopping centers and charging stations. It takes a
quicker charging rate of 30 to 45 minutes as it will provide
more electrical power.
For Electric Vehicle (EV) or hybrid car, charging stations
are expected to energize the batteries for the vehicles which
are about 24kW. There are presently 71 charging stations by
Bosch in Singapore and buyers need to pay SGD$180 a month
for unlimited charging [26].
According to the Straits time, there are a total of approxi-
mate 1.25 million households and around 45% of households
in Singapore own a car. [27].
The number of electrical vehicle in a residential building
can be calculated by:
COper HDB block = Uper HDB block ∗ COpercentage (1)
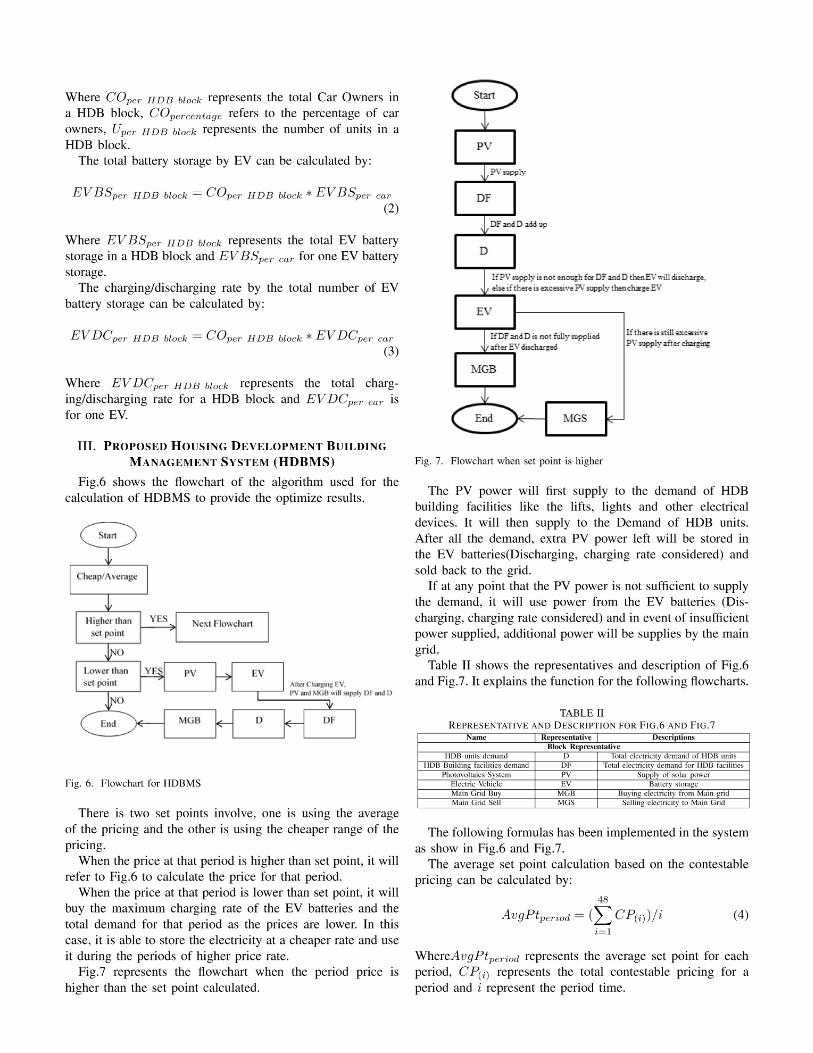


Table VI shows the per period results for cheap set point. It
shows detail of the cheap set point pricing for each periods.
TABLE VISIMULATION RESULTS FOR PERIODS USING CHEAP SETPOINT
Using Cheap as a set point
Period Day 1 Day 2 Day 3 to Day 30
1 $2.02 $0.00 $0.002 $1.92 $0.00 $0.003 $1.75 $0.00 $0.004 $1.78 $0.00 $0.005 $1.73 $0.00 $0.006 $1.92 $0.00 $0.007 $1.80 $0.00 $0.008 $1.75 $0.00 $0.009 $1.72 $0.00 $0.0010 $5.78 $5.78 $5.7811 $5.29 $5.29 $5.2912 $0.00 $0.00 $0.0013 $0.00 $0.00 $0.0014 $0.00 $0.00 $0.0015 $5.03 $5.03 $5.0316 $5.29 $5.29 $5.2917 $5.59 $5.59 $5.5918 $0.00 $0.00 $0.0019 $5.70 $5.70 $5.7020 $0.00 $0.00 $0.0021 $0.00 $0.00 $0.0022 $0.00 $0.00 $0.0023 $0.00 $0.00 $0.0024 $0.00 $0.00 $0.0025 $0.00 $0.00 $0.0026 $0.00 $0.00 $0.0027 $0.00 $0.00 $0.0028 $0.00 $0.00 $0.0029 $0.00 $0.00 $0.0030 $0.00 $0.00 $0.0031 $0.00 $0.00 $0.0032 $0.19 $0.00 $0.0033 $1.63 $0.00 $0.0034 $1.61 $0.00 $0.0035 $1.56 $0.00 $0.0036 $5.68 $5.68 $5.6837 $5.58 $5.58 $5.5838 $5.70 $5.70 $5.7039 $0.00 $0.00 $0.0040 $0.00 $0.00 $0.0041 $0.00 $0.00 $0.0042 $0.00 $0.00 $0.0043 $0.00 $0.00 $0.0044 $0.00 $0.00 $0.0045 $5.52 $5.52 $5.5246 $5.35 $5.35 $5.3547 $5.16 $5.16 $5.1648 $5.04 $5.04 $5.04
The HDB non-contestable and contestable prices were con-
stant at $5.11 and $1.65 throughout the periods.
B. Housing Development Building Management System
(HDBMS) Multi-Agent System (MAS) communications
This sections shows the Multi-Agent System (MAS) com-
munications results for Housing Development Building Man-
agement System (HDBMS).
Fig.13 shows the integration of the Multi-Agent System
(MAS) with the Housing Development Building Management
System (HDBMS) calculations. This integration shows the
potential of a enhanced completed system for real life ap-
plication.
Fig. 13. MAS with HDBMS
Fig.14 shows the overall communication of the Multi-
Agent System (MAS) for HDBMS using JADE. It shows the
importance of the interactions in the communication based
network.
Fig. 14. Overall MAS communication
VI. DISCUSSIONS
Between contestable and non-contestable pricing, it shows
significant difference of cost even when no system is imple-
mented. After the system was implemented, it shows further
reduction in cost with the set points methods. Although ini-
tially the set points method cost more but as the time increases,
it shows slight difference with the average point system and
a bigger difference with cheap set point by comparing the
electricity cost of household.
At the same time, the per period simulations shows the
system cost higher at later periods. This was due to ”off-peak”
prices availiable at later timings. However, it does not affect
the overall results as it is implemented and compared with
different methods.
These results concluded that with the Housing Development
Building Management System (HDBMS) implemention, res-
idential buildings were able to save a significant amount of
electricity bills and reduce the load of electricity generators in
the grid. HDBMS provides a more cost efficient way of using
electricity.

VII. CONCLUSIONS
In this paper, the development of a smart building concept
was designed to optimize the electricity usage through a Hous-
ing Development Building Management System (HDBMS).
This system aims to optimize the energy efficiency and elec-
tricity costs of the residential buildings. A universal idea of
a HDBMS for smart buildings was introduced by integrating
Demand Side Management (DSM) and Supply Side Manage-
ment (SSM) system. Multi-Agent System (MAS) was used
to illustrate the communication process of agents between
management systems and devices for the calculation and data
of energy sources. Such system has shown its capabilities to
achieve the optimal use of energy efficiency and electricity
bills.Enhancements of such smart grid techniques would only
benefit the power grid in terms of increased dependability and
software improvement for the grid. A less costly electricity
bill could also be achieved with the help of renewable energy
resources and electricity market. Eventually, this methodology
would genuinely be a step closer towards a reliable and decen-
tralized decision making smart building system via effective
optimization system.
REFERENCES
[1] B. Asare-Bediako, P. F. Ribeiro, and W. L. Kling, “Integrated energyoptimization with smart home energy management systems,” in Inno-
vative Smart Grid Technologies (ISGT Europe), 2012 3rd IEEE PES
International Conference and Exhibition on. IEEE, 2012, pp. 1–8.[2] J. Byun, I. Hong, B. Kang, and S. Park, “A smart energy distribution and
management system for renewable energy distribution and context-awareservices based on user patterns and load forecasting,” IEEE Transactions
on Consumer Electronics, vol. 57, no. 2, 2011.[3] H.-L. Chao, C.-C. Tsai, P.-A. Hsiung, I. Chou et al., “Smart grid as a
service: a discussion on design issues,” The Scientific World Journal,vol. 2014, 2014.
[4] D. D. Gross, “Spotlight on singapore: Smart grid city,” 2010.[Online]. Available: http://www.cleantechinvestor.com/portal/smart-grid/5860-spotlight-on-singapore-smart-grid-city.html
[5] L. Hurtado, P. Nguyen, and W. Kling, “Agent-based control for buildingenergy management in the smart grid framework,” pp. 1–6, 2014.
[6] A. Mishra, D. Irwin, P. Shenoy, J. Kurose, and T. Zhu, “Greencharge:Managing renewableenergy in smart buildings,” IEEE Journal on Se-
lected Areas in Communications, vol. 31, no. 7, pp. 1281–1293, 2013.[7] F. Corno and F. Razzak, “Intelligent energy optimization for user
intelligible goals in smart home environments,” IEEE Transactions on
Smart Grid, vol. 3, no. 4, pp. 2128–2135, 2012.[8] C. Wang, Y. Zhou, B. Jiao, Y. Wang, W. Liu, and D. Wang, “Robust
optimization for load scheduling of a smart home with photovoltaicsystem,” Energy Conversion and Management, vol. 102, pp. 247–257,2015.
[9] C. Chen, K. Nagananda, G. Xiong, S. Kishore, and L. V. Snyder,“A communication-based appliance scheduling scheme for consumer-premise energy management systems,” IEEE Transactions on smart
Grid, vol. 4, no. 1, pp. 56–65, 2013.[10] E. Mocanu, K. O. Aduda, P. H. Nguyen, G. Boxem, W. Zeiler,
M. Gibescu, and W. L. Kling, “Optimizing the energy exchange betweenthe smart grid and building systems,” pp. 1–6, 2014.
[11] P. Zhao, S. Suryanarayanan, and M. G. Simoes, “An energy managementsystem for building structures using a multi-agent decision-makingcontrol methodology,” IEEE Transactions on Industry Applications,vol. 49, no. 1, pp. 322–330, 2013.
[12] S. D. McArthur, E. M. Davidson, V. M. Catterson, A. L. Dimeas,N. D. Hatziargyriou, F. Ponci, and T. Funabashi, “Multi-agent systemsfor power engineering applicationspart i: Concepts, approaches, andtechnical challenges,” pp. 1743–1752, 2007.
[13] S. D. McArthur, E. M. Davidson, V. M. Catterson, A. L. Dimeas, N. D.Hatziargyriou, F. Ponci, and T. Funabashi, “Multi-agent systems forpower engineering applicationspart ii: Technologies, standards, and toolsfor building multi-agent systems,” pp. 1753–1759, 2007.
[14] W. Li, T. Logenthiran, V.-T. Phan, and W. L. Woo, “Intelligent multi-agent system for power grid communication,” in Region 10 Conference
(TENCON), 2016 IEEE. IEEE, 2016, pp. 3386–3389.[15] W. Li, T. Logenthiran, W. Woo, V. Phan, and D. Srinivasan, “Implemen-
tation of demand side management of a smart home using multi-agentsystem,” in IEEE World Congress on Computational Intelligence. IEEE,2016, pp. 1–8.
[16] W. Li, T. Logenthiran, and W. Woo, “Intelligent multi-agent systemfor smart home energy management,” in Smart Grid Technologies-Asia
(ISGT ASIA), 2015 IEEE Innovative. IEEE, 2015, pp. 1–6.[17] W. Li, T. Logenthiran, V.-T. Phan, and W. L. Woo, “Intelligent hous-
ing development building management system (hdbms) for optimizedelectricity bills,” in Environment and Electrical Engineering and 2017
IEEE Industrial and Commercial Power Systems Europe (EEEIC/I&CPS
Europe), 2017 IEEE International Conference on. IEEE, 2017, pp. 1–6.[18] B. Nee, “Singapore energy statistics 2015,” 2015. [On-
line]. Available: https://www.ema.gov.sg/cmsmedia/Publications andStatistics/Publications/SES2015 Final website 2mb.pdf
[19] E. M. Authority, “Energy consumption,” 2015. [On-line]. Available: https://www.ema.gov.sg/cmsmedia/Publications andStatistics/Publications/ses/2015/energy
[20] P. E. Centre, “Energy audit of selected hdb,” 2004.[Online]. Available: http://www.siongboon.com/projects/2010-08-22%20electronic%20ballast/Energy%20Audit%20of%20selected%20HDB%20residential%20blocks%20in%20Singapore%20Aug%202004.pdf
[21] teoalida, 2015. [Online]. Available: http://www.teoalida.com/singapore/hdbstatistics/
[22] Mypower, “Overview of the singapore electricity market,” 2014.[Online]. Available: https://www.mypower.com.sg/About/about.html
[23] E.M.Company, “Price information,” 2015. [Online]. Available: https://www.emcsg.com/marketdata/priceinformation\#priceDataView
[24] S.P.Ltd, “Tariffs,” 2014. [Online]. Available: http://www.singaporepower.com.sg/irj/servlet/prt/portal/prtroot
[25] J. LUTHER, “Solar energy technology primer: A summary,” 2011.[26] L. T. Authority, “Factsheet on electric vehicles,” 2010.
[Online]. Available: http://www.lta.gov.sg/data/apps/news/press/2010/EV%20Factsheet%20.pdf
[27] K. Mahbubani, “Big idea no. 1: A ’less-car’ singapore,”2014. [Online]. Available: http://www.straitstimes.com/opinion/big-idea-no-1-a-less-car-singapore