Housing Affordability in the City of Akron
47
September 3, 2020 © Anderson Economic Group, LLC, 2020 Permission to reproduce in entirety granted with proper citation. All other rights reserved. Anderson Economic Group, LLC 20 South Clark St., Suite 2110 Chicago, Illinois 60603 Tel: (312) 670-6810 East Lansing | Chicago www.AndersonEconomicGroup.com Housing Affordability in the City of Akron Prepared by: Anderson Economic Group, LLC Andrew Miller, Senior Analyst Brian R. Peterson, Consultant Commissioned By: Akron Cleveland Association of REALTORS®
Transcript of Housing Affordability in the City of Akron

September 3, 2020
© Anderson Economic Group, LLC, 2020Permission to reproduce in entirety granted with proper citation. All other rights reserved.
Anderson Economic Group, LLC20 South Clark St., Suite 2110Chicago, Illinois 60603Tel: (312) 670-6810East Lansing | Chicago
www.AndersonEconomicGroup.com
Housing Affordability in the City of Akron
Prepared by:
Anderson Economic Group, LLCAndrew Miller, Senior AnalystBrian R. Peterson, Consultant
Commissioned By:Akron Cleveland Association of REALTORS®

Table of Contents
Anderson Economic Group, LLC
I. Executive Summary............................................... 1Purpose of Report .................................................................. 1Overview of Approach .......................................................... 1Overview of Findings ............................................................ 3About Anderson Economic Group ........................................ 8
II. Housing Affordability in the United States......... 9National Trends in Housing Affordability ............................ 9Factors Impacting Housing Affordability ........................... 12
III. Housing Affordability in Akron ........................ 18Housing Affordability Trends in Akron .............................. 18Owner Affordability Index .................................................. 23Renter Affordability Index .................................................. 28Conclusion .......................................................................... 28
IV. Appendix A. Methodology................................A-1Data Sources .....................................................................A-1Renter Affordability Index ................................................A-1Owner Affordability Index ................................................A-3
V. Appendix B. Measuring Housing Affordability ..........................................................B-1
Commonly Used Measures of Affordability ..................... B-1
VI. Appendix C. Works Consulted ........................ C-1
VII. Appendix D. About Anderson Economic Group ................................................................... D-1
Authors ..............................................................................D-2

Executive Summary
I.Executive Summary
For many Americans, housing affordability has been an issue of concern for many years. Researchers and policymakers are in agreement that housing is becoming increasingly expensive and unaffordable not just for lower income renters, but also for higher income renters and owners.1
The national trend of increasing housing costs has garnered the focus of local, state, and national policymakers. In June 2019, the Trump administration, in recognition of the importance of encouraging housing affordability, issued an executive order stating that rising housing costs were “negatively affecting [Americans’] quality of life and hindering their access to economic opportu-nity.”2 In January 2020, the National Association of REALTORS® published a letter to the U.S. Department of Housing and Urban Development that proposed a series of policies to address a “housing crisis, where inventory is at an all-time low and costs are beyond the reach of low- and middle-income families.”3
PURPOSE OF REPORT The Akron Cleveland Association of REALTORS® (ACAR) retained Anderson Economic Group (AEG) to conduct a study of housing affordability in Akron, Ohio. The purpose of this report is to:
• Provide an overview of the key housing affordability trends in the U.S. and Akron;
• Construct an index that quantifies housing affordability for renter- and owner-occupied households across Akron; and
• Determine how affordability in Akron has changed over time.
OVERVIEW OF APPROACH
In this report, we discuss housing affordability trends at the national level as well as in Akron. We also analyze data from two indices created to measure housing affordability for renter- and owner-occupied households in Akron at the census tract level.
Housing Affordability Trends in the U.S. and AkronWe conducted a literature review of relevant research publications to identify the most evident trends in housing affordability across the United States. We
1. Harvard University Joint Center for Housing Studies, “The State of the Nation’s Housing 2018,” 2018.
2. President Donald Trump, “Executive Order Establishing a White House Council on Eliminat-ing Regulatory Barriers to Affordable Housing,” June 25, 2019.
3. “Re: Response to Request for Information, 84 Fed. Reg. 64,549 (Nov. 22, 2019) Docket No. FR-6187-N-01, Eliminating Barriers to Affordable Housing,” National Association of REAL-TORS®, Jan. 31, 2020.
Anderson Economic Group, LLC 1
Executive Summary
also collected and analyzed housing market data for Akron and the U.S., includ-ing data on home sales prices, rents, building permits, housing unit completions, and household income.
Owner Affordability IndexWe constructed an owner affordability index to measure the affordability of housing costs for homes sold in 60 of Akron’s 66 census tracts for which robust data was available between 2013 and 2019. Our owner affordability index esti-mates the proportion of Akron households that would be “cost-burdened” if they purchased a home that sold in a specific census tract in a given year. It accounts for changes in the distribution of household income and home sale prices over time.
The cost component of the index captures the cost of mortgage payments, prop-erty tax payments, and homeowners insurance. We estimated monthly housing cost using data on sales price and taxes for over 20,000 transactions in Akron between 2013-19 from the Multiple Listings Service (MLS), data on down pay-ment amounts and interest rates data for over 6,600 transactions in Akron between 2018-19 from the Consumer Financial Protection Bureau’s Home Mortgage Disclosure Act (HMDA) dataset, and Ohio homeowners insurance data from the National Association of Insurance Commissioners.
Renter Affordability IndexWe also constructed a renter affordability index to measure rental affordability in each census tract in Akron. This index estimates the proportion of Akron renter-occupied households that would be rent-burdened if they rented a home in each of Akron’s 66 census tracts during two five-year periods—2009-2013 and 2014-2018. Our index takes into account a variety of housing market fac-tors, including changes to household income, the number of renter-occupied households in the city, and changes in rents over time. The index uses Census income and rent data collected from the American Community Survey.
For a complete discussion of out analysis methodology, see “Appendix A. Methodology” on page A-1.
Anderson Economic Group, LLC 2

Executive Summary
OVERVIEW OF FINDINGS
Using the information available to us and the methodology described above, we concluded the following:
1. Housing affordability in the U.S. has improved since the Great Recession, but low-income and renter-occupied households continue to experience high housing cost burdens.
Housing affordability is commonly defined in terms of the proportion of house-holds that are housing cost-burdened—meaning they spend more than 30% of their household income on housing costs. The share of cost-burdened house-holds nationwide declined from nearly 37% in 2010 to 31% in 2018. However, this decrease mostly reflects gains in affordability for owner-occupied house-holds. Cost burdens for renter-occupied households have remained steady over the last eight years, as shown in Figure 1 below. At the national level, housing affordability has been negatively impacted by insufficient housing supply, slow income growth, rising construction costs, and restrictive housing regulation.
FIGURE 1. Percent of U.S. Renter-Occupied and Owner-Occupied Households Considered Housing Cost-Burdened, 2010 and 2018
See “Housing Affordability in the United States” on page 9 for a complete dis-cussion of national housing affordability trends.
2. Akron households experience higher housing cost burden rates than the national average.
While Akron has not seen the same rapid rise in rents and sale prices that have characterized many housing markets across the country, the proportion of households considered housing cost-burdened remains higher in Akron than nationwide. According to the most recent data from the U.S. Census Bureau, collected during a five-year time period from 2014 to 2018, 35% of Akron households are considered housing cost-burdened, compared to 33% of house-holds nationwide, as shown in Figure 2 on page 4.
49%
31%
46%
22%
Renter-Occupied Households Owner-Occupied Households
Source: AEG analysis using base data from the U.S. Census Bureau
2010 2018
Anderson Economic Group, LLC 3

Executive Summary
FIGURE 2. Percent of Households Considered Housing Cost-Burdened in the U.S. and Akron, 2014-2018
See “Housing Affordability in Akron” on page 18 for a complete discussion of housing affordability trends in Akron.
3. At a citywide level, affordability for owner-occupied households in Akron has improved in recent years; however, the picture is more complicated at the neighborhood level, with some parts of the city experiencing declines in affordability.
Between 2009-13 and 2014-18, the number of owner-occupied Akron house-holds considered cost-burdened dropped from 28% to 22%. Yet even as afford-ability increased citywide, an analysis of home sales shows that approximately two-thirds of the city's census tracts saw slight decreases in the affordability of homes that were sold in 2013 and 2019, as shown in Map 1 on page 5.
See “Owner Affordability Index” on page 23 for a full discussion of trends in owner affordability in Akron.
33% 35%
15%11%
17%24%
U.S. Akron
Cost-Burdened Owner-Occupied Households
Cost-Burdened Renter-Occupied Households
Source: AEG analysis of base data from the U.S. Census Bureau
Anderson Economic Group, LLC 4

Executive Summary
MAP 1. Percent of Akron Households that Could Afford Monthly Owner-Occupied Housing Costs for Homes Sold in Each Census Tract, 2013 and 2019
2013
2019
Source: AEG analysis of base data from the U.S. Census Bureau, the U.S. Consumer Financial Protection Bureau, and MLS records
Anderson Economic Group, LLC 5

Executive Summary
4. While overall affordability for Akron's renter-occupied households has improved in recent years, some neighborhoods have become con-siderably less affordable, especially areas near the city center.
The proportion of renter-occupied households in Akron that pay more than 30% of their monthly income toward housing dropped from 54% between 2009-13 to 48% between 2014-18. However, even as affordability improved citywide, some areas of the city became notably less affordable. In fact, the number of Akron census tracts where more than half of the city's renter-occupied house-holds would be considered cost-burdened more than doubled during this time period, with many of the largest decreases in affordability occurring in tracts near the city center, as shown in Map 2 on page 7.
See “Renter Affordability Index” on page 28 for a detailed discussion of renter-occupied home affordability trends in Akron.
Anderson Economic Group, LLC 6

Executive Summary
MAP 2. Percent of Akron Renter Households That Would Be Cost-Burdened if They Rented Homes in Each Census Tract, 2009-13 and 2014-18
2009-13
2014-18
Source: AEG analysis of base data from the U.S. Census Bureau
Anderson Economic Group, LLC 7

Executive Summary
ABOUT ANDERSON ECONOMIC GROUP
Founded in 1996, Anderson Economic Group is a boutique research and con-sulting firm, with offices in East Lansing, Michigan, and Chicago, Illinois. We specialize in strategy, valuation, public policy, and market analyses. Our team has a deep understanding of advanced economic modeling and cost benefit anal-ysis techniques. We insist on a high level of integrity in our analyses, combined with technical expertise in the field. Examples of past work on housing markets and policy include a 2019 study of the impacts of a lead-safe ordinance in Cleveland, a 2018 report on the impacts of rent control on Chicago’s housing market, and several recent studies of the economic impact of first-time home buyer savings accounts in multiple states.
For more information, please see “Appendix D. About Anderson Economic Group” on page D-1 or visit www.AndersonEconomicGroup.com.
Anderson Economic Group, LLC 8

Housing Affordability in the United States
II. Housing Affordability in the United States
In this section, we discuss housing affordability trends across the United States and the economic factors that can contribute to a lack of affordable housing units.
Housing affordability is a serious problem that affects nearly every community in the United States. Today, millions of households are burdened by housing costs, with renter-occupied and low-income households especially affected by increasing rents and home sales prices. Ensuring that Americans can afford their homes has long been a national policy concern. In June 2019, the Trump admin-istration issued an executive order addressing the housing affordability crisis, noting that rising housing costs are “negatively affecting [Americans’] quality of life and hindering their access to economic opportunity.”4 In January 2020, the National Association of REALTORS® published a letter to the U.S. Depart-ment of Housing and Urban Development in which they proposed a series of policies to address a “housing crisis, where inventory is at an all-time low and costs are beyond the reach of low- and middle-income families.”5
A variety of factors contribute to housing affordability challenges, including limited housing supply, slow income growth, increasing construction costs, and burdensome housing regulations.
NATIONAL TRENDS IN HOUSING AFFORDABILITY
Measuring Housing AffordabilityMeasuring housing affordability is not as simple and straightforward as compar-ing household incomes to home sales prices and rents. A home’s rent or sales price reflects not just the quality of the housing unit itself, but also factors such as school quality, public safety, and access to jobs and amenities. Because of this, dilapidated homes in high-demand neighborhoods can often command pre-mium prices, while new construction in neighborhoods with reduced connectiv-ity, safety concerns, or population declines, can sell at a discount.
Because housing markets are complex and multifaceted, there are multiple approaches to measuring housing affordability. Some approaches attempt to quantify a broad set of housing costs and amenities based on a home’s location. Others consist of a simplified approach that compares median incomes and median housing costs. For the purposes of this report, we employ the most com-mon measure of housing affordability: housing cost burden. A household is con-
4. President Donald Trump, “Executive Order Establishing a White House Council on Eliminat-ing Regulatory Barriers to Affordable Housing,” June 25, 2019.
5. “Re: Response to Request for Information, 84 Fed. Reg. 64,549 (Nov. 22, 2019) Docket No. FR-6187-N-01, Eliminating Barriers to Affordable Housing,” National Association of REAL-TORS®, Jan. 31, 2020.
Anderson Economic Group, LLC 9

Housing Affordability in the United States
sidered cost-burdened if more than 30% of household income is spent on housing costs.6,7
Cost-Burdened Households in the U.S.In 2018, nearly 38 million households nationwide—31% of all households—were considered housing cost-burdened, including 20.2 million renter-occupied households and 17.3 million owner-occupied households.8 For most house-holds, housing costs are typically the largest share of annual household expendi-tures. Because of this, any increase or decrease in housing expenditures has a significant impact on whether households can spend more or less on non-house-hold items such as food, clothing, or transportation. The national share of cost-burdened households declined from nearly 37% in 2010 to 31% in 2018. This decrease mostly reflects gains in affordability for owner-occupied households. Today’s renter-occupied households remain nearly as cost-burdened as they were in 2010, as shown in Figure 3 below.
FIGURE 3. Percent of U.S. Households Considered Housing Cost-Burdened by Tenure, 2010 and 2018
Differences in Housing Affordability by Household Income. Overall trends in housing affordability often mask the significant differences in cost burden experiences of households at different income levels. Renter-occupied house-holds with incomes under $20,000 continue to have the highest cost-burden rates of any group. Since 2010, cost-burden rates have climbed among all
6. See “Appendix B. Measuring Housing Affordability” on page B-1 for an in-depth discussion of different approaches to measuring housing affordability.
7. Since the 1940s, the federal government has measured housing affordability as a percentage of household income. In 1940, the maximum affordable rent for federally subsidized housing was set at 20% of income, rising to 30% of income in 1981. Over time, the 30% threshold also became a standard for owner-occupied housing, and it remains a primary indicator of afford-ability for housing in the U.S. today.
8. Data from the U.S. Census Bureau.
49%
31%
46%
22%
Renter-Occupied Households Owner-Occupied Households
Source: AEG analysis using base data from the U.S. Census Bureau
2010 2018
Anderson Economic Group, LLC 10

Housing Affordability in the United States
renter-occupied households earning over $20,000, shown in Figure 4 below. At the same time, cost-burden rates have declined among homeowners across all income levels, as shown in Figure 5 below.
FIGURE 4. Number of Cost-Burdened Renter-Occupied Households by Income Level, 2010 and 2018 (millions)
FIGURE 5. Number of Cost-Burdened Owner Occupied Households by Income Level, 2010 and 2018 (millions)
Geographic Differences in Housing Affordability. housing cost burden rates vary widely across states, just as they vary across income groups. Map 3 on page 12 shows that housing cost burden rates for renter- and owner-occupied households are highest along the West Coast, in Florida, and along the North-east corridor.
10.2
5.8
2.11.0
0.3
8.2
6.2
3.21.9
0.7
<$20K $20-$35K $35-$50K $50-$75K >$75K
Source: AEG analysis using base data from the U.S. Census Bureau
2010 2018
5.85.1
4.0 4.23.7
4.8
3.9
2.9 3.0 2.8
<$20K $20-$35K $35-$50K $50-$75K >$75K
Source: AEG analysis using base data from the U.S. Census Bureau
2010 2018
Anderson Economic Group, LLC 11

Housing Affordability in the United States
MAP 3. Proportion of Cost-Burdened Households by State, 2018
Source: AEG analysis using base data from the U.S. Census Bureau
While the share of households experiencing housing cost burdens varies mea-surably by income level and state, one trend is common nationwide: renter-occupied households are much more likely to be cost-burdened than owner-occupied households. In 2018, the proportion of renter-occupied households considered cost-burdened was 15 to 30 percentage points higher than the rate for homeowners in all 50 states across all income ranges.
FACTORS IMPACTING HOUSING AFFORDABILITY
Supply and DemandAs is the case with most goods and services, supply and demand are the key fac-tors that determine housing affordability. In a market economy, consumers and producers typically do not expect persistent shortages for most goods or ser-vices. When consumer demand for a good increases, the price of that good will increase, leading to increased production. As production increases, sellers face increasing competition from other sellers, and prices may decline.
Housing markets tend to follow this rule, but some important characteristics of the market make it function differently. When housing demand increases rap-idly, production cannot keep up because developing new homes takes time—sometimes up to several years for large or complex projects. Limited supply can lead to increased competition among buyers, driving up rents and sales prices. When demand decreases—for instance, due to population decline—the existing housing supply does not cease to exist, and markets experience an oversupply of
Anderson Economic Group, LLC 12

Housing Affordability in the United States
housing. An oversupply of housing can lead to depressed home values and vacant units.
Changes in National Housing Market Supply. Since the end of the Great Recession, housing production has slowed significantly. Between 2000 and 2009 over 18 million housing units were built in the U.S. Figure 6 shows that between 2010-2018 only 8.5 million housing units were built in the U.S.—less than half of what was built in the previous decade.
FIGURE 6. Total Number of Housing Units Built by Year in the U.S. (millions)
In recent years, the relatively slow rate of housing supply growth has frequently fallen behind the number of newly-formed households, creating a shortfall between supply and demand. Between 2011 and 2018, the number of new households formed nationwide was greater than the number of new housing units completed in four out of the eight years, as shown in Figure 7 on page 14. Between 2017 and 2018, the total number of households nationwide increased by nearly 2.7 million while only 2.3 million housing units were completed, forc-ing buyers to compete for an increasingly small supply of homes.
8.50
18.7319.1418.5220.99
14.5714.11
6.68
17.29
2010 or later2000-20091990-19991980-19891970-19791960-19691950-19591940-19491939 orearlier
Source: AEG analysis using base data from the U.S. Census Bureau
Anderson Economic Group, LLC 13

Housing Affordability in the United States
FIGURE 7. Change in Number of Households and Number of Completed Housing Units, 2011-2018 (thousands)
Changes in Location of Newly-Constructed Homes and New Households. Further exacerbating the national supply and demand imbalance is the fact that many new housing units that have been built in recent years have not necessarily been concentrated in the areas with the greatest housing demand. In Western states, new housing supply has not kept up with demand, which has resulted in a median home sales price consistently above the national average, shown in Figure 8 below. In the Midwest and South, new housing supply has kept pace with demand, and the median home sales price in these regions has consistently been below the national median.
FIGURE 8. Median New Home Sales Price by Census Region, 2010-2018
0
250
500
750
1,000
1,250
1,500
2011 2012 2013 2014 2015 2016 2017 2018
Source: AEG analysis using base data from the U.S. Census Bureau
Household Growth Completions
U.S., $326,400
Northeast, $484,600
South, $294,600
West, $410,600
Midwest, $290,900
$0
$100,000
$200,000
$300,000
$400,000
$500,000
2010 2011 2012 2013 2014 2015 2016 2017 2018 2019
Source: AEG analysis using base data from the U.S. Census BureauNote: Data callouts show median home sales price for the year 2018.
United States Northeast Midwest South West
Anderson Economic Group, LLC 14

Housing Affordability in the United States
Changes in Housing Market Demand. A study from the Joint Center for Housing Studies (JCHS) predicts that, in the years ahead, demographic trends will support growing demand for homeownership as more members of the mil-lennial generation age into their 30s—when home buying typically peaks. The JCHS estimates that if age-specific homeownership rates remain at the same level as 2018, household growth alone will be responsible for roughly 8 million additional homeowners between 2018 and 2028.
However, rising home prices have put homeownership out of reach for many households. A survey from Freddie Mac found that 82% of renter-occupied households view renting as more affordable than homeownership.9 This finding may explain the recent increase in the number of high-income renter-occupied households. Households with incomes of at least $75,000 accounted for over three-quarters of the growth in renter-occupied households from 2010-2018, while the number earning less than $30,000 fell by nearly 1 million. This repre-sents a sharp reversal of trends in the 2000s, when low-income households drove overall renter occupied household growth.10
Slow Income GrowthMost discussions of housing affordability tend to focus housing costs. However, housing affordability is impacted not just by how much homes costs, but also by how much households can afford to pay for housing. Median household income in the U.S. has grown much more slowly than housing costs since 2000, as shown in Figure 9 on page 16. In 2018, the median household income in the U.S. was 10% higher than it was in 2000, while the median asking rental price and median asking sales price were more than 40% and 60% higher, respec-tively, than they were in 2000.
9. “New Survey Reveals Affordability Challenges for Renters and Homeowners,” Freddie Mac, June 26, 2019.
10.For a more detailed discussion on these trends for renter households see the JCHS report “The State of the Nation’s Housing 2019,” cited in Appendix B.
Anderson Economic Group, LLC 15

Housing Affordability in the United States
FIGURE 9. Indexed Change in Real Housing Costs and Income in the U.S., 2000-2018
Construction CostsOne reason housing costs have grown more quickly than median income has been the significant increase in the cost of housing construction. Since the Great Recession, the number of annual housing unit completions has increased. How-ever, a persistent labor shortage and increasing building material prices have driven up construction costs. Some of these costs have been passed on to home buyers, contributing to rising home prices.
During the Great Recession, residential building construction and specialty trade contractors experienced significant job losses.11 According to a recent sur-vey by the National Association of Home Builders, 85% of the organization’s members believe that cost and availability of labor will be their greatest chal-lenge in 2020. The price of building materials was the second most frequently cited concern that builders face. According to data from the U.S. Bureau of Labor Statistics (BLS), the producer price index for the construction industry (the price of the industry’s raw materials) has risen by 13.7% since 2010; at the same time, the producer price index for all commodities increased by just 4.1%.
Restrictive Housing RegulationWhen developers or landowners want to build new homes or demolish existing ones, they must obtain permission from the local government. While some regu-
11.According to the NAHB, between 2007-2009 the residential building construction industry lost 262,000 jobs and specialty trade contractors lost 945,000 jobs. According to data from the BLS, by the end of 2019,7.5 million people worked in the construction industry. This number suggests that there have been steady job gains in the industry since the Great Recession. How-ever, the industry employment level remains far below peak employment during the housing boom when, according to the NAHB, 11 million people worked in construction.
0.90
1.00
1.10
1.20
1.30
1.40
1.50
1.60
1.70
1.80
2000 2002 2004 2006 2008 2010 2012 2014 2016 2018
Source: AEG Analysis using base data from the Census Bureau
Median Household Income Median Asking Rent Median Asking Sales Price
Anderson Economic Group, LLC 16

Housing Affordability in the United States
lations are intended to safeguard the public or protect the environment, others—such as restrictive zoning or bans on accessory dwelling units—limit opportuni-ties to construct affordable housing. When local regulations governing new housing development are restrictive or overly complex, they may not only increase the cost of housing, but also inhibit supply from responding to changes in demand. A growing body of research in recent years has documented the rela-tionship between housing regulations and affordability.12
Down Payment and Closing CostsAs noted in “Cost-Burdened Households in the U.S.” on page 10, owner-occu-pied households are much less likely to experience housing cost burden than renter-occupied households. However, homeownership remains out of reach for many renter-occupied households, with the up-front cost of purchasing a home, including down payments and closing costs, posing a significant obstacle.13 This trend could result in continued growth of renter households and decreased growth in homeownership.
ConclusionLimited housing supply, slow income growth, rising construction costs, restric-tive housing regulation, and high up-front have all contribute to housing cost burden for households nationwide. Not only do these factors place a heavy strain on many low-income and renter-occupied households, but they may reduce household growth and result in adverse socioeconomic outcomes. Young adults may delay forming independent households separate from their parents. Individuals and families may double up and share housing, and low- and mid-dle-income households may not be able to find housing in growing job markets. In the worst case scenario, high housing costs can lead to homelessness. One recent study found a close link between housing affordability and homelessness rates, especially when a city’s typical resident spends more than 32% of their income on rent.14 Housing affordability therefore represents a complex and urgent challenge facing all levels of government.
12.For a more in-depth discussion of the impacts of regulation on housing affordability, see the U.S. Department of Housing and Urban Development article “Exploring the Current State of Knowledge on the Impact of Regulations on Housing Supply,” cited in Appendix B.
13. Data from a survey completed by Freddie Mac. The full citation can be found in Appendix B. 14. Chris Glynn, Thomas H. Byrne, and Dennis P. Culhane, “Inflection points in community-level
homeless rates,” Zillow, 2018.
Anderson Economic Group, LLC 17

Housing Affordability in Akron
III.Housing Affordability in Akron
This section provides an overview of the housing market in Akron and describes how affordability varies geographically across the city. We begin by discussing owner-occupied housing affordability trends, followed by renter-occupied hous-ing affordability trends, on a citywide basis. We then discuss how affordability has changed according to our affordability indices for both owner- and renter-occupied households.
Most discussion of Akron’s housing market has typically focused on the city’s low property values rather than on affordability. For example, a 2018 Washing-ton Post article about Akron’s housing market noted that the city has “no short-age of homes.”15 Low prices, however, do not necessarily translate into affordable housing for local residents if incomes are also low, as they are in Akron. More recently, Akron has had success in attracting new residents to the city, which appears to have put pressure on housing prices in some of the city’s neighborhoods. A May 2020 USA Today article listed Akron as one of 30 “Cit-ies on the verge of a COVID-driven housing crisis” due to the city’s high hous-ing costs relative to income.
While Akron has not seen the same rapid rise in rents and sale prices that has characterized many housing markets across the country, the proportion of households considered housing cost-burdened is higher in Akron than it is nationwide. And, similar to nationwide affordability trends, these housing cost burdens are especially prevalent among renter-occupied households. Akron has historically experienced population loss and struggled with distressed older housing and high vacancy rates, but its population and housing market activity have been on the rise in recent years. While the proportion of Akron households considered cost-burdened has decreased since the Great Recession, the city has experienced geographic shifts in affordability. Many neighborhoods have become less affordable in recent years, especially for renter-occupied house-holds. Understanding Akron’s housing affordability, therefore, requires not just a close look at citywide trends, but also careful examination of how these trends vary across neighborhoods.
HOUSING AFFORDABILITY TRENDS IN AKRON
Owner-Occupied HouseholdsHousing affordability trends in Akron’s market are very complex. Many homes in Akron sit vacant or require costly repairs, which has caused long-term price declines. This is due in part to the decline in the city’s population, which has fallen from nearly 300,000 residents in the early 1960s to fewer than 200,000
15.Haisten Willis, “The Other housing crisis: Cities where home prices are low because people have left.” The Washington Post (Washington, D.C.), November 29, 2018.
Anderson Economic Group, LLC 18
Housing Affordability in Akron
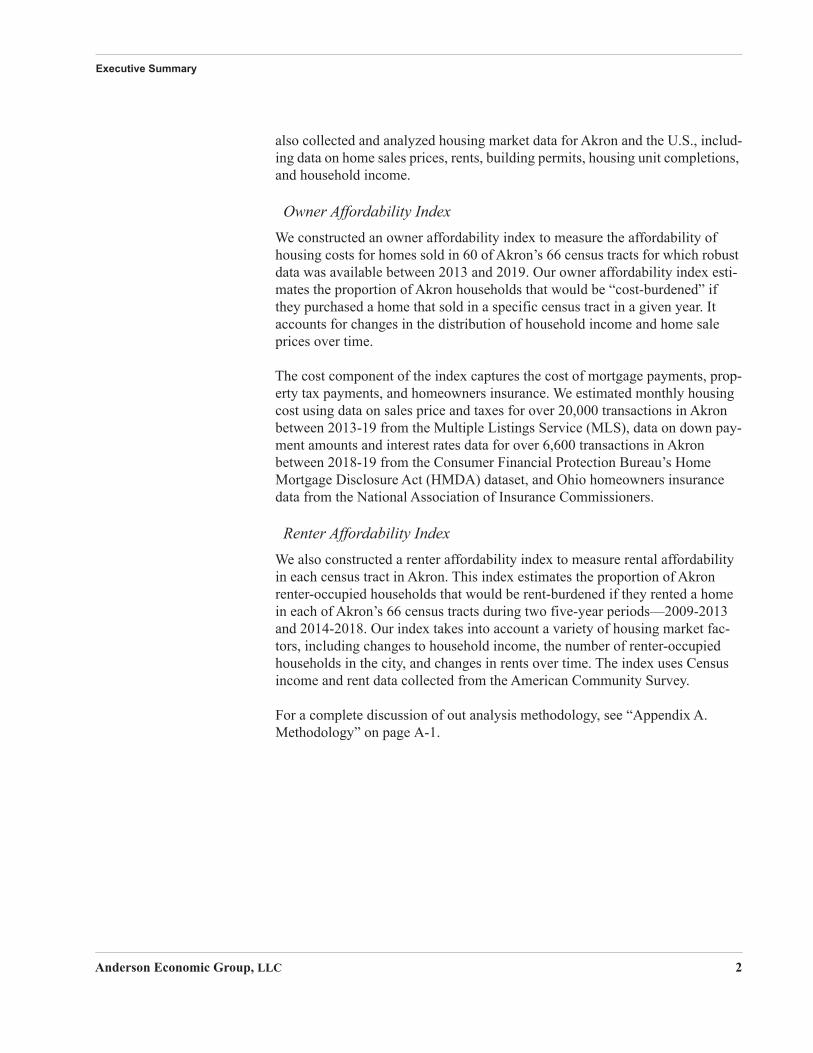
today.16 Additionally, two-thirds of the existing housing stock in Akron was built before 1979, as shown in Figure 10 below. Many of these units are in poor condition. A report issued by the City of Akron in 2017 described the problem as follows: “Approximately one-quarter of the city’s housing is in great shape, while another one-quarter is extremely distressed.”17
This older, distressed housing has limited appeal to would-be homebuyers who do not wish to spend time or money on extensive renovation. When home prices are very low, there is little financial incentive to build new homes or improve old ones because the investment cannot be recouped. This may help to explain why the homeownership rate in Akron fell from 55% to 50% between 2010 and 2015.18 In 2015, the City of Akron approved a 100% property tax abatement program to encourage new home construction and renovation. From 2016 through 2018, the city added nearly 1,500 owner-occupied households—an increase of 4%.
FIGURE 10. Number of Housing Units in Akron by Year Built
16.AEG analysis of base data from the U.S. Census Bureau. 17.City of Akron, “Planning to Grow Akron: Akron Housing Strategy,” 2017, p. 3.18.AEG analysis of base data from the U.S. Census Bureau.
11,366
28,582
40,460
25,491
46,504 41,584
47,094
20,285
54,160
2010 or later2000-20091990-19991980-19891970-19791960-19691950-19591940-19491939 or earlier
Source: AEG analysis using base data from the Census Bureau
Anderson Economic Group, LLC 19

Housing Affordability in Akron
The typical home value in Akron was just over $74,000 in March 2020, signifi-cantly lower than the typical home value for the Akron metropolitan area ($155,400) and U.S. overall ($248,900). However, it should be noted that a typ-ical home value of $74,000 represents a 35% increase compared to the summer of 2015, when the typical home value was roughly $55,000, as shown in Figure 11 below.
FIGURE 11. Typical Home Value for All Homes in the City of Akron, Akron Metropolitan Area, and U.S., 2010-2020
Although home values have increased, it is important to note that many Akron homeowners are still feeling the effects of the Great Recession, when U.S. home values fell by more than 20%.19 Many homeowners are underwater on their mortgages, meaning they owe more than their home is worth. In Akron, 20.6% of homeowners are underwater on their mortgage, almost double the percentage of homeowners underwater in the Akron metropolitan area overall.20 Mortgage delinquency—which occurs when a homeowner fails to make a mortgage pay-ment—is also high in Akron. The percent of delinquent mortgages in Akron is 1.6%, or 0.5 percentage points higher than the national average.21
Apr 2010, $175,500Jun 2015, $193,300
Mar 2020, $248,900
Apr 2010, $127,100 Jun 2015, $122,800Mar 2020, $155,400
May 2010, $70,700Jun 2015, $55,000
Mar 2020, $74,300
$0
$50,000
$100,000
$150,000
$200,000
$250,000
2010 2011 2012 2013 2014 2015 2016 2017 2018 2019
Source: AEG analysis using base data from Zillow
US Akron Metro Akron
Note: “Typical home value” calculated by Zillow using a weighted mean of individual Zillow home value estimates
19.Data from Zillow.com.20.Ibid.21.Ibid.
Anderson Economic Group, LLC 20

Housing Affordability in Akron
Renter-occupied HouseholdsOver the last decade, growth in renter-occupied households has driven growth in new household formation in Akron. Between the two five-year periods of 2009-13 and 2014-18, Akron lost over 2,000 owner-occupied households but gained over 3,500 renter-occupied households. At the same time, rents in Akron have risen—although not as quickly as they have elsewhere in the U.S. Accord-ing to statistics from Zillow, in January 2020 the typical market rent in Akron was $822 per month, which is half the typical market rent nationwide, as shown in Figure 12 below.22
FIGURE 12. Typical Market Rent for All Homes in Akron and U.S.
While typical rents in Akron are lower than typical rents in the U.S., the city’s median household income is lower as well ($41,000 in Akron compared to $62,000 nationwide in 2018).23 As a result, lower rents don’t necessarily trans-late into greater affordability. Furthermore, a close analysis of more recent rent data for the city’s large rental complexes (consisting of nearly 9,000 individual units) shows that inflation-adjusted rents are on the rise. Rents at large com-plexes in Akron increased by 4% in 2020 after decreasing more than 2% per year in 2018 and 2019. Between 2017 and 2020, one-fifth of units in large com-plexes saw rent increases of 10% or more, as shown in Table 1 on page 22.
22.Collecting reliable data on rents is more challenging than collecting home sales price data for a variety of reasons. While the U.S. Census Bureau provides comprehensive survey data on rents, there is substantial lag between collection and reporting (the most recent data available is for 2018). Privately collected data, such as that published by Zillow, may provide more cur-rent estimates, but the data is less comprehensive and representative than Census data, particu-larly if private data primarily consist of asking rents posted online. Acknowledging the trade-offs between these two types of data, we use both to summarize rental market trends in Akron in this report.
23.Data from the U.S. Census Bureau.
Sep 2010, $1,306
Jan 2020, $1,594
Oct 2010, $724 Jan 2020, $822
$0
$400
$800
$1,200
$1,600
2010 2011 2012 2013 2014 2015 2016 2017 2018 2019
Source: AEG analysis using base data from Zillow
US Akron
Note: “Typical market rent” refers to the mean of the middle quintile of rents
Anderson Economic Group, LLC 21

Housing Affordability in Akron
Housing Cost BurdenBetween 2014 and 2018, 35% of Akron households were considered housing cost-burdened—meaning they spent more than 30% of their income on hous-ing.24 Housing cost burdens are slightly more common in Akron than they are nationwide, where one-third of households are cost-burdened. Although cost-burden rates have decreased since the Great Recession, cost burdens are espe-cially common among Akron’s renter-occupied households. Census data col-lected during two five-year time periods, 2009-13 and 2014-18, underscores the scope of the housing cost burdens borne by Akron renter-occupied households. 48% of Akron’s renter-occupied households were cost-burdened in 2014-18, as shown in Figure 13 below. The rate of cost-burdened owner-occupied house-holds was much lower, at 22%.25
FIGURE 13. Percent of Households Cost-Burdened by Tenure in Akron, 2009-13 and 2014-2018
TABLE 1. Growth in average rents in large rental complexesin Akron, 2017-2020 (inflation-adjusted)
Percent of units where rent... 2017-2020
...decreased by 10% or more 9%
...decreased by 1% to 10% 24%
...did not change 20%
...increased by 1% to 10% 26%
...increased by 10% or more 21%
Source: AEG analysis of base data from ALN Apartment Data.
24.AEG analysis of base data from the U.S. Census Bureau.25. Ibid.
54%
28%
48%
22%
Renter-Occupied Households Owner-Occupied Households
2009-13 2014-18
Source: AEG analysis of base data from the U.S. Census Bureau
Anderson Economic Group, LLC 22

Housing Affordability in Akron
As is the case at the national level, housing cost burdens in Akron are particu-larly high for low-income households, reflecting a limited supply of housing available at a cost that these households can afford. High levels of housing cost burden among low-income households may contribute to homelessness in Akron; Summit County’s homelessness rate was 10.1 per 10,000 people in 2019, higher than Ohio’s statewide rate of 8.8.26 It is also important to note that high levels of housing cost burden have increasingly begun to affect not just low-income households, but middle-income ones as well. Even as the number of cost-burdened households in Akron decreased overall between 2009-13 and 2014-18, the number of cost-burdened households earning $20,000 to $35,000 actually increased, as shown in Figure 14 below.
FIGURE 14. Number of Households Cost-Burdened in Akron by Income Level, 2009-13 and 2014-2018 (thousands)
OWNER AFFORDABILITY INDEX
Citywide data on home sales and cost burdens for owner-occupied households provide a useful overview, but do not shed much light on neighborhood-level housing markets. We constructed an owner affordability index to measure the affordability of monthly housing costs for homes sold in each census tract in Akron. The index estimates the proportion of Akron households that would be cost-burdened if they had purchased the homes sold in a specific census tract in a given year.
The index accounts for changes in the distribution of household incomes and the supply and costs of homes over time. The index captures the costs of not just mortgage payments, but also property tax payments and homeowners insurance.
26. National Alliance to End Homelessness, “State of Homelessness: State and CoC Dash-boards.”
20,332
8,499
3,0831,000 333
16,444
9,408
2,712848 85
<$20K $20-35K $35-$50K $50-75K >$75K
2009-13 2014-18Source: AEG analysis of base data from the U.S. Census Bureau
Anderson Economic Group, LLC 23

Housing Affordability in Akron
We estimated the monthly housing costs that buyers would incur using the fol-lowing data:
• Data on sales price and taxes for over 20,000 transactions in Akron between 2013-19 from the Multiple Listings Service (MLS);
• Data on down payment amounts and interest rates data for over 6,600 transac-tions in Akron between 2018-19 from the Consumer Financial Protection Bureau’s Home Mortgage Disclosure Act (HMDA) dataset; and
• Ohio homeowners insurance data from the National Association of Insurance Commissioners.
The results of our analysis show that the affordability of owner-occupied hous-ing in Akron remained steady between 2013 and 2019, with the proportion of households that would be cost-burdened if they bought the homes sold in an average census tract decreasing slightly from 28% in 2013 to 26% in 2019.
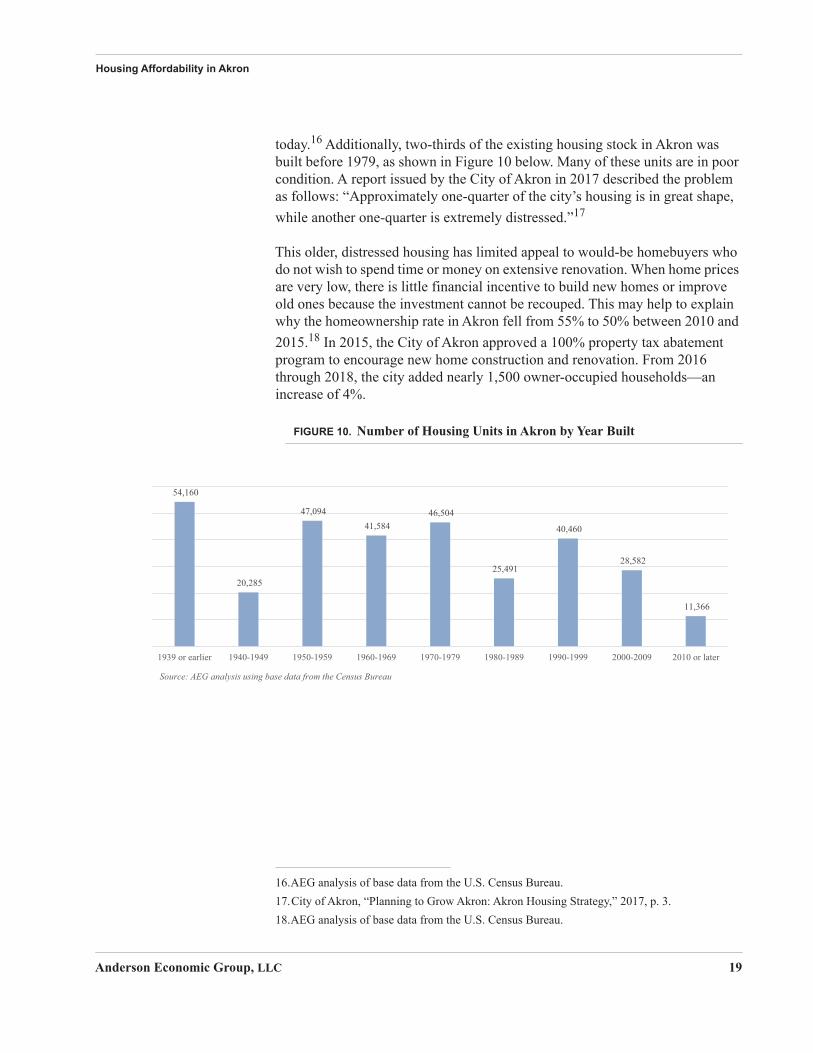
While owner affordability improved slightly from 2013 to 2019, it is important to note that about two-thirds of the city’s tracts saw affordability decreases (albeit small ones).27 Owner affordability index scores, which show the propor-tion of Akron households that could afford monthly payments for owner-occu-pied homes sold in 2013 and 2019 in each census tract, are shown in Map 4 on page 26. Our analysis shows that affordability decreases were generally small, and were spread across the city with no clear geographic pattern.
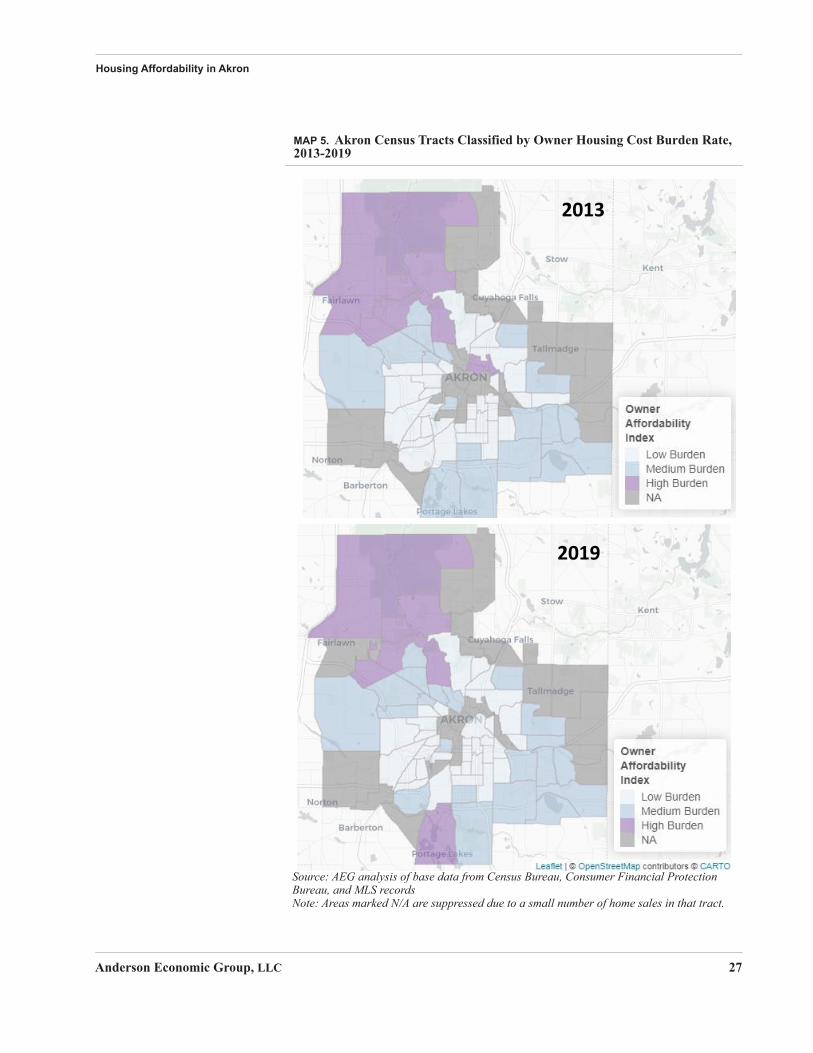
In addition to reviewing the total percentage change in affordability in each cen-sus tract, we also classified each census tract as either low, medium, or high cost burdened depending on the proportion of Akron households that would be cost-burdened in each tract after buying the homes available for sale in each tract in 2013 and 2019.
We classified tracts as “Low Cost Burden” if less than 25% of Akron house-holds would be cost-burdened when buying the homes for sale in that tract. We classified a tract as “Medium Cost Burden” if 25-50% of households would be cost-burdened, and “High Cost Burden” if more than 50% of households would be cost-burdened after buying the available homes in that tract.
Our tract-level analysis reflects similar findings noted above. From 2013 to 2019, the number of Low, Medium, and High Cost Burden tracts remained rela-tively constant, as shown in Map 5 on page 27. There was no clear geographic pattern among tracts that shifted from one classification to another.
Due to lack of available data, the index does not take into account the fact that some homes with low sales prices may require costly repairs. As a result, the
27.The decreases in affordability in these tracts was offset by improvements in affordability in other tracts, resulting in an overall improvement in affordability.
Anderson Economic Group, LLC 24

Housing Affordability in Akron
index may overestimate the affordability of these homes. Additionally, the index does not take into account upfront ownership costs, such as down payments or closing costs, which often prove to be substantial barriers to homeownership.
These barriers are likely a key reason why Akron households earning less than $30,000 constituted only 12% of homebuyers in 2019, even though they account for nearly 40% of Akron’s population, as shown in Table 2 below. Although lower income households may be able to afford monthly ownership costs, they may not have adequate funds saved for a down payment or closing costs.
TABLE 2. Average Down Payment by Income Level for Homes Sold in Akron in 2019
Income Bracket (thousands)
Average DownPayment
Proportion ofHomebuyers
Proportion ofHouseholds (2018)
$30 or less $10,226 12% 38%
$30 to $40 $10,274 15% 11%
$40 to $50 $11,687 16% 9%
$50 to $60 $13,160 12% 8%
$60 to $70 $15,250 10% 6%
$70 to $80 $24,473 7% 5%
$80 to $90 $25,716 5% 5%
$90 to $100 $27,592 4% 3%
$100 and above $43,773 19% 14%
Source: AEG analysis of base data from the U.S. Consumer Financial Protection Bureau.
Anderson Economic Group, LLC 25
Housing Affordability in Akron
MAP 4. Percent of Akron Households that Could Afford Monthly Owner-Occupied Housing for Homes Sold in Each Census Tract, 2013 and 2019
2013
2019
Source: AEG analysis of base data from Census Bureau, Consumer Financial ProtectionBureau, and MLS recordsNote: Areas marked N/A re suppressed due to a small number of home sales in that tract.
Anderson Economic Group, LLC 26
Housing Affordability in Akron
MAP 5. Akron Census Tracts Classified by Owner Housing Cost Burden Rate, 2013-2019
2013
2019
Source: AEG analysis of base data from Census Bureau, Consumer Financial ProtectionBureau, and MLS recordsNote: Areas marked N/A are suppressed due to a small number of home sales in that tract.
Anderson Economic Group, LLC 27

Housing Affordability in Akron
RENTER AFFORDABILITY INDEX
We constructed a renter affordability index to measure rental unit affordability in each census tract in Akron. This index estimates the proportion of Akron renter-occupied households that would be rent-burdened if they rented the homes available for rent in each census tract. The index takes into account all of the key housing market factors described previously, including changes to household income, the number of renter-occupied households, and rents over time. The renter affordability index analyzes Census income and rent data col-lected during two five-year time periods: 2009-13 and 2014-18.
The results of our analysis demonstrate that the number of census tracts with affordable rental housing in Akron has decreased in recent years. The propor-tion of renter-occupied households that would be rent-burdened in a typical Akron census tract increased from 44% in 2009-13 to 51% in 2014-2018.
The decrease in census tract-level rental affordability over the last ten years has not been evenly concentrated across the city. Some census tracts on the city’s periphery have become more affordable to renter-occupied households over time, while other tracts closer to the city center have became less affordable, as shown in Map 6 on page 29.
During the two time periods we examined, the number of Medium Cost Burden census tracts decreased, while the number of High Cost Burden tracts more than doubled, as shown in Map 7 on page 30. These changes in tract-level affordabil-ity occurred even as the city’s overall rate of rent-burdened households declined, suggesting that affordability is decreasing in central parts of the city while remaining constant or growing in other portions of the city.
CONCLUSION While Akron’s owner-occupied housing has remained relatively affordable in recent years, many of the city’s census tracts saw slight decreases in affordabil-ity. The affordability of the city’s rental housing has decreased more rapidly, and this decrease has been especially concentrated in certain parts of the city, including areas close to the city center. To some extent, these developments mirror trends at the national level, where housing affordability has increased more significantly for owner-occupied households than for renter-occupied households since the Great Recession. Any discussion of housing affordability in Akron must take into account not only these broader trends, but also how the local housing market—and housing affordability—varies across the city.
Anderson Economic Group, LLC 28

Housing Affordability in Akron
MAP 6. Percent of Akron Renter-Occupied Households that Could Afford Monthly Rents by Census Tract, 2009-13 and 2014-18
2009-13
2014-18
Source: AEG analysis of base data from the Census Bureau
Anderson Economic Group, LLC 29

Housing Affordability in Akron
MAP 7. Akron Census Tracts by Level of Renter Housing Cost Burden, 2009-13 and 2014-18
2009-13
2014-18
Source: AEG analysis of base data from the Census Bureau
Anderson Economic Group, LLC 30

Appendix A. Methodology
In the following section we outline the data sources we used in our renter and owner occupied housing affordability analyses and discuss the analytical steps we took to produce our estimates.
DATA SOURCES Data and estimates in this report are derived from numerous government sur-veys on population, housing, and household income, as well as proprietary data from ALN Apartment Data and Multiple Listings Service (MLS) records. A complete list of data sources is provided below, along with a description of how the data was used.
We used data from the following sources to complete our analysis:
• Multiple Listings Service (MLS) records for data on home sales price and taxes for over 20,000 transactions in Akron between 2013-19.
• The Consumer Financial Protection Bureau’s Home Mortgage Disclosure Act (HMDA) dataset for down payment amounts and interest rates for over 6,600 transactions in Akron between 2018-19.
• The National Association of Insurance Commissioners (NAIC) annual home-owners insurance reports for homeowners insurance rates in Ohio.
• The U.S. Census Bureau American Community Survey (ACS) for the number of homeowners and renters; the proportion of households considered cost-bur-dened (overall and by tenure), household income in the U.S. and in Akron, and contract rents in Akron.
• The U.S. Census Building Permits Survey for the number of building permits issued in each state.
• The U.S. Census Bureau and U.S. Department of Housing and Urban Develop-ment New Residential Construction dataset for housing unit completions.
• The U.S. Bureau of Labor Statistics Producer Price Index for data on costs of inputs to construction industries.
• Zillow.com for data on typical rents and home sales prices in the U.S. and in Akron.
In addition to data from these sources, we also conducted a comprehensive liter-ature review to identify the most pressing issues in housing markets today, as well the main methods used to define housing affordability. This research is cited in “Appendix C. Works Consulted” on page C-1.
RENTER AFFORDABILITY INDEX
We constructed a renter affordability index to measure rental affordability in each census tract in Akron. The index estimates the proportion of Akron renter-occupied households that would be cost-burdened if they rented in a specific census tract. It takes into account a variety of key housing market factors, including household income, the number of renter-occupied households in
Anderson Economic Group, LLC A-1

Akron, and rents over time. The index analyzes U.S. Census Bureau income and contract rent data collected during two five-year time periods: 2009-13 and 2014-18.
To estimate the proportion of Akron renter-occupied households that would be cost-burdened if they rented in a given Akron census tract, we took the follow-ing steps.
1. We first collected ACS microdata on rental household income and then divided the various household incomes into a series of income brackets ($0 to $10,000, $10,000 to $20,000, and so on). We then used this information to estimate the proportion of households that fall into each bracket, as shown in Table A-1 on page A-5.
2. After separating households into each income bracket we then estimated the average (mean) household income for each bracket, as shown in Table A-2 on page A-5.
3. The ACS separates rental units into rent brackets. We calculated the average (mean) contract rent for each of these brackets. We then determined the compo-sition of rental brackets for each census tract.
4. After determining household incomes for rental households and rents in each census tract, we determined whether each household income bracket would be cost-burdened in each rent bracket in each census tract. In our model, if the mean rent for a given rent bracket was greater than 30% of the mean income in a given bracket, we classified households in that income bracket as cost-bur-dened. For example, any household in the $0-10,000 annual income bracket in 2014-18 would be considered cost-burdened in the $350-399 monthly rent bracket, as the average annual rent for this rent bracket ($4,500) is greater than 30% of the average annual household income ($6,466).
5. We then compared the proportion of rental units considered affordable to a given income bracket to that income bracket’s proportion of all Akron house-holds. For example, if 8% of all rental housing in a census tract was affordable to households earning $0-10,000 per year, but these households constituted 10% of all Akron renter-occupied households, we then assumed that at least 2% of Akron households would be considered cost-burdened in that census tract.
6. For tracts where the supply of affordable housing fell short of each household income bracket’s proportion of all Akron renter-occupied households, we calcu-lated the proportion of housing that was both affordable and actually available to each income bracket, assuming that units in the lowest rental bracket were claimed by households in the lowest income bracket. As we moved from lower to higher income brackets, we excluded housing that would have been claimed by the previous income bracket(s).
For example, if 60% of rental housing in a given census tract was considered affordable to renter households earning $20,000-30,000 per year, but house-holds earning less than $20,000 constituted 36% of Akron renter-occupied households, then only 24% of rental housing would be both affordable and available to households earning $20,000-30,000. If households earning $20,000-30,000 per year constituted 18% of all Akron renter-occupied house-
Anderson Economic Group, LLC A-2

holds, then the census tract would be affordable to all of the households in this income bracket, as 18% is less than 24%.
Note that our model assumption that lower incomes are able to access the least expensive housing represents the most efficient allocation of housing possible according to cost. This allocation minimizes any affordability mismatches. It is possible that, in some cases, wealthier households may choose to pay less than 30% of their income toward rent, forcing a lower income household out of a more affordable unit. In most cases, however, it is reasonable to assume that lower income households tend to purchase lower cost housing, while higher income households tend to purchase higher cost housing.
7. To determine each tract’s overall affordability, we summed the individual income bracket proportions of renter households that would not be cost-bur-dened to determine the total renter affordability score for each census tract. We show affordability rates by tract in Table A-5 on page A-7.
OWNER AFFORDABILITY INDEX
We constructed an owner affordability index to measure the affordability of housing costs for homes sold in each census tract in Akron. This index estimates the proportion of Akron households that would be cost-burdened if they pur-chased a home sold in a specific census tract in a given year. It accounts for changes in the distribution of income and home sale prices over time and cap-tures the cost not just mortgage payments, but also property tax payments and homeowners insurance.
To estimate the proportion of Akron households that would be cost-burdened if they purchased a recently sold home in a given Akron census tract, we com-pleted the following steps.
1. We first collected ACS microdata to divide Akron households into a series of income brackets and estimate the proportion of households that fall into each bracket, similar to our rental affordability analysis. We then used the ACS microdata to estimate the mean household income for each of these income brackets, as shown in Table A-3 and Table A-4 on page A-6.
2. After categorizing households by income bracket, we then calculated the monthly housing costs associated with each home sold in Akron between 2013 and 2019. We first estimated average down payment amounts (as a percentage of home sale price) and interest rates for borrowers at each income bracket using HMDA data on interest rates and down payment amounts for homes sold in Akron in 2018 and 2019. We then applied these down payment and interest rate estimates to individual sales prices for Akron home sales in MLS records for 2013-2019 to calculate mortgage payments.
We also used data from MLS records to estimate an effective property tax rate for each home for each sale year. We applied this rate to individual home sales to estimate property tax payments. Finally, we used annual NAIC homeowners insurance report data on average insurance premiums by state to estimate home-owners insurance payments for each home sold between 2013 and 2019. We then summed the estimated mortgage payments, tax payments, and homeowners
Anderson Economic Group, LLC A-3

insurance payments to estimate total monthly housing costs for each home sale in the MLS records.
3. We then calculated the proportion of Akron households that would be cost-bur-dened if they purchased a given home. First, we determined whether the monthly costs for that home constituted more than 30% of the mean income for each income bracket. To calculate the total proportion of the population that would be cost-burdened if they purchased that home, we summed the propor-tion of homes sold in a given bracket whose estimated housing costs would exceed 30% of mean income for each household income bracket. We then mul-tiplied these estimates by each income bracket’s proportion of all Akron house-holds to determine the proportion of all Akron households that would be cost-burdened, divided by income bracket.
Finally, we summed these income-bracket level proportions to determine the total proportion of Akron households that would be cost-burdened if they pur-chased a home in the census tract. For example, if, in a given census tract in 2019, 100% of homes sold had monthly costs greater than 30% for households in the $10,000 or less and $10,000-$20,000 income brackets, the total propor-tion of households considered cost-burdened would be 25%, as these income brackets constituted 10% and 15% of Akron households, respectively, that year. See Table A-5 on page A-7 for a list of all Owner Affordability Index values by census tract.
Anderson Economic Group, LLC A-4

TABLE A-1. Percent of All Renter-Occupied Households in Akron by Income Bracket, 2009-13 and 2014-18
TABLE A-2. Mean Household Income by Income Bracket for Renter-Occupied Households in Akron, 2009-13 and 2014-18
Household Income 2009-13 2014-18$0 to $10,000 26% 18%$10,001 to $20,000 22% 21%$20,001 to $30,000 13% 17%$30,001 to $40,000 10% 11%$40,001 to $50,000 11% 9%$50,001 to $60,000 5% 7%$60,001 to $70,000 5% 4%$70,001 and over 7% 12%Source: AEG analysis of U.S. Census Bureau American Community Survey microdata
Household Income 2009-13 2014-18$0 to $10,000 $6,281 $6,466$10,001 to $20,000 $14,414 $14,856$20,001 to $30,000 $24,805 $24,670$30,001 to $40,000 $33,909 $34,904$40,001 to $50,000 $44,761 $44,848$50,001 to $60,000 $54,947 $54,671$60,001 to $70,000 $64,228 $64,249$70,001 and over $101,368 $113,466Source: AEG analysis of U.S. Census Bureau American Community Survey microdata
Anderson Economic Group, LLC A-5

TABLE A-3. Percent of All Households in Akron by Income Bracket, 2013-2019
TABLE A-4. Mean Household Income by Income Bracket for All Akron Households, 2013-2019
Household Income 2013 2014 2015 2016 2017 2018 2019$0 to $10,000 16% 15% 12% 9% 12% 10% 10%$10,001 to $20,000 15% 15% 14% 16% 16% 15% 15%$20,001 to $30,000 13% 15% 16% 18% 12% 12% 12%$30,001 to $40,000 12% 11% 12% 12% 13% 11% 11%$40,001 to $50,000 10% 9% 10% 9% 10% 9% 9%$50,001 to $60,000 7% 7% 8% 8% 8% 8% 8%$60,001 to $70,000 8% 7% 6% 5% 5% 6% 6%$70,001 to $80,000 4% 5% 5% 7% 5% 5% 5%$80,001 to$90,000 3% 4% 3% 3% 5% 5% 5%$90,001 to $100,000 1% 4% 3% 3% 3% 3% 3%$100,001 to $125,000 6% 5% 3% 3% 6% 7% 7%$125,001 to $150,000 2% 1% 2% 3% 2% 3% 3%$150,001 and over 4% 3% 5% 4% 4% 4% 4%Source: AEG analysis of U.S. Census Bureau American Community Survey (ACS) microdata
Note: 2019 ACS data is not yet available. Percent of households by income bracket for 2019 estimated as equal to values from 2018 ACS data.
Household Income 2013 2014 2015 2016 2017 2018 2019$0 to $10,000 $6,053 $5,312 $5,684 $4,625 $5,107 $4,926 $5,001$10,001 to $20,000 $14,813 $15,267 $14,671 $14,943 $14,461 $15,594 $15,830$20,001 to $30,000 $24,800 $24,760 $24,742 $24,509 $24,280 $24,400 $24,770$30,001 to $40,000 $33,875 $34,622 $34,433 $34,320 $34,478 $35,200 $35,733$40,001 to $50,000 $44,664 $44,992 $44,797 $44,114 $44,709 $44,397 $45,069$50,001 to $60,000 $54,213 $54,864 $54,718 $54,497 $54,695 $54,635 $55,462$60,001 to $70,000 $63,628 $64,423 $63,953 $64,570 $65,094 $64,590 $65,567$70,001 to $80,000 $73,914 $73,624 $74,698 $74,447 $73,800 $74,577 $75,705$80,001 to$90,000 $84,519 $85,057 $83,715 $85,535 $84,510 $84,331 $85,607$90,001 to $100,000 $93,415 $94,019 $94,107 $94,841 $94,371 $94,068 $95,491$100,001 to $125,000 $108,517 $111,113 $109,855 $109,542 $110,010 $111,543 $113,231$125,001 to $150,000 $137,633 $138,564 $134,750 $136,396 $137,818 $136,385 $138,448$150,001 and over $261,779 $241,315 $271,665 $266,278 $236,725 $256,670 $260,554
Note: 2019 American Communiy Survey (ACS) data is not yet available. Mean income by income bracket for 2019 estimated as equal to values from 2018 ACS data, adjusted for inflation.
Source: AEG analysis of U.S. Census Bureau American Community Survey (ACS) microdata
Anderson Economic Group, LLC A-6

TABLE A-5. Renter and Owner Affordability Index Scores by Census Tract
Census Tract
Renter Affordability
2009-13
Renter Affordability
2014-18
Owner Affordability
2013
Owner Affordability
2019503300 67% 46% 82% 84%503400 59% 46% NA 96%503500 66% 14% 84% 89%503600 42% 48% 73% 67%503701 43% 75% 66% 67%503702 55% 46% 71% 67%503800 80% 26% 65% 58%504100 53% 63% 82% 85%504200 55% 46% 84% 88%504400 53% 59% 84% 91%504500 66% 67% 82% 85%504600 50% 46% 84% 87%504700 50% 46% 78% 77%504800 47% 59% 69% 68%505200 58% 62% 82% 87%505300 96% 72% NA 92%505400 61% 50% 83% 87%505500 51% 53% 82% 81%505600 67% 61% 84% NA505700 58% 65% 83% 89%505800 58% 46% 81% 75%505900 55% 70% 80% 78%506100 49% 45% 55% 57%506200 48% 46% 77% 73%506400 43% 46% 69% 67%506500 59% 46% 84% 90%506600 73% 33% 84% 83%506700 54% 60% 81% 81%506800 81% 27% NA NA507101 50% 35% 48% 44%507102 47% 67% 38% 36%507201 70% 46% 61% 52%507202 30% 46% 53% 53%
Anderson Economic Group, LLC A-7

TABLE A-5 (CONTINUED). Renter and Owner Affordability Index Scores by Census Tract
Census Tract
Renter Affordability
2009-13
Renter Affordability
2014-18
Owner Affordability
2013
Owner Affordability
2019507203 30% 51% 45% 40%507300 47% 63% 59% 58%507400 55% 100% NA 63%507500 46% 63% 75% 78%507600 55% 50% 80% 77%508000 40% 46% 48% 46%508301 64% 46% NA NA508399 65% 15% 82% 81%508600 81% 46% 83% 84%508800 59% 58% 80% 85%508900 45% 46% NA 76%509000 68% 46% 84% 92%520301 66% 53% NA NA531001 55% 46% NA NA531802 48% 75% 62% 60%532302 10% 47% 28% 26%532901 NA 21% 23% 24%532902 60% 92% NA NA533400 52% 55% 55% 51%501100 55% 46% 40% NA501700 15% 66% NA 80%501800 73% 46% NA 84%501900 87% 19% 67% 72%502101 69% 96% 83% 79%502102 62% 35% 72% 67%502200 57% 46% 79% 79%502300 60% 47% 83% 80%502500 55% 42% NA NA502600 55% 52% 82% 82%502700 64% 24% 72% 70%502800 55% 59% 77% 75%503100 56% 3% 84% 92%503200 55% 3% 84% 93%
Anderson Economic Group, LLC A-8

Appendix B. Measuring Housing Affordability
In this section, we provide brief descriptions of some of the most commonly used approaches for measuring housing affordability. We also discuss the advantages and disadvantages of each approach.
COMMONLY USED MEASURES OF AFFORDABILITY
Cost Burden Measure. Traditionally, the 30% cost-income ratio has been a cornerstone of housing affordability measures. Since the 1940s, the Federal government has measured housing affordability as a percentage of household income. In 1940, the maximum affordable rent for Federally subsidized housing was set at 20% of income, rising to 30% of income in 1981. Over time, the 30% threshold also became a standard for owner-occupied housing, and it remains a primary indicator of affordability for housing in the U.S. today.
While widely used, this measure does not fully consider the effects of housing and neighborhood quality or access to transportation. Some households may choose to pay more than 30% of their income toward housing if it decreases transportation costs or ensures higher levels of safety. Generally speaking, this measure may underestimate the true number of households who are burdened by combined housing and transportation costs. It may also underestimate the number of households in need of quality affordable housing and overestimate housing affordability issues for higher-income households.
NAR Housing Affordability Index. The NAR Housing Affordability Index uses recent income and home price data to calculate whether a typical family’s income can qualify for a conventional loan to purchase a typical home on the national and regional level. While this approach provides an informative, at-a-glance measure of affordability, it does not provide information on the full dis-tribution of household incomes and housing costs in an area. The index also treats all loans as “affordable,” even if the loan exceeds 30% of a buyer’s income.
Self-Sufficiency Standard. The Self-Sufficiency Standard was developed by Dr. Diana Pearce at the University of Washington and measures the amount of income needed for a family of a given composition in a given space to meet all basic needs, including housing, medical services, education, and transportation. This measure of housing affordability is unique in that it takes into account costs that differ by family size and composition. However, some argue that this standard has limited utility in addressing the housing affordability crisis because its focus is more on income than housing costs.
Shelter Poverty Measure. The Shelter Poverty Measure for housing afford-ability measures whether the income of a given family can meet basic non-hous-ing necessities after paying for housing. Those who do not have enough income left for their non-housing expenditures are considered to be in “shelter poverty.”
Anderson Economic Group, LLC B-1

Unlike the Self-Sufficiency Standard, the Shelter Poverty measure focuses more on housing than income. Rather than measuring all expenses as a whole, it sub-tracts housing expenses from total income and measures the amount available for non-housing expenses. However, when the measure was implemented in the United Kingdom, researchers did not find a significant difference in the number of people who were housing cost-burdened compared to the number of house-holds who were cost-burdened based on the income-ratio approach.
Amenity-Based Housing Affordability Index. The Amenity-Based Housing Affordability Index is based on the U.S. Department of Housing and Urban Development’s (HUD’s) 30% cost-income ratio standard for affordability but includes a location adjustment element. The rationale is that the index should consider factors like accessibility to jobs, education, and other amenities. According to the index, housing considered unaffordable may be considered affordable after improvements to job accessibility, public transportation, and other amenities are made.
H+T Index. The H+T Index includes the cost of housing and transportation. Like the Amenity-Based Housing Affordability Index, it also assumes that housing affordability should consider location factors. If a family spends more than 45% of their income on housing and transportation, they should be consid-ered cost-burdened. The 45% standard is based on a transportation cost thresh-old of less than 15% of a household’s income plus the 30% threshold from HUD.28
28. For more information on the housing affordability measures discussed here see the paper “Analyzing Measurements of Housing Affordability,” cited in Appendix B.
Anderson Economic Group, LLC B-2

Appendix C. Works Consulted
Zi Cai, “Analyzing Measurements of Housing Affordability,” 2017. digital.lib.washington.edu/researchworks/bitstream/handle/1773/40314/Cai_washington_0250O_16966.pdf.
Andrew M. Dumont. “Housing Affordability in the U.S.: Trends by Geography, Tenure, and Household Income,” FEDS Notes. Washington: Board of Gov-ernors of the Federal Reserve System, September 27, 2019, doi.org/10.17016/2380-7172.2430.
Chris Glynn, Thomas H. Byrne, and Dennis P. Culhane, “Inflection points in community-level homeless rates,” Zillow, 2018, https://www.zillow.com/research/homelessness-rent-affordability-22247/.
Regina C. Gray, “Exploring the Current State of Knowledge on the Impact of Regulations on Housing Supply,” U.S. Department of Housing and Urban Development Office of Policy Development and Research, 2018, https://www.huduser.gov/portal/periodicals/em/spring18/highlight2.html.
Raven Molloy, Christopher L. Smith, and Abigail Wozniak. “Declining Migra-tion within the U.S.: The Role of the Labor Market,” NBER Working Paper, April 2014, nber.org/papers/w20065.
National Alliance to End Homelessness, “State of Homelessness: State and CoC Dashboards,” https://endhomelessness.org/homelessness-in-america/home-lessness-statistics/state-of-homelessness-dashboards/?State=Ohio.
Jenny Schuetz. “The Goldilocks problem of housing supply: Too little, too much, or just right?” Brookings Institution, December 14, 2018, brook-ings.edu/research/the-goldilocks-problem-of-housing-supply-too-little-too-much-or-just-right/.
President Donald Trump, “Executive Order Establishing a White House Coun-cil on Eliminating Regulatory Barriers to Affordable Housing,” June 25, 2019, https://www.whitehouse.gov/presidential-actions/executive-order-establishing-white-house-council-eliminating-regulatory-barriers-afford-able-housing/.
“Labor Shortages Remain Top Concern for Builders,” National Association of Home Builders, February 20, 2020, nahbnow.com/2020/02/labor-shortages-remain-top-concern-for-builders.
“Re: Response to Request for Information, 84 Fed. Reg. 64,549 (Nov. 22, 2019) Docket No. FR-6187-N-01, Eliminating Barriers to Affordable Housing,”
Anderson Economic Group, LLC C-1

National Association of REALTORS®, Jan. 31, 2020, https://narfocus.com/billdatabase/clientfiles/172/3/3494.pdf.
Federal Housing Finance Agency House Price Index, fhfa.gov/DataTools/Downloads/Pages/House-Price-Index.aspx.
“New Survey Reveals Affordability Challenges for Renters and Homeowners,” Freddie Mac, June 26, 2019, freddiemac.com/research/consumer-research/20190626_new_survey_affordability.page.
“The State of the Nation’s Housing 2019,” Joint Center for Housing Studies of Harvard University, jchs.harvard.edu.
“Defining Housing Affordability,” The U.S. Department of Housing and Urban Development’s (HUD’s) Office of Policy Development and Research (PD&R), huduser.gov/portal/pdredge/pdr_edge_home.html.
“Akron Home Prices & Values,” Zillow, zillow.com/akron-oh/home-values/.
“United States Home Prices & Values,” Zillow, zillow.com/home-values/.
Anderson Economic Group, LLC C-2

Appendix D. About Anderson Economic Group
Anderson Economic Group, is a boutique consulting firm founded in 1996, with offices in East Lansing and Chicago. We specialize in strategy, valuation, public policy, and market analyses. Our team has a deep understanding of advanced economic modeling techniques and extensive experience in multiple industries in multiple states and countries.
The consultants at Anderson Economic Group are often published on topics related to real estate. A few recent publications from our team include:
• Economic and Fiscal Impact of First-Time Homebuyer Savings Accounts in Ohio, Ohio Association of Realtors, 2020.
• Impacts of Changes to Cleveland’s Lead Paint Regulations, Akron Association of Realtors, 2019.
• The Impact of Rent Control on Chicago’s Housing Market, Illinois Association of Realtors, 2018.
• Economic and FIscal Impact of First-Time Homebuyer Savings Account in Ala-bama, Louisiana, and Michigan, National Association of Realtors, 2018.
• Land Use Regulations in Greenwich and Surrounding Towns, Greenwich Asso-ciation of Realtors, 2015.
Past clients of Anderson Economic Group include:
• Governments: The government of Canada; the states of Michigan, North Caro-lina, and Wisconsin; the cities of Detroit, Cincinnati, and Sandusky; counties such as Oakland County, and Collier County; and authorities such as the Detroit-Wayne County Port Authority.
• Corporations: Bank of America Merrill Lynch, InBev USA, ITC Holdings Corp., Ford Motor Company, First Merit Bank, Labatt USA, Lithia Motors, Meijer, Inc., National Wine & Spirits, Nestle, and Relevent Sports; automobile dealers and dealership groups representing Toyota, Honda, Chrysler, Mercedes-Benz, General Motors, Kia, and other brands.
• Nonprofit organizations: Convention and visitor bureaus of several major cities; higher education institutions including Michigan State University, Wayne State University, and University of Michigan; trade associations such as the Michigan Manufacturers Association, Service Employees International Union, Automa-tion Alley, and Business Leaders for Michigan.
Please visit www.AndersonEconomicGroup.com for more information.
Anderson Economic Group, LLC D-1

AUTHORS Andrew Miller. Mr. Andrew Miller is a senior analyst in the public policy and economic analysis practice area at Anderson Economic Group. His work focuses on economic and fiscal impact analysis. Recent projects have included economic impact analyses of Fermi National Accelerator Laboratory, a large-scale renewable energy generation facility, and an interactive science learning center. Mr. Miller has also worked on projects involving housing policy, state economic indicators, and infrastructure funding.
Mr. Miller holds a Master of Public Policy degree from the University of Chi-cago Harris School of Public Policy and a Bachelor of Arts degree in history from the University of Chicago.
Brian R. Peterson. Mr. Brian Peterson is a consultant and the director of the public policy and economic analysis practice area at Anderson Economic Group. In addition to conducting economic and fiscal impact analyses, Mr. Peterson works with public and private clients across the country on projects that include pension reform and compensation analysis, housing policy, and environmental economics.
Mr. Peterson holds a Master of Urban Planning degree from the University of Wisconsin—Milwaukee and a Bachelor of Arts degree in economics and urban studies from the University of Minnesota—Twin Cities.
ContributorsSarah Mixon. Ms. Sarah Mixon is a senior analyst in Anderson Economic Group’s public policy and economic analysis practice area. Her work primarily focuses on conducting cost-benefit and economic impact analyses. Ms. Mixon’s recent projects include an assessment of healthcare innovation models, state education funding research, and impact analyses on various development proj-ects that utilize TIF funding models.
Ms. Mixon holds a Master of Public Policy degree from the Harris School of Public Policy at the University of Chicago, and a Bachelor of Arts degree in economics from Oklahoma State University.
Anderson Economic Group, LLC D-2

Anderson Economic Group, LLC D-3