Household Food Insecurity in Canada in 2012 Acknowledgement: This research was funded by operating...
24
Household Food Insecurity in Canada in 2012 Acknowledgement: This research was funded by operating grants from the Canadian Institutes of Health Research. This presentation draws on the work of Lynn McIntyre, Herb Emery, Naomi Dachner, Andy Mitchell, Rachel Loopstra, Urshila Sriram, Jenny Godley, and Genevive Jessiman-Perreault. Valerie Tarasuk and Catherine Mah University of Toronto 1
-
Upload
dandre-anson -
Category
Documents
-
view
214 -
download
0
Transcript of Household Food Insecurity in Canada in 2012 Acknowledgement: This research was funded by operating...

Household Food Insecurity in Canada in 2012
Acknowledgement: This research was funded by operating grants from the Canadian Institutes of Health Research. This presentation draws on the work of Lynn McIntyre, Herb Emery, Naomi Dachner, Andy Mitchell, Rachel Loopstra, Urshila Sriram, Jenny Godley, and Genevieve Jessiman-Perreault.
Valerie Tarasuk and Catherine MahUniversity of Toronto
1

2
Food insecurity: uncertain and insufficient access to food arising from resource constraint
Potential Manifestations:
Reduced food intake
Hunger Adverse socioemotional effects
Stress, worry & anxiety
Social exclusion
Potential Health Outcomes:
Poor nutritional status
Compromised mental health
Chronic health conditions
Obesity
Reduced quality of food intake
Poor child development and learning
Severity and Duration
FINANCIAL INSECURITY and INSUFFICIENCY

Household Food Security Survey Module(administered on the Canadian Community Health Survey since 2004)
• Worry about not having enough food• Reliance on low-cost foods• Not being able to afford balanced meals• Adults/children skip meals• Adults/children cut size of meals• Adults/children not having enough to eat• Adults/children not eating for whole day
“because there wasn’t
enough money to buy
food?”
18 questions, differentiating adults’ and children’s experiences over last 12 months:
3
4
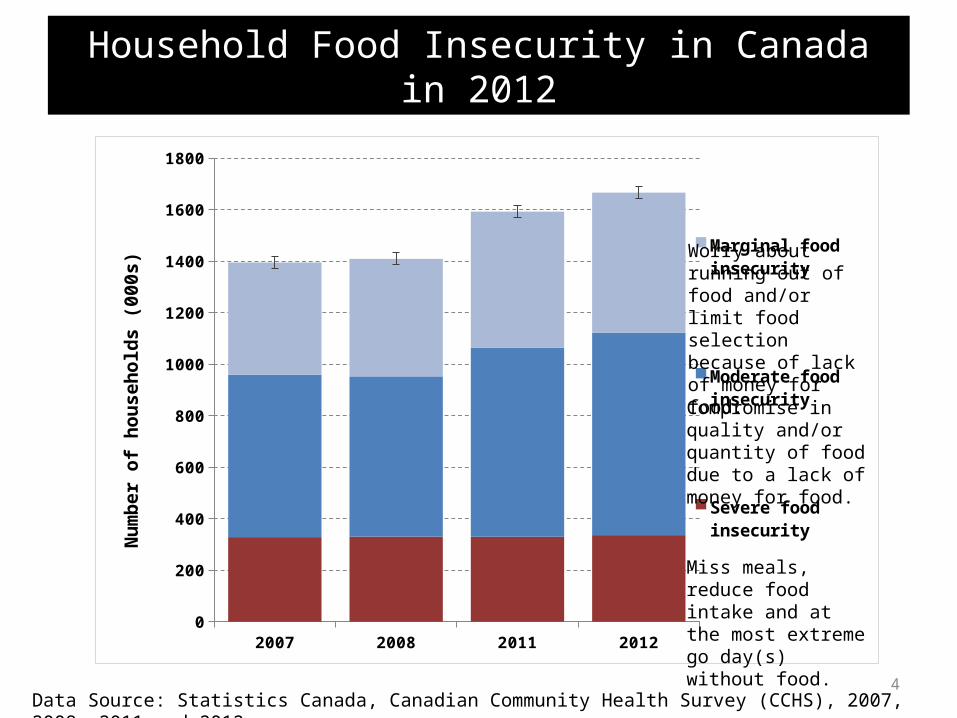
Household Food Insecurity in Canada in 2012
Data Source: Statistics Canada, Canadian Community Health Survey (CCHS), 2007, 2008, 2011 and 2012.
2007 2008 2011 20120
200
400
600
800
1000
1200
1400
1600
1800
Marginal food insecurity
Moderate food insecurity
Severe food insecurityNum
ber o
f hou
seho
lds
(000
s)
Worry about running out of food and/or limit food selection because of lack of money for food.
Compromise in quality and/or quantity of food due to a lack of money for food.
Miss meals, reduce food intake and at the most extreme go day(s) without food.

5
Household Food Insecurity in Canada in 2012
• 12.6% of households reported some food insecurity.• 4 million Canadians lived in food-insecure
households in 2012.• 1 in 6 children under the age of 18 (i.e., 1.15 million
children) lived in food-insecure households.
Relationship to food bank statistics?882,188 individuals received assistance from food banks in March 2012 (Food Banks Canada, HungerCount 2012).

6Data Source: Statistics Canada, Canadian Community Health Survey (CCHS), 2012.
Nunavut
Northwest Territories
Yukon
British Columbia
Alberta
Saskatchewan
Manitoba
Ontario
Quebec
New Brunswick
Nova Scotia
Prince Edward Island
Newfoundland and Labrador
Canada
0% 5% 10% 15% 20% 25% 30% 35% 40% 45% 50%
Household food insecurity,by province and Territory, 2012
Severe
Moderate
Marginal
12.6%
16.2%
13.4%
45.2%
13.5%
11.7%
12.1%
12.5%
11.5%
17.1%
12.7%
20.4%
17.5%
15.6%

7Data Source: Weighted estimates from CCHS 2011-12
St John's
*Hali
fax
Moncton
Saint Jo
hn
Sagu
enay
Quebec
City
Sherb
rooke
Trois-
Riviere
s
*Montre
al
Ottawa-G
atinea
u
*Pete
rboro
ugh
Oshaw
a
Toro
nto
*Ham
ilton
St. Cath
arines-
Niagara
Kitchen
er
Brantford
*Guelp
h
London
Barrie
Greater
Sudbury
Thunder
Bay
Winnipeg
Saska
toon
*Calg
ary
Edmonton
*Abbotsf
ord
Vanco
uver
Victoria
0%
2%
4%
6%
8%
10%
12%
14%
16%
18%
20%
Prevalence of household food insecurity in major census metropolitan areas, 2011-2012

8
$1-$10,000
$10,001-$20,000
$20,001-$30,000
$30,001-$40,000
$40,001-$50,000
$50,001-$60,000
$60,001-$70,000
$70,001-$80,000
$80,001-$90,000
$90,001-$100,000
$100,001+
0.0
5.0
10.0
15.0
20.0
25.0
30.0
35.0
40.0
45.0
50.0
46.2
14.8
6.4
3.32.0
0.9
Household income, adjusted for household size
Perc
ent
Inse
cure
(%)
Prevalence of household food insecurity by income, 2011

In addition to income, other factors associated with heightened vulnerability to food insecurity include:
• Not owning one’s home• Being aboriginal or black • Being a recent immigrant• Living in urban Canada• Being in a lone-parent, female-led household• Relying on social assistance
9

10
Food insecurity, by provinceHouseholds with social assistance as major source of income
Canada 2011-12
Newfoundland and La
brador
Nova Scotia
New Brunsw
ick
Quebec
Ontario
Manito
ba
Saskatch
ewan
Alberta
British
Columbia
Yukon
Nunavut0%
10%
20%
30%
40%
50%
60%
70%
80%
90%
Prevalence of food insecurity among households whose main source of income was social assistance, by province/territory
46.2%
78.7%
Data Source: CCHS 2011-12 Note: PEI and Northwest Territories have been omitted because of the small size of the samples there.

11
Why are social assistance recipients so vulnerable?
• Incomes fall below basic living costs in most jurisdictions.
• Most provinces do not index benefits to inflation.
• Limits on allowable assets mean recipients have typically have no savings and therefore no capacity to buffer sudden increases in expenses or interruptions in income.

12
2007 2008 2009 2010 2011 20120%
2%
4%
6%
8%
10%
12%
14%
16%
18%
Food insecurity in Newfoundland & Labrador
Drop in food insecurity between 2007 and 2011 reflects decreased vulnerability of social assistance recipients with province’s Poverty Reduction Strategy launched in 2006.
Among the changes: Social assistance benefits were increased and indexed benefits to inflation. Asset limits and earnings exemptions were raised.
15.7%
10.6%
(R Loopstra, unpublished analysis.)

13Data Source: CCHS 2011-12
Nunavut
Northwest Territories
Yukon
British Columbia
Alberta
Saskatchewan
Manitoba
Ontario
Quebec
New Brunswick
Nova Scotia
Prince Edward Island
Newfoundland and Labrador
Canada
0% 5% 10% 15% 20% 25% 30% 35% 40% 45% 50%
Wages and salaries or self-employment as main source of income
Other income or none
% food insecure
Most food insecure households are reliant on employment incomes.

Why are so many households reliant on employment incomes food insecure?
• low-waged jobs• short-term, part-time employment• single (vs dual) earner households• inadequacy of income transfers provided to
supplement low employment incomes
14

The low rate of food insecurity among Canadian seniors reflects the effect of policy interventions targeting income.
• In 2012, 7% of households reliant on seniors’ incomes were food insecure.– versus 11% among those reliant on employment and 70% among
those on social assistance.
• Seniors have guaranteed annual incomes, indexed to inflation, and drug coverage, transit subsidies, ‘seniors days’ discounts.
• Turning 65 drops the risk of food insecurity in half for low-income adults. (Emery, Fleisch and McIntyre. How a Guaranteed Annual Income Could Put Food Banks out of Business, University of Calgary SPP Research Papers, Dec 2013)
15

16
Food insecurity: uncertain and insufficient access to food arising from resource constraint
Potential Manifestations:
Reduced food intake
Hunger Adverse socioemotional effects
Stress, worry & anxiety
Social exclusion
Potential Health Outcomes:
Poor nutritional status
Compromised mental health
Chronic health conditions
Obesity
Reduced quality of food intake
Poor child development and learning
Severity and Duration
FINANCIAL INSECURITY and INSUFFICIENCY
Reducing food insecurity means intervening upstream, to tackle the severe financial constraints that give rise to this problem.

93 policy actor roster members
2
70 roster members completed
the survey, naming 117 unique nominees, of which 35 were roster members
3
‘Ego-centred’ network of 160
individuals, of which 11 were most frequently nominated =
policy ‘entrepreneurs’
Social network analysis
Survey
1
Consultation with research team,
network, and partners to assemble roster
Nominate 3 ‘policy entrepreneurs’
Three sets of qualities• Voice or claim to be heard• Connections or able to forge
strategic relationships• Tenacity – persistence
Explain reasons for nominationsIdentify areas of policy influenceState relationship with nominee
Food insecurity policy actors: social network analysisPart of policy framing analysis, team led by McIntyre and Mah; purpose: to examine the makeup of the policy community for this issue

160 individuals in the network 11
entrepreneurs
93 rostermembers
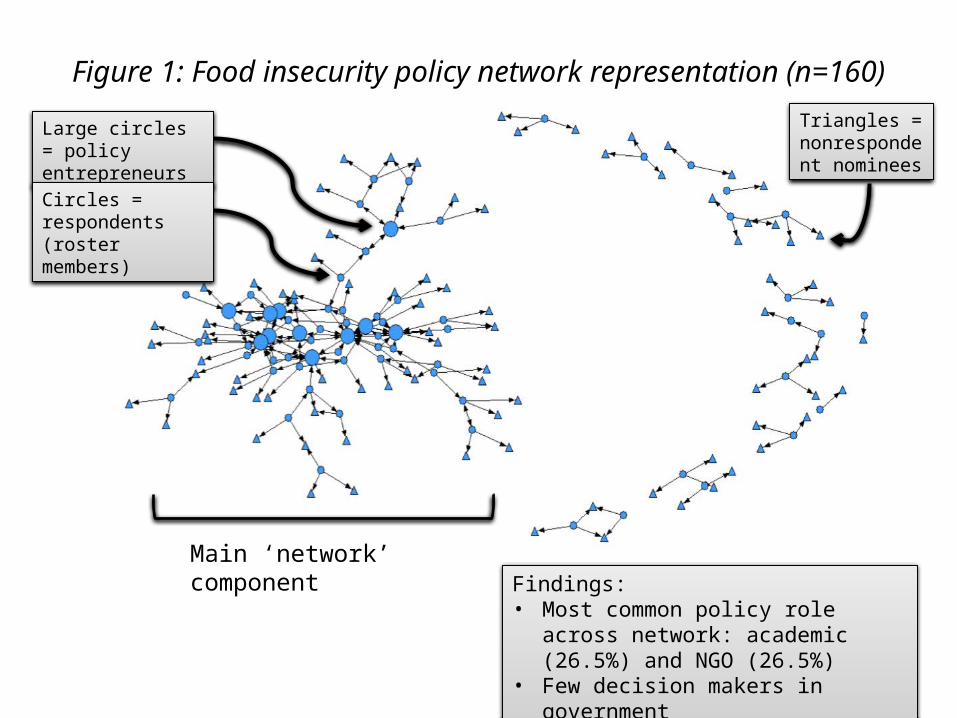
Figure 1: Food insecurity policy network representation (n=160)
Large circles = policy entrepreneurs
Circles = respondents (roster members)
Main ‘network’ componentFindings: • Most common policy role across network:
academic (26.5%) and NGO (26.5%)• Few decision makers in government
Triangles = nonrespondent nominees

20
Figure 2: Food insecurity policy network representation(colour-coded by region, n=160)
BC – GreenAB – RedSK – GreyMB – YellowON – BlueQC – BrownNS – PinkNL – OrangeNU – PurpleNWT – Teal
Findings: • Horizontal network• Predominance of Ontario, followed by BC• Regionally focused – nominations in own region

21
Figure 4: Food insecurity policy network representation(colour-coded by approach, n=160)
Food-based – RedMixed – GreyIncome-based – Blue
Analysis of network homophily (post-hoc)
Findings: • Like-minded individuals connect• ‘Mixed’ as bridge?• 11 entrepreneur nominations: approach not as
important as perception of formal role, action, voice
22
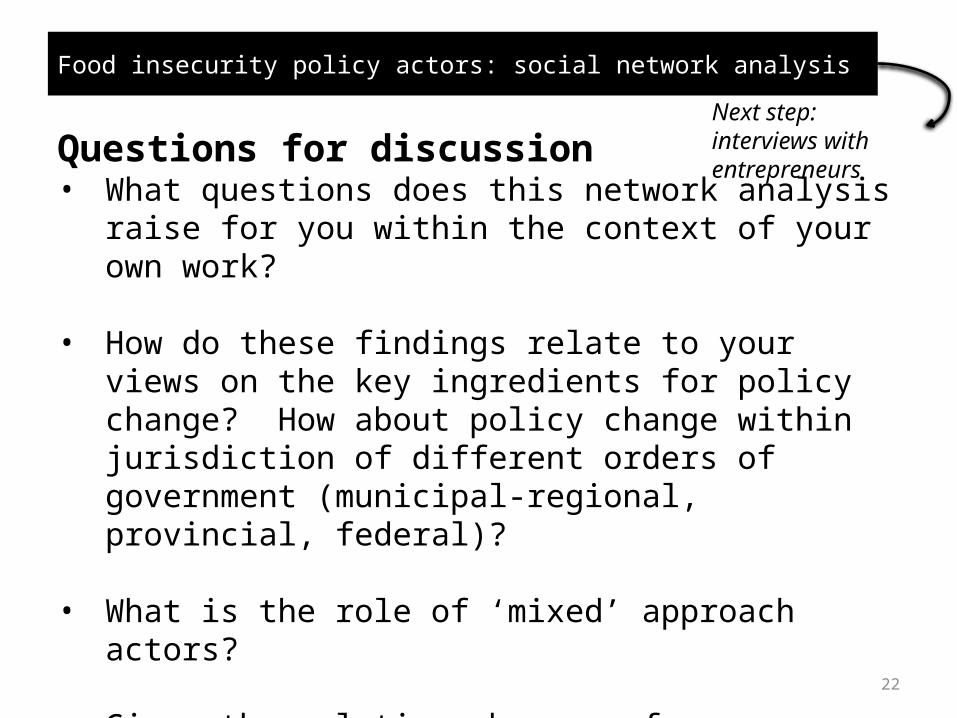
Food insecurity policy actors: social network analysis
Questions for discussion• What questions does this network analysis raise for you
within the context of your own work?
• How do these findings relate to your views on the key ingredients for policy change? How about policy change within jurisdiction of different orders of government (municipal-regional, provincial, federal)?
• What is the role of ‘mixed’ approach actors?
• Given the relative absence of governmental actors (consider legislative and executive), what are the implications for your own work?
Next step: interviews with entrepreneurs

23
Food insecurity: uncertain and insufficient access to food arising from resource constraint
Potential Manifestations:
Reduced food intake
Hunger Adverse socioemotional effects
Stress, worry & anxiety
Social exclusion
Potential Health Outcomes:
Poor nutritional status
Compromised mental health
Chronic health conditions
Obesity
Reduced quality of food intake
Poor child development and learning
Severity and Duration
FINANCIAL INSECURITY and INSUFFICIENCY
Reducing food insecurity means intervening upstream, to tackle the severe financial constraints that give rise to this problem.

For emerging research, please subscribe to our website: http://nutritionalsciences.lamp.utoronto.ca
Note:On our website, you can find links to the research papers and reports referred to in this presentation. If you have trouble accessing this material, please ‘Contact Us’ by following that link on the website.
24