San Antonio, Texas ANN UAL BUDGET - Texas Higher Education ...

1
House Ways and Means Committee Higher Education and Technical Colleges Budget Subcommittee Rep. James Merrill, Chair Rep. Gilda Cobb-Hunter Rep. Garry Smith Rep. Phillip Lowe Presentation on FY16 Budget Priorities: Opening Remarks SC Commission on Higher Education Richard C. Sutton, Ph.D., Executive Director January 28, 2015
Thank you, Mr. Chairman, and members of the committee. I appreciate the opportunity to appear before you today.
Rep. Cobb-Hunter questioned earlier in these proceedings whether her assignment to this committee was a promotion or a demotion. I think you can all agree that it has been, at the very least, a rigorous and exhausting duty.
I want to convey our deep appreciation of your service and the critical role you play in deciding the future of higher education in our state. Your review process demonstrates your intense commitment to understand the complicated dynamics of a confusing post-secondary environment. It is my responsibility to ensure that CHE plays a constructive, transparent, and unbiased role in that process.
Before I begin my presentation, please let me introduce the members of the CHE team who are here with me today (Julie Carullo, Karen Woodfaulk, Gary Glenn, MaryAnn Janosik) and also Brig. Gen. (ret.) John Finan, Chairman of the Commission.
South Carolina faces several key challenges in higher education.
• We need to educate more people at higher levels in all regions of our state. • We have to make sure a college education is affordable for all our residents. • We have to be flexible and far-sighted in preparing for new areas of knowledge and economic
opportunity.
The Commission has adopted a Strategic Agenda that helps us deal with these challenges. It calls for us:
• to align our investments in education with the state’s current and future needs, • to construct a stable, predictable, and sustainable funding model, • to integrate a student’s learning process from pre-K through college and career, and • to focus our energies and decisions on performance metrics of institutions and programs.
Most of all, it calls on us to create a true compact among all stakeholders—governments at all levels, the colleges and universities, business partners, community leaders, donors, students, faculty, and families—to take shared responsibility for our higher education enterprise.
Affordability is THE dominant issue in higher education today, and it is the centerpiece of our FY16 budget request. We are asking you to invest state money to save South Carolina students and their families more of their own hard-earned money.

2
There are many ways to approach the challenge of college affordability. CHE’s initiative calls for focused investments to support innovations and reforms that allow students to earn an associate’s or bachelor’s degree at less expense. We expect the work of the new study committee on Higher Education Efficiency, Effectiveness, and Accountability to help target and grow this initiative.
CHE is ready and eager to move forward, and we count on our partners in the General Assembly to go with us together on a challenging path.
With your permission, Mr. Chairman, I will now move to the presentation you have in front of you—all 108 pages of it, which I’m told is not the smallest but also not the largest you have received during these hearings.
• Slides 2-4 remind you what CHE is and what it does. • Slide 5 outlines the Commissioners’ strategic agenda. • Slides 6-15 give you an overview of the colleges and universities in our state that educate SC
residents. • Slides 16-20 provide data about why higher education is important—both to the individual and
to our economy. • Slides 21-34 give you information about our students—the one true focus that unites everyone
in this room and across our institutions. • Slides 35-41 talk about tuition, fees, and waivers. • Slides 42-56 tell you everything you wanted to know but were afraid to ask about state-funded
scholarship and grant programs. • Slides 57-59 give you some basic information about faculty at our public institutions, including
tenure. • Slides 60-68 illustrate the broad trends in state funding for higher education in SC over time. • Slides 69-73 look at those trends relative to other states. • Then a couple of slides (74-76) on your favorite topics of deferred maintenance and SCEIS. • Followed by a dozen slides (77-89) about how CHE operates as a state agency. • Followed by our FY16 budget request (90-97) • And finishing with the always popular provisos (98-107).
FY 2015-16 Budget Presentation
Higher Education and Technical College Budget Subcommittee House Ways & Means Committee
Rep. James Merrill, Chair Rep. Gilda Cobb-Hunter
Rep. Garry Smith Rep. Phillip Lowe
January 28, 2015
1 1/28/2015

SC Commission on Higher Education (CHE)
Promotes quality and efficiency in the state system of higher education with the goal of fostering economic growth and human development in South Carolina
• Established in 1967 as the coordinating board for SC’s 33 public colleges & universities
• Authorizing Legislation SC Code of Laws §59-103-5, et seq. Promulgated Regulations, SC Code of Regulations Chapter 62
• Offices located at 1122 Lady St., Suite 300, Columbia, SC, 29201
• Web Address: www.che.sc.gov Main Number: 803.737.2260
• CHE provides statewide policy direction, management, and oversight of the state’s higher education enterprise including:
Degree Program Review & Approvals Higher Education Funding Licensing of Nonpublic Postsecondary Education Facilities Project Approvals Student Financial Aid Data & Accountability Systems Statewide Coordination and Effectiveness Access, Awareness & Success
• CHE also – serves as the State Approving Agency (SAA) for Veterans Education and Training Programs – serves as the Fiscal Agent for the Partnership Among Academic Libraries (PASCAL) – staffs the SC Research Centers of Economic Excellence program (SmartState®) which is
overseen by the Research Centers of Economic Excellence Review Board.
2 1/28/2015

15 COMMISSION MEMBERS
8 Appointed by Governor with advice and consent of Senate
1 member statewide at-large appointed as Chair
3 members statewide at-large
3 members (Trustees) representing the sectors of public colleges & universities 1 member (President, non-voting) representing the independent colleges & universities *
7 Appointed by Governor upon recommendation of the majority of the Legislative Delegation 7 members, one from each of Congressional District
COMMISSIONERS
Brig Gen John L. Finan, USAF (Ret.), Chair
Dr. Jennifer B. Settlemyer, Statewide At-Large
Statewide At-Large, Appointment Pending:
Statewide At-Large, Appointment Pending:
Ms. Terrye C. Seckinger, 1st CD
VADM Charles Munns, USN (ret.), 2nd CD
Dr. Bettie Rose Horne, 3rd CD
Ms. Dianne C. Kuhl, 4th CD
Mr. Kim F. Phillips, 5th CD
Mr. Hood Temple, 6th CD
Vacant, 7th CD
Ms. Leah B. Moody, Research Universities
Ms. Natasha M. Hanna, 4-Year Comprehensive Univ.
Appointment Pending, SC Public Technical Colleges
Appointment Pending, SC Independep. Coll. & Univ.
Dr. Richard C. Sutton, Executive Director
For additional about CHE members, see
www.che.sc.gov (“About CHE”)
3 1/28/2015
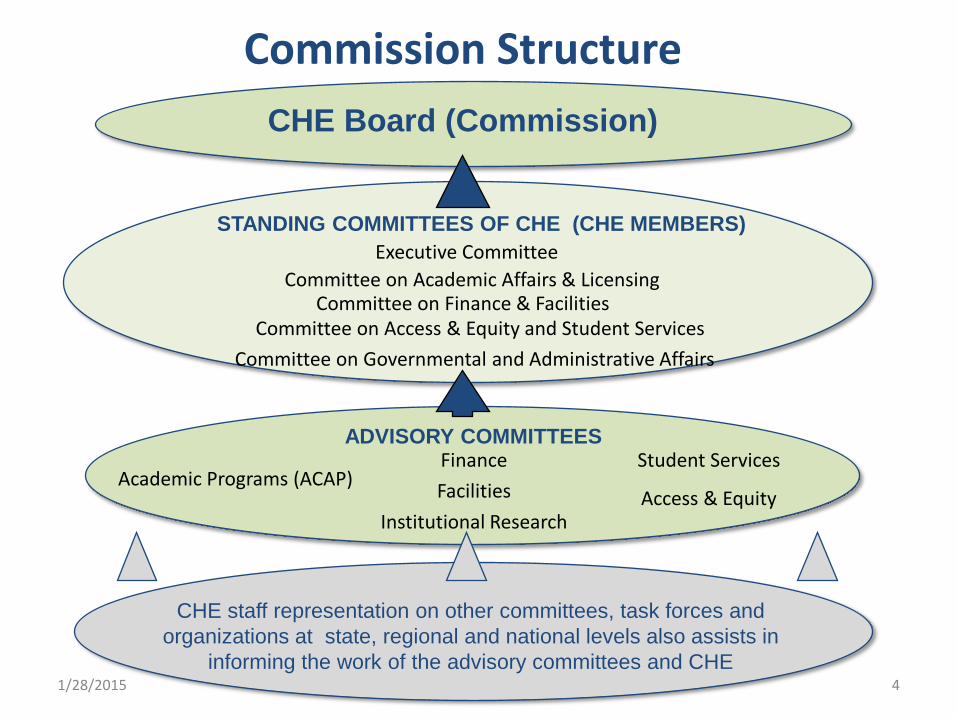
CHE Board (Commission)
STANDING COMMITTEES OF CHE (CHE MEMBERS)
ADVISORY COMMITTEES
Executive Committee Committee on Academic Affairs & Licensing
Committee on Access & Equity and Student Services Committee on Finance & Facilities
Academic Programs (ACAP) Finance Facilities
Institutional Research
Student Services
Access & Equity
CHE staff representation on other committees, task forces and organizations at state, regional and national levels also assists in
informing the work of the advisory committees and CHE
Commission Structure
Committee on Governmental and Administrative Affairs
4 1/28/2015

CHE 2015 Strategic Agenda
Improve Monitoring and Assessment of Academic Programs
Strengthen/Develop Funding Models to Sustain Higher Education
Align Higher Education Resources to Meet Current and Future State Needs
Improve Collaboration among the State Education Enterprise
Strengthen Assessment of Non-Public Postsecondary Institutions Operating in SC
5 1/28/2015
SC Higher Education Structure and Overview
6 1/28/2015

Higher Education Organization in SC Public Higher Education
SC Commission on Higher Education
3 Research Institutions
10 Four-Year Teaching Universities
4 Two-Year USC Regional Campuses
State Board for Technical & Comprehensive Education
16 Technical Colleges
Independent Colleges & Universities in South Carolina
27 headquartered in SC including: 22 Senior Institutions 3 Two-Year Institutions 2 Professional Schools (Law and Chiropractic)
27 other degree-granting institutions licensed by CHE to operate in SC
33 Public Colleges & Universities
15-member Commission responsible for coordinating public higher education
Links to SC colleges and universities are accessible at www.che.sc.gov
General Locations of Public and Independent SC Institutions
Public 4-Year
Technical Colleges
Independent
Regional Two-Year
7 1/28/2015
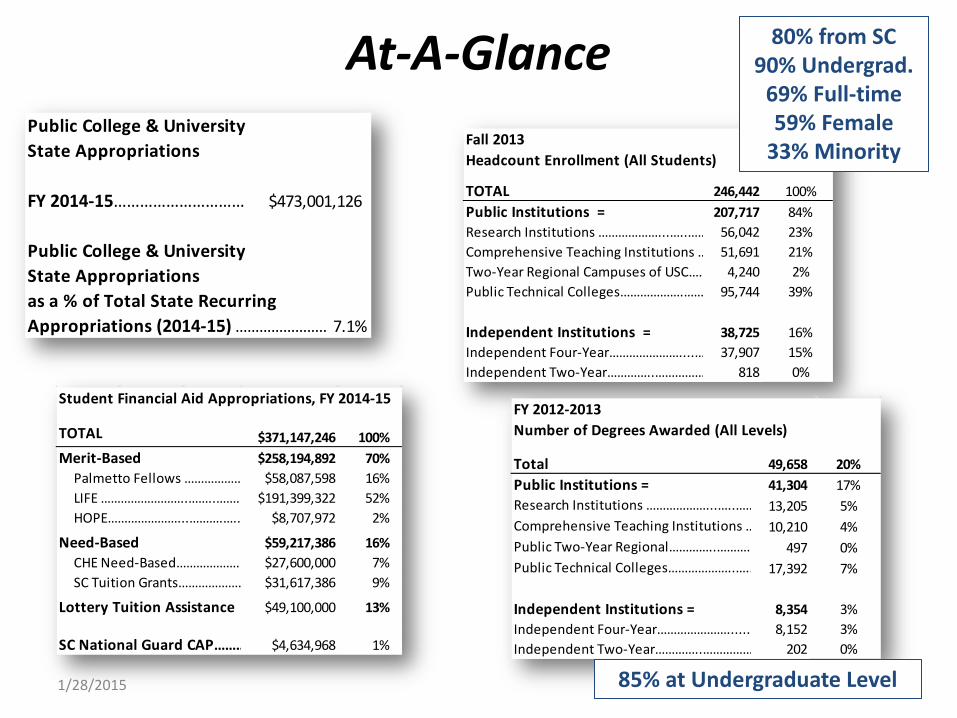
At-A-Glance
8
Public College & UniversityState Appropriations
FY 2014-15…………………………
Public College & UniversityState Appropriationsas a % of Total State RecurringAppropriations (2014-15) ……………………7.1%
$473,001,126
Fall 2013Headcount Enrollment (All Students)
TOTAL 246,442 100%Public Institutions = 207,717 84%Research Institutions ………………...…..…… 56,042 23%Comprehensive Teaching Institutions … 51,691 21%Two-Year Regional Campuses of USC…… 4,240 2%Public Technical Colleges……………….…… 95,744 39%
Independent Institutions = 38,725 16%Independent Four-Year…………………....… 37,907 15%Independent Two-Year…………..…………… 818 0%
FY 2012-2013Number of Degrees Awarded (All Levels)
Total 49,658 20%Public Institutions = 41,304 17%Research Institutions ………………...…..…… 13,205 5%Comprehensive Teaching Institutions … 10,210 4%Public Two-Year Regional…………..………. 497 0%Public Technical Colleges………………..….. 17,392 7%
Independent Institutions = 8,354 3%Independent Four-Year…………………...... 8,152 3%Independent Two-Year…………..…………… 202 0%
85% at Undergraduate Level
80% from SC 90% Undergrad.
69% Full-time 59% Female
33% Minority
Student Financial Aid Appropriations, FY 2014-15
TOTAL $371,147,246 100%Merit-Based $258,194,892 70% Palmetto Fellows ……………… $58,087,598 16% LIFE ……………………..……..……. $191,399,322 52% HOPE…………………...……….….. $8,707,972 2%0%Need-Based $59,217,386 16% CHE Need-Based………………. $27,600,000 7% SC Tuition Grants………………. $31,617,386 9%0%Lottery Tuition Assistance $49,100,000 13%
SC National Guard CAP……… $4,634,968 1%
1/28/2015
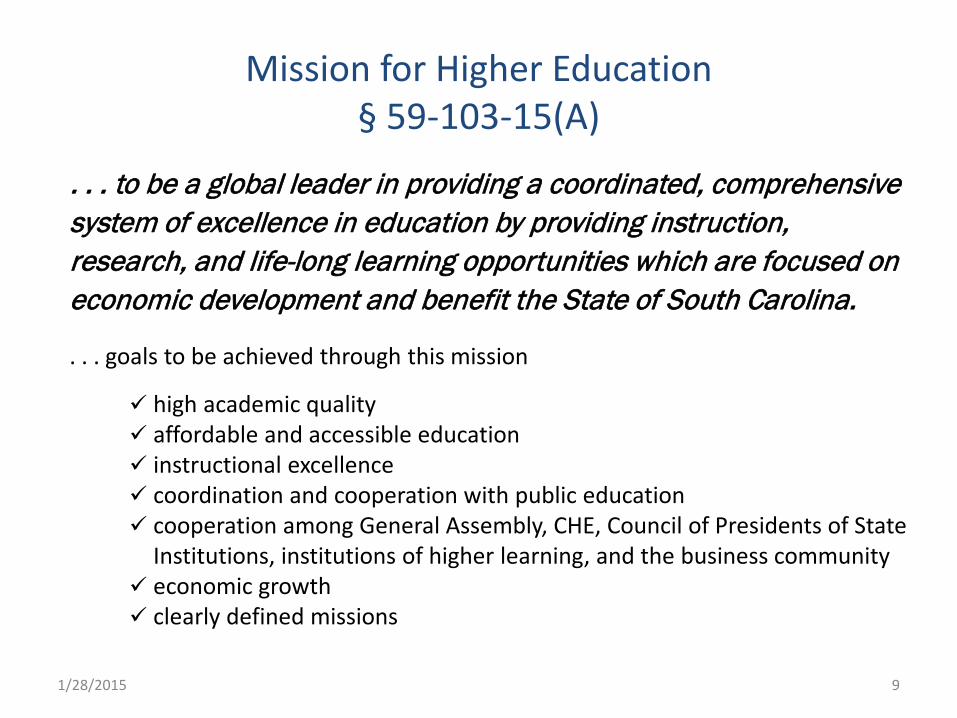
Mission for Higher Education § 59-103-15(A)
. . . to be a global leader in providing a coordinated, comprehensive system of excellence in education by providing instruction, research, and life-long learning opportunities which are focused on economic development and benefit the State of South Carolina.
. . . goals to be achieved through this mission
high academic quality affordable and accessible education instructional excellence coordination and cooperation with public education cooperation among General Assembly, CHE, Council of Presidents of State
Institutions, institutions of higher learning, and the business community economic growth clearly defined missions
9 1/28/2015

Primary Mission By Sector §59-103-15(B), Act 359 of 1996
Research Universities Clemson Univ. of SC Columbia Medical Univ. of SC
college-level baccalaureate education, master’s, professional, and doctor of philosophy degrees which lead to continued education or employment
research through the use of government, corporate, nonprofit-organization grants, or state resources or both
public service to the State and local community
SECTOR: One of four groupings of SC Public Higher Education Institutions identified by mission in legislation
10 1/28/2015

Four-Year Colleges and Universities
The Citadel Lander USC Upstate College of Charleston3 SC State Winthrop Coastal Carolina4 USC Aiken Francis Marion USC Beaufort 1 college-level baccalaureate education and selected master’s degrees
which lead to employment or continued education, or both, except for doctoral degrees currently being offered
Doctoral degree in Marine Science approved by CHE2
limited and specialized research public service to the State and local community
1 CHE considered and approved on June 6, 2002, a mission change for USC Beaufort to enable the campus to become a 4-yr branch campus of USC 2 Act No. 213 of 2012, Section 1, eff. Jun 7, 2012 3 CHE considered and approved on Sept 4, 2014, a revised mission statement for the College of Charleston that designates the University of Charleston (created as a component of the College in 1992) as a research institution as that term is defined in SC law. 4 CHE considered and approved Coastal Carolina’s request for a new program in marine science on Jun 2013. 1/28/2015

Two-Year Institutions Branches of the University of SC
USC Sumter USC Lancaster
USC Union USC Salkehatchie
college-level pre-baccalaureate education necessary to confer associates’ degrees which lead to continued education at a four-year or research institution
public service to the State and local community
12 1/28/2015
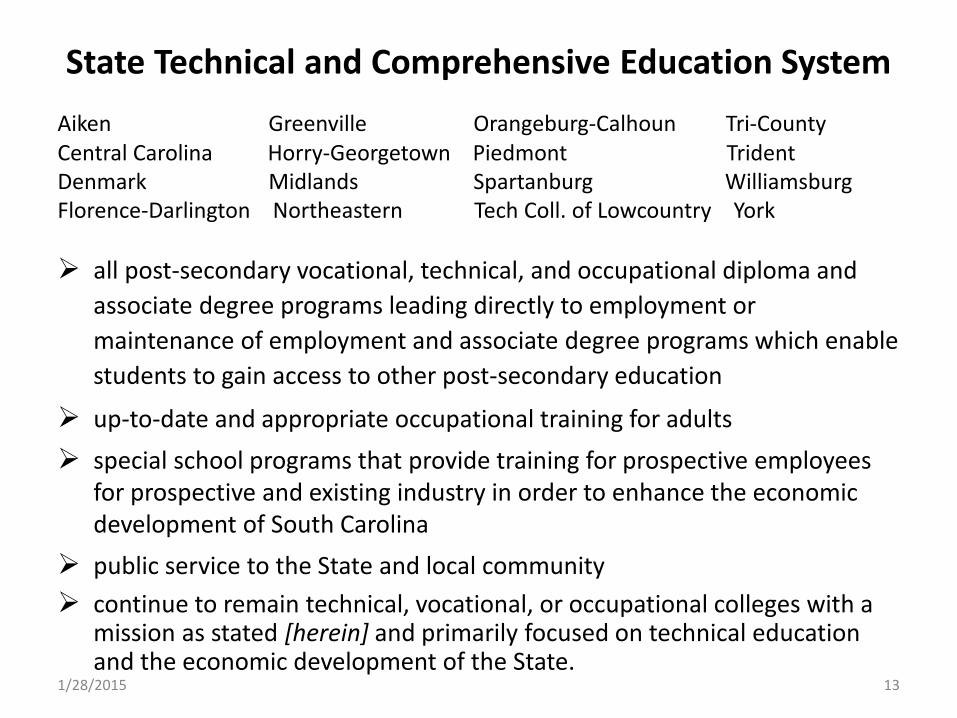
State Technical and Comprehensive Education System Aiken Greenville Orangeburg-Calhoun Tri-County Central Carolina Horry-Georgetown Piedmont Trident Denmark Midlands Spartanburg Williamsburg Florence-Darlington Northeastern Tech Coll. of Lowcountry York
all post-secondary vocational, technical, and occupational diploma and associate degree programs leading directly to employment or maintenance of employment and associate degree programs which enable students to gain access to other post-secondary education
up-to-date and appropriate occupational training for adults special school programs that provide training for prospective employees
for prospective and existing industry in order to enhance the economic development of South Carolina
public service to the State and local community continue to remain technical, vocational, or occupational colleges with a
mission as stated [herein] and primarily focused on technical education and the economic development of the State.
13 1/28/2015

14
SC Independent/Private Senior Institutions 22Allen UniversityAmerican College of the Building Arts (est. 2004 )Anderson UniversityBenedict CollegeBob Jones UniversityCharleston Southern UniversityClaflin UniversityCoker CollegeColumbia International UniversityColumbia CollegeConverse CollegeErskine CollegeFurman UniversityLimestone CollegeMorris CollegeNewberry CollegeNorth Greenville UniversityPresbyterian CollegeSouthern Methodist CollegeSouthern Wesleyan UniversityVoorhees CollegeWofford College
SC Independent/Private Two-year Colleges 3Clinton Junior CollegeSpartanburg Methodist CollegeForrest College (For Profit, 2-year)
SC Independent/Private Professional Schools 2Sherman College of ChiropracticCharleston School of Law (Private, For Profit)
Out-of-State Degree-Granting Institutions with Branches in SC,CHE Licenses to Operate in SC 27
Art Institute of CharlestonBrown Mackie CollegeCentura CollegeECPI College of Technology Embry-Riddle Aeronautical UniversityFortis CollegeGardner-Webb UniversityGolf Academy of AmericaITT Technical InstituteLesley UniversityLenoir Rhyne UniversityLenoir-Rhyne University School of Theology Miller-Motte Technical CollegeNova Southeastern UniversityProfessional Golfers Career CollegeRemington College - Mobile Campus, Inc.Saint Leo UniversitySavannah College of Art and DesignSoutheastern InstituteSouth UniversitySpringfield CollegeStrayer UniversityTroy UniversityUniversity of PhoenixVirginia CollegeEdward Via College of Osteopathic Medicine (VCOM)Webster University
SC Independent and Private Institutions and Other Licensed Postsecondary Degree-Granting Institutions
Independent Institutions: Chartered by SC Secretary of State prior to 1953 and exempt from licensing 1/28/2015
15
2014 SC Higher Education Abstract For Frequently Used Higher Education Acronyms and a Glossary of Higher Education Terms, pp. 136-138 & 141-145
1/28/2015
Higher Education is of Increasing Importance and Value!
Workforce for a successful economy Innovation for Quality of Life Better Citizenry
16 1/28/2015
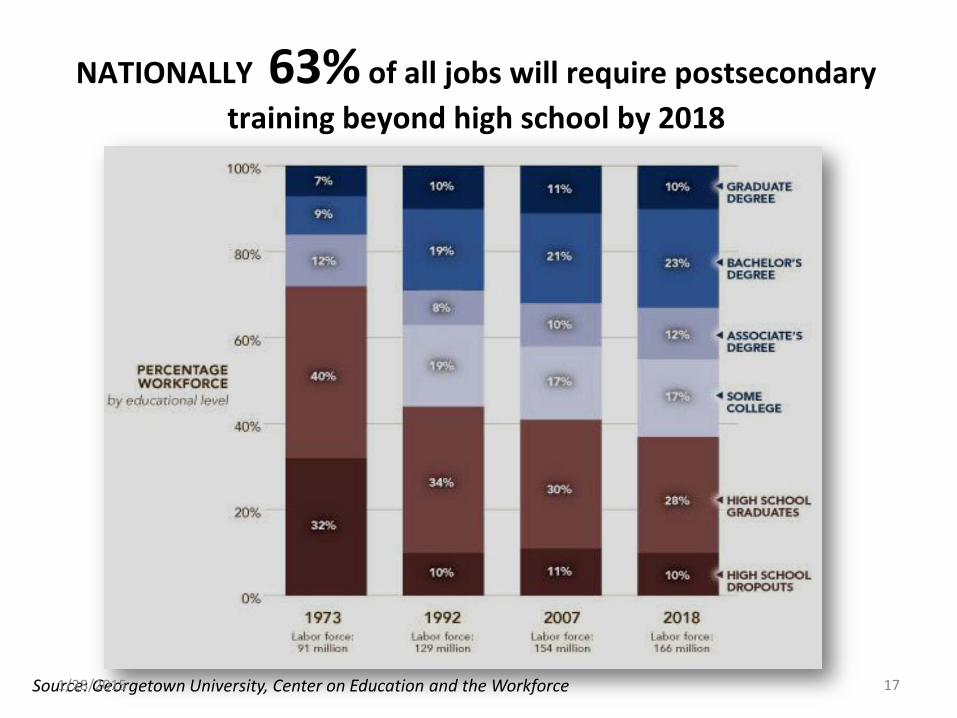
Source: Georgetown University, Center on Education and the Workforce
NATIONALLY 63% of all jobs will require postsecondary training beyond high school by 2018
17 1/28/2015
258,000
710,000
215,000
452,000
369,000
168,000
0%
10%
20%
30%
40%
50%
60%
70%
80%
90%
100%
2018 Jobs
Graduate Degree
Bachelor's Degree
Associate's Degree
Some College, No Degree
High School Graduates
High School Dropouts
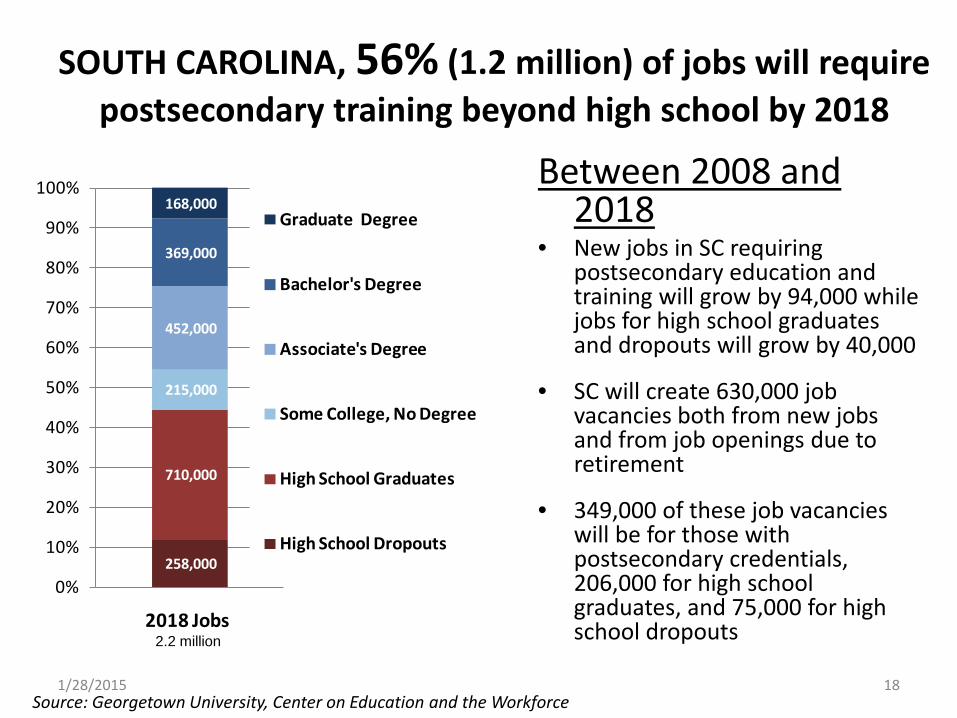
SOUTH CAROLINA, 56% (1.2 million) of jobs will require postsecondary training beyond high school by 2018
Between 2008 and 2018
• New jobs in SC requiring postsecondary education and training will grow by 94,000 while jobs for high school graduates and dropouts will grow by 40,000
• SC will create 630,000 job vacancies both from new jobs and from job openings due to retirement
• 349,000 of these job vacancies will be for those with postsecondary credentials, 206,000 for high school graduates, and 75,000 for high school dropouts
Source: Georgetown University, Center on Education and the Workforce
2.2 million
18 1/28/2015
19 1/28/2015
0.0
1.0
2.0
3.0
4.0
5.0
6.0
7.0
8.0
9.0
Billi
ons
Total Personal Income
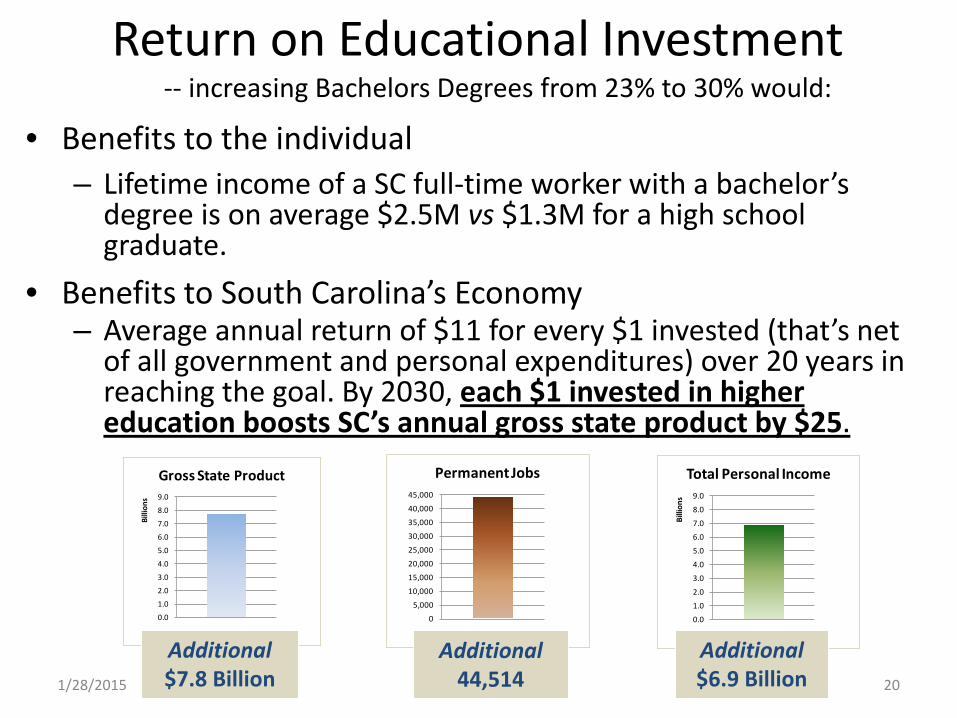
Return on Educational Investment -- increasing Bachelors Degrees from 23% to 30% would:
• Benefits to the individual – Lifetime income of a SC full-time worker with a bachelor’s
degree is on average $2.5M vs $1.3M for a high school graduate.
• Benefits to South Carolina’s Economy – Average annual return of $11 for every $1 invested (that’s net
of all government and personal expenditures) over 20 years in reaching the goal. By 2030, each $1 invested in higher education boosts SC’s annual gross state product by $25.
0
5,000
10,000
15,000
20,000
25,000
30,000
35,000
40,000
45,000
Permanent Jobs
0.0
1.0
2.0
3.0
4.0
5.0
6.0
7.0
8.0
9.0
Billi
ons
Gross State Product
Additional $6.9 Billion
Additional 44,514
Additional $7.8 Billion 20 1/28/2015

SC Higher Education Students
21 1/28/2015
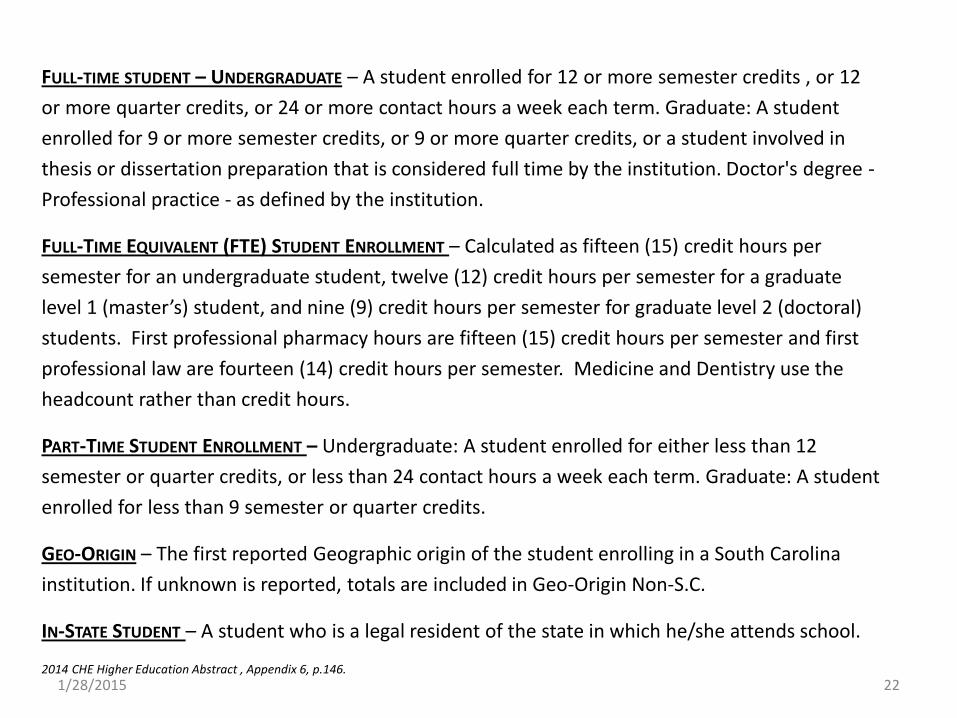
FULL-TIME STUDENT – UNDERGRADUATE – A student enrolled for 12 or more semester credits , or 12 or more quarter credits, or 24 or more contact hours a week each term. Graduate: A student enrolled for 9 or more semester credits, or 9 or more quarter credits, or a student involved in thesis or dissertation preparation that is considered full time by the institution. Doctor's degree - Professional practice - as defined by the institution.
FULL-TIME EQUIVALENT (FTE) STUDENT ENROLLMENT – Calculated as fifteen (15) credit hours per semester for an undergraduate student, twelve (12) credit hours per semester for a graduate level 1 (master’s) student, and nine (9) credit hours per semester for graduate level 2 (doctoral) students. First professional pharmacy hours are fifteen (15) credit hours per semester and first professional law are fourteen (14) credit hours per semester. Medicine and Dentistry use the headcount rather than credit hours.
PART-TIME STUDENT ENROLLMENT – Undergraduate: A student enrolled for either less than 12 semester or quarter credits, or less than 24 contact hours a week each term. Graduate: A student enrolled for less than 9 semester or quarter credits.
GEO-ORIGIN – The first reported Geographic origin of the student enrolling in a South Carolina institution. If unknown is reported, totals are included in Geo-Origin Non-S.C.
IN-STATE STUDENT – A student who is a legal resident of the state in which he/she attends school.
22 2014 CHE Higher Education Abstract , Appendix 6, p.146.
1/28/2015

Explanations and Changes in the Categories for Race/Ethnicity Reporting Note: New Definitions and reporting requirements to the federal government for race and ethnicity have been adopted in accordance with the final guidance issued by the U.S. Department of Education on October 19, 2007. These changes are necessary to implement the US Office of Management and Budget's (OMB) 1997 Standards for Maintaining, Collecting, and Presenting Federal Data on Race and Ethnicity. For more details on the changes, please see the following web site: http://nces.ed.gov/ipeds/reic/resource.asp.
Under the new guidelines, individuals may select an ethnicity and one or more races. The ethnicity choice is between Hispanic and not Hispanic. Hispanic is defined as a person of Cuban, Mexican, Puerto Rican, South or Central American, or Spanish culture or origin, regardless of race. To match Federal reporting guidelines, all who select Hispanic will be reported under this category and non-Hispanic individuals who select more than one race will be reported in the category titled Two or More Races. Those individuals who select non-Hispanic and a single race will be reported under the single race.
Under the new guidelines, all individuals who select Hispanic as their ethnicity will be reported here regardless of the race or races selected.
The new definition separates Asian, Native Hawaiian, and Other Pacific Islander. During the next few years as we transition between the old and new definitions, the data reported under the old definition of Asian or Pacific Islander will be included under Asian so that a mapping of the data from old definitions to new definitions can occur.
Non-Hispanics who select more than one race will be reported under the label Two or More Races.
23
Nonwhite defined as Hispanic, American Indian – Alaskan Native, Asian, Black – African American, Native Hawaiian – Pacific Islander, and Two or more Races.
2014 CHE Higher Education Abstract , Appendix 6, p.146.
1/28/2015
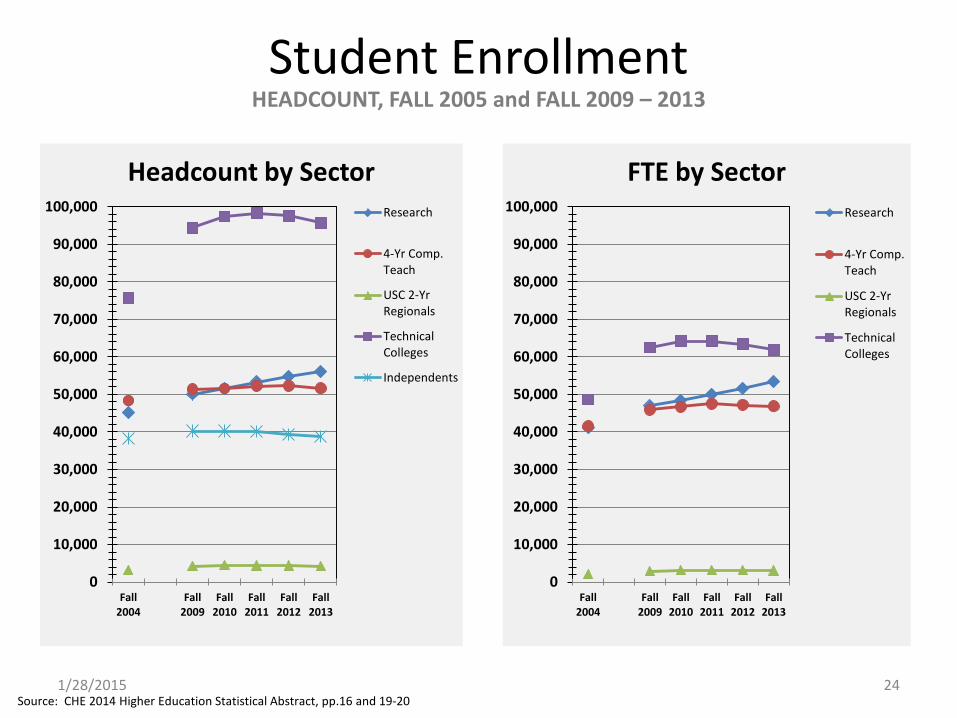
Student Enrollment
24
0
10,000
20,000
30,000
40,000
50,000
60,000
70,000
80,000
90,000
100,000
Fall2004
Fall2009
Fall2010
Fall2011
Fall2012
Fall2013
Headcount by Sector Research
4-Yr Comp.Teach
USC 2-YrRegionals
TechnicalColleges
Independents
Source: CHE 2014 Higher Education Statistical Abstract, pp.16 and 19-20
HEADCOUNT, FALL 2005 and FALL 2009 – 2013
0
10,000
20,000
30,000
40,000
50,000
60,000
70,000
80,000
90,000
100,000
Fall2004
Fall2009
Fall2010
Fall2011
Fall2012
Fall2013
FTE by Sector Research
4-Yr Comp.Teach
USC 2-YrRegionals
TechnicalColleges
1/28/2015
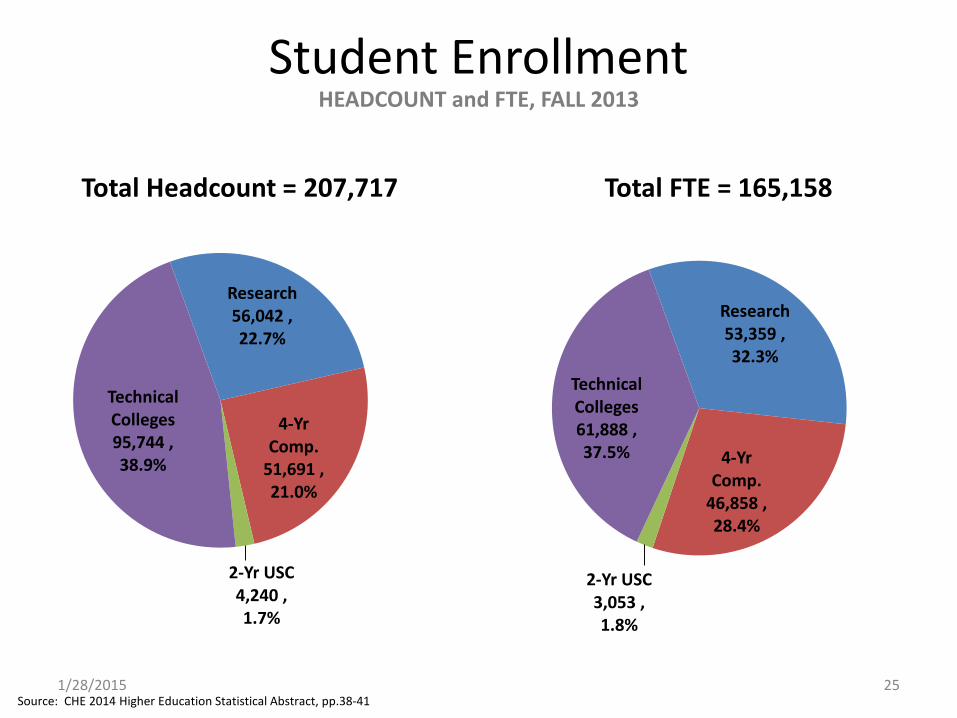
Student Enrollment
25 Source: CHE 2014 Higher Education Statistical Abstract, pp.38-41
HEADCOUNT and FTE, FALL 2013
Research 56,042 , 22.7%
4-Yr Comp.
51,691 , 21.0%
2-Yr USC 4,240 , 1.7%
Technical Colleges 95,744 , 38.9%
Total Headcount = 207,717
Research 53,359 , 32.3%
4-Yr Comp.
46,858 , 28.4%
2-Yr USC 3,053 , 1.8%
Technical Colleges 61,888 , 37.5%
Total FTE = 165,158
1/28/2015
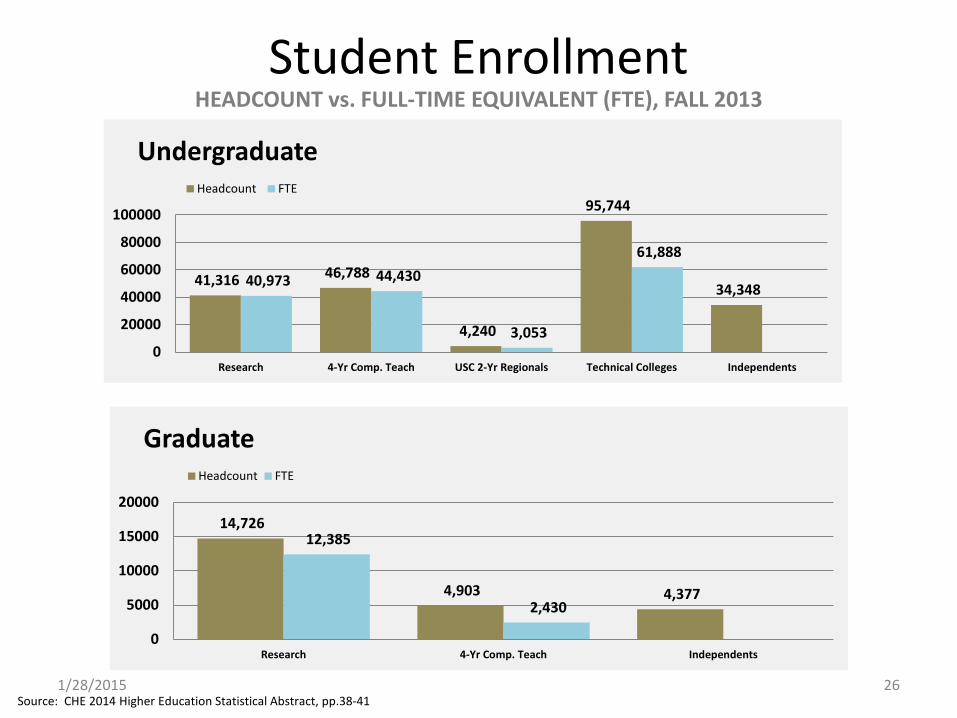
Student Enrollment
26
41,316 46,788
4,240
95,744
34,348 40,973 44,430
3,053
61,888
0
20000
40000
60000
80000
100000
Research 4-Yr Comp. Teach USC 2-Yr Regionals Technical Colleges Independents
Undergraduate Headcount FTE
Source: CHE 2014 Higher Education Statistical Abstract, pp.38-41
HEADCOUNT vs. FULL-TIME EQUIVALENT (FTE), FALL 2013
14,726
4,903 4,377
12,385
2,430
0
5000
10000
15000
20000
Research 4-Yr Comp. Teach Independents
Graduate Headcount FTE
1/28/2015
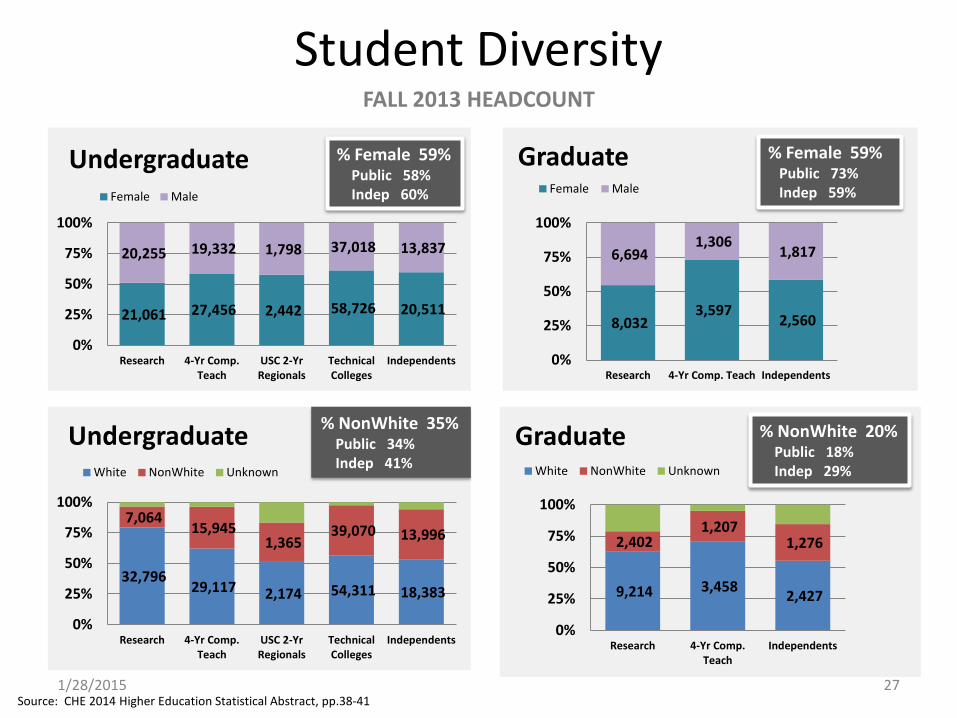
Student Diversity
27
21,061 27,456 2,442 58,726 20,511
20,255 19,332 1,798 37,018 13,837
0%
25%
50%
75%
100%
Research 4-Yr Comp.Teach
USC 2-YrRegionals
TechnicalColleges
Independents
Undergraduate Female Male
8,032 3,597
2,560
6,694 1,306
1,817
0%
25%
50%
75%
100%
Research 4-Yr Comp. Teach Independents
Graduate Female Male
% Female 59% Public 73% Indep 59%
32,796 29,117 2,174 54,311 18,383
7,064 15,945
1,365 39,070 13,996
0%
25%
50%
75%
100%
Research 4-Yr Comp.Teach
USC 2-YrRegionals
TechnicalColleges
Independents
Undergraduate White NonWhite Unknown
% NonWhite 35% Public 34% Indep 41%
9,214 3,458 2,427
2,402 1,207
1,276
0%
25%
50%
75%
100%
Research 4-Yr Comp.Teach
Independents
Graduate White NonWhite Unknown
Source: CHE 2014 Higher Education Statistical Abstract, pp.38-41
% Female 59% Public 58% Indep 60%
% NonWhite 20% Public 18% Indep 29%
FALL 2013 HEADCOUNT
1/28/2015
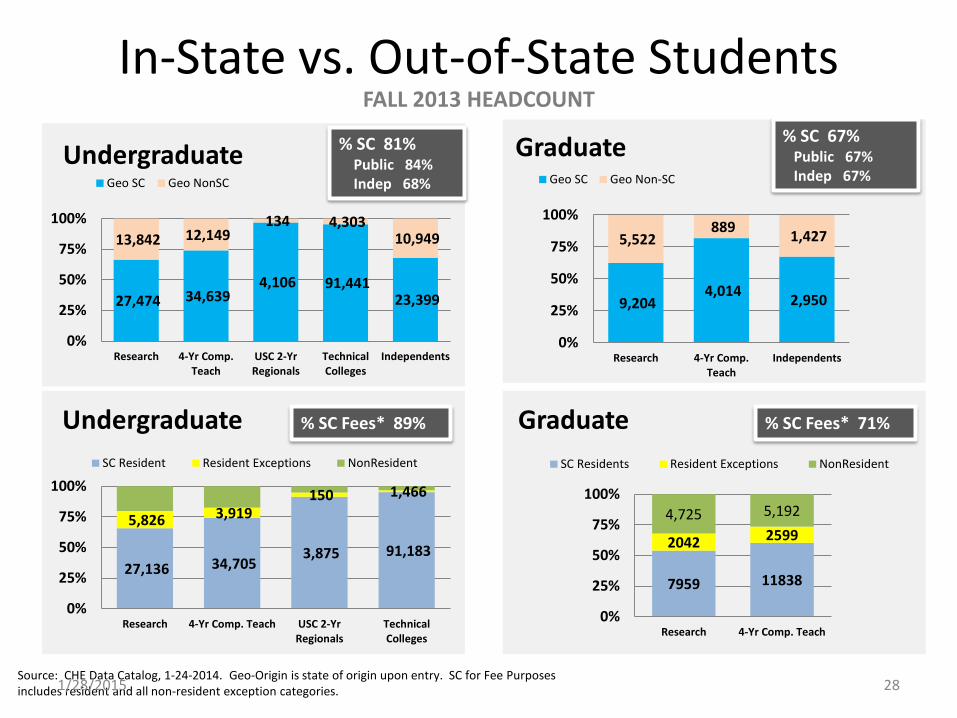
In-State vs. Out-of-State Students
28
27,474 34,639 4,106 91,441
23,399
13,842 12,149 134 4,303
10,949
0%
25%
50%
75%
100%
Research 4-Yr Comp.Teach
USC 2-YrRegionals
TechnicalColleges
Independents
Undergraduate Geo SC Geo NonSC
9,204 4,014 2,950
5,522 889 1,427
0%
25%
50%
75%
100%
Research 4-Yr Comp.Teach
Independents
Graduate Geo SC Geo Non-SC
% SC 67% Public 67% Indep 67%
27,136 34,705 3,875 91,183
5,826 3,919 150 1,466
0%
25%
50%
75%
100%
Research 4-Yr Comp. Teach USC 2-YrRegionals
TechnicalColleges
Undergraduate SC Resident Resident Exceptions NonResident
% SC Fees* 89%
7959 11838
2042 2599 4,725 5,192
0%
25%
50%
75%
100%
Research 4-Yr Comp. Teach
Graduate SC Residents Resident Exceptions NonResident
Source: CHE Data Catalog, 1-24-2014. Geo-Origin is state of origin upon entry. SC for Fee Purposes includes resident and all non-resident exception categories.
% SC 81% Public 84% Indep 68%
% SC Fees* 71%
FALL 2013 HEADCOUNT
1/28/2015

Certificate14%
Associates20%
Bachelors48%
Masters12%
Certificate
Diploma
Associates
Bachelors
Post Bach. Cert
Masters
Post Masters Cert
First Professional
Specialist
Doctorate
Degrees Awarded
29
Degrees Awarded - July 1 to June 30, 2012-13 % of Degrees Awarded by Type InstitutionPublic Independent Total Public Independent Total
Certificate 7,081 0 7,081 Certificate 100.0% 0.0% 100.0%Diploma 1,320 3 1,323 Diploma 99.8% 0.2% 100.0%Associates 9,516 484 10,000 Associates 95.2% 4.8% 100.0%Bachelors 17,220 6,364 23,584 Bachelors 73.0% 27.0% 100.0%Post Bach. Cert 83 9 92 Post Bach. Cert 90.2% 9.8% 100.0%Masters 4,568 1,321 5,889 Masters 77.6% 22.4% 100.0%Post Masters Cert 13 1 14 Post Masters Cert 92.9% 7.1% 100.0%First Professional 121 37 158 First Professional 76.6% 23.4% 100.0%Specialist 682 34 716 Specialist 95.3% 4.7% 100.0%Doctorate 700 101 801 Doctorate 87.4% 12.6% 100.0%Total 41,304 8,354 49,658 Total 83.2% 16.8% 100.0%
1/28/2015

Degrees Awarded
30 0% 25% 50% 75% 100%
Certificate
Diploma
Associate
Bachelor's
Post-Bachelors
Masters
Post-Master's
Specialist
Doctor's Research/Scholarship
Doctor'sProfessional…
By Degree-Level and Race Ethnicity
White African AmericanHispanic Amer Ind/ Alaskan Nat.Asian Nat Hawaiian/ Other PITwo or More Races NonRes AlienUnknown
Source: CHE 2014 Higher Education Statistical Abstract, pp.65
2012-13 HEADCOUNT 27% of Degrees Awarded to NonWhite
3,890
1,083
6,308
13,790
74
3,673
13
119
381
402
3,191
240
3,692
9,794
18
2,216
1
39
335
399
0% 25% 50% 75% 100%
Certificate
Diploma1
Associate
Bachelor's
Post-Bachelors
Masters
Post-Master's
Specialist
Doctor's Research/Scholarship
Doctor'sProfessional Practice
By Degree Level and Gender
Female Male
60% of Degrees Awarded to Females
1/28/2015

31
0.0%
0.0%
0.1%
0.2%
0.3%
0.4%
0.4%
0.6%
0.7%
0.7%
1.1%
1.1%
1.1%
1.2%
1.2%
1.7%
1.7%
2.0%
2.5%
2.5%
3.1%
3.5%
4.4%
4.5%
5.1%
6.0%
7.3%
7.5%
8.3%
8.6%
22.4%
0.0% 5.0% 10.0% 15.0% 20.0% 25.0%
Science Technologies/Technicians
Transportation and Materials Moving
Legal Professions and Studies
Area, Ethnic, Cultural, Gender, and Group Studies
Architecture and Related Services
Engineering Technologies and Engineering-Related…
Natural Resources and Conservation
Multi/Interdisciplinary Studies
Philosophy and Religious Studies
Family and Consumer Sciences/Human Sciences
Public Administration and Social Service Professions
Mathematics and Statistics
Theology and Religious Vocations
Agriculture, Agriculture Operations, and Related…
Foreign Languages, Literatures, and Linguistics
Physical Science
Computer and Information Sciences and Support…
Liberal Arts and Sciences, General Studies and…
Homeland Security, Law Enforcement, Firefighting and…
History
English Language and Literature/Letters
Parks, Recreation, Leisure, and Fitness Studies
Engineering
Communication, Journalism, and Related Programs
Visual and Performing Arts
Psychology
Social Sciences
Health Professions and Related Programs
Education
Biological and Biomedical Sciences
Business, Management, Marketing, and Related…
Public and Independent Institutions Bachelor’s Degrees Awarded
by Discipline
2012-13
23,854 Total Degrees Awarded
1/28/2015
32 1/28/2015
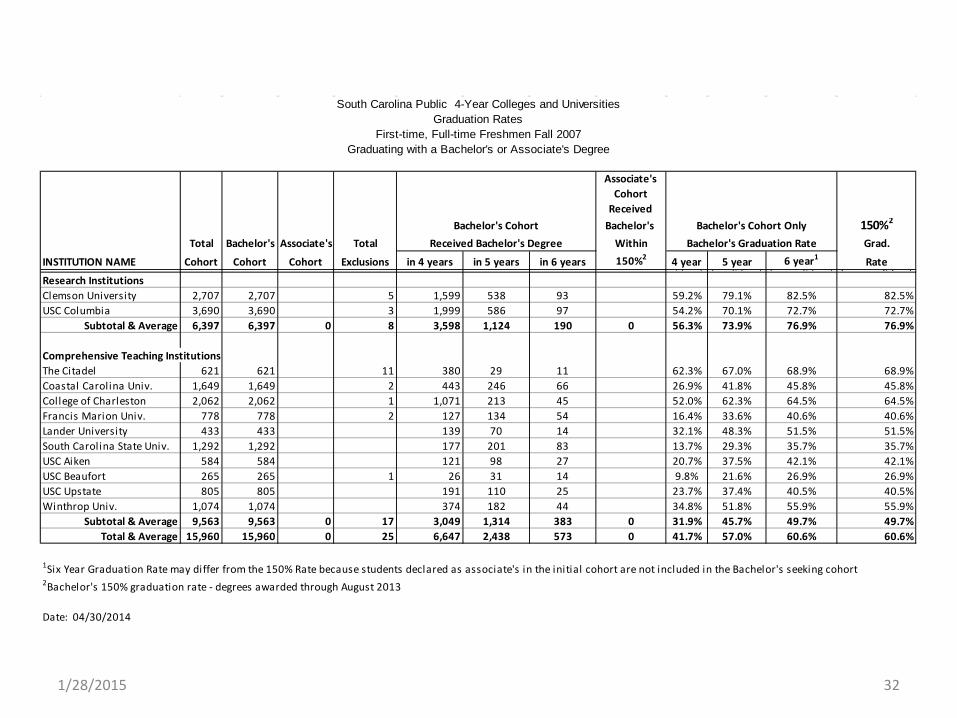
South Carolina Public 4-Year Colleges and UniversitiesGraduation Rates
First-time, Full-time Freshmen Fall 2007Graduating with a Bachelor's or Associate's Degree
Associate's Cohort
ReceivedBachelor's Cohort Bachelor's Bachelor's Cohort Only 150%2
Total Bachelor's Associate's Total Received Bachelor's Degree Within Bachelor's Graduation Rate Grad.
INSTITUTION NAME Cohort Cohort Cohort Exclusions in 4 years in 5 years in 6 years 150%2 4 year 5 year 6 year1 Rate col G col H col I F/( ) (F G)/( ) (F G H)/( ) (F G H I)/(C )Research InstitutionsClemson University 2,707 2,707 5 1,599 538 93 59.2% 79.1% 82.5% 82.5%USC Columbia 3,690 3,690 3 1,999 586 97 54.2% 70.1% 72.7% 72.7%
Subtotal & Average 6,397 6,397 0 8 3,598 1,124 190 0 56.3% 73.9% 76.9% 76.9%
Comprehensive Teaching InstitutionsThe Citadel 621 621 11 380 29 11 62.3% 67.0% 68.9% 68.9%Coastal Carolina Univ. 1,649 1,649 2 443 246 66 26.9% 41.8% 45.8% 45.8%College of Charleston 2,062 2,062 1 1,071 213 45 52.0% 62.3% 64.5% 64.5%Francis Marion Univ. 778 778 2 127 134 54 16.4% 33.6% 40.6% 40.6%Lander University 433 433 139 70 14 32.1% 48.3% 51.5% 51.5%South Carolina State Univ. 1,292 1,292 177 201 83 13.7% 29.3% 35.7% 35.7%USC Aiken 584 584 121 98 27 20.7% 37.5% 42.1% 42.1%USC Beaufort 265 265 1 26 31 14 9.8% 21.6% 26.9% 26.9%USC Upstate 805 805 191 110 25 23.7% 37.4% 40.5% 40.5%Winthrop Univ. 1,074 1,074 374 182 44 34.8% 51.8% 55.9% 55.9%
Subtotal & Average 9,563 9,563 0 17 3,049 1,314 383 0 31.9% 45.7% 49.7% 49.7%Total & Average 15,960 15,960 0 25 6,647 2,438 573 0 41.7% 57.0% 60.6% 60.6%
1Six Year Graduation Rate may differ from the 150% Rate because students declared as associate's in the initial cohort are not included in the Bachelor's seeking cohort2Bachelor's 150% graduation rate - degrees awarded through August 2013
Date: 04/30/2014

33
IPEDS Graduation Rates and Success Rates5 for Fall 2013of First-time, Full-time Degree-Seeking Undergraduates for the 2-year Institutions
------------------------Summary of IPEDS Graduation Rates ------------------------ Additional3 Additional4
Allowable Completers in 150% CHEMIS2 Transfers CHEMIS Transfers Exclusions of normal time 150% Students that Reported by Total Students still Included as Total Students
Initial from Sec. III Final 11A, Sec III 12A, Sec III Graduation transferred the Students that Enrolled at same still enrolled Students Success Non-Compl 150%2010 Cohort Part C, ln 45 Cohort Cert/Dipl Assoc Total Rate within SC Institution Transferred Inst-Fall 2013 at Same Inst Still Enrolled Rate /Not Enrolled
(c) (d) e=c-d (f) (g) h=f-g i=h/e (k) (l) m=k+l (n) (o) p=n-o (h+m+p)/e r=e-h-m-pTwo-Year Regional Campuses of USC
USC-Lancaster 352 352 55 55 15.6% 134 134 18 18 58.8% 145USC-Salkehatchie 230 230 55 55 23.9% 48 48 3 3 46.1% 124USC-Sumter 243 243 34 34 14.0% 125 125 5 5 67.5% 79USC-Union 75 75 22 22 29.3% 16 16 5 5 57.3% 32TOTAL 900 0 900 0 166 166 18.4% 323 0 323 31 0 31 57.8% 380
Technical Colleges1
Aiken 491 491 6 40 46 9.4% 53 0 53 91 0 91 38.7% 301Central Carolina 543 543 28 32 60 11.0% 39 0 39 84 0 84 33.7% 360Denmark 263 263 19 40 59 22.4% 34 0 34 18 0 18 42.2% 152Florence-Darlington 915 915 29 77 106 11.6% 89 0 89 151 0 151 37.8% 569Greenville 1,748 1,748 81 72 153 8.8% 251 171 422 265 5 260 47.8% 913Horry-Georgetown 772 772 19 117 136 17.6% 114 51 165 124 124 55.1% 347Midlands 1,573 1,573 44 111 155 9.9% 293 123 416 224 3 221 50.3% 781Northeastern 223 223 2 30 32 14.3% 24 0 24 28 28 37.7% 139Orangeburg-Calhoun 413 413 4 38 42 10.2% 45 45 59 59 35.4% 267Piedmont 707 707 7 86 93 13.2% 45 45 90 147 147 46.7% 377Spartanburg 897 897 26 79 105 11.7% 68 89 157 128 5 123 42.9% 512T.C. of the Lowcountry 234 234 7 16 23 9.8% 21 41 62 24 2 22 45.7% 127Tri-County 1,708 1,708 21 196 217 12.7% 611 121 732 165 4 161 65.0% 598Trident 2,004 2,004 58 143 201 10.0% 180 215 395 381 26 355 47.5% 1,053Williamsburg 106 106 1 7 8 7.5% 16 16 5 5 27.4% 77York 904 904 18 91 109 12.1% 84 60 144 126 8 118 41.0% 533TOTAL 13,501 0 13,501 370 1,175 1,545 11.4% 1,967 916 2,883 2,020 53 1,967 47.4% 7,106
1Includes Certificate, Diploma, & Associate Degree Seekers2This data is is based on the information available on the SC CHEMIS system only.3Institutions have the opportunity to provide additional data on students who have transferred to institutions that are not included on the CHEMIS system (Based on Data received from SCTCS).4Additional Transfers resulted in changes of retained numbers.
5“Success Rate” is defined as the “GRS Rate Plus.” The Graduation Rate Survey (GRS) defines the cohort of students to be included each year as the first-time, full-time, degree seeking students entering an institution each fall.The GRS rate is calculated on the percentage of a cohort graduating withing 150% of normal program time. The Success Rate, in addition to the graduates, includes those students whoas of 150% of program time have transferred to another institution or those students who have continued to be enrolled the term following 150% of program time.Updated on 6/20/2014
1/28/2015
34
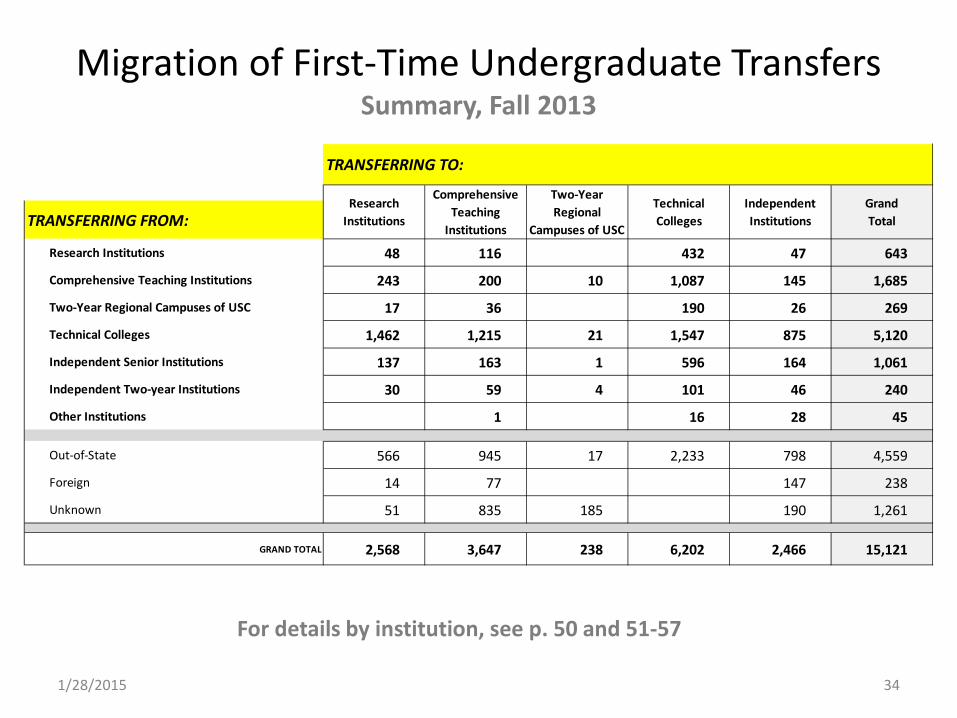
TRANSFERRING FROM:
Research Institutions 48 116 432 47 643
Comprehensive Teaching Institutions 243 200 10 1,087 145 1,685
Two-Year Regional Campuses of USC 17 36 190 26 269
Technical Colleges 1,462 1,215 21 1,547 875 5,120
Independent Senior Institutions 137 163 1 596 164 1,061
Independent Two-year Institutions 30 59 4 101 46 240
Other Institutions 1 16 28 45
Out-of-State 566 945 17 2,233 798 4,559
Foreign 14 77 147 238
Unknown 51 835 185 190 1,261
GRAND TOTAL 2,568 3,647 238 6,202 2,466 15,121
TRANSFERRING TO:
ResearchInstitutions
Comprehensive Teaching
Institutions
Two-Year Regional
Campuses of USC
Technical Colleges
IndependentInstitutions
GrandTotal
Migration of First-Time Undergraduate Transfers Summary, Fall 2013
For details by institution, see p. 50 and 51-57
1/28/2015
Tuition and Required Fees History
• CHE has no role in setting tuition and fees • Collects information from colleges and
universities and publishes annual report by – institution – sector – in-state vs. out-of-state – undergraduate/graduate/professional – five- and ten-year tuition histories – detailed information about dedicated uses of tuition
and required fees
35 1/28/2015

36
$-
$2,000
$4,000
$6,000
$8,000
$10,000
$12,000
$14,000
2005-06 2006-07 2007-08 2008-09 2009-10 2010-11 2011-12 2012-13 2013-14 2014-15 Research (excl MUSC) $8,100 $8,604 $9,108 $9,723 $10,117 $10,820 $11,236 $11,581 $11,935 $12,302 Four-Year Colleges & Univ. $6,592 $7,197 $7,642 $8,338 $8,725 $9,283 $9,605 $9,858 $10,177 $10,511Two-Year USC Campuses $4,324 $4,652 $4,868 $5,264 $5,528 $5,864 $6,092 $6,284 $6,482 $6,686Technical Colleges $2,834 $2,956 $3,045 $3,162 $3,297 $3,436 $3,535 $3,629 $3,727 $3,839
In-State Undergraduate Tuition and Required Fees
$-
$5,000
$10,000
$15,000
$20,000
$25,000
$30,000
$35,000
2005-06 2006-07 2007-08 2008-09 2009-10 2010-11 2011-12 2012-13 2013-14 2014-15 Research (excl MUSC) $18,733 $20,030 $21,716 $23,269 $24,560 $26,391 $27,407 $28,622 $29,508 $30,451 Four-Year Colleges & Univ. $13,911 $14,940 $16,005 $17,257 $18,154 $19,379 $20,338 $21,022 $21,863 $22,602Two-Year USC Campuses $10,384 $11,228 $11,780 $12,680 $13,304 $14,144 $14,696 $15,158 $15,632 $16,130Technical Colleges $5,627 $5,895 $6,113 $6,370 $6,700 $6,920 $7,092 $7,231 $7,416 $7,621
Out-of-State Undergraduate Tuition and Required Fees
Out-of-State T&F 1-year change
10-yr change
Research (excl MUSC) 3.2% 57.5% Four-Year Colleges & Univ. 3.4% 57.2%Two-Year USC Campuses 3.2% 50.5%Technical Colleges 2.8% 31.8%
In-State T&F 1-year change
10-yr change
Research (excl MUSC) 3.1% 47.3% Four-Year Colleges & Univ. 3.3% 54.4%Two-Year USC Campuses 3.1% 49.9%Technical Colleges 3.0% 31.5%
Tuition is an amount of money charged to students for instructional services. (IPEDS)
Required Fees are fixed sums charged to students for items not covered by tuition and required of such a large percentage of students that the student who does not pay the charge is an exception. (IPEDS)
Institutions use T&F revenues to support instruction, research, public service, libraries, student services, physical plant, facilities, operation and maintenance, and administration. State funds are also provided to support the portion of these costs associated with the education of in-state students.
Tuition and Required Fees by Academic Year
1/28/2015
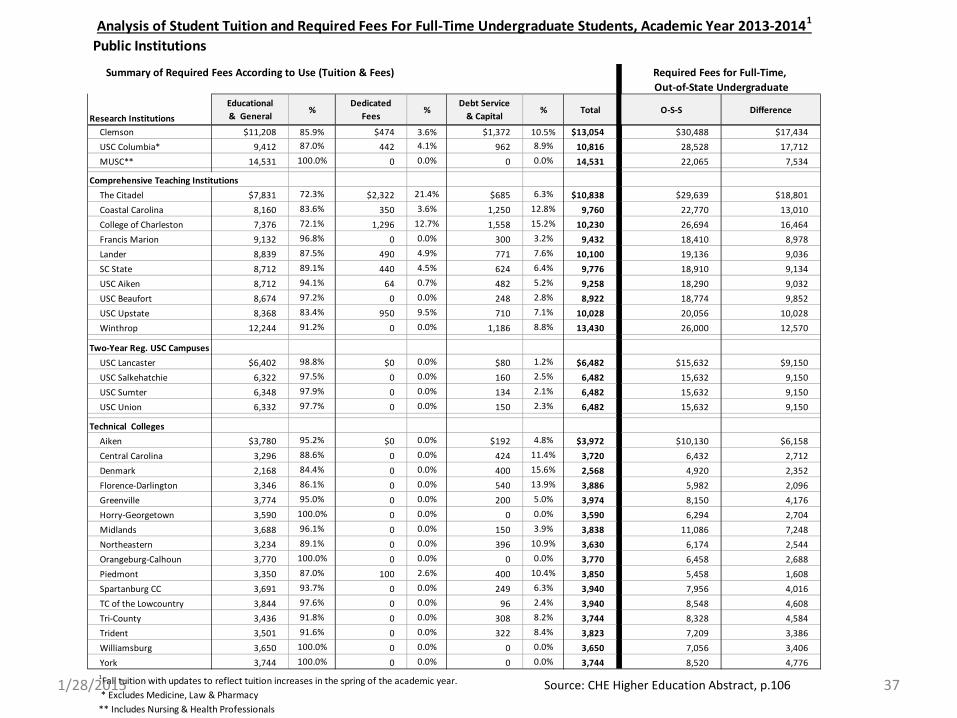
37
Analysis of Student Tuition and Required Fees For Full-Time Undergraduate Students, Academic Year 2013-20141
Public Institutions
Summary of Required Fees According to Use (Tuition & Fees) Required Fees for Full-Time, Out-of-State Undergraduate
Research Institutions
Educational& General
%Dedicated
Fees%
Debt Service& Capital
% Total O-S-S Difference
Clemson $11,208 85.9% $474 3.6% $1,372 10.5% $13,054 $30,488 $17,434USC Columbia* 9,412 87.0% 442 4.1% 962 8.9% 10,816 28,528 17,712MUSC** 14,531 100.0% 0 0.0% 0 0.0% 14,531 22,065 7,534
Comprehensive Teaching InstitutionsThe Citadel $7,831 72.3% $2,322 21.4% $685 6.3% $10,838 $29,639 $18,801Coastal Carolina 8,160 83.6% 350 3.6% 1,250 12.8% 9,760 22,770 13,010College of Charleston 7,376 72.1% 1,296 12.7% 1,558 15.2% 10,230 26,694 16,464Francis Marion 9,132 96.8% 0 0.0% 300 3.2% 9,432 18,410 8,978Lander 8,839 87.5% 490 4.9% 771 7.6% 10,100 19,136 9,036SC State 8,712 89.1% 440 4.5% 624 6.4% 9,776 18,910 9,134USC Aiken 8,712 94.1% 64 0.7% 482 5.2% 9,258 18,290 9,032USC Beaufort 8,674 97.2% 0 0.0% 248 2.8% 8,922 18,774 9,852USC Upstate 8,368 83.4% 950 9.5% 710 7.1% 10,028 20,056 10,028Winthrop 12,244 91.2% 0 0.0% 1,186 8.8% 13,430 26,000 12,570
Two-Year Reg. USC CampusesUSC Lancaster $6,402 98.8% $0 0.0% $80 1.2% $6,482 $15,632 $9,150USC Salkehatchie 6,322 97.5% 0 0.0% 160 2.5% 6,482 15,632 9,150USC Sumter 6,348 97.9% 0 0.0% 134 2.1% 6,482 15,632 9,150USC Union 6,332 97.7% 0 0.0% 150 2.3% 6,482 15,632 9,150
Technical CollegesAiken $3,780 95.2% $0 0.0% $192 4.8% $3,972 $10,130 $6,158Central Carolina 3,296 88.6% 0 0.0% 424 11.4% 3,720 6,432 2,712Denmark 2,168 84.4% 0 0.0% 400 15.6% 2,568 4,920 2,352Florence-Darlington 3,346 86.1% 0 0.0% 540 13.9% 3,886 5,982 2,096Greenville 3,774 95.0% 0 0.0% 200 5.0% 3,974 8,150 4,176Horry-Georgetown 3,590 100.0% 0 0.0% 0 0.0% 3,590 6,294 2,704Midlands 3,688 96.1% 0 0.0% 150 3.9% 3,838 11,086 7,248Northeastern 3,234 89.1% 0 0.0% 396 10.9% 3,630 6,174 2,544Orangeburg-Calhoun 3,770 100.0% 0 0.0% 0 0.0% 3,770 6,458 2,688Piedmont 3,350 87.0% 100 2.6% 400 10.4% 3,850 5,458 1,608Spartanburg CC 3,691 93.7% 0 0.0% 249 6.3% 3,940 7,956 4,016TC of the Lowcountry 3,844 97.6% 0 0.0% 96 2.4% 3,940 8,548 4,608Tri-County 3,436 91.8% 0 0.0% 308 8.2% 3,744 8,328 4,584Trident 3,501 91.6% 0 0.0% 322 8.4% 3,823 7,209 3,386Williamsburg 3,650 100.0% 0 0.0% 0 0.0% 3,650 7,056 3,406York 3,744 100.0% 0 0.0% 0 0.0% 3,744 8,520 4,776
1Fall tuition with updates to reflect tuition increases in the spring of the academic year. * Excludes Medicine, Law & Pharmacy ** Includes Nursing & Health Professionals
Source: CHE Higher Education Abstract, p.106 1/28/2015

Determination of residency for tuition and fee purposes is in accordance with South Carolina Code of Laws § 59-112-10 et seq and State Regulation 62-600 through 62-612.
South Carolina provides for limited legal exceptions that allow some non-residents to qualify for in-state fees. For students in the following categories, the out-of-state tuition differential is waived due to the state law and students pay in-state rates. These exceptions include the following:
1) military personnel and their dependents assigned to duty in South Carolina [§59-112-50(A), R.62-609(A)(1)];
2) faculty/staff employed by SC public higher education institutions and their dependents [§59-112-60(A), R.62-609(A)(2)];
3) retirees and their dependents who reside in SC and have been domiciled in SC for less than 12 months and maintain a South Carolina residence [R.62-609(A)(4)];
4) full-time employees in SC and their dependents who have taken all steps to establish residency but who have not yet resided in South Carolina for the requisite 12 months [§59-112-20(B), R.62-609(A)(3);
5) students participating in the reciprocal SREB Academic Common Market program whereby students may take programs not available in their state but offered in another state within the region at the in-state rate [R.62-609(B)];
6) students from regions in established reciprocal tuition agreements which enable in-state tuition and fee reciprocity [§59-112-20(E), §59-112-70(A)(B)(C), §59-112-110, §59-112-120, §59-125-95 and 59-112-140 ]; and
7) non-resident aliens in approved VISA classifications once they have been awarded permanent resident status and meet statutory provisions for residency and domiciliary[R.62-604(A)]. 38
DETERMINATION OF RATES OF TUITION & FEES – RESIDENCY EXCEPTIONS
1/28/2015

In addition to the exceptions listed on prior slide for tuition and fee purposes, state law allows all public colleges and universities to
– adopt policies to waive some or all of the out-of-state tuition rates for those nonresident students who receive scholarship aid. [§59-112-70(A)]
– offer educational fee waivers to no more than four percent of the undergraduate student body (resident and nonresident). [§59-101-620] and
– a public institution of higher learning with a law school may offer fee waivers to no more than four percent of the law school student body. This waiver does not affect the capacity of the fee waivers for four percent of the undergraduate student body. This waiver must not be applied to fees for out-of-state students. (§59-112-130)
– Free tuition is provided regardless of residency for certain children of veterans are eligible for free tuition (59-111-20) as are children of fireman, law enforcement or government employees killed or totally disabled in line of duty (§59-111-110).
(NOTE: General information on tuition and fees and other provisions may apply.)
39
Waivers
NOTE: Recently passed Federal Choice Act of 2014 will compel SC to adopt a new exception to enable in-state tuition rates for certain eligible discharged members of the service on GI Bill/Montgomery Bill Benefits. Fiscal Implications. 1/28/2015
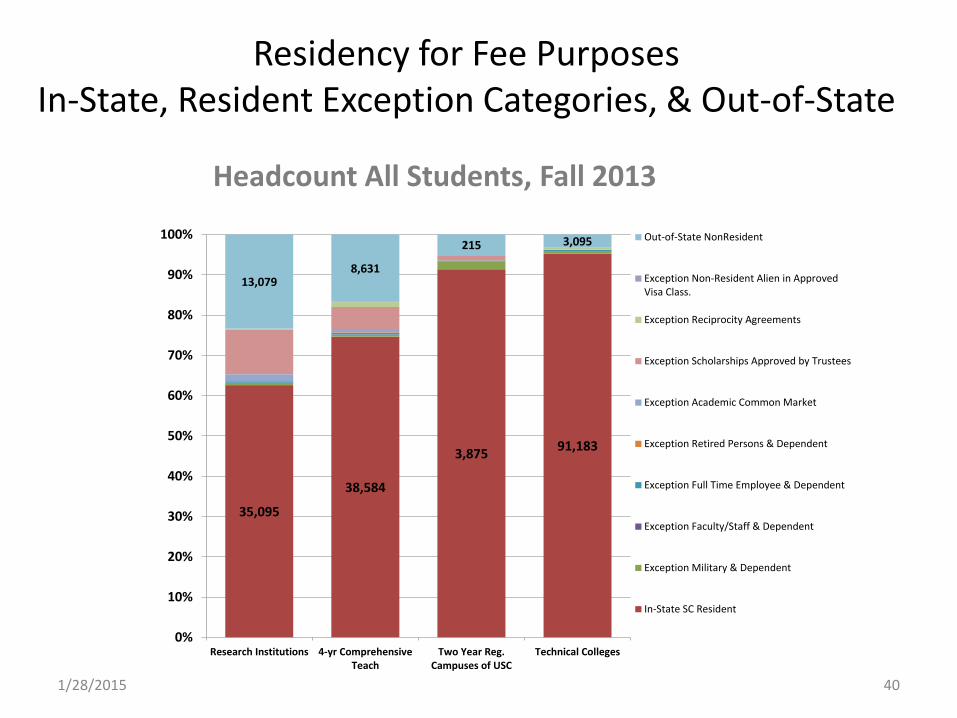
Residency for Fee Purposes In-State, Resident Exception Categories, & Out-of-State
40
Headcount All Students, Fall 2013
35,095
38,584
3,875 91,183
13,0798,631
215 3,095
0%
10%
20%
30%
40%
50%
60%
70%
80%
90%
100%
Research Institutions 4-yr ComprehensiveTeach
Two Year Reg.Campuses of USC
Technical Colleges
Out-of-State NonResident
Exception Non-Resident Alien in ApprovedVisa Class.
Exception Reciprocity Agreements
Exception Scholarships Approved by Trustees
Exception Academic Common Market
Exception Retired Persons & Dependent
Exception Full Time Employee & Dependent
Exception Faculty/Staff & Dependent
Exception Military & Dependent
In-State SC Resident
1/28/2015

“4%” Tuition Waiver SC Code of Laws, §59-101-620. Educational fee waivers. A public institution of higher learning may offer educational fee waivers to no more than four percent of the undergraduate student body.
SC Code of Laws, §59-112-130. Institutions with law schools; fee waivers. A public institution of higher learning with a law school may offer fee waivers to no more than four percent of the law school student body. This waiver does not affect the capacity of the fee waivers for four percent of the undergraduate student body. This waiver must not be applied to fees for out-of-state students.
41
Unlike other forms of student financial aid, CHE has no oversight authority or data collection mandate for waivers
Many states have specified policy objectives (e.g., athletics, international students, etc.) and central allocation of these resources
1/28/2015

Scholarships & Grants
42 1/28/2015

43
The Student must:
1) 1. Be a US citizen/legal permanent resident;
2) 2. Be a SC resident;
3) 3. Be enrolled as a degree-seeking student at an eligible SC public or independent institution;
4) 4. Not owe a refund or repayment on any State or Federal financial aid and not be in default on a Federal student loan; and
5) 5. Certify that he/she has never been convicted of any felonies (not required for Lottery Tuition Assistance) and has not been convicted of any second or subsequent alcohol and/or drug-related misdemeanors within the past academic year.
Scholarships and grants are forms of financial aid that help students pay for postsecondary education. Unlike student loans, scholarships and grants do not have to be repaid. Over the years, millions of dollars in scholarships and grants have been awarded to eligible students attending South Carolina public and independent colleges. The state provides financial assistance to eligible students in the form of need-based, merit-based, and other financial aid. In South Carolina, students may be eligible to receive one of the three statewide, merit-based scholarships: Palmetto Fellows Scholarship, Legislative Incentives for Future Excellence (LIFE) Scholarship, or SC HOPE Scholarship. Additional funding is available for enhancements to the LIFE Scholarship and Palmetto Fellows Scholarship based on declared majors in approved mathematics and science programs. Please be aware that the information provided is subject to change and updates are made as necessary. For the most up-to-date information, visit the Commission’s web site at www.che.sc.gov.
General Eligibility Requirements for all State Scholarships and Grants.
SC Undergraduate Student Financial Aid Scholarships and Grants
1/28/2015
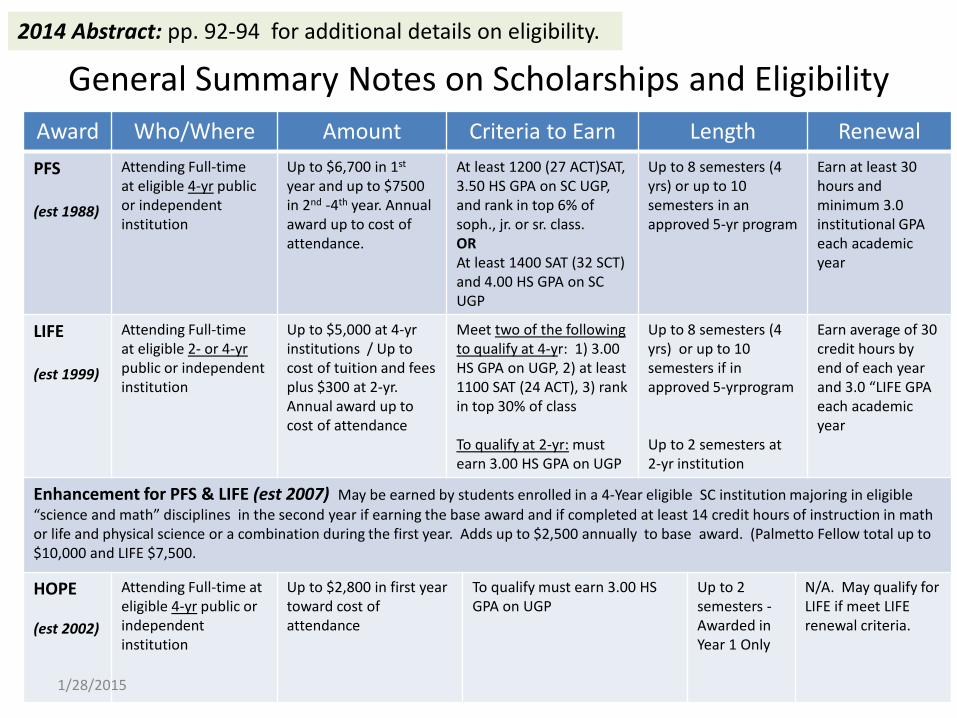
General Summary Notes on Scholarships and Eligibility
44
Award Who/Where Amount Criteria to Earn Length Renewal PFS (est 1988)
Attending Full-time at eligible 4-yr public or independent institution
Up to $6,700 in 1st year and up to $7500 in 2nd -4th year. Annual award up to cost of attendance.
At least 1200 (27 ACT)SAT, 3.50 HS GPA on SC UGP, and rank in top 6% of soph., jr. or sr. class. OR At least 1400 SAT (32 SCT) and 4.00 HS GPA on SC UGP
Up to 8 semesters (4 yrs) or up to 10 semesters in an approved 5-yr program
Earn at least 30 hours and minimum 3.0 institutional GPA each academic year
LIFE (est 1999)
Attending Full-time at eligible 2- or 4-yr public or independent institution
Up to $5,000 at 4-yr institutions / Up to cost of tuition and fees plus $300 at 2-yr. Annual award up to cost of attendance
Meet two of the following to qualify at 4-yr: 1) 3.00 HS GPA on UGP, 2) at least 1100 SAT (24 ACT), 3) rank in top 30% of class To qualify at 2-yr: must earn 3.00 HS GPA on UGP
Up to 8 semesters (4 yrs) or up to 10 semesters if in approved 5-yrprogram Up to 2 semesters at 2-yr institution
Earn average of 30 credit hours by end of each year and 3.0 “LIFE GPA each academic year
Enhancement for PFS & LIFE (est 2007) May be earned by students enrolled in a 4-Year eligible SC institution majoring in eligible “science and math” disciplines in the second year if earning the base award and if completed at least 14 credit hours of instruction in math or life and physical science or a combination during the first year. Adds up to $2,500 annually to base award. (Palmetto Fellow total up to $10,000 and LIFE $7,500.
HOPE (est 2002)
Attending Full-time at eligible 4-yr public or independent institution
Up to $2,800 in first year toward cost of attendance
To qualify must earn 3.00 HS GPA on UGP
Up to 2 semesters - Awarded in Year 1 Only
N/A. May qualify for LIFE if meet LIFE renewal criteria.
2014 Abstract: pp. 92-94 for additional details on eligibility.
1/28/2015
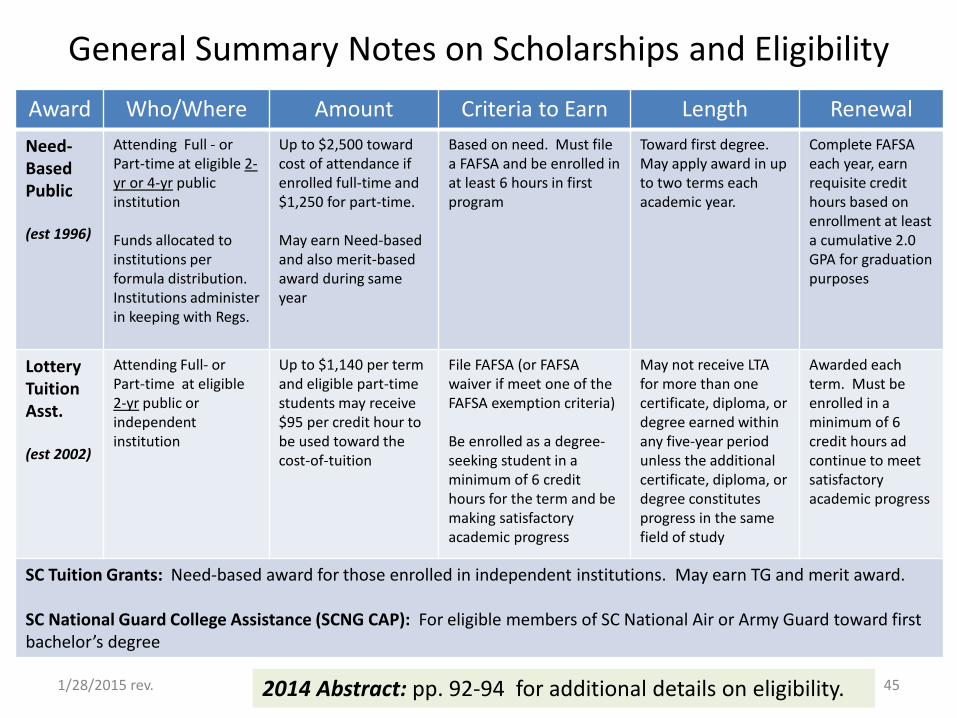
General Summary Notes on Scholarships and Eligibility
45
Award Who/Where Amount Criteria to Earn Length Renewal Need-Based Public (est 1996)
Attending Full - or Part-time at eligible 2-yr or 4-yr public institution Funds allocated to institutions per formula distribution. Institutions administer in keeping with Regs.
Up to $2,500 toward cost of attendance if enrolled full-time and $1,250 for part-time. May earn Need-based and also merit-based award during same year
Based on need. Must file a FAFSA and be enrolled in at least 6 hours in first program
Toward first degree. May apply award in up to two terms each academic year.
Complete FAFSA each year, earn requisite credit hours based on enrollment at least a cumulative 2.0 GPA for graduation purposes
Lottery Tuition Asst. (est 2002)
Attending Full- or Part-time at eligible 2-yr public or independent institution
Up to $1,140 per term and eligible part-time students may receive $95 per credit hour to be used toward the cost-of-tuition
File FAFSA (or FAFSA waiver if meet one of the FAFSA exemption criteria) Be enrolled as a degree-seeking student in a minimum of 6 credit hours for the term and be making satisfactory academic progress
May not receive LTA for more than one certificate, diploma, or degree earned within any five-year period unless the additional certificate, diploma, or degree constitutes progress in the same field of study
Awarded each term. Must be enrolled in a minimum of 6 credit hours ad continue to meet satisfactory academic progress
SC Tuition Grants: Need-based award for those enrolled in independent institutions. May earn TG and merit award. SC National Guard College Assistance (SCNG CAP): For eligible members of SC National Air or Army Guard toward first bachelor’s degree
2014 Abstract: pp. 92-94 for additional details on eligibility. 1/28/2015 rev.

Lottery Appropriations for Scholarships & Grants Trend – Lottery Funds to General Fund
46
0%10%20%30%40%50%60%70%80%90%
100%
FY99
FY00
FY01
FY02
FY03
FY04
FY05
FY06
FY07
FY08
FY09
FY10
FY11
FY12
FY13
FY14
FY15
Total (PFS, LIFE, HOPE, LTA, NB, TG, & NGCAP)
0%10%20%30%40%50%60%70%80%90%
100%
FY99
FY00
FY01
FY02
FY03
FY04
FY05
FY06
FY07
FY08
FY09
FY10
FY11
FY12
FY13
FY14
FY15
NB (CHE & TG)
0%10%20%30%40%50%60%70%80%90%
100%
FY99
FY00
FY01
FY02
FY03
FY04
FY05
FY06
FY07
FY08
FY09
FY10
FY11
FY12
FY13
FY14
FY15
Palmetto Fellows
0%10%20%30%40%50%60%70%80%90%
100%
FY99
FY00
FY01
FY02
FY03
FY04
FY05
FY06
FY07
FY08
FY09
FY10
FY11
FY12
FY13
FY14
FY15
LIFE
HOPE and LTA initiated with the lottery. SC NGCAP began in FY08. LTA is 100% lottery funding. HOPE and SCNG CAP have received limited General Funds
Lottery Funds General/Educ. Endow Funds*
1/28/2015
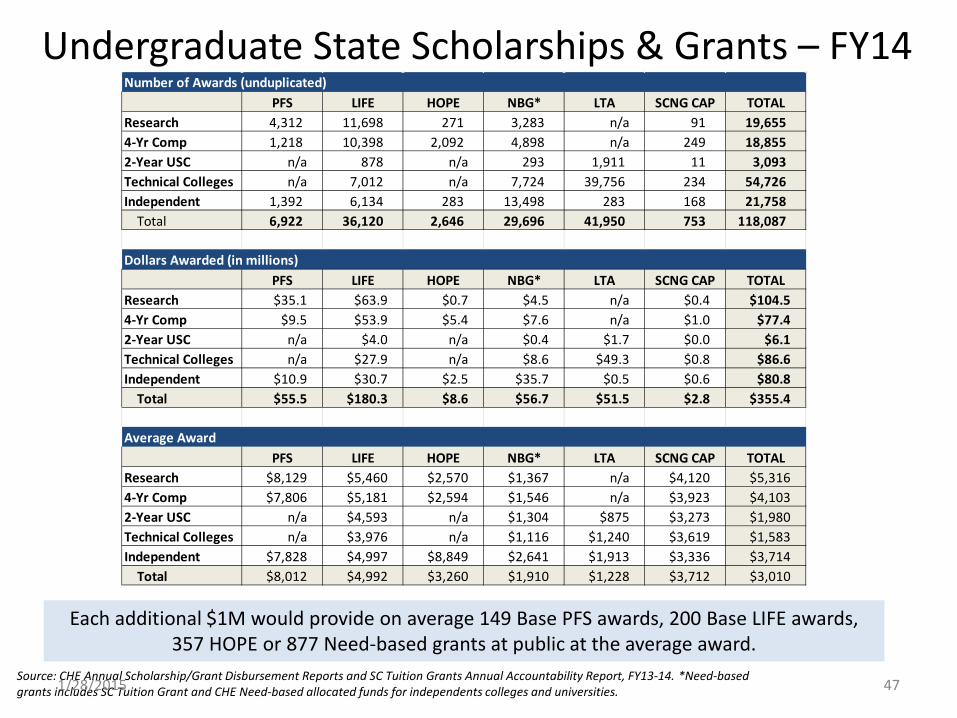
Undergraduate State Scholarships & Grants – FY14
Source: CHE Annual Scholarship/Grant Disbursement Reports and SC Tuition Grants Annual Accountability Report, FY13-14. *Need-based grants includes SC Tuition Grant and CHE Need-based allocated funds for independents colleges and universities.
Number of Awards (unduplicated)PFS LIFE HOPE NBG* LTA SCNG CAP TOTAL
Research 4,312 11,698 271 3,283 n/a 91 19,6554-Yr Comp 1,218 10,398 2,092 4,898 n/a 249 18,8552-Year USC n/a 878 n/a 293 1,911 11 3,093Technical Colleges n/a 7,012 n/a 7,724 39,756 234 54,726Independent 1,392 6,134 283 13,498 283 168 21,758 Total 6,922 36,120 2,646 29,696 41,950 753 118,087
Dollars Awarded (in millions)PFS LIFE HOPE NBG* LTA SCNG CAP TOTAL
Research $35.1 $63.9 $0.7 $4.5 n/a $0.4 $104.54-Yr Comp $9.5 $53.9 $5.4 $7.6 n/a $1.0 $77.42-Year USC n/a $4.0 n/a $0.4 $1.7 $0.0 $6.1Technical Colleges n/a $27.9 n/a $8.6 $49.3 $0.8 $86.6Independent $10.9 $30.7 $2.5 $35.7 $0.5 $0.6 $80.8 Total $55.5 $180.3 $8.6 $56.7 $51.5 $2.8 $355.4
Average AwardPFS LIFE HOPE NBG* LTA SCNG CAP TOTAL
Research $8,129 $5,460 $2,570 $1,367 n/a $4,120 $5,3164-Yr Comp $7,806 $5,181 $2,594 $1,546 n/a $3,923 $4,1032-Year USC n/a $4,593 n/a $1,304 $875 $3,273 $1,980Technical Colleges n/a $3,976 n/a $1,116 $1,240 $3,619 $1,583Independent $7,828 $4,997 $8,849 $2,641 $1,913 $3,336 $3,714 Total $8,012 $4,992 $3,260 $1,910 $1,228 $3,712 $3,010
Each additional $1M would provide on average 149 Base PFS awards, 200 Base LIFE awards, 357 HOPE or 877 Need-based grants at public at the average award.
47 1/28/2015
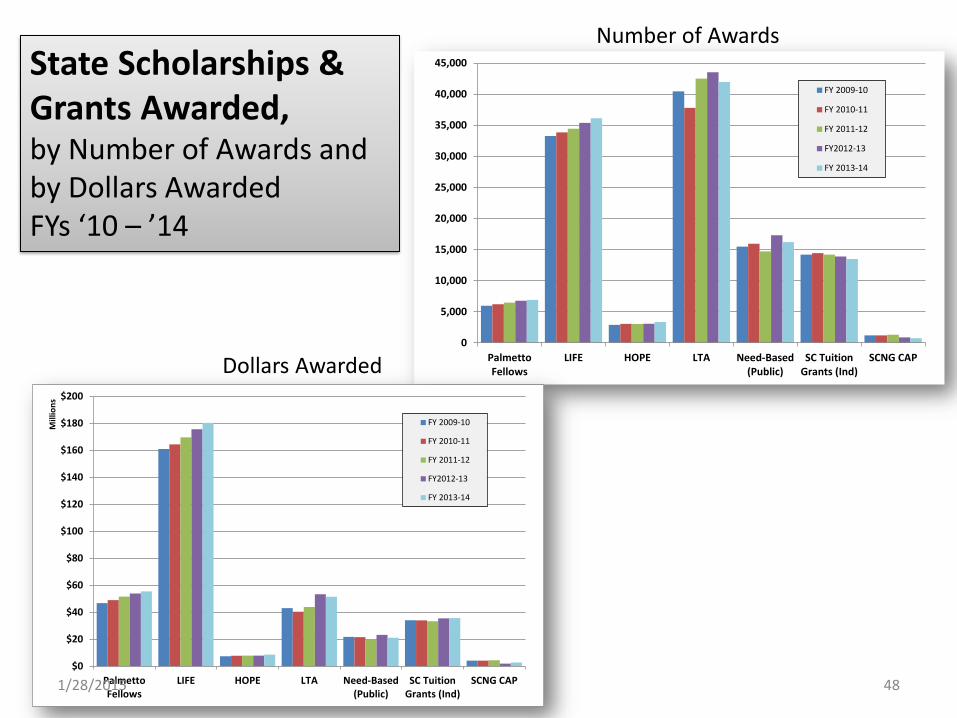
0
5,000
10,000
15,000
20,000
25,000
30,000
35,000
40,000
45,000
PalmettoFellows
LIFE HOPE LTA Need-Based(Public)
SC TuitionGrants (Ind)
SCNG CAP
FY 2009-10
FY 2010-11
FY 2011-12
FY2012-13
FY 2013-14
48
Dollars Awarded
Number of Awards State Scholarships & Grants Awarded, by Number of Awards and by Dollars Awarded FYs ‘10 – ’14
$0
$20
$40
$60
$80
$100
$120
$140
$160
$180
$200
PalmettoFellows
LIFE HOPE LTA Need-Based(Public)
SC TuitionGrants (Ind)
SCNG CAP
Mill
ions
FY 2009-10
FY 2010-11
FY 2011-12
FY2012-13
FY 2013-14
1/28/2015
$0
$20
$40
$60
$80
$100
$120
$140
$160
$180
$200
PFS LIFE HOPE NBG* LTA SCNG CAP
Mill
ions
Dollars Awarded by Type Award by Sector, FY14
Independent
Technical Colleges
2-Year USC
4-Yr Comp
Research
-
5,000
10,000
15,000
20,000
25,000
30,000
35,000
40,000
45,000
PFS LIFE HOPE NBG* LTA SCNG CAP
Number of Awards by Type Award by Sector, FY14
Independent
Technical Colleges
2-Year USC
4-Yr Comp
Research
49
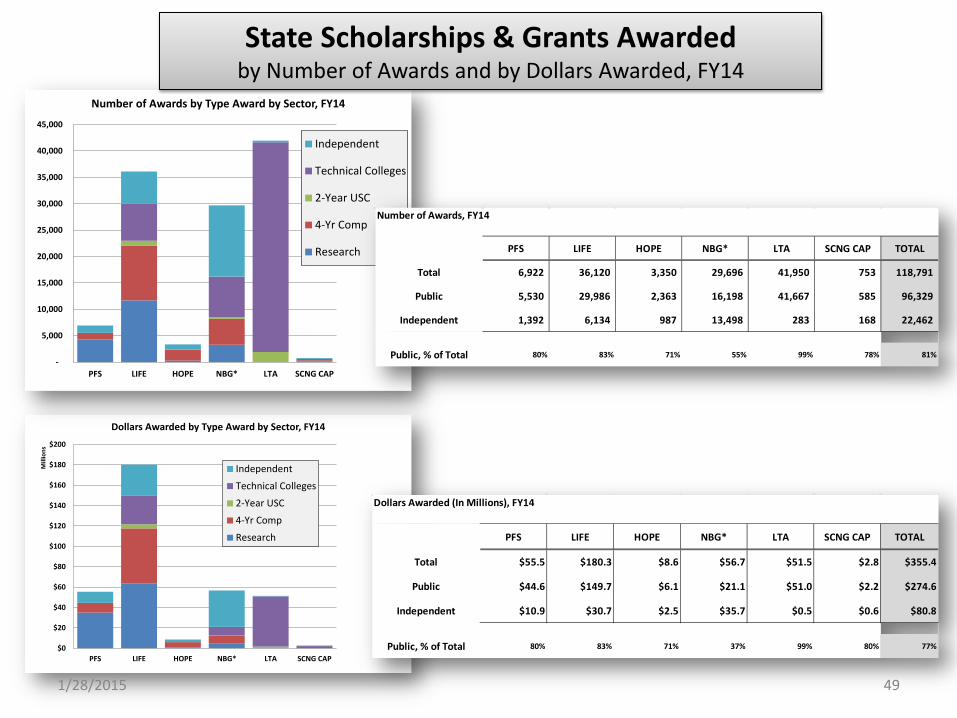
State Scholarships & Grants Awarded by Number of Awards and by Dollars Awarded, FY14
Number of Awards, FY14
PFS LIFE HOPE NBG* LTA SCNG CAP TOTAL
Total 6,922 36,120 3,350 29,696 41,950 753 118,791
Public 5,530 29,986 2,363 16,198 41,667 585 96,329
Independent 1,392 6,134 987 13,498 283 168 22,462
Public, % of Total 80% 83% 71% 55% 99% 78% 81%
Dollars Awarded (In Millions), FY14
PFS LIFE HOPE NBG* LTA SCNG CAP TOTAL
Total $55.5 $180.3 $8.6 $56.7 $51.5 $2.8 $355.4
Public $44.6 $149.7 $6.1 $21.1 $51.0 $2.2 $274.6
Independent $10.9 $30.7 $2.5 $35.7 $0.5 $0.6 $80.8
Public, % of Total 80% 83% 71% 37% 99% 80% 77%
1/28/2015

“Math/Science” Enhancements
50
40.6
%
25.5
%
23.0
%
33.7
%40.7
%
29.2
%
26.5
% 35.3
%42.7
%
30.9
%
26.5
% 36.8
%44.1
%
30.1
%
26.3
%
37.7
%46.2
%
30.2
%
26.9
%
39.5
%
0.0%
10.0%
20.0%
30.0%
40.0%
50.0%
60.0%
70.0%
80.0%
90.0%
100.0%
ResearchInstitutions
ComprehensiveTeaching
Institutions
IndependentSenior
Institutions
Grand Total
2009
2010
2011
2012
2013
22.6
%
14.8
%
9.6% 13
.7%22
.6%
14.4
%
9.4% 13
.4%23
.5%
14.7
%
9.0% 13
.9%
24.9
%
15.4
%
9.5% 14
.7%
26.7
%
15.9
%
9.6% 15
.2%
0.0%
10.0%
20.0%
30.0%
40.0%
50.0%
60.0%
70.0%
80.0%
90.0%
100.0%
ResearchInstitutions
ComprehensiveTeaching
Institutions
IndependentSenior
Institutions
Grand Total
% of Palmetto Fellows Recipients Receiving Enhancements
% of LIFE Recipients Receiving Enhancements
Beginning in Fall 2007, the General Assembly provided for enhanced awards for students receiving majoring in eligible math, science, engineering, and health care related majors. Students must take 14 hours in math or science during the first year and receiving the base Palmetto Fellow or LIFE Award at a 4-year institution to be eligible. The award provides up to an additional $2500 for LIFE and $3300 for Palmetto Fellows. Palmetto Fellows who are not eligible receive an additional $800 beginning in the second year.
FALL 2009 - 20013
1/28/2015
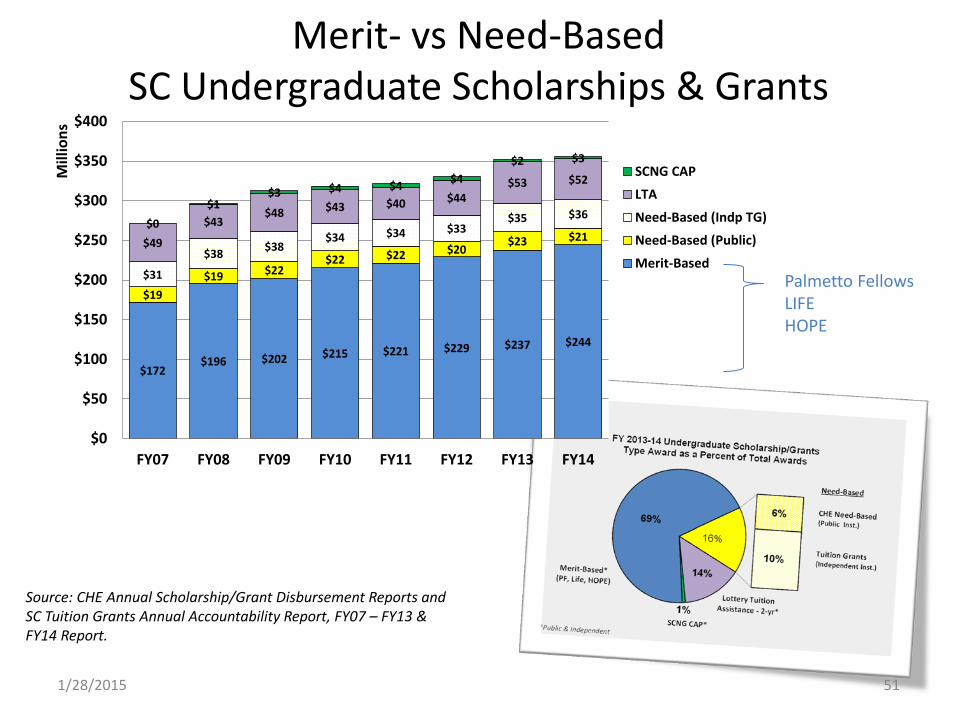
$172$196 $202 $215 $221 $229 $237 $244
$19$19 $22
$22 $22 $20$23 $21
$31
$38 $38$34 $34 $33
$35 $36
$49
$43$48 $43 $40 $44
$53 $52
$0$1
$3 $4 $4 $4$2 $3
$0
$50
$100
$150
$200
$250
$300
$350
$400
FY07 FY08 FY09 FY10 FY11 FY12 FY13 FY14
Mill
ions
SCNG CAP
LTA
Need-Based (Indp TG)
Need-Based (Public)
Merit-Based
Merit- vs Need-Based SC Undergraduate Scholarships & Grants
51
Source: CHE Annual Scholarship/Grant Disbursement Reports and SC Tuition Grants Annual Accountability Report, FY07 – FY13 & FY14 Report.
Palmetto Fellows LIFE HOPE
1/28/2015
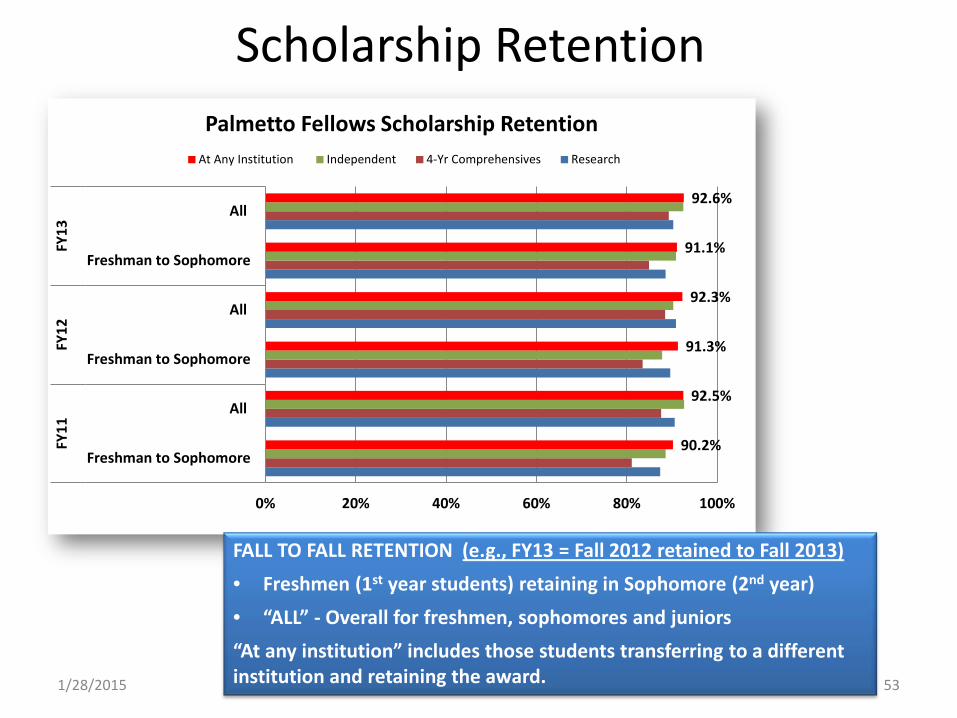
Scholarship Retention
53
90.2%
92.5%
91.3%
92.3%
91.1%
92.6%
0% 20% 40% 60% 80% 100%
Freshman to Sophomore
All
Freshman to Sophomore
All
Freshman to Sophomore
All
FY11
FY12
FY13
Palmetto Fellows Scholarship RetentionAt Any Institution Independent 4-Yr Comprehensives Research
FALL TO FALL RETENTION (e.g., FY13 = Fall 2012 retained to Fall 2013) • Freshmen (1st year students) retaining in Sophomore (2nd year) • “ALL” - Overall for freshmen, sophomores and juniors “At any institution” includes those students transferring to a different institution and retaining the award. 1/28/2015

54
50.1%
67.1%
50.6%
67.3%
50.4%
67.5%
0% 20% 40% 60% 80% 100%
Freshman to Sophomore
All
Freshman to Sophomore
All
Freshman to Sophomore
All
FY11
FY12
FY13
LIFE Scholarship RetentionAt Any Institution Independent Technical Colleges 2-Yr USC 4-Yr Comprehensives Research
FALL TO FALL RETENTION (e.g., FY13 = Fall 2012 retained to Fall 2013) • Freshmen (1st year students) retaining in Sophomore (2nd year) • “ALL” - Overall for freshmen, sophomores and juniors “At any institution” includes those students transferring to a different institution and retaining the award. 1/28/2015

55
22.7%
85.0%
23.7%
84.7%
24.4%
84.7%
0% 20% 40% 60% 80% 100%
% Retained w/ LIFE
% Retained w/o LIFE
% Retained w/ LIFE
% Retained w/o LIFE
% Retained w/ LIFE
% Retained w/o LIFEFY
11FY
12FY
13
HOPE Retention in Second YearEarning LIFE (w/ LIFE) and Not Earning LIFE (w/o LIFE)
At Any Institution Independent 4-Yr Comprehensives Research
HOPE • Awarded in the first year only for students with a 3.00 high school GPA (Uniform
Grading Policy) not earning Palmetto Fellows or LIFE and enrolled in 4-year institutions • Retention reflects those returning in the fall and earning LIFE or those returning
without earning LIFE
1/28/2015

56
57%
81%73%
104%
89%79%
73%67% 63%
58% 56% 52% 51% 49% 48% 46%
0%
20%
40%
60%
80%
100%
120%
FY00 FY01 FY02 FY03 FY04 FY05 FY06 FY07 FY08 FY09 FY10 FY11 FY12 FY13 FY14 FY15
Perc
ent o
f 4-y
r Pub
lic T
uitio
nLIFE Value as a Percentage of Average Tuition & Fees at 4-Yr Public
LIFE @ $2000
LIFE @ $3000
LIFE @ $5000
LIFE Base Value relative to average tuition at SC senior public colleges and universities.
In 2007-08, Science & Math Enhancement of $2500 available beginning in the sophomore year for students majoring in eligible science, technology, engineering, math, and health sciences programs. The percentage of tuition with the enhancement considered drops from 95% in FY08 to 69% in FY15.
1/28/2015

SC Higher Education Faculty
57
Faculty are pivotal resources around which postsecondary education revolves. They determine curriculum content, student performance standards, and quality of students’ preparation for careers. Faculty members perform research and development work which can advance this nation’s technological and economic well-being. Through their public service activities, they also contribute to the public good. Faculty may hold academic rank of professor, associate professor, assistant professor, instructor, or lecturer. Faculty may also include the chancellor/president, provost, vice provosts, deans, directors or the equivalent, as well as associate deans, assistant deans and executive officers of academic departments if their principal activity is instruction combined with research and/or public service. The designation as "faculty" is separate from the activities to which they may be currently assigned. For example, a newly appointed president of an institution may also be appointed as a faculty member. Graduate and research assistants are not included as faculty.
1/28/2015

Tenured vs. Non-Tenured Faculty
58
Part-Time, Tenured or On
Track5%
On Tenure Track25%
Tenured28% Not On
Tenure Track23%
Part-Time, Not on Tenure
Track19%
Research Universities
Part-Time, Tenured or On
Track5%
On Tenure Track16%
Tenured30%
Not On Tenure Track
15%
Part-Time, Not on Tenure
Track39%
4-Year Comprehensives
Research 4-Year Comp. USC 2-Year Regional Technical Colleges
Number % Category Tot.
Number % Category Tot.
Number % Category Tot.
Number % Category Tot.
Tenured 1,585 1,195 48 Full-time 1,482 93.5% 1,184 99.1% 37 77.1% - Part-time 103 6.5% 11 0.9% 11 22.9% -
On Tenure Track 1,472 649 28 Full-time 1,308 88.9% 646 99.5% 28 100.0% - Part-time 164 11.1% 3 0.5% - 0.0% -
Not On Tenure Tra 2,188 2,128 151 5,462 Full-time 1,219 55.7% 603 28.3% 48 31.8% 1,999 36.6% Part-Time 969 44.3% 1,525 71.7% 103 68.2% 3,463 63.4%
Total Faculty 5,245 3,972 227 5,462 Full-time 4,009 76.4% 2,433 61.3% 113 49.8% 1,999 36.6% Part-Time 1,236 23.6% 1,539 38.7% 114 50.2% 3,463 63.4%
Faculty include Instructional, Research, and Public Service. Not on Tenure Track includes those without faculty status.
Source: IPEDS Human Resource Survey. Data accessed www.nces.ed.gov, 1/23/20151/28/2015
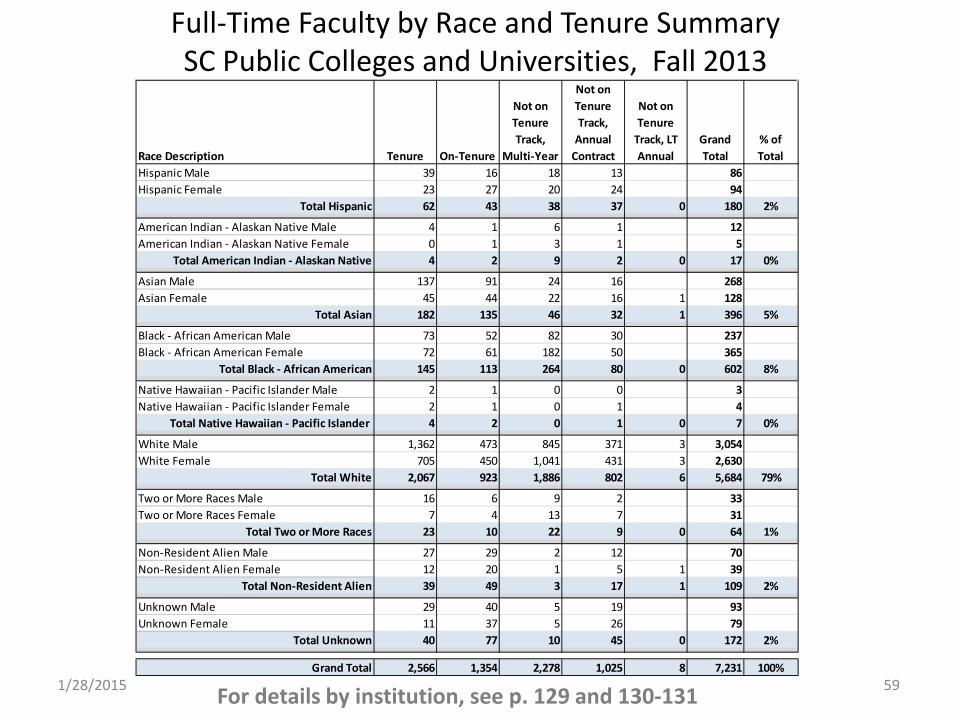
Full-Time Faculty by Race and Tenure Summary SC Public Colleges and Universities, Fall 2013
59
Race Description Tenure On-Tenure
Not on Tenure Track,
Multi-Year
Not on Tenure Track,
Annual Contract
Not on Tenure
Track, LT Annual
Grand Total
% of Total
Hispanic Male 39 16 18 13 86Hispanic Female 23 27 20 24 94
Total Hispanic 62 43 38 37 0 180 2%
American Indian - Alaskan Native Male 4 1 6 1 12American Indian - Alaskan Native Female 0 1 3 1 5
Total American Indian - Alaskan Native 4 2 9 2 0 17 0%
Asian Male 137 91 24 16 268Asian Female 45 44 22 16 1 128
Total Asian 182 135 46 32 1 396 5%
Black - African American Male 73 52 82 30 237Black - African American Female 72 61 182 50 365
Total Black - African American 145 113 264 80 0 602 8%
Native Hawaiian - Pacific Islander Male 2 1 0 0 3Native Hawaiian - Pacific Islander Female 2 1 0 1 4
Total Native Hawaiian - Pacific Islander 4 2 0 1 0 7 0%
White Male 1,362 473 845 371 3 3,054White Female 705 450 1,041 431 3 2,630
Total White 2,067 923 1,886 802 6 5,684 79%
Two or More Races Male 16 6 9 2 33Two or More Races Female 7 4 13 7 31
Total Two or More Races 23 10 22 9 0 64 1%
Non-Resident Alien Male 27 29 2 12 70Non-Resident Alien Female 12 20 1 5 1 39
Total Non-Resident Alien 39 49 3 17 1 109 2%
Unknown Male 29 40 5 19 93Unknown Female 11 37 5 26 79
Total Unknown 40 77 10 45 0 172 2%
Grand Total 2,566 1,354 2,278 1,025 8 7,231 100%
For details by institution, see p. 129 and 130-131 1/28/2015
SC Higher Education Funding
60 1/28/2015
94,906
154,938170,878
108,704
187,253207,717
0
25,000
50,000
75,000
100,000
125,000
150,000
175,000
200,000
225,000
1986 1999 2000 2001 2002 2003 2004 2005 2006 2007 2008 2009 2010 2011 2012 2013
SC Public Colleges and Universities, Fall Headcount Enrollment, 1986 & 1999-2013
SC Students (Geo-Origin) All Students
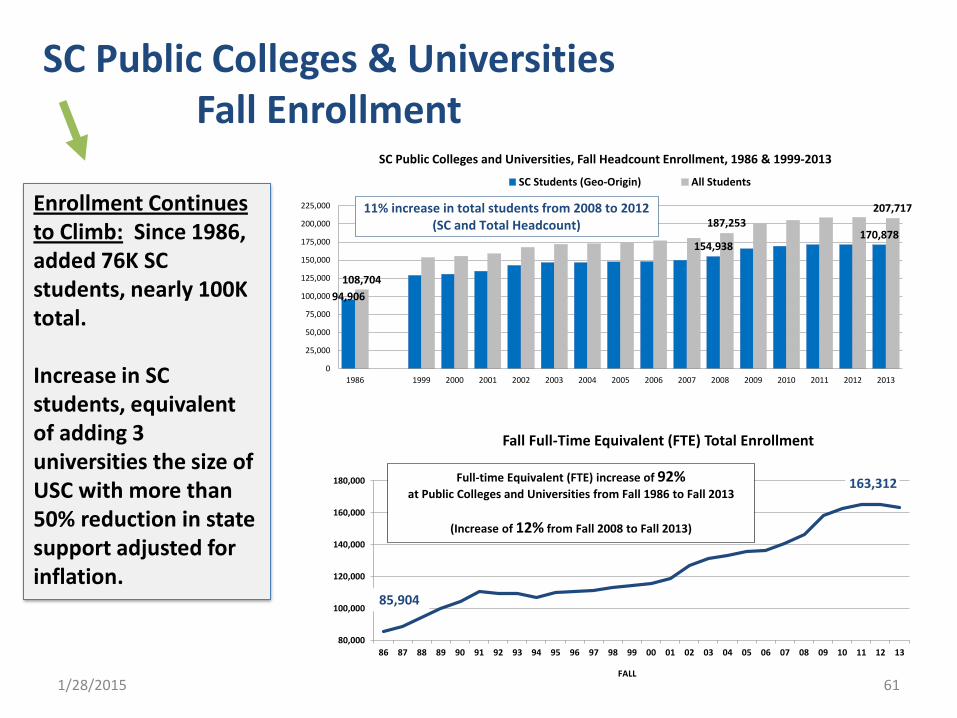
SC Public Colleges & Universities Fall Enrollment
Enrollment Continues to Climb: Since 1986, added 76K SC students, nearly 100K total. Increase in SC students, equivalent of adding 3 universities the size of USC with more than 50% reduction in state support adjusted for inflation.
Fall Full-Time Equivalent (FTE) Total Enrollment
11% increase in total students from 2008 to 2012(SC and Total Headcount)
163,312
80,000
100,000
120,000
140,000
160,000
180,000
86 87 88 89 90 91 92 93 94 95 96 97 98 99 00 01 02 03 04 05 06 07 08 09 10 11 12 13
85,904
Full-time Equivalent (FTE) increase of 92% at Public Colleges and Universities from Fall 1986 to Fall 2013
(Increase of 12% from Fall 2008 to Fall 2013)
FALL61 1/28/2015
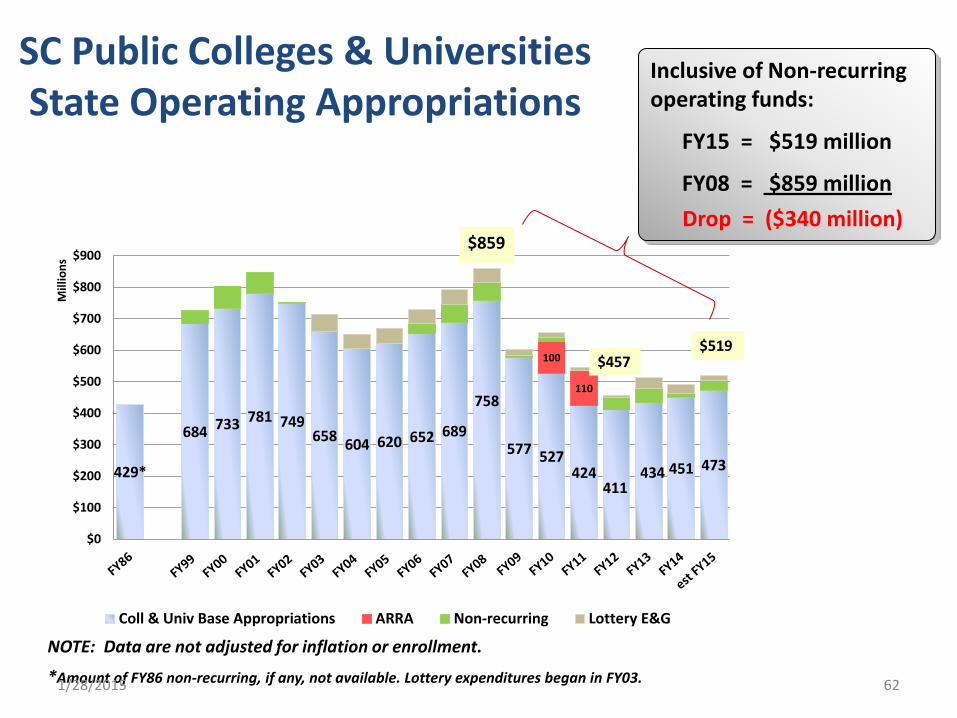
429*
684 733 781 749658 604 620 652 689
758
577 527424
411434 451 473
100
110
$0
$100
$200
$300
$400
$500
$600
$700
$800
$900
Mill
ions
Coll & Univ Base Appropriations ARRA Non-recurring Lottery E&G
$519
$859
$457
Inclusive of Non-recurring operating funds:
FY15 = $519 million
FY08 = $859 million Drop = ($340 million)
SC Public Colleges & Universities State Operating Appropriations
NOTE: Data are not adjusted for inflation or enrollment.
*Amount of FY86 non-recurring, if any, not available. Lottery expenditures began in FY03. 62 1/28/2015
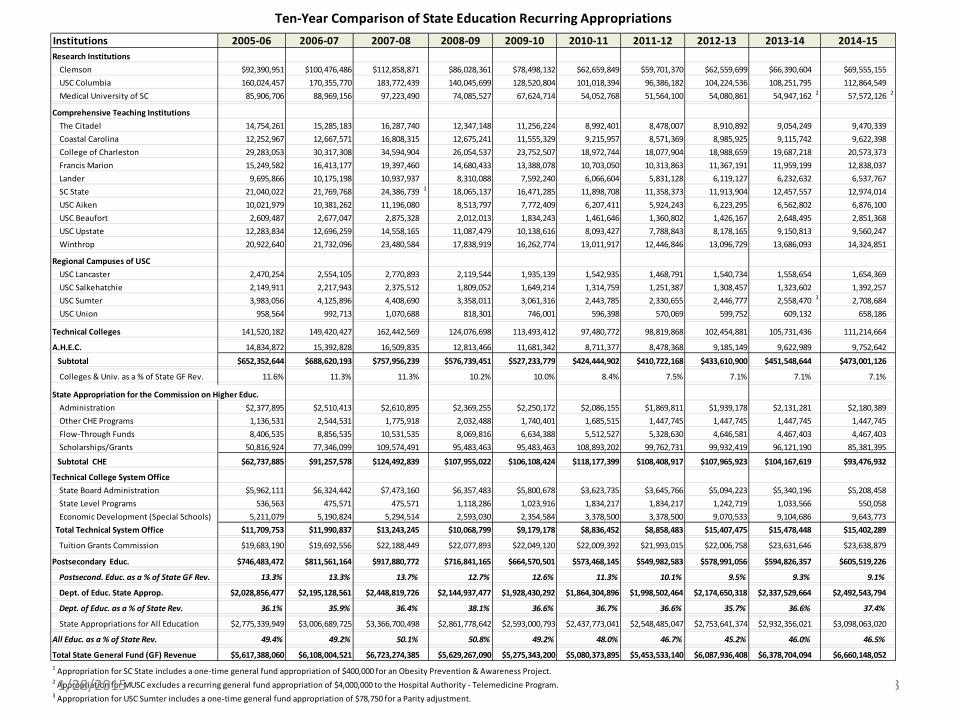
63
Institutions 2005-06 2006-07 2008-09 2009-10 2010-11 2011-12 2012-13Research Institutions
Clemson $92,390,951 $100,476,486 $112,858,871 $86,028,361 $78,498,132 $62,659,849 $59,701,370 $62,559,699 $66,390,604 $69,555,155USC Columbia 160,024,457 170,355,770 183,772,439 140,045,699 128,520,804 101,018,394 96,386,182 104,224,536 108,251,795 112,864,549Medical University of SC 85,906,706 88,969,156 97,223,490 74,085,527 67,624,714 54,052,768 51,564,100 54,080,861 54,947,162 2 57,572,126 2
Comprehensive Teaching InstitutionsThe Citadel 14,754,261 15,285,183 16,287,740 12,347,148 11,256,224 8,992,401 8,478,007 8,910,892 9,054,249 9,470,339Coastal Carolina 12,252,967 12,667,571 16,808,315 12,675,241 11,555,329 9,215,957 8,571,369 8,985,925 9,115,742 9,622,398College of Charleston 29,283,053 30,317,308 34,594,904 26,054,537 23,752,507 18,972,744 18,077,904 18,988,659 19,687,218 20,573,373Francis Marion 15,249,582 16,413,177 19,397,460 14,680,433 13,388,078 10,703,050 10,313,863 11,367,191 11,959,199 12,838,037Lander 9,695,866 10,175,198 10,937,937 8,310,088 7,592,240 6,066,604 5,831,128 6,119,127 6,232,632 6,537,767SC State 21,040,022 21,769,768 24,386,739 1 18,065,137 16,471,285 11,898,708 11,358,373 11,913,904 12,457,557 12,974,014USC Aiken 10,021,979 10,381,262 11,196,080 8,513,797 7,772,409 6,207,411 5,924,243 6,223,295 6,562,802 6,876,100USC Beaufort 2,609,487 2,677,047 2,875,328 2,012,013 1,834,243 1,461,646 1,360,802 1,426,167 2,648,495 2,851,368USC Upstate 12,283,834 12,696,259 14,558,165 11,087,479 10,138,616 8,093,427 7,788,843 8,178,165 9,150,813 9,560,247Winthrop 20,922,640 21,732,096 23,480,584 17,838,919 16,262,774 13,011,917 12,446,846 13,096,729 13,686,093 14,324,851
Regional Campuses of USCUSC Lancaster 2,470,254 2,554,105 2,770,893 2,119,544 1,935,139 1,542,935 1,468,791 1,540,734 1,558,654 1,654,369USC Salkehatchie 2,149,911 2,217,943 2,375,512 1,809,052 1,649,214 1,314,759 1,251,387 1,308,457 1,323,602 1,392,257USC Sumter 3,983,056 4,125,896 4,408,690 3,358,011 3,061,316 2,443,785 2,330,655 2,446,777 2,558,470 3 2,708,684USC Union 958,564 992,713 1,070,688 818,301 746,001 596,398 570,069 599,752 609,132 658,186
Technical Colleges 141,520,182 149,420,427 162,442,569 124,076,698 113,493,412 97,480,772 98,819,868 102,454,881 105,731,436 111,214,664
A.H.E.C. 14,834,872 15,392,828 16,509,835 12,813,466 11,681,342 8,711,377 8,478,368 9,185,149 9,622,989 9,752,642 Subtotal $652,352,644 $688,620,193 $757,956,239 $576,739,451 $527,233,779 $424,444,902 $410,722,168 $433,610,900 $451,548,644 $473,001,126
Colleges & Univ. as a % of State GF Rev. 11.6% 11.3% 11.3% 10.2% 10.0% 8.4% 7.5% 7.1% 7.1% 7.1%
State Appropriation for the Commission on Higher Educ.Administration $2,377,895 $2,510,413 $2,610,895 $2,369,255 $2,250,172 $2,086,155 $1,869,811 $1,939,178 $2,131,281 $2,180,389Other CHE Programs 1,136,531 2,544,531 1,775,918 2,032,488 1,740,401 1,685,515 1,447,745 1,447,745 1,447,745 1,447,745Flow-Through Funds 8,406,535 8,856,535 10,531,535 8,069,816 6,634,388 5,512,527 5,328,630 4,646,581 4,467,403 4,467,403Scholarships/Grants 50,816,924 77,346,099 109,574,491 95,483,463 95,483,463 108,893,202 99,762,731 99,932,419 96,121,190 85,381,395
Subtotal CHE $62,737,885 $91,257,578 $124,492,839 $107,955,022 $106,108,424 $118,177,399 $108,408,917 $107,965,923 $104,167,619 $93,476,932
Technical College System OfficeState Board Administration $5,962,111 $6,324,442 $7,473,160 $6,357,483 $5,800,678 $3,623,735 $3,645,766 $5,094,223 $5,340,196 $5,208,458State Level Programs 536,563 475,571 475,571 1,118,286 1,023,916 1,834,217 1,834,217 1,242,719 1,033,566 550,058Economic Development (Special Schools) 5,211,079 5,190,824 5,294,514 2,593,030 2,354,584 3,378,500 3,378,500 9,070,533 9,104,686 9,643,773
Total Technical System Office $11,709,753 $11,990,837 $13,243,245 $10,068,799 $9,179,178 $8,836,452 $8,858,483 $15,407,475 $15,478,448 $15,402,289
Tuition Grants Commission $19,683,190 $19,692,556 $22,188,449 $22,077,893 $22,049,120 $22,009,392 $21,993,015 $22,006,758 $23,631,646 $23,638,879
Postsecondary Educ. $746,483,472 $811,561,164 $917,880,772 $716,841,165 $664,570,501 $573,468,145 $549,982,583 $578,991,056 $594,826,357 $605,519,226
Postsecond. Educ. as a % of State GF Rev. 13.3% 13.3% 13.7% 12.7% 12.6% 11.3% 10.1% 9.5% 9.3% 9.1%
Dept. of Educ. State Approp. $2,028,856,477 $2,195,128,561 $2,448,819,726 $2,144,937,477 $1,928,430,292 $1,864,304,896 $1,998,502,464 $2,174,650,318 $2,337,529,664 $2,492,543,794
Dept. of Educ. as a % of State Rev. 36.1% 35.9% 36.4% 38.1% 36.6% 36.7% 36.6% 35.7% 36.6% 37.4%
State Appropriations for All Education $2,775,339,949 $3,006,689,725 $3,366,700,498 $2,861,778,642 $2,593,000,793 $2,437,773,041 $2,548,485,047 $2,753,641,374 $2,932,356,021 $3,098,063,020
All Educ. as a % of State Rev. 49.4% 49.2% 50.1% 50.8% 49.2% 48.0% 46.7% 45.2% 46.0% 46.5%
Total State General Fund (GF) Revenue $5,617,388,060 $6,108,004,521 $6,723,274,385 $5,629,267,090 $5,275,343,200 $5,080,373,895 $5,453,533,140 $6,087,936,408 $6,378,704,094 $6,660,148,0521 Appropriation for SC State includes a one-time general fund appropriation of $400,000 for an Obesity Prevention & Awareness Project.2 Appropriation for MUSC excludes a recurring general fund appropriation of $4,000,000 to the Hospital Authority - Telemedicine Program.3 Appropriation for USC Sumter includes a one-time general fund appropriation of $78,750 for a Parity adjustment.
Ten-Year Comparison of State Education Recurring Appropriations2013-142007-08 2014-15
1/28/2015
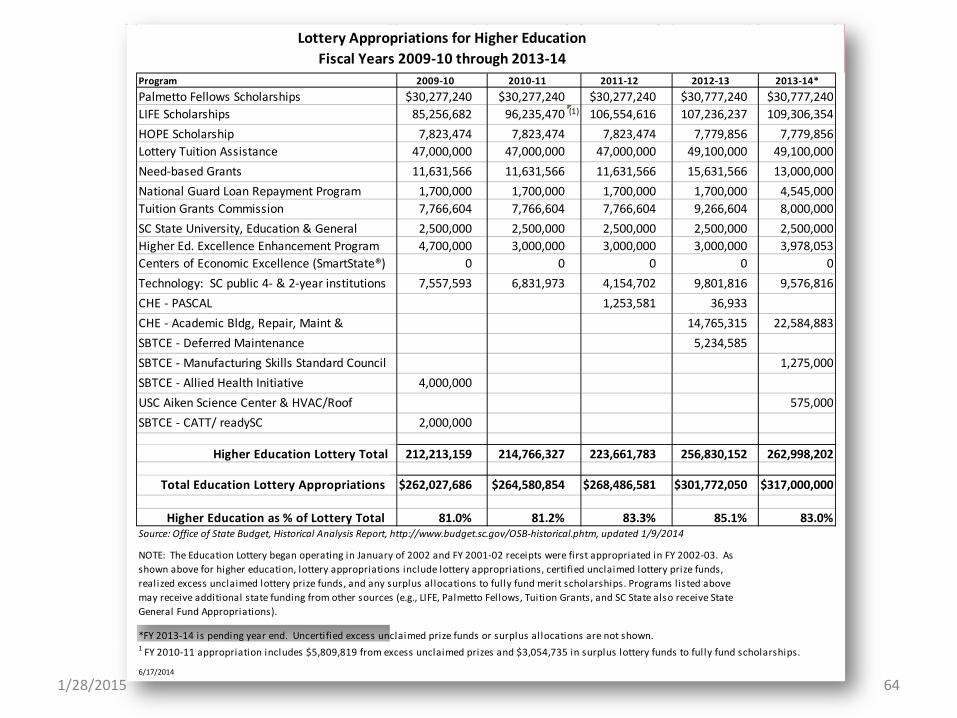
64
Program 2009-10 2010-11 2011-12 2012-13 2013-14*Palmetto Fellows Scholarships $30,277,240 $30,277,240 $30,277,240 $30,777,240 $30,777,240LIFE Scholarships 85,256,682 96,235,470 (1) 106,554,616 107,236,237 109,306,354HOPE Scholarship 7,823,474 7,823,474 7,823,474 7,779,856 7,779,856Lottery Tuition Assistance 47,000,000 47,000,000 47,000,000 49,100,000 49,100,000Need-based Grants 11,631,566 11,631,566 11,631,566 15,631,566 13,000,000National Guard Loan Repayment Program 1,700,000 1,700,000 1,700,000 1,700,000 4,545,000Tuition Grants Commission 7,766,604 7,766,604 7,766,604 9,266,604 8,000,000SC State University, Education & General 2,500,000 2,500,000 2,500,000 2,500,000 2,500,000Higher Ed. Excellence Enhancement Program 4,700,000 3,000,000 3,000,000 3,000,000 3,978,053Centers of Economic Excellence (SmartState®) 0 0 0 0 0Technology: SC public 4- & 2-year institutions 7,557,593 6,831,973 4,154,702 9,801,816 9,576,816CHE - PASCAL 1,253,581 36,933CHE - Academic Bldg, Repair, Maint & 14,765,315 22,584,883SBTCE - Deferred Maintenance 5,234,585SBTCE - Manufacturing Skills Standard Council 1,275,000SBTCE - Allied Health Initiative 4,000,000USC Aiken Science Center & HVAC/Roof 575,000SBTCE - CATT/ readySC 2,000,000
Higher Education Lottery Total 212,213,159 214,766,327 223,661,783 256,830,152 262,998,202
Total Education Lottery Appropriations $262,027,686 $264,580,854 $268,486,581 $301,772,050 $317,000,000
Higher Education as % of Lottery Total 81.0% 81.2% 83.3% 85.1% 83.0%Source: Office of State Budget, Historical Analysis Report, http://www.budget.sc.gov/OSB-historical.phtm, updated 1/9/2014
*FY 2013-14 is pending year end. Uncertified excess unclaimed prize funds or surplus allocations are not shown.
6/17/2014
Lottery Appropriations for Higher EducationFiscal Years 2009-10 through 2013-14
NOTE: The Education Lottery began operating in January of 2002 and FY 2001-02 receipts were first appropriated in FY 2002-03. As shown above for higher education, lottery appropriations include lottery appropriations, certified unclaimed lottery prize funds, realized excess unclaimed lottery prize funds, and any surplus allocations to fully fund merit scholarships. Programs l isted above may receive additional state funding from other sources (e.g., LIFE, Palmetto Fellows, Tuition Grants, and SC State also receive State General Fund Appropriations).
1 FY 2010-11 appropriation includes $5,809,819 from excess unclaimed prizes and $3,054,735 in surplus lottery funds to fully fund scholarships.
1/28/2015

SC HIGHER EDUCATION FUNDING Change in Public Higher Education Support as a Percentage of the State Budget - Institution Educational and General Operating Support and State-supported Financial Aid for Students
14.0%
10.0% 10.2% 9.5% 8.5%7.0% 6.5% 6.2% 6.4% 6.6%
1.2%
0.8% 0.8%
0.1%0.2%
0.0% 0.6% 0.7% 0.2% 0.4%
0.7% 0.6%
0.3%
0.2%
0.2% 0.1% 0.5% 0.4%0.2%
1.6%
1.8%0.0% 0.0% 0.0%
0.9%
3.0% 2.9%3.9% 3.8%
4.0%
4.0% 3.9% 3.9% 4.0%
0.0%
2.0%
4.0%
6.0%
8.0%
10.0%
12.0%
14.0%
16.0%
18.0%
FY01 FY07 FY08 FY09 FY10 FY11 FY12 FY13 FY14 Est FY15
General Fund Base Operating Non-recurring Operating Lottery for E&G Operating
Federal ARRA SFSF State-supported Student Financial Aid
14.5%
11.2%13.2%
16.2%14.3%13.8%14.5%
11.1% 10.9%11.3%
65 1/28/2015
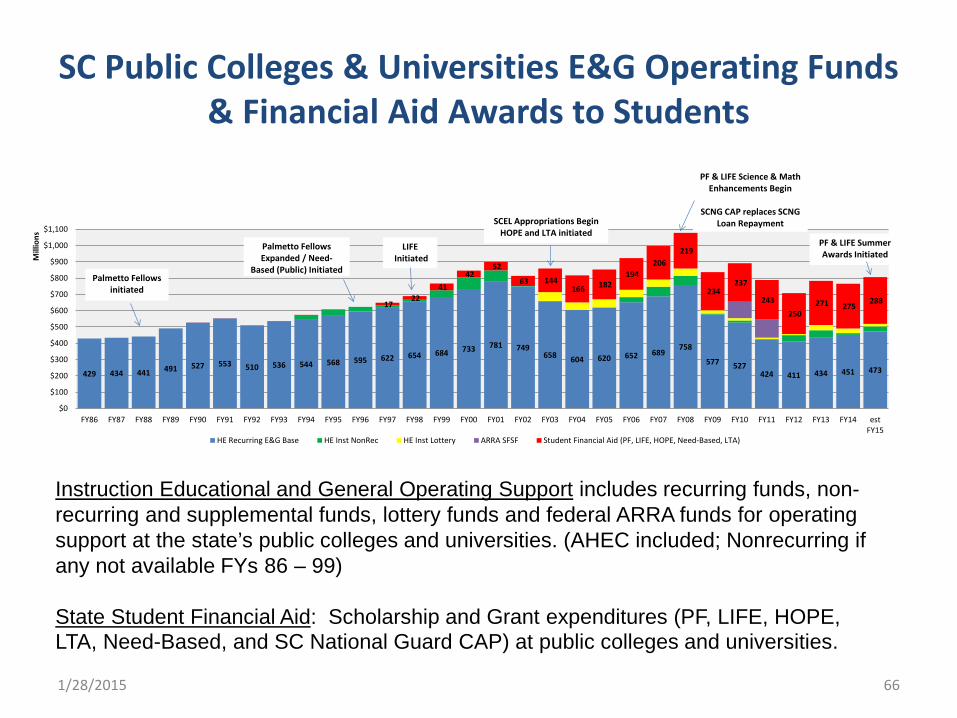
SC Public Colleges & Universities E&G Operating Funds & Financial Aid Awards to Students
66
Instruction Educational and General Operating Support includes recurring funds, non-recurring and supplemental funds, lottery funds and federal ARRA funds for operating support at the state’s public colleges and universities. (AHEC included; Nonrecurring if any not available FYs 86 – 99) State Student Financial Aid: Scholarship and Grant expenditures (PF, LIFE, HOPE, LTA, Need-Based, and SC National Guard CAP) at public colleges and universities.
429 434 441 491 527 553 510 536 544 568 595 622 654 684 733 781 749658 604 620 652 689
758
577 527424 411 434 451 473
17 22
41 42
52
63 144 166 182
194 206
219
234 237
243
250 271 275
288
$0
$100
$200
$300
$400
$500
$600
$700
$800
$900
$1,000
$1,100
FY86 FY87 FY88 FY89 FY90 FY91 FY92 FY93 FY94 FY95 FY96 FY97 FY98 FY99 FY00 FY01 FY02 FY03 FY04 FY05 FY06 FY07 FY08 FY09 FY10 FY11 FY12 FY13 FY14 estFY15
Mill
ions
HE Recurring E&G Base HE Inst NonRec HE Inst Lottery ARRA SFSF Student Financial Aid (PF, LIFE, HOPE, Need-Based, LTA)
Palmetto Fellowsinitiated
Palmetto Fellows Expanded / Need-
Based (Public) Initiated
LIFEInitiated
PF & LIFE Science & Math Enhancements Begin
SCNG CAP replaces SCNG Loan Repayment
PF & LIFE Summer Awards Initiated
SCEL Appropriations Begin HOPE and LTA initiated
1/28/2015

Appropriation History Student vs. Institution Support
•Appropriations (blue) are recurring appropriations for public institutions.
•Student Support includes merit-based (PF, LIFE, HOPE), need-based, LTA and SCNG CAP student financial aid to students at public and independent institutions. Data source is CHE annual disbursement reports and Tuition Grants annual report. In 1986, Tuition Grants (Independents) was the only grant program. FY99 is first year of LIFE. FY03 is first year of Lottery.
•Of the student support, aid to students at public institutions was 0% in 1986, averaged 59% from FYs 99 to 00 and averaged 24% since FY04.
$0
$100,000,000
$200,000,000
$300,000,000
$400,000,000
$500,000,000
$600,000,000
$700,000,000
$800,000,000
$900,000,000
FY86 FY99 FY00 FY01 FY02 FY03 FY04 FY05 FY06 FY07 FY08 FY09 FY10 FY11 FY12 FY13 FY14 FY15
Public Inst. Appropriations (Recurring)
State-Supported Student Financial Aid
67 1/28/2015
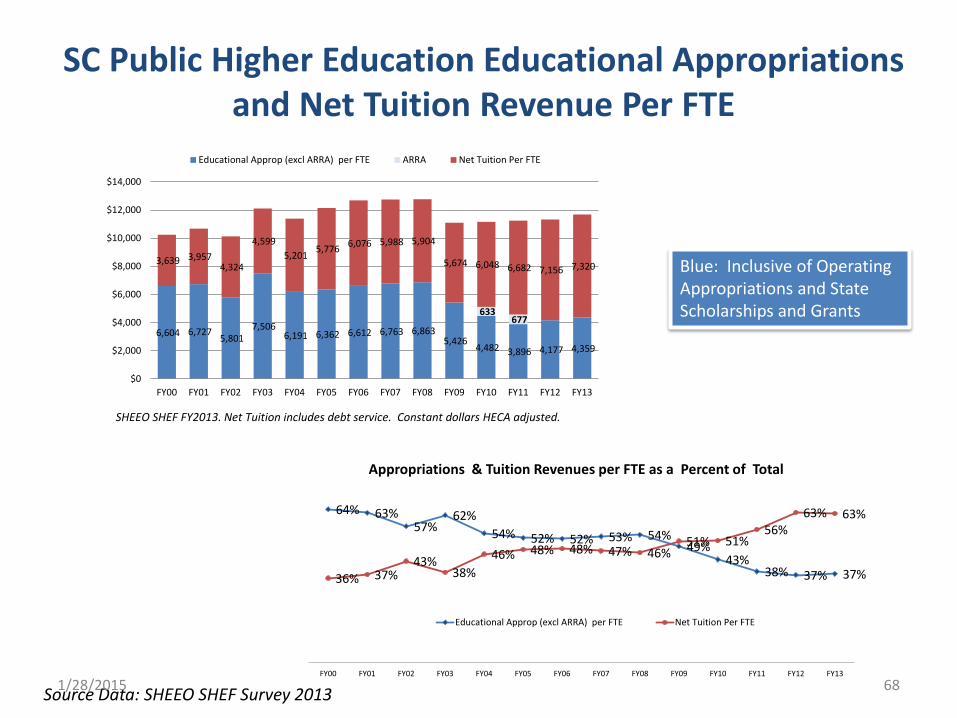
64% 63%57%
62%54% 52% 52% 53% 54%
49%43%
38% 37% 37%36% 37%43%
38%46% 48% 48% 47% 46%
51% 51%56%
63% 63%
FY00 FY01 FY02 FY03 FY04 FY05 FY06 FY07 FY08 FY09 FY10 FY11 FY12 FY13
Appropriations & Tuition Revenues per FTE as a Percent of Total
Educational Approp (excl ARRA) per FTE Net Tuition Per FTE
SC Public Higher Education Educational Appropriations and Net Tuition Revenue Per FTE
Source Data: SHEEO SHEF Survey 2013 68
6,604 6,727 5,801 7,506
6,191 6,362 6,612 6,763 6,863 5,426
4,482 3,896 4,177 4,359
633 677
3,639 3,957 4,324
4,599 5,201 5,776 6,076 5,988 5,904
5,674 6,048 6,682 7,156 7,320
$0
$2,000
$4,000
$6,000
$8,000
$10,000
$12,000
$14,000
FY00 FY01 FY02 FY03 FY04 FY05 FY06 FY07 FY08 FY09 FY10 FY11 FY12 FY13
Educational Approp (excl ARRA) per FTE ARRA Net Tuition Per FTE
SHEEO SHEF FY2013. Net Tuition includes debt service. Constant dollars HECA adjusted.
Blue: Inclusive of Operating Appropriations and State Scholarships and Grants
1/28/2015
SC Funding Compared to Other States
69 1/28/2015

$0
$2,000
$4,000
$6,000
$8,000
$10,000
$12,000
$14,000
$16,000
$18,000
Wyo
min
gAl
aska
Illin
ois
Nor
th C
arol
ina
New
Mex
ico
New
Yor
kN
ebra
ska
Texa
sHa
wai
iCa
lifor
nia
Conn
ectic
utO
klah
oma
Mar
ylan
dKe
ntuc
kyG
eorg
iaN
evad
aN
orth
Dak
ota
Idah
oAr
kans
asM
issi
ssip
piU
.S.
Tenn
esse
eM
aine
Wis
cons
inW
est V
irgin
iaM
assa
chus
etts
Kans
asN
ew Je
rsey
Loui
sian
aAl
abam
aM
isso
uri
Iow
aU
tah
Ariz
ona
Dela
war
eW
ashi
ngto
nSo
uth
Caro
lina
Flor
ida
Sout
h Da
kota
Min
neso
taVi
rgin
iaO
hio
Mic
higa
nRh
ode
Isla
ndIn
dian
aM
onta
naPe
nnsy
lvan
iaO
rego
nCo
lora
doVe
rmon
tN
ew H
amps
hire
Educational Appropriations per FTE FY 2013 (with state-supported scholarships/grants)
SC (red) falls 21.4% below National Average (green)
SC ranks 36th and 14th out of the 16 SREB States (dark blue)
Source: SHEEO State Higher Education Finance Survey, FY2013. Educational appropriations measure state and local support available for public higher education operating expenses and student financial aid for students enrolled in public higher education and exclude research hospitals, medical education. Federal ARRA Stimulus funds are included. Dollars are constant adjusted dollars using Cost of Living Adjustment (COLA), Enrollment Mix Index (EMI), and Higher Education Cost Adjustment. (HECA)
US Avg. $6,105 SC
$4,797
NC GA
70 1/28/2015
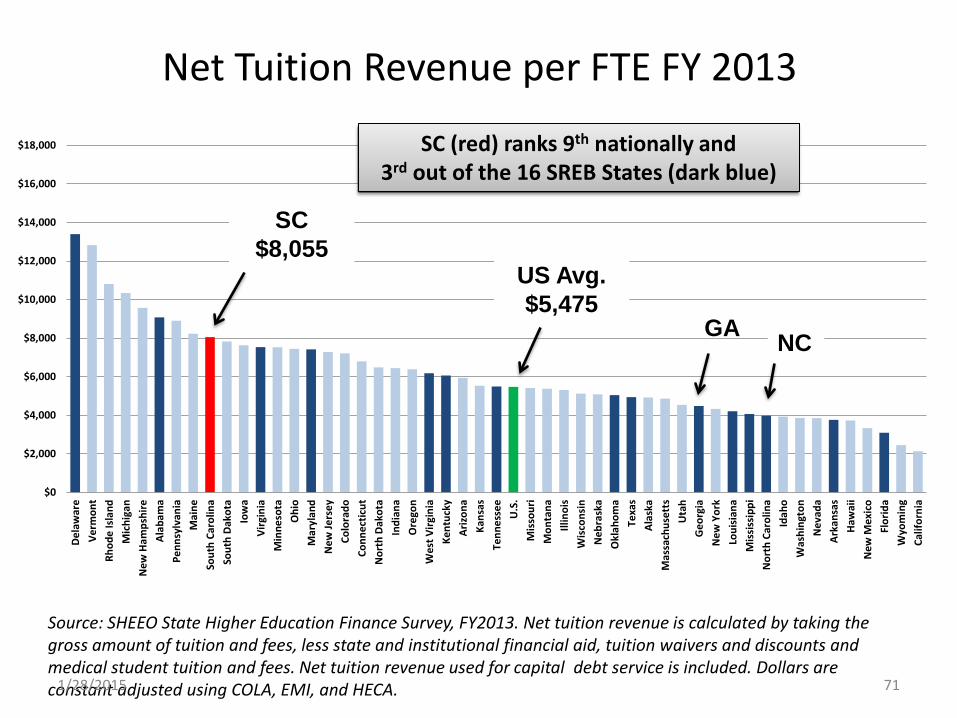
$0
$2,000
$4,000
$6,000
$8,000
$10,000
$12,000
$14,000
$16,000
$18,000
Dela
war
eVe
rmon
tRh
ode
Isla
ndM
ichi
gan
New
Ham
pshi
reAl
abam
aPe
nnsy
lvan
iaM
aine
Sout
h Ca
rolin
aSo
uth
Dako
taIo
wa
Virg
inia
Min
neso
taO
hio
Mar
ylan
dN
ew Je
rsey
Colo
rado
Conn
ectic
utN
orth
Dak
ota
Indi
ana
Ore
gon
Wes
t Virg
inia
Kent
ucky
Ariz
ona
Kans
asTe
nnes
see
U.S
.M
isso
uri
Mon
tana
Illin
ois
Wis
cons
inN
ebra
ska
Okl
ahom
aTe
xas
Alas
kaM
assa
chus
etts
Uta
hG
eorg
iaN
ew Y
ork
Loui
sian
aM
issi
ssip
piN
orth
Car
olin
aId
aho
Was
hing
ton
Nev
ada
Arka
nsas
Haw
aii
New
Mex
ico
Flor
ida
Wyo
min
gCa
lifor
nia
Net Tuition Revenue per FTE FY 2013
SC (red) ranks 9th nationally and 3rd out of the 16 SREB States (dark blue)
Source: SHEEO State Higher Education Finance Survey, FY2013. Net tuition revenue is calculated by taking the gross amount of tuition and fees, less state and institutional financial aid, tuition waivers and discounts and medical student tuition and fees. Net tuition revenue used for capital debt service is included. Dollars are constant adjusted using COLA, EMI, and HECA.
US Avg. $5,475
SC $8,055
GA NC
71 1/28/2015

$0
$2,000
$4,000
$6,000
$8,000
$10,000
$12,000
$14,000
$16,000
$18,000
$20,000
Wyo
min
gDe
law
are
Alas
kaRh
ode
Isla
ndVe
rmon
tM
ichi
gan
Illin
ois
Mai
neM
aryl
and
Alab
ama
Conn
ectic
utN
orth
Dak
ota
Penn
sylv
ania
New
Jers
eyKe
ntuc
kyN
orth
Car
olin
aIo
wa
Neb
rask
aTe
xas
Sout
h Ca
rolin
aN
ew Y
ork
Min
neso
taO
klah
oma
Virg
inia
Ohi
oSo
uth
Dako
taN
ew M
exic
oU
.S.
Tenn
esse
eN
ew H
amps
hire
Geo
rgia
Wes
t Virg
inia
Kans
asW
isco
nsin
Haw
aii
Indi
ana
Mis
sour
iAr
izon
aN
evad
aM
assa
chus
etts
Idah
oO
rego
nM
issi
ssip
piCo
lora
doLo
uisi
ana
Mon
tana
Uta
hCa
lifor
nia
Arka
nsas
Was
hing
ton
Flor
ida
Total Educational Revenue Per FTE 2013 SC (red) ranks 20th nationally and 7th out of the 16 SREB States (dark blue)
Source: SHEEO State Higher Education Finance Survey, FY2013. Total Educational Revenue per FTE represents the sum of educational appropriations and net tuition exclusive of that portion of net tuition per FTE used for capital debt service. Federal ARRA Stimulus funds are included. Dollars are constant adjusted using COLA, EMI, and HECA.
US Avg. $11,523
SC $12,190
GA NC
72 1/28/2015
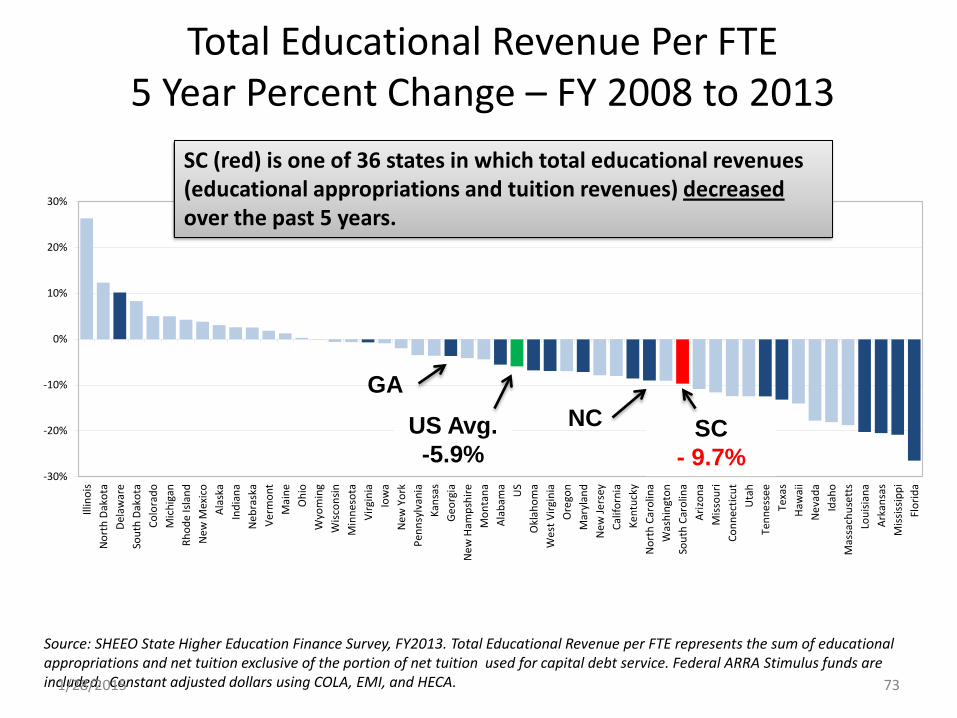
-30%
-20%
-10%
0%
10%
20%
30%
Illin
ois
Nor
th D
akot
aDe
law
are
Sout
h Da
kota
Colo
rado
Mic
higa
nRh
ode
Isla
ndN
ew M
exic
oAl
aska
Indi
ana
Neb
rask
aVe
rmon
tM
aine
Ohi
oW
yom
ing
Wisc
onsin
Min
neso
taVi
rgin
iaIo
wa
New
Yor
kPe
nnsy
lvan
iaKa
nsas
Geor
gia
New
Ham
pshi
reM
onta
naAl
abam
a US
Okl
ahom
aW
est V
irgin
iaO
rego
nM
aryl
and
New
Jers
eyCa
lifor
nia
Kent
ucky
Nor
th C
arol
ina
Was
hing
ton
Sout
h Ca
rolin
aAr
izona
Miss
ouri
Conn
ectic
utU
tah
Tenn
esse
eTe
xas
Haw
aii
Nev
ada
Idah
oM
assa
chus
etts
Loui
siana
Arka
nsas
Miss
issip
piFl
orid
a
Total Educational Revenue Per FTE 5 Year Percent Change – FY 2008 to 2013
SC (red) is one of 36 states in which total educational revenues (educational appropriations and tuition revenues) decreased over the past 5 years.
Source: SHEEO State Higher Education Finance Survey, FY2013. Total Educational Revenue per FTE represents the sum of educational appropriations and net tuition exclusive of the portion of net tuition used for capital debt service. Federal ARRA Stimulus funds are included. Constant adjusted dollars using COLA, EMI, and HECA.
US Avg. -5.9%
SC - 9.7%
GA NC
73 1/28/2015
Deferred Maintenance
74
• Three basic maintenance categories: 1) Routine Annual Maintenance, 2) Routine Periodic Maintenance, and 3) Extraordinary/Emergency Maintenance.
• When any of these is not performed as scheduled, it then becomes “deferred” maintenance
• Deferred maintenance is typically more expensive and potentially more complicated depending on nature and severity of service deferred/required
• Many valid reasons for deferring maintenance (part of a more comprehensive project, institutional priorities, lack of appropriate funding)
1/28/2015
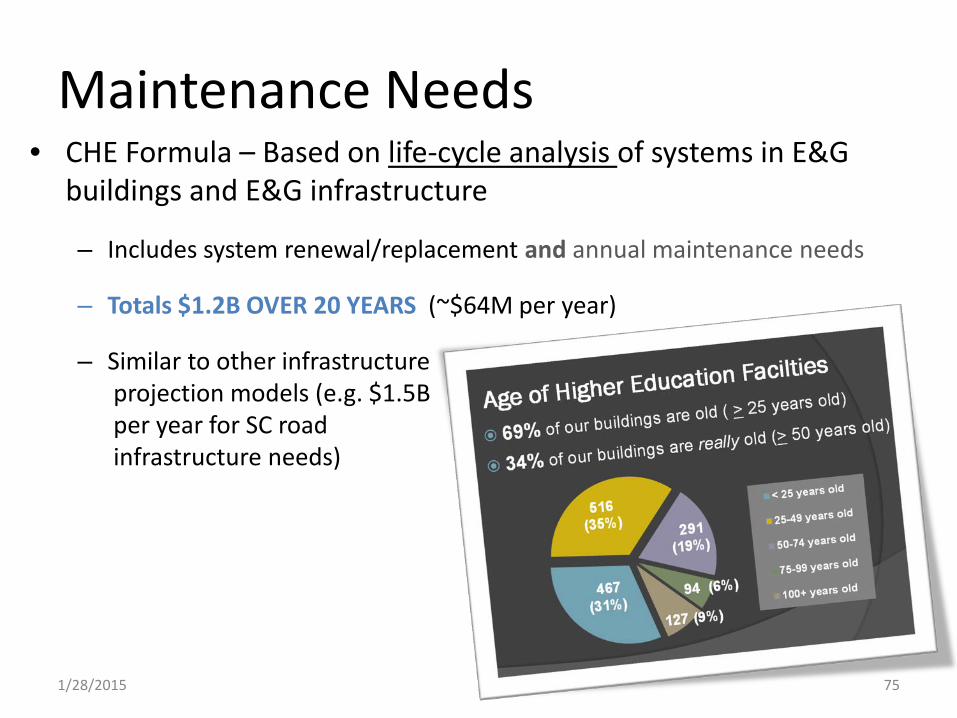
Maintenance Needs • CHE Formula – Based on life-cycle analysis of systems in E&G
buildings and E&G infrastructure
– Includes system renewal/replacement and annual maintenance needs
– Totals $1.2B OVER 20 YEARS (~$64M per year)
– Similar to other infrastructure projection models (e.g. $1.5B per year for SC road infrastructure needs)
75 1/28/2015

SCEIS
• CHE is on SCEIS • CHE must also use a separate information
system to collect and analyze campus data (CHEMIS)
• Cost-benefit of conversion to any new data system is traumatic and expensive
76 1/28/2015
CHE Appropriations & Funding
77 1/28/2015
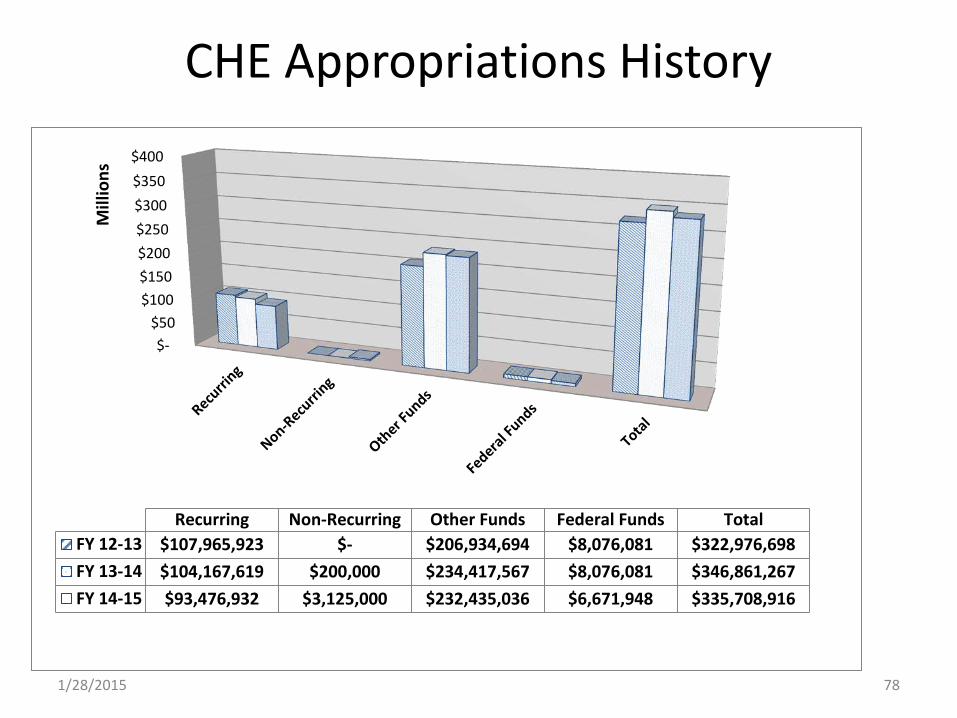
CHE Appropriations History
$- $50
$100 $150 $200 $250 $300 $350 $400
Mill
ions
Recurring Non-Recurring Other Funds Federal Funds TotalFY 12-13 $107,965,923 $- $206,934,694 $8,076,081 $322,976,698FY 13-14 $104,167,619 $200,000 $234,417,567 $8,076,081 $346,861,267FY 14-15 $93,476,932 $3,125,000 $232,435,036 $6,671,948 $335,708,916
78 1/28/2015

Recurring Appropriations
$93,476,932
Recurring Appropriations
Carryover $710,193
Other Restricted - Lottery Funds $223,890,795
Other Restricted - Lottery Funds
Carryover $8,108,170
Federal $6,671,948
Other Restricted - EIA $5,131,053
Non-Recurring Appropriations
$3,125,000
Other Funds $2,527,904
Other Funds – Restricted $885,284
Total FY14-15 Budget - $344,527,279
79
FY14-15 Current Funding
1/28/2015
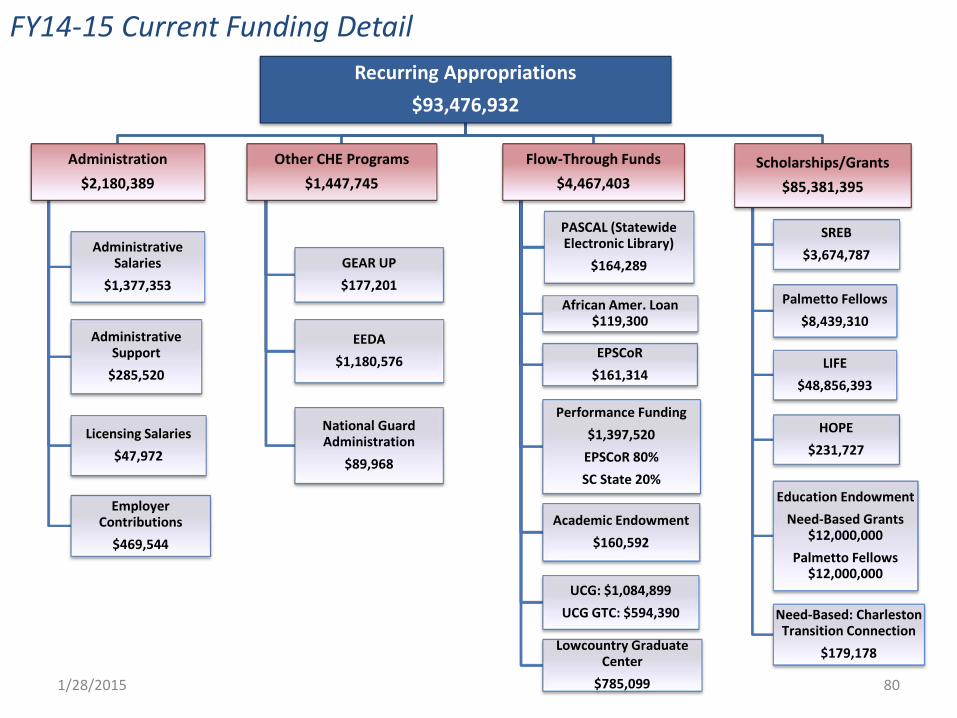
FY14-15 Current Funding Detail Recurring Appropriations
$93,476,932
Administration $2,180,389
Administrative Salaries
$1,377,353
Administrative Support
$285,520
Licensing Salaries $47,972
Employer Contributions
$469,544
Other CHE Programs $1,447,745
GEAR UP $177,201
EEDA $1,180,576
National Guard Administration
$89,968
Flow-Through Funds $4,467,403
EPSCoR $161,314
PASCAL (Statewide Electronic Library)
$164,289
African Amer. Loan $119,300
Performance Funding $1,397,520
EPSCoR 80% SC State 20%
Academic Endowment $160,592
UCG: $1,084,899 UCG GTC: $594,390
Lowcountry Graduate Center
$785,099
Scholarships/Grants $85,381,395
SREB $3,674,787
LIFE $48,856,393
HOPE $231,727
Palmetto Fellows $8,439,310
Education Endowment Need-Based Grants
$12,000,000 Palmetto Fellows
$12,000,000
Need-Based: Charleston Transition Connection
$179,178
80 1/28/2015

Recurring Appropriations Carryover $710,193
Administration $555,205
Administrative Salaries
$163,425
Administrative Support
$359,514
Employer Contributions
$32,266
Other CHE Programs $21,461
EEDA $21,423
SC Nat’l Guard CAP Administration
$38
Flow-Through Funds $31,376
African Amer. Loan $31,376
Scholarships/Grants $102,150
SREB $102,150
FY14-15 Current Funding Detail
81 1/28/2015
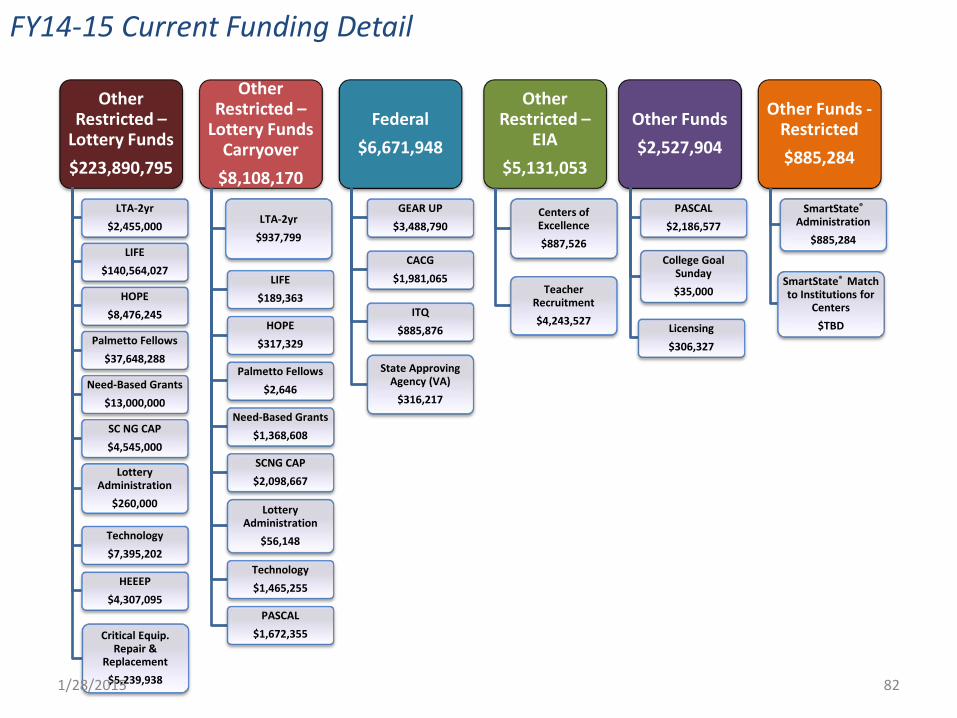
Other Funds $2,527,904
PASCAL $2,186,577
College Goal Sunday $35,000
Licensing $306,327
Other Funds - Restricted $885,284
SmartState®
Administration $885,284
SmartState® Match to Institutions for
Centers $TBD
Other Restricted –
Lottery Funds $223,890,795
LTA-2yr $2,455,000
LIFE $140,564,027
HOPE $8,476,245
Palmetto Fellows $37,648,288
Need-Based Grants $13,000,000
SC NG CAP $4,545,000
Lottery Administration
$260,000
Technology $7,395,202
HEEEP $4,307,095
Critical Equip. Repair &
Replacement $5,239,938
Other Restricted –
Lottery Funds Carryover
$8,108,170
LTA-2yr $937,799
LIFE $189,363
HOPE $317,329
Palmetto Fellows $2,646
Need-Based Grants $1,368,608
SCNG CAP $2,098,667
Lottery Administration
$56,148
Technology $1,465,255
PASCAL $1,672,355
Other Restricted –
EIA $5,131,053
Centers of Excellence $887,526
Teacher Recruitment $4,243,527
Federal $6,671,948
GEAR UP $3,488,790
CACG $1,981,065
ITQ $885,876
State Approving Agency (VA)
$316,217
FY14-15 Current Funding Detail
82 1/28/2015

FY14-15 Recurring Funding
SREB: $157,860 Status: Allocated to SREB Contact Programs (Veterinary Medicine & Optometry)
83
Increased Appropriations Received in FY14-15
1/28/2015
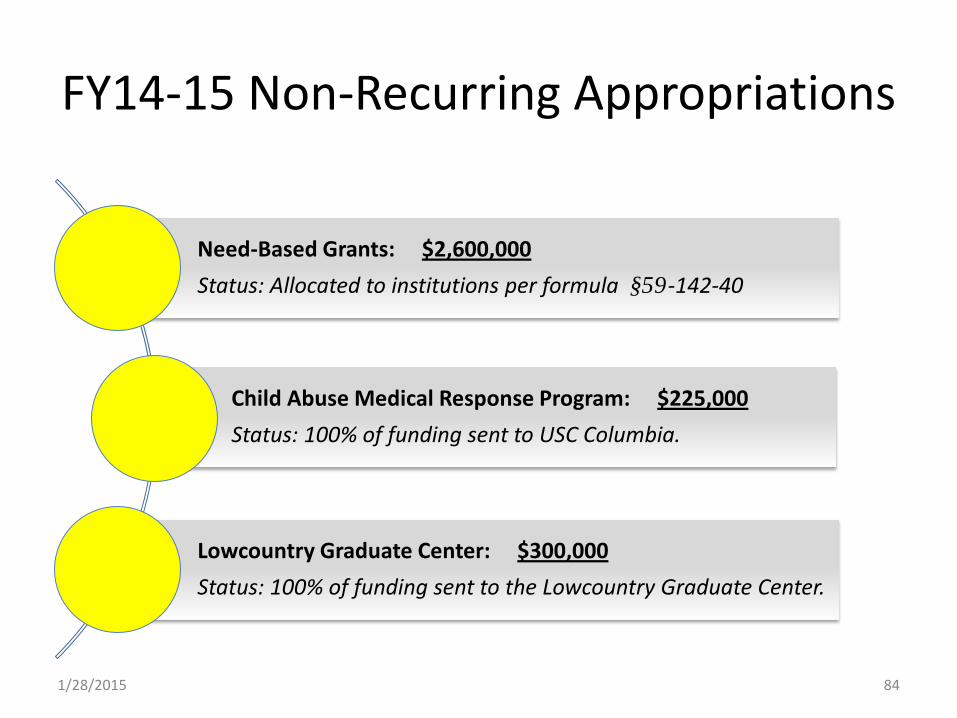
FY14-15 Non-Recurring Appropriations
Need-Based Grants: $2,600,000 Status: Allocated to institutions per formula §59-142-40
Child Abuse Medical Response Program: $225,000 Status: 100% of funding sent to USC Columbia.
Lowcountry Graduate Center: $300,000 Status: 100% of funding sent to the Lowcountry Graduate Center.
84 1/28/2015
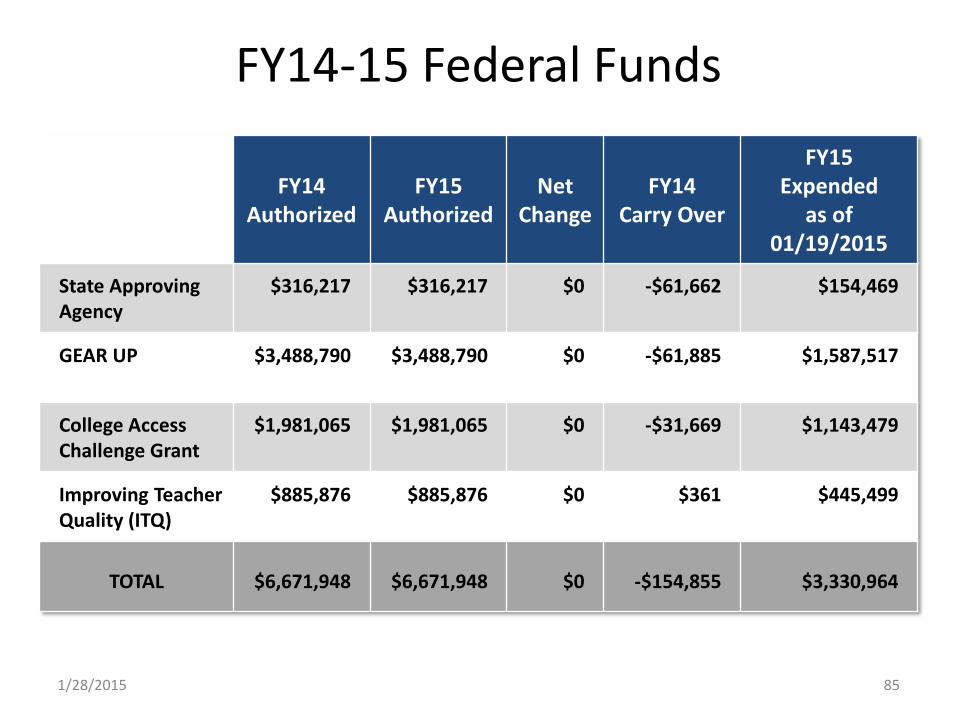
FY14-15 Federal Funds
FY14 Authorized
FY15 Authorized
Net Change
FY14 Carry Over
FY15 Expended
as of 01/19/2015
State Approving Agency
$316,217 $316,217 $0 -$61,662 $154,469
GEAR UP $3,488,790 $3,488,790 $0 -$61,885 $1,587,517
College Access Challenge Grant
$1,981,065 $1,981,065 $0 -$31,669 $1,143,479
Improving Teacher Quality (ITQ)
$885,876 $885,876 $0 $361 $445,499
TOTAL $6,671,948 $6,671,948 $0 -$154,855 $3,330,964
85 1/28/2015
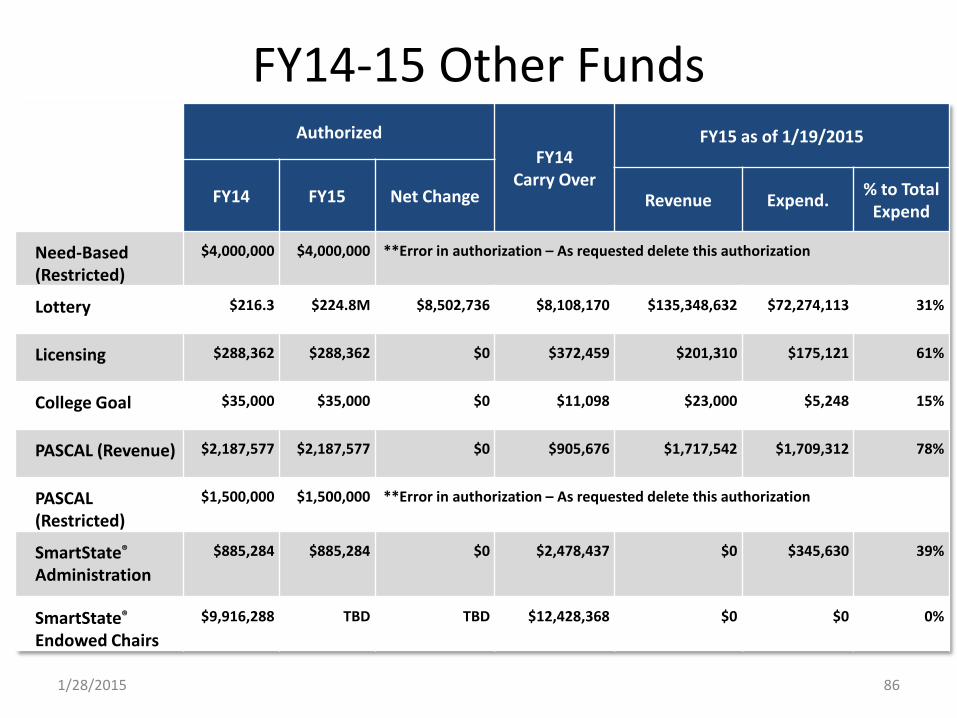
FY14-15 Other Funds Authorized
FY14 Carry Over
FY15 as of 1/19/2015
FY14 FY15 Net Change Revenue Expend. % to Total Expend
Need-Based (Restricted)
$4,000,000 $4,000,000 **Error in authorization – As requested delete this authorization
Lottery $216.3 $224.8M $8,502,736 $8,108,170 $135,348,632 $72,274,113 31%
Licensing $288,362 $288,362 $0 $372,459 $201,310 $175,121 61%
College Goal $35,000 $35,000 $0 $11,098 $23,000 $5,248 15%
PASCAL (Revenue) $2,187,577 $2,187,577 $0 $905,676 $1,717,542 $1,709,312 78%
PASCAL (Restricted)
$1,500,000 $1,500,000 **Error in authorization – As requested delete this authorization
SmartState®
Administration $885,284 $885,284 $0 $2,478,437
$0 $345,630 39%
SmartState®
Endowed Chairs $9,916,288 TBD TBD $12,428,368 $0 $0 0%
86 1/28/2015
Capital Projects and Deferred Maintenance
• N/A for our Agency
87 1/28/2015
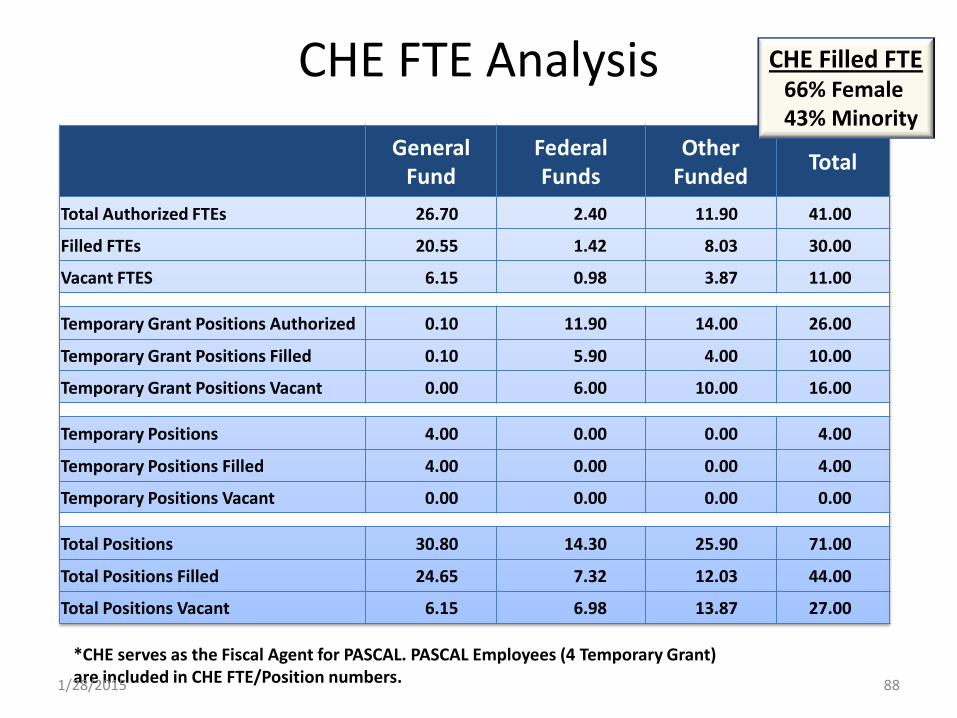
CHE FTE Analysis
General Fund
Federal Funds
Other Funded Total
Total Authorized FTEs 26.70 2.40 11.90 41.00
Filled FTEs 20.55 1.42 8.03 30.00
Vacant FTES 6.15 0.98 3.87 11.00
Temporary Grant Positions Authorized 0.10 11.90 14.00 26.00
Temporary Grant Positions Filled 0.10 5.90 4.00 10.00
Temporary Grant Positions Vacant 0.00 6.00 10.00 16.00
Temporary Positions 4.00 0.00 0.00 4.00
Temporary Positions Filled 4.00 0.00 0.00 4.00
Temporary Positions Vacant 0.00 0.00 0.00 0.00
Total Positions 30.80 14.30 25.90 71.00
Total Positions Filled 24.65 7.32 12.03 44.00
Total Positions Vacant 6.15 6.98 13.87 27.00
*CHE serves as the Fiscal Agent for PASCAL. PASCAL Employees (4 Temporary Grant) are included in CHE FTE/Position numbers. 88
CHE Filled FTE 66% Female 43% Minority
1/28/2015
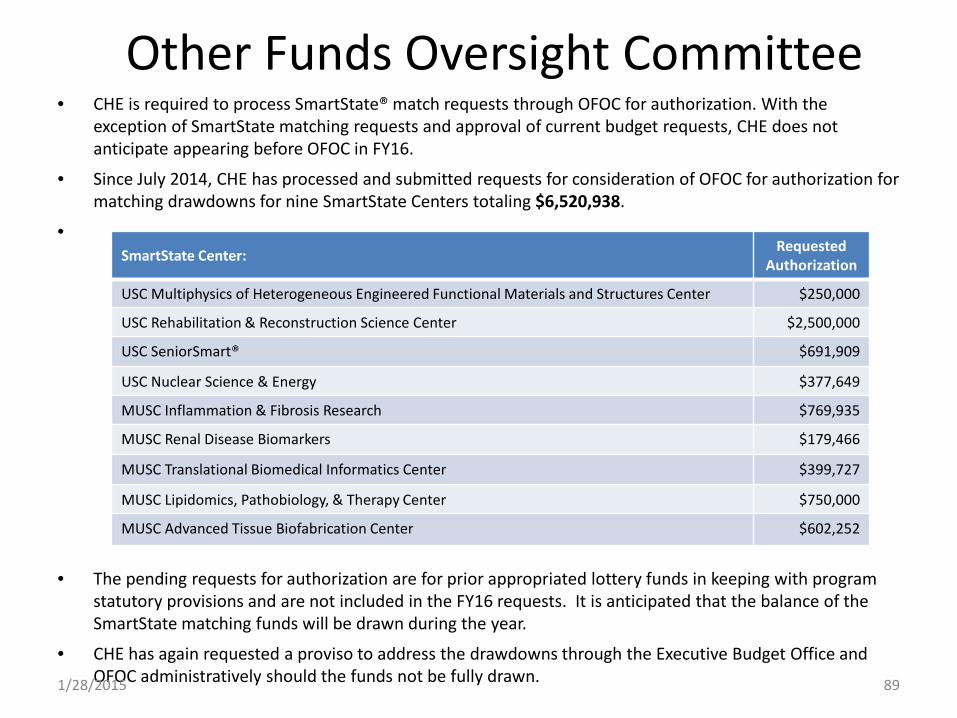
Other Funds Oversight Committee • CHE is required to process SmartState® match requests through OFOC for authorization. With the
exception of SmartState matching requests and approval of current budget requests, CHE does not anticipate appearing before OFOC in FY16.
• Since July 2014, CHE has processed and submitted requests for consideration of OFOC for authorization for matching drawdowns for nine SmartState Centers totaling $6,520,938.
•
• The pending requests for authorization are for prior appropriated lottery funds in keeping with program statutory provisions and are not included in the FY16 requests. It is anticipated that the balance of the SmartState matching funds will be drawn during the year.
• CHE has again requested a proviso to address the drawdowns through the Executive Budget Office and OFOC administratively should the funds not be fully drawn. 89
SmartState Center: Requested Authorization
USC Multiphysics of Heterogeneous Engineered Functional Materials and Structures Center $250,000
USC Rehabilitation & Reconstruction Science Center $2,500,000
USC SeniorSmart® $691,909
USC Nuclear Science & Energy $377,649
MUSC Inflammation & Fibrosis Research $769,935
MUSC Renal Disease Biomarkers $179,466
MUSC Translational Biomedical Informatics Center $399,727
MUSC Lipidomics, Pathobiology, & Therapy Center $750,000
MUSC Advanced Tissue Biofabrication Center $602,252
1/28/2015

CHE FY15-16 Budget Requests
90 1/28/2015
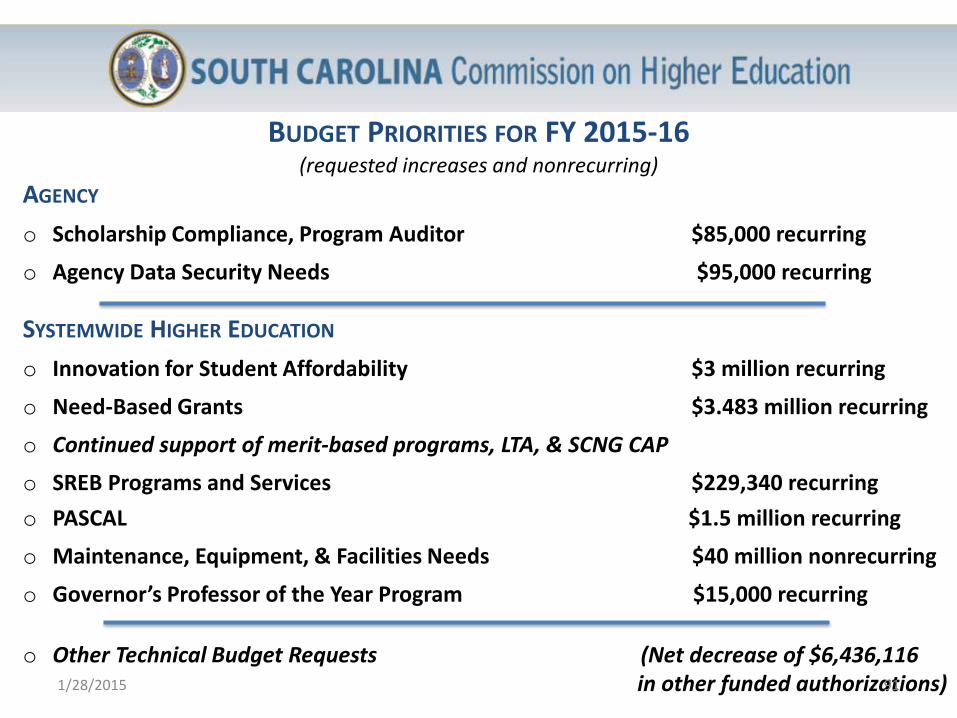
BUDGET PRIORITIES FOR FY 2015-16 (requested increases and nonrecurring)
AGENCY o Scholarship Compliance, Program Auditor $85,000 recurring
o Agency Data Security Needs $95,000 recurring
SYSTEMWIDE HIGHER EDUCATION o Innovation for Student Affordability $3 million recurring
o Need-Based Grants $3.483 million recurring
o Continued support of merit-based programs, LTA, & SCNG CAP
o SREB Programs and Services $229,340 recurring o PASCAL $1.5 million recurring
o Maintenance, Equipment, & Facilities Needs $40 million nonrecurring
o Governor’s Professor of the Year Program $15,000 recurring
o Other Technical Budget Requests (Net decrease of $6,436,116 in other funded authorizations) 91 1/28/2015

92
GENERAL FUND Requests -- SYSTEMWIDE HIGHER EDUCATION -- Item Amount
Innovations for Student Affordability $3,000,000
A primary challenge facing South Carolina students and their families is the increasing cost of attending and completing post-secondary education. This initiative for institutional Educational and General (E&G) funding provides a focused investment in realistic, practical innovations that allow students to earn degrees at less expense.
The requested funding will be awarded to institutions on a competitive basis to enhance, extend, and pilot proposed initiatives focused directly on innovations in course delivery in the form of dual enrollment and other cost-efficient strategies to accelerate college credit completion.
Need-based Grants $3,483,200
Request annualizes $2.6 million provided in FY15 in one-time funds per Proviso 118.16 and increases funding by $883,200 (3.2%). Student financial aid programs provide incentives for our students to enroll in and complete higher education in our state. Need-based aid is a critical element to enhance participation in and completion of degree programs for those with limited means. Funding for Need-based grants (public institutions) makes up only a 6% of the nearly $375 million in state-supported undergraduate financial aid.
SREB Programs & Services $229,340
SREB Contract programs offer students pursuing professional health degrees admission to schools in other states for the price of in-state tuition and fees or reduced rates at private institutions. SC participates by contracting through SREB for 24 student slots in optometry at University of AL Birmingham (8) and Southern College in TN (16) and 104 in veterinary medicine at University of GA (68), Tuskegee University (16) and MS State (20). The requested increase results from a structured increase in SREB contract prices in slots held for SC students.
Governor FY16 recommended funding as requested. 1/28/2015
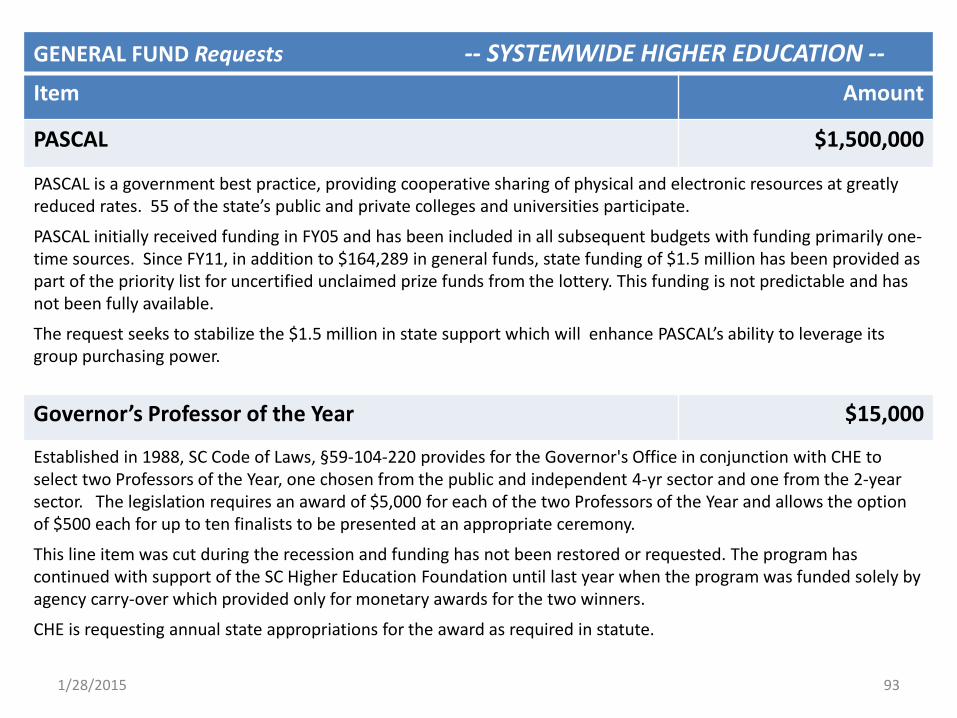
93
GENERAL FUND Requests -- SYSTEMWIDE HIGHER EDUCATION -- Item Amount
PASCAL $1,500,000
PASCAL is a government best practice, providing cooperative sharing of physical and electronic resources at greatly reduced rates. 55 of the state’s public and private colleges and universities participate.
PASCAL initially received funding in FY05 and has been included in all subsequent budgets with funding primarily one-time sources. Since FY11, in addition to $164,289 in general funds, state funding of $1.5 million has been provided as part of the priority list for uncertified unclaimed prize funds from the lottery. This funding is not predictable and has not been fully available.
The request seeks to stabilize the $1.5 million in state support which will enhance PASCAL’s ability to leverage its group purchasing power.
Governor’s Professor of the Year $15,000
Established in 1988, SC Code of Laws, §59-104-220 provides for the Governor's Office in conjunction with CHE to select two Professors of the Year, one chosen from the public and independent 4-yr sector and one from the 2-year sector. The legislation requires an award of $5,000 for each of the two Professors of the Year and allows the option of $500 each for up to ten finalists to be presented at an appropriate ceremony.
This line item was cut during the recession and funding has not been restored or requested. The program has continued with support of the SC Higher Education Foundation until last year when the program was funded solely by agency carry-over which provided only for monetary awards for the two winners.
CHE is requesting annual state appropriations for the award as required in statute.
1/28/2015
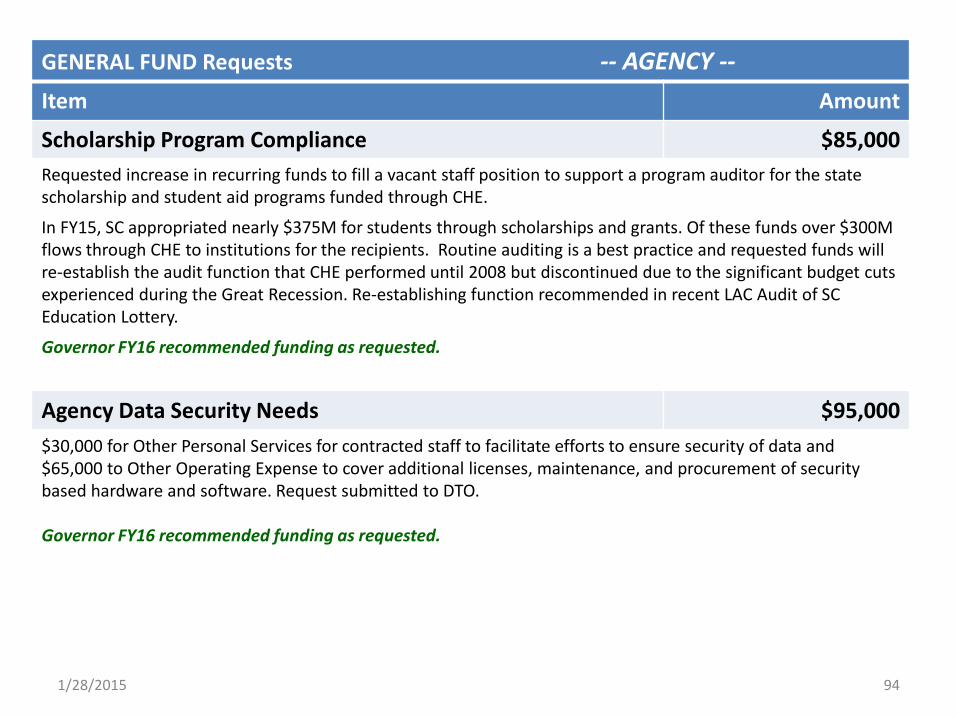
94
GENERAL FUND Requests -- AGENCY -- Item Amount
Scholarship Program Compliance $85,000 Requested increase in recurring funds to fill a vacant staff position to support a program auditor for the state scholarship and student aid programs funded through CHE.
In FY15, SC appropriated nearly $375M for students through scholarships and grants. Of these funds over $300M flows through CHE to institutions for the recipients. Routine auditing is a best practice and requested funds will re-establish the audit function that CHE performed until 2008 but discontinued due to the significant budget cuts experienced during the Great Recession. Re-establishing function recommended in recent LAC Audit of SC Education Lottery.
Governor FY16 recommended funding as requested.
Agency Data Security Needs $95,000 $30,000 for Other Personal Services for contracted staff to facilitate efforts to ensure security of data and $65,000 to Other Operating Expense to cover additional licenses, maintenance, and procurement of security based hardware and software. Request submitted to DTO. Governor FY16 recommended funding as requested.
1/28/2015

95
GENERAL FUND Requests -- AGENCY -- (Technical )
Item Amount
Incorporate appropriated FY15 Agency Pay/Health Insurance Plan Allocations
$49,108
Funds provided in August 2014 through the Budget and Control Board for agency pay/health insurance plan increases are allocated in CHE Part 1A Budget as follows: $30,895 under Section I Administration Personnel, $2,010 under Section V Licensing Personnel and $16,203 under Section IX Employer Contributions.
College Transition Connection – transfer of recurring funding line from stand-alone line to Need-based Grants
Re-alignment of budget per FY14
Proviso 11.16 The request brings CHE budget in alignment with a proviso applicable initially in FY14 by deleting the Charleston Transition Connection line in Section III and moving the General Funds of $179,180 on that line to the Need-based Grant line in Section X. There is $0 impact, and per the proviso, the funds once transferred continue to be dedicated to need-based grants for students with intellectual disabilities in recognized college transition programs.
1/28/2015

FY15-16 Non-Recurring/Capital Request
96
NON-RECURRING Requests -- SYSTEMWIDE HIGHER EDUCATION --
Item Amount
Maintenance, Equipment, and Other Facilities Needs $40,000,000 The General Assembly has provided much needed support for higher education by providing one-time funding in support of Maintenance, Equipment and Facilities. Support from FY12 – FY15 has ranged from $32 million to $68 million annually through a combination of appropriations from the Capital Reserve Fund and for the past three years, the Lottery. (Non-recurring appropriations for facilities, maintenance and equipment needs included approximately $68 million in FY13, $42 million in FY14, and $40 million in FY15) CHE is requesting a minimum of $40,000,000 (and an amount greater to the extent possible) in nonrecurring support to help reduce costs that must otherwise be supported by students and families through tuition and fees. Governor FY16 supported $30 million in funds from the Capital Reserve Fund allocated to the state’s research universities, comprehensive teaching universities, and two-year USC branches. The funds are allocated across the universities with $3 million allocated to MUSC and the remainder allocated according to the respective share of full-time equivalent in-state undergraduate students. The funds must be matched on a 3:1 basis with non-state resources. Additionally, $3.2 million in one-time funding from the Capital Reserve Fund is directed to maintenance needs at the technical colleges.
1/28/2015

Other/Federal Fund Request FY15-16
97
OTHER FUND Requests -- AGENCY -- Item Amount
College Goal Sunday Increase Authorization by $6,000
Need-based Grants Delete authorization of $4 million in other funds that was never funded
PASCAL Net decrease of $500,000 in other funds authorization: includes increase of $1M in
operating revenues and decrease of $1.5M in other funds restricted revenues not
realized
FEDERAL FUND requests -- AGENCY -- Item Amount
College Access Challenge Grant Grant ended. Remove program and authorization of $1,942,116
1/28/2015
FY 15-16 Provisos
98 1/28/2015
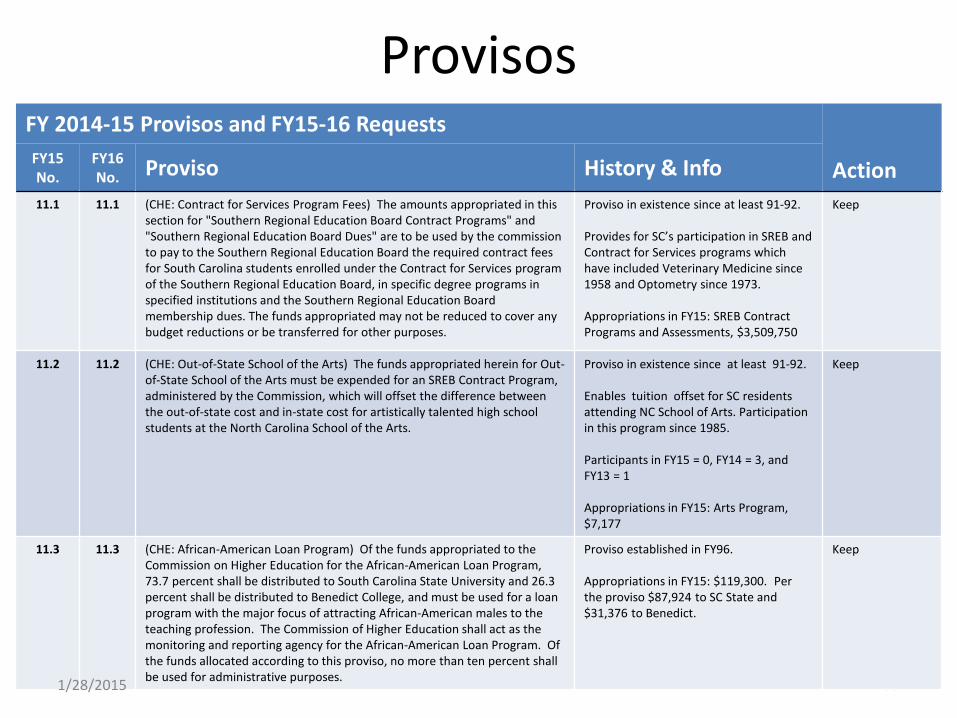
Provisos
99
FY 2014-15 Provisos and FY15-16 Requests Action FY15
No. FY16 No. Proviso History & Info
11.1 11.1 (CHE: Contract for Services Program Fees) The amounts appropriated in this section for "Southern Regional Education Board Contract Programs" and "Southern Regional Education Board Dues" are to be used by the commission to pay to the Southern Regional Education Board the required contract fees for South Carolina students enrolled under the Contract for Services program of the Southern Regional Education Board, in specific degree programs in specified institutions and the Southern Regional Education Board membership dues. The funds appropriated may not be reduced to cover any budget reductions or be transferred for other purposes.
Proviso in existence since at least 91-92. Provides for SC’s participation in SREB and Contract for Services programs which have included Veterinary Medicine since 1958 and Optometry since 1973. Appropriations in FY15: SREB Contract Programs and Assessments, $3,509,750
Keep
11.2 11.2 (CHE: Out-of-State School of the Arts) The funds appropriated herein for Out-of-State School of the Arts must be expended for an SREB Contract Program, administered by the Commission, which will offset the difference between the out-of-state cost and in-state cost for artistically talented high school students at the North Carolina School of the Arts.
Proviso in existence since at least 91-92. Enables tuition offset for SC residents attending NC School of Arts. Participation in this program since 1985. Participants in FY15 = 0, FY14 = 3, and FY13 = 1 Appropriations in FY15: Arts Program, $7,177
Keep
11.3 11.3 (CHE: African-American Loan Program) Of the funds appropriated to the Commission on Higher Education for the African-American Loan Program, 73.7 percent shall be distributed to South Carolina State University and 26.3 percent shall be distributed to Benedict College, and must be used for a loan program with the major focus of attracting African-American males to the teaching profession. The Commission of Higher Education shall act as the monitoring and reporting agency for the African-American Loan Program. Of the funds allocated according to this proviso, no more than ten percent shall be used for administrative purposes.
Proviso established in FY96. Appropriations in FY15: $119,300. Per the proviso $87,924 to SC State and $31,376 to Benedict.
Keep
1/28/2015
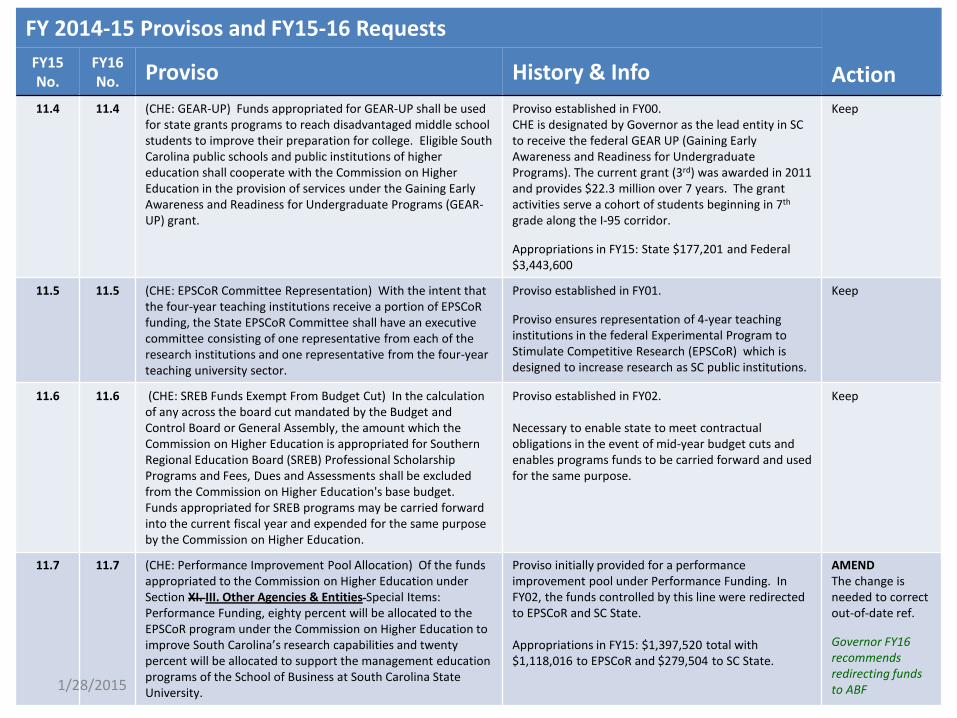
100
FY 2014-15 Provisos and FY15-16 Requests Action FY15
No. FY16 No. Proviso History & Info
11.4 11.4 (CHE: GEAR-UP) Funds appropriated for GEAR-UP shall be used for state grants programs to reach disadvantaged middle school students to improve their preparation for college. Eligible South Carolina public schools and public institutions of higher education shall cooperate with the Commission on Higher Education in the provision of services under the Gaining Early Awareness and Readiness for Undergraduate Programs (GEAR-UP) grant.
Proviso established in FY00. CHE is designated by Governor as the lead entity in SC to receive the federal GEAR UP (Gaining Early Awareness and Readiness for Undergraduate Programs). The current grant (3rd) was awarded in 2011 and provides $22.3 million over 7 years. The grant activities serve a cohort of students beginning in 7th grade along the I-95 corridor. Appropriations in FY15: State $177,201 and Federal $3,443,600
Keep
11.5 11.5 (CHE: EPSCoR Committee Representation) With the intent that the four-year teaching institutions receive a portion of EPSCoR funding, the State EPSCoR Committee shall have an executive committee consisting of one representative from each of the research institutions and one representative from the four-year teaching university sector.
Proviso established in FY01. Proviso ensures representation of 4-year teaching institutions in the federal Experimental Program to Stimulate Competitive Research (EPSCoR) which is designed to increase research as SC public institutions.
Keep
11.6 11.6 (CHE: SREB Funds Exempt From Budget Cut) In the calculation of any across the board cut mandated by the Budget and Control Board or General Assembly, the amount which the Commission on Higher Education is appropriated for Southern Regional Education Board (SREB) Professional Scholarship Programs and Fees, Dues and Assessments shall be excluded from the Commission on Higher Education's base budget. Funds appropriated for SREB programs may be carried forward into the current fiscal year and expended for the same purpose by the Commission on Higher Education.
Proviso established in FY02. Necessary to enable state to meet contractual obligations in the event of mid-year budget cuts and enables programs funds to be carried forward and used for the same purpose.
Keep
11.7 11.7 (CHE: Performance Improvement Pool Allocation) Of the funds appropriated to the Commission on Higher Education under Section XI. III. Other Agencies & Entities Special Items: Performance Funding, eighty percent will be allocated to the EPSCoR program under the Commission on Higher Education to improve South Carolina’s research capabilities and twenty percent will be allocated to support the management education programs of the School of Business at South Carolina State University.
Proviso initially provided for a performance improvement pool under Performance Funding. In FY02, the funds controlled by this line were redirected to EPSCoR and SC State. Appropriations in FY15: $1,397,520 total with $1,118,016 to EPSCoR and $279,504 to SC State.
AMEND The change is needed to correct out-of-date ref. Governor FY16 recommends redirecting funds to ABF 1/28/2015
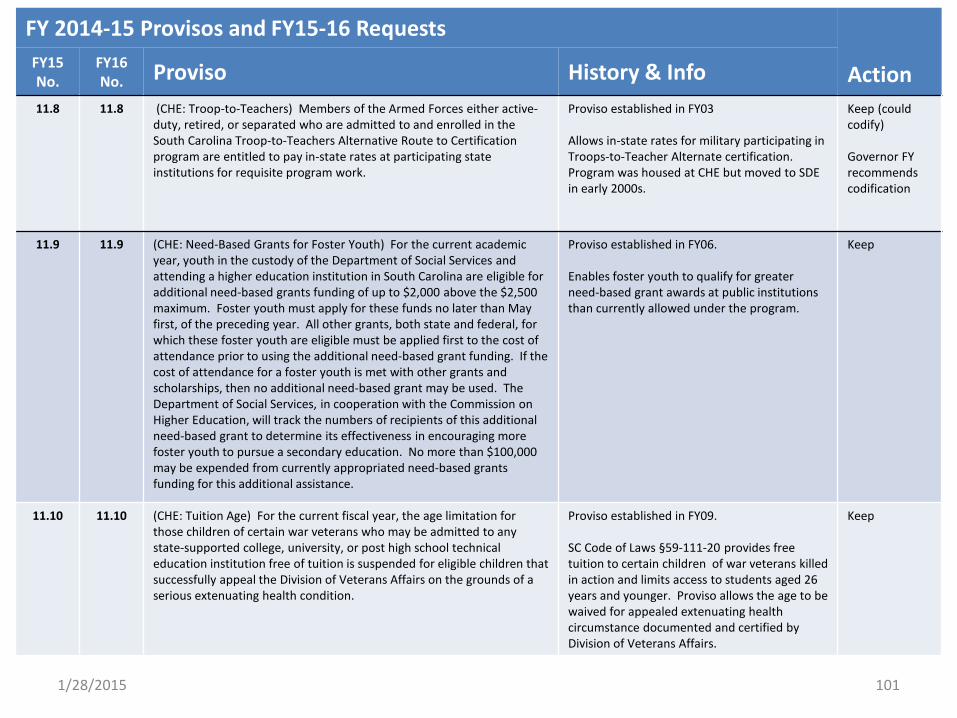
101
FY 2014-15 Provisos and FY15-16 Requests Action FY15
No. FY16 No. Proviso History & Info
11.8 11.8 (CHE: Troop-to-Teachers) Members of the Armed Forces either active-duty, retired, or separated who are admitted to and enrolled in the South Carolina Troop-to-Teachers Alternative Route to Certification program are entitled to pay in-state rates at participating state institutions for requisite program work.
Proviso established in FY03 Allows in-state rates for military participating in Troops-to-Teacher Alternate certification. Program was housed at CHE but moved to SDE in early 2000s.
Keep (could codify) Governor FY recommends codification
11.9 11.9 (CHE: Need-Based Grants for Foster Youth) For the current academic year, youth in the custody of the Department of Social Services and attending a higher education institution in South Carolina are eligible for additional need-based grants funding of up to $2,000 above the $2,500 maximum. Foster youth must apply for these funds no later than May first, of the preceding year. All other grants, both state and federal, for which these foster youth are eligible must be applied first to the cost of attendance prior to using the additional need-based grant funding. If the cost of attendance for a foster youth is met with other grants and scholarships, then no additional need-based grant may be used. The Department of Social Services, in cooperation with the Commission on Higher Education, will track the numbers of recipients of this additional need-based grant to determine its effectiveness in encouraging more foster youth to pursue a secondary education. No more than $100,000 may be expended from currently appropriated need-based grants funding for this additional assistance.
Proviso established in FY06. Enables foster youth to qualify for greater need-based grant awards at public institutions than currently allowed under the program.
Keep
11.10 11.10 (CHE: Tuition Age) For the current fiscal year, the age limitation for those children of certain war veterans who may be admitted to any state-supported college, university, or post high school technical education institution free of tuition is suspended for eligible children that successfully appeal the Division of Veterans Affairs on the grounds of a serious extenuating health condition.
Proviso established in FY09. SC Code of Laws §59-111-20 provides free tuition to certain children of war veterans killed in action and limits access to students aged 26 years and younger. Proviso allows the age to be waived for appealed extenuating health circumstance documented and certified by Division of Veterans Affairs.
Keep
1/28/2015

102
FY 2014-15 Provisos and FY15-16 Requests Action FY15
No. FY16 No. Proviso History & Info
11.11 11.11 (CHE: LIFE and Palmetto Fellows Enhancement Stipends) In the current fiscal year before fall awards are made, to continue eligibility for LIFE and Palmetto Fellows Enhancement Stipends, students shall certify and the institutions shall verify that the student is meeting all requirements as stipulated by the policies established by the institution and the academic department to be enrolled as a declared major in an eligible program and is making academic progress toward completion of the student's declared eligible major. These determinations are subject to the verification and audit of the Commission on Higher Education. Institutions shall return funds determined to have been awarded to ineligible students.
Proviso established in FY11 Keep Governor FY16 recommends codification
11.12 11.12 (CHE: SmartState) The Commission on Higher Education is prohibited from expending any source of funds on the marketing of the SmartState Program.
Proviso established in FY13
11.13 11.13 (CHE: Higher Education Excellence Enhancement Program Additions) Converse College and Columbia College shall be eligible to receive funds under the Higher Education Excellence Enhancement Program.
Proviso established initially in FY04, deleted in FY 2012-13 and re-established in FY 2013-14 HEEEP operates pursuant to §2-77-10 et seq. Eligible institutions per statute in HBCUs (SC State, Allen, Benedict, Claflin, Morris, and Voorhees). The proviso enables Converse and Columbia College to participate
11.15 11.14 (CHE: SCNG CAP Carry Forward) Funds appropriated for the South Carolina National Guard College Assistance Program may be carried forward from the prior fiscal year into the current fiscal year and expended for the same purpose. If a mid-year budget reduction is imposed by the General Assembly or the State Budget and Control Board, the appropriations for the program are exempt.
Proviso established in FY14 and was codified with Act 151 of 2014. The permanent statutory provision is §59-114-65.
DELETE Governor FY16 recommends deletion
1/28/2015

103
FY 2014-15 Provisos and FY15-16 Requests Action FY15
No. FY16 No. Proviso History & Info
11.16 11.15 (CHE: College Transition Need-Based Grants) Of the currently appropriated need-based grants funding, no more than $179,178 shall be used to provide need-based grants to South Carolina resident students enrolled at a public institution of higher education in an established college transition program that serves students with intellectual disabilities. The Commission on Higher Education shall allocate the available funds to eligible institutions on the basis of student need and enrollment in the established college transition programs. All other grants and gift aid for which these students are eligible must be applied first to the cost of attendance prior to using the need-based grant funding. If the cost of attendance for an eligible student is met with all other grants and gift aid, the need-based grant shall not be used. The participating institutions, in cooperation with the Commission on Higher Education, shall track the number of grant recipients and other information determined necessary to evaluate the effectiveness of these grants in assisting students with intellectual disabilities in college transition programs.
Proviso established in FY14 and updated in FY15 for continuation. Proviso established to re-direct recurring funding provided to a non-profit (Charleston Transition Connection) to be dedicated to need-based grant assistance for students now enrolled in recognized transition programs (USC, Clemson, College of Chas., Coastal, and as of spring 2015, Winthrop). The dedicated funding is $179,178, the level of CTC appropriations since FY12. CTC received recurring funding initially in FY08.
Keep
11.18 11.16 (CHE: Mission, Ethics and Values Statements) Each public institution of higher learning shall submit a report that denotes their mission, ethics, and values statements to the members of the General Assembly by January 3, 2015.
Proviso established in FY15.
Governor FY16 recommends deletion. Reports submitted.
11.20 11.17 (CHE: Distribution of Materials on College Campuses) Public institutions of higher education shall not impose restrictions on the distribution of the Constitution of the United States or the Constitution of the State of South Carolina by students properly enrolled in the institution or otherwise eligible to enter the institution's property, so long as the distribution does not interrupt a class in session, a school-wide assembly or other school sponsored function. Distribution of copies of the Constitution of the United States or the Constitution of the State of South Carolina on which unrelated materials or paraphernalia are attached to, or that are inserted or included within copies of either Constitution are not subject to the requirements of this proviso. For purposes of this proviso, an athletic event is not considered a class, school-wide assembly or school sponsored function.
Proviso established in FY15
1/28/2015
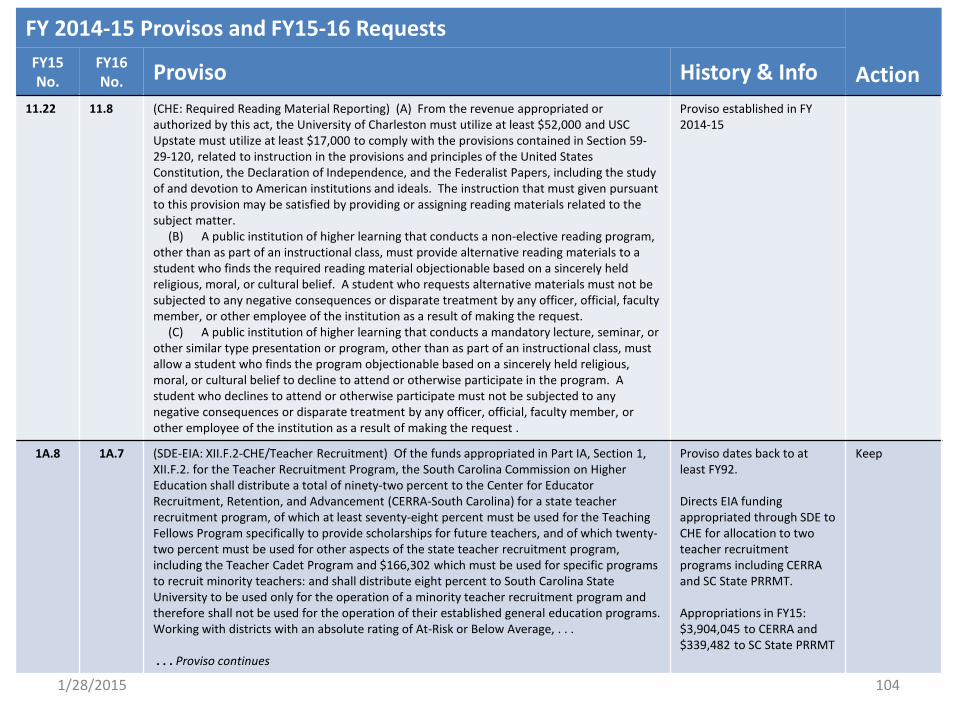
104
FY 2014-15 Provisos and FY15-16 Requests Action FY15
No. FY16 No. Proviso History & Info
11.22 11.8 (CHE: Required Reading Material Reporting) (A) From the revenue appropriated or authorized by this act, the University of Charleston must utilize at least $52,000 and USC Upstate must utilize at least $17,000 to comply with the provisions contained in Section 59-29-120, related to instruction in the provisions and principles of the United States Constitution, the Declaration of Independence, and the Federalist Papers, including the study of and devotion to American institutions and ideals. The instruction that must given pursuant to this provision may be satisfied by providing or assigning reading materials related to the subject matter. (B) A public institution of higher learning that conducts a non-elective reading program, other than as part of an instructional class, must provide alternative reading materials to a student who finds the required reading material objectionable based on a sincerely held religious, moral, or cultural belief. A student who requests alternative materials must not be subjected to any negative consequences or disparate treatment by any officer, official, faculty member, or other employee of the institution as a result of making the request. (C) A public institution of higher learning that conducts a mandatory lecture, seminar, or other similar type presentation or program, other than as part of an instructional class, must allow a student who finds the program objectionable based on a sincerely held religious, moral, or cultural belief to decline to attend or otherwise participate in the program. A student who declines to attend or otherwise participate must not be subjected to any negative consequences or disparate treatment by any officer, official, faculty member, or other employee of the institution as a result of making the request .
Proviso established in FY 2014-15
1A.8 1A.7 (SDE-EIA: XII.F.2-CHE/Teacher Recruitment) Of the funds appropriated in Part IA, Section 1, XII.F.2. for the Teacher Recruitment Program, the South Carolina Commission on Higher Education shall distribute a total of ninety-two percent to the Center for Educator Recruitment, Retention, and Advancement (CERRA-South Carolina) for a state teacher recruitment program, of which at least seventy-eight percent must be used for the Teaching Fellows Program specifically to provide scholarships for future teachers, and of which twenty-two percent must be used for other aspects of the state teacher recruitment program, including the Teacher Cadet Program and $166,302 which must be used for specific programs to recruit minority teachers: and shall distribute eight percent to South Carolina State University to be used only for the operation of a minority teacher recruitment program and therefore shall not be used for the operation of their established general education programs. Working with districts with an absolute rating of At-Risk or Below Average, . . . . . . Proviso continues
Proviso dates back to at least FY92. Directs EIA funding appropriated through SDE to CHE for allocation to two teacher recruitment programs including CERRA and SC State PRRMT. Appropriations in FY15: $3,904,045 to CERRA and $339,482 to SC State PRRMT
Keep
1/28/2015

105
FY 2014-15 Provisos and FY15-16 Requests Action FY15
No. FY16 No. Proviso History & Info
1A.36 1A.33 (SDE-EIA: Centers of Excellence) Of the funds appropriated for Centers of Excellence, $350,000 must be allocated to the Francis Marion University Center of Excellence to Prepare Teachers of Children of Poverty to expand statewide training for individuals who teach children of poverty through weekend college, non-traditional or alternative learning opportunities. Furthermore, with increased funds provided, the Commission on Higher Education will fund a new center in Fiscal Year 2014-15 that will provide professional development to teachers to enable them to transform the P-12 experience to create a college-going and career readiness culture that prepares students for postsecondary education and the world of work.
Proviso established in FY12 when funding for Francis Marion Center was directed for allocation through CHE Centers of Excellence rather than through SDE. The proviso was amended in FY15 to direct new funding provided for the award of a Center of Excellence focused on college and career readiness.
Appropriations: EIA funds totaling $1,137,526 with $787,526 to CHE for Centers of Excellence Program and $350,000 directed to Francis Marion Centers of Excellence to Prepare Teachers of Children of Poverty.
Keep
3.2 3.2 (LEA: Technology Lottery Funds) For the purposes of the allocation of technology funds from the lottery proceeds, $125,000 shall be transferred from the portion designated for two-year institutions to the portion designated for four-year institutions for each University of South Carolina two-year institution that has moved to a four-year status since 2000.
Keep
3.5 3.4 (LEA: FY 2014-15 Lottery Funding) Excerpt from FY15 Expenditure Proviso: A student may receive a Palmetto Fellows or LIFE scholarship award during the summer, in addition to fall and spring semesters of an academic year, provided continued eligibility requirements are met as of the end of the spring semester. Students must enroll full-time, which for purposes of the summer award will require enrollment in at least twelve hours over the course of the summer. The summer is defined as the period between the end of the spring term and prior to the opening of the fall term. The total summer award per student may not exceed half of the allowable academic year award up to the cost of attendance and must be reimbursed if less than twelve hours for academic credit are not completed by the student during summer sessions. If awarded in the summer, a student's total award during his or her enrollment may not exceed the amount that would otherwise be provided under current semester limits applied for the scholarship awards. The Commission on Higher Education may provide additional guidelines necessary to ensure uniform implementation.
Note on Summer Eligibility for LIFE and Palmetto Fellows: The General Assembly established in the FY15 budget provisions at left to initiate awards of Palmetto Fellows and LIFE in the Summer. The provisions need to be continued as the piloting of the year-round awards is underway. Guidelines have been developed for use in Summer 2015.
1/28/2015
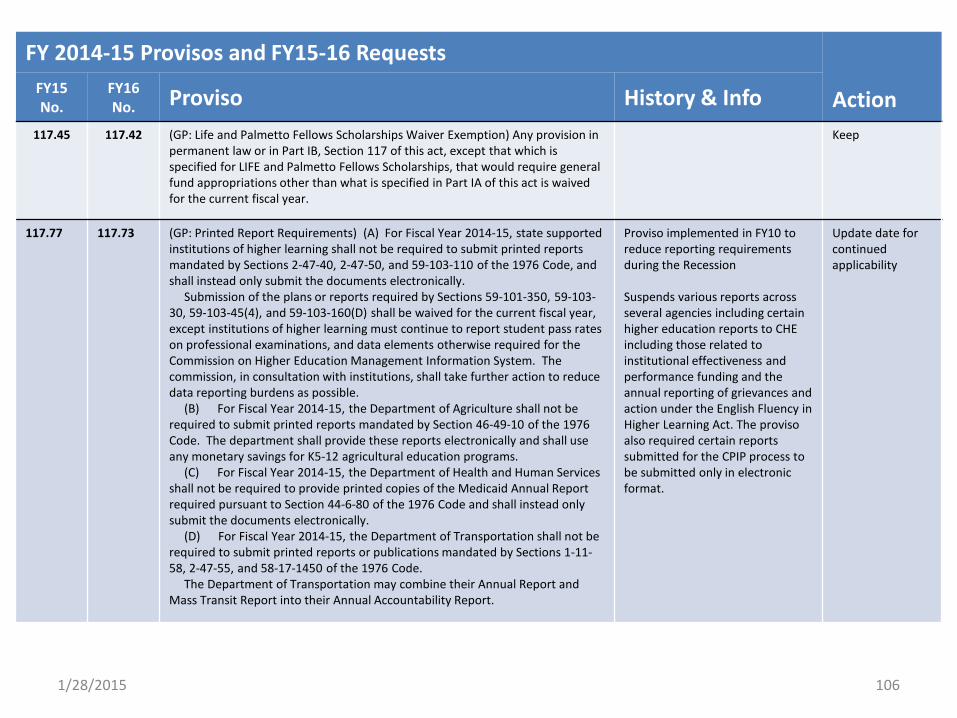
106
FY 2014-15 Provisos and FY15-16 Requests Action FY15
No. FY16 No. Proviso History & Info
117.45 117.42 (GP: Life and Palmetto Fellows Scholarships Waiver Exemption) Any provision in permanent law or in Part IB, Section 117 of this act, except that which is specified for LIFE and Palmetto Fellows Scholarships, that would require general fund appropriations other than what is specified in Part IA of this act is waived for the current fiscal year.
Keep
117.77 117.73 (GP: Printed Report Requirements) (A) For Fiscal Year 2014-15, state supported institutions of higher learning shall not be required to submit printed reports mandated by Sections 2-47-40, 2-47-50, and 59-103-110 of the 1976 Code, and shall instead only submit the documents electronically. Submission of the plans or reports required by Sections 59-101-350, 59-103-30, 59-103-45(4), and 59-103-160(D) shall be waived for the current fiscal year, except institutions of higher learning must continue to report student pass rates on professional examinations, and data elements otherwise required for the Commission on Higher Education Management Information System. The commission, in consultation with institutions, shall take further action to reduce data reporting burdens as possible. (B) For Fiscal Year 2014-15, the Department of Agriculture shall not be required to submit printed reports mandated by Section 46-49-10 of the 1976 Code. The department shall provide these reports electronically and shall use any monetary savings for K5-12 agricultural education programs. (C) For Fiscal Year 2014-15, the Department of Health and Human Services shall not be required to provide printed copies of the Medicaid Annual Report required pursuant to Section 44-6-80 of the 1976 Code and shall instead only submit the documents electronically. (D) For Fiscal Year 2014-15, the Department of Transportation shall not be required to submit printed reports or publications mandated by Sections 1-11-58, 2-47-55, and 58-17-1450 of the 1976 Code. The Department of Transportation may combine their Annual Report and Mass Transit Report into their Annual Accountability Report.
Proviso implemented in FY10 to reduce reporting requirements during the Recession Suspends various reports across several agencies including certain higher education reports to CHE including those related to institutional effectiveness and performance funding and the annual reporting of grievances and action under the English Fluency in Higher Learning Act. The proviso also required certain reports submitted for the CPIP process to be submitted only in electronic format.
Update date for continued applicability
1/28/2015
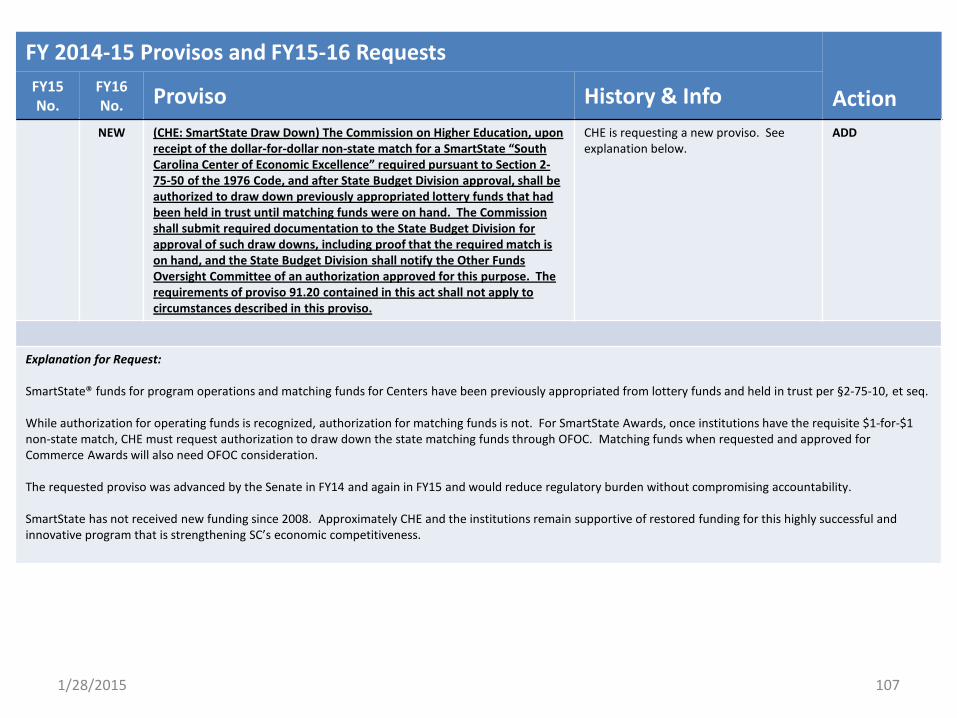
107
FY 2014-15 Provisos and FY15-16 Requests Action FY15
No. FY16 No. Proviso History & Info NEW (CHE: SmartState Draw Down) The Commission on Higher Education, upon
receipt of the dollar-for-dollar non-state match for a SmartState “South Carolina Center of Economic Excellence” required pursuant to Section 2-75-50 of the 1976 Code, and after State Budget Division approval, shall be authorized to draw down previously appropriated lottery funds that had been held in trust until matching funds were on hand. The Commission shall submit required documentation to the State Budget Division for approval of such draw downs, including proof that the required match is on hand, and the State Budget Division shall notify the Other Funds Oversight Committee of an authorization approved for this purpose. The requirements of proviso 91.20 contained in this act shall not apply to circumstances described in this proviso.
CHE is requesting a new proviso. See explanation below.
ADD
Explanation for Request:
SmartState® funds for program operations and matching funds for Centers have been previously appropriated from lottery funds and held in trust per §2-75-10, et seq.
While authorization for operating funds is recognized, authorization for matching funds is not. For SmartState Awards, once institutions have the requisite $1-for-$1 non-state match, CHE must request authorization to draw down the state matching funds through OFOC. Matching funds when requested and approved for Commerce Awards will also need OFOC consideration.
The requested proviso was advanced by the Senate in FY14 and again in FY15 and would reduce regulatory burden without compromising accountability.
SmartState has not received new funding since 2008. Approximately CHE and the institutions remain supportive of restored funding for this highly successful and innovative program that is strengthening SC’s economic competitiveness.
1/28/2015

108
QUESTIONS?
THANK YOU !
1/28/2015