Hotspots and habitat associations of urban mammals People ... · Urban mammals Baseline information...
40
Hotspots and habitat associations of urban mammals People, Cities and Nature: John Innes H , Neil Fitzgerald H , Stephen Hartley w , Cherie Balls w Deb Wilson D , Yolanda van Heezik D , Hayley Ricardo D , Kim Miller D
Transcript of Hotspots and habitat associations of urban mammals People ... · Urban mammals Baseline information...

Hotspots and habitat associations of urban mammals
People, Cities and Nature:John InnesH, Neil FitzgeraldH,
Stephen Hartleyw, Cherie Ballsw
Deb WilsonD, Yolanda van HeezikD, Hayley RicardoD, Kim MillerD

Urban mammals
Baseline information on abundance & distribution • Survey 6 cities, 3 habitats, 2 seasons
• Develop and evaluate monitoring tools for use in an urban environment (for councils and community groups)
• Develop spatially-explicit models of predator activity in urban landscapes.
Relate predator control effort to output (pest responses)
Relate predator control effort to biodiversity outcomes• Before & After / Control-Impact (BACI) comparisons in Hamilton, Wgton & Dunedin
• Biodiversity measures = lizards and large inverts in pitfalls, weta motels (in 3 cities)
• Bird nesting success in Hamilton

Mapping effort-to-impactIntensity of
predator control
Predator numbers
Biodiversity benefits
Backyard trapping
Forest reserves
Rats
Possums

Mammal MonitoringPredator surveys – May & Nov
Study sites:
• Hamilton
• Dunedin
• Wellington
• New Plymouth
• Tauranga
• Nelson
Species of interest:
• Rats (Norway and ship)
• Mice
• Hedgehogs
• Mustelids
• Possums
• Cats

Survey design
• Three broad habitats:
• Amenity spaces
• Forest
• Residential gardens
• Four (or eight) transects per habitat type

Dunedin

Hamilton

Wellington
8 Suburbs x
3 Habitat types
●Amenity
●Forest
●Residential gardens
= 24 transects
!(!(!(!(!(!(!(!(!(!(
!(!(!(!(!(!(!(!(!(!(
!(!(!(!(!(!(!(!(!(!(
!(!(!(!(!(!(!(!(!(!(
!(!(!(!(!(!(!(!(!(!(!( !(
!(!(!(!(!(!(!(!(
!(!(!(!(!(!(!(!(!(!(
!(!(!(!(!(!(!(!(!(!(
!(!(!(!(!(!(!(!(!(!(
!(!(!(!(!(!(!(!(!(!(
!(!(!(!(!(!(!(!(!(!(
!(!(!(!(!(!(!(!(!(!(
!(!(!(!(!(!(!(!(!(!(
!(!(!(!(!(!(!(!(!(!(
!(!(!(!(!(!(!(!(!(!(
!(!(!(!(!(!(!(!(!(!(
!(!(!(!(!(!(!(!(!(!(
!(!(!(!(!(!(!(!(!(!(
!(!(!(!(!(!(!(!(!(!(
!(!(!(!(!(!(!(!(!(!(
!(!(!(!(!(!(!(!(!(!(
!(!(!(!(!(!(!(!(!(!(
!(!(!(!(!(!(!(!(!(!(
!(!(!(!(!(!(!(!(!(!(
!(!(!(!(!(!(!(!(!(!(
!(!(!(!(!(!(!(!(!(!(
!(!(!(!(!(!(!(!(!(
!(
!(!(!(!(!(!(!(!(!(!(
!(!(!(!(!(!(!(!(!(!(!( !(
!(!(!(!(!(!(!(!(
!(!(!(!(!(!(!(!(!(!(
!(!(!(!(!(!(!(!(!(!(
!(!(!(!(!(!(!(!(!(!(
!(!(!(!(!(!(!(!(!(!(
!(!(!(!(!(!(!(!(!(!(
!(!(!(!(!(!(!(!(!(!(
!(!(!(!(!(!(!(!(!(!(
!(!(!(!(!(!(!(!(!(!(
!(!(!(!(!(!(!(!(!(!(
!(!(!(!(!(!(!(!(!(!(
!(!(!(!(!(!(!(!(!(!(
!(!(!(!(!(!(!(!(!(!(
!(!(!(!(!(!(!(!(!(!(
!(!(!(!(!(!(!(!(!(!(
!(!(!(!(!(!(!(!(!(!(
!(!(!(!(!(!(!(!(!(!(
!(!(!(!(!(!(!(!(!(!(
!(!(!(!(!(!(!(!(!(!(
Sourced from the LINZ Data Service and licensed for re-use under the Creative Commons Attribution 4.0 New
0 2 41Km
PCaN monitoring lines
Habitat
!( Amenity
!( Forest
!( Garden

Nelson
Mammal monitoring in 2 Habitat types
oAmenity
●Forest Reserve
= 8 transects
1 Season
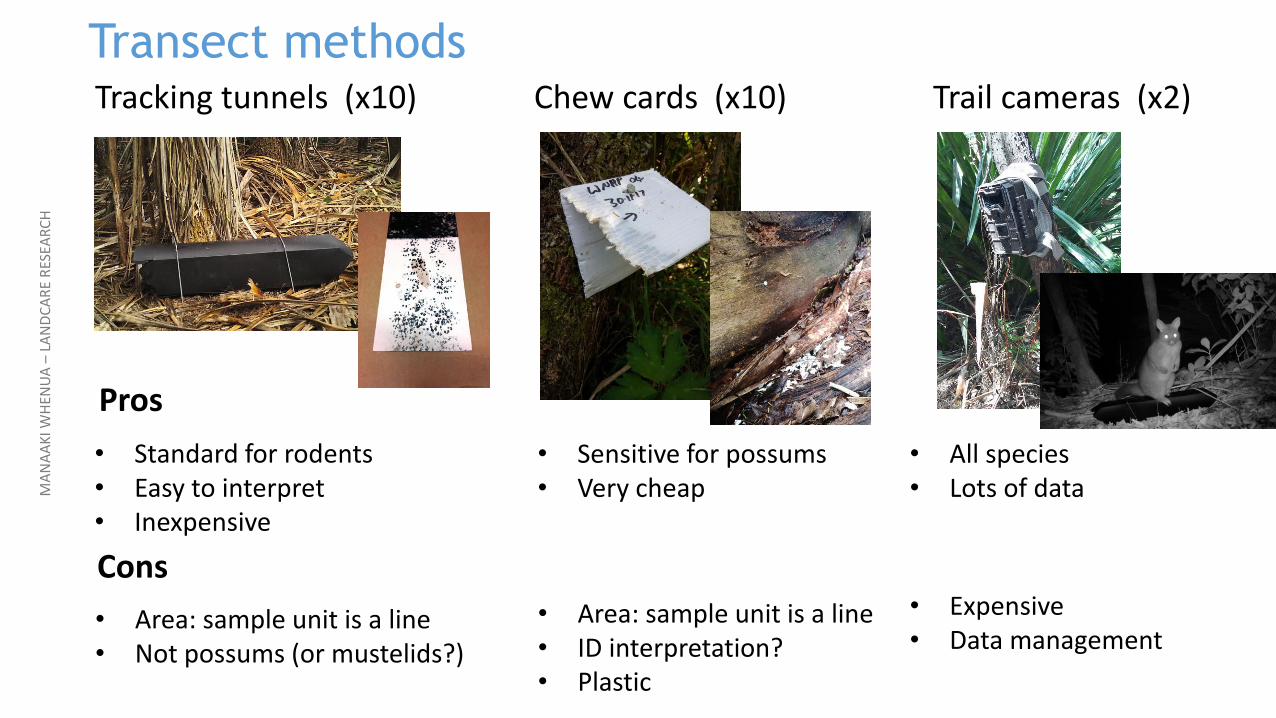
Tracking tunnels (x10) Chew cards (x10) Trail cameras (x2)
MA
NA
AK
I WH
ENU
A –
LAN
DC
AR
E R
ESEA
RC
H
Pros
Cons
• Standard for rodents• Easy to interpret• Inexpensive
• Area: sample unit is a line• Not possums (or mustelids?)
• Sensitive for possums• Very cheap
• Area: sample unit is a line• ID interpretation?• Plastic
• All species• Lots of data
• Expensive• Data management
Transect methods

Developing methods:Sensitivity of chewcards vs tunnels
6 night exposure

Developing methods:Sensitivity (bars) & consistency (kappa values) of
chewcards vs tunnels
0.89 0.94
0.91 0.49
0.85 0.95
0.72 0.96
6 night exposure
Cherie Balls

Results overview
• Hedgehogs, mice and rats most often detected
• Mustelids and cats rarely detected with conventional methods
• Dunedin had highest detections of possums and hedgehogs
• Possible latitudinal trends?H'hog Mouse Mustelid Possum Rat
Hamilton
Wellington
Nelson
Dunedin
ind
ex (
%)
0
20
40
60
80
Tunnel and chewcard detections (6nights) Spring 2018

Seasonal & habitat effects
Most obvious habitat effects:
• Possums preferentially detected in forests
• Mice preferentially in (grassy) amenity sites
• Hedgehogs & Rats consistent across all habitats
Amenity Forest Residential

Some seasonal effects:
• Mice detections higher in autumn
Amenity Forest Residential
Wellington
Amenity Forest Residential

Tunnel/chewcardindices vs cameras Amenity Forest Residential
Hamilton: Spring 2017 & Autumn 2018
% of sites where detectedBars = tunnels or chewcardsOvals = camera data (no. of triggers)

Cats roaming in Polhill Reserve
Urban Ecosystems 2019
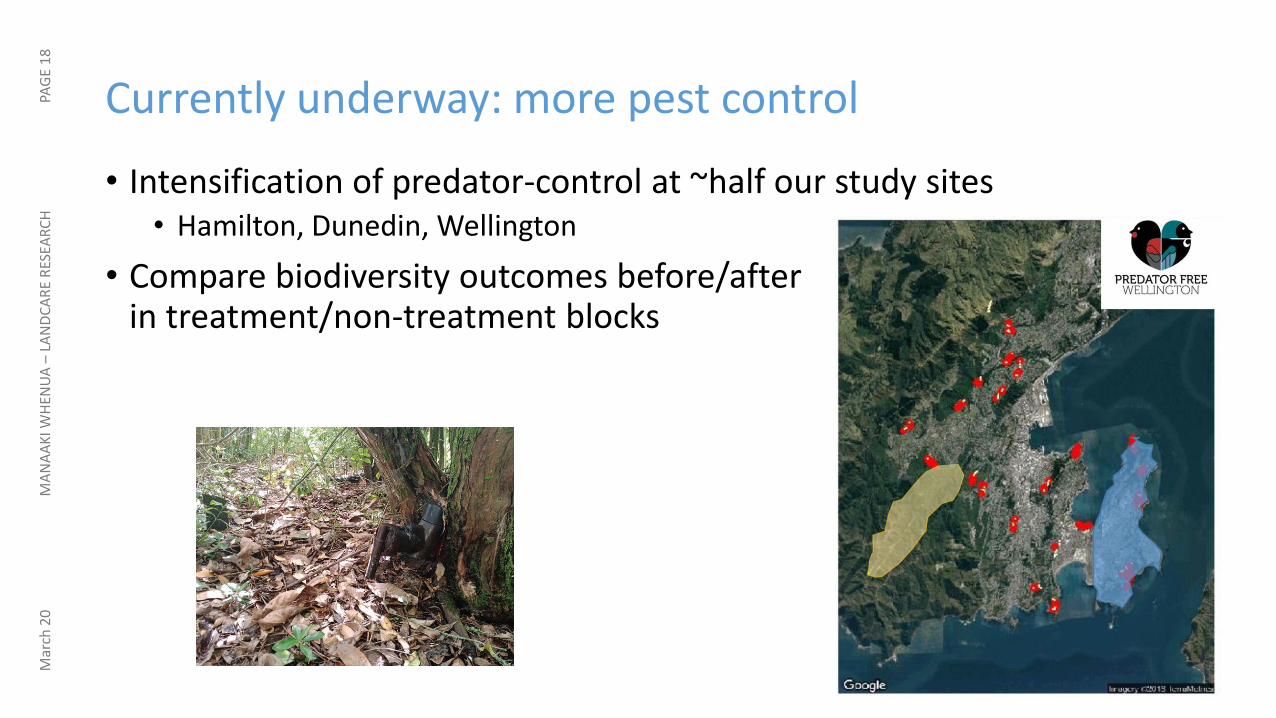
Currently underway: more pest control
Mar
ch 2
0M
AN
AA
KI W
HEN
UA
–LA
ND
CA
RE
RES
EAR
CH
PAG
E 1
8
• Intensification of predator-control at ~half our study sites• Hamilton, Dunedin, Wellington
• Compare biodiversity outcomes before/after in treatment/non-treatment blocks

Trap catch data from 20+ residential trapping groups and reserve care-groups in Wellington
Mice
Hedgehogs

Rats Mice

Stoats Weasels

Next steps: home ranges of urban rats


Conclusion• Still plenty of basic ecology to be learnt about
behaviour and resource use of mammals in cities
• Ambition to control mammals continues to grow
• Social and technological advances continues to be developed (and need further development)
• Biodiversity gains in cities are not just possible, they are an essential part of turning around the biodiversity crisis and the extinction of experience

Acknowledgements
Joe Murphy, Shaun Thomason, Nathan Fan (summer scholars)
Kim Miller and Cherie Balls (MSc students)
Joe Murphy, Dan Crossett, Charlie Clark, David Munro, Florence, Nyree Fea, Olivia Vergara and Roald Bomans (research assistants)
Illona Keenan and Bernard Smith (Wellington City Council)
James Willcocks (Predator Free Wellington)
Bruce Clarkson & Catherine Kirby (Uni. Waikato)
Yolanda van Heezik (Otago Uni.)
John Innes, Neil Fitzgerald, Deb Wilson, Hayley Ricardo (Manaaki Whenua Landcare Research)


Informing the Public
• Reporting cards were made for each participating suburb
• Results given to participants & predator free groups

A citizen science project

AcknowledgementsTony Stoddard Lee BarryMichele FrankRosa Argent
WWF, Kereru Discovery Trust
Kimberley CollinsTiff Stewart
Forest & Bird
Tim Park Myfannwy EmenyRangi Biddle
Wellington City Council
Astrid van Meeuwen-Dijkgraaf
Wildland Consultants
John Sullivan Colin Meurk
NatureWatch NZ
Rhian SalmonAnni Brumby
Victoria University of Wellington

Community participation
• 8,879 records submitted
• ~ 3 records per person
• ~3000 participants

Survey questions (from 2015)
“How many kererū were seen?”
“Location”
“Time spent looking”
“Habitat”
“Is it feeding? If ‘yes’ on what?”
“Did you observe a display flight?”
Casual observation Timed survey
(Counts without zeroes) (Counts with zeroes)Presence-only data Presence-absence data

Opinion questions
“How frequently have you seen kererū at this location before?”
• never (0%)• seldom (1-10%)• sometimes (11-25%) • often (25-50%)• more often than not (51-90%)• almost always (91-100%)
“In your opinion, has the abundance of kererū increased, decreased or stayed about the same, at this location over the past 3 years?”
• Increased• Decreased• Stayed about the same• Don’t know
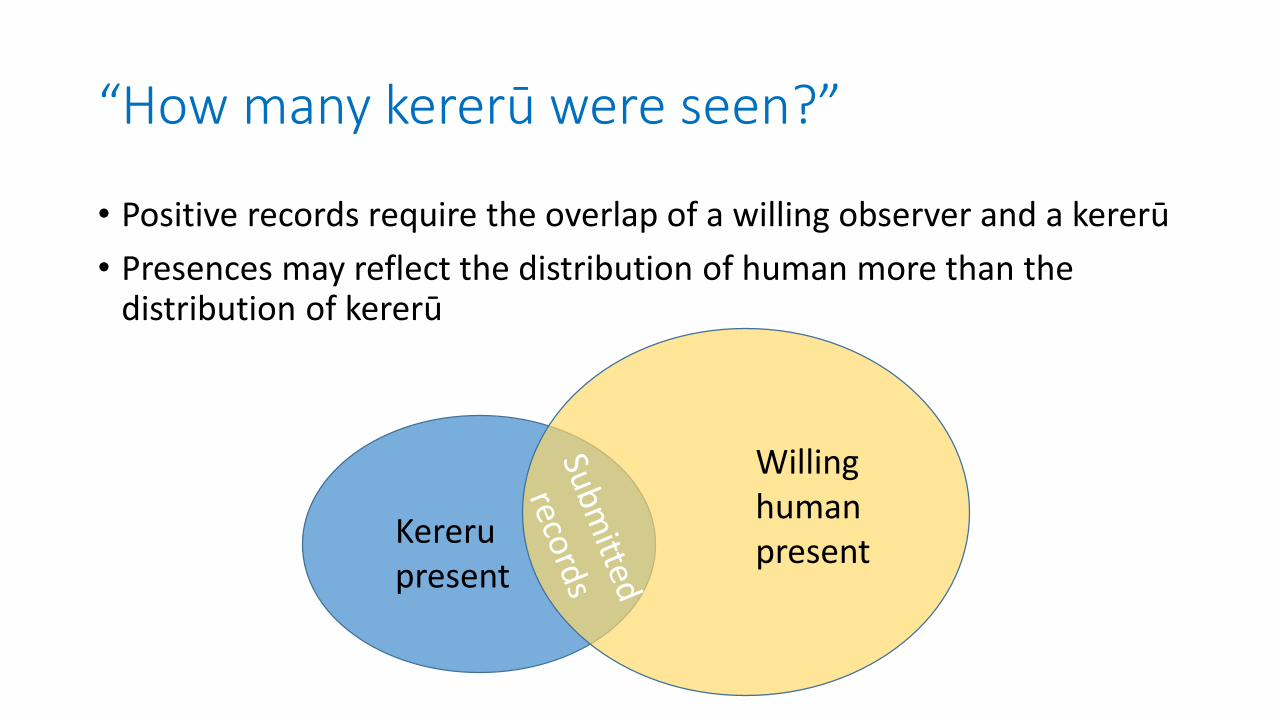
“How many kererū were seen?”
• Positive records require the overlap of a willing observer and a kererū
• Presences may reflect the distribution of human more than the distribution of kererū
Kereru present
Willinghumanpresent

Sightings per 1000 humans
204

1580 1590 1600 1610 1620 1630 1640
5420
5430
5440
Nelson - perceived frequency
0%
1-10%
11-25%
26-50%
51-90%
90-100%
1610 1620 1630
5430
Nelson, close-up
0%
1-10%
11-25%
26-50%
51-90%
90-100%
1580 1590 1600 1610 1620 1630 1640
5420
5430
5440
Opinion of Change (2019)
more abundant
about the sameless abundant
1610 1620 1630
5430
Nelson
more abundantabout the same
less abundant

Nelson and Marlborough regions
Human
population No. of records No. of kererū seen
No. of kererū seen
per 1000 humans
2014 2017 2018 2019 2017 2018 2019 2017 2018 2019
Nelson 49300 92 193 285 198 385 464 4.02 7.06 9.41
Marlborough 44800 107 113 106 202 196 226 4.51 4.22 5.04
Percentage of total
records
Average opinion of recent
change
2017 2018 2019 2017 2018 2019
Nelson 1.3 2.2 3.26 0.257 0.282 0.125
Marlborough 1.3 1.3 1.59 0.256 0.169 0.397

Opinion of change (2015)
opinion of change
-1.0-0.8-0.6-0.4-0.20.00.20.40.60.81.0
-1.0-0.8-0.6-0.4-0.20.00.20.40.60.81.0
increase
decrease
Wellington Auckland
Values are the averages of all opinions expressed per 1km grid cell

Opinion of change (2018)
increase
decrease
Values are the averages of all opinions expressed per 1km grid cell

Future
• Engage
• Educate / Entertain / Feedback results with clear graphics and interactive maps
• Re-engage
• Keep promoting the value of timed surveys
• Keep it accessible
• People want to make a positive contribution as long as it is not too hard / confusing
• Seek to explain the patterns

Photo credit: Tony Stoddard