Hotelia - Market Overview 2015
27
Norwegian Hotel Industry Hotelia’s mid-year report 2015
-
Upload
geir-lundkvist -
Category
Documents
-
view
64 -
download
6
Transcript of Hotelia - Market Overview 2015
Norwegian Hote l Indus t ryHote l i a ’s mid-yea r repor t 2015

Norwegian Hotel Industry Overview | Pg. 2
TABLE OF CONTENTS
1. Introduction……………………………………………………
2. Hotel Industry Performance in the Major Cities……………..
Norway
Oslo
Bergen
Trondheim
Gardermoen (Ullensaker)
Stavanger
Tromsø
Kristiansand
3. Norwegian Hotel Industry in General………………………...
4. Colliers International Mid-year Real Estate Report…………..
5. Highlights from 2015 & 2016………………………………...
…4
…5
21
22
23

Advisory services and business development for hotels, hotel
property owners and the travel industry
Behind Hotelia stands a team of experienced consultants with a long track record from hotel real estate and operations
Services provided by Hotelia include feasibility studies, hotel market research reports, transactions, valuations, operator searches and general advisory services to hotel and travel industry clients
We are specialized in the Nordic region, and base our advices on a wide experience and extensive network from this region
WH
O A
RE
WE
?

Norwegian Hotel Industry Overview | Pg. 4
INTRODUCTION
Hotelia releases a brief market report about the Norwegian hotel industry twice a year, and is draftedduring the two months prior to publication. The majority of data are collected from Statistics Norway(SSB) and Statistikknett. Hotelia have supplied additional data as well.
The main focus of this report is:
Development in the Norwegian hotel industry up to, and including, mid-year 2015 for Norway
and the seven largest cities (based on sold room nights)
Updated overview of the largest hotel chains in Norway, based on number of rooms and hotels
Important events and highlights in the Norwegian hotel industry and real estate market, as wellas highlights from the Swedish market that is of interest for Norwegian investors
A quote from Colliers International’s mid-year report for the Norwegian real estate market, with
link to the entire report
Some reflections of the industry’s outlook in the coming year
The next report is scheduled in February 2016. Please do not hesitate to contact us for furtherinformation, comments or suggestions.
Hotelia AS has conscientiously prepared this report based on our own analyses and the information made available to us or collected during the process of executing the assignment. Hotelia AS can therefore not guarantee for the accurateness or trueness of all the information and estimates carried out in this report.

HOTEL PERFORMANCE
IN THE MAJOR CITIES

Statistikk for Oslo
Norwegian Hotel Industry Overview | Pg. 6
NORWAY
A slightly higher increase in demand than in room capacity, and a moderate growth in ADR contributes toa 1.8% growth in RevPAR this mid-year compared to first half-year 2014.
There are primarily a strong growth in the leisure segment. The growth’s main drivers are a combinationof the currently depreciated NOK, improvements in selected countries’ economy that are important forthe Norwegian tourist industry, and the popularity of northern lights (new winter market).
USD: -21.9% | EUR: -5.4% | GBP: -15.6%
The business segment in total, including conference, decreased by 0.7% compared to first half-year 2014.
Thus, the fall is so far relatively smaller compared to the fall in oil prices and the overall development inthe Norwegian economy.
In total, Norway has experienced an increase in both domestic and foreign travellers by 4.2% and 9.8%respectively compared to first half-year 2014.
13.4 %
-3.1 %
6.6 %
Guest segments development mid-year 2014 vs. 2015
Leisure
Business
Conference
-4%
-2%
0%
2%
4%
300
350
400
450
500
550
600
650
Rolling 12 month RevPAR with %-change
NOK 2014 2015 Nominel chg. Change %
Leisure 4 220 706 4 786 564 565 858 13.4 %
Business 3 934 608 3 811 540 -123 068 -3.1 %
Conference 1 322 293 1 409 186 86 893 6.6 %
Room cap. 13 107 685 13 589 534 481 849 3.7 %
Room nights 6 743 591 7 009 299 265 708 3.9 %
ADR 896 910 13 1.5 %
Occ% 51.4 % 51.6 % 0.1 % 0.3 %
RevPAR 461 469 8 1.8 %
2008 2009 2010 2011 2012 2013 2014 2015
0%
20%
40%
60%
80%
100%
0
200
400
600
800
1 000
1 200
2006 2007 2008 2009 2010 2011 2012 2013 2014 2015*
Development in key figures - Norway
ADR RevPAR Occ% Average Occ%
*First half-year 2014 vs. half-year 2015

NORWEGIAN HOTEL INDUSTRY OVERVIEW
Hotelia | Pg. 7
Oslo
Astrup Fearnley+9.1%
Growth in RevPAR

Statistikk for Oslo
Norwegian Hotel Industry Overview | Pg. 8
OSLO
-4%
-2%
0%
2%
4%
300
400
500
600
700
800
Rolling 12 month RevPAR with %-change
500
550
600
650
700
750
-
50 000
100 000
150 000
200 000
250 000
300 000
350 000
400 000
07/08 08/09 09/10 10/11 11/12 12/13 13/14 14/15
Yearly rolling 12 month RevPAR & room cap.
0%
20%
40%
60%
80%
100%
0
200
400
600
800
1 000
1 200
1 400
2006 2007 2008 2009 2010 2011 2012 2013 2014 2015*
Development in key figures - Oslo
ADR RevPAR Occ% Average Occ%
Overall we see a weak trend change in RevPAR development. The demand side is at the moment slightlygreater than the supply side.
The strong development in June Is mainly dominated by the “Nor-Shipping trade” fair. This also affectsthe total figures for Oslo in the first half
Oslo continues to grow business from the leisure market by 12.8 %. During the last ten years thenumber of guests from this segment has increased by 70 %
Regardless of «Nor-Shipping», price development (ADR ) is positive so far
There are no major projects coming into the market this year, and the pipeline of additional roomcapacity is low
NOK 2014 2015 Nominel chg. Change %
Leisure 793 923 895 602 101 679 12.8 %
Business 865 556 901 410 35 854 4.1 %
Conference 200 622 224 856 24 234 12.1 %
Room cap. 2 047 520 2 183 196 135 676 6.6 %
Room nights 1 354 730 1 460 416 105 686 7.8 %
ADR 901 972 71 7.9 %
Occ% 66.2 % 66.9 % 0.7 % 1.1 %
RevPAR 596 650 54 9.1 %
2008 2009 2010 2011 2012 2013 2014 2015
RevPARRoom cap.
*First half-year 2014 vs. half-year 2015

NORWEGIAN HOTEL INDUSTRY OVERVIEW
Hotelia | Pg. 9
Bergen
-12.9%Growth in RevPAR Bryggen
Statistikk for Oslo
Norwegian Hotel Industry Overview | Pg. 10
BERGEN
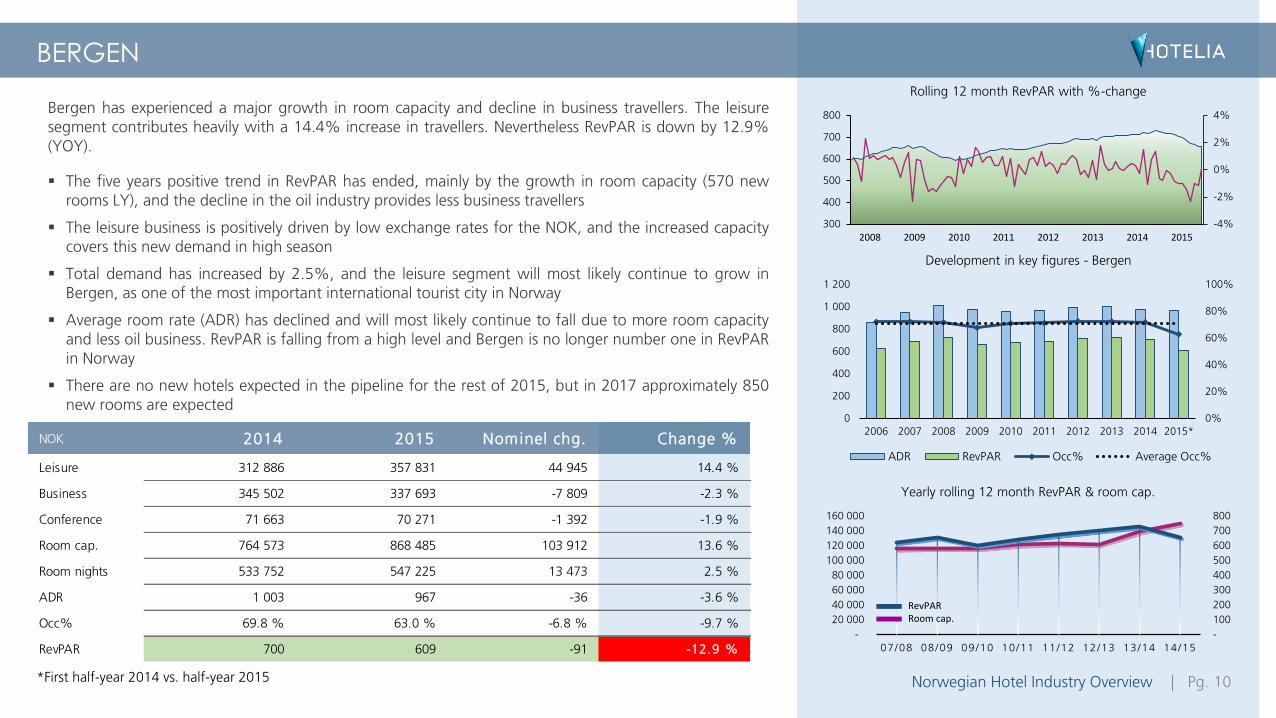
Bergen has experienced a major growth in room capacity and decline in business travellers. The leisuresegment contributes heavily with a 14.4% increase in travellers. Nevertheless RevPAR is down by 12.9%(YOY).
The five years positive trend in RevPAR has ended, mainly by the growth in room capacity (570 new
rooms LY), and the decline in the oil industry provides less business travellers
The leisure business is positively driven by low exchange rates for the NOK, and the increased capacitycovers this new demand in high season
Total demand has increased by 2.5%, and the leisure segment will most likely continue to grow inBergen, as one of the most important international tourist city in Norway
Average room rate (ADR) has declined and will most likely continue to fall due to more room capacityand less oil business. RevPAR is falling from a high level and Bergen is no longer number one in RevPARin Norway
There are no new hotels expected in the pipeline for the rest of 2015, but in 2017 approximately 850new rooms are expected
-4%
-2%
0%
2%
4%
300
400
500
600
700
800
Rolling 12 month RevPAR with %-change
-
100
200
300
400
500
600
700
800
-
20 000
40 000
60 000
80 000
100 000
120 000
140 000
160 000
07/08 08/09 09/10 10/11 11/12 12/13 13/14 14/15
Yearly rolling 12 month RevPAR & room cap.
0%
20%
40%
60%
80%
100%
0
200
400
600
800
1 000
1 200
2006 2007 2008 2009 2010 2011 2012 2013 2014 2015*
Development in key figures - Bergen
ADR RevPAR Occ% Average Occ%
NOK 2014 2015 Nominel chg. Change %
Leisure 312 886 357 831 44 945 14.4 %
Business 345 502 337 693 -7 809 -2.3 %
Conference 71 663 70 271 -1 392 -1.9 %
Room cap. 764 573 868 485 103 912 13.6 %
Room nights 533 752 547 225 13 473 2.5 %
ADR 1 003 967 -36 -3.6 %
Occ% 69.8 % 63.0 % -6.8 % -9.7 %
RevPAR 700 609 -91 -12.9 %
2008 2009 2010 2011 2012 2013 2014 2015
RevPARRoom cap.
*First half-year 2014 vs. half-year 2015

Trondheim
-10.2%Growth in RevPAR

Statistikk for Oslo
Norwegian Hotel Industry Overview | Pg. 12
TRONDHEIM
Trondheim continues to experience more demand from conference as well as the leisure segment.Additional room capacity continues to grow in Trondheim, including the shortfall in business travellers
causes RevPAR to fall by 10.2%.
The increase in room capacity started in 2010 and continues to grow by 11.5% in 2015.
Increase in demand is not making up for the additional rooms. RevPAR trend since 2011 is fallingheavily – from 553,- in 2011 to 475,- in 2015 (-14.1%)
There is no new projects expected into the market in 2015/2016
-4%
-2%
0%
2%
4%
300
350
400
450
500
550
600
650
Rolling 12 month RevPAR with %-change
420
440
460
480
500
520
540
560
-
20 000
40 000
60 000
80 000
100 000
120 000
08/09 09/10 10/11 11/12 12/13 13/14 14/15
Yearly rolling 12 month RevPAR & room cap.
0%
20%
40%
60%
80%
100%
0
200
400
600
800
1 000
1 200
2006 2007 2008 2009 2010 2011 2012 2013 2014 2015*
Development in key figures - Trondheim
ADR RevPAR Occ% Average Occ%
NOK 2014 2015 Nominel chg. Change %
Leisure 174 388 201 888 27 500 15.8 %
Business 232 386 216 254 -16 132 -6.9 %
Conference 71 823 81 573 9 750 13.6 %
Room cap. 579 125 645 567 66 442 11.5 %
Room nights 350 755 359 936 9 181 2.6 %
ADR 818 797 -20 -2.5 %
Occ% 60.6 % 55.8 % -4.8 % -7.9 %
RevPAR 495 445 -51 -10.2 %
2008 2009 2010 2011 2012 2013 2014 2015
RevPARRoom cap.
*First half-year 2014 vs. half-year 2015

Gardermoen
+12.2%Growth in RevPAR New Terminal

Statistikk for Oslo
Norwegian Hotel Industry Overview | Pg. 14
GARDERMOEN (MUNICIPALITY: ULLENSAKER)
The majority of the huge expansion of new capacity, launched in 2008-2011, is now absorbed by theincreased demand. This is driven by both ADR and occupancy rate.
Gardermoen continues to grow their business and achieved the highest increase in RevPAR comparedto the 7 largest hotel destinations in Norway
We assume that the increase in the conference segment comes from the newly opened «The Cube» atClarion Hotel in august 2014. Thon Hotels has also newly opened a new congress hall close to their
operations at Gardermoen
There are no additional room capacity expected in the coming 2-3 years at Gardermoen
-4%
-2%
0%
2%
4%
300
350
400
450
500
550
600
650
Rolling 12 month RevPAR with %-change
-
100
200
300
400
500
600
700
-
20 000
40 000
60 000
80 000
100 000
120 000
07/08 08/09 09/10 10/11 11/12 12/13 13/14 14/15
Yearly rolling 12 month RevPAR & room cap.
0%
20%
40%
60%
80%
100%
0
200
400
600
800
1 000
1 200
2006 2007 2008 2009 2010 2011 2012 2013 2014 2015*
Development in key figures - Gardermoen
ADR RevPAR Occ% Average Occ%
NOK 2014 2015 Nominel chg. Change %
Leisure 164 503 186 778 22 275 13.5 %
Business 197 051 169 426 -27 625 -14.0 %
Conference 85 230 110 348 25 118 29.5 %
Room cap. 582 351 570 771 -11 580 -2.0 %
Room nights 331 750 341 981 10 231 3.1 %
ADR 816 871 54 6.7 %
Occ% 57.0 % 59.9 % 2.9 % 5.2 %
RevPAR 465 522 57 12.2 %
2008 2009 2010 2011 2012 2013 2014 2015
RevPARRoom cap.
*First half-year 2014 vs. half-year 2015
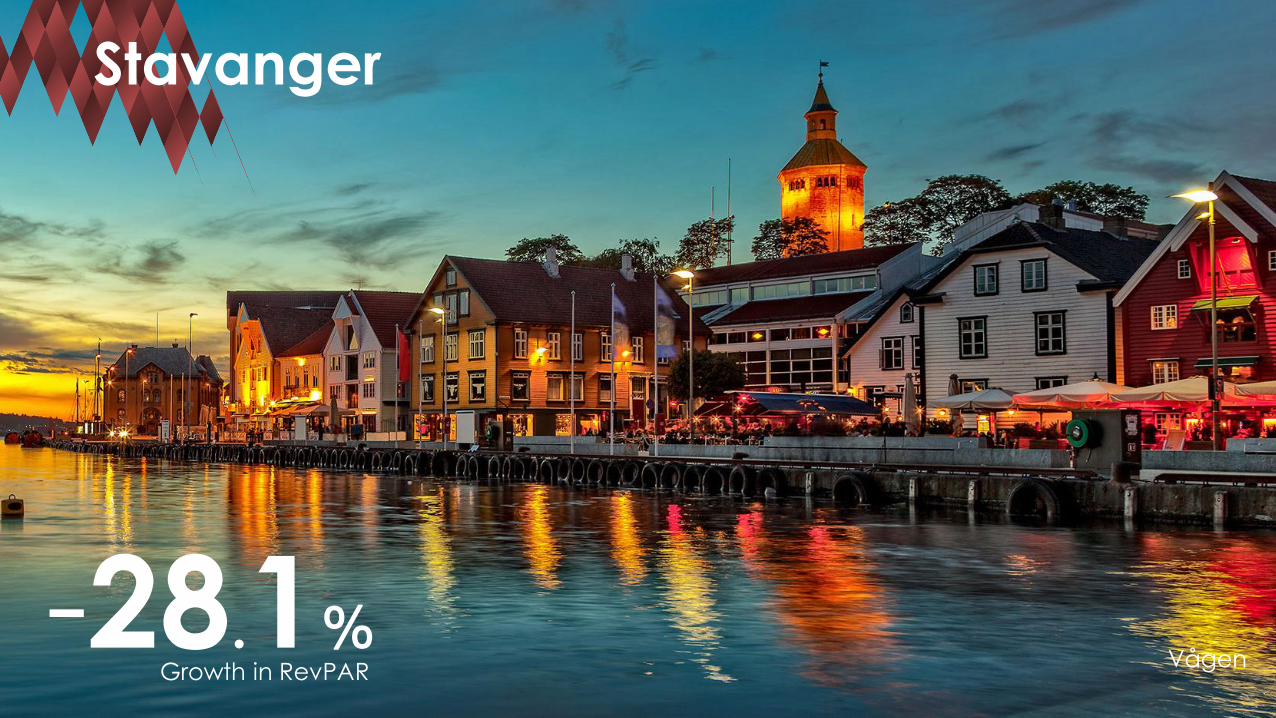
Stavanger
-28.1%Growth in RevPAR
Vågen

Statistikk for Oslo
Norwegian Hotel Industry Overview | Pg. 16
STAVANGER
Stavanger, “The Oil Capital”, is facing the most dramatic downturn of all the Norwegian cities. RevPARdown by 28.1%. The business segment is heavily hit by the oil price and the restricted travel policy in the
oil industry.
The city of Stavanger sold only 1.8% fewer room nights than LY, but the 25% additional new room
capacity made the shift and lowered the occupancy rate by 14% points
Average rate down by 8.7%, mainly due to lack of business travellers and lower paying business fromthe leisure and conference segments
Downturn in the oil sector and the effect of more room capacity in the Stavanger region was partlycovered in Stavanger city by visitors who previously stayed in hotels in the neighbouring cities of
Sandnes, Forus and Sola
Conference segment picking up slowly, but far behind the volume that Oslo, Bergen and Trondheimmanaged to sell
There are still several hotels planned in the pipeline for 2016, approximately 485 new rooms, yet
several projects are put on hold
-5%
-3%
-1%
1%
3%
5%
300
400
500
600
700
800
Rolling 12 month RevPAR with %-change
-
100
200
300
400
500
600
700
800
-
20 000
40 000
60 000
80 000
100 000
120 000
07/08 08/09 09/10 10/11 11/12 12/13 13/14 14/15
Yearly rolling 12 month RevPAR & room cap.
0%
20%
40%
60%
80%
100%
0
200
400
600
800
1 000
1 200
1 400
2006 2007 2008 2009 2010 2011 2012 2013 2014 2015*
Development in key figures - Stavanger
ADR RevPAR Occ% Average Occ%
NOK 2014 2015 Nominel chg. Change %
Leisure 124 394 147 209 22 815 18.3 %
Business 242 344 209 282 -33 062 -13.6 %
Conference 21 434 37 787 16 353 76.3 %
Room cap. 473 263 590 228 116 965 24.7 %
Room nights 312 283 306 798 -5 485 -1.8 %
ADR 1 091 996 -95 -8.7 %
Occ% 66.0 % 52.0 % -14.0 % -21.2 %
RevPAR 720 518 -202 -28.1 %
2008 2009 2010 2011 2012 2013 2014 2015
RevPARRoom cap.
*First half-year 2014 vs. half-year 2015

Tromsø
-10.5%Growth in RevPAR
Tromsø Bridge

Statistikk for Oslo
Norwegian Hotel Industry Overview | Pg. 18
TROMSØ
Tromsø has for years had a strong market growth, but in recent years the substantial increase in capacityhas provided a drop in RevPAR. The city is now back at a level close to the level in 2010 when the positive
development started.
Still a solid increase of the leisure segment. Tromsø has experienced a growth of 250 % in leisure segment since 2007 – mainly caused by the popularity of northern lights
Since 2007 the room capacity has doubled
Compared to the massive increase in capacity over the years , the prices (ADR) are only showing a
minor drop in the same period
New hotels in the pipeline, approximately 250 rooms in 2015/2016, plus some projects that are not yet confirmed
-4%
-3%
-2%
-1%
0%
1%
2%
3%
300
350
400
450
500
550
600
650
Rolling 12 month RevPAR with %-change
460
480
500
520
540
560
580
600
620
-
10 000
20 000
30 000
40 000
50 000
60 000
70 000
80 000
07/08 08/09 09/10 10/11 11/12 12/13 13/14 14/15
Yearly rolling 12 month RevPAR & room cap.
0%
20%
40%
60%
80%
100%
0
200
400
600
800
1 000
2006 2007 2008 2009 2010 2011 2012 2013 2014 2015*
Development in key figures - Tromsø
ADR RevPAR Occ% Average Occ%
NOK 2014 2015 Nominel chg. Change %
Leisure 152 924 191 683 38 759 25.3 %
Business 132 000 123 994 -8 006 -6.1 %
Conference 48 967 48 432 -535 -1.1 %
Room cap. 340 312 407 483 67 171 19.7 %
Room nights 233 418 257 626 24 208 10.4 %
ADR 887 862 -25 -2.9 %
Occ% 68.6 % 63.2 % -5.4 % -7.8 %
RevPAR 609 545 -64 -10.5 %
2008 2009 2010 2011 2012 2013 2014 2015
RevPARRoom cap.
*First half-year 2014 vs. half-year 2015

Kristiansand
-5.6%Growth in RevPAR Bølgen Hall of Culture
Statistikk for Oslo
Norwegian Hotel Industry Overview | Pg. 20
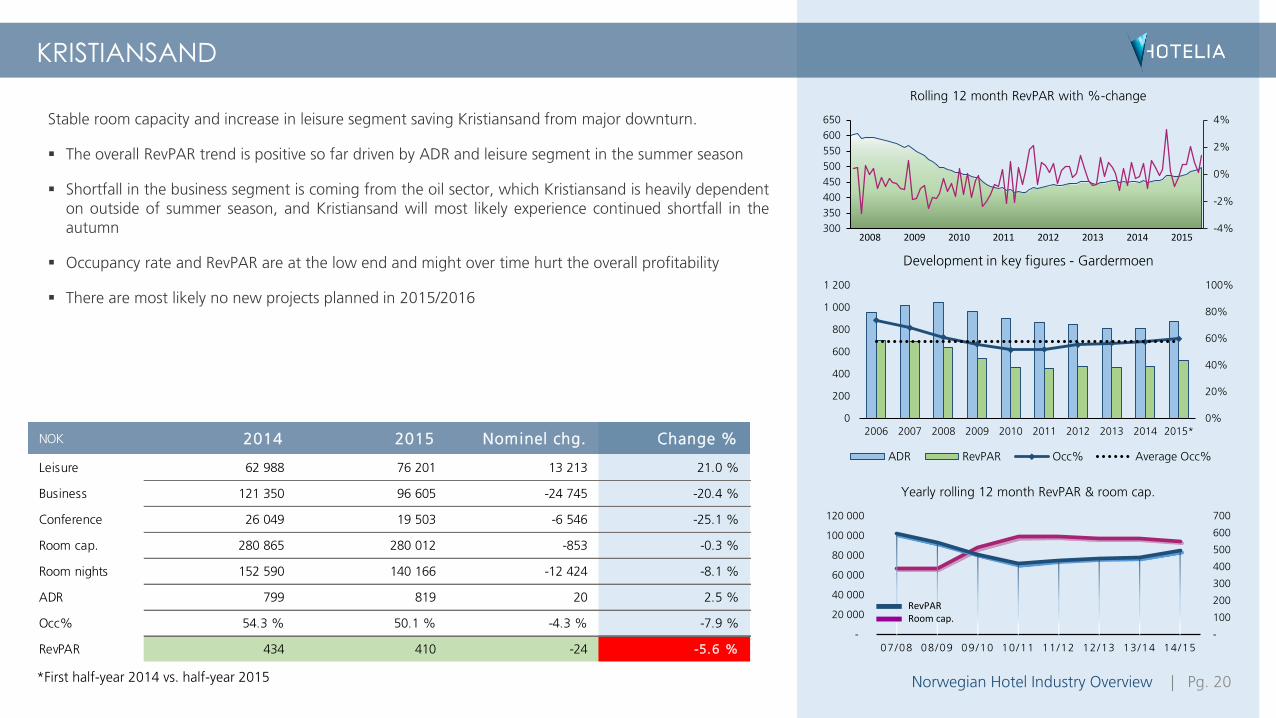
KRISTIANSAND
Stable room capacity and increase in leisure segment saving Kristiansand from major downturn.
The overall RevPAR trend is positive so far driven by ADR and leisure segment in the summer season
Shortfall in the business segment is coming from the oil sector, which Kristiansand is heavily dependenton outside of summer season, and Kristiansand will most likely experience continued shortfall in theautumn
Occupancy rate and RevPAR are at the low end and might over time hurt the overall profitability
There are most likely no new projects planned in 2015/2016
NOK 2014 2015 Nominel chg. Change %
Leisure 62 988 76 201 13 213 21.0 %
Business 121 350 96 605 -24 745 -20.4 %
Conference 26 049 19 503 -6 546 -25.1 %
Room cap. 280 865 280 012 -853 -0.3 %
Room nights 152 590 140 166 -12 424 -8.1 %
ADR 799 819 20 2.5 %
Occ% 54.3 % 50.1 % -4.3 % -7.9 %
RevPAR 434 410 -24 -5.6 %
-4%
-2%
0%
2%
4%
300
350
400
450
500
550
600
650
Rolling 12 month RevPAR with %-change
-
100
200
300
400
500
600
700
-
20 000
40 000
60 000
80 000
100 000
120 000
07/08 08/09 09/10 10/11 11/12 12/13 13/14 14/15
Yearly rolling 12 month RevPAR & room cap.
0%
20%
40%
60%
80%
100%
0
200
400
600
800
1 000
1 200
2006 2007 2008 2009 2010 2011 2012 2013 2014 2015*
Development in key figures - Gardermoen
ADR RevPAR Occ% Average Occ%
2008 2009 2010 2011 2012 2013 2014 2015
RevPARRoom cap.
*First half-year 2014 vs. half-year 2015

21 Hotels
5,600 Rooms
10 Hotels
2,940 Rooms
19 Hotels
2,650 Rooms
26 Hotels
1,500 Rooms
8 Hotels
780 Rooms
6 Hotels
1,350 Rooms
15,000 9,000 3,000 Number of rooms
Num
ber
of
room
s3,0
00
9,0
00
15,0
00
25 Hotels
2,500 Rooms
35 Hotels
6,430 Rooms
Norwegian Hotel Industry Overview | Pg. 21
NORWEGIAN HOTEL INDUSTRY IN GENERAL
In contrast to the popularity of management agreements in international hotel firms, Scandinavian hotel property owners favours rental agreements – often with one of the major brands
Scandic, Thon and Choice (consisting of Quality, Clarion, Clarion Collection and Comfort) dominates the industry
The hotels are mostly based in the mid-market, however the major brands diversify across all three markets
Figure updated September 2015

Norwegian Hotel Industry Overview | Pg. 22
COLLIERS – PROPERTY BROKERAGE
The Norwegian Commercial Real Estate market will see an all time high year in terms of transaction revenue. As of mid August, the total volume is
already close to NOK 65 bn with the office and retail sector being
responsible for over 2 / 3rds of the total. The interest in the Norwegian Commercial Real Estate market is very strong as Norwegian investors are
as present as ever and international investors are looking for low risk assets for their investments.
We firmly expect this development to continue throughout 2015 and we expect the transaction volume at years end to be approximately NOK 90
bn at a minimum. We would not be surprised if we see transactions for more than NOK 100 bn in 2015. However, for this to happen, certain key transactions have to go well.
The international macro economic climate remains very unstable. The oil price has as of August 24th seen levels as low as $ 43 per barrel and stock exchanges around the world in general, and China especially, is seeing
significant declines. China has been extremely volatile for a prolonged period of time, however, we might begin to see that larger parts of the
rest of the world is now increasingly following suit.
Looking at the domestic picture in Norway, the oil price is indeed of a high concern. The unemployment rate has increased in recent months and
salary growth is expected to be the lowest in 20 years. Norway is one of
the few western countries with quite strong inflation numbers at present with a yearly rate close to 2.5 %.
It is expected that the international and domestic appetite for Norwegian Commercial Real Estate will continue going forward. This is however, uncertain times with drastic changes in international financial markets currently happening each week. With record low interest levels and a very
strong financial backbone, we are hopeful going forward, especially for the transaction market.
Entire report available here.Source: Colliers International Norway

Balder
Acquired a Pandox Hotel portfolio in Sweden, with2,430 rooms in total for 2,200 MSEK
Geir Hove with partners
Acquired Scandic Stavanger City Hotel (226 rooms) from Øgreid Eiendom for 350 MNOK
DNB Scandinavian Property Fund
Acquired Quality Expo (301 rooms) for 530 MNOK, whichgave a yield on 5.2%
Balder
Acquired Courtyard by Mariot (280 rooms) in Stockholm from
Invesco European Hotel Real Estate for 670 MSEK
KLP Eiendom
Acquired a Scandic hotel currently under construction in Copenhagen with 370 rooms
Oslo Pensjonsforsikring
Acquired 58,000 m2 at Ullevål Stadion, including Thon Hotel
Ullevaal Stadion (144 rooms) from DNB Næringseiendom
Merkantilbygg
Acquired Park Inn by Radisson (208 rooms) Stavanger from KLP Eiendom
Other highlights Scandic have acquired the operations of three hotels located in Bergen from Bergen Hotel
Group (630 rooms)
Choice have launched a partner concept for its unbranded concept
Pandox are undergoing large changes – gone public on Stockholm Stock Exchange
Two hotels in Oslo rebranded to HTL (owned by Scandic)
Ligula Hospitality Group acquired Norse Hospitality from Svea Fastigheter / Midstar
Accor Hotel Group canceled 13 contracts with Norse Hospitality – the affected hotels
have been rebranded to Good Morning Hotels
SOME HIGHLIGHTS FROM LAST 12 MONTHS
Norwegian Hotel Industry Overview | Pg. 23

Norwegian Hotel Industry Overview | Pg. 24
OUTLOOK FOR THE REST OF 2015 AND 2016
The hotel industry is a cyclical business. Falling oil prices, rising unemployment and a general uncertainty
contributes to a reduction in travel activity in the private sector. The decline is already apparent in the
major cities of Bergen, Stavanger and Trondheim, as we can see in this report. We expect that these cities
will probably be hit even harder in the autumn and winter. Oslo will probably be affected less by the
decline, while hotels in the outskirt of the largest cities will be hit even harder.
Foreign investors still considers real estate investments in Norway as attractive, low exchange
rate and stability in the country is valuable
The summer season 2015 will be historical good
Further capacity growth in Stavanger and Bergen might cause a continued fall
Low exchange rate will create further growth in the foreign leisure business
The big chains will probably start and continue to “clean up“ in their portfolios of hotels in their own
operations. For landlords outside the main cities and region centers can cause that they have to find new
tenants. This will probably strengthen the position of the multi brand companies.

Anders VatnePartner
+47 926 97 [email protected]
Geir LundkvistPartner
+47 928 87 [email protected]
Hotelia monitors the hotel industry in Norway and the Nordics carefully in order to ensure that our clients are updated with relevant market information. In spite of the fact that there have been a record summer in Norwegian tourism industry, we see many challenges for the industry going forward.
During this summer we in Hotelia have develop new and improved existing products and are ready for a new and exciting fall. Our team Anders Vatne, Geir Lundkvist, Commercial Estate Lawyer Chistoffer Aasebø and market analyst Christian Hagen are ready to assist you.
Please do not hesitate to contact us by phone + 47 41 38 44 33
For more information, please visit our websitewww.hotelia.no

Scandic Flesland Airport - BergenContracted by Hotelia

Hotelia AS | Inkognitogata 33 A | 0256 Oslo | Norway | Tlf. +47 41 38 44 33 | [email protected] | hotelia.no | Org.nr. 998 811 910 MVA