HOTEL TAX INCIDENCE WITH HETEROGENEOUS FIRM … · the tax’s incidence, and will need to be...
37
1 HOTEL TAX INCIDENCE WITH HETEROGENEOUS FIRM EVASION: EVIDENCE FROM AIRBNB REMITTANCE AGREEMENTS Eleanor Wilking University of Michigan [email protected] February 10, 2016 ABSTRACT How does assignment of the remittance obligation affect consumption tax incidence? In classical tax theory, the responsibility of transferring tax revenue has no effect on which party bears the economic burden of a consumption tax. I explore this prediction in the context of agreements between city governments and a large digital platform firm that shifted the obligation to remit hotel taxes from independent rentors to the platform firm itself. Using variation in the location and timing of such agreements, I estimate their effect on rental prices. My results indicate that shifting the remittance obligation to the platform increases after-tax prices, suggesting that consumers bear a greater share of the tax burden when the remittance obligation is shifted to a party with fewer evasion opportunities. JEL classification: H22, H26, H32, K2. This is a preliminary draft. Please do not cite or distribute.
Transcript of HOTEL TAX INCIDENCE WITH HETEROGENEOUS FIRM … · the tax’s incidence, and will need to be...

1
HOTEL TAX INCIDENCE WITH HETEROGENEOUS FIRM EVASION: EVIDENCE FROM AIRBNB REMITTANCE AGREEMENTS
Eleanor Wilking
University of Michigan [email protected]
February 10, 2016
ABSTRACT
How does assignment of the remittance obligation affect consumption tax incidence? In classical tax theory, the responsibility of transferring tax revenue has no effect on which party bears the economic burden of a consumption tax. I explore this prediction in the context of agreements between city governments and a large digital platform firm that shifted the obligation to remit hotel taxes from independent rentors to the platform firm itself. Using variation in the location and timing of such agreements, I estimate their effect on rental prices. My results indicate that shifting the remittance obligation to the platform increases after-tax prices, suggesting that consumers bear a greater share of the tax burden when the remittance obligation is shifted to a party with fewer evasion opportunities. JEL classification: H22, H26, H32, K2. This is a preliminary draft. Please do not cite or distribute.

2
1. Introduction
The proliferation of mobile internet-connected devices has given rise to a number of
firms that rely on “digital platforms” to match consumers and service providers. These firms,
such as Uber, Lyft, and Airbnb, are economically significant, expanding rapidly, and often
valued in the tens of billions of dollars.
Policymakers and investors wonder whether and how existing taxes and regulations
should apply to platform firms. Opponents of enforcing existing rules claim they do not apply to
services created out of excess capacity, and their application would stifle innovation and growth
in this industry. Proponents argue instead that existing rules should be enforced on transactions
of the same economic substance (e.g., regulations applying to taxicabs should apply to Uber
rides). Given how differently these new firms are structured relative to their traditional
counterparts, their response to such enforcement is theoretically ambiguous and thus an
empirical question.
This paper examines the effect of one recent policy to enforce greater tax compliance on
platform firms: bilateral tax remittance agreements between Airbnb and a number of U.S. cities.
Specifically, I examine the effect that shifting responsibility for remitting hotel taxes from hosts
to Airbnb has on listing prices.
2. Background and Policy
2.1 What is Airbnb?
Airbnb is the largest of several firms facilitating short-term, peer-to-peer residential space
rentals through an online platform. Originally conceived as an online marketplace to connect
couch surfers, Airbnb has experienced remarkable growth in recent years, expanding

3
exponentially in popular tourism cities around the globe.1 Hosts on Airbnb create listings for
each of their properties. Each listing includes information about the space’s characteristics, such
as the number of beds, kitchen availability, and whether it is a private apartment or a shared
space. Hosts can designate a listing’s availability and set its price for each calendar day.
2.2 How are Airbnb transactions taxed?
In addition to consumer safety concerns, local governments expressed frustration with
Airbnb hosts’ avoidance of short-term rental taxes. In cities with significant tourism, the
estimated loss of occupancy tax revenue is significant. Initially, Airbnb’s position was that its
rentals were not subject to occupancy taxes because transactions were “peer-to-peer” rather than
commercial in nature. In May 2014, the company officially retracted this view and announced
that it believed its hosts were responsible for paying occupancy taxes to local governments. It
also amended its “Terms of Service” agreement to inform hosts of their obligation to research
and comply with applicable local taxes and regulations.2
On June 28, 2014, Airbnb announced that it had reached an agreement with the city of
Portland, OR to collect an 11.5% occupancy tax on all reservations booked on its site, and to pay
these taxes to the city at the end of each quarter. Crucially, the agreement explicitly prohibited
Portland’s city government from requiring Airbnb to disclose information related to taxable
1 Paris is thought to have nearly 40,000 active Airbnb listings, the most of any city in the world. 2 Beginning May 1, 2014, Airbnb’s Terms of Service includes the following paragraph:
YOU AS A HOST UNDERSTAND AND AGREE THAT YOU ARE SOLELY RESPONSIBLE FOR 2 Beginning May 1, 2014, Airbnb’s Terms of Service includes the following paragraph:
YOU AS A HOST UNDERSTAND AND AGREE THAT YOU ARE SOLELY RESPONSIBLE FOR DETERMINING (I) YOUR APPLICABLE TAX REPORTING REQUIREMENTS, AND (II) THE TAXES THAT SHOULD BE INCLUDED, AND FOR INCLUDING TAXES TO BE COLLECTED OR OBLIGATIONS RELATING TO APPLICABLE TAXES IN LISTINGS. YOU ARE ALSO SOLELY RESPONSIBLE FOR REMITTING TO THE RELEVANT AUTHORITY ANY TAXES INCLUDED OR RECEIVED BY YOU. AIRBNB CANNOT AND DOES NOT OFFER TAX-RELATED ADVICE TO ANY MEMBERS.

4
transaction that could individually identify hosts. As part of the exchange, the Portland City
Council agreed to pass a code revision that would legalize short-term home rentals if residents
obtained a $180 permit and installed fire alarms.
Between August 2014 and August 2015, similar agreements to collect and remit hotel
sales taxes were signed with San Francisco, CA (14.5%), San Jose, CA (10%), Chicago, IL
(4.5%), Washington, DC (14.5%), Philadelphia, PA (8.5%), Durham, NC (6%), San Diego, CA
(10.5%), and Phoenix, AZ (3%), as well as several smaller municipalities. Typically, an
agreement is announced two weeks before the date when Airbnb begins collecting taxes on all
bookings in that jurisdiction. Airbnb notifies affected hosts of the policy change via email shortly
after the announcement.
2.3 How do taxes appear to Airbnb guests?
When a guest searches for a rental on Airbnb, she is presented with a set of search results
that includes an image, location, and tax-exclusive estimate of the nightly fee for each listing
(Figure 1).3 After a guest clicks on a listing, she is shown a more detailed accounting of the
rental cost, including Airbnb’s service fee and any occupancy tax. Figure 2 shows examples of
listings from two jurisdictions: one that has a bilateral agreement with Airbnb (Chicago, IL), and
one that does not (Evanston, IL). Notice that both listings appear among same set of search
results. Without clicking on a listing, it is not evident whether an occupancy tax applies to it.
3. Motivation
3 The price shown in the search results is the average cost per night of the room, excluding taxes and Airbnb’s service fee. For example, if a listing’s rental prices for Friday, Saturday, and Sunday are $90, $100, and $110, respectively, and the listing has a $30 cleaning fee, then the price displayed in the search results will be $110 (90+100+110+30 / 3 = 110).

5
In the traditional view, the economic incidence of a tax is independent of its statutory
incidence. In the absence of differences in compliance and monitoring costs or evasion
opportunities between the supply and demand sides of a market, shifting the remittance
obligation from one to the other has no impact on which party bears the economic burden of the
tax. However, recent empirical work suggests that the assignment of the remittance obligation
can affect incidence in practice. I consider two potential reasons why the traditional view may
not hold in the context of Airbnb’s market for short-term rentals.
3.1 Evasion technology and the point of collection
Statutory irrelevance may not hold if economic agents differ in their ability to evade taxes
(Kopczuk, Marion, Muehlegger, and Slemrod forthcoming, hereafter KMMS). KMMS find that
the economic incidence of a quantity tax on diesel fuel depends on the point of collection within
the supply chain. As the remittance obligation moves “up” the chain from retailers to distributors
and prime suppliers, the pass-through rate of diesel taxes to the retail price increases, as do tax
revenues. This suggests that differential evasion opportunities afforded to these agents explain
the relevance of a tax’s collection point.
The context I study differs from that of KMMS in several potentially consequential
respects. First, Airbnb’s role in the provision of short-term rentals cannot be neatly confined to
that of a supplier. Airbnb considers itself a “platform” or “market-maker,” rather than an
upstream firm in a supply chain that provides paid lodging. Second, Airbnb hosts provide a
heterogeneous product, unlike diesel fuel. Third, pre-policy remittance behavior by hosts was
likely binary.4 Additional differences between the Airbnb and diesel fuel contexts—such as the
4 Although I am unable to observe pre-policy remittance behavior, based on online discussions between (anonymous) hosts and public comments by municipal tax authorities, I infer that evasion took place mainly on the

6
occupancy tax being ad valorem rather than specific, and the different costs of compliance and
monitoring within each market—may also affect how changing the point of remittance affects
the tax’s incidence, and will need to be carefully considered.
3.2 Host sophistication in price-setting
Classically, tax incidence is exclusively determined by market-level factors such as the
level of competition and supply and demand elasticities (see, e.g., Myles 1989; Weyl and
Fabinger 2013). However, there is some empirical evidence that differences in firms’
characteristics, such as managerial resources that affect price-setting strategies, can lead to
variation in tax incidence within a market. For example, small, independent firms are more likely
to rely on simplified pricing rules, such as round number heuristics, and may not fully
incorporate tax changes into price setting behavior (Harju, Kosonen, and Skans 2015).
There is likely significant heterogeneity in host experience with, and attention to, optimal
price setting. Some hosts are actually hotels, with substantial managerial resources devoted to
setting prices. On the other end of the spectrum, many hosts list once or twice a year when they
vacate their residences to travel, or in response to anticipated spikes in demand from local events
(e.g., football games). Like consumers, hosts in the latter category may be inattentive to changes
in Airbnb’s occupancy tax policies, or exhibit bounded rationality that constrains them from
setting prices optimally (Chetty 2009; Finkelstein 2009).
4. Model
extensive margin. That is, hosts either voluntarily remitted the occupancy taxes they owed, or they paid nothing at all.

7
This section sets forth a simplified model of Airbnb host behavior. Hosts are divided into
two types: those who remit their tax obligations, and those who do not. Prior to the enactment of
any agreement, both types of host choose listing prices to maximize profit. Between two
otherwise identical hosts, the one who remits sets a higher price to offset the cost of remitting the
tax. Once an agreement is signed, hosts who previously set high, tax-inclusive listing prices now
set low, tax-exclusive listing prices. This, combined with reduced demand by guests now faced
with a tax, drives down listing prices for all hosts in equilibrium.
4.1 Host price-setting under monopolistic competition
Each Airbnb host supplies a product that is differentiated—by location, amenities, and so
on—from those of her competitors. The market for Airbnb rentals is therefore monopolistically
competitive, with each host facing a downward-sloping demand curve: 𝑞! = 𝑞!(𝑝! , 𝛾! ,𝑝!! ,𝑁).
This demand curve is a function of the host’s own price !!!!!!
< 0 , the desirability of the listing
!!!!!!
> 0 , the prices set by all other hosts !!!!!!!
> 0 , and the number of other hosts !!!!"
< 0 .
Assume that the fixed cost of entry into the Airbnb market is zero, and that the variable
cost of hosting is heterogeneous across hosts and represented by 𝐶(𝑞! , 𝛿!), where !!!!!
> 0. The 𝛿!
parameter can be thought to represent a host’s idiosyncratic level of inconvenience from hosting
someone in their property.
Prior to the enactment of Airbnb’s remittance agreements, hosts were responsible for
remitting any hotel taxes owed to the municipal government. While some hosts complied, it is
likely that many did not. Prior to the policy, assume hosts were one of two types: remitting or

8
non-remitting. The former complied fully by remitting all taxes owed, while the latter remitted
nothing.5
All hosts must choose a listing price 𝑝! to maximize profit:
Remitting hosts: 𝜋!! = 𝑝!𝑞! 1− 𝜏 − 𝐶 𝑞! , 𝛿! (1)
Non-remitting hosts: 𝜋!!" = 𝑝!𝑞! − 𝐶 𝑞! , 𝛿! (2)
where 𝜏 denotes the hotel tax rate in the city in which the property is located.
4.2 Equilibrium
Remitting and non-remitting hosts both choose listing prices that satisfy their respective
first order conditions. If two listings are equally desirable and hosts have the same cost index,
then a remitting host will optimally set a higher listing price to account for the additional cost
imposed by the tax remittance obligation:
𝑝!!∗ 𝑝!! ,𝑁, 𝛾! , 𝛿! , 𝜏 > 𝑝!!"
∗ 𝑝!! ,𝑁, 𝛾! , 𝛿! !!!!,!!!!
Free entry implies that the marginal host will earn zero profit in equilibrium. As a result,
there exists a threshold value of 𝛿! that characterizes the variable cost of the marginal host. For
example, conditional on listing desirability, the variable cost of the marginal remitting host is
lower than the variable cost of the marginal non-remitting host:
𝛿!∗ 𝑝!! ,𝑁, 𝛾! , 𝜏 < 𝛿!"∗ 𝑝!! ,𝑁, 𝛾! !!!!
This reflects the fact that, due to the additional cost imposed by the tax remittance obligation,
remitting hosts will tend to have lower idiosyncratic costs in order to remain in the market.
5 This model rules out evasion on the intensive margin. Remitting hosts can be thought of as those facing very large costs of evasion, such as having a neighbor who is a municipal tax officer.
9
In Nash equilibrium, no host can increase her profit given the prices set by other hosts.
Assuming symmetric price-setting within host type and a large number of hosts, the prices
charged by all other hosts, 𝑝!!, can be expressed as the weighted average of the expected price
set by each type of host:
𝑝!! = 𝑝 = 𝛼!𝔼 𝑝!! 𝛿! < 𝛿!∗]+ (1− 𝛼!)𝔼 𝑝!!" 𝛿! < 𝛿!"∗]
where 𝛼! represents the share of hosts who are remitters.
4.3 Shifting the remittance obligation to Airbnb
Under the remittance agreements signed by Airbnb, hosts are relieved of their obligation
to remit hotel taxes to municipal governments. Instead, any tax is added to the listing price set by
hosts and remitted on behalf of guests by Airbnb. In the context of the model, this means that the
fraction of hosts who are remitters falls to zero, and all hosts face the profit maximization in
equation (2).
This change will affect a number of variables in equilibrium, starting with prices. Hosts
who previously remitted, and set tax-inclusive listing prices, will now charge lower, tax-
exclusive listing prices. In addition, even hosts who previously did not remit will find it optimal
to lower their prices: first, because the reduced prices of previously remitting hosts will lower
average prices, and second, because guests now face a tax upon check-out and will reduce their
demand accordingly. The combination of these effects will lead to lower listing prices after an
agreement has been signed.
In addition to affecting the average listing price, an agreement may also affect the
composition of Airbnb hosts. For example, non-remitting hosts with high costs may find that
they earn negative profits after the policy change, and will thus be compelled to exit the market.

10
4.4 Model limitations
This simplified model of Airbnb host behavior leaves out a number of factors that will
likely govern real-world behavior. First, the decisions of hotels, direct competitors to Airbnb
hosts, are left out of the model. The hotel industry, which lobbied heavily for increased tax
enforcement of Airbnb hosts, will face a reduction in downward price pressure once an
agreement is signed.
Second, the guest’s decision problem is omitted from the model. While it may be the case
that demand for temporary lodging within a city is relatively inelastic in the short run, it is almost
certainly more elastic in the long run. If this is the case, then the incidence of the hotel tax will be
increasingly borne by hosts in the long run, as guests have their choice of visiting cities with and
without remittance agreements.
Finally, evasion is modeled here as a corner solution: a host either evades fully, or not at
all. In other contexts where evasion is modeled, it is common to allow entities to choose a level
of evasion (e.g., KMMS forthcoming).
5. Data
5.1 Collection
To measure the response of hosts to Airbnb’s remittance agreements, I collect
information on listings for selected U.S. cities and their surrounding areas between February 13
and August 30, 2015.6 I focus on cities that had announced, but not yet implemented, occupancy
6 These data are collected using an automated script or “crawler” that systematically browses Airbnb.com and collects information on listings associated with a particular geographic search

11
tax remittance agreements with Airbnb throughout this period: Washington, D.C.; Chicago, IL;
and Phoenix, AZ. In addition, I collect data on listings in control cities that did not enact any
agreements during this period: New York, NY; San Francisco, CA; and Los Angeles, CA. For
each listing, I obtain its approximate geographic coordinates,7 price, unit type (e.g., shared,
private room, entire home), number of reviews, and whether it can be booked instantly. Listings
and hosts are each identified by a unique ID, facilitating the tracking of listings over time.
Data are collected in two waves, based on the implementation dates of remittance
agreements. The first wave (February 13 through April 13, 2015) collects data from Washington,
Chicago, New York, San Francisco, and Los Angeles. Washington and Chicago implemented
remittance agreements on February 15, 2015. The second wave (June 25 through August 30,
2015) collects data from Phoenix, New York, San Francisco, and Los Angeles. Phoenix
implemented a remittance agreement on July 1, 2015.
For treated cities, listings are selected in two ways. The “city” approach is to collect data
on all listings returned from a search for the city name (e.g., “Chicago, IL”). In contrast, the
“metro” approach is to collect data on all listings returned from a search for a specific
neighborhood within the city’s metro area (e.g., “Gold Coast”, “Evanston”).
The advantage of the “city” approach is that it facilitates comparisons across cities: a
listing returned in a search for “Chicago, IL” is comparable to a listing returned in a search for
“New York, NY”, whereas a listing returned in a search for a specific neighborhood may not be.
term (e.g., “New York, NY”). The script mimics the browsing experience of a potential guest by clicking through each listing in the search results and obtaining its characteristics. 7 Geographic coordinates are purposefully offset by a small distance from the street address registered by the host for privacy. Once a listing is booked, the guest is sent an email with the exact street address. Anecdotal evidence, based on discussions by hosts on internet forums, suggests that these offsets are small (less than 1/8 mile) and, importantly, according to Airbnb’s website, offsets are done within neighborhoods.

12
The disadvantage of the “city” approach is that it misses many listings. Airbnb’s search
algorithm returns approximately 1,000 listings per geographic search term, even if more listings
exist within the city. Each time the same search is performed, a potentially different set of
listings is drawn from the larger set of listings for the entire city. Searching in this manner, the
fraction of a city’s total listings that are returned on any given day, and the stability of that
sample from day to day, varies by city.
The advantage of the “metro” approach is that it allows for a more complete scrape of a
city’s listings. Because each set of search results is limited to approximately 1,000 listings, going
through a city neighborhood by neighborhood can uncover more listings than would be returned
by a search for the city itself. It is also important because many of the listings returned in this
manner fall outside the city’s boundaries and are located in a neighboring municipality, and are
therefore not bound by the remittance agreement. For example, a search for “Chicago, IL”, and
especially a search for “Evanston”, will return some listings in Evanston, IL, which are not
bound by the agreement signed between Airbnb and the City of Chicago. These listings can serve
as “metro” area controls, analogous to how listings in New York and San Francisco, for example,
serve as controls for listings recovered via the “city” approach.
5.2 Limitations
There are several limitations to my data collection procedure that may hinder my ability
to detect host response to Airbnb’s remittance agreements. First, I am only able to collect data on
a city’s listings after a remittance agreement has been announced, but before it has been
implemented. Typically, the time between announcement and implementation is approximately
two weeks. Attentive hosts may adjust the prices of their listings during this time, possibly

13
before I am able to begin scraping. Relatedly, for Washington and Chicago, I began collecting
data only two days before implementation, resulting in a very short “pre-period” for use in my
estimates.
Second, because data collection is limited to the listings that appear in the search results,
and because those results fluctuate day to day, I am unable to consistently observe a given listing
over time. As a result, I may miss when a price change occurs, and have no way of knowing
whether a listing’s absence is due to search behavior or because the host exited the market. One
way to mitigate this problem is to increase search “depth” within a city by searching for all
listings within an exhaustive set of price ranges (e.g., $1-$50, $50-$100, $100-$200, and so on).
This partially circumvents the 1,000-listing cap on any given search, making it more likely that
data on all active listings within a city will be collected. This approach was used to collect data
from Phoenix and is currently being used to gather data on a broader group of cities.
5.3 Descriptive Statistics
Table 1 contains descriptive statistics for the two waves of data collected. The top panel
contains information for listings in the first wave, focusing on the treated cities of Washington
and Chicago, the control cities of New York, San Francisco, and Los Angeles, and additional
control listings in the Washington metro area (e.g., Bethesda, Arlington) and Chicago metro area
(e.g., Evanston). Columns 1-3 display statistics for all listings scraped during the collection
period in each location, while columns 4-6 are limited to only those listings that appear at least
once in the pre-agreement period (February 13 – February 14) and post-agreement period
(February 15 – April 13).

14
A few points are worth noting. First, as mentioned above, cities vary in the stability of the
composition of their search results. For example, during the entirety of the collection period,
2,100 unique listings were observed in Washington, while almost twice that number were
observed in New York. While it is likely that New York contains more Airbnb listings than
Washington, it’s also likely that a listing returned in a search for New York on one day has a
lower likelihood of appearing in the search results on a subsequent day than the analogous listing
in Washington. Figure 3 displays the fraction of all listings for a given city on the first day it was
scraped that appear on subsequent days. New York stands out relative to the other cities in the
degree of turnover in its listing composition. In contrast, because of the more thorough collection
procedures employed with Phoenix, turnover is relatively low for listings in that city.
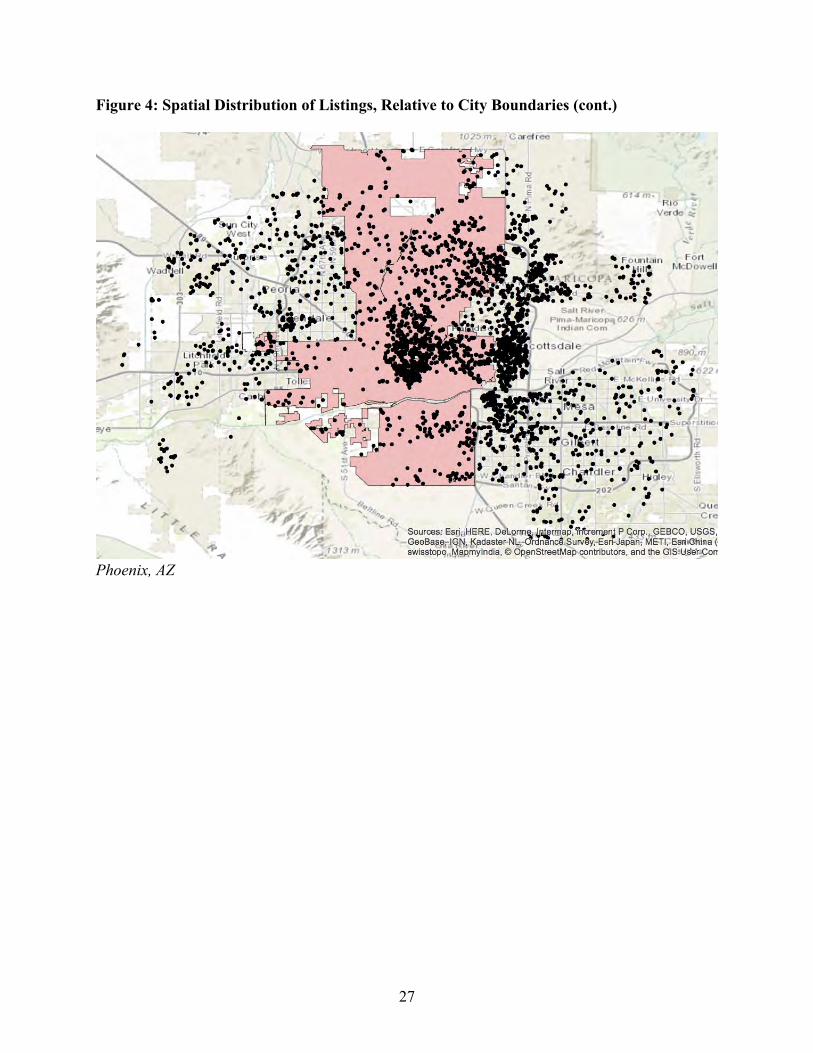
Second, treated cities differ in the number of listings observed in un-treated, neighboring
municipalities. For example, almost one third of listings in the Washington metro area
(=930/(930+2100)) are located in neighboring municipalities, compared to a much smaller
fraction of listings in the Chicago metro area. Phoenix is uniquely well suited for the purpose of
comparing treated host behavior to that of untreated, nearby controls: more than half of the
listings returned in a search for Phoenix are located in Scottsdale, Glendale, and Tempe, three
municipalities that did not sign remittance agreements with Airbnb. Visual evidence of this is
provided in Figure 4, which shows the spatial distribution of listings in Washington, Chicago,
and Phoenix.
Figure 5 displays the cumulative fraction of listings that change price at least once in
each city, limited to those listings appearing at least once in both the pre- and post-agreement

15
periods. On average, over 30% of listings in each city change price by the end of the data
collection period.8
Finally, Figure 6 displays a histogram of prices across all listings under $250 in the data.
It is evident that hosts employ a number of heuristic pricing strategies, such as choosing prices in
increments of $5, as well as prices that end in 9.
6. Empirical Strategy
To measure the price-setting response of hosts to the implementation of Airbnb
remittance agreements, I employ a difference-in-differences estimation strategy. Using data at
the listing-date level, I estimate using OLS:
log(𝑝!"#) = 𝑋!𝛽 + 𝛿! + 𝛿! + 𝜋𝑇𝑟𝑒𝑎𝑡! ∗ 𝑃𝑜𝑠𝑡! + 𝜀!"# (3)
where i is an individual listing, c is the city, and t is the date. The parameter of interest, 𝜋, is the
difference-in-differences estimator: it captures the difference in prices for listings in treated cities
relative to those in untreated cities, in the post-agreement period relative to the pre-agreement
period, controlling for city and time fixed effects and several listing characteristics.9 Standard
errors are clustered to allow for non-independence at the city level. Observations spanning the
pre-agreement period and up to 60 days after an agreement is implemented are used. The
identifying assumption that makes the above interpretation of 𝜋 valid is that any systematic
8 The exception is Phoenix, where fewer than 20% of listings change price by the end of data collection for Wave 2. This is due to the more thorough data collection procedure applied to Phoenix, which allows me to track more listings from the pre-agreement period to the post-agreement period, compared to the other cities sampled. As a result, a larger share of listings with no activity remain in the sample for Phoenix. 9 These include whether a listing can be booked “instantly,” the number of reviews, and whether it is a shared room, private room, or an entire home.

16
change to listing prices in treated cities relative to untreated cities in the post-agreement period is
the result of the tax remittance agreement, and not any other factor.
As an alternative to using listings in untreated cities as a control for listings in treated
cities, I also estimate a version of equation (3) using only listings outside the treated city’s
boundaries as controls. The resulting estimates have different interpretations. Listings in
untreated cities are likely poor substitutes for guests interested in visiting treated cities, so the
possibility of spillovers is minimal. As a result, the implementation of an agreement in Chicago
is unlikely to affect the prices of listings in New York, at least in the short run. However, having
only a limited number of control cities—New York, San Francisco, and Los Angeles—leaves
open the possibility that price trends in these cities may systematically differ from those in
treated cities. In contrast, listings in neighboring municipalities are much closer substitutes for
guests visiting treated cities; indeed, a guest visiting northwest Washington may not care if her
Airbnb rental is within the city limits or in neighboring Bethesda, MD. As a result, the
implementation of an agreement in Washington may well produce spillover effects onto listings
in Bethesda. Yet the parallel trends assumption underlying difference-in-differences estimation is
likelier to hold when comparing listings in Washington and Bethesda, which are functionally a
single rental market.
In addition to estimating equation (3), I also exploit the panel nature of my data to
estimate the following using OLS:
log(𝑝!"#) = 𝛿! + 𝛿! + 𝜋𝑇𝑟𝑒𝑎𝑡! ∗ 𝑃𝑜𝑠𝑡! + 𝜀!"# (4)
Because this specification includes listing fixed effects, it is estimated only on the observations
of listings that appear in both the pre-agreement and post-agreement periods. In contrast to the
repeated cross-sectional estimation in equation (3), the results from equation (4) fix the sample

17
of listings and therefore remove any composition effects of the treatment. In light of this, the
estimates from equation (3) can be interpreted as the effect on average listing price in treated
cities net of any changes to the sample of listings from host entry and exit, or turnover in search
results. In contrast, the estimates from equation (4) isolate the effect on average listing price in
treated cities, holding the sample fixed.
Finally, I also examine the effect that remittance agreements had on the variance of the
listing price distribution in treated cities. To do this, I collapse the data to the city-date level, with
each observation containing the standard deviation of the listing price distribution. I then
estimate using OLS:
log(𝜎!") = 𝛿! + 𝛿! + 𝜋𝑇𝑟𝑒𝑎𝑡! ∗ 𝑃𝑜𝑠𝑡! + 𝜀!" (5)
The parameter of interest, 𝜋, captures the effect of the remittance agreement on the standard
deviation of listing prices in the treated city. Standard errors are clustered at the city level.
7. Results
Table 2 presents results obtained from estimating equation (3) using listings in the cities
of New York, San Francisco, and Los Angeles as controls. The dependent variable is the log of
listing price. The estimation sample is a repeated cross-section of all listings observed for each
city on each day a search was performed. Column 1 reports estimates from the full sample. The
estimated coefficients are all negative and statistically significant, implying that listing prices in
the three treated cities fell by anywhere from 2.9% to 5.5% after the agreements were enacted,
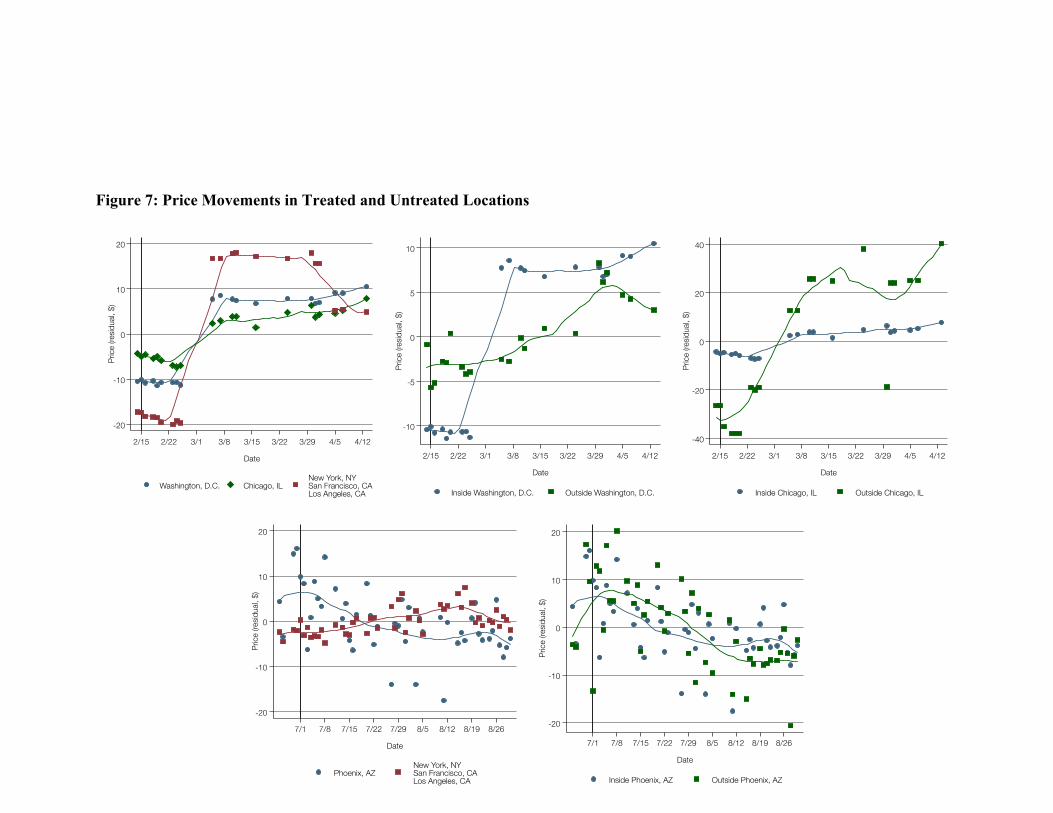
relative to listing prices in the control cities. Figure 7 provides visual evidence of price
movements in treated and control cities and neighborhoods.

18
Recall that listing prices are tax-inclusive before an agreement is signed and tax-
exclusive afterward. Therefore, a coefficient estimate of zero would imply that listing prices
remain unchanged while guest prices rise by the full amount of the tax, a “pass-through” rate of
100%. In contrast, if prices adjust downward by the amount of the tax, there are two possible
explanations. First, if all hosts previously remitted their tax obligations, then only the statutory,
but not the economic, burden of the tax shifted, and incidence remains unchanged. Second, if all
hosts were not previously in compliance, then they bear the entire burden of the tax.10
As a result, it is difficult to gauge from these estimates whether or how economic
incidence was affected by this policy. For example, the magnitude of the listing price declines in
Washington and Phoenix are smaller than the hotel tax amounts in both cities, implying that
guest (after-tax) prices rose.11 I interpret these results to suggest that the tax burden on guests in
these cities rose—they are now paying higher prices for identical products. However, if some
hosts were previously evading their remittance obligation, as seems likely, then their tax burden
rose as well.
Columns 2 through 7 of Table 1 provide estimates separately by several measures of host
sophistication. For example, hosts with multiple listings, or those who use non-heuristic pricing
(e.g., not divisible by 5), or those whose listing is not a shared or private room within their own
home (e.g., a separate apartment) are more likely to be sophisticated, and thus potentially more
responsive to the policy. The results do not convey a consistent story: hosts with just one
observed listing appear more responsive than those with multiple listings, as are hosts who rely
10 Whether the economic incidence is actually affected in this scenario is unclear. If all hosts were previously non-compliant, then the effective tax rate was zero, but may have been “borne” entirely by hosts. 11 Though the estimated magnitude of the listing price decline in Chicago (5.5%) exceeds the hotel tax rate in that city (4.5%), the confidence interval is sufficiently wide for me to be unable to rule out that the two are equal.
19
on heuristic pricing rather than those who do not. However, shared or private room listings are
not as consistently responsive as entire home listings.
Table 3 also reports estimates from equation (3), but uses listings in neighboring
municipalities as controls, rather than listings in untreated cities. Both the magnitude and sign of
the estimates are sensitive to the choice of control. For example, relative to listings in nearby
areas like Bethesda and Arlington, the listing prices of those within the city of Washington rose
by an estimated 5.7% after policy implementation, implying that the after-tax price paid by
guests rose by approximately 20%. Estimates for Chicago and Phoenix are insufficiently precise
to rule out no change at all, but for different reasons: there are very few listings in municipalities
neighboring Chicago available to use as controls, whereas the price movements of listings within
and just outside Phoenix appear very similar (see Figure 7).
One interpretation of the result in Table 3 is that the spillover effects of this policy on
listings outside of a city’s municipal borders are large. As made clear in Figure 1, listings in
adjacent municipalities are often displayed side by side in search results, where it is unclear to a
guest that one is subject to a tax upon checkout while the other is not. As a result, hosts in
untreated municipalities may feel compelled to lower their prices if hosts in treated
municipalities are doing the same.
Tables 4 and 5 present results analogous to those in Tables 2 and 3, but estimated using
the panel specification in equation (4). Recall that, unlike the repeated cross-section results from
equation (3), this approach holds constant the composition of listings to those that appeared in
both the pre-agreement and post-agreement period. This reduces the sample size considerably,
particularly for Washington and Chicago, reducing the precision of those estimates. Using
listings in New York, San Francisco, and Los Angeles as controls (Table 4), the estimated effect

20
on listing prices is negative in Phoenix, and too imprecise to real out a null effect in Washington
and Chicago. Using listings in neighboring municipalities as controls (Table 5), the estimates are
often statistically insignificant, and occasionally positive, suggesting spillover effects may play a
role here as well.
Relative to the repeated cross-section results, the magnitude of the price declines
estimated by the panel specification in Table 4 are smaller. For example, a 3.8% decline in
average listing prices in Phoenix (Table 2) is reduced to a 1.7% decline (Table 4). This implies
that a substantial portion of the policy’s effect on listing prices in Phoenix may have been caused
by changes in composition. For example, if hosts previously deterred from entering the market
because of the legal uncertainty surrounding their participation began listing after
implementation, and if their listings were priced lower than those already on the market, then
average listing prices would decline even if existing hosts failed to respond.
Finally, Tables 6 and 7 present estimates of the policy’s effect on the log standard
deviation of prices in treated cities, using city and metro control listings, respectively. Although
each point estimate is negative, only in Chicago does the policy appear to have narrowed the
distribution of prices sufficiently for the estimate to be consistently distinguishable from zero.
[need to think more about why this is the case.]
8. Conclusion
In classical economic theory, the incidence of a consumption tax is exclusively
determined by market-wide demand and supply elasticites. This paper contributes to an emerging
empirical literature which suggests that other factors, such as assignment of the remittance
obligation, may affect incidence in practice.

21
I find that shifting the legal obligation to remit hotel taxes from small, independent hosts
to Airbnb increases after-tax prices paid by consumers. The magnitude of this effect differs by a
number of host characteristics related to sophistication. While several rationalizations of my
estimates are possible, this primary result is consistent with low levels of voluntary compliance
among individual hosts prior to implementation of mandatory withholding, despite the existence
of a paper trail and federal information reporting on Airbnb rental transactions. This finding has
potentially important implications for understanding the potential revenue and distributional
consequences of taxing non-employee service transactions facilitated by digital platforms.

22
References Chetty, Raj. 2009. “Is the Taxable Income Elasticity Sufficient to Calculate Deadweight Loss?
The Implications of Evasion and Avoidance.” American Economic Journal: Economic Policy, 1(2): 31–52.
Finkelstein, Amy. 2009. “EZ-Tax: Tax Salience and Tax Rates.” Quarterly Journal of Economics, 124(3): 969-1010.
Harju, Jarkko, Tuomas Kosonen, and Oskar Nordström Skans. 2015. “Strategists, generalists and firm-level price setting: Evidence from consumption tax reforms.” Unpublished manuscript. <http://www.sv.uio.no/econ/english/research/news-and-events/events/guest-lectures-seminars/ofs-seminar/2015/swefin_reforms_05032015.pdf>
Kopczuk, Wojciech, Justin Marion, Erich Muehlegger, and Joel Slemrod. Forthcoming. “Does Tax-Collection Invariance Hold? Evasion and the Pass-through of State Diesel Taxes.” American Economic Journal: Economic Policy.
Myles, Gareth D. 1989. “Ramsey tax rules for economies with imperfect competition.” Journal of Public Economics, 38(1): 95-115.
Weyl, E. Glen, and Michal Fabinger. 2013. “Pass-through as an economic tool: Principles of incidence under imperfect competition.” Journal of Political Economy, 121(3): 528-583.

23
Figure 1: Airbnb Search Results

24
Figure 2: Airbnb Listing Details in Chicago and Evanston, IL
Chicago, IL
Evanston, IL

25
Figure 3: Listing Turnover in Search Results
Notes: Figures display the fraction of all listings observed on the first day of data collection observed on each subsequent day that a search was performed.
0
.2
.4
.6
.8
1
Fra
ctio
n o
f fir
st d
ay'
s lis
tings
in s
earc
h r
esu
lts
2/15 2/22 3/1 3/8 3/15 3/22 3/29 4/5 4/12
Date
Washington, DC
0
.2
.4
.6
.8
1
Fra
ctio
n o
f fir
st d
ay'
s lis
tings
in s
earc
h r
esu
lts
2/15 2/22 3/1 3/8 3/15 3/22 3/29 4/5 4/12
Date
Chicago, IL
0
.2
.4
.6
.8
1
Fra
ctio
n o
f fir
st d
ay'
s lis
tings
in s
earc
h r
esu
lts
2/15 2/22 3/1 3/8 3/15 3/22 3/29 4/5 4/12
Date
New York, NY
0
.2
.4
.6
.8
1
Fra
ctio
n o
f fir
st d
ay'
s lis
tings
in s
earc
h r
esu
lts
2/15 2/22 3/1 3/8 3/15 3/22 3/29 4/5 4/12
Date
San Francisco, CA
0
.2
.4
.6
.8
1
Fra
ctio
n o
f fir
st d
ay'
s lis
tings
in s
earc
h r
esu
lts
7/1 7/8 7/15 7/22 7/29 8/5 8/12 8/19 8/26
Date
Phoenix, AZ
0
.2
.4
.6
.8
1
Fra
ctio
n o
f fir
st d
ay'
s lis
tings
in s
earc
h r
esu
lts
7/1 7/8 7/15 7/22 7/29 8/5 8/12 8/19 8/26
Date
Los Angeles, CA

26
Figure 4: Spatial Distribution of Listings, Relative to City Boundaries
Washington, DC
Chicago, IL
27
Figure 4: Spatial Distribution of Listings, Relative to City Boundaries (cont.)
Phoenix, AZ

28
Figure 5: Cumulative Fraction of Listings Changing Price
Notes: Figures display the fraction of listings appearing in both the pre- and post-agreement periods that change price at least once by the date shown.
0
.1
.2
.3
.4
Cum
ula
tive fra
ctio
n o
f lis
tings
changin
g p
rice
2/15 2/22 3/1 3/8 3/15 3/22 3/29 4/5 4/12
Date
Washington, DC
0
.1
.2
.3
.4
Cum
ula
tive fra
ctio
n o
f lis
tings
changin
g p
rice
2/15 2/22 3/1 3/8 3/15 3/22 3/29 4/5 4/12
Date
Chicago, IL
0
.1
.2
.3
.4
Cum
ula
tive fra
ctio
n o
f lis
tings
changin
g p
rice
2/15 2/22 3/1 3/8 3/15 3/22 3/29 4/5 4/12
Date
New York, NY
0
.1
.2
.3
.4
Cum
ula
tive fra
ctio
n o
f lis
tings
changin
g p
rice
2/15 2/22 3/1 3/8 3/15 3/22 3/29 4/5 4/12
Date
San Francisco, CA
0
.1
.2
.3
.4
Cum
ula
tive fra
ctio
n o
f lis
tings
changin
g p
rice
7/1 7/8 7/15 7/22 7/29 8/5 8/12 8/19 8/26
Date
Phoenix, AZ
0
.1
.2
.3
.4
Cum
ula
tive fra
ctio
n o
f lis
tings
changin
g p
rice
7/1 7/8 7/15 7/22 7/29 8/5 8/12 8/19 8/26
Date
Los Angeles, CA

29
Figure 6: Histogram of Listing Prices
Notes: Figure displays the frequency of listings by price, for all observed listings priced under $250.
0
5
10
15
20
Lis
ting
s (0
00
s)
25 50 75 100 125 150 175 200 225 250
Price
Yes No
Divisible by 5
Airbnb listings by price
30
Figure 7: Price Movements in Treated and Untreated Locations
Notes: Figures display demeaned prices for each location on each date, superimposed with a polynomial kernel smoother.
-20
-10
0
10
20
Pric
e (re
sid
ual,
$)
2/15 2/22 3/1 3/8 3/15 3/22 3/29 4/5 4/12
Date
Washington, D.C. Chicago, ILNew York, NYSan Francisco, CALos Angeles, CA
-10
-5
0
5
10
Pric
e (re
sidu
al, $
)
2/15 2/22 3/1 3/8 3/15 3/22 3/29 4/5 4/12
Date
Inside Washington, D.C. Outside Washington, D.C.
-40
-20
0
20
40
Pric
e (re
sidu
al, $
)
2/15 2/22 3/1 3/8 3/15 3/22 3/29 4/5 4/12
Date
Inside Chicago, IL Outside Chicago, IL
-20
-10
0
10
20
Pric
e (re
sid
ual,
$)
7/1 7/8 7/15 7/22 7/29 8/5 8/12 8/19 8/26
Date
Phoenix, AZNew York, NYSan Francisco, CALos Angeles, CA
-20
-10
0
10
20P
rice
(resi
dual
, $)
7/1 7/8 7/15 7/22 7/29 8/5 8/12 8/19 8/26
Date
Inside Phoenix, AZ Outside Phoenix, AZ

31
Table 1: Summary statistics
% Entire Average % Entire AverageLocation Listings Home Price Listings Home Price
(1) (2) (3) (4) (5) (6)
Washington, D.C. 2100 .65 128 922 .634 109Chicago, IL 2758 .611 129 991 .559 105
New York, NY 3779 .508 130 938 .494 116San Francisco, CA 2185 .59 161 982 .578 142Los Angeles, CA 1234 .574 125 n.a. n.a. n.a.
Washington Metro (excl. D.C.) 930 .488 108 74 .378 82Chicago Metro (excl. Chicago) 186 .366 102 7 .286 92
Phoenix, AZ 1534 .693 284 1311 .708 306
New York, NY 9253 .481 122 1443 .444 119San Francisco, CA 4573 .534 166 1393 .513 149Los Angeles, CA 7028 .566 115 1417 .582 103
Phoenix Metro (excl. Phoenix) 2025 .7 342 1716 .707 374
Notes: Data from Los Angeles were not collected prior to February 15.
Wave 1: Feb. 13 - Apr. 13, 2015
Wave 2: Jun. 25 - Aug. 30, 2015
Listings Appearing Pre-and Post-AgreementAll Listings

32
Table 2: Difference-in-differences estimates of Airbnb remittance agreement effect on log(Price) of listings:city controls, repeated cross-section
City All Listings Yes No Yes No Yes No(1) (2) (3) (4) (5) (6) (7)
Washington, D.C. -0.029* -0.038* -0.015 -0.042** 0.004 0.001 -0.058(t = 14.5%) (0.011) (0.012) (0.009) (0.010) (0.014) (0.003) (0.025)
63,252 41,047 22,205 43,687 19,565 26,926 36,326
Chicago, IL -0.055** -0.064*** -0.036** -0.069*** -0.024 -0.036*** -0.070*(t = 4.5%) (0.011) (0.010) (0.010) (0.009) (0.013) (0.004) (0.025)
65,012 41,426 23,586 45,227 19,785 29,616 35,396
Phoenix, AZ -0.038* -0.044** -0.026 -0.043 -0.003 -0.012 -0.052**(t = 5%) (0.016) (0.014) (0.018) (0.021) (0.007) (0.018) (0.012)
199,970 124,815 75,155 138,402 61,568 88,133 111,837
Notes: Estimates from separate regressions of equation (3) in the text, using listings in New York, San Francisco, Los Angeles as controls. Standard errors clustered by city in parentheses. Observations below standard errors.*** Significant at the 1% level. ** Significant at the 5% level. * Significant at the 10% level.
Single-Listing Host Price Divisible by 5 Shared/Private Room

33
Table 3: Difference-in-differences estimates of Airbnb remittance agreement effect on log(Price) of listings:metro controls, repeated cross-section
City All Listings Yes No Yes No Yes No(1) (2) (3) (4) (5) (6) (7)
Washington, D.C. 0.057*** 0.027 0.077*** 0.037* 0.100*** 0.036 0.067**(t = 14.5%) (0.018) (0.021) (0.027) (0.020) (0.036) (0.023) (0.027)
40,803 23,719 17,084 28,722 12,081 16,445 24,358
Chicago, IL 0.042 0.074 0.013 -0.005 0.125** 0.021 0.046(t = 4.5%) (0.035) (0.054) (0.048) (0.041) (0.062) (0.037) (0.079)
39,239 22,464 16,775 27,831 11,408 16,151 23,088
Phoenix, AZ -0.010 -0.020 0.002 -0.017 0.044 0.028 -0.027(t = 5%) (0.018) (0.023) (0.027) (0.021) (0.028) (0.027) (0.023)
142,137 94,675 47,462 108,140 33,997 42,348 99,789
Notes: Estimates from separate regressions of equation (3) in the text, using listings in neighboring municipalitiesas controls. Standard errors clustered by city in parentheses. Observations below standard errors.*** Significant at the 1% level. ** Significant at the 5% level. * Significant at the 10% level.
Single-Listing Host Price Divisible by 5 Shared/Private Room

34
Table 4: Difference-in-differences estimates of Airbnb remittance agreement effect on log(Price) of listings:city controls, panel
City All Listings Yes No Yes No Yes No(1) (2) (3) (4) (5) (6) (7)
Washington, D.C. 0.000 0.001 -0.002 0.003 -0.003 -0.003 0.003(t = 14.5%) (0.008) (0.005) (0.014) (0.007) (0.009) (0.011) (0.004)
35,950 23,534 12,416 24,407 11,543 15,473 20,477
Chicago, IL 0.012 0.014 0.008 0.010 0.011 0.004 0.018*(t = 4.5%) (0.009) (0.006) (0.015) (0.008) (0.009) (0.011) (0.005)
36,226 23,336 12,890 24,840 11,386 16,919 19,307
Phoenix, AZ -0.017** -0.016** -0.019* -0.017** -0.003 -0.007 -0.020***(t = 5%) (0.005) (0.004) (0.006) (0.004) (0.004) (0.007) (0.003)
129,673 78,102 51,571 89,012 40,661 53,465 76,208
Notes: Estimates from separate regressions of equation (4) in the text, using listings in New York, San Francisco, Los Angeles as controls. Standard errors clustered by city in parentheses. Observations below standard errors.*** Significant at the 1% level. ** Significant at the 5% level. * Significant at the 10% level.
Single-Listing Host Price Divisible by 5 Shared/Private Room

35
Table 5: Difference-in-differences estimates of Airbnb remittance agreement effect on log(Price) of listings:metro controls, panel
City All Listings Yes No Yes No Yes No(1) (2) (3) (4) (5) (6) (7)
Washington, D.C. 0.001 -0.003 0.006 0.002 -0.006 0.007** -0.002(t = 14.5%) (0.003) (0.003) (0.005) (0.003) (0.006) (0.004) (0.003)
34,565 20,140 14,425 24,227 10,338 13,731 20,834
Chicago, IL 0.011** 0.017*** 0.005 0.010 0.014*** 0.010 0.011(t = 4.5%) (0.005) (0.006) (0.009) (0.006) (0.005) (0.007) (0.009)
32,963 18,795 14,168 23,264 9,699 13,357 19,606
Phoenix, AZ -0.001 0.002 -0.009** -0.005*** 0.009*** 0.017*** -0.011***(t = 5%) (0.002) (0.002) (0.004) (0.002) (0.003) (0.003) (0.002)
133,278 89,097 44,181 101,527 31,751 39,023 94,255
Notes: Estimates from separate regressions of equation (4) in the text, using listings in neighboring municipalitiesas controls. Standard errors clustered by city in parentheses. Observations below standard errors.*** Significant at the 1% level. ** Significant at the 5% level. * Significant at the 10% level.
Single-Listing Host Price Divisible by 5 Shared/Private Room

Table 6: Difference-in-differences estimates of Airbnb remittance agreement effect on log(σPrice) oflistings: city controls
City All Listings(1)
Washington, D.C. -0.012(t = 14.5%) (0.025)
67
Chicago, IL -0.190***(t = 4.5%) (0.025)
67
Phoenix, AZ -0.097*(t = 5%) (0.039)
192
Notes: Estimates from separate regressions ofequation (5) in the text, using listings in New York, SanFrancisco, Los Angeles as controls. Standard errorsclustered by city in parentheses. Observations belowstandard errors. *** Significant at the 1% level. **Significant at the 5% level. * Significant at the 10%level.

37
Table 7: Difference-in-differences estimates of Airbnb remittance agreement effect on log(σPrice) oflistings: metro controls
City All Listings(1)
Washington, D.C. 0.009(t = 14.5%) (0.107)
44
Chicago, IL -0.234**(t = 4.5%) (0.096)
44
Phoenix, AZ -0.002(t = 5%) (0.007)
96
Notes: Estimates from separate regressions ofequation (5) in the text, using listings in neighboringmunicipalities as controls. Standard errorsclustered by city in parentheses. Observations belowstandard errors. *** Significant at the 1% level. **Significant at the 5% level. * Significant at the 10%level.