Hotel Management – Jekkmans Consulting Taken from Hotel Seralago Website.
12
Hotel Management – Jekkmans Consulting Taken from Hotel Seralago Website
-
Upload
easter-farmer -
Category
Documents
-
view
219 -
download
1
Transcript of Hotel Management – Jekkmans Consulting Taken from Hotel Seralago Website.

Hotel Management – Jekkmans Consulting
Taken from Hotel Seralago Website
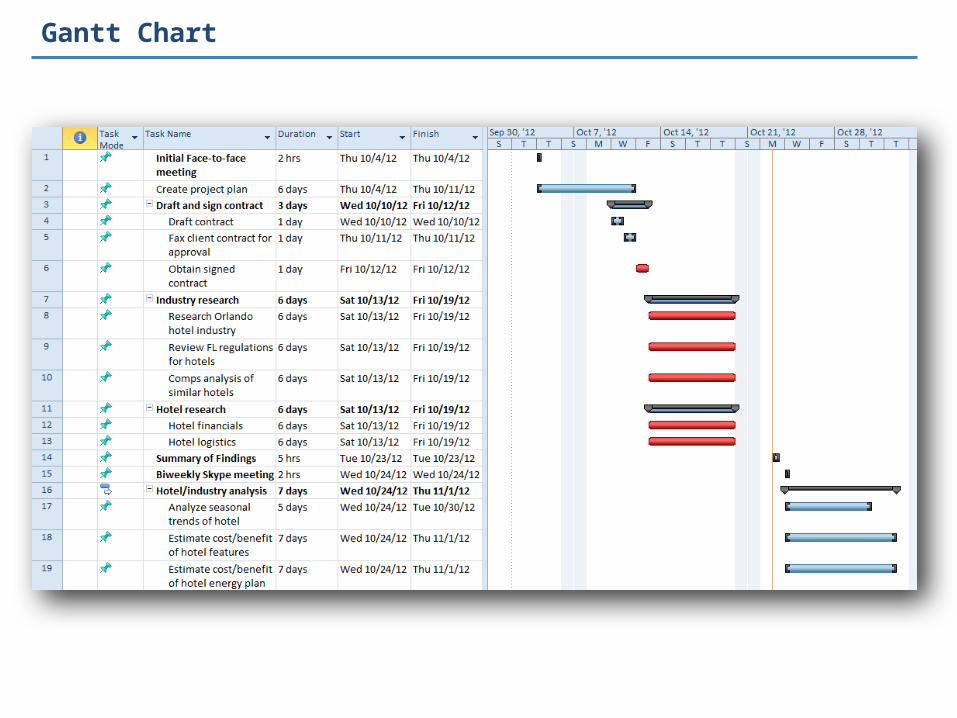
Gantt Chart

Financial Data
Cost Distribution
Cost of salesPayroll & RelatedOther expenses (directly related to revenue)Undistributed expenses (G&A, Security, Quality assurance, S&M, etc. )Profit

•Rooms are costly to maintain during the year•AC must be kept on at all times to maintain furniture•During off season, over half of the hotel is not occupied, so cutting rooms could save a lot of energy and cost
Communication with Client/Follow-ups:•Follow-ups:• Communicate with hotel managers to retrieve more
specific data to calculate actual cost of room maintenance
Proposed Plan: Energy Saving

Energy Saving Research: Utility Analysis
•Expense on water is surprisingly high. Seralago is paying nearly 200,000 per year on water.
Follow-Ups:•Generate a graph showing the relations between utility cost and room occupancy/ revenue.

Energy Saving Research: Water Expenses
•Water price remains quite stable over the years, except year 2008
Follow-Ups:•Research potential causes of low water expenditure in 2008, which could help the hotel save money in the future

•Rooms are costly to maintain during the year•AC must be kept on at all times to maintain furniture•During off season, over half of the hotel is not occupied, so cutting rooms could save a lot of energy and cost
•Follow-ups:• Communicate with hotel managers to retrieve more
specific data to calculate actual cost of room maintenance
Proposed Plan/Communication with Client

January
Febru
aryMarc
hApril
MayJune
July
August
Septem
ber
October
November
December
0.0%
10.0%
20.0%
30.0%
40.0%
50.0%
60.0%
70.0%
80.0%
90.0%
Occupancy Rates Throughout the Year
200620072008200920102011
Occ
upan
cy R
ate

The 8th week (this week): Analyzing the sectors that are not currently profitingUpcoming task: the 9th week: Creating plans for maximizing revenue and minimizing for the red sectors •Restaurant and Telephone currently are two sectors seeing losses.
Financial Data

•Revenue:• Vineyard Food (43.7% of the total Restaurant
Revenue), Food Court Food (13.6%) and General Store (21.1%) bring most of the Restaurant Revenue.
• All American Grille (4.5%), Pizza Food Court (5.5%) and Food Court Food still have potential to increase Restaurant Revenue. They will be the sectors that we are focusing on to maximize revenue.
• Cost• Salary (54.5% of Restaurant Revenue) and
Cost of Sales (52.5%) are two main costs. • Vineyard (9.4%), Food Court (13.7%) and
Kitchen (16.7%) are the three main parts of Salary cost.
• For Food Court, Salary cost already exceeds the revenue from this sector, even before the costs form Kitchen, Food and Electricity. So Food Court will be our focus of cutting cost.
•Data needed: Staff numbers in each department under Restaurant and detailed functions
Financial Data: Restaurant

•Gross Profit (Total Revenue from telephone less the Net Cost of Sales) is 7.2%.•Combining department and staff cutting may be considered•Data needed: Staff numbers in each department under Restaurant and detailed functions
Financial Data: Telephone
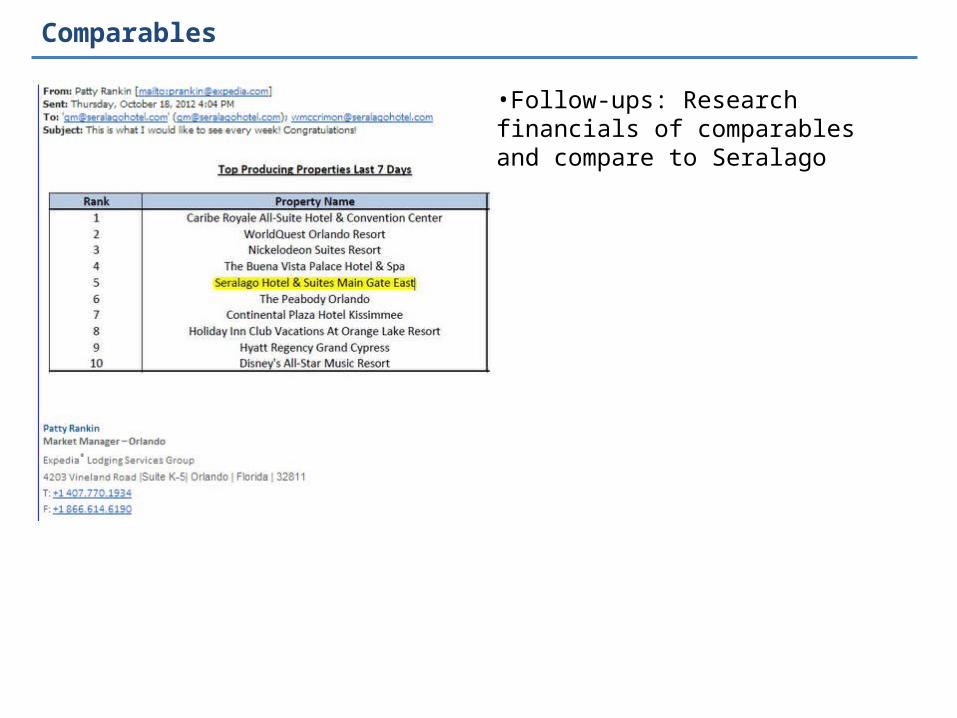
Comparables
•Follow-ups: Research financials of comparables and compare to Seralago