
HOTEL INDUSTRY OVERVIEW | FALL 2014 - United - … States/PG and Service Lines...HOTEL INDUSTRY...
11
Accelerating success. http://www.colliers.com/en-us/us/hotels Prepared For: Colliers International Hotels HOTEL INDUSTRY OVERVIEW | FALL 2014
Transcript of HOTEL INDUSTRY OVERVIEW | FALL 2014 - United - … States/PG and Service Lines...HOTEL INDUSTRY...

Accelerating success. http://www.colliers.com/en-us/us/hotels
Prepared For:
Colliers International Hotels
HOTEL INDUSTRY OVERVIEW | FALL 2014
1 | P a g e
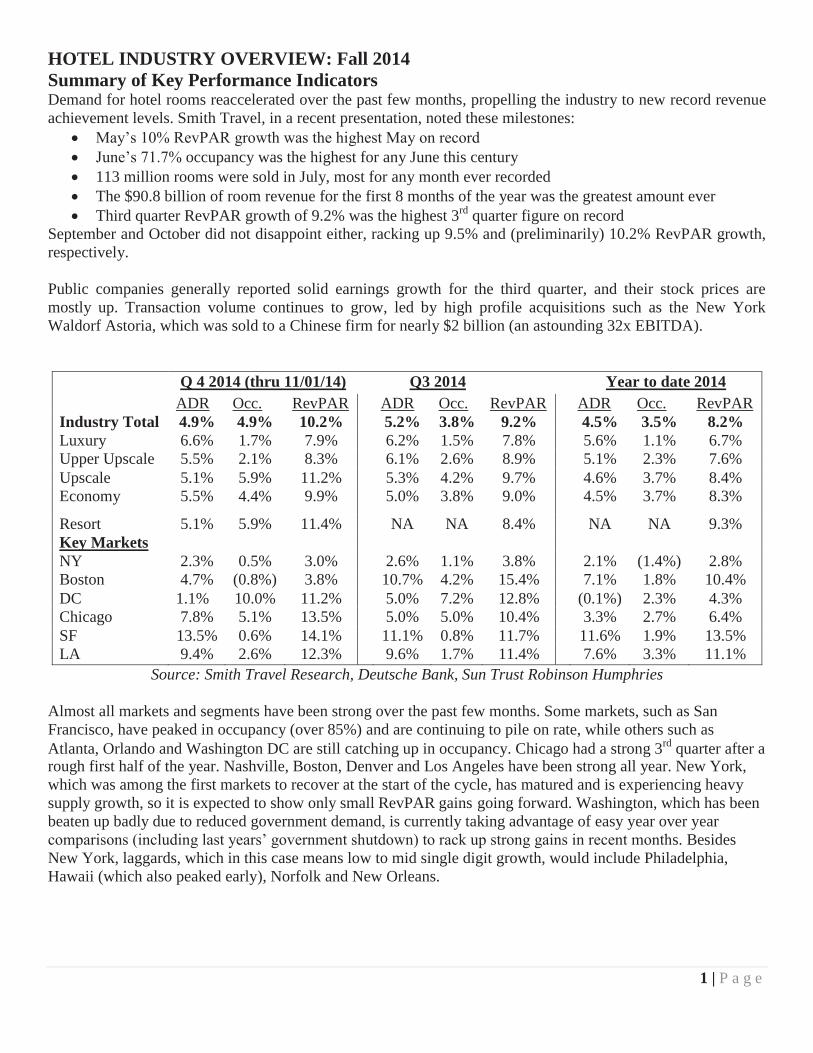
HOTEL INDUSTRY OVERVIEW: Fall 2014Summary of Key Performance Indicators Demand for hotel rooms reaccelerated over the past few months, propelling the industry to new record revenue achievement levels. Smith Travel, in a recent presentation, noted these milestones:
May’s 10% RevPAR growth was the highest May on recordJune’s 71.7% occupancy was the highest for any June this century113 million rooms were sold in July, most for any month ever recordedThe $90.8 billion of room revenue for the first 8 months of the year was the greatest amount everThird quarter RevPAR growth of 9.2% was the highest 3rd quarter figure on record
September and October did not disappoint either, racking up 9.5% and (preliminarily) 10.2% RevPAR growth, respectively.
Public companies generally reported solid earnings growth for the third quarter, and their stock prices are mostly up. Transaction volume continues to grow, led by high profile acquisitions such as the New York Waldorf Astoria, which was sold to a Chinese firm for nearly $2 billion (an astounding 32x EBITDA).
Q 4 2014 (thru 11/01/14) Q3 2014 Year to date 2014ADR Occ. RevPAR ADR Occ. RevPAR ADR Occ. RevPAR
Industry Total 4.9% 4.9% 10.2% 5.2% 3.8% 9.2% 4.5% 3.5% 8.2%Luxury 6.6% 1.7% 7.9% 6.2% 1.5% 7.8% 5.6% 1.1% 6.7%Upper Upscale 5.5% 2.1% 8.3% 6.1% 2.6% 8.9% 5.1% 2.3% 7.6%Upscale 5.1% 5.9% 11.2% 5.3% 4.2% 9.7% 4.6% 3.7% 8.4%Economy 5.5% 4.4% 9.9% 5.0% 3.8% 9.0% 4.5% 3.7% 8.3%
Resort 5.1% 5.9% 11.4% NA NA 8.4% NA NA 9.3%Key MarketsNY 2.3% 0.5% 3.0% 2.6% 1.1% 3.8% 2.1% (1.4%) 2.8%Boston 4.7% (0.8%) 3.8% 10.7% 4.2% 15.4% 7.1% 1.8% 10.4%DC 1.1% 10.0% 11.2% 5.0% 7.2% 12.8% (0.1%) 2.3% 4.3%Chicago 7.8% 5.1% 13.5% 5.0% 5.0% 10.4% 3.3% 2.7% 6.4%SF 13.5% 0.6% 14.1% 11.1% 0.8% 11.7% 11.6% 1.9% 13.5%LA 9.4% 2.6% 12.3% 9.6% 1.7% 11.4% 7.6% 3.3% 11.1%
Source: Smith Travel Research, Deutsche Bank, Sun Trust Robinson Humphries
Almost all markets and segments have been strong over the past few months. Some markets, such as San Francisco, have peaked in occupancy (over 85%) and are continuing to pile on rate, while others such as Atlanta, Orlando and Washington DC are still catching up in occupancy. Chicago had a strong 3rd quarter after arough first half of the year. Nashville, Boston, Denver and Los Angeles have been strong all year. New York, which was among the first markets to recover at the start of the cycle, has matured and is experiencing heavy supply growth, so it is expected to show only small RevPAR gains going forward. Washington, which has been beaten up badly due to reduced government demand is currently taking advantage of easy year over year comparisons (including last years’ government shutdown) to rack up strong gains in recent months. Besides New York, laggards, which in this case means low to mid single digit growth, would include Philadelphia,Hawaii (which also peaked early), Norfolk and New Orleans.

2 | P a g e
Group in general has rebounded after a slow start this year. Group demand growth is back up in the 4% levels (similar to mid 2012), while ADR is steady at around 3%. Importantly, the overall average spread between transient and group ADR has widened to almost $30 (16%) in the upper-priced hotels, the highest since 2008, which means that there is room to move on group pricing.
BRAND DETAIL Q3 2014 Rolling 4 Quarters
ADR Occ RevPAR ADR Occ RevPARLuxury
Ritz-Carlton 3.6% 4.0% 7.6% 4.9% 2.4% 7.3%Waldorf Astoria 6.5% 0.6% 7.2% 6.2% 0.6% 6.8%St Regis/Lux Coll 7.8% 1.3% 9.2% 6.7% 1.4% 8.3%W 6.1% 1.3% 7.5% 4.0% 1.0% 5.1%
Upper UpscaleMarriott 4.8% 3.6% 8.5% 3.8% 2.4% 6.2%Hilton 3.5% 3.7% 7.4% 3.4% 2.1% 5.6%Sheraton 4.3% 2.8% 7.3% 3.4% 2.3% 5.7%Westin 6.9% 3.0% 10.1% 4.4% 2.6% 7.1%Hyatt Regency 6.0% 1.6% 7.6% 3.4% 2.1% 5.6%
UpscaleDoubletree 5.7% 3.7% 9.5% 4.1% 3.1% 7.5%Courtyard 5.0% 4.2% 9.4% 3.9% 2.8% 6.9%Four Points 4.5% 5.3% 10.0% 2.8% 3.4% 6.4%
Upper MidscaleHampton Inn 4.0% 4.8% 9.2% 3.6% 3.2% 7.1%Fairfield 4.1% 3.7% 7.9% 3.3% 2.5% 6.1%
MidscaleRamada 1.6% 0.9% 2.4% 0.6% 2.6% 3.0%La Quinta 4.6% 4..1% 8.9% 4.7% 2.9% 7.8%Quality Inns 2.5% 5.7% 8.4% 3.8% 4.5% 6.5%
EconomyDay’s Inn 4.4% 2.3% 6.7% 1.8% 4.2% 6.1%Econo Lodge 3.5% 5.4% 8.9% 1.2% 3.8% 5.2%Knights Inn 0.4% 6.6% 7.0% 3.6% 5.5% 9.1%Super 8 (1.7%) (1.1%) (2.8%) (2.8%) 1.2% (1.6%)
Source: Q3 Company earnings releases
The detail on the chain scales, as shown in the chart above, reveals that there is a fair amount of consistency in the top 2/3 of the market (upper midscale and above), but there are wide variations at the lower end which are mostly due to product inconsistency. Chains with newer or renovated products such as La Quinta, are doing significantly better than tired old brands like Ramada and Super 8.
Outlook The near term outlook is still very positive. The table below summarizes the current 2014 year end and 2015 forecasts from the major hospitality consultants. PWC’s estimates were updated on November 10 to reflect a 60 bp increase in 2014 RevPAR and a 70 bp increase in 2015 RevPAR, with gains coming from both occupancy (higher demand) and ADR. STR is also expect to revise their numbers higher in mid November, with 2015 moving up to the 5.5% to 6.0% range.

3 | P a g e
2014 2015STR PKF PWC STR PKF PWC
Supply 1.0% 0.9% 0.9% 1.3% 1.3% 1.3%Demand 3.6% 4.5% 4.3% 2.1% 2.2% 2.5%Occupancy 2.6% 3.6% 3.4% 0.7% 0.9% 1.2%ADR 4.2% 4.5% 4.7% 4.4% 5.7% 6.2%RevPAR 6.9% 8.2% 8.2% 5.2% 6.7% 7.4%
To put these in perspective, the 25 year CAGR for supply and demand are each 1.9% (meaning that occupancy has averaged out flat across that time span), while ADR and RevPAR have each averaged just about 3%, which has more than kept pace with the 2.7% compound increase in the CPI.
Most observers expect supply to continue to grow, but it is not expected to get to the 2% range until 2017 or 2018, while barring a “black swan” event, demand should continue to grow as the economy continues its gradual recovery. The industry is currently about 4 ½ years into the cycle, having seen as of September 55 straight months of increasing RevPAR. While there were only 56 consecutive months of growth in the 2003-08 cycle, the profile of this recovery appears to be more like the 1992-2001 period, which had 107 months of positive RevPAR growth marred by only one month (August 1998) that showed a minor (0.4%) drop. Accordingly, the consensus is that we should be good at least through the end of 2018. This marks a definite shift in sentiment over the past few months, pushing the expansion period out by at least a full year.
Transactions The chart below lists the largest individual property sales over the past three months. In addition to these, there were four major select service portfolio purchases. Two portfolios were purchased by Northstar from Inland America (mixed brands) and Clarion Partners (Courtyards) for total of approximately $1.3 Billion, a collection of Hyatt Places and Hyatt Houses that Hyatt sold to Lone Star for $600MM and Blackstone purchased 12 hotels of various brands in the South from OTO Development for $110MM.
Pyramid is very well represented on this list, having been retained as manager of the Forbes Five Star Boston Harbor hotel by Morgan Stanley and is competing for assignments on several other of these properties. Pyramid was formerly the manager of the Marriott Sawgrass, and its operational and project management expertise contributed to a significant increase in value for the seller Goldman Sachs. In addition, Pyramid also provided consulting services to Northstar to help them underwrite their Courtyard acquisition.
Overall, this list is again dominated by large markets including New York, South Florida, Hawaii and Atlanta. Of course, the marquee deal was the Waldorf, which was worth more than the next seven highest properties combined, and probably is a record for price per key for a large property. Public REIT’s were again on both sides of these transactions- Chesapeake, RLJ and Diamondrock were buyers, while Host and LaSalle were sellers. Hyatt and Hilton were other notable public sellers. The other players are generally well capitalized private equity funds or real estate powerhouses like Brookfield and Blackstone.
Finally, a major international deal was recently announced where Starwood Capital sold Paris-based Louvre Hotels Group to the Chinese firm Jin Jiang for US $1.5 billion. Louvre has over 1,100 hotels in 47 mostly European countries, while Jin Jiang operates more than 1,700 hotels in 11 mostly Asian countries, and also (together with Thayer Lodging) owns US based Interstate Hotels. The two firms are no strangers, having established a co-branding program to promote international tourism in 2011.

4 | P a g e
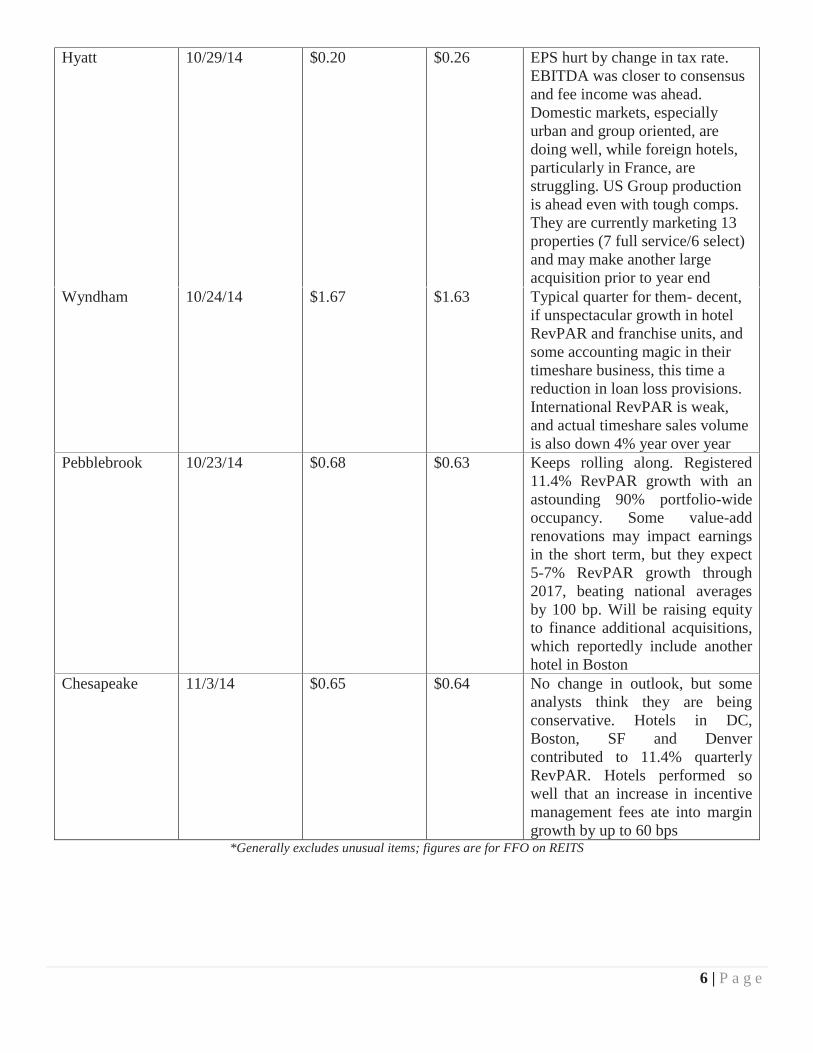
Public Company NewsEarningsThe table below summarizes Q3 2014 earnings reported by major public hospitality companies. For the most part, companies met or slightly exceeded expectations (which had been pumped up based on YTD performance metrics), but they turned more cautious when speaking about Q4 or next year. A common theme among the larger companies was problems in international markets due to poorer economic conditions and unfavorable foreign exchange rates. The companies that did the best were the ones that had the most relative exposure in the US cities with above-average RevPAR growth such as Washington, Boston and San Francisco.
Company Release Date Reported EPS*Consensus EPS* Comments
Starwood 10/28/14 $0.66 $0.65 Guiding slightly lower for 4Q (reduced top end RevPAR from 7% to 6%, citing impact of unfavorable US dollar exchange rates on overseas properties. Looking for 4-6% RevPAR in 2015. Aggressive share buyback, but they may have overpaid- missed the window in October when price went down
Marriott 10/28/14 $0.65 $0.62 Also continuing to aggressively buying back shares. 5-7% RevPAR guidance for 2015, unchanged for 2014.Pipeline up 5% since last quarter. Group pace is up mid single digits

5 | P a g e
Host Hotels 10/30/14 $0.34 $0.31 A penny of the beat was due to non recurring insurance settlements and legal fee adjustments. Attempting to recycle capital from Tampa salebut will distribute $.05 per share special dividend if 1031 exchanges cannot be completed by year end. Looking for further asset sales including reducing dependence on NY. Solid group performance (over 10% gain) for quarter with improvements in ancillary revenue as well
Hilton 10/31/14 $0.18 $0.17 Guidance was raised for Q4; they have raised every quarter since going public last year. For 2015, they are projecting 5-7% RevPAR and 6-7% unit growth. They are still trading at a discounted multiple/EPS compared to Marriott. Blackstone sold more shares in early Nov. Hilton will likely buy assets from Blackstone to useWaldorf proceeds in a 1031 exchange.
LaSalle 10/22/14 $0.85 $0.79 Healthy beat, with 11.5% RevPAR for the quarter, boosted by exposure to strong Eastern markets like DC and Boston. Recent sale of non-core Viking hotel was also viewed positively by the Street
Hersha 10/29/14 $0.14 $0.13 12% RevPAR for the quarter, as they were in all the right markets (Boston, DC, CA). Q4 also looks solid. Recent Key West hotel appears to be running ahead of underwriting,
Choice 10/24/14 $0.67 $0.63 Beat driven by stronger than expected RevPAR growth from franchised units- 8.8% vs. guidance of 6-7%. G&A also better than advertised. They are considering share repurchases and also promise to detail returns from Skytouch system
6 | P a g e
Hyatt 10/29/14 $0.20 $0.26 EPS hurt by change in tax rate. EBITDA was closer to consensus and fee income was ahead. Domestic markets, especially urban and group oriented, are doing well, while foreign hotels, particularly in France, are struggling. US Group production is ahead even with tough comps. They are currently marketing 13 properties (7 full service/6 select) and may make another large acquisition prior to year end
Wyndham 10/24/14 $1.67 $1.63 Typical quarter for them- decent, if unspectacular growth in hotel RevPAR and franchise units, and some accounting magic in their timeshare business, this time a reduction in loan loss provisions. International RevPAR is weak, and actual timeshare sales volume is also down 4% year over year
Pebblebrook 10/23/14 $0.68 $0.63 Keeps rolling along. Registered11.4% RevPAR growth with an astounding 90% portfolio-wide occupancy. Some value-add renovations may impact earnings in the short term, but they expect 5-7% RevPAR growth through 2017, beating national averages by 100 bp. Will be raising equity to finance additional acquisitions, which reportedly include anotherhotel in Boston
Chesapeake 11/3/14 $0.65 $0.64 No change in outlook, but some analysts think they are being conservative. Hotels in DC, Boston, SF and Denver contributed to 11.4% quarterly RevPAR. Hotels performed sowell that an increase in incentive management fees ate into margin growth by up to 60 bps
*Generally excludes unusual items; figures are for FFO on REITS
7 | P a g e
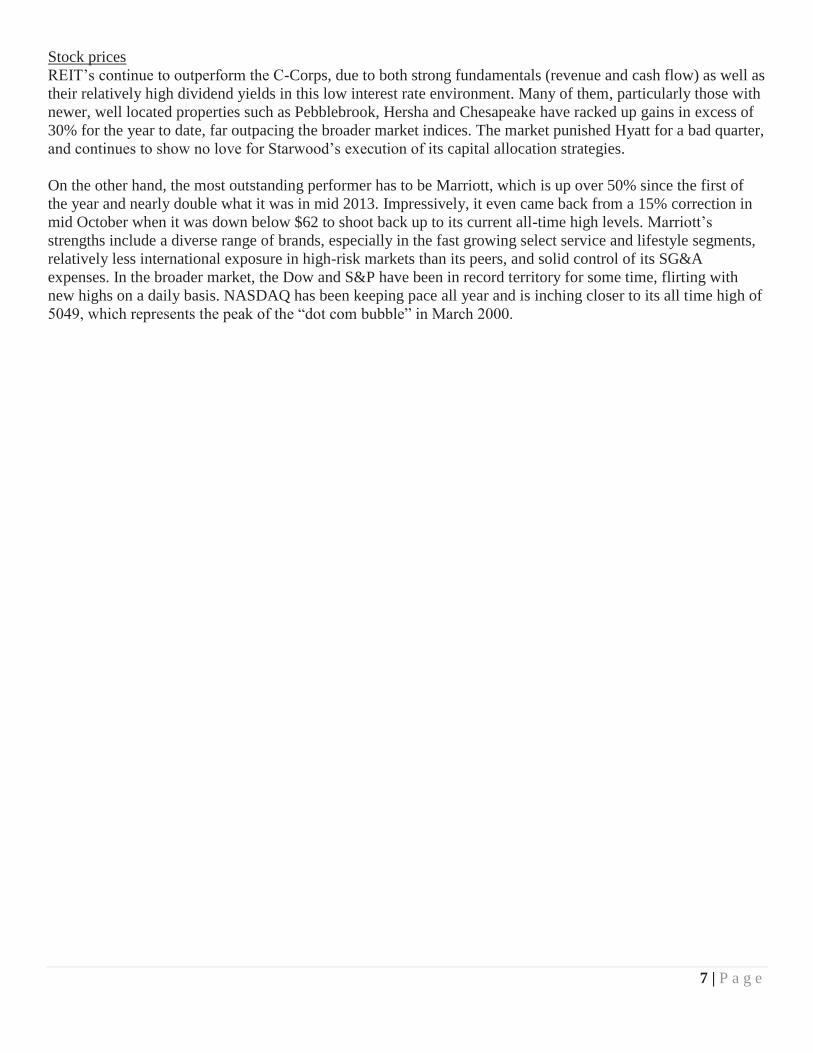
Stock pricesREIT’s continue to outperform the C-Corps, due to both strong fundamentals (revenue and cash flow) as well as their relatively high dividend yields in this low interest rate environment. Many of them, particularly those with newer, well located properties such as Pebblebrook, Hersha and Chesapeake have racked up gains in excess of 30% for the year to date, far outpacing the broader market indices. The market punished Hyatt for a bad quarter, and continues to show no love for Starwood’s execution of its capital allocation strategies.
On the other hand, the most outstanding performer has to be Marriott, which is up over 50% since the first of the year and nearly double what it was in mid 2013. Impressively, it even came back from a 15% correction in mid October when it was down below $62 to shoot back up to its current all-time high levels. Marriott’s strengths include a diverse range of brands, especially in the fast growing select service and lifestyle segments, relatively less international exposure in high-risk markets than its peers, and solid control of its SG&A expenses. In the broader market, the Dow and S&P have been in record territory for some time, flirting with new highs on a daily basis. NASDAQ has been keeping pace all year and is inching closer to its all time high of 5049, which represents the peak of the “dot com bubble” in March 2000.

8 | P a g e
Publicly traded hotel company stock performance (US based companies with market capitalization in excess of $1 Billion plus selected companies over $500 Million
Company Type Primary Segment (s)
Price as of11/07/14
ChangeSince
9/30/14
Change Since
12/31/13
Marriot International C-Corp Upper Upscale, Luxury, Resorts
$75.33 7.8% 52.6%
Starwood Hotels C-Corp Upper Upscale, Luxury 76.13 (8.5%) (4.2%)
Choice C-Corp Limited Service 52.75 1.8% 7.4%
Hilton C-Corp All except economy 24.99 1.5% 12.3%
Hyatt C-Corp Upper Upscale 57.43 (5.1%) 16.1%
Host Hotels REIT Upper Upscale, Luxury 22.70 6.4 16.8%
La Salle REIT Urban boutique, Upper Upscale
38.88 13.6% 26.0%
Diamondrock REIT Upper Upscale, Luxury, Urban Limited Service
14.12 11.4% 22.3%
RLJ REIT Limited Service with some Upper Upscale
31.90 12.0% 31.2%
Sunstone REIT Upper Upscale 15.43 11.6% 15.1%
Strategic REIT Upper Upscale, Luxury 12.57 7.9% 33.0%
Pebblebrook REIT Upper Upscale, Luxury 41.75 11.8% 35.7%
Hersha REIT Urban Limited Service 7.37 15.7% 32.3%
Chesapeake REIT Upper Upscale 33.28 14.2% 31.6%
Hospitality PropertiesTrust
REIT Limited Service 30.09 14.0% 11.3%
Dow Jones Industrial (comparison) 17530.90 2.9% 5.8%
Nasdaq Composite (comparison) 4620.27 2.8% 10.6%
S&P 500 (comparison) 2027.54 2.8% 9.7%
Source: Yahoo! Finance

9 | P a g e
Other News and Trends in Brief Technology is at the forefront of the news. First, Marriott got fined $600K by the FCC for allegedlyjamming guest internet access in the conference facilities at one of its Gaylord Resort properties, thenthey announced that they will no longer charge for wireless internet for its Marriott Rewards membersprovided that reservations were made through the Marriott system as opposed to OTA’s (online travelagencies)OTA’s were also the target of other brands technology initiatives, including Hilton’s plan to make roomkeys available on your smart phone but again only if you book directly through them. This segues intothe trend forAutomation, which is the hotelier’s weapon to increase efficiency and maximize profits. The front deskis currently the easiest target. While automated checkout has been in place for years, the check inexperience has been radically changing. In addition to cost savings, the time savings are also greatlyappreciated by the millennial generation, who do not seem to be as concerned with the face-to-faceexperience. The restaurant industry, including so-called “fast casual” chains such as Chili’s in additionto the fast food segment, is also wholeheartedly embracing this trendHilton recently announced a focus on building up weekend occupancy, actively going after leisuretravelers by selling rooms at attractive rates. This is something that Pyramid has been doing for yearswith its “Win the Weekends” marketing effort, which also includes creative packaging andprogramming to drive demandNew brands continue to proliferate, mostly in the mid to upscale “lifestyle” segment. In addition to anumber of boutique urban-oriented brands by smaller or newer players such as Hampshire (“Chatwal,”“Dream” and “Night”), “B” hotel and Thompson Hotels, the established brands are also embracing theconcept. Marriott recently unveiled “Moxy,” IHG launched “Even,” Best Western introduced“Vib,” Red Lion’s “RL” was debuted during last month’s Lodging Conference and Hilton began rollingout its new “Canopy” brand.Rising occupancy rates are starting to put pressure on corporate negotiated rates, which have beenlagging behind the curve. NYU projects a 5.5% to 6.0% increase in 2015, which is good news for upperupscale and upscale select service properties, especially those in suburban locations, that depend onthese customersNew minimum wage initiatives were approved in several states during the last election, includingAlaska, Arkansas, Illinois, Nebraska and South Dakota, as well as locally in parts of Wisconsin andCalifornia. As has previously been noted, this is much more of an issue in the food service industry thanin hospitality, especially for tipped employees. The prevailing sentiment is that most people feel thatgoing from the current Federal standard of $7.25 up to the $10 range over a period of a few years is notunreasonable, but when the rates start getting up to $12 to $15 or more, there is a big pushback becausethere is not enough productivity to justify those levels, resulting in higher prices and/or lower margins.A clear example is McDonalds, which has to contend with high beef prices as well as rising labor andbenefit costs- their same store US sales declined by 3.3% this year, as customers voted with their feetagainst rising menu prices for what many perceive as an inferior product compared to other chains.

COLLIERS INTERNATIONAL HOTELSOur Extensive Advisory Services Inc lude:• Investment Sales and Acquis i t ion• Capi ta l Markets• Resort and Gaming• Strategic Advisory
HOTELS | US LEADERSHIP
MIKE MIXER Executive Managing Director, Hotels | USAExecutive Managing Director | Las VegasDirect: +1 702 836 3777Mobile: +1 702 845 [email protected]
DHARMESH PATEL Executive Managing Director, Hotels | USADirect: +1 408 282 3990Mobile: +1 408 497 [email protected]
KENT SCHWARZ EVP | Colliers International HotelsDirect: +1 727 298 5308Mobile: +1 917 716 [email protected]
RICH LILLIS Executive Vice President | South FloridaDirect: +1 786 735 3181Mobile: +1 561 716 [email protected]
KEITH CUBBA Vice President, National Director | Golf GroupDirect: +1 702 836 3733Mobile: +1 702 375 [email protected]
http://www.colliers.com/en-us/us/hotels


![fall banquet event menus - Bardessono Hotel & Spa · 2019-10-02 · [2019] fall banquet & event menus 6526 Yount Street | Yountville, CA 94599](https://static.fdocuments.net/doc/165x107/5f880ed8688d596ac966833e/fall-banquet-event-menus-bardessono-hotel-spa-2019-10-02-2019-fall-banquet.jpg)


