
Hotel Distribution Costs - Hospitality Net · Final Report 2 May 2018 Examination of the costs...
39
Final Report 2 May 2018 Examination of the costs associated with direct and indirect distribution channels for Hotels, together with the impact of ‘channel shift’ All data in this study has been sourced from publically available sources or from ETTSA member companies on a confidential basis. The confidential data has been anonymized and aggregated to ensure the source data cannot be identified and the data cannot be ‘reverse’ engineered. Sponsored by the European Travel Technology Services Association (ETTSA) Privileged Document. This document is subject to sensitive data protocols Hotel Distribution Costs
Transcript of Hotel Distribution Costs - Hospitality Net · Final Report 2 May 2018 Examination of the costs...

Final Report
2 May 2018
Examination of the costs associated with direct and indirect distribution channels for Hotels, together with the impact of ‘channel shift’
All data in this study has been sourced from publically available sources or from ETTSA member companies on a confidential basis. The confidential data has been anonymized and aggregated to ensure the source data cannot be identified and the data cannot be ‘reverse’ engineered.
Sponsored by the European Travel Technology Services Association (ETTSA)
Privileged Document. This document is subject to sensitive data protocols
Hotel Distribution Costs

Distr
ibutio
n Co
st St
udy -
Hote
ls ©
Infra
ta20
18
This report has been prepared in accordance with the scope of Infrata Limited’s appointment with its client and is subject to the terms of that appointment. Infrata accepts no liability for any use of this document other than by its client and only for the purposes for which it was prepared and provided.
The conclusions and recommendations contained in this Report are based upon information sourced in the public domain and provided by others and upon the assumption that all relevant information has been provided by those parties from whom it has been requested and that such information is accurate. Information obtained by Infrata has not been independently verified by Infrata, unless otherwise stated in the Report.
Certain statements made in the Report that are not historical facts may constitute estimates, projections or other forward-looking statements and even though they are based on reasonable assumptions as of the date of the Report, such forward-looking statements by their nature involve risks and uncertainties that could cause actual results to differ materially from the results predicted. Infrata specifically does not guarantee or warrant any estimate or projections contained in this Report.
Infrata disclaims any undertaking or obligation to advise any person of any change in any matter affecting the Report, which may come or be brought to Infrata’s attention after the date of the Report.
Disclaimer

Distr
ibutio
n Co
st St
udy -
Hote
ls ©
Infra
ta20
18
Hotel Distribution:
Executive Summary
Page 3

Distr
ibutio
n Co
st St
udy -
Hote
ls ©
Infra
ta20
18
Shifting customers to direct has no impact on net contribution to hotels
Page 4
The claim that direct distribution is ‘considerably cheaper’ than indirect distribution for a typical hotel is extensively reported. (pg8)
Our analysis shows the average net contribution* of all the direct distribution channels is €4.59 per booking greater than the average of all the indirect channels. (The overall net contribution from all channels is €80.94) (pg 9)
However, if we compare solely the net contribution of the OTA with Brand.com, then the net contribution is €78.43 with OTA channel contributing €0.12 more per booking than the Brand.com. (pg 10)
Were a hotel to shift their entire inventory (away from the OTA channels to Brand.com), there would be a statistically insignificant change in the overall net contribution**. This shift assumes a net cost*** rebalancing. This also assumes all other market dynamic factors remain the same. (pg 11)
However, a hotel is likely to face a significant drop in occupancy, which would require a material increase in spend in the areas of: customer acquisition, online marketing, technology development and customer services.
When selling indirectly, these costs are usually borne by the intermediary from commission proceeds whereas if the hotel would have to directly expend resources in these areas if there was a shift from indirect to direct channels.
Furthermore, the hotel is likely to lose the positive impact of the billboard effect (between €7 - €10 per booking). (pg 12)
Source: Infrata
* Net Contribution is the preferred Key Performance Indicator as this takes into account both channel costs and their respective channel revenues. Av. ADR of €112 normalised across all channels to allow examination of costs in isolation.** a reduction in average net contribution from €80.94 to €80.92 (or 0.03%)*** e.g. removal of commission, addition of SEO costs, etc

Distr
ibutio
n Cos
t Stud
y -Ho
tels ©
Infra
ta20
18
The hotel industry has a wide range of channels* to connect with and generate bookings from, end consumers
* Channels include Indirect: OTA (4 sub channels), TMC, Wholesaler, Direct: Brand.com (2 sub channels), CRO, local direct and Offline: MICE- this is non exhaustive** OTAs have differing final connectivity options to the Hotel via the switch, extranet or CRS- each with different cost implicationsThis graphic illustrates the main distribution channels and linkages and the authors recognize that other connections exist and vary greatly by hotel/chain.
Guest
GoogleYahoo
Inventory Management
Revenue Channel
ManagementBooking Platform
CRSSearch
Brand.com
HiltonStarwood
CROFront Office Back Office
Non-Loyal
Business
Leisure
Non Loyal
TMC
LeisureAgents
Corporate GDS
Wholesalers
Tour operators
Representation company
Loyal
Local corporate
Meta
Social
AffiliateReview
Hotel
Rich Media Content AggSwitch
Connectivity
Extranet
OTA**
ExpediaBooking
Source: Infrata
Our model assumes that an average hotel receives the majority of its bookings from 11 primary channels*. Each channel will have different combinations of ‘connections’ to deliver each hotels' final product to the guest. Guests have a wide range of choice and ultimately decide which channel they will use
‘Offline’
Hotel distribution is fragmented, with multiple connectivity options and varied competing commercial models. Total costs per booking range from between 10% and 30% of room revenue.
Page 5
Major channelMinor channel
Distr
ibutio
n Co
st St
udy -
Hote
ls ©
Infra
ta20
18
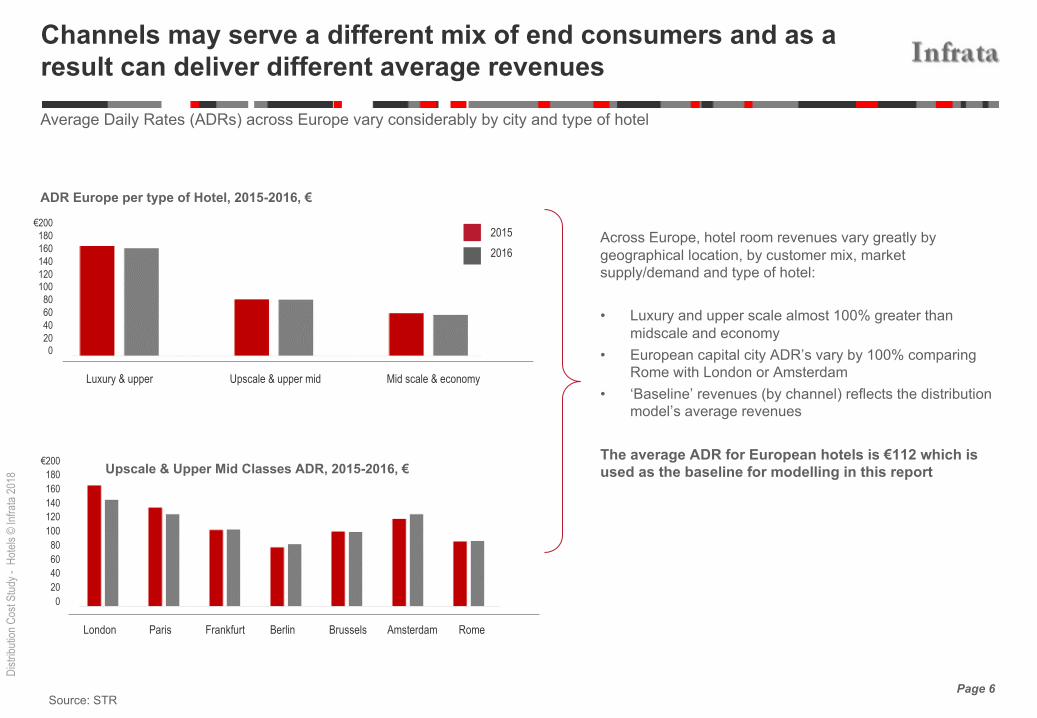
Channels may serve a different mix of end consumers and as a result can deliver different average revenues
Across Europe, hotel room revenues vary greatly by geographical location, by customer mix, market supply/demand and type of hotel:
• Luxury and upper scale almost 100% greater than midscale and economy
• European capital city ADR’s vary by 100% comparing Rome with London or Amsterdam
• ‘Baseline’ revenues (by channel) reflects the distribution model’s average revenues
The average ADR for European hotels is €112 which is used as the baseline for modelling in this report
ADR Europe per type of Hotel, 2015-2016, €
Upscale & Upper Mid Classes ADR, 2015-2016, €
Page 6Source: STR
Average Daily Rates (ADRs) across Europe vary considerably by city and type of hotel
Luxury & upper Upscale & upper mid Mid scale & economy
2015
2016
€200180160140120100806040200
€200180160140120100806040200
London Paris Frankfurt Berlin Brussels Amsterdam Rome
Distr
ibutio
n Co
st St
udy -
Hote
ls ©
Infra
ta20
18
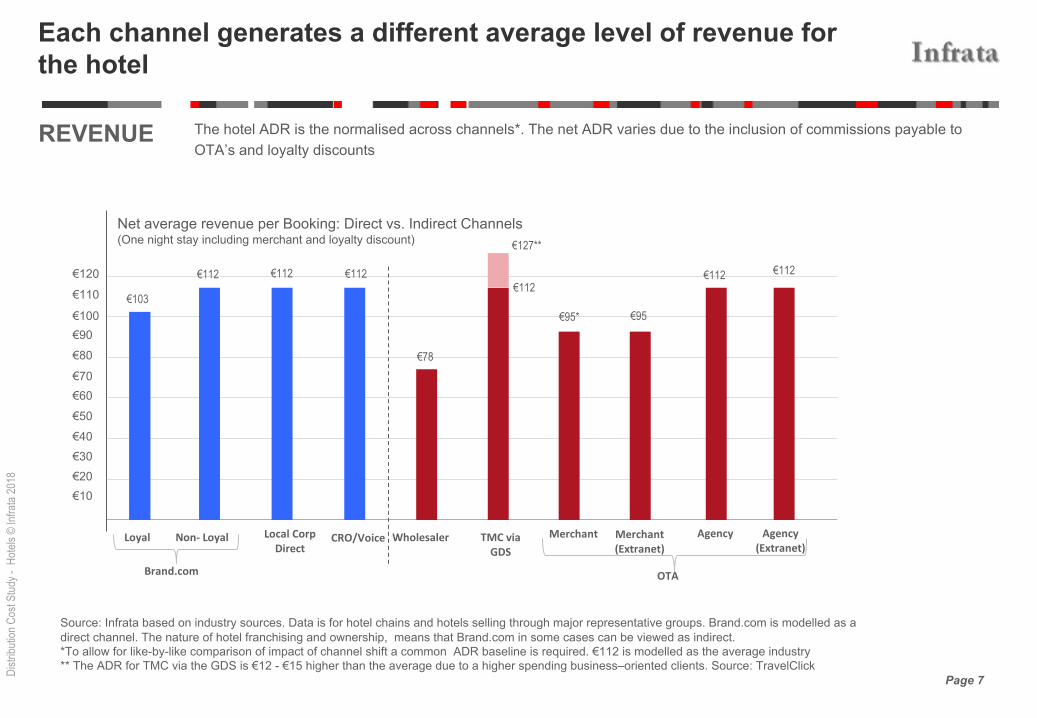
€103
€112 €112 €112
€78
€112
€95* €95
€112 €112
Each channel generates a different average level of revenue for the hotel
Page 7
Net average revenue per Booking: Direct vs. Indirect Channels (One night stay including merchant and loyalty discount)
REVENUE The hotel ADR is the normalised across channels*. The net ADR varies due to the inclusion of commissions payable to OTA’s and loyalty discounts
€10€20€30€40€50€60€70
€80€90€100
€110
€120
Source: Infrata based on industry sources. Data is for hotel chains and hotels selling through major representative groups. Brand.com is modelled as a direct channel. The nature of hotel franchising and ownership, means that Brand.com in some cases can be viewed as indirect.*To allow for like-by-like comparison of impact of channel shift a common ADR baseline is required. €112 is modelled as the average industry** The ADR for TMC via the GDS is €12 - €15 higher than the average due to a higher spending business–oriented clients. Source: TravelClick
Loyal Non- Loyal Local Corp Direct
CRO/Voice Wholesaler TMC via GDS
Merchant Merchant(Extranet)
Agency Agency(Extranet)
OTABrand.com
€127**

Distr
ibutio
n Co
st St
udy -
Hote
ls ©
Infra
ta20
18
As a result of the different connectivity options, each channel (direct or indirect) has a different level of total (average) cost
Page 8
Source: TravelClick 2016; Phocuswright 2016. Data is for hotel chains and hotels selling through major representative groups. Please see main report cost tables
€10
€20
€30
€40
€25.73
€32.10
€16.17
€24.18
€9.94
€33.86
€18.37
€12.87
€31.40
Loyal Non- Loyal Local Corp Direct
CRO/Voice Wholesaler TMC via GDS
Merchant Merchant(Extranet)
Agency Agency(Extranet)
Direct: 65% (online 41% , offline 24%)* Indirect: 35%
11% 11% 8% 11% 4% 15% 4% 4% 4% 4%
Cost of Booking: Direct vs. Indirect Channels(One night stay including merchant and loyalty discount)
Different cost level within different categories contribute to the cost per channel. These costs are either fixed or variable per booking. Agency channel costs include commissions which are treated as ADR discounts where the booking intermediaries are collecting payments
COSTS
€36.90
OTABrand.com
Cost categories
* Hotels receive guests from both online and offline bookings. Percentages shown here are for online bookings (offline not shown).** Credit card fees are either paid directly by the hotels or indirectly (for Merchant transactions), which is modelled by through lower revenues via the merchant channel*** Phocuswright OTA market share is approx. 26%, but does not take into account of 24% offline.Taking this into account OTA market share=19% (vs Travelclick 16%)
offline 24%

Distr
ibutio
n Co
st St
udy -
Hote
ls ©
Infra
ta20
18
€77.10 €79.67
€95.60€87.59
€68.30
€79.91€76.63
€82.13
€74.87€80.36
As a consequence, we have examined the net contribution per channel as the basis for comparison
Page 9
Average Net Contribution per Booking: Direct vs. Indirect Channels (One night stay including commissions and loyalty discount)
CONTRIBUTION- Base scenario
€10
€20
€30
€40
€50
€60
€70
€80
€90
Average contribution
across all channels*
€80.94
Source: Infrata based on industry sources. Data is for hotel chains and hotels selling through major representative groups.
Loyal Non- Loyal Local Corp Direct
CRO/Voice Wholesaler TMC via GDS
Merchant Merchant(Extranet)
Agency Agency(Extranet)
OTABrand.com
Net contribution takes into account channel costs and net ADR. The net average contribution of the OTA channel is marginally higher than that of Brand.com (loyalty and no loyalty guest)
Weighted Averages
DirectIndirect
Blended
€82.79
€78.20
IndirectDirect
* Direct bookings deliver an average of €4.59 per booking more than Indirect (€82.79- €78.20)

Distr
ibutio
n Co
st St
udy -
Hote
ls ©
Infra
ta20
18
€77.10 €79.67
€95.60€87.59
€68.30
€79.91€76.63
€82.13
€74.87€80.36
Looking solely at online channels – OTA delivers an additional net contribution of €0.12 per booking vs Brand.com
Page 10
Average Net Contribution per Booking: Direct vs. Indirect Channels (One night stay including commissions and loyalty discount)
CONTRIBUTION- Online channels only
€10
€20
€30
€40
€50
€60
€70
€80
€90
Average contribution across online
channels*
€78.43
Source: Infrata based on industry sources. Data is for hotel chains and hotels selling through major representative groups.
Loyal Non- Loyal Local Corp Direct
CRO/Voice Wholesaler TMC via GDS
Merchant Merchant(Extranet)
Agency Agency(Extranet)
OTABrand.com Weighted Averages
DirectIndirect
Blended
€78.38€78.50
offline 24%
Indirect: 35%
11% 11% 8% 11% 4% 15% 4% 4% 4% 4%
Direct: 41%
* OTA channels deliver an average of €0.12 per booking more than Brand.com (€78.50 - €78.38)

Distr
ibutio
n Co
st St
udy -
Hote
ls ©
Infra
ta20
18
€80.20** €79.67
Channel Shift Scenario: Shifting all OTA bookings to Brand.com -assuming all other factors remain the same
Page 11
€10
€20
€30
€40
€50
11% 11%
In this scenario where all other factors remain the same – specifically hotels do not need to do anything to secure those OTA-originating guests -the net impact of shifting all bookings from OTA to Brand.com is a reduction in net contribution of €0.02 (0.03%)
€60
€70
€80
€90
18.4%
€80.92
Revised average
contribution across all channels
€95.60€87.59
8% 11% 4.9% 4% 4% 4% 4%
€68.30
€79.91
4% 15%
€76.63
€82.13
€74.87€80.37
16.9%* 16.9%
* Shift from the OTA channels to Brand.com equally split between loyalty and non loyal sub-channels (50-50)** The loyal Brand.com channel experiences a mathematical net contribution increase of €3.1 (€80.2-€77.1) due to reallocation of net costs.*** Statistically insignificant difference (€0.02/€80.92 =0.0247%)
Loyal Non- Loyal Local Corp
DirectCRO/Voice Wholesaler TMC via
GDS
Merchant Merchant
(Extranet)
Agency Agency
(Extranet)
OTA
Brand.com
€0.02***
€80.92
€80.94
Base S. 1
Source: Infrata based on industry sources. Data is for hotel chains and hotels selling through major representative groups.

Distr
ibutio
n Co
st St
udy -
Hote
ls ©
Infra
ta20
18
Billboard Effect: Hotel presence on OTA displays significantly increases direct hotel booking numbers
Page 12Source: Infrata based on industry sources. Data is for hotel chains and hotels selling through major representative groups.
€10
€20
€30
€40
€25.7
€36.2
Loyal Non- Loyal
Cost per Booking* Cost categories
Groups of hotels which were listed and
then removed from display in alternate
weeks showed that, when listed, the
hotels received an increase of between
5% and 35% in the level of bookings on
the own hotel’s website
It is estimated that 75% consumers who
made reservations with a hotel brand
had previously visited an OTA in
advance of booking directly.
Consumers visit an OTA on average
7.2 times prior to booking directly.
Cornell university research:
*One night stay including merchant and loyalty discount
Assumptions:
1. Brand.com share of total hotel bookings is 15.3% (50-50 loyal and non-loyal)
2. Up to 35% of these bookings is due to the billboard effect.
3. Therefore total bookings due to the billboard effect is 5.35%
4. The Hotel’s current non-loyal SEM
cost component per booking is €13.4.
5. To recover the lost volume (5.35%) hotels needs to increase average spend to €39.3 per booking in non-
loyal and €36.2 in loyal.
6. We assume that loyal SEM has to
be increased to non-loyal rates to attract new customers.
7. Non-loyal are assumed to cost more
in terms of SEO because they are not already ‘captured’ by the hotel or
the OTA.
Brand.com
Hotels benefit significantly from being displayed on OTA websites. Up to 35% of hotel bookings can be attributed to guests finding out about a particular hotel, then booking directly with that hotel- known as the billboard effect. If the billboard effect did not exist, Brand.com would need to to compensate to regain the ‘lost’ guests by increasing its SEO spending by between €7 and €10 per booking.
The columns labelled ‘Billboard’ reflects the existing situation in which the hotels are benefitting from the advertising spend of the OTA leading to more bookings through native search. The cost to ‘Brand.com’ would increase if the OTA did not advertise as found by the Cornell University research.
€39.3
Billboard (existing
situation)
Billboard (existing situation)
None None
€32.1

Distr
ibutio
n Co
st St
udy -
Hote
ls ©
Infra
ta20
18
Hotel Distribution:
Market Dynamics
Page 13

Distr
ibutio
n Co
st St
udy -
Hote
ls ©
Infra
ta20
18
This study took a rigorous approach to modelling distribution and
associated costs and industry dynamics
Page 14
• A number of costs were channel
independent (e.g. internal hotel
distribution systems)
• Other major cost groups varied
considerable by channel (e.g.
commissions, SEM, GDS)
• Reviewed a wide range current
literature within the industry
• Used recognised industry bodies and
research to support numerical analysis
• Analysed the impact of trends and
forces shaping the industry
• Where appropriate used an industry
average in the analysis, and these may
vary widely when looked individually,
such as the costs associated with hotel
franchise and chain participation
agreements
To build a robust model we:
• How costs vary by channel and
technology/system
• How channel type impacts cost and
revenue
• How market dynamics and shifting
channel structures impact profitability
Consumer buying
behaviour overall: one
itinerary for travel, shop
air first, shop sites
offering full travel
components, etc..
This study did not review the full spectrum of dynamics impacting hotel channel shift. In particular:
The model allowed us to test:This study shows that:
Impact of hotels’ use of
channels to increase
hotel occupancy rates as
some channels are more
effective as marketing
tools than others
The specific practicalities
enabling a business or
leisure traveller to shift
booking channels from
indirect to direct –
impacting booking costs,
booking revenue,
mandatory support
systems and negatively
impact hotel occupancy
Long term trends in
customer segmentation
i.e. business vs. leisure
and groups vs.
independents
The impact distribution
costs and the ability to
satisfy consumer needs,
if customers (e.g. those
currently being served
through TMCs) are
‘forced’ to move to
Brand.com, how is travel
policy compliance
handled?
Source: Infrata

Distr
ibutio
n Co
st St
udy -
Hote
ls ©
Infra
ta20
18
In particular, three dynamics (Channel, Customers, Market) were considered in the distribution cost ‘equation’
Market developments are having a significant impact on costs:• Online advertising: google and other web search ads are now the main way
to drive traffic to websites. ‘Ads’ are consumer’s first touch point. The most effective ads are paid, unbranded but these are an expensive and growing costs. They are ‘owned’ mainly by the major OTA’s (Expedia, booking.com) not the hotel chains.
• Technology: intermediaries such as Expedia, edreams, Sabre, Travelport and Amadeus are investing heavily in technological development to enhance the consumer shopping experience and booking needs. Many developments concentrate on ‘mobile’ – which are expensive and long term investment programmes.
• “New startup” companies continually enter the hospitality distribution space challenging the industry norm, with new and disruptive business models, i.e.: Airbnb.com, onefinestay, TripBam.
Page 15
Differing customer types have a strong preference for particular channels. Channel shifting has specific revenue impacts:• Hotels selling direct may claw back some
discounts previously shared with merchants
• There is likely to be an ADR and occupancy impact that is not addressed in this study
To fully understand the impact, we considered the interactions between three key dynamics:
Hotels employ a variety of direct and indirect ‘Channels to market’. Cost differences exist between the various channels. Hotels seek to minimise these costs where ever possible
12 3
Channel
Customer behaviour Market dynamics
Source: Infrata

Distr
ibutio
n Co
st St
udy -
Hote
ls ©
Infra
ta20
18
Category Dynamic
1 Online Hotels aim to increase bookings via their own websites (“own-brand.com”) including ‘direct connect’
(led by major US chains)
2 Advertising Hotels needs to ‘invest’ heavily in customer acquisition via Google ads (others also exist) to ensure
traffic to own-brand.com site
3 Technology (1) Hotels aim to optimize their bookings on their most profitable channel mix - employing sophisticated
revenue and channel management tools.
Technology (2) Hotels are facing new distribution players (e.g. TripBam, Airbnb, RocketMiles, Travelperk) that employ
new technology (e.g. mobiles) and business models (e.g. Google’s Trips).
4 Consolidation Hotel chains are increasing market power through consolidation (e.g. Accor acquisition of FRHI,
Marriott, Starwood. HNA acquisition of Carlson and Hilton (25% stake)
5 Branding Hotel branding increasingly important in customer acquisition (largest chains offer 113 brands, various
product types & price points. 31 new brands evolved over last ten years).
6 Loyalty Hotel loyalty programmes are increasingly impacting marketing/product mix.
7 ‘Transience’ Hotels are facing increasing ‘channel’ fragmentation among individual customers (a.k.a. ‘transient’)
versus ‘group’ sales as individuals seek to ‘game’ the systems
Hotel distribution costs are impacted by the market dynamics of this channels shift, product mix and technology
Key market dynamics impact Hotel distribution costs. These dynamics either simplify the ‘chain’ thus reducing certain cost (e.g.
online booking) whilst other dynamics increase complexity (e.g. increased advertising costs and distribution technology).
Page 16Source: Infrata

Distr
ibutio
n Co
st St
udy -
Hote
ls ©
Infra
ta20
18
Bookings via the online channel are growing in both business and leisure segments
Online booking is growing globally at 13% per annum and online now accounts for 35% of the global market.
• Initially focussed on the price-driven leisure segment.
• Consumers search many sites before making a booking.
• Business segment is being encouraged to book direct and annual negotiation process with hotels for corporate rates is being undermined.
• Corporations are incentivizing their travellers to book lower priced travel options by sharing the savings with the traveller. (Travelperks, TripBam, HRS examples)
Overall costs of distribution have risen resulting in the trend of hotels being much more selective and competitive when placing inventory on channels. Source: Euromonitor Passport
• Global online room bookings have increased from 22% in 2010 to 35% in 2015
Penetration of global online accommodation bookings(%, 2004-2015)
Key trends
Growing share of sales through OTA and Brand.com and reducing OTA margins are reflected in the cost comparison model
Page 17

Distr
ibutio
n Co
st St
udy -
Hote
ls ©
Infra
ta20
18
The cost of attracting ‘non-loyal’ customers is extremely high in the online environment
Page 18
When examining how feasible it is to move customers from one channel to another, a detailed understanding of the dynamics is required. In particular, the associated increase spend to acquire non-branded internet hotel search has a disproportionate impact on costs.
OTA’s outspend hotel chains on non-branded hotel search by ‘orders of magnitude’ and due to their scale achieve a more efficient use of marketing investments. The more efficient and higher spending means higher visibility in the websearch which translates into bookings
Consumers often use OTAs for initial research then book directly via Brand.com. 65% of Brand.com bookings come from consumers who first researched options via an OTA. This ‘unpaid marketing’ for the hotels is described as the ‘billboard effect’ as the hotels benefit from OTA marketing spend.
Data from Skift shows the significant investment in direct online advertising of the OTA’s with Priceline and Expedia spending a combined $5.8 bn in 2016, some 37% of their revenues. This massive spending benefits all suppliers as well as these OTA
.
Source: Company Filings, Skift Estimates
2016 Year-End (U.S.$ Millions)
Total Ad Spend % of Gross Profit Digital Ad Spend Estimate % of Gross Profit Revenue
Priceline $3,775 36.6% $3,479 33.7% $10,743
Expedia $2,700 37.6% $2,295 32% $8,774
Total OTA $6,475 37% $5,774 33% $19,517
Priceline and Expedia Ad Spend 2016 $000

Distr
ibutio
n Co
st St
udy -
Hote
ls ©
Infra
ta20
18
Consolidation, Branding, Loyalty and Transience of Hotel Market Have Mixed Impact on Direct Distribution
Market Dynamic Likely Impact on Direct / Indirect
Consolidation
is accelerating in the hotel chain space for example with Accor
purchasing FRHI, Marriott Starwood, HNA acquiring Carlson and
25% stake in Hilton
Increasing Direct as fewer hotel groups
with greater market power. Challenge for
hotels to be travel sites incorporating: air,
car rental and rail for trip bundling.
Branding
is an increasingly important marketing tool and the world’s largest
hotel chains offer 113 brands combined, various product types
and price points, 31 of these did not exist ten years ago.
Impact varied: some are mass market,
some are targeted at specific niche.
Loyalty
Loyalty programme members outnumber non-members by 3 to 1
in hotel transient website sales (called Brand.com in this study).
Non-members outnumber members by 4 to 1 in on-line travel
agent (OLTA) transient sales. Hotels are pro-actively offering
loyalty members attractive rates, add-ons, and packages to book
direct on ‘own-brand.com
Loyalty customers more likely to use
Brand.com.
Transience Transience increase in share of ‘transient’ i.e. More individual
customers may lead to need for more distribution.
Increasing indirect; non-transients likely to
use numerous distribution channels. Want
aggregated content choice including: air,
car rental and rail to bundle trip.
Consolidation, branding, loyalty and transience of hotel market and customer behaviour have mixed impact on direct
distribution
Page 19Source: Infrata

Distr
ibutio
n Co
st St
udy -
Hote
ls ©
Infra
ta20
18
Customer Groups Propensity for Channel Switching: Business –Low Switchers, Leisure (independent) High, Leisure (group) Low
Overall distribution costs impact business model across a number of factors:
• Cost per channel varies by customer group
• Revenue per customer varies by type
• Different groups have varying potential for channel shift
Customer group
Description Channels used Factors affecting model
Corporate Require tracking systems,consistency and security of data, lost productivity, tax information, and duty of care
Importantsegmentation: preferred partners/volume deals, ‘ad hoc’ travel
Strong resistance to channel shifting due to reporting requirements, some potential for direct connect between largest B2B
Leisure (independent)
Lack of conformity and predictability, extremely price sensitive, high levels of websearch and responsiveness to ads
OTA, meta, travel agent, hotel websites
Potential for channel shift but substantial marketing cost required (witness Travelodge UK campaigns).
Leisure (Group)
Predictable and ‘controllable’ group, served by tour operators, price sensitive
Mostly sold and negotiated direct with hotel
Limited need for channel shift to save distribution cost.
Channel Analysis Overview
Page 20Source: Infrata

Distr
ibutio
n Co
st St
udy -
Hote
ls ©
Infra
ta20
18
Revenues: ADR’s in Europe vary considerably by city and type of hotel: average used for cost model
Hotel room revenues vary greatly by geographical location, by customer mix, market supply/demand and type of hotel. The chart shows the channel variance in ADR.
• European hotel ADR shows significant variance between hotel types
• Luxury and Upper scale almost 100% greater than Midscale and Economy
• European Capital City ADR’s vary by 100% comparing Rome with London or Amsterdam
• ‘Baseline’ revenues by channel in distribution model reflect overall market experience
• Some fixed costs but majority are % of revenue
• The average ADR used in the model is €112
Key Trends
Page 21Source: STR Media Request November 2016.
ADR Europe per type of Hotel, 2015-2016, €
Upscale & Upper Mid Classes ADR, 2015-2016, €
Luxury & upper Upscale & upper mid Mid scale & economy
2015
2016
€200180160140120100806040200
€200180160140120100806040200
London Paris Frankfurt Berlin Brussels Amsterdam Rome

Distr
ibutio
n Co
st St
udy -
Hote
ls ©
Infra
ta20
18
Hotel Distribution:
Hotel Channels and Cost Model
Page 22

Distr
ibutio
n Co
st St
udy -
Hote
ls ©
Infra
ta20
18
Hotel model developed to measure impact of direct / indirect channel shifting
• Costs allocated by channel• Base channel and average costs derived• Channel and average costs derived according to distribution channel mix scenario
• Dynamic model for Royalty and non-Royalty
Page 23
Costs and Revenues
Channel Mix
Modelling
The hotel distribution model was developed in three stages:
Development of cost base: research within the industry to understand costs for all the main categories:• Average costs derived for royalty / non-royalty
• Ranges of costs developed for each distribution channel• Key costs ascertained to be SEM, commissions, merchant discounts, credit cards• ADR and likely discounts established by distribution channel• Costs defined in main categories of (1) Systems and connectivity, (2) Commissions
and fees, (3) Back office and support
• Revenue per channel normalised to an ADR of €112
1
2
3
• Establishment of ‘average’ industry mix of bookings by distribution channel• Allocation of mix to direct / indirect categories• Most likely channel shift scenarios established
Source: Infrata

Distr
ibutio
n Co
st St
udy -
Hote
ls ©
Infra
ta20
18
Hotel costs: distribution systems are a major category –varying propensity to be reduced /removed with more direct distribution
System Function Cost Sensitivity to Direct or Indirect
PMS Property Management System –software application automates the operational functions of a hotel: Front Office, Inventory Management, Reservations and Rooms Management, Housekeeping, Accounting, etc..
Varies - €$1.8 per booking No impact
IBE Internet Booking Engine – a software system that transacts a hotel booking from its website.
Varies - €1.5-4.1per booking
Varies by channel mix
CRS Central Reservations System –software database application that distributes information about a hotels inventory, (rates, availability, descriptive content) it transacts reservations and interfaces with customer booking channels. It may or may not direct connect to a PMS.Some voice charges may also be applicable.
€2.5 per booking –not applicable to all channels
Varies by channel mix
Sales &MarketingFees
Reflect cost of brand and individual hotel marketing 4% overall, higher in direct channels
Not directly related to distribution channel
CRO / Voice
Staff, software and buildings cost of a call centre €7.6 per booking in this channel
Varies by channel mix
Labour Some management cost in wholesaler allocation and merchant extranet
€1.12 per booking in this channel
Varies by channel mix
SEO / SEM Acquisition
Drive traffic to websites to Brand.com 3.5% (loyalty), 12% (non-loyalty)
Will increase proportionately with move to Direct Online
Page 24Source: Infrata based on industry sources

Distr
ibutio
n Co
st St
udy -
Hote
ls ©
Infra
ta20
18
Hotel costs: Commissions and fees are an important cost driver for the indirect versus direct distribution assessment
Activity Function Cost Sensitivity to Direct/Indirect
TA Commissions Paid on most TA, OTA, TMC bookings
0-10% Eliminated by Direct bookings
OTA Commissions Paid on OTA bookings 15% Eliminated by Direct bookings
GDS Booking Fee Paid on most TMC bookings
€6.65 Eliminated by Direct bookings
Franchise & Royalty Fees Payment for use of chain brand and infrastructure
5% Not directly related to distribution channel but may reduce at group level with Direct
Loyalty Fees Operation of chain brand loyalty programme
4.7% Not directly related to distribution channel but may reduce slightly with indirect
Credit Card Fees Processing fees 1.5-2.5% Likely to move with channel so not sensitive
Page 25Source: Infrata based on industry sources

Distr
ibutio
n Co
st St
udy -
Hote
ls ©
Infra
ta20
18
Hotel costs: Back office and support systems not sensitive to channel shifting and excluded from model
Activity Function Cost Sensitivity to Direct/Indirect
CMS Channel Management System – is a software application for hotel rate distribution and management tool distributing rates, inventory, rate rules to OTA’s GDS’ and booking engines. It interfaces with a PMS
€1.8 per booking No impact
RMS Revenue Management System – softwareapplication of disciplined analytics that predicts consumer purchasing behaviour so as to optimise room availability with best rates to achieve highest revenue growth.
€1.35 per booking No impact
Content Management A content management system – is a software application for hotels that manages and distributes all of its descriptive text, pages, images, pictures, videos to websites, GDS, OTA and other booking systems
€1.8 per booking No impact
Switch The switch is a central communications hub that connects hotel CRS’ to other computer systems, i.e.: GDS, OTA. It facilities transactions between systems: booking, modification and cancellations
€1.7 per bookingHigh impact but difficult to isolate
Extranet A low cost, web enable controlled access interface to an OTA and other sales distribution sites for hotels to supply rates, availability, text and images, etc.
Eliminates CRS and other connectivity charges
Page 26Source: Infrata based on industry sources

Distr
ibutio
n Co
st St
udy -
Hote
ls ©
Infra
ta20
18
Page 27
Hotel Distribution Mix - Bookings % by Channel
Hotel Cost and Revenue Model Base Case Distribution Channel Mix
Source: Travelclick, Industry research, Infrata
• The channel mix data has been sourced from TravelClick Demand 360 Europe.
• Sub-categorisation has been developed after researching other industry information and industry discussions.
• Largest part is direct to hotel – MICE, walk-in, IT and other groups. This part is excluded from the model.
• Brand.com of 22% has been divided equally between Loyalty / Non-loyalty
• Other Direct channels are Local Corporate, CRO/Voice and Wholesale – these are regarded as less effective channels and may be moved to Brand.com
• Indirect channels used are OTA and TMC via a GDS
• OTA total of 16% has been split into four main sub-channels.
• Travelclick global data shows an OTA market share of 14.8% of all bookings, based on revenue. Phocuswright indicates OTA market share is 23.8%, but does not take into account the 24% offline contribution. The impact on the cost modelling in the following pages is marginal.
Direct to property (excl. local corp direct and wholesaler)
Brand.com Loyalty member
Brand.com Non-Loyalty member
Local Corp Direct
CRO/Voice non-loyalty booking
Wholesaler Allocation
8%11%
11%
25%
10%
4%
Corporate TMC via GDS Booking
15%
OTA – Merchant booking
4%4%
4% 4%
OTA – Retail extranet
OTA – Retail booking
OTA – Merchant extranet
This analysis uses the Travelclick ‘low’ estimate of OTA bookings revenue share of 14.8%. Phocuswright data for Europe gives a ‘high’ estimate of OTA share of 23.8%.

Distr
ibutio
n Co
st St
udy -
Hote
ls ©
Infra
ta20
18
The Cost Model Platform and Mechanics
Page 28
The Model PlatformThe cost model has been developed to reflect a ‘real world’ mix of distribution channels used by a chain franchise hotel and
independents that are part of a major representation group.
Costs per booking have been sourced from a number of sources for all the quantifiable parts of the distribution chain for every channel.
The model allows the shifting of bookings between channels and the calculation of the cost impact including discounts.
Model Mechanics
The model allows the assessment of channel shifting from a ‘base’ mix of channels. The shift is from indirect or less efficient direct
channels to hotels’ websites ‘Brand.com’:
• Base: 66% direct, 34% indirect
• Scenario 1: moves all OTA bookings (16%) to Brand.com
• Scenario 2: all wholesaler allocation (4%) to Brand.com
• Scenario 3: all corporate TMC (15%) to Brand.com
• Scenario 4: excludes all offline channels excluding walk-in
The channel shifts have been used to produce the results for one and two nights.
Source: Infrata

Distr
ibutio
n Co
st St
udy -
Hote
ls ©
Infra
ta20
18
Page 29
Hotel Cost Model Results: Average Net Revenue per Scenario, One and Two Nights, Shows Limited Impact of Shift to Direct
Major cost impacts:
Data based upon gross ADR minus distribution costs and discounts for chain and hotels selling though a representative group with Royalty. Based on 2016 data.
Scenario 1: moves all OTA bookings (18%) to Brand.com- increase in SEM cost, reduced commissions and discounts
Scenario 2: all wholesaler allocation (5%) to Brand.com -increased SEM, reduced discounts
Scenario 3: all corporate TMC (12%) to Brand.com – increased SEM, reduced commissions and GDS costs
CRO/Voice shift: a move within direct distribution cost - all CRO/Voice (7%) to Brand.com – reduced call centre cost, increased SEM
The scenario that appears to be of most interest to hotels – moving OTA bookings to Brand.com produces lower average net revenue over one night and slightly higher over two nights.
These cost scenarios do not reflect potential impact on occupancy due to loss of key customer services and market reach.
This analysis (and subsequent ones) has used the ‘low’ OTA share estimate of 14.8%. The impact of using the ‘high’ estimate of 23.8% is to reduce net revenue by 0.3% for one night with similarly limited impact on channel shift.
Source: Infrata

Distr
ibutio
n Cos
t Stud
y -Ho
tels ©
Infra
ta20
18
Channel Mix Scenarios - % Mix Bookings by Channel
Page 30
* Totals include Direct to property includes MICE, walk-in and groups booking direct excluding Local Corporate (26%)Source: TravelClick channel mix 2016, Industry research, Infrata, based on 2016 data
Source: Infrata
Direct channels Indirect Channels
Brand.com Global OTA
% of bookings Loyalty Member Non-loyalty Local
Corporate Direct
CRO/Voice non-loyalty
Corporate TMC via
GDS
Wholesaler Allocation Merchant Merchant
(Extranet) Agency Agency (Extranet) Total*
Base 10.9 10.9 8.0 10.7 15.1 4.0 3.7 3.7 3.7 3.7 100
Scenario 1 18.3 18.3 8.0 10.7 15.1 4.0 0 0 0 0 100
Scenario 2 12.9 12.9 8.0 10.7 15.1 0 3.7 3.7 3.7 3.7 100
Scenario 3 18.5 18.5 8.0 10.7 0 4.0 3.7 3.7 3.7 3.7 100
Scenario 4 20.8 20,8 0 0 0 0 9.0 9.0 9.0 9.0 100
In each case, the indirect bookings were moved into Direct (brand.com split 50-50 between loyal and non loyal, except scenario 4 where al bookings moved to non-loyal)

Distr
ibutio
n Cos
t Stud
y -Ho
tels ©
Infra
ta20
18
Cost Model Results – One Night Stay
Page 31Source: industry research, Infrata. Based on 2016 data.
Brand.com Global OTA
Channel: Loyalty Member Non-loyalty Local Corporate Direct
CRO/Voice non-loyalty
Corporate TMC via GDS
Wholesaler Allocation Merchant Merchant
(Extranet) Agency Agency (Extranet)
ADR Euro € 112 € 112 € 112 € 112 € 112 € 112 € 112 € 112 € 112 € 112Merchant Discount € 33.53 € 16.77 € 16.77 Loyalty Discount € 8.94
Effective ADR EURO € 102.83 € 111.77 € 111.77 € 111.77 € 111.77 € 78.24 € 95.00 € 95.00 € 111.77 € 111.77
Distribution System FeesPMS € 1.78 € 1.78 € 1.78 € 1.78 € 1.78 € 1.78 € 1.78 € 1.78 € 1.78 € 1.78 CRS € 2.51 € 2.51 € 2.51 € 2.51 € 2.51 € 2.51
Connectivity € 1.54 € 1.54 € 1.54 € - € 4.10 € 4.10 Commissions € 11.18 € 16.77 € 16.77
GDS € 6.65 CRO/Voice € 7.59
Labour € 1.12 € 1.12 € 1.12 Other Fees
Franchise € 5.14 € 5.59 € 5.59 € 5.59 € 5.59 € 3.91 € 4.75 € 4.75 € 5.59 € 5.59 Sales & Marketing € 4.11 € 4.47 € 4.47 € 4.47 € 4.47 € 3.13 € 3.80 € 3.80 € 4.47 € 4.47
Loyalty € 4.83 Credit Card € 2.57 € 2.79 € 2.79 € 2.24 € 1.68 € 1.43 € 1.43 € 1.68 € 1.68
SEM/SEO € 3.24 € 13.41
Total Cost € 25.73 € 32.10 € 16.17 € 24.18 € 33.86 € 9.94 € 18.37 € 12.87 € 36.90 € 31.40
Net Revenue 1 Night € 77.10 € 79.67 € 95.60 € 87.59 € 77.91 € 68.30 € 76.63 € 82.13 € 74.87 € 80.37
Average ADR is €112 (rounded up from €117.77)

Distr
ibutio
n Cos
t Stud
y -Ho
tels ©
Infra
ta20
18
Cost Model Results – Second, and each additional stay Nights
Page 32Source: industry research, Infrata. Based on 2016 data.
Brand.com Global OTA
Channel: Loyalty Member Non-loyalty Local Corporate Direct
CRO/Voicenon-loyalty
Corporate TMC via GDS
Wholesaler Allocation Merchant Merchant
(Extranet) Agency Agency (Extranet)
ADR Euro € 112 € 112 € 112 € 112 € 112 € 112 € 112 € 112 € 112 € 112 Merchant Discount € 33.53 € 16.77 € 16.77 Loyalty Discount € 8.94 Effective ADR EURO € 102.83 € 112 € 112 € 112 € 112 € 78.24 € 95.01 € 95.01 € 112 € 112
Distribution System FeesPMSCRS
ConnectivityCommissions € 11.18 € 16.77 € 16.77
GDSCRO/Voice
Other FeesFranchise & Royalty € 5.14 € 5.59 € 5.59 € 5.59 € 5.59 € 3.91 € 4.75 € 4.75 € 5.59 € 5.59
Sales & Marketing € 4.11 € 4.47 € 4.47 € 4.47 € 4.47 € 3.13 € 3.80 € 3.80 € 4.47 € 4.47 Loyalty € 4.83
Credit Card € 2.57 € 2.79 € 2.79 € 2.24 € 1.68 € 1.43 € 1.43 € 1.68 € 1.68 SEM/SEO
Total Cost € 16.66 € 12.85 € 12.85 € 12.29 € 22.91 € 7.04 € 9.98 € 9.98 € 28.50 € 28.50
Additional Nights € 86.17 € 98.92 € 98.92 € 99.48 € 88.86 € 71.20 € 85.03 € 85.03 € 83.27 € 83.27

Distr
ibutio
n Co
st St
udy -
Hote
ls ©
Infra
ta20
18
Definitions: 'Channels to market' (in order or listing in Infrata model)
Channel Connectivity Definition
1 Loyal brand.com Booked on hotel's websiteReference to a hotel guests status, as being part of the frequent guest affiliate/loyalty programme, often providing access to discount rates, addition of ancillary products and services during a stay at the hotel
2 Non-loyal brand.com Booked on hotel's website A term referring to hotel guests who are not participating as members of the frequent guest/loyalty
programme
3 Local corporate direct
Booked via phone direct to the hotel,or via an extranet.
Refers to a hotels business mix, and references bookings that are made by/for guests staying at the hotel where a local company has a contracted rate at the hotel, and for bookings made direct to the hotel, and not via an intermediary.
4 CRO/Voice
Bookings made through the Central Reservations Office (CRO), or call center providing live reservation services via the telephone
This requires, offsite staff, office space, access to live inventory in booking systems and generally 24 hour coverage.
5 WholesalersBookings for contracted net rates made direct or via extranet directto hotel
3rd party organizations that sell hotel room nights. Wholesalers are companies that buy rooms in bulk, or contract an allocation of rooms to sell on a time release basis. Wholesalers then sell them to travel agents and OTAs, allowing hotels to generate more sales. Wholesalers are operating in the B2B segment, meaning they do not sell directly to the public but to other 3rd party sites and distribution channels.
6 TMC via GDS Booked via GDSTravel management company - travel agency sold focusing on corporate bookings. Rates are mainly negotiated via RFP process, and made available through the GDS along with all other transient rates/inventory.
7 Merchant Model (OTA) Booked via OTA
The commercial model of an OTA (online travel agency), that contracts a net rate from a hotel and marks it up with it's commission. The main characteristic of a Merchant Model OTA is that the guest pays the OTA at the time of booking a room (as an undisclosed agent acting in its own name, therefore becoming the “merchant”), and the OTA pays the hotel when the actual stay occurs
8 Merchant Model (extranet) (OTA) Booked via OTA
References a booking that is a merchant model, and the booking is made through an extranet (manually maintained inventory), as opposed to a distribution system (dynamically maintained inventory).
9 Agency (OTA) Booked via OTAThe commercial model of an OTA (online travel agency). The main characteristic of the Agency Model is that the guest pays the Hotel directly when the stay is consumed and the hotel pays the OTA commission after the stay has occurred.
10 Agency (extranet) (OTA) Booked via OTA
References a booking that is a Agency model, and the booking is made through an extranet (manually maintained inventory), as opposed to a distribution system (dynamically maintained inventory).
Sold
via
dire
ct s
ale
chan
nels
(e
xclu
ding
wal
k-in
and
MIC
EIn
dire
ct s
ourc
es/c
hann
els
Page 33

Distr
ibutio
n Co
st St
udy -
Hote
ls ©
Infra
ta20
18
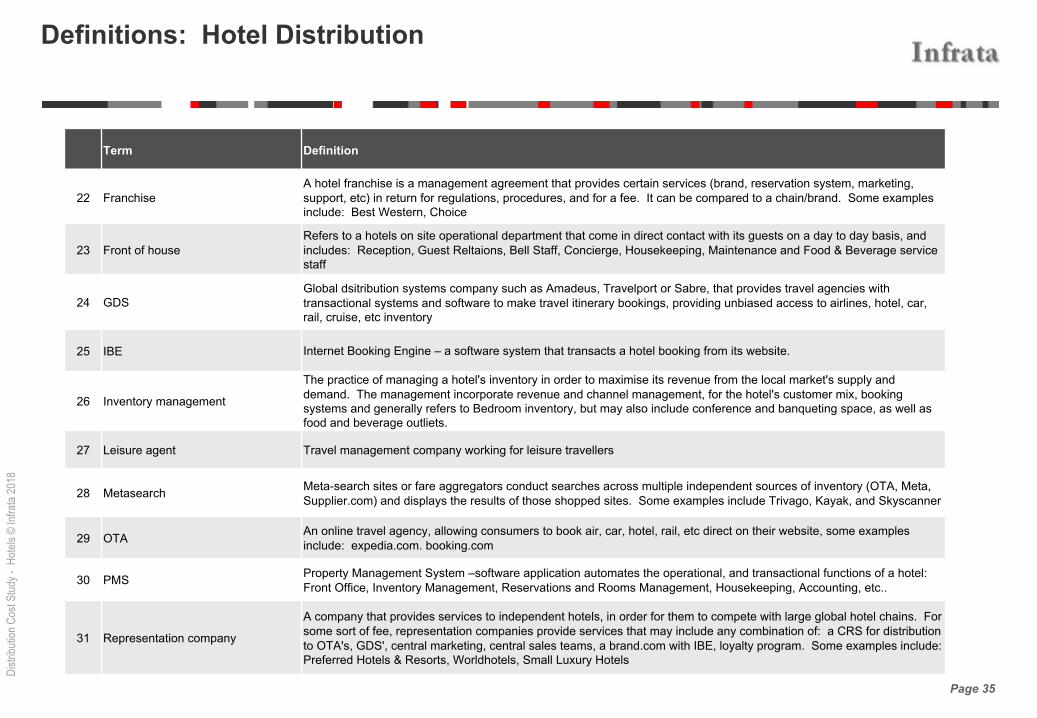
Definitions: Hotel Distribution
Page 34
Term Definition
11 Affiliate review Product review sites may be supported by providing affiliate links to the websites that sell the reviewed items, for instance in travel the main review site is TripAdvisor
12 Agency (extranet) (OTA) Travel agency sold through an online travel agent using the agent's extranet
13 Agency (OTA) Travel agency sold through an online travel agent
14 Back office Refers to a hotels on site operational staff that serve the front office teams, they do not interface directly with hotel guests, and generally these include: finance & accounting, reservations, revenue management, sales & marketing, etc.
15 Brand.com A term referencing an Hotel chain's own website. May also be referenced as supplier.com
16 CommissionsGenerally refers to a payment made to an IATA registered travel agency for booking a hotel room. It is generally 10% of the net room rate for the duration of the total stay, and applies only to bookings that are made for commissionable rates (indicated in the rate terms/conditions) to IATA registered, or locally authorised travel agencies / hotel booking agencies.
17 content aggregator A content aggregator is an individual or organization that gathers Web content (and/or sometimes applications) from different online sources for reuse or resale.
18 Content management A content management system – is a software application for hotels that manages and distributes all of its descriptive text, pages, images, pictures, videos to websites, GDS, OTA and other booking systems
19 CorporateRefers to a hotels business mix, and references bookings that are made by/for guests staying at the hotel whilst on business, who are part of a corporation. Other segments in the business mix might include: leisure, government, meetings & conferences, groups, etc.
20 CRSCentral Reservations System, is a software database application that distributes information about a hotels inventory, (rates, availability, descriptive content) it transacts reservations and interfaces with customer booking channels. It may or may not direct connect to a PMS.
21 Extranet A low cost, web enable controlled access interface to an OTA and other sales distribution sites for hotels to supply rates, availability, text and images, etc. Manually maintained by the hotel's reservations staff.
Distr
ibutio
n Co
st St
udy -
Hote
ls ©
Infra
ta20
18
Definitions: Hotel Distribution
Page 35
Term Definition
22 FranchiseA hotel franchise is a management agreement that provides certain services (brand, reservation system, marketing, support, etc) in return for regulations, procedures, and for a fee. It can be compared to a chain/brand. Some examples include: Best Western, Choice
23 Front of houseRefers to a hotels on site operational department that come in direct contact with its guests on a day to day basis, and includes: Reception, Guest Reltaions, Bell Staff, Concierge, Housekeeping, Maintenance and Food & Beverage service staff
24 GDSGlobal dsitribution systems company such as Amadeus, Travelport or Sabre, that provides travel agencies with transactional systems and software to make travel itinerary bookings, providing unbiased access to airlines, hotel, car, rail, cruise, etc inventory
25 IBE Internet Booking Engine – a software system that transacts a hotel booking from its website.
26 Inventory management
The practice of managing a hotel's inventory in order to maximise its revenue from the local market's supply and demand. The management incorporate revenue and channel management, for the hotel's customer mix, booking systems and generally refers to Bedroom inventory, but may also include conference and banqueting space, as well as food and beverage outliets.
27 Leisure agent Travel management company working for leisure travellers
28 Metasearch Meta-search sites or fare aggregators conduct searches across multiple independent sources of inventory (OTA, Meta, Supplier.com) and displays the results of those shopped sites. Some examples include Trivago, Kayak, and Skyscanner
29 OTAAn online travel agency, allowing consumers to book air, car, hotel, rail, etc direct on their website, some examples include: expedia.com. booking.com
30 PMS Property Management System –software application automates the operational, and transactional functions of a hotel: Front Office, Inventory Management, Reservations and Rooms Management, Housekeeping, Accounting, etc..
31 Representation company
A company that provides services to independent hotels, in order for them to compete with large global hotel chains. For some sort of fee, representation companies provide services that may include any combination of: a CRS for distribution to OTA's, GDS', central marketing, central sales teams, a brand.com with IBE, loyalty program. Some examples include: Preferred Hotels & Resorts, Worldhotels, Small Luxury Hotels

Distr
ibutio
n Co
st St
udy -
Hote
ls ©
Infra
ta20
18
Definitions: Hotel Distribution
Page 36
Term Definition
32 Revenue channel managementRevenue and channel management is the day to day practice at a hotel of adjusting its inventory (rooms, rates and
availability) in order to maximise revenue making and adjusint according to market supply and demand conditions
33 Rich media Digital advertising term for ditigal content that includes advanced features like video, audio or other elements that
encourage viewers to interact and engage with the content.
34 Rich media content aggregator Platform for aggregating rich media.
35 SEM Search engine marketing - use of 'paid ads' to enhance screen position and therefore clicks on a website
36 SEO Search engine optimisation - use of complex algorithms to optimise positioning ranks in search return.
37 Social Social media - distribution through facebook and other similar sites
38 SwitchA central communications hub that connects hotel CRS’ to other computer systems, i.e.: GDS, OTA. It facilities
transactions between systems: booking, modification and cancellations
39 TMC Travel management company - travel service provider usually working for business clients
40 Tour operatorA tour operator typically combines tour and travel components to create a leisure package holiday. They advertise and
produce brochures to promote their products, holidays and itineraries.

Distr
ibutio
n Co
st St
udy -
Hote
ls ©
Infra
ta20
18
References
Page 37
The following documents and sources have been used in this study:Journal Title Author / Year
The Billboard Effect: Still Alive and Well Anderson / Han, 2017, Cornell University
European Hotel Distribution StudyResults for the Reference Year 2015
Prof. Roland ScheggInstitute of Tourism, HES-SO Valais, 2016
The Economic Impact of OTAs in the EU: Summary Report Impacts on trips, night, spend and employment
Oxford Economics, 2016
2017 Outlook On Hotel Direct Booking by Jared Wein, Luke Bujarski, Dave Montali + Skift Team, 2016
Tnooz Various studies
Skift Various studies
Travel and Technology: Digital Trends for The Travel Industry and Beyond 2015 John Lynch, Kate Fitzpatrick 2015
TravelClick Q4 2016 Webinar Presentation TravelClick 2016
The Distribution Cost Conundrum: Are OTAs actually good value for the money? Professor Peter O’Connor Chair Digital Disruption, Essec Duetto Revenue Strategy ForumLondon 2017
Travel Distribution: The End Of The World As We Know It? London School of Economics 2016
Fraud and the U.S. Travel Agency Marketplace Phocuswright 2016
Channel Surfing Phocuswright 2016
The New Online Consumer Euromonitor 2016
Making Tough Business indispensable Research for Measuring Travel Agency Success
ASTA, 2015
The Cost of Choice: Why Hotel Distribution Costs Matter To Corporates HRS 2016
The Pillars Of Perfect Programmes: How You Can Achieve Optimum Compliance To Your Policy
HRS 2016
Source: Infrata

Distr
ibutio
n Co
st St
udy -
Hote
ls ©
Infra
ta20
18
References (2)
Page 38
Journal Title Author / Year
Euromonitor Hotels Online and Offline for Europe and World Euromonitor, 2016
Expedia Investor Presentation Expedia, 2016
Travelclick 4th
Global Hotel Industry Update Travelclick, 2016
STR Global Hotel Review STR, 2016
Hotel Yearbook HTFP, 2015
Accor Hotels Annual Report Accor, 2016
Morgan Stanley Global Insight – Lodging and Internet Morgan Stanley, 2016
Hotel Distribution Report Hotel Analyst, 2016
Top Travel Keywords in Paid Search Adgooroo, 2015
Source: Infrata

Ian LowdenInfrata
5 Chancery Lane,London, WC2A 1LG
+44 (0)20 3440 5916
Carlos de PommesCambiio
Old RectoryWeybridge, KT13 8DE
+44 (0)7747780301


