Host Responses to Melioidosis and Tuberculosis Are Both ... fileHost Responses to Melioidosis and...
13
Host Responses to Melioidosis and Tuberculosis Are Both Dominated by Interferon-Mediated Signaling Gavin C. K. W. Koh 1,2,3,4 *, M. Fernanda Schreiber 1 , Ruben Bautista 1 , Rapeephan R. Maude 3 , Susanna Dunachie 3 , Direk Limmathurotsakul 3 , Nicholas P. J. Day 3 , Gordon Dougan 1 , Sharon J. Peacock 1,2,3,5 1 Wellcome Trust Sanger Institute, Hinxton, Cambridge, United Kingdom, 2 Department of Medicine, University of Cambridge, Cambridge, United Kingdom, 3 Mahidol- Oxford Tropical Medicine Research Unit, Mahidol University, Bangkok, Thailand, 4 Department of Infection and Tropical Diseases, Birmingham Heartlands Hospital, Birmingham, United Kingdom, 5 Department of Microbiology, Mahidol University, Bangkok, Thailand Abstract Melioidosis (Burkholderia pseudomallei infection) is a common cause of community-acquired sepsis in Northeast Thailand and northern Australia. B. pseudomallei is a soil saprophyte endemic to Southeast Asia and northern Australia. The clinical presentation of melioidosis may mimic tuberculosis (both cause chronic suppurative lesions unresponsive to conventional antibiotics and both commonly affect the lungs). The two diseases have overlapping risk profiles (e.g., diabetes, corticosteroid use), and both B. pseudomallei and Mycobacterium tuberculosis are intracellular pathogens. There are however important differences: the majority of melioidosis cases are acute, not chronic, and present with severe sepsis and a mortality rate that approaches 50% despite appropriate antimicrobial therapy. By contrast, tuberculosis is characteristically a chronic illness with mortality ,2% with appropriate antimicrobial chemotherapy. We examined the gene expression profiles of total peripheral leukocytes in two cohorts of patients, one with acute melioidosis (30 patients and 30 controls) and another with tuberculosis (20 patients and 24 controls). Interferon-mediated responses dominate the host response to both infections, and both type 1 and type 2 interferon responses are important. An 86-gene signature previously thought to be specific for tuberculosis is also found in melioidosis. We conclude that the host responses to melioidosis and to tuberculosis are similar: both are dominated by interferon-signalling pathways and this similarity means gene expression signatures from whole blood do not distinguish between these two diseases. Citation: Koh GCKW, Schreiber MF, Bautista R, Maude RR, Dunachie S, et al. (2013) Host Responses to Melioidosis and Tuberculosis Are Both Dominated by Interferon-Mediated Signaling. PLoS ONE 8(1): e54961. doi:10.1371/journal.pone.0054961 Editor: Olivier Neyrolles, Institut de Pharmacologie et de Biologie Structurale, France Received September 12, 2012; Accepted December 18, 2012; Published January 29, 2013 Copyright: ß 2013 Koh et al. This is an open-access article distributed under the terms of the Creative Commons Attribution License, which permits unrestricted use, distribution, and reproduction in any medium, provided the original author and source are credited. Funding: This study was funded by the Wellcome Trust of Great Britain (grants 086532/Z/08/Z and 089275/Z/09/Z, www.wellcome.ac.uk). SJP is supported by the NIHR Cambridge Biomedical Research Centre (www.cambridge-brc.org.uk). The funders had no role in study design, data collection and analysis, decision to publish, or preparation of the manuscript. Competing Interests: The authors have declared that no competing interests exist. * E-mail: [email protected] Introduction Melioidosis is a serious infectious disease caused by the environmental Gram-negative bacillus Burkholderia pseudomallei. The organism is distributed in soil across much of southeast Asia and northern Australia [1], and infection results from bacterial inoculation, ingestion or inhalation of the organism. The majority of cases are reported during the rainy season in northeast Thailand and northern Australia, and the most common presenting features are community-acquired pneumonia and/or bacteraemia [1]. The spectrum of clinical manifestations is very diverse, and melioidosis may present as acute, chronic and latent disease. Patients with chronic melioidosis may present with signs, symptoms and chest radiograph changes that are indistinguishable from tuberculosis [1]. Comparisons have also been drawn between melioidosis and tuberculosis based on apparent parallels in epidemiology, patho- physiology and therapy. Melioidosis and tuberculosis have risk factors in common, in that corticosteroid use and diabetes predispose to both diseases [1]. At clinical presentation, chronic melioidosis, like tuberculosis, causes chronic suppurative lesions that do not respond to commonly used first line antimicrobials (viz., aminopenicillins, first and second generation cephalosporins, macrolides or aminoglycosides). Histological examination of tissue taken from patients with melioidosis may reveal granulomas with central necrosis, which mimic those of tuberculosis [2]. At a cellular level, both B. pseudomallei and Mycobacterium tuberculosis are intracellular pathogens and this ability to parasitise cells appears crucial to their virulence [3,4]. Melioidosis, like tuberculosis, is also able to cause latent infection, the longest documented interval between exposure and clinical melioidosis being 62 years [1]. While chronic melioidosis is clinically similar to active tuberculosis, and latent of forms of both melioidosis and tuberculosis undoubtedly occur, acute melioidosis has no clinical counterpart in tuberculosis. Only ,10% of melioidosis cases are chronic (symptoms .2 months) [1], and the majority of melioidosis cases present acutely, with sepsis frequently compli- cated by hypotension and organ dysfunction, which rarely occurs in tuberculosis. Acute melioidosis is therefore a clinical entity quite distinct from tuberculosis. In northeast Thailand, mortality is 40% despite appropriate treatment [5], whereas tuberculosis mortality is ,2% with appropriate treatment. HIV infection is also an PLOS ONE | www.plosone.org 1 January 2013 | Volume 8 | Issue 1 | e54961
Transcript of Host Responses to Melioidosis and Tuberculosis Are Both ... fileHost Responses to Melioidosis and...

Host Responses to Melioidosis and Tuberculosis Are BothDominated by Interferon-Mediated SignalingGavin C. K. W. Koh1,2,3,4*, M. Fernanda Schreiber1, Ruben Bautista1, Rapeephan R. Maude3,
Susanna Dunachie3, Direk Limmathurotsakul3, Nicholas P. J. Day3, Gordon Dougan1,
Sharon J. Peacock1,2,3,5
1 Wellcome Trust Sanger Institute, Hinxton, Cambridge, United Kingdom, 2 Department of Medicine, University of Cambridge, Cambridge, United Kingdom, 3 Mahidol-
Oxford Tropical Medicine Research Unit, Mahidol University, Bangkok, Thailand, 4 Department of Infection and Tropical Diseases, Birmingham Heartlands Hospital,
Birmingham, United Kingdom, 5 Department of Microbiology, Mahidol University, Bangkok, Thailand
Abstract
Melioidosis (Burkholderia pseudomallei infection) is a common cause of community-acquired sepsis in Northeast Thailandand northern Australia. B. pseudomallei is a soil saprophyte endemic to Southeast Asia and northern Australia. The clinicalpresentation of melioidosis may mimic tuberculosis (both cause chronic suppurative lesions unresponsive to conventionalantibiotics and both commonly affect the lungs). The two diseases have overlapping risk profiles (e.g., diabetes,corticosteroid use), and both B. pseudomallei and Mycobacterium tuberculosis are intracellular pathogens. There are howeverimportant differences: the majority of melioidosis cases are acute, not chronic, and present with severe sepsis and amortality rate that approaches 50% despite appropriate antimicrobial therapy. By contrast, tuberculosis is characteristically achronic illness with mortality ,2% with appropriate antimicrobial chemotherapy. We examined the gene expression profilesof total peripheral leukocytes in two cohorts of patients, one with acute melioidosis (30 patients and 30 controls) andanother with tuberculosis (20 patients and 24 controls). Interferon-mediated responses dominate the host response to bothinfections, and both type 1 and type 2 interferon responses are important. An 86-gene signature previously thought to bespecific for tuberculosis is also found in melioidosis. We conclude that the host responses to melioidosis and to tuberculosisare similar: both are dominated by interferon-signalling pathways and this similarity means gene expression signatures fromwhole blood do not distinguish between these two diseases.
Citation: Koh GCKW, Schreiber MF, Bautista R, Maude RR, Dunachie S, et al. (2013) Host Responses to Melioidosis and Tuberculosis Are Both Dominated byInterferon-Mediated Signaling. PLoS ONE 8(1): e54961. doi:10.1371/journal.pone.0054961
Editor: Olivier Neyrolles, Institut de Pharmacologie et de Biologie Structurale, France
Received September 12, 2012; Accepted December 18, 2012; Published January 29, 2013
Copyright: � 2013 Koh et al. This is an open-access article distributed under the terms of the Creative Commons Attribution License, which permits unrestricteduse, distribution, and reproduction in any medium, provided the original author and source are credited.
Funding: This study was funded by the Wellcome Trust of Great Britain (grants 086532/Z/08/Z and 089275/Z/09/Z, www.wellcome.ac.uk). SJP is supported by theNIHR Cambridge Biomedical Research Centre (www.cambridge-brc.org.uk). The funders had no role in study design, data collection and analysis, decision topublish, or preparation of the manuscript.
Competing Interests: The authors have declared that no competing interests exist.
* E-mail: [email protected]
Introduction
Melioidosis is a serious infectious disease caused by the
environmental Gram-negative bacillus Burkholderia pseudomallei.
The organism is distributed in soil across much of southeast Asia
and northern Australia [1], and infection results from bacterial
inoculation, ingestion or inhalation of the organism. The majority
of cases are reported during the rainy season in northeast Thailand
and northern Australia, and the most common presenting features
are community-acquired pneumonia and/or bacteraemia [1]. The
spectrum of clinical manifestations is very diverse, and melioidosis
may present as acute, chronic and latent disease. Patients with
chronic melioidosis may present with signs, symptoms and chest
radiograph changes that are indistinguishable from tuberculosis
[1].
Comparisons have also been drawn between melioidosis and
tuberculosis based on apparent parallels in epidemiology, patho-
physiology and therapy. Melioidosis and tuberculosis have risk
factors in common, in that corticosteroid use and diabetes
predispose to both diseases [1]. At clinical presentation, chronic
melioidosis, like tuberculosis, causes chronic suppurative lesions
that do not respond to commonly used first line antimicrobials
(viz., aminopenicillins, first and second generation cephalosporins,
macrolides or aminoglycosides). Histological examination of tissue
taken from patients with melioidosis may reveal granulomas with
central necrosis, which mimic those of tuberculosis [2]. At a
cellular level, both B. pseudomallei and Mycobacterium tuberculosis are
intracellular pathogens and this ability to parasitise cells appears
crucial to their virulence [3,4]. Melioidosis, like tuberculosis, is also
able to cause latent infection, the longest documented interval
between exposure and clinical melioidosis being 62 years [1].
While chronic melioidosis is clinically similar to active
tuberculosis, and latent of forms of both melioidosis and
tuberculosis undoubtedly occur, acute melioidosis has no clinical
counterpart in tuberculosis. Only ,10% of melioidosis cases are
chronic (symptoms .2 months) [1], and the majority of
melioidosis cases present acutely, with sepsis frequently compli-
cated by hypotension and organ dysfunction, which rarely occurs
in tuberculosis. Acute melioidosis is therefore a clinical entity quite
distinct from tuberculosis. In northeast Thailand, mortality is 40%
despite appropriate treatment [5], whereas tuberculosis mortality
is ,2% with appropriate treatment. HIV infection is also an
PLOS ONE | www.plosone.org 1 January 2013 | Volume 8 | Issue 1 | e54961

important risk factor for tuberculosis, but there is no established
association between HIV and melioidosis [6]. The taxonomic
relationship between B. pseudomallei and M. tuberculosis is distant
(they are in different phyla: Proteobacteria and Actinobacteria,
respectively). Their cell surfaces also present different pathogen-
associated molecular patterns (PAMP) to the host immune system,
and it seems reasonable to expect the host to respond differently to
challenge by different PAMPs.
In this study, we sought differences in host response between
acute melioidosis and tuberculosis using whole genome arrays to
compare gene expression in circulating peripheral blood leuko-
cytes collected from two cohorts of patients, one with melioidosis
and one with tuberculosis. We also sought to define whether whole
blood gene expression profiling distinguishes between melioidosis
and tuberculosis.
Materials and Methods
The melioidosis data were taken from a previously published
cohort of 30 patients and 30 healthy controls, frequency-matched
for diabetes and glibenclamide use (an oral hypoglycaemic drug
used to treat diabetes mellitus) [5]. Each group contained 10 non-
diabetics and 20 diabetics. Diabetics were divided into 10 taking
glibenclamide ( = glyburide) and 10 not taking any sulphonylurea
(but who may have been on insulin, metformin or diet-control
alone). We adjusted for diabetes and glibenclamide because two-
thirds of all melioidosis patients have diabetes, diabetes is itself a
pro-inflammatory condition, and because glibenclamide is anti-
inflammatory [5]. The tuberculosis cohort has been published
previously and consists of 20 patients with pulmonary tuberculosis
and 24 healthy controls [7]. That study did not control for the
effect of confounders such as diabetes. Inclusion and exclusion
criteria for both studies have been published previously [5,7].
Eligible cases for both studies were persons aged between 18 and
75 years. In the melioidosis cohort, diabetes was defined as an
abnormal Hb A1c at enrolment or a previous diagnosis of diabetes.
The tuberculosis cohort excluded patients with diabetes. Both
studies excluded patients who were pregnant or immunosup-
pressed.
Melioidosis MicroarraysThe methods used in the melioidosis cohort have been reported
previously [5] and the data is deposited at ArrayExpress, EMBL-
EBI (accession number E-TABM-852-n). In brief, a 3 ml blood
sample was collected from each study subject in a PaxGeneTM
Blood RNA tube (PreAnalytiX, GmbH) and stored at –70uC.
RNA was extracted using the PaxGeneTM Blood RNA Purifica-
tion Kit (PreAnalytix) according to the manufacturer’s instruc-
tions. The RNA was amplified using the IlluminaH TotalPrep
RNA Amplification Kit (Applied Biosystems) and assayed using
the IlluminaH HumanWG-6 v3.0 Expression BeadChip (Illumi-
naH), which probes 48,803 transcripts from across the human
genome. Quantitative PCR verification of these microarrays has
been reported previously [5].
Tuberculosis MicroarraysThe methods used in the tuberculosis cohort have been
published elsewhere previously [7]. In brief, a 3 ml blood sample
was collected into Tempus tubes (Applied Biosystems, California)
and stored at –20 to –80uC. RNA was extracted using the
PerfectPure RNA Blood Kit (5 PRIME) according to the
manufacturer’s instructions. The RNA was then amplified using
the Illumina CustomPrep RNA amplification kit (Applied
Biosystems) and assayed using the Illumina Human HT-12 v3
BeadChip array (Illumina), which uses the same probe set as the
HumanWG-6 v3.0. Raw data was downloaded from a publicly
available repository (NCBI GEO accession number GSE19491)
and consists of tuberculosis patients with controls recruited in
London. The study also included data from a cohort of South
African tuberculosis patients, but that cohort was excluded from
this analysis because it does not contain uninfected controls, which
made it impossible to normalize across the cohorts. The original
study was analysed using GeneSpring, but we reanalysed the raw
data using Bioconductor for the sake of comparability.
EthicsApproval for the melioidosis study was obtained from the
Oxford Tropical Research Ethics Committee (OXTREC 018-07)
and the Ethics Committee of the Faculty of Tropical Medicine,
Mahidol University (MUTM 2008-001-01) [5]. Approval for the
tuberculosis study was obtained from the Research Ethics
Committee at St Mary’s Hospital, London, UK (REC 06/
Q0403/128) [7]. Written informed consent was obtained from all
subjects.
Statistical MethodsDifferential expression analyses were performed using Biocon-
ductor [8] version 2.12.1 running on R 2.13.0 [9]. Pre-processing
was performed using the beadarray 2.2.0 package [10,11], and
background correction was performed using normexp [12,13].
Fluorescence intensities were quantile-normalized between arrays
within each cohort and non-expressed probes were removed
(detection p-value .0.05). Differential expression was performed
Table 1. Patient characteristics.
Melioidosis patients
No diabetes Diabetes patients
Parameter On Gb Not on Gb
Male gender 9 of 10 6 of 10 5 of 10
Age (years) 53 60 51
Glucose (mg dL–1) 128 218 256
Hb A1c (%) 6.0 10.8 11.1
Neutrophils (6109 L–1) 8.1 10.8 8.8
Lymphocytes (6109 L–1) 1.0 1.6 1.5
Mortality 1 of 10 2 of 10 5 of 10a
Controls
No diabetes Diabetes patients
Parameter On Gb Not on Gb
Male gender 10 of 10 3 of 10 5 of 10
Age (years) 40 54 56
Glucose (mg dL–1) 95 126 124
Neutrophils (6109 L–1) 4.0 4.7 5.1
Lymphocytes (6109 L–1) 1.9 4.4 5.1
Hb A1c (%) 5.4 9.0 9.0
aOne patient in this group was lost to follow-up following discharge fromhospital, and was counted as having survived to discharge.Gb = Glibenclamide. Values reported are means, except where stated.doi:10.1371/journal.pone.0054961.t001
Host Responses in Melioidosis and Tuberculosis
PLOS ONE | www.plosone.org 2 January 2013 | Volume 8 | Issue 1 | e54961

using limma 3.8.1 [14]. For the melioidosis cohort, the linear
model fit was log e = b0 + b1x1 + b2x2 + b3x3 + b12x1x2, where e is
expression, x1 is melioidosis, x2 is diabetes and x3 is glibenclamide
treatment. The expression values for melioidosis, b1, are therefore
adjusted for diabetes and glibenclamide treatment. For the
tuberculosis data, the model was log e = b0 + b1x1, where x1 is
tuberculosis. The p-value cut-off of 0.01 was set following visual
inspection of the histogram of unadjusted p-values for b1, as
Figure 1. The 86-gene signature of tuberculosis is also seen in melioidosis. These heat maps demonstrate the gene expression profiles fortwo cohorts: (A) melioidosis and (B) tuberculosis. The 86 genes displayed are those identified by Berry et al. [7] as being specific for tuberculosis, afterexcluding genes differentially regulated in other infections (Staphylococcus aureus and Group A Streptococcus) and inflammatory conditions (adultonset Still’s disease and systemic lupus erythematosus). Each column in the heat map is the gene expression profile of an individual, with controlsubjects on the left and patients on the right. Each cell within the heat map is the expression of a single gene: orange genes are upregulated andpurple genes are downregulated, with expression normalized across the rows. We used this 86-gene signature to cluster study participants into twogroups (marked black and red in the coloured banner at the top of each heat map). In the tuberculosis cohort, three controls clustered with thepatients, and two patients clustered with the controls. In the melioidosis cohort, the same 86-gene signature also allowed us to distinguish controlsand patients, with the exception of four patients who clustered with the controls. Despite the same microarray platform being used, the two cohortswere assayed as separate batches, so the absolute fluorescence intensities are different, making a direct comparison of melioidosis and tuberculosisimpossible. All patients were therefore compared to their own controls.doi:10.1371/journal.pone.0054961.g001
Host Responses in Melioidosis and Tuberculosis
PLOS ONE | www.plosone.org 3 January 2013 | Volume 8 | Issue 1 | e54961

Table 2. Genes upregulated in melioidosis and tuberculosis, arranged by pathway.
Melioidosis (total = 651) Tuberculosis (total = 847)
Pathway Genes List p-value Genes List p-value
IFN-c pathway 61 MEF2A, SLC9A1, IL4R, LYN, SLC3A2,TXN, PML, MKNK1, CDKN2B, RALB,IL1B, JUNB, DDIT3, COL1A2, FGR, TFE3,VDR, ATF6, CDKN1A, FES, MAX, CASP1,PPP2R2A, CEBPB, HCK, JAK2, JAK3,STAT5A, STAT5B, LAMC1, PPARG,PTEN, GADD45G, GADD45B,GADD45A, MAP3K11, FKBP1A,ZBTB17, BCL6, CSNK1A1, YWHAB,STAT1, MAPK13, MAPK14, SOCS3,SOCS1, GRB2, ITGB3, RUNX1, PTPN6,PTPN2, EIF4E, SAP30, IFNGR1, PRKCD,TNF, XIAP, MAP3K3, IL2RG, IRF7, IRF1
,0.0001 79 MEF2A, MAP3K7, MAP3K8, MAPK1,MAPK3, DUSP10, ARG1, LYN,SLC3A2, TXN, GSK3B, RALB, IL1B,ARRB2, ATF6, CDKN1A, MAX, CASP1,PKN1, CEBPB, PARP14, PPARG, PTEN,RBBP4, RAB5A, YWHAZ, FKBP1A,BCL6, CSNK1A1, YWHAB, YWHAH,DYNLRB1, GRB2, ITGB3, RAP1A,PRKCD, MAP3K3, CAMK2D, NUP153,IRF7, IRF1, CTNNB1, TGFBR2, PML,PPP2CA, SOS1, PPP2CB, DAB2, JUNB,DDIT3, FGR, VDR, TRAF6, ZFYVE16,NCOA2, PPM1A, NR3C1, NEDD4L,JAK2, LAMC1, CREBBP, RHEB,GADD45G, GADD45B, GADD45A,HBP1, STAT1, MAPK14, SOCS3,SOCS1, ELK4, PTPN2, SAP30, PAK2,IFNGR1, EGR3, EGR2, DAPK1,PPP1R15A
,0.0001
Glypican network 60 MEF2A, NFKBIB, NFKBIA, ARF1,SLC9A1, NOD2, LYN, SLC3A2, TXN,PML, MKNK1, DAPP1, CDKN2B, RALB,RELB, JUNB, DDIT3, COL1A2, ARFGAP1,FGR, TFE3, MDK, VDR, VAV1, ATF6,CDKN1A, CDC42, MAX, CASP9,PPP2R2A, REL, CEBPB, HCK, LAMC1,ASAP1, GOSR2, PPARG, NFKB2, PTEN,GADD45G, GADD45B, GADD45A,FKBP1A, ZBTB17, CSNK1A1, YWHAB,MAPK13, MAPK14, PAG1, ERC1, GRB2,RUNX1, PTPN6, EIF4E, SAP30, PRKCD,TNF, XIAP, MAP3K3, IRF7
,0.0001 87 APP, ARRB2, ASAP1, ATF6, BCL10,BCL3, BIRC2, CASP9, CDC42,CDKN1A, CEBPB, CLTA, CREBBP,CSNK1A1, CTNNB1, DAB2, DAPP1,DDIT3, DUSP10, DYNLRB1, EGR2,EGR3, ELK4, FBXW11, FGR, FKBP1A,FZD1, GADD45A, GADD45B,GADD45G, GOSR2, GRB2, GSK3B,HBP1, HSP90AA1, IRF7, JUNB,LAMC1, LYN, MACF1, MAP3K3,MAP3K7, MAP3K8, MAPK1, MAPK14,MAPK3, MAX, MEF2A, NCOA2,NEDD4L, NFKBIA, NFKBIB, NR3C1,NRAS, NUP153, PAG1, PAK2, PKN1,PML, PPARG, PPM1A, PPP1R15A,PPP2CA, PPP2CB, PRKCD, PTEN,PTPRC, RAB5A, RALB, RAP1A, RBBP4,RELB, RHEB, RIPK2, SAP30, SLC3A2,SOS1, TGFBR2, TNFAIP3, TRAF6, TXN,UBE2D3, VDR, YWHAB, YWHAH,YWHAZ, ZFYVE16
,0.0001
TRAIL (TNF superfamily,member 10) signalling
47 NFKBIB, NFKBIA, ARF1, ASAH1,NOD2, LYN, SLC3A2, MKNK1,DAPP1, RELB, FADD, JUNB, ARFGAP1,FGR, VAV1, CDKN1A, TNFSF10, CASP4,CASP9, CASP7, CASP1, LIMK1, REL,HCK, SMPD1, KRT18, LMNB1, ASAP1,GOSR2, PPARG, NFKB2, PTEN, FKBP1A,CSNK1A1, YWHAB, MAPK14, PAG1,MAP4K4, ERC1, GRB2, PTPN6, EIF4E,PRKCD, CTSD, TNF, XIAP, CASP10
,0.0001 70 MAP3K7, APP, MAP3K8, MAPK1,MAPK3, NFKBIB, NFKBIA, ASAH1,LYN, AIFM1, SLC3A2, NRAS, GSK3B,BCL10, RELB, ARRB2, EGF, CDKN1A,CASP4, CASP9, CASP7, CASP8,CASP1, CASP2, CYCS, NSMAF,LMNB1, GOSR2, PPARG, PTEN, BID,YWHAZ, FKBP1A, BCL3, CSNK1A1,YWHAB, BIRC2, YWHAH, PDGFA,GRB2, UBE2D3, RAP1A, CLTA, PRKCD,DAPP1, SOS1, FBXW11, CRADD,JUNB, TNFAIP3, FGR, TRAF6,TNFSF10, LIMK1, RB1, VIM, SMPD1,ASAP1, CREBBP, RHEB, TNFRSF10C,MAPK14, PAG1, RIPK2, EGR3,HSP90AA1, EGR2, CTSD, PTPRC,CASP10
,0.0001
Host Responses in Melioidosis and Tuberculosis
PLOS ONE | www.plosone.org 4 January 2013 | Volume 8 | Issue 1 | e54961
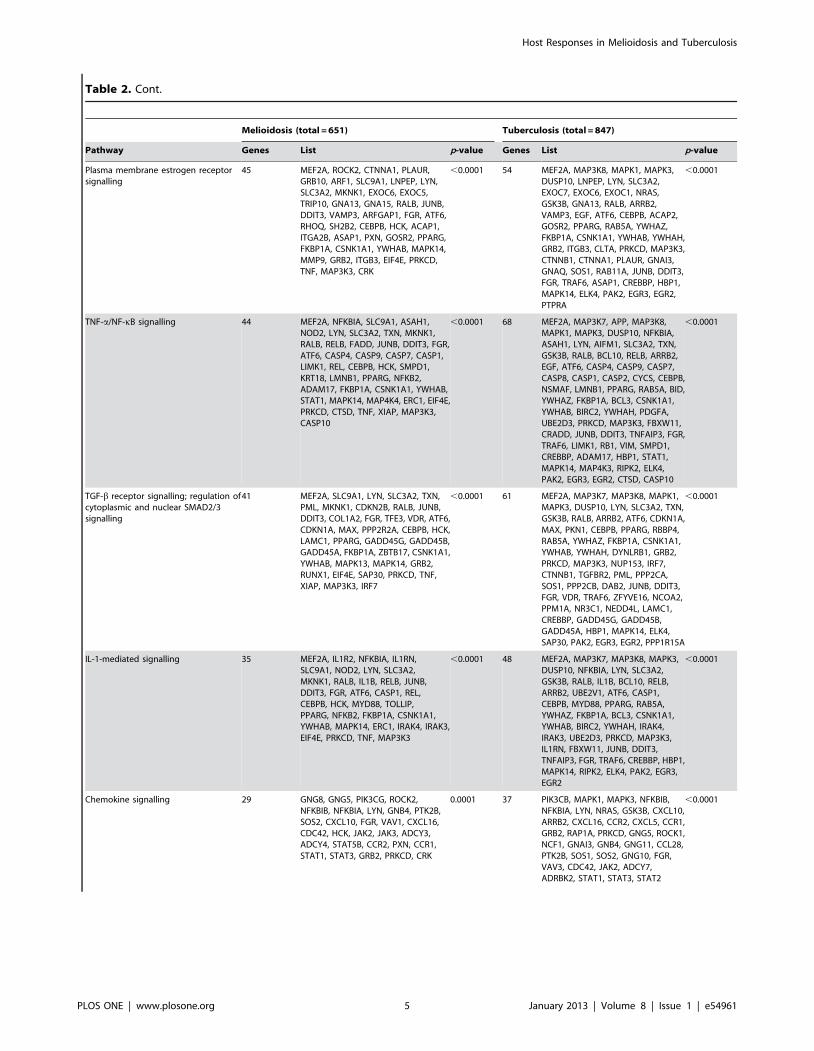
Table 2. Cont.
Melioidosis (total = 651) Tuberculosis (total = 847)
Pathway Genes List p-value Genes List p-value
Plasma membrane estrogen receptorsignalling
45 MEF2A, ROCK2, CTNNA1, PLAUR,GRB10, ARF1, SLC9A1, LNPEP, LYN,SLC3A2, MKNK1, EXOC6, EXOC5,TRIP10, GNA13, GNA15, RALB, JUNB,DDIT3, VAMP3, ARFGAP1, FGR, ATF6,RHOQ, SH2B2, CEBPB, HCK, ACAP1,ITGA2B, ASAP1, PXN, GOSR2, PPARG,FKBP1A, CSNK1A1, YWHAB, MAPK14,MMP9, GRB2, ITGB3, EIF4E, PRKCD,TNF, MAP3K3, CRK
,0.0001 54 MEF2A, MAP3K8, MAPK1, MAPK3,DUSP10, LNPEP, LYN, SLC3A2,EXOC7, EXOC6, EXOC1, NRAS,GSK3B, GNA13, RALB, ARRB2,VAMP3, EGF, ATF6, CEBPB, ACAP2,GOSR2, PPARG, RAB5A, YWHAZ,FKBP1A, CSNK1A1, YWHAB, YWHAH,GRB2, ITGB3, CLTA, PRKCD, MAP3K3,CTNNB1, CTNNA1, PLAUR, GNAI3,GNAQ, SOS1, RAB11A, JUNB, DDIT3,FGR, TRAF6, ASAP1, CREBBP, HBP1,MAPK14, ELK4, PAK2, EGR3, EGR2,PTPRA
,0.0001
TNF-a/NF-kB signalling 44 MEF2A, NFKBIA, SLC9A1, ASAH1,NOD2, LYN, SLC3A2, TXN, MKNK1,RALB, RELB, FADD, JUNB, DDIT3, FGR,ATF6, CASP4, CASP9, CASP7, CASP1,LIMK1, REL, CEBPB, HCK, SMPD1,KRT18, LMNB1, PPARG, NFKB2,ADAM17, FKBP1A, CSNK1A1, YWHAB,STAT1, MAPK14, MAP4K4, ERC1, EIF4E,PRKCD, CTSD, TNF, XIAP, MAP3K3,CASP10
,0.0001 68 MEF2A, MAP3K7, APP, MAP3K8,MAPK1, MAPK3, DUSP10, NFKBIA,ASAH1, LYN, AIFM1, SLC3A2, TXN,GSK3B, RALB, BCL10, RELB, ARRB2,EGF, ATF6, CASP4, CASP9, CASP7,CASP8, CASP1, CASP2, CYCS, CEBPB,NSMAF, LMNB1, PPARG, RAB5A, BID,YWHAZ, FKBP1A, BCL3, CSNK1A1,YWHAB, BIRC2, YWHAH, PDGFA,UBE2D3, PRKCD, MAP3K3, FBXW11,CRADD, JUNB, DDIT3, TNFAIP3, FGR,TRAF6, LIMK1, RB1, VIM, SMPD1,CREBBP, ADAM17, HBP1, STAT1,MAPK14, MAP4K3, RIPK2, ELK4,PAK2, EGR3, EGR2, CTSD, CASP10
,0.0001
TGF-b receptor signalling; regulation ofcytoplasmic and nuclear SMAD2/3signalling
41 MEF2A, SLC9A1, LYN, SLC3A2, TXN,PML, MKNK1, CDKN2B, RALB, JUNB,DDIT3, COL1A2, FGR, TFE3, VDR, ATF6,CDKN1A, MAX, PPP2R2A, CEBPB, HCK,LAMC1, PPARG, GADD45G, GADD45B,GADD45A, FKBP1A, ZBTB17, CSNK1A1,YWHAB, MAPK13, MAPK14, GRB2,RUNX1, EIF4E, SAP30, PRKCD, TNF,XIAP, MAP3K3, IRF7
,0.0001 61 MEF2A, MAP3K7, MAP3K8, MAPK1,MAPK3, DUSP10, LYN, SLC3A2, TXN,GSK3B, RALB, ARRB2, ATF6, CDKN1A,MAX, PKN1, CEBPB, PPARG, RBBP4,RAB5A, YWHAZ, FKBP1A, CSNK1A1,YWHAB, YWHAH, DYNLRB1, GRB2,PRKCD, MAP3K3, NUP153, IRF7,CTNNB1, TGFBR2, PML, PPP2CA,SOS1, PPP2CB, DAB2, JUNB, DDIT3,FGR, VDR, TRAF6, ZFYVE16, NCOA2,PPM1A, NR3C1, NEDD4L, LAMC1,CREBBP, GADD45G, GADD45B,GADD45A, HBP1, MAPK14, ELK4,SAP30, PAK2, EGR3, EGR2, PPP1R15A
,0.0001
IL-1-mediated signalling 35 MEF2A, IL1R2, NFKBIA, IL1RN,SLC9A1, NOD2, LYN, SLC3A2,MKNK1, RALB, IL1B, RELB, JUNB,DDIT3, FGR, ATF6, CASP1, REL,CEBPB, HCK, MYD88, TOLLIP,PPARG, NFKB2, FKBP1A, CSNK1A1,YWHAB, MAPK14, ERC1, IRAK4, IRAK3,EIF4E, PRKCD, TNF, MAP3K3
,0.0001 48 MEF2A, MAP3K7, MAP3K8, MAPK3,DUSP10, NFKBIA, LYN, SLC3A2,GSK3B, RALB, IL1B, BCL10, RELB,ARRB2, UBE2V1, ATF6, CASP1,CEBPB, MYD88, PPARG, RAB5A,YWHAZ, FKBP1A, BCL3, CSNK1A1,YWHAB, BIRC2, YWHAH, IRAK4,IRAK3, UBE2D3, PRKCD, MAP3K3,IL1RN, FBXW11, JUNB, DDIT3,TNFAIP3, FGR, TRAF6, CREBBP, HBP1,MAPK14, RIPK2, ELK4, PAK2, EGR3,EGR2
,0.0001
Chemokine signalling 29 GNG8, GNG5, PIK3CG, ROCK2,NFKBIB, NFKBIA, LYN, GNB4, PTK2B,SOS2, CXCL10, FGR, VAV1, CXCL16,CDC42, HCK, JAK2, JAK3, ADCY3,ADCY4, STAT5B, CCR2, PXN, CCR1,STAT1, STAT3, GRB2, PRKCD, CRK
0.0001 37 PIK3CB, MAPK1, MAPK3, NFKBIB,NFKBIA, LYN, NRAS, GSK3B, CXCL10,ARRB2, CXCL16, CCR2, CXCL5, CCR1,GRB2, RAP1A, PRKCD, GNG5, ROCK1,NCF1, GNAI3, GNB4, GNG11, CCL28,PTK2B, SOS1, SOS2, GNG10, FGR,VAV3, CDC42, JAK2, ADCY7,ADRBK2, STAT1, STAT3, STAT2
,0.0001
Host Responses in Melioidosis and Tuberculosis
PLOS ONE | www.plosone.org 5 January 2013 | Volume 8 | Issue 1 | e54961

calculated from the moderated t-statistic (B-statistic) using Bayes-
ian methods [14]. Illumina probe IDs were mapped to HUGO
gene symbols [15] by illuminaHumanv3.db [16]. Networks were
clustered by pathway by the Reactome [17] functional interaction
network [18] plug-in for Cytoscape 2.8.1 [19], restricting the
analysis to modules larger than 10 proteins. The p-values reported
are for the hypergeometric test. The top 1000 probes were used to
construct networks for presentation in figures. We searched
specifically for interferon-regulated gene signatures on Interferome
also [20]. Heat maps were drawn with gplots 2.8.0 [21] using
colour blind-safe colour ramps generated by RColorBrewer 1.0–2
[22,23]. We divided controls and patients by unsupervised k-
means [24] and verified stability of the clusters under 5 random
starts.
Table 2. Cont.
Melioidosis (total = 651) Tuberculosis (total = 847)
Pathway Genes List p-value Genes List p-value
p75 (NTR) signalling 28 BCL2L11, NFKBIA, NOD2, SORT1,RELB, CDC42, CASP9, CDK5, APH1B,REL, NCSTN, STAT5A, MYD88, TRPC3,RIT1, NFKB2, ADAM17, YWHAB, STAT3,MAPK14, ERC1, GRB2, DYNLT1, PRKCD,TNF, XIAP, RGS19, CRK
0.0001 40 APP, MAPK1, MAPK3, NFKBIA,SORT1, NRAS, GSK3B, FRS3, BCL10,RELB, ARRB2, BEX1, CASP9, CYCS,MYD88, RIT1, YWHAZ, BCL3, YWHAB,BIRC2, YWHAH, GRB2, UBE2D3,RAP1A, PRKCD, SOS1, FBXW11,TNFAIP3, TRAF6, CDC42, APH1B,NEDD4L, GAB2, NGFRAP1, PSEN1,ADAM17, MAPK10, STAT3, MAPK14,RIPK2
,0.0001
Phagosome 28 NCF4, MSR1, HLA-B, HLA-G, VAMP3,STX7, ATP6V1H, NOX3, CYBA, CYBB,CD36, TUBA4A, CTSL1, ATP6V0E1,FCGR1A, THBS1, ATP6V1E1, FCGR2A,CD14, TLR2, TLR4, TLR6, ITGB2, ITGB3,ITGAM, FCAR, TAP2, TAP1
,0.0001 41 HLA-DRA, HLA-B, HLA-F, VAMP3,RAB7A, HLA-DMB, CYBB, CD36,STX12, ATP6V0E1, RAB5C, FCGR3A,FCGR3B, RAB5A, FCGR1A, TUBA8,FCGR2A, CD14, ITGB3, FCAR,TUBA1A, TUBA1B, TAP2, TAP1, NCF2,NCF1, NCF4, HLA-DPA1, HLA-DPB1,MSR1, EEA1, STX7, TCIRG1, CTSL1,DYNC1I2, ATP6V1G1, ATP6V1E1,TLR2, TLR4, TLR6, ACTB
,0.0001
Apoptosis 26 H1F0, BCL2L11, FADD, TNFSF10,CASP9, CASP7, LMNB1, YWHAB,PSMD12, TJP2, PSMA6, PSMA4,PSMA3, PSMB7, PSMB3, PSMB2, BMX,PSMB8, PSMB9, PSMC1, PSMD6,PSMD9, PRKCD, TNF, XIAP, CASP10
,0.0001 21 PIK3CB, NFKBIA, AIFM1, IL1B, CASP9,CASP7, CASP8, CYCS, MYD88, BID,BIRC2, IRAK4, IRAK3, IRAK2, FAS,TNFSF10, PRKAR1A, CSF2RB,TNFRSF10C, PPP3R1, CASP10
,0.0001
Toll-like receptor signalling 25 PIK3CG, NFKBIA, CXCL10, IL1B,FADD, TRAF3, MYD88, TOLLIP,LY96, STAT1, MAPK13, MAPK14,CD14, TBK1, TLR1, TLR2, TLR4,TLR5, TLR6, TLR8, IRAK4, IFNAR1,IFNAR2, TNF, IRF7
,0.0001 29 MAP3K7, MAP3K8, PIK3CB, MAPK1,MAPK3, NFKBIA, CXCL10, IL1B,CASP8, MYD88, CD40, LY96, CD14,IRAK4, CD86, IRF7, TRAF6, MAPK10,STAT1, MAPK14, TBK1, TLR2, TLR4,TLR5, TLR6, TLR7, TLR8, IFNAR1,IFNAR2
,0.0001
IL-12 mediated signalling events 21 NFKBIA, NOD2, IL1B, IL27, RELB,IL18RAP, REL, JAK2, STAT5A, NFKB2,GADD45G, GADD45B, IL18R1, STAT1,STAT3, MAPK14, SOCS1, ERC1, TNF,IL2RG, IRF1
0.0001 31 HLA-DRA, NFKBIA, IL1B, BCL10, IL27,RELB, ARRB2, RAB7A, IL12RB1,IL18RAP, IL6ST, PIAS2, BCL3, BIRC2,UBE2D3, CD86, IRF1, FBXW11,TNFAIP3, TRAF6, JAK2, CREBBP,GADD45G, GADD45B, IL18R1, STAT1,STAT3, STAT2, MAPK14, SOCS1,RIPK2
,0.0001
IL-2 mediated signalling 20 UGCG, NFKBIA, NOD2, PTK2B, RELB,REL, SMPD1, JAK3, STAT5A, STAT5B,NFKB2, STAT1, STAT3, MAPK14,SOCS3, SOCS1, ERC1, GRB2, TNF,IL2RG
0.0002 31 SGMS1, UGCG, MAPK1, MAPK3,NFKBIA, ELF1, NRAS, BCL10, RELB,ARRB2, STAM2, BCL3, BIRC2, GRB2,UBE2D3, TERT, CCNA2, PTK2B, SOS1,FBXW11, TNFAIP3, TRAF6, SMPD1,GAB2, STAT1, STAT3, MAPK14,SOCS3, SOCS1, RIPK2, HSP90AA1
,0.0001
NOD-like receptor signalling 15 NFKBIB, NFKBIA, NOD2, NLRC4,IL1B, TRIP6, CASP5, CASP1, MEFV,ERBB2IP, MAPK13, MAPK14, TNF,XIAP, PYCARD
0.0001 21 MAP3K7, MAPK1, MAPK3, NFKBIB,NFKBIA, NLRC4, IL1B, CASP5, CASP8,CASP1, BIRC2, CARD6, PYCARD,TNFAIP3, TRAF6, MEFV, MAPK10,ERBB2IP, MAPK14, RIPK2, HSP90AA1
,0.0001
doi:10.1371/journal.pone.0054961.t002
Host Responses in Melioidosis and Tuberculosis
PLOS ONE | www.plosone.org 6 January 2013 | Volume 8 | Issue 1 | e54961

Table 3. Genes downregulated in melioidosis and tuberculosis, arranged by pathway.
Melioidosis (total = 1007) Tuberculosis (total = 1138)
GeneSet Genes List p-value Genes List p-value
Glypican network 99 MEF2C, MAP3K4, PPP1CA, ZAP70,ATM, CARD11, PPP3CC, IL8, MEF2D,RALA, ATF2, CCM2, CDKN1B, HDAC1,CD4, NFATC3, MAF, CABIN1, WWP1,CAMK4, ETS1, AES, CTBP1, RBBP7,MAP3K14, BCL2, CD22, FYN, YWHAQ,FOXO1, FOXO4, GATA3, BLK, EIF4B,SPTBN1, CD79B, CD79A, PLEKHA2,PLEKHA1, CLTB, RANBP3, PRKCH, LEF1,UBE2I, PRKCQ, PRNP, CYTH1, CAMK2G,CYTH3, MAP3K3, PIK3R1, PTGS2, CTGF,GNG2, TGIF1, TGIF2, TCF3, RPS6,TGFBR3, MAPT, MYC, ARHGEF7, GNB1,DGKA, TBC1D4, CTLA4, RPS6KA5,PDE3B, CTDSP2, EEF2, LAT, TSC1,SGK1, LCK, NR3C1, HSPA8, CREB1,CDC25B, SNIP1, SIN3A, CD40LG,SMAD4, SMAD3, CBLB, CYLD, STRAP,MAP4K1, SRF, AXIN2, RUNX2, RUNX3,AXIN1, ITK, PTPN6, MALT1, PLCG1,AKT1, GSC, PTPRC
,0.0001 105 HRAS, PPP2R5D, MAP3K7, MAP3K4,ZAP70, ATM, EEF2K, CARD11,PPP3CB, PPP3CC, IL4, MEF2D,DUSP8, IL10, RALA, ARFGAP1,MAPKAPK5, HDAC2, CDKN1B,HDAC1, IKBKB, PPP2R2A, CD4,NFATC3, MAF, CABIN1, WWP1,TGFBRAP1, CD72, ETS1, AES, CTBP1,RBBP4, RBBP7, MAP3K14, BCL2,CD22, CD19, FYN, FOXO1, FOXO3,GATA3, BLK, EIF3A, CD79B, CD79A,SHC1, PRKCA, LEF1, PRKCH, UBE2I,PRKCQ, CYTH1, CAMK2G, MAP3K1,YES1, IRF4, IBTK, TGFBR2, RPS6,TGFBR3, MYC, ARHGEF7, TLE1, GNB1,TBC1D4, CTLA4, RPS6KA5, XPO1,RPS6KB1, CTDSP1, CTDSP2, EEF2,TRAF2, LAT, TSC1, TSC2, SGK1, CDK4,LCK, INPP5D, HSPA8, CREB1, SIN3B,SIN3A, CD40LG, MACF1, SMAD7,SMAD3, DCP1A, CYLD, FZD3,MAPK13, CALM1, MAP4K1, AXIN2,RUNX2, RUNX3, AXIN1, ITK, MALT1,PLCG1, AKT1, PAK2, CSK
,0.0001
Protein synthesis, RNA translation,ribosome
85 RPLP2, RPLP0, RPLP1, PABPC1,EIF4A2, EEF1G, EEF1D, RPS27A,RPL35A, RPL10A, DOHH, RPL37A,RPL13A, CCT3, CCT7, RPL18A, EIF5A,EEF1B2, EIF3D, EIF3B, EIF3G, EIF3H,EIF3E, EIF3F, EIF3K, EEF1A1, EIF4B,EIF4H, DHPS, GSPT2, RPL18, RPL17,RPL19, RPL14, RPL13, RPL15, RPL10,RPL11, RPL12, EIF2S3, RPS18, RPS19,RPS16, RPS14, RPS15, RPS12, RPS13,RPS10, RPS11, RPS25, RPS27, RPS28,RPS29, RPS20, RPS23, RPS6, RPS5,RPL35, RPL36, RPL38, RPL30, RPL32,RPL27, RPL29, RPL22, DPM2, EIF5,EEF2, UBA52, RPL7, RPL6, RPL8, RPL3,RPL5, RPL4, RPL7A, RPL23A, RPS2,RPS3, RPS4X, RPS15A, RPL27A, EIF2B1,PIGA, PIGP
,0.0001 80 CCT2, CCT3, CCT6A, CCT7, EEF1B2,EEF1D, EEF1G, EEF2, EIF1AX, EIF2B1,EIF2B4, EIF2B5, EIF2S3, EIF3A, EIF3B,EIF3D, EIF3F, EIF3G, EIF3H, EIF3I,EIF3K, EIF4A2, FBXW7, PABPC1,RPL10, RPL10A, RPL11, RPL13,RPL13A, RPL14, RPL15, RPL18, RPL19,RPL22, RPL23, RPL23A, RPL26, RPL27,RPL29, RPL3, RPL31, RPL32, RPL35,RPL36, RPL36A, RPL37A, RPL4, RPL5,RPL6, RPL7, RPL7A, RPL8, RPL9,RPLP0, RPLP1, RPLP2, RPS11, RPS13,RPS15, RPS15A, RPS16, RPS18,RPS19, RPS2, RPS20, RPS23, RPS24,RPS25, RPS27, RPS27A, RPS28,RPS29, RPS3, RPS3A, RPS4X, RPS5,RPS6, RPS7, RPS9, UBA52
,0.0001
TGF-b receptor signalling,regulation of SMAD2/3
76 MEF2C, MAP3K4, PPP1CA, ATM, IL8,MEF2D, RALA, ATF2, CCM2, HDAC1,NFATC3, MAF, CABIN1, WWP1,CAMK4, CTBP1, RBBP7, BCL2, FYN,YWHAQ, FOXO1, FOXO4, GATA3, BLK,SPTBN1, PRKCH, UBE2I, PRKCQ,MAP3K3, PTGS2, CTGF, TGIF1, TGIF2,TCF3, TGFBR3, MAPT, MYC, DGKA,CTLA4, RPS6KA5, CTDSP2, LCK, NR3C1,HSPA8, CREB1, CDC25B, SNIP1, SIN3A,CD40LG, SMAD4, SMAD3, CBLB,STRAP, SRF, RUNX2, RUNX3, AXIN1,GSC, TGFB3, FNTA, E2F4, ANAPC1,ANAPC5, ETS1, SNW1, LEF1, CAMK2G,PIK3R1, PIK3R2, FOSB, RBL2, JUND,CTCF, CDC23, GIPC1, AXIN2
,0.0001 61 MAP3K7, MAP3K4, ATM, EEF2K, IL4,MEF2D, DUSP8, IL10, RALA,MAPKAPK5, HDAC2, HDAC1,PPP2R2A, NFATC3, MAF, CABIN1,WWP1, TGFBRAP1, CTBP1, RBBP4,RBBP7, BCL2, FYN, FOXO1, FOXO3,GATA3, BLK, SHC1, PRKCA, PRKCH,UBE2I, PRKCQ, MAP3K1, YES1, IRF4,TGFBR2, TGFBR3, MYC, CTLA4,RPS6KA5, RPS6KB1, CTDSP1,CTDSP2, TRAF2, TSC2, CDK4, LCK,HSPA8, CREB1, SIN3B, SIN3A,CD40LG, SMAD7, SMAD3, DCP1A,MAPK13, CALM1, RUNX2, RUNX3,AXIN1, PAK2
,0.0001
Host Responses in Melioidosis and Tuberculosis
PLOS ONE | www.plosone.org 7 January 2013 | Volume 8 | Issue 1 | e54961
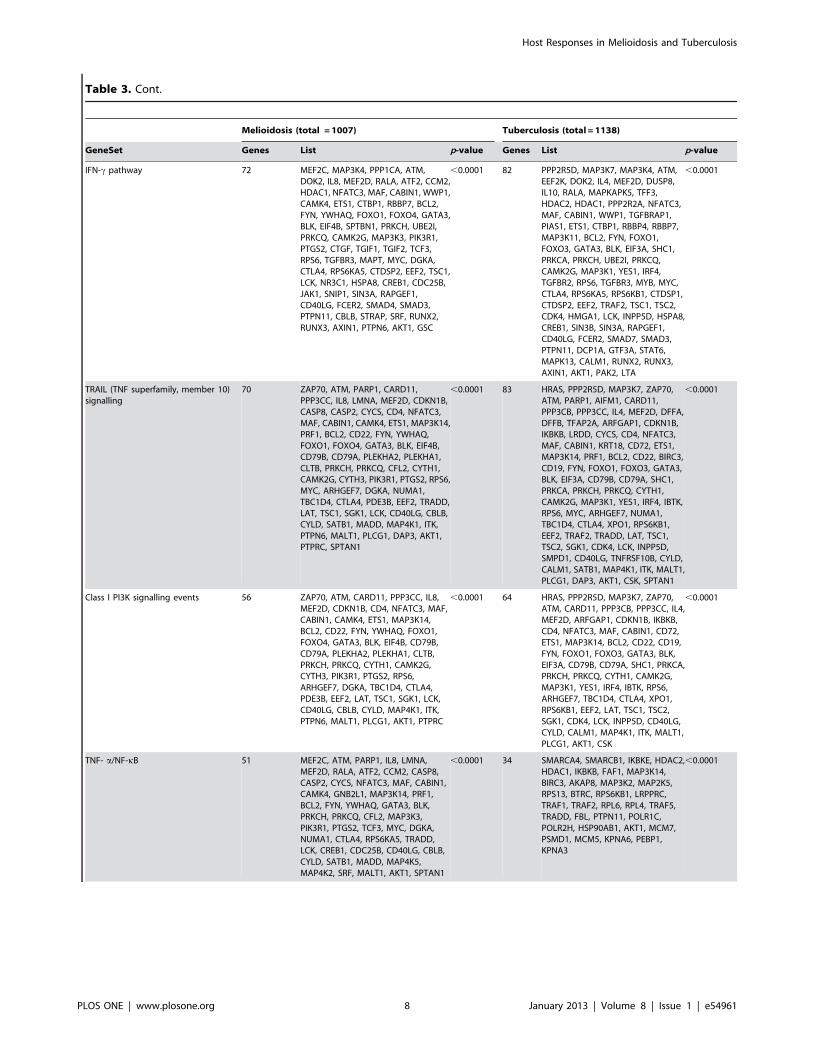
Table 3. Cont.
Melioidosis (total = 1007) Tuberculosis (total = 1138)
GeneSet Genes List p-value Genes List p-value
IFN-c pathway 72 MEF2C, MAP3K4, PPP1CA, ATM,DOK2, IL8, MEF2D, RALA, ATF2, CCM2,HDAC1, NFATC3, MAF, CABIN1, WWP1,CAMK4, ETS1, CTBP1, RBBP7, BCL2,FYN, YWHAQ, FOXO1, FOXO4, GATA3,BLK, EIF4B, SPTBN1, PRKCH, UBE2I,PRKCQ, CAMK2G, MAP3K3, PIK3R1,PTGS2, CTGF, TGIF1, TGIF2, TCF3,RPS6, TGFBR3, MAPT, MYC, DGKA,CTLA4, RPS6KA5, CTDSP2, EEF2, TSC1,LCK, NR3C1, HSPA8, CREB1, CDC25B,JAK1, SNIP1, SIN3A, RAPGEF1,CD40LG, FCER2, SMAD4, SMAD3,PTPN11, CBLB, STRAP, SRF, RUNX2,RUNX3, AXIN1, PTPN6, AKT1, GSC
,0.0001 82 PPP2R5D, MAP3K7, MAP3K4, ATM,EEF2K, DOK2, IL4, MEF2D, DUSP8,IL10, RALA, MAPKAPK5, TFF3,HDAC2, HDAC1, PPP2R2A, NFATC3,MAF, CABIN1, WWP1, TGFBRAP1,PIAS1, ETS1, CTBP1, RBBP4, RBBP7,MAP3K11, BCL2, FYN, FOXO1,FOXO3, GATA3, BLK, EIF3A, SHC1,PRKCA, PRKCH, UBE2I, PRKCQ,CAMK2G, MAP3K1, YES1, IRF4,TGFBR2, RPS6, TGFBR3, MYB, MYC,CTLA4, RPS6KA5, RPS6KB1, CTDSP1,CTDSP2, EEF2, TRAF2, TSC1, TSC2,CDK4, HMGA1, LCK, INPP5D, HSPA8,CREB1, SIN3B, SIN3A, RAPGEF1,CD40LG, FCER2, SMAD7, SMAD3,PTPN11, DCP1A, GTF3A, STAT6,MAPK13, CALM1, RUNX2, RUNX3,AXIN1, AKT1, PAK2, LTA
,0.0001
TRAIL (TNF superfamily, member 10)signalling
70 ZAP70, ATM, PARP1, CARD11,PPP3CC, IL8, LMNA, MEF2D, CDKN1B,CASP8, CASP2, CYCS, CD4, NFATC3,MAF, CABIN1, CAMK4, ETS1, MAP3K14,PRF1, BCL2, CD22, FYN, YWHAQ,FOXO1, FOXO4, GATA3, BLK, EIF4B,CD79B, CD79A, PLEKHA2, PLEKHA1,CLTB, PRKCH, PRKCQ, CFL2, CYTH1,CAMK2G, CYTH3, PIK3R1, PTGS2, RPS6,MYC, ARHGEF7, DGKA, NUMA1,TBC1D4, CTLA4, PDE3B, EEF2, TRADD,LAT, TSC1, SGK1, LCK, CD40LG, CBLB,CYLD, SATB1, MADD, MAP4K1, ITK,PTPN6, MALT1, PLCG1, DAP3, AKT1,PTPRC, SPTAN1
,0.0001 83 HRAS, PPP2R5D, MAP3K7, ZAP70,ATM, PARP1, AIFM1, CARD11,PPP3CB, PPP3CC, IL4, MEF2D, DFFA,DFFB, TFAP2A, ARFGAP1, CDKN1B,IKBKB, LRDD, CYCS, CD4, NFATC3,MAF, CABIN1, KRT18, CD72, ETS1,MAP3K14, PRF1, BCL2, CD22, BIRC3,CD19, FYN, FOXO1, FOXO3, GATA3,BLK, EIF3A, CD79B, CD79A, SHC1,PRKCA, PRKCH, PRKCQ, CYTH1,CAMK2G, MAP3K1, YES1, IRF4, IBTK,RPS6, MYC, ARHGEF7, NUMA1,TBC1D4, CTLA4, XPO1, RPS6KB1,EEF2, TRAF2, TRADD, LAT, TSC1,TSC2, SGK1, CDK4, LCK, INPP5D,SMPD1, CD40LG, TNFRSF10B, CYLD,CALM1, SATB1, MAP4K1, ITK, MALT1,PLCG1, DAP3, AKT1, CSK, SPTAN1
,0.0001
Class I PI3K signalling events 56 ZAP70, ATM, CARD11, PPP3CC, IL8,MEF2D, CDKN1B, CD4, NFATC3, MAF,CABIN1, CAMK4, ETS1, MAP3K14,BCL2, CD22, FYN, YWHAQ, FOXO1,FOXO4, GATA3, BLK, EIF4B, CD79B,CD79A, PLEKHA2, PLEKHA1, CLTB,PRKCH, PRKCQ, CYTH1, CAMK2G,CYTH3, PIK3R1, PTGS2, RPS6,ARHGEF7, DGKA, TBC1D4, CTLA4,PDE3B, EEF2, LAT, TSC1, SGK1, LCK,CD40LG, CBLB, CYLD, MAP4K1, ITK,PTPN6, MALT1, PLCG1, AKT1, PTPRC
,0.0001 64 HRAS, PPP2R5D, MAP3K7, ZAP70,ATM, CARD11, PPP3CB, PPP3CC, IL4,MEF2D, ARFGAP1, CDKN1B, IKBKB,CD4, NFATC3, MAF, CABIN1, CD72,ETS1, MAP3K14, BCL2, CD22, CD19,FYN, FOXO1, FOXO3, GATA3, BLK,EIF3A, CD79B, CD79A, SHC1, PRKCA,PRKCH, PRKCQ, CYTH1, CAMK2G,MAP3K1, YES1, IRF4, IBTK, RPS6,ARHGEF7, TBC1D4, CTLA4, XPO1,RPS6KB1, EEF2, LAT, TSC1, TSC2,SGK1, CDK4, LCK, INPP5D, CD40LG,CYLD, CALM1, MAP4K1, ITK, MALT1,PLCG1, AKT1, CSK
,0.0001
TNF- a/NF-kB 51 MEF2C, ATM, PARP1, IL8, LMNA,MEF2D, RALA, ATF2, CCM2, CASP8,CASP2, CYCS, NFATC3, MAF, CABIN1,CAMK4, GNB2L1, MAP3K14, PRF1,BCL2, FYN, YWHAQ, GATA3, BLK,PRKCH, PRKCQ, CFL2, MAP3K3,PIK3R1, PTGS2, TCF3, MYC, DGKA,NUMA1, CTLA4, RPS6KA5, TRADD,LCK, CREB1, CDC25B, CD40LG, CBLB,CYLD, SATB1, MADD, MAP4K5,MAP4K2, SRF, MALT1, AKT1, SPTAN1
,0.0001 34 SMARCA4, SMARCB1, IKBKE, HDAC2,HDAC1, IKBKB, FAF1, MAP3K14,BIRC3, AKAP8, MAP3K2, MAP2K5,RPS13, BTRC, RPS6KB1, LRPPRC,TRAF1, TRAF2, RPL6, RPL4, TRAF5,TRADD, FBL, PTPN11, POLR1C,POLR2H, HSP90AB1, AKT1, MCM7,PSMD1, MCM5, KPNA6, PEBP1,KPNA3
,0.0001
Host Responses in Melioidosis and Tuberculosis
PLOS ONE | www.plosone.org 8 January 2013 | Volume 8 | Issue 1 | e54961

Results
The melioidosis cohort consisted of 30 patients and 30 controls.
Baseline characteristics are in Table 1. In the melioidosis cohort,
6,755 probes were differentially expressed (that is, either up or
downregulated) representing 4632 unique genes. Annotation was
available for 1,658 of these genes, of which 651 were upregulated
and 1,007 were downregulated. The tuberculosis cohort consisted
of 20 patients and 24 controls. In the tuberculosis cohort, 6911
probes differentially expressed (5045 unique genes). Annotation
was available for 1985 of these genes, of which 847 were
upregulated and 1138 were downregulated. In both the melioi-
dosis and the tuberculosis cohorts, the signature seen was
dominated by neutrophils, which formed the bulk of the
circulating leukocytes. Multiple lymphocyte-related pathways were
downregulated, but this reflects the fact that lymphocyte counts
were low in both melioidosis and tuberculosis. Pathways associated
with transcription and translation were also prominent, in keeping
with the large number of genes differentially regulated in both
melioidosis and tuberculosis.
Pathway AnalysisInterferon-mediated responses were the dominant pathway seen
in both melioidosis and in tuberculosis (p,0.0001 for both,
Tables 2 & 3). Class 1 and class 2 interferons were prominent in
both (Table 4). Of the immune-related pathways, TRAIL (TNF
superfamily member 10), tumour necrosis factor a (TNFa),
transforming growth factor b (TGF-b), interleukin (IL)-1, IL-2,
IL-12, chemokine and Toll-like receptor (TLR) pathways were all
differentially regulated (Tables 2 & 3). There was no gene
signature that distinguished melioidosis from tuberculosis, and for
each of the pathways differentially expressed in melioidosis, we
were able to find a counterpart in tuberculosis (Tables 2 & 3).
Berry et al. reported an 86-gene signature that was specific for
tuberculosis [7]. This 86-gene signature was also present in
melioidosis (Figure 1).
Modular AnalysisIn a modular analysis of the upregulated genes (Figure 2A),
interferon and cytokine signalling clustered together in the centre
of the network, causing the complement (cluster 1), NOD-like
receptor (cluster 2) and TLR (cluster 3) pathways to gain
Table 3. Cont.
Melioidosis (total = 1007) Tuberculosis (total = 1138)
GeneSet Genes List p-value Genes List p-value
Formation and maturation of mRNAtranscript
47 PTBP1, DHX9, YBX1, SF3B4, SF3B3,SF3A2, SF3A1, SF3A3, HNRNPUL1,TXNL4A, NCBP2, SNRPD3, DNAJC8,PRPF6, SNRNP200, PRPF8, HNRNPA0,TH1L, PCBP1, PCBP2, ERCC3, LSM2,NHP2L1, GTF2H3, TCEA1, RNMT,RBM5, SNRPA1, HNRNPR, HNRNPU,HNRNPM, HNRNPK, HNRNPD,HNRNPC, TAF4, RBMX, HNRNPH1,CPSF1, U2AF2, CCNT2, SNRNP40,POLR2H, POLR2G, SNRNP70, SRRM1,SNRPB, RNPS1
,0.0001 49 TAF4B, PTBP1, SF3B4, SF3B3, SF3B1,SF3A2, SF3A1, SF3A3, HNRNPUL1,NCBP2, DNAJC8, PRPF4, SNRNP200,PRPF8, HNRNPA1, SUPT16H, TH1L,ERCC3, ERCC2, LSM2, NHP2L1,GTF2H1, RNMT, RBM5, DDX23,SNRPA1, HNRNPU, HNRNPM,METTL3, HNRNPD, TAF4, TAF6,HNRNPH1, COBRA1, CPSF1, SUPT5H,RNGTT, POLR2H, POLR2G, POLR2F,POLR2I, POLR2A, SNRNP70, SRRM1,EFTUD2, SNRPB, SNRPA, RNPS1,SMC1A
,0.0001
Spliceosome 37 THOC3, THOC1, SF3B4, SF3B3,SF3A2, SF3A1, SF3A3, TXNL4A, NCBP2,SNRPD3, PRPF3, PRPF6, SNRNP200,PRPF8, DDX5, SNW1, PPIE, PUF60,PCBP1, LSM4, LSM2, NHP2L1, SNRPA1,HNRNPU, HNRNPM, HNRNPK, TCERG1,DDX46, HNRNPC, RBMX, WBP11,HSPA8, U2AF2, SNRNP40, SNRNP70,RBM17, SNRPB
,0.0001 39 XAB2, THOC2, THOC1, SF3B4, SF3B3,SF3B1, DHX15, DHX16, SF3A2,SF3A1, SF3A3, NCBP2, PRPF3, PRPF4,SNRNP200, PRPF8, DDX5, HNRNPA1,PPIH, PUF60, LSM7, LSM5, LSM4,LSM2, NHP2L1, HSPA1A, DDX23,SNRPA1, HNRNPU, HNRNPM, DDX42,HSPA8, SNRNP70, RBM25, RBM17,EFTUD2, SNRPB, SNRPA, SNRPC
,0.0001
T-cell receptor signalling 34 ZAP70, CARD11, PPP3CC, ICOS,CD4, NFATC3, CD3G, CD3D, CD3E,MAP3K14, CD28, FYN, CD8A, CD8B,PRKCQ, PIK3R1, PIK3R2, CTLA4, LAT,LCK, CD40LG, CBLB, ITK, PTPN6,MALT1, PLCG1, AKT1, PAK4, CD247,PTPRC, HLA-DOA, HLA-DOB, RPS27A,HLA-DPA1
,0.0001 38 HRAS, MAP3K7, ZAP70, ATM,CARD11, IL4, IKBKB, CD4, NFATC3,CABIN1, CD3D, CD3E, MAP3K14,CD28, FYN, SHC1, PRKCA, PRKCQ,MAP3K1, XPO1, STK39, LAT, LCK,INPP5D, CD40LG, PTPN11, CYLD,CALM1, MAP4K1, PTPN7, ITK, MALT1,PLCG1, AKT1, CSK, CD247, RASGRP1,RASGRP2
,0.0001
IL-2-mediated signalling events 18 ATM, DOK2, IKZF3, MAP3K14,PRF1, BCL2, FYN, PIK3R1, IL2RB,RPS6, MYC, CCND2, LCK, JAK1,PTPN11, CYLD, MALT1, AKT1
0.022 30 HRAS, ATM, DOK2, IL4, IKBKB,MAP3K14, PRF1, BCL2, FYN, FOXO3,EIF3A, SHC1, PRKCA, IL2RB, RPS6,MYB, MYC, CCND2, XPO1, RPS6KB1,CDK6, LCK, SMPD1, PTPN11, CYLD,CISH, CALM1, MALT1, AKT1, LTA
,0.0001
IFN = interferon, IGF = insulin-like growth factor, IL = interleukin, NF-kB = nuclear factor kappa-light-chain-enhancer of activated B cells, PI3K = phosphoinositide 3-kinase,RNA = ribonucleic acid, TGF = transforming growth factor, TNF = tumour necrosis factor.Note:– Genes names are those assigned by the HUGO gene nomenclature committee.doi:10.1371/journal.pone.0054961.t003
Host Responses in Melioidosis and Tuberculosis
PLOS ONE | www.plosone.org 9 January 2013 | Volume 8 | Issue 1 | e54961

prominence. In the downregulated genes (Figure 2B), the most
prominent clusters were the ribosomal proteins (cluster 1) and zinc
finger proteins (cluster 2).
PAMP-specific ResponsesB. pseudomallei expresses lipopolysaccharide on its outer mem-
brane, while M. tuberculosis does not and has a lipid-rich cell wall.
Lipopolysaccharide is recognized by TLR4 and CD14, and both
are upregulated in melioidosis (P = 0.0016 and 1.5 6 10–6,
respectively); however, TLR4 and CD14 are also upregulated in
tuberculosis (P = 1.5 6 10–6 and 9.4 6 10–4). B. pseudomallei is a
flagellated, motile bacterium, while M. tuberculosis is immotile with
no flagellum. Flagellin is a ligand for TLR5 [25] and NLRC4 [26].
Both TLR5 and NLRC4 were upregulated in melioidosis (P = 5.4
610–13 and 4.2 610–10, respectively), but both were upregulated
in tuberculosis also (P = 8.1 6 10–10 and 2.4 6 10–11).
Discussion
There were 4632 genes differentially expressed in melioidosis
and 5045 genes in tuberculosis, thus approximately 20% of the
human genome is differentially regulated in each disease. The
most prominent pathway in melioidosis was interferon (IFN)-c and
the same was true of tuberculosis. There were no pathways
differentially regulated in melioidosis that were not also differen-
tially regulated in tuberculosis, and there was no signature which
reliably distinguished melioidosis and tuberculosis.
Berry et al. identified an 86-gene signature as being specific for
tuberculosis after eliminating differentially regulated genes com-
mon to Streptococcus pyogenes and Staphylococcus aureus infections, and
to two auto-inflammatory diseases (systemic lupus erythematosus
and Still’s disease). This signature was also present in melioidosis,
which is surprising given that all melioidosis patients recruited had
acute rather than chronic melioidosis, which is clinically distinct
from tuberculosis.
Interferon-mediated ResponsesThe IFN-c pathway was reported as the most prominent
pathway identified in gene expression studies of a mouse model of
melioidosis [27], and blocking IFN-c dramatically increases host
susceptibility to melioidosis [3]. In human studies, plasma IFN-cconcentrations were high in melioidosis [3], and IFN-c-mediated
responses were also the most prominent feature in a gene
expression study of melioidosis in another human cohort [28].
The finding here that this feature is shared with tuberculosis is
unsurprising, because IFN-c responses are crucial for the host
response against intracellular pathogens such as B. pseudomallei and
M. tuberculosis. IFN-c treatment has a role in the management of
multidrug-resistant tuberculosis, and adjunctive therapy with IFN-
c is beneficial in a mouse model of melioidosis [29], although its
role in clinical melioidosis remains undefined [30].
In their original report on this tuberculosis cohort, Berry et al.
noted that type 2 IFN-c responses were prominent, but noted that
type 1 IFN-ab responses were present also [7]. We found that type
1 interferon-ab responses were just as prominent in melioidosis,
but the clinical relevance of this remains to be defined.
Type 1 interferons can be produced by almost any cell type
(leukocytes, fibroblasts and endothelial cells) and are induced by a
range of bacterial pathogens, whereupon they proceed to
modulate the host response in a manner that is as yet incompletely
understood [31]. The signalling pathways initiated by type 1
interferons are best described in terms of their activation of signal
transducer and activator of transcription (STAT) family members
(STAT1 to STAT6) [32], the best studied of which are STAT1
and STAT3. STAT1 activation is dependent on both type 1 and
type 2 interferons and results in a pro-inflammatory response, with
recruitment of inflammatory cells and the enhancement of antigen
presentation [31]. On the other hand, STAT3 activation is a key
mediator of IL-10 signalling, and results in inhibition of
inflammatory responses and directly inhibits STAT1 activation
[31]. The role of STAT4 is less well described, but STAT4
activation may play a role in T helper 1 lymphocyte differenti-
ation, which is an essential part of the host response to intracellular
pathogens. Type 1 interferons are also necessary for the
production of inducible nitric oxide synthase [33], which is in
turn necessary for the clearance of intracellular bacteria.
Interestingly, type 1 interferons are able to inhibit IL-1bproduction and inflammasome assembly by two separate mech-
anisms: the first is via inhibition of NLRP1 and NLRP3
inflammasomes in a STAT1-dependent manner; the second, is a
reduction in pro-IL-1 levels via a STAT3-dependent pathway
[34]. It has previously be shown that host response to B.
pseudomallei is inflammasome-dependent [35].
The role of type 1 interferons in tuberculosis is unclear, since
mice deficient in the production of type 1 interferons are better
able to control M. tuberculosis infections [36], but type 1 interferons
also play a non-redundant protective role in the absence of type 2
interferon signaling [37]. The role of type 1 interferons in the
pathogenesis of melioidosis remains to be studied.
Table 4. Interferon signatures for melioidosis andtuberculosis.
Melioidosis Tuberculosis
Type 1 Both Type 2 Type 1 Both Type 2
AIM2CTSASH3GLB1TCN2NEU1FCGR1AH2AFJIFITM3LACTBDYSFVNN1PGS1CXCL16
TLR5GYG1DUSP3CASP1IFITM1UPP1SERPING1VAMP5SOCS3SAT1SLC30A1JAG1LIMK2DYNLT1TXNMYD88TAP1JAK2IL15
TNFSF10DRAMNEUR1CASP5SEPT4CD274SYN2H4HIST2H4BRAB24
GBP5ANKRD22FCGR1AAIM2CEACAM1WDFY1EPSTI1LY96GADD45BLACTBSP140SERTAD3SH3GLB1
CASP1DUSP3GBP1GBP2GBP4IL15ATF3PSME1PSME2UBE2L6GSTO1GCH1TAP1TRIM22STAT1TAP2PSMB8VAMP5WARSSECTM1GYG1SERPING1IRF1SAT1RTP4CLIC1CASP4PLAURDYNLT1SLC30A1ACTA2
SEPT4CD274NLRC5PSMB10P2RY14RNF213
Note: The interferon signatures for melioidosis (A) and tuberculosis (B) arelisted here (analysis from www.interferome.org). Berry et al. noted that bothtype 1 and type 2 interferon responses were prominent in tuberculosis. We findthat type 1 interferon responses appear in melioidosis also.doi:10.1371/journal.pone.0054961.t004
Host Responses in Melioidosis and Tuberculosis
PLOS ONE | www.plosone.org 10 January 2013 | Volume 8 | Issue 1 | e54961

Figure 2. Network representation of genes differentially expressed in melioidosis. ‘Canonical’ pathways (such as those presented in astandard biochemistry textbook) are manually curated collections of protein interactions arranged in a manner that aids human understanding, andas artificial constructs the boundaries between pathways are subjective. Pathways that are conceptually distinct often have proteins in common andoverlap, so in modular analysis, multiple pathways may collapse into a single module, causing other pathways and relationships to gain prominence.These two networks (A and B) represent those genes that are differentially expressed in melioidosis. For simplicity of presentation, we have used onlya subset of genes in these networks. The top 221 upregulated genes (as ranked by p-value) are presented in A, and the top 155 downregulated genesare in B. The same clusters were found in an analysis of the whole gene set and those results are presented in Tables 2 & 3. Network A. IFN-c, TNF-a,IL-12 signalling pathways cluster together with the glypican network in the centre of the graph, but the complement/chemokine receptor (cluster1), inflammasome (cluster 2) and Toll-like receptor pathways come to prominence in this analysis (cluster 3). Network B. IFN-c, TGF-b and TNFsignalling again cluster in the middle of the network. The two most prominent clusters are ribosomal proteins (cluster 1) and zinc finger proteins(cluster 2).doi:10.1371/journal.pone.0054961.g002
Host Responses in Melioidosis and Tuberculosis
PLOS ONE | www.plosone.org 11 January 2013 | Volume 8 | Issue 1 | e54961

PAMP-specific ResponsesTLR4 and CD14 are upregulated in both melioidosis and
tuberculosis. The classical ligand for TLR4 [38] and for CD14
[39] is lipopolysaccharide (LPS), which would explain this finding
for B. pseudomallei. TLR4 will recognize heparin-binding haemag-
glutinin [40], and CD14 will bind lipoarabinomannan [41], both
of which are expressed by M. tuberculosis.
The pattern recognition receptors TLR5 [25] and NLRC4 [26]
both recognize flagellin. No alternative ligand has yet been
described for TLR5, so it is more difficult to explain why
tuberculosis should apparently induce a flagellin-response. One
explanation is that upregulation of pattern recognition receptors is
not driven by their ligands. TLR5 expression is induced as part of
the type 1 interferon response [42], while NLRC4 is upregulated
as part of the TNF-a response [43]. Both pathways are prominent
in the host response to melioidosis. In support of this hypothesis,
the TLRs are upregulated as a group in both melioidosis (TLR1,
TLR2, TLR4, TLR5, TLR6, TLR8 and TLR10) and tuberculosis
(TLR2, TLR4, TLR5, TLR6, TLR7, TLR8).
Limitations and Future ResearchTuberculosis is strongly associated with HIV infection, but
melioidosis is not. HIV targets primarily CD4-positive T-
lymphocytes and lymphocyte depletion is a feature of all sepsis.
Lymphocytes were depleted in both the melioidosis and the TB
cohorts, so lymphocyte-related pathways and modules are missing
from the whole blood gene expression data of both cohorts,
making it difficult to make any comment about the relative role of
CD4-positive cells in melioidosis compared to tuberculosis. The
whole blood signature was dominated by neutrophils which may
also have obscured any lymphocyte signature. Future studies that
use purified lymphocytes harvested from melioidosis patients may
shed light on this issue.
Microarrays generate large amounts of data that are useful for
the development of hypotheses. Our analysis has identified a
number of other pathways that are differentially regulated in
melioidosis, but which are unstudied to date. Notably, the TRAIL
pathway is differentially regulated in melioidosis, but its role
remains undefined at present. The glypicans (cell surface
proteoglycans) contribute to cell proliferation and growth, both
essential processes in the host response to infection. To date,
investigations into the role of glypicans have been confined
primarily to cancer biology, although glypican-deficient mice are
more susceptibility to respiratory infections [44]. In tuberculosis,
the glypican network appears to have greater prominence than
even the interferon-mediated responses.
ConclusionsHost responses to melioidosis and TB are dominated by
interferon-signalling events, despite the fact that the organisms
are unrelated and present completely different cell-surface PAMPs
to the host. This is likely because they both stimulate host
responses common to intracellular pathogens, and because the
expression of pattern recognition receptors is not driven by their
ligands, but by cytokine responses (primarily IFN-c and TNF-a).
The 86-gene signature identified by Berry et al. clusters melioidosis
patients just as effectively as it clusters tuberculosis. It therefore
seems likely that whole blood gene signatures will not be able to
diagnose tuberculosis in areas where melioidosis and TB are co-
endemic, but may find utility when interpreted in combination
with clinical features. Further studies using direct comparisons will
be required to confirm this finding.
Acknowledgments
We thank the staff of Sappasithiprasong Hospital, Ubon Ratchathani, who
cared for the melioidosis patients in this study, and the staff of the
Wellcome Trust Mahidol-Oxford Tropical Medicine Research Unit, who
recruited the patients and collected the samples. We also thank Roslin
Russell, Keith James, Mike Smith, Robert Stojnic, Mark Dunning, Wei Shi
for help with scripting for R and Bioconductor; Joost Wiersinga, Tassili
Weehuizen, Ana Luisa Toribio for helpful discussions; Damien Chaussa-
bel, Christine Graham and Anne O’Garra with help using the raw data
from their TB cohort.
Author Contributions
Conceived and designed the experiments: GCKWK MFS GD SJP.
Performed the experiments: GCKWK MFS RRM DL. Analyzed the data:
GCKWK MFS RB SD. Contributed reagents/materials/analysis tools:
MFS RB NPJD GD SJP. Wrote the paper: GCKWK SD SJP.
References
1. Limmathurotsakul D, Peacock S (2011) Melioidosis: a clinical overview. Br Med
Bull 99: 125–139.
2. Wong KT, Puthucheary SD, Vadivelu J (1995) The histopathology of human
melioidosis. Histopathology 26: 51–55.
3. Wiersinga WJ, van der Poll T, White NJ, Day NP, Peacock SJ (2006)
Melioidosis: insights into the pathogenicity of Burkholderia pseudomallei. Nat
Rev Microbiol 4: 272–282. doi:10.1038/nrmicro1385.
4. Collins HL, Kaufmann SH (2001) The many faces of host responses to
tuberculosis. Immunology 103: 1–9.
5. Koh GCKW, Maude RR, Schreiber MF, Limmathurotsakul D, Wiersinga WJ,
et al. (2011) Glyburide is anti-inflammatory and associated with reduced
mortality in melioidosis. Clin Infect Dis 52: 717–725. doi:10.1093/cid/ciq192.
6. Chierakul W, Wuthiekanun V, Chaowagul W, Amornchai P, Cheng AC, et al.
(2005) Short report: disease severity and outcome of melioidosis in HIV
coinfected individuals. Am J Trop Med Hyg 73: 1165–1166.
7. Berry MPR, Graham CM, McNab FW, Xu Z, Bloch SAA, et al. (2010) An
interferon-inducible neutrophil-driven blood transcriptional signature in human
tuberculosis. Nature 466: 973–977. doi:10.1038/nature09247.
8. Gentleman RC, Carey VJ, Bates DM, Bolstad B, Dettling M, et al. (2004)
Bioconductor: open software development for computational biology and
bioinformatics. Genome Biol 5: R80. doi:10.1186/gb-2004–5-10-r80.
9. R Development Core Team (2010) R: A Language and Environment for
Statistical Computing. Vienna, Austria: R Foundation for Statistical Computing.
p. Available: http://www.R-project.org/.
10. Dunning MJ, Smith ML, Ritchie ME, Tavare S (2007) beadarray: R classes and
methods for Illumina bead-based data. Bioinformatics 23: 2183–2184.
doi:10.1093/bioinformatics/btm311.
11. Cairns JM, Dunning MJ, Ritchie ME, Russell R, Lynch AG (2008) BASH: a tool
for managing BeadArray spatial artefacts. Bioinformatics 24: 2921–2922.doi:10.1093/bioinformatics/btn557.
12. Ritchie ME, Silver J, Oshlack A, Holmes M, Diyagama D, et al. (2007) Acomparison of background correction methods for two-colour microarrays.
Bioinformatics 23: 2700–2707. doi:10.1093/bioinformatics/btm412.
13. Silver JD, Ritchie ME, Smyth GK (2009) Microarray background correction:maximum likelihood estimation for the normal-exponential convolution.
Biostatistics 10: 352–363. doi:10.1093/biostatistics/kxn042.
14. Smyth GK, Gentleman R, Carey V, Dudoit S, Irizarry R, et al. (2005) Limma:linear models for microarray data. Bioinformatics and Computational Biology
Solutions using R and Bioconductor. New York: Springer. 397–420.
15. Bruford EA, Lush MJ, Wright MW, Sneddon TP, Povey S, et al. (2008) The
HGNC Database in 2008: a resource for the human genome. Nucleic Acids Res
36: D445–448. doi:10.1093/nar/gkm881.
16. Barbosa-Morais NL, Dunning MJ, Samarajiwa SA, Darot JFJ, Ritchie ME, et al.
(2009) A re-annotation pipeline for Illumina BeadArrays: improving theinterpretation of gene expression data. Nucleic Acids Res 38: e17.
doi:10.1093/nar/gkp942.
17. Matthews L, Gopinath G, Gillespie M, Caudy M, Croft D, et al. (2009)Reactome knowledgebase of human biological pathways and processes. Nucleic
Acids Res 37: D619–622. doi:10.1093/nar/gkn863.
18. Wu G, Feng X, Stein L (2010) A human functional protein interaction networkand its application to cancer data analysis. Genome Biol 11: R53. doi:10.1186/
gb-2010–11–5-r53.
19. Shannon P, Markiel A, Ozier O, Baliga NS, Wang JT, et al. (2003) Cytoscape: a
software environment for integrated models of biomolecular interaction
networks. Genome Research 13: 2498–2504.
Host Responses in Melioidosis and Tuberculosis
PLOS ONE | www.plosone.org 12 January 2013 | Volume 8 | Issue 1 | e54961

20. Samarajiwa SA, Forster S, Auchettl K, Hertzog PJ (2009) INTERFEROME:
the database of interferon regulated genes. Nucleic Acids Res 37: D852–7.21. Warnes GR (2010) gplots: Various R programming tools for plotting data.
Available: http://CRAN.R-project.org/package = gplots.
22. Neuwirth E (2007) RColorBrewer: ColorBrewer palettes. Available: http://cran.r-project.org/web/packages/RColorBrewer/index.html.
23. Brewer CA, Hatchard GW, Harrower MA (2003) ColorBrewer in print: acatalog of color schemes for maps. Cartography and geographic information
science 30: 5–32.
24. Hartigan JA, Wong MA (1979) A K-means clustering algorithm. AppliedStatistics 28: 100–108.
25. Hayashi F, Smith KD, Ozinsky A, Hawn TR, Yi EC, et al. (2001) The innateimmune response to bacterial flagellin is mediated by Toll-like receptor 5.
Nature 410: 1099–1103. doi:10.1038/35074106.26. Sutterwala FS, Flavell RA (2009) NLRC4/IPAF: a CARD carrying member of
the NLR family. Clin Immunol 130: 2–6. doi:10.1016/j.clim.2008.08.011.
27. Chin C-Y, Monack DM, Nathan S (2010) Genome wide transcriptome profilingof a murine acute melioidosis model reveals new insights into how Burkholderia
pseudomallei overcomes host innate immunity. BMC Genomics 11: 672.doi:10.1186/1471–2164–11–672.
28. Pankla R, Buddhisa S, Berry M, Blankenship D, Bancroft G, et al. (2009)
Genomic transcriptional profiling identifies a candidate blood biomarkersignature for the diagnosis of septicemic melioidosis. Genome Biology 10:
R127. doi:10.1186/gb-2009–10–11-r127.29. Propst KL, Troyer RM, Kellihan LM, Schweizer HP, Dow SW (2010)
Immunotherapy markedly increases the effectiveness of antimicrobial therapyfor treatment of Burkholderia pseudomallei infection. Antimicrob Agents
Chemother 54: 1785–1792. doi:10.1128/AAC.01513–09.
30. Koh GCKW, Limmathurotsakul D (2010) Gamma interferon supplementationfor melioidosis. Antimicrob Agents Chemother 54: 4520. doi:10.1128/
AAC.00805–10.31. Gonzalez-Navajas JM, Lee J, David M, Raz E (2012) Immunomodulatory
functions of type I interferons. Nat Rev Immunol 12: 125–135. doi:10.1038/
nri3133.32. Hebenstreit D, Wirnsberger G, Horejs-Hoeck J, Duschl A (2996) Signaling
mechanisms, interaction partners, and target genes of STAT6. Cytokine GrowthFactor Rev 17: 173–188.
33. Utaisincharoen P, Anuntagool N, Arjcharoen S, Limposuwan K, Chaisuriya P,
et al. (2004) Induction of iNOS expression and antimicrobial activity by
interferon (IFN)-beta is distinct from IFN-gamma in Burkholderia pseudomallei-
infected mouse macrophages. Clin Exp Immunol 136: 277–283.
34. Guarda G, Braun M, Staehli F, Tardivel A, Mattmann C, et al. (2011) Type I
interferon inhibits interleukin-1 production and inflammasome activation.
Immunity 34: 213–223.
35. Breitbach K, Sun GW, Koehler J, Eske K, Wongprompitak P, et al. (2009)
Caspase-1 mediates resistance in murine melioidosis. Infect Immun. Available:
http://www.ncbi.nlm.nih.gov/pubmed/19179418. Accessed 1 February 2009.
36. Stanley SA, Johndrow JE, Manzanillo P, Cox JS (2007) The Type I IFN
response to infection with Mycobacterium tuberculosis requires ESX-1-
mediated secretion and contributes to pathogenesis. J Immunol 178: 3143–3152.
37. Desvignes L, Wolf AJ, Ernst JD (2012) Dynamic roles of type I and type II IFNs
in early infection with Mycobacterium tuberculosis. J Immunol 188: 6205–6215.
38. Qureshi ST, Lariviere L, Leveque G, Clermont S, Moore KJ, et al. (1999)
Endotoxin-tolerant mice have mutations in Toll-like receptor 4 (Tlr4). J Exp
Med 189: 615–625.
39. Kitchens RL (2000) Role of CD14 in cellular recognition of bacterial
lipopolysaccharides. Chem Immunol 74: 61–82.
40. Jung ID, Jeong SK, Lee C-M, Noh KT, Heo DR, et al. (2011) Enhanced
efficacy of therapeutic cancer vaccines produced by co-treatment with
Mycobacterium tuberculosis heparin-binding hemagglutinin, a novel TLR4
agonist. Cancer Res 71: 2858–2870. doi:10.1158/0008–5472.CAN-10–3487.
41. Pugin J, Heumann ID, Tomasz A, Kravchenko VV, Akamatsu Y, et al. (1994)
CD14 is a pattern recognition receptor. Immunity 1: 509–516.
42. Khoo JJ, Forster S, Mansell A (2011) Toll-like receptors as interferon-regulated
genes and their role in disease. J Interferon Cytokine Res 31: 13–25.
doi:10.1089/jir.2010.0095.
43. Gutierrez O, Pipaon C, Fernandez-Luna JL (2004) Ipaf is upregulated by tumor
necrosis factor-alpha in human leukemia cells. FEBS Lett 568: 79–82.
doi:10.1016/j.febslet.2004.04.095.
44. Cano-Gauci DF, Song HH, Yang H, McKerlie C, Choo B, et al. (1999)
Glypican-3-deficient mice exhibit developmental overgrowth and some of the
abnormalities typical of Simpson-Golabi-Behmel syndrome. J Cell Biol 146:
255–264.
Host Responses in Melioidosis and Tuberculosis
PLOS ONE | www.plosone.org 13 January 2013 | Volume 8 | Issue 1 | e54961