
HOSPITAL-WIDE - ACHS · Hospital-Wide, version 12 1 ... 9.3 Tonsillectomy ... Rationale Unplanned...
56
HOSPITAL-WIDE VERSION 12 Retrospective data in full ACIR 2008 - 2015
Transcript of HOSPITAL-WIDE - ACHS · Hospital-Wide, version 12 1 ... 9.3 Tonsillectomy ... Rationale Unplanned...

HOSPITAL-WIDE VERSION 12
Retrospective data in full ACIR 2008 - 2015

Australasian Clinical Indicator Report 2008–2015
© ACHS. This work is copyright. Requests and inquiries concerning reproduction and rights should be addressed to [email protected]
Contents
Hospital-Wide, version 12 1
Hospital readmissions ....................................................................................................................... 1
1.1 Unplanned and unexpected readmissions within 28 days (L) 1 Return to the operating room ............................................................................................................ 3
2.1 Unplanned return to the operating room during the same admission (L) 3 2.2 Reviewed cases following an unplanned return to the operating room (H) 5
Pressure injuries ................................................................................................................................ 6
3.1 Inpatients who develop 1 or more pressure injuries (L) 6 Inpatient falls ...................................................................................................................................... 8
4.1 Inpatient falls (L) 8 4.2 Inpatient falls resulting in fracture or closed head injury (L) 9 4.3 Inpatient falls - patients 65 years and older (L) 11
Patient deaths ................................................................................................................................... 13
5.1 Patient deaths addressed within a clinical audit process (H) 13 5.2 Deaths in adult patients who do not have a NFR order (L) 15 5.3 Adult deaths (L) 16 5.4 Coronary artery graft surgery (CAGS) – death (L) 18 5.5 Elective coronary artery graft surgery – death (L) 19 5.6 Coronary artery graft surgery patients aged 71 years or older – death (L) 20 5.7 Elective abdominal aortic aneurysm (AAA) open repair – death (L) 21
Blood transfusion ............................................................................................................................ 22
6.1 Significant adverse blood transfusion events (L) 22 6.2 Transfusion episodes where informed patient consent was not documented (L) 25 6.3 RBC transfusion where Hb reading is 100 g/L or more (L) 27
Thromboprophylaxis........................................................................................................................ 29
7.1 VTE prophylaxis administered to high risk medical patients (N) 29 Minimum standards for rapid response system (RRS) calls ........................................................ 30
8.1 Rapid response system calls to adult patients (N) 30 8.2 Rapid response system calls to adult patients within 24 hours of admission (N) 31 8.3 Adult patients experiencing cardiopulmonary arrest (L) 32 8.4 Rapid response system attendances within 5 minutes (H) 34 8.5 Adult deaths avoided by rapid response system calls (H) 35
Surgery .............................................................................................................................................. 36
9.1 Pre-operative acute appendicitis (children) - normal histology (L) 36 9.2 Laparoscopic cholecystectomy - bile duct injury requiring operative intervention (L) 37 9.3 Tonsillectomy - significant reactionary haemorrhage (L) 39
Characteristics of contributing HCOs ............................................................................................ 41
Summary of Results 45
Hospital readmissions 45 Return to the operating room 45 Pressure injuries 45 Inpatient falls 45 Patient deaths 46 Blood transfusion 46 Thromboprophylaxis 47 Minimum standards for rapid response system (RRS) calls 47 Surgery 47
Australasian Clinical Indicator Report 2008–2015
© ACHS. This work is copyright. Requests and inquiries concerning reproduction and rights should be addressed to [email protected]
Expert Commentary 49
The Royal Australasian College of Medical Administrators (RACMA) ........................................ 49
Introductory comments 49 Hospital readmissions 49 Return to the operating room 49 Pressure injuries 50 Inpatient falls 50 Patient deaths 50 Blood transfusion 51 Thromboprophylaxis 51 Minimum standards for rapid response system (RRS) calls 51 Surgery 51
Australian College of Nursing (ACN) .............................................................................................. 52
Introductory comments 52 Hospital readmissions 52 Return to the operating room 52 Pressure injuries 52 Inpatient falls 52 Patient deaths 53 Blood transfusion 53 General/closing comments 53 References 53

Australasian Clinical Indicator Report 2008–2015 Page 1
© ACHS. This work is copyright. Requests and inquiries concerning reproduction and rights should be addressed to [email protected]
Hospital-Wide, version 12
Hospital readmissions
1.1 Unplanned and unexpected readmissions within 28 days (L)
Rationale
Unplanned and unexpected readmissions to a hospital may reflect less than optimal patient
management.
Numerator Number of unplanned and unexpected readmissions within 28 days of separation related to
the primary admission.
Denominator Number of separations (excluding deaths).
Desirable level: Low High Not specified
Type of Indicator: Process Outcome Structure
Year
No.
HCOs
Total
numerator
Total
denominator Rate#
Rate#
(20)
Rate#
(80)
Centile
Gains
Stratum
Gains
Outlier
Gains
2008 299 45,485 2,708,519 1.68 0.36 3.06 35,718 20,277
2009 274 46,056 2,695,411 1.71 0.30 2.60 37,845 21,175
2010 279 34,744 2,871,585 1.21 0.24 2.09 27,927 15,270
2011 294 34,239 2,964,712 1.15 0.26 2.05 26,553 14,318
2012 289 37,427 3,159,627 1.18 0.19 2.10 31,484 16,368
2013 278 30,851 3,096,888 1.00 0.19 1.79 24,856 12,535
2014 284 38,292 3,260,187 1.17 0.16 1.74 33,107 17,284
2015 288 45,658 3,648,033 1.25 0.15 1.50 40,248 26,140 22,622
# per 100 separations
In 2015, there were 525 records from 288 HCOs. The annual rate was 1.25 per 100 separations.
Trends
The fitted rate improved from 1.6 to 1.1, a change of 0.49 per 100 separations. This trend was also
significant after allowing for the changing composition of HCOs contributing over the period. The rate
change was 0.49 per 100 separations.
Trend plot of rates and centiles by year
A Low rate is desirable
80th centile rate
20th centile rate
Fitted rate
Aggregate rate x
Period average rate
Hospital-Wide, version 12
Australasian Clinical Indicator Report 2008–2015 Page 2
© ACHS. This work is copyright. Requests and inquiries concerning reproduction and rights should be addressed to [email protected]
Variation between strata
Rates by Public / Private
Year Stratum
No.
HCOs
Total
numerator
Total
denominator
Stratum
rate#
Standard
error
Stratum
gains
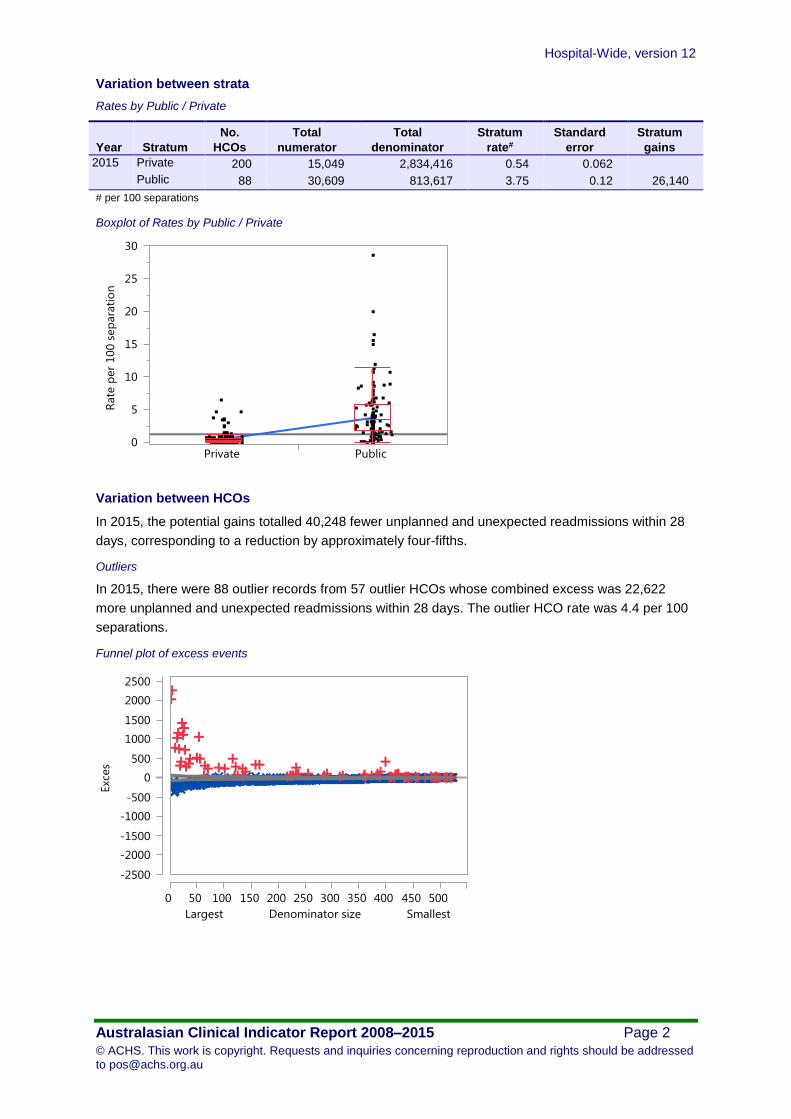
2015 Private 200 15,049 2,834,416 0.54 0.062
Public 88 30,609 813,617 3.75 0.12 26,140
# per 100 separations
Boxplot of Rates by Public / Private
Variation between HCOs
In 2015, the potential gains totalled 40,248 fewer unplanned and unexpected readmissions within 28
days, corresponding to a reduction by approximately four-fifths.
Outliers
In 2015, there were 88 outlier records from 57 outlier HCOs whose combined excess was 22,622
more unplanned and unexpected readmissions within 28 days. The outlier HCO rate was 4.4 per 100
separations.
Funnel plot of excess events

Hospital-Wide, version 12
Australasian Clinical Indicator Report 2008–2015 Page 3
© ACHS. This work is copyright. Requests and inquiries concerning reproduction and rights should be addressed to [email protected]
Return to the operating room
2.1 Unplanned return to the operating room during the same admission (L)
Rationale
Unplanned return of a patient to the operating room during the same admission may reflect less than
optimal management.
Numerator Number of patients having an unplanned return to the operating room during the same
admission.
Denominator Number of patients having an operation or procedure in the operating room.
Desirable level: Low High Not specified
Type of Indicator: Process Outcome Structure
Year
No.
HCOs
Total
numerator
Total
denominator Rate#
Rate#
(20)
Rate#
(80)
Centile
Gains
Stratum
Gains
Outlier
Gains
2008 280 6,660 1,838,190 0.36 0.11 0.42 4,678 1,602
2009 262 6,676 1,813,414 0.37 0.12 0.45 4,568 1,493
2010 268 6,142 1,968,002 0.31 0.12 0.38 3,792 1,466
2011 264 6,168 1,910,596 0.32 0.11 0.41 4,088 1,425
2012 251 5,872 1,921,087 0.31 0.11 0.40 3,780 1,248
2013 237 5,441 1,947,428 0.28 0.10 0.37 3,461 996
2014 229 5,643 2,008,707 0.28 0.100 0.36 3,641 1,175
2015 221 5,082 2,002,383 0.25 0.085 0.32 3,382 1,087
# per 100 patients
In 2015, there were 411 records from 221 HCOs. The annual rate was 0.25 per 100 patients.
Trends
The fitted rate improved from 0.37 to 0.26, a change of 0.11 per 100 patients. This trend was also
significant after allowing for the changing composition of HCOs contributing over the period. The rate
change was 0.11 per 100 patients.
Trend plot of rates and centiles by year
Variation between strata
There were no significant stratum differences in 2014 and 2015.
A Low rate is desirable
80th centile rate
20th centile rate
Fitted rate
Aggregate rate x
Period average rate

Hospital-Wide, version 12
Australasian Clinical Indicator Report 2008–2015 Page 4
© ACHS. This work is copyright. Requests and inquiries concerning reproduction and rights should be addressed to [email protected]
Variation between HCOs
In 2015, the potential gains totalled 3,382 fewer patients having an unplanned return to the operating
room, corresponding to a reduction by approximately one-half.
Outliers
In 2015, there were 40 outlier records from 30 outlier HCOs whose combined excess was 1,087 more
patients having an unplanned return to the operating room. The outlier HCO rate was 0.64 per 100
patients.
Funnel plot of excess events
Hospital-Wide, version 12
Australasian Clinical Indicator Report 2008–2015 Page 5
© ACHS. This work is copyright. Requests and inquiries concerning reproduction and rights should be addressed to [email protected]
2.2 Reviewed cases following an unplanned return to the operating room (H)
Numerator Number of cases reviewed following an unplanned return to the operating room during the
same admission.
Denominator Number of patients having an unplanned return to the operating room during the same
admission.
Desirable level: Low High Not specified
Type of Indicator: Process Outcome Structure
Year
No.
HCOs
Total
numerator
Total
denominator Rate#
Rate#
(20)
Rate#
(80)
Centile
Gains
Stratum
Gains
Outlier
Gains
2015 51 1,105 1,122 98.5 99.5 99.9 16 14
# per 100 patients having an unplanned return to the operating room
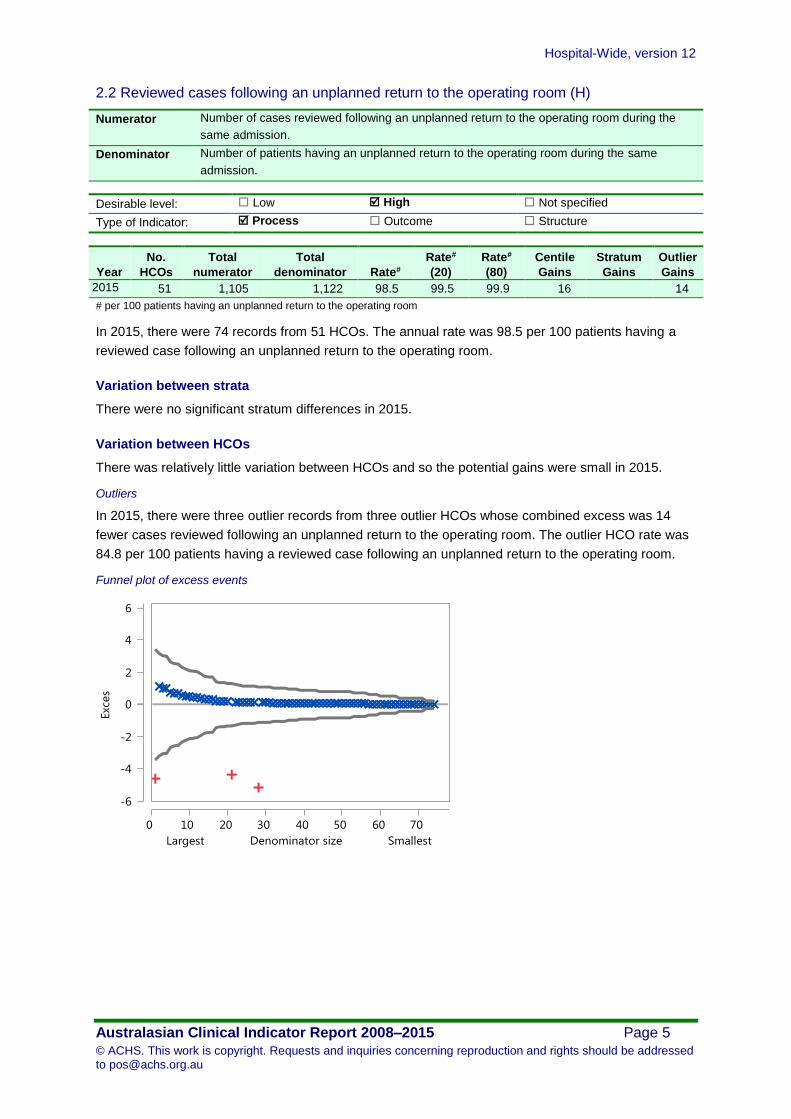
In 2015, there were 74 records from 51 HCOs. The annual rate was 98.5 per 100 patients having a
reviewed case following an unplanned return to the operating room.
Variation between strata
There were no significant stratum differences in 2015.
Variation between HCOs
There was relatively little variation between HCOs and so the potential gains were small in 2015.
Outliers
In 2015, there were three outlier records from three outlier HCOs whose combined excess was 14
fewer cases reviewed following an unplanned return to the operating room. The outlier HCO rate was
84.8 per 100 patients having a reviewed case following an unplanned return to the operating room.
Funnel plot of excess events

Hospital-Wide, version 12
Australasian Clinical Indicator Report 2008–2015 Page 6
© ACHS. This work is copyright. Requests and inquiries concerning reproduction and rights should be addressed to [email protected]
Pressure injuries
3.1 Inpatients who develop 1 or more pressure injuries (L)
Rationale
Pressure injuries are largely preventable hospital acquired injuries caused by unrelieved pressure
resulting in damage to the skin and underlying tissue. In the majority of cases they can be regarded
as an adverse outcome of a health care admission. Many national and international healthcare
agencies acknowledge that pressure injuries not only affect the health of the individual, but also place
a significant strain on already stretched health resources.
Numerator Number of inpatients who develop one or more pressure injuries during their admission.
Denominator Number of inpatient bed days.
Desirable level: Low High Not specified
Type of Indicator: Process Outcome Structure
Year
No.
HCOs
Total
numerator
Total
denominator Rate#
Rate#
(20)
Rate#
(80)
Centile
Gains
Stratum
Gains
Outlier
Gains
2015 432 9,090 12,412,612 0.073 0.019 0.094 6,753 3,529 2,172
# per 100 bed days
In 2015, there were 745 records from 432 HCOs. The annual rate was 0.073 per 100 bed days.
Variation between strata
Rates by Public / Private
Year Stratum
No.
HCOs
Total
numerator
Total
denominator
Stratum
rate#
Standard
error
Stratum
gains
2015 Private 197 2,501 5,853,043 0.045 0.003
Public 235 6,589 6,559,569 0.099 0.003 3,529
# per 100 bed days
Boxplot of Rates by Public / Private
Variation between HCOs
In 2015, the potential gains totalled 6,753 fewer patients who develop one or more pressure injuries,
corresponding to a reduction by approximately two-thirds.

Hospital-Wide, version 12
Australasian Clinical Indicator Report 2008–2015 Page 7
© ACHS. This work is copyright. Requests and inquiries concerning reproduction and rights should be addressed to [email protected]
Outliers
In 2015, there were 58 outlier records from 45 outlier HCOs whose combined excess was 2,172 more
patients who develop one or more pressure injuries. The outlier HCO rate was 0.17 per 100 bed days.
Funnel plot of excess events

Hospital-Wide, version 12
Australasian Clinical Indicator Report 2008–2015 Page 8
© ACHS. This work is copyright. Requests and inquiries concerning reproduction and rights should be addressed to [email protected]
Inpatient falls
4.1 Inpatient falls (L)
Rationale
Fall-related injury is one of the leading causes of morbidity and mortality in older Australians and is
the single biggest reason for hospital admissions and emergency department presentations in people
over 65 years of age. Adverse events associated with falls may include bone fractures, soft tissue
injury, and fear of falling again. Interventions based on a proactive assessment, anticipation of patient
needs, and participation by multidisciplinary teams in prevention efforts are critical.
Numerator Number of inpatient falls.
Denominator Number of occupied bed days.
Desirable level: Low High Not specified
Type of Indicator: Process Outcome Structure
Year
No.
HCOs
Total
numerator
Total
denominator Rate#
Rate#
(20)
Rate#
(80)
Centile
Gains
Stratum
Gains
Outlier
Gains
2015 408 53,916 15,304,836 0.35 0.19 0.57 24,075 9,463
# per 100 bed days
In 2015, there were 719 records from 408 HCOs. The annual rate was 0.35 per 100 bed days.
Variation between strata
There were no significant stratum differences in 2015.
Variation between HCOs
In 2015, the potential gains totalled 24,075 fewer inpatient falls, corresponding to a reduction by
approximately one-third.
Outliers
In 2015, there were 153 outlier records from 104 outlier HCOs whose combined excess was 9,463
more inpatient falls. The outlier HCO rate was 0.65 per 100 bed days.
Funnel plot of excess events

Hospital-Wide, version 12
Australasian Clinical Indicator Report 2008–2015 Page 9
© ACHS. This work is copyright. Requests and inquiries concerning reproduction and rights should be addressed to [email protected]
4.2 Inpatient falls resulting in fracture or closed head injury (L)
Numerator Number of fractures or closed head injuries that result because of an inpatient fall.
Denominator Number of occupied bed days.
Desirable level: Low High Not specified
Type of Indicator: Process Outcome Structure
Year
No.
HCOs
Total
numerator
Total
denominator Rate#
Rate#
(20)
Rate#
(80)
Centile
Gains
Stratum
Gains
Outlier
Gains
2015 349 1,343 14,069,400 0.010 0.004 0.011 713 205 282
# per 100 bed days
In 2015, there were 652 records from 349 HCOs. The annual rate was 0.010 per 100 bed days.
Variation between strata
Rates by State
Year Stratum
No.
HCOs
Total
numerator
Total
denominator
Stratum
rate#
Standard
error
Stratum
gains
2015 NSW 125 326 4,570,690 0.007 0.001
Qld 58 249 2,415,588 0.010 0.002
SA 30 43 929,641 0.006 0.002
Tas 7 15 396,085 0.005 0.004
Vic 101 304 3,651,078 0.008 0.001
WA 19 130 1,423,498 0.009 0.002
Other 9 276 682,820 0.037 0.003 205
# per 100 bed days
Boxplot of Rates by State
Variation between HCOs
In 2015, the potential gains totalled 713 fewer inpatient falls resulting in a fracture or closed head
injury, corresponding to a reduction by approximately one-half.
Hospital-Wide, version 12
Australasian Clinical Indicator Report 2008–2015 Page 10
© ACHS. This work is copyright. Requests and inquiries concerning reproduction and rights should be addressed to [email protected]
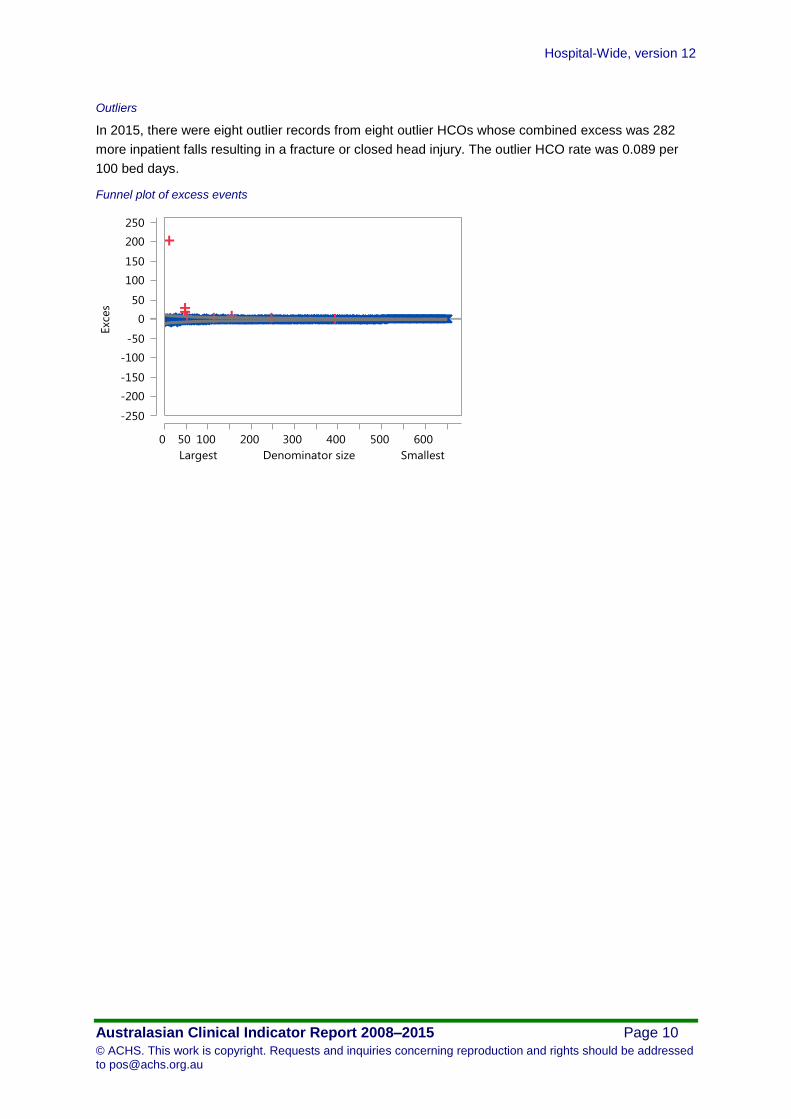
Outliers
In 2015, there were eight outlier records from eight outlier HCOs whose combined excess was 282
more inpatient falls resulting in a fracture or closed head injury. The outlier HCO rate was 0.089 per
100 bed days.
Funnel plot of excess events
Hospital-Wide, version 12
Australasian Clinical Indicator Report 2008–2015 Page 11
© ACHS. This work is copyright. Requests and inquiries concerning reproduction and rights should be addressed to [email protected]
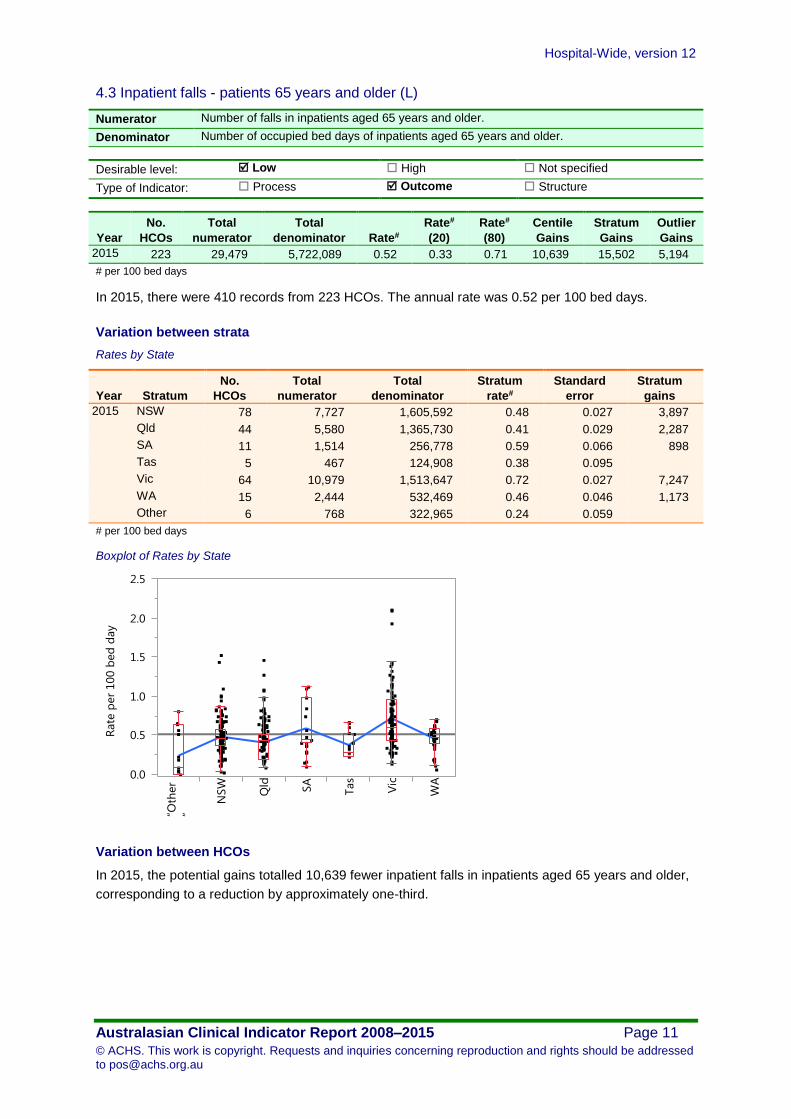
4.3 Inpatient falls - patients 65 years and older (L)
Numerator Number of falls in inpatients aged 65 years and older.
Denominator Number of occupied bed days of inpatients aged 65 years and older.
Desirable level: Low High Not specified
Type of Indicator: Process Outcome Structure
Year
No.
HCOs
Total
numerator
Total
denominator Rate#
Rate#
(20)
Rate#
(80)
Centile
Gains
Stratum
Gains
Outlier
Gains
2015 223 29,479 5,722,089 0.52 0.33 0.71 10,639 15,502 5,194
# per 100 bed days
In 2015, there were 410 records from 223 HCOs. The annual rate was 0.52 per 100 bed days.
Variation between strata
Rates by State
Year Stratum
No.
HCOs
Total
numerator
Total
denominator
Stratum
rate#
Standard
error
Stratum
gains
2015 NSW 78 7,727 1,605,592 0.48 0.027 3,897
Qld 44 5,580 1,365,730 0.41 0.029 2,287
SA 11 1,514 256,778 0.59 0.066 898
Tas 5 467 124,908 0.38 0.095
Vic 64 10,979 1,513,647 0.72 0.027 7,247
WA 15 2,444 532,469 0.46 0.046 1,173
Other 6 768 322,965 0.24 0.059
# per 100 bed days
Boxplot of Rates by State
Variation between HCOs
In 2015, the potential gains totalled 10,639 fewer inpatient falls in inpatients aged 65 years and older,
corresponding to a reduction by approximately one-third.
Hospital-Wide, version 12
Australasian Clinical Indicator Report 2008–2015 Page 12
© ACHS. This work is copyright. Requests and inquiries concerning reproduction and rights should be addressed to [email protected]
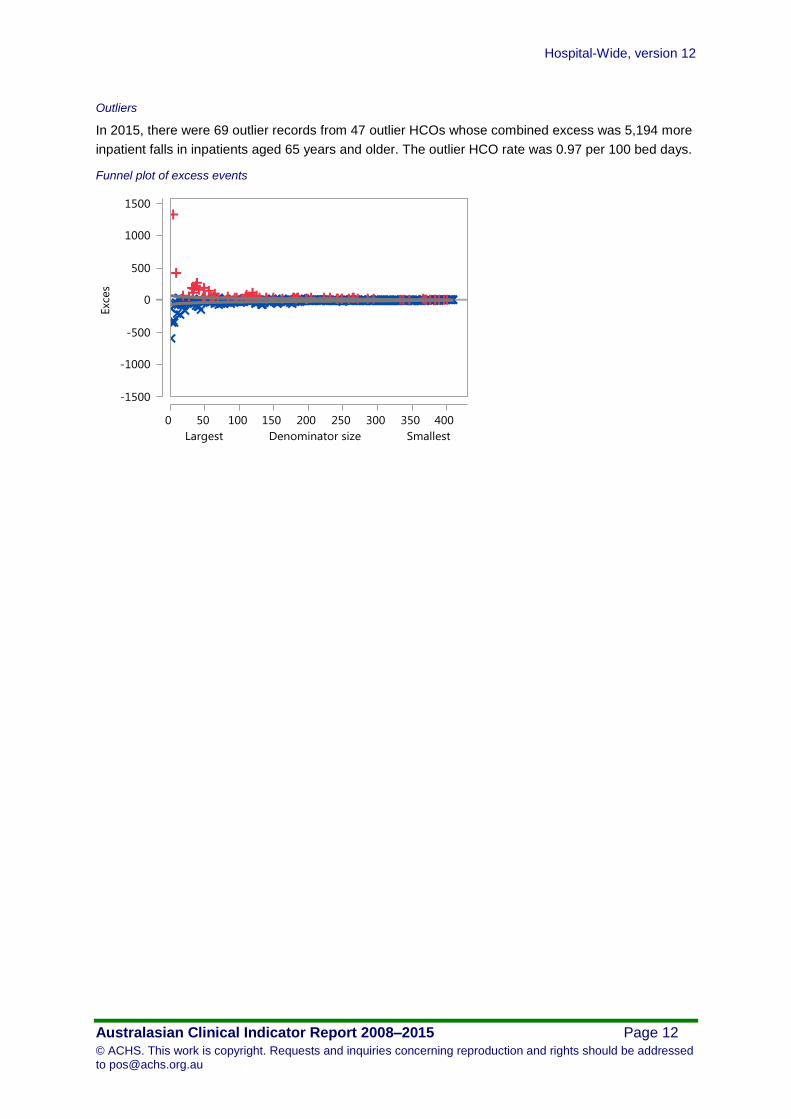
Outliers
In 2015, there were 69 outlier records from 47 outlier HCOs whose combined excess was 5,194 more
inpatient falls in inpatients aged 65 years and older. The outlier HCO rate was 0.97 per 100 bed days.
Funnel plot of excess events

Hospital-Wide, version 12
Australasian Clinical Indicator Report 2008–2015 Page 13
© ACHS. This work is copyright. Requests and inquiries concerning reproduction and rights should be addressed to [email protected]
Patient deaths
5.1 Patient deaths addressed within a clinical audit process (H)
Rationale
Although death can be the expected outcome from progression of all illness or disease, it can also be
the ultimate adverse event associated with or resulting from health care delivery. It is appropriate for
patient deaths occurring within a healthcare organisation to be analysed through clinical audit and
review processes to facilitate identification of any issues in patient care and the introduction of any
necessary improvements in safety.
Numerator Number of patient deaths addressed within a clinical audit process.
Denominator Number of patient deaths.
Desirable level: Low High Not specified
Type of Indicator: Process Outcome Structure
Year
No.
HCOs
Total
numerator
Total
denominator Rate#
Rate#
(20)
Rate#
(80)
Centile
Gains
Stratum
Gains
Outlier
Gains
2008 162 15,220 16,737 90.9 95.9 99.9 1,497 671 1,118
2009 195 17,557 18,776 93.5 98.4 99.9 1,204 657 919
2010 196 17,304 18,291 94.6 98.4 99.9 969 335 721
2011 201 19,077 20,091 95.0 97.1 99.9 989 646
2012 186 18,169 18,861 96.3 98.1 99.9 675 173 496
2013 176 16,988 17,518 97.0 98.5 99.9 515 394
2014 161 17,186 18,662 92.1 98.1 99.9 1,459 1,073
2015 192 19,201 20,086 95.6 98.4 99.9 869 678
# per 100 deaths
In 2015, there were 324 records from 192 HCOs. The annual rate was 95.6 per 100 deaths.
Trends
The fitted rate improved from 93.0 to 95.6, a change of 2.7 per 100 deaths. This trend was also
significant after allowing for the changing composition of HCOs contributing over the period. The rate
change was 2.6 per 100 deaths.
Trend plot of rates and centiles by year
Fitted rate
20th centile rate
80th centile rate
Aggregate rate x
A High rate is desirable
Period average rate

Hospital-Wide, version 12
Australasian Clinical Indicator Report 2008–2015 Page 14
© ACHS. This work is copyright. Requests and inquiries concerning reproduction and rights should be addressed to [email protected]
Variation between strata
There were no significant stratum differences in 2014 and 2015.
Variation between HCOs
There was relatively little variation between HCOs and so the potential gains were small in 2015.
Outliers
In 2015, there were 22 outlier records from 18 outlier HCOs whose combined excess was 678 fewer
patient deaths addressed within a clinical audit process. The outlier HCO rate was 64.3 per 100
deaths.
Funnel plot of excess events

Hospital-Wide, version 12
Australasian Clinical Indicator Report 2008–2015 Page 15
© ACHS. This work is copyright. Requests and inquiries concerning reproduction and rights should be addressed to [email protected]
5.2 Deaths in adult patients who do not have a NFR order (L)
Numerator Number of deaths in adult patients who DO NOT have a not for resuscitation (NFR) order at
the time of death.
Denominator Number of adult hospital admissions.
Desirable level: Low High Not specified
Type of Indicator: Process Outcome Structure
Year
No.
HCOs
Total
numerator
Total
denominator Rate#
Rate#
(20)
Rate#
(80)
Centile
Gains
Stratum
Gains
Outlier
Gains
2015 65 1,145 784,447 0.15 0.020 0.27 985 469
# per 100 patients
In 2015, there were 96 records from 65 HCOs. The annual rate was 0.15 per 100 patients.
Variation between strata
There were no significant stratum differences in 2015.
Variation between HCOs
In 2015, the potential gains totalled 985 fewer deaths in adult patients who do not have a not for
resuscitation order, corresponding to a reduction by approximately four-fifths.
Outliers
In 2015, there were 14 outlier records from 12 outlier HCOs whose combined excess was 469 more
deaths in adult patients who do not have a not for resuscitation order. The outlier HCO rate was 0.66
per 100 patients.
Funnel plot of excess events

Hospital-Wide, version 12
Australasian Clinical Indicator Report 2008–2015 Page 16
© ACHS. This work is copyright. Requests and inquiries concerning reproduction and rights should be addressed to [email protected]
5.3 Adult deaths (L)
Numerator Number of adult deaths in all patients.
Denominator Number of adult hospital admissions.
Desirable level: Low High Not specified
Type of Indicator: Process Outcome Structure
Year
No.
HCOs
Total
numerator
Total
denominator Rate#
Rate#
(20)
Rate#
(80)
Centile
Gains
Stratum
Gains
Outlier
Gains
2015 71 9,104 914,036 1.00 0.31 1.67 6,246 3,371 1,935
# per 100 patients
In 2015, there were 102 records from 71 HCOs. The annual rate was 1.00 per 100 patients.
Variation between strata
Rates by Public / Private
Year Stratum
No.
HCOs
Total
numerator
Total
denominator
Stratum
rate#
Standard
error
Stratum
gains
2015 Private 38 2,027 325,370 0.63 0.13
Public 33 7,077 588,666 1.20 0.098 3,371
# per 100 patients
Boxplot of Rates by Public / Private
Variation between HCOs
In 2015, the potential gains totalled 6,246 fewer adult deaths, corresponding to a reduction by
approximately two-thirds.
Outliers
In 2015, there were 28 outlier records from 20 outlier HCOs whose combined excess was 1,935 more
adult deaths. The outlier HCO rate was 1.8 per 100 patients.

Hospital-Wide, version 12
Australasian Clinical Indicator Report 2008–2015 Page 17
© ACHS. This work is copyright. Requests and inquiries concerning reproduction and rights should be addressed to [email protected]
Funnel plot of excess events

Hospital-Wide, version 12
Australasian Clinical Indicator Report 2008–2015 Page 18
© ACHS. This work is copyright. Requests and inquiries concerning reproduction and rights should be addressed to [email protected]
5.4 Coronary artery graft surgery (CAGS) – death (L)
Numerator Number of patients who die in the same admission as having CAGS.
Denominator Number of patients having CAGS.
Desirable level: Low High Not specified
Type of Indicator: Process Outcome Structure
Year
No.
HCOs
Total
numerator
Total
denominator Rate#
Rate#
(20)
Rate#
(80)
Centile
Gains
Stratum
Gains
Outlier
Gains
2008 35 160 8,570 1.87 1.62 2.07 21 14
2009 35 141 8,159 1.73 1.58 1.90 12
2010 36 154 9,007 1.71 1.65 1.75 6 3
2011 34 93 6,603 1.41 1.23 1.52 12 6
2012 31 85 5,999 1.42 1.42 1.42
2013 29 80 6,062 1.32 1.18 1.49 8
2014 28 68 6,156 1.10 0.98 1.33 8
2015 30 65 5,057 1.29 1.28 1.28
# per 100 patients
In 2015, there were 50 records from 30 HCOs. The annual rate was 1.29 per 100 patients.
Trends
The fitted rate improved from 1.9 to 1.1, a change of 0.73 per 100 patients. This trend was also
significant after allowing for the changing composition of HCOs contributing over the period. The rate
change was 0.68 per 100 patients.
Trend plot of rates and centiles by year
Variation between strata
There were no significant stratum differences in 2014 and 2015.
Variation between HCOs
There were no potential gains in 2015.
Outliers
There were no outlier HCOs in 2015.
A Low rate is desirable
80th centile rate
20th centile rate
Fitted rate
Aggregate rate x
Period average rate

Hospital-Wide, version 12
Australasian Clinical Indicator Report 2008–2015 Page 19
© ACHS. This work is copyright. Requests and inquiries concerning reproduction and rights should be addressed to [email protected]
5.5 Elective coronary artery graft surgery – death (L)
Numerator Number of elective patients who die in the same admission as having CAGS.
Denominator Number of patients having CAGS as an elective procedure.
Desirable level: Low High Not specified
Type of Indicator: Process Outcome Structure
Year
No.
HCOs
Total
numerator
Total
denominator Rate#
Rate#
(20)
Rate#
(80)
Centile
Gains
Stratum
Gains
Outlier
Gains
2008 26 68 4,958 1.37 1.22 1.44 8
2009 27 58 4,470 1.30 1.24 1.39 3
2010 24 57 4,296 1.33 1.32 1.33
2011 22 36 3,149 1.14 1.14 1.14
2012 20 31 2,891 1.07 0.95 1.16 4 2
2013 17 35 2,561 1.37 1.36 1.37
2014 16 22 2,501 0.88 1.13 1.13
2015 17 29 1,957 1.48 1.21 1.73 5
# per 100 patients
In 2015, there were 25 records from 17 HCOs. The annual rate was 1.48 per 100 patients.
Trends
There was no significant trend in the fitted rate.
Trend plot of rates and centiles by year
Variation between strata
There were no significant stratum differences in 2014 and 2015.
Variation between HCOs
In 2015, the potential gains totalled five fewer elective patients who die in the same admission as
having CAGS, corresponding to a reduction by approximately one-tenth.
Outliers
There were no outlier HCOs in 2015.
A Low rate is desirable
80th centile rate
20th centile rate
Fitted rate
Aggregate rate x
Period average rate

Hospital-Wide, version 12
Australasian Clinical Indicator Report 2008–2015 Page 20
© ACHS. This work is copyright. Requests and inquiries concerning reproduction and rights should be addressed to [email protected]
5.6 Coronary artery graft surgery patients aged 71 years or older – death (L)
Numerator Number of patients aged 71 years or older who die in the same admission as having CAGS.
Denominator Number of patients aged 71 years or older having CAGS performed.
Desirable level: Low High Not specified
Type of Indicator: Process Outcome Structure
Year
No.
HCOs
Total
numerator
Total
denominator Rate#
Rate#
(20)
Rate#
(80)
Centile
Gains
Stratum
Gains
Outlier
Gains
2008 31 83 3,227 2.57 2.08 3.24 16
2009 28 75 3,105 2.42 2.04 2.96 12
2010 29 94 3,154 2.98 2.96 2.97 1
2011 26 42 2,215 1.90 1.89 1.90
2012 22 49 1,949 2.51 2.50 2.51
2013 21 42 1,860 2.26 2.26 2.26
2014 19 29 1,655 1.75 0.98 1.99 13 5 3
2015 20 31 1,225 2.53 2.54 2.54
# per 100 patients
In 2015, there were 31 records from 20 HCOs. The annual rate was 2.53 per 100 patients.
Trends
There was no significant trend in the fitted rate.
Trend plot of rates and centiles by year
Variation between strata
There were no significant stratum differences in 2014 and 2015.
Variation between HCOs
There were no potential gains in 2015.
Outliers
There were no outlier HCOs in 2015.
A Low rate is desirable
80th centile rate
20th centile rate
Fitted rate
Aggregate rate x
Period average rate
Hospital-Wide, version 12
Australasian Clinical Indicator Report 2008–2015 Page 21
© ACHS. This work is copyright. Requests and inquiries concerning reproduction and rights should be addressed to [email protected]
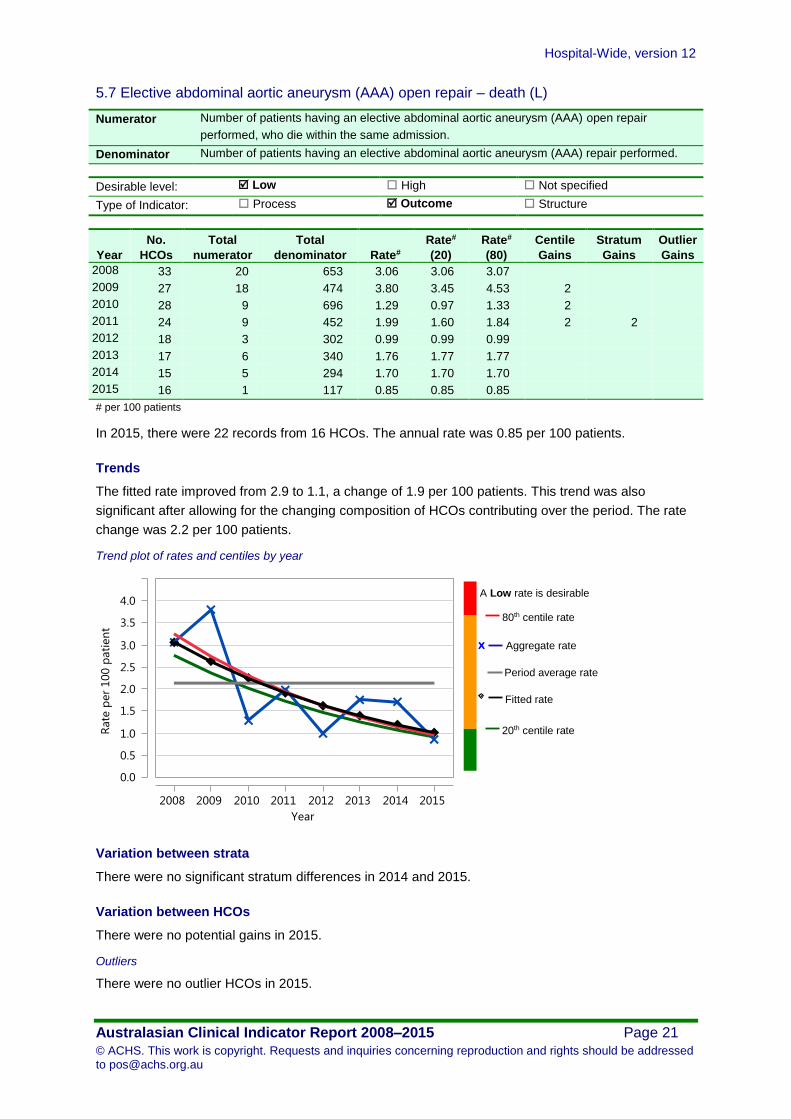
5.7 Elective abdominal aortic aneurysm (AAA) open repair – death (L)
Numerator Number of patients having an elective abdominal aortic aneurysm (AAA) open repair
performed, who die within the same admission.
Denominator Number of patients having an elective abdominal aortic aneurysm (AAA) repair performed.
Desirable level: Low High Not specified
Type of Indicator: Process Outcome Structure
Year
No.
HCOs
Total
numerator
Total
denominator Rate#
Rate#
(20)
Rate#
(80)
Centile
Gains
Stratum
Gains
Outlier
Gains
2008 33 20 653 3.06 3.06 3.07
2009 27 18 474 3.80 3.45 4.53 2
2010 28 9 696 1.29 0.97 1.33 2
2011 24 9 452 1.99 1.60 1.84 2 2
2012 18 3 302 0.99 0.99 0.99
2013 17 6 340 1.76 1.77 1.77
2014 15 5 294 1.70 1.70 1.70
2015 16 1 117 0.85 0.85 0.85
# per 100 patients
In 2015, there were 22 records from 16 HCOs. The annual rate was 0.85 per 100 patients.
Trends
The fitted rate improved from 2.9 to 1.1, a change of 1.9 per 100 patients. This trend was also
significant after allowing for the changing composition of HCOs contributing over the period. The rate
change was 2.2 per 100 patients.
Trend plot of rates and centiles by year
Variation between strata
There were no significant stratum differences in 2014 and 2015.
Variation between HCOs
There were no potential gains in 2015.
Outliers
There were no outlier HCOs in 2015.
A Low rate is desirable
80th centile rate
20th centile rate
Fitted rate
Aggregate rate x
Period average rate

Hospital-Wide, version 12
Australasian Clinical Indicator Report 2008–2015 Page 22
© ACHS. This work is copyright. Requests and inquiries concerning reproduction and rights should be addressed to [email protected]
Blood transfusion
6.1 Significant adverse blood transfusion events (L)
Rationale
In certain clinical circumstances, blood component therapy (the administration of components derived
from human blood) can save lives, restore normal life expectancy and improve quality of life.
However, it is increasingly clear that such therapy has limitations, and that the decision to transfuse
must be made with great care.
Numerator Number of significant adverse transfusion events related to a blood transfusion episode.
Denominator Number of transfusion episodes.
Desirable level: Low High Not specified
Type of Indicator: Process Outcome Structure
Year
No.
HCOs
Total
numerator
Total
denominator Rate#
Rate#
(20)
Rate#
(80)
Centile
Gains
Stratum
Gains
Outlier
Gains
2008 103 175 61,758 0.28 0.21 0.33 44 47 31
2009 122 187 73,940 0.25 0.13 0.35 93 80 48
2010 134 174 69,363 0.25 0.094 0.29 109 34
2011 146 187 80,966 0.23 0.093 0.32 112 47
2012 152 123 70,771 0.17 0.11 0.18 43 34 8
2013 146 136 70,276 0.19 0.12 0.18 52 70 14
2014 179 169 93,471 0.18 0.075 0.23 99 33
2015 183 147 95,433 0.15 0.10 0.15 48 64 12
# per 100 transfusions
In 2015, there were 324 records from 183 HCOs. The annual rate was 0.15 per 100 transfusions.
Trends
The fitted rate improved from 0.28 to 0.16, a change of 0.12 per 100 transfusions. This trend was also
significant after allowing for the changing composition of HCOs contributing over the period. The rate
change was 0.13 per 100 transfusions.
Trend plot of rates and centiles by year
A Low rate is desirable
80th centile rate
20th centile rate
Fitted rate
Aggregate rate x
Period average rate
Hospital-Wide, version 12
Australasian Clinical Indicator Report 2008–2015 Page 23
© ACHS. This work is copyright. Requests and inquiries concerning reproduction and rights should be addressed to [email protected]
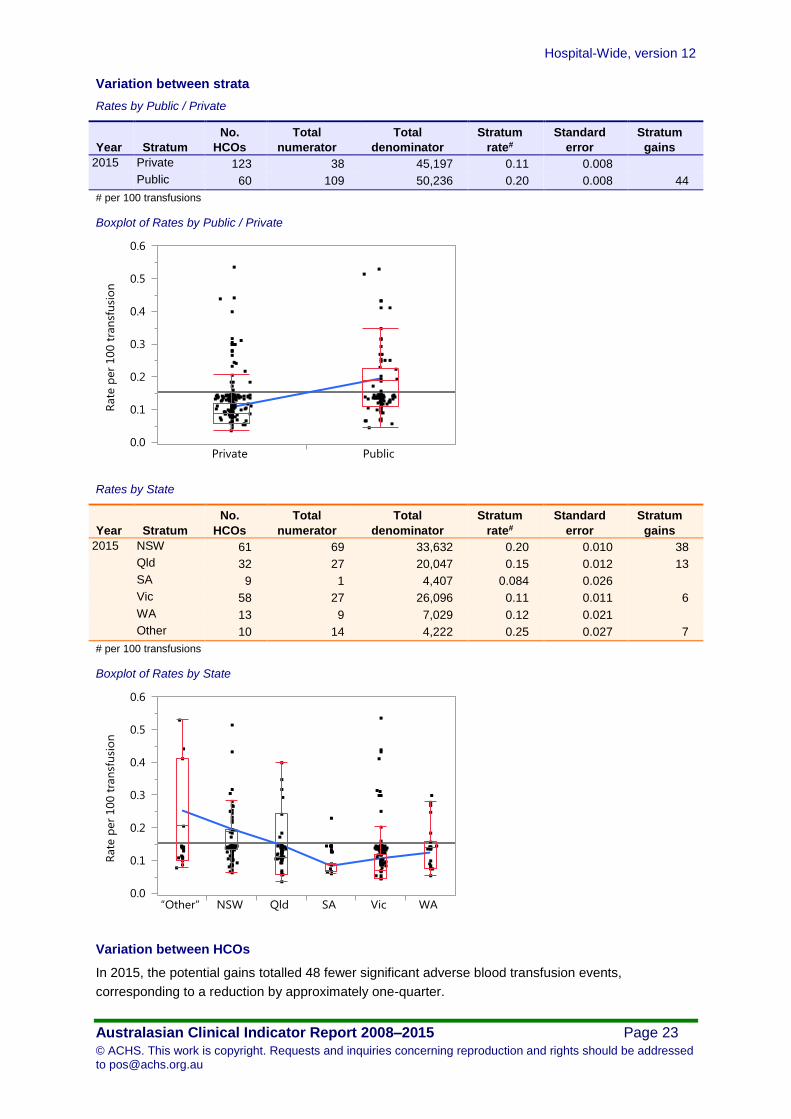
Variation between strata
Rates by Public / Private
Year Stratum
No.
HCOs
Total
numerator
Total
denominator
Stratum
rate#
Standard
error
Stratum
gains
2015 Private 123 38 45,197 0.11 0.008
Public 60 109 50,236 0.20 0.008 44
# per 100 transfusions
Boxplot of Rates by Public / Private
Rates by State
Year Stratum
No.
HCOs
Total
numerator
Total
denominator
Stratum
rate#
Standard
error
Stratum
gains
2015 NSW 61 69 33,632 0.20 0.010 38
Qld 32 27 20,047 0.15 0.012 13
SA 9 1 4,407 0.084 0.026
Vic 58 27 26,096 0.11 0.011 6
WA 13 9 7,029 0.12 0.021
Other 10 14 4,222 0.25 0.027 7
# per 100 transfusions
Boxplot of Rates by State
Variation between HCOs
In 2015, the potential gains totalled 48 fewer significant adverse blood transfusion events,
corresponding to a reduction by approximately one-quarter.
Hospital-Wide, version 12
Australasian Clinical Indicator Report 2008–2015 Page 24
© ACHS. This work is copyright. Requests and inquiries concerning reproduction and rights should be addressed to [email protected]
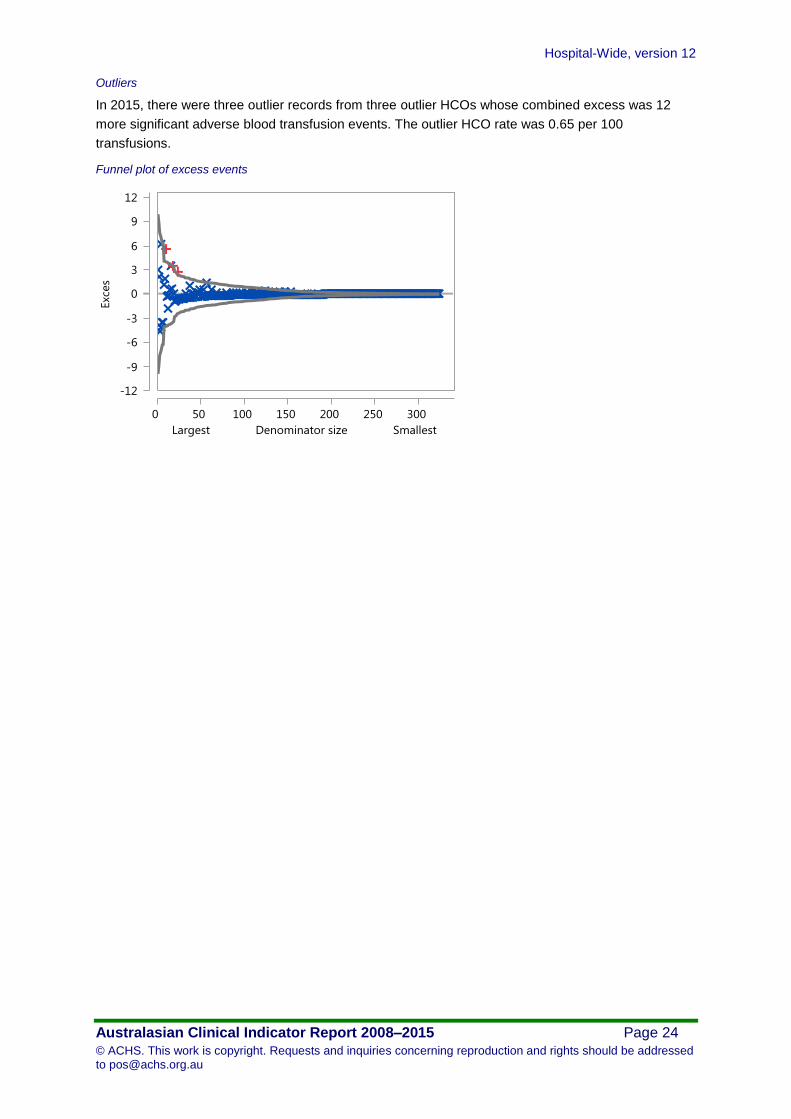
Outliers
In 2015, there were three outlier records from three outlier HCOs whose combined excess was 12
more significant adverse blood transfusion events. The outlier HCO rate was 0.65 per 100
transfusions.
Funnel plot of excess events
Hospital-Wide, version 12
Australasian Clinical Indicator Report 2008–2015 Page 25
© ACHS. This work is copyright. Requests and inquiries concerning reproduction and rights should be addressed to [email protected]
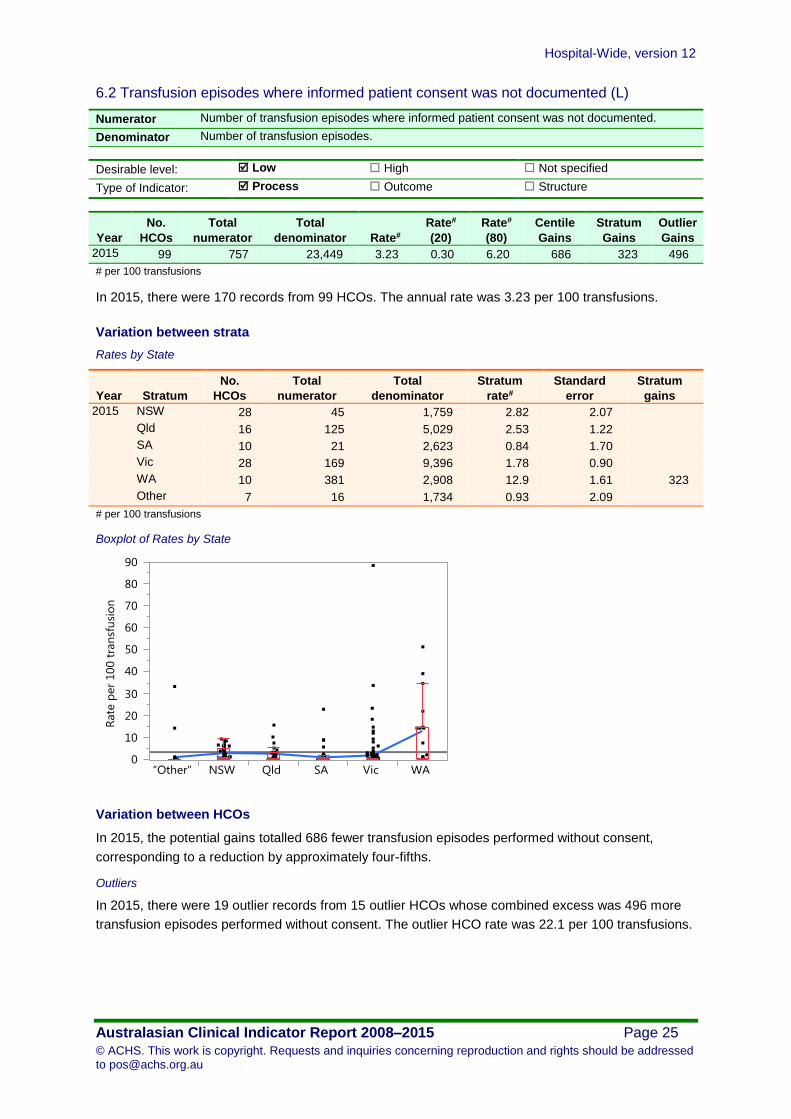
6.2 Transfusion episodes where informed patient consent was not documented (L)
Numerator Number of transfusion episodes where informed patient consent was not documented.
Denominator Number of transfusion episodes.
Desirable level: Low High Not specified
Type of Indicator: Process Outcome Structure
Year
No.
HCOs
Total
numerator
Total
denominator Rate#
Rate#
(20)
Rate#
(80)
Centile
Gains
Stratum
Gains
Outlier
Gains
2015 99 757 23,449 3.23 0.30 6.20 686 323 496
# per 100 transfusions
In 2015, there were 170 records from 99 HCOs. The annual rate was 3.23 per 100 transfusions.
Variation between strata
Rates by State
Year Stratum
No.
HCOs
Total
numerator
Total
denominator
Stratum
rate#
Standard
error
Stratum
gains
2015 NSW 28 45 1,759 2.82 2.07
Qld 16 125 5,029 2.53 1.22
SA 10 21 2,623 0.84 1.70
Vic 28 169 9,396 1.78 0.90
WA 10 381 2,908 12.9 1.61 323
Other 7 16 1,734 0.93 2.09
# per 100 transfusions
Boxplot of Rates by State
Variation between HCOs
In 2015, the potential gains totalled 686 fewer transfusion episodes performed without consent,
corresponding to a reduction by approximately four-fifths.
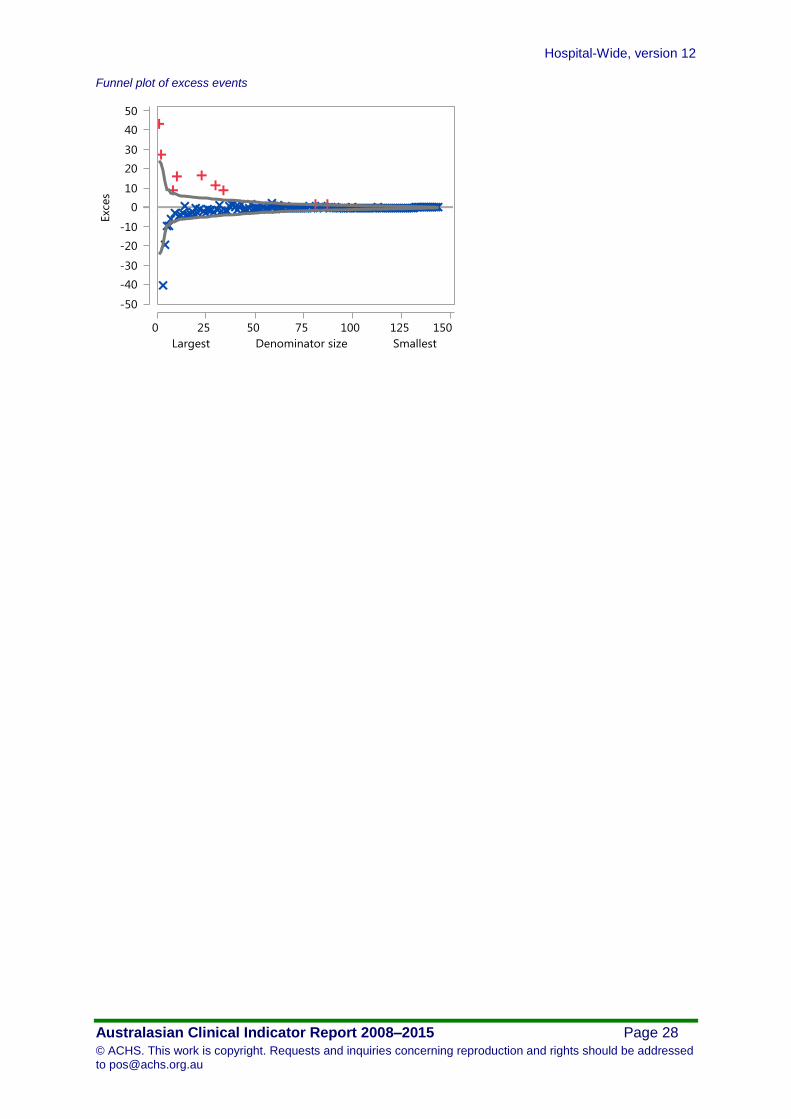
Outliers
In 2015, there were 19 outlier records from 15 outlier HCOs whose combined excess was 496 more
transfusion episodes performed without consent. The outlier HCO rate was 22.1 per 100 transfusions.

Hospital-Wide, version 12
Australasian Clinical Indicator Report 2008–2015 Page 26
© ACHS. This work is copyright. Requests and inquiries concerning reproduction and rights should be addressed to [email protected]
Funnel plot of excess events
Hospital-Wide, version 12
Australasian Clinical Indicator Report 2008–2015 Page 27
© ACHS. This work is copyright. Requests and inquiries concerning reproduction and rights should be addressed to [email protected]
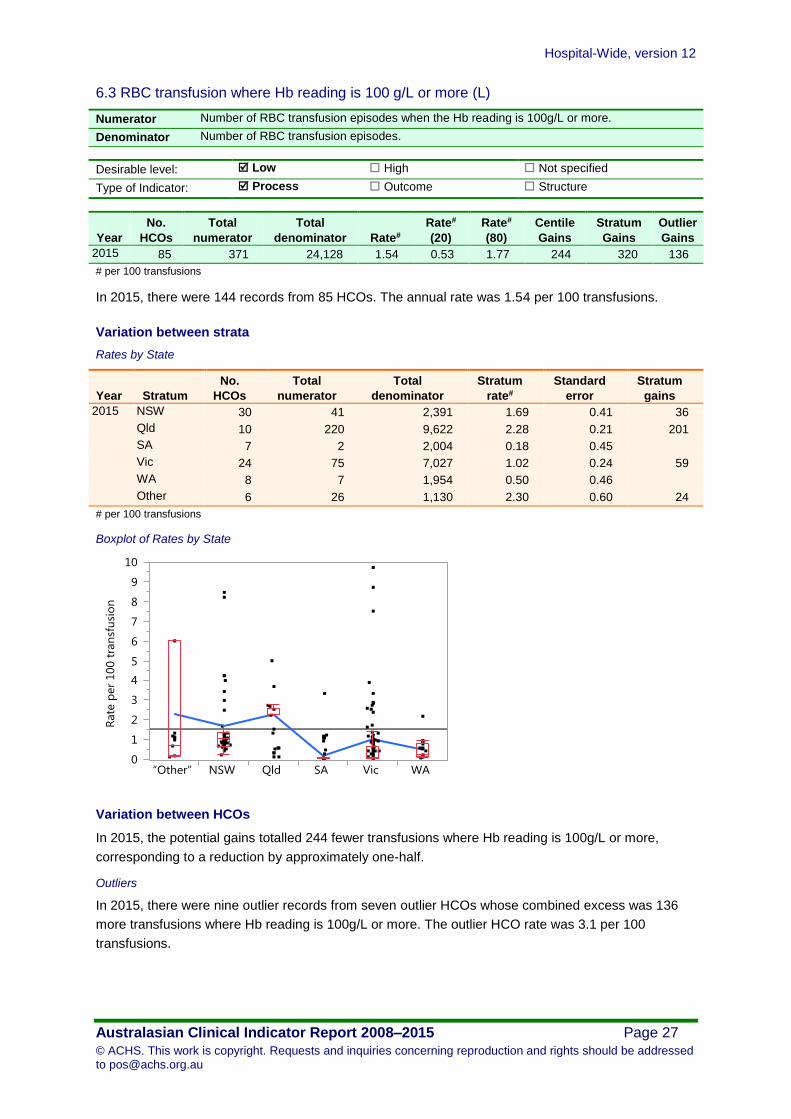
6.3 RBC transfusion where Hb reading is 100 g/L or more (L)
Numerator Number of RBC transfusion episodes when the Hb reading is 100g/L or more.
Denominator Number of RBC transfusion episodes.
Desirable level: Low High Not specified
Type of Indicator: Process Outcome Structure
Year
No.
HCOs
Total
numerator
Total
denominator Rate#
Rate#
(20)
Rate#
(80)
Centile
Gains
Stratum
Gains
Outlier
Gains
2015 85 371 24,128 1.54 0.53 1.77 244 320 136
# per 100 transfusions
In 2015, there were 144 records from 85 HCOs. The annual rate was 1.54 per 100 transfusions.
Variation between strata
Rates by State
Year Stratum
No.
HCOs
Total
numerator
Total
denominator
Stratum
rate#
Standard
error
Stratum
gains
2015 NSW 30 41 2,391 1.69 0.41 36
Qld 10 220 9,622 2.28 0.21 201
SA 7 2 2,004 0.18 0.45
Vic 24 75 7,027 1.02 0.24 59
WA 8 7 1,954 0.50 0.46
Other 6 26 1,130 2.30 0.60 24
# per 100 transfusions
Boxplot of Rates by State
Variation between HCOs
In 2015, the potential gains totalled 244 fewer transfusions where Hb reading is 100g/L or more,
corresponding to a reduction by approximately one-half.
Outliers
In 2015, there were nine outlier records from seven outlier HCOs whose combined excess was 136
more transfusions where Hb reading is 100g/L or more. The outlier HCO rate was 3.1 per 100
transfusions.
Hospital-Wide, version 12
Australasian Clinical Indicator Report 2008–2015 Page 28
© ACHS. This work is copyright. Requests and inquiries concerning reproduction and rights should be addressed to [email protected]
Funnel plot of excess events

Hospital-Wide, version 12
Australasian Clinical Indicator Report 2008–2015 Page 29
© ACHS. This work is copyright. Requests and inquiries concerning reproduction and rights should be addressed to [email protected]
Thromboprophylaxis
7.1 VTE prophylaxis administered to high risk medical patients (N)
Rationale
This indicator has been included as an index of utilisation of evidence-based guidelines for
thromboprophylaxis in high risk medical patients.
Numerator Number of high-risk medical patients admitted who receive VTE prophylaxis.
Denominator Number of high-risk medical patients admitted.
Desirable level: Low High Not specified
Type of Indicator: Process Outcome Structure
Year
No.
HCOs
Total
numerator
Total
denominator Rate#
Rate#
(20)
Rate#
(80)
*Centile
Gains
*Stratum
Gains
*Outlier
Gains
2015 10 2,763 4,953 55.8 50.9 99.6
# per 100 high-risk medical patients *Gains are not calculated when the desirable level is not specified.
In 2015, there were 16 records from 10 HCOs. The annual rate was 55.8 per 100 high-risk medical
patients.
Variation between strata
There were no significant stratum differences in 2015.
Variation between HCOs
Outliers
Since it has not been specified whether high or low rates are desirable, outlier HCOs are not reported.

Hospital-Wide, version 12
Australasian Clinical Indicator Report 2008–2015 Page 30
© ACHS. This work is copyright. Requests and inquiries concerning reproduction and rights should be addressed to [email protected]
Minimum standards for rapid response system (RRS) calls
8.1 Rapid response system calls to adult patients (N)
Rationale
Recognising and responding effectively to clinical deterioration within an acute health care facility.
Numerator Number of rapid response system calls to adult patients.
Denominator Number of adult hospital admissions.
Desirable level: Low High Not specified
Type of Indicator: Process Outcome Structure
Year
No.
HCOs
Total
numerator
Total
denominator Rate#
Rate#
(20)
Rate#
(80)
*Centile
Gains
*Stratum
Gains
*Outlier
Gains
2015 109 40,872 1,473,637 2.77 0.66 4.37
# per 100 admissions *Gains are not calculated when the desirable level is not specified.
In 2015, there were 175 records from 109 HCOs. The annual rate was 2.77 per 100 admissions.
Variation between strata
There were no significant stratum differences in 2015.
Variation between HCOs
Outliers
Since it has not been specified whether high or low rates are desirable, outlier HCOs are not reported.

Hospital-Wide, version 12
Australasian Clinical Indicator Report 2008–2015 Page 31
© ACHS. This work is copyright. Requests and inquiries concerning reproduction and rights should be addressed to [email protected]
8.2 Rapid response system calls to adult patients within 24 hours of admission (N)
Numerator Number of rapid response system calls to adult patients within 24 hours of admission to
hospital.
Denominator Number of adult hospital admissions.
Desirable level: Low High Not specified
Type of Indicator: Process Outcome Structure
Year
No.
HCOs
Total
numerator
Total
denominator Rate#
Rate#
(20)
Rate#
(80)
*Centile
Gains
*Stratum
Gains
*Outlier
Gains
2015 79 7,004 1,080,934 0.65 0.16 1.02
# per 100 admissions *Gains are not calculated when the desirable level is not specified.
In 2015, there were 124 records from 79 HCOs. The annual rate was 0.65 per 100 admissions.
Variation between strata
There were no significant stratum differences in 2015.
Variation between HCOs
Outliers
Since it has not been specified whether high or low rates are desirable, outlier HCOs are not reported.
Hospital-Wide, version 12
Australasian Clinical Indicator Report 2008–2015 Page 32
© ACHS. This work is copyright. Requests and inquiries concerning reproduction and rights should be addressed to [email protected]
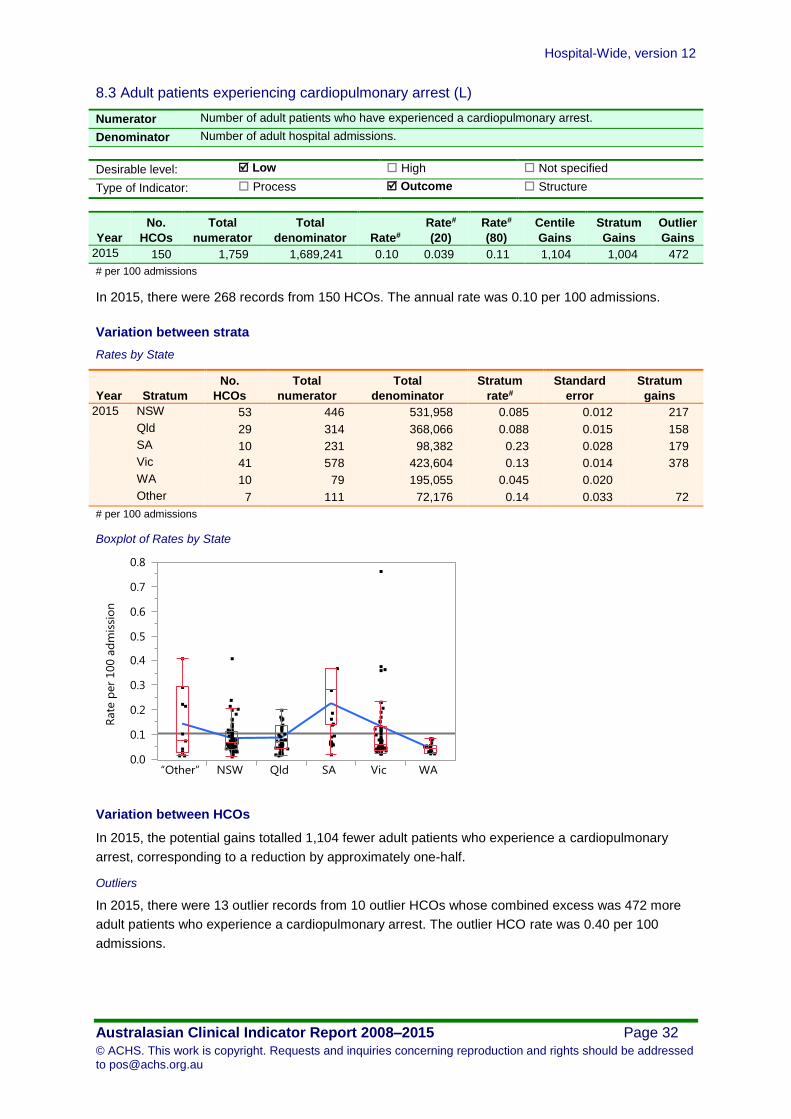
8.3 Adult patients experiencing cardiopulmonary arrest (L)
Numerator Number of adult patients who have experienced a cardiopulmonary arrest.
Denominator Number of adult hospital admissions.
Desirable level: Low High Not specified
Type of Indicator: Process Outcome Structure
Year
No.
HCOs
Total
numerator
Total
denominator Rate#
Rate#
(20)
Rate#
(80)
Centile
Gains
Stratum
Gains
Outlier
Gains
2015 150 1,759 1,689,241 0.10 0.039 0.11 1,104 1,004 472
# per 100 admissions
In 2015, there were 268 records from 150 HCOs. The annual rate was 0.10 per 100 admissions.
Variation between strata
Rates by State
Year Stratum
No.
HCOs
Total
numerator
Total
denominator
Stratum
rate#
Standard
error
Stratum
gains
2015 NSW 53 446 531,958 0.085 0.012 217
Qld 29 314 368,066 0.088 0.015 158
SA 10 231 98,382 0.23 0.028 179
Vic 41 578 423,604 0.13 0.014 378
WA 10 79 195,055 0.045 0.020
Other 7 111 72,176 0.14 0.033 72
# per 100 admissions
Boxplot of Rates by State
Variation between HCOs
In 2015, the potential gains totalled 1,104 fewer adult patients who experience a cardiopulmonary
arrest, corresponding to a reduction by approximately one-half.
Outliers
In 2015, there were 13 outlier records from 10 outlier HCOs whose combined excess was 472 more
adult patients who experience a cardiopulmonary arrest. The outlier HCO rate was 0.40 per 100
admissions.

Hospital-Wide, version 12
Australasian Clinical Indicator Report 2008–2015 Page 33
© ACHS. This work is copyright. Requests and inquiries concerning reproduction and rights should be addressed to [email protected]
Funnel plot of excess events
Hospital-Wide, version 12
Australasian Clinical Indicator Report 2008–2015 Page 34
© ACHS. This work is copyright. Requests and inquiries concerning reproduction and rights should be addressed to [email protected]
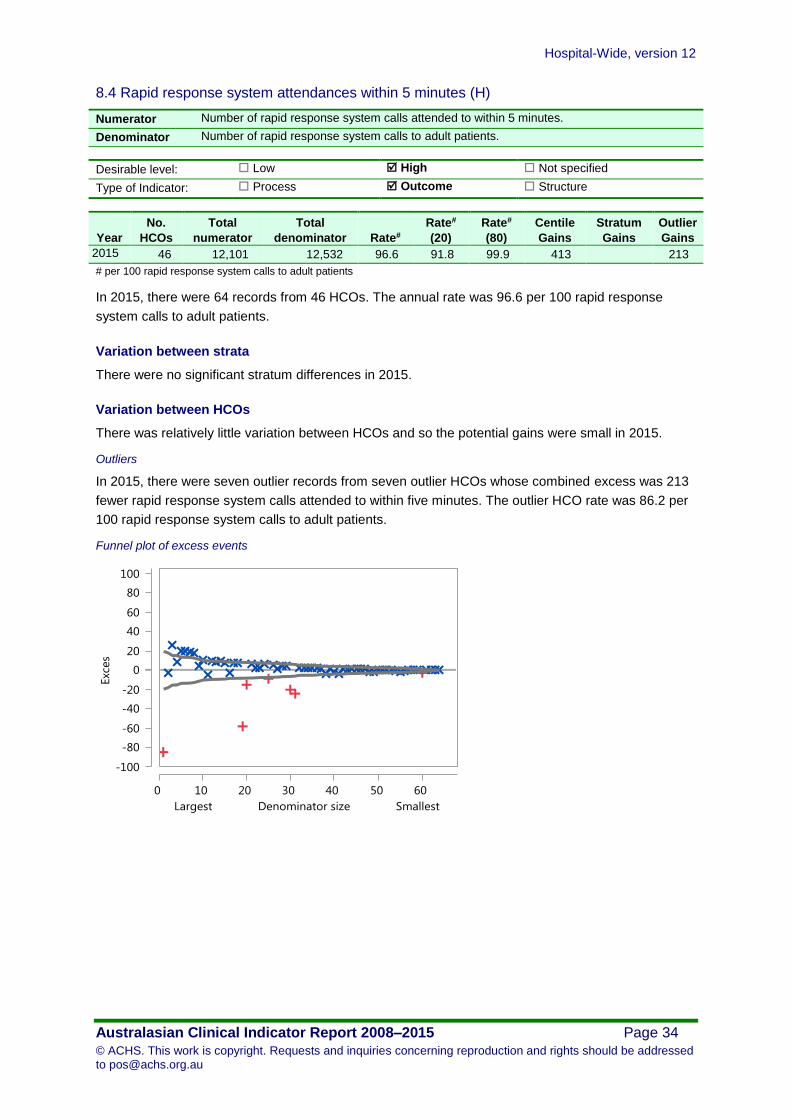
8.4 Rapid response system attendances within 5 minutes (H)
Numerator Number of rapid response system calls attended to within 5 minutes.
Denominator Number of rapid response system calls to adult patients.
Desirable level: Low High Not specified
Type of Indicator: Process Outcome Structure
Year
No.
HCOs
Total
numerator
Total
denominator Rate#
Rate#
(20)
Rate#
(80)
Centile
Gains
Stratum
Gains
Outlier
Gains
2015 46 12,101 12,532 96.6 91.8 99.9 413 213
# per 100 rapid response system calls to adult patients
In 2015, there were 64 records from 46 HCOs. The annual rate was 96.6 per 100 rapid response
system calls to adult patients.
Variation between strata
There were no significant stratum differences in 2015.
Variation between HCOs
There was relatively little variation between HCOs and so the potential gains were small in 2015.
Outliers
In 2015, there were seven outlier records from seven outlier HCOs whose combined excess was 213
fewer rapid response system calls attended to within five minutes. The outlier HCO rate was 86.2 per
100 rapid response system calls to adult patients.
Funnel plot of excess events

Hospital-Wide, version 12
Australasian Clinical Indicator Report 2008–2015 Page 35
© ACHS. This work is copyright. Requests and inquiries concerning reproduction and rights should be addressed to [email protected]
8.5 Adult deaths avoided by rapid response system calls (H)
Numerator Number of adult deaths avoided due to rapid response system calls.
Denominator Number of rapid response system calls to adult patients.
Desirable level: Low High Not specified
Type of Indicator: Process Outcome Structure
Year
No.
HCOs
Total
numerator
Total
denominator Rate#
Rate#
(20)
Rate#
(80)
Centile
Gains
Stratum
Gains
Outlier
Gains
2015 12 3,602 3,870 93.1 88.8 96.9 147 36
# per 100 rapid response system calls to adult patients
In 2015, there were 17 records from 12 HCOs. The annual rate was 93.1 per 100 rapid response
system calls to adult patients.
Variation between strata
There were no significant stratum differences in 2015.
Variation between HCOs
There was relatively little variation between HCOs and so the potential gains were small in 2015.
Outliers
In 2015, there were two outlier records from two outlier HCOs whose combined excess was 36 fewer
adult deaths avoided due to rapid response system calls. The outlier HCO rate was 87.2 per 100
rapid response system calls to adult patients.
Funnel plot of excess events

Hospital-Wide, version 12
Australasian Clinical Indicator Report 2008–2015 Page 36
© ACHS. This work is copyright. Requests and inquiries concerning reproduction and rights should be addressed to [email protected]
Surgery
9.1 Pre-operative acute appendicitis (children) - normal histology (L)
Rationale
Appendicectomy is a commonly performed operation in childhood, where good management should
achieve a low rate of negative (normal) histology. Laparoscopic cholecystectomy is associated with
an increased risk of injury to the extra hepatic biliary system. Tonsillectomy is a commonly performed
discretionary procedure with a low, but definite morbidity.
Numerator Number of children with a pre-operative diagnosis of acute appendicitis, who undergo
appendicectomy with normal histology.
Denominator Number of children with a pre-operative diagnosis of acute appendicitis who undergo
appendicectomy.
Desirable level: Low High Not specified
Type of Indicator: Process Outcome Structure
Year
No.
HCOs
Total
numerator
Total
denominator Rate#
Rate#
(20)
Rate#
(80)
Centile
Gains
Stratum
Gains
Outlier
Gains
2015 16 103 750 13.7 13.7 20.7 1
# per 100 children with a pre-operative diagnosis of acute appendicitis who undergo appendicectomy
In 2015, there were 26 records from 16 HCOs. The annual rate was 13.7 per 100 children with a pre-
operative diagnosis of acute appendicitis who undergo appendicectomy with normal histology.
Variation between strata
There were no significant stratum differences in 2015.
Variation between HCOs
There were no potential gains in 2015.
Outliers
There were no outlier HCOs in 2015.
Hospital-Wide, version 12
Australasian Clinical Indicator Report 2008–2015 Page 37
© ACHS. This work is copyright. Requests and inquiries concerning reproduction and rights should be addressed to [email protected]
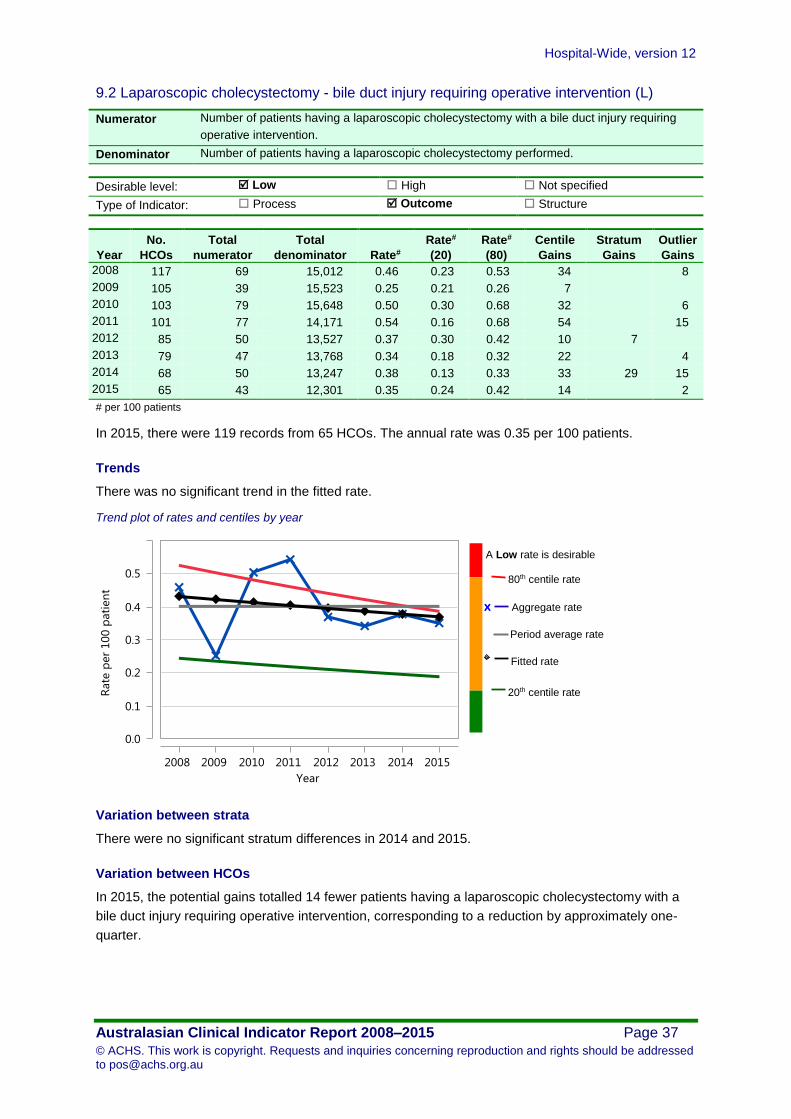
9.2 Laparoscopic cholecystectomy - bile duct injury requiring operative intervention (L)
Numerator Number of patients having a laparoscopic cholecystectomy with a bile duct injury requiring
operative intervention.
Denominator Number of patients having a laparoscopic cholecystectomy performed.
Desirable level: Low High Not specified
Type of Indicator: Process Outcome Structure
Year
No.
HCOs
Total
numerator
Total
denominator Rate#
Rate#
(20)
Rate#
(80)
Centile
Gains
Stratum
Gains
Outlier
Gains
2008 117 69 15,012 0.46 0.23 0.53 34 8
2009 105 39 15,523 0.25 0.21 0.26 7
2010 103 79 15,648 0.50 0.30 0.68 32 6
2011 101 77 14,171 0.54 0.16 0.68 54 15
2012 85 50 13,527 0.37 0.30 0.42 10 7
2013 79 47 13,768 0.34 0.18 0.32 22 4
2014 68 50 13,247 0.38 0.13 0.33 33 29 15
2015 65 43 12,301 0.35 0.24 0.42 14 2
# per 100 patients
In 2015, there were 119 records from 65 HCOs. The annual rate was 0.35 per 100 patients.
Trends
There was no significant trend in the fitted rate.
Trend plot of rates and centiles by year
Variation between strata
There were no significant stratum differences in 2014 and 2015.
Variation between HCOs
In 2015, the potential gains totalled 14 fewer patients having a laparoscopic cholecystectomy with a
bile duct injury requiring operative intervention, corresponding to a reduction by approximately one-
quarter.
A Low rate is desirable
80th centile rate
20th centile rate
Fitted rate
Aggregate rate x
Period average rate

Hospital-Wide, version 12
Australasian Clinical Indicator Report 2008–2015 Page 38
© ACHS. This work is copyright. Requests and inquiries concerning reproduction and rights should be addressed to [email protected]
Outliers
In 2015, there was one outlier record from one outlier HCO whose combined excess was two more
patients having a laparoscopic cholecystectomy with a bile duct injury requiring operative intervention.
The outlier HCO rate was 2.2 per 100 patients.

Hospital-Wide, version 12
Australasian Clinical Indicator Report 2008–2015 Page 39
© ACHS. This work is copyright. Requests and inquiries concerning reproduction and rights should be addressed to [email protected]
9.3 Tonsillectomy - significant reactionary haemorrhage (L)
Numerator Number of patients who have a significant reactionary haemorrhage following tonsillectomy.
Denominator Number of patients who have a tonsillectomy performed.
Desirable level: Low High Not specified
Type of Indicator: Process Outcome Structure
Year
No.
HCOs
Total
numerator
Total
denominator Rate#
Rate#
(20)
Rate#
(80)
Centile
Gains
Stratum
Gains
Outlier
Gains
2008 93 86 15,472 0.56 0.40 0.88 25 5
2009 87 74 16,091 0.46 0.39 0.63 12
2010 84 98 15,422 0.64 0.29 0.67 53 21
2011 85 94 14,473 0.65 0.31 0.91 49 13
2012 73 56 14,335 0.39 0.34 0.58 7
2013 64 57 13,449 0.42 0.34 0.58 11
2014 62 72 12,561 0.57 0.41 0.80 21 20 7
2015 56 70 11,284 0.62 0.38 0.83 27 14 6
# per 100 patients
In 2015, there were 100 records from 56 HCOs. The annual rate was 0.62 per 100 patients.
Trends
There was no significant trend in the fitted rate.
Trend plot of rates and centiles by year
A Low rate is desirable
80th centile rate
20th centile rate
Fitted rate
Aggregate rate x
Period average rate

Hospital-Wide, version 12
Australasian Clinical Indicator Report 2008–2015 Page 40
© ACHS. This work is copyright. Requests and inquiries concerning reproduction and rights should be addressed to [email protected]
Variation between strata
Rates by State
Year Stratum
No.
HCOs
Total
numerator
Total
denominator
Stratum
rate#
Standard
error
Stratum
gains
2015 NSW 13 11 3,099 0.46 0.10
Qld 10 3 1,341 0.49 0.16
SA 7 20 1,892 0.89 0.13 8
Vic 12 16 1,541 0.86 0.15 6
WA 7 11 2,443 0.47 0.12
Other 7 9 968 0.77 0.18
# per 100 patients
Boxplot of Rates by State
Variation between HCOs
In 2015, the potential gains totalled 27 fewer patients who have a significant reactionary haemorrhage
following tonsillectomy, corresponding to a reduction by approximately one-third.
Outliers
In 2015, there were two outlier records from two outlier HCOs whose combined excess was six more
patients who have a significant reactionary haemorrhage following tonsillectomy. The outlier HCO rate
was 5.7 per 100 patients.
Funnel plot of excess events

Hospital-Wide, version 12
Australasian Clinical Indicator Report 2008–2015 Page 41
© ACHS. This work is copyright. Requests and inquiries concerning reproduction and rights should be addressed to [email protected]
Characteristics of contributing HCOs
Public/ Private and Metropolitan/ Non-metro total denominators and number of HCOs by clinical indicator
All indicators Combined
Public % Private % Metropolitan % Non-metro % Total
Hospital-Wide Indicators Combined HCOs 292 56% 233 44% 283 54% 242 46% 525
Indicators by Topic
Hospital readmissions
Clinical Indicator Public % Private % Metropolitan % Non-metro % Total
1.1 Unplanned and unexpected readmissions within 28 days (L)
HCOs 88 31% 200 69% 182 63% 106 37% 288
Denominator 813,617 22% 2,834,416 78% 2,901,741 80% 746,292 20% 3,648,033
Return to the operating room
Clinical Indicator Public % Private % Metropolitan % Non-metro % Total
2.1 Unplanned return to the operating room during the same admission (L)
HCOs 49 22% 172 78% 158 71% 63 29% 221
Denominator 241,251 12% 1,761,132 88% 1,697,216 85% 305,167 15% 2,002,383
2.2 Reviewed cases following an unplanned return to the operating room (H)
HCOs 7 14% 44 86% 42 82% 9 18% 51
Denominator 129 11% 993 89% 907 81% 215 19% 1,122
Pressure injuries
Clinical Indicator Public % Private % Metropolitan % Non-metro % Total
3.1 Inpatients who develop 1 or more pressure injuries (L) HCOs 235 54% 197 46% 232 54% 200 46% 432
Denominator 6,559,569 53% 5,853,043 47% 9,880,196 80% 2,532,416 20% 12,412,612

Hospital-Wide, version 12
Australasian Clinical Indicator Report 2008–2015 Page 42
© ACHS. This work is copyright. Requests and inquiries concerning reproduction and rights should be addressed to [email protected]
Inpatient falls
Clinical Indicator Public % Private % Metropolitan % Non-metro % Total
4.1 Inpatient falls (L) HCOs 194 48% 214 52% 250 61% 158 39% 408
Denominator 8,376,320 55% 6,928,516 45% 12,341,062 81% 2,963,774 19% 15,304,836
4.2 Inpatient falls resulting in fracture or closed head injury (L)
HCOs 149 43% 200 57% 220 63% 129 37% 349
Denominator 7,082,081 50% 6,987,319 50% 11,321,425 80% 2,747,975 20% 14,069,400
4.3 Inpatient falls - patients 65 years and older (L) HCOs 101 45% 122 55% 145 65% 78 35% 223
Denominator 3,026,630 53% 2,695,459 47% 4,811,277 84% 910,812 16% 5,722,089
Patient deaths
Clinical Indicator Public % Private % Metropolitan % Non-metro % Total
5.1 Patient deaths addressed within a clinical audit process (H)
HCOs 69 36% 123 64% 128 67% 64 33% 192
Denominator 12,049 60% 8,037 40% 16,141 80% 3,945 20% 20,086
5.2 Deaths in adult patients who do not have a NFR order (L)
HCOs 34 52% 31 48% 36 55% 29 45% 65
Denominator 442,005 56% 342,442 44% 613,926 78% 170,521 22% 784,447
5.3 Adult deaths (L) HCOs 33 46% 38 54% 46 65% 25 35% 71
Denominator 588,666 64% 325,370 36% 752,117 82% 161,919 18% 914,036
5.4 Coronary artery graft surgery (CAGS) - death (L) HCOs 10 33% 20 67% 27 90% 3 10% 30
Denominator 2,168 43% 2,889 57% 4,701 93% 356 7% 5,057
5.5 Elective coronary artery graft surgery - death (L) HCOs 10 59% 7 41% 14 82% 3 18% 17
Denominator 1,373 70% 584 30% 1,726 88% 231 12% 1,957
5.6 Coronary artery graft surgery patients aged 71 years or older - death (L)
HCOs 10 50% 10 50% 17 85% 3 15% 20
Denominator 757 62% 468 38% 1,121 92% 104 8% 1,225
5.7 Elective abdominal aortic aneurysm (AAA) open repair - death (L)
HCOs 9 56% 7 44% 15 94% 1 6% 16
Denominator 96 82% 21 18% 115 98% 2 2% 117

Hospital-Wide, version 12
Australasian Clinical Indicator Report 2008–2015 Page 43
© ACHS. This work is copyright. Requests and inquiries concerning reproduction and rights should be addressed to [email protected]
Blood transfusion
Clinical Indicator Public % Private % Metropolitan % Non-metro % Total
6.1 Significant adverse blood transfusion events (L) HCOs 60 33% 123 67% 120 66% 63 34% 183
Denominator 50,236 53% 45,197 47% 87,381 92% 8,052 8% 95,433
6.2 Transfusion episodes where informed patient consent was not documented (L)
HCOs 47 47% 52 53% 52 53% 47 47% 99
Denominator 13,916 59% 9,533 41% 19,048 81% 4,401 19% 23,449
6.3 RBC transfusion where Hb reading is 100 g/L or more (L)
HCOs 40 47% 45 53% 46 54% 39 46% 85
Denominator 18,724 78% 5,404 22% 20,316 84% 3,812 16% 24,128
Thromboprophylaxis
Clinical Indicator Public % Private % Metropolitan % Non-metro % Total
7.1 VTE prophylaxis administered to high risk medical patients (N)
HCOs 6 60% 4 40% 6 60% 4 40% 10
Denominator 1,555 31% 3,398 69% 3,802 77% 1,151 23% 4,953
Minimum standards for rapid response system (RRS) calls
Clinical Indicator Public % Private % Metropolitan % Non-metro % Total
8.1 Rapid response system calls to adult patients (N) HCOs 53 49% 56 51% 79 72% 30 28% 109
Denominator 857,269 58% 616,368 42% 1,256,492 85% 217,145 15% 1,473,637
8.2 Rapid response system calls to adult patients within 24 hours of admission (N)
HCOs 30 38% 49 62% 65 82% 14 18% 79
Denominator 571,745 53% 509,189 47% 938,579 87% 142,355 13% 1,080,934
8.3 Adult patients experiencing cardiopulmonary arrest (L) HCOs 42 28% 108 72% 116 77% 34 23% 150
Denominator 786,863 47% 902,378 53% 1,433,168 85% 256,073 15% 1,689,241
8.4 Rapid response system attendances within 5 minutes (H) HCOs 19 41% 27 59% 37 80% 9 20% 46
Denominator 9,729 78% 2,803 22% 10,461 83% 2,071 17% 12,532
8.5 Adult deaths avoided by rapid response system calls (H) HCOs 10 83% 2 17% 4 33% 8 67% 12
Denominator 3,787 98% 83 2% 1,501 39% 2,369 61% 3,870
Hospital-Wide, version 12
Australasian Clinical Indicator Report 2008–2015 Page 44
© ACHS. This work is copyright. Requests and inquiries concerning reproduction and rights should be addressed to [email protected]
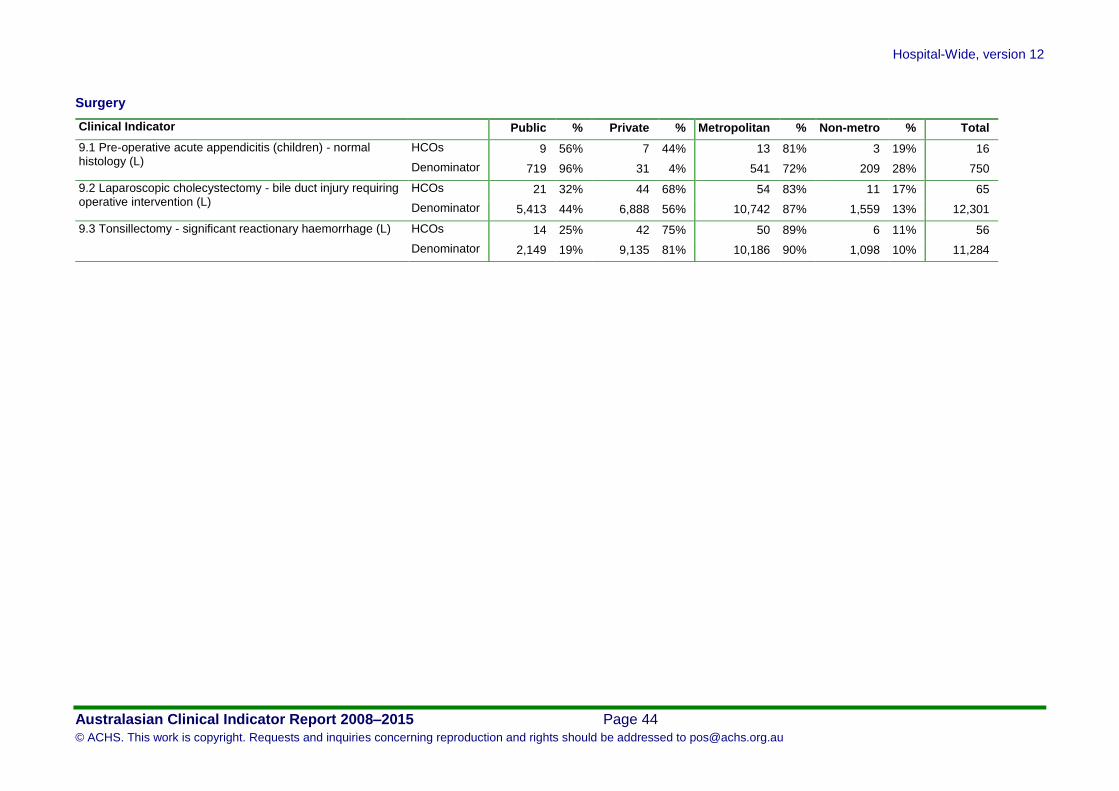
Surgery
Clinical Indicator Public % Private % Metropolitan % Non-metro % Total
9.1 Pre-operative acute appendicitis (children) - normal histology (L)
HCOs 9 56% 7 44% 13 81% 3 19% 16
Denominator 719 96% 31 4% 541 72% 209 28% 750
9.2 Laparoscopic cholecystectomy - bile duct injury requiring operative intervention (L)
HCOs 21 32% 44 68% 54 83% 11 17% 65
Denominator 5,413 44% 6,888 56% 10,742 87% 1,559 13% 12,301
9.3 Tonsillectomy - significant reactionary haemorrhage (L) HCOs 14 25% 42 75% 50 89% 6 11% 56
Denominator 2,149 19% 9,135 81% 10,186 90% 1,098 10% 11,284

Hospital-Wide, version 12
Australasian Clinical Indicator Report 2008–2015 Page 45
© ACHS. This work is copyright. Requests and inquiries concerning reproduction and rights should be addressed to [email protected]
Summary of Results
Hospital readmissions
1.1 Unplanned and unexpected readmissions within 28 days (L)
In 2015, there were 3,648,033 separations reported from 288 HCOs. The annual rate was 1.25 per 100 separations. The fitted rate improved from 1.6 to 1.1, a change of 0.49 per 100 separations. This trend was also significant after allowing for the changing composition of HCOs contributing over the period. The rate change was 0.49 per 100 separations. In 2015, the potential gains totalled 40,248 fewer unplanned and unexpected readmissions within 28 days, corresponding to a reduction by approximately four-fifths. There were 88 outlier records from 57 outlier HCOs whose combined excess was 22,622 more unplanned and unexpected readmissions within 28 days. The outlier HCO rate was 4.4 per 100 separations.
Return to the operating room
2.1 Unplanned return to the operating room during the same admission (L)
In 2015, there were 2,002,383 patients reported from 221 HCOs. The annual rate was 0.25 per 100 patients. The fitted rate improved from 0.37 to 0.26, a change of 0.11 per 100 patients. This trend was also significant after allowing for the changing composition of HCOs contributing over the period. The rate change was 0.11 per 100 patients. In 2015, the potential gains totalled 3,382 fewer patients having an unplanned return to the operating room, corresponding to a reduction by approximately one-half. There were 40 outlier records from 30 outlier HCOs whose combined excess was 1,087 more patients having an unplanned return to the operating room. The outlier HCO rate was 0.64 per 100 patients.
2.2 Reviewed cases following an unplanned return to the operating room (H)
In 2015, there were 1,122 patients having an unplanned return to the operating room reported from 51 HCOs. The annual rate was 98.5 per 100 patients having a reviewed case following an unplanned return to the operating room. There was relatively little variation between HCOs and so the potential gains were small in 2015. There were three outlier records from three outlier HCOs whose combined excess was 14 fewer cases reviewed following an unplanned return to the operating room. The outlier HCO rate was 84.8 per 100 patients having a reviewed case following an unplanned return to the operating room.
Pressure injuries
3.1 Inpatients who develop 1 or more pressure injuries (L)
In 2015, there were 12,412,612 bed-days reported from 432 HCOs. The annual rate was 0.073 per 100 bed-days. In 2015, the potential gains totalled 6,753 fewer patients who develop one or more pressure injuries, corresponding to a reduction by approximately two-thirds. There were 58 outlier records from 45 outlier HCOs whose combined excess was 2,172 more patients who develop one or more pressure injuries. The outlier HCO rate was 0.17 per 100 bed-days.
Inpatient falls
4.1 Inpatient falls (L)
In 2015, there were 15,304,836 bed-days reported from 408 HCOs. The annual rate was 0.35 per 100 bed-days. In 2015, the potential gains totalled 24,075 fewer inpatient falls, corresponding to a reduction by approximately one-third. There were 153 outlier records from 104 outlier HCOs whose combined excess was 9,463 more inpatient falls. The outlier HCO rate was 0.65 per 100 bed-days.
4.2 Inpatient falls resulting in fracture or closed head injury (L)
In 2015, there were 14,069,400 bed-days reported from 349 HCOs. The annual rate was 0.010 per 100 bed-days. In 2015, the potential gains totalled 713 fewer inpatient falls resulting in a fracture or closed head injury, corresponding to a reduction by approximately one-half. There were eight outlier records from eight outlier HCOs whose combined excess was 282 more inpatient falls resulting in a fracture or closed head injury. The outlier HCO rate was 0.089 per 100 bed-days.
4.3 Inpatient falls - patients 65 years and older (L)
In 2015, there were 5,722,089 bed-days reported from 223 HCOs. The annual rate was 0.52 per 100 bed-days. In 2015, the potential gains totalled 10,639 fewer inpatient falls in inpatients aged 65 years and older, corresponding to a reduction by approximately one-third. There were 69 outlier records from 47 outlier HCOs whose combined excess was 5,194 more inpatient falls in inpatients aged 65 years and older. The outlier HCO rate was 0.97 per 100 bed-days.

Hospital-Wide, version 12
Australasian Clinical Indicator Report 2008–2015 Page 46
© ACHS. This work is copyright. Requests and inquiries concerning reproduction and rights should be addressed to [email protected]
Patient deaths
5.1 Patient deaths addressed within a clinical audit process (H)
In 2015, there were 20,086 deaths reported from 192 HCOs. The annual rate was 95.6 per 100 deaths. The fitted rate improved from 93.0 to 95.6, a change of 2.7 per 100 deaths. This trend was also significant after allowing for the changing composition of HCOs contributing over the period. The rate change was 2.6 per 100 deaths. There was relatively little variation between HCOs and so the potential gains were small in 2015. There were 22 outlier records from 18 outlier HCOs whose combined excess was 678 fewer patient deaths addressed within a clinical audit process. The outlier HCO rate was 64.3 per 100 deaths.
5.2 Deaths in adult patients who do not have a NFR order (L)
In 2015, there were 784,447 patients reported from 65 HCOs. The annual rate was 0.15 per 100 patients. In 2015, the potential gains totalled 985 fewer deaths in adult patients who do not have a not for resuscitation order, corresponding to a reduction by approximately four-fifths. There were 14 outlier records from 12 outlier HCOs whose combined excess was 469 more deaths in adult patients who do not have a not for resuscitation order. The outlier HCO rate was 0.66 per 100 patients.
5.3 Adult deaths (L)
In 2015, there were 914,036 patients reported from 71 HCOs. The annual rate was 1.00 per 100 patients. In 2015, the potential gains totalled 6,246 fewer adult deaths, corresponding to a reduction by approximately two-thirds. There were 28 outlier records from 20 outlier HCOs whose combined excess was 1,935 more adult deaths. The outlier HCO rate was 1.8 per 100 patients.
5.4 Coronary artery graft surgery (CAGS) - death (L)
In 2015, there were 5,057 patients reported from 30 HCOs. The annual rate was 1.29 per 100 patients. The fitted rate improved from 1.9 to 1.1, a change of 0.73 per 100 patients. This trend was also significant after allowing for the changing composition of HCOs contributing over the period. The rate change was 0.68 per 100 patients. There were no potential gains in 2015.
5.5 Elective coronary artery graft surgery - death (L)
In 2015, there were 1,957 patients reported from 17 HCOs. The annual rate was 1.48 per 100 patients. There was no significant trend in the fitted rate. In 2015, the potential gains totalled five fewer elective patients who die in the same admission as having coronary artery graft surgery, corresponding to a reduction by approximately one-tenth.
5.6 Coronary artery graft surgery patients aged 71 years or older - death (L)
In 2015, there were 1,225 patients reported from 20 HCOs. The annual rate was 2.53 per 100 patients. There was no significant trend in the fitted rate. There were no potential gains in 2015.
5.7 Elective abdominal aortic aneurysm (AAA) open repair - death (L)
In 2015, there were 117 patients reported from 16 HCOs. The annual rate was 0.85 per 100 patients. The fitted rate improved from 2.9 to 1.1, a change of 1.9 per 100 patients. This trend was also significant after allowing for the changing composition of HCOs contributing over the period. The rate change was 2.2 per 100 patients. There were no potential gains in 2015.
Blood transfusion
6.1 Significant adverse blood transfusion events (L)
In 2015, there were 95,433 transfusions reported from 183 HCOs. The annual rate was 0.15 per 100 transfusions. The fitted rate improved from 0.28 to 0.16, a change of 0.12 per 100 transfusions. This trend was also significant after allowing for the changing composition of HCOs contributing over the period. The rate change was 0.13 per 100 transfusions. In 2015, the potential gains totalled 48 fewer significant adverse blood transfusion events, corresponding to a reduction by approximately one-quarter. There were three outlier records from three outlier HCOs whose combined excess was 12 more significant adverse blood transfusion events. The outlier HCO rate was 0.65 per 100 transfusions.
6.2 Transfusion episodes where informed patient consent was not documented (L)
In 2015, there were 23,449 transfusions reported from 99 HCOs. The annual rate was 3.23 per 100 transfusions. In 2015, the potential gains totalled 686 fewer transfusion episodes performed without consent, corresponding to a reduction by approximately four-fifths. There were 19 outlier records from 15 outlier HCOs whose combined excess was 496 more transfusion episodes performed without consent. The outlier HCO rate was 22.1 per 100 transfusions.
Hospital-Wide, version 12
Australasian Clinical Indicator Report 2008–2015 Page 47
© ACHS. This work is copyright. Requests and inquiries concerning reproduction and rights should be addressed to [email protected]
6.3 RBC transfusion where Hb reading is 100 g/L or more (L)
In 2015, there were 24,128 transfusions reported from 85 HCOs. The annual rate was 1.54 per 100 transfusions. In 2015, the potential gains totalled 244 fewer transfusions where Hb reading is 100g/L or more, corresponding to a reduction by approximately one-half. There were nine outlier records from seven outlier HCOs whose combined excess was 136 more transfusions where Hb reading is 100g/L or more. The outlier HCO rate was 3.1 per 100 transfusions.
Thromboprophylaxis
7.1 VTE prophylaxis administered to high risk medical patients (N)
In 2015, there were 4,953 high-risk medical patients reported from 10 HCOs. The annual rate was 55.8 per 100 high-risk medical patients.
Minimum standards for rapid response system (RRS) calls
8.1 Rapid response system calls to adult patients (N)
In 2015, there were 1,473,637 admissions reported from 109 HCOs. The annual rate was 2.77 per 100 admissions.
8.2 Rapid response system calls to adult patients within 24 hours of admission (N)
In 2015, there were 1,080,934 admissions reported from 79 HCOs. The annual rate was 0.65 per 100 admissions.
8.3 Adult patients experiencing cardiopulmonary arrest (L)
In 2015, there were 1,689,241 admissions reported from 150 HCOs. The annual rate was 0.10 per 100 admissions. In 2015, the potential gains totalled 1,104 fewer adult patients who experience a cardiopulmonary arrest, corresponding to a reduction by approximately one-half. There were 13 outlier records from 10 outlier HCOs whose combined excess was 472 more adult patients who experience a cardiopulmonary arrest. The outlier HCO rate was 0.40 per 100 admissions.
8.4 Rapid response system attendances within 5 minutes (H)
In 2015, there were 12,532 rapid response system calls to adult patients reported from 46 HCOs. The annual rate was 96.6 per 100 rapid response system calls to adult patients. There was relatively little variation between HCOs and so the potential gains were small in 2015. There were seven outlier records from seven outlier HCOs whose combined excess was 213 fewer rapid response system calls attended to within five minutes. The outlier HCO rate was 86.2 per 100 rapid response system calls to adult patients.
8.5 Adult deaths avoided by rapid response system calls (H)
In 2015, there were 3,870 rapid response system calls to adult patients reported from 12 HCOs. The annual rate was 93.1 per 100 rapid response system calls to adult patients. There was relatively little variation between HCOs and so the potential gains were small in 2015. There were two outlier records from two outlier HCOs whose combined excess was 36 fewer adult deaths avoided due to rapid response system calls. The outlier HCO rate was 87.2 per 100 rapid response system calls to adult patients.
Surgery
9.1 Pre-operative acute appendicitis (children) - normal histology (L)
In 2015, there were 750 children with a pre-operative diagnosis of acute appendicitis who undergo appendicectomy reported from 16 HCOs. The annual rate was 13.7 per 100 children with a pre-operative diagnosis of acute appendicitis who undergo appendicectomy with normal histology. There were no potential gains in 2015.
9.2 Laparoscopic cholecystectomy - bile duct injury requiring operative intervention (L)
In 2015, there were 12,301 patients reported from 65 HCOs. The annual rate was 0.35 per 100 patients. There was no significant trend in the fitted rate. In 2015, the potential gains totalled 14 fewer patients having a laparoscopic cholecystectomy with a bile duct injury requiring operative intervention, corresponding to a reduction by approximately one-quarter. There was one outlier record from one outlier HCO whose combined excess was two more patients having a laparoscopic cholecystectomy with a bile duct injury requiring operative intervention. The outlier HCO rate was 2.2 per 100 patients.
9.3 Tonsillectomy - significant reactionary haemorrhage (L)
In 2015, there were 11,284 patients reported from 56 HCOs. The annual rate was 0.62 per 100 patients. There was no significant trend in the fitted rate. In 2015, the potential gains totalled 27 fewer patients who have a significant reactionary haemorrhage following tonsillectomy, corresponding to a reduction by approximately one third. There were two outlier records from two outlier HCOs whose combined excess was six more patients who

Hospital-Wide, version 12
Australasian Clinical Indicator Report 2008–2015 Page 48
© ACHS. This work is copyright. Requests and inquiries concerning reproduction and rights should be addressed to [email protected]
have a significant reactionary haemorrhage following tonsillectomy. The outlier HCO rate was 5.7 per 100 patients.

Hospital-Wide, version 12
Australasian Clinical Indicator Report 2008–2015 Page 49
© ACHS. This work is copyright. Requests and inquiries concerning reproduction and rights should be addressed to [email protected]
Expert Commentary
The Royal Australasian College of Medical Administrators (RACMA)
Introductory comments The Royal Australasian College of Medical Administrators (RACMA) is in a unique position within the
quality assurance space. Our Fellows manage and lead health service organisations across Australia
and New Zealand, within a range of roles predominantly as Chief Medical Officers and Directors of
Medical Services. Our Fellows coordinate the compliance of their organisations to the Australian
Commission on Safety and Quality in Health Care’s ten National Standards, as well as the ACHS’
additional five EQuIP standards. Most health service organisations use the ACHS to conduct the
compliance assessment and performance management. In addition, our Fellows will also coordinate
compliance assessments for the National Standards for Mental Health Services and the Standards
for Aged Care Services. Fortunately, very few health service organisations fail the aforementioned
quality assurance assessments.
As for clinical indicators (CIs), once again through the inherent roles that our Fellows hold they are
commonly the custodians of performance reporting frameworks and clinical data benchmarking. The
health service organisations that our Fellows lead will provide performance data to state, federal and
non-government groups. This data is then processed and distributed back to respective organisations
through several sources such as the Core Hospital-Based Outcome Indicators (CHBOIs), statebased
indicators (i.e. PRISM in Victoria), Quality Investigator (Dr Foster – Telstra Health) and the Health
Roundtable (HRT). There is generally very good compliance with indicator benchmarks across states
and jurisdictions. Through independent groups such as the HRT, there is very good information-
sharing and collaboration between organisations within Australia and New Zealand.
Hospital readmissions
There is a pleasing continued downward trend for ‘Unplanned and unexpected readmission within 28
days’ (CI 1.1) that is likely to be indicative of continued improvements in care and discharge planning.
Rates of outlier HCOs continue to be more than three times the rate of the aggregate group. Careful
and detailed review of the data by these HCOs is required to identify potential differences in care or
discharge planning, thus identifying opportunities for improvement. HCOs should consider these
results in the context of their definition of “admission”, including changing models of care such as
short stay units and hospital avoidance to ensure they understand the local context behind potential
reasons for readmissions varying between HCOs.
Return to the operating room The rate for ‘Unplanned return to the operating room during the same admission’ (CI 2.1) continues its
downward trend which may be related to improvements in surgical techniques, clinician training and
supervision, credentialing and defining scope of practice as well as improved preoperative
assessment (including suitability for surgery) and postoperative practices. It is pleasing to note that
98.5 per 100 patients in this category have had their case reviewed (CI 2.2). Whilst this rate is
impressive, 100% of these cases should be reviewed in order to accurately identify potential practice
improvement issues.
It could be of interest to outlier HCOs to reflect on their case selection and access to tertiary centres
as well as risk adjusted rates that include comorbidity. It may also be of use to consider this CI in the
context of each outcome post-surgery (i.e. no further surgery required, further surgery required or
death post-surgery). Outlier HCOs may find value in mining their data to examine both patient and
non-patient factors. Important non-patient factors would include whether the primary surgery was
emergency or elective and at what time of day and day of the week the primary surgery occurred.

Hospital-Wide, version 12
Australasian Clinical Indicator Report 2008–2015 Page 50
© ACHS. This work is copyright. Requests and inquiries concerning reproduction and rights should be addressed to [email protected]
Pressure injuries
Both public and private HCOs have undertaken significant work to improve pressure ulcer screening,
assessment, management and prevention and to improve the training of clinicians, predominantly
nursing staff. This is in line with the requirements of the National Safety and Quality Health Service
(NSQHS) Standard 8: Preventing and Managing Pressure Injuries. This area of clinical practice
continues to require ongoing and concerted effort. The ageing of our patient population and
associated co-morbidities will continue to impact on CI 3.1. This CI should also be interpreted in the
context of external constraints such as funding structures and models that are designed to promote
awareness, detection and early treatment of pressure injuries. It is important to note the changing
definitions of pressure injuries and the impact that further detail in specific definitions will have on the
data over time.
Inpatient falls
The rate of ‘Inpatient falls’ (CI 4.1) remains an area of improvement for both public and private sectors
with no significant difference in rate noted. The outlier group of HCOs is of particular concern with a
fall rate nearly double that of the aggregate rate. The rate of ‘Inpatient falls resulting in fracture or
closed health injury’ (CI 4.2) was similar in all states except the “other group” with relatively few
outliers. It is unsurprising that the fall rates remain higher in patients over the age of 65 (CI 4.3). It
would be interesting to identify a sub-indicator: inpatient falls resulting in fracture or closed head injury
in this age group. This would be of benefit in the continued focus on falls screening, assessment,
management and prevention required by NSQHS Standard 10: Preventing Falls and Harm from Falls.
Patient deaths The review of patient deaths addressed within a clinical audit process (CI 5.1) is of great value in
understanding avoidable causes and improving clinical practice. The improving trend to 95.6 per 100
deaths reviewed is pleasing and indicates that death screening and review as part of Morbidity and
Mortality meetings has been widely implemented. It is a concern that there are still outlier HCOs and
that their rate was 64.3 per 100 deaths.
There are considerably fewer HCOs able to submit data for ‘Deaths in adult patients who do not have
an NFR order’ (CI 5.2). This could in part be due to differences in definitions of treatment limiting
orders and the way in which they are recorded and identified in the medical record. The numbers of
patients who died without an NFR order is low at 0.15 per 100 patients. The data is insufficiently
granular to allow interpretation on the appropriate timing of NFR orders throughout admission and
before death.
Given the scoping of ‘Adult deaths’ (CI 5.3), this may reflect the CI’s overall utility, as raw mortality
rates need to be considered in the context of casemix and comorbidity. Reflection on standardised or
casemix adjusted mortality rates may add understanding to the variations in mortality rate. Subsets of
data, such as “unexpected deaths” and “expected deaths” will be of utility. Unexpected deaths are
arguably the higher risk from a governance perspective and should be the first addressed in any
death review clinical audit process.
Although Coronary Artery Graft Surgery (CAGS) related deaths (CI 5.4) are small in number, data
volumes have showed consistency since 2008, allowing an interpretation that deaths related to CAGS
has decreased over time. This may be due to earlier detection and proactive management of
cardiovascular disease, improved surgical techniques and maintenance medical therapies
postoperatively.
CI 5.6 demonstrates the higher death rate post CAGS of patients aged 71 years and over. Further
detail is required to comment on whether age is an independent risk factor for death post CAGS.
There was a low data volume for death after elective abdominal aortic aneurysm (AAA) open repair
(CI 5.7), which likely represents the natural incidence and clinical detection of this issue as well as the
few centres nationally that are equipped to conduct these surgeries. Pleasing rates over time indicate
surgical advances, including non-open surgical techniques and improved screening and earlier
detection as well as advances in postoperative care.

Hospital-Wide, version 12
Australasian Clinical Indicator Report 2008–2015 Page 51
© ACHS. This work is copyright. Requests and inquiries concerning reproduction and rights should be addressed to [email protected]
Blood transfusion There is a continued downward trend in the rate of ‘Significant adverse blood transfusion events’ (CI
6.1). It is further noted that the public rate is nearly twice that of the private rate, but the state rates
are reasonably similar. Whilst the low rate for ‘Transfusion episodes where informed patient consent
was not documented’ (CI 6.2) is noted, variation between states remain and further work needs to be
undertaken particularly in the outlier HCOs where the outlier HCO rate was over six times higher at
22.1 per 100 transfusions compared to 3.23 per 100 transfusions. Similarly the low rate for ‘RBC
transfusion where the Hb reading is 100g/L or more’ (CI 6.3) is noted, but the variation between the
states and the significant spread in the box plots indicates that further improvement in this CI can
occur with continued focus on appropriate prescribing and administrative practices ensuring that a
scarce resource is effectively utilised.
Outlier HCOs should reflect on transfusion volumes and also indications for transfusion (i.e.
emergency, intraoperative or elective). Results also demonstrate the ongoing need for patient
engagement in relation to informed consent for blood transfusion. The work led by national and state
jurisdictions and underpinned for HCOs by the NSQHS Standard 7: Blood and Blood Products,
provides a framework for decreasing risks and improving safety in this clinical area. Outlier HCOs
should carefully review these requirements, audit their practices against them and implement
improvement strategies.
Thromboprophylaxis
The number of HCOs contributing data for ‘VTE prophylaxis administered to high risk medical
patients’ (CI 7.1) remains low and it is therefore difficult to comment productively. Further work needs
to be undertaken to continually raise awareness amongst clinicians of the importance of identifying
high-risk patients and administering appropriate thromboprophylaxis. HCOs should be routinely
examining their own data on this CI, preferably with the denominator of high risk patients who are
“eligible to receive” thromboprophylaxis.
Minimum standards for rapid response system (RRS) calls Whilst the rate of ‘RRS calls to adult patients’ (CI 8.1) is noted as 2.77 per 100 admissions from 109
contributing HCOs and no significant stratum differences were noted, it is impossible to make sensible
comment given the lack of a definition of what an appropriate rate might be. Similarly no sensible
comment is possible for the ‘RRS calls to adult patients within 24 hours of admission’ (CI 8.2) with a
rate of 0.65 per 100 admissions and no significant stratum difference for the same reasons.
Definitions of RRS calls are important, in that do they include cardiac arrest calls as well as calls
regarding acute deterioration? The literature indicates that RRS type calls vary between 26-56 per
1,000 separations; as such the rate is at the lower end of what can be anticipated.
With respect to ‘Adult patients experience cardiopulmonary arrest’ (CI 8.3) the annual rate was 0.10
per 100 admissions from 150 HCOs with wide variation between the states and an outlier HCO rate
four times that of the aggregate rate. What is not clear is the likely cause of this variation. This is an
area requiring additional study and discussion with appropriate clinical groups. HCOs should consider
examining their methods of detection and responding to clinical deterioration to determine the
contribution to the rate of cardiopulmonary arrest calls.
It was pleasing to note that the rate for ‘RRS attendances within 5 minutes’ (CI 8.4), granted from a
relatively small sample of 46 HCOs was 96.6 per 100 RRS calls to adult patients, with no significant
stratum differences. All organisations may find benefit in differentiating RRS calls occurring “in hours”
and “after hours” to further delineate the risks to the deteriorating patient.
Surgery
No significant trends noted.

Hospital-Wide, version 12
Australasian Clinical Indicator Report 2008–2015 Page 52
© ACHS. This work is copyright. Requests and inquiries concerning reproduction and rights should be addressed to [email protected]
Australian College of Nursing (ACN)
Introductory comments
The potential for nurse sensitive indicators (NSIs) is emerging but how they are used in relation to
supporting quality and safety of nursing care,1 how nurses perceive the quality,2 and the quality and
safety of care of the multidisciplinary team is yet to be determined.
Hospital readmissions
The improved fitted rate of ‘Unplanned and unexpected hospital readmissions within 28 days’ (CI 1.1)
is acknowledged as a significant outcome of the efforts of multiple teams and processes within HCOs.
The role of nurses is integral to hospital admission risk programs, residential in-reach services, post-
acute care services, rapid assessment and discharge teams, clinical response services, case
management and discharge planning as consultants and members of multidisciplinary teams,3 all of
which have a strategic impact on readmissions. The changing composition of contributing HCOs is
noted.
Return to the operating room
This nurse sensitive criteria shows that patients are being closely monitored and the findings are
being reported in a timely manner. These support the National Safety and Quality Health Service
(NSQHS) Standards. Care of the patient with reference to Standard 9 of the National Standards
means identification, action and reporting of the antecedents to clinical deterioration by
ward/department nurses.4 The appropriate escalation of care5 by nurses for an unplanned return to
the operating room (CI 2.1) ensures quality and safe standards of care observations that may cause
concern.4 It is pleasing to note the fitted rate improved and remained significant after allowing for a
change in the composition of the contributing HCOs.
Pressure injuries
Pressure injuries are largely prevented from developing or becoming worse by sound nursing
practice. Nurses contribute significantly to the outcomes of this CI and it is pleasing to note a low rate
in the number of patients affected. Patients with one or more pressure injuries in hospital most
commonly develop them prior to admission and this indicates the need for greater education and
support of carers and aged care providers as partners in care.6
CI 3.1 is a NSI which requires interventions of routine nursing practice for all patients, but in particular
those frail and elderly individuals who are requiring hospitalisation in increasing numbers as the
population ages. Such practices include regular audits, air mattresses for patients at risk, incident
reporting systems and processes for identified education and supervision requirements. The research
shows that continued uses of evidence-based interventions are required, especially in aged care
facilities.7
Inpatient falls
The rate of falls in HCOs, especially in the elderly is decreasing. The Australian Commission on
Safety and Quality in Health Care delivered a national resource in 2009 to aide in the reduction of
falls. However, there does not appear to be a model that is consistently used nationwide as a
preventative measure.
Falls prevention in acute hospitals is complex and there remains no high quality evidence of
successful falls prevention strategies in wards.8 Patients at risk of falling require multidisciplinary
involvement in care planning, pro-active and accurate assessment, various sensor devices and
systems and risk identification. However, despite the lack of a successful empirical strategy, the
majority of the direct care remains the responsibility of nurses and the low rates reported for CIs 4.1 -
4.3 corresponds to safe and quality nursing practice to prevent those at risk from falling, injuring
themselves or others and is a pleasing trend.
Hospital-Wide, version 12
Australasian Clinical Indicator Report 2008–2015 Page 53
© ACHS. This work is copyright. Requests and inquiries concerning reproduction and rights should be addressed to [email protected]
Patient deaths
Nurses as part of the health professional team ensure there has been a documented not for
resuscitation (NFR) order (CI 5.2) on admission, including prior to transfer from Emergency
Department, as part of the admission process.
Blood transfusion
The highest number of HCOs contributed to CI 6.1 in 2015, and the changing composition is noted.
The fitted rate improved allowing for this pattern. Nurses identify the first changes to vital signs in
transfusion reaction and they are responsible for patient education to ask them to alert nurses to any
changes experienced. The first to be detected is usually T>374 followed by stopping transfusion and a
decision to escalate care. Intervention by nurses contributes directly to fewer adverse transfusion
events (CI 6.1).
Informed patient consent (CI 6.2) is part of the checking of documentation before administration of a
blood transfusion, thus providing safe and quality care. Nurses check consent orders at the same time
as checking administration orders for transfusion and provide another level of quality and safety
checking for this documentation. If not present, the transfusion would be delayed until completed.
Nurses check Hb prior to transfusion (CI 6.3), but reported blood is not provided by pathology
departments where Hb is 100g/L or more. Fewer transfusions in this range were reported in 2015,
and there were nine outlier records of a combined excess of 136 transfusions.
General/closing comments
Overall, this review has shown positive outcomes for nurse sensitive criteria.
References
1. Burston S, Chaboyer W and Gillespie B. Nurse-sensitive indicators suitable to reflect nursing care quality: a review and
discussion of issues. Journal of Clinical Nursing 2014; 23(13-14): 1785-1795.
2. Stalpers D, Kieft R, Van Der Linden D et al. Concordance between nurse-reported quality of care and quality of care as
publicly reported by nurse-sensitive indicators. BMC Health Services Research 2016; 16.
3. Department of Human Services. Improving Care: Hospital Admission Risk Program. Victorian Government, Melbourne;
2012.
4. Douw G, Schoonhoven L, Holwerda T et al. Nurses' worry or concern and early recognition of deteriorating patients on
general wards in acute care hospitals: a systematic review. Crit Care 2015; 19: 230.
5. Australian Commission on Safety and Quality in Health Care (ACSQHC). Safety and Quality Improvement Guide Standard
9: Recognising and Responding to Clinical Deterioration in Acute Health Care. 2012.
6. Australian Commission on Safety and Quality in Health Care (ACSQHC). Safety and Quality Improvement Guide Standard
8: Preventing and Managing Pressure Injuries. 2012.
7. Kwong EW, Pang SM, Aboo GH and Law SS. Pressure ulcer development in older residents in nursing homes: influencing
factors. J Adv Nurs 2009; 65(12): 2608-2620.
8. Barker AL, Morello RT, Wolfe R et al. 6-PACK programme to decrease fall injuries in acute hospitals: cluster randomised
controlled trial. BMJ 2016; 352.