Hospital Sisters - emma.msrb.org
83
Hospital Sisters HEALTH SYSTEM Annual Report and Audit June 30, 2013 /
Transcript of Hospital Sisters - emma.msrb.org

Hospital Sisters HEALTH SYSTEM
Annual Report and Audit
June 30, 2013
/
P.O. Box 19456 Springfield, Illinois 62794-9456 P: 217-523-4747 F: 217-523-0542
An Affiliate of Hospital Sisters Health System
Hospital Sisters Services, Inc. This report is delivered in satisfaction of the obligations created by the Disclosure Agreement dated October 1, 2012 (the "Master Agreement") and, executed and delivered by Hospital Sisters Services, Inc. (the "Corporation") in connection with the issuance of the Bonds listed on Exhibit C. Terms used herein and not otherwise defined shall have the meanings ascribed thereto in the Disclosure Agreement.
Section 2 of the Disclosure Certificate requires the Corporation to provide an Annual Report which updates certain information which was originally provided in its Official Statement dated September 21, 2012 (the "Official Statement") relating to the issuance of the Bonds.
FINANICAL INFORMATION
Attached to this Annual Report as EXHffiIT A are the audited consolidated financial statements of the Corporation for the fiscal years ended 2012 and 2013 which have been prepared in accordance with generally accepted accounting principles as promulgated from time to time by the Financial Accounting Standards Board, and have been audited by the accounting firm, KPMG, LLP.
INFORMATION REGARDING THE CORPORATION AND RESULTS FROM OPERATIONS
Attached to this Annual Report as EXHffiIT B is the following information, substantially similar in form and scope to the financial information and operating data originally set forth in Appendix A to the Official Statement under the captions
(i) List of Obligated Group
(ii) List of Affiliates of the Corporation
(iii) Total licensed and staffed beds of Obligated Group
(iv) Updated tables provided under the heading "SELECTED OPERATIONAL, STATISTICAL, AND FINANCIAL INFORMATION - Condensed Consolidated Balance Sheet of Hospital Sisters Health System";
(v) Updated table provided under the heading "SELECTED OPERATIONAL, STATISTICAL, AND FINANCIAL INFORMATION - Consolidated Summary Statements of Operations of Hospital Sisters Health System";
(vi) Updated table provided under the heading "SELECTED OPERATIONAL, STATISTICAL AND FINANCIAL INFORMATION - Obligated Group Relative to HSHS";
(vii) Updated Income Available for Debt Service table provided under the heading "SELECTED OPERATIONAL, STATISTICAL AND FINANCIAL INFORMATION - Coverage of Historical and Pro Forma Historical Maximum Annual Debt Service" (Historical Maximum Annual only) for the most recent fiscal year;
(viii) Updated information provided under the heading "SELECTED OPERATIONAL, STATISTICAL, AND FINANCIAL INFORMATION - Outstanding Indebtedness of the Obligated Group;
(ix) Updated table provided under the heading "SELECTED OPERATIONAL, STATISTICAL AND FINANCIAL INFORMATION - Historical and Pro Forma Capitalization" (Historical Only);
(x) Updated table provided under the heading "SELECTED OPERATIONAL, STATISTICAL, AND FINANCIAL INFORMATION - Liquidity and Investments";

(xi) Updated asset allocation table provided under the heading "SELECTED OPERATIONAL, STATISTICAL AND FINANCIAL INFORMATION -Investment Policy";
The information provided in the attached Exhibit B is true and correct as of the date of this Annual Report.
IN WITNESS WHEREOF the undersigned has executed and delivered the Annual Report to the Dissemination Agent, for distribution for the benefit of Holders of the Bonds, all as of this 28 th day of October, 2013.
HOSPITALSISTERS SERVICES, INC.
By: ~fh -~ AnnM. Carr
Its: Obligated Group Agent
Exhibit A
HOSPITAL SISTERS HEALTH SYSTEM AND SUBSIDIARIES Springfield, Illinois
Consolidated Financial Statements and Supplementary Information
June 30, 2013 and 2012
(With Independent Auditors' Report Thereon)

The Board of Directors Hospital Sisters Health System:
KPMGLLP Aon Center Suite 5500 200 East Randolph Drive Chicago. IL 60601-6436
Independent Auditors' Report
Report on the Financial Statements
We have audited the accompanying consolidated fmancial statements of Hospital Sisters Health System and Subsidiaries (HSHS), which comprise the consolidated balance sheets as of June 30, 2013 and 2012, and the related consolidated statements of operations, changes in net assets, and cash flows for the years then ended, and the related notes to the consolidated fmancial statements.
Management's Responsibility for the Financial Statements
Management is responsible for the preparation and fair presentation of these consolidated fmancial statements in accordance with u.s. generally accepted accounting principles; this includes the design, implementation, and maintenance of internal control relevant to the preparation and fair presentation of consolidated fmancial statements that are free from material misstatement, whether due to fraud or error.
Auditors'Responsibility
Our responsibility is to express an opinion on these consolidated fmancial statements based on our audits. We conducted our audits in accordance with auditing standards generally accepted in the United States of America. Those standards require that we plan and perform the audit to obtain reasonable assurance about whether the consolidated fmancial statements are free from material misstatement.
An audit involves performing procedures to obtain audit evidence about the amounts and disclosures in the consolidated fmancial statements. The procedures selected depend on the auditors' judgment, including the assessment of the risks of material misstatement of the consolidated fmancial statements, whether due to fraud or error. In making those risk assessments, the auditor considers internal control relevant to the entity's preparation and fair presentation of the consolidated fmancial statements in order to design audit procedures that are appropriate in the circumstances, but not for the purpose of expressing an opinion on the effectiveness of the entity's internal control. Accordingly, we express no such opinion. An audit also includes evaluating the appropriateness of accounting policies used and the reasonableness of significant accounting estimates made by management, as well as evaluating the overall presentation of the consolidated fmancial statements.
We believe that the audit evidence we have obtained is sufficient and appropriate to provide a basis for our audit opinion.
Opinion
In our opinion, the consolidated fmancial statements referred to above present fairly, in all material respects, the fmancial position of Hospital Sisters Health System as of June 30, 2013 and 2012, and the results of its operations, the changes in its net assets, and its cash flows for the years then ended, in accordance with U.S. generally accepted accounting principles.
KPMG LLP Is a Delaware limited lIabHlty partnership. the U.S. member finn of KPMG Intemational Cooperative ("KPMG International"). a Swiss entity.

Emphasis of Matter
As described in note 2(n) to the consolidated fmancial statements, HSHS adopted the provisions of Financial Accounting Standards Board Accounting Standards Update No. 2011-07, Presentation and Disclosure of Patient Service Revenue, Provision for Bad Debts, and the Allowance for Doubtful Accounts for Certain Healthcare Entities, for the year ended June 30, 2012. As a result of this adoption, HSHS has presented on a separate line the provision for uncollectible accounts as a deduction from net patient service revenue (net of contractual allowances and discounts) and included enhanced disclosures about the entity's policies for recognizing revenue and assessing bad debts. Our opinion is not modified with respect to the matter emphasized.
Other Matters
Our audits were conducted for the purpose of fonning an opinion on the consolidated fmancial statements as a whole. The supplementary infonnation included in schedules 1 through 6 is presented for purposes of additional analysis and is not a required part of the consolidated fmancial statements. Such infonnation is the responsibility of management and was derived from and relates directly to the underlying accounting and other records used to prepare the consolidated fmancial statements. The infonnation has been subjected to the auditing procedures applied in the audit of the consolidated fmancial statements and certain additional procedures, including comparing and reconciling such infonnation directly to the underlying accounting and other records used to prepare the consolidated fmancial statements or to the consolidated fmancial statements themselves, and other additional procedures in accordance with auditing standards generally accepted in the United States of America. In our opinion, the infonnation is fairly stated in all material respects in relation to the consolidated fmancial statements as a whole.
October 28,2013
2
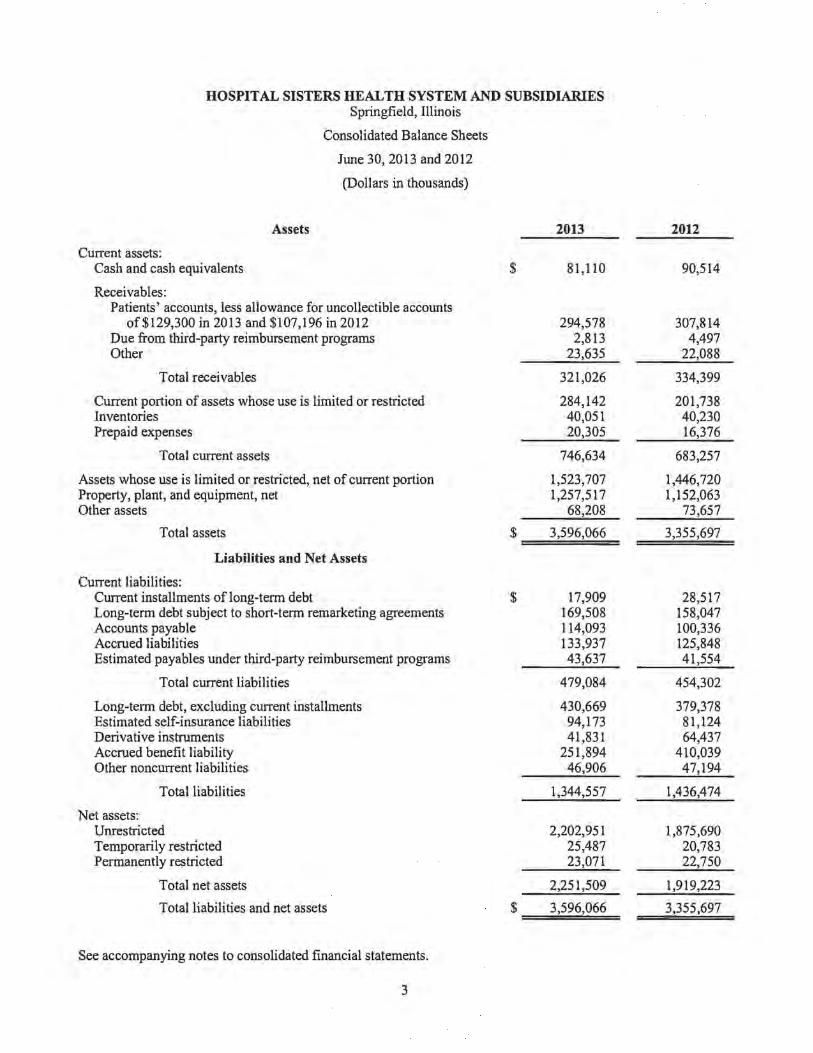
HOSPITAL SISTERS HEALTH SYSTEM AND SUBSIDIARIES Springfield, Illinois
Consolidated Balance Sheets
June 30,2013 and 2012
(Dollars in thousands)
Assets
Current assets: Cash and cash equivalents
Receivables: Patients' accounts, less allowance for uncollectible accounts
of$129,300 in 2013 and $107,196 in 2012 Due from third-party reimbursement programs Other
Total receivables
Current portion of assets whose use is limited or restricted Inventories Prepaid expenses
Total current assets
Assets whose use is limited or restricted, net of current portion Property, plant, and equipment, net Other assets
Total assets
Liabilities and Net Assets
Current liabilities: Current installments of long-term debt Long-term debt subject to short-term remarketing agreements Accounts payable Accrued liabilities Estimated payables under third-party reimbursement programs
Total current liabilities
Long-term debt, excluding current installments Estimated self-insurance liabilities Derivative instruments Accrued benefit liability Other noncurrent liabilities
Total liabilities
Net assets: Unrestricted Temporarily restricted Permanently restricted
Total net assets
Total liabilities and net assets
See accompanying notes to consolidated financial statements.
3
2013
$ 81,110
294,578 2,813
23,635
321,026
284,142 40,051 20,305
746,634
1,523,707 1,257,517
68,208
$ 3,596,066
$ 17,909 169,508 114,093 133,937 43,637
479,084
430,669 94,173 41,831
251,894 46,906
1,344,557
2,202,951 25,487 23,071
2,251,509
$ 3,596,066
2012
90,514
307,814 4,497
22,088
334,399
201,738 40,230 16,376
683,257
1,446,720 1,152,063
73,657
3,355,697
28,517 158,047 100,336 125,848 41,554
454,302
379,378 81,124 64,437
410,039 47,194
1,436,474
1,875,690 20,783 22,750
1,919,223
3,355,697

HOSPITAL SISTERS HEALTH SYSTEM AND SUBSIDIARIES Springfield, Illinois
Consolidated Statements of Operations
Years ended June 30, 2013 and 2012
(Dollars in thousands)
2013
Net patient service revenues $ 2,012,108 Provision for uncollectible accounts (107,131)
Net patient service revenue less provision for uncollectible accounts 1,904,977
Other revenues: Investment income 2,751 Net assets released from restrictions used for operations 1,513 Other 98,325
Total revenues 2,007,566
Expenses: Sisters' services 1,275 Salaries and wages 740,688 Employee benefits 242,056 Professional fees 113,362 Supplies 275,961 Depreciation and amortization 135,871 Interest 7,247 Other 469,542
Total expenses 1,986,002
Income from operations 21,564
Nonoperating gains (losses): Investment income 128,782 Change in fair value of interest rate swaps 22,606 Loss on conversion and early extinguishment of debt (5,073)
Revenues and gains (losses) in excess (deficient) of expenses 167,879
Other changes in unrestricted net assets: Net assets released from restrictions used for
the purchase of property, plant, and equipment 1,237 Reversal (recognition) of change in pension funded status 158,145
Change in unrestricted net assets $ 327,261
See accompanying notes to consolidated financial statements.
4
2012
1,981,070 (111,142)
1,869,928
786 1,702
57,458
1,929,874
1,155 722,856 205,171 114,690 275,291 143,523
6,313 460,584
1,929,583
291
23,565 (35,799)
(11,943)
7,369 (160,928)
(165,502)

HOSPITAL SISTERS HEALTH SYSTEM AND SUBSIDIARIES Springfield, Illinois
Consolidated Statements of Changes in Net Assets
Years ended June 30, 2013 and 2012
(Dollars in thousands)
Unrestricted net assets: Revenues and gains (losses) in excess (deficient) of expenses $ Other changes in unrestricted net assets:
Net assets released from restrictions used for the purchase of property, plant, and equipment
Reversal (recognition) of change in pension funded status
Change in unrestricted net assets
Temporarily restricted net assets: Investment income Contributions Net assets released from restrictions
Change in temporarily restricted net assets
Permanently restricted net assets: Investment income (loss) Contributions
Change in permanently restricted net assets
Change in net assets
2013
167,879
1,237 158,145
327,261
1,182 6,272
(2,750)
4,704
(9) 330
321
332,286
Net assets at beginning of year 1,919,223
Net assets at end of year $ 2,251,509
See accompanying notes to consolidated fmancial statements.
5
2012
(11,943)
7,369 (160,928)
(165,502)
308 8,630
(9,071)
(133)
28 393
421
(165,214)
2,084,437
1,919,223

HOSPITAL SISTERS HEALTH SYSTEM AND SUBSIDIARIES Springfield, Illinois
Consolidated Statements of Cash Flows
Years ended June 30, 2013 and 2012
(Dollars in thousands)
Cash flows from operating activities: Change in net assets Adjustments to reconcile change in net assets to net cash provided by operating
activities: Loss on conversion and early extinguishment of debt Recognition (reversal) of change in pension funded status Income from equity basis investments Cash received from equity basis investments, net Net assets released from restrictions and used for operations Restricted contributions and investment return Amortization of bond issuance costs, included in interest expense Depreciation and amortization Provision for uncollectible accounts Change in net unrealized gain and losses on investments Net realized gains on sale of investments Change in the fair value of derivative instruments Changes in assets and liabilities:
Patients' accounts receivable Other receivables Inventories Prepaid expenses Net amounts due to third-party reimbursement programs Accounts payable and accrued liabilities Estimated self-insurance liabilities and other noncurrent liabilities
Net cash provided by operating activities
Cash flows from investing activities: Acquisition of property, plant, and equipment Gross purchases of investments Gross proceeds from sale or maturity of investments Change in other assets
Net cash used in investing activities
Cash flows from financing activities: Repayment oflong-term debt Proceeds from issuance of debt Payment of bond issuance cost Net assets released from restrictions and used for operations Restricted contributions and investment return
Net cash provided by (used in) financing activities
Change in cash and cash equivalents
Cash and cash equivalents at beginning of year
Cash and cash equivalents at end of year
Supplemental disclosure of cash flow information: Cash paid for interest, net of amounts capitalized
Supplemental disclosure of noncash transactions: Assets acquired under capital lease
See accompanying notes to consolidated financial statements.
6
2013
$ 332,286
5,073 (158,145)
(4,158) 4,230 1,513
(7,775) 244
135,871 107,131 (69,286) (40,538) (22,606)
(93,895) (1,547)
179 (3,929) 3,767
21,846 12,761
223,022
(242,210) (1,917,036) 1,867,469
5,133
(286,644)
(468,900) 520,720
(3,864) (1,513) 7,775
54,218
(9,404)
90,514
$ 81,110
$ 7,085
$ 885
2012
(165,214)
160,928 (5,241) 3,944 1,702
(9,359) 197
143,523 111,142 63,563
(58,743) 35,799
(141,257) 4,488 (179)
1,642 6,328
18,424 6,291
177,978
(192,020) (1,828,882)
1,874,143 2,908
(143,851)
(22,130) 10,000
(1,702) 9,359
(4,473)
29,654
60,860
90,514
4,137
24,332
HOSPITAL SISTERS HEALTH SYSTEM AND SUBSIDIARIES Springfield, Illinois
(1) Organization and Purpose
Notes to Consolidated Financial Statements
June 30, 2013 and 2012
(Dollars in thousands)
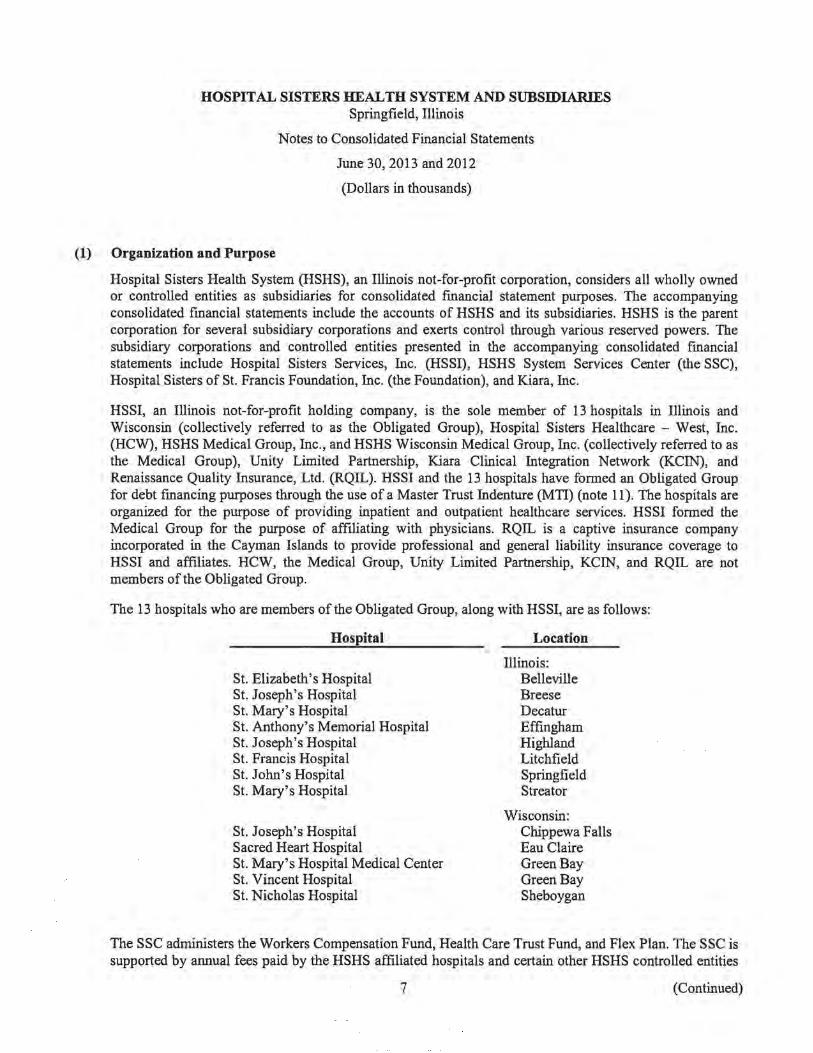
Hospital Sisters Health System (HSHS), an Illinois not-for-profit corporation, considers all wholly owned or controlled entities as subsidiaries for consolidated fmancial statement purposes. The accompanying consolidated fmancial statements include the accounts of HSHS and its subsidiaries. HSHS is the parent corporation for several subsidiary corporations and exerts control through various reserved powers. The subsidiary corporations and controlled entities presented in the accompanying consolidated fmancial statements include Hospital Sisters Services, Inc. (HSSI), HSHS System Services Center (the SSC), Hospital Sisters of st. Francis Foundation, Inc. (the Foundation), and Kiara, Inc.
HSSI, an Illinois not-for-profit holding company, is the sole member of 13 hospitals in Illinois and Wisconsin (collectively referred to as the Obligated Group), Hospital Sisters Healthcare - West, Inc. (HCW), HSHS Medical Group, Inc., and HSHS Wisconsin Medical Group, Inc. (collectively referred to as the Medical Group), Unity Limited Partnership, Kiara Clinical Integration Network (KCIN) , and Renaissance Quality Insurance, Ltd. (RQIL). HSSI and the 13 hospitals have formed an Obligated Group for debt fmancing purposes through the use of a Master Trust Indenture (MTI) (note 11). The hospitals are organized for the purpose of providing inpatient and outpatient healthcare services. HSSI formed the Medical Group for the purpose of affiliating with physicians. RQIL is a captive insurance company incorporated in the Cayman Islands to provide professional and general liability insurance coverage to HSSI and affiliates. HCW, the Medical Group, Unity Limited Partnership, KCIN, and RQIL are not members of the Obligated Group.
The 13 hospitals who are members of the Obligated Group, along with HSSI, are as follows:
Hospital
St. Elizabeth's Hospital St. Joseph's Hospital St. Mary's Hospital St. Anthony's Memorial Hospital St. Joseph's Hospital St. Francis Hospital St. John's Hospital St. Mary's Hospital
St. Joseph's Hospital Sacred Heart Hospital St. Mary's Hospital Medical Center St. Vincent Hospital St. Nicholas Hospital
Location
Illinois: Belleville Breese Decatur Effingham Highland Litchfield Springfield Streator
Wisconsin: Chippewa Falls Eau Claire Green Bay Green Bay Sheboygan
The SSC administers the Workers Compensation Fund, Health Care Trust Fund, and Flex Plan. The SSC is supported by annual fees paid by the HSHS affiliated hospitals and certain other HSHS controlled entities
7 (Continued)
HOSPITAL SISTERS HEALTH SYSTEM AND SUBSIDIARIES Springfield, Illinois
Notes to Consolidated Financial Statements
June 30, 2013 and 2012
(Dollars in thousands)
to the SSC. The SSC utilizes these funds to provide centralized management and information services to the 13 affiliated hospitals, workers' compensation, and employee health administration. In addition, the SSC administers a centralized investment program and defmed contribution pension plan on behalf of all HSHS entities.
The Foundation, an Illinois not-for-profit corporation, is an entity whose purpose is to solicit and administer philanthropic funds. The Foundation is structured into 14 separate divisions to administer restricted and unrestricted gifts and bequests at each of the respective hospital locations and the SSC.
Kiara, Inc., an Illinois for-profit corporation, provides a vehicle for joint ventures with physicians and an entry into those health related services, which do not qualify as tax-exempt services, such as pharmacy, durable medical equipment, nonaffiliate electronic health records (EHR) implementations, and real estate holdings. Kiara, Inc. is the holding company of three subsidiary corporations in which it is the sole stockholder, LaSante, Inc., LaSante Wisconsin, Inc., and Prairie Cardiovascular Consultants, Inc. (PCC). The operations of these three wholly owned subsidiaries are consolidated into the fmancial statements of Kiara, Inc. In connection with the acquisition of PCC, $3,372 and $5,059 is still payable at June 30, 2013 and 2012, respectively, and is a component of other noncurrent liabilities in the accompanying consolidated balance sheets.
All significant intercompany transactions have been eliminated in consolidation.
(2) Summary of Significant Accounting Policies
The significant accounting policies ofHSHS are as follows:
(a) Presentation
For purposes of display, transactions deemed by management to be ongoing, major, or central to the provision of healthcare services are reported as revenues and expenses. Peripheral or incidental transactions are reported as nonoperating gains or losses. Nonoperating gains or losses include investment income, other than that which is associated with self-insurance programs, or funds held by trustee under indenture agreements, settlements on derivative instruments, loss on conversion and early extinguishment of debt, and the change in fair value of the interest rate swap agreements.
(b) Use of Estimates
The preparation of consolidated fmancial statements in conformity with U.S. generally accepted accounting principles requires management to make estimates and assumptions that affect the reported amounts of assets and liabilities and disclosure of contingent assets and liabilities at the date of the consolidated fmancial statements. Estimates also affect the reported amounts of revenues and expenses during the reporting period. Significant estimates include allowances for contractual allowances and bad debts, third-party payor settlements, valuation of investments, recoverability of property, plant, and equipment, self-insurance liabilities, derivative instruments, accrued benefit liability, and other liabilities. Actual results could differ from those estimates.
8 (Continued)

HOSPITAL SISTERS HEALTH SYSTEM AND SUBSIDIARIES Springfield, Illinois
Notes to Consolidated Financial Statements
(c) Cash and Cash Equivalents
June 30,2013 and 2012
(Dollars in thousands)
Cash and cash equivalents include investments in highly liquid debt instruments with a maturity of three months or less when purchased, excluding those amounts included as assets whose use is limited or restricted.
(d) Assets Whose Use is Limited or Restricted
Assets whose use is limited or restricted include assets set aside by the board of directors for future capital improvements, over which the board of directors retains control and may at its discretion subsequently use for other purposes; assets held by third-party trustees under indenture agreements; and funds temporarily or permanently restricted by donors. Management classifies the current portion of assets whose use is limited or restricted based on the approximate amount of the current portion of long-term debt.
Investments in equity securities with readily determinable values and all investments in debt securities are measured at fair value in the accompanying consolidated balance sheets. Investment income on assets associated with self-insurance programs or assets deposited in funds held by trustee under indenture agreements is reported as other revenues. Investment income from all other investments is reported as nonoperating gains - investment income, unless the income or loss is restricted by donor or law. Changes in net unrealized gains and losses on investments are included in revenues and gains (losses) in excess (deficient) of expenses and losses as all investments are considered to be trading securities.
(e) Inventories
Inventories are stated at the lower of cost or market. Cost is determined on a first-in, first-out basis.
(f) Property, Plant, and Equipment
Property, plant, and equipment additions are stated at cost or fair value at the date of acquisition or donation. Depreciation is provided over the estimated useful life of each class of depreciable asset and is computed using the straight-line method of accounting. Interest cost incurred on borrowed funds during the period of construction of capital assets is capitalized as a component of the cost of acquiring those assets. Capitalized interest is reduced by the amount of investment income earned on unexpended proceeds from project specific borrowings.
(g) Long-Lived Assets
Long-lived assets (including property, plant, and equipment) are periodically assessed for recoverability based on the occurrence of a significant adverse event or change in the environment in which HSHS operates or if the expected future cash flows (undiscounted and without interest) would become less than the carrying amount of the asset. An impairment loss would be recorded in the period such determination is made based on the fair value of the related entity. No impairments were recorded for the years ended June 30, 2013 and 2012.
9 (Continued)
HOSPITAL SISTERS HEALTH SYSTEM AND SUBSIDIARIES Springfield, Illinois
Notes to Consolidated Financial Statements
(h) Other Assets - Joint Ventures
June 30, 2013 and 2012
(Dollars in thousands)
HSHS invests in various organizations that are not wholly owned or controlled by HSHS. Investments in affiliates in which HSHS has significant influence but does not control are reported on the equity method of accounting, which represents HSHS' equity in the underlying net book value. The equity method of accounting is discontinued when the investment is reduced to zero unless HSHS has guaranteed the obligations of the organization or is committed to provide additional capital support. There were no existing guarantees at June 30, 2013 or 2012.
(i) Loss Reserves
HSHS is self-insured for professional and general liability, workers' compensation, and employee health claims. The provisions for loss reserves include the ultimate cost for both reported losses and losses incurred, but not reported as of the respective consolidated balance sheet dates.
The liability for loss reserves represents an estimate of the ultimate net cost of all such amounts that are unpaid at the consolidated balance sheet dates. The liability is based on projections and the historical claim experience of HSHS and gives effect to estimates of trends. Although management believes that the estimate of the liability for claims is reasonable, it is possible that HSHS' actual incurred claims will not conform to the assumptions' inherent variability with respect to the significant assumptions utilized. Accordingly, the ultimate settlement of claims may vary from the liability for unpaid claims included in the accompanying consolidated fmancial statements.
(j) Derivative Instruments
HSHS accounts for derivatives and hedging activities in accordance with Financial Accounting Standards Board Accounting Standards Codification (ASC) Subtopic 815-10, Accounting for Derivative Instruments and Hedging Activities, which requires that an entity recognize all derivatives as either assets or liabilities in the consolidated balance sheet and measure those instruments at fair value. HSHS is involved in various interest rate swaps. The fair value of the interest rate swap programs is included as derivative instruments in the accompanying consolidated balance sheets. For HSHS, the derivatives are not designated as hedge instruments, and therefore, settlements on derivative instruments and the change in fair values of the interest rate swap agreements are recognized in the consolidated statements of operations as a component of nonoperating gains (losses).
(k) Asbestos Removal Costs
HSHS accounts for asbestos removal costs in accordance with ASC Subtopic 410-20, Accountingfor Conditional Asset Retirement Obligations. ASC Subtopic 410-20 requires the current recognition of a liability when a legal obligation exists to perform an asset retirement obligation (ARO) in which the timing or method of settlement is conditional on a future event that mayor may not be under the control of the entity. ASC Subtopic 410-20 requires an ARO liability be recorded at its net present value with recognition of a related long-lived asset in a corresponding amount. The ARO liability is accreted through periodic charges to depreciation expense. The initially capitalized ARO long-lived
10 (Continued)
HOSPITAL SISTERS HEALTH SYSTEM AND SUBSIDIARIES Springfield, Illinois
Notes to Consolidated Financial Statements
June 30, 2013 and 2012
(Dollars in thousands)
asset is depreciated over the corresponding long-lived asset's remaining useful life. HSHS is legally liable to remove asbestos from existing buildings prior to future remodeling or demolishing of the existing hospital buildings. The estimated asbestos removal cost at June 30, 2013 and 2012 is $28,957 and $28,786, respectively, and is included within other noncurrent liabilities in the accompanying consolidated balance sheets. The net book value of the ARO long-lived asset at June 30, 2013 and 2012 is $553 and $742, respectively, and is included within other assets in the accompanying consolidated balance sheets.
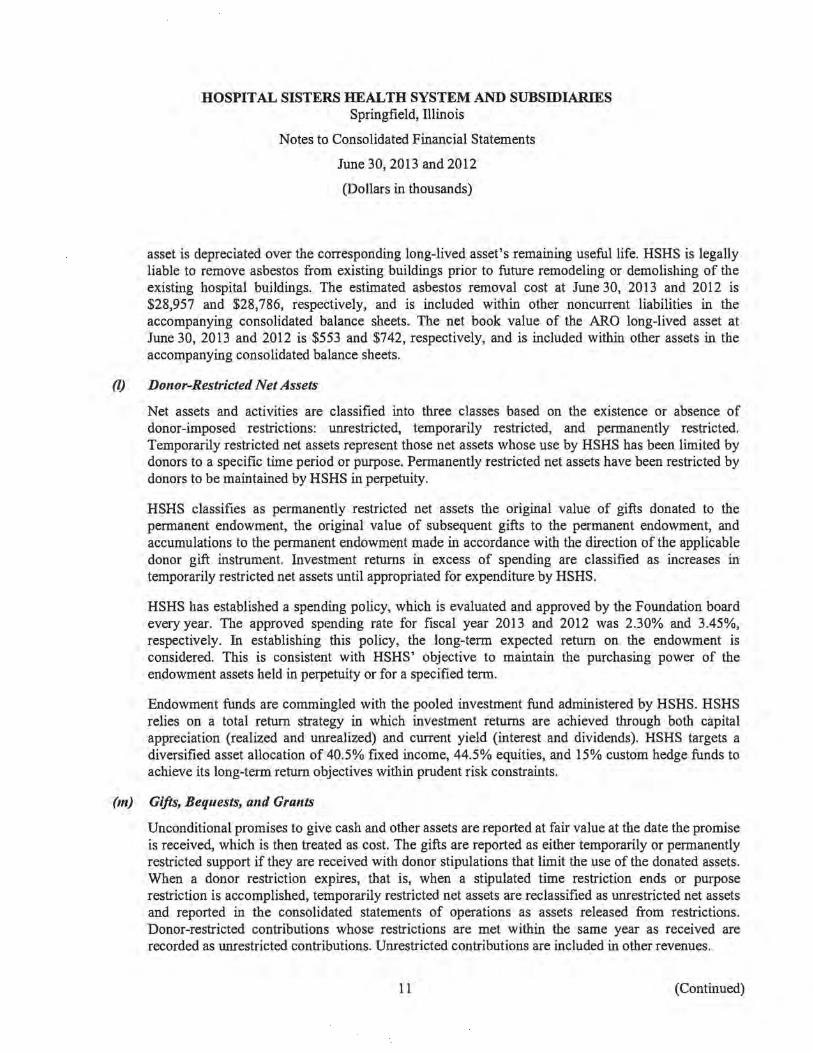
(l) Donor-Restricted Net Assets
Net assets and activities are classified into three classes based on the existence or absence of donor-imposed restrictions: unrestricted, temporarily restricted, and permanently restricted. Temporarily restricted net assets represent those net assets whose use by HSHS has been limited by donors to a specific time period or purpose. Permanently restricted net assets have been restricted by donors to be maintained by HSHS in perpetuity.
HSHS classifies as permanently restricted net assets the original value of gifts donated to the permanent endowment, the original value of subsequent gifts to the permanent endowment, and accumulations to the permanent endowment made in accordance with the direction of the applicable donor gift instrument. Investment returns in excess of spending are classified as increases in temporarily restricted net assets until appropriated for expenditure by HSHS.
HSHS has established a spending policy, which is evaluated and approved by the Foundation board every year. The approved spending rate for fiscal year 2013 and 2012 was 2.30% and 3.45%, respectively. In establishing this policy, the long-term expected return on the endowment is considered. This is consistent with HSHS' objective to maintain the purchasing power of the endowment assets held in perpetuity or for a specified term.
Endowment funds are commingled with the pooled investment fund administered by HSHS. HSHS relies on a total return strategy in which investment returns are achieved through both capital appreciation (realized and unrealized) and current yield (interest and dividends). HSHS targets a diversified asset allocation of 40.5% fixed income, 44.5% equities, and 15% custom hedge funds to achieve its long-term return objectives within prudent risk constraints.
(m) Gifts, Bequests, and Grants
Unconditional promises to give cash and other assets are reported at fair value at the date the promise is received, which is then treated as cost. The gifts are reported as either temporarily or permanently restricted support if they are received with donor stipulations that limit the use of the donated assets. When a donor restriction expires, that is, when a stipulated time restriction ends or purpose restriction is accomplished, temporarily restricted net assets are reclassified as unrestricted net assets and reported in the consolidated statements of operations as assets released from restrictions. Donor-restricted contributions whose restrictions are met within the same year as received are recorded as unrestricted contributions. Unrestricted contributions are included in other revenues.
11 (Continued)

HOSPITAL SISTERS HEALTH SYSTEM AND SUBSIDIARIES Springfield, Illinois
Notes to Consolidated Financial Statements
June 30,2013 and 2012
(Dollars in thousands)
Gifts of long-lived assets such as property, plant, and equipment are reported as unrestricted gifts and bequests and are excluded from revenues and gains (losses) in excess (deficient) of expenses, unless explicit donor stipulations specify how the donated assets must be used. Gifts of long-lived assets with explicit restrictions that specify how the assets are to be used and gifts of cash or other assets that must be used to acquire long-lived assets are reported as restricted contributions. In the absence of explicit donor stipulations about how long those long-lived assets must be maintained, expirations of donor restrictions are reported when the donated or acquired long-lived assets are placed in servIce.
(n) Net Patient Service Revenues
Net patient service revenues are reported at the estimated net realizable amounts due from patients, third-party payors, and others for services rendered, including estimated retroactive adjustments under reimbursement agreements with third-party payors and amounts received under the Medicaid assessment tax programs. Retroactive adjustments are accrued on an estimated basis in the period the related services are rendered and adjusted in future periods as fmal settlements are determined.
Effective July 1, 2012, HSHS adopted the provisions of Financial Accounting Standards Board (FASB) Accounting Standards Update (ASU) No. 2011-07, Presentation and Disclosure of Patient Service Revenue, Provision for Bad Debts, and the Allowance for Doubtful Accounts for Certain Health Care Entities. ASU 2011-07 requires that entities that recognize significant amounts of patient service revenue at the time the services are rendered even though they do not assess the patient's ability to pay must present the provision for bad debts related to patient service revenue as a deduction from patient service revenue (net of contractual allowances and discounts) on their statement of operations. The provision for uncollectible accounts on the accompanying consolidated statements of operations for the years ended June 30, 2013 and 2012 has been presented on a separate line as a deduction from net patient service revenue.
(0) Charity Care
HSHS provides care to patients who meet certain criteria under its charity care policy without charge or at amounts less than its established rates. Amounts determined to qualify as charity care are not reported as net patient service revenues, since HSHS does not pursue collection of such amounts.
(P) Revenues and Gains (Losses) in Excess (Deficient) of Expenses
The consolidated statements of operations include revenues and gains (losses) in excess (deficient) of expenses. Changes in unrestricted net assets that are excluded from revenues and gains (losses) in excess (deficient) of expenses, consistent with industry practice, include: contributions of property, plant, and equipment (including assets acquired using contributions that by donor restrictions or grants were to be used for the purpose of acquiring such assets); nonreciprocal transfer to affiliate for other than goods and services; and (recognition) reversal of change in pension funded status.
12 (Continued)

HOSPITAL SISTERS HEALTH SYSTEM AND SUBSIDIARIES Springfield, Illinois
(q) Income Taxes
Notes to Consolidated Financial Statements
June 30,2013 and 2012
(Dollars in thousands)
HSHS and the Foundation are Illinois not-for-profit organizations as described in Section 501(c)(3) of the Internal Revenue Code (the Code) and are exempt from federal income taxes on related income pursuant to Section 501(a) of the Code. Kiara, Inc. is an Illinois for-profit corporation that recognizes income taxes under the asset and liability method. Deferred tax assets and liabilities are recognized for the future tax consequences attributable to differences between the consolidated fmancial statement carrying amounts of existing assets and liabilities and their respective tax basis and operating loss and tax credit carryforwards. Deferred tax assets and liabilities are measured using the enacted tax rates expected to apply to taxable income in the years in which those temporary differences are expected to be recovered or settled. The effect on deferred tax assets and liabilities of a change in tax rates is recognized in income in the period that includes the enactment date.
HSHS has adopted ASC Subtopic 740-10, Accounting for Uncertainty in Income Taxes - an Interpretation of FASB Statement No. 109. ASC Subtopic 740-10 addresses the determination of how tax benefits claimed or expected to be claimed on a tax return should be recorded in the consolidated fmancial statements. Under ASC Subtopic 740-10, HSHS must recognize the tax benefit from an uncertain tax position only if it is more likely than not that the tax position will be sustained on examination by the taxing authorities, based on the technical merits of the position. The tax benefits recognized in the consolidated fmancial statements from such a position are measured based on the largest benefit that has a greater than 50% likelihood of being realized upon ultimate settlement. ASC Subtopic 740-10 also provides guidance on derecognition, classification, interest and penalties on income taxes, and accounting in interim periods and requires increased disclosures. As of June 30, 2013 and 2012, HSHS does not have an asset or liability for unrecognized tax benefits.
(r) Fair Vallie
HSHS has adopted the provisions of ASC Topic 820, Fair Value Measurements, for fair value measurements of fmancial assets and fmancial liabilities and for fair value measurements of nonfmancial items that are recognized or disclosed at fair value in the fmancial statements on a recurring basis. ASC Topic 820 defmes fair value as the price that would be received to sell an asset or paid to transfer a liability in an orderly transaction between market participants at the measurement date. ASC Topic 820 also establishes a framework for measuring fair value and expands disclosures about fair value measurements.
In conjunction with the adoption of ASC Topic 820, HSHS adopted the measurement provisions of ASU 2009-12, Investments in Certain Entities That Calculate Net Asset Value per Share (or Its Equivalent), to certain investments in funds that do not have readily determinable fair values including private investments, hedge funds, real estate, and other funds. This guidance amends ASC Topic 820 and allows for the estimation of the fair value of investments in investment companies for which the investment does not have a readily determinable fair value using net asset value (NA V) per share or its equivalent.
13 (Continued)

HOSPITAL SISTERS HEALTH SYSTEM AND SUBSIDIARIES Springfield, Illinois
Notes to Consolidated Financial Statements
(s) EHR Incentive Program
June 30, 2013 and 2012
(Dollars in thousands)
The ERR Incentive Program (the Program) provides incentive payments to eligible hospitals and professionals as they adopt, implement, upgrade, or demonstrate meaningful use of certified EHR technology in their first year of participation and demonstrate meaningful use for up to five remaining participation years. HSHS accounts for the Program using the grant model. HSHS applies the "ratable recognition" approach, which states that the grant income can be recognized ratably over the entire EHR reporting period once a "reasonable assurance" income recognition threshold is met. For the years ended June 30,2013 and 2012, HSHS recognized $31,800 and $4,181, respectively, as other revenue related to ERR incentives, which have been received or are expected to be received based on certifications prepared by management under the appropriate guidelines for year 1 and year 2 payments.
(3) Community Benefit
Consistent with its mission, HSHS provides medical care to all patients regardless of their ability to pay. In addition, HSHS provides services intended to benefit the poor and underserved, including those persons who cannot afford health insurance because of inadequate resources and/or are uninsured or underinsured, and to enhance the health status of the communities in which it operates.
The following summary has been prepared in accordance with the Catholic Health Association of the United States' (CRA) policy document, A Guide/or Planning and Reporting Community Benefit, released in May 2006. HSHS uses a cost-to-charge ratio to calculate the cost of charity care and the unpaid cost of Medicaid. The amounts in the following table reflect the quantifiable costs of HSHS' community benefit for the years ended June 30, 2013 and 2012:
Benefits for the poor: Charity care at cost Unpaid cost of Medicaid and other public programs Community health services Other
Benefits for the broader community: Community health services Health professions education Other
Total community benefit
14
$
2013
45,974 104,232
1,657 1,798
153,661
4,451 15,558 13,083
33,092
186,753
2012
43,076 97,878
1,322 766
143,042
4,443 15,895 10,772
31,110
174,152
(Continued)
HOSPITAL SISTERS HEALTH SYSTEM AND SUBSIDIARIES Springfield, Illinois
Notes to Consolidated Financial Statements
June 30, 2013 and 2012
(Dollars in thousands)
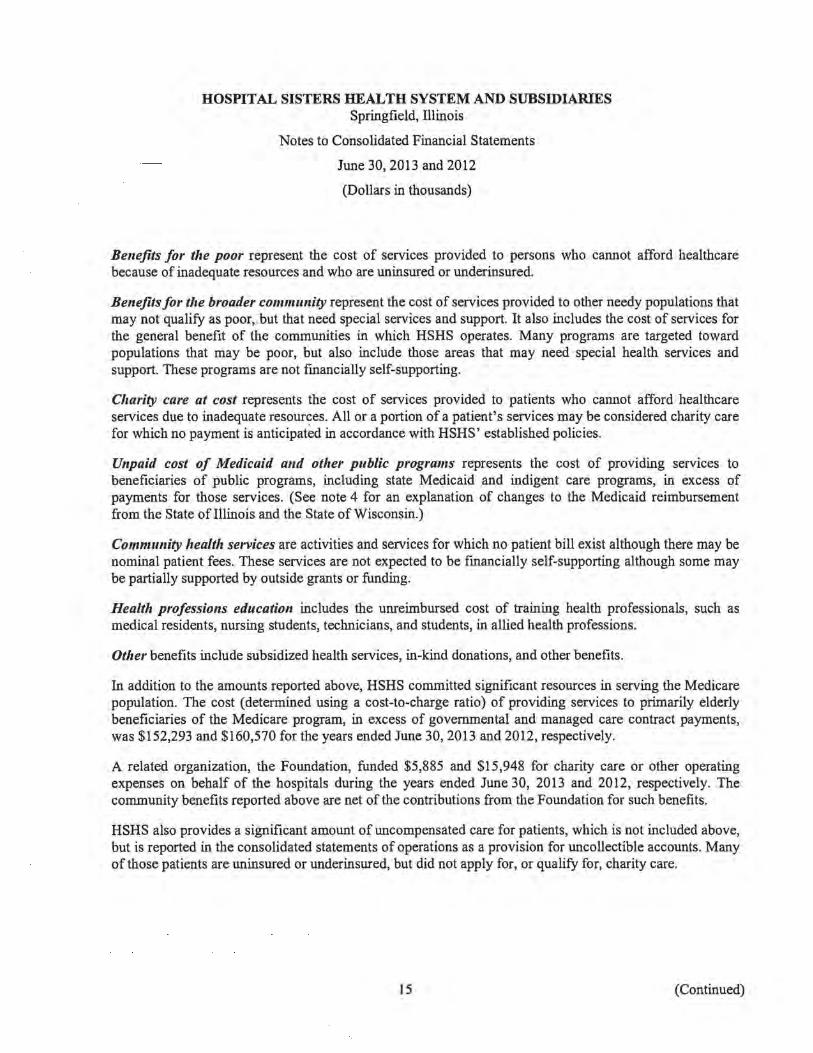
Benefits for the poor represent the cost of services provided to persons who cannot afford healthcare because of inadequate resources and who are uninsured or underinsured.
Benefits for the broader community represent the cost of services provided to other needy populations that may not qualify as poor, but that need special services and support. It also includes the cost of services for the general benefit of the communities in which HSHS operates. Many programs are targeted toward populations that may be poor, but also include those areas that may need special health services and support. These programs are not fmancially self-supporting.
Charity care at cost represents the cost of services provided to patients who cannot afford healthcare services due to inadequate resources. All or a portion of a patient's services may be considered charity care for which no payment is anticipated in accordance with HSHS' established policies.
Unpaid cost of Medicaid and other pllblic programs represents the cost of providing services to beneficiaries of public programs, including state Medicaid and indigent care programs, in excess of payments for those services. (See note 4 for an explanation of changes to the Medicaid reimbursement from the State of Illinois and the State of Wisconsin.)
Community health services are activities and services for which no patient bill exist although there may be nominal patient fees. These services are not expected to be fmancially self-supporting although some may be partially supported by outside grants or funding.
Health professions education includes the unreimbursed cost of training health professionals, such as medical residents, nursing students, technicians, and students, in allied health professions.
Other benefits include subsidized health services, in-kind donations, and other benefits.
In addition to the amounts reported above, HSHS committed significant resources in serving the Medicare population. The cost (determined using a cost-to-charge ratio) of providing services to primarily elderly beneficiaries of the Medicare program, in excess of governmental and managed care contract payments, was $152,293 and $160,570 for the years ended June 30, 2013 and 2012, respectively.
A related organization, the Foundation, funded $5,885 and $15,948 for charity care or other operating expenses on behalf of the hospitals during the years ended June 30, 2013 and 2012, respectively. The community benefits reported above are net of the contributions from the Foundation for such benefits.
HSHS also provides a significant amount of uncompensated care for patients, which is not included above, but is reported in the consolidated statements of operations as a provision for uncollectible accounts. Many of those patients are uninsured or underinsured, but did not apply for, or qualify for, charity care.
15 (Continued)
HOSPITAL SISTERS HEALTH SYSTEM AND SUBSIDIARIES Springfield, Illinois
Notes to Consolidated Financial Statements
(4) Net Patient Service Revenues
June 30, 2013 and 2012
(Dollars in thousands)
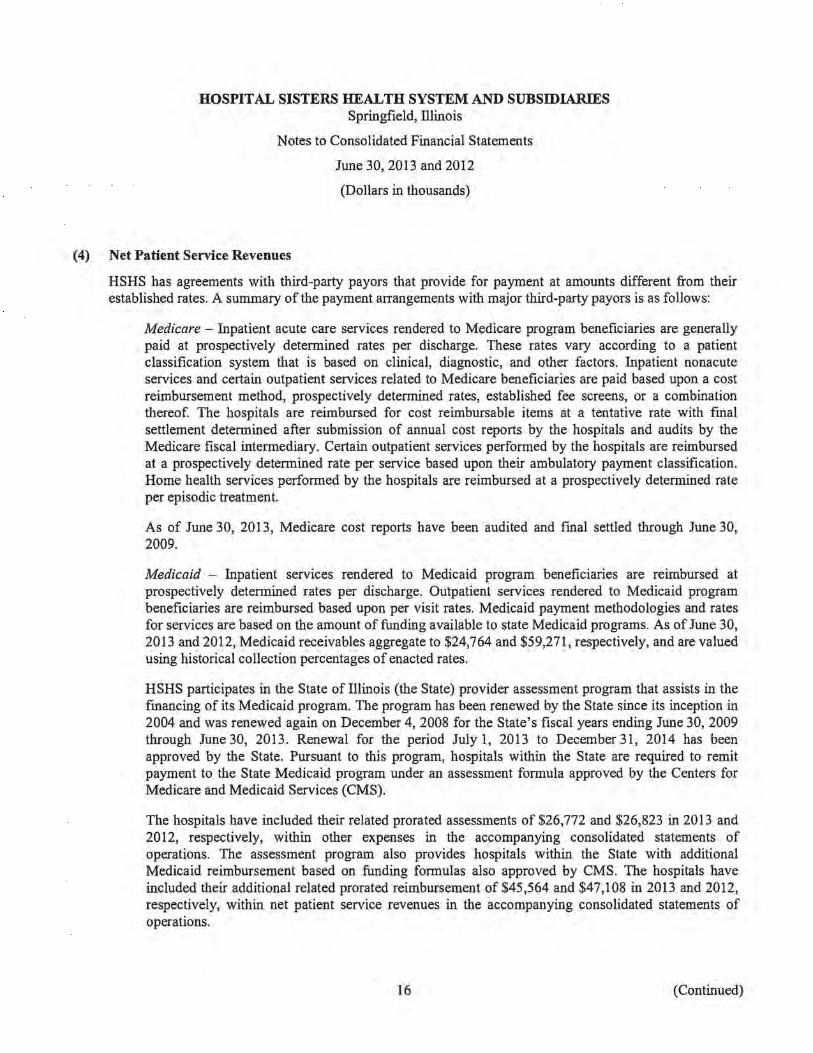
HSHS has agreements with third-party payors that provide for payment at amounts different from their established rates. A summary of the payment arrangements with major third-party payors is as follows:
Medicare - Inpatient acute care services rendered to Medicare program beneficiaries are generally paid at prospectively determined rates per discharge. These rates vary according to a patient classification system that is based on clinical, diagnostic, and other factors. Inpatient nona cute services and certain outpatient services related to Medicare beneficiaries are paid based upon a cost reimbursement method, prospectively determined rates, established fee screens, or a combination thereof. The hospitals are reimbursed for cost reimbursable items at a tentative rate with fmal settlement determined after submission of annual cost reports by the hospitals and audits by the Medicare fiscal intermediary. Certain outpatient services performed by the hospitals are reimbursed at a prospectively determined rate per service based upon their ambulatory payment classification. Home health services performed by the hospitals are reimbursed at a prospectively determined rate per episodic treatment.
As of June 30, 2013, Medicare cost reports have been audited and fmal settled through June 30, 2009.
Medicaid - Inpatient services rendered to Medicaid program beneficiaries are reimbursed at prospectively determined rates per discharge. Outpatient services rendered to Medicaid program beneficiaries are reimbursed based upon per visit rates. Medicaid payment methodologies and rates for services are based on the amount of funding available to state Medicaid programs. As of June 30, 2013 and 2012, Medicaid receivables aggregate to $24,764 and $59,271, respectively, and are valued using historical collection percentages of enacted rates.
HSHS participates in the State of Illinois (the State) provider assessment program that assists in the fmancing of its Medicaid program. The program has been renewed by the State since its inception in 2004 and was renewed again on December 4,2008 for the State's fiscal years ending June 30,2009 through June 30, 2013. Renewal for the period July 1, 2013 to December 31, 2014 has been approved by the State. Pursuant to this program, hospitals within the State are required to remit payment to the State Medicaid program under an assessment formula approved by the Centers for Medicare and Medicaid Services (CMS).
The hospitals have included their related prorated assessments of $26,772 and $26,823 in 2013 and 2012, respectively, within other expenses in the accompanying consolidated statements of operations. The assessment program also provides hospitals within the State with additional Medicaid reimbursement based on funding formulas also approved by CMS. The hospitals have included their additional related prorated reimbursement of $45,564 and $47,108 in 2013 and 2012, respectively, within net patient service revenues in the accompanying consolidated statements of operations.
16 (Continued)
HOSPITAL SISTERS HEALTH SYSTEM AND SUBSIDIARIES Springfield, Illinois
Notes to Consolidated Financial Statements
June 30, 2013 and 2012
(Dollars in thousands)
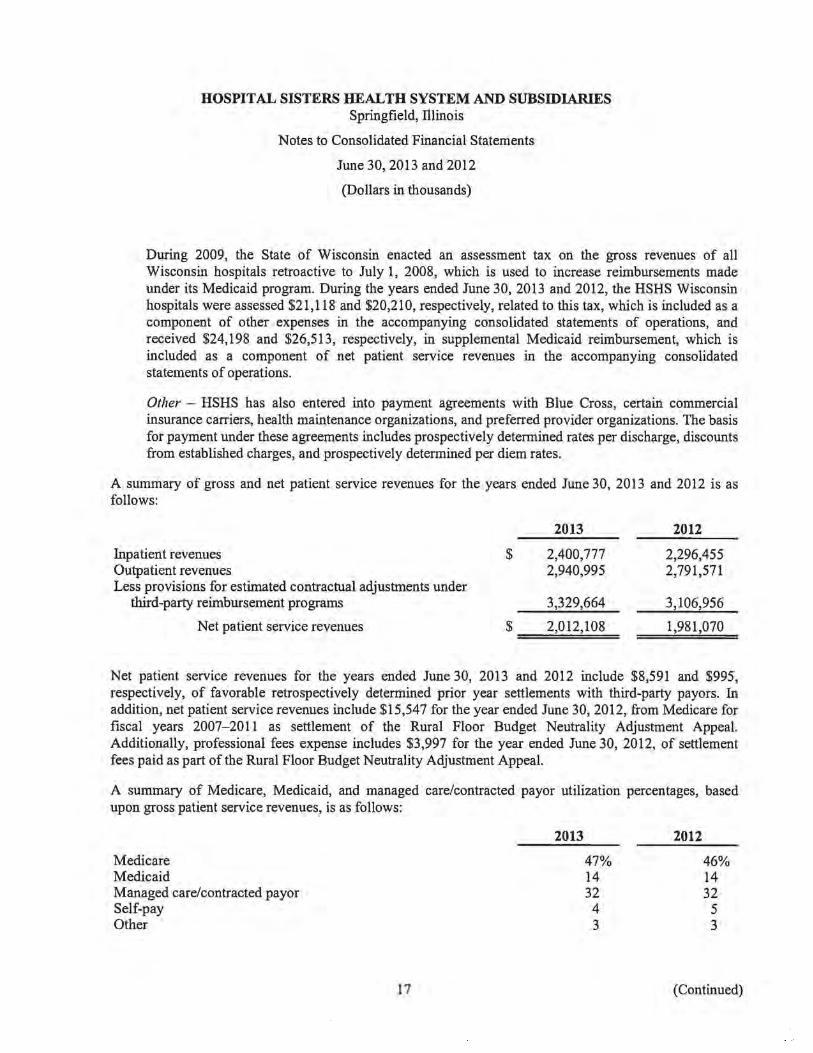
During 2009, the State of Wisconsin enacted an assessment tax on the gross revenues of all Wisconsin hospitals retroactive to July 1, 2008, which is used to increase reimbursements made under its Medicaid program. During the years ended June 30,2013 and 2012, the HSHS Wisconsin hospitals were assessed $21,118 and $20,210, respectively, related to this tax, which is included as a component of other expenses in the accompanying consolidated statements of operations, and received $24,198 and $26,513, respectively, in supplemental Medicaid reimbursement, which is included as a component of net patient service revenues in the accompanying consolidated statements of operations.
Other - HSHS has also entered into payment agreements with Blue Cross, certain commercial insurance carriers, health maintenance organizations, and preferred provider organizations. The basis for payment under these agreements includes prospectively determined rates per discharge, discounts from established charges, and prospectively determined per diem rates.
A summary of gross and net patient service revenues for the years ended June 30, 2013 and 2012 is as follows:
2013 2012
Inpatient revenues $ 2,400,777 2,296,455 Outpatient revenues 2,940,995 2,791,571 Less provisions for estimated contractual adjustments under
third-party reimbursement programs 3,329,664 3,106,956
Net patient service revenues $ 2,012,108 1,981,070
Net patient service revenues for the years ended June 30, 2013 and 2012 include $8,591 and $995, respectively, of favorable retrospectively determined prior year settlements with third-party payors. In addition, net patient service revenues include $15,547 for the year ended June 30, 2012, from Medicare for fiscal years 2007-2011 as settlement of the Rural Floor Budget Neutrality Adjustment Appeal. Additionally, professional fees expense includes $3,997 for the year ended June 30, 2012, of settlement fees paid as part of the Rural Floor Budget Neutrality Adjustment Appeal.
A summary of Medicare, Medicaid, and managed care/contracted payor utilization percentages, based upon gross patient service revenues, is as follows:
Medicare Medicaid Managed care/contracted payor Self-pay Other
2013
17
47% 14 32 4 3
2012
46% 14 32
5 3
(Continued)

HOSPITAL SISTERS HEALTH SYSTEM AND SUBSIDIARIES Springfield, Illinois
Notes to Consolidated Financial Statements
June 30, 2013 and 2012
(Dollars in thousands)
Patients' accounts receivable are reduced by an allowance for uncollectible accounts. In evaluating the collectibility of patients' accounts receivable, HSHS analyzes its past history and identifies trends for each of its major payor sources of revenue to estimate the appropriate allowance for uncollectible accounts and provision for bad debts. Management regularly reviews data about these major payor sources of revenue in evaluating the sufficiency of the allowance for doubtful accounts. For receivables associated with services provided to patients who have third-party coverage, HSHS analyzes contractually due amounts and provides an allowance for doubtful accounts and a provision for bad debts, if necessary (e.g., for expected uncollectible deductibles and co-payments on accounts for which the third-party payor has not yet paid, or for payors who are known to be having fmancial difficulties that make the realization of amounts due unlikely). For receivables associated with self-pay patients (which includes both patients without insurance and patients with deductible and co-payment balances due for which third-party coverage exists for part of the bill), HSHS records a significant provision for bad debts in the period of service on the basis of its past experience, which indicates that many patients are unable or unwilling to pay the portion of their bill for which they are fmancially responsible. The difference between the standard rates (or the discounted rates if negotiated) and the amounts actually collected after all reasonable collection efforts have been exhausted is charged off against the allowance for doubtful accounts.
HSHS' allowance for uncollectible accounts for self-pay patients increased from 81.0% of self-pay accounts receivable at June 30, 2012, to 81.7% of self-pay accounts receivable at June 30, 2013. In addition, HSHS' self-pay write-offs decreased $13,604 from $98,642 for fiscal year 2012 to $85,038 for fiscal year 2013. Both changes were the result of current trends experienced in the collection of amounts from self-pay patients in fiscal year 2013. HSHS has not substantially changed its charity care or uninsured discount policies during fiscal years 2012 or 2013. HSHS does not maintain a material allowance for uncollectible accounts from third-party payors, nor did it have significant write-offs from third-party payors.
18 (Continued)
HOSPITAL SISTERS HEALTH SYSTEM AND SUBSIDIARIES Springfield, Illinois
Notes to Consolidated Financial Statements
June 30,2013 and 2012
(Dollars in thousands)
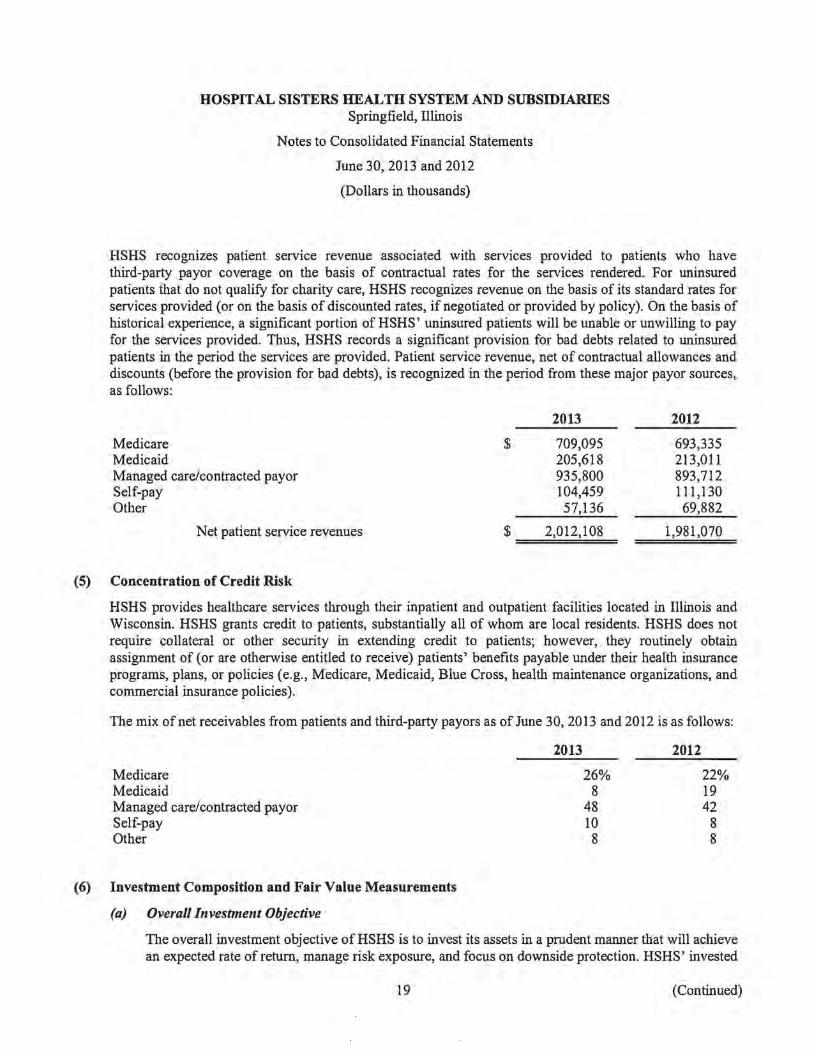
HSHS recognizes patient service revenue associated with services provided to patients who have third-party payor coverage on the basis of contractual rates for the services rendered. For uninsured patients that do not qualify for charity care, HSHS recognizes revenue on the basis of its standard rates for services provided (or on the basis of discounted rates, if negotiated or provided by policy). On the basis of historical experience, a significant portion of HSHS' uninsured patients will be unable or unwilling to pay for the services provided. Thus, HSHS records a significant provision for bad debts related to uninsured patients in the period the services are provided. Patient service revenue, net of contractual allowances and discounts (before the provision for bad debts), is recognized in the period from these major payor sources, as follows:
Medicare Medicaid Managed care/contracted payor Self-pay Other
Net patient service revenues
(5) Concentration of Credit Risk
2013
$ 709,095 205,618 935,800 104,459 57,136
2,012,108 $ ===========
2012
693,335 213,011 893,712 111,130 69,882
1,981,070
HSHS provides healthcare services through their inpatient and outpatient facilities located in Illinois and Wisconsin. HSHS grants credit to patients, substantially all of whom are local residents. HSHS does not require collateral or other security in extending credit to patients; however, they routinely obtain assignment of (or are otherwise entitled to receive) patients' benefits payable under their health insurance programs, plans, or policies (e.g., Medicare, Medicaid, Blue Cross, health maintenance organizations, and commercial insurance policies).
The mix of net receivables from patients and third-party payors as of June 30, 2013 and 2012 is as follows:
Medicare Medicaid Managed care/contracted payor Self-pay Other
(6) Investment Composition and Fair Value Measurements
(a) Overall Investment Objective
2013
26% 8
48 10 8
2012
22% 19 42
8 8
The overall investment objective of HSHS is to invest its assets in a prudent manner that will achieve an expected rate of return, manage risk exposure, and focus on downside protection. HSHS' invested
19 (Continued)
HOSPITAL SISTERS HEALTH SYSTEM AND SUBSIDIARIES Springfield, Illinois
Notes to Consolidated Financial Statements
June 30, 2013 and 2012
(Dollars in thousands)
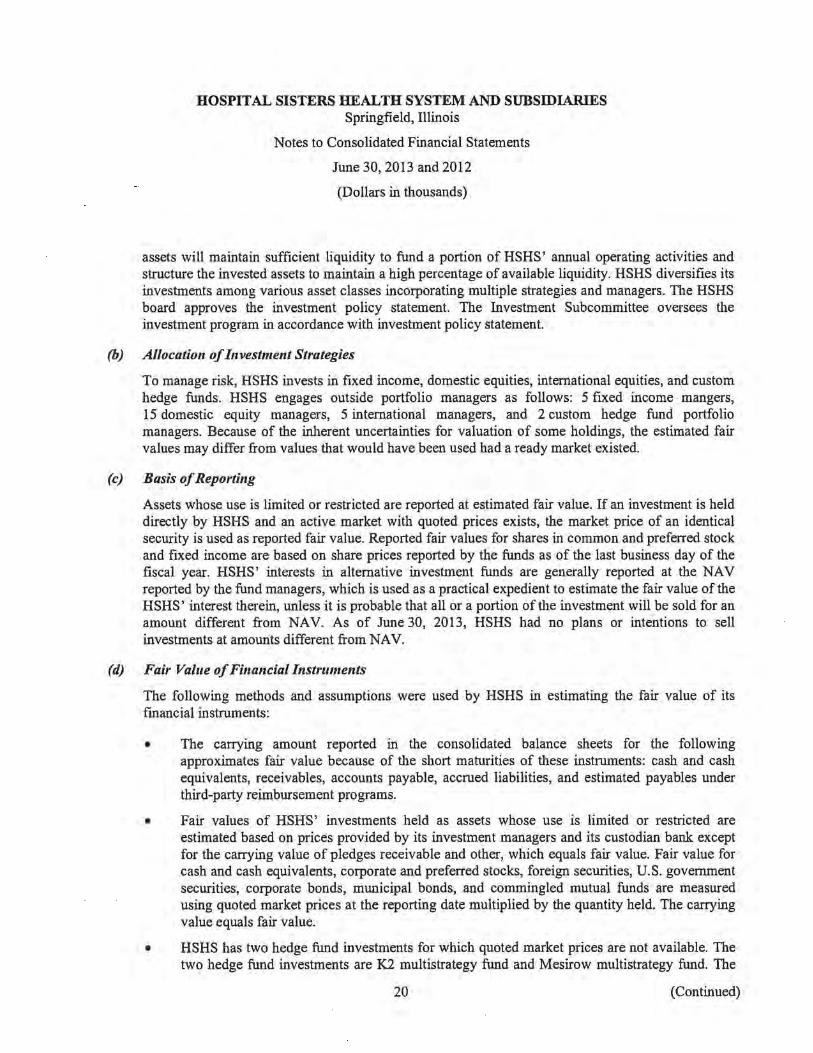
assets will maintain sufficient liquidity to fund a portion of HSHS' annual operating activities and structure the invested assets to maintain a high percentage of available liquidity. HSHS diversifies its investments among various asset classes incorporating multiple strategies and managers. The HSHS board approves the investment policy statement. The Investment Subcommittee oversees the investment program in accordance with investment policy statement.
(b) Allocation of Investment Strategies
To manage risk, HSHS invests in fixed income, domestic equities, international equities, and custom hedge funds. HSHS engages outside portfolio managers as follows: 5 fixed income mangers, 15 domestic equity managers, 5 international managers, and 2 custom hedge fund portfolio managers. Because of the inherent uncertainties for valuation of some holdings, the estimated fair values may differ from values that would have been used had a ready market existed.
(c) Basis of Reporting
Assets whose use is limited or restricted are reported at estimated fair value. If an investment is held directly by HSHS and an active market with quoted prices exists, the market price of an identical security is used as reported fair value. Reported fair values for shares in common and preferred stock and fixed income are based on share prices reported by the funds as of the last business day of the fiscal year. HSHS' interests in alternative investment funds are generally reported at the NAV reported by the fund managers, which is used as a practical expedient to estimate the fair value of the HSHS' interest therein, unless it is probable that all or a portion of the investment will be sold for an amount different from NAV. As of June 30, 2013, HSHS had no plans or intentions to sell investments at amounts different from NAV.
(d) Fair Vallie of Financial Instrllments
The following methods and assumptions were used by HSHS in estimating the fair value of its fmancial instruments:
• The carrying amount reported in the consolidated balance sheets for the following approximates fair value because of the short maturities of these instruments: cash and cash equivalents, receivables, accounts payable, accrued liabilities, and estimated payables under third-party reimbursement programs.
• Fair values of HSHS' investments held as assets whose use is limited or restricted are estimated based on prices provided by its investment managers and its custodian bank except for the carrying value of pledges receivable and other, which equals fair value. Fair value for cash and cash equivalents, corporate and preferred stocks, foreign securities, U.S. government securities, corporate bonds, municipal bonds, and commingled mutual funds are measured using quoted market prices at the reporting date multiplied by the quantity held. The carrying value equals fair value.
• HSHS has two hedge fund investments for which quoted market prices are not available. The two hedge fund investments are K2 multistrategy fund and Mesirow multi strategy fund. The
20 (Continued)

HOSPITAL SISTERS HEALTH SYSTEM AND SUBSIDIARIES Springfield, Illinois
Notes to Consolidated Financial Statements
June 30,2013 and 2012
(Dollars in thousands)
estimated fair value of these hedge fund investments includes estimates, appraisals, assumptions, and methods provided by external fmancial advisers and reviewed by HSHS.
The investment objective of the K2 multistrategy fund is to achieve equity type returns with reduced volatility and risk. This is achieved through a diversified portfolio targeting allocations of long strategies and low volatility strategies.
The investment objective of the Mesirow multistrategy fund is to achieve positive returns with low volatility and risk. This is achieved through a multimanager, multi strategy, and diversified investment approach.
• Fair value of fixed rate long-term debt is estimated based on the quoted market prices for the same or similar issues or on the current rates offered to HSHS for debt of the same remaining maturities. For variable rate debt, carrying amounts approximate fair value. Fair value was estimated using quoted market prices based upon HSHS' current borrowing rates for similar types of long-term debt securities.
• Fair value of interest rate swaps is determined using pricing models developed based on the LIBOR swap rate and other observable market data by fmancial advisers. The value was determined after considering the potential impact of collateralization and netting agreements, adjusted to reflect nonperformance risk of both the counterparty and HSHS. The carrying value equals fair value.
The preceding methods described may produce a fair value calculation that may not be indicative of net realizable value or reflective of future fair values. Furthermore, although HSHS believes its valuation methods are appropriate and consistent with other market participants, the use of different methodologies or assumptions to determine the fair value of certain fmancial instruments could result in a different fair value measurement at the reporting date.
The following table presents the carrying amounts and estimated fair values of HSHS' fmancial instruments not carried at fair value at June 30, 2013 :
Long-term debt $
(e) Fair Value Hierarchy
Carrying amount
618,086
2013
Fair value
615,920
Carrying amount
565,942
2012
Fair value
571,456
HSHS has adopted ASC Topic 820 for fair value measurements of fmancial assets and liabilities and for fair value measurements of nonfmancial items that are recognized or disclosed at fair value in the consolidated fmancial statements on a recurring basis. ASC Topic 820 establishes a fair value hierarchy that prioritizes the inputs to valuation techniques used to measure fair value. The hierarchy gives the highest priority to unadjusted quoted prices in active markets for identical assets or
21 (Continued)
HOSPITAL SISTERS HEALTH SYSTEM AND SUBSIDIARIES Springfield, Illinois
Notes to Consolidated Financial Statements
June 30,2013 and 2012
(Dollars in thousands)
liabilities (Levell measurements) and the lowest priority to measurements involving significant unobservable inputs (Level 3 measurements). The three levels of the fair value hierarchy are as follows:
• Levell inputs are quoted prices (unadjusted) in active markets for identical assets or liabilities that HSHS has the ability to access at the measurement date.
• Level 2 are observable inputs other than Levell prices such as quoted prices for similar assets or liabilities, quoted prices in markets that are not active; or other inputs that are observable or can be corroborated by observable market data for substantially the full term of the assets or liabilities.
• Level 3 inputs are unobservable inputs for the asset or liability.
The availability of observable market data is monitored to assess the appropriate classification of fmancial instruments within the fair value hierarchy. Changes in economic conditions or model-based valuation techniques may require the transfer of fmancial instruments from one fair value level to another. In such instances, the transfer is reported at the beginning of the reporting period. There were no transfers between Levell, Level 2, or Level 3 for the fiscal years ended June 30, 2013 and 2012.
22 (Continued)
HOSPITAL SISTERS HEALTH SYSTEM AND SUBSIDIARIES Springfield, Illinois
Notes to Consolidated Financial Statements
June 30, 2013 and 2012
(Dollars in thousands)
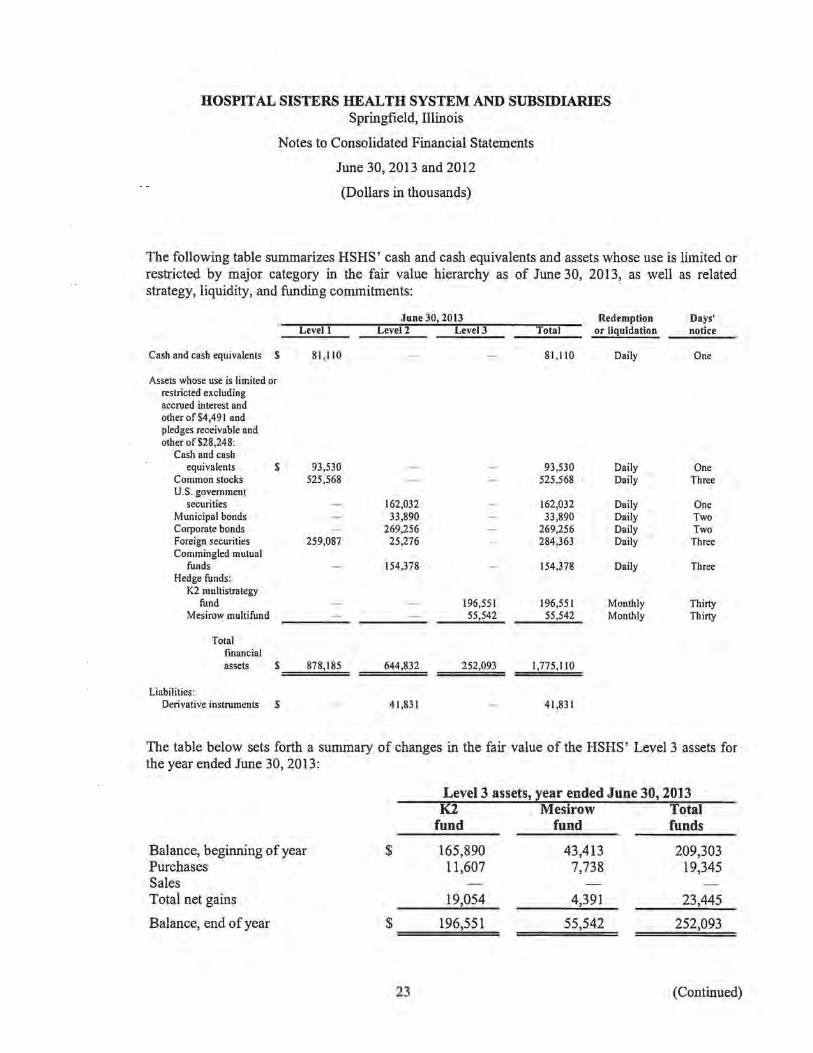
The following table summarizes HSHS' cash and cash equivalents and assets whose use is limited or restricted by major category in the fair value hierarchy as of June 30, 2013, as well as related strategy, liquidity, and funding commitments:
June 30,2013 Redemption Days' Levell Level 2 Level 3 Total or liquidation notice
Cash and cash equivalents $ 81,110 81,110 Daily One
Assets whose use is limited or restricted excluding accrued interest and other of$4,491 and pledges receivable and other of $28,248:
Cash and cash equivalents $ 93,530 93,530 Daily One
Common stocks 525,568 525,568 Daily Three U.S. government
securities 162,032 162,032 Daily One Municipal bonds 33,890 33,890 Daily Two Corporate bonds 269,256 269,256 Daily Two Foreign securities 259,087 25,276 284,363 Daily Three Commingled mutual
funds 154,378 154,378 Daily Three Hedge funds:
K2 multistrategy fund 196,551 196,551 Monthly Thirty
Mesirow multi fund 55,542 55,542 Monthly Thirty
Total financial assets $ 878,185 644,832 252,093 1,775,110
Liabilities: Derivative instruments $ 41,831 41,831
The table below sets forth a summary of changes in the fair value of the HSHS' Level 3 assets for the year ended June 30, 2013:
Balance, beginning of year Purchases Sales Total net gains
Balance, end of year
$
Level 3 assets, year ended June 30, 2013 K2 Mesirow Total
fund fund funds
165,890 11,607
19,054
43,413 7,738
4,391
209,303 19,345
23,445
$ ==1 ..... 96=,5::::5 .... 1 = 55,542 252,093
23 (Continued)

HOSPITAL SISTERS HEALTH SYSTEM AND SUBSIDIARIES Springfield, Illinois
Notes to Consolidated Financial Statements
June 30, 2013 and 2012
(Dollars in thousands)
The following table summarizes HSHS' cash and cash equivalents and assets whose use is limited or restricted by major category in the fair value hierarchy as of June 30, 2012, as well as related strategy, liquidity, and funding commitments:
June 30,2012 Redemption Days' Levell Level i Level 3 Total or Iiguidation notice
Cash and cash equivalents $ 90,514 90,514 Daily One
Assets whose use is limited or restricted excluding accrued interest and other of $8,666 and pledges receivable and other of $22, 127:
Cash and cash equivalents $ 114,831 114,831 Daily One
Common stocks 443,162 443,162 Daily Three u.s. government
securities 296,522 296,522 Daily One Municipal bonds 33,879 33,879 Daily Two Corporate bonds 121,931 121,931 Daily Two Foreign securities 217,740 27,460 245,200 Daily Three Commingled mutual
funds 152,837 152,837 Daily Three Hedge funds:
K2 multistrategy fund 165,890 165,890 Monthly Thirty
Mesirow multi fund 43,413 43,413 Monthly Thirty
Total financial assets $ 775,733 632,629 209,303 1,617,665
Liabilities: Derivative instruments $ 64,437 64,437
The table below sets forth a summary of changes in the fair value of the HSHS' Level 3 assets for the year ended June 30, 2012:
Balance, beginning of year Purchases Total net gains (losses) Sales
Balance, end of year
$
Level 3 assets, year ended June 30, 2012 K2 Mesirow Total
fund fund funds
166,400 (510)
41,600 1,813
208,000 1,303
$ 165,890 ======
43,413 209,303
24 (Continued)

HOSPITAL SISTERS HEALTH SYSTEM AND SUBSIDIARIES Springfield, Illinois
Notes to Consolidated Financial Statements
June 30,2013 and 2012
(Dollars in thousands)
A summary of assets whose use is limited or restricted as of June 30,2013 and 2012 is as follows:
Assets whose use is limited or restricted: By the board for capital improvements $ Funds held by trustee under indenture agreements Funds held by trustee for self-insurance Funds held by RQIL Funds temporarily restricted by donors Investments held at the Foundation
Total assets whose use is limited or restricted $
2013 2012
1,547,405 1,375,077 34,723
90,251 83,710 73,541 64,051
463 425 96,189 90,472
1,807,849 =========
1,648,458
The composition of investment return for the years ended June 30, 2013 and 2012 is as follows:
Investment return: Interest and dividend income Net realized gains on sale of investments Change in net unrealized gains and losses
Total investment return
$
2013
22,883 40,538 69,286
$ ===13=2=,7=07=
2012
29,548 58,743
(63,563)
24,728
Investment returns are included in the accompanying consolidated statements of operations and changes in net assets for the years ended June 30, 2013 and 2012 as follows:
Other revenues - investment income Nonoperating gains - investment income Temporarily restricted net assets - investment income Permanently restricted net assets - investment income
(loss) Interest income capitalized as part of construction in
progress
Total investment return
25
$
2013 2012
2,751 786 128,782 23,565
1,182 308
(9) 28
1 41
132,707 24,728
(Continued)
HOSPITAL SISTERS HEALTH SYSTEM AND SUBSIDIARIES Springfield, Illinois
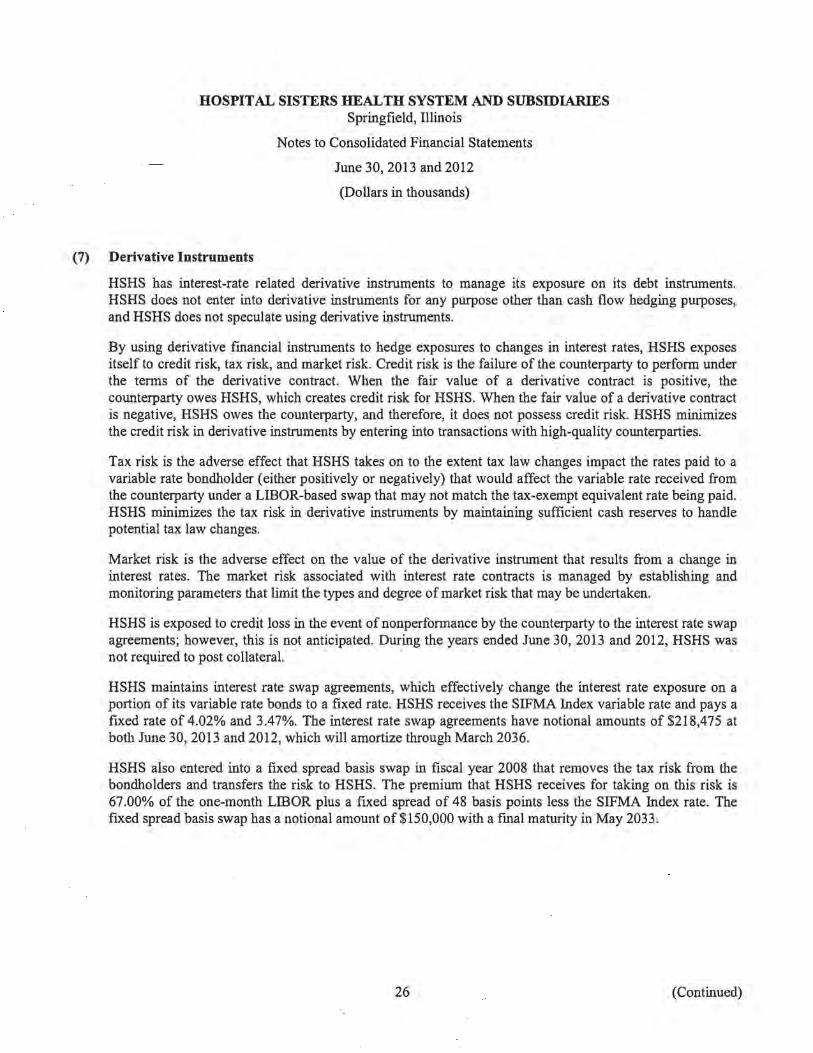
(7) Derivative Instruments
Notes to Consolidated Financial Statements
June 30,2013 and 2012
(Dollars in thousands)
HSHS has interest-rate related derivative instruments to manage its exposure on its debt instruments. HSHS does not enter into derivative instruments for any purpose other than cash flow hedging purposes, and HSHS does not speculate using derivative instruments.
By using derivative [mancial instruments to hedge exposures to changes in interest rates, HSHS exposes itself to credit risk, tax risk, and market risk. Credit risk is the failure of the counterparty to perform under the terms of the derivative contract. When the fair value of a derivative contract is positive, the counterparty owes HSHS, which creates credit risk for HSHS. When the fair value of a derivative contract is negative, HSHS owes the counterparty, and therefore, it does not possess credit risk. HSHS minimizes the credit risk in derivative instruments by entering into transactions with high-quality counterparties.
Tax risk is the adverse effect that HSHS takes on to the extent tax law changes impact the rates paid to a variable rate bondholder (either positively or negatively) that would affect the variable rate received from the counterparty under a LIBOR-based swap that may not match the tax-exempt equivalent rate being paid. HSHS minimizes the tax risk in derivative instruments by maintaining sufficient cash reserves to handle potential tax law changes.
Market risk is the adverse effect on the value of the derivative instrument that results from a change in interest rates. The market risk associated with interest rate contracts is managed by establishing and monitoring parameters that limit the types and degree of market risk that may be undertaken.
HSHS is exposed to credit loss in the event of nonperformance by the counterparty to the interest rate swap agreements; however, this is not anticipated. During the years ended June 30,2013 and 2012, HSHS was not required to post collateral.
HSHS maintains interest rate swap agreements, which effectively change the interest rate exposure on a portion of its variable rate bonds to a fixed rate. HSHS receives the SIFMA Index variable rate and pays a fixed rate of 4.02% and 3.47%. The interest rate swap agreements have notional amounts of $218,475 at both June 30,2013 and 2012, which will amortize through March 2036.
HSHS also entered into a fixed spread basis swap in fiscal year 2008 that removes the tax risk from the bondholders and transfers the risk to HSHS. The premium that HSHS receives for taking on this risk is 67.00% of the one-month LIDOR plus a fixed spread of 48 basis points less the SIFMA Index rate. The fixed spread basis swap has a notional amount of$150,000 with a [mal maturity in May 2033.
26 (Continued)
(8)
HOSPITAL SISTERS HEALTH SYSTEM AND SUBSIDIARIES Springfield, Illinois
Notes to Consolidated Financial Statements
June 30, 2013 and 2012
(Dollars in thousands)
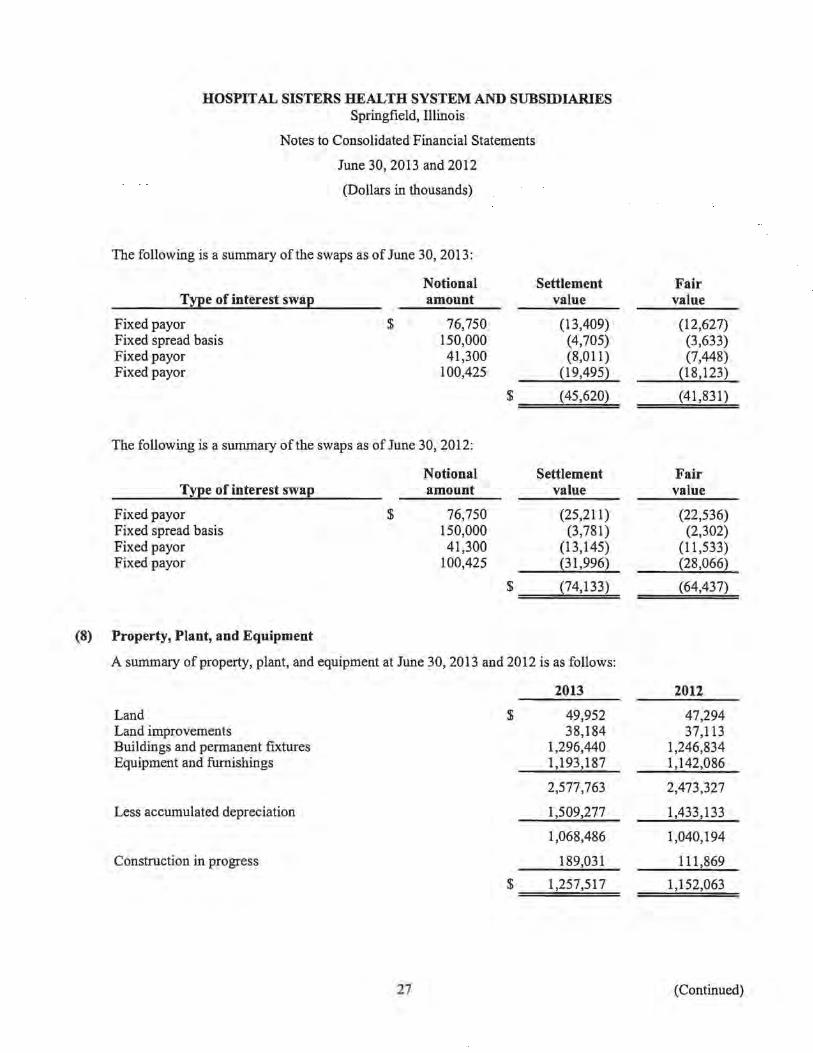
The following is a summary of the swaps as of June 30, 2013:
Notional T~e of interest swa~ amount
Fixed payor $ 76,750 Fixed spread basis 150,000 Fixed payor 41,300 Fixed payor 100,425
$
The following is a summary of the swaps as of June 30,2012:
Notional T~~e of interest swap amount
Fixed payor $ 76,750 Fixed spread basis 150,000 Fixed payor 41,300 Fixed payor 100,425
$
Property, Plant, and Equipment
Settlement value
(13,409) (4,705) (8,011)
(19,4952 (45,620)
Settlement value
(25,211) (3,781)
(13,145) ~31,996)
(74,133)
A summary of property, plant, and equipment at June 30, 2013 and 2012 is as follows:
2013
Land $ 49,952 Land improvements 38,184 Buildings and permanent fixtures 1,296,440 Equipment and furnishings 1,193,187
2,577,763
Less accumulated depreciation 1,509,277
1,068,486
Construction in progress 189,031
$ 1,257,517
27
Fair value
(12,627) (3,633) (7,448)
(18,123)
(41,831)
Fair value
(22,536) (2,302)
(11,533) (28,066)
(64,437)
2012
47,294 37,113
1,246,834 1,142,086
2,473,327
1,433,133
1,040,194
111,869
1,152,063
(Continued)

HOSPITAL SISTERS HEALTH SYSTEM AND SUBSIDIARIES Springfield, Illinois
Notes to Consolidated Financial Statements
June 30, 2013 and 2012
(Dollars in thousands)
As of June 30, 2013, construction in progress represents various building and remodeling projects. These projects, which have remaining contracted costs at June 30, 2013 of approximately $84,973, will be fmanced with board-designated assets or from operations.
A reconciliation of total interest costs, as reported in the accompanying consolidated statements of operations for 2013 and 2012, is as follows:
2013 2012
Interest cost capitalized $ 3,238 3,997 Interest cost charged to expense 7,247 6,316
Total interest cost $ 10,485 10,313
Interest income capitalized $ 1 41
(9) Self-Insurance
(a) Professional and General Liability
Under the System's professional and general liability self-insurance program through RQIL, claims are reflected based upon actuarial estimation, including both reported and incurred but not reported claims, taking into consideration the severity of incidents and the expected timing of claim payments. At June 30, 2013 and 2012, funds held by RQIL were $73,541 and $64,051, respectively. The related estimated self-insurance liabilities for June 30, 2013 and 2012 were $66,881 and $51,488, respectively. At June 30, 2013 and 2012, RQIL's estimated self-insurance liability for all future claims payments reflects the actuarially determined outstanding losses at the undiscounted/expected level. The amount included in expenses for professional and general liability insurance by RQIL for 2013 and 2012 was $19,099 and $14,267, respectively, and is included in other expense in the consolidated statements of operations. These calculations take into consideration any liability that may be covered under an extended reporting endorsement and considered "tail" liability.
HSHS is involved in litigation arising in the ordinary course of business. Reported claims are in various stages of litigation. Additional claims may be asserted against HSHS arising from services through June 30, 2013. It is the opinion of management that the estimated malpractice liabilities accrued at June 30, 2013 are adequate to provide for potential losses resulting from pending or threatened litigation.
(b) Workers' Compensation and Employee Health
The HSHS self-insurance program provides workers' compensation insurance and health insurance for employees. An independent actuary has been retained to assist management in determining funding requirements for workers' compensation insurance. For health insurance claims, HSHS has developed internal techniques for estimating the ultimate costs. The amounts funded for each program have been placed in separate accounts that are administered by the trustee.
28 (Continued)

HOSPITAL SISTERS IlEAL TH SYSTEM AND SUBSIDIARIES Springfield, Illinois
Notes to Consolidated Financial Statements
June 30, 2013 and 2012
(Dollars in thousands)
At June 30, 2013 and 2012, funds held by the trustee and critical access hospitals for workers' compensation liability self-insurance are $28,790 and $25,237, respectively, and related estimated self-insurance liabilities are $15,274 and $13,005, respectively. The discount rate used to compute the estimated self-insurance liability at June 30, 2013 and 2012 was 4%, for all future claim payments. The amount included in employee benefits for 2013 and 2012 was $8,256 and $5,599, respectively, and is included in other expense in the consolidated statements of operations. Subsequently, in July 2013, the estimated workers' compensation liability of$15,274 was transferred to RQIL to begin to administer this risk program.
At June 30, 2013 and 2012, funds held by the trustee for health insurance liability for employees' self-insurance are $61,461 and $58,473, respectively, and are included in assets whose use is limited or restricted. At June 30, 2013 and 2012, related estimated self-insurance liabilities are $12,018 and $10,518, respectively.
(10) Pension
HSHS employees participate in The Hospitals Sisters Health System Employees Pension Plan (the Plan). This noncontributory defined benefit pension plan covers substantially all employees of the System who have completed 1,000 hours of employment during any calendar year subsequent to the commencement of employment. The Plan recognizes and funds the costs related to employee service using the projected unit credit actuarial cost method. The information below represents the aggregation of HSHS' pension fmancial status, which is determined by the consulting actuaries on a member-specific basis.
29 (Continued)

HOSPITAL SISTERS HEALTH SYSTEM AND SUBSIDIARIES Springfield, Illinois
Notes to Consolidated Financial Statements
June 30, 2013 and 2012
(Dollars in thousands)
The following table sets forth the Plan's funded status, amounts recognized in HSHS' fmancial statements, and assumptions at June 30, 2013 and 2012:
2013
Change in benefit obligation: Benefit obligation at beginning of year $ 1,293,236 Service cost 49,622 Interest cost 60,884 Actuarial loss (gain) (6,623) Expected expenses (102,258) Benefits paid (23,091)
Benefit obligation at end of year $ 1,271,770
Change in plan assets: Fair value of plan assets at beginning of year $ 883,197 Actual gain on plan assets 92,864 Employer contributions 66,906 Benefits paid (23,091)
Fair value of plan assets at end of year $ 1,019,876
Reconciliation of funded status: Funded status $ (251,894)
Amounts recognized in the accompanying consolidated balance sheets:
Accrued benefit liability (251,894)
Amounts not yet reflected in net periodic benefit cost and included as an accumulated charge to unrestricted net assets:
Prior service cost $ (2,495) Actuarial loss (249,399)
$ (251,894)
30
consolidated
2012
1,057,227 40,998 58,154
161,114 (6,061)
(18,196)
1,293,236
808,116 52,814 40,463
(18,196)
883,197
(410,039)
(410,039)
(3,070) (406,969)
(410,039)
(Continued)
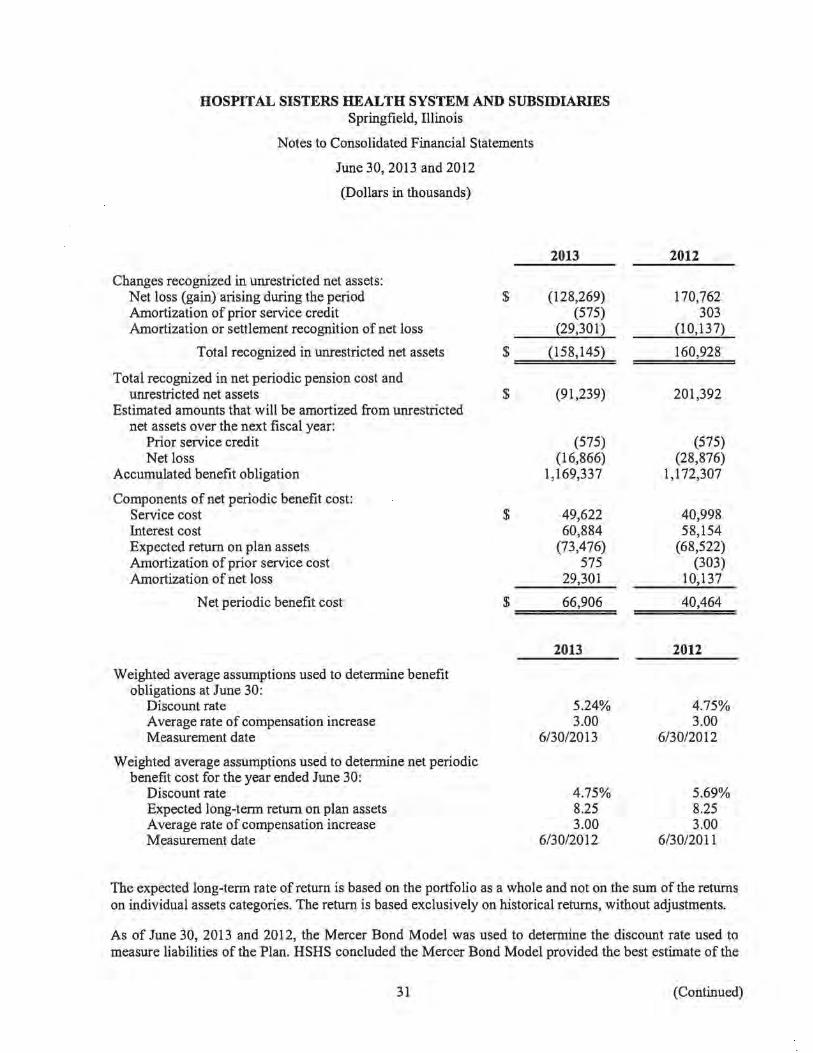
HOSPITAL SISTERS HEALTH SYSTEM AND SUBSIDIARIES Springfield, Illinois
Notes to Consolidated Financial Statements
June 30,2013 and 2012
(Dollars in thousands)
Changes recognized in unrestricted net assets: Net loss (gain) arising during the period Amortization of prior service credit Amortization or settlement recognition of net loss
Total recognized in unrestricted net assets
Total recognized in net periodic pension cost and unrestricted net assets
Estimated amounts that will be amortized from unrestricted net assets over the next fiscal year:
Prior service credit Net loss
Accumulated benefit obligation
Components of net periodic benefit cost: Service cost Interest cost Expected return on plan assets Amortization of prior service cost Amortization of net loss
Net periodic benefit cost
Weighted average assumptions used to determine benefit obligations at June 30:
Discount rate Average rate of compensation increase Measurement date
Weighted average assumptions used to determine net periodic benefit cost for the year ended June 30:
Discount rate Expected long-term return on plan assets Average rate of compensation increase Measurement date
$
$
$
$
$
2013
(128,269) (575)
(29,301)
(158,145)
(91,239)
(575) (16,866)
1,169,337
49,622 60,884
(73,476) 575
29,301
66,906
2013
5.24% 3.00
6/30/2013
4.75% 8.25 3.00
6/30/2012
2012
170,762 303
(10,137)
160,928
201,392
(575) (28,876)
1,172,307
40,998 58,154
(68,522) (303)
10,137
40,464
2012
4.75% 3.00
6/30/2012
5.69% 8.25 3.00
6/30/2011
The expected long-term rate of return is based on the portfolio as a whole and not on the sum of the returns on individual assets categories. The return is based exclusively on historical returns, without adjustments.
As of June 30, 2013 and 2012, the Mercer Bond Model was used to determine the discount rate used to measure liabilities of the Plan. HSHS concluded the Mercer Bond Model provided the best estimate of the
31 (Continued)

HOSPITAL SISTERS HEALTH SYSTEM AND SUBSIDIARIES Springfield, Illinois
Notes to Consolidated Financial Statements
June 30, 2013 and 2012
(Dollars in thousands)
interest rates at which the pension benefits could be effectively settled in accordance with ASC Section 715-30-55-25. The Mercer Bond Model discounts the Plan's cash flow and calculates the Plan's appropriate equivalent single discount rate for the given cash flow based on a hypothetical bond portfolio whose cash flows from coupons and maturities match year-by-year the projected liability benefit payments from the Plan.
HSHS expects to contribute to its pension plan for the 2014 fiscal year the following amount $
The following benefit payments that reflect expected future service, as appropriate, are expected to be paid:
2014 $ 2015 2016 2017 2018 2019-2023
49,908
30,401 36,236 42,432 49,385 56,541
384,527
The expected benefits are based on the same assumptions used to measure HSHS' benefit obligation at June 30, 2013 and include estimated future employee service.
The Plan has developed a Pension Plan Investment Policy Statement (the IPS), which is reviewed and approved by the HSHS board of directors. The IPS established goals and objectives of the fund, asset allocations, allowable and prohibited investments, socially responsible guidelines, and asset classifications, as well as specific investment manager guidelines. The IPS dictates that assets should be rebalanced back to target allocation on a quarterly basis. Investments are managed by independent advisers. Management monitors the performance of these managers on a monthly basis.
The table below lists the target asset allocation and acceptable ranges and actual asset allocations as of June 30, 2013 and 2012:
Target Acceptable Actual allocation at June 30 Asset allocation range 2ii13 2012
Equities 57% 30%-70% 58% 55% Debt securities 30 20-70 26 29 Alternative investments 13 0-15 13 12 Cash and cash equivalents 0--6 3 4
32 (Continued)
HOSPITAL SISTERS HEALTH SYSTEM AND SUBSIDIARIES Springfield, Illinois
Notes to Consolidated Financial Statements
(a) Overall Investment Objective
June 30,2013 and 2012
(Dollars in thousands)
The overall investment objective of the Plan is to invest the Plan's assets in a prudent manner to best serve the participants of the Plan. Plan investment assets are to produce investment results that achieve the Plan's actuarial assumed rate of return, protect the integrity of the Plan, assist HSHS in meeting the obligations to the Plan's participants, manage risk exposures, focus on downside protection, and to maintain enough liquidity in the portfolio to ensure timely cash outflows and beneficiary payments. The Plans' investments are diversified among various asset classes incorporating multiple strategies and managers to exceed a weighted benchmark return based upon policy asset allocation targets and standard index returns. Major investment decisions are authorized by the Board's Retirement Committee, which oversees the Plan's investment program in accordance with established guidelines.
(b) Allocation of Investment Strategies
The Plan maintains a percent of assets in domestic and international equity stocks to achieve the expected rate of return. To manage risk exposure, up to 30% of the Plans' assets are invested in a liability driven investment strategy.
(c) Basis of Reporting
Investments are reported at estimated fair value. If an investment is held directly by HSHS and an active market with quoted prices exists, the market price of an identical security is used as reported fair value. Reported fair values for shares in mutual funds registered with them are based on share prices reported by the funds as of the last business day of the fiscal year. The Plan's interests in alternative investment funds are generally reported at the net asset value reported by the fund managers, which is used as a practical expedient to estimate the fair value of the Plan's interest therein, unless it is probable that all or a portion of the investment will be sold for an amount different from net asset value. As of June 30, 2013, the Plan had no plans or intentions to sell investments at amounts different from net asset value.
33 (Continued)

HOSPITAL SISTERS HEALTH SYSTEM AND SUBSIDIARIES Springfield, Illinois
Notes to Consolidated Financial Statements
The fair values of HSHS' follows:
Pension plan assets excluding accrued interest of $2,084:
Cash and cash equivalents $ Common stocks U.S. government
securities Commingled mutual funds Municipal bonds Corporate bonds, notes,
and debentures Foreign securities Hedge funds:
K2 multi strategy fund Mesirow multistrategy
fund
Total assets at fair value $
June 30,2013 and 2012
(Dollars in thousands)
pension plan assets at June 30, 2013, by asset category class, are as
June 30,2013 Redemption Days' Levell Level 2 Level 3 Total or liquidation notice
56,421 56,421 Daily One 409,767 409,767 Daily Three
105,915 105,915 Daily One 143,194 143,194 Daily One
2,688 2,688 Daily Two
5,794 5,794 Daily Two 154,366 5,092 159,458 Daily Three
29,679 29,679 Monthly Thirty
104,876 104,876 Monthly Thirty
620,554 262,683 134,555 1,017,792
The table below sets forth a summary of changes in the fair value of the Plan's Level 3 assets for the year ended June 30, 2013:
Balance, beginning of year Purchases Total net gains Sales
Balance, end of year
$
Level 3 assets, year ended June 30, 2013 K2 Escrow Total
fund fund funds
20,537 6,657 2,485
86,305 9,986 8,585
106,842 16,643 11,070
$ ===2=9=,6=7=9 = 104,876 134,555
34 (Continued)

(d)
HOSPITAL SISTERS HEALTH SYSTEM AND SUBSIDIARIES Springfield, Illinois
Notes to Consolidated Financial Statements
June 30, 2013 and 2012
(Dollars in thousands)
The fair values of the HSHS' pension plan assets at June 30, 2012, by asset category class, are as follows:
June 30, 2012 Redemption Days' Levell Level i Level 3 Total or liguidation notice
Pension plan assets excluding accrued interest 0[$2,017:
Cash and cash equivalents $ 31,627 31,627 Daily One Common stocks 342,927 342,927 Daily Three U.S. government securities 108,654 108,654 Daily One Commingled mutual funds 142,355 142,355 Daily One Municipal bonds 2,917 2,917 Daily Two Corporate bonds, notes,
and debentures 11,893 11,893 Daily Two Foreign securities 129,130 4,835 133,965 Daily Three Hedge funds:
K2 multi strategy fund 20,537 20,537 Monthly Thirty Mesirow multi strategy
fund 86,305 86,305 Monthly Thirty
Total assets at fair value $ 503,684 270,654 106,842 881,180
The table below sets forth a summary of changes in the fair value of the Plan's Level 3 assets for the year ended June 30, 2012:
Level 3 assets, year ended June 30, 2012 K2 Mesirow Total
fund fund funds
Balance, beginning of year $ Purchases 20,600 82,700 103,300 Total net gains (losses) (63) 3,605 3,542 Sales
Balance, end of year $ 20,537 86,305 106,842
Fair Value of Financial Instruments
The following is a description of the valuation methodologies used for assets measured at fair value. There have been no changes in the methodologies used at June 30, 2013 and 2012.
• Cash and cash equivalents: Valued at the carrying amount that approximates fair value because of the short-term maturity of these investments.
• Common and preferred stocks, U.S. government securities, commingled mutual funds, and foreign securities: Valued at the closing price reported on the active market on which the individual securities are traded.
35 (Continued)

HOSPITAL SISTERS HEALTH SYSTEM AND SUBSIDIARIES Springfield, Illinois
Notes to Consolidated Financial Statements
June 30,2013 and 2012
(Dollars in thousands)
• Municipal bonds, corporate bonds, notes, and debentures: Certain corporate bonds are valued at the closing price reported in the active market in which the bond is traded. Other corporate bonds are valued based on yields currently available on comparable securities of issuers with similar credit ratings. When quoted prices are not available for identical or similar bonds, the bond is valued under a discounted cash flows approach that maximizes observable inputs, such as current yields of similar instruments, but includes adjustments for certain risks that may not be observable, such as credit and liquidity.
The Plan has certain hedge fund investments for which quoted market prices are not available. The estimated fair value of these hedge fund investments includes estimates, appraisals, assumptions, and methods provided by external fmancial advisers and reviewed by HSHS.
The preceding methods described may produce a fair value calculation that may not be indicative of net realizable value or reflective of future fair values. Furthermore, although the Plan believes its valuation methods are appropriate and consistent with other market participants, the use of different methodologies or assumptions to determine the fair value of certain fmancial instruments could result in a different fair value measurement at the reporting date.
(e) Fair Vallie Hierarchy
The Plan has adopted ASC Subtopic 715-20-50, Compensation - Retirement Benefits: Defined Benefit Plans - General: Disclosures, for fair value measurements of financial assets and fmancial liabilities and for fair value measurements of nonfmancial items that are recognized or disclosed at fair value in the consolidated fmancial statements on a recurring basis. ASC Subtopic 715-20-50 establishes a fair value hierarchy that prioritizes the inputs to valuation techniques used to measure fair value.
(11) Long-Term Debt
HSSI and its 13 hospital affiliates are included in the HSSI Obligated Group. Under the terms of the Obligated Group MTI, each member of the Obligated Group is jointly and severally liable for all obligations issued thereunder. Bonds issued are unsecured general obligations, but carry covenants regarding withdrawals from the Obligated Group, issuance of additional debt, and creations of liens on property. Obligations outstanding under the Obligated Group MTI are issued through state health facility authorities and comprise both serial and term bonds with varying maturities.
36 (Continued)

HOSPITAL SISTERS HEALTH SYSTEM AND SUBSIDIARIES Springfield, Illinois
Notes to Consolidated Financial Statements
June 30, 2013 and 2012
(Dollars in thousands)
As of June 30, 2013, long-term debt consisted of the following:
Series Interest rates
Fixed interest rate issues: 2007A 5.00% 2012B 2.00% to 5.00% 2012C 2.00% to 5.00%
Variable interest rate issues:
2012A Variable 0.88% at June 30,2013
2012D Variable 0.05% at June 30, 2013
2012E Variable 0.05% at June 30, 2013
2012F Variable 0.07% at June 30, 2013
2012G Variable 0.07% at June 30, 2013
2012H Variable 0.15% and 0.16% at June 30, 2013
20121 Variable 0.13% to 0.17% at June 30, 2013
2012J Variable 0.16% at June 30,2013
Total fIxed and variable interest debt
Other long-tenn debt Plus unamortized bond issue premiums
Total debt
Less current installments Less long-tenn debt subject to short-tenn remarketing agreements
Totallong-tenn debt, excluding current installments
37
Final maturity dates
March 15,2028 August 15,2021 August 15,2021
June 30, 2041
August I, 2040
August I, 2040
August I, 2040
August I, 2040
August I, 2040
August 1,2040
August 1,2040
2013
$ 72,035 76,880 68,785
20,300
61,050
41,550
31,645
31,645
65,885
89,460
14,160
573,395
23,974 20,717
618,086
17,909 169,508
$ 430,669
(Continued)

HOSPITAL SISTERS HEALTH SYSTEM AND SUBSIDIARIES Springfield, Illinois
Notes to Consolidated Financial Statements
June 30, 2013 and 2012
(Dollars in thousands)
As of June 30, 2012, long-term debt consisted of the following:
Series Interest rates
Fixed interest rate issues: 2007A 5.00%
Variable interest rate Issues:
Variable 0.50% 2003A at June 30, 2012
Variable 0.25% to 0.37% 2003B at June 30, 2012
Variable 0.35% 2007B-l at June 30, 2012
Variable 0.50% 2007B-2 at June 30,2012
Variable 0.50% 2007C at June 30,2012
Variable 0.15% to 0.19% 2008A at June 30, 2012
Variable 0.17% to 0.18% 2008B at June 30,2012
Other long-term debt
Plus unamortized bond issue premiums
Total debt
Less current installments Less long-term debt subject to short-term remarketing agreements
Total long-term debt, excluding current installments
38
Final maturity dates
March 15,2028
December 1, 2023
December I, 2023
March 15,2036
March 15, 2036
March 15, 2036
June 1, 2029
June 1,2029
2012
$ 72,035
65,550
69,850
76,750
41,300
100,425
89,005
14,090
529,005
34,318
563,323
2,619
565,942
28,517 158,047
$ 379,378
(Continued)
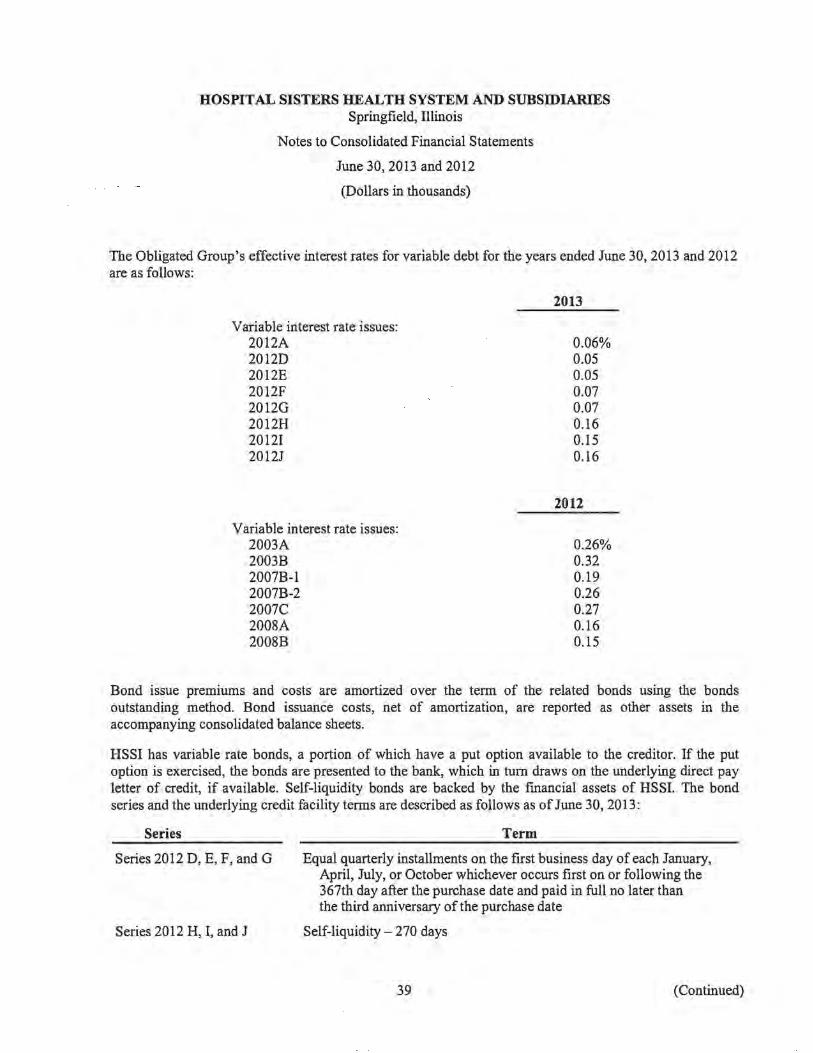
HOSPITAL SISTERS HEALTH SYSTEM AND SUBSIDIARIES Springfield, Illinois
Notes to Consolidated Financial Statements
June 30,2013 and 2012
(Dollars in thousands)
The Obligated Group's effective interest rates for variable debt for the years ended June 30, 2013 and 2012 are as follows:
Variable interest rate issues: 2012A 2012D 2012E 2012F 2012G 2012H 20121 2012J
Variable interest rate issues: 2003A 2003B 2007B-I 2007B-2 2007C 2008A 2008B
2013
0.06% 0.05 0.05 0.07 0.07 0.16 0.15 0.16
2012
0.26% 0.32 0.19 0.26 0.27 0.16 0.15
Bond issue premiums and costs are amortized over the term of the related bonds using the bonds outstanding method. Bond issuance costs, net of amortization, are reported as other assets in the accompanying consolidated balance sheets.
HSSI has variable rate bonds, a portion of which have a put option available to the creditor. If the put option is exercised, the bonds are presented to the bank, which in tum draws on the underlying direct pay letter of credit, if available. Self-liquidity bonds are backed by the fmancial assets of HSSI. The bond series and the underlying credit facility terms are described as follows as of June 30, 2013:
Series
Series 2012 D, E, F, and G
Series 2012 H, I, and J
Term
Equal quarterly installments on the first business day of each January, April, July, or October whichever occurs first on or following the 367th day after the purchase date and paid in full no later than the third anniversary of the purchase date
Self-liquidity - 270 days
39 (Continued)
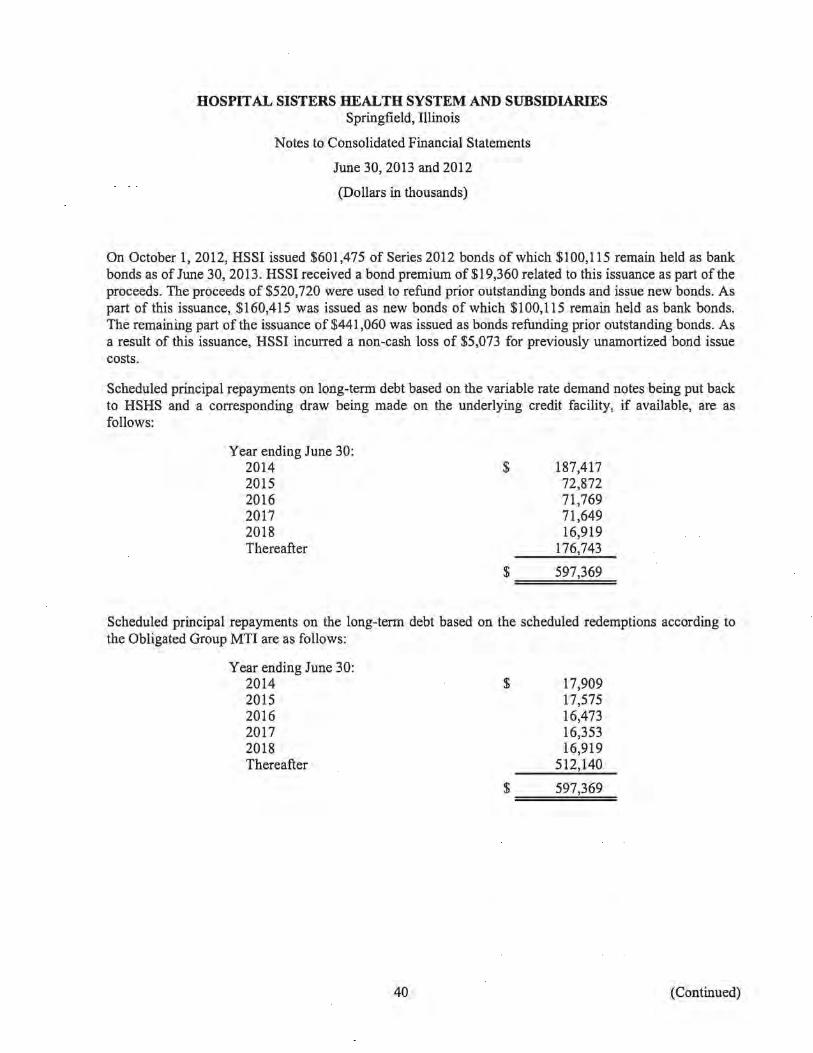
HOSPITAL SISTERS HEALTH SYSTEM AND SUBSIDIARIES Springfield, Illinois
Notes to Consolidated Financial Statements
June 30, 2013 and 2012
(Dollars in thousands)
On October 1, 2012, HSSI issued $601,475 of Series 2012 bonds of which $100,115 remain held as bank bonds as of June 30, 2013. HSSI received a bond premium of $19,360 related to this issuance as part of the proceeds. The proceeds of $520,720 were used to refund prior outstanding bonds and issue new bonds. As part of this issuance, $160,415 was issued as new bonds of which $100,115 remain held as bank bonds. The remaining part of the issuance of$441,060 was issued as bonds refunding prior outstanding bonds. As a result of this issuance, HSSI incurred a non-cash loss of $5,073 for previously unamortized bond issue costs.
Scheduled principal repayments on long-term debt based on the variable rate demand notes being put back to HSHS and a corresponding draw being made on the underlying credit facility, if available, are as follows:
Year ending June 30: 2014 $ 187,417 2015 72,872 2016 71,769 2017 71,649 2018 16,919 Thereafter 176,743
$ 597,369
Scheduled principal repayments on the long-term debt based on the scheduled redemptions according to the Obligated Group MTI are as follows:
Year ending June 30: 2014 $ 17,909 2015 17,575 2016 16,473 2017 16,353 2018 16,919 Thereafter 512,140
$ 597,369
40 (Continued)

HOSPITAL SISTERS HEALTH SYSTEM AND SUBSIDIARIES Springfield, Illinois
(12) Capital Leases
Notes to Consolidated Financial Statements
June 30, 2013 and 2012
(Dollars in thousands)
HSHS leases certain equipment under capital leases. Included with property, plant, and equipment are $25,184 of assets held under capital leases and $8,317 of related accumulated amortization at June 30, 2013. A summary of future minimum lease payments and the present value of future minimum lease payments related to capital leases at June 30, 2013 is as follows:
Year: 2014 2015 2016 2017 2018 Thereafter
Total future minimum lease payments
Less amount representing interest at rates ranging from 5.0% to 6.5%
Present value of future minimum lease payments
Less current portion of obligations under capital leases included in current installments of long-term debt
Obligations under capital leases, excluding current portion included in long-term debt, excluding current installments
(13) Functional Expenses
$
Amount
4,606 3,805 2,251 1,381 1,189 9,882
23,114
5,535
17,579
3,684
$ ===1=3,=89=5=
HSHS provides general healthcare services to residents within its respective geographic regions. Expenses related to providing these services for the years ended June 30,2013 and 2012 are as follows:
Healthcare services General and administrative services
(14) Prevea
$
2013
1,545,042 440,960
$ =====1,=98=6=,0=02=
2012
1,506,246 423,337
1,929,583
St. Vincent Hospital (St. Vincent) and St. Mary's Hospital Medical Center (St. Mary's) (collectively referred to as the Green Bay Hospitals), two members of the Obligated Group located in Green Bay, Wisconsin, each have a 25% interest in Prevea Health Systems, Inc. (Prevea). The Green Bay Hospitals held $21,989 (21,989 shares), at June 30, 2013 and 2012, of Prevea preferred stock. Prevea has
41 (Continued)
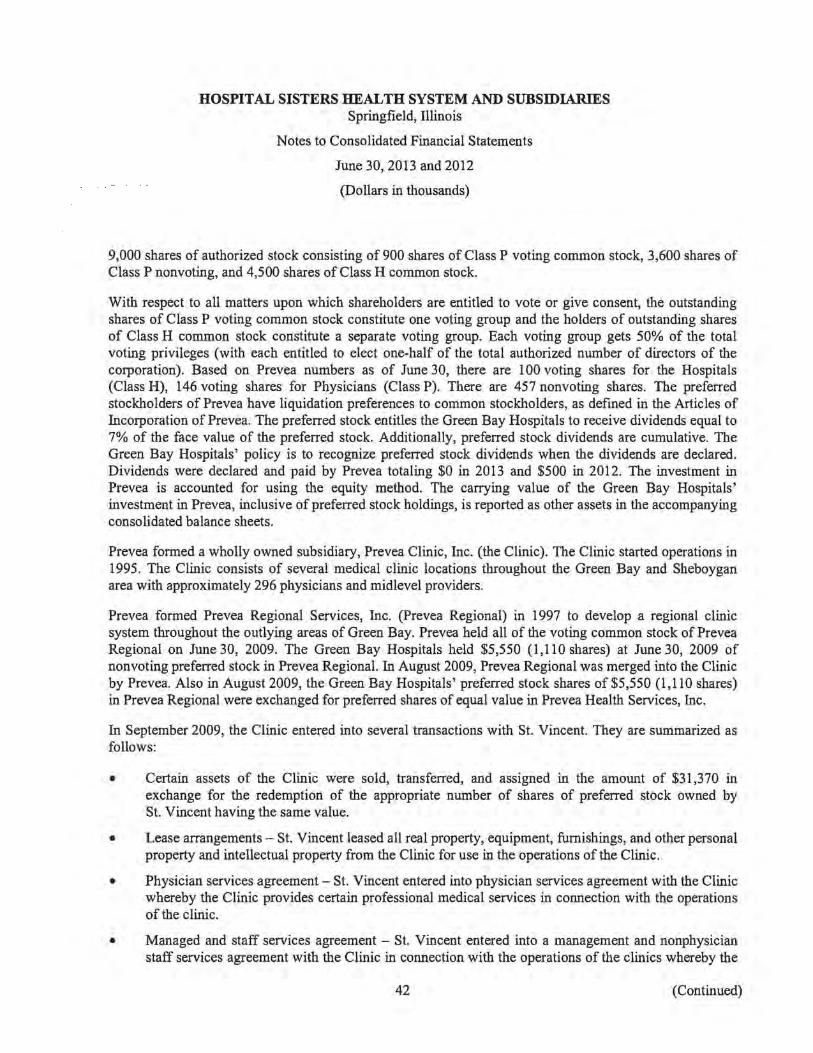
HOSPITAL SISTERS HEALTH SYSTEM AND SUBSIDIARIES Springfield, Illinois
Notes to Consolidated Financial Statements
June 30, 2013 and 2012
(Dollars in thousands)
9,000 shares of authorized stock consisting of 900 shares of Class P voting common stock, 3,600 shares of Class P nonvoting, and 4,500 shares of Class H common stock.
With respect to all matters upon which shareholders are entitled to vote or give consent, the outstanding shares of Class P voting common stock constitute one voting group and the holders of outstanding shares of Class H common stock constitute a separate voting group. Each voting group gets 50% of the total voting privileges (with each entitled to elect one-half of the total authorized number of directors of the corporation). Based on Prevea numbers as of June 30, there are 100 voting shares for the Hospitals (Class H), 146 voting shares for Physicians (Class P). There are 457 nonvoting shares. The preferred stockholders of Prevea have liquidation preferences to common stockholders, as defmed in the Articles of Incorporation of Prevea. The preferred stock entitles the Green Bay Hospitals to receive dividends equal to 7% of the face value of the preferred stock. Additionally, preferred stock dividends are cumulative. The Green Bay Hospitals' policy is to recognize preferred stock dividends when the dividends are declared. Dividends were declared and paid by Prevea totaling $0 in 2013 and $500 in 2012. The investment in Prevea is accounted for using the equity method. The carrying value of the Green Bay Hospitals' investment in Prevea, inclusive of preferred stock holdings, is reported as other assets in the accompanying consolidated balance sheets.
Prevea formed a wholly owned subsidiary, Prevea Clinic, Inc. (the Clinic). The Clinic started operations in 1995. The Clinic consists of several medical clinic locations throughout the Green Bay and Sheboygan area with approximately 296 physicians and midlevel providers.
Prevea formed Prevea Regional Services, Inc. (Prevea Regional) in 1997 to develop a regional clinic system throughout the outlying areas of Green Bay. Prevea held all of the voting common stock of Prevea Regional on June 30, 2009. The Green Bay Hospitals held $5,550 (1,110 shares) at June 30, 2009 of nonvoting preferred stock in Prevea Regional. In August 2009, Prevea Regional was merged into the Clinic by Prevea. Also in August 2009, the Green Bay Hospitals' preferred stock shares of $5,550 (1,110 shares) in Prevea Regional were exchanged for preferred shares of equal value in Prevea Health Services, Inc.
In September 2009, the Clinic entered into several transactions with St. Vincent. They are summarized as follows:
• Certain assets of the Clinic were sold, transferred, and assigned in the amount of $31,370 in exchange for the redemption of the appropriate number of shares of preferred stock owned by St. Vincent having the same value.
• Lease arrangements - St. Vincent leased all real property, equipment, furnishings, and other personal property and intellectual property from the Clinic for use in the operations of the Clinic.
• Physician services agreement - St. Vincent entered into physician services agreement with the Clinic whereby the Clinic provides certain professional medical services in connection with the operations of the clinic.
• Managed and staff services agreement - St. Vincent entered into a management and nonphysician staff services agreement with the Clinic in connection with the operations of the clinics whereby the
42 (Continued)
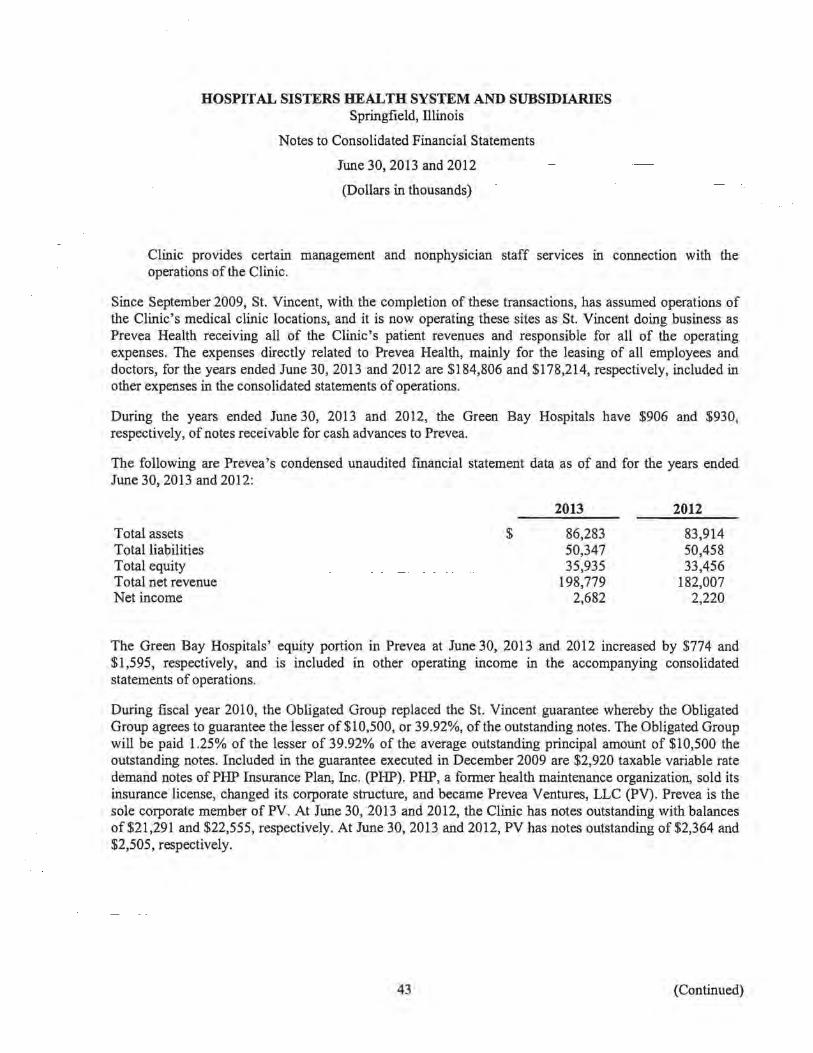
HOSPITAL SISTERS HEALTH SYSTEM AND SUBSIDIARIES Springfield, Illinois
Notes to Consolidated Financial Statements
June 30,2013 and 2012
(Dollars in thousands)
Clinic provides certain management and nonphysician staff services in connection with the operations of the Clinic.
Since September 2009, St. Vincent, with the completion of these transactions, has assumed operations of the Clinic's medical clinic locations, and it is now operating these sites as St. Vincent doing business as Prevea Health receiving all of the Clinic's patient revenues and responsible for all of the operating expenses. The expenses directly related to Prevea Health, mainly for the leasing of all employees and doctors, for the years ended June 30, 2013 and 2012 are $184,806 and $178,214, respectively, included in other expenses in the consolidated statements of operations.
During the years ended June 30, 2013 and 2012, the Green Bay Hospitals have $906 and $930, respectively, of notes receivable for cash advances to Prevea.
The following are Prevea's condensed unaudited fmancial statement data as of and for the years ended June 30,2013 and 2012:
2013 2012
Total assets $ 86,283 83,914 Total liabilities 50,347 50,458 Total equity 35,935 33,456 Total net revenue 198,779 182,007 Net income 2,682 2,220
The Green Bay Hospitals' equity portion in Prevea at June 30, 2013 and 2012 increased by $774 and $1,595, respectively, and is included in other operating income in the accompanying consolidated statements of operations.
During fiscal year 2010, the Obligated Group replaced the St. Vincent guarantee whereby the Obligated Group agrees to guarantee the lesser of$10,500, or 39.92%, of the outstanding notes. The Obligated Group will be paid 1.25% of the lesser of 39.92% of the average outstanding principal amount of $10,500 the outstanding notes. Included in the guarantee executed in December 2009 are $2,920 taxable variable rate demand notes of PHP Insurance Plan, Inc. (PHP). PHP, a former health maintenance organization, sold its insurance license, changed its corporate structure, and became Prevea Ventures, LLC (PV). Prevea is the sole corporate member of PV. At June 30,2013 and 2012, the Clinic has notes outstanding with balances of$21,291 and $22,555, respectively. At June 30,2013 and 2012, PV has notes outstanding of $2,364 and $2,505, respectively.
43 (Continued)

HOSPITAL SISTERS HEALTH SYSTEM AND SUBSIDIARIES Springfield, Illinois
(15) Joint Ventures
Notes to Consolidated Financial Statements
June 30,2013 and 2012
(Dollars in thousands)
Joint ventures are accounted for using the equity method of accounting and represent $14,925 and $18,002 of other long-term assets in the accompanying consolidated balance sheets at June 30, 2013 and 2012, respectively. The most significant of these investments, excluding Prevea (note 14), include:
• Protestant Memorial Medical Center and St. Elizabeth's Healthcare Services, LLP (held by st. Elizabeth's Hospital) - 50% ownership interest
• Northeast Wisconsin Radiation Therapy Services, LLC (held by St. Vincent and St. Mary's, Green Bay) - each hospital has a 25% ownership interest
• Pain Center of Wisconsin (held by St. Vincent) - 50% ownership interest
• Surgery Center of Sheboygan, LLC (held by St. Nicholas Hospital) - 50% ownership interest
• Orange Cross Ambulance, Inc. (held by St. Nicholas Hospital) - 50% ownership interest
• Holy Family (held by St. Vincent) - 50% ownership interest
• Wisconsin Upper Peninsula Oncology Management Services, Inc. (held by St. Vincent) - 50% ownership interest
• Community Memorial Hospital - (held by st. Vincent (70%) and St. Mary's, Green Bay (30%» -24% ownership interest overall, beginning May 17,2011.
For the years ended June 30, 2013 and 2012, HSHS recognized income of$3,384 and $4,131, respectively, in investments in affiliated companies. This activity is included as a component of other revenue in the accompanying consolidated statements of operations. During 2013 and 2012, HSHS received cash distributions of $4,230 and $4,039, respectively, from the joint ventures. During 2012, HSHS also contributed cash of $95 to the joint ventures.
The following table summarizes the unaudited aggregated fmancial information of unconsolidated affiliated companies ofHSHS as of June 30, 2013 and 2012:
Total assets Total liabilities Total equity Total net revenue Net income
44
$
2013
51,504 17,143 34,361 33,489
6,590
2012
52,613 18,411 34,202 35,030 7,886
(Continued)

HOSPITAL SISTERS HEALTH SYSTEM AND SUBSIDIARIES Springfield, Illinois
(16) Pledges Receivable
Notes to Consolidated Financial Statements
June 30,2013 and 2012
(Dollars in thousands)
Pledges, net of a present value discount rate, determined in the year the pledge is made, and an allowance for uncollectible pledges are recorded as a component of assets whose use is limited or restricted in the accompanying consolidated fmancial statements based on their expected collection date.
Included in assets whose use is limited or restricted at June 30, 2013 and 2012 are the following unconditional promises to give:
Unconditional promises to give Less unamortized discount
Less allowance for uncollectible pledges
Net pledges receivable
Amounts due in: Less than one year One to five years More than five years
Total
(17) Temporarily and Permanently Restricted Assets
2013
$ 7,103 158
6,945
260
6,685 $========
$ 2,487 4,413
203
$ 7,103 ======
2012
8,291 419
7,872
286
7,586
2,553 4,751
987
8,291
Temporarily restricted assets are available for the following purposes or periods at June 30, 2013 and 2012:
2013 2012
Healthcare services $ 11,916 9,475 Capital expenditures 13,109 10,883 Catholic Radio 207 221 College of nursing 255 204
$ 25,487 20,783
45 (Continued)
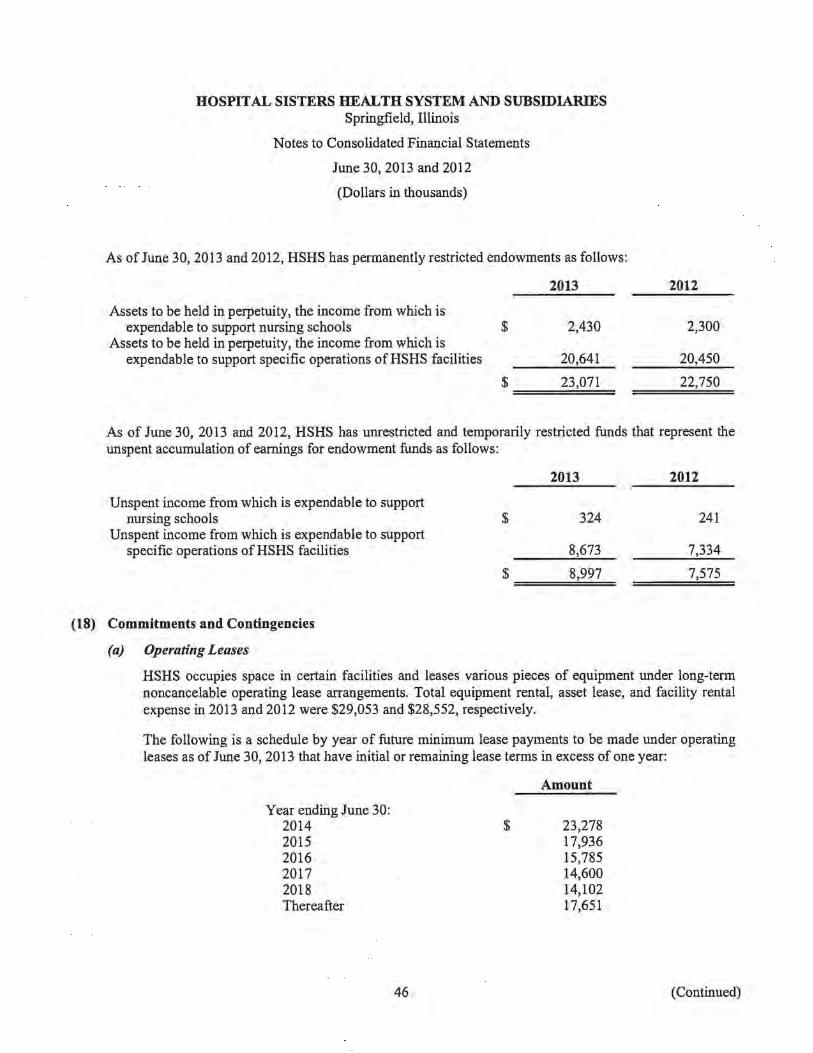
HOSPITAL SISTERS HEALTH SYSTEM AND SUBSIDIARIES Springfield, Illinois
Notes to Consolidated Financial Statements
June 30,2013 and 2012
(Dollars in thousands)
As of June 30, 2013 and 2012, HSHS has permanently restricted endowments as follows:
Assets to be held in perpetuity, the income from which is expendable to support nursing schools $
Assets to be held in perpetuity, the income from which is expendable to support specific operations ofHSHS facilities
2013
2,430
20,641
$ ===23:f,0=7.;,1 =
2012
2,300
20,450
22,750
As of June 30, 2013 and 2012, HSHS has unrestricted and temporarily restricted funds that represent the unspent accumulation of earnings for endowment funds as follows:
Unspent income from which is expendable to support nursing schools
Unspent income from which is expendable to support specific operations ofHSHS facilities
(18) Commitments and Contingencies
(a) Operating Leases
2013
$ 324
8,673
$ ===8~,9;.;,9.;",7 =
2012
241
7,334
7,575
HSHS occupies space in certain facilities and leases various pieces of equipment under long-term noncancelable operating lease arrangements. Total equipment rental, asset lease, and facility rental expense in 2013 and 2012 were $29,053 and $28,552, respectively.
The following is a schedule by year of future minimum lease payments to be made under operating leases as of June 30,2013 that have initial or remaining lease terms in excess of one year:
Year ending June 30: 2014 2015 2016 2017 2018 Thereafter
46
$
Amount
23,278 17,936 15,785 14,600 14,102 17,651
(Continued)

HOSPITAL SISTERS HEALTH SYSTEM AND SUBSIDIARIES Springfield, Illinois
Notes to Consolidated Financial Statements
June 30,2013 and 2012
(Dollars in thousands)
(b) Legal, Regulatory, and Otlrer Contingencies and Commitments
The laws and regulations governing the Medicare, Medicaid, and other government healthcare programs are extremely complex and subject to interpretation, making compliance an ongoing challenge for HSHS and other healthcare organizations. Recently, the federal government has increased its enforcement activity, including audits and investigations related to billing practices, clinical documentation, and related matters. HSHS maintains a compliance program designed to educate employees and to detect and correct possible violations.
(c) Litigation
HSHS is involved in litigation arising in the ordinary course of business. After consultation with legal counsel, management estimates that these matters will be resolved without material adverse effect on the HSHS's future consolidated fmancial position or results of operations.
(d) Unemployment
The Wisconsin hospitals of HSHS pledged a U.S. Treasury note as collateral for any unpaid unemployment compensation claims with a face value of $4,000 for 2013 and 2012 to the Wisconsin Unemployment Reserve Fund. The pledged U.S. Treasury note remained unused at June 30, 2013 and 2012.
(e) Tire Patient Protection and Affordable Care Act
The Patient Protection and Affordable Care Act, as amended by the Health Care and Education Reconciliation Act of 2010 (often referred to, collectively, as the Affordable Care Act or the healthcare reform law), was signed into law on March 23, 2010. The statute will change how healthcare services are delivered and reimbursed through a variety of mechanisms. The law contains stronger antifraud enforcement provisions and provides additional funding for enforcement activity.
On May 6, 2011, CMS issued a fmal rule establishing a value-based purchasing program for acute care hospitals paid under the Medicare Inpatient Prospective Payment System. Beginning in federal fiscal year 2013, incentive payments will be made based on achievement of or improvement in a set of clinical and quality measures designed to foster improved clinical outcomes. HSHS continues to monitor the impact of this ruling as regulations become fmalized.
(f) Tax Exemption for Sales Tax and Property Tax
Effective June 14,2012, the Governor of Illinois signed into law, Public Act 97-0688, which creates new standards for state sales tax and property tax exemptions in Illinois. The law establishes new standards for the issuance of charitable exemptions, including requirements for a nonprofit hospital to certify annually that in the prior year, it provided an amount of qualified services and activities to low-income and underserved individuals with a value at least equal to the hospital's estimated property tax liability. HSHS certified in 2013 and has not recorded a liability for related property taxes based upon management's current determination of qualified services provided.
47 (Continued)
HOSPITAL SISTERS HEALTH SYSTEM AND SUBSIDIARIES Springfield, Illinois
Notes to Consolidated Financial Statements
June 30, 2013 and 2012
(Dollars in thousands)
(g) Investment Risk and Uncertainties
HSHS invests in various investment securities. Investment securities are exposed to various risks such as interest rate, credit, and overall market volatility risks. Due to the level of risk associated with certain investment securities, it is at least reasonably possible that changes in the values of investment securities will occur in the near term and that such change could materially affect the amounts reported in the accompanying consolidated balance sheets.
(19) Subsequent Events
HSHS evaluated events and transactions through October 28, 2013, the date the consolidated fmancial statements were issued, noting no subsequent events requiring recording or disclosure.
48

HOSPITAL SISTERS HEALTH SYSTEM AND SUBSIDIARIES Springfield, Illinois
Consolidating Balance Sheet Information
June 30, 2013
(Dollars in thousands)
HSSI-Obligated Unity LImIted Healthcare
Assets Groul! RQIL Partnershil! KCIN West
Current assets: Cash and cash equivalents $ 55,473 3,693 1,666 106
Receivables: Patients' accounts, less allowance for uncollectible accounts
of$129,300 276,021 1,932 Due from third-party reimbursement programs 2,813 Other 18,702 26 380
Total receivables 297,536 1,958 380
Current portion of assets whose use is limited or restricted 156,825 4,048 Inventories 38,875 Prepaid expenses 9,691 438
Total current assets 558,400 9,699 2,484 106
Assets whose use is limited or restricted 1,552,282 73,541 317 8,571 Property, plant, and equipment, net 1,058,097 5,216 7,495 1,971 Other assets 71,232
Total assets $ 3,240,011 73,541 15,232 9,979 10,648
LIabilities and Net Assets
Current liabilities: Current installments of long-term debt $ 14,481 Long-term debt subject to short-term remarketing agreements 169,508 Accounts payable 96,058 1,319 3,005 78 Accrued liabilities 96,804 475 43 721 12 Estimated payables under third-party reimbursement programs 43,637
Total current liabilities 420,488 475 1,362 3,726 90
Long-term debt, excluding current installments 474,091 5,000 Estimated self-insurance liabilities 15,274 66,881 Derivative instruments 41,831 Accrued benefit liability 232,510 Other noncurrent liabilities 30,041 6,242 411
Total liabilities 1,214,235 67,356 7,604 8,726 501
Net assets: Unrestricted 1,929,884 6,185 7,628 1,253 10,147 Temporarily restricted 72,821 Permanently restricted 23,071
Total net assets 2,025,776 6,185 7,628 1,253 10,147
Stockholder's equity
Total liabilities and net assets $ 3,240,011 73,541 15,232 9,979 10,648
See accompanying independent auditors' report.
49

Schedule I
System HSHS Health Care Flex Office Medical Grou~ Trust Fund Plan Foundation Kiara Eliminations Total
6,381 7,733 762 2,717 5,296 (2,717) 81,1 JO
7,829 8,796 294,578 2,813
14,430 4,588 1,983 6,685 4,838 (27,997) 23,635
14,430 12,417 1,983 6,685 13,634 (27,997) 321,026
108,645 6,599 8,025 284,142 41 1,135 40,051
9,034 659 483 20,305
138,531 27,408 2,745 9,402 28,573 (30,714) 746,634
760 61,461 87,931 (261,156) 1,523,707 173,657 6,132 4,949 1,257,517 28,223 918 9,989 (42,154) 68,208
341,171 33,540 61,461 2,745 98,251 43,511 (334,024) 3,596,066
3,199 229 17,909 169,508
9,007 1,948 20,558 2,557 875 (21,312) 114,093 14,193 10,795 3,351 98,251 7,755 (98,463) 133,937
43,637
26,399 12,743 23,909 2,557 98,251 8,859 (119,775) 479,084
121,836 7,755 (178,013) 430,669 12,018 94,173
41,831 15,480 3,405 499 251,894 6,237 3,975 46,906
169,952 16,148 35,927 2,557 98,251 21,088 (297,788) 1,344,557
170,459 17,392 25,534 188 34,281 2,202,951 760 (48,094) 25,487
23,071
171,219 17,392 25,534 188 (13,813) 2,251,509
22,423 (22,423)
341,171 33,540 61,461 2,745 98,251 43,511 (334,024) 3,596,066
50

HOSPITAL SISTERS HEALTH SYSTEM AND SUBSIDIARIES Springfield, Illinois
Consolidating Statement of Operations Infonnation
Year ended June 30, 2013
Net patient service revenues Provision for uncollectible accounts
Net patient service revenue less provision for uncollectible accounts
Other revenues: Investment income Net assets released from restrictions used for operations Other
Total revenues and other support
Expenses: Sisters' services Salaries and wages Employee benefits Professional fees Supplies Depreciation and amortization Interest Other
Total expenses
Income (loss) from operations
Nonoperating gains (losses): Investment income Change in fair value of interest rate swaps Loss on conversion and early extinguishment of debt
Revenues and gains (losses) in excess (deficient) of expenses
Other changes in unrestricted net assets: Net assets released from restrictions used for the purchase of
property, plant, and equipment Reversal of change in pension funded status Transfers from (to) affiliates
Change in unrestricted net assets
See accompanying independent auditors' report.
$
$
(Dollars in thousands)
HSSI-Obligated
Graul! RQIL
1,902,152 (100,341)
1,801,811
2,036 4,789 1,933
65,763 14,310
1,871,543 19,099
244 550,241 208,683
96,221 275,015 102,209
7,881 570,069 19,099
1,810,563 19,099
60,980
110,721 22,606 (5,073)
189,234
4,218 150,522 (47,095)
296,879
51
Unity Limited Partnershil!
19,777
19,777
617
20,394
9,649 4,094
211 217 430
5,226
19,827
567
(26)
541
541
Healthcare KCIN West
6,922 885
6,922 885
95 7 19 44
1,908 322 99
9,218 306
11,339 679
(4,417) 206
4 573
(4,413) 779
1,500
(2,913) 779
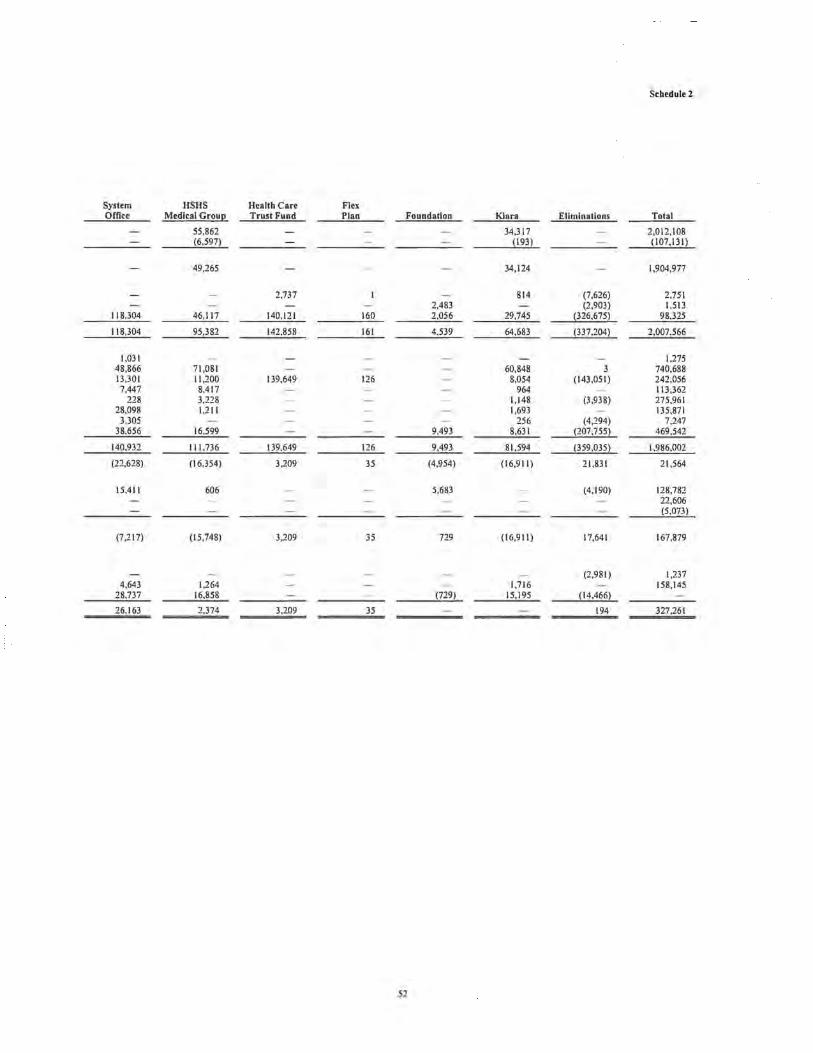
Schedule 2
System HSHS Health Care Flex Office Medical Grou!! Trust Fund Plan Foundation Kiara Eliminations Total
55,862 34,317 2,012,108 (6,597) (193) (107,131)
49,265 34,124 1,904,977
2,737 814 (7,626) 2,751 2,483 (2,903) 1,513
118,304 46,117 140,121 160 2,056 29,745 (326,675) 98,325
118,304 95,382 142,858 161 4,539 64,683 (337,204) 2,007,566
1,031 1,275 48,866 71,081 60,848 3 740,688 13,301 11,200 139,649 126 8,054 (143,051) 242,056 7,447 8,417 964 113,362
228 3,228 1,148 (3,938) 275,961 28,098 1,211 1,693 135,871
3,305 256 (4,294) 7,247 38,656 16,599 9,493 8,631 (207,755) 469,542
140,932 111,736 139.649 126 9,493 81.594 (359.035) 1.986.002
(22,628) (16,354) 3,209 35 (4,954) (16,911) 21,831 21,564
15,411 606 5,683 (4,190) 128,782 22,606 (5,073)
(7,217) (15,748) 3,209 35 729 (16,911) 17,641 167,879
(2,981) 1,237 4,643 1,264 1,716 158,145
28.737 16,858 (729) 15,195 (14,466)
26,163 2,374 3.209 35 194 327,261
52

HOSPITAL SISTERS HEALTH SYSTEM AND SUBSIDIARIES Springfield, I\Iinois
Consolidating Statement of Changes in Net Assets Infonnation
Year ended June 30, 2013
(Dollars in thousands)
HSSI-Obligated
Group ROIL U ntty Limited Partnership
Unrestricted net assets: Revenues and gains (losses) in excess (deficient) of expenses Other changes in unrestricted net assets:
Net assets released from restrictions use for the purchase of property, plant, and equipment
Reversal of change in pension funded status Transfers from (to) affiliates
Change in unrestricted net assets
Temporarily restricted net assets: Investment income Contributions Transfers from (to) affiliates Net assets released from restrictions
Change in temporarily restricted net assets
Pennanently restricted net assets: Investment income (loss) Contributions Transfers from (to) affiliates
Change in pennanently restricted net assets
Change in net assets
Net assets at beginning of year
Net assets at end of year
See accompanying independent auditors' report.
$
$
189,234
4,218 150,522 (47,095)
296,879
6,118 5,423
(6,151)
5,390
(9) 330
321
302,590
1,723,186
2,025,776
53
6,185
6,185
541
541
541
7,087
7,628
KCIN
(4,413)
1,500
(2,913)
(2,913)
4,166
1,253
Healthcare West
779
779
779
9,368
10,147

Schedule 3
System HSHS Health Care Flex Office Medical Groul! Trust Fund Plan Foundation Kiara Eliminations Total
(7,217) (15,748) 3,209 35 729 (16,911) 17,641 167,879
(2,981) 1,237 4,643 1,264 1,716 158,145
28,737 16,858 (729) 15,195 (14,466)
26,163 2,374 3,209 35 194 327,261
752 1,182 (6,870) 1,182 (703) 5,967 (4,415) 6,272
(4,666) 4,666 (2,483) 5,884 (2,750)
49 (735) 4,704
(9) 9 (9) 329 (329) 330
(320) 320
321
26,212 2,374 3,209 35 (541) 332,286
145,007 15,018 22,325 153 (13,272) 1,919,223
171,219 17,392 25,534 188 (13,813) 2,251,509
54
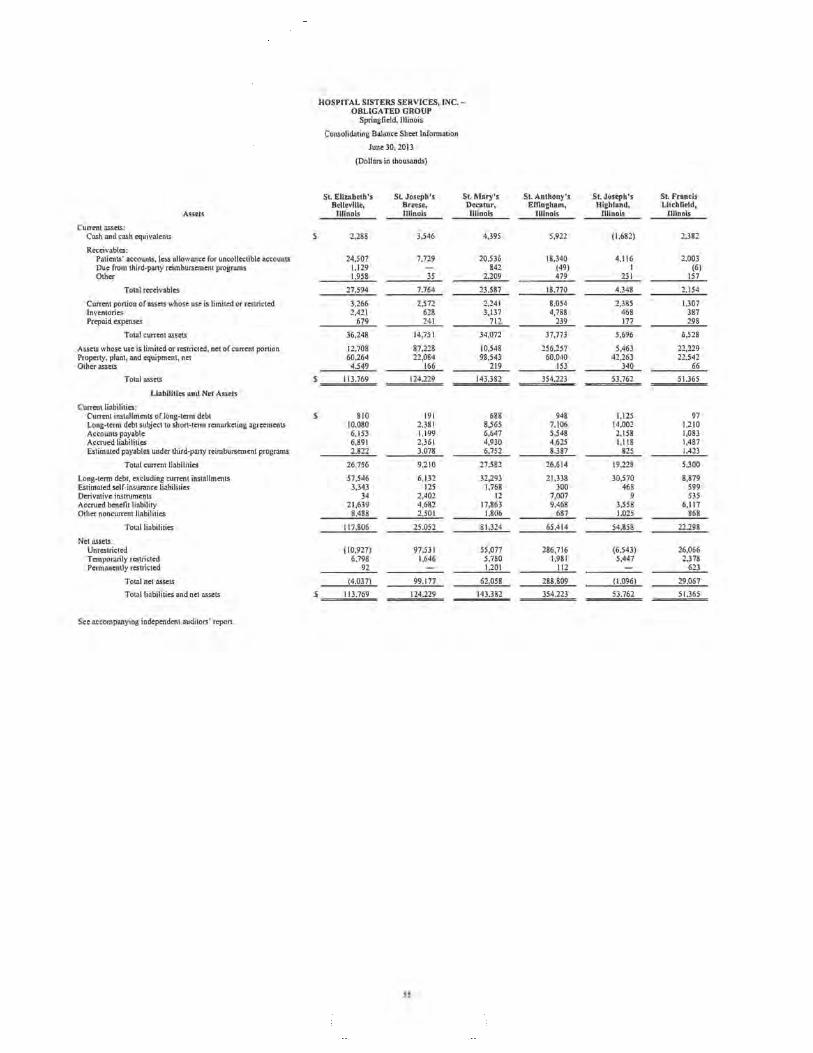
HOSPITAL SISTERS SERVICES, INC. -OBLIGATED GROUP
Springfield, Illinois
Consolidating Balance Sheet Infonnation
Iune 30, 2013
(Dollars in thousands)
St. Elizabeth's SL Joseph'. St.Mary'. St. Anthony'. St. Jo.eph'. SL Francis Belleville, Breese, Decatur, Effingham, Highland, Litchfield,
Assets Illino" Illino" Illino" Illino" Illino" Illino"
Current assets: Cash and cash equivalents 2.288 3.546 4,395 5,922 (1,682) 2,382
Receivables: Patients' accounts, less allowance for uncollectible accounts 24,507 7.729 20,536 18,340 4.116 2.003 Due from third-party reimbursement programs 1,129 842 (49) I (6) Other 1.958 35 2.209 479 231 157
Total receivables 27.594 7.764 23.587 18.770 4.348 2.154
Current portion of assets whose usc is limited or restricted 3,266 2,572 2,241 8.054 2,385 1,307 Inventories 2,421 628 3,137 4,788 468 387 Prepaid expertses 679 241 712 239 177 298
Total current assets 36,248 14,75 I 34,072 37.773 5,696 6,528
Assets whose usc is limited or restricted, net of current portion 12,708 87,228 10,548 256,257 5,463 22,229 Property, plant, and equipment, net 60,264 22,084 98,543 60,040 42,263 22,542 Other assets 4.549 166 219 153 340 66
Total assets 113,769 124.229 143.382 354.223 53.762 51.365
Llablllties and Net Assets
Current liabilities: Current installments ofloDg-term debt S 810 191 688 948 1,125 97 Long-term debt subject to short-term remarketing agreements 10,080 2,381 8,565 7,106 14.002 1.210 Accounts payable 6,153 1,199 6,647 5,548 2,158 1,083 Accrued liabilities 6,891 2.361 4,930 4,625 1,118 1,487 Estimated payables under third-party reimbursement programs 2.822 3.078 6.752 8.387 825 1.423
Total current liabilities 26,756 9,210 27,582 26,614 19,228 5,300
Longaterm. debt, excluding current installments 57,546 6,132 32,293 21,338 30.570 8,879 Estimated self-insurance liabilities 3,343 125 1,768 300 468 599 Derivative instruments 34 2,402 12 7,007 9 535 Accrued benefit liability 21,639 4.682 17,863 9.468 3.558 6,117 Other noncurrent liabilities 8.488 2.501 1.806 687 1.025 868
Totalliabiliti .. 117.806 25.052 81.324 65.414 54.858 22.298
Net assets: Unrestricted (10,927) 97,531 55,077 286,716 (6,543) 26,066 Temporarily restricted 6.798 1,646 5,780 1.981 5,447 2.378 Permanently restricted 92 1.201 112 623
Total net assets (4.037) 99.177 62.058 288.809 (1.096) 29.067
Total liabilities and net assets 113.769 124.229 143.382 354.223 53.762 51.365
See accompanying independent auditors' report.
5S

Schedule 4
Sacred Ho'pital St. John's St.Mary', St. Jo,eph', Heart SL Mary" St. Vincent St. Nichola, Sisters
Springfield, Streator, Chippewa Fan" Eau Claire, Green Bay, Green Bay, Sheboygan, Services, Illinois Illinois \ViscoDsin \Visconsin \Vis:coDsin WI,con,ln Wiscon,ln Inc. Elimination, Total
2,201 (507) 637 858 6,598 19,204 6,211 3,420 55,473
90,001 7,078 6,406 23,582 II ,839 49,664 10,220 276,021 101 295 198 302 2,813
3.359 457 127 715 613 9.004 647 149 (1,438) 18.702
93.360 7.636 6.533 24.297 12.747 58.866 11.169 149 (1,438) 297.536
72,599 3,747 4,674 17,669 9,793 22,970 4,848 700 156,825 10,975 922 391 5,100 2,780 5,267 1,611 38,875 3.608 351 59 677 205 2.305 140 9.691
182,743 12,149 12,294 48,601 32,123 108,612 23,979 4,269 (1,438) 558,400
273,858 31,509 92,615 342,836 56,429 320,129 40,473 1,552,282 331,112 37,618 24.610 103,424 74,994 131,919 48,684 1,058,097
4.857 460 93 352 10.355 41.347 1,449 6.826 71.232
792.570 81.736 129.612 495.213 173.901 602.007 114.585 11.095 (1,438) 3.240.011
5,399 279 348 1,314 728 1,958 596 14,481 67,200 3,468 4,326 16,355 9,065 21,262 4,488 169,508 25,664 2,066 2,963 11,682 5,439 18,338 4,978 3.578 (1,438) 96,058 21,244 2.180 3,583 7,705 3.798 30,898 2,565 3,419 96,804 10.394 2.886 1.033 5.321 96 620 43.637
129,901 10,879 12,253 42,377 19,126 73,076 12.627 6,997 (1,438) 420,488
155,455 8,933 11,144 42,129 23,350 60,155 16,167 474,091 6,461 433 170 870 97 352 288 15,274 8,092 840 2,271 9,424 1,542 8,614 1,049 41,831
51,999 9,418 13,966 23.967 15,828 47,025 6,980 232,510 10.203 1.855 500 231 654 582 641 30.041
362.111 32.358 39.804 119.267 60.174 189.876 37.693 7.638 !1,438) 1.214.235
402,509 46,957 79,994 368,796 106,744 404,059 69,448 3,457 1,929,884 25,458 2,339 3,464 1,813 4,684 5,240 5,793 72.821
2.492 82 6.350 5.337 2.299 2.832 1.651 23.071
430,459 49.378 89.808 375.946 113.727 412.131 76.892 3,457 2.025.776
792.570 81.736 129.612 495.213 173.901 602.007 114.585 11.095 (1,438) 3.240.011
56

Net patient service revenues Pro\'ision for uncollectible accounts
Net patient service rcvrnue less provision for uncollectible accounts
Other revenues: Investment income Net assets released from restrictions used for operations Other
Total revenues
Expenses: Sisters' services Salaries and wages Employee benefits Professional fees Supplies Depreciation and amortization Interest Other
Tot.1 expenses
Income (loss) from operations
Nonoperating gains (loss): Investment income (loss) Change in fair value of interest rate swap Loss on conversion and early extinguishment or debt
Revenues and gains (losses) in e;~cess (deficient) of expenses
Other changes in unrestricted net assets: Net assets released from restrictions used for the purchase of
property, plant, and equipment Transfers to affiliate Reversal of changes in pension funded status
Change in unrestricted net assets
See accompanying independent auditors' repon
HOSPITAL SISTERS SERVICES, INC, -OBLIGATED GROUP
Springfield, Illinois
Consolidating Statement of Operations lnfonnation
Year ended Iune 30, 2013
(Dollars in thousands)
St. Elizabeth', St Joseph's St.Mary', Belle.lIIe, Breese, Decatur,
illinois Illinois Illinois
158,547 48.566 137,909 (17.624) (785) (10.770)
140,923 47.781 127,139
395 25 253 9
6.512 2.396 6.540
147.830 50.211 133.932
2 53,068 16,962 42,169 19,287 6,607 16.384 4,996 3,012 7,362
21,496 4,022 18,971 9,395 3,316 8,044
857 I3S 645 54,644 9.271 39.046
163.745 43 ,325 132.623
(15,915) 6,886 1,309
23 6,156 (281) 5,673 (1,067) 3,409 (370) (101) (368)
(10,589) 11,874 4,069
444 81 (6.382) (1 .084) (4,929) 16.928 3.001 10.720
401 13,791 9.941
57
St. Anthony" St. Joseph's St. Francis Effingham, Highland, Litchfield,
illinois Illinois Illinois
118 ,705 25,655 33,943 (5.239) (955) (2.569)
113,466 24,700 31,374
71 62
5.446 442 1.193
118.983 25.148 32.629
24 32,491 8,466 10,716 14,030 4,261 4,372 6.039 2,525 2,944
17,360 2,462 2.651 6,247 1,005 1,429
511 136 II 24,730 6.980 7.746
101,408 25.859 29.869
17,575 (711) 2,760
18,582 (129) 1,516 (3,793) 460 910
(239) (5) (5 I)
32.125 (385) 5,13S
275 115 (2,990) (765) (2,368) 7.387 2.979 3.599
36.797 1.944 6.366

Schedule 5
Sacred HospUal SI. John's SI.Mary's SI. Joseph's Hearl SI.Mary's St. Vincent SI. Nicholas Sislers
Springfield, Streator, Chippewa Falls, Eau Claire, Green Bay, Green Bay, Sheboygan, Sen-Ices, illinois illinois Wisconsin \Visconsin \Viseon!in \Visconsin \Visconsin Inc. Eliminations Tolal
440,166 48,050 68,622 215,929 123,136 415,744 67,180 1,902,152 (37.485) (1 .816) 19521 (5.007) (4.912) (9.743) (2.484) 1100.341)
402.681 46.234 61.610 210,922 118,224 406,001 64,696 1,801,811
819 99 18 10 21 126 11 2,036 1,924 1,933
20.047 2.532 2.401 5,856 6.086 1.293 4.311 235 (5.527) 65.163
425.411 48.865 70.089 216.848 124.331 413.420 69.018 235 (5.527) 1.871,543
57 159 244 138,423 16,031 27.605 12,264 34,141 77,894 20.005 550.241 50,495 6,549 10,428 24,185 13,692 30,459 1,334 208,683 41,392 5,310 3,467 5,452 3.099 12.341 984 (200) (2,568) 96,221 81 ,948 4,834 4,695 32.519 18,493 55,839 9,665 275,015 26,013 3,739 2,931 12.812 6,483 16,212 4,583 102,209
2,413 ISS 226 863 531 1,183 209 1,881 95.757 13.865 14.975 39.799 35.609 205.809 23.925 812 (2.959) 570.069
436.498 50.549 64.327 188.554 112.054 399.902 66.105 672 (5.527) 1.810.563
(11,027) (1,684) 5.762 28.294 12.217 13.518 2.313 (437) 60,980
23.280 2,273 6,025 23,803 3,155 23,433 2,243 42 110.721 14.171 692 (372) (2,224) 2,446 765 936 22,606 11.351) (141) (186) (694) (421 ) (957) (189) (5.013)
25,673 1,140 11.229 49,179 18,057 36,759 5,363 (395) 189,234
41 66 512 734 494 555 901 4,218 (18,149) (1,797) (1.265) (2.001) (1 .091) (3,645) (623) (47,095) 37.387 6.714 6.513 13.523 9.368 26.284 6.119 150.522
44.952 6.123 16.989 61.435 26.822 59.953 11.760 (395) 296.879
58
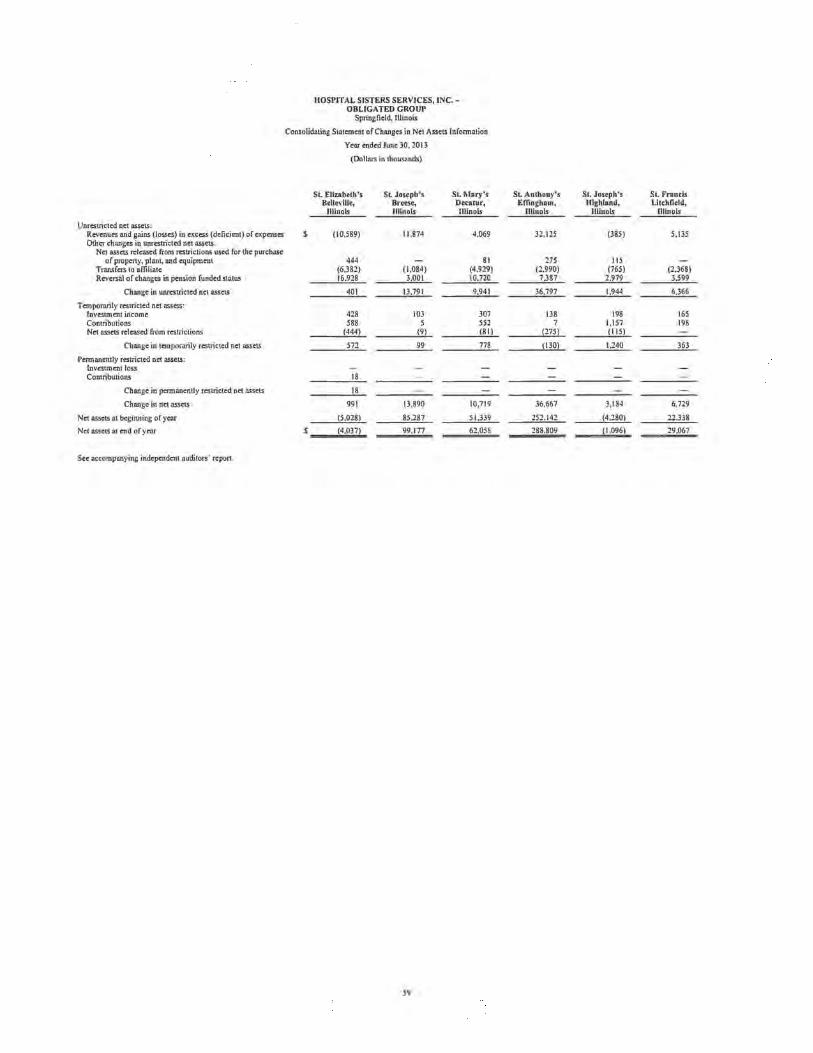
Unrestricted net assets: Revenues and gains (losses) in excess (deficient) of expenses Other changes in unrestricted net assets.
Net assets released from restrictions used for the purchase of property, plant, and equipment
Transfers to affiliate Reversal of changes in pension funded status
Change in unrestricted net assets
Temporarily restricted net assets: Investment income Contributions Net assets released from restrictions
Change in temporarily restricted net assets
Pcnnancntly restricted net assets: Investment loss Contributions
Change in permanently restricted net assets
Change in net assets
Net assets at beginning of year
Net assets al end of year
Sec accompanying independent auditors' report,
HOSPITAL SISTERS SERVICES, INC. -OBLIGATED GROUP
Springfield, JIlin Dis
Consolidating Statement of Changes in Net Assets Infonnation
Year ended June 30, 2013
(Dollars in thousands)
51. Elizabeth's 51. Joseph's St. Mary's Belleville, Breese, Decatur,
Illinois Illinois Illinois
S (10,589) 11 ,874 4,069
444 81 (6,382) (1.084) (4.929) 16.928 3.001 10.720
401 13.791 9.941
428 103 307 588 5 552
(444) (9) (81)
572 99 778
18
18
991 13.890 10.719
(5.028) 85.287 51.339
(4.037) 99.177 62.058
S9
St. Anthony's St. Joseph's 51. Francis Effingham, Highland, Litchfield,
Illinois Illinois Illinois
32,125 (385) 5,135
275 115 (2.990) (765) (2,368)
7.387 2.979 3.599
36.797 1.944 6.366
138 198 165 7 1,157 198
(275) (115)
!130) 1.240 363
36.667 3,184 6,729
252.142 (4.280) 22.338
288.809 (1.096) 29.067

Schedule 6
Sacred Hospllal SI. John's SI.Mary's SI. Joseph's Hearl SI. Mary's Sl Vincent SI. Nicholas Slslers
Springfield, Streator, Chippewa Falls, Eau Claire, Green Bay, Green Bay, Sheboygan, Services, Illinois illinois Wisconsin \Visconsin \Visconsin \Visconsin Wisconsin Inc. Eliminations Tolal
25,673 1,140 11 ,229 49,179 18,057 36,759 5,363 (395) 189,234
41 66 512 734 494 555 901 4,218 (18,149) (1,797) (1,265) (2,001) (1,097) (3,645) (623) (47,095) 37.387 6.714 6.513 13.523 9.368 26.284 6.119 150,522
44.952 6.123 16.989 61.435 26.822 59,953 11.760 !395) 296.879
1,926 164 670 503 481 473 562 6.118 947 57 236 160 (7) 1,455 68 5,423
!1.965) (66) (512) (734) !494) (555) (901) (6,15 I)
908 155 394 (71) 120) 1.373 (271) 5.390
(9) (9) IS 19 237 28 10 330
IS 19 228 28 10 321
45,875 6,279 17,402 61 ,592 26,804 61,354 11,499 (395) 302,590
384.584 43.099 72,406 314.354 86.923 350.777 65,393 3,852 1.723.186
430.459 49.378 89.808 375.946 113,727 412.131 76,892 3,457 2.025.776
60

Exhibit B
HSHS Organization Chart
Hospital Sisters Health System (HSHS)
I I I
Kiara,lnc. Hospital Sister Services, Inc. Hospital Sisters of
(For Profit) (HSSI) St. Francis Foundation, Inc.
t St. Elizabeth st. Joseph's Belleville, IL Chippewa Falls. WI
Select (SID) (WWD) Subsidiaries:
LaSante St. Joseph's Sacred'Heart
Wisconsin, Inc. Breese,IL Eau Clare, WI
(SII!») (WWD)
LaSante, Inc. St. Mary's St. Mary's
Prairie Decatur,IL Green Bay, WI Cardiovascular (CID) (EWD)
Consultants
St. Anthony's St. Vincent Effingham, IL Green Bay, WI
(SID) (EWD)
st. Joseph's St. Nicholas Highland, IL Sheboygan, WI
(SID) (EWD)
St. Francis HSHS Litchfield, Il Medical Group,
(SRD) Inc.
St. John's HSHS Medical Springfield, IL Group, Inc.
(SRD) Wisconsin
St. MaJiy's Renaissance Streator, IL Quality
(ClIll) Insurance Limited
Select Subsidiaries:
Hospital Sisters Healthcare - West, Inc.
Physician Clinical Integration Network (PCIN) Obligated Group
Kiara Clinical Integration Network (KCIN) Members
1

The Hospital Affiliates
The following is a list of the Hospital Affiliates and the location of the primary facilities separated by Division.
Springfield(lllinois) Referral Description of Number of Number of Location Division Facility Licensed Beds Staffed Beds
St. Francis Hospital Acute, Critical 36 25 Litchfield of the Hospital Sisters Access Hospital of the Third Order of St. Francis (referred to as "St. Francis")
St. John's Hospital of the Hospital Acute, Heart 439 430 Springfield Sisters of the Third Order of Institute, and St. Francis (referred to as "St. Women's and John's") Children's Hospital
Southern Illinois Division
St. Elizabeth's Hospital Acute, Psychiatric 338 260 Belleville of the Hospital Sisters of the Third Order ofSt. Francis (referred to as "St. Elizabeth's")
St. Joseph's Hospital, Breese, Acute 72 46 Breese of the Hospital Sisters of the Third Order ofSt. Francis (referred to as "St. Joseph's-Breese")
St. Anthony's Memorial Hospital Acute 146 146 Effingham of the Hospital Sisters of the Third Order of St. Francis (referred to as "St. Anthony's")
St. Joseph's Hospital Acute, Critical 25 25 Highland of the Hospital Sisters Access Hospital of the Third Order ofSt. Francis (referred to as "St. Joseph's-Highland")
Central Illinois Division
St. Mary's Hospital, Streator, Acute 97 68 Streator of the Hospital Sisters of the Third Order ofSt. Francis (referred to as "St. Mary's-Streator")
St. Mary's Hospital, Decatur, Acute 355 231 Decatur of the Hospital Sisters of the Third Order ofSt. Francis (referred to as "St. Mary's-Decatur")
2
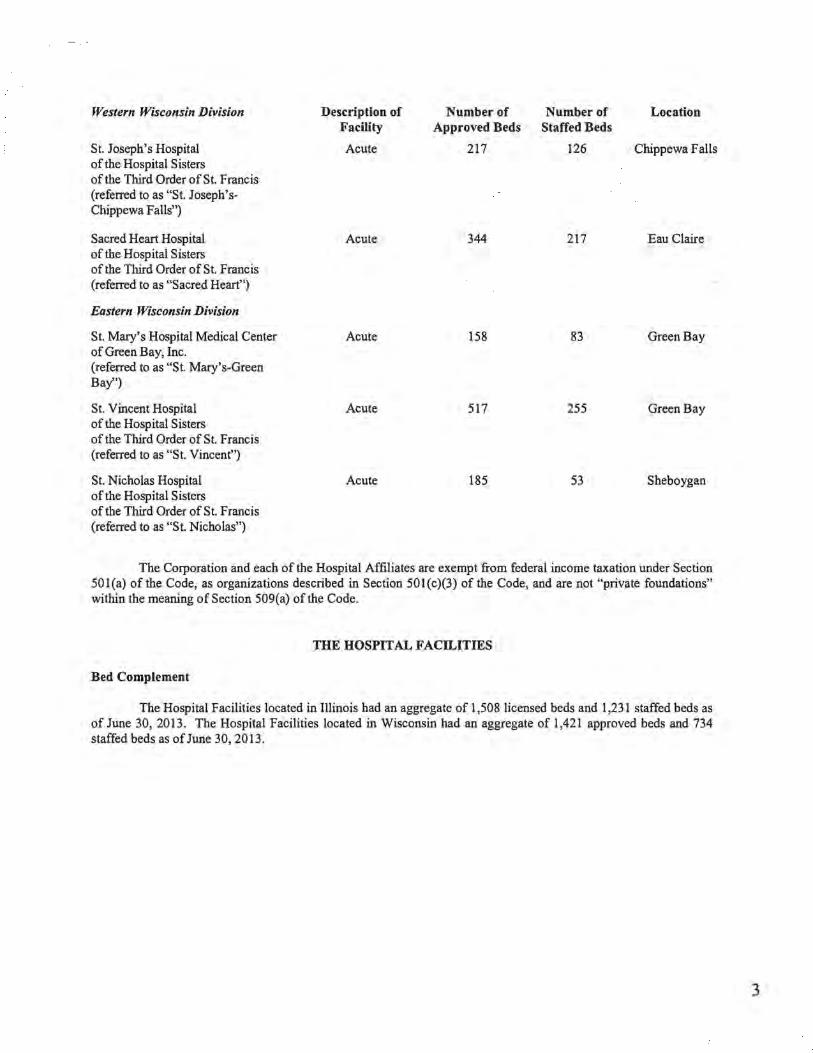
Western Wisconsin Division
St. Joseph's Hospital of the Hospital Sisters of the Third Order ofSt. Francis (referred to as "St. Joseph'sChippewa Falls")
Sacred Heart Hospital of the Hospital Sisters of the Third Order ofSt. Francis (referred to as "Sacred Heart")
Eastern Wisconsin Division
St. Mary's Hospital Medical Center of Green Bay, Inc. (referred to as "St. Mary's-Green Bay")
St. Vincent Hospital of the Hospital Sisters of the Third Order ofSt. Francis (referred to as "St. Vincent")
St. Nicholas Hospital of the Hospital Sisters of the Third Order ofSt. Francis (referred to as "St. Nicholas")
Description of Facility
Acute
Acute
Acute
Acute
Acute
N umber of N umber of Location Approved Beds Staffed Beds
217 126 Chippewa Falls
344 217 Eau Claire
158 83 Green Bay
517 255 Green Bay
185 53 Sheboygan
The Corporation and each of the Hospital Affiliates are exempt from federal income taxation under Section 501(a) of the Code, as organizations described in Section 501 (c)(3) of the Code, and are not "private foundations" within the meaning of Section 509(a) of the Code.
THE HOSPITAL FACILITIES
Bed Complement
The Hospital Facilities located in Illinois had an aggregate of 1,508 licensed beds and 1,231 staffed beds as of June 30, 2013 . The Hospital Facilities located in Wisconsin had an aggregate of 1,421 approved beds and 734 staffed beds as of June 30, 2013 .
3

Summary of Certain Operating Statistics of the Obligated Group and Financial Data of HSHS
The following tables set forth certain operating statistics for the Obligated Group and financial information for HSHS for the fiscal years ended June 30, 2010, 2011 , 2012, and 2013. The fmancial data was derived from the audited consolidated fmancial statements ofHSHS for the fiscal years ended June 30, 2010, 2011, 2012, and 2013. For more detailed information regarding the financial results of HSHS, see the information under the caption "Condensed Consolidated Summary Statements of Operations of HSHS" herein and the audited consolidated statements of operations ofHSHS for the fiscal years ended June 30,2012 and 2013 attached as Exhibit A.
Summary of Certain Operating Statistics of the Obligated Group
2010
Number of Licensed! Approved Beds 3,286 Number of Staffed Beds 2,064 Admissions 85,707 Average Length of Stay 4.55 Average Daily Census 1,067.9
Patient Days 389,783 Outpatient Registrations 1,322,975 Total Patients 1,712,758
Inpatient Surgical Cases 22,150 Outpatient Surgical Cases 44,685 Total Surgeries 66,835
Emergency Room Visits 318,570
Summary of Certain Financial Data of HSHS
Fiscal Year Ended June 30 2011 2012
3,103 3,062 2,069 1,996
83,135 83,062 4.63 4.49
1,055.7 1,019.95
385,327 373,302 1,402,441 1,480,542 1,787,768 1,853,844
21,847 21,105 43,372 43,981 65,219 65,086
309,030 300,915
Fiscal Year Ended June 30 (dollars in thousands)
2010 2011 2012 Net Patient Service Revenues less
Provision for Uncollectible Accounts Income (Loss) from Operations
Revenues and Gains in Excess (Deficient) of Expenses
$1,729,142 $ 26,809
$126,490
$1,829,091 $ (38,886)
$ 190,611
$1,869,928 $ 291
$ (11,943)
2013
2,929 1,965
82,681 4.43
1,003.96
366,445 1,440,323 1,806,768
19,461 41,639 61,100
296,655
2013
$1,904,977 $ 21,564
$ 167,879
4

Utilization Statistics
The following tables provide selected utilization statistics for the System Divisions.
lllinois Hospitals
Springfield Referral Division Fiscal Year Ended June 30 2010 2011 2012 2013
Admissions 21,111 20,994 20,905 21,889 Average Length of Stay:
St. John's Springfield 5.23 5.24 5.26 5.12 St. Francis Litchfield 3.29 3.51 3.53 3.34
Average Daily Census 294.35 294.39 293.91 300.52
Patient Days 107,435 107,451 107,572 109,967 Outpatient Registrations 296,716 292,186 294,353 292,384 Total Patients 404,151 399,637 401,925 402,351
Inpatient Surgical Cases 5,581 5,427 5,469 5,231 Outpatient Surgical Cases 12,619 11,547 11,448 10,440 Total Surgical Cases 18,200 16,974 16,917 15,671
Emergency Room Visits 69,305 68,355 65,077 65,051 Medicare Case Mix:
St. John's Springfield 1.77 1.75 1.80 1.86 St. Francis Litchfield 1.02 1.02 1.00 0.96
5

Southern Illinois Division Fiscal Year Ended June 30 2010 2011 2012 2013
Admissions 23,375 21,609 20,896 18,942 Average Length of Stay:
St. Elizabeth's Belleville 4.24 4.27 4.04 4.07 St. Joseph's Breese 3.31 2.98 2.70 2.43 St. Anthony's Effingham 3.77 3.80 3.67 3.84 St. Joseph's Highland 4.74 4.64 4.19 4.28
Average Daily Census 258.87 238.99 218.67 201.29
Patient Days 94,488 87,230 80,037 73,469 Outpatient Registrations 394,781 412,023 430,269 405,531 Total Patients 489,269 499,253 510,306 510,306
Inpatient Surgical Cases 4,921 4,857 4,532 4,011 Outpatient Surgical Cases 12,843 11,194 11,442 10,736 Total Surgical Cases 17,764 16,051 15,974 14,747
Emergency Room Visits 74,775 75,580 77,062 73,276 Medicare Case Mix:
St. Elizabeth's Belleville 1.64 1.61 1.67 1.62 St. Joseph's Breese 1.31 1.27 1.24 1.21 St. Anthony's Effingham 1.26 1.43 1.38 1.38 St. Joseph's Highland 1.06 1.17 1.14 1.20
Central Illinois Division Fiscal Year Ended June 30 2010 2011 2011 2013
Admissions 10,724 10,309 10,467 10,084 Average Length of Stay:
St. Mary's Decatur 4.98 5.02 5.23 5.34 St. Mary's Streator 5.16 5.27 3.72 3.60
Average Daily Census 147.91 143.77 140.68 138.77
Patient Days 53,990 52,479 51,488 50,652 Outpatient Registrations 193,321 245,004 254,160 242,329 Total Patients 247,311 297,483 305,648 292,981
Inpatient Surgical Cases 2,318 2,160 2,023 1,454 Outpatient Surgical Cases 4,914 4,823 4,783 4,047 Total Surgical Cases 7,232 6,983 6,761 5,501
Emergency Room Visits 45,416 43,547 45,269 48,444 Medicare Case Mix:
St. Mary's Decatur 1.26 1.46 1.43 1.44 St. Mary's Streator 1.25 1.29 1.36 1.37
6
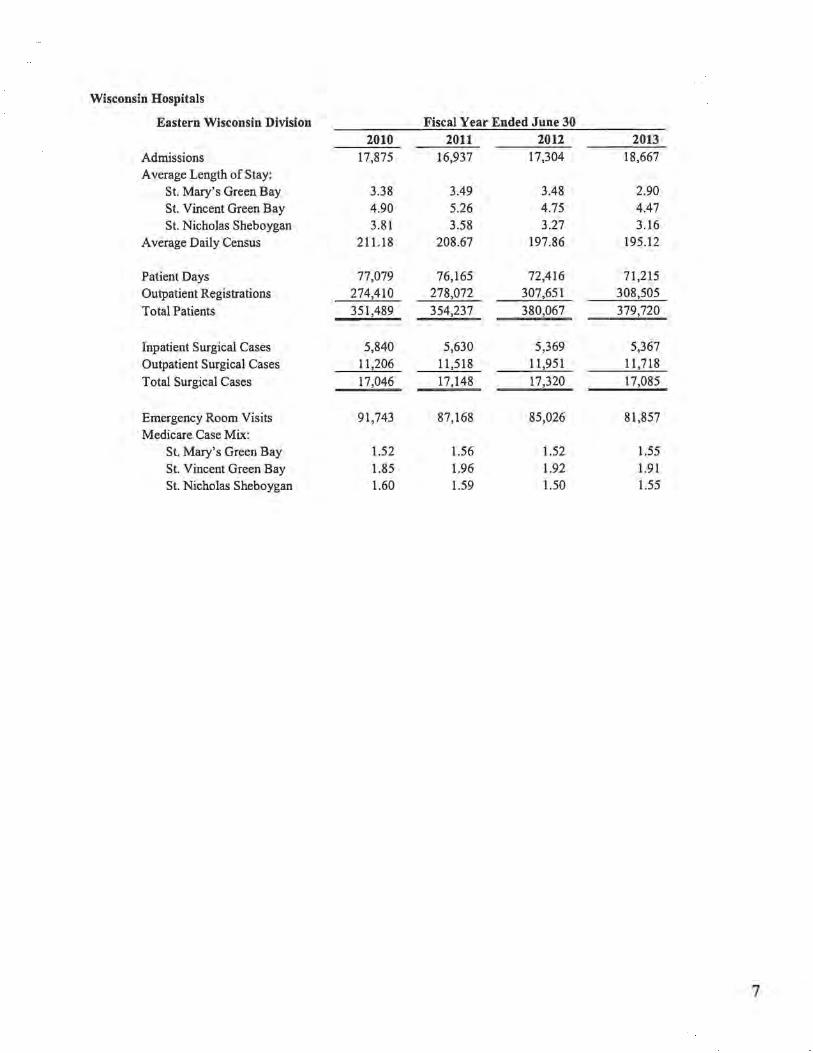
Wisconsin Hospitals
Eastern Wisconsin Division Fiscal Year Ended June 30 2010 2011 2012 2013
Admissions 17,875 16,937 17,304 18,667 Average Length of Stay:
St. Mary's Green Bay 3.38 3.49 3.48 2.90 St. Vincent Green Bay 4.90 5.26 4.75 4.47 St. Nicholas Sheboygan 3.81 3.58 3.27 3.16
Average Daily Census 211.18 208.67 197.86 195.12
Patient Days 77,079 76,165 72,416 71,215 Outpatient Registrations 274,410 278,072 307,651 308,505
Total Patients 351,489 354,237 380,067 379,720
Inpatient Surgical Cases 5,840 5,630 5,369 5,367 Outpatient Surgical Cases 11,206 11,518 11,951 11,718
Total Surgical Cases 17,046 17,148 17,320 17,085
Emergency Room Visits 91,743 87,168 85,026 81,857 Medicare Case Mix:
St. Mary's Green Bay 1.52 1.56 1.52 1.55 St. Vincent Green Bay 1.85 1.96 1.92 1.91 St. Nicholas Sheboygan 1.60 1.59 1.50 1.55
7

Western Wisconsin Division Fiscal Year Ended June 30 2010 2011 2012 2013
Admissions 12,622 13,286 13,490 13,099 Average Length of Stay:
St. Joseph's Chippewa Falls 4.29 4.59 4.40 4.54 Sacred Heart Eau Claire 4.57 4.69 4.64 4.74
Average Daily Census 155.59 169,.87 168.82 145.56
Patient Days 56,791 62,002 61,789 51,131 Outpatient Registrations 163,747 175,156 194,109 191,574 Total Patients 220,538 237,158 255,898 242,705
Inpatient Surgical Cases 3,554 3,773 3,712 3,712 Outpatient Surgical Cases 4,406 4,290 4,402 4,402
Total Surgical Cases 7,960 8,063 8,114 8,114
Emergency Room Visits 36,028 34,380 28,481 28,027 Medicare Case Mix:
St. Joseph's Chippewa Falls 1.09 1.16 1.18 1.20 Sacred Heart Eau Claire 1.68 1.63 1.76 1.75
Inpatient Market Share
The tables below reflect the total inpatient market share by discharge for the three largest Obligated Group Member's markets and those of the entities that are its main competitors in each respective market. The information includes both the primary service area (PSA) and secondary service area (SSA). In Illinois, the market share for 2012 represents the first nine months ofHSHS's fiscal year. In Wisconsin the market share for 2013 represents the first six months ofHSHS's fiscal year.
St. Elizabeth's Hospita1- Belleville (PSAISSA)
2010 2011 2012 2013
St. Elizabeth's - Belleville 22.4% 20.0% 19.8% 19.9%
Memorial Belleville 27.3% 28.5% 30.2% 30.l%
Outmigration Greater St. 30.3% 31.4% 31.8% 31.9% Louis, Missouri Hospitals
Other Illinois Hospitals 20.0% 20.l% 18.2% 18.1%
8

St. John's Hospital- Springfield (PSAlSSA)
2010 2011 2012 2013
St. John's-Springfield! St. Mary's-Decatur/ 33.5% 32.5% 32.8% 33.6% St. Francis-Litchfield
Memorial Springfield 34.6% 34.6% 33.6% 44.3%
Others 31.9% 32.9% 33.6% 22.1%
2013
2010 2011 2012 2013
St. Vincent-Green Bay/ St. 43 .0% 42.5% 43.1% 44.3%
Mary's-Green Bay
Bellin Hospital 21.1% 217% 21 .6% 22.1%
Others 35.9% 35.8% 35.3% 33.6%
(I) Source: Illinois Hospitals- IHA Compdata, DataBay 2013. Wisconsin Hospitals- WHA, DataBay 2013
SELECTED OPERATIONAL, STATISTICAL AND FINANCIAL INFORMATION
The selected consolidated summary financial information of HSHS for the fiscal years ended June 30, 2010,2011, 2012, and 2013 which is presented below under the subcaptions "Summary of Certain Operating and Financial Data" and "Condensed Consolidated Summary Statements of Operations of the Hospital Sisters Health System" was derived from, and should be read in conjunction with, the audited consolidated fmancial statements of HSHS as of and for the fiscal years then ended. The audited consolidated fmancial statements of Hospital Sisters Health System as of and for the fiscal years ended June 30, 2012 and 2013 are attached as Exhibit A. See footnote (2) to such audited consolidated fmancial statements for a summary ofHSHS's significant accounting policies. The selected summary financial information ofHSHS for the fiscal year ended June 30, 2013, which is presented below under the subcaptions "Summary of Certain Operating and Financial Data" and "Condensed Consolidated Summary Statements of Operations of Hospital Sisters Health System" was derived from the unaudited consolidated financial statements ofHSHS as ofJune 30, 2013.
Unless otherwise noted herein, financial information as and for fiscal years 2010, 2011, 2012, and 2013 refers to the consolidated financial statements of HSHS, of which the Obligated Group is a part. As noted here, HSHS is not a Member of the Obligated Group. Unless otherwise noted herein, operational information is limited to the operations of the Obligated Group.
9

Condensed Consolidated Balance Sheet of Hospital Sisters Health System
The following table presents the condensed consolidated summary balance sheet of HSHS for the fiscal years June 30, 2010, 2011, 2012 and 2013 as derived from the audited consolidated financial statements of HSHS for such fiscal years. This table should be read in conjunction with the audited consolidated fmancial statements of Hospital Sisters Health System for the fiscal years ended June 30,2012 and 2013 attached as Exhibit A.
Fiscal Year Ended June 30 (Dollars in thousands}
2010 2011 2012 2013 Current assets:
Cash and cash equivalents $58,436 $60,860 $90,514 $81,110 Patient receivables and other 285,019 307,784 334,399 321,026 Current portion of assets whose use is limited or restricted 195,756 185,733 201,738 284,142 Other current assets 62,197 58,069 56,606 60,356
Total current assets 601,408 612,446 683,257 746,634
Assets whose use is limited or restricted, net of current portion 1,421,051 1,512,806 1,446,720 1,523,707 Property, plant, and equipment, net 975,715 1,071,432 1,152,063 1,257,517 Other assets 122,592 83,267 73,657 68,208
Total Assets $3,120,766 $3,279,951 $3,355,697 $3596,066
Liabilities and Net Assets
Current liabilities:
Current installments oflong-term debt $202,215 $187,876 $186,564 $187,417
Accounts payable/accrued liabilities 223,911 241,998 267,738 291,667
Total current liabilities 426,126 429,874 454,302 479,084 Long-term debt, excluding current installments 366,929 365,864 379,378 430,669 Accrued benefit liability 362,860 249,111 410,039 251,894 Other noncurrent liabilities 147,946 150,665 192,755 182,910
Total liabilities 1,303,861 1,195,514 1,436,474 1,344,557
Net assets: Unrestricted 1,773,866 2,041,192 1,875,690 2,202,951 Temporarily restricted 22,0580 20,916 20,783 25,487 Permanently restricted 20,981 22,329 22,750 23,071
Total net assets 1,816,905 2,084,437 1,919,223 2,251,509 $3,120,766 $3,279,951 $3,355697 $3,596,066
10
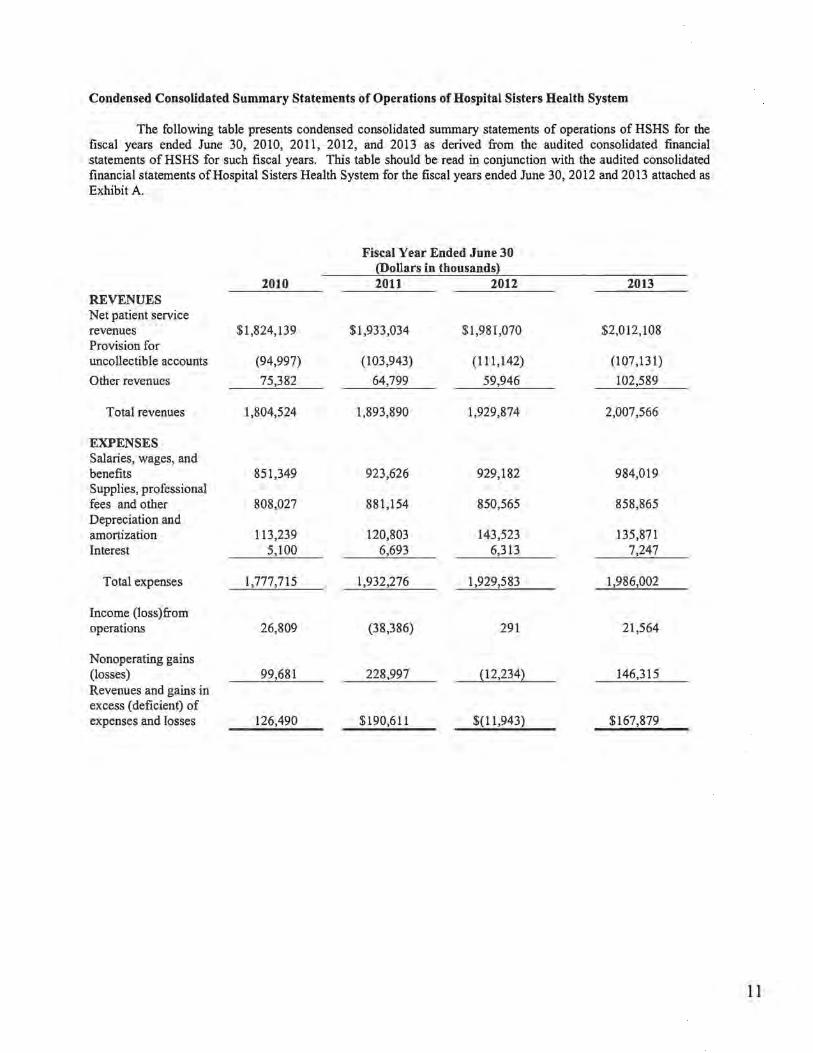
Condensed Consolidated Summary Statements of Operations of Hospital Sisters Health System
The following table presents condensed consolidated summary statements of operations of HSHS for the fiscal years ended June 30, 2010, 2011, 2012, and 2013 as derived from the audited consolidated [mancia1 statements of HSHS for such fiscal years. This table should be read in conjunction with the audited consolidated financial statements of Hospital Sisters Health System for the fiscal years ended June 30, 2012 and 2013 attached as Exhibit A.
Fiscal Year Ended June 30 (Dollars in thousands)
2010 2011 2012 2013 REVENUES Net patient service revenues $1,824,139 $1,933,034 $1,981,070 $2,012,108 Provision for uncollectible accounts (94,997) (103,943) (111,142) (107,131)
Other revenues 75,382 64,799 59,946 102,589
Total revenues 1,804,524 1,893,890 1,929,874 2,007,566
EXPENSES Salaries, wages, and benefits 851,349 923,626 929,182 984,019 Supplies, professional fees and other 808,027 881,154 850,565 858,865 Depreciation and amortization 113,239 120,803 143,523 135,871 Interest 5,100 6,693 6,313 7,247
Total expenses 1,777,715 1,932,276 1,929,583 1,986,002
Income (loss)from operations 26,809 (38,386) 291 21,564
Nonoperating gains (losses) 99,681 228,997 (12,234} 146,315 Revenues and gains in excess (deficient) of expenses and losses 126,490 $190,611 $(11,943) $167,879
11

Obligated Group Relative to HSHS
The consolidated fmancial information of HSHS includes the accounts and activities of the Obligated Group. Shown in the table below is the Obligated Group's portion relative to HSHS of various balance sheet and revenue indicators, for the fiscal years ended June 30, 2010, 2011, 2012 and 2013, as derived from the audited consolidated financial statements of HSHS for such fiscal. This table should be read in conjunction with the audited consolidated financial statements of Hospital Sisters Health System for the fiscal years ended June 30, 2012 and 2013 attached as Exhibit A.
Fiscal Year Ended June 30 Obligated Group as a Percentage of HSHS 2010 2011 2012 2013
Total Revenue 96.0% 94.3% 93.7% 93.2%
Unrestricted Cash and Investments 101.2% 99.8% 101.5% 100.78%
Revenues in Excess of Expenses 95.0% 98.8% 109.0% 112.7%
Total Assets 91.7% 90.6% 88.2% 90.1%
Significant Third Party Reimbursement Programs
The Obligated Group derives a substantial portion of their operating revenues from federal and state programs and insurance (e.g., Blue Cross) plans that pay for all or a portion of the health care services provided to a patient. As a consequence, the operating revenues of the Obligated Group depend to a great extent upon the availability and level of reimbursement or payment under such programs and plans. The following table sets forth the percentages of gross patient revenues for the Obligated Group applicable to each of the different programs and plans for the fiscal years ended June 30, 2010, 2011, 2012, and 2013.
Fiscal Year Ended June 30 2010 2011 2012 2013
Medicare 45.0% 46.0% 46.0% 47.0%
Medicaid 14.0% 15.0% 15.0% 14.0%
Blue CrosslManaged Care(1) 32.0% 31.0% 30.0% 32.0%
Commercial/Other 9.0% 8.0% 9.0% 7.0%
Total 100.0% 100.0% 100.0% 100.0%
(I) Includes health maintenance organizations and preferred provider organizations.
12
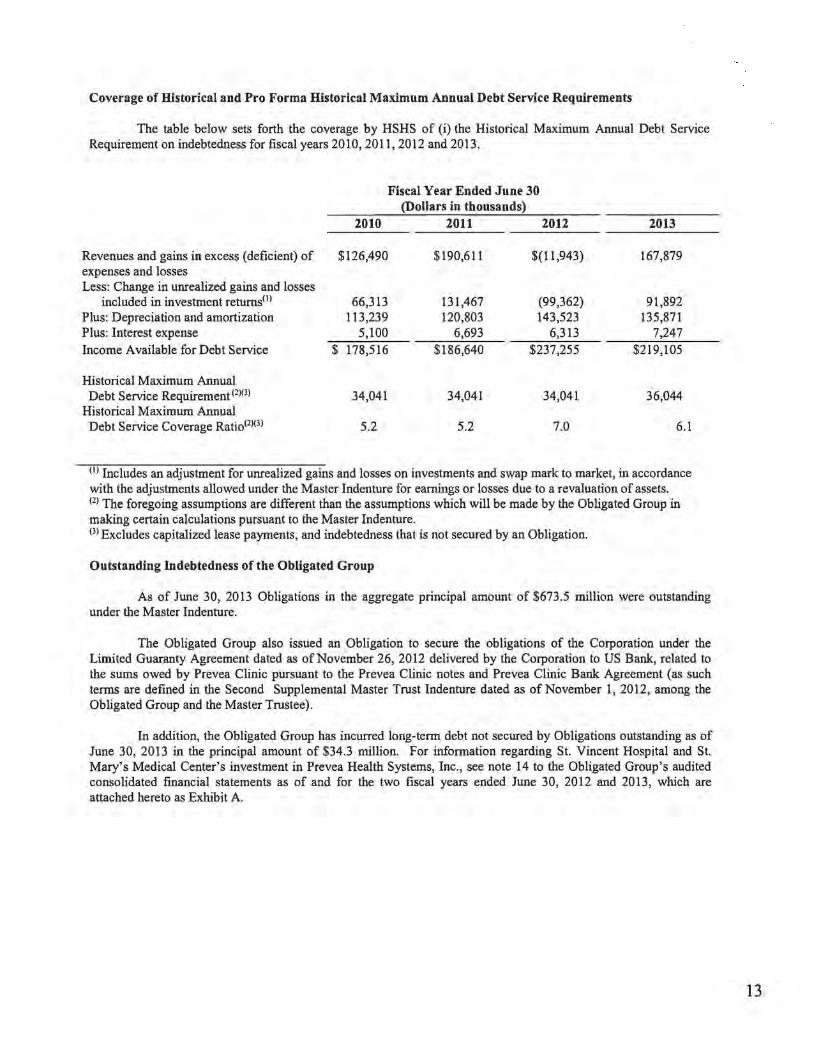
Coverage of Historical and Pro Forma Historical Maximum Annual Debt Service Requirements
The table below sets forth the coverage by HSHS of (i) the Historical Maximum Annual Debt Service Requirement on indebtedness for fiscal years 2010, 2011, 2012 and 2013.
Fiscal Year Ended June 30 (Dollars in thousands)
2010 2011 2012 2013
Revenues and gains in excess (deficient) of $126,490 $190,611 $(11,943) 167,879 expenses and losses Less: Change in unrealized gains and losses
included in investment returns(l) 66,313 131,467 (99,362) 91,892 Plus: Depreciation and amortization 113,239 120,803 143,523 135,871 Plus: Interest expense 5,100 6,693 6,313 7,247 Income Available for Debt Service $ 178,516 $186,640 $237,255 $219,105
Historical Maximum Annual Debt Service Requirement (2)(3) 34,041 34,041 34,041 36,044
Historical Maximum Annual Debt Service Coverage Ratio!2)(3) 5.2 5.2 7.0 6.1
(I) Includes an adjustment for unrealized gains and losses on investments and swap mark to market, in accordance with the adjustments allowed under the Master Indenture for earnings or losses due to a revaluation of assets. (2) The foregoing assumptions are different than the assumptions which will be made by the Obligated Group in making certain calculations pursuant to the Master Indenture. (3) Excludes capitalized lease payments, and indebtedness that is not secured by an Obligation.
Outstanding Indebtedness of the Obligated Group
As of June 30, 2013 Obligations in the aggregate principal amount of $673.5 million were outstanding under the Master Indenture.
The Obligated Group also issued an Obligation to secure the obligations of the Corporation under the Limited Guaranty Agreement dated as of November 26,2012 delivered by the Corporation to US Bank, related to the sums owed by Prevea Clinic pursuant to the Prevea Clinic notes and Prevea Clinic Bank Agreement (as such terms are defined in the Second Supplemental Master Trust Indenture dated as of November 1, 2012, among the Obligated Group and the Master Trustee).
In addition, the Obligated Group has incurred long-term debt not secured by Obligations outstanding as of June 30, 2013 in the principal amount of $34.3 million. For information regarding St. Vincent Hospital and St. Mary's Medical Center's investment in Prevea Health Systems, Inc., see note 14 to the Obligated Group's audited consolidated fmancial statements as of and for the two fiscal years ended June 30, 2012 and 2013, which are attached hereto as Exhibit A.
13
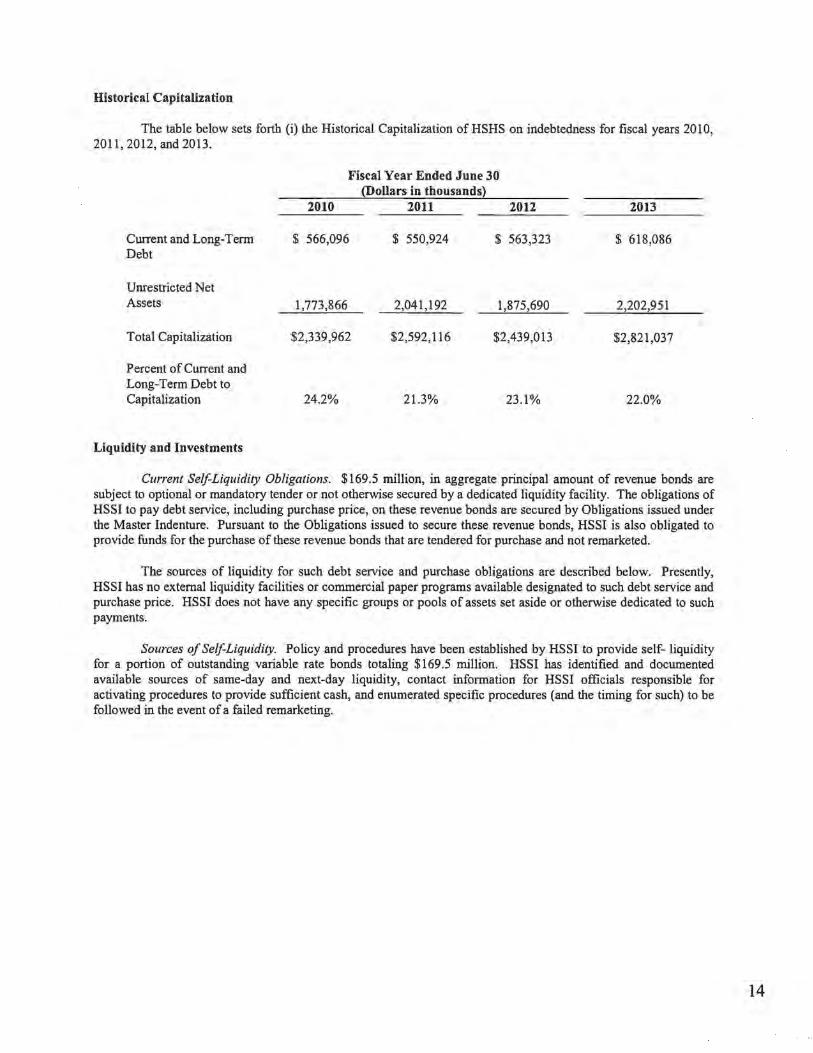
Historical Capitalization
The table below sets forth (i) the Historical Capitalization of HSHS on indebtedness for fiscal years 20 I 0, 2011,2012, and 2013.
Current and Long-Term Debt
Unrestricted Net Assets
Total Capitalization
Percent of Current and Long-Term Debt to Capitalization
Liquidity and Investments
Fiscal Year Ended June 30 (Dollars in thousands)
2010 2011 2012
$ 566,096 $ 550,924 $ 563,323
1,773,866 2,041,192 1,875,690
$2,339,962 $2,592,116 $2,439,013
24.2% 21.3% 23.1%
2013
$ 618,086
2,202,951
$2,821,037
22.0%
Current Self-Liquidity Obligations. $169.5 million, in aggregate principal amount of revenue bonds are subject to optional or mandatory tender or not otherwise secured by a dedicated liquidity facility. The obligations of HSSI to pay debt service, including purchase price, on these revenue bonds are secured by Obligations issued under the Master Indenture. Pursuant to the Obligations issued to secure these revenue bonds, HSSI is also obligated to provide funds for the purchase of these revenue bonds that are tendered for purchase and not remarketed.
The sources of liquidity for such debt service and purchase obligations are described below. Presently, HSSI has no external liquidity facilities or commercial paper programs available designated to such debt service and purchase price. HSSI does not have any specific groups or pools of assets set aside or otherwise dedicated to such payments.
Sources of Self-Liquidity. Policy and procedures have been established by HSSI to provide self- liquidity for a portion of outstanding variable rate bonds totaling $169.5 million. HSSI has identified and documented available sources of same-day and next-day liquidity, contact information for HSSI officials responsible for activating procedures to provide sufficient cash, and enumerated specific procedures (and the timing for such) to be followed in the event of a failed remarketing.
14

The following table represents the internal funding sources available for same-day, next-day and up to three day liquidity as of June 30, 2013.
Same Day Settlement
Next Day Settlement
Line of Credit
Three Day Settlement
Total Available for Internal Funding
Fiscal Year Ended June 30, 2013
(Dollars in thousands)(l) $220,731
339,470
o
164,200
$724,401
(I) Includes mutual funds, cash and cash equivalents and debt securities.
Investment Policy
Hospital Sisters Health System has and Investment Subcommittee comprised of individuals experienced in investments and individuals who serve on the Board of Directors. The Subcommittee, management, and the investment consultant develop investment policies, recommends asset allocation and investment manager changes, monitors and reviews investment performance, risk, and adherence to guidelines. The Board of Directors approves the investment policy statement. The current asset allocation for investments is summarized in the table below:
All Cap Equity 4.0%
Large Cap Equity 20.6%
SmalllMid Cap Equity 7.8%
Foreign Equity 12.0%
Emerging Market Equity 2.7%
Fixed Income 37.3%
Hedge Funds 15.6%
Total 100.0%
To achieve the objectives of the investment policy, Hospital Sisters Health System seeks to engage the best investment managers for the respective sub-class. HSHS currently engages 15 equity managers 5 international equity managers 5 fixed income managers and 2 custom hedge fund of fund managers.
Cash and Board Designated Funds
The following table presents the operating cash, board designated funds for capital improvements (funded depreciation) and other board designated funds (referred to as liquid funds) of Hospital Sisters Health System as of June 30, 2010, 2011, 2012, and 2013. Excluded from Hospital Sisters Health System's liquid funds for this purpose
15

are temporarily or permanently restricted assets, trustee-held bond funds, and self-insurance trusts. The table also presents Hospital Sisters Health System days cash on hand ratio for the fiscal years ended June 30, 2010, 2011, 2012, and 2013. The days cash on hand ratio for each such period is calculated by dividing such liquid funds, as shown on the audited consolidated fmancial statements of Hospital Sisters Health System for such period, by the amount determined by dividing (i) the expenses of the Hospital Sisters Health System (excluding depreciation and amortization), as shown on such audited consolidated fmancial statements for such fiscal year, by (ii) 365.
Fiscal Year Ended June 30 (Dollars in thousands}
2010 2011 2012 2013
Cash and cash equivalents $ 58,436 $ 60,860 $ 90,514 $ 81,110
Board-designated funds for capital improvements 1,185,317 1,370,367 1,375,077 1,547,405 Total $1,245,753 $1,431,227 $1,465,591 $1,628,515
Cash Expenses per day(l) $ 4,559 $ 4,964 $ 4,890 $ 5,068
Days cash on hand ratio 273 288 300 321
(1) Total expenses less amortization and depreciation divided by number of days in applicable period.
Sources of Investment Income
Investment income is a significant source of additional revenue for the Obligated Group, and is included in both operating revenue and other (non-operating) income. Investment return for HSHS for the fiscal years ended 2010,2011,2012, and 2013 is summarized in the table below.
The System's ability to generate investment income and realized gains on investments is dependent in large measure on market conditions. The market value ofHSHS centralized investment portfolio, as well as the HSHS's investment income, has fluctuated significantly in the past and may continue to fluctuate in the future. Investments are recorded at market value, with changes in market value recorded as investment income (losses) and included, together with realized investment income (losses), in revenues and gains in excess (deficient) of expenses. Given the size of its centralized investment program, the Obligated Group anticipates that changes in levels of realized and unrealized returns on its investment portfolio are likely to continue to have a significant impact on the Obligated Group's revenues and gains in excess (deficient) of expenses.
16
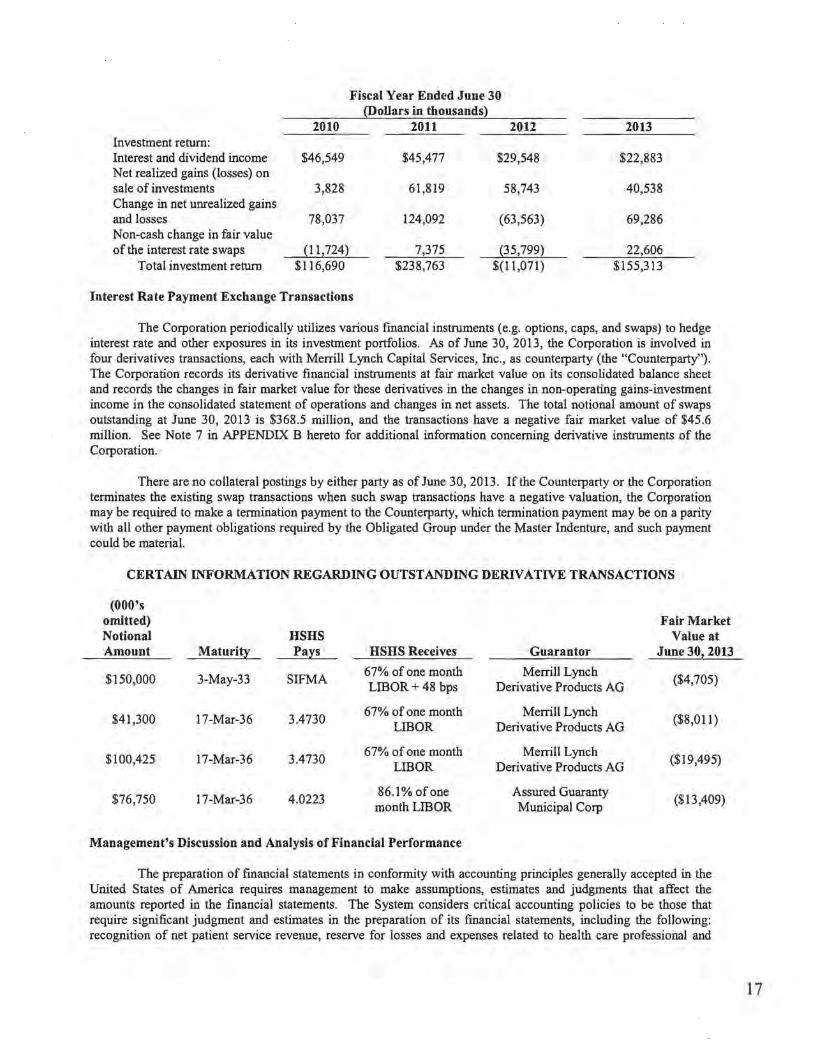
Fiscal Year Ended June 30 (Dollars in thousands}
2010 2011 2012 2013 Investment return: Interest and dividend income $46,549 $45,477 $29,548 $22,883 Net realized gains (losses) on sale of investments 3,828 61,819 58,743 40,538 Change in net unrealized gains and losses 78,037 124,092 (63,563) 69,286 Non-cash change in fair value of the interest rate swaps {11,724) 7,375 {35,799) 22,606
Total investment return $116,690 $238,763 $(11,071) $155,313
Interest Rate Payment Exchange Transactions
The Corporation periodically utilizes various fmancial instruments (e.g. options, caps, and swaps) to hedge interest rate and other exposures in its investment portfolios. As of June 30, 2013, the Corporation is involved in four derivatives transactions, each with Merrill Lynch Capital Services, Inc., as counterparty (the "Counterparty"). The Corporation records its derivative financial instruments at fair market value on its consolidated balance sheet and records the changes in fair market value for these derivatives in the changes in non-operating gains-investment income in the consolidated statement of operations and changes in net assets. The total notional amount of swaps outstanding at June 30, 2013 is $368.5 million, and the transactions have a negative fair market value of $45.6 million. See Note 7 in APPENDIX B hereto for additional information concerning derivative instruments of the Corporation.
There are no collateral postings by either party as of June 30, 2013. If the Counterparty or the Corporation terminates the existing swap transactions when such swap transactions have a negative valuation, the Corporation may be required to make a termination payment to the Counterparty, which termination payment may be on a parity with all other payment obligations required by the Obligated Group under the Master Indenture, and such payment could be material.
CERTAIN INFORMATION REGARDING OUTSTANDING DERIVATIVE TRANSACTIONS
(OOO's omitted) Fair Market Notional HSHS Value at Amount Maturi~ Pa~s HSHS Receives Guarantor June 30, 2013
$150,000 3-May-33 SIFMA 67% of one month Merrill Lynch
($4,705) LIBOR + 48 bps Derivative Products AG
$41,300 17-Mar-36 3.4730 67% of one month Merrill Lynch
($8,011) LIB OR Derivative Products AG
$100,425 l7-Mar-36 3.4730 67% of one month Merrill Lynch
($19,495) LIB OR Derivative Products AG
$76,750 17-Mar-36 4.0223 86.1% of one Assured Guaranty
($13,409) month LIB OR Municipal Corp
Management's Discussion and Analysis of Financial Performance
The preparation of fmancial statements in conformity with accounting principles generally accepted in the United States of America requires management to make assumptions, estimates and judgments that affect the amounts reported in the financial statements. The System considers critical accounting policies to be those that require significant judgment and estimates in the preparation of its fmancial statements, including the following: recognition of net patient service revenue, reserve for losses and expenses related to health care professional and
17

general liability risks, and risks and assumptions for measurement of pension liabilities. The System's management relies on historical experience and on other assumptions believed to be reasonable under the circumstances in making its judgment and estimates. Actual results could differ from those estimates.
Historical Performance: Twelve Month Period Ending June 30,2013
Consolidated Statements of Operations
Operating Results. For the twelve month period ending June 30, 2013, HSHS 's income from operations was $21.5 million and its operating margin improved to 1.07% from 0.2% over the comparable period ending June 30,2012.
Total revenues increased $77.7 million or 1.04% during this period. Contributing to the change in HSHS's revenues over the comparable period was the receipt of $31 .8 million for Electronic Health Record meaningful use for the Medicaid program. Current year reimbursement from State and Federal payers are influenced by provisions of Healthcare reform and state budget constraints.
Total recurring operating expenses for the twelve month period ending June 30, 2013 of $1.9 billion increased $.6 million or 2.84% compared to the June 30, 2012 operating expenses. Salaries and benefits increased $54.8 million or 5.6%, primarily due to wage and pension increases. These were partially offset by reduced employee healthcare costs. Salaries, wages and benefits remain a near constant percentage of total expense during this period (49.5% in 2013 and 48.1% in 2012). Supplies, professional fees and other increased $8.3 million or 1.0%. This is the result of the Corporation management's continued focus on reducing variable costs. Depreciation and amortization have decreased $7.6 million or 5.3%. This is due to the impairment of an asset in fiscal 2012.
Non-operating gains (losses). For the twelve months ending June 30, 2013, other income increased $166.3 million as compared to fiscal year 2012. This increase primarily relates to the favorable financial markets, with the Corporation recognizing $69.3 million in unrealized gains on trading securities for fiscal year 2013 versus an unrealized loss of ($63 .6) million that was experienced for fiscal year 2012. The negative value of the Corporation's interest rate swap contracts have decreased during the twelve month period ending June 30, 2013, with the Corporation recording $22.6 million as the net unrealized gain and periodic settlements on the interest rate swap contracts compared to a net realized loss of($35 .8) million for fiscal year 2012.
Revenue in excess (deficit) of expenses and non-operating income (loss). Excess of revenue over expenses for the twelve month period ending June 30, 2013 increased by $179.8 million as compared to June 30, 2012, primarily due to the unrealized gain on trading securities and the mark to market on interest rate swap contracts.
Historical Performance: Consolidated Balance Sheets (2012-2013)
The System's cash and investments increased by $149.9 million, or 8.6% at June 30, 2013 to $1.889 billion compared to the balance of$1.739 billion at June 30, 2012. At June 30, 2013 $1.547 billion funds are available for capital improvements; $163.7 million of assets held for estimated self insurance liabilities; and $96.6 million of other restricted investments.
Patient Accounts Receivable and other. Patient accounts receivable and other have decreased $13.2 million or 10.8% from $307.8 million at June 30, 2012 to $294.5 million at June 30, 2013. Net days in accounts receivable decreased from 56.3 days at June 30, 2012 to 47.0 days as of June 30, 2013. The changes in accounts receivable are due to the paydown of the receivable balance for the State of Illinois Medicaid program.
Change in Net Assets. Unrestricted net assets increased $327.2 million from $1.876 billion at June 30, 2012 to $2.20 billion at June 30, 2013. These changes reflect the total operating performance of HSHS over this historical period. The accrued benefit liability decreased $158.1 million from $410.0 million at June 30, 2012 to $251.9 million at June 30, 2013. The changes are a result of a change in discount rates used to determine the projected benefit obligations of the System's retirement plan.
18
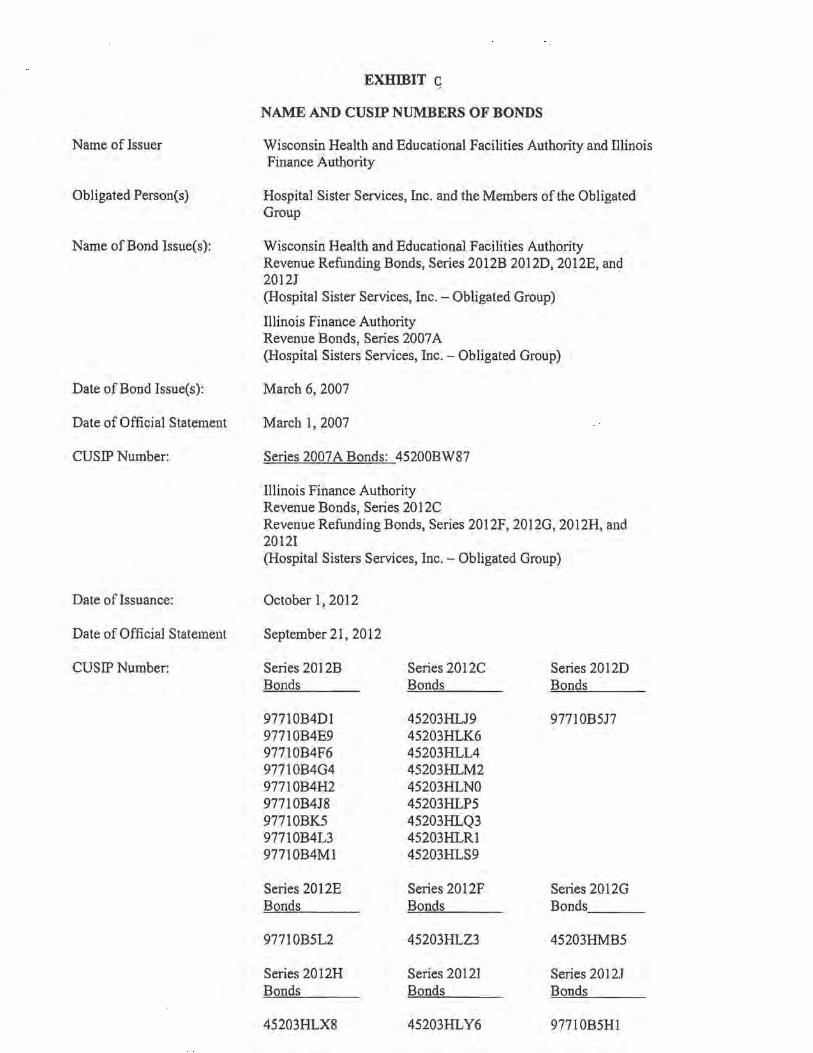
Name of Issuer
Obligated Person(s)
Name of Bond 1ssue(s):
Date of Bond Issue(s):
Date of Official Statement
CUSIP Number:
Date of Issuance:
Date of Official Statement
CUSIP Number:
EXHmIT G
NAME AND CUSIP NUMBERS OF BONDS
Wisconsin Health and Educational Facilities Authority and lllinois Finance Authority
Hospital Sister Services, Inc. and the Members of the Obligated Group
Wisconsin Health and Educational Facilities Authority Revenue Refunding Bonds, Series 2012B 2012D, 2012E, and 2012J (Hospital Sister Services, Inc. - Obligated Group)
Illinois Finance Authority Revenue Bonds, Series 2007 A (Hospital Sisters Services, Inc. - Obligated Group)
March 6, 2007
March 1, 2007
Series 2007 A Bonds: 45200BW87
Illinois Finance Authority Revenue Bonds, Series 2012C Revenue Refunding Bonds, Series 2012F, 2012G, 2012H, and 20121 (Hospital Sisters Services, Inc. - Obligated Group)
October 1,2012
September 21, 2012
Series 2012B Bonds
97710B4D1 97710B4E9 9771OB4F6 97710B4G4 97710B4H2 97710B4J8 97710BK5 97710B4L3 97710B4Ml
Series 2012E Bonds
97710B5L2
Series 2012H Bonds
45203HLX8
Series 2012C Bonds
45203HU9 45203HLK6 45203HLL4 45203HLM2 45203HLNO 45203HLP5 45203HLQ3 45203HLR1 45203HLS9
Series 2012F Bonds
45203HLZ3
Series 20121 Bonds
45203HLY6
Series 2012D Bonds
97710B5J7
Series 2012G Bonds ---
45203HMB5
Series 20121 Bonds
97710B5H1