Nutrition care practices in hospital wards: Results from ...
Upload
duongkhuongCategory
view
215download
2
Hospital Results
PHC4 • Cardiac Surgery Report • Jan 2014 – Mar 2016 Data
Hospital Results • 1
Table Notes Total Number of Cases includes all cases after exclusions (patients less than 30 years of age, patients who left against medical advice and clinically complex cases were excluded). The total number of cases includes inpatient hospital discharges from January 1, 2014 through March 31, 2016. In-Hospital Mortality represents the number of patients who died during the hospitalization in which the procedure was performed. This analysis includes inpatient hospital discharges from January 1, 2014 through March 31, 2016. 30-Day Readmission represents the number of patients who were readmitted to any general acute care hospital in Pennsylvania for a heart-related condition, an infection or a complication. This analysis is based on inpatient hospital discharges from January 1, 2014 through August 31, 2015. Actual Percent is the percent (rate) of patients who died (In-Hospital Mortality) or who were readmitted (30-Day Readmission). Expected Range is the range (upper and lower limits) of the percent of patients one could reasonably expect to die (In-Hospital Mortality) or be readmitted (30-Day Readmission) after accounting for patient risk. Rating identifies whether the actual percent (rate) is significantly higher than, significantly lower than or not significantly different than expected. See Understanding the Statistical Rating Symbols below. Average Hospital Charge is for the entire length of stay and is trimmed and case-mix adjusted. In almost all cases, hospitals typically receive actual payments from private insurers or government payers that are considerably less than the listed charge. This analysis includes inpatient hospital discharges from January 1, 2014 through March 31, 2016. See About the Report section or the Technical Notes for further details.
Understanding the Statistical Rating Symbols
The rating symbols displayed in this report represent a comparison of a hospital’s actual percent of mortality or readmission to its
expected range, which takes into account varying illness levels among patients. See example below.
In-Hospital Mortality
Actual
Percent Expected
Range Rating
Sample Hospital A
CABG without Valve 1.3% 0.4% - 3.5%
Hospital’s actual percent is within the hospital’s
expected range. The hospital’s rating is not
significantly different than expected.
Sample Hospital B
CABG without Valve 0.0% 0.5% - 3.8%
Hospital’s actual percent is less than the hospital’s
expected range. The hospital’s rating is
significantly lower (better) than expected.
Sample Hospital C
CABG without Valve 4.0% 0.0% - 2.9%
Hospital’s actual percent is more than the
hospital’s expected range. The hospital’s rating is
significantly higher (worse) than expected.

Hospital Results
Rate was significantly lower than expected.
Rate was not significantly different than expected.
Rate was significantly higher than expected.
NR: Not reported. Too few cases after exclusions.
PHC4 • Cardiac Surgery Report • Jan 2014 – Mar 2016 Data
Hospital Results • 2
In-Hospital Mortality 30-Day
Readmission Average Hospital Charge
Total Number of Cases
Actual Percent
Actual Percent
Statewide Statistics
CABG without Valve 16,641 1.5% 10.2% $168,627
Total Valve 12,937 2.7% 13.7% $221,013
Valve without CABG 8,618 1.8% 13.3% $207,548
Valve with CABG 4,319 4.4% 14.5% $248,178
In-Hospital Mortality 30-Day Readmission Average Hospital Charge
Hospital
Total Number of Cases
Actual Percent
Expected Range Rating
Actual Percent
Expected Range Rating
Abington Memorial
CABG without Valve 230 1.3% 0.4% - 3.5% 10.8% 6.4% - 15.3% $181,730
Total Valve 225 3.6% 0.4% - 4.0% 11.9% 8.2% - 18.2% $205,510
Valve without CABG 144 3.5% 0.0% - 3.5% 12.6% 6.8% - 18.4% $198,926
Valve with CABG 81 3.7% 0.0% - 7.4% 10.7% 5.4% - 23.2% $228,149
Albert Einstein
CABG without Valve 263 2.3% 0.4% - 3.4% 19.1% 8.1% - 17.3% $227,872
Total Valve 120 2.5% 0.8% - 5.8% 18.2% 9.1% - 23.4% $272,795
Valve without CABG 94 1.1% 0.0% - 5.3% 17.7% 6.5% - 22.6% $264,643
Valve with CABG 26 NR NR NR NR NR NR $296,611
Allegheny General
CABG without Valve 448 1.3% 0.2% - 2.0% 13.0% 6.1% - 12.6% $107,556
Total Valve 560 3.2% 1.8% - 4.1% 15.1% 9.8% - 16.9% $128,994
Valve without CABG 397 3.3% 0.8% - 3.3% 15.6% 8.7% - 17.0% $119,464
Valve with CABG 163 3.1% 2.5% - 8.0% 14.0% 8.4% - 20.6% $144,124

Hospital Results
Rate was significantly lower than expected.
Rate was not significantly different than expected.
Rate was significantly higher than expected.
NR: Not reported. Too few cases after exclusions.
PHC4 • Cardiac Surgery Report • Jan 2014 – Mar 2016 Data
Hospital Results • 3
In-Hospital Mortality 30-Day Readmission Average Hospital Charge
Hospital
Total Number of Cases
Actual Percent
Expected Range Rating
Actual Percent
Expected Range Rating
Aria Health
CABG without Valve 265 1.5% 0.4% - 2.6% 14.9% 6.1% - 14.4% $93,640
Total Valve 58 6.9% 0.0% - 8.6% 34.3% 5.7% - 25.7% $143,629
Valve without CABG 38 5.3% 0.0% - 5.3% NR NR NR $128,738
Valve with CABG 20 NR NR NR NR NR NR $183,426
Brandywine
CABG without Valve 109 0.9% 0.0% - 3.7% 14.1% 3.8% - 16.7% $367,746
Total Valve 45 0.0% 0.0% - 4.4% 14.0% 4.7% - 23.3% $419,444
Valve without CABG 32 0.0% 0.0% - 3.1% 9.4% 3.1% - 25.0% $408,057
Valve with CABG 13 NR NR NR NR NR NR NR
Butler Memorial
CABG without Valve 421 0.7% 0.2% - 2.1% 7.1% 6.4% - 12.8% $99,667
Total Valve 259 3.1% 0.8% - 3.9% 12.0% 8.2% - 16.9% $115,485
Valve without CABG 145 2.8% 0.0% - 2.8% 11.3% 6.6% - 17.9% $104,690
Valve with CABG 114 3.5% 0.9% - 6.1% 13.0% 6.5% - 19.5% $132,387
Chester County
CABG without Valve 182 1.6% 0.0% - 2.7% 9.2% 4.2% - 14.3% $120,156
Total Valve 93 2.2% 0.0% - 5.4% 21.8% 7.3% - 23.6% $151,311
Valve without CABG 59 1.7% 0.0% - 3.4% 25.0% 3.1% - 21.9% $146,712
Valve with CABG 34 2.9% 0.0% - 11.8% NR NR NR $166,638
Conemaugh Memorial
CABG without Valve 288 2.4% 0.3% - 2.8% 8.4% 6.2% - 13.3% $75,858
Total Valve 157 5.7% 0.6% - 4.5% 14.5% 7.3% - 18.5% $99,367
Valve without CABG 81 6.2% 0.0% - 3.7% 14.1% 4.7% - 18.8% $93,464
Valve with CABG 76 5.3% 0.0% - 6.6% 15.0% 5.0% - 21.7% $107,723
This health system submitted comments available at www.phc4.org.

Hospital Results
Rate was significantly lower than expected.
Rate was not significantly different than expected.
Rate was significantly higher than expected.
NR: Not reported. Too few cases after exclusions.
PHC4 • Cardiac Surgery Report • Jan 2014 – Mar 2016 Data
Hospital Results • 4
In-Hospital Mortality 30-Day Readmission Average Hospital Charge
Hospital
Total Number of Cases
Actual Percent
Expected Range Rating
Actual Percent
Expected Range Rating
Crozer Chester
CABG without Valve 166 0.6% 0.0% - 3.0% 11.3% 4.8% - 14.5% $321,149
Total Valve 93 5.4% 1.1% - 7.5% 15.1% 5.7% - 22.6% $363,168
Valve without CABG 56 3.6% 0.0% - 3.6% 20.6% 2.9% - 23.5% $344,621
Valve with CABG 37 8.1% 2.7% - 16.2% NR NR NR $414,823
Doylestown
CABG without Valve 190 0.0% 0.0% - 2.1% 5.9% 3.7% - 11.8% $119,373
Total Valve 211 0.0% 0.5% - 3.8% 17.4% 7.2% - 16.2% $140,593
Valve without CABG 134 0.0% 0.0% - 3.7% 18.3% 5.5% - 16.5% $131,183
Valve with CABG 77 0.0% 0.0% - 5.2% 15.5% 5.2% - 19.0% $164,051
Easton
CABG without Valve 128 2.3% 0.0% - 3.9% 16.7% 4.2% - 18.1% $447,677
Total Valve 65 1.5% 0.0% - 4.6% 13.2% 5.3% - 26.3% $506,241
Valve without CABG 37 2.7% 0.0% - 5.4% NR NR NR $482,775
Valve with CABG 28 NR NR NR NR NR NR $581,113
Einstein Montgomery
CABG without Valve 190 2.1% 0.0% - 3.2% 8.3% 5.6% - 15.7% $191,320
Total Valve 195 2.6% 0.5% - 3.6% 16.2% 8.1% - 19.8% $232,919
Valve without CABG 173 1.7% 0.0% - 3.5% 15.5% 8.2% - 20.6% $219,975
Valve with CABG 22 NR NR NR NR NR NR $255,463
Excela Hlth Westmoreland
CABG without Valve 267 1.1% 0.0% - 2.2% 8.0% 5.3% - 13.4% $67,786
Total Valve 109 2.8% 0.0% - 3.7% 14.8% 6.2% - 19.8% $77,265
Valve without CABG 62 0.0% 0.0% - 3.2% 17.4% 4.3% - 21.7% $70,414
Valve with CABG 47 6.4% 0.0% - 6.4% 11.4% 2.9% - 22.9% $88,225

Hospital Results
Rate was significantly lower than expected.
Rate was not significantly different than expected.
Rate was significantly higher than expected.
NR: Not reported. Too few cases after exclusions.
PHC4 • Cardiac Surgery Report • Jan 2014 – Mar 2016 Data
Hospital Results • 5
In-Hospital Mortality 30-Day Readmission Average Hospital Charge
Hospital
Total Number of Cases
Actual Percent
Expected Range Rating
Actual Percent
Expected Range Rating
Forbes
CABG without Valve 228 2.2% 0.4% - 3.1% 13.4% 5.5% - 14.0% $94,687
Total Valve 226 1.8% 0.9% - 4.4% 18.9% 9.4% - 19.5% $111,505
Valve without CABG 149 0.0% 0.0% - 3.4% 17.3% 7.3% - 19.1% $102,436
Valve with CABG 77 5.2% 0.0% - 7.8% 22.4% 8.2% - 26.5% $126,468
Geisinger Community
CABG without Valve 212 1.9% 0.0% - 2.8% 5.1% 5.8% - 14.7% $164,117
Total Valve 107 3.7% 0.9% - 5.6% 9.0% 6.4% - 20.5% $232,114
Valve without CABG 47 4.3% 0.0% - 4.3% 5.7% 2.9% - 20.0% $214,452
Valve with CABG 60 3.3% 1.7% - 8.3% 11.6% 7.0% - 25.6% $260,175
Geisinger Danville
CABG without Valve 364 1.4% 0.3% - 2.5% 6.3% 6.3% - 12.9% $210,715
Total Valve 424 3.1% 1.4% - 4.0% 10.9% 9.0% - 15.7% $252,733
Valve without CABG 278 1.4% 0.4% - 2.9% 10.4% 8.0% - 16.0% $228,847
Valve with CABG 146 6.2% 2.1% - 7.5% 12.0% 7.0% - 19.0% $298,215
Geisinger Wyoming Valley
CABG without Valve 216 2.3% 0.9% - 4.6% 10.1% 6.0% - 14.8% $235,242
Total Valve 173 4.0% 2.3% - 6.9% 10.0% 7.7% - 19.2% $273,887
Valve without CABG 102 2.0% 1.0% - 4.9% 7.6% 7.6% - 21.5% $251,041
Valve with CABG 71 7.0% 2.8% - 11.3% 13.7% 3.9% - 19.6% $306,404
Good Samaritan Lebanon
CABG without Valve 189 0.5% 0.0% - 2.6% 2.6% 4.5% - 12.9% $96,629
Total Valve 79 1.3% 0.0% - 3.8% 16.1% 4.8% - 19.4% $116,347
Valve without CABG 40 2.5% 0.0% - 2.5% NR NR NR $104,759
Valve with CABG 39 0.0% 0.0% - 5.1% 12.1% 3.0% - 21.2% $135,175

Hospital Results
Rate was significantly lower than expected.
Rate was not significantly different than expected.
Rate was significantly higher than expected.
NR: Not reported. Too few cases after exclusions.
PHC4 • Cardiac Surgery Report • Jan 2014 – Mar 2016 Data
Hospital Results • 6
In-Hospital Mortality 30-Day Readmission Average Hospital Charge
Hospital
Total Number of Cases
Actual Percent
Expected Range Rating
Actual Percent
Expected Range Rating
Hahnemann University
CABG without Valve 76 0.0% 0.0% - 5.3% 20.5% 2.3% - 18.2% $437,298
Total Valve 40 2.5% 0.0% - 7.5% NR NR NR $500,831
Valve without CABG 29 NR NR NR NR NR NR $462,051
Valve with CABG 11 NR NR NR NR NR NR NR
Heritage Valley Beaver
CABG without Valve 286 2.4% 0.3% - 2.4% 8.9% 5.3% - 12.6% $59,100
Total Valve 166 3.6% 0.6% - 4.2% 9.5% 6.7% - 18.1% $68,958
Valve without CABG 103 1.0% 0.0% - 2.9% 8.1% 4.8% - 19.4% $65,013
Valve with CABG 63 7.9% 0.0% - 6.3% 11.6% 4.7% - 20.9% $75,446
Holy Spirit
CABG without Valve 227 2.2% 0.0% - 2.6% 8.2% 5.7% - 13.9% $123,545
Total Valve 80 7.5% 0.0% - 5.0% 12.8% 2.6% - 20.5% $149,829
Valve without CABG 45 8.9% 0.0% - 4.4% NR NR NR $136,300
Valve with CABG 35 5.7% 0.0% - 8.6% NR NR NR $173,423
Hospital University PA
CABG without Valve 345 4.3% 1.2% - 4.1% 15.3% 6.1% - 14.7% $306,724
Total Valve 981 2.7% 2.0% - 4.0% 12.2% 10.3% - 16.1% $337,415
Valve without CABG 773 1.6% 1.3% - 3.2% 12.1% 9.7% - 16.1% $310,760
Valve with CABG 208 6.7% 2.9% - 8.2% 12.5% 7.7% - 20.2% $428,634
Jeanes
CABG without Valve 116 0.9% 0.0% - 3.4% 12.5% 6.3% - 18.8% $316,079
Total Valve 88 0.0% 0.0% - 5.7% 15.4% 7.7% - 23.1% $321,668
Valve without CABG 68 0.0% 0.0% - 4.4% 16.7% 6.3% - 25.0% $300,214
Valve with CABG 20 NR NR NR NR NR NR $391,590
This health system submitted comments available at www.phc4.org.

Hospital Results
Rate was significantly lower than expected.
Rate was not significantly different than expected.
Rate was significantly higher than expected.
NR: Not reported. Too few cases after exclusions.
PHC4 • Cardiac Surgery Report • Jan 2014 – Mar 2016 Data
Hospital Results • 7
In-Hospital Mortality 30-Day Readmission Average Hospital Charge
Hospital
Total Number of Cases
Actual Percent
Expected Range Rating
Actual Percent
Expected Range Rating
Jefferson
CABG without Valve 443 1.1% 0.7% - 2.7% 8.6% 7.7% - 14.2% $78,349
Total Valve 268 2.2% 1.9% - 6.0% 13.9% 11.9% - 21.9% $97,135
Valve without CABG 126 1.6% 0.0% - 4.0% 11.7% 8.5% - 22.3% $87,675
Valve with CABG 142 2.8% 2.8% - 9.2% 15.9% 11.2% - 24.3% $111,147
Lancaster General
CABG without Valve 614 2.4% 0.5% - 2.1% 11.1% 7.5% - 13.0% $105,337
Total Valve 468 3.4% 1.1% - 3.6% 13.8% 10.4% - 17.1% $117,488
Valve without CABG 258 2.7% 0.4% - 2.7% 11.9% 8.8% - 17.6% $109,561
Valve with CABG 210 4.3% 1.4% - 5.7% 16.0% 9.8% - 19.6% $132,610
Lancaster Regional
CABG without Valve 83 2.4% 0.0% - 2.4% 8.3% 3.3% - 15.0% $214,961
Total Valve 29 NR NR NR NR NR NR $257,295
Valve without CABG 14 NR NR NR NR NR NR NR
Valve with CABG 15 NR NR NR NR NR NR NR
Lehigh Valley Allentown
CABG without Valve 681 1.2% 0.7% - 2.3% 13.6% 7.7% - 13.0% $184,478
Total Valve 518 1.4% 1.2% - 3.3% 13.9% 10.0% - 16.6% $235,270
Valve without CABG 382 0.8% 0.5% - 2.6% 14.9% 9.0% - 16.3% $216,106
Valve with CABG 136 2.9% 1.5% - 6.6% 10.9% 8.7% - 21.7% $276,337
Lehigh Valley Muhlenberg
CABG without Valve 112 0.0% 0.0% - 2.7% 5.3% 3.9% - 14.5% $198,931
Total Valve 82 1.2% 0.0% - 3.7% 8.8% 5.3% - 19.3% $232,826
Valve without CABG 53 0.0% 0.0% - 3.8% 14.7% 2.9% - 20.6% $220,725
Valve with CABG 29 NR NR NR NR NR NR $263,973
This health system submitted comments available at www.phc4.org.

Hospital Results
Rate was significantly lower than expected.
Rate was not significantly different than expected.
Rate was significantly higher than expected.
NR: Not reported. Too few cases after exclusions.
PHC4 • Cardiac Surgery Report • Jan 2014 – Mar 2016 Data
Hospital Results • 8
In-Hospital Mortality 30-Day Readmission Average Hospital Charge
Hospital
Total Number of Cases
Actual Percent
Expected Range Rating
Actual Percent
Expected Range Rating
Main Line Bryn Mawr
CABG without Valve 35 0.0% 0.0% - 2.9% 8.8% 0.0% - 17.6% $199,537
Total Valve 19 NR NR NR NR NR NR $257,871
Valve without CABG 13 NR NR NR NR NR NR $262,953
Valve with CABG 6 NR NR NR NR NR NR NR
Main Line Lankenau
CABG without Valve 676 0.6% 0.6% - 2.2% 10.4% 7.7% - 13.1% $176,431
Total Valve 483 1.7% 1.0% - 3.5% 12.6% 9.7% - 17.2% $244,748
Valve without CABG 379 1.3% 0.5% - 2.9% 11.5% 8.9% - 17.0% $225,490
Valve with CABG 104 2.9% 1.0% - 7.7% 16.2% 8.1% - 21.6% $298,539
Main Line Paoli
CABG without Valve 87 0.0% 0.0% - 3.4% 8.6% 1.7% - 15.5% $199,744
Total Valve 39 2.6% 0.0% - 5.1% NR NR NR $227,747
Valve without CABG 30 0.0% 0.0% - 3.3% NR NR NR $207,735
Valve with CABG 9 NR NR NR NR NR NR NR
Mercy Fitzgerald
CABG without Valve 59 1.7% 0.0% - 3.4% 18.9% 2.7% - 21.6% $274,074
Total Valve 44 2.3% 0.0% - 6.8% 12.9% 6.5% - 29.0% $340,944
Valve without CABG 34 2.9% 0.0% - 5.9% NR NR NR $314,654
Valve with CABG 10 NR NR NR NR NR NR NR
Milton S Hershey
CABG without Valve 390 1.3% 0.5% - 2.6% 13.8% 6.2% - 12.7% $126,482
Total Valve 350 1.4% 1.1% - 4.0% 15.8% 9.3% - 17.0% $145,273
Valve without CABG 252 1.6% 0.8% - 3.6% 15.7% 9.0% - 18.0% $134,249
Valve with CABG 98 1.0% 1.0% - 7.1% 15.9% 5.8% - 18.8% $166,174
Hospital Results
Rate was significantly lower than expected.
Rate was not significantly different than expected.
Rate was significantly higher than expected.
NR: Not reported. Too few cases after exclusions.
PHC4 • Cardiac Surgery Report • Jan 2014 – Mar 2016 Data
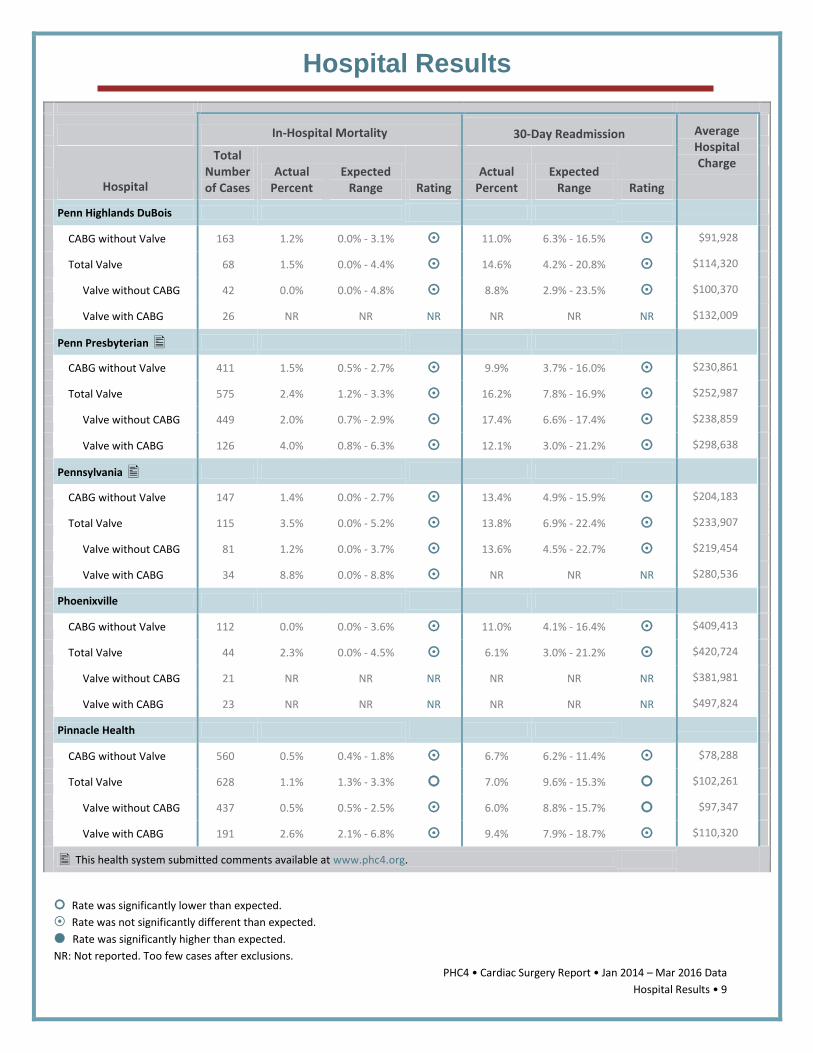
Hospital Results • 9
In-Hospital Mortality 30-Day Readmission Average Hospital Charge
Hospital
Total Number of Cases
Actual Percent
Expected Range Rating
Actual Percent
Expected Range Rating
Penn Highlands DuBois
CABG without Valve 163 1.2% 0.0% - 3.1% 11.0% 6.3% - 16.5% $91,928
Total Valve 68 1.5% 0.0% - 4.4% 14.6% 4.2% - 20.8% $114,320
Valve without CABG 42 0.0% 0.0% - 4.8% 8.8% 2.9% - 23.5% $100,370
Valve with CABG 26 NR NR NR NR NR NR $132,009
Penn Presbyterian
CABG without Valve 411 1.5% 0.5% - 2.7% 9.9% 3.7% - 16.0% $230,861
Total Valve 575 2.4% 1.2% - 3.3% 16.2% 7.8% - 16.9% $252,987
Valve without CABG 449 2.0% 0.7% - 2.9% 17.4% 6.6% - 17.4% $238,859
Valve with CABG 126 4.0% 0.8% - 6.3% 12.1% 3.0% - 21.2% $298,638
Pennsylvania
CABG without Valve 147 1.4% 0.0% - 2.7% 13.4% 4.9% - 15.9% $204,183
Total Valve 115 3.5% 0.0% - 5.2% 13.8% 6.9% - 22.4% $233,907
Valve without CABG 81 1.2% 0.0% - 3.7% 13.6% 4.5% - 22.7% $219,454
Valve with CABG 34 8.8% 0.0% - 8.8% NR NR NR $280,536
Phoenixville
CABG without Valve 112 0.0% 0.0% - 3.6% 11.0% 4.1% - 16.4% $409,413
Total Valve 44 2.3% 0.0% - 4.5% 6.1% 3.0% - 21.2% $420,724
Valve without CABG 21 NR NR NR NR NR NR $381,981
Valve with CABG 23 NR NR NR NR NR NR $497,824
Pinnacle Health
CABG without Valve 560 0.5% 0.4% - 1.8% 6.7% 6.2% - 11.4% $78,288
Total Valve 628 1.1% 1.3% - 3.3% 7.0% 9.6% - 15.3% $102,261
Valve without CABG 437 0.5% 0.5% - 2.5% 6.0% 8.8% - 15.7% $97,347
Valve with CABG 191 2.6% 2.1% - 6.8% 9.4% 7.9% - 18.7% $110,320
This health system submitted comments available at www.phc4.org.

Hospital Results
Rate was significantly lower than expected.
Rate was not significantly different than expected.
Rate was significantly higher than expected.
NR: Not reported. Too few cases after exclusions.
PHC4 • Cardiac Surgery Report • Jan 2014 – Mar 2016 Data
Hospital Results • 10
In-Hospital Mortality 30-Day Readmission Average Hospital Charge
Hospital
Total Number of Cases
Actual Percent
Expected Range Rating
Actual Percent
Expected Range Rating
Pocono
CABG without Valve 265 0.4% 0.0% - 1.9% 6.3% 5.2% - 13.2% $92,671
Total Valve 105 3.8% 0.0% - 4.8% 17.9% 6.0% - 19.4% $116,807
Valve without CABG 56 0.0% 0.0% - 3.6% 14.6% 2.4% - 22.0% $107,895
Valve with CABG 49 8.2% 0.0% - 8.2% NR NR NR $130,142
Reading
CABG without Valve 354 0.6% 0.3% - 2.3% 9.6% 6.8% - 13.6% $121,274
Total Valve 137 2.9% 0.0% - 3.6% 10.4% 7.5% - 18.9% $139,056
Valve without CABG 92 3.3% 0.0% - 2.2% 12.3% 5.5% - 19.2% $136,677
Valve with CABG 45 2.2% 0.0% - 6.7% 6.1% 6.1% - 27.3% $146,344
Regional Scranton
CABG without Valve 173 4.0% 0.0% - 2.9% 10.3% 5.1% - 14.5% $168,473
Total Valve 238 1.3% 0.8% - 3.8% 14.8% 9.1% - 18.8% $213,115
Valve without CABG 161 0.6% 0.0% - 3.1% 15.4% 8.5% - 19.7% $196,539
Valve with CABG 77 2.6% 0.0% - 7.8% 13.6% 6.8% - 22.0% $233,745
Robert Packer
CABG without Valve 201 0.5% 0.0% - 2.5% 8.1% 5.4% - 17.6% $102,041
Total Valve 194 2.6% 0.5% - 3.6% 12.3% 7.7% - 23.1% $125,688
Valve without CABG 125 2.4% 0.0% - 3.2% 7.5% 5.0% - 22.5% $113,507
Valve with CABG 69 2.9% 0.0% - 7.2% NR NR NR $143,002
Saint Vincent
CABG without Valve 361 1.1% 0.3% - 2.5% 7.2% 6.3% - 13.6% $163,187
Total Valve 181 2.2% 0.6% - 3.9% 9.7% 7.3% - 18.5% $200,290
Valve without CABG 86 0.0% 0.0% - 2.3% 10.3% 5.2% - 19.0% $182,055
Valve with CABG 95 4.2% 0.0% - 5.3% 9.1% 6.1% - 21.2% $226,833

Hospital Results
Rate was significantly lower than expected.
Rate was not significantly different than expected.
Rate was significantly higher than expected.
NR: Not reported. Too few cases after exclusions.
PHC4 • Cardiac Surgery Report • Jan 2014 – Mar 2016 Data
Hospital Results • 11
In-Hospital Mortality 30-Day Readmission Average Hospital Charge
Hospital
Total Number of Cases
Actual Percent
Expected Range Rating
Actual Percent
Expected Range Rating
Sharon Regional
CABG without Valve 46 0.0% 0.0% - 2.2% 19.4% 0.0% - 16.1% $131,378
Total Valve 15 NR NR NR NR NR NR $136,258
Valve without CABG 11 NR NR NR NR NR NR $125,229
Valve with CABG 4 NR NR NR NR NR NR NR
St Clair Memorial
CABG without Valve 195 0.0% 0.0% - 2.6% 5.6% 4.9% - 14.1% $85,604
Total Valve 105 1.9% 0.0% - 3.8% 15.1% 6.8% - 20.5% $106,866
Valve without CABG 76 0.0% 0.0% - 3.9% 17.3% 5.8% - 21.2% $102,964
Valve with CABG 29 NR NR NR NR NR NR $108,180
St Joseph Reading
CABG without Valve 133 2.3% 0.0% - 3.8% 12.0% 6.0% - 18.0% $127,050
Total Valve 126 4.0% 0.8% - 6.3% 16.0% 8.5% - 22.3% $135,139
Valve without CABG 91 3.3% 0.0% - 4.4% 13.2% 7.4% - 22.1% $123,959
Valve with CABG 35 5.7% 0.0% - 14.3% NR NR NR $159,307
St Luke's Bethlehem
CABG without Valve 372 0.3% 0.3% - 2.4% 6.9% 6.5% - 13.4% $255,683
Total Valve 279 1.4% 0.7% - 3.6% 9.8% 9.3% - 18.0% $300,483
Valve without CABG 168 1.2% 0.0% - 2.4% 6.9% 6.9% - 18.1% $281,347
Valve with CABG 111 1.8% 0.9% - 6.3% 14.1% 7.7% - 21.8% $348,414
St Mary MC
CABG without Valve 306 2.0% 0.0% - 2.3% 6.4% 6.4% - 14.4% $149,236
Total Valve 181 1.7% 0.6% - 4.4% 14.0% 7.0% - 19.0% $200,122
Valve without CABG 125 0.8% 0.0% - 3.2% 11.3% 5.6% - 19.7% $183,753
Valve with CABG 56 3.6% 0.0% - 8.9% NR NR NR $240,557
Hospital Results
Rate was significantly lower than expected.
Rate was not significantly different than expected.
Rate was significantly higher than expected.
NR: Not reported. Too few cases after exclusions.
PHC4 • Cardiac Surgery Report • Jan 2014 – Mar 2016 Data
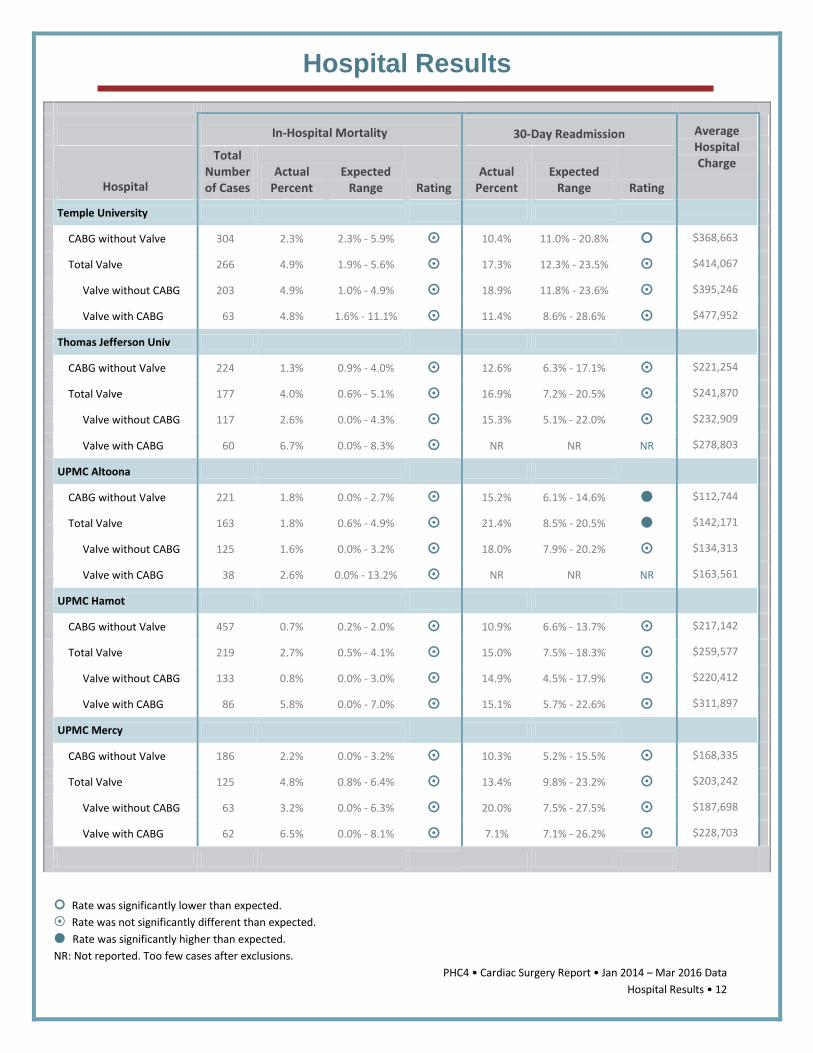
Hospital Results • 12
In-Hospital Mortality 30-Day Readmission Average Hospital Charge
Hospital
Total Number of Cases
Actual Percent
Expected Range Rating
Actual Percent
Expected Range Rating
Temple University
CABG without Valve 304 2.3% 2.3% - 5.9% 10.4% 11.0% - 20.8% $368,663
Total Valve 266 4.9% 1.9% - 5.6% 17.3% 12.3% - 23.5% $414,067
Valve without CABG 203 4.9% 1.0% - 4.9% 18.9% 11.8% - 23.6% $395,246
Valve with CABG 63 4.8% 1.6% - 11.1% 11.4% 8.6% - 28.6% $477,952
Thomas Jefferson Univ
CABG without Valve 224 1.3% 0.9% - 4.0% 12.6% 6.3% - 17.1% $221,254
Total Valve 177 4.0% 0.6% - 5.1% 16.9% 7.2% - 20.5% $241,870
Valve without CABG 117 2.6% 0.0% - 4.3% 15.3% 5.1% - 22.0% $232,909
Valve with CABG 60 6.7% 0.0% - 8.3% NR NR NR $278,803
UPMC Altoona
CABG without Valve 221 1.8% 0.0% - 2.7% 15.2% 6.1% - 14.6% $112,744
Total Valve 163 1.8% 0.6% - 4.9% 21.4% 8.5% - 20.5% $142,171
Valve without CABG 125 1.6% 0.0% - 3.2% 18.0% 7.9% - 20.2% $134,313
Valve with CABG 38 2.6% 0.0% - 13.2% NR NR NR $163,561
UPMC Hamot
CABG without Valve 457 0.7% 0.2% - 2.0% 10.9% 6.6% - 13.7% $217,142
Total Valve 219 2.7% 0.5% - 4.1% 15.0% 7.5% - 18.3% $259,577
Valve without CABG 133 0.8% 0.0% - 3.0% 14.9% 4.5% - 17.9% $220,412
Valve with CABG 86 5.8% 0.0% - 7.0% 15.1% 5.7% - 22.6% $311,897
UPMC Mercy
CABG without Valve 186 2.2% 0.0% - 3.2% 10.3% 5.2% - 15.5% $168,335
Total Valve 125 4.8% 0.8% - 6.4% 13.4% 9.8% - 23.2% $203,242
Valve without CABG 63 3.2% 0.0% - 6.3% 20.0% 7.5% - 27.5% $187,698
Valve with CABG 62 6.5% 0.0% - 8.1% 7.1% 7.1% - 26.2% $228,703

Hospital Results
Rate was significantly lower than expected.
Rate was not significantly different than expected.
Rate was significantly higher than expected.
NR: Not reported. Too few cases after exclusions.
PHC4 • Cardiac Surgery Report • Jan 2014 – Mar 2016 Data
Hospital Results • 13
In-Hospital Mortality 30-Day Readmission Average Hospital Charge
Hospital
Total Number of Cases
Actual Percent
Expected Range Rating
Actual Percent
Expected Range Rating
UPMC Passavant
CABG without Valve 325 1.2% 0.6% - 2.8% 11.1% 6.0% - 12.8% $150,496
Total Valve 212 0.0% 0.9% - 4.7% 13.7% 8.2% - 18.5% $169,838
Valve without CABG 125 0.0% 0.0% - 3.2% 12.2% 5.6% - 17.8% $156,556
Valve with CABG 87 0.0% 1.1% - 8.0% 16.1% 7.1% - 23.2% $191,464
UPMC Presby Shadyside
CABG without Valve 974 2.5% 1.0% - 2.5% 10.2% 8.7% - 13.3% $312,397
Total Valve 1,249 3.8% 2.5% - 4.3% 14.0% 12.7% - 17.3% $401,863
Valve without CABG 786 2.3% 1.3% - 3.2% 13.3% 11.9% - 17.4% $364,244
Valve with CABG 463 6.5% 3.5% - 7.1% 15.3% 12.0% - 19.8% $463,910
Washington
CABG without Valve 167 0.0% 0.0% - 2.4% 11.2% 4.7% - 15.0% $75,058
Total Valve 71 1.4% 0.0% - 4.2% 11.3% 3.8% - 18.9% $106,240
Valve without CABG 42 2.4% 0.0% - 4.8% 12.9% 3.2% - 22.6% $99,739
Valve with CABG 29 NR NR NR NR NR NR $117,202
West Penn
CABG without Valve 198 2.5% 0.0% - 3.0% 13.3% 5.2% - 14.8% $154,102
Total Valve 52 3.8% 0.0% - 5.8% 18.8% 3.1% - 25.0% $170,828
Valve without CABG 25 NR NR NR NR NR NR $153,469
Valve with CABG 27 NR NR NR NR NR NR $196,780
Wilkes-Barre General
CABG without Valve 299 1.3% 0.0% - 1.7% 9.9% 5.6% - 12.9% $185,909
Total Valve 62 4.8% 0.0% - 6.5% 25.5% 4.3% - 21.3% $262,674
Valve without CABG 20 NR NR NR NR NR NR $251,909
Valve with CABG 42 7.1% 0.0% - 7.1% 29.0% 3.2% - 22.6% $292,607

Hospital Results
Rate was significantly lower than expected.
Rate was not significantly different than expected.
Rate was significantly higher than expected.
NR: Not reported. Too few cases after exclusions.
PHC4 • Cardiac Surgery Report • Jan 2014 – Mar 2016 Data
Hospital Results • 14
In-Hospital Mortality 30-Day Readmission Average Hospital Charge
Hospital
Total Number of Cases
Actual Percent
Expected Range Rating
Actual Percent
Expected Range Rating
Williamsport Regional
CABG without Valve 328 0.9% 0.3% - 2.1% 10.6% 6.6% - 14.1% $125,898
Total Valve 180 3.3% 0.0% - 3.3% 15.4% 7.7% - 18.8% $179,872
Valve without CABG 111 1.8% 0.0% - 2.7% 14.8% 6.2% - 18.5% $160,234
Valve with CABG 69 5.8% 0.0% - 5.8% 16.7% 5.6% - 25.0% $216,799
York
CABG without Valve 573 4.0% 0.9% - 2.8% 10.6% 8.2% - 14.0% $99,545
Total Valve 316 2.2% 0.6% - 3.2% 15.2% 8.8% - 17.1% $115,716
Valve without CABG 220 1.8% 0.0% - 2.3% 14.6% 7.9% - 17.2% $107,336
Valve with CABG 96 3.1% 0.0% - 6.3% 16.7% 6.1% - 21.2% $131,350