Hospital Response to Changes in Medicaid … of Pennsylvania ScholarlyCommons Publicly Accessible...
133
University of Pennsylvania ScholarlyCommons Publicly Accessible Penn Dissertations 1-1-2016 Hospital Response to Changes in Medicaid Reimbursement Preethi Rao University of Pennsylvania, [email protected] Follow this and additional works at: hp://repository.upenn.edu/edissertations Part of the Economics Commons , and the Health and Medical Administration Commons is paper is posted at ScholarlyCommons. hp://repository.upenn.edu/edissertations/1964 For more information, please contact [email protected]. Recommended Citation Rao, Preethi, "Hospital Response to Changes in Medicaid Reimbursement" (2016). Publicly Accessible Penn Dissertations. 1964. hp://repository.upenn.edu/edissertations/1964
-
Upload
phunghuong -
Category
Documents
-
view
216 -
download
0
Transcript of Hospital Response to Changes in Medicaid … of Pennsylvania ScholarlyCommons Publicly Accessible...

University of PennsylvaniaScholarlyCommons
Publicly Accessible Penn Dissertations
1-1-2016
Hospital Response to Changes in MedicaidReimbursementPreethi RaoUniversity of Pennsylvania, [email protected]
Follow this and additional works at: http://repository.upenn.edu/edissertations
Part of the Economics Commons, and the Health and Medical Administration Commons
This paper is posted at ScholarlyCommons. http://repository.upenn.edu/edissertations/1964For more information, please contact [email protected].
Recommended CitationRao, Preethi, "Hospital Response to Changes in Medicaid Reimbursement" (2016). Publicly Accessible Penn Dissertations. 1964.http://repository.upenn.edu/edissertations/1964

Hospital Response to Changes in Medicaid Reimbursement
AbstractChanges to reimbursement levels and reimbursement methodology have become increasingly common aspublic health insurance programs seek to slow the rate of cost growth. Despite the fact that Medicaid is amajor public health insurance program, little is known about how hospitals respond to price cuts by Medicaid.On the other hand, existing research on hospital response to a commonly used payment method (prospectivepayment) by Medicaid is largely based on policy changes from the 1980s. In this dissertation, I study 1) howhospitals in California responded to a 10% payment reduction by Medicaid in 2008, and 2) how hospitals inCalifornia responded to the 2013 introduction of a prospective payment system by Medicaid. For bothanalyses, I make use of hospital and emergency department discharge records from the California Office ofStatewide Health Planning and Development, and study outcomes related to access to hospital care andintensity of care. I find little response to the 10% payment cut along these margins; suggesting that hospitalsmay have responded along other margins. In the analysis of hospital response to prospective payment, I findresults consistent with theoretical predictions as well as the existing literature. Hospitals responded toprospective payment by reducing average inpatient length of stay. Furthermore, this response was drivenprimarily by hospitals with the strongest incentives---those previously paid on a per diem basis. These resultssuggest that hospitals may not respond strongly to across-the-board payment cuts in the way that they treatpatients. On the other hand, hospitals had a strong, immediate, and predictable response to a change in thepayment methodology, suggesting that perhaps this is a more effective policy tool.
Degree TypeDissertation
Degree NameDoctor of Philosophy (PhD)
Graduate GroupHealth Care Management & Economics
First AdvisorMark Pauly
KeywordsHealth policy, Hospital, Medicaid, Reimbursement
Subject CategoriesEconomics | Health and Medical Administration
This dissertation is available at ScholarlyCommons: http://repository.upenn.edu/edissertations/1964

HOSPITAL RESPONSE TO CHANGES IN MEDICAID REIMBURSEMENT
Preethi M. Rao
A DISSERTATION
in
Health Care Management and Economics
For the Graduate Group in Managerial Science and Applied Economics
Presented to the Faculties of the University of Pennsylvania
in
Partial Ful�llment of the Requirements for the
Degree of Doctor of Philosophy
2016
Supervisor of Dissertation
Mark Pauly, Professor of Health Care Management
Graduate Group Chairperson
Eric Bradlow, Professor of Marketing
Dissertation Committee
Daniel Polsky, Professor of Medicine and Health Care ManagementScott Harrington, Professor of Health Care ManagementJonathan Kolstad, Assistant Professor of Economic Analysis and Policy, University
of California at Berkeley

HOSPITAL RESPONSE TO CHANGES IN MEDICAID REIMBURSEMENT
c© COPYRIGHT
2016
Preethi Mahadeva Rao

Dedicated to my parents.
To my dad for inspiring me to get a PhD, and to my mom for never letting me quit.
iii

ACKNOWLEDGEMENTS
First and foremost, I want to thank my dissertation committee, Mark Pauly, Dan
Polsky, Scott Harrington, and Jon Kolstad for all of their help, advice, and mentorship
over the years. Their guidance has helped to shape this project, and more importantly,
has helped to shape me as a researcher. I also want to thank Guy David for all of
the pep talks and encouragement, particularly during the job market process. I also
appreciate the conversations and feedback I have received from a number of other
faculty members in the department. In addition, I owe a debt of gratitude to Jesse
Hsu, who spent many hours helping me code in R.
I never could have made it through the past �ve years without the friendship and
emotional support of several of my classmates and closest friends. Jess, Sunita, Ana,
Ellie, Nora, Alix, Kaitlin, Cinthia, Shulamite, and many others have �lled these crazy
and stressful �ve years with fun and friendship. I entered the program expecting to
learn a lot about health economics, but never expecting to �nd such a wonderful and
tight-knit group of friends. I count myself extremely lucky to have done both. Thank
you also to Ellie and Adam for being best job market team I could have asked for.
Go team HCMG!
Last, but certainly not least, I owe a huge thank you to my family. My parents have
supported me and encouraged me since day one, and have always been con�dent in
my success, even (or especially) when I have not been. Thanks to Pooja for not
letting me take myself too seriously, and thanks to my nephew Ethan, whose smile,
laughter, and hugs instantly brighten my day. Finally, I want to thank my soon-to-be
husband, Kevin. He has listened patiently as I've complained, comforted me when I
was sure I was going to fail, and given me his shoulder when I needed a good cry. He
iv

has shared in my successes and cheered me on every step of the way. I am so grateful
for his love and support over the past several years.
I gratefully acknowledge funding from the following sources: the Agency for Health-
care Research and Quality, the Leonard Davis Institute of Health Economics, and the
Wharton Risk Management and Decision Processes Center. This research does not
represent the o�cial views of any of these funding agencies.
v

ABSTRACT
HOSPITAL RESPONSE TO CHANGES IN MEDICAID REIMBURSEMENT
Preethi M. Rao
Mark Pauly
Changes to reimbursement levels and reimbursement methodology have become in-
creasingly common as public health insurance programs seek to slow the rate of cost
growth. Despite the fact that Medicaid is a major public health insurance program,
little is known about how hospitals respond to price cuts by Medicaid. On the other
hand, existing research on hospital response to a commonly used payment method
(prospective payment) by Medicaid is largely based on policy changes from the 1980s.
In this dissertation, I study 1) how hospitals in California responded to a 10% pay-
ment reduction by Medicaid in 2008, and 2) how hospitals in California responded
to the 2013 introduction of a prospective payment system by Medicaid. For both
analyses, I make use of hospital and emergency department discharge records from
the California O�ce of Statewide Health Planning and Development, and study out-
comes related to access to hospital care and intensity of care. I �nd little response
to the 10% payment cut along these margins; suggesting that hospitals may have
responded along other margins. In the analysis of hospital response to prospective
payment, I �nd results consistent with theoretical predictions as well as the existing
literature. Hospitals responded to prospective payment by reducing average inpatient
length of stay. Furthermore, this response was driven primarily by hospitals with the
strongest incentives�those previously paid on a per diem basis. These results sug-
gest that hospitals may not respond strongly to across-the-board payment cuts in the
vi

way that they treat patients. On the other hand, hospitals had a strong, immediate,
and predictable response to a change in the payment methodology, suggesting that
perhaps this is a more e�ective policy tool.
vii

TABLE OF CONTENTS
ACKNOWLEDGEMENTS . . . . . . . . . . . . . . . . . . . . . . . . . . . . iv
ABSTRACT . . . . . . . . . . . . . . . . . . . . . . . . . . . . . . . . . . . . vi
LIST OF TABLES . . . . . . . . . . . . . . . . . . . . . . . . . . . . . . . . . xi
LIST OF ILLUSTRATIONS . . . . . . . . . . . . . . . . . . . . . . . . . . . . xii
CHAPTER 1 : Introduction . . . . . . . . . . . . . . . . . . . . . . . . . . . 1
1.1 Prior Literature . . . . . . . . . . . . . . . . . . . . . . . . . . . . . . 4
1.2 Policy Background . . . . . . . . . . . . . . . . . . . . . . . . . . . . 11
1.3 Outline . . . . . . . . . . . . . . . . . . . . . . . . . . . . . . . . . . . 16
1.4 Tables and Figures . . . . . . . . . . . . . . . . . . . . . . . . . . . . 17
CHAPTER 2 : Conceptual Framework . . . . . . . . . . . . . . . . . . . . . 18
2.1 Hospital Response to Payment Cut . . . . . . . . . . . . . . . . . . . 19
2.2 Hospital Response to Change in Payment Methodology . . . . . . . . 25
CHAPTER 3 : Hospital Response to Medicaid Payment Cuts: Evidence from
California . . . . . . . . . . . . . . . . . . . . . . . . . . . . . 30
3.1 Introduction . . . . . . . . . . . . . . . . . . . . . . . . . . . . . . . . 30
3.2 Empirical Approach . . . . . . . . . . . . . . . . . . . . . . . . . . . . 35
3.3 Data Sources . . . . . . . . . . . . . . . . . . . . . . . . . . . . . . . 43
3.4 Results . . . . . . . . . . . . . . . . . . . . . . . . . . . . . . . . . . . 47
3.5 Policy Implications and Discussion . . . . . . . . . . . . . . . . . . . 54
3.6 Tables & Figures . . . . . . . . . . . . . . . . . . . . . . . . . . . . . 59
viii
CHAPTER 4 : The E�ect of Medicaid Payment Incentives on Patient Care in
California Hospitals . . . . . . . . . . . . . . . . . . . . . . . 76
4.1 Introduction . . . . . . . . . . . . . . . . . . . . . . . . . . . . . . . . 76
4.2 Empirical Approach . . . . . . . . . . . . . . . . . . . . . . . . . . . . 78
4.3 Data Sources . . . . . . . . . . . . . . . . . . . . . . . . . . . . . . . 85
4.4 Results . . . . . . . . . . . . . . . . . . . . . . . . . . . . . . . . . . . 88
4.5 Policy Implications and Discussion . . . . . . . . . . . . . . . . . . . 94
4.6 Tables & Figures . . . . . . . . . . . . . . . . . . . . . . . . . . . . . 96
CHAPTER 5 : Conclusion . . . . . . . . . . . . . . . . . . . . . . . . . . . . 112
5.1 The Impact of Level Cuts to Medicaid Payments . . . . . . . . . . . . 112
5.2 The Impact of Changes to Medicaid Reimbursement-Based Incentives 114
5.3 Conclusions . . . . . . . . . . . . . . . . . . . . . . . . . . . . . . . . 115
BIBLIOGRAPHY . . . . . . . . . . . . . . . . . . . . . . . . . . . . . . . . . 116
ix

LIST OF TABLES
TABLE 1 : Medi-Cal Reimbursement System . . . . . . . . . . . . . . . 17
TABLE 2 : Hospitals Subject to DRG Implementation . . . . . . . . . . 17
TABLE 3 : Hospital Characteristics (2007) . . . . . . . . . . . . . . . . . 62
TABLE 4 : Patient Characteristics . . . . . . . . . . . . . . . . . . . . . 63
TABLE 5 : Likelihood of Admission . . . . . . . . . . . . . . . . . . . . 66
TABLE 6 : Likelihood of Admission by ED Visit Severity . . . . . . . . . 67
TABLE 7 : Hospital Mix . . . . . . . . . . . . . . . . . . . . . . . . . . 68
TABLE 8 : Length of Stay . . . . . . . . . . . . . . . . . . . . . . . . . 69
TABLE 9 : Charges . . . . . . . . . . . . . . . . . . . . . . . . . . . . . 70
TABLE 10 : Number of Procedures . . . . . . . . . . . . . . . . . . . . . 71
TABLE 11 : Likelihood of C-Section Among Birth Cohort . . . . . . . . 71
TABLE 12 : Standardized Di�erences Among Hospitals Before and After
Matching . . . . . . . . . . . . . . . . . . . . . . . . . . . . . 73
TABLE 13 : Likelihood of Admission . . . . . . . . . . . . . . . . . . . . 73
TABLE 14 : Length of Stay . . . . . . . . . . . . . . . . . . . . . . . . . 74
TABLE 15 : Charges . . . . . . . . . . . . . . . . . . . . . . . . . . . . . 74
TABLE 16 : Number of Procedures . . . . . . . . . . . . . . . . . . . . . 74
TABLE 17 : Likelihood of C-Section Among Birth Cohort . . . . . . . . 75
TABLE 18 : Hospital Characteristics (2012) . . . . . . . . . . . . . . . . . 98
TABLE 19 : Patient Characteristics . . . . . . . . . . . . . . . . . . . . . 99
TABLE 20 : Hospital Mix . . . . . . . . . . . . . . . . . . . . . . . . . . . 103
TABLE 21 : Likelihood of Admission . . . . . . . . . . . . . . . . . . . . 104
x

TABLE 22 : Likelihood of Admission by Previous Payment Type . . . . . 104
TABLE 23 : Likelihood of Admission by ED Visit Severity . . . . . . . . . 105
TABLE 24 : Length of Stay . . . . . . . . . . . . . . . . . . . . . . . . . . 106
TABLE 25 : Length of Stay by Previous Payment Type . . . . . . . . . . 107
TABLE 26 : Number of Procedures . . . . . . . . . . . . . . . . . . . . . 107
TABLE 27 : Number of Procedures by Previous Payment Type . . . . . . 108
TABLE 28 : Charges . . . . . . . . . . . . . . . . . . . . . . . . . . . . . 108
TABLE 29 : Charges by Previous Payment Type . . . . . . . . . . . . . . 109
TABLE 30 : Likelihood of C-Section . . . . . . . . . . . . . . . . . . . . . 109
TABLE 31 : Likelihood of C-Section by Previous Payment Method . . . . 110
TABLE 32 : Likelihood of Coded 'With Complications' . . . . . . . . . . 110
TABLE 33 : Likelihood of Coded 'With Complications' by Previous Pay-
ment Method . . . . . . . . . . . . . . . . . . . . . . . . . . 111
TABLE 34 : Results of Sensitivity Analyses . . . . . . . . . . . . . . . . . 111
xi

LIST OF ILLUSTRATIONS
FIGURE 1 : Number of States with Changes to Medicaid Reimbursement
Rates . . . . . . . . . . . . . . . . . . . . . . . . . . . . . . 59
FIGURE 2 : Map of Hospitals by Fee Cut Status . . . . . . . . . . . . . 60
FIGURE 3 : Sample Selection Flowchart . . . . . . . . . . . . . . . . . . 61
FIGURE 4 : Di�erence-in-Di�erences Plots: Access to Care Measures . . 64
FIGURE 5 : Di�erence-in-Di�erences Plots: Intensity of Care Measures 65
FIGURE 6 : Hospitals' Propensity to Be Subject to Payment Cut (Distri-
butions) . . . . . . . . . . . . . . . . . . . . . . . . . . . . . 72
FIGURE 7 : Sample Selection Flowchart . . . . . . . . . . . . . . . . . . 97
FIGURE 8 : Di�erence-in-Di�erences Plots: Access to Care Measures . . 100
FIGURE 9 : Di�erence-in-Di�erences Plots: Intensity of Care Measures . 101
FIGURE 10 : Di�erence-in-Di�erences Plots: Intensity of Care Measures
(Birth) . . . . . . . . . . . . . . . . . . . . . . . . . . . . . 102
xii

CHAPTER 1 : Introduction
Health insurance plans have long used supply-side �nancial incentives in e�orts to
slow health care cost growth. Changes in the level and structure of reimbursement
are often used to align the incentives of providers and insurers, particularly within
public insurance programs such as Medicaid.
In this dissertation, I examine two recent major changes to Medicaid payment rates in
the state of California. The �rst was a payment decrease in 2008 that a�ected about
a third of the hospitals in the state. The fee cut amounted to at least a ten percent
decrease of rates from the previous level, and was a substantial decrease that a�ected
acute care services provided to Medicaid fee-for-service patients by certain general
acute care hospitals. The second was a change in the reimbursement methodology
that took place in 2013. Prior to this change, hospitals were reimbursed for fee-for-
service Medicaid patients either on a per diem basis (i.e. they were paid a �x rate per
day of inpatient stay), or on a fee-for-service basis, depending on hospital type. After
July 2013, the state switched to a diagnosis-related group (DRG) reimbursement
scheme for all general acute care hospitals, whereby hospitals were reimbursed per
inpatient stay, rather than inpatient day or on a cost basis. This thesis tests the
hypothesis that hospitals respond to reductions in payment by reducing the amount of
care provided to Medicaid patients, increasing the amount of care provided to higher-
paying, non-Medicaid patients, or both. This thesis also tests the hypothesis that
hospitals reimbursed on a fee-for-service basis will respond to the introduction of DRG
payments by decreasing both the length of stay and the amount of treatment provided,
but that hospitals previously paid on a per diem basis will reduce only length of stay
under DRG payments.
1
Much of the existing literature regarding provider response to payment changes or
payment di�erentials focuses on the Medicare program or on the treatment of Med-
icaid patients compared to patients with other insurance. Lindrooth et al. (2007)
�nd that following a reduction in Medicare reimbursement rates, hospitals with a
higher share of Medicare patients lowered treatment intensity for generously reim-
bursed services. Studying the impact of physician fees on treatment intensity in the
context of Cesarean versus normal childbirth, Gruber et al. (1999) �nd that due to
Medicaid's relatively low reimbursement di�erential between the two procedures, a
reduction in reimbursement rates would result in reduced treatment intensity for Med-
icaid patients. In the literature speci�cally surrounding hospital response to payment
reductions, the most commonly studied outcome is cost shifting � the notion that
in response to a decrease in payments from a public payer, hospitals will increase
prices to private payers. Dranove (1988) notes that even theoretically, strict condi-
tions need to hold for cost-shifting to occur. Broad reviews of the literature show that
empirically, the occurrence of cost shifting is at most very rare and limited (Morrisey,
1996; Frakt, 2011) and some work has shown that private payments may even fall in
response to payment reductions by Medicare (White, 2013). Thus, cost-shifting ap-
pears to play a minimal role at most, and there is no consensus in the literature about
hospitals' response to fee cuts. A number of other responses to payment changes are
possible; Ellis (1998) notes that providers may overprovide care to low-cost patients,
underprovide care to high-cost patients, or avoid high-cost patients. Dafny (2005)
examines a change in relative reimbursements by Medicare, and �nds that the ma-
jority of the response was administrative (i.e. changes in billing) as opposed to real
changes in patient care. However, hospital response to broad price cuts is not yet
well understood and research on other potential responses to payment cuts is limited.
This is especially true of cuts made by Medicaid, which generally has the lowest reim-
2
bursement rates among any payer. While a large literature exists on hospital response
to prospective payment systems, the majority of it focuses on state or federal policy
changes from the 1980s (Rosko and Broyles, 1987; Ellis and McGuire, 1996). These
articles do �nd substantial responses to prospective payments�signi�cant reduction
of cost growth is found in states where prospective payment in instituted, with cost
savings coming about mainly from reduced length of stay. Over the past 30 years,
health care costs have risen tremendously, there has been a large shift into managed
care insurance plans, and there have been a number of major changes in healthcare
policy, including the A�ordable Care Act. Given the rapidly changing healthcare
landscape in the United States, it is important to understand how incentives brought
about by prospective payment may impact hospital behavior today.
This dissertation contributes to the literature in several ways. First, there is a gen-
eral paucity of research in the health economics literature regarding state Medicaid
programs (as they generally pose a challenge in terms of institutional knowledge).
Second, as previously mentioned, research on hospital response to payment changes
has largely centered around relative changes in rates within the Medicare program.
The current research will explore the e�ects of broader fee cuts by Medicaid that
impact all general acute care inpatient services. Finally, this project will examine
hospital response to a re-structuring of the payment methodology to a DRG-based
system. A number of studies have examined the introduction of the Medicare DRG
system, but its introduction in 1982 does not lead to obvious conclusions as to how
hospitals may respond today in a vastly di�erent health care landscape. Furthermore,
analysis of other states' experience with implementing DRG programs is largely out-
dated. This work also represents a major contribution to the literature in that it
is able to separately identify hospital response to a DRG system based on previous
3

method of reimbursement.
The motivation behind this work is to shed light on the ways hospitals may respond to
changes in reimbursement by Medicaid. It has become increasingly common for states
to respond to �scal pressure by cutting provider rates, and yet it is not well understood
how this might a�ect treatment and access to care. Policymakers often argue that
there are ine�ciencies in the health care system, and cutting reimbursement rates will
simply encourage providers to reduce the ine�ciencies in their systems. However, it
is not obvious that this is the case. Hospitals are likely to continue seeing payment
reductions by state Medicaid programs in the coming years if current trends continue.
It may be the case that taxpayers and policymakers are willing to trade o� changes
to care and access to care for Medicaid patients in exchange for a reduction in the
growth rate of Medicaid spending. However, it is not possible to know this without
quantifying the impacts of changes to reimbursement on patient care. It is therefore
very important to have a more complete understanding of how hospitals respond to
broad cuts to payments by Medicaid. As described above, some work has explored
hospital response to payment decreases by Medicare, but it is not immediately clear
that hospitals would have a similar response to decreases by Medicaid. Furthermore,
for other states considering policy changes seeking to provide hospitals with incentives
to decrease costs, results from California's recent experience with the shift to a DRG
system will be very relevant.
1.1. Prior Literature
The literature regarding hospital response to payment changes has largely focused on
one particular hypothesis: cost shifting. Cost shifting is the notion that in response
to a decrease in payments from a public payer, hospitals will increase prices to private
4
payers to make up the losses. Despite a large body of literature, there has been little
reliable evidence in support of cost shifting, suggesting that this response is at most
rare and limited (Morrisey, 1996; Frakt, 2011). However, cost shifting is only one of a
number of ways hospitals may respond to a change in payment from a public payer,
and the lack of evidence for the cost shifting hypothesis leads to the conclusion that
hospitals must largely respond in other ways. A smaller literature has examined the
other varied responses that a hospital may have in response to a payment decrease.
For example, hospitals may alter the way they treat patients a�ected by the payment
changes (Ellis, 1998), change the way they treat other patients (Ellis, 1998; David
et al., 2014), or make administrative changes to elicit higher payments without al-
tering actual treatment (Dafny, 2005). A number of papers have looked at hospital
response to the introduction of prospective payment systems, but generally draw on
decades-past policy changes. I review the literature in greater detail below.
1.1.1. Hospital Response to Payment Cuts
Cost-Shifting Papers
A large body of literature has examined both the theoretical and empirical existence
of cost shifting. Dranove (1988) wrote the seminal model of hospital response to
payment changes, showing the theoretical conditions that need to hold for cost shifting
to occur. Building o� the earlier work on non-pro�t hospitals by Newhouse (1970)
and Pauly and Redisch (1973), Dranove presents a model of hospital utility that
maximizes both pro�ts and quantity in two separate markets. The hospital then sets
prices to maximize the objective function:
U = U(πi(P i, Ci
)+ πj
(P j, Cj
), Qi
(P i), Qj
(P j))
(1.1)
5

where i and j denote the two markets, and P and C denote prices and costs, respec-
tively. Dranove shows that even theoretically, cost shifting only occurs when certain
conditions have been met; �rst, the hospital cannot be a pure pro�t maximizer, and
second, the hospital must have market power.
Empirical studies have also found limited evidence of cost shifting. Hadley et al.
(1996) note that cost shifting behavior could occur not only in response to a reduc-
tion in prices by some payers, but also from other �nancial stresses such as increases
in uncompensated care or increases in competition. However, the authors �nd that
in response to low pro�ts and high competition, hospitals may increase e�ciency or
reduce costs, but that there is no evidence to support the cost shifting hypothesis.
Morrisey (1996) provides a review of the empirical evidence on cost shifting. Cross
sectional studies generally found no evidence of cost shifting, but many su�ered from
an inability to control for the level of service, quality, and amenities. However, dy-
namic studies that were able to control for these factors also found no evidence of
cost shifting. Morrisey suggests that the theoretical conditions which must hold for
cost shifting to occur were unlikely to exist, and hospitals were likely to respond to
falling prices by reducing the amount of uncompensated care they provide.
Cutler (1998) �nds some of the only credible evidence of cost shifting, but still shows
that its extent is limited. Studying reductions to Medicare payments in the late
1980s and the early 1990s, Cutler �nds that while cost shifting did seem to be the
primary response in the 1980s, by the 1990s, cost shifting was no longer a viable
response for hospitals. Instead, hospitals turned to other cost-cutting measures such
as reduction of nursing sta� and reduction of capacity. Cutler also examined other
potential responses, such as reductions in the acquisition of new technologies and
removal of services that primarily serve the poor, and found little evidence supporting
6

these hypotheses.
Others have also pointed out that cost shifting need not be the only way a hospital
might respond to reductions in payment. Frakt (2011) notes that cost shifting is
only one of a number of potential hospital responses to decreases in public payment
rates, speci�cally noting that cost cutting may also be likely to occur. Frakt up-
dates Morrisey's 1996 review, providing a comprehensive review of the more recent
empirical literature. He includes cross-sectional studies, �xed-e�ects speci�cations,
and di�erence models. He �nds that much of the literature that �nds substantial
cost-shifting is based on descriptive, industry-wide hospital payment-to-cost margins,
which does not allow for careful analysis of cost shifting as opposed to simple price
discrimination. Studies that are more careful in their analysis �nd that cost shifting
may occur, but relatively infrequently. Furthermore, Cutler (1998) is the only paper
to �nd evidence of full dollar-for-dollar cost shifting.
More recent evidence has even found the opposite of cost shifting to occur�the
lowering of private prices in response to a decrease in rates from public payers. White
(2013) examines hospital spending in areas with relatively low Medicare spending, and
�nds that these areas actually experienced relatively low growth in private payment
rates. Regression analyses show that a 10% cut in Medicare rates actually resulted
in a 3-8% cut in private payment rates. The author hypothesizes that this may be a
result of spillover e�ects of e�ciency measures hospitals may undertake to cut costs,
or part of strategic e�orts to attract more privately insured patients.
Although cost shifting remains a popular topic among economists, policymakers, and
hospitals, the empirical literature seems to show that its true extent is fairly limited.
Based on this previous research, I focus my empirical analyses on other potential
responses of hospitals to payment reductions.
7

Other Responses to Fee Changes
A smaller literature has examined other potential e�ects of fee changes on hospital
behavior. Ellis (1998) notes that as reimbursement incentives are increasingly used
to in�uence provider behavior, it is important to understand how these forces a�ect
patient treatment. Ellis focuses on three potential provider responses to reimburse-
ment incentives: 1) creaming, the overprovision of services to low-cost patients, 2)
skimping, the underprovision of services to high-cost patients, and 3) dumping, the
avoidance of high-cost patients. Ellis determines that theoretically, a fee-for-service
or cost-based reimbursement system will result in overprovision of services to all pa-
tient types. He also �nds that when providers dump high severity patients, they also
engage in skimping behavior. Empirical evidence supporting this theoretical work is
provided in White and Yee (2013). In this paper, the authors study hospital response
to Medicare price cuts between 1995 and 2009, and �nd that a 10% reduction in
Medicare prices leads to a 4.6% reduction in hospital discharges among the elderly,
i.e., a �dumping� response.
Dafny (2005) examines hospital response to a change in payment rates by Medicare.
The author takes advantage of a 1988 policy change that resulted in large price
changes for 40% of diagnosis-related groups (DRGs). Using this policy change as an
exogenous source of variation, Dafny �nds that the primary response among hospitals
was so-called �upcoding�, or the practice of coding patients to diagnoses with higher
DRG weights to receive higher reimbursement. Contrary to previous literature, she
�nds little evidence of real response to fee changes in the form of intensity or quality
of care. This suggests that hospitals are responsive to targeted changes to the fee
schedule, but may try to avoid changes to patient care.
8
Finally, there is some evidence that in response to �nancial pressures, hospitals may
cease to o�er some unpro�table services or services primarily used by higher-cost,
lower-paying patients. Dranove et al. (2013) examine hospital response to negative
�nancial shocks by studying the di�erential impact of the 2008 �nancial recession on
hospital endowments. The authors propose a number of potential hospital responses
(in addition to cost shifting): changes in hospital sta�ng, o�ering of low-pro�t ser-
vices (such as trauma centers of psychiatric services), and level of investment in new
technologies, speci�cally electronic medical record systems. The authors do not �nd
substantial evidence of cost shifting, but do �nd that hospitals with large negative
shocks to their endowments delayed purchases of health information technology and
reduced their o�erings of unpro�table services.
Another avenue through which changes to Medicaid reimbursements may impact hos-
pital behavior is through the potential for cross-subsidization. Cross subsidization in
the hospital setting refers to hospitals subsidizing unpro�table care for the Medicaid
or uninsured population by charger higher prices to the privately insured population
(or, subsidizing the provision of unpro�table services with the provision of pro�table
ones). Previous work has provided evidence that cross subsidization does in fact
occur broadly in hospitals to allow for the provision of unpro�table services(David
et al., 2014). However, some research has noted that due to increasing competition in
the hospital industry, as well as increasing price transparency, the next decade could
bring an increasing need for hospital cross-subsidization, but a declining ability to
do so (Altman et al., 2006). Therefore, it is possible that the changes to Medicaid
reimbursement could a�ect treatment not only for Medicaid patients, but for other
patients as well.
Limited evidence exists regarding potential responses of hospitals to fee decreases by
9

Medicaid. This dissertation seeks to address this gap in the literature.
1.1.2. Hospital Response to DRG Implementation
A number of papers have studied the impact of prospective payment on hospital be-
havior. Rosko and Broyles (1987) examine the short term response of hospitals to
a DRG pricing system by Medicaid. The authors examine the response of hospitals
to the implementation of a DRG system in the early 1980s by the New Jersey De-
partment of Health, using hospitals in eastern Pennsylvania that were reimbursed
retrospectively as a control group. Regression analyses showed that a cost savings
of 14.1 percent per admission and 9.8 percent per day occurred in hospitals subject
to prospective payment. Furthermore, although not statistically signi�cant, length
of stay fell by an average of 6.5 percent. These �ndings are consistent with the idea
that a shift to a prospective payment system will motivate hospitals to increase the
pro�tability of each inpatient stay, primarily by decreasing length of stay.
Frank and Lave (1989) estimate a model of hospital length of stay for Medicaid psychi-
atric patients, comparing per case prospective payment with cost-based reimburse-
ment. Using a comparison of hospital discharges in states with di�erent Medicaid
payment models, the authors �nd that compared with cost-based reimbursement,
there is a signi�cant reduction in length of hospital stay associated with prospective
payment. Somewhat more recently, Ellis and McGuire (1996) investigated hospital
response to the 1989 shift to a DRG system by New Hampshire Medicaid. Speci�cally,
they evaluate three potential responses of hospitals to a change in reimbursement in-
centives: changing intensity of services, changing the patient type or patient severity
seen at the hospital, or changing the market share. Using both Medicaid data and
New Hampshire hospital discharge data, the authors �nd that compared to a non-
Medicaid population, Medicaid patients experienced a 14.5% reduction in length of
10

stay as a result of the prospective payment system. A number of other papers also
�nd similar responses to DRG-based payments (Gay et al., 1989; Freiman et al., 1989;
Sche�er et al., 1994; Eldenburg and Kallapur, 1997).
While a large body of research exists that addresses hospital response to a switch
to a DRG system, much of it uses policy changes from over thirty years ago, when
the healthcare landscape in the U.S. was very di�erent. This dissertation updates
this older strain of research, and also conducts a comparison of response to DRG
implementation based on prior reimbursement method (per diem versus FFS).
1.2. Policy Background
The Medicaid program was created (along with Medicare) as a provision of the Social
Security Amendments of 1965 to provide health insurance coverage for individuals
and families with low income. Medicaid is a means-tested program jointly funded by
the state and federal governments, but managed by each state. States also have broad
decision-making power in terms of eligibility, bene�ts, and reimbursement associated
with the program.
The California Medical Assistance program, or Medi-Cal, is California's state Medi-
caid program, and is jointly administered and �nanced by the California Department
of Health Care Services (DHCS) and the Centers for Medicare and Medicaid Services
(CMS). The goal of Medi-Cal is to provide health insurance coverage to low-income
individuals, particularly families with children, seniors, the disabled, those in foster
care, pregnant women, and low-income individuals with certain conditions such as
tuberculosis, breast cancer, or HIV/AIDS(DHCS, 2014a).
11

1.2.1. Hospital Payment Scheme
In the early 1980s, a combination of a large state budget de�cit and substantial
excess capacity of hospital inpatient beds in California led legislators to seek reform
to the existing fee-for-service based payment system (DHCS, 2014d). Prior to 1982,
hospitals were reimbursed by Medi-Cal under a cost-based reimbursement system.
The Selective Provider Contracting Program (SPCP) was established in 1982 in an
e�ort to allow DHCS to control Medi-Cal costs without restricting hospital access
for bene�ciaries. The SPCP allowed DHCS to contract on a competitive basis with
hospitals willing to provide inpatient care to Medi-Cal bene�ciaries at a negotiated
daily capitated rate, or per diem rate, for all services. This model was intended to give
hospitals an incentive to improve e�ciency of care and control costs. The concept was
that Medi-Cal bene�ciaries would receive care at only those hospitals that contracted
with DHCS.
However, the legislation also required that su�cient hospital beds and services remain
available to all Medi-Cal bene�ciaries. Accordingly, geographic areas of the state
known as Health Facility Planning Areas (HFPAs) were designated as �closed� areas
or �open� areas based on the level of hospital competition in the area. Closed HFPAs
were more competitive areas, where SPCP contracts had been signed with some
hospitals, and Medi-Cal bene�ciaries were required to receive inpatient care at a
contract hospital (other than in emergencies or other speci�c circumstances described
by the Welfare and Institutions code section 140871). In open HFPAs, the SPCP was
not in e�ect, primarily because these were more rural areas with few hospitals, and
the amount of competition in the market was not su�cient to induce hospitals to
1Additional exclusions include services provided to Medi-Cal bene�ciaries dually eligible for Medi-care, services provided to Medi-Cal Managed Care patients, and services provided to patients livinga certain distance from a contract hospital.
12
contract. As such, to ensure su�cient access to care for Medi-Cal bene�ciaries in
these areas, bene�ciaries were allowed to receive inpatient care at any hospital in the
open HFPA. While hospitals could still choose to contract with DHCS, there was
no penalty for not doing so. Non-contract hospitals in open HFPAs were initially
reimbursed an interim charge-based rate that was negotiated with Medi-Cal. This
rate was negotiated as a set percentage of the hospital's charges. The reimbursement
was later adjusted based on Medi-Cal allowable audited costs (DHCS, 2014b).2 Table
1 summarizes the payment system.
1.2.2. 2008 Fee Decrease to Non-Contract Hospitals
Due to state �scal constraints, an e�ort was made to rein in costs associated with
Medi-Cal in 2008. E�ective July 1, 2008, DHCS was required to reduce the interim
payment made for inpatient services for many non-contract hospitals. Speci�cally,
DHCS was required to limit the interim payment to the lesser of the interim rate
less 10%, or the applicable regional average per diem contract rate for tertiary and
non-tertiary hospitals, less 5%. Furthermore, when calculating the cost report settle-
ment for a non-contract hospital for inpatient services, DHCS was required to limit
the settlement to the lesser of the hospital's audited allowable cost less 10%, or the
applicable regional average per diem contract rate for tertiary and non-tertiary hos-
pitals less 5%. These reductions applied to non-contract hospitals only. Speci�cally,
they applied to(DHCS, 2008):
1. All non-contract hospitals in closed HFPAs
2. Non-contract hospitals in open HFPAs that were closed at any point on or after
July 1, 2005, but were open on July 1, 2008
2Note that this payment scheme applies only to Medi-Cal fee-for-service patients, and does notapply to Medi-Cal managed care.
13
3. Non-contract hospitals in open HFPAs on July 1, 2008, regardless of whether
the area had ever been closed, if there were three or more hospitals with licensed
general acute care beds in the HFPA
Exemptions also existed for certain types of hospitals, including:
1. Small and rural hospitals
2. Non-contract hospitals in open HFPAs on July 1, 2008, if there were fewer than
three hospitals with licensed general acute care beds in the HFPA
Essentially, this entailed a decrease in fees of at least 10% to all a�ected hospitals for
inpatient services. Of the 388 general care hospitals in California between 2007 and
2009, 94 hospitals were subject to this cut (Figure 2).3
1.2.3. 2013 Switch to DRG System
In 2010, the Statutes of 2010 mandated the design and implementation of a new
reimbursement methodology for hospital inpatient services provided to fee-for-service
Medi-Cal bene�ciaries (DHCS, 2014b). This system was to be based on diagnosis
related groups (DRGs), a system that the federal Medicare program had been using
since 1983. Generally, DRGs provide a classi�cation scheme for inpatient admissions.
Each DRG is a de�nition of case types meant to represent patients who would be
expected to receive similar services and incur, on average, similar costs during the
hospital stay (Fetter et al., 1980). Then, each inpatient admission is assigned a DRG,
3Given that non-contract hospitals were initially reimbursed as a percentage of their charges,there could be concern that hospitals may simply have increased charges in response to the feedecrease. However, this is unlikely for two reasons. First, hospitals were only permitted to chargeMedi-Cal a certain percentage of the average charges they applied to other payers. Second, the feedecrease was the lesser of a ten percent reduction to charges or a �ve percent reduction of the averageregional per diem contract rate, so hospitals would have seen a reduction to payments regardless ofany strategic changes to their charges.
14

and hospitals are paid a capitated amount for that DRG, regardless of what services
were actually provided and how long the patient remained in the hospital. There
are a number of methodologies for classifying DRGs, including the original system
Medicare used, the Centers for Medicare and Medicaid Services (CMS)-DRG, the
system Medicare currently uses, Medicare Severity (MS)-DRGs, and the system that
is currently in use by Medi-Cal, All Patient Re�ned (APR)-DRGs.
Similar to other DRGs systems, the APR-DRG system works by assigning a DRG
to each stay, taking into account not only the patient's diagnoses, but also age,
procedures performed, and discharge status. Then, each stay is assigned a severity
level on a four point scale (minor, moderate, major, extreme). The DRG-severity
combination is assigned a DRG weight that allows it to be compared to the resource
use and cost of the �average patient.� A base DRG price is determined by DHCS, and
the amount paid to the hospital is then the DRG base price multiplied by the DRG
weight. The APR-DRG system is used by Medi-Cal (and a number of other state
Medicaid programs) rather than the CMS-DRG or MS-DRG systems because the
Medicare DRG systems were designed with the elderly Medicare population in mind.
The APR-DRG system is more appropriate for obstetric, newborn, and pediatric care,
which represent a substantial portion of Medi-Cal hospital visits (DHCS, 2014c).
Although the new DRG system was mandated in 2010, it was only implemented be-
ginning with admissions on July 1, 2013 for private hospitals and with admissions on
January 1, 2014 for non-designated public (NDP) hospitals. Once the new system was
fully implemented, hospitals were no longer designated as contract or non-contract,
HFPAs were no longer open or closed, and all private and NDP hospitals were subject
to DRG-based reimbursement for inpatient services to Medi-Cal FFS enrollees. Table
2 below summarizes the number of hospitals that were subject to DRG implementa-
15
tion.
1.3. Outline
The remainder of this dissertation proceeds as follows. In Chapter 2, I provide a
theoretical framework that provides motivation for the empirical questions addressed
in subsequent chapters. In Chapter 3, I analyze the impacts of the California Medicaid
hospital payment cut on hospital behavior. In particular, I study the impact of the
Medicaid payment cut on access to care and intensity of care for both Medicaid
patients and non-Medicaid patients. In Chapter 4, I estimate the impact of the
introduction of DRG-based payments on hospital behavior. In Chapter 5, I summarize
the results of these analyses and discuss policy implications.
16

1.4. Tables and Figures
Table 1: Medi-Cal Reimbursement SystemClosed HFPA (more competitive
area)Open HFPA (less competitive
area)
Contract HospitalsNegotiate per diem rate, cantreat any Medi-Cal patients
Negotiate per diem rate, cantreat any Medi-Cal patients (noclear reason to do this, very few)
Non-Contract Hospitals
Can only treat Medi-Cal patientsif emergency or no other nearby
hospitals
Paid a percentage of chargesupfront, and then adjusted based
on allowable costs
Table 2: Hospitals Subject to DRG ImplementationHospital Type Number of Hospitals DRG Status
Private Hospital 352 Implemented July 1, 2013Non-Designated Public Hospital 48 Implemented January 1, 2014Designated Public Hospital 26 DRG not implemented
17
CHAPTER 2 : Conceptual Framework
In this chapter, I describe separate frameworks to conceptualize how hospitals may
respond to payment reductions and to the introduction of DRG-based payments in
theory. In both models, I consider how hospitals may respond to these payment
changes in the way that they make admissions decisions and treatment decisions for
patients. One concept I abstract from in these models is the link between hospital pay-
ments and the behavior of the individual physicians within those hospitals. Changes
to hospital payments intended to change treatment patterns, such as bundled pay-
ments, pay-for-performance measures, or DRG payments all inherently assume that
hospitals have some level of control over the decision-making of individual physi-
cians acting within those hospitals. While changes to hospital payments have been
shown empirically to elicit changes in treatment in various settings, the mechanism
by which hospital boards or other hospital �nancial decision-makers may in�uence
physician behavior is not explicitly modeled in this dissertation. Research on the
hospital-physician relationship has noted that those who support hospital payment
changes recognize the need for integration between hospitals' and physicians' goals
for payment reform to be e�ective (Burns et al., 2010). The models presented in
the following sections implicitly assume that hospitals exert some level of in�uence
over physician behavior. However, it is true that a hospital cannot fully control the
behavior of an individual physician, particularly those who are not employees of the
hospital and only have admitting privileges. Among hospitals with less in�uence over
physician behavior, or with a smaller proportion of employed physicians compared
to physicians with admitting privileges, the response to hospital �nancial incentives
intended to in�uence treatment or admissions behavior may be attenuated.
18
2.1. Hospital Response to Payment Cut
2.1.1. Intuition
The theoretical approach for this section focuses on how hospitals may respond to a
payment reduction. In this subsection, I describe the intuition behind the theoreti-
cal predictions; the derivations are provided in the next subsection. I begin with a
simple model of a pro�t maximizing hospital, and then expand the model to consider
more complex responses. The pro�t maximizing hospital has two patient populations,
which can be interpreted as a high-paying population of privately insured individuals,
and a low-paying population of publicly insured individuals. The hospital can per-
fectly price discriminate between these two groups, and therefore the chooses quantity
of care for each group such that price equals marginal cost. Then, if the public payer
reduces its payment rates, the hospital responds by reducing the quantity of care
provided to the publicly insured patients, while making no changes to care for pri-
vately insured patients. In this section, I derive predictions of hospital behavior for
two payer types (which can be interpreted as a Medicaid-type payer, and a private
insurer) because of the popularity in both the literature and among providers and
insurers of the idea that a change in payments by a public payer can impact prices
or care received by privately insured patients.
However, following previous theory, suppose that rather than being purely pro�t-
maximizing, hospitals gain utility not only from pro�ts, but also from the quantity of
treatment provided to each group (Dranove, 1988). Then, if the public payer reduces
prices, hospitals may respond in a number of ways based on their speci�c utility
and cost functions. Hospitals will still respond by reducing the quantity provided
to publicly insured patients, but not to the extent of the pro�t maximizing hospital,
19

since they gain utility from providing care to these patients. In order to o�set losses
from this population, hospitals will also change the way they treat privately insured
patients. The model predicts that unless a hospital sets quantity such that price equals
marginal cost (i.e. unless the hospital is a pro�t maximizer), hospitals may respond
to price reductions from the public payer by increasing quantity to the privately
insured patients. The extent of this spillover e�ect is ultimately an empirical question
determined by the speci�c functional forms of the utility and cost functions.
This model of hospital behavior under pro�t maximization indicates that in response
to a payment decrease by Medicaid, pure pro�t-maximizing hospitals should simply
reduce the quantity supplied to patients with Medicaid. However, if the hospital
places some value on providing care to patients, it may be the case that either instead
of or in addition to reducing the quantity provided to Medicaid patients by some
amount, hospitals will increase the quantity provided to non-Medicaid, higher-paying
patients. The potential responses I describe can be thought of as analagous to the
income and substitution e�ects of a price change on an individual. The income e�ect
may cause hospitals to reduce the amount of treatment for Medicaid patients, while
the substitution e�ect may cause hospitals to respond by increasing the amount of
care provided to higher paying patients. The intuition behind this model is that
hospitals value more than pro�ts alone, and in particular, value providing timely,
appropriate care to patients. When a public payer cuts its payment rates, hospitals
may not want to drastically reduce the quantity of care provided to a�ected patients.
Instead, they may make more modest cuts to care for those patients, while seeking
to make up the losses elsewhere. One way in which they may do this is by providing
more care to more pro�table patients.
This model focuses on hospitals' quantity responses, which brings up the following
20

question: in the hospital setting, what does �quantity� mean? Broadly, quantity could
mean two things: either the overall number of patients treated, or the �amount� or
intensity of treatment patients receive in the hospital. Whether hospitals respond on
the number of patients, amount of treatment, or both, as well as the extent of any
change, remain empirical questions.
2.1.2. Derivation
Pro�t Maximizing Hospital
Suppose a hospital's objective function is as follows:
π = P1 ·Q1 − C1(Q1) + P2 ·Q2 − C2(Q2) (2.1)
where P is price, Q is quantity, and C(Q) is the cost function, and the subscripts 1
and 2 refer to groups of patients under two di�erent insurers, where P1 < P2. Then,
assuming the hospital is a price taker (which is fairly accurate in the case of Medicaid
or Medicare), the �rst order conditions are as follows:
∂π
∂Q1
= P1 − C ′1 (Q1) = 0 (2.2)
∂π
∂Q2
= P2 − C ′2 (Q2) = 0 (2.3)
Pro�ts are maximized when quantity is chosen such that Pi = C ′i(Qi), i.e. when
price equals marginal cost for each patient group. Under the standard assumptions
that C ′(Q) > 0 and C”(Q) > 0, then ∂Qi
∂Piis positive, meaning that when the price
decreases for either group, the hospital will reduce the quantity provided to that
21

group in response, or in the extreme, cease supplying to that payer entirely. Since
Pi does not enter into the equation of the optimal Qj, when the price for group i
changes, the optimal quantity for group j does not change.
Pro�t and Quantity Maximizing Hospital
Suppose that in addition to valuing pro�ts, hospitals also gain utility through pro-
viding care to patients, as follows:
U = U (Q1, Q2;P1, P2) =
U (P1 ·Q1 − C1(Q1) + P2 ·Q2 − C2(Q2)) + U (Q1) + U (Q2) (2.4)
where U ′(π) > 0, U ′′(π) < 0, U ′(Q) > 0, U ′′(Q) < 0, C ′(Q) > 0, and C ′′(Q) > 0.
Taking the �rst order conditions of equation 2.4 with respect to Q1 and Q2, I obtain:
∂U (Q1, Q2;P1, P2)
∂Q1
= f1 (Q1, Q2;P1, P2) =
U ′ (P1 ·Q1 − C1(Q1) + P2 ·Q2 − C2(Q2)) · (P1 − C ′(Q1)) + U ′ (Q1) = 0 (2.5)
∂U (Q1, Q2;P1, P2)
∂Q2
= f2 (Q1, Q2;P1, P2) =
U ′ (P1 ·Q1 − C1(Q1) + P2 ·Q2 − C2(Q2)) · (P2 − C ′(Q2)) + U ′ (Q2) = 0 (2.6)
Applying the implicit function theorem to the �rst order conditions above, I obtain:
22

∂Q1(P1,P2)∂P1
∂Q1(P1,P2)∂P2
∂Q2(P1,P2)∂P1
∂Q2(P1,P2)∂P2
= −
∂f1∂Q1
∂f1∂Q2
∂f2∂Q1
∂f2∂Q2
−1 ∂f1
∂P1
∂f1∂P2
∂f2∂P1
∂f2∂P2
=
− 1∂f1∂Q1
∂f2∂Q2− ∂f1
∂Q2
∂f2∂Q1
∂f2∂Q2
− ∂f1∂Q2
− ∂f2∂Q1
∂f1∂Q1
∂f1
∂P1
∂f1∂P2
∂f2∂P1
∂f2∂P2
(2.7)
The relationships of interest are ∂Q1
∂P1and ∂Q2
∂P1, which describe how the quantity pro-
vided to groups 1 and 2 change when payer 1 (i.e. Medicaid) changes its price. Then,
by equation 2.7, these relationships are de�ned as follows:
∂Q1 (P1, P2)
∂P1
= − 1∂f1∂Q1
∂f2∂Q2− ∂f1
∂Q2
∂f2∂Q1
[∂f2∂Q2
∂f1∂P1
− ∂f1∂Q2
∂f2∂P1
](2.8)
∂Q2 (P1, P2)
∂P1
= − 1∂f1∂Q1
∂f2∂Q2− ∂f1
∂Q2
∂f2∂Q1
[− ∂f2∂Q1
∂f1∂P1
+∂f1∂Q1
∂f2∂P1
](2.9)
The fraction in equations 2.8 and 2.9 expands to the following, where
U (P1 ·Q1 − C1(Q1) + P2 ·Q2 − C2(Q2)) is shortened to U (π) for brevity:
−1
U” (π){− (P1 − C ′ (Q1))
2C” (Q2)U′ (π) + U” (Q2) (P1 − C ′ (Q1))
2−
C” (Q1)U′ (π) (P2 − C ′ (Q2))
2 + U” (Q1) (P2 − C ′ (Q2))2}
+U ′ (π) {U ′ (π)C” (Q1)C” (Q2)− C” (Q1)U” (Q2)− C” (Q2)U” (Q1)}
+U” (Q1)U” (Q2)
(2.10)
Here, the fraction can be signed as negative based on the assumptions regarding the
23

shapes of the utility and cost functions. The expression in brackets in equation 2.8
expands to:
U” (π) (P2 − C ′ (Q2))2U ′ (π)− C” (Q2)U
′ (π)U” (π) ·Q1 · (P1 − C ′ (Q1))
− C” (Q2)U′ (π)2 + U” (π) ·Q1 · (P1 − C ′ (Q1))U” (Q2) + U ′ (π)U” (π) (2.11)
Making the assumption that both expressions of the form P−C ′(Q) will be negative at
the optimal Q1 and Q2 (given the utility function in equation 2.4), then the expression
in equation 2.11 is negative based on the shapes of the utility and cost functions. Since
the fraction in equation 2.10 is also negative, the sign of ∂Q1
∂P1is positive, meaning that
when prices fall from payer 1, the quantity supplied to group 1 also falls, and vice
versa.
To calculate ∂Q2
∂P1, I expand the expression in square brackets in equation 2.9 to:
U” (π) (P2 − C ′ (Q2)) {U ′ (π) (P1 − C ′ (Q1)) + U ′ (π)C” (Q1) ·Q1 − U” (Q1) ·Q1}
(2.12)
Again assuming that both expressions of the form P − C ′(Q) will be negative at the
optimal Q1 and Q2, the sign of the overall expression in equation 2.12 is ambiguous.
This means that the sign of ∂Q2
∂P1is also ambiguous.
24

2.2. Hospital Response to Change in Payment Methodology
2.2.1. Intuition
The theoretical approach for this section focuses on how hospitals may respond to a
shift to a new reimbursement methodology. In this subsection, I describe the intuition
behind the theoretical predictions; the derivations are provided in the next subsection.
I describe two types of hospitals�one that is paid on a FFS basis, and one paid on
a per diem basis. Then, I describe how their incentives and behavior change when
a DRG-based payment system in introduced. In modeling this behavior, I focus on
hospitals' responses in the treatment of Medicaid patient only. While I study other
patient types in the empirical analyses for completeness, the theoretical notion of a
hospital responding to prospective payment by one payer by changing the treatment
of other patients is much less popular in this literature than in the literature on
hospital response to payment cuts.
Hospitals paid on a FFS basis get paid both for the treatment administered as well
as per day of inpatient stay, so they choose treatment and LOS such that their prices
equal their marginal costs. However, once DRG payments are introduced, hospitals
don't receive payments based on speci�c treatments administered or length of stay.
Instead, their incentive is to minimize treatment and length of stay subject to any
minimum amounts they are legally required to provide. Therefore, it is expected
that following the introduction of DRG payments, treatment intensity and length of
stay should fall. However, it is possible that intensity and length of stay may remain
relatively stable if under FFS payments, prices were relatively low, which in turn
would imply low levels of treatment and length of stay even under FFS payments.
Hospitals paid on a per diem basis get paid per day of hospital stay, but do not
25

get paid based on the treatment administered. Therefore, they choose length of
stay such that its marginal cost equals its price, but seek to minimize the intensity
of treatment, subject only to minimum levels of treatment required by law, fear of
malpractice suits, or hospital goodwill. Furthermore, it may be the case that on
average, for Medicaid patients (who are less likely to be in hospital for end-of-life care
than Medicare patients), subsequent days of hospital stay require less treatment that
the initial day.4 Declining minimal treatment required gives an additional incentive
for hospitals to increase length of stay. Once DRG payments are introduced, there
is no major change in incentive when it comes to treatment intensity, given that
hospitals already had an incentive to minimize intensity. However, the incentive
when it comes to length of stay is completely reversed. It is expected that following
the introduction of DRG payments, hospitals previously paid on a per diem basis
should reduce average length of stay.
2.2.2. Derivation
Previous FFS Hospital
Suppose a hospital, paid on a FFS basis, has the following objective function:
π = PT · T + PL · L− C(T )− C(L) (2.13)
where P is price, T is the �quantity� of treatment, L is the number of days of hospital
stay, and C(·) is the cost function. Under a FFS payment scheme, a hospital would be
paid separately for each treatment, as well as a �room and board� fee for the number
of days of hospital stay. Then, assuming the hospital is a price taker (which is fairly
4For example, for patients admitted to the hospital for childbirth, the major cost comes on the�rst day when the delivery occurs, and subsequent days for recovery may require only minimal timewith providers.
26

accurate in the case of Medicaid or Medicare), the �rst order conditions are as follows:
∂π
∂T= PT − C ′ (T ) = 0 (2.14)
∂π
∂L= PL − C ′ (L) = 0 (2.15)
Pro�ts are maximized when the quantities of treatment and days of stay are chosen
such that their prices equal their marginal costs; hospitals have no incentive to cut
back on services.
Now, suppose that the hospital is switched to a DRG-based payment methodology:
π = P̄ − C (T )− C(L) (2.16)
For a given T and L it could be the case that P̄ ≤ PT ·T +PL ·L or P̄ ≥ PT ·T +PL ·L.
Therefore, I can only conclude that for services where prices on average decrease, the
likelihood of admission may also decrease, and vice versa. However, in the empirical
context of this research, predictions cannot be made about which direction this e�ect
may go in overall. Taking the �rst order conditions of equation 2.16 gives:
∂π
∂T= −C ′ (T ) = 0 (2.17)
∂π
∂L= −C ′ (L) = 0 (2.18)
This implies that hospitals now have incentive to keep the amount of treatment and
the length of stay as low as possible, subject only to any constraints on the minimum
27

level of care necessary to avoid lawsuits.
Previous Per Diem Hospital
Suppose now that a hospital was previously paid on a per diem basis, with the
following objective function:
π = PL · L− C(T )− C(L) (2.19)
where P ,T , and L are as de�ned above, and C(·) is the cost function. Under a
per diem payment scheme, a hospital would be paid per day of stay, but not per
treatment.Then, the �rst order conditions are as follows:
∂π
∂T= −C ′ (T ) = 0 (2.20)
∂π
∂L= PL − C ′ (L) = 0 (2.21)
Here we see that the per diem hospital has an incentive to minimize T , again subject
only to any constraints on the minimum amount of care necessary. However, the per
diem hospital will choose L such that PL = C ′(L).
Now, suppose that the hospital is switched to a DRG-based payment methodology:
π = P̄ − C (T )− C(L) (2.22)
Again, for a given T and L it could be the case that P̄ ≤ PL · L or P̄ ≥ PL · L.
Therefore, I can only conclude that for services where prices on average decrease, the
28

likelihood of admission may also decrease, and vice versa. However, taking the �rst
order conditions of equation 2.22 gives:
∂π
∂T= −C ′ (T ) = 0 (2.23)
∂π
∂L= −C ′ (L) = 0 (2.24)
Per diem hospitals already had an incentive to keep T as low as possible, and therefore
I do not expect any change in behavior in terms of amount or itensity of treatment.
However, when it comes to length of stay, the incentive is now reversed; per diem
hospitals should reduce average length of stay once DRG payments are introduced.
29

CHAPTER 3 : Hospital Response to Medicaid Payment Cuts: Evidence
from California
3.1. Introduction
Health insurance plans have long used supply-side �nancial incentives in e�orts to
slow health care cost growth. Changes in the level and structure of reimbursement
are often used to align the incentives of providers and insurers, particularly within
public insurance programs such as Medicaid. A simple way to attempt to change
provider behavior is to reduce payments, which should theoretically cause a reduction
in the quantity supplied. Lower quantities at lower prices should translate to savings
for payers, but things are not always so straightforward in health care markets. For
both legal and ethical reasons, providers may exhibit behaviors not consistent with
pro�t maximization.
Over the past �fteen years, �scally constrained state Medicaid programs have increas-
ingly used hospital payment cuts as a policy lever to slow Medicaid spending growth.
Economic downturns generally lead to an increase in the number of individuals who
are eligible for Medicaid, which in turn worsens the burden on state budgets. Fol-
lowing the repeal of a requirement for �reasonable and adequate� payment rates for
inpatient hospital services in 1997, it has become increasingly common for states to
respond to this �scal pressure by cutting or freezing Medicaid reimbursement rates
to health care providers (Figure 1).5 The incidence of payment cuts can be expected
to grow if current trends continue; in 2015, 32 states restricted hospital payment
through either payment freezes or cuts, up from 30 states in 2014 and 20 states in
5See Smith (2003, 2004, 2005, 2006, 2007, 2008, 2009) for detailed annual coverage of this issue.
30

2013.6 While physicians may respond to low or decreasing Medicaid reimbursement
rates by simply not accepting new Medicaid patients, it is infeasible for many hospi-
tals, which operate at a much larger scale than most physician organizations, to forego
admissions from the entire Medicaid population. Therefore, hospitals generally must
respond to Medicaid fee decreases along other margins.
This chapter studies the extent to which hospitals may change patient care in response
to a decrease in reimbursement by Medicaid. While it has become increasingly com-
mon for states to respond to �scal pressure by cutting provider rates, the e�ects on
treatment and access to care are not yet well understood. Policymakers often argue
that there are ine�ciencies in the health care system, and that cutting reimbursement
will simply encourage providers to reduce the ine�ciencies in their systems. However,
it is not obvious that hospitals can or will respond in this way�if ine�ciencies could
easily be targeted and reduced, why would hospitals not already have done so? Hospi-
tals are likely to continue seeing restrictions to payments by state Medicaid programs
in the coming years. Quantifying the impacts of hospital payment cuts by Medicaid
is therefore crucial to assessing whether taxpayers and policymakers are willing to
make the tradeo� between reductions in Medicaid cost growth and potential changes
to patient care.
Hospitals may respond to payment reductions by a public payer in a number of
ways, but by far the most commonly studied outcome in the current literature has
been cost shifting. Cost shifting refers to the notion that in response to a decrease
in payments from a public payer, hospitals will increase prices to private payers.
However, both theoretically and empirically, cost shifting appears to play at most
a minimal role (Dranove, 1988; Morrisey, 1996; Frakt, 2011). A number of other
6Data kindly provided to the author by the Kaiser Family Foundation.
31
responses to payment changes are possible, such as overprovision of care to low-
cost patients, underprovision of care to high-cost patients, or avoidance of high-cost
patients (Ellis, 1998). Empirical work on these responses is limited, and existing
research is largely focused on payment changes by Medicare (Dafny, 2005; White and
Yee, 2013). However, it is not immediately clear that hospitals would have a similar
response to payment decreases by Medicaid as they would to payment decreases by
Medicare, highlighting a gap in the current literature (Gruber et al., 1999). Hospital
response to broad Medicaid payment cuts is not yet well understood and research on
responses other than cost shifting is limited.
In this research, I examine whether hospitals respond to Medicaid payment cuts by
changing the way they provide treatment or control access to hospital care for patients,
using a major decrease in Medicaid reimbursement rates in the state of California as
a natural experiment. In 2008, the California Department of Health Care Services
(DHCS) instituted a broad Medicaid payment decrease that a�ected about a third
of the hospitals in the state. The cut amounted to at least a ten percent reduction
in payment rates, a substantial decrease that a�ected reimbursement for acute care
services provided to Medicaid fee-for-service patients by certain general acute care
hospitals.7 Given that prior to this reduction, hospitals typically saw modest annual
increases to the reimbursement rate, I expect a priori that hospitals would have a
strong response to such a large reduction in payments.
The state of California provides a particularly ripe setting for studying changes to
Medicaid reimbursement, with one of the largest and most diverse Medicaid popula-
tions in the country (California HealthCare Foundation, 2009). Furthermore, Cali-
fornia Medicaid was known for having some of the lowest reimbursement rates in the
7Some hospitals were exempt from this payment change. Reasons for exemption are detailed inSection 1.2.2.
32

country,8 making it likely that reductions to already low reimbursement could have
major impacts on hospitals.
I use a comprehensive hospital and emergency department discharge data set for
the years 2007-2009 from the California O�ce of Statewide Health Planning and
Development (OSHPD). Using a di�erence-in-di�erences approach, I measure the
impact of the 2008 hospital payment reduction by Medicaid on both access to care
and intensity of care for Medicaid patients. To test for spillover e�ects onto non-
Medicaid patients, I also evaluate the impact of the Medicaid payment reduction on
access to care and treatment intensity for Medicare and privately insured patients
(White, 2013). To address concerns that treated and control hospitals may be di�er
substantially from one another, I analyze the same outcomes in a propensity score
matched sample that mimics the di�erence-in-di�erences approach. These analyses
provide a number of insights into hospitals' responses to cuts in Medicaid payment
rates.
Contrary to conventional economic wisdom that a decrease in price would lead to a
decrease in the quantity supplied, I do not �nd evidence supporting this behavior by
hospitals. Across many measures of access to care and intensity of treatment, changes
to Medicaid patients as a result of the Medicaid payment change are very small and
not statistically signi�cant. While I �nd some evidence suggestive of a spillover e�ect
onto more pro�table, non-Medicaid patients, these results do not persist in robust-
ness checks. However, if it exists, an increase in intensity for non-Medicaid patients
suggests that rather than responding to Medicaid payment cuts in the way they
treat Medicaid patients themselves, hospitals responded by increasing the intensity
of treatment for privately insured patients. This may occur if hospitals are trying to
8For example, in 2008, California Medicaid paid just 78% of the Medicaid national average forobstetric care (Zuckerman et al., 2009).
33

o�set Medicaid losses with increased care to more pro�table patients or are trying to
attract more high-paying patients by providing �higher quality� care.
These �ndings have important policy implications. A reduction in prices to hospitals
without an accompanying reduction in the amount of care provided indicates that
the full cost-saving potential of this policy may not have been reached. Medicaid
policymakers should consider whether other reimbursement incentives would be more
e�ective in reining in Medicaid spending. Furthermore, policymakers should con-
sider what spillover e�ects onto non-Medicaid patients may signal about a hospital.
In the long term, hospital closures may be a concern hospitals are in �nancial dis-
tress. If this is more likely to occur among hospitals treating a high percentage of
Medicaid patients, access to care for Medicaid patients could be seriously a�ected.
Future work should further explore the potential spillover e�ects uncovered in this
paper and examine the �nancial rami�cations to Medicaid of hospital payment cuts.
Provider payment cuts have become a frequently used policy tool, and therefore a
clear understanding of the impacts of Medicaid payment cuts on Medicaid enrollees,
non-Medicaid patients, and the Medicaid program itself is essential.
This research contributes to the literature in several ways. First, existing research on
hospital response to payment changes has largely centered around relative changes in
payment rates within the Medicare program, as opposed to the across-the-board cuts
in Medicaid studied in this paper.9 Second, there is a general paucity of research in
the health economics literature regarding state Medicaid programs, as they generally
pose a challenge in terms of institutional knowledge (Sommers, 2015). Finally, this
research provides insight not only into how Medicaid patients might be a�ected by
Medicaid payment cuts, but also how Medicare and privately insured patients are
9See Dafny (2005); Eldenburg and Kallapur (1997); Lindrooth et al. (2007); White (2013); Whiteand Yee (2013); White and Wu (2014).
34
a�ected.
3.2. Empirical Approach
3.2.1. Outcome Measures
1. Access to care is measured in two ways:
(a) First, the likelihood of admission is de�ned as the likelihood of inpatient
admission to the hospital following a visit to the same hospital's emergency
department.
(b) Second, hospital-level insurance mix is de�ned at the hospital level as the
proportion of Medicaid FFS patients divided by the total population of
patients.
2. Intensity of care is measured in a number of ways:
(a) First, it is measured as the length of stay (LOS), which is included in each
hospital discharge record.
(b) Second, it is measured as the total charges associated with the discharge,
with the assumption that higher charges generally imply more intense care.
(c) A third measure of intensity of care is measured as the number of procedures
associated with the discharge (under the assumption that a greater number
of procedures generally implies more intense care).
(d) Finally, I also conduct analyses among a subset of patients for whom de�n-
ing intensity of care is much more straightforward�women admitted to the
hospital for childbirth. Childbirth is an ideal setting to study intensity of
35

care, since there are essentially only two options for care (vaginal deliv-
ery or delivery via cesarean section), and one (and only one) of those is
associated with every delivery. Furthermore, childbirth is commonly used
in the literature to study intensity of care because as previous work has
noted, the underlying costs in terms of physician time are considered sim-
ilar between cesarean section and vaginal delivery, but cesarean section is
typically reimbursed at a higher rate (Gruber et al., 1999). Finally, child-
birth is particularly useful to study in the context of this research since it
is a very common reason for hospital admissions among the Medicaid pop-
ulation. Therefore, among the cohort of women admitted to the hospital
for childbirth, I also measure the likelihood of receiving a cesarean section.
3.2.2. Identi�cation Strategy
To identify the e�ects of the reimbursement rate reduction, I include only hospitals
within open HFPAs in my sample, since treated hospitals in closed HFPAs would
have mechanically had very low proportions of Medicaid FFS patients, and therefore
may not have had major response to the fee decrease. Non-contract hospitals subject
to the payment cut make up the treated group, and all remaining hospitals in open
HFPAs that were not subject to this payment change make up the control group.
When choosing hospitals to include in the control group, there were three potential
groups of hospitals to consider:
• Non-contract hospitals that were exempt from the fee decrease because they
quali�ed as �small or rural� hospitals
• Non-contract hospitals that were exempt from the fee decrease because the
HFPA to which they belonged had fewer than three total hospitals
36

• Contract hospitals
Arguments could be made as to why each of these groups would or would not make
appropriate comparison groups for the treated hospitals. Overall, recall that open and
closed HFPAs were grouped as such due to the level of competition in the market,
so one can at least say that the level of competition each of these hospitals faces is
similar. More speci�cally, small or rural hospital status is given to hospitals that
meet at least one of the following criteria: have 100 or fewer beds, have 4000 or fewer
admissions, or are located outside a Metropolitan Statistical Area. For all of these
criteria, it is likely that many hospitals that are in open HFPAs (already more rural,
less densely populated parts of the state) that do not actually qualify as small or rural
may have �just missed� qualifying for this status and therefore may not be inherently
di�erent from those that did qualify. In terms of the number of hospitals in the open
HFPA, the data shows that within an open HFPA, the number of hospitals ranges
only from one to �ve. Hospitals in HFPAs with three or four hospitals may not di�er
greatly from hospitals in HFPAs with one or two hospitals. Finally, one might argue
that hospitals that willingly contract with Medicaid when there is no incentive to
do so must di�er from hospitals that do not contract. However, anecdotal evidence
shows that hospitals that contract in open HFPAs generally do so because they are
a part of a larger hospital system where many of the other hospitals are in closed
HFPAs, so the hospital in the open HFPA contracts only for administrative ease with
the rest of the system. Furthermore, for the most part, contracting status was chosen
in the 1980s and not changed, making this an almost exogenous factor. These three
types of potential control hospitals make up a group that is reasonably similar to the
hospitals in the treated group, and I therefore include them all in the control group.
One concern with these analyses is that a number of counties in California had Med-
37
icaid managed care plans that were mandatory for most non-elderly, non-disabled
enrollees. This would imply that for most Medi-Cal enrollees in these counties, the
10% fee decrease would not have applied. However, by the end of the study period,
33 of the 58 counties in California still had no managed care plans at all, and even
hospitals in counties that o�ered managed care may have seen substantial numbers of
patients from neighboring counties. Furthermore, upon �rst enrollment in Medicaid,
all patients, regardless of county, are enrolled in FFS for the �rst 30 days. Given that
many uninsured patients are enrolled in Medicaid upon presentation in an emergency
department or hospital, this may impact the proportion of Medicaid FFS patients a
given hospital sees. Therefore, to ensure that the hospitals included in the sample
would have felt real impacts of the Medicaid FFS payment cut, I simply use cuto�s
based on the hospital's lagged share of Medicaid FFS patients. Using the percentage
of Medicaid FFS patients in hospitals in counties that did not o�er managed care as
a benchmark, I use a cuto� of 10% in my analyses.10
Finally, in the analyses studying the likelihood of hospital admission for patients
appearing in the ED, it may be unlikely to see a response across all reasons for
ED visit. For example, in the case of an immediate life-threatening emergency, it is
unlikely (and illegal) for hospitals to refuse to treat a patient based on insurance status
(CMS, 2012). Therefore, in addition to looking at overall ED visits, I also examine
ED visits broken down into visits considered to require emergency care, versus those
that are primary care treatable or non-emergent, using an ED classi�cation algorithm
developed by researchers at New York University (Billings et al., 2000). The algorithm
provides a percentage of cases for a given diagnosis that are considered non-emergent
(ED care not needed), emergent but primary care treatable (ED care not needed),
10Sensitivity analyses around this cuto� were conducted, and did not change the results of thestudy.
38

emergent but preventable (ED care needed), and emergent and not preventable (ED
care needed). I break up the sample into ED visits with a non-zero proportion of �ED
care not needed� versus those with a non-zero proportion of �ED care needed.�11
3.2.3. Sample Selection
A sample selection �owchart is provided in Figure 3. The sample of hospitals was lim-
ited to those in open HFPAs only, and further to hospitals with at least a ten percent
share of Medicaid FFS patients in the pre-period. Additionally, I drop hospitals with
fewer than 500 admissions in either the pre- or post-periods, and hospitals that were
run by a city, county, or district.12 This resulted in a sample of 12 treated hospitals
and 37 control hospitals.13 For sample selection of patients, only patients insured by
Medicaid FFS, Medicare, or private insurance were included in the sample. Patients
for whom certain variables (age, race, gender, or admission source) were missing were
excluded from the analysis. Finally, patients with very uncommon conditions or who
were extreme outliers in LOS or charges were excluded from analysis as well, leading
to a �nal sample of 704,312 patients.
3.2.4. Di�erence-in-Di�erences Analysis
I utilize patient discharge data and emergency department data from quarter 1 of
2007 to quarter 3 of 2009. The reimbursement rate decrease took e�ect in July 2008,
so this provides six quarters of pre-data and �ve quarters of post-data. I use the end
of Q3 2009 as the end of my study period for several reasons. First of all, given the
magnitude of the rate cut, I expect that any potential hospital response would be
11These are not mutually exclusive categories. However, this is the broadest way to classify thedata without introducing arbitrary cuto� points.
12These hospitals were dropped because they only appeared among the control group.13Statistical power issues were generally not a concern, as most analyses are done at the patient
level.
39
observed soon after the policy was enacted. More importantly, I speci�cally end my
study period at the end of Q3 2009 rather than the end of 2009 due to a lawsuit �led
by several non-contract hospitals which resulted in a preliminary injunction being
issued in November 2009 that prohibited the DHCS from continuing to apply the ten
percent reduction in allowable costs to the plainti� hospitals (DHCS, 2009). However,
the existence of this lawsuit indicates that the rate cut was more than just super�cial,
and provides anecdotal evidence that the rate cut likely had real impacts on hospitals.
Prior to the 2008 cut, hospital reimbursement rates had been increasing nominally
each year.
I use a di�erence-in-di�erences approach to compare access to care and intensity of
care in hospitals that were subject to the fee cut versus those that were not, prior to
and following its 2008 implementation. The regression is speci�ed as follows:
Yijtk = β0+β1·Postt+β2·Treatedj+β3 (Post× Treated)tj+β4·Xi+β5·Zj+β6·Wk+ε
(3.1)
where Y is the outcome of interest. Post indicates the admission occurred at time t
following the fee decrease, Treated indicates that hospital j was subject to the fee de-
crease, and Post×Treated is the interaction of the two. X is a vector of patient-level
covariates for patient i, Z is a vector of hospital level covariates for hospital j, and W
is a vector of county-level covariates for county k. Patient level demographics include
age, gender, ethnicity (Hispanic or non-Hispanic), and race. Additionally, patient
health characteristics associated with the admission are included. Hospital level co-
variates include the pro�t status of the hospital (for pro�t vs. not-for-pro�t) and the
pre-payment change Medicaid FFS proportion of patients. County level characteris-
tics include the county-level Medicaid FFS proportion, the unemployment rate, and
average income. For continuous outcomes (i.e., charges), the equation is estimated via
40

linear regression. For count outcomes (i.e., length of stay, number of procedures), the
equation is estimated using Poisson regression. Finally, to estimate event likelihood
(i.e., likelihood of admission, likelihood of c-section), I use logistic regression. The
analyses are done separately for Medicaid fee-for-service patients (primary e�ect), and
then for Medicare or privately insured patients to test for secondary e�ects. Standard
errors are cluster robust, with clusters de�ned at the hospital level (Bertrand et al.,
2004).
To understand the impact of the fee cut on the hospital-level mix of patients by
insurer type, I estimate the following equation:
Yjtk = β0+β1 ·Postt+β2 ·Treatedj+β3 (Post× Treated)tj+β4 ·Zj+β5 ·Wk+ε (3.2)
where the outcome Y is the proportion of Medi-Cal FFS patients, de�ned at the
hospital level. Since discharges are on the quarter-year level, each hospital has one
observation per quarter-year. I use heteroskedasticity robust standard errors.
3.2.5. Propensity Score Triple Matching
One issue that may be raised with a di�erence-in-di�erences strategy is that it may
su�er from bias if hospitals subject to the fee decrease di�er in unobservable ways from
hospitals not subject to the fee decrease. Therefore, as a sensitivity analysis, I also
conduct these analyses using a matched sample approach. While matching does not
explicitly control for omitted variable bias, it excludes control hospitals or patients
that are �too di�erent� from treated units on observable characteristics. Matching
also has the desirable property of not relying on the correct speci�cation of functional
form (Zanutto, 2006).
For the analyses of length of stay, intensity of care, and likelihood of admission (i.e.,
41

the discharge-level analyses), I adapt a triple matching procedure which allows me
to implement a propensity score matching procedure while utilizing the variation
found in the di�erence-in-di�erences approach (Hansen, 2007; Rosenbaum, 2002).
The match ensures that pre-treatment characteristics are similar, implying that any
post-match di�erences can be attributed to the policy change. The �rst step in
this approach is to match each treated hospital to a control hospital based on pre-
treatment hospital characteristics. Then, within each hospital, a patient from the
pre-period is matched to a patient from the post-period. Finally, the matched pa-
tient pair from a treated hospital is matched to a patient pair from the hospital's
matched control, resulting in a patient quadruple similar to the basis for a di�erence-
in-di�erence analysis. Each level of matching is carried out using a propensity score
matching technique. For the hospital-level match, the propensity score is estimated
using logit regression as the predicted probability of a hospital being subject to the
fee decrease:
Pr(FeeCut = 1) = β0 + β1 · Zj + β2 ·Wk + ε (3.3)
where Zj are hospital characteristics, including the proportion of Medicaid discharges,
number of total discharges, and average available beds, and Wk are county-level
characteristics, and include unemployment rate, average income, and the proportion
of county residents eligible for Medicaid FFS. Next, I construct the within-hospital
match of patients:
Pr(Post) = β0 + β1 ·Xi + ε (3.4)
In the estimation of the propensity score, I include the following patient-level covari-
ates on the right-hand side: diagnosis, age, gender, race, and source of admission.
Once pre-post matched pairs are constructed within each hospital, the average of
42
the covariates for each pair is calculated, and then each pair in a treated hospital is
matched to a pair in the control hospital with the propensity score estimated as in
equation 3.4. I use 1:1 propensity score caliper matching throughout, because any
larger number of controls to treated units would result in large numbers of observa-
tions needing to be discarded.
I use a random e�ects model to estimate the results:
Yijtk = β0 + β1 · Postt + β2 · Treatedj + β3 (Post× Treated)tj + ε (3.5)
This allows me to utilize the systematic bias introduced by matching by using the
matched group identi�er as the group variable in the regression. Similar to the un-
matched di�erence-in-di�erences regressions, I use linear regression for continuous
variables, Poisson regression for count variables, and logistic regression for binary
variables.
3.3. Data Sources
I use discharge-level, hospital-level, and county-level data. The discharge data in-
cludes information on patients discharged from both hospitals and emergency de-
partments (EDs), and includes patient characteristics as well as diagnosis and treat-
ment variables. Hospital-level variables include both general hospital characteristics,
as well as more speci�c information regarding SPCP contracting status and HFPA
area status. Finally, county-level variables include variables on county-level unem-
ployment, income, and Medicaid penetration rates. The sources for each of these are
described in more detail in the following subsections.
43
3.3.1. Patient-Level Variables
Patient Discharge Data
Patient-level discharge data come from the California O�ce of Statewide Health Plan-
ning and Development (OSHPD) for the years 2007 to 2009. I use the non-public
use versions of the inpatient discharge data and the emergency department data to
ensure full access to demographic variables. The inpatient discharge data include a
record for every inpatient discharge from a California-licensed hospital. Each record
consists of the hospital at which care was received, date of birth, gender, ethnicity,
race, principal language spoken, county of residence, zip code, admission date, dis-
charge date, length of stay, source of admission (own hospital ED, other hospital
ED, no ED), disposition, expected source of payment (Medicare, Medi-Cal, private
coverage, etc), type of coverage (traditional FFS, managed care, etc), total charges,
major diagnostic category (MDC), CMS Diagnosis Related Group (DRG), principal
diagnosis, other diagnoses, principal procedure, and other procedures. I control for
diagnoses by using the DRG grouping.
Emergency Department Data
Patient-level emergency department data for the years 2007 to 2009 also come from
OSHPD. The ED data include a record for every ED encounter that involved face-
to-face contact with a provider at a hospital licensed to provide emergency medical
services. Patients who left the ED without being seen are not included in the data.
The ED data include variables on the facility at which emergency care was sought,
the patient's date of birth, gender, ethnicity, race, principal language spoken, county
of residence, zip code, service date, disposition, expected source of payment, principal
44

and other diagnoses, and principal and other procedures. Since DRGs are not included
in the ED data, I use the Clinical Classi�cations Software, a diagnosis-grouping algo-
rithm, in order to cluster diagnoses into clinically meaningful categories (Elixhauser
et al., 2014). It is also important to note that in analyses using the ED data only, I
can only observe the payer category (Medicare, Medi-Cal, private coverage, etc.), but
not the type of coverage (managed care vs. FFS). Therefore, I include all Medi-Cal
patients in the analyses.
3.3.2. Hospital-Level Variables
Basic hospital-level variables were found in the OSHPD data. This includes a unique
hospital identi�cation number and hospital name, hospital zip code, hospital county,
and the total number of discharges by year. Additional hospital-level variables are
described below.
Information on the contracting status of each hospital, as well as the area status
(open or closed) of the HFPA in which the hospital is found, was hand-collected
from a number of sources. The HFPA to which each hospital was assigned was
found in hospital �nancial reports that are publicly available from OSHPD.14 These
reports also denoted whether a hospital was considered a small or rural hospital
(small and rural hospitals were exempt from the 2008 fee decrease). HFPA area
status (closed or open) was found in the California Medical Assistance Commission
(CMAC) Annual Reports to the Legislature (2009-2010).15 Finally, the contracting
status of each hospital came from the CMAC reports and individual annual hospital
�nancial disclosure reports publicly available from OSHPD.16
14http://www.oshpd.ca.gov/hid/Products/Hospitals/QuatrlyFinanData/CmpleteData/default.asp15http://www.dhcs.ca.gov/services/spcp/Pages/default.aspx16https://siera.oshpd.ca.gov/FinancialDisclosure.aspx
45
The hospital-level data set was then constructed as follows: all hospitals that appeared
in the OSHPD discharge data were identi�ed, and then hospitals that did not appear
in all three years of data were excluded. Additionally, all hospitals that were not
general acute care hospitals were excluded from the analysis. HFPA status, HFPA
area status, and contracting status variables were then merged into the hospital data.
There were a small number of hospitals for which contracting status could not be
identi�ed, so records from these hospitals were excluded. There were also a small
number of hospitals that changed contracting status during the study period, and
were therefore excluded.
3.3.3. County-Level Variables
County-level variables are included in regression analyses to control for any di�erential
impacts of the 2008 economic recession, and include Medi-Cal fee-for-service pene-
tration rates, unemployment rates, and income levels. Medi-Cal penetration rates
come from publicly available Medi-Cal eligibility and enrollment statistics which are
available by year and county.17 County-level unemployment statistics come from the
Bureau of Labor Statistics Local Area Unemployment Statistics.18 These data include
monthly county-level unemployment rates, and were merged into the OSHPD patient
discharge data based on hospital county. Finally, county-level income levels come
from the U.S. Census Bureau Small Area Income and Poverty Estimates.19 These
data include annual county-level income rates, and were merged into the OSHPD
patient discharge data based on hospital county.
17dhcs.ca.gov/dataandstats/statistics/Pages/RASD_Enrollment_by_Geographic_Region.aspx18bls.gov/lau/data.htm19census.gov/did/www/saipe/index.html
46
3.4. Results
3.4.1. Descriptive Statistics
Descriptive statistics of the hospitals included in the analysis are presented in Table 3.
A total of 12 treated hospitals and 37 control hospitals met the inclusion criteria for
the analysis. Treatment hospitals were generally larger than control hospitals, with
roughly twice as many total discharges and twice as many total hospital days in 2007.
This is likely due to the fact that hospital size in part determined exemption from
the reimbursement cut, and it should therefore be expected that control hospitals are
smaller that treatment hospitals. However, both treated and control hospitals had
similar proportions of patients covered by Medi-Cal FFS, with nearly a quarter of
patients on average covered by Medi-Cal FFS.20
Descriptive statistics of Medicaid FFS patients are presented in the left four columns
of Table 4. Among the Medicaid FFS population, average age is 23-24 years old and
over two-thirds are female, with little variation between treatment/control hospitals
or pre/post periods. Control hospitals see a more predominantly white Medicaid
population (more than 75% white), while treatment hospitals have a Medicaid pop-
ulation that is about 60% white, with the di�erence largely attributable to more
patients of �other� race. Average charges appear stable among patients in treated
hospitals, while increasing slightly among patients in control hospitals. Within the
cohort of women admitted to the hospital for childbirth, there is little change in the
proportion of women receiving a cesarean section compared to vaginal birth. There
is also very little change in the proportion of patients admitted to the hospital given
20Recall that these are hospitals in less wealthy, more rural areas of the state, and that over halfof CA counties at this time did not o�er Medicaid Managed Care plans. In addition, hospitals withless than a 10% Medicaid FFS share were excluded from analyses.
47

an appearance in the ED.
Descriptive statistics of Medicare and privately insured patients are presented in the
right four columns of Table 4. These patients are on average older than Medicaid
patients (due to the Medicare population), but there are no major changes in age over
time. Almost 60% of patients in both treated and control hospitals are female, and
similar to the Medicaid population, a higher proportion of patients in control hospitals
are white, likely attributable to geographic di�erences in treated and control hospitals.
In both treated and control hospitals, there is very little change in inpatient LOS.
There is a small increase in mean charges and a small decrease in the average number
of procedures in both treatment and control hospitals. Where the descriptive results
may point to a potential spillover e�ect of the policy, however, is in the likelihood of
receiving a c-section and the likelihood of admission to the hospital. Among privately
insured women, the percentage receiving a c-section in treated hospitals increases by
two percentage points, while no change was observed in control hospitals. Similarly,
the percentage of patients admitted to the hospital given an ED visit increases by
about two percentage points in treated hospitals following the policy change, while
remaining the same in control hospitals.
The descriptive statistics are suggestive of a spillover e�ect, but highlight the need
for regression analyses controlling for potential confounders.
3.4.2. Access to Care
The plots in Figure 4 present the di�erence-in-di�erences plots of access to care mea-
sures. The top pair of plots shows the trends in likelihood of hospital admission over
time among both Medicaid patients and Medicare/privately insured patients. Based
on the plots alone, it appears that after the Medicaid payment decrease, the likeli-
48

hood of hospital admission given an ED visit decreases for both Medicaid patients and
Medicare or privately insured patients in treated hospitals compared to control hos-
pitals. Table 5 presents the results of the di�erence-in-di�erences logistic regression
on the likelihood of hospital admission.21 The coe�cient on Post × FeeCut, pre-
sented as an odds ratio (OR), is the coe�cient of interest. The results show that in
response to the Medicaid reimbursement cut, the likelihood of admission falls slightly
among Medicaid patients (OR = 0.996), and increases slightly among Medicare and
privately insured patients (OR=1.013), but the coe�cients are not statistically signif-
icant. This suggests that it is unlikely that hospitals are systematically responding to
Medicaid reimbursement cuts by changing their criteria for hospital admission from
the ED. To address concerns that all ED visits may not be responsive to changes in
reimbursement, I also examine the results broken down by visits that were considered
�ED Care Needed� versus visits that were considered �Primary Care Treatable� or
�Non-Emergent.� One might expect that there would be little response to payment
changes among ED visits that are truly emergencies, but that there may be more
movement among visits that did not require emergency services. Table 6 presents
the results; even broken down by severity of ED visit, there is little movement in the
likelihood of admission for either Medicaid patients or Medicare/privately insured
patients.
The bottom plot in Figure 4 presents the di�erence-in-di�erences plot of hospital
proportion of Medicaid FFS patients over time; no clear pattern is evident. In the
regression analysis presented in Table 7, the coe�cient of interest is in the expected
direction (-0.01), but is not statistically signi�cant. However, these results may be
noisy given the relatively small sample of hospitals.
21Note that in all regression tables, coe�cients on individual diagnoses-level controls have beenomitted for brevity.
49

In both analyses, the results are in the expected direction, but are not statistically
signi�cant. The results of these analyses together suggest that access to care may not
su�er signi�cantly for Medicaid patients following a Medicaid reimbursement decrease
to hospitals. Further, there is no evidence of increased admissions of patients with
higher paying insurers.
3.4.3. Intensity of Care
To study the impact of the Medicaid payment cut on intensity of care, I study a
number of measures of inpatient intensity of care. The plots in Figure 5 illustrate
the existence of pre-policy parallel trends in outcomes. Table 8 presents the results
of the di�erence-in-di�erences analysis of the impact of the Medicaid payment cut
on inpatient length of stay. In both the Medicaid cohort as well as the cohort of
Medicare or privately insured patients, the coe�cient of interest is very small and not
statistically distinguishable from zero. This failure to reject the null implies that it is
unlikely that hospitals respond to Medicaid payment cuts by altering average length
of stay. This is perhaps not a surprising result in the context of this paper, given
that California is already known to have a relatively short length of stay on average,
compared to other states (California HealthCare Foundation, 2010). Table 9 similarly
shows little evidence of a primary or spillover e�ect of the Medicaid payment change on
hospital charges. Table 10 presents the results on the number of procedures associated
with each discharge. Similar to the other measures of intensity of care, the size of
the coe�cients on Post×FeeCut are very small, and not statistically di�erent from
zero for both the Medicaid and the Medicare/privately insured populations. These
results together would suggest that the hospitals in this study do not appear to react
strongly to Medicaid payment cuts on the margin of intensity of care.
Table 11 presents the results of the logistic regressions on the likelihood of childbirth
50
via cesarean section among the cohort of women admitted to the hospital for child-
birth. Similar to the other measures of intensity of care, there is little response to
the payment decrease on the likelihood of receiving a c-section among the Medicaid
population. However, the odds of a privately-insured woman receiving a c-section
increased by 12.5% (p<0.01). This implies a spillover e�ect of the Medicaid payment
decrease onto privately insured women, indicating that to make up losses from the
Medicaid population, hospitals may be increasing intensity of care to privately insured
patients. Although the results from the other measures of intensity of care were not
statistically signi�cant, the results from the birth analysis represent the most accurate
measure of intensity of care. It may also be the case that this increase in intensity
of care is only possible or feasible in certain inpatient settings, and when studying a
broad set of diagnoses as with the other measures of intensity of care, these e�ects are
obscured. Finally, it should be noted that for the other measures of intensity of care,
hospitals have no incentive to provide more services or more intense care (controlling
for the DRG) when paid prospectively, as they are paid by Medicare, and most pri-
vate insurers. Therefore, a lack of signi�cant �ndings for the Medicare and privately
insured population for the other measures of intensity is unsurprising. Hospitals do
however, generally get paid more for c-sections compared to vaginal deliveries.
3.4.4. Results from Matched Analysis
Table 12 presents a table of standardized di�erences in covariates prior to and follow-
ing the propensity score matching procedure on hospitals. Generally, standardized
di�erences of lower than 0.2 imply acceptable covariate balance. Standardized di�er-
ences below or around 0.2 are achieved for all covariates, and those that are slightly
above 0.2 are generally a strong improvement over the unmatched sample. Figure
6 plots the distributions of hospitals' propensity to be subject to the payment re-
51
duction among treated hospitals, among all control hospitals, and among matched
control hospitals. While the range of support for the treated hospitals is wider than
that of the potential control hospitals, it is clear that the matched control sample has
a much closer distribution of propensities than the overall group of control hospitals.
In general, the results from the matched analyses are similar to the results from
the unmatched di�erence-in-di�erences analyses, indicating that the di�erence-in-
di�erences setup was well designed to control for confounders. However, there are
some di�erences to note. First, in the analysis of likelihood of hospital admission, the
results of the matched analysis imply that as a result of the Medicaid payment cut,
hospitals are signi�cantly more likely to admit both Medicaid patients (OR=1.193,
p<0.001) and Medicare or privately insured patients (OR=1.054, p<0.01). Among
the intensity of care measures, length of stay and charges continue to have very small,
and statistically non-signi�cant e�ects (as in the unmatched di�erence-in-di�erences
analyses). However, in the matched analysis of number of procedures, the result
becomes slightly signi�cant for the Medicare/privately insured population, implying
that as a result of the Medicaid payment cut, Medicare or privately insured patients
saw a 1.8% increase in the number of procedures per admission (p<0.05). This e�ect
is small and only mildly signi�cant.
However, in the matched analysis, while privately insured women are still more likely
to receive a c-section in treated hospitals after the Medicaid payment change, the
result is no longer statistically signi�cant. Given that this is the only signi�cant
result in the main analyses, I conduct some further analyses to help determine the
true nature of the e�ect. If the likelihood of c-section truly increased, then there
should be corresponding increases in the length of stay and charges among the birth
population, since c-sections are on average associated with longer inpatient stays and
52
higher charges. Running these analyses on the original, unmatched sample, I �nd no
signi�cant changes in length of stay or charges among the birth cohort, leading to the
conclusion that any real changes in the likelihood were minimal at best.
3.4.5. Additional Analysis
Robustness Checks
1. I conduct sensitivity analyses to determine whether the results are robust to the
10% Medicaid FFS proportion cuto� that I introduce in my sample selection
procedure for hospitals. Varying this cuto� down to 5% and up to 15% does
not have any major impacts on the results.
2. I also run these analyses under other speci�cations, including using a quarter-
year �xed e�ect rather than a pre/post dummy, and using a hospital �xed e�ect
rather than a treated/control dummy. These alternate speci�cations also did
not alter the results substantially.
Subgroup Analysis of Uninsured Population
In my exploration of potential spillover e�ects of the Medicaid fee cut, I focus on
spillover e�ects onto Medicare and privately insured patients, who make up the largest
population of non-Medicaid patients. However, one might expect spillover e�ects, if
any, to be strongest among the uninsured population. Due to di�culty identifying
uninsured patients in the OSHPD data, I do not include them in the main analyses.
However, I do conduct analyses on the patient population identi�ed in the data as
having a payer type of �county indigent program,� �other indigent,� or �self-pay,� which
is the closest approximation of uninsurance. In these analyses, I �nd no signi�cant
impacts of the Medicaid fee cut on any of the measures of access to care or intensity of
53

care that I study in this chapter. However, it is di�cult to draw inferences from these
results, as it is not clear how accurately the uninsured population was identi�ed.
3.5. Policy Implications and Discussion
3.5.1. Policy Implications
Following the Balanced Budget Act of 1997, it has become increasingly common for
states to use provider payment cuts in an attempt to control Medicaid cost growth.
This is likely to become even more commonplace if recent trends continue. This
research �nds no evidence to support the economic intuition that in response to Med-
icaid payment cuts, Medicaid patients should see reductions to their access to care
or intensity of care in the hospital setting. This would suggest that from Medicaid's
perspective, in the face of state budgetary issues, hospital payment changes may be
preferable to broader changes in eligibility for Medicaid or generosity of coverage.
However, it may be the case that a larger reduction to payments may have had more
dramatic e�ects on patient treatment. Policymakers should also take into considera-
tion that the lack of hospital response to the Medicaid payment cut means that rather
than a reduction in both quantity and price, the reduction in price alone would lead
to a smaller reduction in spending from Medicaid's perspective.
Policymakers should also take into consideration other ways that hospitals may re-
spond to �nancial distress caused by payment cuts. In particular, �nancial distress
may be expressed in ways not studied in this dissertation. Cuts to hospital sta�,
cutting unpro�table services, or at the extreme, hospital closures could all occur in
response to �nancial distress caused by Medicaid payment reductions. This could
indirectly impact quality of care and access to care for Medicaid patients in the long
run, and future work should focus on studying these potential responses over a longer
54

time horizon.
3.5.2. Discussion
Despite the increasing use of provider payment cuts in e�orts to slow Medicaid cost
growth, prior to this work, little was known about how hospitals may respond to such
payment cuts. Contrary to model predictions and conventional economic thought,
as well as previous work on Medicare hospital payments (White, 2013), this research
�nds no evidence to support the notion that hospitals would reduce the quantity
of care supplied to Medicaid patients in response to a decrease in Medicaid prices.
However, I evidence suggestive of increased intensity of care to privately insured
patients in response to the Medicaid payment decrease, implying a spillover e�ect
by which hospitals seek to make up losses from lower Medicaid prices by increasing
services to higher-paying patients. These �ndings are suggestive that hospitals may
be unwilling to reduce the level of treatment or reduce access to care even in the face
of a large payment reduction for a given population, but may attempt to make up for
those losses by increasing intensity of care to higher-paying patients.
Although this paper does not �nd evidence that hospitals reduce access to care or
intensity of care to Medicaid patients in response to Medicaid payment cuts, this
�nding is consistent with prior research that �nds that hospitals lean toward admin-
istrative changes rather than changes to patient care in response to relative changes to
payments (Dafny, 2005). This could imply that in general, hospitals' roles as agents
for their patients lead them to seek other, non-care related ways to make up for losses
in payment. Furthermore, while the physicians in charge of individual patients' care
decisions may be less concerned with general hospital �nances, those making deci-
sions on general o�erings of services, the amount of uncompensated care provided, or
other administrative decisions are likely to be the same individuals concerned with
55
the hospital's �nancial status.
There may be several other explanations for the results found in this research. The
hospitals in this study may have had some capacity to bear payment reductions
without drastically changing patient treatment, so it is possible that the 10% payment
reduction studied in this research was not large enough to cause dramatic changes. In
the same vein, there may also be discontinuities in the response to payment reductions
whereby the magnitude of the response to the reductions studied in this research
were small, but could increase drastically with a small increase in the size of the
payment decrease. It is also important to note that this research speci�cally focused
on spillover e�ects to Medicare or privately insured patients, but it has been posited
in the literature that hospitals may respond to payment cuts by limiting the amount
of uncompensated care they provide (Morrisey, 1996; Altman et al., 2006). While
I attempt to address this issue, the data used for this research do not allow for
clear identi�cation of uncompensated care, and therefore making inferences based
on the results is di�cult. While some existing empirical work has failed to �nd
evidence of this hypothesized e�ect in the Medicare setting, future work should focus
on addressing this question in the Medicaid setting (Cutler, 1998).
It should also be noted that this research is not comprehensive in its study of the
potential responses of hospitals to Medicaid payment decreases; rather, this study
focused speci�cally on hospital response to Medicaid payment cuts along the patient
care margins of access or intensity of care. In general, hospital �nancial distress
caused by a Medicaid payment cut may be expressed in other ways, such as physician
time per patient, hospital sta�ng, or the purchase of new equipment. In particular,
prior work has found some evidence that hospitals may reduce their o�erings of less
pro�table or unpro�table services in response to negative �nancial shocks (Dranove
56

et al., 2013). At the extreme, hospital �nancial distress could also lead to hospital
closure. Especially among hospitals with larger proportions of Medicaid patients, this
could be a serious consideration for policymakers concerned with access to care for
Medicaid patients. Future research should explore these other potential responses.
Some limitations should be taken into account when considering the results of this
study. First, the study is focused on a subset of hospitals within California. A prob-
lem inherent to studying Medicaid is that Medicaid programs di�er from state to
state, and a study of one state's program may not be nationally generalizable. How-
ever, California has one of the largest Medicaid populations in the country, serving
16% of the non-elderly population in the state, and also has a demographically di-
verse Medicaid population. Furthermore, despite the limited generalizability of the
speci�c institutional details, this study still has important implications for how hos-
pitals may respond to Medicaid payment cuts. Finally, Medicaid has generally been
understudied by researchers, and this study can add to the very limited literature on
hospital response to changes in Medicaid payments. While the study includes a large
number of patients, the number of hospitals included was fairly limited. In order to
maintain strong internal validity, hospitals that mechanically would not have seen a
large impact of the Medicaid fee decrease were excluded from the study. Given the
lack of signi�cant changes to access to care or intensity of care among Medicaid pa-
tients, it was essential to focus on hospitals likely to see large impacts of the payment
decrease. It is also important to note that this study focused on a relatively short-
term response (i.e., within �ve quarters),22 and it could be that the major response
to payment reductions occurs in the long term. Some research has shown that at
least in the short term, hospitals do not have strong treatment-related responses to
22The length of the study period was chosen to avoid confounding with changes to the policy thatoccurred in late 2009.
57

reimbursement incentives (US GAO, 2015).
The major contribution of this research to the literature is to shed light on the way
hospitals respond to Medicaid payment decreases along patient care margins. Prior
to this work, very little research had addressed this issue. A number of papers have
studied hospital response to Medicare payment changes, or else physician response
to Medicaid payment changes, but prior work that has explicitly addressed hospital
response to Medicaid payment cuts is extremely limited. The challenges faced by
researchers in understanding the institutional details of Medicaid programs, and the
inherent issues with national generalizability have led to a general dearth of research
on the Medicaid program. Despite its limitations, this study provides valuable insight
into how hospitals may respond to Medicaid payment cuts.
58
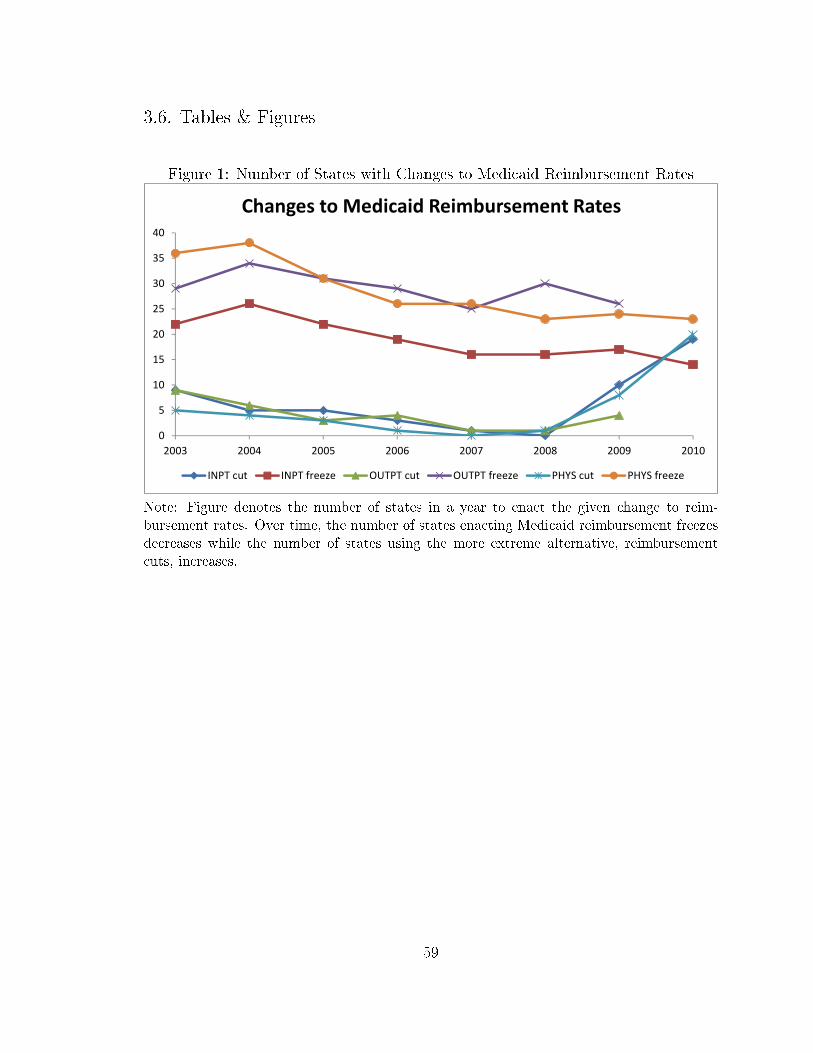
3.6. Tables & Figures
Figure 1: Number of States with Changes to Medicaid Reimbursement Rates
�
�
��
��
��
��
��
��
��
���� ���� ���� ���� ���� ��� ��� ����
������������ �� ���� ��������������
�� ����� �� �������� ��� ����� ��� �������� ������� ����������
Note: Figure denotes the number of states in a year to enact the given change to reim-bursement rates. Over time, the number of states enacting Medicaid reimbursement freezesdecreases while the number of states using the more extreme alternative, reimbursementcuts, increases.
59

Figure 2: Map of Hospitals by Fee Cut Status
0 150 30075 Miles
´
Not subject to fee cut
Subject to fee cut
Map 2
Note: Figure includes all hospitals subject to Medi-Cal fee decrease in 2008, includinghospitals in closed HFPAs.
60
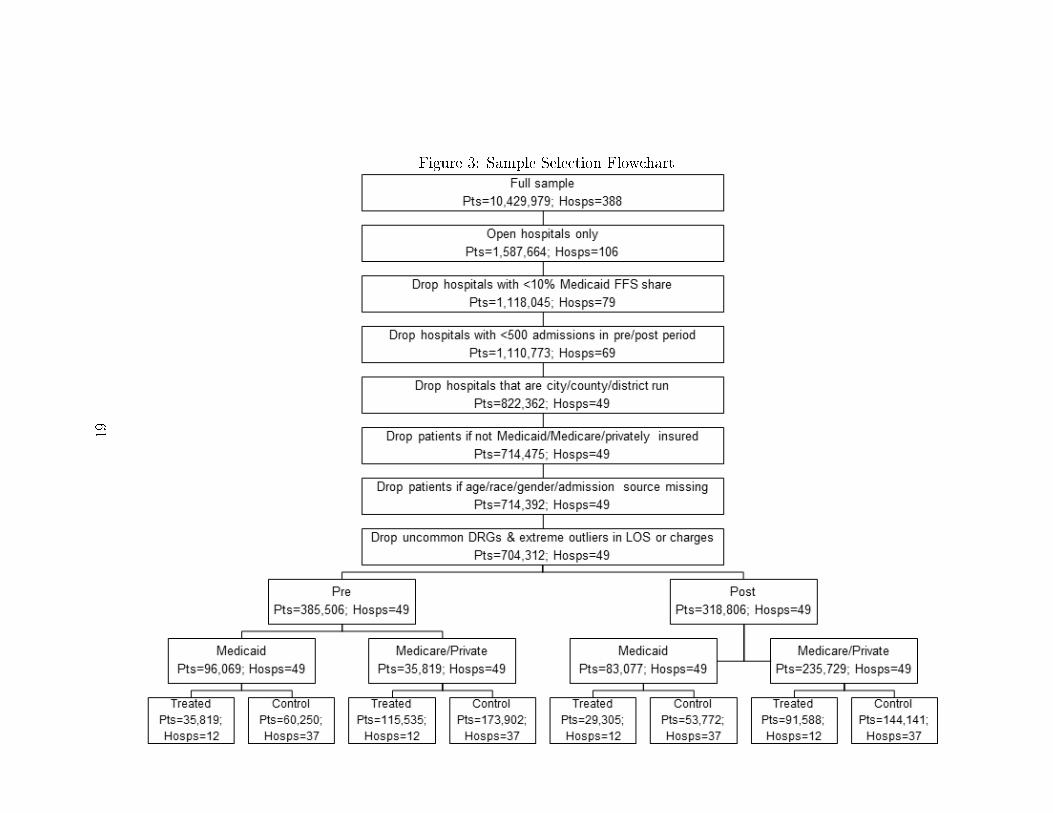
Figure 3: Sample Selection Flowchart
61

Table 3: Hospital Characteristics (2007)Treatment Control
N* 12 37
Average Total Discharges 9,073 4,262
Average Medi-Cal Discharges 1,660 788
Average Total Hospital Days 41,488 19,237
Average Medi-Cal Days 7,762 4,104
Average Percentage Medi-Cal FFS 24.24% 24.32%
Note: Characteristics of hospitals included in the analyses (see sample selection �owchartin Table 3).
62
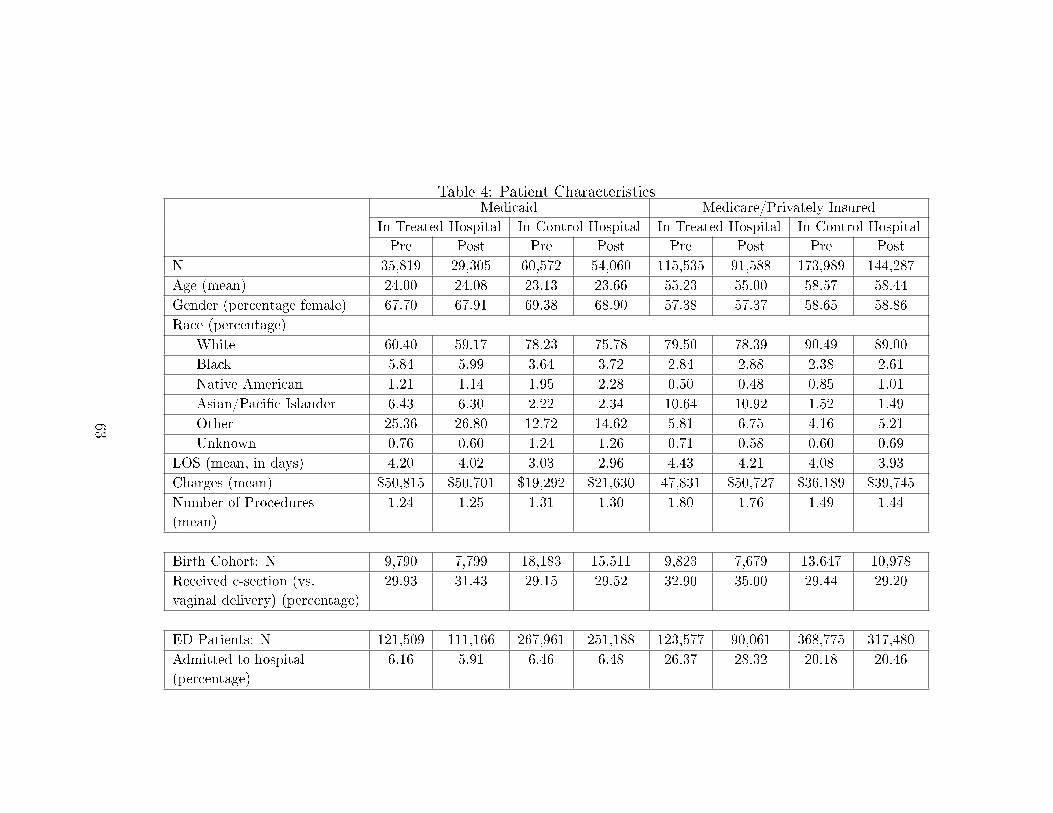
Table 4: Patient CharacteristicsMedicaid Medicare/Privately Insured
In Treated Hospital In Control Hospital In Treated Hospital In Control Hospital
Pre Post Pre Post Pre Post Pre Post
N 35,819 29,305 60,572 54,060 115,535 91,588 173,989 144,287
Age (mean) 24.00 24.08 23.13 23.66 55.23 55.00 58.57 58.44
Gender (percentage female) 67.70 67.91 69.38 68.90 57.38 57.37 58.65 58.86
Race (percentage)
White 60.40 59.17 78.23 75.78 79.50 78.39 90.49 89.00
Black 5.84 5.99 3.64 3.72 2.84 2.88 2.38 2.61
Native American 1.21 1.14 1.95 2.28 0.50 0.48 0.85 1.01
Asian/Paci�c Islander 6.43 6.30 2.22 2.34 10.64 10.92 1.52 1.49
Other 25.36 26.80 12.72 14.62 5.81 6.75 4.16 5.21
Unknown 0.76 0.60 1.24 1.26 0.71 0.58 0.60 0.69
LOS (mean, in days) 4.20 4.02 3.03 2.96 4.43 4.21 4.08 3.93
Charges (mean) $50,815 $50,701 $19,292 $21,630 47,831 $50,727 $36,189 $39,745
Number of Procedures
(mean)
1.24 1.25 1.31 1.30 1.80 1.76 1.49 1.44
Birth Cohort: N 9,790 7,799 18,183 15,511 9,823 7,679 13,647 10,978
Received c-section (vs.
vaginal delivery) (percentage)
29.93 31.43 29.15 29.52 32.90 35.00 29.44 29.20
ED Patients: N 121,509 111,166 267,961 251,188 123,577 90,061 368,775 317,480
Admitted to hospital
(percentage)
6.16 5.91 6.46 6.48 26.37 28.32 20.18 20.46
63

Figure 4: Di�erence-in-Di�erences Plots: Access to Care Measures
-10
12
3M
edic
aid
07Q1 07Q3 08Q1 08Q3 09Q1 09Q3
-10
12
Med
icar
e/Pr
ivat
ely
Insu
red
07Q1 07Q3 08Q1 08Q3 09Q1 09Q3
Likelihood of Hospital Admission
Treated hospitals Control hospitals
-.10
.1.2
07Q1 07Q3 08Q1 08Q3 09Q1 09Q3
Treated hospitals Control hospitals
Proportion of Hospital's Patients with Medicaid FFS
Note: Figures are plotted quarterly regression coe�cients.
64
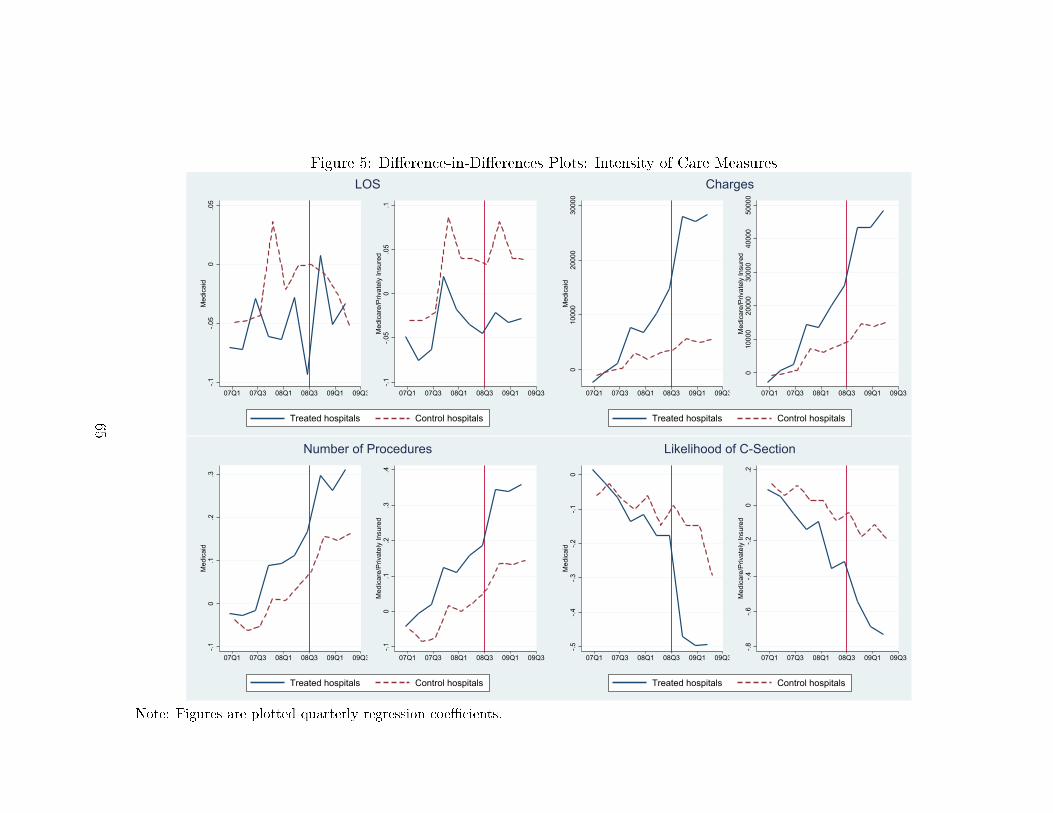
Figure 5: Di�erence-in-Di�erences Plots: Intensity of Care Measures
-.1-.0
50
.05
Med
icai
d
07Q1 07Q3 08Q1 08Q3 09Q1 09Q3-.1
-.05
0.0
5.1
Med
icar
e/Pr
ivat
ely
Insu
red
07Q1 07Q3 08Q1 08Q3 09Q1 09Q3
LOS
Treated hospitals Control hospitals
010
000
2000
030
000
Med
icai
d
07Q1 07Q3 08Q1 08Q3 09Q1 09Q3
010
000
2000
030
000
4000
050
000
Med
icar
e/Pr
ivat
ely
Insu
red
07Q1 07Q3 08Q1 08Q3 09Q1 09Q3
Charges
Treated hospitals Control hospitals
-.10
.1.2
.3M
edic
aid
07Q1 07Q3 08Q1 08Q3 09Q1 09Q3
-.10
.1.2
.3.4
Med
icar
e/Pr
ivat
ely
Insu
red
07Q1 07Q3 08Q1 08Q3 09Q1 09Q3
Number of Procedures
Treated hospitals Control hospitals
-.5-.4
-.3-.2
-.10
Med
icai
d
07Q1 07Q3 08Q1 08Q3 09Q1 09Q3
-.8-.6
-.4-.2
0.2
Med
icar
e/Pr
ivat
ely
Insu
red
07Q1 07Q3 08Q1 08Q3 09Q1 09Q3
Likelihood of C-Section
Treated hospitals Control hospitals
Note: Figures are plotted quarterly regression coe�cients.
65

Measures of Access to Care
Note: In all regression analyses Post× FeeCut is the coe�cient of interest.
Table 5: Likelihood of AdmissionMedicaid Medicare/Private
OR SE OR SEAdmitted to HospitalFee Cut 1.756 (0.574) 2.026∗∗ (0.504)Post 2.455∗∗ (0.696) 1.720∗∗ (0.328)Post X Fee Cut 0.996 (0.104) 1.013 (0.105)Male 1 (.) 1 (.)Female 0.980 (0.0387) 0.926∗∗∗ (0.0179)White 1 (.) 1 (.)Black 1.015 (0.136) 0.957 (0.115)Native American/Eskimo/Aleut 0.966 (0.0918) 0.881 (0.138)Asian/Paci�c Islander 0.977 (0.122) 0.844 (0.0970)Other 0.494∗ (0.161) 0.486∗ (0.163)Unknown 0.728 (0.219) 0.754 (0.208)Investor 1 (.) 1 (.)Non Pro�t 1.222 (0.394) 1.113 (0.311)County Medicaid FFS Proportion 0.244 (0.286) 0.729 (0.697)County Unemployment 0.890∗ (0.0478) 0.947 (0.0333)County Average Income 1.000 (0.0000211) 1.000 (0.0000186)Observations 740363 899790
Exponentiated coe�cients; Standard errors in parentheses∗ p < 0.05, ∗∗ p < 0.01, ∗∗∗ p < 0.001
Standard errors are clustered at the hospital level
OR - "Odds Ratio," SE - "Standard Error"
66

Table 6: Likelihood of Admission by ED Visit Severity
ED Not Needed ED NeededMedicaid Medicare/Private Medicaid Medicare/Private
OR SE OR SE OR SE OR SEAdmitted to HospitalFee Cut 1.766 (0.648) 1.874∗ (0.561) 1.691 (0.603) 1.810∗ (0.529)Post 2.411∗ (0.829) 1.681∗ (0.394) 2.248∗ (0.717) 1.585∗ (0.343)Post X Fee Cut 1.092 (0.117) 1.090 (0.130) 1.090 (0.124) 1.092 (0.114)Male 1 (.) 1 (.) 1 (.) 1 (.)Female 1.019 (0.0592) 0.908∗∗∗ (0.0228) 1.000 (0.0444) 0.923∗∗∗ (0.0194)White 1 (.) 1 (.) 1 (.) 1 (.)Black 1.073 (0.157) 0.990 (0.127) 1.114 (0.173) 0.990 (0.123)Native American/Eskimo/Aleut 0.996 (0.129) 0.851 (0.137) 0.997 (0.130) 0.832 (0.140)Asian/Paci�c Islander 0.679∗∗ (0.0866) 0.771 (0.104) 0.769 (0.109) 0.794 (0.102)Other 0.468∗ (0.153) 0.471∗ (0.158) 0.464∗ (0.155) 0.475∗ (0.162)Unknown 0.616 (0.196) 0.745 (0.204) 0.618 (0.197) 0.743 (0.199)Investor 1 (.) 1 (.) 1 (.) 1 (.)Non Pro�t 1.226 (0.422) 1.037 (0.336) 1.164 (0.407) 1.014 (0.330)County Medicaid FFS Proportion 0.248 (0.337) 0.656 (0.705) 0.229 (0.298) 0.654 (0.695)County Unemployment 0.896 (0.0567) 0.952 (0.0403) 0.903 (0.0533) 0.961 (0.0383)County Average Income 1.000 (0.0000225) 1.000 (0.0000208) 1.000 (0.0000217) 1.000 (0.0000199)Observations 456939 473703 409709 477053
Exponentiated coe�cients; Standard errors in parentheses∗ p < 0.05, ∗∗ p < 0.01, ∗∗∗ p < 0.001
Standard errors are clustered at the hospital level
OR - "Odds Ratio," SE - "Standard Error"
67
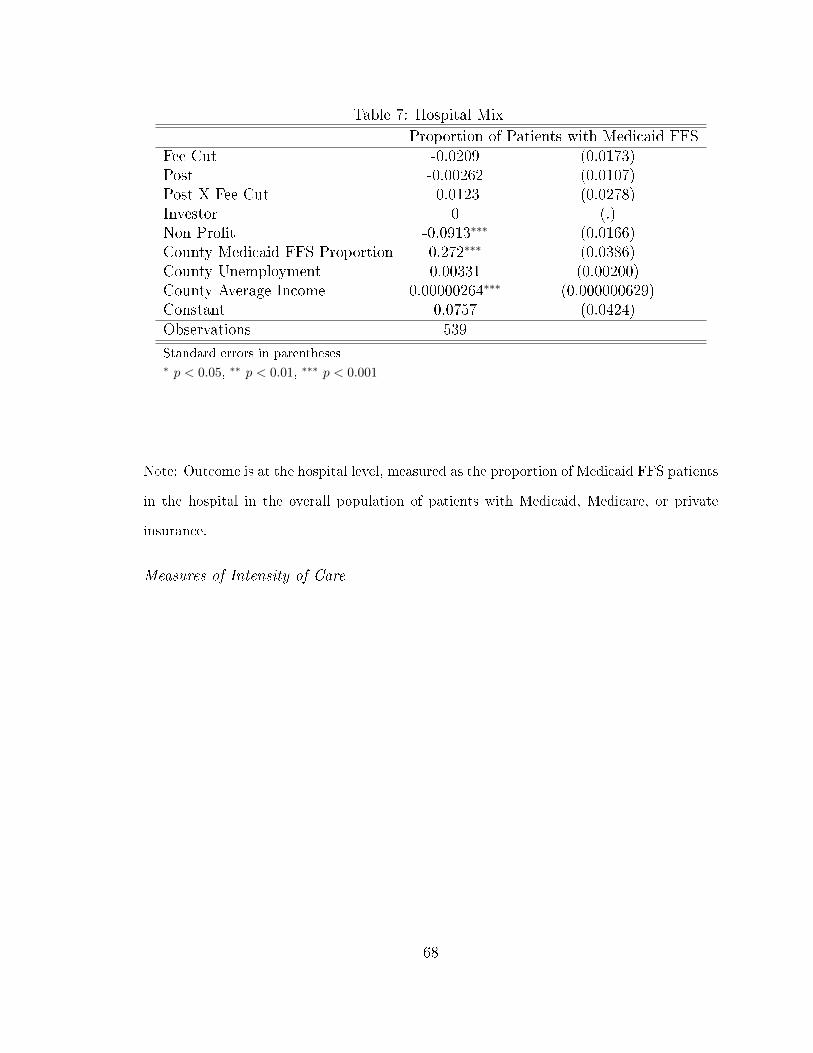
Table 7: Hospital Mix
Proportion of Patients with Medicaid FFSFee Cut -0.0209 (0.0173)Post -0.00262 (0.0107)Post X Fee Cut -0.0123 (0.0278)Investor 0 (.)Non Pro�t -0.0913∗∗∗ (0.0166)County Medicaid FFS Proportion 0.272∗∗∗ (0.0386)County Unemployment 0.00331 (0.00200)County Average Income 0.00000264∗∗∗ (0.000000629)Constant 0.0757 (0.0424)Observations 539
Standard errors in parentheses∗ p < 0.05, ∗∗ p < 0.01, ∗∗∗ p < 0.001
Note: Outcome is at the hospital level, measured as the proportion of Medicaid FFS patients
in the hospital in the overall population of patients with Medicaid, Medicare, or private
insurance.
Measures of Intensity of Care
68
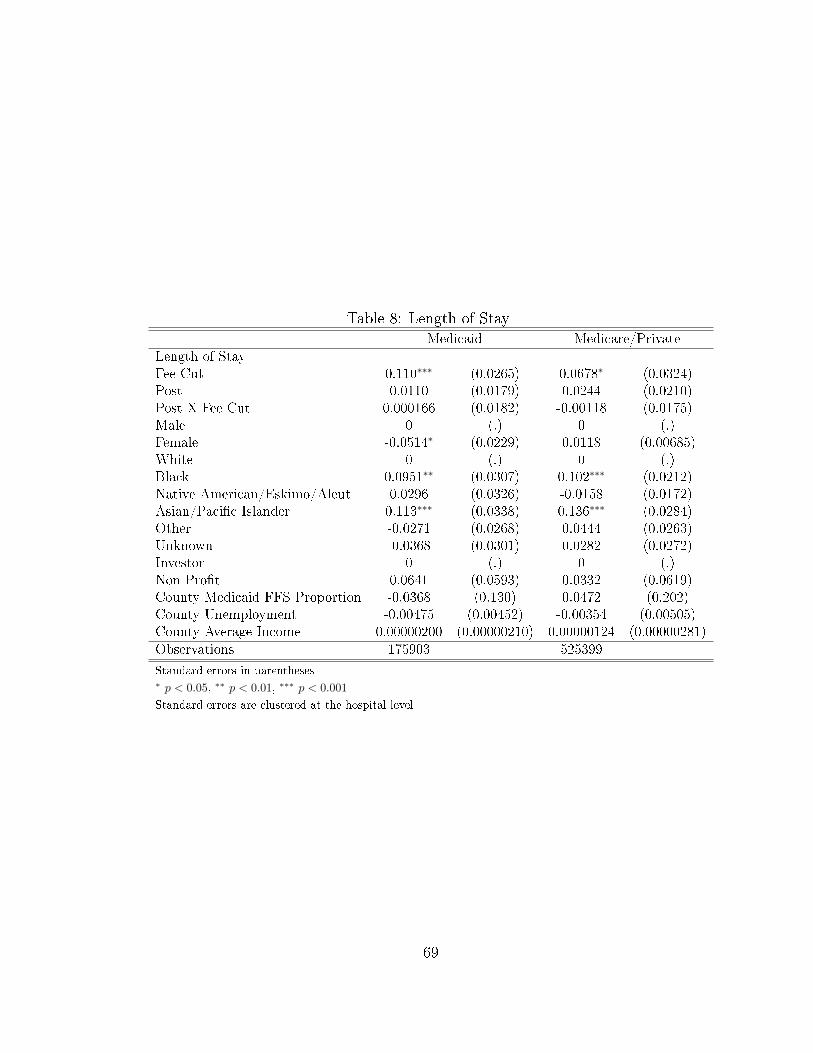
Table 8: Length of StayMedicaid Medicare/Private
Length of StayFee Cut 0.110∗∗∗ (0.0265) 0.0678∗ (0.0324)Post 0.0110 (0.0179) 0.0244 (0.0210)Post X Fee Cut 0.000166 (0.0182) -0.00118 (0.0175)Male 0 (.) 0 (.)Female -0.0514∗ (0.0229) 0.0118 (0.00685)White 0 (.) 0 (.)Black 0.0951∗∗ (0.0307) 0.102∗∗∗ (0.0212)Native American/Eskimo/Aleut 0.0296 (0.0326) -0.0158 (0.0172)Asian/Paci�c Islander 0.113∗∗∗ (0.0338) 0.136∗∗∗ (0.0284)Other -0.0271 (0.0268) 0.0444 (0.0263)Unknown -0.0368 (0.0301) 0.0282 (0.0272)Investor 0 (.) 0 (.)Non Pro�t 0.0641 (0.0593) 0.0332 (0.0619)County Medicaid FFS Proportion -0.0368 (0.130) 0.0472 (0.202)County Unemployment -0.00475 (0.00452) -0.00354 (0.00505)County Average Income 0.00000200 (0.00000210) 0.00000124 (0.00000281)Observations 175903 525399
Standard errors in parentheses∗ p < 0.05, ∗∗ p < 0.01, ∗∗∗ p < 0.001
Standard errors are clustered at the hospital level
69

Table 9: Charges
Medicaid Medicare/PrivateFee Cut 2755.9 (2127.9) 2460.5 (3363.1)Post 2670.7∗∗ (860.0) 6517.2∗∗ (1903.8)Post X Fee Cut -619.3 (1025.0) -232.5 (1460.3)Male 0 (.) 0 (.)Female -1277.6∗∗ (401.9) -1164.0∗∗∗ (258.7)White 0 (.) 0 (.)Black -184.3 (1223.0) -171.7 (1391.7)Native American/Eskimo/Aleut -1514.1 (1040.8) -1486.3 (1488.9)Asian/Paci�c Islander -601.2 (1806.0) -1251.6 (3199.0)Other -535.3 (1280.7) -950.0 (2032.0)Unknown -889.8 (890.3) 1180.1 (1606.9)Investor 0 (.) 0 (.)Non Pro�t 257.4 (2743.2) -5004.8 (5478.1)County Medicaid FFS Proportion 8317.1 (6702.4) 15346.3 (13198.0)County Unemployment -151.8 (209.1) -508.1 (460.9)County Average Income 0.161 (0.122) 0.290 (0.204)Observations 175903 525399
Standard errors in parentheses∗ p < 0.05, ∗∗ p < 0.01, ∗∗∗ p < 0.001
Standard errors are clustered at the hospital level
70

Table 10: Number of ProceduresMedicaid Medicare/Private
Number of ProceduresFee Cut -0.0104 (0.0703) 0.0152 (0.0564)Post 0.0543 (0.0373) 0.0632∗ (0.0306)Post X Fee Cut 0.00459 (0.0415) 0.0286 (0.0380)Male 0 (.) 0 (.)Female -0.0493∗∗ (0.0166) -0.0388∗∗∗ (0.00731)White 0 (.) 0 (.)Black -0.0660 (0.0359) -0.0188 (0.0297)Native American/Eskimo/Aleut 0.00706 (0.0310) 0.0984∗ (0.0393)Asian/Paci�c Islander 0.129∗ (0.0641) 0.125∗∗ (0.0409)Other -0.0376 (0.0524) -0.0249 (0.0336)Unknown -0.0474 (0.0459) 0.0390 (0.0351)Investor 0 (.) 0 (.)Non Pro�t -0.0913 (0.112) -0.0487 (0.0642)County Medicaid FFS Proportion 0.157 (0.225) 0.302 (0.207)County Unemployment -0.00961 (0.0100) -0.0186 (0.00973)County Average Income 3.78e-08 (0.00000361) -0.000000378 (0.00000258)Observations 175903 525399
Standard errors in parentheses∗ p < 0.05, ∗∗ p < 0.01, ∗∗∗ p < 0.001
Standard errors are clustered at the hospital level
Table 11: Likelihood of C-Section Among Birth Cohort
Medicaid Privately InsuredOdds Ratio Std. Error Odds Ratio Std. Error
csectionFee Cut 0.977 (0.148) 0.981 (0.0996)Post 0.879 (0.0705) 0.856∗ (0.0625)Post X Fee Cut 1.054 (0.0569) 1.125∗∗ (0.0473)White 1 (0) 1 (0)Black 1.154∗ (0.0731) 1.214∗ (0.106)Native American/Eskimo/Aleut 0.982 (0.0948) 1.409∗∗∗ (0.140)Asian/Paci�c Islander 0.586∗∗∗ (0.0543) 0.787 (0.0971)Other 0.882 (0.0632) 1.159 (0.107)Unknown 0.974 (0.115) 1.062 (0.131)Observations 51283 42127
Exponentiated coe�cients; Standard errors in parentheses∗ p < 0.05, ∗∗ p < 0.01, ∗∗∗ p < 0.001
Standard errors are clustered at the hospital level
71

Results from Matched Analysis
Figure 6: Hospitals' Propensity to Be Subject to Payment Cut (Distributions)
−0.5 0.0 0.5 1.0 1.5
0.0
0.2
0.4
0.6
0.8
1.0
Treated
N = 11 Bandwidth = 0.176
Den
sity
−0.5 0.0 0.5 1.0 1.5
0.0
0.5
1.0
1.5
2.0
Matched Controls
N = 11 Bandwidth = 0.09654
Den
sity
−0.5 0.0 0.5 1.0 1.5
02
46
8
All Controls
N = 67 Bandwidth = 0.02424
Den
sity
72
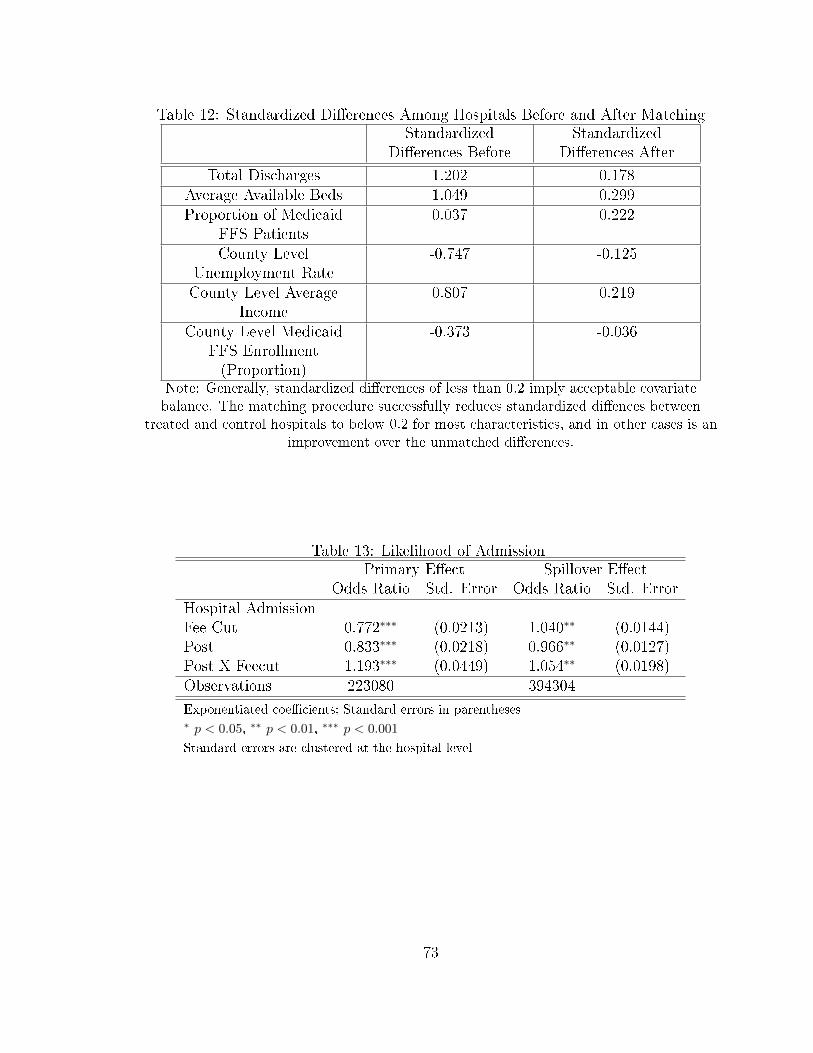
Table 12: Standardized Di�erences Among Hospitals Before and After MatchingStandardized
Di�erences BeforeStandardized
Di�erences After
Total Discharges 1.202 0.178Average Available Beds 1.049 0.299Proportion of Medicaid
FFS Patients0.037 0.222
County LevelUnemployment Rate
-0.747 -0.125
County Level AverageIncome
0.807 0.219
County Level MedicaidFFS Enrollment(Proportion)
-0.373 -0.036
Note: Generally, standardized di�erences of less than 0.2 imply acceptable covariatebalance. The matching procedure successfully reduces standardized di�ences between
treated and control hospitals to below 0.2 for most characteristics, and in other cases is animprovement over the unmatched di�erences.
Table 13: Likelihood of AdmissionPrimary E�ect Spillover E�ect
Odds Ratio Std. Error Odds Ratio Std. ErrorHospital AdmissionFee Cut 0.772∗∗∗ (0.0213) 1.040∗∗ (0.0144)Post 0.833∗∗∗ (0.0218) 0.966∗∗ (0.0127)Post X Feecut 1.193∗∗∗ (0.0449) 1.054∗∗ (0.0198)Observations 223080 394304
Exponentiated coe�cients; Standard errors in parentheses∗ p < 0.05, ∗∗ p < 0.01, ∗∗∗ p < 0.001
Standard errors are clustered at the hospital level
73
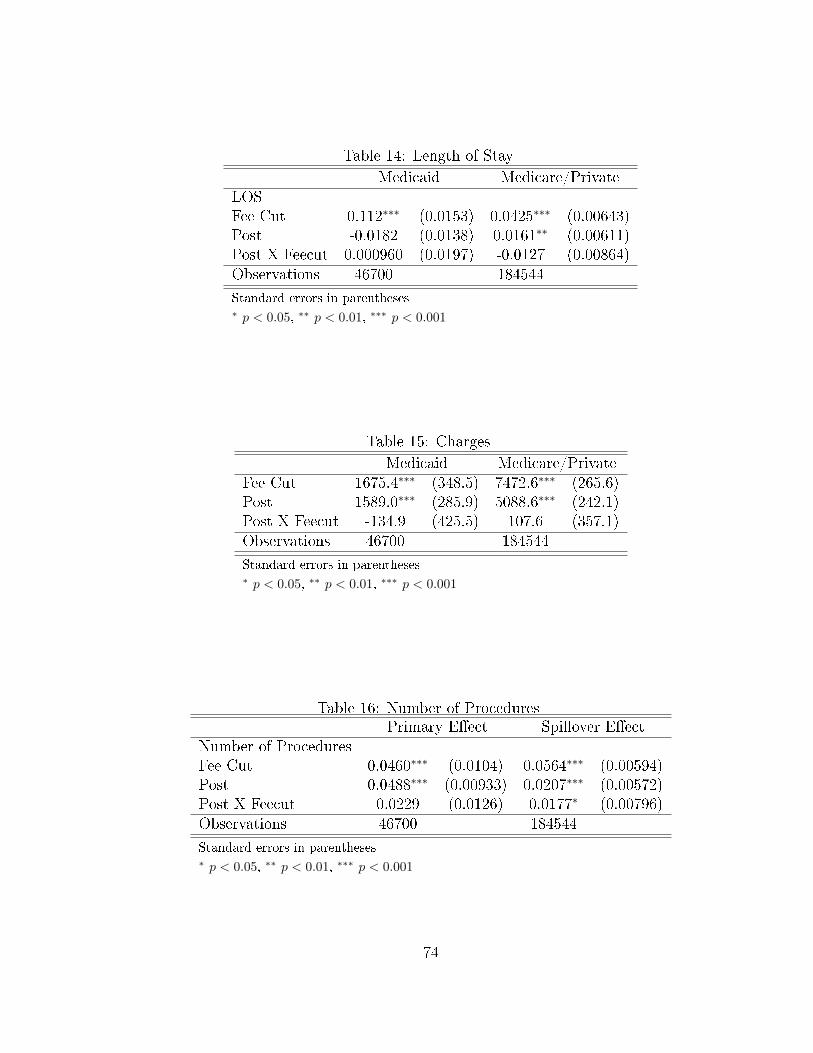
Table 14: Length of Stay
Medicaid Medicare/PrivateLOSFee Cut 0.112∗∗∗ (0.0153) 0.0425∗∗∗ (0.00643)Post -0.0182 (0.0138) 0.0161∗∗ (0.00611)Post X Feecut 0.000960 (0.0197) -0.0127 (0.00864)Observations 46700 184544
Standard errors in parentheses∗ p < 0.05, ∗∗ p < 0.01, ∗∗∗ p < 0.001
Table 15: Charges
Medicaid Medicare/PrivateFee Cut 1675.4∗∗∗ (348.5) 7472.6∗∗∗ (265.6)Post 1589.0∗∗∗ (285.9) 5088.6∗∗∗ (242.1)Post X Feecut -134.9 (425.5) 107.6 (357.1)Observations 46700 184544
Standard errors in parentheses∗ p < 0.05, ∗∗ p < 0.01, ∗∗∗ p < 0.001
Table 16: Number of ProceduresPrimary E�ect Spillover E�ect
Number of ProceduresFee Cut 0.0460∗∗∗ (0.0104) 0.0564∗∗∗ (0.00594)Post 0.0488∗∗∗ (0.00933) 0.0207∗∗∗ (0.00572)Post X Feecut 0.0229 (0.0126) 0.0177∗ (0.00796)Observations 46700 184544
Standard errors in parentheses∗ p < 0.05, ∗∗ p < 0.01, ∗∗∗ p < 0.001
74

Table 17: Likelihood of C-Section Among Birth Cohort
Medicaid PrivateOdds Ratio Std. Error Odds Ratio Std. Error
C-SectionFee Cut 1.159∗∗ (0.0535) 1.102∗ (0.0450)Post 1.030 (0.0477) 1.046 (0.0428)Post X Feecut 0.966 (0.0625) 1.044 (0.0593)Observations 18448 22668
Exponentiated coe�cients; Standard errors in parentheses∗ p < 0.05, ∗∗ p < 0.01, ∗∗∗ p < 0.001
75

CHAPTER 4 : The E�ect of Medicaid Payment Incentives on Patient
Care in California Hospitals
4.1. Introduction
Insurance providers may make use of a variety of �nancial incentives in order to
encourage both health care providers and consumers to take costs into consideration
when making decisions. For state Medicaid programs, where demand-side incentives
are less common, changing incentives to health care providers is becoming increasingly
common. One of the most commonly used reimbursement-based incentives in hospital
payments has been the use of DRG-based prospective payments. Medicare, as well as
a number of state Medicaid programs, switched their hospital reimbursement systems
from fee-for-service based systems to DRG-based systems in the 1980s, with the basic
concept being that a DRG-based payment system shifted some of the risk onto the
provider (rather than on the insurer alone), and gave providers incentives to lower
costs.
This chapter studies how hospitals may respond to a shift in reimbursement method-
ology to a prospective, DRG-based payment system. I study California Medicaid's
2013 shift to DRG-based payments. Prior to this shift, some hospitals were paid on
a fee-for-service basis, while others were paid on a per-diem basis. The shift to a
DRG-based payment system represents a change in incentives for hospitals. Ex ante,
I expect the strongest e�ects to occur where there is a clear reversal in incentive from
the prior payment method.
I use a comprehensive hospital and emergency department discharge data set for the
years 2012-2014 from the California O�ce of Statewide Health Planning and Devel-
76
opment (OSHPD). Using a di�erence-in-di�erences approach, I measure the impact
of the 2013 shift to DRG-based payments by Medicaid on access to care, intensity
of care, and complications of care for Medicaid patients. For identi�cation, I take
advantage of the fact that the new payment system was implemented six months
earlier in private hospitals than in public hospitals. To test for spillover e�ects onto
non-Medicaid patients, I also evaluate the impact of the introduction of Medicaid
DRG payments on access to care, treatment intensity, and complications of care for
Medicare, privately insured, and uninsured patients. To address concerns that treated
and control hospitals may be di�erent from one another, I conduct sensitivity anal-
yses of the same outcomes among private hospitals only, using the lagged Medicaid
proportion of hospitalized patients at the county level for identi�cation. These anal-
yses provide a number of insights into hospitals' responses to changes in Medicaid
payment methodology.
I �nd that the major response of hospitals to the implementation of DRG payments
is a reduction in the average inpatient length of stay. Furthermore, this reduction
is driven primarily by hospitals previously reimbursed on a per diem basis. This
implies that hospitals respond strongly to clear changes in incentives. Paid on a per
diem basis, hospitals have an incentive to increase LOS; this incentive is reversed
under a DRG payment system. There are no signi�cant changes in treatment or
access to care for non-Medicaid patients. Medicaid policymakers should take note
that hospitals still respond to strong incentives; despite California having relatively
low LOS on average compared to the rest of the country, hospitals reduced LOS in
response to DRG payments.
77
4.2. Empirical Approach
4.2.1. Outcome Measures
1. Access to care is measured in two ways:
(a) First, the likelihood of admission is de�ned as the likelihood of inpatient
admission to the hospital following a visit to the same hospital's emergency
department.
(b) Second, hospital-level insurance mix is de�ned at the hospital level as the
proportion of Medicaid FFS patients divided by the total population of
patients.
2. Intensity of care is measured in a number of ways:
(a) First, it is measured as the length of stay (LOS), which is included in each
hospital discharge record.
(b) Second, it is measured as the total charges associated with the discharge,
with the assumption that higher charges generally imply more intense care.
(c) A third measure of intensity of care is measured as the number of procedures
associated with the discharge (under the assumption that a greater number
of procedures generally implies more intense care).
(d) Finally, I also conduct analyses among a subset of patients for whom de�n-
ing intensity of care is much more straightforward�women admitted to the
hospital for childbirth. Childbirth is an ideal setting to study intensity of
care, since there are essentially only two options for care (vaginal deliv-
ery or delivery via cesarean section), and one (and only one) of those is
78
associated with every delivery. Furthermore, childbirth is commonly used
in the literature to study intensity of care because as previous work has
noted, the underlying costs in terms of physician time are considered sim-
ilar between cesarean section and vaginal delivery, but cesarean section is
typically reimbursed at a higher rate (Gruber et al., 1999). Finally, child-
birth is particularly useful to study in the context of this paper since it is
a very common reason for hospital admissions among the Medicaid pop-
ulation. Therefore, among the cohort of women admitted to the hospital
for childbirth, I also measure the likelihood of receiving a cesarean section.
3. Complications of care may be coded for two reasons: actual complications
occurring; or, an administrative response by hospitals known as �upcoding,�
whereby hospitals may code patients as being more �severe� in order to extract
higher DRG payments (Dafny, 2005). While I cannot distinguish between those
two possibilities in the data, an increase in complications of care among Medi-
caid patients could imply either poorer quality of care, or an upcoding response.
Therefore, among the cohort of women admitted to the hospital for childbirth, I
examine the proportion of patients coded as having births �with complications�
versus �without complications.�
4.2.2. Identi�cation Strategy
To identify the e�ects of the shift to DRG-based payments, I include in my sample all
private and non-designated public hospitals in California, as these hospitals all became
subject to DRG-based payments by Medicaid either on July 1, 2013, or on January 1,
2014. The basic identi�cation strategy is based on the staggered implementation of
the DRG payment methodology; private hospitals were switched to DRG payments in
July 2013, while NDP hospitals were switched in January 2014. This provides a six-
79
month study period (July 2013 to December 2013) during which I compare outcomes
among private hospitals (the treated group) to outcomes among NDP hospitals (the
control group).
To address concerns that private and NDP hospitals may di�er on unobservable char-
acteristics, as a sensitivity analysis, I also conduct all analyses among private hos-
pitals only. However, this presents an issue, as the source of identi�cation from the
primary analyses is no longer available. Therefore, I instead use the proportion of
hospitalized patients covered by Medicaid FFS in 2012 at the county level to provide
variation. In these analyses, I make the assumption that hospitals in counties with
a smaller proportion of Medicaid FFS patients should have a smaller response to the
implementation of DRG payments.
4.2.3. Sample Selection
A sample selection �owchart is provided in Figure 7. The sample of hospitals was
limited to private or NDP hospitals only, with private hospitals making up the treated
group and NDP hospitals making up the controls. In addition, I exclude hospitals
from the sample that were previously non-contract hospitals in closed HFPAs. These
hospitals are excluded because prior to the switch to DRG-based payments, they
were by de�nition treating only very small numbers of Medicaid FFS patients. This
restriction was no longer in places once DRG payments were introduced, so I exclude
these hospitals because I cannot separately identify the e�ect of DRG payments versus
the e�ect of the removal on the restriction of the treament of Medicaid FFS patients.
In addition, to ensure that the hospitals in the study are su�ciently exposed to the
policy change, I limit the sample of hospitals to those with at least a ten percent
80
share of Medicaid FFS patients in the pre-period.23 Additionally, I drop hospitals
with fewer than 500 admissions in either the pre- or post-periods, and hospitals that
were run by a city, county, or district.24 One concern with these analyses is the issue of
how to handle Medicaid managed care plans, which a number of counties in California
mandate for subsets of their Medicaid population. To address this issue, I exclude
from my sample of hospitals any hospital in a county with changes to its o�erings
of managed care plans or requirements during the study period. Di�erences between
counties that remained consistent throughout the study period are controlled for in the
di�erence-in-di�erences setup. This resulted in a �nal sample of 122 treated hospitals
and 12 control hospitals. For sample selection of patients, only patients insured by
Medicaid FFS, Medicare, or private insurance were included in the sample. Patients
for whom certain variables (age, race, or gender) were missing were excluded from
the analysis. Finally, patients with very uncommon conditions or who were extreme
outliers in LOS or charges were excluded from analysis as well, leading to a �nal
sample of 2,130,768 patients.
One concern with the analyses studying the likelihood of hospital admission for pa-
tients appearing in the ED, is that it may be unlikely to see a response across all
reasons for ED visit. For example, in the case of an immediate life-threatening emer-
gency, it is unlikely (and illegal) for hospitals to refuse to treat a patient based on
insurance status (CMS, 2012). Therefore, in addition to looking at overall ED visits,
I also examine ED visits broken down into visits considered to require emergency
care, versus those that are primary care treatable or non-emergent, using an ED clas-
si�cation algorithm developed by researchers at New York University (Billings et al.,
2000). The algorithm provides a percentage of cases for a given diagnosis that are
23Sensitivity analyses around this cuto� were conducted, and did not change the results of thestudy.
24These hospitals were dropped because they only appeared among the control group.
81
considered non-emergent (ED care not needed), emergent but primary care treatable
(ED care not needed), emergent but preventable (ED care needed), and emergent and
not preventable (ED care needed). I break up the sample into ED visits with a non-
zero proportion of �ED care not needed� versus those with a non-zero proportion of
�ED care needed.�25
4.2.4. Di�erence-in-Di�erences Analysis
I utilize patient discharge data and emergency department data from quarter 1 of 2012
to quarter 4 of 2013. The change to DRG based payments took e�ect in July 2013 for
private hospitals, and in January 2014 for NDP hospitals, so this provides six quarters
of pre-data and two quarters of post-data. While the post period is relatively short, its
length is necessary given the change in payment methodology for the control hospitals
in January 2014. In addition, given the major change in reimbursement methodology,
I expect that changes in outcomes may occur very quickly following the policy change.
I use a di�erence-in-di�erences approach to compare outcomes in hospitals that were
subject to DRG payments versus those that were not, prior to and following its July
2013 implementation. The regression is speci�ed as follows:
Yijtk = β0 + β1 · Postt + β2 · Treatedj + β3 (Post× Treated)tj +
β4 ·Xi + β5 · Zj + β6 ·Wk + ε (4.1)
where Y is the outcome of interest. Post indicates the admission occurred at time
25These are not mutually exclusive categories. However, this is the broadest way to classify thedata without introducing arbitrary cuto� points.
82

t following DRG implementation, Treated indicates that hospital j was subject to
DRG payments in July 2013, and Post×Treated is the interaction of the two. X is a
vector of patient-level covariates for patient i, Z is a vector of hospital level covariates,
and W is a vector of county-level covariates for county k. Patient level demographics
include age, gender, ethnicity (Hispanic or non-Hispanic), and race. Additionally, pa-
tient health characteristics associated with the admission are included. Hospital level
covariates include the pro�t status of the hospital (for pro�t vs. not-for-pro�t), the
2012 Medicaid FFS proportion of patients, and the hospital's prior status as a con-
tract or non-contract hospital. County level characteristics include the unemployment
rate and average income levels, as well as a county-level �xed e�ect. For continuous
outcomes (i.e., charges), the equation is estimated via linear regression. For count
outcomes (i.e., length of stay, number of procedures), the equation is estimated using
Poisson regression. Finally, to estimate event likelihood (i.e., likelihood of admission,
likelihood of c-section), I use logistic regression. The analyses are done separately for
Medicaid fee-for-service patients (primary e�ect), and then for Medicare or privately
insured patients to test for secondary e�ects. Standard errors are cluster robust, with
clusters de�ned at the hospital level (Bertrand et al., 2004).
I further break down all Medicaid patient-level regressions by the previous payment
methodology of the hospital. That is, I separately run the Medicaid patient regres-
sions among previous contract hospitals (that were paid on a per diem basis) and
previous non-contract hospitals (that were paid on a fee-for-service basis), to under-
stand if the e�ects (if any) di�er by previous payment method. In these regressions,
the control for the hospital's prior contracting status is therefore dropped.
To understand the impact of the fee cut on the hospital-level mix of patients by
83
insurer type, I estimate the following equation:
Yjtk = β0+β1 ·Postt+β2 ·Treatedj+β3 (Post× Treated)tj+β4 ·Zj+β5 ·Wk+ε (4.2)
where the outcome Y is the proportion of Medi-Cal FFS patients, de�ned at the
hospital level. Since discharges are on the quarter-year level, each hospital has one
observation per quarter-year. I use heteroskedasticity robust standard errors.
4.2.5. Sensitivity Analyses
One issue that may be raised with a di�erence-in-di�erences strategy is that it may
su�er from bias if private hospitals di�er in unobservable ways from NDP hospitals,
which is the source of identi�cation in the main analysis. Therefore, as a sensitivity
analysis, I also conduct these analyses among the subset of private hospitals only.
In this case, a new identi�cation strategy is required. I make use of the lagged
county-level proportion of hospitalized patients covered by Medicaid FFS. I make the
assumption here that hospitals in counties with a larger proportion of Medicaid FFS
patients will have a stronger response to the change in payment methodology.
In these analyses, I use slightly di�erent inclusion criteria for the sample of hospitals.
I no longer exclude hospitals based on their proportion of Medicaid FFS patients,
given that this is part of the identi�cation strategy. In addition, I no longer exclude
2014 admissions. I exclude 2014 admissions in the main analysis because the control
group of hospitals gets switched over to DRG payments in January 2014. However,
this is not an issue in these sensitivity analyses. The �nal sample in this approach
consists of 152 hospitals and 4,790,111 patients.
I analyze the same outcomes as in the main analyses, but rather than a �true�
di�erence-in-di�erences set up, I use the continuous 2012 county-level Medicaid FFS
84

proportion rather than a binary �treated� variable, as follows:
Yijtk = β0 + β1 · Postt + β2 ·MdcdPropj + β3 (Post×MdcdProp)tj +
β4 ·Xi + β5 · Zj + β6 ·Wk + ε (4.3)
Here Xi are the patient-level characteristics, Zj are the county-level characteristics,
andWk are the county-level variables, as in the main analysis, with the only di�erence
being that there is no longer a county �xed e�ect, given that the 2012 Medicaid
porportion is measured at the county-level and is time-invariant.
4.3. Data Sources
I use discharge-level, hospital-level, and county-level data. The discharge data in-
cludes information on patients discharged from both hospitals and emergency depart-
ments (EDs), and includes patient characteristics as well as diagnosis and treatment
variables. Hospital-level variables include both general hospital characteristics, as
well as information regarding the timing of the hospital's DRG payment implementa-
tion and information regarding the prior payment methodology. Finally, county-level
variables include variables on county-level unemployment, income levels, and the pro-
portion of hospitalizations covered by Medicaid FFS. The sources for each of these
are described in more detail in the following subsections.
4.3.1. Patient-Level Variables
Patient Discharge Data
Patient-level discharge data come from the California O�ce of Statewide Health Plan-
ning and Development (OSHPD) for the years 2012 to 2014. I use the non-public use
85

versions of the inpatient discharge data and the emergency department data to ensure
full access to demographic variables. The inpatient discharge data include a record
for every inpatient discharge from a California-licensed hospital. Each record consists
of the hospital at which care was received, date of birth, gender, ethnicity, race, prin-
cipal language spoken, county of residence, zip code, admission date, discharge date,
length of stay, source of admission (own hospital ED, other hospital ED, no ED),
disposition, expected source of payment (Medicare, Medi-Cal, private coverage, etc),
type of coverage (traditional FFS, managed care, etc), total charges, major diagnostic
category (MDC), Medicare Severity Diagnosis Related Group (MS-DRG), principal
diagnosis, other diagnoses, principal procedure, and other procedures. I control for
diagnoses by using the MS-DRG grouping.
Emergency Department Data
Patient-level emergency department data for the years 2012 to 2014 also come from
OSHPD. The ED data include a record for every ED encounter that involved face-
to-face contact with a provider at a hospital licensed to provide emergency medical
services. Patients who left the ED without being seen are not included in the data.
The ED data include variables on the facility at which emergency care was sought,
the patient's date of birth, gender, ethnicity, race, principal language spoken, county
of residence, zip code, service date, disposition, expected source of payment, principal
and other diagnoses, and principal and other procedures. Since DRGs are not included
in the ED data, I use the Clinical Classi�cations Software, a diagnosis-grouping algo-
rithm, in order to cluster diagnoses into clinically meaningful categories (Elixhauser
et al., 2014). It is also important to note that in analyses using the ED data only, I
can only observe the payer category (Medicare, Medi-Cal, private coverage, etc.), but
not the type of coverage (managed care vs. FFS). Therefore, I include all Medi-Cal
86
patients in the analyses.
4.3.2. Hospital-Level Variables
Basic hospital-level variables were found in the OSHPD data. This includes a unique
hospital identi�cation number and hospital name, hospital zip code, hospital county,
and the total number of discharges by year. Additional hospital-level variables are
described below.
Information on the hospitals' status as private hospitals, designated public hospitals,
or non-designated public hospitals (and therefore the timing and implementation of
DRG payments) was available from a hospital characteristics �le publicly available
from the California Department of Health Care Services.26 Information on the con-
tracting status of each hospital, as well as the area status (open or closed) of the
HFPA in which the hospital is found, was hand-collected from a number of sources.
The HFPA to which each hospital was assigned was found in hospital �nancial reports
that are publicly available from OSHPD.27 HFPA area status (closed or open) was
found in the California Medical Assistance Commission (CMAC) Annual Reports to
the Legislature (2009-2010).28 Finally, the contracting status of each hospital came
from the CMAC reports and individual annual hospital �nancial disclosure reports
publicly available from OSHPD.29 This allowed for the identi�cation of the prior
payment methodology, and for the exclusion of hospitals that were previously non-
contract hospitals in closed HFPAs.
26http://www.dhcs.ca.gov/provgovpart/Pages/DRG-pricing-sfy2013-14.aspx27http://www.oshpd.ca.gov/hid/Products/Hospitals/QuatrlyFinanData/CmpleteData/default.asp28http://www.dhcs.ca.gov/services/spcp/Pages/default.aspx29https://siera.oshpd.ca.gov/FinancialDisclosure.aspx
87

4.3.3. County-Level Variables
County-level variables are included in regression analyses to control for any di�erential
e�ects by geographic region, and include the proportion of hospitalization attributable
to Medi-Cal fee-for-service, unemployment rates, and income levels. The proportion
of Medi-Cal hospitalizations was calculated directly from the OSHPD data. County-
level unemployment statistics come from the Bureau of Labor Statistics Local Area
Unemployment Statistics.30 These data include monthly county-level unemployment
rates, and were merged into the OSHPD patient discharge data based on hospital
county. Finally, county-level income levels come from the U.S. Census Bureau Small
Area Income and Poverty Estimates.31 These data include annual county-level income
rates, and were merged into the OSHPD patient discharge data based on hospital
county.
4.4. Results
4.4.1. Descriptive Statistics
Descriptive statistics of the hospitals included in the analysis are presented in Table
18. A total of 110 treated hospitals and 12 control hospitals met the inclusion cri-
teria for the analysis. Treatment hospitals were on average fairly similar to control
hospitals, both in terms of total discharges and total hospital days. They also served
similar numbers of proportions of Medi-Cal FFS patients, with nearly a quarter of
patients on average covered by Medi-Cal FFS.
Descriptive statistics of Medicaid FFS patients are presented in the left four columns
of Table 19. Among the Medicaid FFS population, the average age is 21-24 years
30http://www.bls.gov/lau/data.htm31http://www.census.gov/did/www/saipe/index.html
88
old and over two-thirds are female, with little variation between treatment/control
hospitals or pre/post periods. About 60 percent of the Medicaid population is white,
but control hospitals see a smaller proportion of black Medicaid patients than treat-
ment hospitals (5% versus 8%). Length of stay increased in both treatment and
control hospitals from the pre-period to the post-period. Similarly, average charges
vary widely between treatment and control hospitals, but on average increase in both
groups from the pre-period to the post-period. Within the cohort of women admitted
to the hospital for childbirth, there is little change in the proportion of women re-
ceiving a cesarean section compared to vaginal birth; there is also little change in the
proportion of women coded as having a birth with complications. Among patients
appearing in the ED, there were slight reductions in the proportion admitted to the
hospital among both treatment and control hospitals.
Descriptive statistics of Medicare and privately insured patients are presented in the
right four columns of Table 19. These patients are on average older than Medicaid
patients (due to the Medicare population), but there are no major changes in age
over time. Almost 60% of patients in both treated and control hospitals are female,
and similar to the Medicaid population, a higher proportion of patients in treated
hospitals are black. In both treated and control hospitals, there is very little change
in inpatient LOS, charges, or the average number of procedures per discharge. Among
the cohort of women admitted to the hospital for childbirth, the proportion receiving
a c-section as well as the proportion with complications remained stable over time
in both treatment and control hospitals. Similarly, there was little change in the
proportion of patients admitted to the hospital given a visit to the ED.
89
4.4.2. Access to Care
The plots in Figure 8 present the di�erence-in-di�erences plots of access to care mea-
sures. The top pair of plots shows the trends in likelihood of hospital admission over
time among both Medicaid patients and Medicare/privately insured patients. Based
on the plots alone, it appears that after the implementation of DRG payments by
Medicaid, the likelihood of hospital admission given an ED visit shows relatively lit-
tle change in treated hospitals, but increases in control hospitals. Table 21 presents
the results of the di�erence-in-di�erences logistic regression on the likelihood of hos-
pital admission.32 The coe�cient on Post × July1DRG, presented as an odds ratio
(OR), is the coe�cient of interest. The results show that in response to the intro-
duction of DRG payments by Medicaid, the likelihood of admission does not change
signi�cantly among Medicaid patients or among the Medicare and privately insured
population. Even when the results for Medicaid patients are broken down by the
hospital's previous payment methodology (Table 22), the e�ects remain small and
not statistically signi�cant. This suggests that it is unlikely that hospitals are sys-
tematically responding to the Medicaid payment change by changing their criteria for
hospital admission from the ED.
To address concerns that not all ED visits may be responsive to changes in reim-
bursement, I also examine the results broken down by visits that were considered
�ED Care Needed� versus visits that were considered �Primary Care Treatable� or
�Non-Emergent.� One might expect that there would be little response to payment
changes among ED visits that are truly emergencies, but that there may be more
movement among visits that did not require emergency services. Table 23 presents
32Note that in all regression tables, coe�cients on individual diagnoses-level controls have beenomitted for brevity.
90

the results; even broken down by severity of ED visit, there is little movement in the
likelihood of admission for either Medicaid patients or Medicare/privately insured
patients.
The bottom plot in Figure 8 presents the di�erence-in-di�erences plot of hospital
proportion of Medicaid FFS patients over time; no clear pattern is evident. In the
regression analysis presented in Table 20, the coe�cient of interest is small and not
statistically signi�cant.
In all of the analyses of access to care measures, the coe�cient on the explanatory
variable of interest is small and non-signi�cant. The results of these analyses together
suggest that access to care may not change substantially following a change in the
reimbursement methodology. This is not particularly surprising, as there is not a clear
incentive for hospitals to change their admissions procedures; a switch to DRG-based
payments may decrease or increase average payments for a given service.
4.4.3. Intensity of Care
To study the impact of the introduction of DRG payments by Medicaid on intensity
of care, I study a number of measures of inpatient intensity of care. The plots in Fig-
ure 9 illustrate the trends in outcomes prior to and following DRG implementation.
Table 24 presents the results of the di�erence-in-di�erences analysis of the impact of
DRG implementation on inpatient length of stay. Recall that in this case, there is
a clear incentive for hospitals, particularly those that were previously paid on a per
diem basis, to reduce LOS. Among Medicaid patients, there is a signi�cant reduction
in length of stay (Poisson coe�cient=-0.06, p<0.01), while there is a small but signif-
icant increase in length of stay among the Medicare and privately insured population
(Poisson coe�cient=0.029, p<0.05). Breaking down the Medicaid response by pre-
91
vious payment type (Table 25), both hospitals that were previously paid on a FFS
basis and on a per diem basis saw reductions in LOS, but the e�ect is driven primarily
by previous per diem hospitals. This is consistent with theoretical predictions, given
that the incentive for previous per diem hospitals is completely reversed after the
switch to DRG payments.
Note that for the outcomes of number of procedures and charges, previous FFS hos-
pitals would have a strong incentive to reduce intensity, whereas previous per diem
hospital would have already had that incentive. Table 26 shows the results of the
analyses of the number of procedures associated with the discharge. However, the
analyses show no signi�cant changes in the number of procedures for either Medi-
caid patients or for Medicare/privately insured patients. When the Medicaid result
is broken down by previous payment method, the result remains nonsigni�cant for
previous per diem hospitals, but counter to theory, there is a small increase in the
number of procedures in previous FFS hospitals. Table ?? presents the results on
the charges associated with each discharge. Similar to the number of procedures, the
size of the coe�cient on Post× July1DRG for Medicaid patients is very small, and
not statistically di�erent from zero. These results hold even when broken down by
previous payment type. These results together would suggest that the hospitals in
this study react to the change in payments when there is a clear reversal in incentive,
but do not react strongly to weaker incentives.
Table 30 presents the results of the logistic regressions on the likelihood of childbirth
via cesarean section among the cohort of women admitted to the hospital for child-
birth. I �nd a reduction in the likelihood of having a c-section by Medicaid patients
following the introduction of DRG payments (OR=0.932, p<0.05). Breaking that
result down by previous payment method, I �nd again that this response is primar-
92
ily driven by hospitals that were previously paid on a per diem basis (OR=0.884,
p<0.001). The e�ect is not signi�cant for previous FFS hospitals, or for privately in-
sured women. This could imply that on average, the marginal payment for a c-section
relative to a vaginal birth decreased under the DRG payment system.
4.4.4. Complications of Care
To study whether the switch to DRG payments impacted the likelihood of a diagnosis
being coded as having complications, I examine the likelihood of complications among
women admitted to the hospital for childbirth, controlling for whether she had a c-
section or a vaginal birth. Across the board for Medicaid patients (regardless of
previous payment method) and for privately insured women, there were no signi�cant
e�ects of the switch to DRG based payments on the likelihood of having complications
(Table ). This implies that at least in this setting, an �upcoding� response seems
unlikely, and similarly, it does not appear that changes to quality of care (if any),
have strong negative impacts on patient outcomes.
4.4.5. Sensitivity Analyses
The results on the coe�cient of interest from the sensitivity analyses using the county-
level proportion of hospitalized patients covered by Medicaid FFS are brie�y summa-
rized in Table 34. The signi�cant result on LOS from the main analyses is observed
in the sensitivity analysis as well, and continues to be driven by hospitals previously
reimbursed on a per diem basis. However, the result on the likelihood of a c-section
loses statistical signi�cance. To explore the lack of persistance in this result, I ex-
plore changes to the LOS and charges among the birth cohort, using the identi�cation
strategy from the main analysis. If the likelihood of a c-section truly increased, then
there should be accompanying increases in both LOS and charges, as higher LOS
93
and charges are associated with c-sections compared to vaginal births on average.
However, I �nd no signi�cant increases in LOS or charges among this population,
implying that the �nding of increased likelihood of c-section may be spurious.
4.4.6. Subgroup Analysis of Uninsured Population
I conducted additional analyses on the subgroup of patients who were uninsured.
All patients coded with a payer type of �county indigent program,� �other indigent,�
or �self pay� were included in this analysis. I found no signi�cant impacts of the
introductions of Medicaid DRG payments on any of the measures of access to care,
intensity of care, or complications of care studied in this chapter.
4.5. Policy Implications and Discussion
4.5.1. Policy Implications
The results uncovered in this chapter show that at least along certain dimensions,
hospitals are very responsive to changes in incentives. Policymakers should take into
consideration that especially when the incentives change dramatically, such as the
incentive for longer length of stay under a per diem payment system versus shorter
length of stay under a DRG system, hospital response can be both quick and strong.
While a DRG-based payment system may reduce costs to Medicaid compared to the
previous systems, policy makers should also consider whether reductions in length
of stay may imply lower quality of care, and how that may a�ect health care costs
overall. Hospitals that were previously paid on a FFS basis did not have a strong
response to DRG payments, contrary to theoretical predictions. Policymakers should
keep in mind that responses may have occurred in the longer term than than studied
in this chapter, and future work should focus on examining the long-term impact.
94

4.5.2. Discussion
Many state Medicaid programs, as well as the Medicare program, make use of DRG-
based payments, yet existing knowledge on the impacts of this reimbursement method-
ology is largely based on studies of policy changes that occurred in the 1980's. Con-
sistent with the older literature, I �nd signi�cant reductions in the length of hospital
stay for Medicaid patients (Ellis and McGuire, 1996; Frank and Lave, 1989; Rosko
and Broyles, 1987). These reductions, however, are primarily driven by hospitals that
were previously reimbursed on a per diem basis. While the same response should be
expected from hospitals previously paid on a FFS basis, the result is not statistically
signi�cant (although the coe�cient is in the correct direction). These �ndings suggest
that consistent with the older literature, hospitals have a strong response along the
length of stay margin to a DRG-based payment system. However, given that that
response was not signi�cant among prior FFS hospitals, it may be the case that the
strength of the response depends on the prior reimbursement method, or that some
hospitals may not be able to adjust in the short term.
The lack of strong response from FFS hospitals could also be explained by relatively
low FFS margins. If FFS payments were relatively low, and hospitals have increasing
marginal costs, they may not have been in a place where reductions to length of stay
or other measures of intensity of care were feasible. Indeed, California already has
a relatively short inpatient LOS on average, compared to other states, so in some
hospitals there may simply have been little room to move (California HealthCare
Foundation, 2010). The lack of response on other measures of intensity is perhaps
unsurprising, given that for previous per diem hospitals, the incentive remained the
same for measures such as the number of procedures.
95
Some limitations should be taken into account when considering the results of this
study. First, the study is focused on a subset of hospitals within California. A prob-
lem inherent to studying Medicaid is that Medicaid programs di�er from state to
state, and a study of one state's program may not be nationally generalizable. How-
ever, California has one of the largest Medicaid populations in the country, serving
16% of the non-elderly population in the state, and also has a demographically di-
verse Medicaid population. While the study includes a large number of patients, the
number of hospitals included in the control group was fairly limited, due to the way
the implementation of the DRG payment system was implemented and the sample
selection. However, the sensitivity analyses did not su�er from the same problem,
and found the same results in terms of length of stay.
The major contribution of this research to the literature is to update the existing
literature on hospital response to prospective payment. Prior to this work, existing
research was largely based on policy changes in the 1980's; the healthcare landscape
in the U.S. certainly looks very di�erent today than 30 years ago.
4.6. Tables & Figures
96

Figure 7: Sample Selection Flowchart
97

Table 18: Hospital Characteristics (2012)Treatment Control
N* 110 12Average Total Discharges 10,939 9,538
Average Medi-Cal Discharges 2,230 1,324Average Total Hospital Days 58,842 53,990Average Medi-Cal Days 14,853 14,108
Average Medi-Cal FFS Patient Proportion 22.6% 21.4%
98
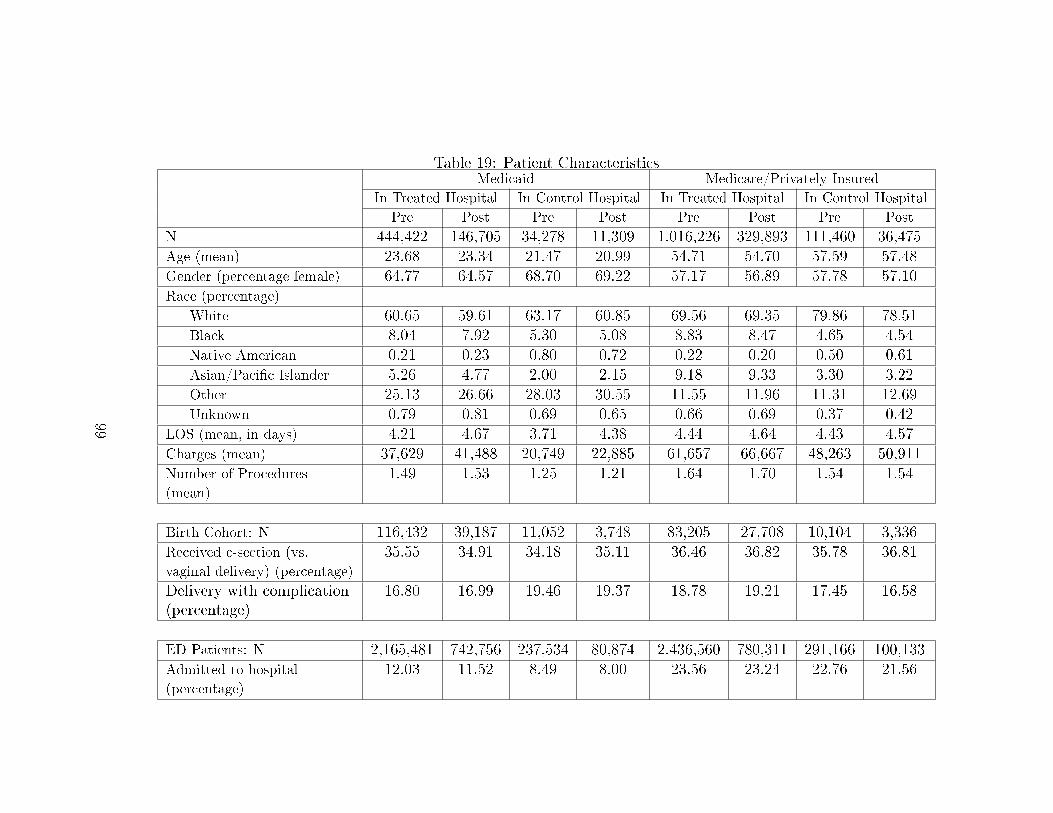
Table 19: Patient CharacteristicsMedicaid Medicare/Privately Insured
In Treated Hospital In Control Hospital In Treated Hospital In Control Hospital
Pre Post Pre Post Pre Post Pre Post
N 444,422 146,705 34,278 11,309 1,016,226 329,893 111,460 36,475Age (mean) 23.68 23.34 21.47 20.99 54.71 54.70 57.59 57.48Gender (percentage female) 64.77 64.57 68.70 69.22 57.17 56.89 57.78 57.10Race (percentage)
White 60.65 59.61 63.17 60.85 69.56 69.35 79.86 78.51Black 8.04 7.92 5.30 5.08 8.83 8.47 4.65 4.54Native American 0.21 0.23 0.80 0.72 0.22 0.20 0.50 0.61Asian/Paci�c Islander 5.26 4.77 2.00 2.15 9.18 9.33 3.30 3.22Other 25.13 26.66 28.03 30.55 11.55 11.96 11.31 12.69Unknown 0.79 0.81 0.69 0.65 0.66 0.69 0.37 0.42
LOS (mean, in days) 4.21 4.67 3.71 4.38 4.44 4.64 4.43 4.57Charges (mean) 37,629 41,488 20,749 22,885 61,657 66,667 48,263 50,911Number of Procedures
(mean)
1.49 1.53 1.25 1.21 1.64 1.70 1.54 1.54
Birth Cohort: N 116,432 39,187 11,052 3,748 83,205 27,708 10,104 3,336Received c-section (vs.
vaginal delivery) (percentage)
35.55 34.91 34.18 35.11 36.46 36.82 35.78 36.81
Delivery with complication(percentage)
16.80 16.99 19.46 19.37 18.78 19.21 17.45 16.58
ED Patients: N 2,165,481 742,756 237,534 80,874 2,436,560 780,311 291,166 100,133Admitted to hospital
(percentage)
12.03 11.52 8.49 8.00 23.56 23.24 22.76 21.56
99

Figure 8: Di�erence-in-Di�erences Plots: Access to Care Measures
-.4-.3
-.2-.1
0.1
Med
icai
d
12Q212Q312Q413Q113Q213Q313Q4
-.2-.1
0.1
Med
icar
e/Pr
ivat
ely
Insu
red
12Q212Q312Q413Q113Q213Q313Q4
Likelihood of Hospital Admission
Treated hospitals Control hospitals
-.02
0.0
2.0
4.0
6
12Q2 12Q3 12Q4 13Q1 13Q2 13Q3 13Q4
Treated hospitals Control hospitals
Proportion of Hospital's Patients with Medicaid FFS
100
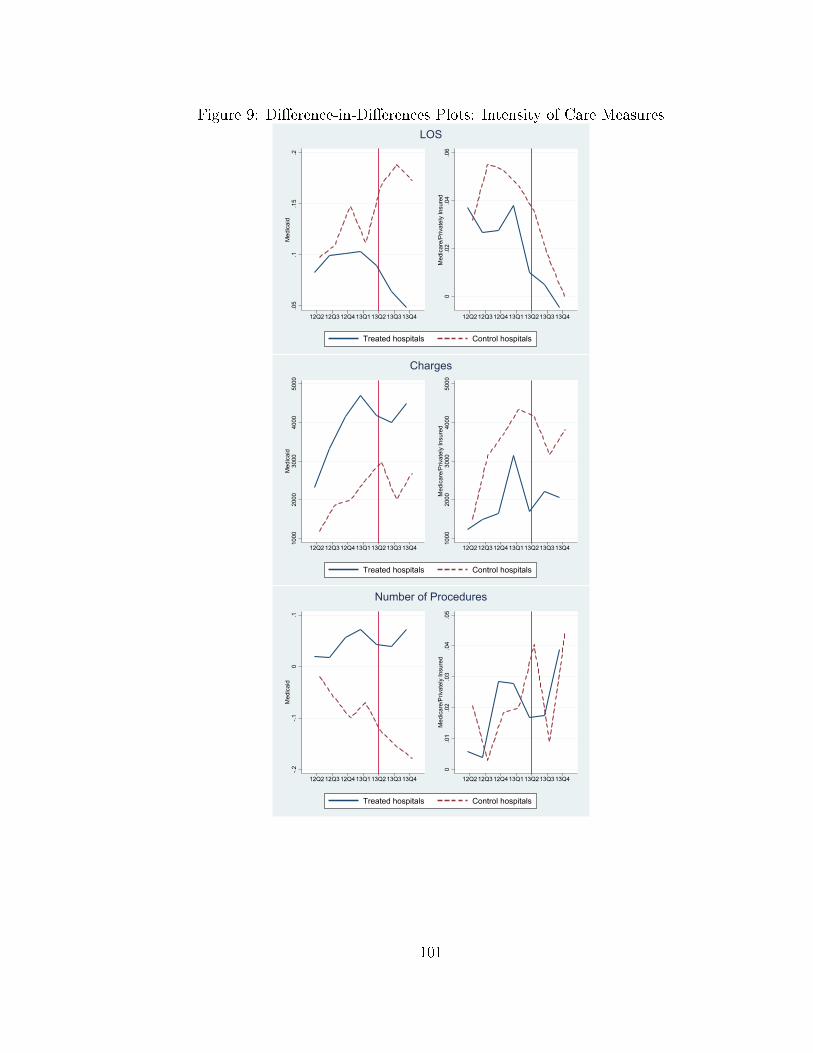
Figure 9: Di�erence-in-Di�erences Plots: Intensity of Care Measures
.05
.1.1
5.2
Med
icai
d
12Q212Q312Q413Q113Q213Q313Q4
0.0
2.0
4.0
6M
edic
are/
Priv
atel
y In
sure
d
12Q212Q312Q413Q113Q213Q313Q4
LOS
Treated hospitals Control hospitals
1000
2000
3000
4000
5000
Med
icai
d
12Q212Q312Q413Q113Q213Q313Q4
1000
2000
3000
4000
5000
Med
icar
e/Pr
ivat
ely
Insu
red
12Q212Q312Q413Q113Q213Q313Q4
Charges
Treated hospitals Control hospitals
-.2-.1
0.1
Med
icai
d
12Q212Q312Q413Q113Q213Q313Q4
0.0
1.0
2.0
3.0
4.0
5M
edic
are/
Priv
atel
y In
sure
d
12Q212Q312Q413Q113Q213Q313Q4
Number of Procedures
Treated hospitals Control hospitals
101

Figure 10: Di�erence-in-Di�erences Plots: Intensity of Care Measures (Birth)
-.15
-.1-.0
50
.05
.1M
edic
aid
12Q212Q312Q413Q113Q213Q313Q4
-.10
.1.2
.3Pr
ivat
ely
Insu
red
12Q212Q312Q413Q113Q213Q313Q4
Likelihood of C-Section
Treated hospitals Control hospitals
.05
.1.1
5.2
.25
Med
icai
d
12Q212Q312Q413Q113Q213Q313Q4
-.3-.2
-.10
.1Pr
ivat
ely
Insu
red
12Q212Q312Q413Q113Q213Q313Q4
Likelihood of Birth with Complications
Treated hospitals Control hospitals
102

Measures of Access to Care
Table 20: Hospital Mix
July 1st DRG 0.118∗∗∗ (0.014)Post -0.016 (0.018)Post X July1DRG 0.015 (0.019)Church 0.000 (.)County Unemployment 0.000 (0.003)County Average Income 0.000 (0.000)Observations 964
Standard errors in parentheses∗ p < 0.05, ∗∗ p < 0.01, ∗∗∗ p < 0.001
103
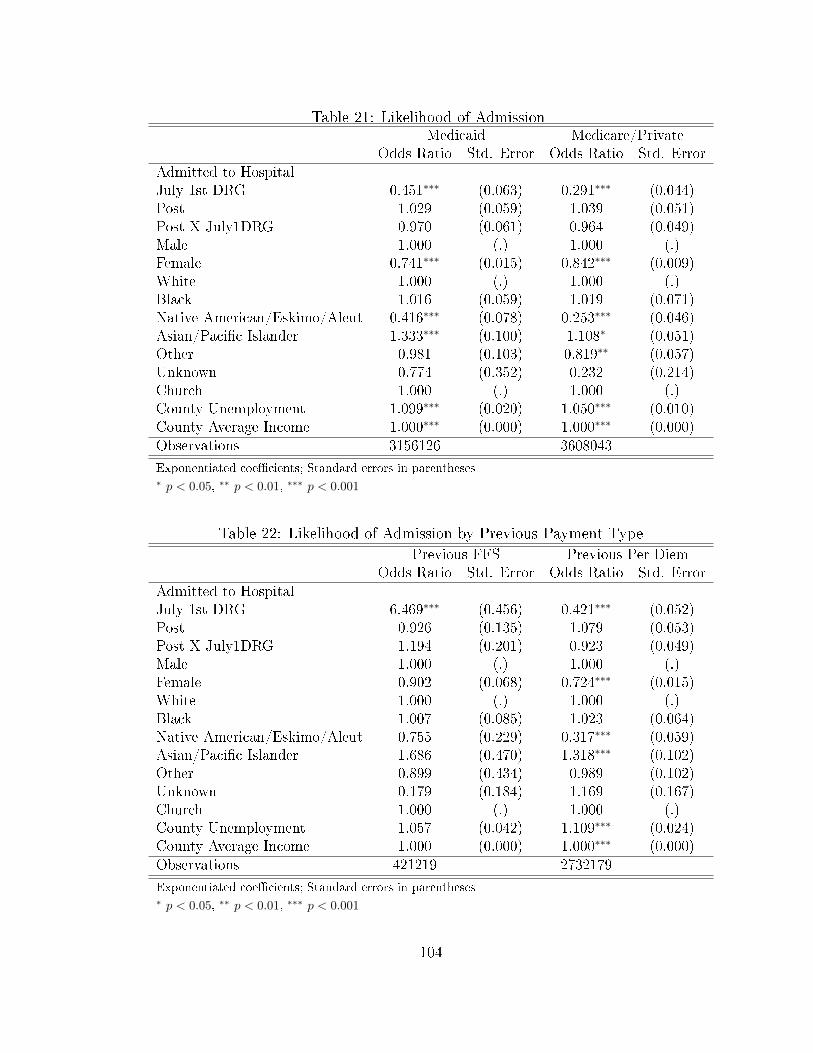
Table 21: Likelihood of AdmissionMedicaid Medicare/Private
Odds Ratio Std. Error Odds Ratio Std. ErrorAdmitted to HospitalJuly 1st DRG 0.451∗∗∗ (0.063) 0.291∗∗∗ (0.044)Post 1.029 (0.059) 1.039 (0.051)Post X July1DRG 0.970 (0.061) 0.964 (0.049)Male 1.000 (.) 1.000 (.)Female 0.741∗∗∗ (0.015) 0.842∗∗∗ (0.009)White 1.000 (.) 1.000 (.)Black 1.016 (0.059) 1.019 (0.071)Native American/Eskimo/Aleut 0.416∗∗∗ (0.078) 0.253∗∗∗ (0.046)Asian/Paci�c Islander 1.333∗∗∗ (0.100) 1.108∗ (0.051)Other 0.981 (0.103) 0.819∗∗ (0.057)Unknown 0.774 (0.352) 0.232 (0.214)Church 1.000 (.) 1.000 (.)County Unemployment 1.099∗∗∗ (0.020) 1.050∗∗∗ (0.010)County Average Income 1.000∗∗∗ (0.000) 1.000∗∗∗ (0.000)Observations 3156126 3608043
Exponentiated coe�cients; Standard errors in parentheses∗ p < 0.05, ∗∗ p < 0.01, ∗∗∗ p < 0.001
Table 22: Likelihood of Admission by Previous Payment Type
Previous FFS Previous Per DiemOdds Ratio Std. Error Odds Ratio Std. Error
Admitted to HospitalJuly 1st DRG 6.469∗∗∗ (0.456) 0.421∗∗∗ (0.052)Post 0.926 (0.135) 1.079 (0.053)Post X July1DRG 1.194 (0.201) 0.923 (0.049)Male 1.000 (.) 1.000 (.)Female 0.902 (0.068) 0.724∗∗∗ (0.015)White 1.000 (.) 1.000 (.)Black 1.007 (0.085) 1.023 (0.064)Native American/Eskimo/Aleut 0.755 (0.229) 0.317∗∗∗ (0.059)Asian/Paci�c Islander 1.686 (0.470) 1.318∗∗∗ (0.102)Other 0.899 (0.434) 0.989 (0.102)Unknown 0.179 (0.184) 1.169 (0.167)Church 1.000 (.) 1.000 (.)County Unemployment 1.057 (0.042) 1.109∗∗∗ (0.024)County Average Income 1.000 (0.000) 1.000∗∗∗ (0.000)Observations 421219 2732179
Exponentiated coe�cients; Standard errors in parentheses∗ p < 0.05, ∗∗ p < 0.01, ∗∗∗ p < 0.001
104

Table 23: Likelihood of Admission by ED Visit Severity
ED Not Needed ED NeededMedicaid Medicare/Private Medicaid Medicare/Private
OR SE OR SE OR SE OR SEAdmitted to HospitalJuly 1st DRG 0.545∗∗∗ (0.069) 0.372∗∗∗ (0.063) 0.521∗∗∗ (0.069) 0.375∗∗∗ (0.061)Post 0.990 (0.063) 1.001 (0.051) 1.028 (0.073) 1.028 (0.050)Post X July1DRG 1.028 (0.070) 1.001 (0.052) 0.992 (0.074) 0.980 (0.049)Male 1.000 (.) 1.000 (.) 1.000 (.) 1.000 (.)Female 0.710∗∗∗ (0.017) 0.827∗∗∗ (0.010) 0.717∗∗∗ (0.017) 0.835∗∗∗ (0.010)White 1.000 (.) 1.000 (.) 1.000 (.) 1.000 (.)Black 1.072 (0.077) 1.022 (0.081) 1.068 (0.074) 1.044 (0.078)Native American/Eskimo/Aleut 0.430∗∗∗ (0.085) 0.238∗∗∗ (0.045) 0.386∗∗∗ (0.082) 0.234∗∗∗ (0.042)Asian/Paci�c Islander 1.297∗∗∗ (0.102) 1.059 (0.058) 1.285∗∗ (0.108) 1.068 (0.056)Other 0.936 (0.106) 0.777∗∗∗ (0.058) 0.928 (0.103) 0.793∗∗ (0.058)Unknown 0.784 (0.346) 0.219 (0.197) 0.723 (0.338) 0.203 (0.184)Church 1.000 (.) 1.000 (.) 1.000 (.) 1.000 (.)County Unemployment 1.127∗∗∗ (0.022) 1.074∗∗∗ (0.013) 1.116∗∗∗ (0.020) 1.060∗∗∗ (0.012)County Average Income 1.000∗∗∗ (0.000) 1.000∗∗∗ (0.000) 1.000∗∗∗ (0.000) 1.000∗∗∗ (0.000)Observations 1944294 1921574 1726751 1897127
Exponentiated coe�cients; Standard errors in parentheses∗ p < 0.05, ∗∗ p < 0.01, ∗∗∗ p < 0.001
Standard errors clustered at hospital level
OR - "Odds Ratio," SE - "Standard Error"
105

Measures of Intensity and Complications of Care
Table 24: Length of Stay
Medicaid Medicare/PrivateLength of StayJuly 1st DRG -0.584∗∗∗ (0.057) -0.394∗∗∗ (0.039)Post 0.005 (0.020) -0.053∗∗∗ (0.014)Post X July1DRG -0.060∗∗ (0.020) 0.029∗ (0.015)Male 0.000 (.) 0.000 (.)Female -0.023∗∗ (0.008) 0.019∗∗∗ (0.003)White 0.000 (.) 0.000 (.)Black 0.035∗ (0.017) 0.042∗ (0.020)Native American/Eskimo/Aleut -0.056 (0.033) -0.048∗∗ (0.017)Asian/Paci�c Islander 0.055∗ (0.026) 0.022∗ (0.010)Other 0.003 (0.016) 0.013 (0.012)Unknown 0.083∗ (0.042) 0.024 (0.019)Church 0.000 (.) 0.000 (.)County Unemployment -0.026∗∗∗ (0.007) -0.011∗∗∗ (0.003)County Average Income 0.000 (0.000) 0.000 (0.000)Observations 597714 1485397
Standard errors in parentheses∗ p < 0.05, ∗∗ p < 0.01, ∗∗∗ p < 0.001
106

Table 25: Length of Stay by Previous Payment Type
Previous FFS Previous Per DiemLength of StayJuly 1st DRG -0.284∗∗ (0.092) -0.566∗∗∗ (0.060)Post -0.008 (0.036) 0.013 (0.029)Post X July1DRG -0.038 (0.046) -0.069∗ (0.028)Male 0.000 (.) 0.000 (.)Female -0.066∗∗ (0.021) -0.019∗ (0.008)White 0.000 (.) 0.000 (.)Black 0.038∗∗ (0.014) 0.039∗ (0.019)Native American/Eskimo/Aleut -0.068 (0.051) -0.028 (0.038)Asian/Paci�c Islander 0.224 (0.166) 0.039 (0.023)Other 0.036 (0.031) 0.005 (0.016)Unknown 0.124∗ (0.050) 0.084 (0.046)Church 0.000 (.) 0.000 (.)County Unemployment -0.029∗ (0.014) -0.026∗∗ (0.008)County Average Income 0.000 (0.000) 0.000 (0.000)Observations 55208 542506
Standard errors in parentheses∗ p < 0.05, ∗∗ p < 0.01, ∗∗∗ p < 0.001
Table 26: Number of ProceduresMedicaid Medicare/Private
Number of ProceduresJuly 1st DRG 1.118∗∗∗ (0.091) 0.566∗∗∗ (0.076)Post -0.066 (0.041) -0.024 (0.015)Post X July1DRG 0.051 (0.046) 0.023 (0.018)Male 0.000 (.) 0.000 (.)Female -0.021∗ (0.009) -0.032∗∗∗ (0.004)White 0.000 (.) 0.000 (.)Black -0.018 (0.029) -0.014 (0.018)Native American/Eskimo/Aleut -0.036 (0.036) -0.009 (0.023)Asian/Paci�c Islander 0.007 (0.022) 0.032∗∗ (0.011)Other -0.010 (0.058) 0.021 (0.030)Unknown -0.015 (0.029) 0.006 (0.016)Church 0.000 (.) 0.000 (.)County Unemployment -0.001 (0.006) 0.002 (0.004)County Average Income 0.000 (0.000) 0.000 (0.000)Observations 597714 1485397
Standard errors in parentheses∗ p < 0.05, ∗∗ p < 0.01, ∗∗∗ p < 0.001
107
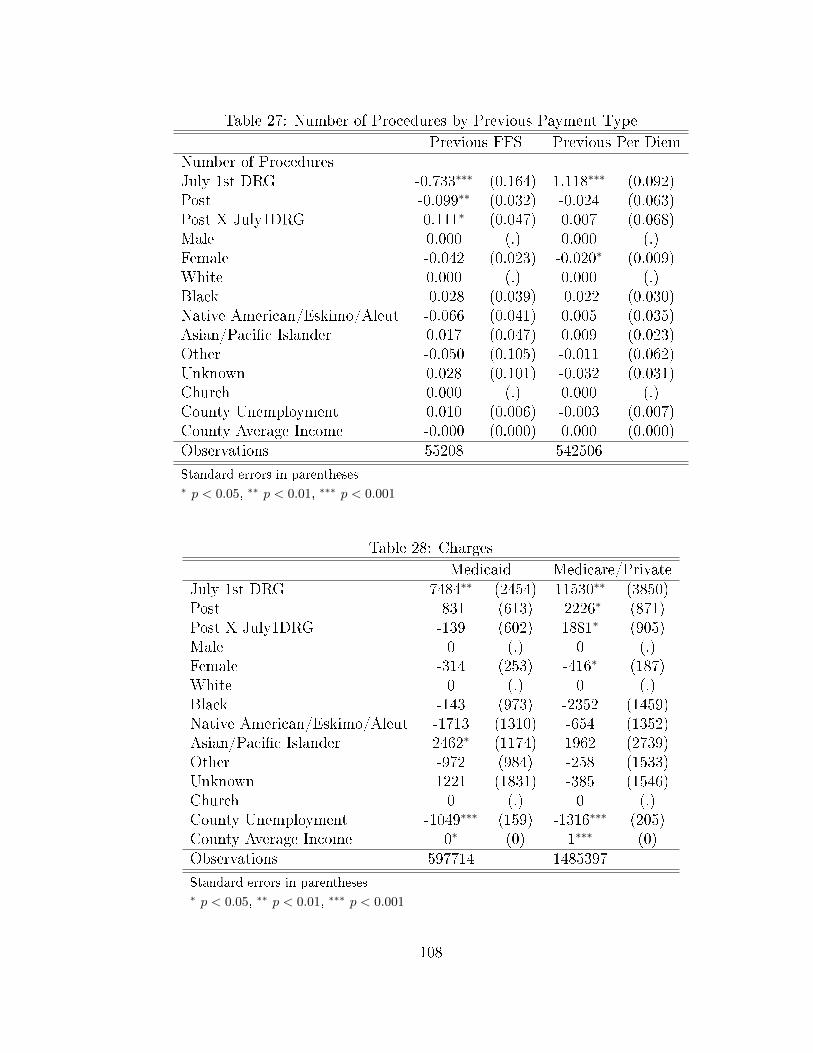
Table 27: Number of Procedures by Previous Payment Type
Previous FFS Previous Per DiemNumber of ProceduresJuly 1st DRG -0.733∗∗∗ (0.164) 1.118∗∗∗ (0.092)Post -0.099∗∗ (0.032) -0.024 (0.063)Post X July1DRG 0.111∗ (0.047) 0.007 (0.068)Male 0.000 (.) 0.000 (.)Female -0.042 (0.023) -0.020∗ (0.009)White 0.000 (.) 0.000 (.)Black -0.028 (0.039) -0.022 (0.030)Native American/Eskimo/Aleut -0.066 (0.041) 0.005 (0.035)Asian/Paci�c Islander 0.017 (0.047) 0.009 (0.023)Other -0.050 (0.105) -0.011 (0.062)Unknown 0.028 (0.101) -0.032 (0.031)Church 0.000 (.) 0.000 (.)County Unemployment 0.010 (0.006) -0.003 (0.007)County Average Income -0.000 (0.000) 0.000 (0.000)Observations 55208 542506
Standard errors in parentheses∗ p < 0.05, ∗∗ p < 0.01, ∗∗∗ p < 0.001
Table 28: Charges
Medicaid Medicare/PrivateJuly 1st DRG 7484∗∗ (2454) 11530∗∗ (3850)Post -831 (613) -2226∗ (871)Post X July1DRG -139 (602) 1881∗ (905)Male 0 (.) 0 (.)Female -314 (253) -416∗ (187)White 0 (.) 0 (.)Black -143 (973) -2352 (1459)Native American/Eskimo/Aleut -1713 (1310) -654 (1352)Asian/Paci�c Islander 2462∗ (1174) 1962 (2739)Other -972 (984) -258 (1533)Unknown 1221 (1831) -385 (1546)Church 0 (.) 0 (.)County Unemployment -1049∗∗∗ (159) -1316∗∗∗ (205)County Average Income 0∗ (0) 1∗∗∗ (0)Observations 597714 1485397
Standard errors in parentheses∗ p < 0.05, ∗∗ p < 0.01, ∗∗∗ p < 0.001
108
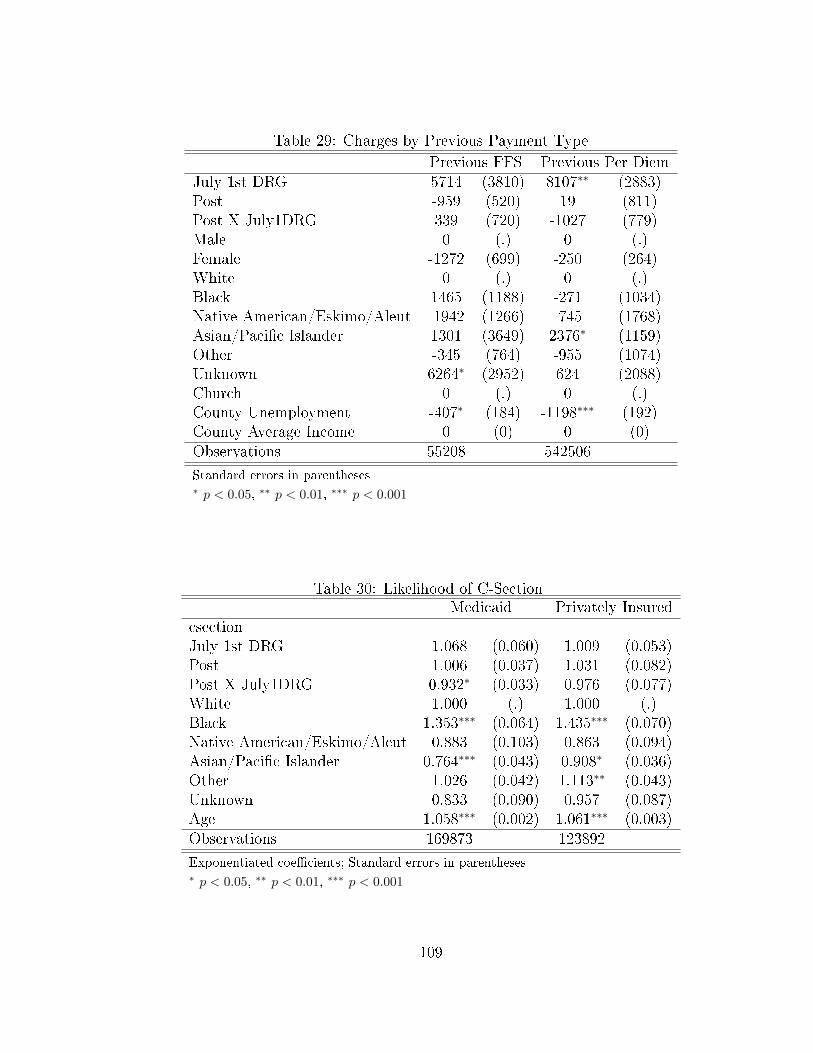
Table 29: Charges by Previous Payment Type
Previous FFS Previous Per DiemJuly 1st DRG 5714 (3810) 8107∗∗ (2883)Post -959 (520) 19 (811)Post X July1DRG 339 (720) -1027 (779)Male 0 (.) 0 (.)Female -1272 (699) -250 (264)White 0 (.) 0 (.)Black 1465 (1188) -271 (1034)Native American/Eskimo/Aleut -1942 (1266) -745 (1768)Asian/Paci�c Islander 1301 (3649) 2376∗ (1159)Other -345 (764) -955 (1074)Unknown 6264∗ (2952) 624 (2088)Church 0 (.) 0 (.)County Unemployment -407∗ (184) -1198∗∗∗ (192)County Average Income 0 (0) 0 (0)Observations 55208 542506
Standard errors in parentheses∗ p < 0.05, ∗∗ p < 0.01, ∗∗∗ p < 0.001
Table 30: Likelihood of C-SectionMedicaid Privately Insured
csectionJuly 1st DRG 1.068 (0.060) 1.009 (0.053)Post 1.006 (0.037) 1.031 (0.082)Post X July1DRG 0.932∗ (0.033) 0.976 (0.077)White 1.000 (.) 1.000 (.)Black 1.353∗∗∗ (0.064) 1.435∗∗∗ (0.070)Native American/Eskimo/Aleut 0.883 (0.103) 0.863 (0.094)Asian/Paci�c Islander 0.764∗∗∗ (0.043) 0.908∗ (0.036)Other 1.026 (0.042) 1.113∗∗ (0.043)Unknown 0.833 (0.090) 0.957 (0.087)Age 1.058∗∗∗ (0.002) 1.061∗∗∗ (0.003)Observations 169873 123892
Exponentiated coe�cients; Standard errors in parentheses∗ p < 0.05, ∗∗ p < 0.01, ∗∗∗ p < 0.001
109
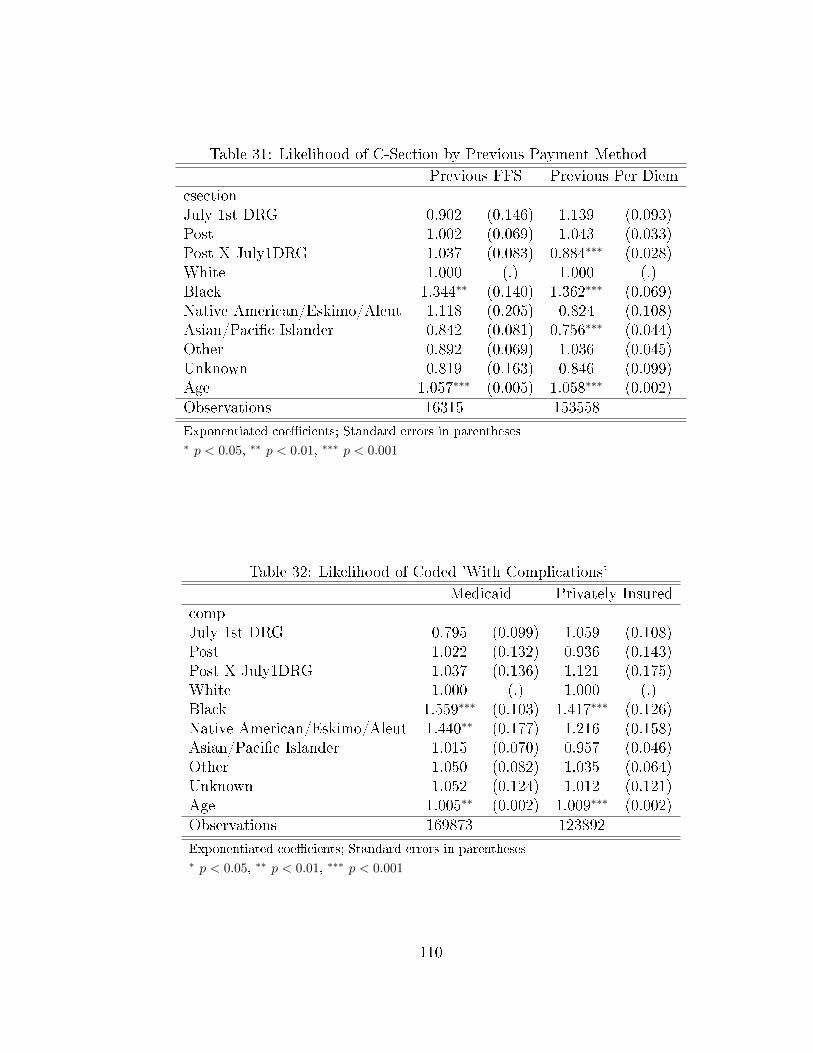
Table 31: Likelihood of C-Section by Previous Payment Method
Previous FFS Previous Per DiemcsectionJuly 1st DRG 0.902 (0.146) 1.139 (0.093)Post 1.002 (0.069) 1.043 (0.033)Post X July1DRG 1.037 (0.083) 0.884∗∗∗ (0.028)White 1.000 (.) 1.000 (.)Black 1.344∗∗ (0.140) 1.362∗∗∗ (0.069)Native American/Eskimo/Aleut 1.118 (0.205) 0.824 (0.108)Asian/Paci�c Islander 0.842 (0.081) 0.756∗∗∗ (0.044)Other 0.892 (0.069) 1.036 (0.045)Unknown 0.819 (0.163) 0.846 (0.099)Age 1.057∗∗∗ (0.005) 1.058∗∗∗ (0.002)Observations 16315 153558
Exponentiated coe�cients; Standard errors in parentheses∗ p < 0.05, ∗∗ p < 0.01, ∗∗∗ p < 0.001
Table 32: Likelihood of Coded 'With Complications'
Medicaid Privately InsuredcompJuly 1st DRG 0.795 (0.099) 1.059 (0.108)Post 1.022 (0.132) 0.936 (0.143)Post X July1DRG 1.037 (0.136) 1.121 (0.175)White 1.000 (.) 1.000 (.)Black 1.559∗∗∗ (0.103) 1.417∗∗∗ (0.126)Native American/Eskimo/Aleut 1.440∗∗ (0.177) 1.216 (0.158)Asian/Paci�c Islander 1.015 (0.070) 0.957 (0.046)Other 1.050 (0.082) 1.035 (0.064)Unknown 1.052 (0.124) 1.012 (0.121)Age 1.005∗∗ (0.002) 1.009∗∗∗ (0.002)Observations 169873 123892
Exponentiated coe�cients; Standard errors in parentheses∗ p < 0.05, ∗∗ p < 0.01, ∗∗∗ p < 0.001
110
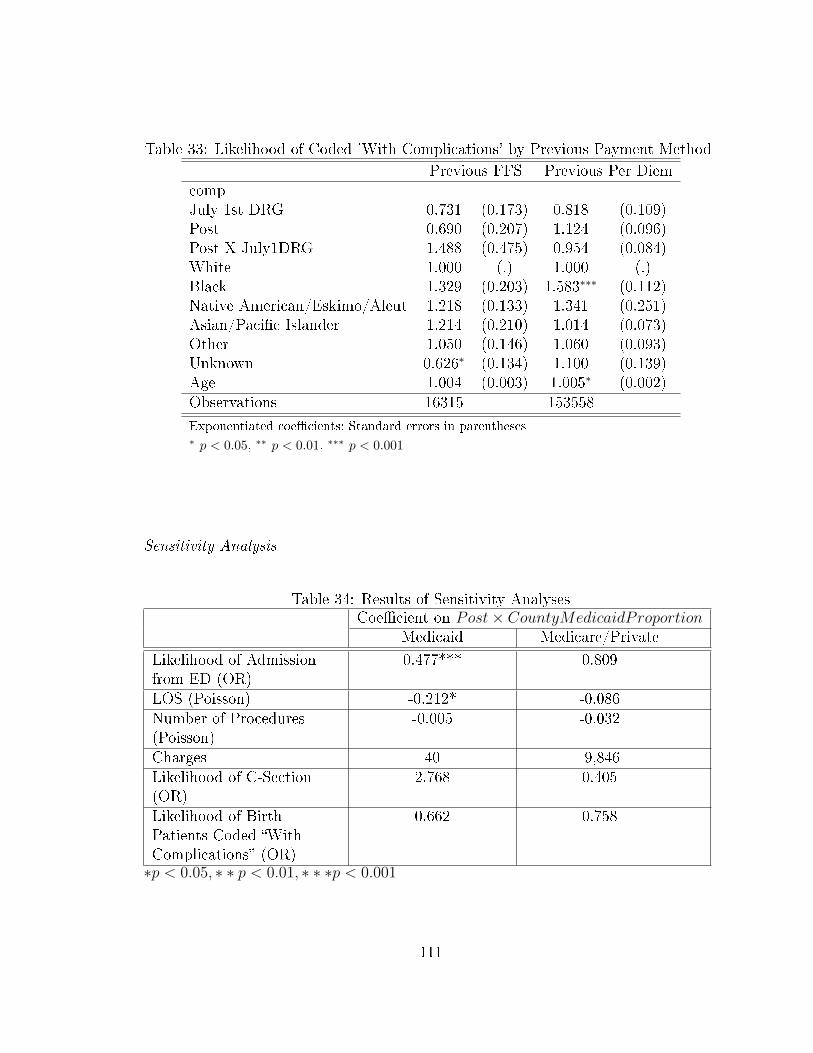
Table 33: Likelihood of Coded 'With Complications' by Previous Payment Method
Previous FFS Previous Per DiemcompJuly 1st DRG 0.731 (0.173) 0.818 (0.109)Post 0.690 (0.207) 1.124 (0.096)Post X July1DRG 1.488 (0.475) 0.954 (0.084)White 1.000 (.) 1.000 (.)Black 1.329 (0.203) 1.583∗∗∗ (0.112)Native American/Eskimo/Aleut 1.218 (0.133) 1.341 (0.251)Asian/Paci�c Islander 1.214 (0.210) 1.014 (0.073)Other 1.050 (0.146) 1.060 (0.093)Unknown 0.626∗ (0.134) 1.100 (0.139)Age 1.004 (0.003) 1.005∗ (0.002)Observations 16315 153558
Exponentiated coe�cients; Standard errors in parentheses∗ p < 0.05, ∗∗ p < 0.01, ∗∗∗ p < 0.001
Sensitivity Analysis
Table 34: Results of Sensitivity AnalysesCoe�cient on Post× CountyMedicaidProportion
Medicaid Medicare/Private
Likelihood of Admissionfrom ED (OR)
0.477*** 0.809
LOS (Poisson) -0.212* -0.086Number of Procedures(Poisson)
-0.005 -0.032
Charges 40 -9,846Likelihood of C-Section(OR)
2.768 0.405
Likelihood of BirthPatients Coded �WithComplications� (OR)
0.662 0.758
∗p < 0.05, ∗ ∗ p < 0.01, ∗ ∗ ∗p < 0.001
111

CHAPTER 5 : Conclusion
In this dissertation, I examine the impact of a level cut to Medicaid payment rates
on hospital behavior, as well as the impact of a change in Medicaid reimbursement
methodology on hospital behavior. Although such policy measures by state Medicaid
programs have become increasingly common, current evidence is fairly limited or
dated on their e�ects.
5.1. The Impact of Level Cuts to Medicaid Payments
I use data from the California O�ce of Statewide Health Planning and Development
to examine the impact of a 10% cut to Medicaid FFS payment rates in the state of
California. I �nd little evidence that the payment cut impacts access to inpatient care
for Medicaid patients; I also �nd no evidence of changes to intensity of treatment.
Given the emphasis in the existing literature on cost-shifting as a potential outcome,
combined with the lack of strong or consistent empirical evidence of its occurrence, I
also examine the impacts of the Medicaid price change on treatment of non-Medicaid
patients. In the main analyses, I �nd evidence of an increased likelihood of cesarean
section for privately insured women in hospitals a�ected by the payment cut. How-
ever, this �nding did not hold up in the sensitivity and other checks, leading to the
conclusion, that at best, any e�ect was fairly limited.
These results are not consistent with the theoretical predictions, which imply that
hospitals will change the way they treat Medicaid patients, non-Medicaid patients,
or both. One potential explanation for these results would be that hospitals have
some altruistic reasons (which would be consistent with theory if hospitals get very
high utility from quantity of care), or even legal reasons for not wanting to reduce
112

quantity of care. It could be that hospitals instead respond to payment cuts in other,
non-treatment related ways. Indeed, previous research has shown that hospitals may
choose administrative, rather than treatment-related means in response to payment
reductions (Dafny, 2005). The lack of e�ect on the non-Medicaid population is also
largely consistent with the broad lack of empirical evidence for cost shifting (Frakt,
2011; Morrisey, 1996).
Policymakers should consider several implications of this research. Although Medicaid
patients' treatment does not appear to be adversely a�ected by changes to Medicaid
payments in the hospital setting, policymakers should consider whether this is truly
the optimal response from Medicaid's standpoint. Policymakers may instead want to
consider other, more e�ective measures of changing provider behavior. Policymakers
should also consider other ways that hospitals may respond to payment cuts, and how
these responses could a�ect care for Medicaid and other patients. This also highlights
areas for future work. For example, hospitals may have responded to Medicaid price
cuts by reducing their nursing sta�, which could have implications on the quality of
care provided. In addition, hospitals may have increased their use of laboratory or
diagnostic testing to o�set �nancial losses, which would certainly have lessened any
cost-savings Medicaid would have otherwise seen. It may also have been the case
that there was a switch from care provided in an inpatient setting to providing care
in an outpatient setting in certain care settings, which could have implications for
both costs and quality of care.33 Future research should explore these other avenues
of hospital response.
33Only inpatient payment rates were a�ected by the policy change.
113

5.2. The Impact of Changes to Medicaid Reimbursement-Based Incen-
tives
To study the impacts of the 2013 switch to DRG-based payments by California Med-
icaid, I also make use of the inpatient and emergency department discharge data
from the California O�ce of Statewide Health Planning and Development. I �nd no
evidence that the switch to DRG payments impacted access to care for Medicaid ben-
e�ciaries. However, I do �nd strong evidence that hospitals reduce average inpatient
length of stay in response to DRG payments, and furthermore, that this response is
driven primarily by hospitals that were previously reimbursed on a per diem basis.
The results from the empirical analyses are broadly consistent with the theoretical
predictions from the model in Chapter 2. Without information on the speci�c DRG
weights and prices, changes in overall access to care cannot be predicted; indeed, I
do not �nd any evidence of changes to access to care. While the model predicts that
hospitals paid on a FFS basis will have incentive to reduce intensity of care, it is
also consistent with the model that intensity remain relatively stable if FFS prices
were already relatively low (which is likely, given the subject of Chapter 3 of this
dissertation). Similarly, we may expect no e�ects on intensity of care for prior FFS
hospitals if prior FFS rates were already low. For per diem hospitals, the results were
also consistent with theory. These hospitals already had incentive to keep the number
of procedures and amount of treatment (as measured by charges) low. However, under
per diem payments, they had incentive to keep LOS high, at least in cases where the
average cost per day decreased for subsequent hospital days. Once hospitals are
switched to DRG payments, the incentive changes; hospitals are now incentived to
keep LOS low, and I observe this e�ect empirically.
114
Policymakers should take note that hospitals remain sensitive to changes in incentive,
at least along some dimensions. However, they should also consider what implica-
tions these changes in hospital behavior may have on the quality of care provided to
Medicaid patients. Future work should examine the impacts on the quality of patient
care with DRG payments versus other payment mechanisms. In addition, future work
could delve into individual diagnoses to determine how hospitals respond based on
the average change in price. Finally, it would be interesting to use a longer follow up
period to understand the long term impacts of prospective payment when the data
become available.
5.3. Conclusions
The di�erence in results between the two major empirical analyses that comprise this
dissertation are interesting to note. The 2008 policy change represents a reduction
in the reimbursement level, while the 2013 policy change represents a change in the
reimbursement methodology. The former e�ected no statistically discernible changes
in access or intensity of care, while the latter resulted in a reduction in length of stay
consistent with theoretical predictions. Policymakers should note that the introduc-
tion of prospective payment mechanisms (where changes in incentives are clear) have
consistently brought about reductions in length of stay, as observed both in this work
and in the existing literature. On the other hand, changes to payment levels have
brought about a variety of responses that may be context-speci�c, and there is no
consesus in the literature on the impacts of such changes in payments. My results,
together with existing literature, suggest that Medicaid policymakers should strongly
consider reimbursement based incentives, where the impacts are generally consistent
and predictable, rather than changes to payment levels, when contemplating various
policy measures to slow the rate of cost growth associated with Medicaid.
115
BIBLIOGRAPHY
Stuart H Altman, David Shactman, and Efrat Eilat. Could us hospitals go the wayof us airlines? Health A�airs, 25(1):11�21, 2006.
Marianne Bertrand, Esther Du�o, and Sendhil Mullainathan. How much should wetrust di�erences-in-di�erences estimates? The Quarterly Journal of Economics,119(1):249�275, 2004.
John Billings, Nina Parikh, and Tod Mijanovich. Emergency room use: The new yorkstory. The Commonwealth Fund Issue Brief, 2000.
Lawton R Burns, Je� C Goldsmith, and Ralph W Muller. History of Physician-Hospital Collaboration. 2010.
California HealthCare Foundation. California health care almanac: Medi-cal factsand �gures, 2009.
California HealthCare Foundation. California health care almanac: California hospi-tal facts and �gures, 2010.
CMS. Emergency Medical Treatment & Labor Act (EMTALA), 2012. URL https:
//www.cms.gov/Regulations-and-Guidance/Legislation/EMTALA/.
David M Cutler. Cost shifting or cost cutting? the incidence of reductions in medicarepayments. In Tax Policy and the Economy, Volume 12, pages 1�28. Mit Press, 1998.
Leemore S. Dafny. How Do Hospitals Respond to Price Changes? American EconomicReview, 95(5):1525�1547, 2005.
Guy David, Richard C Lindrooth, Lorens A Helmchen, and Lawton R Burns. Dohospitals cross-subsidize? Journal of health economics, 37:198�218, 2014.
California DHCS. Non-contract hospital rate reduction, 2008. URL {http://files.
medi-cal.ca.gov/pubsdoco/newsroom/newsroom\_9855.asp}.
California DHCS. Medi-cal: Update to medi-cal reimbursement reductions - december10, 2009 court action, 2009. URL {http://files.medi-cal.ca.gov/pubsdoco/
newsroom/newsroom\_11172.asp}.
California DHCS. Medi-cal, 2014a. URL http://www.dhcs.ca.gov/services/
medi-cal/Pages/default.aspx.
116

California DHCS. Diagnosis related group hospital inpatient payment methodology,2014b. URL http://www.dhcs.ca.gov/provgovpart/pages/DRG.aspx.
California DHCS. Medi-cal drg payment method frequently asked questions for fy2014-15, 2014c. URL {http://www.dhcs.ca.gov/provgovpart/Documents/DRG/
W416\_CA\_DRG\_FAQ\_FY\_2014-15\_2014-09-11.pdf}.
California DHCS. Spcp - history/archive, 2014d. URL http://www.dhcs.ca.gov/
services/spcp/Pages/default.aspx.
David Dranove. Pricing by non-pro�t institutions: the case of hospital cost-shifting.Journal of Health Economics, 7(1):47�57, 1988.
David Dranove, Craig Garthwaite, and Christopher Ody. How do hospitals respondto negative �nancial shocks? the impact of the 2008 stock market crash. Technicalreport, National Bureau of Economic Research, 2013.
Leslie Eldenburg and Sanjay Kallapur. Changes in hospital service mix and costallocations in response to changes in medicare reimbursement schemes. Journal ofAccounting and Economics, 23(1):31�51, 1997.
A Elixhauser, C Steiner, and L Palmer. Clinical classi�cations software (ccs). U.S.Agency for Healthcare Research and Quality, 2014.
Randall P Ellis. Creaming, skimping and dumping: provider competition on theintensive and extensive margins. Journal of health economics, 17(5):537�555, 1998.
Randall P Ellis and Thomas G McGuire. Hospital response to prospective payment:moral hazard, selection, and practice-style e�ects. Journal of health economics, 15(3):257�277, 1996.
Robert B Fetter, Youngsoo Shin, Jean L Freeman, Richard F Averill, and John DThompson. Case mix de�nition by diagnosis-related groups. Medical care, pagesi�53, 1980.
Austin B Frakt. How much do hospitals cost shift? A review of the evidence. MilbankQuarterly, 89(1):90�130, 2011.
Richard G Frank and Judith R Lave. A comparison of hospital responses to reimburse-ment policies for medicaid psychiatric patients. The Rand journal of economics,pages 588�600, 1989.
Marc P Freiman, Randall P Ellis, and Thomas G McGuire. Provider response tomedicare's pps: Reductions in length of stay for psychiatric patients treated inscatter beds. Inquiry, pages 192�201, 1989.
117

E Greer Gay, Jennie J Kronenfeld, Samuel L Baker, and Roger L Amidon. Anappraisal of organizational response to �scally constraining regulation: the case ofhospitals and drgs. Journal of Health and Social Behavior, pages 41�55, 1989.
Jon Gruber, John Kim, and Dina Mayzlin. Physician fees and procedure intensity:the case of cesarean delivery. Journal of health economics, 18(4):473�490, 1999.
Jack Hadley, Stephen Zuckerman, and Lisa I Iezzoni. Financial pressure and compe-tition: changes in hospital e�ciency and cost-shifting behavior. Medical Care, 34(3):205�219, 1996.
BB Hansen. Flexible, optimal matching for observational studies. R News, 7:18�24,2007.
Richard C Lindrooth, Gloria J Bazzoli, and Jan Clement. The e�ect of reimbursementon the intensity of hospital services. Southern Economic Journal, pages 575�587,2007.
Michael A Morrisey. Hospital cost shifting, a continuing debate. EBRI issuebrief/Employee Bene�t Research Institute, (180):1�13, 1996.
Joseph P Newhouse. Toward a theory of nonpro�t institutions: An economic modelof a hospital. The American Economic Review, pages 64�74, 1970.
Mark Pauly and Michael Redisch. The not-for-pro�t hospital as a physicians' coop-erative. The American Economic Review, pages 87�99, 1973.
Paul R Rosenbaum. Observational studies. Springer, 2002.
Michael D Rosko and Robert W Broyles. Short-term responses of hospitals to thedrg prospective pricing mechanism in new jersey. Medical Care, pages 88�99, 1987.
Richard M Sche�er, Dolores G Clement, Sean D Sullivan, Teh-wei Hu, and Hai-Yen Sung. The hospital response to medicare's prospective payment system: aneconometric model of blue cross and blue shield plans. Medical Care, pages 471�485,1994.
Vernon K Smith. States respond to �scal pressure: State Medicaid spending growthand cost containment in �scal years 2003 and 2004: Results from a 50-state survey.Kaiser Commission on Medicaid and the Uninsured, 2003.
Vernon K Smith. The continuing Medicaid budget challenge: State Medicaid spendinggrowth and cost containment in �scal years 2004 and 2005: results from a 50-Statesurvey. Henry J. Kaiser Family Foundation, 2004.
Vernon K Smith. Medicaid budgets, spending and policy initiatives in state �scal years2005 and 2006: Results from a 50-state survey. Henry J. Kaiser Family Foundation,2005.
118

Vernon K Smith. Low Medicaid spending growth amid rebounding state revenues:results from a 50-State Medicaid budget survey state �scal years 2006 and 2007.Henry J. Kaiser Family Foundation, 2006.
Vernon K Smith. As tough times wane, states act to improve Medicaid coverage andquality: Results from a 50-state Medicaid budget survey for state �scal years 2007and 2008. Henry J. Kaiser Family Foundation, 2007.
Vernon K Smith. Headed for a crunch: An update on Medicaid spending, coverage andpolicy heading into an economic downturn: Results from a 50-state Medicaid budgetsurvey for state �scal years 2008 and 2009. Henry J. Kaiser Family Foundation,2008.
Vernon K Smith. The Crunch Continues: Medicaid Spending, Coverage and Polcyin the Midst of a Recession: Results from a 50-state Medicaid Budget Survey forState Fiscal Years 2009 and 2010. Henry J. Kaiser Family Foundation, 2009.
Benjamin Sommers. Medicaid at 50: Research overview. Presented at 2015 Acade-myHealth Annual Research Meeting, June 14-16, Minneapolis, MN, 2015.
US GAO. Initial results show modest e�ects on medicare payments and no apparentchange in quality-of-care trends. Technical report, oct 2015.
Chapin White. Contrary to cost-shift theory, lower medicare hospital payment ratesfor inpatient care lead to lower private payment rates. Health A�airs, 32(5):935�943, 2013.
Chapin White and Vivian Yaling Wu. How do hospitals cope with sustained slowgrowth in medicare prices? Health services research, 49(1):11�31, 2014.
Chapin White and Tracy Yee. When medicare cuts hospital prices, seniors use lessinpatient care. Health A�airs, 32(10):1789�1795, 2013.
Elaine L Zanutto. A comparison of propensity score and linear regression analysis ofcomplex survey data. Journal of Data Science, 4(1):67�91, 2006.
Stephen Zuckerman, Aimee F Williams, and Karen E Stockley. Trends in medicaidphysician fees, 2003�2008. Health A�airs, 28(3):w510�w519, 2009.
119