
Hospital Profitability: Intrinsic and Extrinsic Factors ...
43
Kwon 1 Hospital Profitability: Intrinsic and Extrinsic Factors The College of New Jersey Jooeun Kwon Spring 2014 Advisor, Prof. M. Naples
Transcript of Hospital Profitability: Intrinsic and Extrinsic Factors ...

Kwon 1
Hospital Profitability: Intrinsic and Extrinsic Factors
The College of New Jersey
Jooeun Kwon
Spring 2014
Advisor, Prof. M. Naples

Kwon 2
Table of Contents
I. Introduction
II. Literature Review
III. Data and Model
a. Data: Extrinsic and Intrinsic Factors
b. Hypothesis
IV. Results and Analysis
V. Conclusion
VI. Future Directions
Kwon 3
I. Introduction
In terms of health care, the United States has consistently been one of the highest-spending yet the worst-performing amongst
the developing countries. In the 1950s, the US was the leading country in healthcare quality, with its spending on par with other
developing countries. However, since then, US healthcare spending been increasing while its healthcare quality decreasing relative to
other OECDs. The US now ranks first in healthcare spending per capita, yet its healthcare system ranks 37th in the world- the bottom
amongst the OECDs (Murray & Frenk, 2010). There is an apparent twofold problem- quality and costs- that must be considered to
understand the structure of the US healthcare, especially as it evolves and advances.
Data trends in the recent decades are alarming indicators of a problem in US healthcare system. Since the enactment of the
Social Securities Act, especially the installment of Medicare and Medicaid, healthcare spending has grown at unprecedented rates.
Since 2010, healthcare spending has grown 9.8% annually, 2.5% faster than the economy. In the 1970s, healthcare took 7.2% of GDP,
grew to 17% in 2012, and is projected to be 20% in 2015 (Kaiser Family Foundation, 2007). Not only are costs skyrocketing, but the
US is consistently underperforming compared to other OECD countries. Data trends since 1974 show that US is falling behind in
major health indicator areas, such as life expectancy, maternal mortality rate, and most importantly infant mortality rate. (Bleich,
Jarlenski, Bell, & LaVeist, 2012).
Kwon 4
Understanding the root causes behind this growing high-cost low-quality paradox is key to identifying greater flaws in the US
healthcare system. The US needs to recognize why its system continually underperforms at such high costs, and where gaps can be
fixed to make healthcare more affordable and effective. The steadily rising costs of the US healthcare system are problematic to the
government and financial wellbeing of the country as a whole, which funds almost half of healthcare spending. This also affects its
citizens who pay increasing taxes and costs in insurance and out-of-pocket payments.
The hospital care sector must be taken most into consideration, as it has the greatest healthcare expenditure at 31.4%, with
growth at 4.9 percent to $882.3 billion in 2012 (National Center for Health Statistics, 2013). Not only is spending high and growing,
but competition gets higher with the advent of non-hospital providers such as emergency care facilities, specialized physician groups,
and commercial clinics. Under the face of increasing competition, hospitals must not only perform optimally in health standards, but
also financially. Poor judgment in terms of allocating healthcare resources, quality of care, and direction can all contribute to financial
losses.
Many studies have focused on understanding the effectiveness and outcome of care in healthcare systems. However, there is no
integrative study of costs that considers multiple aspects of hospitals and care. This study will focus on hospitals as the dominant and
most costly form of health provision. Comparing hospital operating margins (a measure of profitability) against various factors of
healthcare provision and hospital structure will help highlight which factors are most important in considering costs. Factors are
generally divided into intrinsic (provision of care) and extrinsic factors (environmental and organizational structure). Especially with
increased competition, positive revenue is key because it determines the hospital’s ability to sustain itself and grow. Hospitals unable
Kwon 5
to profit and compete in the health industry cannot afford to invest in the latest technology, have to reduce staffing ratios, patient
experience suffers, they lose clients and thus have to close. This compromises the quality and quantity of the most important sector of
our healthcare system- hospitals.
Understanding the structure of hospitals, and the key influences that contribute to growing expenditure is crucial to improving
US healthcare both financially and systematically.
II. Literature Review
A. History
Throughout US history, the healthcare system has continually been in a process of change and reform in trying to balance the
unsolvable triad of costs, quality, and access. Access was initially targeted by policy-makers, as compulsory insurance started in 1915.
But giving everyone access skyrocketed the use of healthcare, especially in times of need during the Great Depression and World War
II. Uncontrolled usage forced the government to start regulating healthcare provision to the neediest, in the form of welfare programs
that eventually became Medicare and Medicaid, through the Social Security Act of 1935. (Sultz & Young, 2009).
Until the Reagan administration, healthcare was paid for by a fixed fee. Under this system, once a patient paid a single set fee,
there was no constraint on the type and amount of service they received. The government and insurance systems had to pay for the
differences in costs, creating massive expenditures for all parties except the patient who only had to pay a fixed fee. As a result,
Kwon 6
Diagnosis-Related Groups (DRG) were implemented by the government and some private insurance companies. (Bezruchka, 2012).
This system reimburses institutions based specifically on the patient diagnosis, and losses and profits were incurred based on length of
stay relative to standards of the diagnosis (Sultz & Young, 2009).
The DRG revolutionized healthcare by introducing profits and losses for care- i.e., market conditions- to the healthcare system.
The DRG standards were based on average patient data, so if the actual patient did not require as much care as the DRG allowed,
hospitals still were compensated for the full treatment despite not having expended as much, making them profitable. Likewise,
hospitals that used more treatment for a patient than the standards of DRG faced losses, since they were not compensated for excess
services. With the DRG and Medicare plan, hospitals found room to profit by providing the quickest and least costly services as
possible while delivering the same outcomes.
With increased pressures of competition and high costs, avoiding loss became a motive for many healthcare institutions. They
had to transform themselves to meet the DRG standards and compete more effectively against other institutions, such as private
specialties, retail clinics, and physician groups. Costly, loss-incurring hospitals became severely limited in service provision or had no
choice to close down. Thus, with limited funds, hospitals had to allocate resources effectively to various departments, while
maintaining the quality provided by other institutions to draw in patients. The profitability of a hospital thus measures their financial
stability and also their provision of service- measuring hospital’s likelihood of survival (Sultz & Young, 2009).
B. Factors in Healthcare Finance

Kwon 7
In financing healthcare, various factors can directly and indirectly influence hospital’s revenues and thus profitability. This
study aims to look at patterns of hospital profitability influenced by two categories of factors: internal and external. Internal factors
include properties contained in the hospital, such as performance, quality, and decisions made within the hospital. This aspect
questions whether hospital financial performance is more related to the services provided, such healthcare workers and their quality of
performance. External factors include structural and uncontrollable factors, such as the environment the hospital is in, economies of
scale, and the regulations the hospital must abide by.
i. Technology and Specialty
With the growth of scientific and medical knowledge, technological advances have increased the effectiveness of treatment.
Imaging technology such as the Computer Tomography and Magnetic Resonance Imaging scan has taken diagnosis to a new level,
permitting specific tissues and regions to be targeted. The CT scan uses x-rays to give a cross section image of a specific organ or part
of the body. The MRI scan uses radio waves to produce detailed images inside the body which helps in detecting even the minutest
changes. These are only a few technological advances that help better diagnose and monitor the human body. However, up-to-date
technology requires a high capital investment, expensive software and hardware, and highly-trained personnel (Sultz & Young, 2009).
As technology becomes more advanced and required significant investment in equipment and training, it becomes more
profitable for medicine to specialize. Unlike other healthcare systems, the US has no ban on patient self-referrals. Also, in a developed
country like the US, patients value and demand advanced technology. Thus to keep up with demands and competition, medicine
Kwon 8
becomes more specialized and advanced therapeutic and diagnostic services are carried out more than necessary, contributing to the
cost (Sultz & Young, 2009).
ii. Aging Population, Medicare, Reimbursement
Insurance and the growth of the aging population are linked through Medicare, and both play a major role in shaping hospitals.
Most patients who require inpatient care are 65 or older. The elderly population makes up a third of hospital stays, and half of all care
in hospitals (Sultz and Young, 2009). The elderly population also stays two times the average stay. Since the government funds almost
half of healthcare spending, predominantly through Medicare and Medicaid, the elderly population plays a significant role in costs for
both the government and hospitals (Sultz & Young, 2009).
The reimbursement plan for the Medicare population significantly shapes hospitals through cost constraints. Hospitals can
come in private, for-profit, and nonprofit forms (Table 1). However the government as payer and the DRG-reimbursement system
gives eligible hospitals, regardless of their hospital type, opportunities for-profits and loss based on their performance. Amid the
financial struggle and competition of hospitals, this may shift the focus of many hospitals as profit seeking, to avoid being among the
one-third of hospitals which are failing financially (Sultz & Young, 2009, p. 77). This may especially be problematic when
considering Medicare Part B, which reimburses physicians by paying fees for service, meaning physicians get paid based on how
much services they provide. Thus physicians and healthcare personnel may refer and prescribe more treatments than necessary for
higher pay (Sultz & Young, 2009).
Kwon 9
iii. Socioeconomic Environment
a. Conceptual Models in Healthcare Analysis
Models and studies are needed to understand better the system of healthcare, and the root causes of discrepancies among
different healthcare systems. Disparities in healthcare are important to analyze because they reflect a deeper societal system that may
be unjust and inefficient at distributing necessary resources to support health and wellbeing. However, accurately analyzing health
systems is difficult because many causes are interrelated and difficult to isolate, as they are rooted in institutional, social, and cultural
factors (Roux, 2012).
There are four major conceptual approaches in studying health disparities: the genetic model, fundamental-cause model,
pathways model, and interaction model. The genetic model focuses on hereditary factors as the main source of health patterns.
However this is a poor proxy as certain genetic patterns are difficult to identify due to the lack of genetic explanations/links to
common diseases (Roux, 2012).
On the other hand, the fundamental-cause model takes social conditions into consideration. Those in higher socioeconomic
conditions have more flexible, wide-ranging sources of knowledge, money, and social connections. Thus they have the advantage of
avoiding or healing disease by early prevention or at the prognosis stage [define]. Where the fundamental-cause model focuses on
distal factors, the pathways model focuses on mediating mechanisms. Factors within our control, such as physical activity, substance
use, and psychosocial aspects, all mediate the impact of our genetic factors on our health conditions (Roux, 2012).
Kwon 10
Finally, the interaction model emphasizes how social contexts can bring out specific genetic elements. Though this model
integrates many key elements of the previous models, it is difficult to identify replicable interactions, as the genetic and social context
can vary significantly. In considering the various conceptual models, it is important to integrate different key elements of various
models. Analyzing health in terms of biological/genetic factors, while considering key social and behavioral factors is key in
understanding a more holistic view of health (Roux, 2012).
b. Factors in Population Health: Sociodemographic factors
Various studies have shown that racial and socioeconomic factors contribute most to people’s health status. In a study of the
US, UK, and other OECDs, time trends have shown that the gap between the best and worst countries are narrowing in overall health
indicators, such as life expectancy. However, the gap for other more specific health indicators, such as diabetes prevalence, is
widening. This study defines factors that cause the growing gap, in order to eliminate avoidable mistakes in systematic planning in
healthcare (Bleich, Jarlenski, Bell, & LaVeist, 2012).
A wide range of literature reviews confirm that when holding constant sociodemographic factors, insurance status, and clinical
needs, the only remaining statistically perceptible differences are racial and systematic. However, racial factors are difficult to isolate
and analyze because race and socioeconomic factors are confounded. As most minorities have lower socioeconomic status, SES is a
good overall measure of these factors (Bleich, Jarlenski, Bell, & LaVeist, 2012).
Kwon 11
In a study of a racially-integrated communities without income differences among the races, differences in specific health
categories, such as hypertension, obesity, and diabetes were absent or small, compared with the national average. The study found that
risk factors, such as drinking, smoking, lack of exercising and of fruit/vegetable consumption, are greatest in the least-educated
community. The most-educated community had the lowest metabolic factors of obesity, diabetes, and hypertension, and lowest risk
factors (Bleich, Jarlenski, Bell, & LaVeist, 2012). Metabolic factors, especially obesity in the US, are crucial because they are
pathways to more severe chronic diseases. The rise in obesity and obesity-related chronic diseases were identified as the two major
contributors to high healthcare spending (Bleich, Jarlenski, Bell, & LaVeist, 2012).
Another study confirmed that unemployed Americans, especially those of no education or not receiving unemployment
benefits, had the poorest health. Higher income, job status, education, and job security were found to be the most significant aspects of
better health (Bleich, Jarlenski, Bell, & LaVeist, 2012).
While racial factors were deemed significant, they are not a reliable measurement for health discrepancies. Immigrants
constitute a large portion of the US population, especially today when births in developed countries like the US are declining. Except
for infant mortality, which was consistently lowest in Hispanics, socioeconomic status is the more determinant factor of health
(Bleich, Jarlenski, Bell, & LaVeist, 2012). In considering US health conditions since the 1950s, the Annual Review of Public Health
study by the nonprofit scientific publisher Annual Reviews, shows that income and economic inequalities are the most important
factors in population health. Because the US is a multifaceted diverse country, it is open to a wide range of genetic and social
behaviors that affect health. Thus it is not the racial factor but the equality factor that measures health discrepancies among the diverse
Kwon 12
population. Social behaviors, such as smoking or stress are more common in low income populations. Lack of attention in early life
stages also contribute to the development of social habits (such as eating, smoking, and drinking), which affects the population’s
health (Bezruchka, 2012).
iv. Profit Seeking Behavior and Type of Hospital
Medical spending, primarily hospital costs, are the leading components associated with increased healthcare spending. With
competition between hospitals and other health institutions increasing, all hospitals are limited in funds and left at risk of debt or
shutdown. With federal and private insurance reimbursement methods that leave room for-profit and risk for loss, hospitals want to
shift their care to avoid losses. While all hospitals do not want to struggle financially, for-profit hospitals are specifically motivated to
make profits.
In a study observing hospitals shifting to for-profit status, it was found that profit-seeking hospitals will lower quality in not
readily observed ways. Within one or two years, patient mortality increases, hospital profitability increases, and staffing decreases.
Though these observations are not yet shown in government or nonprofit hospitals, profit-seeking behavior in hospitals encourage
exploitation of market power, through price increases or lower quality of care. In a competitive environment, hospitals cannot raise
prices, so they lower quality while maintaining the same health outcomes. (Picone, Chou, & Sloan, 2002)
In contrast, another 11-year study that measured heart attacks shows that the for-profit status of hospitals benefits medical
productivity, as they produce the same results with lower expenditure. Profits provide greater incentives for hospitals to provide more
Kwon 13
cost-effective care (Kessler, 2002). Thus, if hospitals retain good outcomes of care, a profit seeking motive may help hospitals be
more conscious of costs and be more stable financially.
v. Emergency Care
Since the 1980s, inpatient days have declined by a third, which is correlated with 2000 hospitals closing. This has pressured
hospitals to focus more on emergency care, requiring more specialized diagnosis and treatment methods (Sultz & Young, 2009). Thus
hospitals with emergency care services may provide more pertinent care to the increasing outpatient population today.
vi. Technology
In contrast to the limiting effects of Medicare reimbursement, one study has shown that increasing Medicare population
encourages hospitals to supply more capital, and use greater technologically advanced methods when providing inpatient care
(Bradford & Craycraft, 1996). This is significant considering that the elderly population makes up a third of inpatient stays and half of
inpatient days. Innovative technology is not only funded by Medicare, but also by other private and public insurance, which provide
assurance to researchers and suppliers for further innovation, as well as hospital investment and use. Combined with consumer
demand for innovative treatment methods, and providers’ desires to provide improved care, there is an increased use of advanced
medical technology despite its high costs (Kaiser Family Foundation, 2007).
vii. Horizontal Mergers
Finally, various studies have shown that horizontal mergers are rising among hospitals. Mergers come in the form of systems
and networks, in which a central institution or organization ties many hospitals together. The nature of systems and networks vary, and
Kwon 14
can be based on location (state), hospital type (for-profit, non-profit, government), and other qualities. Instead of hospitals each
working as individual institutions, mergers allow hospitals to communicate and share information, resources, and planning. As groups
of hospitals purchase resources and personnel as one entity, the individual purchasing power of the hospital increases when
participating in groups. This also gives them economies of scale, as a network of connected hospitals increases their scale in both
purchasing and provision of care. In addition, networks set some basis of standards within the hospitals under one name. Thus patients
can attain better more organized information of hospitals through networks, which helps in promoting hospitals and their services.
(Ferrier & Valdamanis, 2004) (Sultz & Young, 2009) (Harris, Ozgen, & Ozcan, 2000).
viii. Hospital Quality and Efficiency
Along with up-to-date medical technology, a variety of measures constitute hospital quality. The IOM, The Institute of Medicine:
an independent non-profit organization committed to providing unbiased opinion, has identified 6 aims for quality health: safety,
effectiveness, patient-centered care, timeliness, efficiency, and equity (Rowley & Hogan, 2012). Understanding how well a hospital
performs and provides services is a crucial factor in measuring their financial stability.
ix. Patient Satisfaction
As the healthcare industry enters into more market-like conditions, facing competition and price pressures, the consumer
perspective is playing a larger role, as consumers are given more choices and decisions in their healthcare. Thus, along with health
outcomes, consumer perspectives are another way of measuring hospital quality (Sultz & Young, 2009).
Kwon 15
Patient perception of quality is a rising measure of hospital performance. Though patient surveys cannot be objectively analyzed
based on numerical measures, they generally reflect the quality of interpersonal experience, such as communication, which is vital to
effective workings of a complex facility with numerous divided roles.
Skepticism concerning that patient experience may be biased by personal views on appropriate medical treatment at odds with
the doctors’ choices, or medical adherence (doctors did what they could but patient failed to respond) proved irrelevant. Patient-
experience ratings of particular procedures or instances were uncorrelated with volume of orders requested by patients or health
outcomes. However, when considering the entire patient visit and experience as a whole, ratings were consistently correlated with
accepted outcome measures. Measures concerning to nursing care and communication were especially predictive of outcomes
(Manary, Boulding, Staelin, & Glickman, 2013). Patient perception is not only important measure of hospital performance, but is
getting more important as patient roles are becoming more consumer-like in the face of more healthcare options.
III. Model & Data
As the literature above, there are various aspects that contribute to how a hospital works and costs associated with each hospital’s
care of service and type. Hospitals are more and more concerned with cost reduction, as their net revenue determines their survival in
the industry. Consumer choices expand as specialized medical services and retail services provide higher quality or lower-cost care, so
hospitals must compete with other facilities in terms of both quality and costs. Thus, like other markets, the net revenue of a hospital is
Kwon 16
becoming more important. Cost pressures are forcing hospitals to improve productivity, and eliminating those that are not.
Understanding the root cause and determinants of profitability answers bigger questions, such as whether financial status is
determined within the hospital or whether there is a bigger fundamental pattern in the healthcare market.
The model will focus on two broad factor categories determining net hospital revenue: extrinsic and intrinsic. External factors
include the socioeconomic status of hospital location (population, education status, & median household income of the city, and state),
hospital type (acute care, critical access, children’s hospital, veteran’s), hospital ownership (government, proprietary, voluntary-
nonprofit), and affiliation with mergers or systems (alliance). Internal factors include hospital effectiveness of care (readmission
rates), quality of care (hospital survey), efficiency of care (timeliness and correct procedures for emergency and critical conditions),
rate of serious complications (wound opening after surgery, wrong surgical procedure, etc), bedsize, and medicare spending ratio
(measures how much is spent on Medicare patients compared to a standard average)
Net Revenue = f(external, internal) = f(city socioeconomic characteristics, state, hospital type, hospital ownership,
alliance, presence of emergency services, hospital size, effectiveness of care, quality, efficiency of care, emergency service
care, rate of serious complication, Medicare spending)
In order to test this relation of hospital revenue to quality and productivity, I will run a regression on net hospital revenue with the
states indicators.
A. Explanatory Variables & Data Collection
Kwon 17
Due to heavy involvement of government and private-insurance companies with hospital facilities, there are various sources of
publicly available data on hospital ratings for people to research and utilize when choosing their healthcare facility. One of the largest
databases is Hospital Compare, which lists every hospital by region and rates hospitals based on several categories. Operating Margins
will be collected via each state’s department of health.
States were chosen based on financial data, because these were the most unavailable data. The five states chosen were
California, Connecticut, Massachusetts, Oregon, and Vermont. This selection provides an interesting group of study, because of the
diversity of the states.
i. Hospital Profitability
Profitability was measured as the operating margin, the revenue left after operating expenses, as a ratio of operating revenue.
This was collected through the financial statements of the hospitals provided by the State Department of Health for each of the states.
EXTERNAL FACTORS
a. SES & Population
As shown by the literature, socioeconomic status is a big factor in prevention and better choices in health, which will affect the
services demanded of the hospital. Also, population plays a role as larger heavily populated cities have a higher flux of people and
resources. SES data was collected as median hospital income of the city the hospital was located in. Education was measured as the
Kwon 18
percent of population educated beyond high school in the city. Finally, population for each of the hospital cities was gathered. All data
was gathered from the US Census Bureau.
b. State
Each state is like a microcosm of a healthcare system, with their own regulations and controls of hospitals. Four states were
selected based on availability of financial data: California, Connecticut, Massachusetts, Oregon, and Vermont. Massachusetts was an
interesting state since it had already enacted universal healthcare system. Hospitals for each state was collected using American
Hospital Association Guide, and assigned dummy variables (CA=0, CT=1, MA=2, OR=3, VT=4).
c. Hospital Ownership
Hospital ownership shows whether the structural differences in the hospital and regulations affects profits. The three types are
federal, for-profit, and non-profit. Federal hospitals are defined as those operated by the Department of Defense, the Department of
Health and Human Services, and the Veterans Health Administration. For-profit hospitals are considered facilities owned by private
investors or publicly by shareholders that are a part of a company that issues shares of stock to raise revenue to expand the hospital
activities. Finally, not-for-profit hospitals abide by state and federal guidelines to provide community benefits and operate as a
charities, and thus are exempt from state and local property taxes and federal income taxes. Data was gathered from the American
Hospital Association Guide, and assigned dummy variables (Federal=0, For-profit=1, Not-for-Profit=2).
Kwon 19
d. Hospital Type
Hospital type is categorized as acute care, psychiatric care, and children’s hospitals. Acute care is the most prevalent type of
hospital, and gives most range on health needs. Determining whether different hospital types have a significant factor will indicate
whether the acute care direction is profitable. Data was gathered from Medicare, and assigned dummy variables (acute care=0,
psychiatric=1, children’s hospital=2).
e. Hospital Size
Hospital size is measured as bed size, and will help determine whether economies of scale within the hospital affects finances.
Data was collected through the American Hospital Association Guide.
f. Alliance
Alliance categorizes hospitals that are affiliated with mergers, systems, or networks. This variable will measure if joint
networks of hospitals affect profitability, and have economies of scale. The data was collected as dummy variables (Alliance: yes=1,
no=0) from the American Hospital Association Guide.
g. Emergency Care Service
Presence of an Emergency Care Department is important as inpatient ratios are decreasing, and many care services are outpatient.
Emergency care is also important in that it serves un-insured population, and also the most critical conditions, which may be the most
costly. Data was collected from Medicare as dummy variables (Emergency Service: yes=1, no=0).
INTRINSIC FACTORS
Kwon 20
a. Effectiveness of Care
Effectiveness of care was measured by average the readmission rates of the most severe conditions: stroke, heart attack/failure, and
pneumonia. Data was collected by Hospital Compare from the Center for Medicare and Medicaid Services.
b. Process of Care
Process of care measured the efficiency of care service, considering factors such as amount of time appropriate medication was given
before and after treatments and percentage of patients given the appropriate treatments. Data was collected from Hospital Compare
from the Center for Medicare and Medicaid Services.
c. Quality of Care
Hospital Compare gives the percentage of patients who gave satisfactory responses to various conditions, such as communication,
satisfaction of needs, accessibility, cleanliness, recommendations, etc. Based on these factors, Hospital Compare gives hospitals a
score of quality.
d. Technology
Technology, mainly MRI and CT scans are costly to operate. Technology measures how CT scans and MRI are utilized in the
hospitals, including when they are referred for diagnosis, whether if other diagnostic measures were taken before using the scans, and
whether these scans were used in combinations to prevent redundant scans. Data was collected from the Hospital Compare.
e. Medicare Spending Per Patient
Kwon 21
Medicare spending per patient measures hospital cost effectiveness as a ratio of average spending per Medicare patient
compared to a national standard. A ratio of 1 would indicate that the Medicare spending is same as the national standard, below 1
would indicate that the hospital spends less on the Medicare patient and is thus cost efficient, and above 1 indicates that the hospital
spends more than the national standards, meaning they are not cost efficient. Data was collected from Medicare.
f. Emergency Care
Emergency Care measures various factors, such as time taken to be evaluated by healthcare professional, time to diagnosis,
and time to treatment. This data was collected from Medicare.
g. Serious Complications
Rate of serious complications, such as an open wound, wrong surgery, or improper treatment, was measured as average rates
of total patients by category. Data was collected from Medicare.
h. Hypothesis
Based on the literature and available data, the prediction is that hospitals with better performance and outcomes will have
higher profits since they are better at providing services. Also, bigger hospitals will have higher profits due to economies of scale.
Finally, hospitals with lower Medicare spending ratios will have more profit because they are more cost efficient (Table 3).
In considering external factors, hospitals that are affiliated with mergers are predicted to have higher profits due to economies
of scale and increased market power. Also, hospitals located in higher SES and population cities will be more profitable, because they
have patients who respond better and can pay for their treatments, and also a higher number of patients. Hospitals with emergency
Kwon 22
services and acute care hospitals should perform better financially because this services is crucial for outpatients and most patients are
categorized into acute care. It also predicted that for-profit hospitals should be most profitable, since they are profit seeking and more
conscious of costs (Table 4).
IV. Results & Analysis
a. Initial Data Analysis
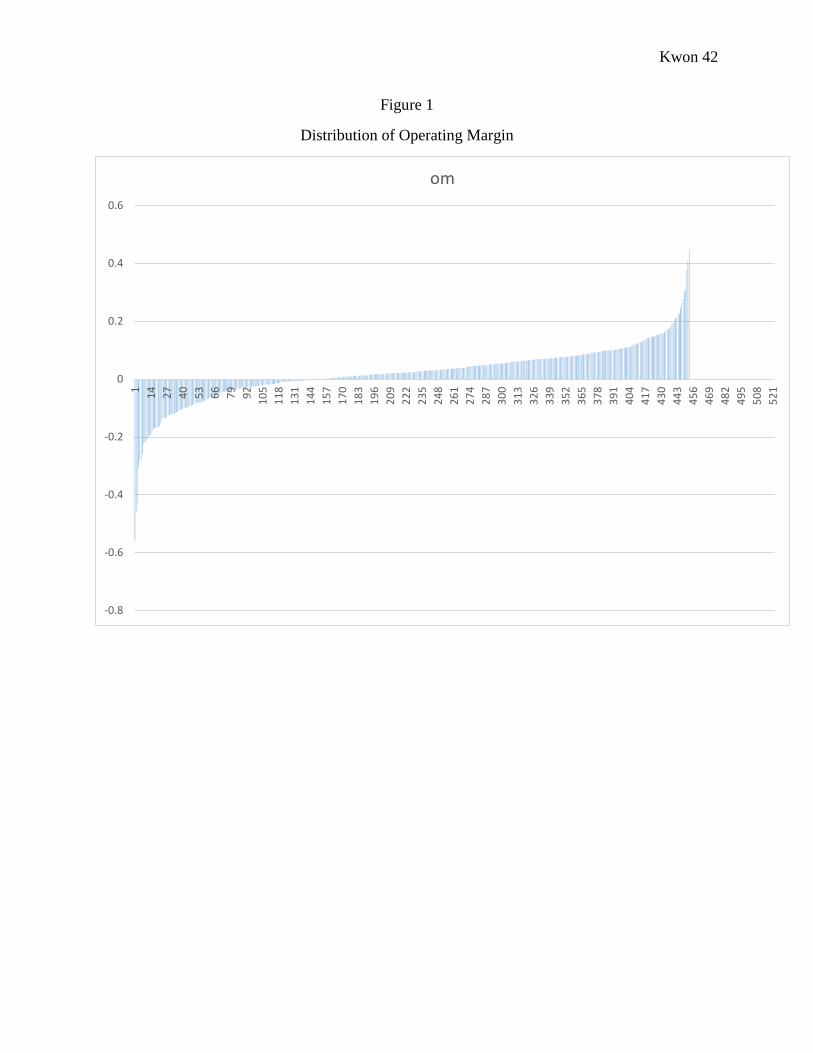
Distribution of operating margins of the hospitals were skewed right (Figure 1), showing that most hospitals do make a profit.
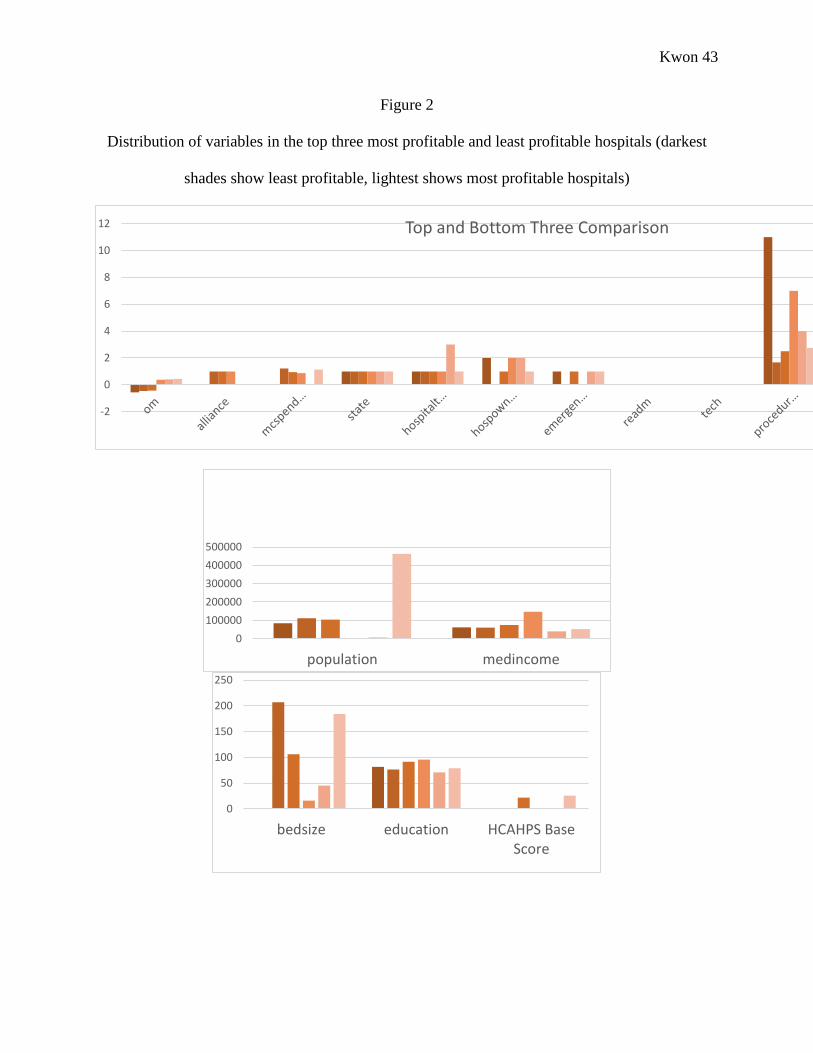
Comparing the data of all variables in the most profitable and least profitable hospitals show that there are no immediate patterns
among any of the variables and the profits (Figure 2).
b. OLS Multiple Regression
First an OLS regression was run including all variables. Dummy variables were assigned to hospital type, hospital ownership,
state, and availability of emergency service. The VIF test was run to check for multicollinearity, and showed there was
multicollinearity present, especially among the state variables1. The Breusch Pagan Test showed that heteroskedasticity not was
1 Mean VIF: 7.75 (Stat1: 61.20; Stat2: 38.08; Stat2:20.39; Stat4: 10.44)
Kwon 23
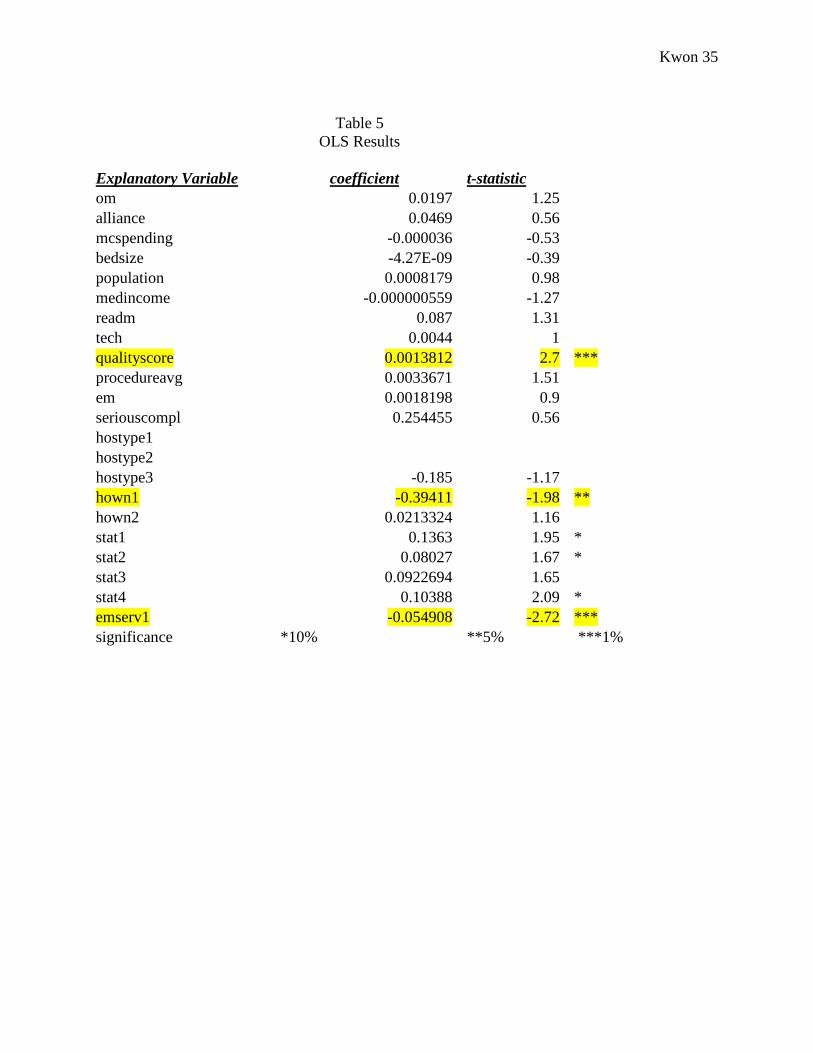
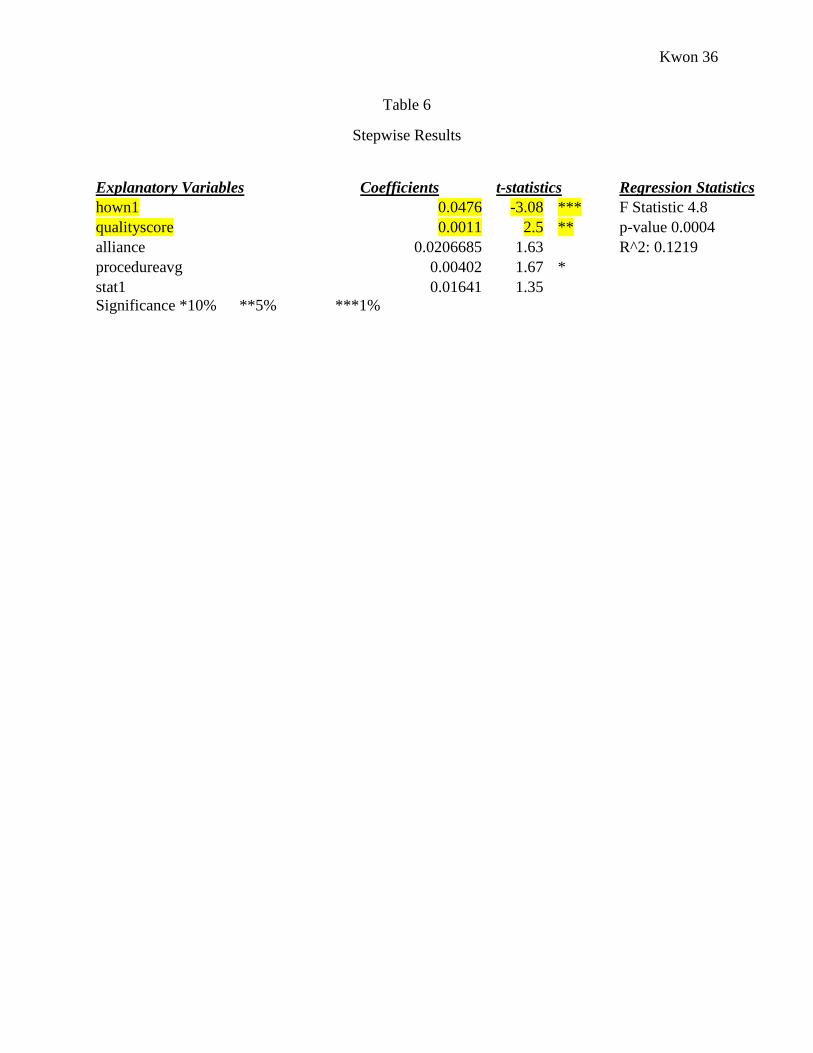
present2. Significant results are shown in Table 5 and 6. Quality, the presence of emergency services, and federal ownership had
significant coefficients with the expected signs.
c. Log-Log Regression
Because the dependent and many other explanatory variables are rates and percentages, both the dependent variable and
specific explanatory variables were logged and regressed to extend the tails of the distribution. The VIF test showed collinearity was
present mostly in the state variables since they were dummy variables, but not significantly in other variables3. The Breusch Pagan test
showed that there was heteroskedasticity in this version of the analysis, so a robust regression was run4. Also, to rank explanatory
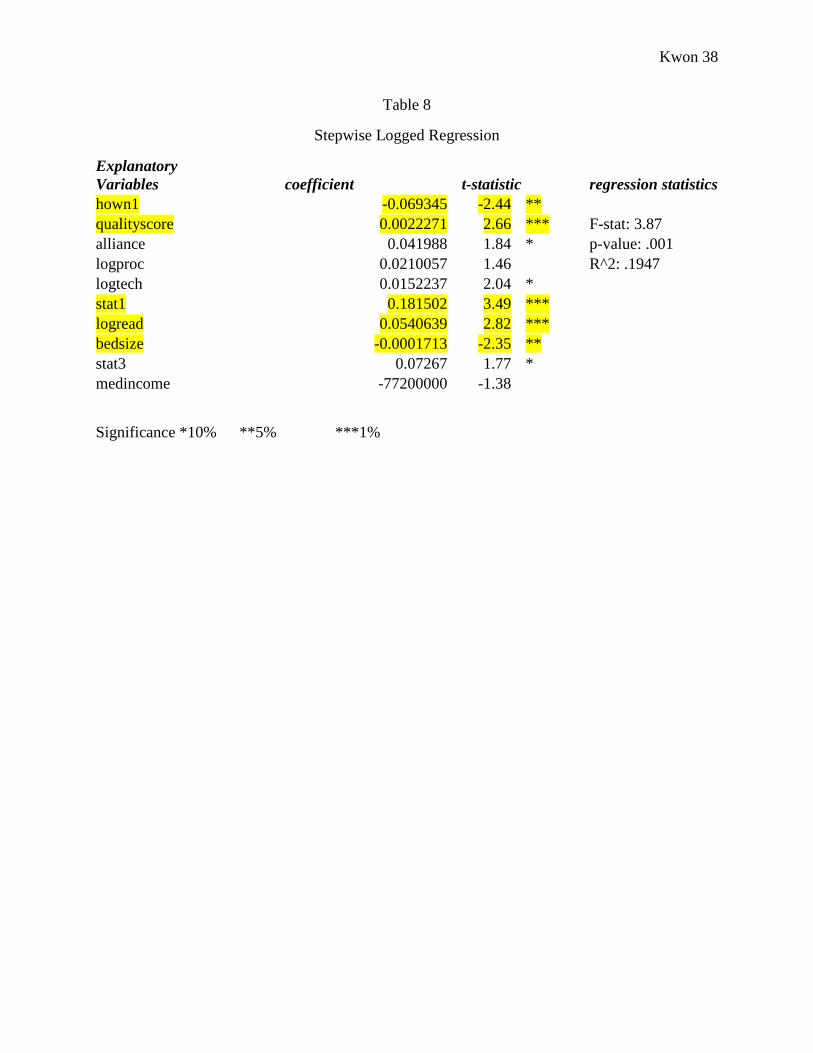
variables, a stepwise regression was done (Table 8). Bed size, readmission rates, quality, federal ownership, technology, and state
showed to be significant variables.
d. Massachusetts Regression
2 BP Test: chi2(1): 1.11 p-value: .2930 3 Mean VIF: 6.51 (Stat1: 48.81; Stat3: 28.74; Stat2:17.03; Stat4: 7.37) 4 Breusch Pagan test: chi2(1) = 9.65 p-value= .0019
Kwon 24
A separate regression was run on Massachusetts, since this state has special healthcare coverage, providing universal health
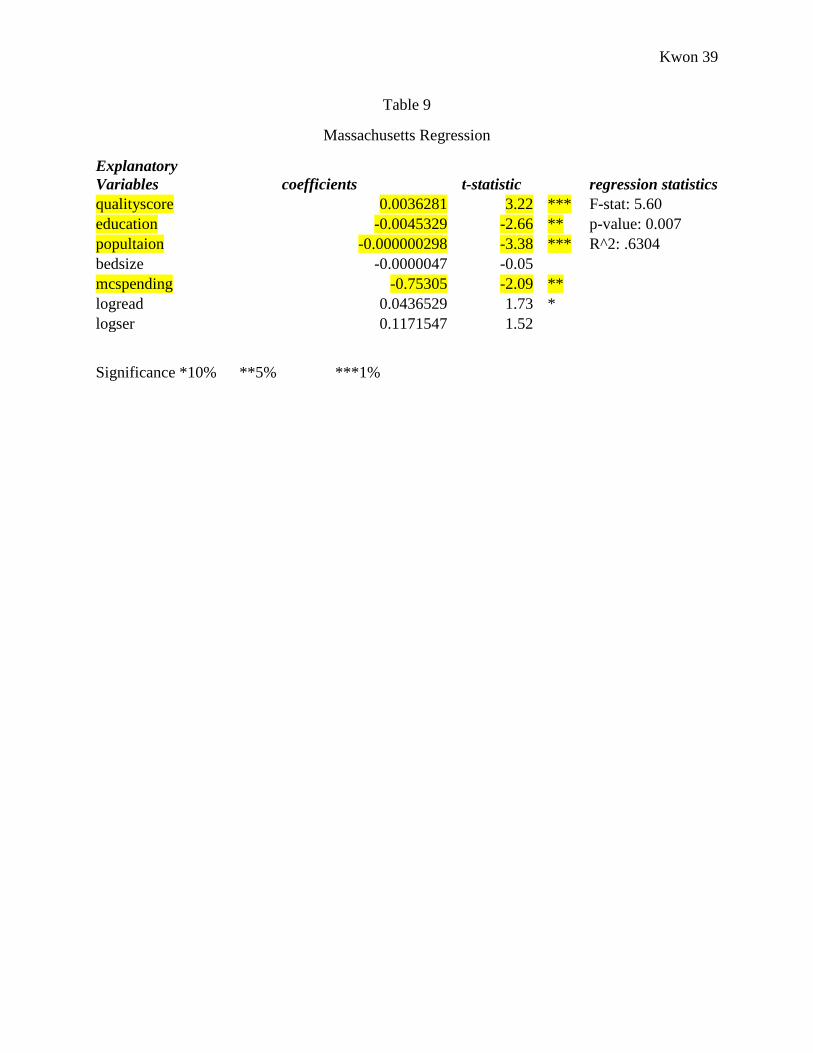
insurance. There was heteroskedasticity present, so a robust regression was run. Also, to rank explanatory variables, a stepwise
regression was done. Significant results are displayed in Table 9. Quality, education, population, and Medicare spending were the
significant variables.
V. Discussion
OLS Regression
The OLS regression showed that quality, EM service, and federal ownership were significant factors in hospital profitability.
Increase in quality raised profitability, as predicted by the hypothesis. The presence of emergency services was shown to decrease
operating margin, which was different from the hypothesis that predicted emergency service should increase profitability since it treats
patients with critical conditions and under all circumstances. However, profitability decreasing with the presence of emergency
services may indicate that the high cost of treating emergency critical conditions may be financially damaging to hospitals.
Finally, ownership type was significant, as federally owned hospitals were less profitable than for-profit or not-for-profit
hospitals. This was different from the hypothesis, which predicted that only for-profit hospitals would be profitable. Federal hospitals
may not be profitable because they support most government-provisioned services, including Medicare, Medicaid, Veterans, and other
government services. They are tightly regulated by the government so are not as independent in acquiring resources and setting
Kwon 25
regulations as for-profit hospitals. For-profits may not be such a significant factor as thought, so the profit motive may not be as
important. Also, non-profit hospitals may be not be so prone to loss because they still function as independent hospitals while being
exempt from government taxation.
Multicollinearity, especially between the states, was present. This is because there are only five states used, of which CA has
most observations in. Since the states were assigned dummy variables, CA having a wide majority of hospitals affects the dummy
variables of other states. This shows that states may not be a significant predictor of profitability, due to the nature of this dataset.
Log-Log Regression
The log-log regression showed that other variables are significant. This regression is a better model that reflects the nature of
the data, since many variables and dependent variable are in rates. This regression showed that readmission rates, quality, ownership,
technology, state, and bed size were significant.
Unlike the prediction, the coefficient of readmission rates was positive, indicating that a 0.6% increase in readmission rates
would increase operating margin by 1% (Table 7). The hypothesis was that hospitals with lower readmission rates would have greater
profitability, because they had more effective outcomes of care and was a better performing hospital. Also reduced readmission would
decrease redundant treatments. However, the positive coefficient may indicate that profitability is not as related to performance, as
number of services- linking back to the fee for service payment. Readmission increases number of patients and treatments given, thus
more services are given to the same patient. Thus, hospitals and physicians are reimbursed for the increase in services and treatments
they provide, despite ineffective outcomes.
Kwon 26
This outcome is similar to technology, as higher use of technology increased profits. A lower rate of use in technology
indicates more efficient usage, because lower rates means that hospitals are using technology only when needed. However, results
show that a 1.5% increase in technological use would increase profits by 1% (Table 8). Similar to the readmission rates, increased
technological use is reimbursed under a fee for service payment, meaning that the more technology is used, the more hospitals and
doctors get reimbursed. Although lower and more efficient usage is ideal in hospitals, the healthcare reimbursement system may
contribute to a more ‘wasteful’ system of care as increased use brings more profits.
As predicted, quality had a positive impact on profitability, showing that quality perception in patients is important. However,
because the nature of this variable is personal surveys, it is hard to distinguish survey biases due to personal reasons and responders’
health status.
State also had an impact, as the state of California was shown to be more profitable. Each state is under a different subset of
regulations, so this may indicate that a system such as California’s health may promote profitability.
Unlike the hypothesis, increasing bed size seemed to decrease profits, signifying that economies of scale within the hospital
may not exist. Bigger hospitals may actually be less cost-efficient, contributing to their lowering their profitability.
The most surprising variable was ownership. Unlike the hypothesis that predicted that for-profit hospitals would be most
profitable, the results showed the federally-owned hospitals were least profitable, as stated in the simple regression model.
Multicollinearity, especially among the states was once again present, for similar reasons stated above. This shows that states
are not a reliable predictor of profitability due to the nature of this dataset.

Kwon 27
Other Regressions
The separate Massachussetts regression showed interesting results. Quality, education, population, and medicare spending
ratios were important variables in measuring profitability. As was true above, quality was a positive indicator of operating margin.
Unlike the prediction, population and education were negative indicators of profitability. More educated population may decrease
profitability because highly-educated people can prevent disease and respond to treatments better, reducing the need for care. The
negative population coefficient may be related to the universal healthcare coverage. If a hospital is located in a bigger population of
insured members, and getting less profits, this may indicate that a greater flux of insured patients may be lowering profitability.
Medicare spending ratio has a negative coefficient, which means that more cost-efficient hospitals have higher profitability (as
a lower medicare spending ratio means greater cost efficiency), as predicted.
Overall, the results indicate that increased treatments (higher readmission rates and technology use) contribute to higher profits
despite lower effectiveness of care, showing that there may be a systematic flaw in reimbursement methods. Also, quality is an
important factor from the patient side as well as for hospital profitability. Economies of scale did not prove to be signficant or helpful,
as the presence of alliances was not signficant, and bigger hospitals were less profitable. Also, procedures of care, emergency care,
and serious complication rates were not significant, which may indicate that the particular services that the hospitals provides do not
impact costs. Rather it is the frequency of treatments and other systematic components that contribute more to hospital finances.
Kwon 28
VI. Future Directions
Future directions for this study would be to go more in depth with the variables. Since key components affecting profitability
were highlighted, the next direction would be to question why these components impact profits. Investigating more on the type of
technology used and whether the hospital has specialized technology is important to study, since there is a trend toward specialization.
Also, specific data such as insurance type and claim filing methods were not available, but may be important in considering how a
hospital handles its finances. Considering the type of insurance is important in understanding how reimbursement plans affect hospital
finaces, since each insurance company may have different protocols. Also this will help show which insurance type has the biggest
impact on hospital profitability. Alos, there may be flaws in the claim filing methods so investigating how a hospital files its claims
(electronically, manually), and number of errors will help show how important this step is to hospital finances.
Kwon 29
Works Cited Bezruchka, S. (2012). The Hurrider I Go the Behinder I Get: The Deteriorating International Ranking of US Health Status. Annual
Review of Public Health, 157-73.
Bleich, S. N., Jarlenski, M. P., Bell, C. N., & LaVeist, T. A. (2012). Health Inequalities: Trends, Progess, and Policy. Annual Review of Public Health, 7-40.
BMJ. (1954). Measuring Hospital Efficiency. The British Medical Journal, 570-71.
Bradford, D., & Craycraft, C. (1996). Prospective Payments and Hospital Efficiency. Review of Industrial Organization, 791-809.
Ferrier, G. D., & Valdamanis, V. G. (2004). Do Mergers Improve Hospital Productivity. Journal of Operational Research and Society, 1071-80.
Harris, J., Ozgen, H., & Ozcan, Y. (2000). Do Mergers Enhance the Performance of Hospital Efficiency? Journal of Operational Research Society, 801-11.
Kaiser Family Foundation. (2007, March 2). Snapshots: How Changes in Medical Technology Affect Health Care Costs. Retrieved from The Henry J. Kaiser Family Foundation: http://kff.org/health-costs/issue-brief/snapshots-how-changes-in-medical-technology-affect/
Kwon 30
Kaiser Family Foundation. (2007, March 2). Snapshots: How Changes in Medical Technology Affect Health Care Costs. Retrieved from The Kaiser Family Foundation: http://kff.org/health-costs/issue-brief/snapshots-how-changes-in-medical-technology-affect/
Kessler, D. P. (2002). The Effects of Hospital Ownership on Medical Productivity. RAND Journal of Economics, 488-506.
Manary, M. P., Boulding, W., Staelin, R., & Glickman, S. (2013). The Patient Experience and Health Outcomes. The New England Journal of Medicine, 201-203.
Murray, C. J., & Frenk, J. (2010). Ranking 37th- Measuring the Performance of the US Health Care System. The New England Journal of Medicine, 98-99.
National Center for Health Statistics. (2013). Heath, United States, 2012: With Special Feature on Emergency Care. Washington DC: US Government Printing Office.
Picone, G., Chou, S.-Y., & Sloan, F. (2002). Are For-Profit Hospital Conversions Harmful to Patients and to Medicare? RAND Journal of Economics, 507-23.
Roux, A. V. (2012). Conceptual Approaches to the Study of Health Disparities. Annual Reveiw of Public Health, 41-58.
Rowley, D. L., & Hogan, V. (2012). DIsparities in Infant Mortality and Effective, Equitable Care: Are Infants Suffering from Benign Neglect. Annual Review of Public Health, 75-87.
Sultz, H. A., & Young, K. M. (2009). Health Care USA. Ontario: Jones and Bartlett Publishers .

Kwon 31
Appendix
Table 1
Number of Hospitals by Ownership Type
1980 1990 1999 2000
All Hospitals 6965 6649 5890 5810
Non-profit 3322 3191 3012 3003
For-profit 730 749 747 749
Kwon 32
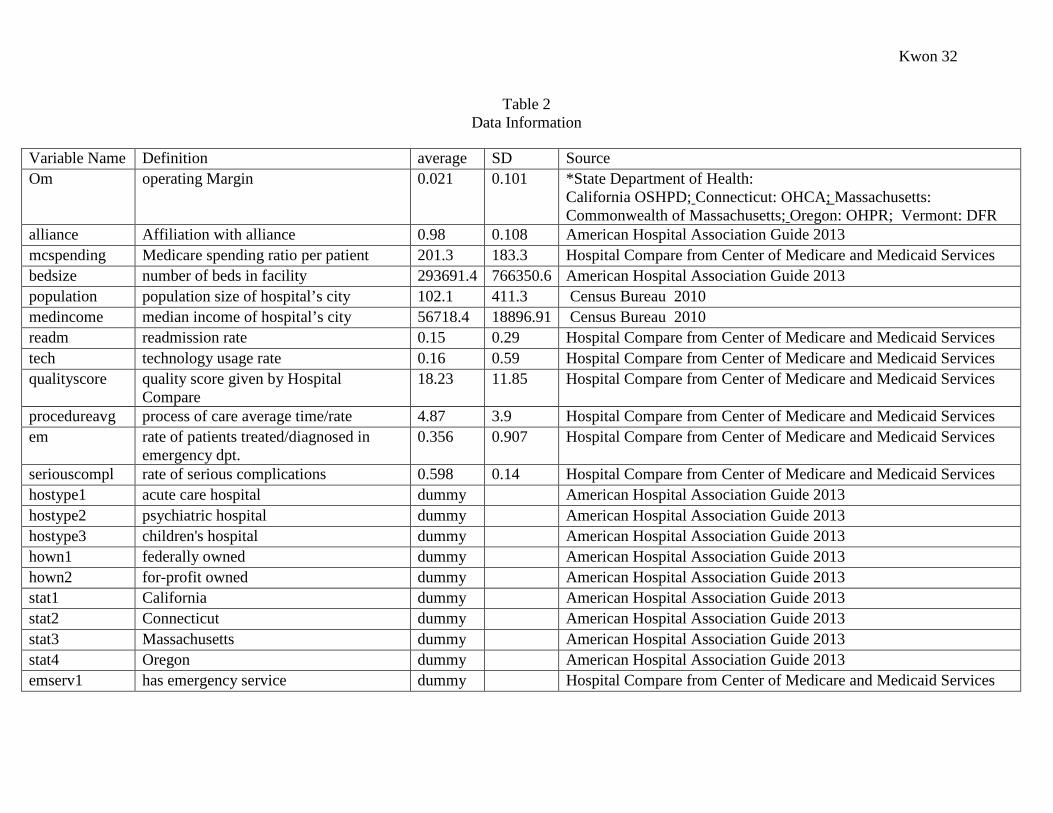
Table 2 Data Information
Variable Name Definition average SD Source Om operating Margin 0.021 0.101 *State Department of Health:
California OSHPD; Connecticut: OHCA; Massachusetts: Commonwealth of Massachusetts; Oregon: OHPR; Vermont: DFR
alliance Affiliation with alliance 0.98 0.108 American Hospital Association Guide 2013 mcspending Medicare spending ratio per patient 201.3 183.3 Hospital Compare from Center of Medicare and Medicaid Services bedsize number of beds in facility 293691.4 766350.6 American Hospital Association Guide 2013 population population size of hospital’s city 102.1 411.3 Census Bureau 2010 medincome median income of hospital’s city 56718.4 18896.91 Census Bureau 2010 readm readmission rate 0.15 0.29 Hospital Compare from Center of Medicare and Medicaid Services tech technology usage rate 0.16 0.59 Hospital Compare from Center of Medicare and Medicaid Services qualityscore quality score given by Hospital
Compare 18.23 11.85 Hospital Compare from Center of Medicare and Medicaid Services
procedureavg process of care average time/rate 4.87 3.9 Hospital Compare from Center of Medicare and Medicaid Services em rate of patients treated/diagnosed in
emergency dpt. 0.356 0.907 Hospital Compare from Center of Medicare and Medicaid Services
seriouscompl rate of serious complications 0.598 0.14 Hospital Compare from Center of Medicare and Medicaid Services hostype1 acute care hospital dummy American Hospital Association Guide 2013 hostype2 psychiatric hospital dummy American Hospital Association Guide 2013 hostype3 children's hospital dummy American Hospital Association Guide 2013 hown1 federally owned dummy American Hospital Association Guide 2013 hown2 for-profit owned dummy American Hospital Association Guide 2013 stat1 California dummy American Hospital Association Guide 2013 stat2 Connecticut dummy American Hospital Association Guide 2013 stat3 Massachusetts dummy American Hospital Association Guide 2013 stat4 Oregon dummy American Hospital Association Guide 2013 emserv1 has emergency service dummy Hospital Compare from Center of Medicare and Medicaid Services

Kwon 33
Table 3
Hypothesis of coefficients of extrinsic variables
Variable Alliance Population Education Median Income
β >0 β >0 β >0 β >0
Hosp. Type Hosp. Ownership
(for-profit)
State EM Service
β >0 β >0 β ≠0 β >0

Kwon 34
Table 4
Hypothesis of coefficients of intrinsic variables
Variable Bed size Medicare
Spending
Readmission Technology
β >0 β <0 β <0 β <0
Process of
Care
Emergency Care Serious
Complications
Quality
β <0 β <0 β <0 β >0
Kwon 35
Table 5
OLS Results Explanatory Variable coefficient t-statistic
om 0.0197 1.25 alliance 0.0469 0.56 mcspending -0.000036 -0.53 bedsize -4.27E-09 -0.39 population 0.0008179 0.98 medincome -0.000000559 -1.27 readm 0.087 1.31 tech 0.0044 1 qualityscore 0.0013812 2.7 ***
procedureavg 0.0033671 1.51 em 0.0018198 0.9 seriouscompl 0.254455 0.56 hostype1
hostype2 hostype3 -0.185 -1.17
hown1 -0.39411 -1.98 ** hown2 0.0213324 1.16
stat1 0.1363 1.95 * stat2 0.08027 1.67 * stat3 0.0922694 1.65
stat4 0.10388 2.09 * emserv1 -0.054908 -2.72 *** significance *10% **5% ***1%
Kwon 36
Table 6
Stepwise Results
Explanatory Variables Coefficients t-statistics Regression Statistics hown1 0.0476 -3.08 *** F Statistic 4.8 qualityscore 0.0011 2.5 ** p-value 0.0004 alliance 0.0206685 1.63
R^2: 0.1219
procedureavg 0.00402 1.67 * stat1 0.01641 1.35
Significance *10% **5% ***1%

Kwon 37
Table 7
Robust Logged Regression
Explanatory Variables coefficients t-statistics alliance 0.039196 1.59
mcspending 0.0535691 0.32 bedsize -1.74E-04 -2.17 **
population -1.71E-08 -0.83 medincome -1.14E-06 0.52 logreadm 6.18E-02 2.97 ***
logtech 0.0143853 1.8 * qualityscore 0.0025994 2.76 *** logproc 0.017343 1.13
logem -0.00648 -0.44 logser 0.0347 0.449 hostype1
hostype2 hostype3 -0.0281135 -0.21
hown1 -0.056239 -1.83 * hown2 -0.05623 1.12
stat1 0.2774223 1.87 * stat2 0.0951927 0.7
stat3 0.1629156 1.18 stat4 0.1196636 0.82 emserv1 -0.1091741 -0.79 Significance *10% **5% ***1%
Kwon 38
Table 8
Stepwise Logged Regression
Explanatory Variables coefficient t-statistic
regression statistics
hown1 -0.069345 -2.44 ** qualityscore 0.0022271 2.66 *** F-stat: 3.87
alliance 0.041988 1.84 * p-value: .001 logproc 0.0210057 1.46
R^2: .1947
logtech 0.0152237 2.04 * stat1 0.181502 3.49 *** logread 0.0540639 2.82 *** bedsize -0.0001713 -2.35 ** stat3 0.07267 1.77 * medincome -77200000 -1.38
Significance *10% **5% ***1%
Kwon 39
Table 9
Massachusetts Regression
Explanatory Variables coefficients t-statistic
regression statistics
qualityscore 0.0036281 3.22 *** F-stat: 5.60 education -0.0045329 -2.66 ** p-value: 0.007 popultaion -0.000000298 -3.38 *** R^2: .6304 bedsize -0.0000047 -0.05
mcspending -0.75305 -2.09 ** logread 0.0436529 1.73 * logser 0.1171547 1.52
Significance *10% **5% ***1%
Kwon 40
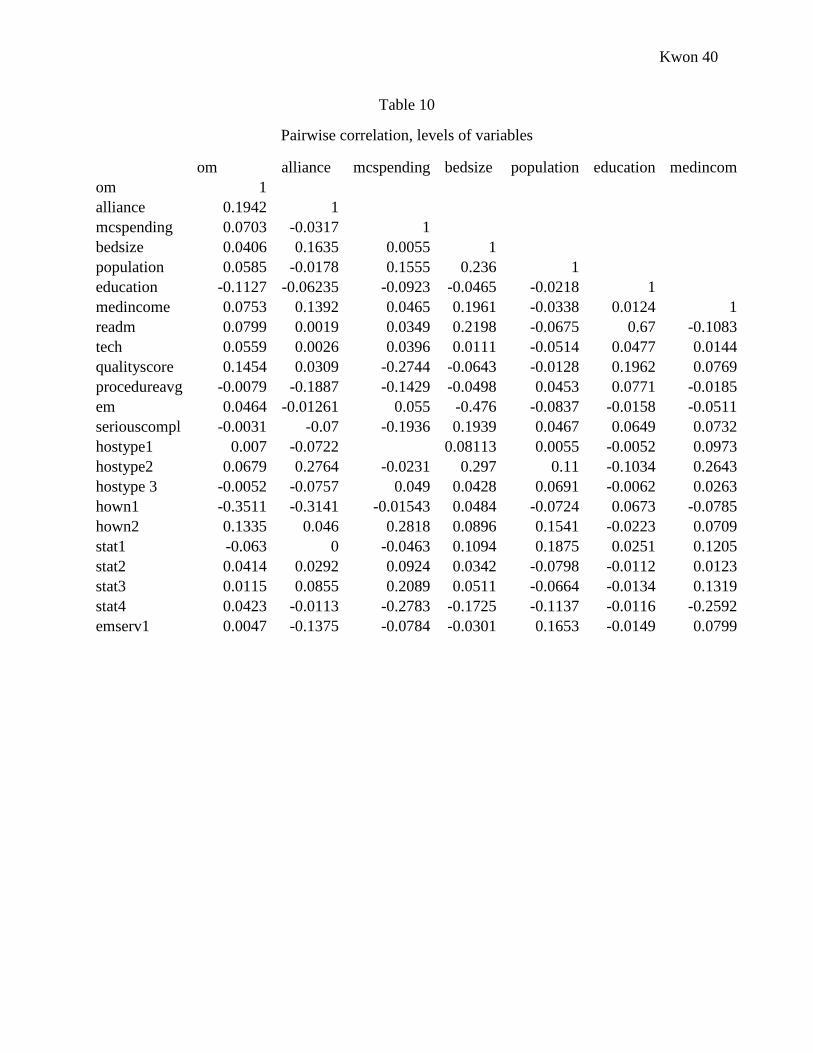
Table 10
Pairwise correlation, levels of variables
om alliance mcspending bedsize population education medincom
om 1 alliance 0.1942 1
mcspending 0.0703 -0.0317 1 bedsize 0.0406 0.1635 0.0055 1
population 0.0585 -0.0178 0.1555 0.236 1 education -0.1127 -0.06235 -0.0923 -0.0465 -0.0218 1
medincome 0.0753 0.1392 0.0465 0.1961 -0.0338 0.0124 1 readm 0.0799 0.0019 0.0349 0.2198 -0.0675 0.67 -0.1083 tech 0.0559 0.0026 0.0396 0.0111 -0.0514 0.0477 0.0144 qualityscore 0.1454 0.0309 -0.2744 -0.0643 -0.0128 0.1962 0.0769 procedureavg -0.0079 -0.1887 -0.1429 -0.0498 0.0453 0.0771 -0.0185 em 0.0464 -0.01261 0.055 -0.476 -0.0837 -0.0158 -0.0511 seriouscompl -0.0031 -0.07 -0.1936 0.1939 0.0467 0.0649 0.0732 hostype1 0.007 -0.0722
0.08113 0.0055 -0.0052 0.0973
hostype2 0.0679 0.2764 -0.0231 0.297 0.11 -0.1034 0.2643 hostype 3 -0.0052 -0.0757 0.049 0.0428 0.0691 -0.0062 0.0263 hown1 -0.3511 -0.3141 -0.01543 0.0484 -0.0724 0.0673 -0.0785 hown2 0.1335 0.046 0.2818 0.0896 0.1541 -0.0223 0.0709 stat1 -0.063 0 -0.0463 0.1094 0.1875 0.0251 0.1205 stat2 0.0414 0.0292 0.0924 0.0342 -0.0798 -0.0112 0.0123 stat3 0.0115 0.0855 0.2089 0.0511 -0.0664 -0.0134 0.1319 stat4 0.0423 -0.0113 -0.2783 -0.1725 -0.1137 -0.0116 -0.2592 emserv1 0.0047 -0.1375 -0.0784 -0.0301 0.1653 -0.0149 0.0799

Kwon 41
Table 10, cont.
Pairwise correlation, levels of variables
readm tech qualityscore procedureavg em seriouscompl hostype1
readm 1 tech 0.293 1
qualityscore 0.1355 0.083 1 procedureavg 0.14 0.0555 0.1748 1
em 0.2206 0.1499 0.0825 0.0274 1 seriouscompl 0.0378 0.116 0.1218 0.0158 -0.012 1
hostype1 0.1449 -0.0183
0.2212 -0.0165
1 hostype2 -0.0044 0.0348 0.049 -0.1834 -0.0809 -0.0315 -0.382 hostype3 -0.0143 0.0442 -0.01 0.0479 -0.0144 0.0315 -0.0185 hown1 -0.083 -0.0066 -0.039 0.1099 -0.011 0.1004 0.3348 hown2 -0.1315 -0.0705 -0.1932 -0.0534 -0.071 -0.1236 -0.0753 stat1 -0.4862 0.2692 -0.226 -0.1444 -0.3755 -0.026 -0.0471 stat2 0.2832 0.5833 0.0206 -0.0014 0.2378 0.0636 0.0038 stat3 0.103 -0.0735 0.1643 0.1138 0.1112 -0.117 0.0344 stat4 0.1315 -0.0345 0.0991 0.0573 0.1243 0.1374 0.0099 emserv1 0.0047 -0.0396 0.1819 0.4483 -0.0228 0.0133 0.5117
Table 10, cont.
Pairwise correlation, levels of variables
hostype2 hostype3 hown1 hown2 stat1 stat2 stat3 stat4 emserv1
hostype2 1 hostype3 -0.2395 1
hown1 -0.3352 -0.0554 1 hown2 0.1833 -0.0472 -0.225 1
stat1 0.1659 0.0009 0.1072 0.169 1 stat2 0.024 0.0474 -0.02 -0.0902 -0.3583 1
stat3 0.07 0.011 -0.1031 -0.0016 -0.5472 -0.0997 1 stat4 -0.2709 -0.0389 0.0513 -0.1415 -0.5053 -0.0921 -0.1406 1
emserv1 -0.1705 -0.0362 0.1394 0.0599 0.0385 -0.0066 -0.0001 -0.0416 1
Kwon 42
Figure 1
Distribution of Operating Margin
-0.8
-0.6
-0.4
-0.2
0
0.2
0.4
0.6
1 14 27 40 53 66 79 92 105
118
131
144
157
170
183
196
209
222
235
248
261
274
287
300
313
326
339
352
365
378
391
404
417
430
443
456
469
482
495
508
521
om
Kwon 43
Figure 2
Distribution of variables in the top three most profitable and least profitable hospitals (darkest
shades show least profitable, lightest shows most profitable hospitals)
-2
0
2
4
6
8
10
12 Top and Bottom Three Comparison
0100000200000300000400000500000
population medincome
0
50
100
150
200
250
bedsize education HCAHPS BaseScore