Hospital Pharmacy in Canada Report 2016/17
84
2013/14 Hospital Pharmacy in Canada Report Cover www.hospitalpharmacysurvey.ca page i Hospital Pharmacy in Canada Report 2016/17 Hospital Pharmacy in Canada Survey Board
Transcript of Hospital Pharmacy in Canada Report 2016/17
2013/14 Hospital Pharmacy in Canada Report Cover
www.hospitalpharmacysurvey.ca page i
Hospital Pharmacy in Canada Report 2016/17
Hospital Pharmacy in Canada Survey Board
Hospital Pharmacy in Canada Report 2016/17
www.hospitalpharmacysurvey.ca page ii
Published by the Canadian Society of Hospital Pharmacists (CSHP), Ottawa, Ontario. 2018
Suggested citation:
Hospital Pharmacy in Canada Survey Board. Hospital Pharmacy in Canada Report 2016/17. Ottawa, ON: Canadian
Society of Hospital Pharmacists; 2018.
© Canadian Society of Hospital Pharmacists, 2018
All rights reserved. Publications of the Canadian Society of Hospital Pharmacists (CSHP)
can be obtained from:
30 Concourse Gate, Unit 3
Ottawa ON K2E 7V7
Telephone: 613.736.9733
Fax: 613.736.5660
www.cshp.pharmacy
The current and past editions of the Hospital Pharmacy in Canada Report
can be obtained from:
www.hospitalpharmacysurvey.ca
This published material is being distributed without warranty of any kind, either expressed or implied. Although the
intended primary application of this publication is stated in its Introduction, it remains the responsibility of the user
of the publication to judge its suitability for his or her particular purpose within the context of his or her practice and
the applicable legislative framework. In no event shall the CSHP or any persons involved in the development and
review of this publication be liable for damages arising from its use.
The Hospital Pharmacy in Canada Survey is conducted at approximately 2-year intervals. Suggestions for the next
iteration of the Survey are welcomed.
All inquiries regarding this publication, including requests for interpretation, and permission to reproduce or
translate this paper, whether for sale or for non-commercial distribution, should be addressed to
Hospital Pharmacy in Canada Report 2016/17 Contents
www.hospitalpharmacysurvey.ca page iii
Contents
Hospital Pharmacy in Canada Report 2016/17
Click on the red bullets below or open and click on PDF bookmarks to navigate
Masthead ………………………………………………………………… ii
Contents .................................................................................................... iii
Acknowledgements …………………………………………………….. iv
Survey Board ………………………………………………………… v
Forewords ………………………………………………………………. vi
Introduction ……………………………………………………………. viii
Data Collection Methodology …………………………………………… x
A - Demographics ……………………………………………………………. 1
B - Clinical Pharmacy Practice ……………………………………………… 3
C - Drug Distribution Systems ………………………………………………. 24
D - Human Resources ………………………………………………………... 37
E - Benchmarking/ Resource Matrix ……………………………………….. 46
F - Pharmacy Technicians …………………………………………………… 48
G - Technology …………………………………………………………..,…. 58
Appendices
Appendix I - List of Tables and Figures ………………………………… 65
Appendix II - Recognition List ………………………………………….. 67
Appendix III - Key Ratios ……………………………………………..... 69

Hospital Pharmacy in Canada Report 2016/17 Acknowledgements
www.hospitalpharmacysurvey.ca page iv
Acknowledgements
Hospital Pharmacy in Canada Report 2016/17
Hospital Pharmacy in Canada Survey Board,
an affiliated board of the Canadian Society of Hospital Pharmacists (CSHP)
The Survey Board wishes to acknowledge and thank the support team of the Hospital Pharmacy in Canada
Report 2016/17.
Managing Editors
Chuck Wilgosh, Edmonton, AB ([email protected])
Carolyn Dittmar, Aurora, ON ([email protected])
Research Analyst
Paul Oeltjen, Montréal, QC
Executive Assistant
Marjorie Robertson, Vancouver, BC
Copy Editor
Peggy Robinson, Ottawa, ON
Website scripting and report cover design
George Horne, George Horne Associates, Vancouver, BC
Cover photo
Compliment of André Bonnici, McGill University Health Centre / Centre universitaire de santé
McGill, Montréal, QC
Translation services
Les Traductions Tessier
188, rue Montcalm, bureau 100, Gatineau, QC J8Y 3B5
Téléphone : +1-855-385-6687 - Télécopieur : +1-819-776-1161 - Courriel: [email protected]
Special thanks
CSHP and the Hospital Pharmacy in Canada Survey Board would like to thank the sponsors: AstraZeneca Canada
and its representatives, George DeAngelis and Rita Egan; Eli Lilly Canada Inc. and its representative, Andrew Merrick;
and Pfizer Canada and its representative, Aidan Griffin. Although the sponsor representatives were invited to attend
the meetings of the Survey Board, any influence they might have had on the design and conduct of the survey or on
the content of the report is deemed inconsequential. They had advance access only to the aggregate data that became
publicly available with the publication of this report.
The Survey Board would also like to thank the staff of hospital pharmacy departments across Canada who
assembled data from their respective institutions and committed the time to complete the survey.
The Survey Board thanks the Canadian Society of Hospital Pharmacists, its Board, and its staff for their support
of this survey.

Hospital Pharmacy in Canada Report 2016/17 Survey Board
Survey Board
André Bonnici, BPharm, MSc Chef, département de pharmacie / Pharmacist-in-Chief, Centre universitaire de santé McGill / McGill University Health Centre, Montréal, QC
Jean-François Bussières, BPharm, MSc, MBA, FCSHP Chef, département de pharmacie et Unité de recherche en pratique pharmaceutique, CHU Sainte-Justine; Professeur titulaire de clinique, Faculté de pharmacie, Université de Montréal, Montréal, QC
Managing Editor Carolyn Dittmar, BScPhm, RPh, ACPR, BCGP, FCSHP The Arthritis Program, Southlake Regional Health Centre, Newmarket, ON
Douglas Doucette, BSc(Pharm), PharmD, FCSHP Regional Pharmacy Clinical Manager, Horizon Health Network, Moncton, NB
Executive Editor Richard Jones, BSc, BSP, RPh, ACPR, FACHE Director, Pharmacy Services, Vancouver Island Health Authority, Victoria, BC
Kyle MacNair, BScPharm, ACPR Regional Director – Pharmacy, Southern Health–Santé Sud, Morden, MB
Debra Merrill, BScPharm, PharmD Director, Pharmacy Program, Royal Victoria Regional Health Centre, Barrie, ON
Allan Mills, Pharm.D., FCSHP Director of Pharmacy Services, Trillium Health Partners; Assistant Professor, Leslie Dan Faculty of Pharmacy, University of Toronto; Affiliate Scientist, Institute for Better Health, Mississauga, ON
Managing Editor Chuck Wilgosh, BScPharm, MBA Pharmacy Consultant, Edmonton, AB
www.hospitalpharmacysurvey.ca page v
Hospital Pharmacy in Canada Report 2016/17 Foreword
www.hospitalpharmacysurvey.ca page vi
Forewords
Myrella Roy

Hospital Pharmacy in Canada Report 2016/17 Foreword
www.hospitalpharmacysurvey.ca page vii
Forewords
Jamie Freedman
We are pleased to support this 21st edition of the Hospital Pharmacy in Canada Report. At AstraZeneca, we
recognize the critical role that hospital pharmacists play in helping patients manage medications and improving
health outcomes.
Together, we share a common goal with pharmacists, which is to improve patients’ lives through creative
solutions that help prevent and treat diseases. This survey is an important tool that enables Canadian hospital
pharmacists and leaders to effectively share their insights with an aim to further that goal. Thank you for the
opportunity to support this important research.
Jamie Freedman
President
AstraZeneca Canada
Hospital Pharmacy in Canada Report 2016/17 Foreword
www.hospitalpharmacysurvey.ca page viii
Forewords
Lauren Fisher
Eli Lilly Canada is proud to continue our support for the Hospital Pharmacy in Canada Report. First published
in 1986, the 2016/17 report is the 21st edition, and falls for the first time under the umbrella of the Canadian Society
of Hospital Pharmacists. Eli Lilly is pleased to welcome two new co-sponsors for 2016/17, AstraZeneca Canada and
Pfizer Canada.
The participation of 180 hospital pharmacy departments from across Canada, who responded to the 2016/17
survey, represents a phenomenal response rate of 83%, a testimony to the importance and value of this national
initiative.
This survey report continues to provide reliable clinical and management information for pharmacy and hospital
administrators to use in identifying baseline, benchmarking current and planning enhanced pharmacy services.
We are confident that the information in the 2016/17 Hospital Pharmacy in Canada Report will assist your
decision making in responding to the needs of your organizations.
Lauren Fischer
Vice President, Corporate Affairs
Eli Lilly Canada Inc.
The Survey Board’s comments are based on an analysis of this data. The views expressed in the text do not
necessarily represent those of Eli Lilly Canada Inc.
Hospital Pharmacy in Canada Report 2016/17 Foreword
www.hospitalpharmacysurvey.ca page ix
Forewords
Aidan Griffin
Pfizer Canada is pleased to add our support to this 21st edition of the Hospital Pharmacy in Canada Report. This
report is an important vehicle for Canadian hospital pharmacy leaders to share information on clinical and
administrative practices within their institutions. This sharing helps to promote the advancement of the hospital
pharmacy profession through identification and promotion of best practices. The participation of 180 hospital
pharmacy departments across Canada, which responded to the 2016/17 Hospital Pharmacy in Canada Survey,
provides testimony to the quality and value of this initiative.
Pfizer Canada is delighted to have the opportunity to contribute to this valuable national effort.
Aidan Griffin
Business Unit Director, Pfizer Injectables
Pfizer Canada Inc.
Hospital Pharmacy in Canada Report 2016/17 Introduction
www.hospitalpharmacysurvey.ca page viii
Introduction
Richard Jones
The hospital Pharmacy in Canada Report for 2016/17 is the 21st edition of this national report. With the current
edition, this publication has undergone several changes, principally in terms of support and administration for both
the report and the survey on which it is based. Working closely with the Canadian Society of Hospital Pharmacists
(CSHP), specifically Executive Director Myrella Roy and members of the CSHP Executive Committee, and with the
guidance of Andrew Merrick of Eli Lilly Canada, the renamed Hospital Pharmacy in Canada Survey Board now
proudly operates as an Affiliated Board of CSHP. AstraZeneca Canada, Eli Lilly Canada and Pfizer Canada have
come together to support this edition, setting the stage for a strong future for both the survey and the report.
The 2016/17 report is the culmination of extensive analysis of data gathered in spring 2017 via an online survey
of directors of hospital pharmacy across Canada. A total of 184 respondents from 223 eligible organizations
completed the survey, for an 83% response rate.
Previous editions of this report have used the definition of a teaching hospital set forth by the Association of
Canadian Academic Health Care Organizations (ACAHCO). However, the definition of a teaching hospital has
become less clear with the replacement of ACAHCO by a new organization, HealthCareCAN, which does not
specifically define academic facilities. For the purposes of the 2016/17 report, we used the previous ACAHCO
definition to identify academic facilities, thereby enabling comparability with previous reports. In the 2016/17
report, pediatric hospitals are not discussed within a dedicated chapter (as was the case in the two previous reports).
Instead, data for the seven pediatric hospitals that responded to the survey are presented in the chapter tables as a
separate column, alongside data for teaching and non-teaching facilities.
Chapter A, Demographics, provides an overview of participating facilities from across Canada. As in recent
reports, data from certain pairs of jurisdictions are combined: Newfoundland and Labrador with Nova Scotia, Prince
Edward Island with New Brunswick and the Yukon with British Columbia. There were no respondents from the
Northwest Territories in 2016/17. Where results are reported on a regional basis, BC and Yukon are again
combined, Prairie Provinces consist of Alberta, Saskatchewan and Manitoba, and the Atlantic Provinces combine
Nova Scotia, New Brunswick, Prince Edward Island and Newfoundland and Labrador.
Chapter B, Clinical Pharmacy Practice, by Jean-François Bussières and Debra Merrill, highlights research
demonstrating that comprehensive medication management, performed by a pharmacist in collaborative practice, is
a successful approach to patient care. The authors also compare Canadian clinical pharmacist services with those in
the United States, where the American College of Clinical Pharmacy is leading the process to re-assess the value
that clinical pharmacists bring to patient care. The chapter authors also review the current status of pharmacist roles
in ambulatory and inpatient care settings, including the range of services provided. An update on the status of the
Canadian clinical pharmacy key performance indicators is included in this chapter.
In Chapter C, Kyle MacNair and Allan Mills review several aspects of drug distribution systems. Data are
presented on the expanded implementation of unit-dose systems, changes in the level of decentralized services and
the deployment of technologies such as automated dispensing cabinets on patient care units. This chapter also
highlights some changes since the last report in medication order entry, checking and verification by pharmacists.
Chapter D focuses on human resources. In this chapter, André Bonnici analyzes vacancy rates for both
pharmacists and regulated pharmacy technicians. He also presents new information on the ratio of pharmacists to
regulated technicians for various organization types. André also notes some substantial differences in compensation
among provinces.
In Chapter E, Benchmarking, Jean-François Bussières and Douglas Doucette report the results of a new
resource matrix for gathering benchmark data (see methodology chapter). The matrix was developed in an attempt to
generate more detailed information concerning how organizations allocate both dollars and staff (specifically
pharmacists and regulated technicians) to various services.
Douglas Doucette presents an update on regulated and non-regulated pharmacy technicians in Chapter F.
Trends in specific functions performed by pharmacy technicians and their roles in direct patient care activities are
presented. Doug also reviews how job descriptions have evolved for technical staff in the context of pharmacy
Hospital Pharmacy in Canada Report 2016/17 Introduction
www.hospitalpharmacysurvey.ca page ix
technician regulation in the various provinces. Non-regulated pharmacy technicians, also known as pharmacy
assistants, continue to play a role in many hospital pharmacies.
The final chapter, by Allan Mills, reviews changes in the use of technology in Canadian hospitals. Examples
include the extent of adoption of TALLman lettering in electronic systems, the implementation of computerized
practitioner order entry (CPOE) systems and confirmation that pharmacists are no longer accessing laboratory data
through paper-based systems. Allan examines the expansion of smart pump deployment, noting that wireless
updating of pump data is becoming standard practice. By contrast, although barcoding is a unifying and quality
driver of medication system safety, its implementation remains limited.
The Hospital Pharmacy in Canada Survey Board wishes to recognize our sponsors and the support they have
provided during our transition to becoming a CSHP Affiliated Board. George DeAngelis served as AstraZeneca
Canada’s first representative to the Board, and we are pleased to now welcome Rita Egan in this role. Eli Lilly
Canada continues to be capably represented by Andrew Merrick. Andrew has worked with the Board for many
years, and his guidance and support with the transition are greatly appreciated. Finally, we welcome Aidan Griffin
as the representative for Pfizer Canada. Aidan is well known and respected by his peers in hospital pharmacy across
Canada.
The contributions of certain other members of the Board deserve recognition here. Emily Musing has served on
the Board for 8 years, first, for 2 years as the CSHP 2015 guest editor for the 2007/08 report and then for an
additional 6 years (from 2009 to 2015) as Executive Editor. Emily was instrumental in facilitating transition of this
endeavour to CSHP, and her efforts have allowed the Board to continue to produce a nationally and internationally
recognized report. Allan Mills and Debra Merrill have recently joined the Board as Editors for Ontario. Finally, after
6 years as the CSHP 2015 guest editor, Carolyn Dittmar is now a Managing Editor, serving in this role with Chuck
Wilgosh.
With this report, we bid farewell to three amazing individuals who, for many years, have played significant
roles in production of the reports. We wish to acknowledge and pay tribute to Managing Editor Chuck Wilgosh,
Research Analyst Paul Oeltjen and Executive Assistant Marjorie Robertson. The Board is truly grateful for their
many years of service and their important contributions to the national fabric of hospital pharmacy. In addition,
Website Manager George Horne will be retiring once the current report has been migrated to a new web platform.
With the release of the 2016/17 report, the transition to CSHP and the appointment of our new Board members,
we hope that the Hospital Pharmacy in Canada project will continue to empower and inform hospital pharmacy
leaders as they provide leadership in their respective organizations. On behalf of the Board, I now tender this report
to the Canadian hospital pharmacy community. We hope it will prove useful as hospital pharmacy continues to grow
and evolve, while providing the highest-quality comprehensive medication management for all patients receiving
care in Canadian healthcare institutions.
Richard Jones
Executive Editor
Hospital Pharmacy in Canada Report 2016/17 Data Collection Methodology
www.hospitalpharmacysurvey.ca page x
Data Collection Methodology
Paul Oeltjen
An initial list of Canadian hospital pharmacies was prepared, based on respondents to previous surveys, hospital
pharmacies identified by members of the Hospital Pharmacy in Canada Survey Board, and hospital pharmacies on the
mailing list of the Hospital Pharmacy in Canada Survey Board. The members of the Board (listed on page v of this
report and referred to hereafter as “the Editors”) were responsible for verifying the current name and email address of
the director of pharmacy and the hospital’s chief executive officer (CEO) for each hospital pharmacy on the list from
the province(s) that they represented. At that point, the facilities were classified by hospital type (teaching or non-
teaching) and each hospital’s eligibility to participate in the survey was determined, according to the qualifying
criterion of 50 or more acute care beds. Based on the information collected at this stage, and after deletion of redundant
contact information, the list consisted of 223 hospitals.
The 2016/17 Hospital Pharmacy in Canada Survey was announced in email messages sent to directors of pharmacy (on
May 15, 2017) and CEOs (on May 29, 2017) of the initial selection of hospitals. Because some of the data required to
complete the survey had to be obtained from other departments within each facility, a second email message was sent
to the directors of pharmacy on May 19, 2017, containing a summary of the data elements that the pharmacy
department would likely need to obtain from other departments within the organization. A third email message was
sent only to the directors of pharmacy during the period from May 27 to May 31, 2017. This message contained a
hospital-specific identification code and password required to log on to the survey website. Regional directors of
pharmacy, where applicable, were informed of the ongoing survey and were asked for their support on May 30, 2018.
During the subsequent weeks, the Editors followed up with potential respondents to ensure that the identification codes
and passwords had been received and to encourage participation. If required, email messages with access information
were re-sent to directors who had difficulties locating the messages sent in May. On June 10, June 23, July 6 and July
11, reminder notices were sent by email to directors of pharmacy who had not yet completed the online survey, asking
them to participate. In addition, in early July, the Editors personally contacted hospital pharmacies that had not yet
responded, explaining the importance of participation in this national survey.
The identification code and password enabled the respondent representing each facility to log on to the survey website
at any time to complete any part of the questionnaire (in English or in French); the respondent could use as many
sessions as desired to complete the survey. The first page of the website contained instructions for completing the
survey and a link for downloading a pdf version of the survey questionnaire. This pdf document (also available in
English or in French) was 43 pages long. On the website, the survey questions were distributed over eight web pages
corresponding to the eight sections of the questionnaire. From any questionnaire web page, a respondent could return to
the instruction page or move to any other page of the online survey. Each section of the survey opened with a list of
definitions of terms used in the questions in the section. These definitions also popped up when the cursor was
positioned over the first occurrence of each defined term in that section of the questionnaire.
Completion of the online survey was interactive: if follow-up questions were applicable because of the answer given on
a screening question, a modified version of the questionnaire web page was presented which included these additional
questions. After a respondent had saved responses for the current page, the program warned of any instances where
non-numeric information had been entered in fields that required numeric answers. To avoid problems resulting from
inconsistent use of periods or commas for decimal indicators, the system forced users to enter numeric information
requiring a decimal place in two separate fields, one for the whole-number part of the value and the other for the
decimal part.
The 2016/17 survey introduced a new element, the Benchmarking Resource Matrix. This matrix was a spreadsheet to
support the reporting of financial and workload information for use in generating benchmarking data and ratios. The
matrix allowed each respondent to enter total workload and resource data for each of 13 pharmacy service areas
(programs). Workload and resource data consisted of five workload indicators, nine inpatient resource indicators and
nine outpatient resource indicators. Respondents were asked to download the spreadsheet from the survey website,
complete the matrix on the local computer system and then upload the completed spreadsheet to the survey website.
The deadline for completing the survey was July 16, and most facilities were able to meet this deadline. In a few cases
a brief extension was granted to complete the online survey or to submit the Benchmarking Resource Matrix.
On August 13, the survey website was closed for participation. At that time, representatives from a total of 184
hospitals had logged on, confirmed the number of acute care beds as 50 or more, and entered responses to six or more
sections of the survey questionnaire. Using as a base the 223 potentially qualified hospitals that were invited to

Hospital Pharmacy in Canada Report 2016/17 Data Collection Methodology
www.hospitalpharmacysurvey.ca page xi
participate, the response rate was therefore 83%. The actual response rate may have been higher, because it is possible
that hospitals that never logged on to the survey website or that did not answer any questions had fewer than 50 acute
care beds, in which case they would not have been qualified to participate in the survey and the overall number of
eligible facilities would have been smaller.
The Editors confirmed the initial classification of hospitals as teaching hospitals, non-teaching hospitals and pediatric
hospitals. Although all of the pediatric hospitals were also teaching hospitals, they were excluded from the teaching
hospital category, to ensure exclusive categories for use as headings in the summary tables of survey results.
After the survey website was closed, a new site was created for the exclusive use of the two Managing Editors, who
each selected for review half of the responding hospitals. For each respondent, the Managing Editor was presented with
a summary page showing 15 different ratios (e.g., calculated occupancy rate for acute care beds, budgeted inpatient
hours per acute care inpatient day, total technician + assistant full-time equivalent [FTE] per total pharmacist FTE,
pharmacist vacancy rate [as a percentage]). If any of these ratios looked questionable, the Managing Editor contacted
the responding hospital for an explanation or excluded the corresponding answers from the analysis. The Managing
Editor then proceeded to review data for all sections of the questionnaire, looking for inconsistencies, obviously
incorrect entries of numeric data or questionable data. After completion of this review, the data were downloaded from
the website, and results were tabulated by the team’s research analyst who prepared summary tables for all variables
captured by the online survey. For categorical variables these summary tables included the total number of respondents
who answered the corresponding question and the percentage of respondents who checked each alternative. Summary
tables for numeric variables included the number of respondents who provided the requested data and the mean and
standard deviation as well as the median and the lowest and highest value. In addition to the overall results, results were
also tabulated for three banner variables: Bed Size (50 – 200, 201- 500, and >500), Hospital Type (Teaching
[excluding pediatric] hospitals], Non-teaching hospitals, Pediatric hospitals), Region (Western Provinces [BC,YT],
Prairie Provinces [AB,MB,SK], Ontario, Quebec, Atlantic Provinces [NS, NB, PE, NL]) or for Province (BC/YT, AB,
SK, MB, ON, QC, NB/ PE, NS/ NL). These summary tables were uploaded to a website where editors could download
each summary table for use in writing their chapter.
Hospital Pharmacy in Canada Report 2016/17 A - Demographics
www.hospitalpharmacysurvey.ca page 1
A - Demographics
Richard Jones
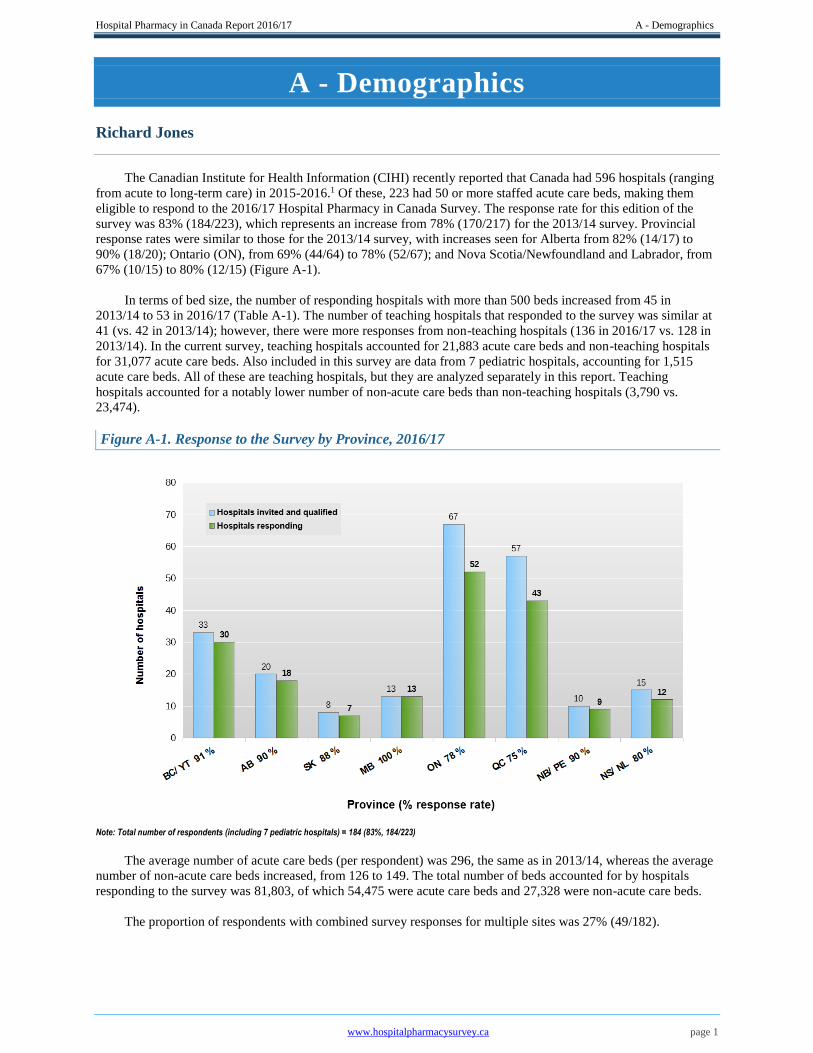
The Canadian Institute for Health Information (CIHI) recently reported that Canada had 596 hospitals (ranging
from acute to long-term care) in 2015-2016.1 Of these, 223 had 50 or more staffed acute care beds, making them
eligible to respond to the 2016/17 Hospital Pharmacy in Canada Survey. The response rate for this edition of the
survey was 83% (184/223), which represents an increase from 78% (170/217) for the 2013/14 survey. Provincial
response rates were similar to those for the 2013/14 survey, with increases seen for Alberta from 82% (14/17) to
90% (18/20); Ontario (ON), from 69% (44/64) to 78% (52/67); and Nova Scotia/Newfoundland and Labrador, from
67% (10/15) to 80% (12/15) (Figure A-1).
In terms of bed size, the number of responding hospitals with more than 500 beds increased from 45 in
2013/14 to 53 in 2016/17 (Table A-1). The number of teaching hospitals that responded to the survey was similar at
41 (vs. 42 in 2013/14); however, there were more responses from non-teaching hospitals (136 in 2016/17 vs. 128 in
2013/14). In the current survey, teaching hospitals accounted for 21,883 acute care beds and non-teaching hospitals
for 31,077 acute care beds. Also included in this survey are data from 7 pediatric hospitals, accounting for 1,515
acute care beds. All of these are teaching hospitals, but they are analyzed separately in this report. Teaching
hospitals accounted for a notably lower number of non-acute care beds than non-teaching hospitals (3,790 vs.
23,474).
Figure A-1. Response to the Survey by Province, 2016/17
Note: Total number of respondents (including 7 pediatric hospitals) = 184 (83%, 184/223)
The average number of acute care beds (per respondent) was 296, the same as in 2013/14, whereas the average
number of non-acute care beds increased, from 126 to 149. The total number of beds accounted for by hospitals
responding to the survey was 81,803, of which 54,475 were acute care beds and 27,328 were non-acute care beds.
The proportion of respondents with combined survey responses for multiple sites was 27% (49/182).
Hospital Pharmacy in Canada Report 2016/17 A - Demographics
www.hospitalpharmacysurvey.ca page 2
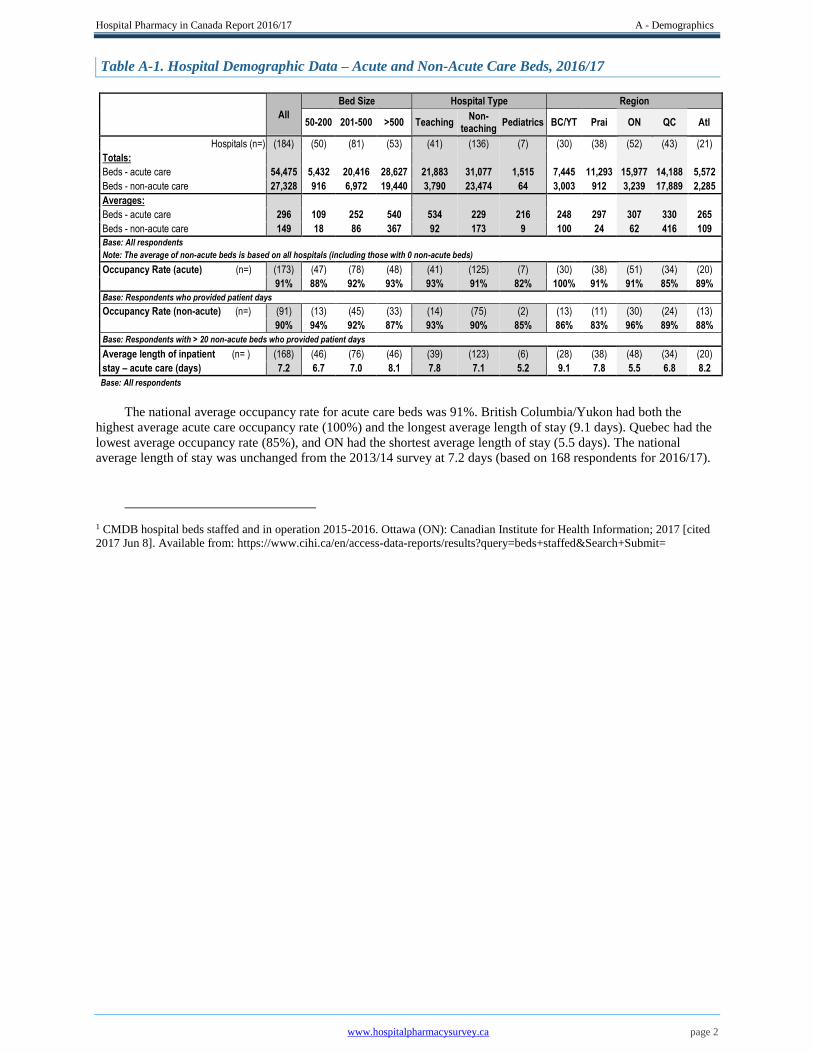
Table A-1. Hospital Demographic Data – Acute and Non-Acute Care Beds, 2016/17
All
Bed Size Hospital Type Region
50-200 201-500 >500 Teaching
Non- teaching
Pediatrics BC/YT Prai ON QC Atl
Hospitals (n=) (184) (50) (81) (53) (41) (136) (7) (30) (38) (52) (43) (21)
Totals:
Beds - acute care 54,475 5,432 20,416 28,627 21,883 31,077 1,515 7,445 11,293 15,977 14,188 5,572
Beds - non-acute care 27,328 916 6,972 19,440 3,790 23,474 64 3,003 912 3,239 17,889 2,285
Averages:
Beds - acute care 296 109 252 540 534 229 216 248 297 307 330 265
Beds - non-acute care 149 18 86 367 92 173 9 100 24 62 416 109
Base: All respondents
Note: The average of non-acute beds is based on all hospitals (including those with 0 non-acute beds)
Occupancy Rate (acute) (n=) (173) (47) (78) (48) (41) (125) (7) (30) (38) (51) (34) (20)
91% 88% 92% 93% 93% 91% 82% 100% 91% 91% 85% 89%
Base: Respondents who provided patient days
Occupancy Rate (non-acute) (n=) (91) (13) (45) (33) (14) (75) (2) (13) (11) (30) (24) (13)
90% 94% 92% 87% 93% 90% 85% 86% 83% 96% 89% 88%
Base: Respondents with > 20 non-acute beds who provided patient days
Average length of inpatient (n= ) (168) (46) (76) (46) (39) (123) (6) (28) (38) (48) (34) (20)
stay – acute care (days) 7.2 6.7 7.0 8.1 7.8 7.1 5.2 9.1 7.8 5.5 6.8 8.2
Base: All respondents
The national average occupancy rate for acute care beds was 91%. British Columbia/Yukon had both the
highest average acute care occupancy rate (100%) and the longest average length of stay (9.1 days). Quebec had the
lowest average occupancy rate (85%), and ON had the shortest average length of stay (5.5 days). The national
average length of stay was unchanged from the 2013/14 survey at 7.2 days (based on 168 respondents for 2016/17).
1 CMDB hospital beds staffed and in operation 2015-2016. Ottawa (ON): Canadian Institute for Health Information; 2017 [cited
2017 Jun 8]. Available from: https://www.cihi.ca/en/access-data-reports/results?query=beds+staffed&Search+Submit=
Hospital Pharmacy in Canada Report 2016/17 B - Clinical Pharmacy Practice
www.hospitalpharmacysurvey.ca page 3
B - Clinical Pharmacy Practice
Jean-François Bussières and Debra Merrill
It is not by chance that the chapter on clinical pharmacy is one of the first in this report. The pharmacist is the
primary healthcare professional trained to ensure the most appropriate treatment of patients from a medication
perspective and to monitor drug therapy. For these activities to be successful, the right mix of human, material and
financial resources is required. Key technologies are also essential to ensure that the medication management loop is
closed. Enabled by current trends (e.g., regulation of pharmacy technical staff, centralization of pharmaceutical
production and use of robotic technologies), the essential roles of the pharmacist are to treat patients and provide
pharmaceutical care adapted to varied inpatient and outpatient clienteles, to ensure the proper use of drug therapy
and to regularly assess its benefits.
Since the 2013/14 Hospital Pharmacy in Canada Report was published, there have been a number of
developments and publications relevant to the survey data that will be presented in this chapter.
In 2017, the American College of Clinical Pharmacy (ACCP) published clinical competency guidelines for
pharmacists,1 which define the clinical practice model for evaluating a clinical pharmacist’s profile, as defined in the
ACCP position statement on scope of practice.2 In particular, the ACCP guidelines focus on a patient-centred
approach to delivering comprehensive medication management with a team-based approach. They define the
competencies toward which clinical pharmacist practitioners should strive: direct patient care, pharmacotherapy
knowledge, systems-based care and population health, communication, professionalism and continuing professional
development. These competencies were designed to align with the competencies for physicians, as defined by the
Accreditation Council for Graduate Medical Education.
Along with the guidelines, the ACCP provided a self-assessment tool and a template to facilitate the evaluation
of both clinical pharmacists and pharmacy residents.3,4
Traditionally, there has been the impression that non-adherence was the major factor contributing to treatment
failure. However, in 2016, the ACCP submitted a briefing document5 showing that non-adherence accounted for
only about 15% of medication-related problems. In fact, 57% of such problems were due to inadequate therapy, an
area that the clinical pharmacist is best trained to address. The ACCP paper focused on the clinical pharmacist and
comprehensive medication management as means to improve patients’ medication therapy.
In the past two to three years, a plethora of publications pertaining to clinical pharmacists have utilized the
ACCP’s position paper on the optimal use of emerging medicines6 and the ACCP’s white paper on natural health
products.7 Recommendations to align post-graduate year 2 (PGY2) residency-type training with Board of Pharmacy
Specialties certification,8 as well as current licensing requirements, have positioned the clinical pharmacist as a key
player in team-based settings, although there still remains a gap in patients’ access to pharmacists in the United
States.9 This gap indicates that considerable work is still needed to ensure recognition of the positive effect that
clinical pharmacists can have on medication-related outcomes. Research on pharmacy activities, as described in the
Pharmacy Practice Model Initiative on specialty pharmacy practice,10 is also important; hence, the need for
programs such as research fellowships to train independent clinical pharmacy scientists.11
To meet the increased requirement of incorporating research into practice, the ACCP will launch a new online
journal in October 2018 (the Journal of the American College of Clinical Pharmacy or JACCP) targeting work
related to the practice of clinical pharmacy.12 In addition, a recent paper looked at the peer-reviewed literature
exploring the importance of developing residency research and defining relevant strategies.13
Canadian pharmacists have not been as prolific as their US counterparts, nor has their research been as focused
on comprehensive medication management, although additional guidance sources are available in this country, such
as publications of Accreditation Canada14 and position statements of the Canadian Pharmacists Association15 and the
Canadian Society of Hospital Pharmacists (CSHP).16 In Quebec (QC), the Ministry of Health and Social Services
has published a guide on pharmaceutical care in oncology17 detailing the specifics of pharmaceutical care and
pharmacy services as they pertain to the field of oncology. The Association des pharmaciens des établissements de
santé du Québec has pre-published for consultation a white paper on pharmacy practice and clinical pharmacy
services.18 The importance of having governing bodies recognize the role of clinical pharmacists’ abilities cannot be
overstated.
Hospital Pharmacy in Canada Report 2016/17 B - Clinical Pharmacy Practice
www.hospitalpharmacysurvey.ca page 4
In this chapter, we analyze survey data relating to the development of clinical pharmacy practice in Canadian
hospitals, showing how far it has come and where it needs to go in the future.
Structured Patient Care Programs
The following definition of a “patient care program” has been included in the Hospital Pharmacy in Canada
Survey since the 2007/08 iteration:
Healthcare delivery that is formally structured around a group of patients with similar healthcare needs
(e.g., child health program, mental health program, critical care program). A formal patient care program
will usually have a physician and/or nurse leader or director.
Respondents to the 2016/17 survey were asked whether their facility had (or did not have) formal patient care
programs for 19 specific patient groups. Respondents were also asked to identify the number and the nature of any
newly supported patient care programs.
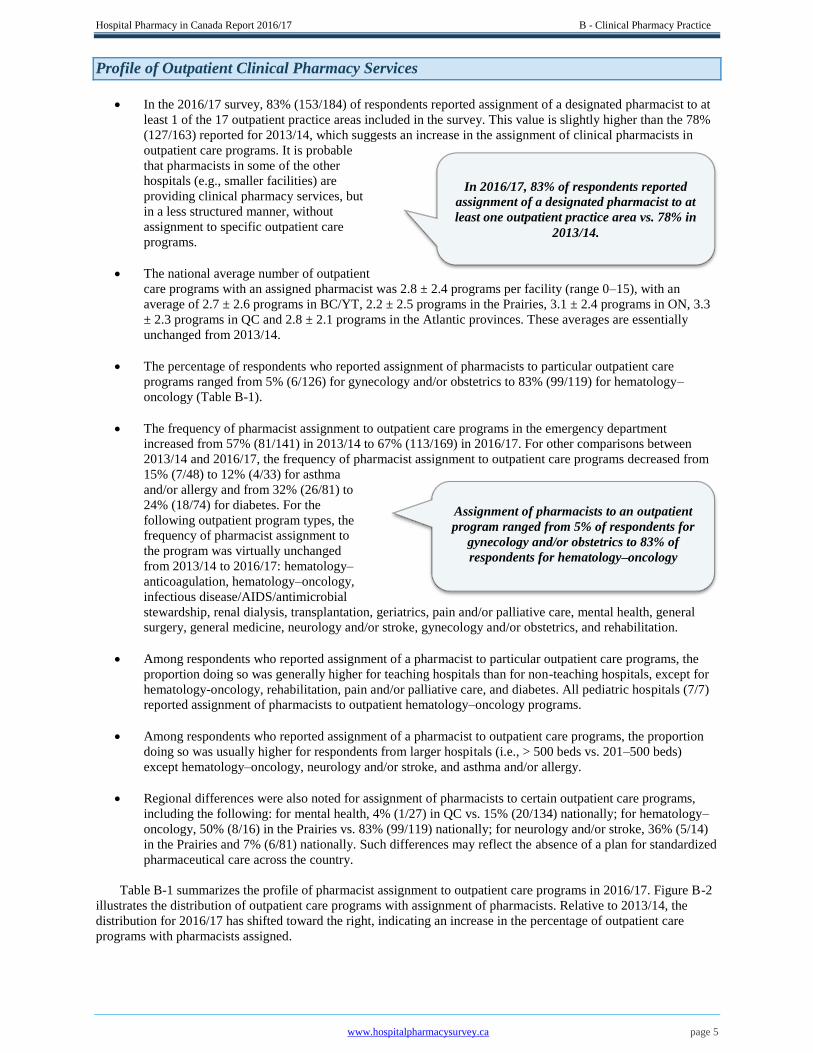
Out of the 19 formal patient care programs listed in the survey, respondents nationally reported a facility
average ± standard deviation of 11.5 ± 4.1 programs (range 1–19) (2013/14 data: 11.2 ± 4.3, range 0–19),
with an average of 10.1 ± 5.0 programs in British Columbia/Yukon (BC/YT), 10.1 ± 4.6 programs in the
Prairies, 12.9 ± 3.2 programs in Ontario (ON), 12.0 ± 3.7 programs in QC and 11.7 ± 3.8 programs in the
Atlantic provinces. [The Prairies comprise Alberta (AB), Saskatchewan (SK) and Manitoba (MB). The
Atlantic provinces comprise New Brunswick (NB), Nova Scotia (NS), Prince Edward Island (PE) and
Newfoundland and Labrador (NL).]
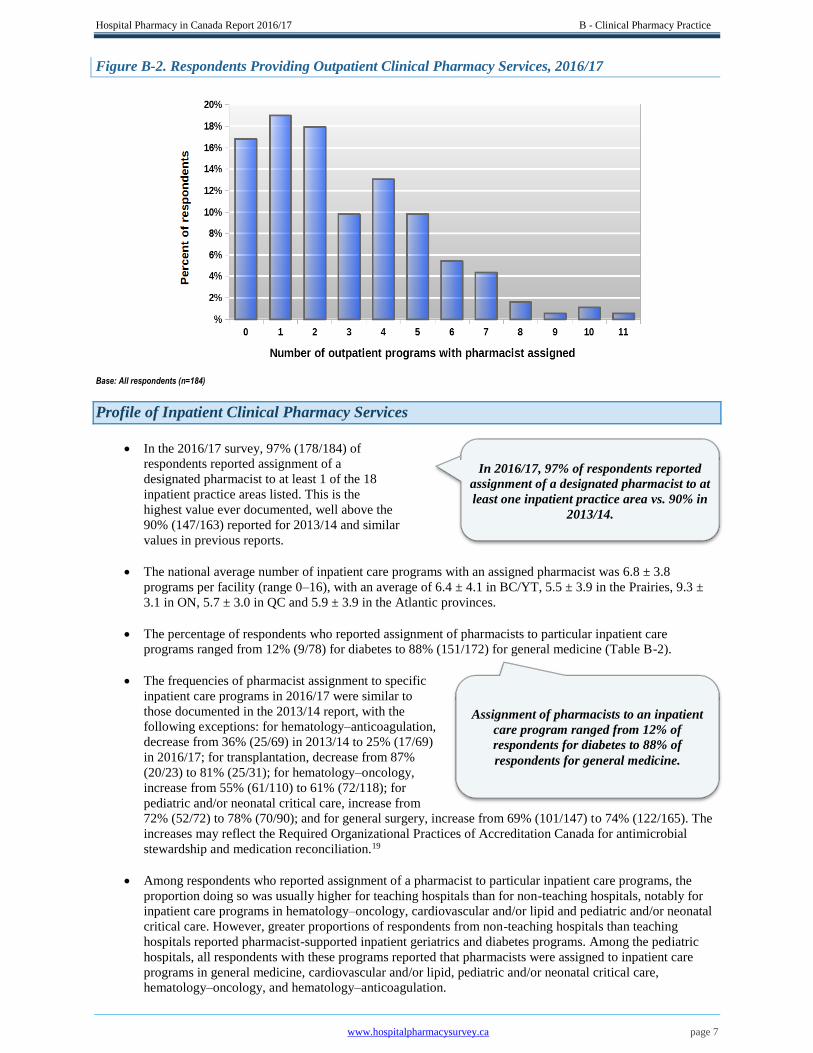
Figure B-1 summarizes the distribution of respondents who reported providing formal patient care
programs in 2016/17, with 2% (4/184) reporting just one or two formal patient care programs, and none
reporting no formal patient care programs (by comparison, 2% of respondents [4/163] reported no clinical
programs in 2013/14).
Figure B-1. Respondents Providing Formal Patient Care Programs, 2016/17
Base: All respondents (n=184)
Respondents were also asked to indicate whether one or more designated pharmacists were assigned to these
formal programs for inpatient and/or outpatient services, where a designated pharmacist was defined as a minimum
of 0.2 full-time equivalent (FTE) pharmacist (whether this minimum was one day per week or two half-days per
week). Formal assignment of a pharmacist to a patient care program is assumed to indicate that a reasonable level of
clinical pharmacy support is being provided to that program.
Note: If a respondent identified and provided data for a specific clinical program that was not already listed in
the survey questionnaire, those data were not incorporated into the data tables in any form and are not discussed
here.
Hospital Pharmacy in Canada Report 2016/17 B - Clinical Pharmacy Practice
www.hospitalpharmacysurvey.ca page 5
Assignment of pharmacists to an outpatient
program ranged from 5% of respondents for
gynecology and/or obstetrics to 83% of
respondents for hematology–oncology
Profile of Outpatient Clinical Pharmacy Services
In the 2016/17 survey, 83% (153/184) of respondents reported assignment of a designated pharmacist to at
least 1 of the 17 outpatient practice areas included in the survey. This value is slightly higher than the 78%
(127/163) reported for 2013/14, which suggests an increase in the assignment of clinical pharmacists in
outpatient care programs. It is probable
that pharmacists in some of the other
hospitals (e.g., smaller facilities) are
providing clinical pharmacy services, but
in a less structured manner, without
assignment to specific outpatient care
programs.
The national average number of outpatient
care programs with an assigned pharmacist was 2.8 ± 2.4 programs per facility (range 0–15), with an
average of 2.7 ± 2.6 programs in BC/YT, 2.2 ± 2.5 programs in the Prairies, 3.1 ± 2.4 programs in ON, 3.3
± 2.3 programs in QC and 2.8 ± 2.1 programs in the Atlantic provinces. These averages are essentially
unchanged from 2013/14.
The percentage of respondents who reported assignment of pharmacists to particular outpatient care
programs ranged from 5% (6/126) for gynecology and/or obstetrics to 83% (99/119) for hematology–
oncology (Table B-1).
The frequency of pharmacist assignment to outpatient care programs in the emergency department
increased from 57% (81/141) in 2013/14 to 67% (113/169) in 2016/17. For other comparisons between
2013/14 and 2016/17, the frequency of pharmacist assignment to outpatient care programs decreased from
15% (7/48) to 12% (4/33) for asthma
and/or allergy and from 32% (26/81) to
24% (18/74) for diabetes. For the
following outpatient program types, the
frequency of pharmacist assignment to
the program was virtually unchanged
from 2013/14 to 2016/17: hematology–
anticoagulation, hematology–oncology,
infectious disease/AIDS/antimicrobial
stewardship, renal dialysis, transplantation, geriatrics, pain and/or palliative care, mental health, general
surgery, general medicine, neurology and/or stroke, gynecology and/or obstetrics, and rehabilitation.
Among respondents who reported assignment of a pharmacist to particular outpatient care programs, the
proportion doing so was generally higher for teaching hospitals than for non-teaching hospitals, except for
hematology-oncology, rehabilitation, pain and/or palliative care, and diabetes. All pediatric hospitals (7/7)
reported assignment of pharmacists to outpatient hematology–oncology programs.
Among respondents who reported assignment of a pharmacist to outpatient care programs, the proportion
doing so was usually higher for respondents from larger hospitals (i.e., > 500 beds vs. 201–500 beds)
except hematology–oncology, neurology and/or stroke, and asthma and/or allergy.
Regional differences were also noted for assignment of pharmacists to certain outpatient care programs,
including the following: for mental health, 4% (1/27) in QC vs. 15% (20/134) nationally; for hematology–
oncology, 50% (8/16) in the Prairies vs. 83% (99/119) nationally; for neurology and/or stroke, 36% (5/14)
in the Prairies and 7% (6/81) nationally. Such differences may reflect the absence of a plan for standardized
pharmaceutical care across the country.
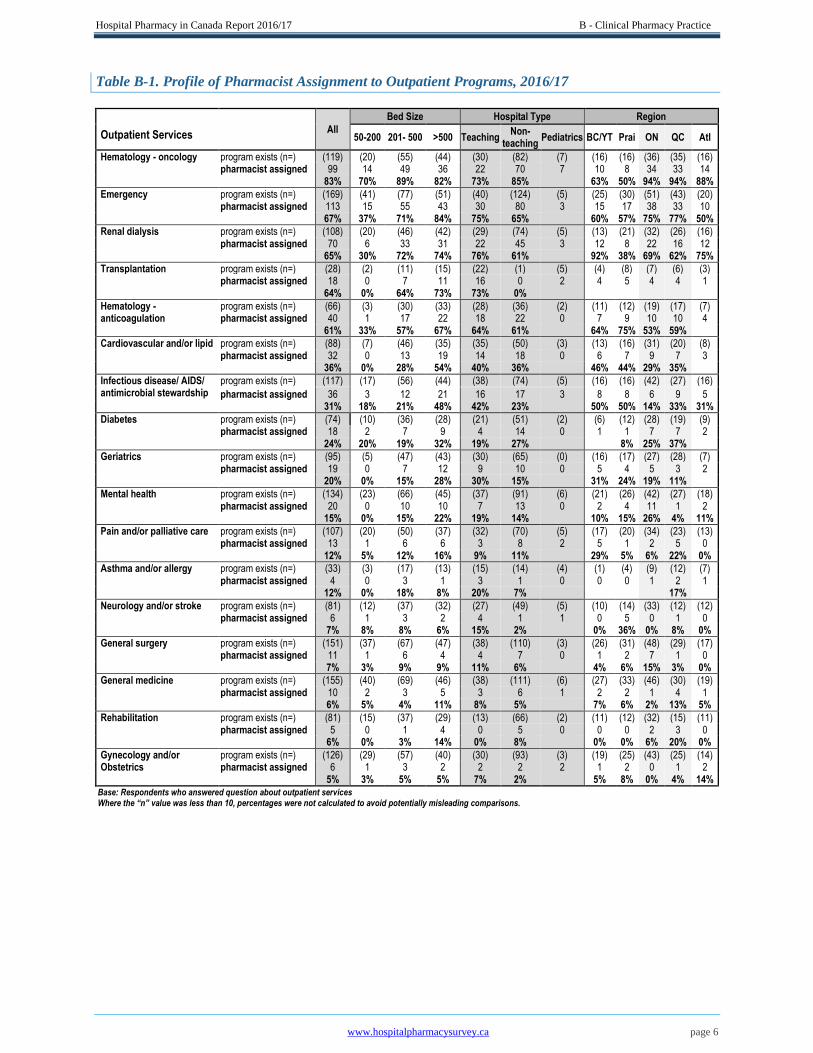
Table B-1 summarizes the profile of pharmacist assignment to outpatient care programs in 2016/17. Figure B-2
illustrates the distribution of outpatient care programs with assignment of pharmacists. Relative to 2013/14, the
distribution for 2016/17 has shifted toward the right, indicating an increase in the percentage of outpatient care
programs with pharmacists assigned.
In 2016/17, 83% of respondents reported
assignment of a designated pharmacist to at
least one outpatient practice area vs. 78% in
2013/14.
Hospital Pharmacy in Canada Report 2016/17 B - Clinical Pharmacy Practice
www.hospitalpharmacysurvey.ca page 6
Table B-1. Profile of Pharmacist Assignment to Outpatient Programs, 2016/17
All
Bed Size Hospital Type Region
Outpatient Services
50-200 201- 500 >500 Teaching Non-
teaching Pediatrics BC/YT Prai ON QC Atl
Hematology - oncology program exists (n=) (119) (20) (55) (44) (30) (82) (7) (16) (16) (36) (35) (16) pharmacist assigned 99 14 49 36 22 70 7 10 8 34 33 14
83% 70% 89% 82% 73% 85% 63% 50% 94% 94% 88%
Emergency program exists (n=) (169) (41) (77) (51) (40) (124) (5) (25) (30) (51) (43) (20) pharmacist assigned 113 15 55 43 30 80 3 15 17 38 33 10
67% 37% 71% 84% 75% 65% 60% 57% 75% 77% 50%
Renal dialysis program exists (n=) (108) (20) (46) (42) (29) (74) (5) (13) (21) (32) (26) (16) pharmacist assigned 70 6 33 31 22 45 3 12 8 22 16 12
65% 30% 72% 74% 76% 61% 92% 38% 69% 62% 75%
Transplantation program exists (n=) (28) (2) (11) (15) (22) (1) (5) (4) (8) (7) (6) (3) pharmacist assigned 18 0 7 11 16 0 2 4 5 4 4 1
64% 0% 64% 73% 73% 0%
Hematology - program exists (n=) (66) (3) (30) (33) (28) (36) (2) (11) (12) (19) (17) (7) anticoagulation pharmacist assigned 40 1 17 22 18 22 0 7 9 10 10 4 61% 33% 57% 67% 64% 61% 64% 75% 53% 59%
Cardiovascular and/or lipid program exists (n=) (88) (7) (46) (35) (35) (50) (3) (13) (16) (31) (20) (8) pharmacist assigned 32 0 13 19 14 18 0 6 7 9 7 3
36% 0% 28% 54% 40% 36% 46% 44% 29% 35%
Infectious disease/ AIDS/ antimicrobial stewardship
program exists (n=) (117) (17) (56) (44) (38) (74) (5) (16) (16) (42) (27) (16)
pharmacist assigned 36 3 12 21 16 17 3 8 8 6 9 5 31% 18% 21% 48% 42% 23% 50% 50% 14% 33% 31%
Diabetes program exists (n=) (74) (10) (36) (28) (21) (51) (2) (6) (12) (28) (19) (9) pharmacist assigned 18 2 7 9 4 14 0 1 1 7 7 2
24% 20% 19% 32% 19% 27% 8% 25% 37%
Geriatrics program exists (n=) (95) (5) (47) (43) (30) (65) (0) (16) (17) (27) (28) (7) pharmacist assigned 19 0 7 12 9 10 0 5 4 5 3 2
20% 0% 15% 28% 30% 15% 31% 24% 19% 11%
Mental health program exists (n=) (134) (23) (66) (45) (37) (91) (6) (21) (26) (42) (27) (18) pharmacist assigned 20 0 10 10 7 13 0 2 4 11 1 2
15% 0% 15% 22% 19% 14% 10% 15% 26% 4% 11%
Pain and/or palliative care program exists (n=) (107) (20) (50) (37) (32) (70) (5) (17) (20) (34) (23) (13) pharmacist assigned 13 1 6 6 3 8 2 5 1 2 5 0
12% 5% 12% 16% 9% 11% 29% 5% 6% 22% 0%
Asthma and/or allergy program exists (n=) (33) (3) (17) (13) (15) (14) (4) (1) (4) (9) (12) (7) pharmacist assigned 4 0 3 1 3 1 0 0 0 1 2 1
12% 0% 18% 8% 20% 7% 17%
Neurology and/or stroke program exists (n=) (81) (12) (37) (32) (27) (49) (5) (10) (14) (33) (12) (12) pharmacist assigned 6 1 3 2 4 1 1 0 5 0 1 0
7% 8% 8% 6% 15% 2% 0% 36% 0% 8% 0%
General surgery program exists (n=) (151) (37) (67) (47) (38) (110) (3) (26) (31) (48) (29) (17) pharmacist assigned 11 1 6 4 4 7 0 1 2 7 1 0
7% 3% 9% 9% 11% 6% 4% 6% 15% 3% 0%
General medicine program exists (n=) (155) (40) (69) (46) (38) (111) (6) (27) (33) (46) (30) (19) pharmacist assigned 10 2 3 5 3 6 1 2 2 1 4 1
6% 5% 4% 11% 8% 5% 7% 6% 2% 13% 5%
Rehabilitation program exists (n=) (81) (15) (37) (29) (13) (66) (2) (11) (12) (32) (15) (11) pharmacist assigned 5 0 1 4 0 5 0 0 0 2 3 0
6% 0% 3% 14% 0% 8% 0% 0% 6% 20% 0%
Gynecology and/or program exists (n=) (126) (29) (57) (40) (30) (93) (3) (19) (25) (43) (25) (14) Obstetrics pharmacist assigned 6 1 3 2 2 2 2 1 2 0 1 2
5% 3% 5% 5% 7% 2% 5% 8% 0% 4% 14% Base: Respondents who answered question about outpatient services Where the “n” value was less than 10, percentages were not calculated to avoid potentially misleading comparisons.
Hospital Pharmacy in Canada Report 2016/17 B - Clinical Pharmacy Practice
www.hospitalpharmacysurvey.ca page 7
Figure B-2. Respondents Providing Outpatient Clinical Pharmacy Services, 2016/17
Base: All respondents (n=184)
Profile of Inpatient Clinical Pharmacy Services
In the 2016/17 survey, 97% (178/184) of
respondents reported assignment of a
designated pharmacist to at least 1 of the 18
inpatient practice areas listed. This is the
highest value ever documented, well above the
90% (147/163) reported for 2013/14 and similar
values in previous reports.
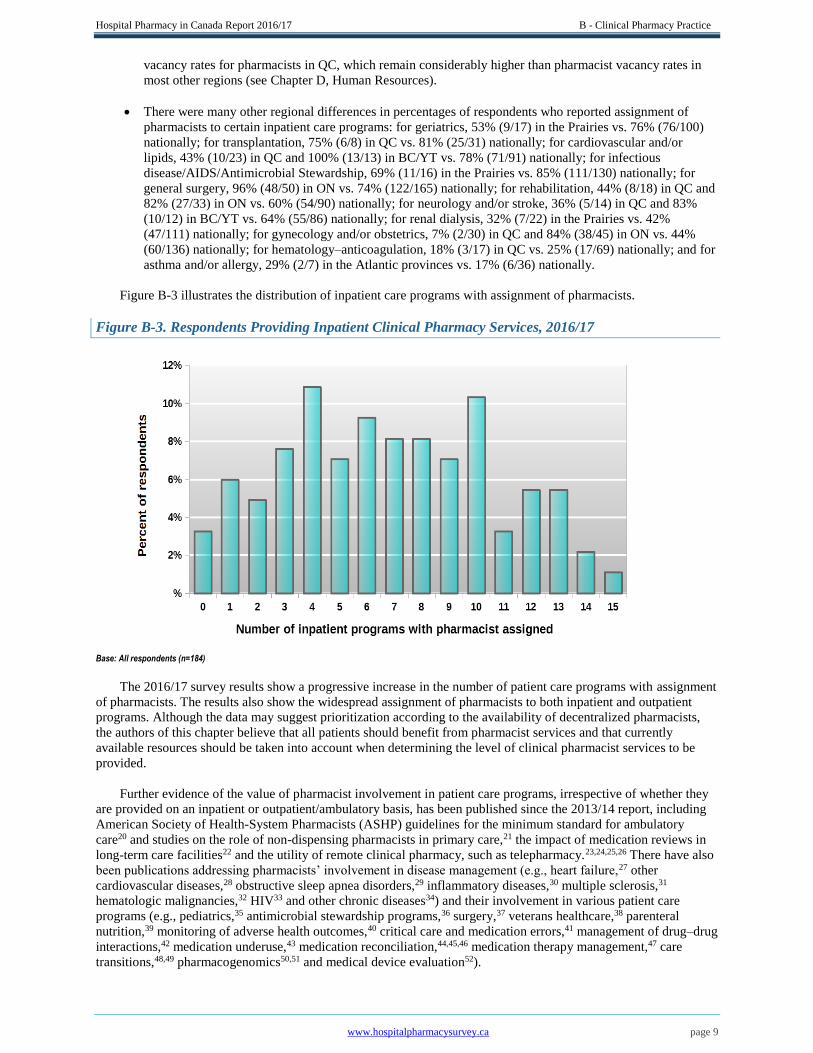
The national average number of inpatient care programs with an assigned pharmacist was 6.8 ± 3.8
programs per facility (range 0–16), with an average of 6.4 ± 4.1 in BC/YT, 5.5 ± 3.9 in the Prairies, 9.3 ±
3.1 in ON, 5.7 ± 3.0 in QC and 5.9 ± 3.9 in the Atlantic provinces.
The percentage of respondents who reported assignment of pharmacists to particular inpatient care
programs ranged from 12% (9/78) for diabetes to 88% (151/172) for general medicine (Table B-2).
The frequencies of pharmacist assignment to specific
inpatient care programs in 2016/17 were similar to
those documented in the 2013/14 report, with the
following exceptions: for hematology–anticoagulation,
decrease from 36% (25/69) in 2013/14 to 25% (17/69)
in 2016/17; for transplantation, decrease from 87%
(20/23) to 81% (25/31); for hematology–oncology,
increase from 55% (61/110) to 61% (72/118); for
pediatric and/or neonatal critical care, increase from
72% (52/72) to 78% (70/90); and for general surgery, increase from 69% (101/147) to 74% (122/165). The
increases may reflect the Required Organizational Practices of Accreditation Canada for antimicrobial
stewardship and medication reconciliation.19
Among respondents who reported assignment of a pharmacist to particular inpatient care programs, the
proportion doing so was usually higher for teaching hospitals than for non-teaching hospitals, notably for
inpatient care programs in hematology–oncology, cardiovascular and/or lipid and pediatric and/or neonatal
critical care. However, greater proportions of respondents from non-teaching hospitals than teaching
hospitals reported pharmacist-supported inpatient geriatrics and diabetes programs. Among the pediatric
hospitals, all respondents with these programs reported that pharmacists were assigned to inpatient care
programs in general medicine, cardiovascular and/or lipid, pediatric and/or neonatal critical care,
hematology–oncology, and hematology–anticoagulation.
In 2016/17, 97% of respondents reported
assignment of a designated pharmacist to at
least one inpatient practice area vs. 90% in
2013/14.
Assignment of pharmacists to an inpatient
care program ranged from 12% of
respondents for diabetes to 88% of
respondents for general medicine.
Hospital Pharmacy in Canada Report 2016/17 B - Clinical Pharmacy Practice
www.hospitalpharmacysurvey.ca page 8
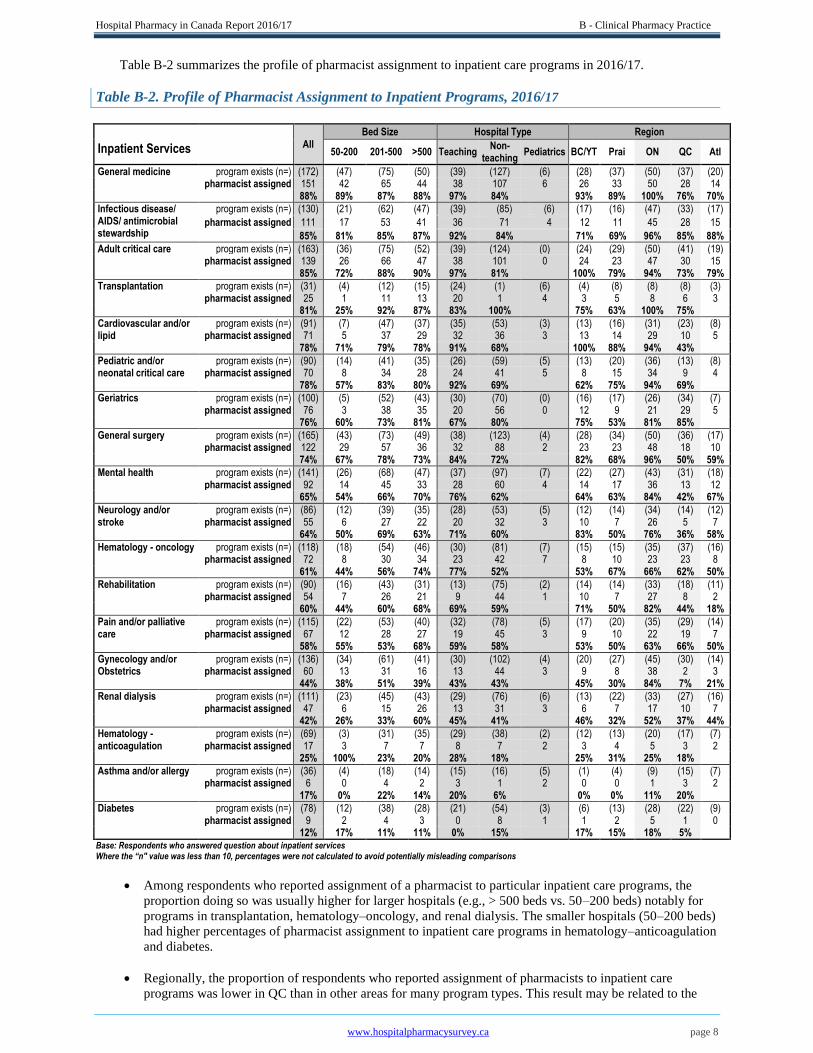
Table B-2 summarizes the profile of pharmacist assignment to inpatient care programs in 2016/17.
Table B-2. Profile of Pharmacist Assignment to Inpatient Programs, 2016/17
All
Bed Size Hospital Type Region
Inpatient Services
50-200 201-500 >500 Teaching Non-
teaching Pediatrics BC/YT Prai ON QC Atl
General medicine program exists (n=) (172) (47) (75) (50) (39) (127) (6) (28) (37) (50) (37) (20) pharmacist assigned 151 42 65 44 38 107 6 26 33 50 28 14 88% 89% 87% 88% 97% 84% 93% 89% 100% 76% 70%
Infectious disease/ AIDS/ antimicrobial stewardship
program exists (n=) (130) (21) (62) (47) (39) (85) (6) (17) (16) (47) (33) (17)
pharmacist assigned 111 17 53 41 36 71 4 12 11 45 28 15
85% 81% 85% 87% 92% 84% 71% 69% 96% 85% 88%
Adult critical care program exists (n=) (163) (36) (75) (52) (39) (124) (0) (24) (29) (50) (41) (19) pharmacist assigned 139 26 66 47 38 101 0 24 23 47 30 15 85% 72% 88% 90% 97% 81% 100% 79% 94% 73% 79%
Transplantation program exists (n=) (31) (4) (12) (15) (24) (1) (6) (4) (8) (8) (8) (3) pharmacist assigned 25 1 11 13 20 1 4 3 5 8 6 3 81% 25% 92% 87% 83% 100% 75% 63% 100% 75%
Cardiovascular and/or program exists (n=) (91) (7) (47) (37) (35) (53) (3) (13) (16) (31) (23) (8) lipid pharmacist assigned 71 5 37 29 32 36 3 13 14 29 10 5 78% 71% 79% 78% 91% 68% 100% 88% 94% 43%
Pediatric and/or program exists (n=) (90) (14) (41) (35) (26) (59) (5) (13) (20) (36) (13) (8) neonatal critical care pharmacist assigned 70 8 34 28 24 41 5 8 15 34 9 4 78% 57% 83% 80% 92% 69% 62% 75% 94% 69%
Geriatrics program exists (n=) (100) (5) (52) (43) (30) (70) (0) (16) (17) (26) (34) (7) pharmacist assigned 76 3 38 35 20 56 0 12 9 21 29 5 76% 60% 73% 81% 67% 80% 75% 53% 81% 85%
General surgery program exists (n=) (165) (43) (73) (49) (38) (123) (4) (28) (34) (50) (36) (17) pharmacist assigned 122 29 57 36 32 88 2 23 23 48 18 10 74% 67% 78% 73% 84% 72% 82% 68% 96% 50% 59%
Mental health program exists (n=) (141) (26) (68) (47) (37) (97) (7) (22) (27) (43) (31) (18) pharmacist assigned 92 14 45 33 28 60 4 14 17 36 13 12 65% 54% 66% 70% 76% 62% 64% 63% 84% 42% 67%
Neurology and/or program exists (n=) (86) (12) (39) (35) (28) (53) (5) (12) (14) (34) (14) (12) stroke pharmacist assigned 55 6 27 22 20 32 3 10 7 26 5 7 64% 50% 69% 63% 71% 60% 83% 50% 76% 36% 58%
Hematology - oncology program exists (n=) (118) (18) (54) (46) (30) (81) (7) (15) (15) (35) (37) (16) pharmacist assigned 72 8 30 34 23 42 7 8 10 23 23 8 61% 44% 56% 74% 77% 52% 53% 67% 66% 62% 50%
Rehabilitation program exists (n=) (90) (16) (43) (31) (13) (75) (2) (14) (14) (33) (18) (11) pharmacist assigned 54 7 26 21 9 44 1 10 7 27 8 2 60% 44% 60% 68% 69% 59% 71% 50% 82% 44% 18%
Pain and/or palliative program exists (n=) (115) (22) (53) (40) (32) (78) (5) (17) (20) (35) (29) (14) care pharmacist assigned 67 12 28 27 19 45 3 9 10 22 19 7 58% 55% 53% 68% 59% 58% 53% 50% 63% 66% 50%
Gynecology and/or program exists (n=) (136) (34) (61) (41) (30) (102) (4) (20) (27) (45) (30) (14) Obstetrics pharmacist assigned 60 13 31 16 13 44 3 9 8 38 2 3 44% 38% 51% 39% 43% 43% 45% 30% 84% 7% 21%
Renal dialysis program exists (n=) (111) (23) (45) (43) (29) (76) (6) (13) (22) (33) (27) (16) pharmacist assigned 47 6 15 26 13 31 3 6 7 17 10 7 42% 26% 33% 60% 45% 41% 46% 32% 52% 37% 44%
Hematology - program exists (n=) (69) (3) (31) (35) (29) (38) (2) (12) (13) (20) (17) (7) anticoagulation pharmacist assigned 17 3 7 7 8 7 2 3 4 5 3 2 25% 100% 23% 20% 28% 18% 25% 31% 25% 18%
Asthma and/or allergy program exists (n=) (36) (4) (18) (14) (15) (16) (5) (1) (4) (9) (15) (7) pharmacist assigned 6 0 4 2 3 1 2 0 0 1 3 2 17% 0% 22% 14% 20% 6% 0% 0% 11% 20%
Diabetes program exists (n=) (78) (12) (38) (28) (21) (54) (3) (6) (13) (28) (22) (9) pharmacist assigned 9 2 4 3 0 8 1 1 2 5 1 0 12% 17% 11% 11% 0% 15% 17% 15% 18% 5% Base: Respondents who answered question about inpatient services Where the “n" value was less than 10, percentages were not calculated to avoid potentially misleading comparisons
Among respondents who reported assignment of a pharmacist to particular inpatient care programs, the
proportion doing so was usually higher for larger hospitals (e.g., > 500 beds vs. 50–200 beds) notably for
programs in transplantation, hematology–oncology, and renal dialysis. The smaller hospitals (50–200 beds)
had higher percentages of pharmacist assignment to inpatient care programs in hematology–anticoagulation
and diabetes.
Regionally, the proportion of respondents who reported assignment of pharmacists to inpatient care
programs was lower in QC than in other areas for many program types. This result may be related to the
Hospital Pharmacy in Canada Report 2016/17 B - Clinical Pharmacy Practice
www.hospitalpharmacysurvey.ca page 9
vacancy rates for pharmacists in QC, which remain considerably higher than pharmacist vacancy rates in
most other regions (see Chapter D, Human Resources).
There were many other regional differences in percentages of respondents who reported assignment of
pharmacists to certain inpatient care programs: for geriatrics, 53% (9/17) in the Prairies vs. 76% (76/100)
nationally; for transplantation, 75% (6/8) in QC vs. 81% (25/31) nationally; for cardiovascular and/or
lipids, 43% (10/23) in QC and 100% (13/13) in BC/YT vs. 78% (71/91) nationally; for infectious
disease/AIDS/Antimicrobial Stewardship, 69% (11/16) in the Prairies vs. 85% (111/130) nationally; for
general surgery, 96% (48/50) in ON vs. 74% (122/165) nationally; for rehabilitation, 44% (8/18) in QC and
82% (27/33) in ON vs. 60% (54/90) nationally; for neurology and/or stroke, 36% (5/14) in QC and 83%
(10/12) in BC/YT vs. 64% (55/86) nationally; for renal dialysis, 32% (7/22) in the Prairies vs. 42%
(47/111) nationally; for gynecology and/or obstetrics, 7% (2/30) in QC and 84% (38/45) in ON vs. 44%
(60/136) nationally; for hematology–anticoagulation, 18% (3/17) in QC vs. 25% (17/69) nationally; and for
asthma and/or allergy, 29% (2/7) in the Atlantic provinces vs. 17% (6/36) nationally.
Figure B-3 illustrates the distribution of inpatient care programs with assignment of pharmacists.
Figure B-3. Respondents Providing Inpatient Clinical Pharmacy Services, 2016/17
Base: All respondents (n=184)
The 2016/17 survey results show a progressive increase in the number of patient care programs with assignment
of pharmacists. The results also show the widespread assignment of pharmacists to both inpatient and outpatient
programs. Although the data may suggest prioritization according to the availability of decentralized pharmacists,
the authors of this chapter believe that all patients should benefit from pharmacist services and that currently
available resources should be taken into account when determining the level of clinical pharmacist services to be
provided.
Further evidence of the value of pharmacist involvement in patient care programs, irrespective of whether they
are provided on an inpatient or outpatient/ambulatory basis, has been published since the 2013/14 report, including
American Society of Health-System Pharmacists (ASHP) guidelines for the minimum standard for ambulatory
care20 and studies on the role of non-dispensing pharmacists in primary care,21 the impact of medication reviews in
long-term care facilities22 and the utility of remote clinical pharmacy, such as telepharmacy.23,24,25,26 There have also
been publications addressing pharmacists’ involvement in disease management (e.g., heart failure,27 other
cardiovascular diseases,28 obstructive sleep apnea disorders,29 inflammatory diseases,30 multiple sclerosis,31
hematologic malignancies,32 HIV33 and other chronic diseases34) and their involvement in various patient care
programs (e.g., pediatrics,35 antimicrobial stewardship programs,36 surgery,37 veterans healthcare,38 parenteral
nutrition,39 monitoring of adverse health outcomes,40 critical care and medication errors,41 management of drug–drug
interactions,42 medication underuse,43 medication reconciliation,44,45,46 medication therapy management,47 care
transitions,48,49 pharmacogenomics50,51 and medical device evaluation52).

Hospital Pharmacy in Canada Report 2016/17 B - Clinical Pharmacy Practice
www.hospitalpharmacysurvey.ca page 10
Only 8% of respondents indicated that
pharmacists at their institutions performed mostly
distributive functions, with limited provision of
clinical services.
Clinical pharmacy practice should be pivotal in the
organizational plan of a pharmacy department, but there
also needs to be strong leadership supporting such
orientation and development for the future.53,54 Studies
have been published demonstrating the effectiveness and
impact of clinical pharmacy services over
time.55,56,57,58,59 Some published studies have shown
negative clinical outcomes associated with clinical pharmacy services,60 but such results are scarce. Further
evolution of clinical pharmacy practice should rely on pharmacy practice research, which should begin during
residency training and continue throughout the pharmacist’s career.11,61,62,63
Pharmacy Practice Models
The pharmacy practice model of a particular institution is the method by which the pharmacy department’s
resources are used to provide patient care services. It also encompasses the outcomes to be achieved through the
particular model of resource utilization. The pharmacy practice model specifies the roles played by pharmacists,
pharmacy technicians, students, information technologies and automation technologies.
The ASHP and the ASHP Foundation have a common goal of significantly advancing healthcare by supporting
models that effectively use pharmacists as direct patient care providers. These organizations have developed a series
of self-assessment tools and resources through their Practice Advancement Initiative (PAI).64 Use of these tools has
helped US-based organizations to develop successful pharmacy practice models in both hospital and ambulatory
care settings. The PAI also provides tools to help engage senior leadership, a necessity in a time when financial
resources are scare and all decisions must be justified with evidence. The PAI has tracked progress in many areas,
such as medication-related continuity of care and antimicrobial stewardship, from 2011 to 2017.65
Given the practice model definitions developed recently by both ACCP and ASHP, the Hospital Pharmacy in
Canada Survey Board revised practice model descriptions for the 2016/17 survey. Four practice models were
defined, and respondents were asked to specify the model that best described deployment of pharmacists in their
facilities, rather than stating the proportion of resources devoted to each model, as was requested in previous
surveys.
In the 2016/17 survey, the question about practice models was answered by183 of the 184 respondents.
Two models appeared dominant: the
clinical generalist (integrated) model, with
limited differentiation of pharmacist roles
(i.e., nearly all pharmacists have both
distributive and clinical responsibilities)
(45%, 83/183), and the comprehensive
model, with pharmacists assigned to distributive, generalist/integrated and specialist roles (43%, 78/183).
The practice model with “mostly distributive pharmacists with limited clinical services” was most common
in the Atlantic region (24%, 5/21).
It is encouraging that only a small percentage of respondents nationally (8%, 15/183) had mostly
distributive pharmacists with limited clinical
services.
The practice model with “separate clinical
specialist and distributive roles” was generally
rare, but most prevalent in QC (9%, 4/43); the
clinical professor tenure in Quebec faculties of
pharmacy could be a contributing factor.
Ideally, the progression should be toward the comprehensive model, in which pharmacists work in
distributive, generalist/integrated and specialist roles. This shift was evident among larger hospitals (51%,
27/53), teaching hospitals (73%, 30/41), pediatric hospitals (5 of 7) and regionally in BC/YT (53%, 16/30).
Table B-3 summarizes the distribution of clinical pharmacy practice models.
Clinical pharmacy practice should be pivotal in a
pharmacy department’s organizational plan, with
strong leadership supporting such orientation and
its future development.
Two models of pharmacy practice appeared
dominant: the clinical generalist (integrated)
model and the comprehensive model.

Hospital Pharmacy in Canada Report 2016/17 B - Clinical Pharmacy Practice
www.hospitalpharmacysurvey.ca page 11
Table B-3. Pharmacy Practice Models, 2016/17
Practice Model (Best description of deployment of pharmacists)
All
Bed Size Hospital Type Region
50-200 201-500 >500 Teaching Non-
teaching Pediatrics BC/YT Prai ON QC Atl
(n= ) (183) (49) (81) (53) (41) (135) (7) (30) (37) (52) (43) (21) Clinical generalist model with limited differentiation of roles
83 32 30 21 10 72 1 12 21 28 14 8
45% 65% 37% 40% 24% 53% 40% 57% 54% 33% 38%
Comprehensive model, including pharmacists in distributive, generalist, specialist roles
78 9 42 27 30 43 5 16 15 21 19 7
43% 18% 52% 51% 73% 32% 53% 41% 40% 44% 33%
Mostly distributive pharmacists with limited clinical services
15 5 8 2 0 15 0 2 1 1 6 5
8% 10% 10% 4% 0% 11% 7% 3% 2% 14% 24%
Separate clinical specialist and distributive roles
7 3 1 3 1 5 1 0 0 2 4 1
4% 6% 1% 6% 2% 4% 0% 0% 4% 9% 5%
Base: All respondents Where the “n” value was less than 10, percentages were not calculated to avoid potentially misleading comparisons
Profile of Clinical Pharmacy Activities
A web-based platform is now available that presents the best published evidence pertaining to the role and
impact of pharmaceutical activities.66,67 This platform was developed by a Canadian research team on the basis of a
structured and reproducible search and analytical method to describe the evidence, according to 100 themes,
concerning patient care programs, diseases and pharmaceutical activities.68 The team has described three approaches
to optimize use of this website and its data, which are applicable to pharmacy students and residents, pharmacists
and clinicians, as well as other healthcare decision-makers. The website can be accessed without a login or
password, and includes reference lists, article summaries (currently available only in French), fact sheets (also
available only in French), knowledge transfer strategies and the profiles of team members. A weekly blog
(http://impactpharmacie.wordpress.com) is also maintained to comment on recently published studies.
The 2016/17 iteration of the Hospital Pharmacy in Canada Survey Board included a re-design of questions
about the type and level of clinical pharmacy services provided. We used a selection of questions similar to those in
the PAI Hospital Self-Assessment Tool to address the targeted topics important for clinical pharmacy practice in
Canadian hospitals. Respondents were asked questions about 20 clinical activities and the extent to which these had
been implemented and performed within their organization, as of March 31, 2017.
The following is a summary of key observations (representing the sum of responses for implementation in “all
areas” and “most areas”); however, because these re-designed questions about clinical activities were new in the
2016/17 survey, comparison with previous surveys is not possible:
The extent of clinical activity implementation was higher in teaching than in non-teaching hospitals.
The following activities were widely implemented (i.e., reported by more than 50% of respondents):
o Involvement of pharmacists in identifying, developing, reviewing or approving new medication
order sets (91%, 167/184).
o Identification by the facility’s pharmacy department of drug therapy management as a service that
should be provided consistently by pharmacists (82%, 150/183).
o Adjustment by pharmacists of medication dosing, on the basis of the patient’s response or
pharmacokinetic characteristics (75%, 139/184).
o Review of medication orders by a pharmacist before the first dose is administered (75%, 137/183).
o Prioritization of drug therapy management services for inpatients, according to the complexity of
patients’ medication therapy (73%,
134/183).
o Involvement of pharmacists in
monitoring and reporting potential and
actual adverse drug events (71%,
131/184)
For two clinical activities, substantial numbers
of respondents reported that pharmacists were
not involved at their facilities:
o More than three-quarters of respondents (78%, 126/161) reported that no pharmacists participated
on the facility’s rapid response teams, and 75% (128/170) reported that no pharmacists
Two widely implemented activities were
involvement of pharmacists in new medication
order sets and consistent provision of drug
therapy management by pharmacists.
Hospital Pharmacy in Canada Report 2016/17 B - Clinical Pharmacy Practice
www.hospitalpharmacysurvey.ca page 12
participated on the facility’s cardiopulmonary resuscitation teams. Although the value of
pharmacists on rapid response and cardiopulmonary resuscitation teams has been documented, it
can be difficult to have pharmacists available to perform these activities 24 hours per day, 7 days a
week.
For two other clinical activities, implementation was somewhat limited but can be expected to grow in the
future:
o For patients whose genetic characteristics are known, 54% (84/156) of respondents reported that
pharmacists had no role in adjusting dosing or changing therapy for select medications (e.g.,
through results of genetic tests for variants of the CYP2C9 and VKORC1 genes for patients
receiving warfarin therapy). This is an emerging clinical activity for pharmacists and should be
integrated in any pharmaceutical care
plan.
o More than one-third of respondents
(36%, 59/164) reported that their
facilities’ outpatient pharmacists were
not authorized by policy or protocol
to write medication orders and/or
prescriptions as part of their scope of practice, and 22% (40/182) reported that inpatient
pharmacists were not authorized to do so. The right to adapt or manage medication orders has
been granted to pharmacists in most provinces; the right to prescribe independently and in
collaboration has been also given to pharmacists in several provinces.69
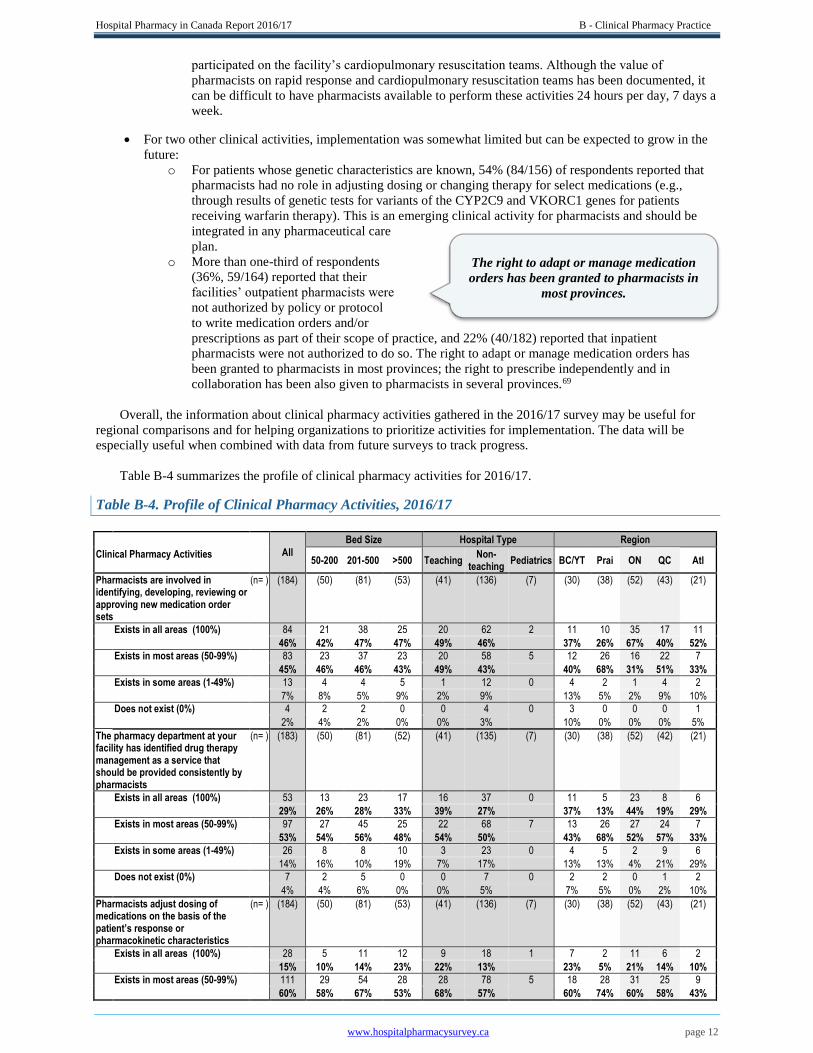
Overall, the information about clinical pharmacy activities gathered in the 2016/17 survey may be useful for
regional comparisons and for helping organizations to prioritize activities for implementation. The data will be
especially useful when combined with data from future surveys to track progress.
Table B-4 summarizes the profile of clinical pharmacy activities for 2016/17.
Table B-4. Profile of Clinical Pharmacy Activities, 2016/17
All
Bed Size Hospital Type Region
Clinical Pharmacy Activities
50-200 201-500 >500 Teaching Non-
teaching Pediatrics BC/YT Prai ON QC Atl
Pharmacists are involved in identifying, developing, reviewing or approving new medication order sets
(n= ) (184) (50) (81) (53) (41) (136) (7) (30) (38) (52) (43) (21)
Exists in all areas (100%)
84 21 38 25 20 62 2 11 10 35 17 11
46% 42% 47% 47% 49% 46%
37% 26% 67% 40% 52%
Exists in most areas (50-99%)
83 23 37 23 20 58 5 12 26 16 22 7
45% 46% 46% 43% 49% 43%
40% 68% 31% 51% 33%
Exists in some areas (1-49%)
13 4 4 5 1 12 0 4 2 1 4 2
7% 8% 5% 9% 2% 9%
13% 5% 2% 9% 10%
Does not exist (0%)
4 2 2 0 0 4 0 3 0 0 0 1
2% 4% 2% 0% 0% 3%
10% 0% 0% 0% 5%
The pharmacy department at your facility has identified drug therapy management as a service that should be provided consistently by pharmacists
(n= ) (183) (50) (81) (52) (41) (135) (7) (30) (38) (52) (42) (21)
Exists in all areas (100%)
53 13 23 17 16 37 0 11 5 23 8 6
29% 26% 28% 33% 39% 27%
37% 13% 44% 19% 29%
Exists in most areas (50-99%)
97 27 45 25 22 68 7 13 26 27 24 7
53% 54% 56% 48% 54% 50%
43% 68% 52% 57% 33%
Exists in some areas (1-49%)
26 8 8 10 3 23 0 4 5 2 9 6
14% 16% 10% 19% 7% 17%
13% 13% 4% 21% 29%
Does not exist (0%)
7 2 5 0 0 7 0 2 2 0 1 2
4% 4% 6% 0% 0% 5%
7% 5% 0% 2% 10%
Pharmacists adjust dosing of medications on the basis of the patient’s response or pharmacokinetic characteristics
(n= ) (184) (50) (81) (53) (41) (136) (7) (30) (38) (52) (43) (21)
Exists in all areas (100%)
28 5 11 12 9 18 1 7 2 11 6 2
15% 10% 14% 23% 22% 13%
23% 5% 21% 14% 10%
Exists in most areas (50-99%)
111 29 54 28 28 78 5 18 28 31 25 9
60% 58% 67% 53% 68% 57%
60% 74% 60% 58% 43%
The right to adapt or manage medication
orders has been granted to pharmacists in
most provinces.

Hospital Pharmacy in Canada Report 2016/17 B - Clinical Pharmacy Practice
www.hospitalpharmacysurvey.ca page 13
Table B-4 continued
All
Bed Size Hospital Type Region
Clinical Pharmacy Activities
50-200 201-500 >500 Teaching Non-
teaching Pediatrics BC/YT Prai ON QC Atl
Exists in some areas (1-49%)
41 13 15 13 4 36 1 5 6 9 12 9
22% 26% 19% 25% 10% 26%
17% 16% 17% 28% 43%
Does not exist (0%)
4 3 1 0 0 4 0 0 2 1 0 1
2% 6% 1% 0% 0% 3%
0% 5% 2% 0% 5%
Pharmacists review medication orders before the first dose is administered
(n= ) (183) (50) (81) (52) (41) (135) (7) (30) (38) (52) (43) (20)
Exists in all areas (100%)
2 1 0 1 0 2 0 0 0 1 1 0
1% 2% 0% 2% 0% 1%
0% 0% 2% 2% 0%
Exists in most areas (50-99%)
135 29 64 42 36 94 5 23 21 39 39 13
74% 58% 79% 81% 88% 70%
77% 55% 75% 91% 65%
Exists in some areas (1-49%)
43 17 17 9 5 36 2 7 16 11 3 6
23% 34% 21% 17% 12% 27%
23% 42% 21% 7% 30%
Does not exist (0%)
3 3 0 0 0 3 0 0 1 1 0 1
2% 6% 0% 0% 0% 2%
0% 3% 2% 0% 5%
Drug therapy management services are prioritized for inpatients according to the complexity of patients’ medication therapy
(n= ) (183) (50) (81) (52) (41) (135) (7) (30) (38) (52) (42) (21)
Exists in all areas (100%)
22 2 10 10 10 12 0 5 2 8 5 2
12% 4% 12% 19% 24% 9%
17% 5% 15% 12% 10%
Exists in most areas (50-99%)
112 33 48 31 25 80 7 14 28 38 23 9
61% 66% 59% 60% 61% 59%
47% 74% 73% 55% 43%
Exists in some areas (1-49%)
43 12 21 10 6 37 0 10 7 5 13 8
23% 24% 26% 19% 15% 27%
33% 18% 10% 31% 38%
Does not exist (0%)
6 3 2 1 0 6 0 1 1 1 1 2
3% 6% 2% 2% 0% 4%
3% 3% 2% 2% 10%
Pharmacists are involved in monitoring and reporting potential and actual adverse drug events (ADEs)
(n= ) (184) (50) (81) (53) (41) (136) (7) (30) (38) (52) (43) (21)
Exists in all areas (100%)
39 12 18 9 11 26 2 6 4 18 8 3
21% 24% 22% 17% 27% 19%
20% 11% 35% 19% 14%
Exists in most areas (50-99%)
92 27 36 29 26 61 5 14 26 27 14 11
50% 54% 44% 55% 63% 45%
47% 68% 52% 33% 52%
Exists in some areas (1-49%)
50 8 27 15 4 46 0 10 6 7 21 6
27% 16% 33% 28% 10% 34%
33% 16% 13% 49% 29%
Does not exist (0%)
3 3 0 0 0 3 0 0 2 0 0 1
2% 6% 0% 0% 0% 2%
0% 5% 0% 0% 5%
Pharmacists routinely document recommendations and assess progress and achievement of therapeutic goals in patients’ medical records
(n= ) (184) (50) (81) (53) (41) (136) (7) (30) (38) (52) (43) (21)
Exists in all areas (100%)
22 6 10 6 5 17 0 5 2 9 3 3
12% 12% 12% 11% 12% 13%
17% 5% 17% 7% 14%
Exists in most areas (50-99%)
95 26 40 29 26 63 6 12 24 31 17 11
52% 52% 49% 55% 63% 46%
40% 63% 60% 40% 52%
Exists in some areas (1-49%)
65 17 30 18 10 54 1 13 11 12 22 7
35% 34% 37% 34% 24% 40%
43% 29% 23% 51% 33%
Does not exist (0%)
2 1 1 0 0 2 0 0 1 0 1 0
1% 2% 1% 0% 0% 1%
0% 3% 0% 2% 0%
Pharmacists facilitate medication-related continuity of care when patients experience transitions of care
(n= ) (183) (50) (80) (53) (41) (135) (7) (30) (38) (52) (43) (20)
Exists in all areas (100%)
16 6 6 4 7 7 2 1 2 10 3 0
9% 12% 8% 8% 17% 5%
3% 5% 19% 7% 0%
Exists in most areas (50-99%)
95 23 46 26 26 64 5 14 23 28 21 9
52% 46% 58% 49% 63% 47%
47% 61% 54% 49% 45%
Exists in some areas (1-49%)
66 18 25 23 8 58 0 12 11 14 18 11
36% 36% 31% 43% 20% 43%
40% 29% 27% 42% 55%
Does not exist (0%)
6 3 3 0 0 6 0 3 2 0 1 0
3% 6% 4% 0% 0% 4%
10% 5% 0% 2% 0%
Pharmacists monitor patients’ responses to medication therapy
(n= ) (184) (50) (81) (53) (41) (136) (7) (30) (38) (52) (43) (21)
Exists in all areas (100%)
11 1 5 5 5 6 0 4 1 5 1 0
6% 2% 6% 9% 12% 4%
13% 3% 10% 2% 0%
Hospital Pharmacy in Canada Report 2016/17 B - Clinical Pharmacy Practice
www.hospitalpharmacysurvey.ca page 14
Table B-4 continued
All
Bed Size Hospital Type Region
Clinical Pharmacy Activities
50-200 201-500 >500 Teaching Non-
teaching Pediatrics BC/YT Prai ON QC Atl
Exists in most areas (50-99%)
97 26 46 25 30 60 7 11 26 31 19 10
53% 52% 57% 47% 73% 44%
37% 68% 60% 44% 48%
Exists in some areas (1-49%)
69 20 27 22 6 63 0 15 9 16 20 9
38% 40% 33% 42% 15% 46%
50% 24% 31% 47% 43%
Does not exist (0%)
7 3 3 1 0 7 0 0 2 0 3 2
4% 6% 4% 2% 0% 5%
0% 5% 0% 7% 10%
Medication reconciliation is performed by pharmacy staff at your facility
(n= ) (184) (50) (81) (53) (41) (136) (7) (30) (38) (52) (43) (21)
Exists in all areas (100%)
15 4 9 2 6 8 1 1 0 10 2 2
8% 8% 11% 4% 15% 6%
3% 0% 19% 5% 10%
Exists in most areas (50-99%)
90 24 37 29 25 61 4 6 21 31 22 10
49% 48% 46% 55% 61% 45%
20% 55% 60% 51% 48%
Exists in some areas (1-49%)
66 13 31 22 10 54 2 16 14 10 18 8
36% 26% 38% 42% 24% 40%
53% 37% 19% 42% 38%
Does not exist (0%)
13 9 4 0 0 13 0 7 3 1 1 1
7% 18% 5% 0% 0% 10%
23% 8% 2% 2% 5%
Pharmacists are involved in developing patient care plans
(n= ) (184) (50) (81) (53) (41) (136) (7) (30) (38) (52) (43) (21)
Exists in all areas (100%)
15 3 6 6 8 6 1 3 2 8 2 0
8% 6% 7% 11% 20% 4%
10% 5% 15% 5% 0%
Exists in most areas (50-99%)
86 20 45 21 26 54 6 14 26 26 13 7
47% 40% 56% 40% 63% 40%
47% 68% 50% 30% 33%
Exists in some areas (1-49%)
74 22 26 26 7 67 0 12 7 17 26 12
40% 44% 32% 49% 17% 49%
40% 18% 33% 60% 57%
Does not exist (0%)
9 5 4 0 0 9 0 1 3 1 2 2
5% 10% 5% 0% 0% 7%
3% 8% 2% 5% 10%
All patients’ medication profiles reviewed for appropriateness at least once daily by a pharmacist
(n= ) (183) (50) (81) (52) (41) (135) (7) (30) (38) (52) (42) (21)
Exists in all areas (100%)
11 4 3 4 3 7 1 1 1 6 2 1
6% 8% 4% 8% 7% 5%
3% 3% 12% 5% 5%
Exists in most areas (50-99%)
87 23 36 28 29 53 5 12 22 26 16 11
48% 46% 44% 54% 71% 39%
40% 58% 50% 38% 52%
Exists in some areas (1-49%)
68 17 31 20 7 60 1 12 11 16 22 7
37% 34% 38% 38% 17% 44%
40% 29% 31% 52% 33%
Does not exist (0%)
17 6 11 0 2 15 0 5 4 4 2 2
9% 12% 14% 0% 5% 11%
17% 11% 8% 5% 10%
Your facility has processes to ensure medication-related continuity of care for discharged patients
(n= ) (184) (50) (81) (53) (41) (136) (7) (30) (38) (52) (43) (21)
Exists in all areas (100%)
18 8 9 1 5 11 2 0 7 8 1 2
10% 16% 11% 2% 12% 8%
0% 18% 15% 2% 10%
Exists in most areas (50-99%)
75 26 32 17 22 50 3 7 23 25 13 7
41% 52% 40% 32% 54% 37%
23% 61% 48% 30% 33%
Exists in some areas (1-49%)
77 12 33 32 13 62 2 17 6 19 25 10
42% 24% 41% 60% 32% 46%
57% 16% 37% 58% 48%
Does not exist (0%)
14 4 7 3 1 13 0 6 2 0 4 2
8% 8% 9% 6% 2% 10%
20% 5% 0% 9% 10%
Inpatient pharmacists are authorized by policy or protocol to write medication orders as part of their scope of practice
(n= ) (182) (49) (80) (53) (40) (135) (7) (28) (38) (52) (43) (21)
Exists in all areas (100%)
45 13 19 13 13 29 3 8 17 13 5 2
25% 27% 24% 25% 33% 21%
29% 45% 25% 12% 10%
Exists in most areas (50-99%)
43 8 17 18 8 34 1 9 7 11 11 5
24% 16% 21% 34% 20% 25%
32% 18% 21% 26% 24%
Exists in some areas (1-49%)
54 10 27 17 15 37 2 4 5 19 21 5
30% 20% 34% 32% 38% 27%
14% 13% 37% 49% 24%
Does not exist (0%)
40 18 17 5 4 35 1 7 9 9 6 9
22% 37% 21% 9% 10% 26%
25% 24% 17% 14% 43%
Drug therapy management services are prioritized for outpatients according to the complexity of patients’ medication therapy
(n= ) (170) (41) (78) (51) (39) (125) (6) (25) (36) (46) (42) (21)
Exists in all areas (100%)
12 2 6 4 4 8 0 2 1 4 4 1
7% 5% 8% 8% 10% 6%
8% 3% 9% 10% 5%

Hospital Pharmacy in Canada Report 2016/17 B - Clinical Pharmacy Practice
www.hospitalpharmacysurvey.ca page 15
Table B-4 continued
All
Bed Size Hospital Type Region
Clinical Pharmacy Activities
50-200 201-500 >500 Teaching Non-
teaching Pediatrics BC/YT Prai ON QC Atl
Exists in most areas (50-99%)
51 5 26 20 10 39 2 2 7 18 21 3
30% 12% 33% 39% 26% 31%
8% 19% 39% 50% 14%
Exists in some areas (1-49%)
79 20 35 24 23 52 4 13 22 18 14 12
46% 49% 45% 47% 59% 42%
52% 61% 39% 33% 57%
Does not exist (0%)
28 14 11 3 2 26 0 8 6 6 3 5
16% 34% 14% 6% 5% 21%
32% 17% 13% 7% 24%
Outpatient pharmacists are authorized by policy or protocol to write medication orders and/or prescriptions as part of their scope of practice
(n= ) (164) (38) (75) (51) (36) (121) (7) (22) (35) (45) (43) (19)
Exists in all areas (100%)
31 10 11 10 8 20 3 1 16 7 7 0
19% 26% 15% 20% 22% 17%
5% 46% 16% 16% 0%
Exists in most areas (50-99%)
26 1 10 15 7 19 0 4 2 5 14 1
16% 3% 13% 29% 19% 16%
18% 6% 11% 33% 5%
Exists in some areas (1-49%)
48 8 24 16 17 28 3 6 6 11 18 7
29% 21% 32% 31% 47% 23%
27% 17% 24% 42% 37%
Does not exist (0%)
59 19 30 10 4 54 1 11 11 22 4 11
36% 50% 40% 20% 11% 45%
50% 31% 49% 9% 58%
Pharmacists provide discharge education to patients at your facility
(n= ) (184) (50) (81) (53) (41) (136) (7) (30) (38) (52) (43) (21)
Exists in all areas (100%)
2 0 2 0 1 1 0 0 0 1 1 0
1% 0% 2% 0% 2% 1%
0% 0% 2% 2% 0%
Exists in most areas (50-99%)
48 15 18 15 19 24 5 6 19 14 5 4
26% 30% 22% 28% 46% 18%
20% 50% 27% 12% 19%
Exists in some areas (1-49%)
117 28 54 35 21 94 2 22 14 35 30 16
64% 56% 67% 66% 51% 69%
73% 37% 67% 70% 76%
Does not exist (0%)
17 7 7 3 0 17 0 2 5 2 7 1
9% 14% 9% 6% 0% 13%
7% 13% 4% 16% 5%
When a patient’s genetic characteristics are known, pharmacists have a role in adjusting dosing or changing therapy for select medications
(n= ) (156) (41) (73) (42) (38) (111) (7) (25) (34) (41) (38) (18)
Exists in all areas (100%)
4 0 3 1 3 1 0 0 0 4 0 0
3% 0% 4% 2% 8% 1%
0% 0% 10% 0% 0%
Exists in most areas (50-99%)
19 4 10 5 6 11 2 1 4 3 10 1
12% 10% 14% 12% 16% 10%
4% 12% 7% 26% 6%
Exists in some areas (1-49%)
49 11 20 18 15 31 3 7 18 5 16 3
31% 27% 27% 43% 39% 28%
28% 53% 12% 42% 17%
Does not exist (0%)
84 26 40 18 14 68 2 17 12 29 12 14
54% 63% 55% 43% 37% 61%
68% 35% 71% 32% 78%
Pharmacists participate in your facility’s cardiopulmonary resuscitation teams
(n= ) (170) (48) (75) (47) (39) (124) (7) (24) (38) (48) (41) (19)
Exists in all areas (100%)
3 0 3 0 3 0 0 1 0 0 2 0
2% 0% 4% 0% 8% 0%
4% 0% 0% 5% 0%
Exists in most areas (50-99%)
10 3 3 4 3 5 2 0 1 0 7 2
6% 6% 4% 9% 8% 4%
0% 3% 0% 17% 11%
Exists in some areas (1-49%)
29 4 14 11 9 19 1 5 4 11 8 1
17% 8% 19% 23% 23% 15%
21% 11% 23% 20% 5%
Does not exist (0%)
128 41 55 32 24 100 4 18 33 37 24 16
75% 85% 73% 68% 62% 81%
75% 87% 77% 59% 84%
Pharmacists participate in your facility’s rapid response teams
(n= ) (161) (41) (71) (49) (36) (118) (7) (27) (38) (41) (37) (18)
Exists in all areas (100%)
1 0 1 0 1 0 0 1 0 0 0 0
1% 0% 1% 0% 3% 0%
4% 0% 0% 0% 0%
Exists in most areas (50-99%)
9 3 1 5 1 6 2 0 0 2 5 2
6% 7% 1% 10% 3% 5%
0% 0% 5% 14% 11%
Exists in some areas (1-49%)
25 1 10 14 6 19 0 9 4 3 9 0
16% 2% 14% 29% 17% 16%
33% 11% 7% 24% 0%
Does not exist (0%)
126 37 59 30 28 93 5 17 34 36 23 16
78% 90% 83% 61% 78% 79%
63% 89% 88% 62% 89% Base: All respondents Note: Sorted by percentage of exists in all and in most areas Where the “n” value was less than 10, percentages were not calculated to avoid potentially misleading comparisons.
Hospital Pharmacy in Canada Report 2016/17 B - Clinical Pharmacy Practice
www.hospitalpharmacysurvey.ca page 16
Key Performance Indicators
Key performance indicators (KPIs) are quantifiable measures of quality that reflect the critical success factors
of an organization; they are used to track the organization’s progress with specific, essential processes and
outcomes. More specifically, clinical pharmacy KPIs (cpKPIs) are evidence-based processes of care in the domain
of clinical pharmacy that are associated with a meaningful impact on patient outcomes, such as improved morbidity
or reduced hospital readmissions; they can be used to both guide and assess hospital pharmacists.
A set of hospital cpKPI was developed using a systematic, national, pan-Canadian consensus-building
(modified Delphi) process. The cpKPIs were grouped into eight evidence-informed critical activity areas (see below)
representing hospital pharmacists’ best practices that demonstrated improvements in meaningful patient outcomes.
A cpKPI is defined by five characteristics: it reflects a desired quality practice; it is a metric that can be linked to
direct patient care; it is associated with evidence of impact on meaningful patient outcomes; it is pharmacist
sensitive; and it is feasible to measure.
The Canadian cpKPI Collaborative spent two years developing a core set of national cpKPIs.70,71 After a group
of panelists completed three Delphi rounds, the following eight candidate cpKPIs of activities performed by
pharmacists met the consensus definition: (1) performing admission medication reconciliation, including best
possible medication history; (2) participating in inter-professional patient care rounds; (3) completing
pharmaceutical care plans; (4) resolving drug therapy problems; (5) providing in-person disease and medication
education to patients; (6) providing discharge patient medication education; (7) performing discharge medication
reconciliation; and (8) providing bundled, proactive direct patient care activities. Bannerman and others72 also
studied and compared local, provincial and national perspectives on cpKPIs in critical activity areas.
In 2016, Minard and others73 published a paper on pharmacists’ perceptions and acceptance of these cpKPIs.
Overall, pharmacists strongly supported the cpKPIs and identified both barriers and facilitators for their
implementation. In BC, use of the cpKPIs has
facilitated demonstration of the value of clinical
pharmacy services and has helped in both creating and
maintaining clinical pharmacist positions during
periods of financial constraint within the Vancouver
Island Health Authority.74
The 2016/17 iteration of the Hospital Pharmacy in
Canada Survey was the first to investigate cpKPIs. The data collected, including the following key points, will serve
as a baseline for subsequent surveys:
Data were being collected for all eight cpKPIs, ranging from a minimum of 27% (48/180) of respondents
who reported data collection for patient education at discharge to a maximum of 57% (105/183) of
respondents who reported data collection for medication reconciliation on admission.
Implementation at the 76%–100% level (where the implementation level refers to the proportion of patients
who received the service) was still limited, ranging from a minimum of 6% (3/53) of respondents for
pharmaceutical care plans to a maximum of
40% (42/105) for medication reconciliation
on admission.
The percentage of respondents with plans to
collect data on particular cpKPIs in 2017/18
ranged from 43% (73/168) for development of
a pharmaceutical care plan to 66% (111/167)
for medication reconciliation on admission.
The extent of implementation of cpKPIs was
generally higher in large hospitals than in smaller hospitals and was higher in teaching hospitals than in
non-teaching hospitals. Overall, ON led implementation on a regional basis, whereas implementation in QC
was lagging (for five of the eight cpKPIs, there were no QC respondents who reported 76%–100%
implementation); similarly, there were some laggards in the Prairies and the Atlantic provinces.
Table B-5 summarizes the profile of the reported use and implementation of cpKPIs in 2016/17.
Overall, 40% of respondents indicated that they
had between 76% and 100% implementation of the
cpKPIs, with 55% of Ontario facilities having this
rate of implementation.
The 2016/17 survey was the first in this series to
collect data about the eight clinical pharmacy key
performance indicators.
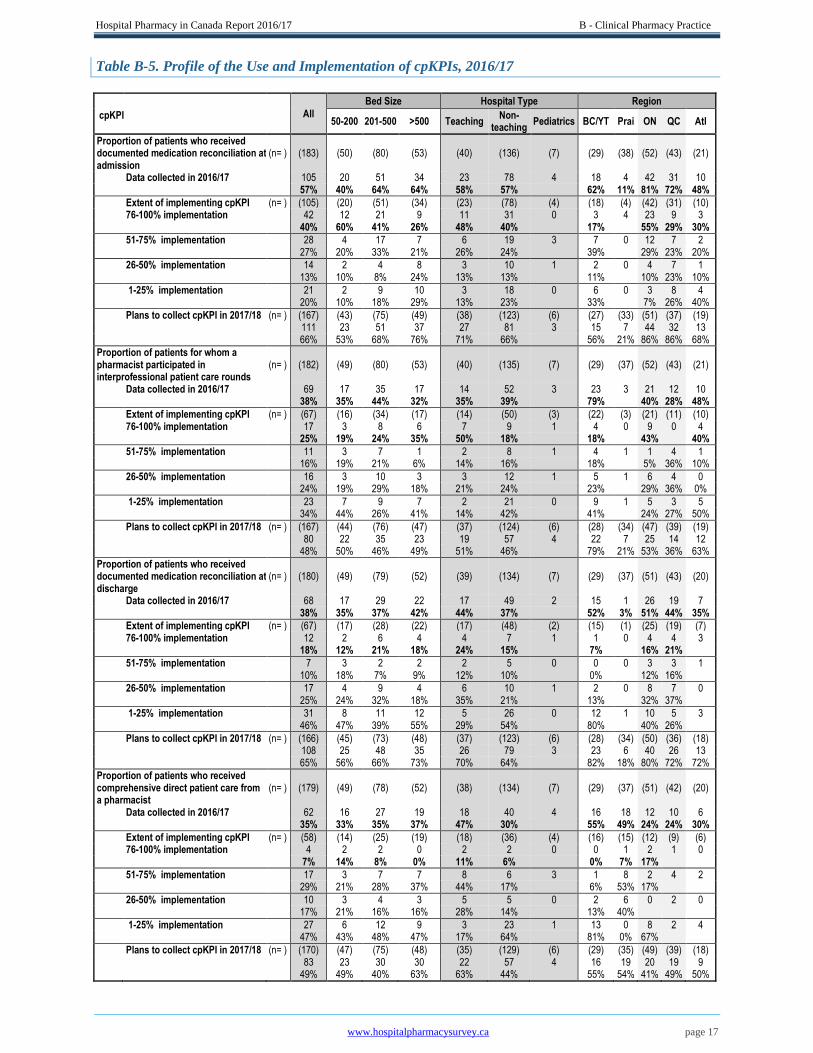
Hospital Pharmacy in Canada Report 2016/17 B - Clinical Pharmacy Practice
www.hospitalpharmacysurvey.ca page 17
Table B-5. Profile of the Use and Implementation of cpKPIs, 2016/17
All
Bed Size Hospital Type Region
cpKPI 50-200 201-500 >500 Teaching
Non- teaching
Pediatrics BC/YT Prai ON QC Atl
Proportion of patients who received documented medication reconciliation at admission
(n= ) (183) (50) (80) (53) (40) (136) (7) (29) (38) (52) (43) (21)
Data collected in 2016/17 105 20 51 34 23 78 4 18 4 42 31 10 57% 40% 64% 64% 58% 57% 62% 11% 81% 72% 48%
Extent of implementing cpKPI (n= ) (105) (20) (51) (34) (23) (78) (4) (18) (4) (42) (31) (10) 76-100% implementation 42 12 21 9 11 31 0 3 4 23 9 3 40% 60% 41% 26% 48% 40% 17% 55% 29% 30%
51-75% implementation 28 4 17 7 6 19 3 7 0 12 7 2 27% 20% 33% 21% 26% 24% 39% 29% 23% 20%
26-50% implementation 14 2 4 8 3 10 1 2 0 4 7 1 13% 10% 8% 24% 13% 13% 11% 10% 23% 10%
1-25% implementation 21 2 9 10 3 18 0 6 0 3 8 4 20% 10% 18% 29% 13% 23% 33% 7% 26% 40%
Plans to collect cpKPI in 2017/18 (n= ) (167) (43) (75) (49) (38) (123) (6) (27) (33) (51) (37) (19)
111 23 51 37 27 81 3 15 7 44 32 13
66% 53% 68% 76% 71% 66% 56% 21% 86% 86% 68%
Proportion of patients for whom a pharmacist participated in interprofessional patient care rounds
(n= ) (182) (49) (80) (53) (40) (135) (7) (29) (37) (52) (43) (21)
Data collected in 2016/17 69 17 35 17 14 52 3 23 3 21 12 10 38% 35% 44% 32% 35% 39% 79% 40% 28% 48%
Extent of implementing cpKPI (n= ) (67) (16) (34) (17) (14) (50) (3) (22) (3) (21) (11) (10) 76-100% implementation 17 3 8 6 7 9 1 4 0 9 0 4 25% 19% 24% 35% 50% 18% 18% 43% 40%
51-75% implementation 11 3 7 1 2 8 1 4 1 1 4 1 16% 19% 21% 6% 14% 16% 18% 5% 36% 10%
26-50% implementation 16 3 10 3 3 12 1 5 1 6 4 0 24% 19% 29% 18% 21% 24% 23% 29% 36% 0%
1-25% implementation 23 7 9 7 2 21 0 9 1 5 3 5 34% 44% 26% 41% 14% 42% 41% 24% 27% 50%
Plans to collect cpKPI in 2017/18 (n= ) (167) (44) (76) (47) (37) (124) (6) (28) (34) (47) (39) (19)
80 22 35 23 19 57 4 22 7 25 14 12
48% 50% 46% 49% 51% 46% 79% 21% 53% 36% 63%
Proportion of patients who received documented medication reconciliation at discharge
(n= ) (180) (49) (79) (52) (39) (134) (7) (29) (37) (51) (43) (20)
Data collected in 2016/17 68 17 29 22 17 49 2 15 1 26 19 7 38% 35% 37% 42% 44% 37% 52% 3% 51% 44% 35%
Extent of implementing cpKPI (n= ) (67) (17) (28) (22) (17) (48) (2) (15) (1) (25) (19) (7) 76-100% implementation 12 2 6 4 4 7 1 1 0 4 4 3 18% 12% 21% 18% 24% 15% 7% 16% 21%
51-75% implementation 7 3 2 2 2 5 0 0 0 3 3 1 10% 18% 7% 9% 12% 10% 0% 12% 16%
26-50% implementation 17 4 9 4 6 10 1 2 0 8 7 0 25% 24% 32% 18% 35% 21% 13% 32% 37%
1-25% implementation 31 8 11 12 5 26 0 12 1 10 5 3 46% 47% 39% 55% 29% 54% 80% 40% 26%
Plans to collect cpKPI in 2017/18 (n= ) (166) (45) (73) (48) (37) (123) (6) (28) (34) (50) (36) (18)
108 25 48 35 26 79 3 23 6 40 26 13
65% 56% 66% 73% 70% 64% 82% 18% 80% 72% 72%
Proportion of patients who received comprehensive direct patient care from a pharmacist
(n= ) (179) (49) (78) (52) (38) (134) (7) (29) (37) (51) (42) (20)
Data collected in 2016/17 62 16 27 19 18 40 4 16 18 12 10 6 35% 33% 35% 37% 47% 30% 55% 49% 24% 24% 30%
Extent of implementing cpKPI (n= ) (58) (14) (25) (19) (18) (36) (4) (16) (15) (12) (9) (6) 76-100% implementation 4 2 2 0 2 2 0 0 1 2 1 0 7% 14% 8% 0% 11% 6% 0% 7% 17%
51-75% implementation 17 3 7 7 8 6 3 1 8 2 4 2 29% 21% 28% 37% 44% 17% 6% 53% 17%
26-50% implementation 10 3 4 3 5 5 0 2 6 0 2 0 17% 21% 16% 16% 28% 14% 13% 40%
1-25% implementation 27 6 12 9 3 23 1 13 0 8 2 4 47% 43% 48% 47% 17% 64% 81% 0% 67%
Plans to collect cpKPI in 2017/18 (n= ) (170) (47) (75) (48) (35) (129) (6) (29) (35) (49) (39) (18)
83 23 30 30 22 57 4 16 19 20 19 9
49% 49% 40% 63% 63% 44% 55% 54% 41% 49% 50%
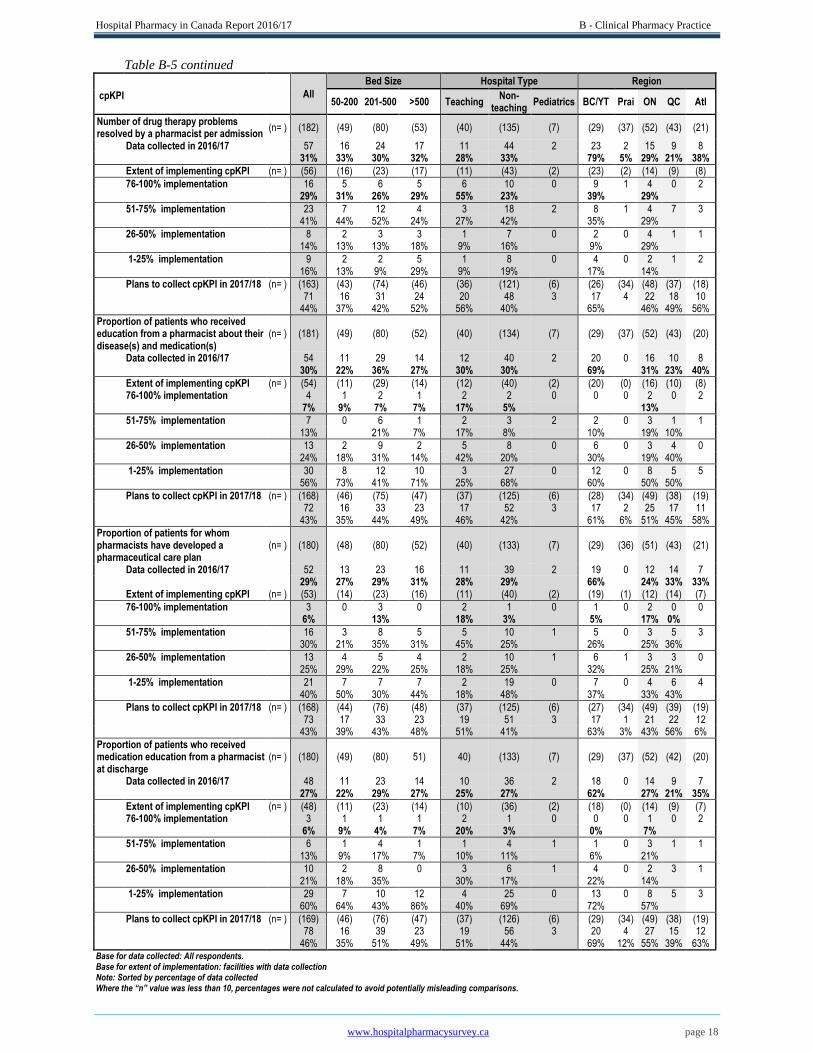
Hospital Pharmacy in Canada Report 2016/17 B - Clinical Pharmacy Practice
www.hospitalpharmacysurvey.ca page 18
Table B-5 continued
All
Bed Size Hospital Type Region
cpKPI
50-200 201-500 >500 Teaching Non-
teaching Pediatrics BC/YT Prai ON QC Atl
Number of drug therapy problems resolved by a pharmacist per admission
(n= ) (182) (49) (80) (53) (40) (135) (7) (29) (37) (52) (43) (21)
Data collected in 2016/17 57 16 24 17 11 44 2 23 2 15 9 8 31% 33% 30% 32% 28% 33% 79% 5% 29% 21% 38%
Extent of implementing cpKPI (n= ) (56) (16) (23) (17) (11) (43) (2) (23) (2) (14) (9) (8)
76-100% implementation 16 5 6 5 6 10 0 9 1 4 0 2 29% 31% 26% 29% 55% 23% 39% 29%
51-75% implementation 23 7 12 4 3 18 2 8 1 4 7 3 41% 44% 52% 24% 27% 42% 35% 29%
26-50% implementation 8 2 3 3 1 7 0 2 0 4 1 1 14% 13% 13% 18% 9% 16% 9% 29%
1-25% implementation 9 2 2 5 1 8 0 4 0 2 1 2 16% 13% 9% 29% 9% 19% 17% 14%
Plans to collect cpKPI in 2017/18 (n= ) (163) (43) (74) (46) (36) (121) (6) (26) (34) (48) (37) (18)
71 16 31 24 20 48 3 17 4 22 18 10
44% 37% 42% 52% 56% 40% 65% 46% 49% 56%
Proportion of patients who received education from a pharmacist about their disease(s) and medication(s)
(n= ) (181) (49) (80) (52) (40) (134) (7) (29) (37) (52) (43) (20)
Data collected in 2016/17 54 11 29 14 12 40 2 20 0 16 10 8 30% 22% 36% 27% 30% 30% 69% 31% 23% 40%
Extent of implementing cpKPI (n= ) (54) (11) (29) (14) (12) (40) (2) (20) (0) (16) (10) (8) 76-100% implementation 4 1 2 1 2 2 0 0 0 2 0 2 7% 9% 7% 7% 17% 5% 13%
51-75% implementation 7 0 6 1 2 3 2 2 0 3 1 1 13% 21% 7% 17% 8% 10% 19% 10%
26-50% implementation 13 2 9 2 5 8 0 6 0 3 4 0 24% 18% 31% 14% 42% 20% 30% 19% 40%
1-25% implementation 30 8 12 10 3 27 0 12 0 8 5 5 56% 73% 41% 71% 25% 68% 60% 50% 50%
Plans to collect cpKPI in 2017/18 (n= ) (168) (46) (75) (47) (37) (125) (6) (28) (34) (49) (38) (19)
72 16 33 23 17 52 3 17 2 25 17 11
43% 35% 44% 49% 46% 42% 61% 6% 51% 45% 58%
Proportion of patients for whom pharmacists have developed a pharmaceutical care plan
(n= ) (180) (48) (80) (52) (40) (133) (7) (29) (36) (51) (43) (21)
Data collected in 2016/17 52 13 23 16 11 39 2 19 0 12 14 7 29% 27% 29% 31% 28% 29% 66% 24% 33% 33% Extent of implementing cpKPI (n= ) (53) (14) (23) (16) (11) (40) (2) (19) (1) (12) (14) (7)
76-100% implementation 3 0 3 0 2 1 0 1 0 2 0 0 6% 13% 18% 3% 5% 17% 0%
51-75% implementation 16 3 8 5 5 10 1 5 0 3 5 3 30% 21% 35% 31% 45% 25% 26% 25% 36%
26-50% implementation 13 4 5 4 2 10 1 6 1 3 3 0 25% 29% 22% 25% 18% 25% 32% 25% 21%
1-25% implementation 21 7 7 7 2 19 0 7 0 4 6 4 40% 50% 30% 44% 18% 48% 37% 33% 43%
Plans to collect cpKPI in 2017/18 (n= ) (168) (44) (76) (48) (37) (125) (6) (27) (34) (49) (39) (19)
73 17 33 23 19 51 3 17 1 21 22 12
43% 39% 43% 48% 51% 41% 63% 3% 43% 56% 6%
Proportion of patients who received medication education from a pharmacist at discharge
(n= ) (180) (49) (80) 51) 40) (133) (7) (29) (37) (52) (42) (20)
Data collected in 2016/17 48 11 23 14 10 36 2 18 0 14 9 7 27% 22% 29% 27% 25% 27% 62% 27% 21% 35%
Extent of implementing cpKPI (n= ) (48) (11) (23) (14) (10) (36) (2) (18) (0) (14) (9) (7) 76-100% implementation 3 1 1 1 2 1 0 0 0 1 0 2 6% 9% 4% 7% 20% 3% 0% 7%
51-75% implementation 6 1 4 1 1 4 1 1 0 3 1 1 13% 9% 17% 7% 10% 11% 6% 21%
26-50% implementation 10 2 8 0 3 6 1 4 0 2 3 1 21% 18% 35% 30% 17% 22% 14%
1-25% implementation 29 7 10 12 4 25 0 13 0 8 5 3 60% 64% 43% 86% 40% 69% 72% 57%
Plans to collect cpKPI in 2017/18 (n= ) (169) (46) (76) (47) (37) (126) (6) (29) (34) (49) (38) (19)
78 16 39 23 19 56 3 20 4 27 15 12
46% 35% 51% 49% 51% 44% 69% 12% 55% 39% 63% Base for data collected: All respondents. Base for extent of implementation: facilities with data collection Note: Sorted by percentage of data collected
Where the “n” value was less than 10, percentages were not calculated to avoid potentially misleading comparisons.
Hospital Pharmacy in Canada Report 2016/17 B - Clinical Pharmacy Practice
www.hospitalpharmacysurvey.ca page 19
Evaluation of Clinical Pharmacy Services
Changing solely for the sake of change is counterproductive. Experience has shown, and research continues to
confirm, that change must be evaluated to ensure that it results in positive improvements or outcomes. With the
evolution of clinical pharmacy services in hospitals, not only are robust systems for evaluation necessary, but they
also provide evidence that can be used to justify the investment to healthcare administrators. With appropriately
justified investments, pharmacy programs will have the right mix of human, material and financial resources for a
medication management system that ensures the proper use of medications for all patients.
The 2013/14 report provided baseline data on the development of clinical services both nationally and
regionally. As elements of pharmacy services change, indicators also change. CSHP’s survey of facilities for the
CSHP 2015 initiative, Targeting Excellence in Pharmacy Practice, gave a clear snapshot of hospital practice in
2009.75 Some of the targeted goals and objectives were lofty, but overall, they gave guidance and direction to help
optimize care for patients across the country. Following this initiative, the development of cpKPIs by the national
working group70,71 has provided important indicators for hospital practice that are specific, measurable, achievable
and relevant.
The 2016/17 survey results indicate a positive trend in the evaluation of pharmacists and pharmacy services:
37% (66/179) reported that their facilities were collecting “other clinical pharmacy performance indicators
(not cpKPIs)”; this was the first time the survey asked about collection of this type of information.
63% (115/182) of respondents reported that their organizations’ pharmacy leadership was using a
structured approach to define and prioritize pharmacists’ activities, up from 50% (81/161) in 2013/14.
In terms of the methodology used to evaluate the provision of direct patient care pharmacy services, there
were increases for peer-review evaluation, from 27% (12/44) in 2013/14 to 38% (25/66) in 2016/17, and
self-evaluation, from 48% (21/44) in 2013/14 to 76% (50/66) in 2016/17.
The use of retrospective chart review has
declined, from 70% (31/44) in 2013/14 to
56% (37/66) in 2016/17, with the shift to
more meaningful evaluation methods.
There are also opportunities in the area of
evaluation:
Only 36% (66/182) of respondents reported that their facilities were evaluating the provision of direct
patient care pharmacy services.
This percentage encompasses all five methods listed in the survey: retrospective chart review, direct
observation, peer-review evaluation, self-evaluation by pharmacist, and knowledge and competence testing
Evaluation practices lagged in QC, with no respondents reporting direct observation or testing of
knowledge and competence, and a few reporting the use of retrospective evaluation.
Evaluation was reported more frequently for conformity of documentation with clinical practice (90%,
55/61) than for individualized pharmaceutical care plans (64%, 39/61), counselling and medication
adherence (28%, 17/61) and drug information answers (18%, 11/61).
Overall, 98% (181/184) of respondents replied to questions about the evaluation of clinical services.
Only 14% (26/181) reported the presence of established mechanisms to measure patients’ medication-
related outcomes, and only 15% (4/26) of respondents with such mechanisms in place used the outcomes to
evaluate pharmacists’ performance.
Some questions remain to be answered:
o What is the role of regulatory authorities?
o Should the regulatory authorities be the sole drivers of clinical services, and if not, what are the
motivators to improve clinical services and how can they be facilitated?
Table B-6 summarizes the reported approaches for the evaluation of clinical services.
The 2016/17 survey results indicate a positive
trend in the evaluation of pharmacists and
pharmacy services.

Hospital Pharmacy in Canada Report 2016/17 B - Clinical Pharmacy Practice
www.hospitalpharmacysurvey.ca page 20
Table B-6. Evaluation of Clinical Services, 2016/17
All
Bed Size Hospital Type Region
50-200 201-500 >500 Teaching Non-
teaching Pediatrics BC/YT Prai ON QC Atl
A structured approach is used to define and prioritize pharmacists activities
(n= ) (182) (49) (81) (52) (41) (134) (7) (30) (37) (51) (43) (21)
115 31 50 34 34 75 6 23 32 26 22 12
63% 63% 62% 65% 83% 56%
77% 86% 51% 51% 57%
Other clinical pharmacy performance indicators (not cpKPI) are being collected
(n= ) (179) (49) (77) (53) (40) (132) (7) (28) (37) (51) (42) (21)
66 22 22 22 24 39 3 9 23 17 8 9
37% 45% 29% 42% 60% 30%
32% 62% 33% 19% 43%
The provision of direct patient care pharmacy services is being evaluated
(n= ) (182) (49) (80) (53) (40) (135) (7) (29) (37) (52) (43) (21)
66 20 25 21 24 39 3 12 23 17 5 9
36% 41% 31% 40% 60% 29%
41% 62% 33% 12% 43%
Base: All respondents
Methods used for evaluating provision of direct patient care pharmacy services:
(n= ) (66) (20) (25) (21) (24) (39) (3) (12) (23) (17) (5) (9)
self-evaluation by pharmacist 50 14 21 15 19 28 3 10 21 10 2 7
76% 70% 84% 71% 79% 72%
83% 91% 59%
retrospective chart review 37 13 15 9 10 24 3 7 17 7 3 3
56% 65% 60% 43% 42% 62%
58% 74% 41%
direct observation 33 11 13 9 14 17 2 5 17 7 0 4
50% 55% 52% 43% 58% 44%
42% 74% 41%
peer-review evaluation 25 6 11 8 10 14 1 6 5 9 2 3
38% 30% 44% 38% 42% 36%
50% 22% 53%
other 12 6 3 3 5 6 1 0 6 1 1 4
18% 30% 12% 14% 21% 15%
0% 26% 6%
knowledge and competence testing
5 2 1 2 1 4 0 0 1 3 0 1
8% 10% 4% 10% 4% 10%
0% 4% 18%
Base: Facilities where the provision of direct patient care pharmacy services is evaluated Note: multiple mentions permitted
Aspects of clinical practice evaluated:
(n= ) (61) (18) (25) (18) (21) (37) (3) (9) (21) (17) (5) (9)
conformity of documentation with clinical practice
55 16 22 17 20 32 3 7 20 15 5 8
90% 89% 88% 94% 95% 86%
95% 88%
development of an individualized pharmaceutical care plan
39 13 16 10 13 23 3 8 19 8 2 2
64% 72% 64% 56% 62% 62%
90% 47%
medication counselling and evaluation of adherence
17 7 6 4 4 12 1 3 2 6 1 5
28% 39% 24% 22% 19% 32%
10% 35%
answers to drug information questions
11 4 2 5 3 7 1 0 2 4 2 3
18% 22% 8% 28% 14% 19%
10% 24%
Base: Facilities where the provision of direct patient care pharmacy services is evaluated Note: multiple mentions permitted
Mechanisms have been established to measure patients' medication-related outcomes
(n= ) (181) (49) (79) (53) (40) (134) (7) (28) (37) (52) (43) (21)
26 6 9 11 9 17 0 0 2 16 5 3
14% 12% 11% 21% 23% 13%
0% 5% 31% 12% 14%
Base: All respondents
Those outcomes are used to evaluate the performance of pharmacists
(n= ) (26) (6) (9) (11) (9) (17) (0) (0) (2) (16) (5) (3)
4 1 1 2 1 3 0 0 0 2 1 1
15%
18%
18%
13%
Base: Facilities with mechanisms to measure patients' medication-related outcomes Where the “n” value was less than 10, percentages were not calculated to avoid potentially misleading comparisons.
1 Saseen JJ, Ripley TL, Bondi D, Burke JM, Cohen LJ, McBane S, et al. ACCP clinical pharmacist competencies.
Pharmacotherapy. 2017;37(5):630-6.
2 Scope of practice for clinical pharmacists. Lenexa (KS): American College of Clinical Pharmacy; 2016 [cited 2017 Dec 9].
Available from: https://www.accp.com/docs/positions/misc/scopeofpractice.pdf
3 Lee M, Badowski ME, Acquisto NM, Covey DF, Fox BD, Gaffney SM, et al. ACCP template for evaluating a clinical
pharmacist. Pharmacotherapy. 2017;37(5):e21-9.
4 Engle JP, Franks AM, Ashjian E, Bingham AL, Burke JM, Erstad BL, et al. A self-assessment guide for resident teaching
experiences. Pharmacotherapy. 2016;36(6):e58-79.
5 Comprehensive medication management in team-based care. Lenexa (KS): American College of Clinical Pharmacy; 2016 [cited
2017 Dec 9]. Available from: https://www.accp.com/docs/positions/misc/CMM%20Brief.pdf
6 Optimizing specialty drug use. ACCP position statement. Lenexa (KS): American College of Clinical Pharmacy; 2017 [cited
2017 Dec 9]. Available from:
https://www.accp.com/docs/positions/positionStatements/Specialty%20Drug%20Use_Final_3.1.17.pdf

Hospital Pharmacy in Canada Report 2016/17 B - Clinical Pharmacy Practice
www.hospitalpharmacysurvey.ca page 21
7 Gabay M, Smith JA, Chavez ML, Goldwire M, Walker S, Coon SA, et al.; American College of Clinical Pharmacy. White
paper on natural products. Pharmacotherapy. 2017;37(1):e1-15.
8 American College of Clinical Pharmacy; Sorensen TD, Shapiro NL, Benedict N, Edwards KL, Chan A, Covey D, et al.
Recommendations for aligning PGY2 pharmacy residency training and pharmacy specialist board certification. Pharmacotherapy.
2016;36(5):e34-9.
9 American College of Clinical Pharmacy; McBane SE, Dopp AL, Abe A, Benavides S, Chester EA, Dixon DL, et al.
Collaborative drug therapy management and comprehensive medication management-2015. Pharmacotherapy. 2015;35(4):e39-
50.
10 Jacobi J, Ray S, Danelich I, Dodds Ashley E, Eckel S, Guharoy R, et al. Impact of the Pharmacy Practice Model Initiative on
clinical pharmacy specialist practice. Pharmacotherapy. 2016;36(5):e40-9.
11 Mueller EW, Bishop JR, Kanaan AO, Kiser TH, Phan H, Yang KY. Research fellowship programs as a pathway for training
independent clinical pharmacy scientists. Pharmacotherapy. 2015;35(3):e13-9.
12 ACPP to launch new journal. Lenexa (KS): American College of Clinical Pharmacy; 2017 [cited 2017 Dec 9]. Available from:
https://www.accp.com/report/index.aspx?iss=1017&art=2
13 Bulkley CF, Miller MJ, Draugalis JR. Developing and improving residency research training. Am J Health Syst Pharm.
2017;74(3):152-61.
14 Medication management standards. Ottawa (ON): Accreditation Canada; [cited 2017 Dec 9]. Available for purchase from:
https://store.accreditation.ca/products/medication-management-standards
15 Blueprint for pharmacy: designing the future together. Ottawa (ON): Canadian Pharmacists Association; [cited 2017 Dec 9].
Available from: https://www.pharmacists.ca/pharmacy-in-canada/blueprint-for-pharmacy/
16 Standards and guidelines. Ottawa (ON): Canadian Society of Hospital Pharmacists; [cited 2018 Feb 19]. Available from:
https://www.cshp.ca/standards-and-guidelines
17 Recommandations sur le rôle du pharmacien en oncologie dans les établissements de santé. Rapport du Comité de l’évolution
de la pratique des soins pharmaceutiques. Québec (QC): Ministère de la Santé et des Services sociaux, Direction générale de
cancérologie; 2016 [cited 2017 Dec 9]. Available from: http://publications.msss.gouv.qc.ca/msss/fichiers/2016/16-902-06W.pdf
18 Le rôle et la place du pharmacien en établissement de santé : recommandations selon l’axe 1 – soins pharmaceutiques.
Montréal (QC): Association des pharmaciens des établissements de santé du Québec; 2017.
19 Required organizational practices handbook 2017. Ottawa (ON): Accreditation Canada; [cited 2018 Mar 2]. Available from:
https://accreditation.ca/required-organizational-practices/
20 Buxton JA, Babbitt R, Clegg CA, Durley SF, Epplen KT, Marsden LM, et al. ASHP guidelines: minimum standard for
ambulatory care pharmacy practice. Am J Health Syst Pharm. 2015;72(14):1221-36. Erratum in: Am J Health Syst Pharm.
2015;72(17):1432.
21 Hazen ACM, de Bont AA, Boelman L, Zwart DLM, de Gier JJ, de Wit NJ, et al. The degree of integration of non-dispensing
pharmacists in primary care practice and the impact on health outcomes: a systematic review. Res Social Adm Pharm.
2018;14(3):228-40.
22 Hasan SS, Thiruchelvam K, Kow CS, Ghori MU, Babar ZU. Economic evaluation of pharmacist-led medication reviews in
residential aged care facilities. Expert Rev Pharmacoecon Outcomes Res. 2017;17(5):431-9.
23 Alexander E, Butler CD, Darr A, Jenkins MT, Long RD, Shipman CJ, et al. ASHP statement on telepharmacy. Am J Health
Syst Pharm. 2017;74(9):e236-41.
24 Perdew C, Erickson K, Litke J. Innovative models for providing clinical pharmacy services to remote locations using clinical
video telehealth. Am J Health Syst Pharm. 2017;74(14):1093-8.
25 Niznik JD, He H, Kane-Gill SL. Impact of clinical pharmacist services delivered via telemedicine in the outpatient or
ambulatory care setting: a systematic review. Res Social Adm Pharm 2017. pii: S1551-7411(17)30236-X. doi:
10.1016/j.sapharm.2017.10.011. [Epub ahead of print]
26 Kane-Gill SL, Niznik JD, Kellum JA, Culley CM, Boyce RD, Marcum ZA, et al. Use of telemedicine to enhance pharmacist
services in the nursing facility. Consult Pharm. 2017;32(2):93-8.
27 Stough WG, Patterson JH. Role and value of clinical pharmacy in heart failure management. Clin Pharmacol Ther.
2017;102(2):209-12.
28 Dunn SP, Birtcher KK, Beavers CJ, Baker WL, Brouse SD, Page RL 2nd, et al. The role of the clinical pharmacist in the care
of patients with cardiovascular disease. J Am Coll Cardiol. 2015;66(19):2129-39.
29 Cawley MJ, Warning WJ 2nd. A systematic review of pharmacists performing obstructive sleep apnea screening services. Int J
Clin Pharm. 2016;38(4):752-60.
30 Mullican KA, Francart SJ. The role of specialty pharmacy drugs in the management of inflammatory diseases. Am J Health
Syst Pharm. 2016;73(11):821-30.
31 Hanson RL, Habibi M, Khamo N, Abdou S, Stubbings J. Integrated clinical and specialty pharmacy practice model for
management of patients with multiple sclerosis. Am J Health Syst Pharm. 2014;71(6):463-9.
32 Fajardo S, Zook F, Dotson E. Specialty pharmacy for hematologic malignancies. Am J Health Syst Pharm. 2016;73(11):797-
809.
33 Gilbert EM, Gerzenshtein L. Integration of outpatient infectious diseases clinic pharmacy services and specialty pharmacy
services for patients with HIV infection. Am J Health Syst Pharm. 2016;73(11):757-63.

Hospital Pharmacy in Canada Report 2016/17 B - Clinical Pharmacy Practice
www.hospitalpharmacysurvey.ca page 22
34 Greer N, Bolduc J, Geurkink E, Koeller E, Rector T, Olson K, et al. Pharmacist-led chronic disease management: a systematic
review of effectiveness and harms compared to usual care. Washington (DC): Department of Veterans Affairs (US); 2015 Oct.
35 Leroux A, Guérin A, Bussières JF, Lebel D, Tremblay S, Roy H, et al. [Upgrading a pediatric pharmaceutical care service in
Quebec]. Arch Pediatr. 2016;23(2):117-27. Article in French.
36 Goff DA, Karam GH, Haines ST. Impact of a national antimicrobial stewardship mentoring program: insights and lessons
learned. Am J Health Syst Pharm. 2017;74(4):224-31.
37 Jarfaut A, Nivoix Y, Vigouroux D, Kehrli P, Gaudias J, Kempf JF, et al. [Clinical pharmacy and surgery: review]. Ann Pharm
Fr. 2014;72(3):152-63. Article in French.
38 Aspinall SL, Sales MM, Good CB, Calabrese V, Glassman PA, Burk M, et al. Pharmacy benefits management in the Veterans
Health Administration revisited: a decade of advancements, 2004-2014. J Manag Care Spec Pharm. 2016;22(9):1058-63.
39 Martínez Gabarrón J, Sanz-Valero J, Wanden-Berghe C. Information systems in clinical pharmacy applied to parenteral
nutrition management and traceability: a systematic review. Farm Hosp. 2017;41(1):89-104.
40 Morath B, Mayer T, Send AFJ, Hoppe-Tichy T, Haefeli WE, Seidling HM. Risk factors of adverse health outcomes after
hospital discharge modifiable by clinical pharmacist interventions: a review with a systematic approach. Br J Clin Pharmacol.
2017;83(10):2163-78.
41 Wang T, Benedict N, Olsen KM, Luan R, Zhu X, Zhou N, et al. Effect of critical care pharmacist’s intervention on medication
errors: a systematic review and meta-analysis of observational studies. J Crit Care. 2015;30(5):1101-6.
42 Romagnoli KM, Nelson SD, Hines L, Empey P, Boyce RD, Hochheiser H. Information needs for making clinical
recommendations about potential drug-drug interactions: a synthesis of literature review and interviews. BMC Med Inform Decis
Mak. 2017;17(1):21.
43 Meid AD, Lampert A, Burnett A, Seidling HM, Haefeli WE. The impact of pharmaceutical care interventions for medication
underuse in older people: a systematic review and meta-analysis. Br J Clin Pharmacol. 2015;80(4):768-76.
44 Hammad EA, Bale A, Wright DJ, Bhattacharya D. Pharmacy led medicine reconciliation at hospital: a systematic review of
effects and costs. Res Social Adm Pharm. 2017;13(2):300-12.
45 Mekonnen AB, McLachlan AJ, Brien JA. Pharmacy-led medication reconciliation programmes at hospital transitions: a
systematic review and meta-analysis. J Clin Pharm Ther. 2016;41(2):128-44.
46 Mekonnen AB, McLachlan AJ, Brien JA. Effectiveness of pharmacist-led medication reconciliation programmes on clinical
outcomes at hospital transitions: a systematic review and meta-analysis. BMJ Open. 2016;6(2):e010003.
47 Viswanathan M, Kahwati LC, Golin CE, Blalock SJ, Coker-Schwimmer E, Posey R, et al. Medication therapy management
interventions in outpatient settings: a systematic review and meta-analysis. JAMA Intern Med. 2015;175(1):76-87.
48 Ensing HT, Stuijt CC, van den Bemt BJ, van Dooren AA, Karapinar-Çarkit F, Koster ES, et al. Identifying the optimal role for
pharmacists in care transitions: a systematic review. J Manag Care Spec Pharm. 2015;21(8):614-36.
49 Nazar H, Nazar Z, Portlock J, Todd A, Slight SP. A systematic review of the role of community pharmacies in improving the
transition from secondary to primary care. Br J Clin Pharmacol. 2015;80(5):936-48.
50 Haga SB, Allen LaPointe NM, Moaddeb J. Challenges to integrating pharmacogenetic testing into medication therapy
management. J Manag Care Spec Pharm. 2015;21(4):346-52.
51 Owusu-Obeng A, Weitzel KW, Hatton RC, Staley BJ, Ashton J, Cooper-Dehoff RM, et al. Emerging roles for pharmacists in
clinical implementation of pharmacogenomics. Pharmacotherapy. 2014;34(10):1102-12.
52 Ferrand É, Painchart L, Grimandi G, Décaudin B, Bussières JF. [The roles and the impacts of pharmacists in the management
of medical devices at the hospital: a literature review]. Ann Pharm Fr. 2017;75(6):409-19. Article in French.
53 Helling DK, Johnson SG. Executive leadership: critical to developing clinical pharmacy programs and services. Am J Health
Syst Pharm. 2015;72(23):2060.
54 Carter BL. Evolution of clinical pharmacy in the USA and future directions for patient care. Drugs Aging. 2016;33(3):169-77.
55 Gammie T, Vogler S, Babar ZU. Economic evaluation of hospital and community pharmacy services. Ann Pharmacother.
2017;51(1):54-65.
56 Gallagher J, McCarthy S, Byrne S. Economic evaluations of clinical pharmacist interventions on hospital inpatients: a
systematic review of recent literature. Int J Clin Pharm. 2014;36(6):1101-14.
57 Touchette DR, Doloresco F, Suda KJ, Perez A, Turner S, Jalundhwala Y, et al. Economic evaluations of clinical pharmacy
services: 2006-2010. Pharmacotherapy. 2014;34(8):771-93.
58 Rotta I, Salgado TM, Silva ML, Correr CJ, Fernandez-Llimos F. Effectiveness of clinical pharmacy services: an overview of
systematic reviews (2000-2010). Int J Clin Pharm. 2015;37(5):687-97.
59 Sowell AJ, Pherson EC, Almuete VI, Gillespie JV, Gilmore V, Jensen M, et al. Expansion of inpatient clinical pharmacy
services through reallocation of pharmacists. Am J Health Syst Pharm. 2017;74(21):1806-13.
60 Guérin A, Leroux A, Lebel D, Bussières JF. Publications presenting negative impacts of pharmacists. Ann Pharm Fr.
2016;74(6):448-52.
61 Gums T, Carter B, Foster E. Cluster randomized trials for pharmacy practice research. Int J Clin Pharm. 2016;38(3):607-14.
62 Hadi MA, José Closs S. Ensuring rigour and trustworthiness of qualitative research in clinical pharmacy. Int J Clin Pharm.
2016;38(3):641-6.
63 Vass C, Gray E, Payne K. Discrete choice experiments of pharmacy services: a systematic review. Int J Clin Pharm.
2016;38(3):620-30.
Hospital Pharmacy in Canada Report 2016/17 B - Clinical Pharmacy Practice
www.hospitalpharmacysurvey.ca page 23
64 ASHP PAI: Practice Advancement Initiative [website]. Bethesda (MD): American Society of Health-System Pharmacists;
[cited 2017 Dec 9]. Available from: http://www.ashpmedia.org/pai/
65 Progress measures. ASHP hospital and ambulatory care self-assessment data, collected 2011–2017. Bethesda (MD): American
Society of Health-System Pharmacists; [cited 2017 Dec 9]. Available from: http://www.ashpmedia.org/pai/docs/PAI-Progress-
Measures.pdf
66 Guérin A, Lebel D, Bussières JF. Evidence for the role and impact of pharmacists: description of a website. Can Pharm J (Ott).
2015;148(2):68-70.
67 Barbier A, Girard S, Garnier J, Nugyen KD, Jaatoul M, Bergeron M, et al. A web platform used in a pharmacy curriculum to
expose pharmacy students about evidences of the roles and the impacts of pharmacists in the world: phase III [poster]. Canadian
Pharmacy Education and Research Conference; 2017 Jun 3-5; Québec (QC).
68 Guérin A, Barthélémy I, Merger D, Lebel D, Bussières JF. Projet IMPACT PHARMACIE sur la description du rôle et sur les
retombées du pharmacien : mise en contexte. Ann Unite Rech Prat Pharm. 2014 Jan 23 [cited 2017 Dec 9]:1-6. Available from:
http://indicible.ca/urpp/20140123_IMPACTPHARMACIE1_Annales.pdf
69 Pharmacists’ expanded scope of practice in Canada. Ottawa (ON): Canadian Pharmacists Association; 2016 [cited 2017 Nov
19]. Available from: https://www.pharmacists.ca/pharmacy-in-canada/scope-of-practice-canada/
70 Fernandes O, Gorman SK, Slavik RS, Semchuk WM, Doucette D, Bannerman H, et al. What are the appropriate clinical
pharmacy key performance indicators for hospital pharmacists? [abstract]. Can J Hosp Pharm. 2014;67(1):69.
71 Chan W, Doucette D, Toombs K, Slavik R, Slobodan J, Gorman S, et al. What are the appropriate candidate clinical pharmacy
key performance indicators (cpKPI) for hospital pharmacists? [abstract]. Can J Hosp Pharm. 2013;66(1):60.
72 Bannerman H, Gorman S, Toombs K, Lo J, Shukla S, Doucette D, et al. How do local, provincial and national perspectives on
clinical pharmacy key performance indicator critical activity areas compare? [abstract]. Can J Hosp Pharm. 2014;67(1):64.
73 Minard LV, Deal H, Harrison ME, Toombs K, Neville H, Meade A. Pharmacists’ perceptions of the barriers and facilitators to
the implementation of clinical pharmacy key performance indicators. PLoS One. 2016;11(4):e0152903.
74 Lo E, Rainkie D, Semchuk WM, Gorman SK, Toombs K, Slavik RS, et al. Measurement of clinical pharmacy key performance
indicators to focus and improve your hospital pharmacy practice. Can J Hosp Pharm. 2016;69(2):149-55.
75 CSHP 2015 survey of facilities October to December 2009. Ottawa (ON): Canadian Society of Hospital Pharmacists; [cited
2017 Dec 9]. Available from:
https://cshp.ca/sites/default/files/Clinical%20Pharmacy/CSHP%202015%20Survey%20of%20Facilities_Feb%20(2).pdf
Hospital Pharmacy in Canada Report 2016/17 C - Drug Distribution Systems
www.hospitalpharmacysurvey.ca page 24
C - Drug Distribution Systems
Kyle MacNair and Allan Mills
The practice of drug distribution in Canadian healthcare institutions continues to evolve, with the introduction
of new standards, the adoption and implementation of new technology and the integration of regulated pharmacy
technicians into patient care teams in many jurisdictions. The goal of this evolution is to create a system that delivers
medications in a safe, accountable and cost-effective manner.
Oral Medication Systems
Twenty years ago, when the 1997/98 Hospital Pharmacy in Canada Report was published, drug distribution by
hospital pharmacies looked very different from how it looks today. At that time, more than three-quarters of
hospitals employed a traditional dispensing system, and only seven hospitals in the country had incorporated unit-
based automated dispensing systems in the care of their patients. Over the past two decades, there has been a
complete reversal of this pattern, with traditional dispensing now occurring in only a handful of facilities across the
country. This shift has been driven by the recognition that automated drug distribution and the administration of
drugs in ready-to-use unit-dose packaging reduce medication errors and improve patient safety. This knowledge has
led Accreditation Canada to make medication dispensing in unit-dose packaging a high priority within its Managing
Medication Standards.1
Unit-Dose Systems
Centralized unit-dose systems, in which
unit-dose medications are dispensed from
a central pharmacy, were reported by
77% (140/181) of all respondents in
2016/17 (Table C-1). This represents a
slight increase from 75% (118/157) in
2013/14 and reflects the steady adoption
of centralized unit-dose systems since
2007/08, when such systems were reported by 64% (103/162) of respondents.
Centralized unit-dose systems were reported to be in use by all respondent facilities in Quebec (QC)
(100%, 43/43), but were less commonly seen in other regions: 86% (25/29) in British Columbia/Yukon
(BC/YT), 73% (37/51) in Ontario (ON), 57% (12/21) in the Atlantic provinces and 62% (23/37) in the
Prairie provinces. [The Atlantic provinces comprise New Brunswick (NB), Nova Scotia (NS), Prince
Edward Island (PE) and Newfoundland and
Labrador (NL). The Prairie provinces
comprise Alberta (AB), Saskatchewan (SK)
and Manitoba (MB).]
Decentralized unit-dose systems that involve
dispensing of unit-dose medications from a
satellite pharmacy were reported to be in use
by 15% (28/181) of all respondents (Table C-1). This is almost double the 8% (12/157) rate reported for
2013/14. Decentralized unit-dose drug distribution from satellite pharmacies was more commonly reported
by respondents in QC (23%, 10/43), the Prairies (16%, 6/37) and ON (14%, 7/51) than in the Atlantic
provinces (14%, 3/21) or BC/YT (7%, 2/29).
The use of decentralized unit-dose systems in which unit-dose medications are provided from automated
dispensing cabinets (ADCs) located in patient care areas that service overnight beds (i.e., not including the
emergency department [ED], operating rooms [OR] and other outpatient locations), was reported by 56%
(102/181) of all respondents. The provision of medication from ADCs varied across regions, being more
common in the Atlantic provinces (71%, 15/21), ON (65%, 33/51) and BC/YT (59%, 17/29) than in QC
(49%, 21/43) or the Prairies (43%, 16/37). Uptake of decentralized unit-dose systems in ON was markedly
increased from the 48% (19/40) reported for 2013/14.
The percentage of respondents employing unit-dose
systems has increased over the past five survey
periods.
Use of decentralized unit-dose systems from
satellite pharmacies has almost doubled since
2013/14.
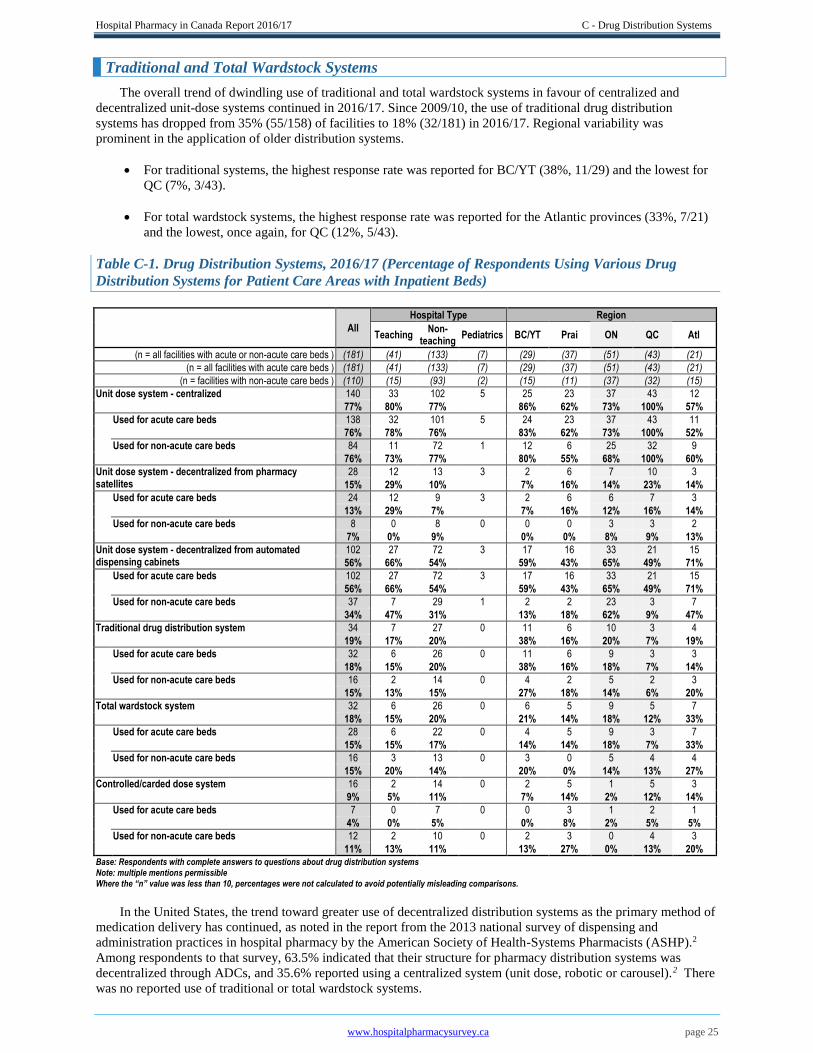
Hospital Pharmacy in Canada Report 2016/17 C - Drug Distribution Systems
www.hospitalpharmacysurvey.ca page 25
Traditional and Total Wardstock Systems
The overall trend of dwindling use of traditional and total wardstock systems in favour of centralized and
decentralized unit-dose systems continued in 2016/17. Since 2009/10, the use of traditional drug distribution
systems has dropped from 35% (55/158) of facilities to 18% (32/181) in 2016/17. Regional variability was
prominent in the application of older distribution systems.
For traditional systems, the highest response rate was reported for BC/YT (38%, 11/29) and the lowest for
QC (7%, 3/43).
For total wardstock systems, the highest response rate was reported for the Atlantic provinces (33%, 7/21)
and the lowest, once again, for QC (12%, 5/43).
Table C-1. Drug Distribution Systems, 2016/17 (Percentage of Respondents Using Various Drug
Distribution Systems for Patient Care Areas with Inpatient Beds)
All
Hospital Type Region
Teaching Non-
teaching Pediatrics BC/YT Prai ON QC Atl
(n = all facilities with acute or non-acute care beds ) (181) (41) (133) (7) (29) (37) (51) (43) (21)
(n = all facilities with acute care beds ) (181) (41) (133) (7) (29) (37) (51) (43) (21)
(n = facilities with non-acute care beds ) (110) (15) (93) (2) (15) (11) (37) (32) (15)
Unit dose system - centralized 140 33 102 5 25 23 37 43 12
77% 80% 77%
86% 62% 73% 100% 57%
Used for acute care beds 138 32 101 5 24 23 37 43 11
76% 78% 76%
83% 62% 73% 100% 52%
Used for non-acute care beds 84 11 72 1 12 6 25 32 9
76% 73% 77%
80% 55% 68% 100% 60%
Unit dose system - decentralized from pharmacy satellites
28 12 13 3 2 6 7 10 3
15% 29% 10%
7% 16% 14% 23% 14%
Used for acute care beds 24 12 9 3 2 6 6 7 3
13% 29% 7%
7% 16% 12% 16% 14%
Used for non-acute care beds 8 0 8 0 0 0 3 3 2
7% 0% 9%
0% 0% 8% 9% 13%
Unit dose system - decentralized from automated dispensing cabinets
102 27 72 3 17 16 33 21 15
56% 66% 54% 59% 43% 65% 49% 71%
Used for acute care beds 102 27 72 3 17 16 33 21 15
56% 66% 54%
59% 43% 65% 49% 71%
Used for non-acute care beds 37 7 29 1 2 2 23 3 7
34% 47% 31%
13% 18% 62% 9% 47%
Traditional drug distribution system 34 7 27 0 11 6 10 3 4
19% 17% 20%
38% 16% 20% 7% 19%
Used for acute care beds 32 6 26 0 11 6 9 3 3
18% 15% 20%
38% 16% 18% 7% 14%
Used for non-acute care beds 16 2 14 0 4 2 5 2 3
15% 13% 15%
27% 18% 14% 6% 20%
Total wardstock system 32 6 26 0 6 5 9 5 7
18% 15% 20%
21% 14% 18% 12% 33%
Used for acute care beds 28 6 22 0 4 5 9 3 7
15% 15% 17%
14% 14% 18% 7% 33%
Used for non-acute care beds 16 3 13 0 3 0 5 4 4
15% 20% 14%
20% 0% 14% 13% 27%
Controlled/carded dose system 16 2 14 0 2 5 1 5 3
9% 5% 11%
7% 14% 2% 12% 14%
Used for acute care beds 7 0 7 0 0 3 1 2 1
4% 0% 5%
0% 8% 2% 5% 5%
Used for non-acute care beds 12 2 10 0 2 3 0 4 3
11% 13% 11%
13% 27% 0% 13% 20% Base: Respondents with complete answers to questions about drug distribution systems Note: multiple mentions permissible Where the “n” value was less than 10, percentages were not calculated to avoid potentially misleading comparisons.
In the United States, the trend toward greater use of decentralized distribution systems as the primary method of
medication delivery has continued, as noted in the report from the 2013 national survey of dispensing and
administration practices in hospital pharmacy by the American Society of Health-Systems Pharmacists (ASHP).2
Among respondents to that survey, 63.5% indicated that their structure for pharmacy distribution systems was
decentralized through ADCs, and 35.6% reported using a centralized system (unit dose, robotic or carousel).2 There
was no reported use of traditional or total wardstock systems.
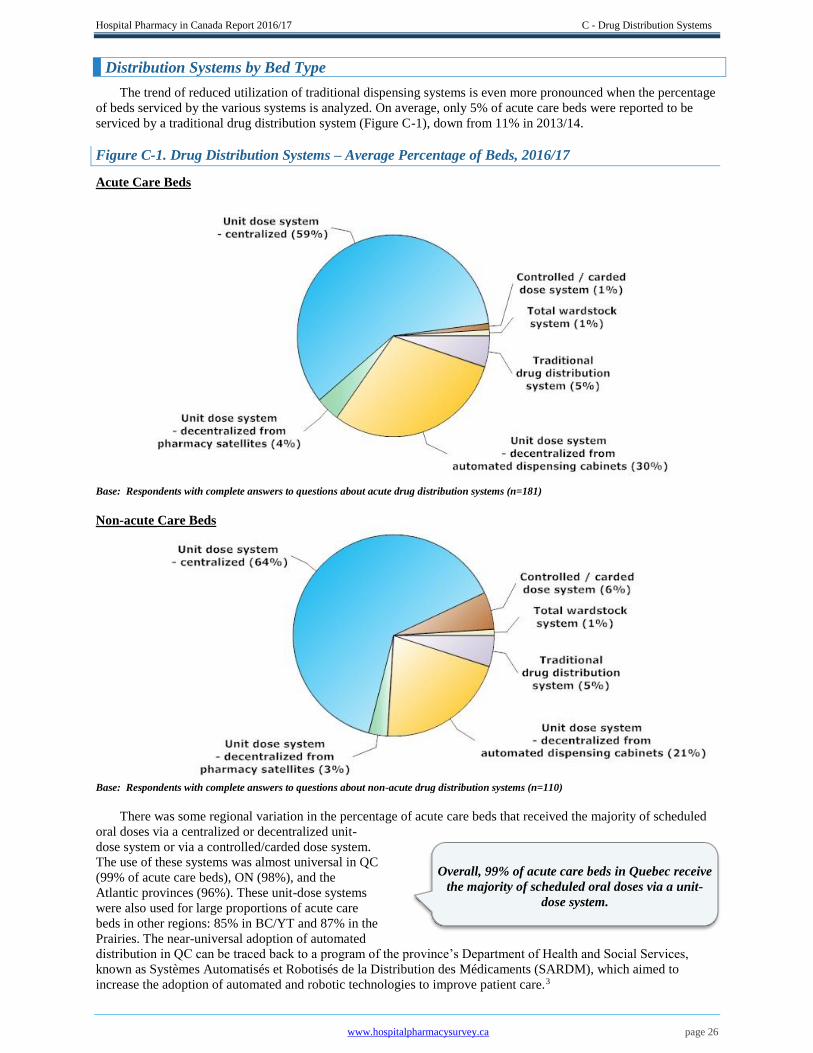
Hospital Pharmacy in Canada Report 2016/17 C - Drug Distribution Systems
www.hospitalpharmacysurvey.ca page 26
Distribution Systems by Bed Type
The trend of reduced utilization of traditional dispensing systems is even more pronounced when the percentage
of beds serviced by the various systems is analyzed. On average, only 5% of acute care beds were reported to be
serviced by a traditional drug distribution system (Figure C-1), down from 11% in 2013/14.
Figure C-1. Drug Distribution Systems – Average Percentage of Beds, 2016/17
Acute Care Beds
Base: Respondents with complete answers to questions about acute drug distribution systems (n=181)
Non-acute Care Beds
Base: Respondents with complete answers to questions about non-acute drug distribution systems (n=110)
There was some regional variation in the percentage of acute care beds that received the majority of scheduled
oral doses via a centralized or decentralized unit-
dose system or via a controlled/carded dose system.
The use of these systems was almost universal in QC
(99% of acute care beds), ON (98%), and the
Atlantic provinces (96%). These unit-dose systems
were also used for large proportions of acute care
beds in other regions: 85% in BC/YT and 87% in the
Prairies. The near-universal adoption of automated
distribution in QC can be traced back to a program of the province’s Department of Health and Social Services,
known as Systèmes Automatisés et Robotisés de la Distribution des Médicaments (SARDM), which aimed to
increase the adoption of automated and robotic technologies to improve patient care.3
Overall, 99% of acute care beds in Quebec receive
the majority of scheduled oral doses via a unit-
dose system.
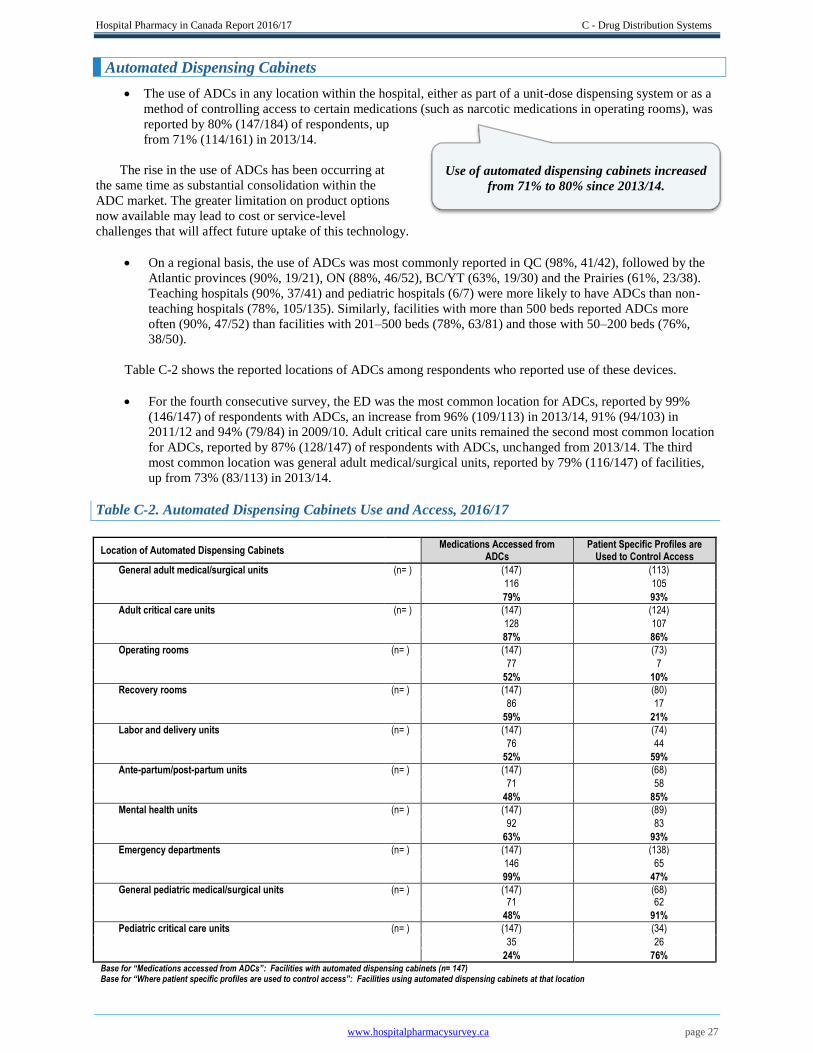
Hospital Pharmacy in Canada Report 2016/17 C - Drug Distribution Systems
www.hospitalpharmacysurvey.ca page 27
Automated Dispensing Cabinets
The use of ADCs in any location within the hospital, either as part of a unit-dose dispensing system or as a
method of controlling access to certain medications (such as narcotic medications in operating rooms), was
reported by 80% (147/184) of respondents, up
from 71% (114/161) in 2013/14.
The rise in the use of ADCs has been occurring at
the same time as substantial consolidation within the
ADC market. The greater limitation on product options
now available may lead to cost or service-level
challenges that will affect future uptake of this technology.
On a regional basis, the use of ADCs was most commonly reported in QC (98%, 41/42), followed by the
Atlantic provinces (90%, 19/21), ON (88%, 46/52), BC/YT (63%, 19/30) and the Prairies (61%, 23/38).
Teaching hospitals (90%, 37/41) and pediatric hospitals (6/7) were more likely to have ADCs than non-
teaching hospitals (78%, 105/135). Similarly, facilities with more than 500 beds reported ADCs more
often (90%, 47/52) than facilities with 201–500 beds (78%, 63/81) and those with 50–200 beds (76%,
38/50).
Table C-2 shows the reported locations of ADCs among respondents who reported use of these devices.
For the fourth consecutive survey, the ED was the most common location for ADCs, reported by 99%
(146/147) of respondents with ADCs, an increase from 96% (109/113) in 2013/14, 91% (94/103) in
2011/12 and 94% (79/84) in 2009/10. Adult critical care units remained the second most common location
for ADCs, reported by 87% (128/147) of respondents with ADCs, unchanged from 2013/14. The third
most common location was general adult medical/surgical units, reported by 79% (116/147) of facilities,
up from 73% (83/113) in 2013/14.
Table C-2. Automated Dispensing Cabinets Use and Access, 2016/17
Location of Automated Dispensing Cabinets Medications Accessed from
ADCs Patient Specific Profiles are
Used to Control Access
General adult medical/surgical units (n= ) (147) (113)
116 105
79% 93%
Adult critical care units (n= ) (147) (124)
128 107
87% 86%
Operating rooms (n= ) (147) (73)
77 7
52% 10%
Recovery rooms (n= ) (147) (80)
86 17
59% 21%
Labor and delivery units (n= ) (147) (74)
76 44
52% 59%
Ante-partum/post-partum units (n= ) (147) (68)
71 58
48% 85%
Mental health units (n= ) (147) (89)
92 83
63% 93%
Emergency departments (n= ) (147) (138)
146 65
99% 47%
General pediatric medical/surgical units (n= ) (147) (68)
71 62
48% 91%
Pediatric critical care units (n= ) (147) (34)
35 26
24% 76% Base for “Medications accessed from ADCs”: Facilities with automated dispensing cabinets (n= 147) Base for “Where patient specific profiles are used to control access”: Facilities using automated dispensing cabinets at that location
Use of automated dispensing cabinets increased
from 71% to 80% since 2013/14.
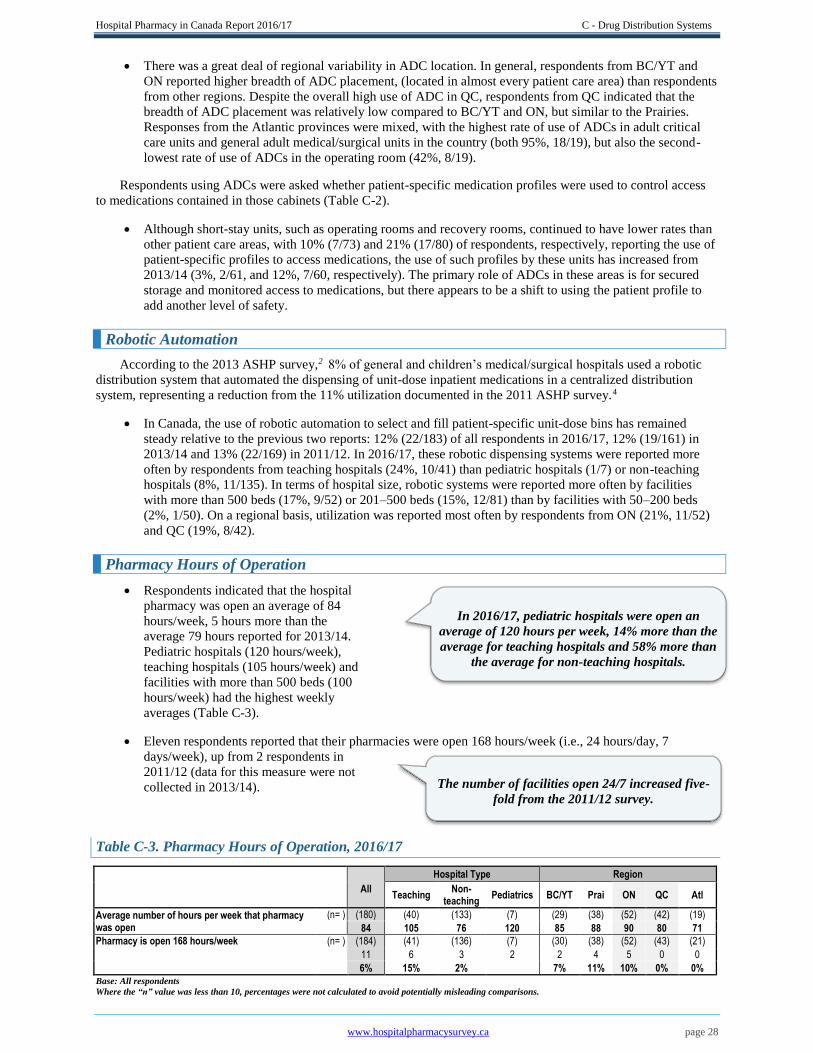
Hospital Pharmacy in Canada Report 2016/17 C - Drug Distribution Systems
www.hospitalpharmacysurvey.ca page 28
There was a great deal of regional variability in ADC location. In general, respondents from BC/YT and
ON reported higher breadth of ADC placement, (located in almost every patient care area) than respondents
from other regions. Despite the overall high use of ADC in QC, respondents from QC indicated that the
breadth of ADC placement was relatively low compared to BC/YT and ON, but similar to the Prairies.
Responses from the Atlantic provinces were mixed, with the highest rate of use of ADCs in adult critical
care units and general adult medical/surgical units in the country (both 95%, 18/19), but also the second-
lowest rate of use of ADCs in the operating room (42%, 8/19).
Respondents using ADCs were asked whether patient-specific medication profiles were used to control access
to medications contained in those cabinets (Table C-2).
Although short-stay units, such as operating rooms and recovery rooms, continued to have lower rates than
other patient care areas, with 10% (7/73) and 21% (17/80) of respondents, respectively, reporting the use of
patient-specific profiles to access medications, the use of such profiles by these units has increased from
2013/14 (3%, 2/61, and 12%, 7/60, respectively). The primary role of ADCs in these areas is for secured
storage and monitored access to medications, but there appears to be a shift to using the patient profile to
add another level of safety.
Robotic Automation
According to the 2013 ASHP survey,2 8% of general and children’s medical/surgical hospitals used a robotic
distribution system that automated the dispensing of unit-dose inpatient medications in a centralized distribution
system, representing a reduction from the 11% utilization documented in the 2011 ASHP survey.4
In Canada, the use of robotic automation to select and fill patient-specific unit-dose bins has remained
steady relative to the previous two reports: 12% (22/183) of all respondents in 2016/17, 12% (19/161) in
2013/14 and 13% (22/169) in 2011/12. In 2016/17, these robotic dispensing systems were reported more
often by respondents from teaching hospitals (24%, 10/41) than pediatric hospitals (1/7) or non-teaching
hospitals (8%, 11/135). In terms of hospital size, robotic systems were reported more often by facilities
with more than 500 beds (17%, 9/52) or 201–500 beds (15%, 12/81) than by facilities with 50–200 beds
(2%, 1/50). On a regional basis, utilization was reported most often by respondents from ON (21%, 11/52)
and QC (19%, 8/42).
Pharmacy Hours of Operation
Respondents indicated that the hospital
pharmacy was open an average of 84
hours/week, 5 hours more than the
average 79 hours reported for 2013/14.
Pediatric hospitals (120 hours/week),
teaching hospitals (105 hours/week) and
facilities with more than 500 beds (100
hours/week) had the highest weekly
averages (Table C-3).
Eleven respondents reported that their pharmacies were open 168 hours/week (i.e., 24 hours/day, 7
days/week), up from 2 respondents in
2011/12 (data for this measure were not
collected in 2013/14).
Table C-3. Pharmacy Hours of Operation, 2016/17
All
Hospital Type Region
Teaching Non-
teaching Pediatrics BC/YT Prai ON QC Atl
Average number of hours per week that pharmacy was open
(n= ) (180) (40) (133) (7) (29) (38) (52) (42) (19)
84 105 76 120 85 88 90 80 71
Pharmacy is open 168 hours/week (n= ) (184) (41) (136) (7) (30) (38) (52) (43) (21)
11 6 3 2 2 4 5 0 0
6% 15% 2% 7% 11% 10% 0% 0% Base: All respondents
Where the “n” value was less than 10, percentages were not calculated to avoid potentially misleading comparisons.
In 2016/17, pediatric hospitals were open an
average of 120 hours per week, 14% more than the
average for teaching hospitals and 58% more than
the average for non-teaching hospitals.
The number of facilities open 24/7 increased five-
fold from the 2011/12 survey.

Hospital Pharmacy in Canada Report 2016/17 C - Drug Distribution Systems
www.hospitalpharmacysurvey.ca page 29
Medication Order Entry and Verification
Entry of medication orders into the pharmacy information system continues to be performed most frequently by
pharmacists and pharmacy technicians (Table C-4).
Table C-4. Medication Order Entry and Verification, 2016/17
All
Hospital Type Region
Teaching
Non- teaching
Pediatrics BC/YT Prai ON QC Atl
Order entry performed by prescribing physicians, entering their own orders
(n= ) (184) (41) (136) (7) (30) (38) (52) (43) (21)
33 13 18 2 1 6 19 4 3
18% 32% 13% 3% 16% 37% 9% 14%
Verification of order entry by prescribing physicians is done by:
(n= ) (33) (13) (18) (2) (1) (6) (19) (4) (3)
A pharmacist only 27 10 16 1 1 1 19 3 3
82% 77% 89% 100%
A pharmacy technician only 3 3 0 0 0 3 0 0 0
9% 23% 0% 0%
Either a pharmacist or a pharmacy technician 3 0 2 1 0 2 0 1 0
9% 0% 11% 0%
Verification of order entry is not required 0 0 0 0 0 0 0 0 0
0% 0% 0% 0%
Order entry performed by prescribing pharmacists, entering their own orders
(n= ) (184) (41) (136) (7) (30) (38) (52) (43) (21)
37 10 25 2 5 10 10 8 4
20% 24% 18% 17% 26% 19% 19% 19%
Verification of order entry by prescribing pharmacists is done by:
(n= ) (36) (10) (24) (2) (5) (10) (9) (8) (4)
A pharmacist only 21 4 16 1 4 2 6 6 3
58% 40% 67% 20%
A pharmacy technician only 4 3 1 0 0 3 1 0 0
11% 30% 4% 30%
Either a pharmacist or a pharmacy technician 4 0 3 1 0 3 1 0 0
11% 0% 13% 30%
Verification of order entry is not required 7 3 4 0 1 2 1 2 1
19% 30% 17% 20%
Order entry performed by pharmacists, entering prescribers orders
(n= ) (184) (41) (136) (7) (30) (38) (52) (43) (21)
131 28 97 6 22 29 42 21 17
71% 68% 71% 73% 76% 81% 49% 81%
Verification of order entry by pharmacists, entering prescribers' orders, is done by:
(n= ) (126) (28) (92) (6) (22) (28) (42) (19) (15)
A pharmacist only 67 16 46 5 10 15 17 14 11
53% 57% 50% 45% 54% 40% 74% 73%
A pharmacy technician only 2 0 2 0 0 0 2 0 0
2% 0% 2% 0% 0% 5% 0% 0%
Either a pharmacist or a pharmacy technician 17 3 13 1 1 4 9 2 1
13% 11% 14% 5% 14% 21% 11% 7%
Verification of order entry is not required 40 9 31 0 11 9 14 3 3
32% 32% 34% 50% 32% 33% 16% 20%
Order entry performed by pharmacy technicians, entering prescribers’ orders
(n= ) (184) (41) (136) (7) (30) (38) (5)2 (43) (21)
139 32 103 4 27 23 28 43 18
76% 78% 76% 90% 61% 54% 100% 86%
Verification of order entry by pharmacy technicians, entering prescribers orders, is done by:
(n= ) (136) (32) (100) (4) (27) (22) (28) (41) (18)
A pharmacist only 114 24 88 2 27 16 16 39 16
84% 75% 88% 100% 73% 57% 95% 89%
A pharmacy technician only 7 4 3 0 0 3 4 0 0
5% 13% 3% 0% 14% 14% 0% 0%
Either a pharmacist or a pharmacy technician 11 3 6 2 0 3 5 2 1
8% 9% 6% 0% 14% 18% 5% 6%
Verification of order entry is not required 4 1 3 0 0 0 3 0 1
3% 3% 3% 0% 0% 11% 0% 6%
Order entry performed by other prescribers (e.g. nurse prescribers)
(n= ) (184) (41) (136) (7) (30) (38) (52) (43) (21)
28 10 17 1 2 9 12 3 2
15% 24% 13% 7% 24% 23% 7% 10%
Verification of order entry by other prescribers (e.g. nurse prescribers) is done by:
(n= ) (28) (10) (17) (1) (2) (9) (12) (3) (2)
A pharmacist only 21 7 14 0 2 4 11 2 2
75% 70% 82% 92%
A pharmacy technician only 4 3 1 0 0 3 1 0 0 14% 30% 6% 8%
Either a pharmacist or a pharmacy technician 3 0 2 1 0 2 0 1 0 11% 0% 12% 0%
Verification of order entry is not required 0 0 0 0 0 0 0 0 0 0% 0% 0% 0%
Base: All respondents Where the “n” value was less than 10, percentages were not calculated to avoid potentially misleading comparisons.
Hospital Pharmacy in Canada Report 2016/17 C - Drug Distribution Systems
www.hospitalpharmacysurvey.ca page 30
Among respondents to the 2016/17 survey, 76% (139/184) indicated that prescribers’ medication orders
were entered into the pharmacy information system by pharmacy technicians, similar to levels reported in
2013/14 (78%, 126/161) and in 2011/12 (79%, 133/169). In addition, 71% (131/184) of respondents
indicated that pharmacists entered prescribers’ medication orders, similar to levels reported in 2013/14
(71%, 114/161) and 2011/12 (72%; 122/169).
Entry of medication orders into the pharmacy information system by prescribing physicians was reported
by 18% (33/184) of respondents, an increase from the 14% (23/161) reported in 2013/14. Order entry by
prescribing pharmacists was unchanged in 2016/17, at 20% (37/184), compared with 19% (30/161) in
2013/14. Order entry by prescribing physicians was highest in ON (37%, 19/52), more than twice the rate
reported for the next highest region (Prairies: 16%, 6/38).
The finding that order entry by prescribing pharmacists has not changed since 2013/14 was somewhat of a
surprise, considering the expansion of the scope of pharmacy practice in most Canadian provinces to include
adaptation of medication orders and more independent prescribing.
The 2016/17 survey included a new option to document the frequency of order entry performed by “other
prescribers” with the opportunity to enter free-text details as to the qualifications of those prescribers.
Overall, 15% (28/184) of respondents reported that other prescribers performed medication order entry.
The professionals identified as “other prescribers” included nurse practitioners, physician assistants, and
nurses/pharmacists operating under medical directives.
For orders entered by prescribing
physicians, respondents reported that
verification was most frequently
performed by a pharmacist (82%, 27/33)
(Table C-4). For orders entered by
prescribing pharmacists, 19% (7/36) of
respondents reported that no additional verification was required, about half the 44% (12/27) reported in
2013/14. Respondents reported that pharmacy technicians infrequently verified medication order entry,
although this practice had increased across all groups of prescribers relative to the 2013/14 report.
There was substantial regional variation in medication order entry by pharmacy technicians: 54% (28/52)
of respondents in ON, 61% (23/38) of those in the Prairies, 86% (18/21) of those in the Atlantic region,
90% (27/30) of those in BC/YT and 100% of those in QC (43/43). Overall, medication orders entered by
pharmacy technicians were reported to be verified by pharmacists in 84% (114/136) of facilities, with very
few respondents indicating no requirement for verification of order entry by pharmacy technicians.
For facilities where pharmacists enter prescribers’ orders, 32% (40/126) of respondents reported that
verification of order entry was not required,
down from 51% (57/112) in 2013/14
Compared with the modest uptake of computerized
practitioner (or physician) order entry (CPOE) in the
Canadian market, the 2016 ASHP survey showed
continued rapid progress in this area in the United
States.5 This most recent iteration of the ASHP survey
indicated that medication orders were received
electronically in the pharmacy through CPOE at 90.7%
of responding facilities, with digital image capture
(4.2%), fax (2.8%) and handwritten orders (2.3%)
accounting for the remainder. In contrast, just 10 years ago, the 2007 ASHP survey found that CPOE was used for
communication with the pharmacy by only 5.1% of respondents.5
Among respondents to the 2016/17 Canadian survey, 95% (164/172) reported that, during the hours that the
pharmacy is open, a pharmacist reviews at least 95% of all routine medication orders for therapeutic
appropriateness before the medications are dispensed from the central or a satellite pharmacy (Table C-5).
This is similar to the 93% (156/168) reported for 2011/12. In addition, 70% (102/145) reported that this
type of review occurred before medications were accessed from ADCs on patient care units, up
substantially from the 44% (74/168) reported for 2011/12.
Pharmacists verify the majority of orders entered
in the pharmacy computerized information
system.
For both prescribing pharmacists and
pharmacists entering other prescribers’ orders,
the proportion of respondents reporting that
verification of order entry was not required
declined from 2013/14.
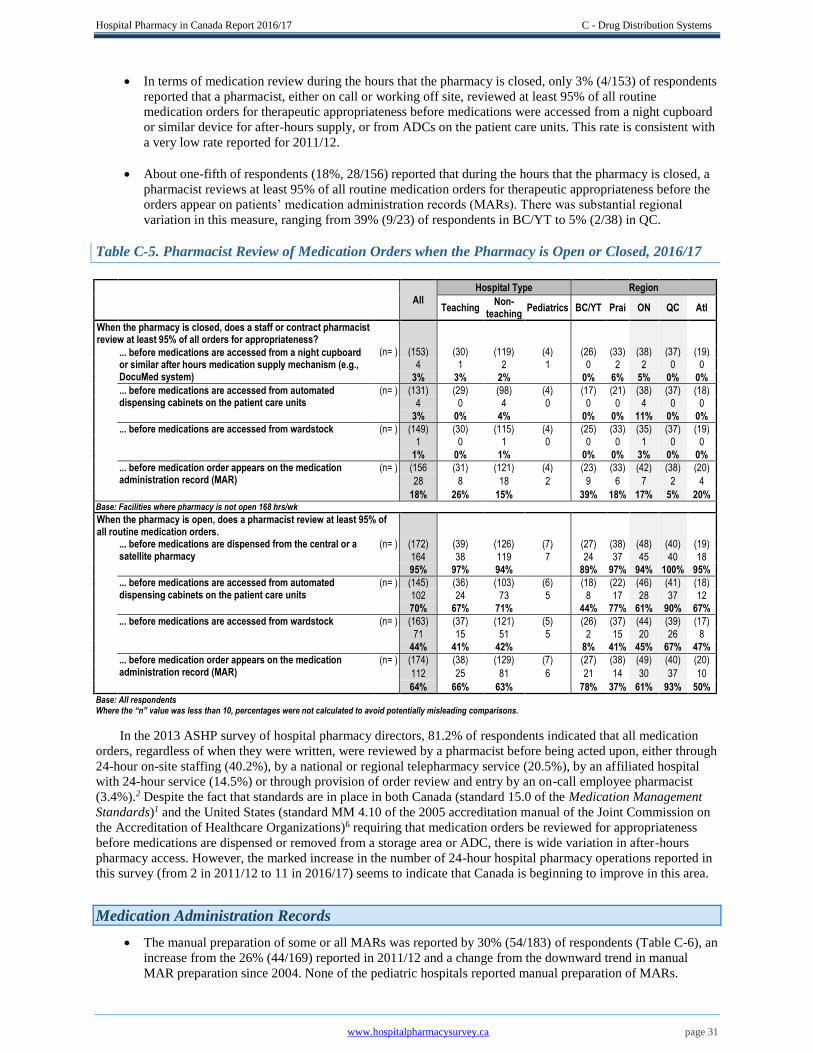
Hospital Pharmacy in Canada Report 2016/17 C - Drug Distribution Systems
www.hospitalpharmacysurvey.ca page 31
In terms of medication review during the hours that the pharmacy is closed, only 3% (4/153) of respondents
reported that a pharmacist, either on call or working off site, reviewed at least 95% of all routine
medication orders for therapeutic appropriateness before medications were accessed from a night cupboard
or similar device for after-hours supply, or from ADCs on the patient care units. This rate is consistent with
a very low rate reported for 2011/12.
About one-fifth of respondents (18%, 28/156) reported that during the hours that the pharmacy is closed, a
pharmacist reviews at least 95% of all routine medication orders for therapeutic appropriateness before the
orders appear on patients’ medication administration records (MARs). There was substantial regional
variation in this measure, ranging from 39% (9/23) of respondents in BC/YT to 5% (2/38) in QC.
Table C-5. Pharmacist Review of Medication Orders when the Pharmacy is Open or Closed, 2016/17
All Hospital Type Region
Teaching
Non- teaching
Pediatrics BC/YT Prai ON QC Atl
When the pharmacy is closed, does a staff or contract pharmacist review at least 95% of all orders for appropriateness?
... before medications are accessed from a night cupboard or similar after hours medication supply mechanism (e.g., DocuMed system)
(n= ) (153) (30) (119) (4) (26) (33) (38) (37) (19)
4 1 2 1 0 2 2 0 0
3% 3% 2% 0% 6% 5% 0% 0%
... before medications are accessed from automated dispensing cabinets on the patient care units
(n= ) (131) (29) (98) (4) (17) (21) (38) (37) (18)
4 0 4 0 0 0 4 0 0
3% 0% 4% 0% 0% 11% 0% 0%
... before medications are accessed from wardstock (n= ) (149) (30) (115) (4) (25) (33) (35) (37) (19)
1 0 1 0 0 0 1 0 0
1% 0% 1% 0% 0% 3% 0% 0%
... before medication order appears on the medication administration record (MAR)
(n= ) (156 (31) (121) (4) (23) (33) (42) (38) (20)
28 8 18 2 9 6 7 2 4
18% 26% 15% 39% 18% 17% 5% 20% Base: Facilities where pharmacy is not open 168 hrs/wk
When the pharmacy is open, does a pharmacist review at least 95% of all routine medication orders.
... before medications are dispensed from the central or a satellite pharmacy
(n= ) (172) (39) (126) (7) (27) (38) (48) (40) (19)
164 38 119 7 24 37 45 40 18
95% 97% 94% 89% 97% 94% 100% 95%
... before medications are accessed from automated dispensing cabinets on the patient care units
(n= ) (145) (36) (103) (6) (18) (22) (46) (41) (18)
102 24 73 5 8 17 28 37 12
70% 67% 71% 44% 77% 61% 90% 67%
... before medications are accessed from wardstock (n= ) (163) (37) (121) (5) (26) (37) (44) (39) (17)
71 15 51 5 2 15 20 26 8
44% 41% 42% 8% 41% 45% 67% 47%
... before medication order appears on the medication administration record (MAR)
(n= ) (174) (38) (129) (7) (27) (38) (49) (40) (20)
112 25 81 6 21 14 30 37 10
64% 66% 63% 78% 37% 61% 93% 50% Base: All respondents Where the “n” value was less than 10, percentages were not calculated to avoid potentially misleading comparisons.
In the 2013 ASHP survey of hospital pharmacy directors, 81.2% of respondents indicated that all medication
orders, regardless of when they were written, were reviewed by a pharmacist before being acted upon, either through
24-hour on-site staffing (40.2%), by a national or regional telepharmacy service (20.5%), by an affiliated hospital
with 24-hour service (14.5%) or through provision of order review and entry by an on-call employee pharmacist
(3.4%).2 Despite the fact that standards are in place in both Canada (standard 15.0 of the Medication Management
Standards)1 and the United States (standard MM 4.10 of the 2005 accreditation manual of the Joint Commission on
the Accreditation of Healthcare Organizations)6 requiring that medication orders be reviewed for appropriateness
before medications are dispensed or removed from a storage area or ADC, there is wide variation in after-hours
pharmacy access. However, the marked increase in the number of 24-hour hospital pharmacy operations reported in
this survey (from 2 in 2011/12 to 11 in 2016/17) seems to indicate that Canada is beginning to improve in this area.
Medication Administration Records
The manual preparation of some or all MARs was reported by 30% (54/183) of respondents (Table C-6), an
increase from the 26% (44/169) reported in 2011/12 and a change from the downward trend in manual
MAR preparation since 2004. None of the pediatric hospitals reported manual preparation of MARs.
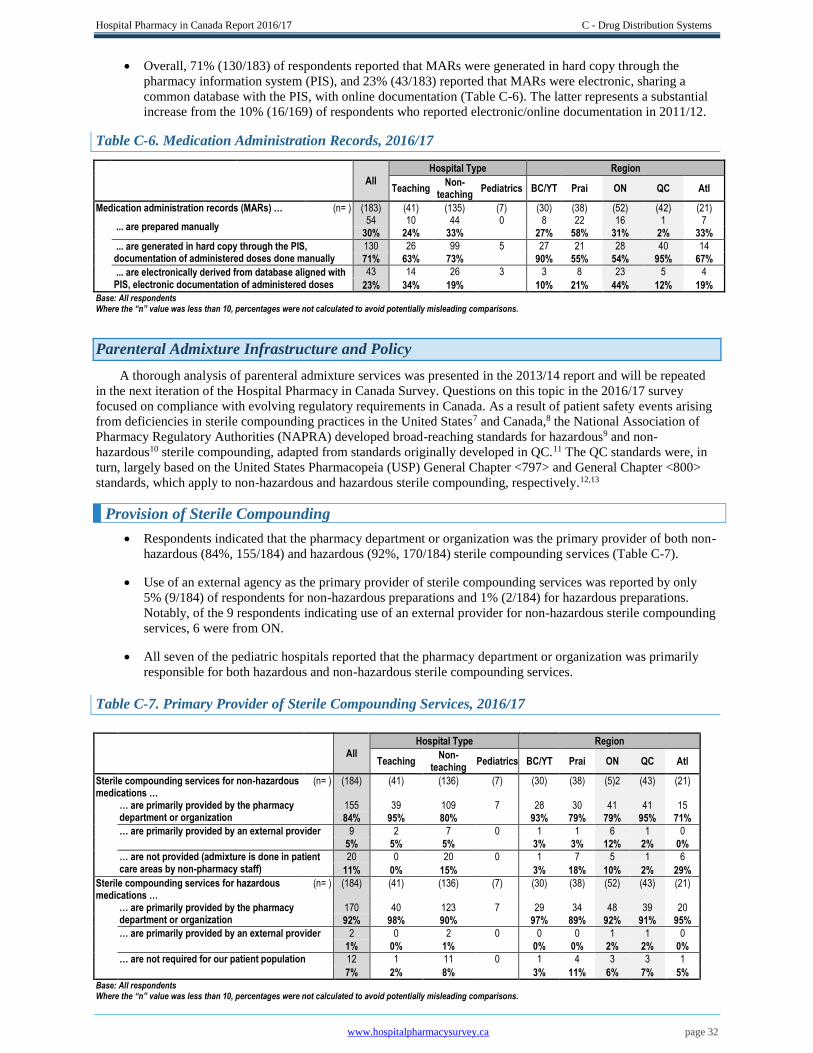
Hospital Pharmacy in Canada Report 2016/17 C - Drug Distribution Systems
www.hospitalpharmacysurvey.ca page 32
Overall, 71% (130/183) of respondents reported that MARs were generated in hard copy through the
pharmacy information system (PIS), and 23% (43/183) reported that MARs were electronic, sharing a
common database with the PIS, with online documentation (Table C-6). The latter represents a substantial
increase from the 10% (16/169) of respondents who reported electronic/online documentation in 2011/12.
Table C-6. Medication Administration Records, 2016/17
All
Hospital Type Region
Teaching
Non- teaching
Pediatrics BC/YT Prai ON QC Atl
Medication administration records (MARs) … (n= ) (183) (41) (135) (7) (30) (38) (52) (42) (21)
... are prepared manually 54 10 44 0 8 22 16 1 7
30% 24% 33% 27% 58% 31% 2% 33%
... are generated in hard copy through the PIS, documentation of administered doses done manually
130 26 99 5 27 21 28 40 14
71% 63% 73% 90% 55% 54% 95% 67%
... are electronically derived from database aligned with PIS, electronic documentation of administered doses
43 14 26 3 3 8 23 5 4
23% 34% 19% 10% 21% 44% 12% 19% Base: All respondents
Where the “n” value was less than 10, percentages were not calculated to avoid potentially misleading comparisons.
Parenteral Admixture Infrastructure and Policy
A thorough analysis of parenteral admixture services was presented in the 2013/14 report and will be repeated
in the next iteration of the Hospital Pharmacy in Canada Survey. Questions on this topic in the 2016/17 survey
focused on compliance with evolving regulatory requirements in Canada. As a result of patient safety events arising
from deficiencies in sterile compounding practices in the United States7 and Canada,8 the National Association of
Pharmacy Regulatory Authorities (NAPRA) developed broad-reaching standards for hazardous9 and non-
hazardous10 sterile compounding, adapted from standards originally developed in QC.11 The QC standards were, in
turn, largely based on the United States Pharmacopeia (USP) General Chapter <797> and General Chapter <800>
standards, which apply to non-hazardous and hazardous sterile compounding, respectively.12,13
Provision of Sterile Compounding
Respondents indicated that the pharmacy department or organization was the primary provider of both non-
hazardous (84%, 155/184) and hazardous (92%, 170/184) sterile compounding services (Table C-7).
Use of an external agency as the primary provider of sterile compounding services was reported by only
5% (9/184) of respondents for non-hazardous preparations and 1% (2/184) for hazardous preparations.
Notably, of the 9 respondents indicating use of an external provider for non-hazardous sterile compounding
services, 6 were from ON.
All seven of the pediatric hospitals reported that the pharmacy department or organization was primarily
responsible for both hazardous and non-hazardous sterile compounding services.
Table C-7. Primary Provider of Sterile Compounding Services, 2016/17
All Hospital Type Region
Teaching
Non- teaching
Pediatrics BC/YT Prai ON QC Atl
Sterile compounding services for non-hazardous medications …
(n= ) (184) (41) (136) (7) (30) (38) (5)2 (43) (21)
… are primarily provided by the pharmacy department or organization
155 39 109 7 28 30 41 41 15
84% 95% 80% 93% 79% 79% 95% 71%
… are primarily provided by an external provider 9 2 7 0 1 1 6 1 0
5% 5% 5% 3% 3% 12% 2% 0%
… are not provided (admixture is done in patient care areas by non-pharmacy staff)
20 0 20 0 1 7 5 1 6
11% 0% 15% 3% 18% 10% 2% 29%
Sterile compounding services for hazardous medications …
(n= ) (184) (41) (136) (7) (30) (38) (52) (43) (21)
… are primarily provided by the pharmacy department or organization
170 40 123 7 29 34 48 39 20
92% 98% 90% 97% 89% 92% 91% 95%
… are primarily provided by an external provider 2 0 2 0 0 0 1 1 0
1% 0% 1% 0% 0% 2% 2% 0%
… are not required for our patient population 12 1 11 0 1 4 3 3 1
7% 2% 8% 3% 11% 6% 7% 5% Base: All respondents Where the “n” value was less than 10, percentages were not calculated to avoid potentially misleading comparisons.
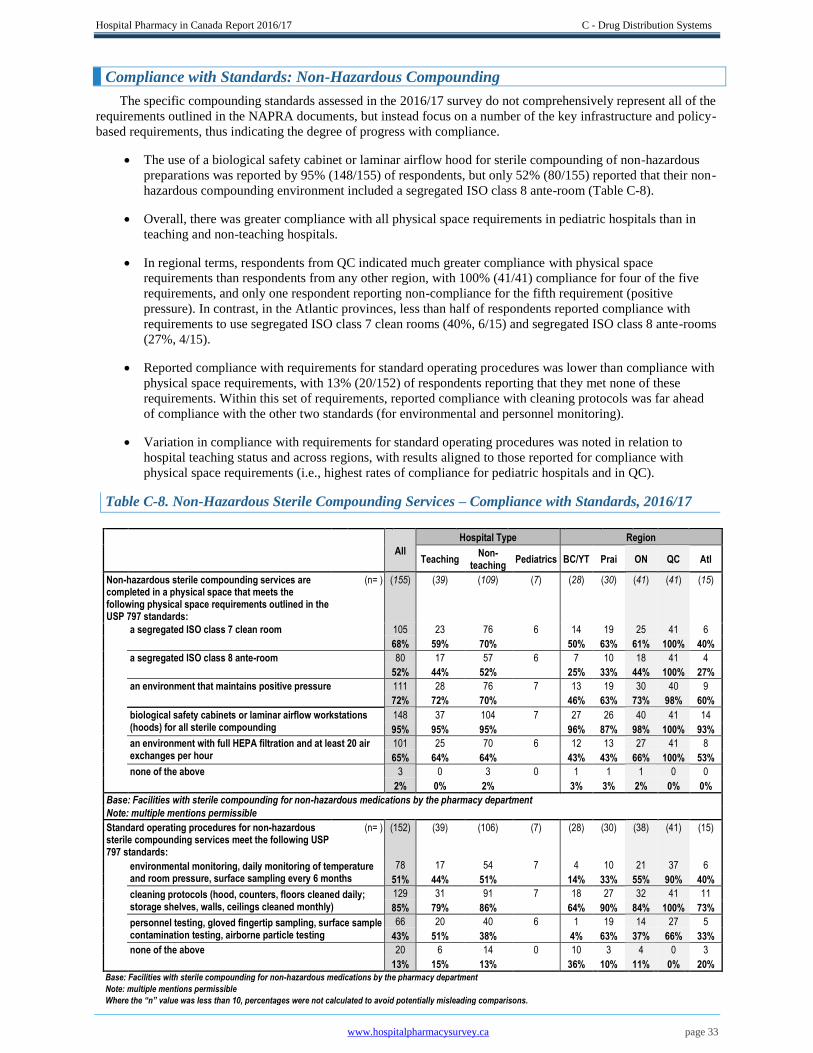
Hospital Pharmacy in Canada Report 2016/17 C - Drug Distribution Systems
www.hospitalpharmacysurvey.ca page 33
Compliance with Standards: Non-Hazardous Compounding
The specific compounding standards assessed in the 2016/17 survey do not comprehensively represent all of the
requirements outlined in the NAPRA documents, but instead focus on a number of the key infrastructure and policy-
based requirements, thus indicating the degree of progress with compliance.
The use of a biological safety cabinet or laminar airflow hood for sterile compounding of non-hazardous
preparations was reported by 95% (148/155) of respondents, but only 52% (80/155) reported that their non-
hazardous compounding environment included a segregated ISO class 8 ante-room (Table C-8).
Overall, there was greater compliance with all physical space requirements in pediatric hospitals than in
teaching and non-teaching hospitals.
In regional terms, respondents from QC indicated much greater compliance with physical space
requirements than respondents from any other region, with 100% (41/41) compliance for four of the five
requirements, and only one respondent reporting non-compliance for the fifth requirement (positive
pressure). In contrast, in the Atlantic provinces, less than half of respondents reported compliance with
requirements to use segregated ISO class 7 clean rooms (40%, 6/15) and segregated ISO class 8 ante-rooms
(27%, 4/15).
Reported compliance with requirements for standard operating procedures was lower than compliance with
physical space requirements, with 13% (20/152) of respondents reporting that they met none of these
requirements. Within this set of requirements, reported compliance with cleaning protocols was far ahead
of compliance with the other two standards (for environmental and personnel monitoring).
Variation in compliance with requirements for standard operating procedures was noted in relation to
hospital teaching status and across regions, with results aligned to those reported for compliance with
physical space requirements (i.e., highest rates of compliance for pediatric hospitals and in QC).
Table C-8. Non-Hazardous Sterile Compounding Services – Compliance with Standards, 2016/17
All
Hospital Type Region
Teaching
Non- teaching
Pediatrics BC/YT Prai ON QC Atl
Non-hazardous sterile compounding services are completed in a physical space that meets the following physical space requirements outlined in the USP 797 standards:
(n= ) (155) (39) (109) (7) (28) (30) (41) (41) (15)
a segregated ISO class 7 clean room 105 23 76 6 14 19 25 41 6
68% 59% 70% 50% 63% 61% 100% 40%
a segregated ISO class 8 ante-room 80 17 57 6 7 10 18 41 4
52% 44% 52% 25% 33% 44% 100% 27%
an environment that maintains positive pressure 111 28 76 7 13 19 30 40 9
72% 72% 70% 46% 63% 73% 98% 60%
biological safety cabinets or laminar airflow workstations (hoods) for all sterile compounding
148 37 104 7 27 26 40 41 14
95% 95% 95% 96% 87% 98% 100% 93%
an environment with full HEPA filtration and at least 20 air exchanges per hour
101 25 70 6 12 13 27 41 8
65% 64% 64% 43% 43% 66% 100% 53%
none of the above 3 0 3 0 1 1 1 0 0
2% 0% 2% 3% 3% 2% 0% 0%
Base: Facilities with sterile compounding for non-hazardous medications by the pharmacy department Note: multiple mentions permissible Standard operating procedures for non-hazardous
sterile compounding services meet the following USP 797 standards:
(n= ) (152) (39) (106) (7) (28) (30) (38) (41) (15)
environmental monitoring, daily monitoring of temperature and room pressure, surface sampling every 6 months
78 17 54 7 4 10 21 37 6
51% 44% 51% 14% 33% 55% 90% 40%
cleaning protocols (hood, counters, floors cleaned daily; storage shelves, walls, ceilings cleaned monthly)
129 31 91 7 18 27 32 41 11
85% 79% 86% 64% 90% 84% 100% 73%
personnel testing, gloved fingertip sampling, surface sample contamination testing, airborne particle testing
66 20 40 6 1 19 14 27 5
43% 51% 38% 4% 63% 37% 66% 33%
none of the above 20 6 14 0 10 3 4 0 3
13% 15% 13% 36% 10% 11% 0% 20% Base: Facilities with sterile compounding for non-hazardous medications by the pharmacy department
Note: multiple mentions permissible
Where the “n” value was less than 10, percentages were not calculated to avoid potentially misleading comparisons.
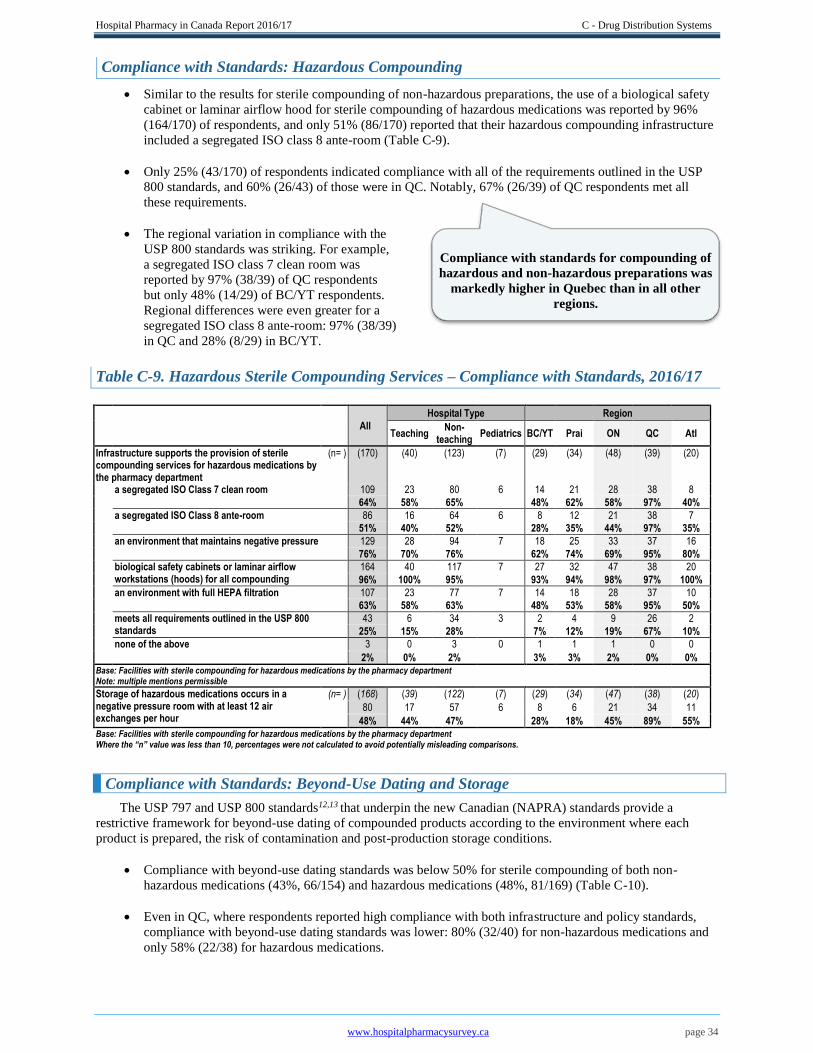
Hospital Pharmacy in Canada Report 2016/17 C - Drug Distribution Systems
www.hospitalpharmacysurvey.ca page 34
Compliance with Standards: Hazardous Compounding
Similar to the results for sterile compounding of non-hazardous preparations, the use of a biological safety
cabinet or laminar airflow hood for sterile compounding of hazardous medications was reported by 96%
(164/170) of respondents, and only 51% (86/170) reported that their hazardous compounding infrastructure
included a segregated ISO class 8 ante-room (Table C-9).
Only 25% (43/170) of respondents indicated compliance with all of the requirements outlined in the USP
800 standards, and 60% (26/43) of those were in QC. Notably, 67% (26/39) of QC respondents met all
these requirements.
The regional variation in compliance with the
USP 800 standards was striking. For example,
a segregated ISO class 7 clean room was
reported by 97% (38/39) of QC respondents
but only 48% (14/29) of BC/YT respondents.
Regional differences were even greater for a
segregated ISO class 8 ante-room: 97% (38/39)
in QC and 28% (8/29) in BC/YT.
Table C-9. Hazardous Sterile Compounding Services – Compliance with Standards, 2016/17
All
Hospital Type Region
Teaching
Non- teaching
Pediatrics BC/YT Prai ON QC Atl
Infrastructure supports the provision of sterile compounding services for hazardous medications by the pharmacy department
(n= ) (170) (40) (123) (7) (29) (34) (48) (39) (20)
a segregated ISO Class 7 clean room 109 23 80 6 14 21 28 38 8
64% 58% 65% 48% 62% 58% 97% 40%
a segregated ISO Class 8 ante-room 86 16 64 6 8 12 21 38 7
51% 40% 52% 28% 35% 44% 97% 35%
an environment that maintains negative pressure 129 28 94 7 18 25 33 37 16
76% 70% 76% 62% 74% 69% 95% 80%
biological safety cabinets or laminar airflow workstations (hoods) for all compounding
164 40 117 7 27 32 47 38 20
96% 100% 95% 93% 94% 98% 97% 100%
an environment with full HEPA filtration 107 23 77 7 14 18 28 37 10
63% 58% 63% 48% 53% 58% 95% 50%
meets all requirements outlined in the USP 800 standards
43 6 34 3 2 4 9 26 2
25% 15% 28% 7% 12% 19% 67% 10%
none of the above 3 0 3 0 1 1 1 0 0
2% 0% 2% 3% 3% 2% 0% 0% Base: Facilities with sterile compounding for hazardous medications by the pharmacy department
Note: multiple mentions permissible
Storage of hazardous medications occurs in a negative pressure room with at least 12 air exchanges per hour
(n= ) (168) (39) (122) (7) (29) (34) (47) (38) (20)
80 17 57 6 8 6 21 34 11
48% 44% 47% 28% 18% 45% 89% 55% Base: Facilities with sterile compounding for hazardous medications by the pharmacy department Where the “n” value was less than 10, percentages were not calculated to avoid potentially misleading comparisons.
Compliance with Standards: Beyond-Use Dating and Storage
The USP 797 and USP 800 standards12,13 that underpin the new Canadian (NAPRA) standards provide a
restrictive framework for beyond-use dating of compounded products according to the environment where each
product is prepared, the risk of contamination and post-production storage conditions.
Compliance with beyond-use dating standards was below 50% for sterile compounding of both non-
hazardous medications (43%, 66/154) and hazardous medications (48%, 81/169) (Table C-10).
Even in QC, where respondents reported high compliance with both infrastructure and policy standards,
compliance with beyond-use dating standards was lower: 80% (32/40) for non-hazardous medications and
only 58% (22/38) for hazardous medications.
Compliance with standards for compounding of
hazardous and non-hazardous preparations was
markedly higher in Quebec than in all other
regions.
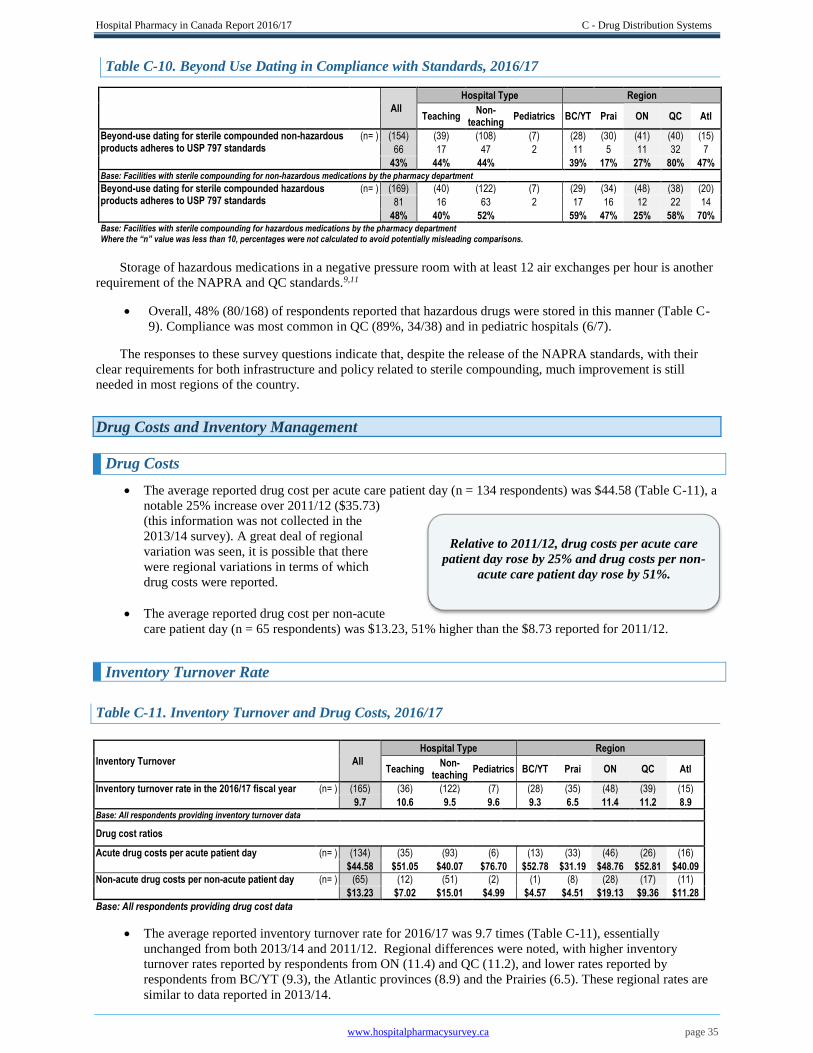
Hospital Pharmacy in Canada Report 2016/17 C - Drug Distribution Systems
www.hospitalpharmacysurvey.ca page 35
Relative to 2011/12, drug costs per acute care
patient day rose by 25% and drug costs per non-
acute care patient day rose by 51%.
Table C-10. Beyond Use Dating in Compliance with Standards, 2016/17
All
Hospital Type Region
Teaching
Non- teaching
Pediatrics BC/YT Prai ON QC Atl
Beyond-use dating for sterile compounded non-hazardous products adheres to USP 797 standards
(n= ) (154) (39) (108) (7) (28) (30) (41) (40) (15)
66 17 47 2 11 5 11 32 7
43% 44% 44% 39% 17% 27% 80% 47% Base: Facilities with sterile compounding for non-hazardous medications by the pharmacy department Beyond-use dating for sterile compounded hazardous products adheres to USP 797 standards
(n= ) (169) (40) (122) (7) (29) (34) (48) (38) (20)
81 16 63 2 17 16 12 22 14
48% 40% 52% 59% 47% 25% 58% 70% Base: Facilities with sterile compounding for hazardous medications by the pharmacy department
Where the “n” value was less than 10, percentages were not calculated to avoid potentially misleading comparisons.
Storage of hazardous medications in a negative pressure room with at least 12 air exchanges per hour is another
requirement of the NAPRA and QC standards.9,11
Overall, 48% (80/168) of respondents reported that hazardous drugs were stored in this manner (Table C-
9). Compliance was most common in QC (89%, 34/38) and in pediatric hospitals (6/7).
The responses to these survey questions indicate that, despite the release of the NAPRA standards, with their
clear requirements for both infrastructure and policy related to sterile compounding, much improvement is still
needed in most regions of the country.
Drug Costs and Inventory Management
Drug Costs
The average reported drug cost per acute care patient day (n = 134 respondents) was $44.58 (Table C-11), a
notable 25% increase over 2011/12 ($35.73)
(this information was not collected in the
2013/14 survey). A great deal of regional
variation was seen, it is possible that there
were regional variations in terms of which
drug costs were reported.
The average reported drug cost per non-acute
care patient day (n = 65 respondents) was $13.23, 51% higher than the $8.73 reported for 2011/12.
Inventory Turnover Rate
Table C-11. Inventory Turnover and Drug Costs, 2016/17
Inventory Turnover All
Hospital Type Region
Teaching Non-
teaching Pediatrics BC/YT Prai ON QC Atl
Inventory turnover rate in the 2016/17 fiscal year (n= ) (165) (36) (122) (7) (28) (35) (48) (39) (15)
9.7 10.6 9.5 9.6 9.3 6.5 11.4 11.2 8.9 Base: All respondents providing inventory turnover data
Drug cost ratios
Acute drug costs per acute patient day (n= ) (134) (35) (93) (6) (13) (33) (46) (26) (16)
$44.58 $51.05 $40.07 $76.70 $52.78 $31.19 $48.76 $52.81 $40.09
Non-acute drug costs per non-acute patient day (n= ) (65) (12) (51) (2) (1) (8) (28) (17) (11)
$13.23 $7.02 $15.01 $4.99 $4.57 $4.51 $19.13 $9.36 $11.28
Base: All respondents providing drug cost data
The average reported inventory turnover rate for 2016/17 was 9.7 times (Table C-11), essentially
unchanged from both 2013/14 and 2011/12. Regional differences were noted, with higher inventory
turnover rates reported by respondents from ON (11.4) and QC (11.2), and lower rates reported by
respondents from BC/YT (9.3), the Atlantic provinces (8.9) and the Prairies (6.5). These regional rates are
similar to data reported in 2013/14.
Hospital Pharmacy in Canada Report 2016/17 C - Drug Distribution Systems
www.hospitalpharmacysurvey.ca page 36
1 Medication management standards. Ottawa (ON): Accreditation Canada; 2017.
2 Pedersen CA, Schneider PJ, Scheckelhoff DJ. ASHP national survey of pharmacy practice in hospital settings: prescribing and
transcribing—2013. Am J Health Syst Pharm. 2014;71(11):924-42.
3 Jodoin J, Lantin S, Bussières JF, Bouchard S, Cohen E, Lussier-Labelle F et coll. Les systèmes automatisés et robotisés
utilisés pour la distribution des médicaments dans les établissements de santé au Québec. Rapport et recommandations du groupe
de travail. MSSS. ISBN 2-550-45497-9 Avril 2005 - Diffusé en octobre 2005. [en ligne]
http://publications.msss.gouv.qc.ca/msss/document-001234/ (cited 2018 Feb 5)
4 Pedersen CA, Schneider PJ, Scheckelhoff DJ. ASHP national survey of pharmacy practice in hospital settings: dispensing and
administration—2011. Am J Health Syst Pharm. 2012;69(9):768-85.
5 Pedersen CA, Schneider PJ, Scheckelhoff DJ. ASHP national survey of pharmacy practice in hospital settings: prescribing and
transcribing—2016 Am J Health-Syst Pharm. 2017;74(17):1336-52.
6 Joint Commission on the Accreditation of Healthcare Organizations. Standard MM.4.10. In: 2005 JCAHO comprehensive
accreditation manual for hospitals: the official handbook. Oak Brook (IL): Joint Commission Resources; 2005:14-5.
7 Multistate outbreak of fungal meningitis and other infections — healthcare facilities. Atlanta (GA): Centers for Disease Control
and Prevention; 2013 Oct 23 [cited 2017 Dec 15]. Available from: http://www.cdc.gov/hai/outbreaks/meningitis-facilities-
map.html
8 Thiessen JJ. A review of the oncology under-dosing incident. A report to the Ontario Minister of Health and Long-Term Care.
Toronto (ON): Ministry of Health and Long-Term Care; 2013 Jul 12.
9 Model standards for pharmacy compounding of hazardous sterile preparations. Ottawa (ON): National Association of Pharmacy
Regulatory Authorities; 2016 Nov [cited 2017 Dec 13]. Available from: http://napra.ca/sites/default/files/2017-
09/Mdl_Stnds_Pharmacy_Compounding_Hazardous_Sterile_Preparations_Nov2016_Revised_b.pdf
10 Model standards for pharmacy compounding of non-hazardous sterile preparations. Ottawa (ON): National Association of
Pharmacy Regulatory Authorities; 2016 Nov [cited 2017 Dec 13]. Available from: http://napra.ca/sites/default/files/2017-
09/Mdl_Stnds_Pharmacy_Compounding_NonHazardous_Sterile_Preparations_Nov2016_Revised_b.pdf
11 Préparation de produits stériles dangereux en pharmacie – Norme 2014.02. Montréal (QC): Ordre des pharmaciens du Québec;
2014 Feb.
12 General chapter<797>: pharmaceutical compounding — sterile preparations. In: United States Pharmacopeia 36. Rockville
(MD): United States Pharmacopeial Convention; 2013.
13 General chapter <800>: hazardous drugs – handling in health care settings. In: United States Pharmacopeia 40-NF 35.
Rockville (MD): United States Pharmacopeial Convention; 2017.
Hospital Pharmacy in Canada Report 2016/17 D - Human Resources
www.hospitalpharmacysurvey.ca page 37
D - Human Resources
André Bonnici
The relationship between staffing levels in hospital pharmacies and patient safety and health outcomes has been
well documented.1,2,3,4 However, attaining and maintaining the desired levels of pharmacy staffing in North
American hospitals, especially Canadian hospitals, has been a challenge in past decades, mainly because of
shortages of qualified personnel and financial constraints in healthcare organizations. Furthermore, with many novel
medication therapies arriving on the marketplace and the ever-increasing complexity of pharmacotherapy regimens
for the aging patient population in hospitals, the demand for pharmaceutical expertise has also been on the rise.
The American Society of Health-System Pharmacists (ASHP)5 has taken the following positions on appropriate
staffing levels:
o To advocate that pharmacists at each practice site base the site’s pharmacist and technician
staffing levels on patient safety considerations, taking into account factors such as (1) acuity of
care, (2) breadth of services, (3) historical safety data, and (4) results of research on the
relationship between staffing patterns and patient safety; further,
o To advocate that regulatory bodies not mandate specific, uniform pharmacy personnel ratios but
rather ensure that site-specific staffing levels optimize patient safety; further,
o To encourage additional research on the relationship between pharmacy staffing patterns and
patient safety.
In recent years, shortages of hospital pharmacists appear to be resolving in both the United States and Canada,
according to surveys about vacant positions.6 However, these data should be interpreted with care, keeping in mind
that hospitals may not post vacant positions or may not have funding for additional needed positions. Hence, a low
vacancy rate does not necessarily mean that the number of institutional pharmacists is adequate to provide safe and
effective pharmaceutical care and services.
In the 2013/14 report, the reported vacancy rates for pharmacist positions appeared to indicate that staffing
shortages in Canadian hospital pharmacies were finally under control. The overall increase in the availability of
pharmacists in Canada combined with the adoption of legislation to regulate pharmacy technicians in most
provinces would seem to support an increase in the proportion of time that pharmacists spend on clinical activities
relative to drug distribution activities. Pharmacy technician vacancies were also relatively low in 2013/14, despite
fears that regulation might create a temporary shortage. We therefore hoped that the 2016/17 survey would show a
continuation of these trends.
Data from the Canadian Institute for Health Information (CIHI) indicate that the number of pharmacists in
hospital pharmacy positions did indeed continue to increase in most provinces in 2016, although at a slower rate
than in previous years.7 According to CIHI, the number of new graduates from pharmacy programs in Canadian
universities also continued to rise in 2016. The number of regulated pharmacy technicians in Canada in 2016 was
estimated at 6,601.8 In the United States, the ASHP has reported that vacancy rates for both pharmacists and
technicians stabilized and remained low between 2010 and 2016.6
Human Resource Shortages – Pharmacists
Care is needed in interpreting vacancy rates, as they represent only existing positions that are currently vacant.
They do not take into account positions that are occupied but for which the incumbent pharmacists are on leave
(maternity leave or other types of leave) and have not been replaced. Furthermore, low vacancy rates do not
necessarily indicate that all patient needs for pharmaceutical care are being met; they may simply reflect insufficient
funding to create needed pharmacist positions.
As of March 31, 2017, the average reported vacancy rate for hospital pharmacists (staff pharmacists and
advanced practice pharmacists) was 4.8% (Table D-1). This is slightly lower than the vacancy rate reported
for 2013/14 (5.1%) and markedly lower than rates reported for 2011/12 (8.1%) and 2009/10 (8.2%).
However, Canada’s current vacancy rate is higher than the 2.8% rate reported for the United States in a
2016 survey.6

Hospital Pharmacy in Canada Report 2016/17 D - Human Resources
www.hospitalpharmacysurvey.ca page 38
The reported number of pharmacist vacancies was higher in 2016/17 than in 2013/14 (171.5 vs. 154). The
average number of vacant pharmacist positions per hospital/facility was slightly lower in 2016/17, at 0.96
(171 vacancies reported by 179 respondents), than in previous years: 0.99 in 2013/14 (154 vacancies
reported by 156 respondents), 1.5 in 2011/12 (237 vacancies reported by 160 respondents) and 1.5 in
2009/10 (235 vacancies reported by 159 respondents).
For 2016/17, pediatric hospitals had a higher pharmacist vacancy rate than did teaching hospitals and non-
teaching hospitals (9.6% vs. 5.0% and 4.4%, respectively).
On a regional basis, British Columbia/Yukon (BC/YT) had the highest pharmacist vacancy rate (10.9%),
followed by Saskatchewan (SK; 7.3%) and Quebec (QC; 6.1%). For BC/YT and SK, these data represent
increases relative to 2013/14, when
pharmacist vacancies were 6.8% and
3.5%, respectively. For QC, the current
data represent a slight improvement over
2013/14, when the rate was 7.4%. The
increase in pharmacist vacancies in BC
may be attributable, in part, to the
increasing cost of living in that province
in recent years, a period when hospital pharmacists’ salaries have remained lower than the Canadian
average. Also, certain pharmacist positions in BC are restricted to those who have completed a post-
graduate year 1 (PGY1) pharmacy residency, according to the terms of the provincial labour contract.
Overall, 35% (55/155) of respondents reported vacant staff pharmacist positions, whereas 30% (28/93)
reported vacant advanced practice pharmacist positions.
Human Resource Shortages – Pharmacy Technicians
In previous Hospital Pharmacy in Canada Reports, we postulated that the regulation of pharmacy technicians
might create a temporary reduction in the availability of this type of personnel if a substantial number of pharmacy
assistants failed to qualify for licensure. However, despite a rise in the number of vacant pharmacy technician
positions, there has been no increase in the vacancy rate. We nonetheless urge caution in drawing any conclusions
from the current data: it is possible that the transition from non-regulated to regulated pharmacy technician
positions has been accomplished in many hospitals by displacement or attrition. Note: Where the term “pharmacy
technician” is used below, it refers to both regulated and non-regulated pharmacy technicians, unless specified
otherwise.
In 2016/17, the vacancy rate for pharmacy technicians was 3.1%, lower than the 3.5% reported for 2013/14
and slightly higher than the 2.3% reported for 2011/12 and the 1.5% reported for 2009/10. (Notably, before
2013/14, vacancies for pharmacy assistants were combined with vacancies for pharmacy technicians, which
had the result of lower calculated combined vacancy rates.) The current Canadian vacancy rate is also
lower than the 4.9% reported for the United States in 2016.6
The reported number of vacancies for pharmacy technicians (regulated and non-regulated) was higher in
2016/17 than in 2013/14 (142.6 vs. 105). The average number of vacant positions per hospital/facility was
also higher in 2016/17 than in 2013/14 (0.82, 142.6 vacancies reported by 173 facilities, vs. 0.74, 105
vacancies in 141 facilities).
Pediatric hospitals had a higher vacancy rate
for pharmacy technicians in 2016/17 than did
teaching and non-teaching hospitals (5.6%,
10/178, vs. 3.6%, 68.2/1870, and 2.5%,
64.4/2567, respectively).
On a regional basis, the vacancy rate for pharmacy technicians was highest in BC/YT, at 5.9% (37.6/636), a
notable increase over 2013/14 (1%). Like the increasing vacancy rate for pharmacists in that province, the
rising vacancy rate for technicians may be due in part to the increasing cost of living in BC.
The percentage of respondents reporting vacant positions for regulated pharmacy technicians was 39%
(44/113), similar to the reporting of vacant positions for pharmacists.
There was no evidence of pharmacy technician or
pharmacy assistant shortages, except in BC/YT and
in pediatric hospitals.
The average vacancy rate for pharmacists in
Canada has remained relatively low and stable;
however, some regions, including BC/YT and SK,
have seen their vacancy rates rise.
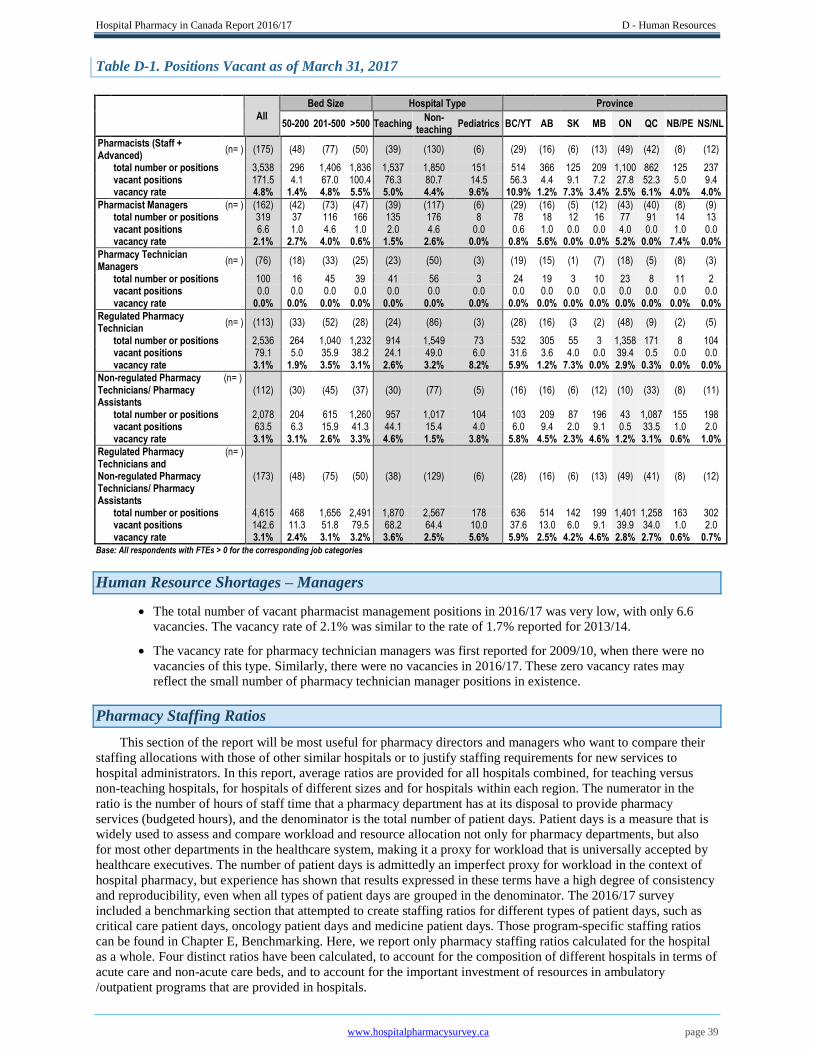
Hospital Pharmacy in Canada Report 2016/17 D - Human Resources
www.hospitalpharmacysurvey.ca page 39
Table D-1. Positions Vacant as of March 31, 2017
All
Bed Size Hospital Type Province
50-200 201-500 >500 Teaching Non-
teaching Pediatrics BC/YT AB SK MB ON QC NB/PE NS/NL
Pharmacists (Staff + Advanced)
(n= ) (175) (48) (77) (50) (39) (130) (6) (29) (16) (6) (13) (49) (42) (8) (12)
total number or positions 3,538 296 1,406 1,836 1,537 1,850 151 514 366 125 209 1,100 862 125 237 vacant positions 171.5 4.1 67.0 100.4 76.3 80.7 14.5 56.3 4.4 9.1 7.2 27.8 52.3 5.0 9.4 vacancy rate 4.8% 1.4% 4.8% 5.5% 5.0% 4.4% 9.6% 10.9% 1.2% 7.3% 3.4% 2.5% 6.1% 4.0% 4.0%
Pharmacist Managers (n= ) (162) (42) (73) (47) (39) (117) (6) (29) (16) (5) (12) (43) (40) (8) (9) total number or positions 319 37 116 166 135 176 8 78 18 12 16 77 91 14 13 vacant positions 6.6 1.0 4.6 1.0 2.0 4.6 0.0 0.6 1.0 0.0 0.0 4.0 0.0 1.0 0.0 vacancy rate 2.1% 2.7% 4.0% 0.6% 1.5% 2.6% 0.0% 0.8% 5.6% 0.0% 0.0% 5.2% 0.0% 7.4% 0.0%
Pharmacy Technician Managers
(n= ) (76) (18) (33) (25) (23) (50) (3) (19) (15) (1) (7) (18) (5) (8) (3)
total number or positions 100 16 45 39 41 56 3 24 19 3 10 23 8 11 2 vacant positions 0.0 0.0 0.0 0.0 0.0 0.0 0.0 0.0 0.0 0.0 0.0 0.0 0.0 0.0 0.0 vacancy rate 0.0% 0.0% 0.0% 0.0% 0.0% 0.0% 0.0% 0.0% 0.0% 0.0% 0.0% 0.0% 0.0% 0.0% 0.0%
Regulated Pharmacy Technician
(n= ) (113) (33) (52) (28) (24) (86) (3) (28) (16) (3 (2) (48) (9) (2) (5)
total number or positions 2,536 264 1,040 1,232 914 1,549 73 532 305 55 3 1,358 171 8 104 vacant positions 79.1 5.0 35.9 38.2 24.1 49.0 6.0 31.6 3.6 4.0 0.0 39.4 0.5 0.0 0.0 vacancy rate 3.1% 1.9% 3.5% 3.1% 2.6% 3.2% 8.2% 5.9% 1.2% 7.3% 0.0% 2.9% 0.3% 0.0% 0.0%
Non-regulated Pharmacy Technicians/ Pharmacy Assistants
(n= ) (112) (30) (45) (37) (30) (77) (5) (16) (16) (6) (12) (10) (33) (8) (11)
total number or positions 2,078 204 615 1,260 957 1,017 104 103 209 87 196 43 1,087 155 198 vacant positions 63.5 6.3 15.9 41.3 44.1 15.4 4.0 6.0 9.4 2.0 9.1 0.5 33.5 1.0 2.0 vacancy rate 3.1% 3.1% 2.6% 3.3% 4.6% 1.5% 3.8% 5.8% 4.5% 2.3% 4.6% 1.2% 3.1% 0.6% 1.0%
Regulated Pharmacy Technicians and Non-regulated Pharmacy Technicians/ Pharmacy Assistants
(n= )
(173) (48) (75) (50) (38) (129) (6) (28) (16) (6) (13) (49) (41) (8) (12)
total number or positions 4,615 468 1,656 2,491 1,870 2,567 178 636 514 142 199 1,401 1,258 163 302 vacant positions 142.6 11.3 51.8 79.5 68.2 64.4 10.0 37.6 13.0 6.0 9.1 39.9 34.0 1.0 2.0 vacancy rate 3.1% 2.4% 3.1% 3.2% 3.6% 2.5% 5.6% 5.9% 2.5% 4.2% 4.6% 2.8% 2.7% 0.6% 0.7% Base: All respondents with FTEs > 0 for the corresponding job categories
Human Resource Shortages – Managers
The total number of vacant pharmacist management positions in 2016/17 was very low, with only 6.6
vacancies. The vacancy rate of 2.1% was similar to the rate of 1.7% reported for 2013/14.
The vacancy rate for pharmacy technician managers was first reported for 2009/10, when there were no
vacancies of this type. Similarly, there were no vacancies in 2016/17. These zero vacancy rates may
reflect the small number of pharmacy technician manager positions in existence.
Pharmacy Staffing Ratios
This section of the report will be most useful for pharmacy directors and managers who want to compare their
staffing allocations with those of other similar hospitals or to justify staffing requirements for new services to
hospital administrators. In this report, average ratios are provided for all hospitals combined, for teaching versus
non-teaching hospitals, for hospitals of different sizes and for hospitals within each region. The numerator in the
ratio is the number of hours of staff time that a pharmacy department has at its disposal to provide pharmacy
services (budgeted hours), and the denominator is the total number of patient days. Patient days is a measure that is
widely used to assess and compare workload and resource allocation not only for pharmacy departments, but also
for most other departments in the healthcare system, making it a proxy for workload that is universally accepted by
healthcare executives. The number of patient days is admittedly an imperfect proxy for workload in the context of
hospital pharmacy, but experience has shown that results expressed in these terms have a high degree of consistency
and reproducibility, even when all types of patient days are grouped in the denominator. The 2016/17 survey
included a benchmarking section that attempted to create staffing ratios for different types of patient days, such as
critical care patient days, oncology patient days and medicine patient days. Those program-specific staffing ratios
can be found in Chapter E, Benchmarking. Here, we report only pharmacy staffing ratios calculated for the hospital
as a whole. Four distinct ratios have been calculated, to account for the composition of different hospitals in terms of
acute care and non-acute care beds, and to account for the important investment of resources in ambulatory
/outpatient programs that are provided in hospitals.
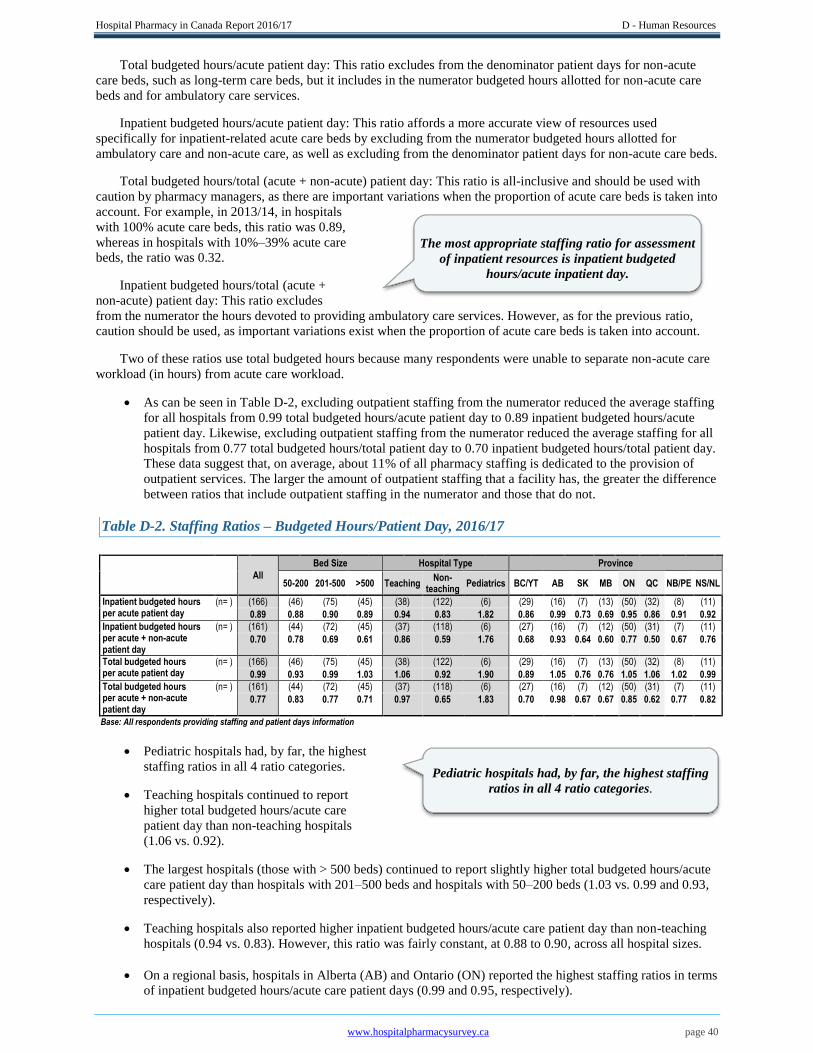
Hospital Pharmacy in Canada Report 2016/17 D - Human Resources
www.hospitalpharmacysurvey.ca page 40
Total budgeted hours/acute patient day: This ratio excludes from the denominator patient days for non-acute
care beds, such as long-term care beds, but it includes in the numerator budgeted hours allotted for non-acute care
beds and for ambulatory care services.
Inpatient budgeted hours/acute patient day: This ratio affords a more accurate view of resources used
specifically for inpatient-related acute care beds by excluding from the numerator budgeted hours allotted for
ambulatory care and non-acute care, as well as excluding from the denominator patient days for non-acute care beds.
Total budgeted hours/total (acute + non-acute) patient day: This ratio is all-inclusive and should be used with
caution by pharmacy managers, as there are important variations when the proportion of acute care beds is taken into
account. For example, in 2013/14, in hospitals
with 100% acute care beds, this ratio was 0.89,
whereas in hospitals with 10%–39% acute care
beds, the ratio was 0.32. Inpatient budgeted hours/total (acute +
non-acute) patient day: This ratio excludes
from the numerator the hours devoted to providing ambulatory care services. However, as for the previous ratio,
caution should be used, as important variations exist when the proportion of acute care beds is taken into account.
Two of these ratios use total budgeted hours because many respondents were unable to separate non-acute care
workload (in hours) from acute care workload.
As can be seen in Table D-2, excluding outpatient staffing from the numerator reduced the average staffing
for all hospitals from 0.99 total budgeted hours/acute patient day to 0.89 inpatient budgeted hours/acute
patient day. Likewise, excluding outpatient staffing from the numerator reduced the average staffing for all
hospitals from 0.77 total budgeted hours/total patient day to 0.70 inpatient budgeted hours/total patient day.
These data suggest that, on average, about 11% of all pharmacy staffing is dedicated to the provision of
outpatient services. The larger the amount of outpatient staffing that a facility has, the greater the difference
between ratios that include outpatient staffing in the numerator and those that do not.
Table D-2. Staffing Ratios – Budgeted Hours/Patient Day, 2016/17
All
Bed Size Hospital Type Province
50-200 201-500 >500 Teaching Non-
teaching Pediatrics BC/YT AB SK MB ON QC NB/PE NS/NL
Inpatient budgeted hours per acute patient day
(n= ) (166) (46) (75) (45) (38) (122) (6) (29) (16) (7) (13) (50) (32) (8) (11)
0.89 0.88 0.90 0.89 0.94 0.83 1.82 0.86 0.99 0.73 0.69 0.95 0.86 0.91 0.92
Inpatient budgeted hours per acute + non-acute patient day
(n= ) (161) (44) (72) (45) (37) (118) (6) (27) (16) (7) (12) (50) (31) (7) (11)
0.70 0.78 0.69 0.61 0.86 0.59 1.76 0.68 0.93 0.64 0.60 0.77 0.50 0.67 0.76
Total budgeted hours per acute patient day
(n= ) (166) (46) (75) (45) (38) (122) (6) (29) (16) (7) (13) (50) (32) (8) (11)
0.99 0.93 0.99 1.03 1.06 0.92 1.90 0.89 1.05 0.76 0.76 1.05 1.06 1.02 0.99
Total budgeted hours per acute + non-acute patient day
(n= ) (161) (44) (72) (45) (37) (118) (6) (27) (16) (7) (12) (50) (31) (7) (11)
0.77 0.83 0.77 0.71 0.97 0.65 1.83 0.70 0.98 0.67 0.67 0.85 0.62 0.77 0.82
Base: All respondents providing staffing and patient days information
Pediatric hospitals had, by far, the highest
staffing ratios in all 4 ratio categories.
Teaching hospitals continued to report
higher total budgeted hours/acute care
patient day than non-teaching hospitals
(1.06 vs. 0.92).
The largest hospitals (those with > 500 beds) continued to report slightly higher total budgeted hours/acute
care patient day than hospitals with 201–500 beds and hospitals with 50–200 beds (1.03 vs. 0.99 and 0.93,
respectively).
Teaching hospitals also reported higher inpatient budgeted hours/acute care patient day than non-teaching
hospitals (0.94 vs. 0.83). However, this ratio was fairly constant, at 0.88 to 0.90, across all hospital sizes.
On a regional basis, hospitals in Alberta (AB) and Ontario (ON) reported the highest staffing ratios in terms
of inpatient budgeted hours/acute care patient days (0.99 and 0.95, respectively).
The most appropriate staffing ratio for assessment
of inpatient resources is inpatient budgeted
hours/acute inpatient day.
Pediatric hospitals had, by far, the highest staffing
ratios in all 4 ratio categories.

Hospital Pharmacy in Canada Report 2016/17 D - Human Resources
www.hospitalpharmacysurvey.ca page 41
Hospitals in QC had the lowest staffing ratios when total patient days was used as the denominator. This
finding would imply that QC hospitals have a high number of non-acute patient days, and indeed, Chapter
A, Demographics, shows that QC had a disproportionate number of non-acute care beds relative to its acute
care beds (17,889 vs. 14,188).
Overall, most staffing ratios have increased since 2007/08, indicating steady growth in pharmacy services
in Canadian hospitals over the past decade (Table D-3).
Table D-3. Staffing Ratios – Trends from 2007/08 to 2016/17
Ratio 2016/17 2013/14 2011/12 2009/10 2007/08
Inpatient budgeted hours per acute inpatient day
(n= ) (166) (154) (155)
0.89 0.89 0.84
Inpatient budgeted hours per acute + non-acute inpatient day
(n= ) (161) (147) (150) (149)
0.69 0.65 0.63 0.62
Total budgeted hours per acute inpatient day
(n= ) (166) (154) (155) (154) (144)
0.99 0.98 0.91 0.87 0.85
Total budgeted hours per acute + non-acute inpatient day
(n= ) (161) (147) (150) (149) (139)
0.77 0.71 0.68 0.68 0.63 Base: All respondents providing staffing and patient days information Note: Data are for total number of hospitals (including pediatrics)
Staff Composition of the Typical Hospital Pharmacy Department
To allow pharmacy directors to compare the staff composition of their respective departments with that of other
comparable hospitals, this report includes data on the different types of staff that facilities employ, specifically,
managers, staff pharmacists, pharmacy technicians, support staff and pharmacy residents. This information will be
useful for examining characteristics such as pharmacy technician/pharmacist ratios and for comparing staff
composition among different regions, between teaching and non-teaching hospitals, and among hospitals of different
sizes.
Respondents reported an average of 14.3 full-time equivalent (FTE) staff pharmacists and an average of 5.5
FTE advanced practice pharmacists (Table D-4). The only region with a higher ratio of advanced practice
pharmacists to staff pharmacists was QC, as a result of the MSc advanced pharmacotherapy program that is
offered at both pharmacy faculties in that province.
Table D-4. Average Budgeted Pharmacy Staffing (FTEs), 2016/17
All Bed Size Hospital Type Province
50-200 201-500 >500 Teaching Non-
teaching Pediatrics BC/YT AB SK MB ON QC NB/PE NS/NL
(n= ) (179) (49) (80) (50) (39) (134) (6) (30) (16) (7) (13) (51) (42) (8) (12)
Staff Pharmacists 14.3 5.4 13.3 24.7 27.2 10.5 14.3 11.5 22.4 17.1 15.4 19.9 5.1 13.7 17.1 Advanced Practice Pharmacists 5.5 0.7 4.3 12.0 12.2 3.3 10.8 5.7 0.5 0.8 0.7 1.7 15.5 1.8 2.7
Pharmacist Managers (who are pharmacists)
1.8 0.8 1.5 3.3 3.5 1.3 1.4 2.6 1.1 1.8 1.2 1.5 2.2 1.7 1.1
Pharmacy Managers (neither pharmacist or technician)
0.2 0.0 0.1 0.5 0.4 0.1 0.2 0.0 0.0 0.0 0.0 0.1 0.5 0.3 0.5
Pharmacy Technician Managers (who are technicians)
0.6 0.3 0.6 0.8 1.0 0.4 0.5 0.8 1.2 0.4 0.8 0.5 0.2 1.4 0.2
Regulated Pharmacy Technicians
14.2 5.4 13.0 24.6 23.4 11.6 12.2 17.7 19.1 7.9 0.2 26.6 4.1 1.0 8.6
Non-regulated Pharmacy Technicians/ Pharmacy Assistants
11.6 4.2 7.7 25.2 24.5 7.6 17.4 3.4 13.1 12.4 15.1 0.8 25.9 19.4 16.5
Support Personnel (clerical /porter /aide)
1.3 0.2 1.1 2.6 3.0 0.8 1.5 0.8 1.3 0.6 0.6 1.3 1.9 1.5 1.0
Residents 0.7 0.1 0.8 1.4 2.2 0.3 0.9 1.0 0.1 1.0 0.2 0.6 1.3 0.5 0.3
Total pharmacy staff (including residents)
50.1 17.0 42.3 95.1 97.5 35.9 59.1 43.6 58.6 41.9 34.2 53.0 56.5 41.2 48.0
Subtotals:
Pharmacists (Staff + Advanced) 19.8 6.0 17.6 36.7 39.4 13.8 25.1 17.1 22.9 17.9 16.1 21.6 20.5 15.6 19.7
Regulated Pharmacy Technicians and non-regulated Pharmacy Technicians/ Pharmacy Assistants
25.8 9.5 20.7 49.8 48.0 19.2 29.6 21.2 32.1 20.3 15.3 27.5 29.9 20.4 25.2
Base: All respondents providing staffing information

Hospital Pharmacy in Canada Report 2016/17 D - Human Resources
www.hospitalpharmacysurvey.ca page 42
Hospitals in AB, SK and Manitoba had the lowest average number of FTE advanced practice pharmacists.
The average pharmacy technician/pharmacist ratio for all respondents was 1.45 (Table D-5). When only
inpatient staff were included, the ratio was 1.54. The ratio for inpatient staff only was higher for non-
teaching hospitals than for teaching hospitals and pediatric hospitals (1.61 vs. 1.35 and 1.34, respectively).
The lower ratios for teaching and pediatric hospitals may be due to higher numbers of clinical pharmacists
and teaching/research pharmacists in these institutions, which would increase the total number of
pharmacists.
Table D-5. Ratio of Regulated Pharmacy Technicians + Non-regulated Pharmacy Technicians/
Assistants to Pharmacists, 2016/17
All Bed Size Hospital Type Province
50-200 201-500 >500 Teaching Non-
teaching Pediatrics BC/YT AB SK MB ON QC NB/PE NS/NL
Inpatient Technicians/Assistants to Inpatient Pharmacists (Staff + Advanced)
(n= ) (165) (40) (74) (45) (38) (121) (6) (29) (16) (6) (13) (50) (31) (8) (12)
1.54 1.67 1.43 1.59 1.35 1.61 1.34 1.47 1.64 1.41 1.19 1.56 1.62 1.56 1.72
Outpatient Technicians/Assistants to Outpatient Pharmacists (Staff + Advanced)
(n= ) (117) (20) (57) (40) (34) (78) (5) (15) (10) (4) (9) (35) (30) (7) (7)
0.90 1.67 0.77 0.71 0.66 1.04 0.49 0.19 0.76 0.12 0.43 1.44 1.08 0.60 0.52
Inpatient + Outpatient Technicians/ Assistants to Inpatient + Outpatient Pharmacists (Staff + Advanced)
(n= ) (165) (46) (74) (45) (38) (121) (6) (29) (16) (6) (13) (50) (31) 8) (12)
1.45 1.65 1.33 1.42 1.23 1.52 1.30 1.39 1.49 1.28 1.12 1.50 1.48 1.39 1.63
Base: All respondents providing staffing information
Staff composition remained similar to that documented in previous reports. However, the proportion of
advanced practice pharmacists has increased (from 9% in 2013/14 to 11% in 2016/17), as has the
proportion of regulated pharmacy
technicians (from 21% in 2013/14 to
28% in 2016/17) (Figure D-1).
Together, staff pharmacists and
advanced practice pharmacists
represented 40% of the pharmacy
workforce, similar to 39% in 2013/14.
Pharmacist management and technician
management positions together represented 5% of staffing in 2016/17, similar to 4% in 2013/14.
Pharmacy technician/assistant positions represented 51% of overall pharmacy staffing in 2016/17, similar
to 52% in 2013/14 and 51% in both 2011/12 and 2009/10.
Support personnel represented 3% of total pharmacy staffing in 2016/17, the same as in 2013/14.
Figure D-1. Staff Composition of the Typical Hospital Pharmacy Department, 2016/17
Base: All respondents who provided staffing data (179)
The composition of the typical pharmacy
department has been relatively stable over the past
several surveys, with increases in the proportions of
advanced practice pharmacists and regulated
pharmacy technicians.
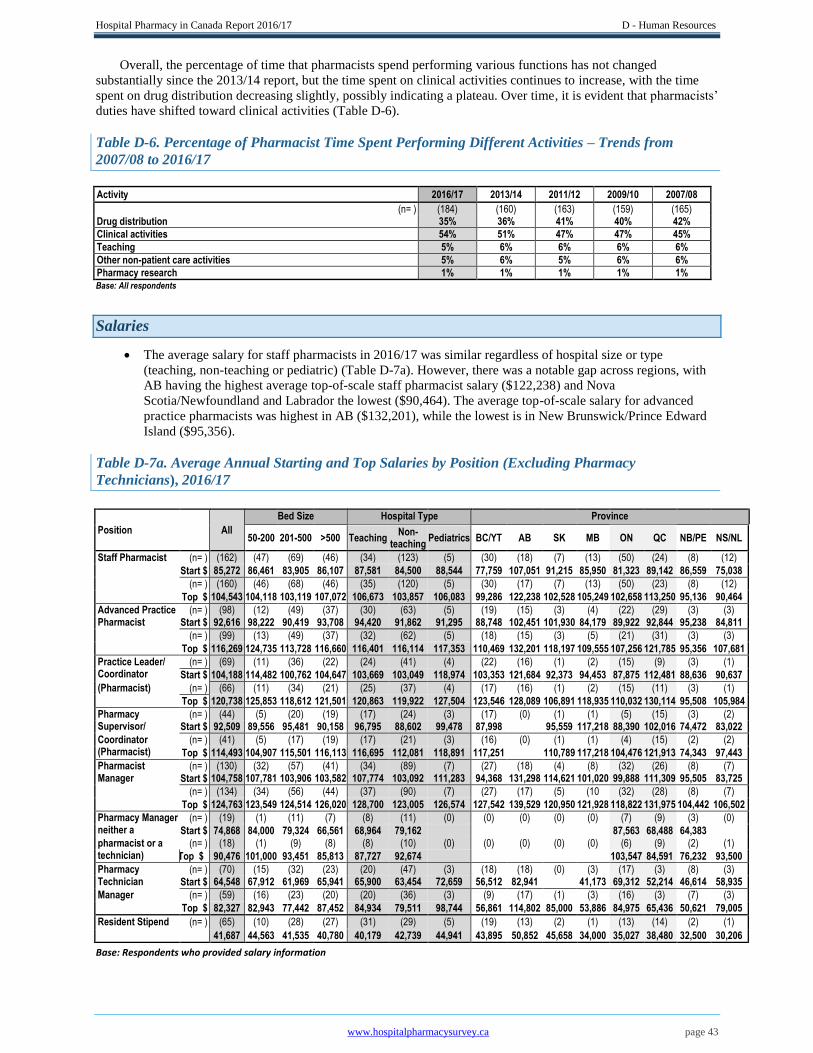
Hospital Pharmacy in Canada Report 2016/17 D - Human Resources
www.hospitalpharmacysurvey.ca page 43
Overall, the percentage of time that pharmacists spend performing various functions has not changed
substantially since the 2013/14 report, but the time spent on clinical activities continues to increase, with the time
spent on drug distribution decreasing slightly, possibly indicating a plateau. Over time, it is evident that pharmacists’
duties have shifted toward clinical activities (Table D-6).
Table D-6. Percentage of Pharmacist Time Spent Performing Different Activities – Trends from
2007/08 to 2016/17
Activity 2016/17 2013/14 2011/12 2009/10 2007/08
(n= ) (184) (160) (163) (159) (165) Drug distribution 35% 36% 41% 40% 42%
Clinical activities 54% 51% 47% 47% 45%
Teaching 5% 6% 6% 6% 6%
Other non-patient care activities 5% 6% 5% 6% 6%
Pharmacy research 1% 1% 1% 1% 1% Base: All respondents
Salaries
The average salary for staff pharmacists in 2016/17 was similar regardless of hospital size or type
(teaching, non-teaching or pediatric) (Table D-7a). However, there was a notable gap across regions, with
AB having the highest average top-of-scale staff pharmacist salary ($122,238) and Nova
Scotia/Newfoundland and Labrador the lowest ($90,464). The average top-of-scale salary for advanced
practice pharmacists was highest in AB ($132,201), while the lowest is in New Brunswick/Prince Edward
Island ($95,356).
Table D-7a. Average Annual Starting and Top Salaries by Position (Excluding Pharmacy
Technicians), 2016/17
Position
All
Bed Size Hospital Type Province
50-200 201-500 >500 Teaching
Non- teaching
Pediatrics BC/YT AB SK MB ON QC NB/PE NS/NL
Staff Pharmacist (n= ) (162) (47) (69) (46) (34) (123) (5) (30) (18) (7) (13) (50) (24) (8) (12)
Start $ 85,272 86,461 83,905 86,107 87,581 84,500 88,544 77,759 107,051 91,215 85,950 81,323 89,142 86,559 75,038
(n= ) (160) (46) (68) (46) (35) (120) (5) (30) (17) (7) (13) (50) (23) (8) (12)
Top $ 104,543 104,118 103,119 107,072 106,673 103,857 106,083 99,286 122,238 102,528 105,249 102,658 113,250 95,136 90,464
Advanced Practice Pharmacist
(n= ) (98) (12) (49) (37) (30) (63) (5) (19) (15) (3) (4) (22) (29) (3) (3) Start $ 92,616 98,222 90,419 93,708 94,420 91,862 91,295 88,748 102,451 101,930 84,179 89,922 92,844 95,238 84,811
(n= ) (99) (13) (49) (37) (32) (62) (5) (18) (15) (3) (5) (21) (31) (3) (3)
Top $ 116,269 124,735 113,728 116,660 116,401 116,114 117,353 110,469 132,201 118,197 109,555 107,256 121,785 95,356 107,681
Practice Leader/ Coordinator
(n= ) (69) (11) (36) (22) (24) (41) (4) (22) (16) (1) (2) (15) (9) (3) (1)
Start $ 104,188 114,482 100,762 104,647 103,669 103,049 118,974 103,353 121,684 92,373 94,453 87,875 112,481 88,636 90,637
(Pharmacist) (n= ) (66) (11) (34) (21) (25) (37) (4) (17) (16) (1) (2) (15) (11) (3) (1)
Top $ 120,738 125,853 118,612 121,501 120,863 119,922 127,504 123,546 128,089 106,891 118,935 110,032 130,114 95,508 105,984
Pharmacy Supervisor/
(n= ) (44) (5) (20) (19) (17) (24) (3) (17) (0) (1) (1) (5) (15) (3) (2) Start $ 92,509 89,556 95,481 90,158 96,795 88,602 99,478 87,998 95,559 117,218 88,390 102,016 74,472 83,022
Coordinator (Pharmacist)
(n= ) (41) (5) (17) (19) (17) (21) (3) (16) (0) (1) (1) (4) (15) (2) (2)
Top $ 114,493 104,907 115,501 116,113 116,695 112,081 118,891 117,251 110,789 117,218 104,476 121,913 74,343 97,443
Pharmacist Manager
(n= ) (130) (32) (57) (41) (34) (89) (7) (27) (18) (4) (8) (32) (26) (8) (7)
Start $ 104,758 107,781 103,906 103,582 107,774 103,092 111,283 94,368 131,298 114,621 101,020 99,888 111,309 95,505 83,725
(n= ) (134) (34) (56) (44) (37) (90) (7) (27) (17) (5) (10 (32) (28) (8) (7)
Top $ 124,763 123,549 124,514 126,020 128,700 123,005 126,574 127,542 139,529 120,950 121,928 118,822 131,975 104,442 106,502
Pharmacy Manager neither a
(n= ) (19) (1) (11) (7) (8) (11) (0) (0) (0) (0) (0) (7) (9) (3) (0)
Start $ 74,868 84,000 79,324 66,561 68,964 79,162 87,563 68,488 64,383 pharmacist or a technician)
(n= ) (18) (1) (9) (8) (8) (10) (0) (0) (0) (0) (0) (6) (9) (2) (1)
Top $ 90,476 101,000 93,451 85,813 87,727 92,674 103,547 84,591 76,232 93,500
Pharmacy Technician
(n= ) (70) (15) (32) (23) (20) (47) (3) (18) (18) (0) (3) (17) (3) (8) (3)
Start $ 64,548 67,912 61,969 65,941 65,900 63,454 72,659 56,512 82,941 41,173 69,312 52,214 46,614 58,935
Manager (n= ) (59) (16) (23) (20) (20) (36) (3) (9) (17) (1) (3) (16) (3) (7) (3)
Top $ 82,327 82,943 77,442 87,452 84,934 79,511 98,744 56,861 114,802 85,000 53,886 84,975 65,436 50,621 79,005
Resident Stipend (n= ) (65) (10) (28) (27) (31) (29) (5) (19) (13) (2) (1) (13) (14) (2) (1)
41,687 44,563 41,535 40,780 40,179 42,739 44,941 43,895 50,852 45,658 34,000 35,027 38,480 32,500 30,206
Base: Respondents who provided salary information
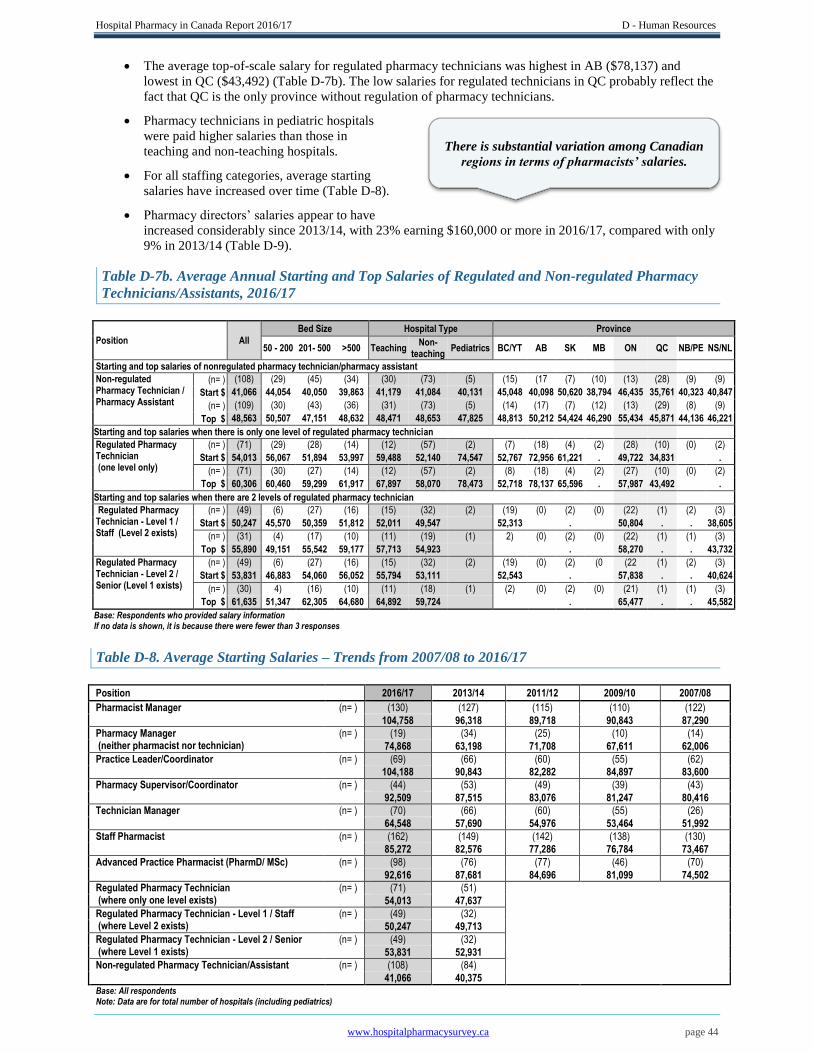
Hospital Pharmacy in Canada Report 2016/17 D - Human Resources
www.hospitalpharmacysurvey.ca page 44
The average top-of-scale salary for regulated pharmacy technicians was highest in AB ($78,137) and
lowest in QC ($43,492) (Table D-7b). The low salaries for regulated technicians in QC probably reflect the
fact that QC is the only province without regulation of pharmacy technicians.
Pharmacy technicians in pediatric hospitals
were paid higher salaries than those in
teaching and non-teaching hospitals.
For all staffing categories, average starting
salaries have increased over time (Table D-8).
Pharmacy directors’ salaries appear to have
increased considerably since 2013/14, with 23% earning $160,000 or more in 2016/17, compared with only
9% in 2013/14 (Table D-9).
Table D-7b. Average Annual Starting and Top Salaries of Regulated and Non-regulated Pharmacy
Technicians/Assistants, 2016/17
Position All
Bed Size Hospital Type Province
50 - 200 201- 500 >500 Teaching Non-
teaching Pediatrics BC/YT AB SK MB ON QC NB/PE NS/NL
Starting and top salaries of nonregulated pharmacy technician/pharmacy assistant
Non-regulated Pharmacy Technician / Pharmacy Assistant
(n= ) (108) (29) (45) (34) (30) (73) (5) (15) (17 (7) (10) (13) (28) (9) (9)
Start $ 41,066 44,054 40,050 39,863 41,179 41,084 40,131 45,048 40,098 50,620 38,794 46,435 35,761 40,323 40,847
(n= ) (109) (30) (43) (36) (31) (73) (5) (14) (17) (7) (12) (13) (29) (8) (9)
Top $ 48,563 50,507 47,151 48,632 48,471 48,653 47,825 48,813 50,212 54,424 46,290 55,434 45,871 44,136 46,221
Starting and top salaries when there is only one level of regulated pharmacy technician
Regulated Pharmacy Technician (one level only)
(n= ) (71) (29) (28) (14) (12) (57) (2) (7) (18) (4) (2) (28) (10) (0) (2)
Start $ 54,013 56,067 51,894 53,997 59,488 52,140 74,547 52,767 72,956 61,221 . 49,722 34,831 .
(n= ) (71) (30) (27) (14) (12) (57) (2) (8) (18) (4) (2) (27) (10) (0) (2)
Top $ 60,306 60,460 59,299 61,917 67,897 58,070 78,473 52,718 78,137 65,596 . 57,987 43,492 .
Starting and top salaries when there are 2 levels of regulated pharmacy technician
Regulated Pharmacy Technician - Level 1 / Staff (Level 2 exists)
(n= ) (49) (6) (27) (16) (15) (32) (2) (19) (0) (2) (0) (22) (1) (2) (3)
Start $ 50,247 45,570 50,359 51,812 52,011 49,547 52,313 . 50,804 . . 38,605
(n= ) (31) (4) (17) (10) (11) (19) (1) 2) (0) (2) (0) (22) (1) (1) (3)
Top $ 55,890 49,151 55,542 59,177 57,713 54,923 . 58,270 . . 43,732
Regulated Pharmacy Technician - Level 2 / Senior (Level 1 exists)
(n= ) (49) (6) (27) (16) (15) (32) (2) (19) (0) (2) (0 (22 (1) (2) (3)
Start $ 53,831 46,883 54,060 56,052 55,794 53,111 52,543 . 57,838 . . 40,624
(n= ) (30) 4) (16) (10) (11) (18) (1) (2) (0) (2) (0) (21) (1) (1) (3)
Top $ 61,635 51,347 62,305 64,680 64,892 59,724 . 65,477 . . 45,582
Base: Respondents who provided salary information If no data is shown, it is because there were fewer than 3 responses
Table D-8. Average Starting Salaries – Trends from 2007/08 to 2016/17
Position 2016/17 2013/14 2011/12 2009/10 2007/08
Pharmacist Manager (n= ) (130) (127) (115) (110) (122)
104,758 96,318 89,718 90,843 87,290
Pharmacy Manager (neither pharmacist nor technician)
(n= ) (19) (34) (25) (10) (14)
74,868 63,198 71,708 67,611 62,006
Practice Leader/Coordinator (n= ) (69) (66) (60) (55) (62)
104,188 90,843 82,282 84,897 83,600
Pharmacy Supervisor/Coordinator (n= ) (44) (53) (49) (39) (43)
92,509 87,515 83,076 81,247 80,416
Technician Manager (n= ) (70) (66) (60) (55) (26)
64,548 57,690 54,976 53,464 51,992
Staff Pharmacist (n= ) (162) (149) (142) (138) (130)
85,272 82,576 77,286 76,784 73,467
Advanced Practice Pharmacist (PharmD/ MSc) (n= ) (98) (76) (77) (46) (70)
92,616 87,681 84,696 81,099 74,502
Regulated Pharmacy Technician (where only one level exists)
(n= ) (71) (51) 54,013 47,637 Regulated Pharmacy Technician - Level 1 / Staff
(where Level 2 exists) (n= ) (49) (32)
50,247 49,713 Regulated Pharmacy Technician - Level 2 / Senior
(where Level 1 exists) (n= ) (49) (32)
53,831 52,931 Non-regulated Pharmacy Technician/Assistant (n= ) (108) (84) 41,066 40,375 Base: All respondents
Note: Data are for total number of hospitals (including pediatrics)
There is substantial variation among Canadian
regions in terms of pharmacists’ salaries.

Hospital Pharmacy in Canada Report 2016/17 D - Human Resources
www.hospitalpharmacysurvey.ca page 45
Table D-9. Director Salary Ranges – Trends from 2007/08 to 2016/17
Salary Range 2016/17 2013/14 2011/12 2009/10 2007/08
(n= ) (175) (165) (172) (155) (162)
under $ 90,000 1% 1% 5% 6% 15%
$ 90,000 - $ 99,999 2% 5% 10% 10% 20%
$100,000 - $109,999 7% 10% 13% 19% 29%
$110,000 - $119,999 10% 13% 18% 22% 12%
$120,000 - $129,000 13% 28% 19% 19% 14%
$130,000 - $139,000 ( $130,000 or more)
9% 19% 11% 25% 10%
$140,000 - $149,999 ( $140,000 or more)
23% 8% 24%
$150,000 - $159,999 12% 6%
$160,000 - $169,999 ( $160,000 or more)
6% 9%
$170,000 or more 17% Base: All respondents Note: Data are for total number of hospitals (including pediatrics)
Conclusion
Data from the 2016/17 survey indicate that vacancy rates for pharmacist positions in Canada are moderate to
low. However, pharmacist vacancy rates remain high in pediatric hospitals, and there has been a substantial rise in
vacancies in at least one region (BC/YT). The vacancy rates for pharmacy technician positions remain low in all
regions. Overall, pharmacy staffing ratios have continued to increase, while the composition of the typical pharmacy
department has remained essentially unchanged since 2013/14. However, there continues to be considerable
variation among regions in terms of the proportion of advanced practice pharmacists on staff. The proportion of time
that pharmacists spend on clinical activities continues to increase, with a concomitant decrease in time spent on drug
distribution activities. In fact, pharmacists now spend the majority of their time performing clinical activities.
Salaries for all categories of pharmacy staff have continued to increase, with regional differences for both
pharmacists and pharmacy technicians.
It will be interesting to see if the importance of clinical activities performed by pharmacists will increase the
demand for these healthcare professionals, leading to further increases in staffing ratios.
1 Bond CA, Raehl CL, Pitterle ME, Franke T. Healthcare professional staffing, hospital characteristics, and hospital mortality
rates. Pharmacotherapy. 1999;19(2):130-8.
2 Bond CA, Raehl CL, Pitterle ME. Staffing and the cost of clinical and hospital pharmacy services in United States hospitals.
Pharmacotherapy. 1999;19(6):767-81.
3 Bond CA, Raehl CL. Clinical pharmacy services, pharmacy staffing, and hospital mortality rates. Pharmacotherapy.
2007;27(4):481-93.
4 Bond CA, Raehl CL. Clinical pharmacy services, pharmacy staffing, and adverse drug reactions in United States hospitals.
Pharmacotherapy. 2006;26(6):735-47.
5 Pharmacy management: human resources–positions. In: ASHP policy positions 2009–2017. Rockville (MD): American Society
of Health-System Pharmacists; [cited 2018 Jan 2]. Available from: https://www.ashp.org/-/media/assets/policy-
guidelines/docs/policy-positions/policy-positions-human-
resources.ashx?la=en&hash=FA61A43CF1A40F7C95B32F4D26D621999BAEC96E
6 Pedersen CA, Schneider PJ, Scheckelhoff DJ. ASHP national survey of pharmacy practice in hospital settings: prescribing and
transcribing—2016. Am J Health Syst Pharm. 2017;74(17):1336-52.
7 Pharmacists in Canada 2016: data tables. Ottawa (ON): Canadian Institute for Health Information; 2017 [cited 2018 Jan 2].
Available from: https://secure.cihi.ca/estore/productSeries.htm?pc=PCC376
8 Technicians and pharmacy support workforce cadres working with pharmacists: an introductory global descriptive study. The
Hague (Netherland): International Pharmaceutical Federation; 2017 [cited 2018 Jan 2]. Available from:
http://fip.org/files/fip/publications/2017-02-Technicians-Pharmacy-Support-Worforce-Cadres.pdf
Hospital Pharmacy in Canada Report 2016/17 E - Benchmarking
www.lillyhospitalsurvey.ca page 46
E – Benchmarking/ Resource Matrix
Jean-François Bussières and Douglas Doucette
The importance of benchmarking as part of the Hospital Pharmacy in Canada Survey and Report has been
recognized for at least two decades. Since 1985, the survey has collected quantitative data allowing comparisons
among Canadian hospitals, in relation to hospital size, hospital type and geographic region. Previous reports have
included a variety of simple ratios covering much of the data collected (e.g., number of budgeted hours per patient
day).
In 1997/98, recognizing that some patient care programs require more human and material resources than
others, we began soliciting more specific data for certain targeted programs, including oncology and critical care.
This process has culminated in development of a matrix, in spreadsheet format for the reporting of data on human
and material resources. This new matrix was included for the first time in the 2016/17 survey. Ultimately,
widespread use of this matrix should ensure that all respondents present their human and material resources data in
the same way, which will allow more robust comparisons in the future. However, the benchmarks generated by this
new matrix differ in certain ways from those documented previously, and we therefore prefer not to make direct
comparisons with benchmarks in past reports.
In addition to concerns about comparability with previous reports, we recommend that the benchmarking data
reported here be interpreted with caution, because the number of respondents per cell was variable. Furthermore,
most of the benchmarking data did not have a normal distribution. Thus, the data presented in this chapter are non-
parametric, with median values being reported, and ranges being expressed as 10th and 90th percentiles (instead of
minimum and maximum). Although respondents were asked to provide detailed data for 12 specified patient care
programs, sufficient data for reporting were collected for only 10 of these programs.
The median number of inpatient budgeted hours per inpatient day was higher for technician staff (0.32)
than for pharmacists (0.26).
Among inpatient pharmacists, the median number of hours per inpatient day was highest for adult critical
care (0.48), followed by pediatrics within a general hospital (0.39), oncology (0.38) and pediatric and/or
neonatal critical care (0.32). General medicine (0.18), general surgery (0.16), rehabilitation (0.11) and
gynecology and/or obstetrics (0.10) tended to have lower values for this benchmark.
The median number of inpatient beds per inpatient automated dispensing cabinet was 16.
Human resources devoted to outpatient activities were more variable relative to most inpatient programs.
Although pharmacy departments within healthcare facilities typically dedicate more resources to services
for inpatients, it is equally important to collect (and then analyze trends for) comparative data for outpatient
services.
Outpatient staff pharmacist hours per 100 outpatient visits was higher for oncology (22.47) and general
medicine (13.33). Other program types had far fewer assigned hours per 100 visits, or the number of
respondents was too low (i.e. <7) to calculate meaningful 10th and 90th percentiles.
With the experience gained through using the 2016/17 data collection tool (the new matrix), we expect to
improve data collection and simplify the gathering of information from respondents in the next survey.
Table E-1 shows some key ratios for inpatient and outpatient hospital pharmacy practice.

Hospital Pharmacy in Canada Report 2016/17 E - Benchmarking
www.lillyhospitalsurvey.ca page 47
Table E-1. Key Ratios in Hospital Pharmacy Practice, 2016/17
Ratios
Patient care programs
TOTAL
Emergency General Medicine
General Surgery Oncology
Adult Critical
Care Gynecology Obstetrics
Mental Health
Rehab- ilitation
Pediatrics within a General Hospital
Pediatric and
Neonatal Critical
Care
Inpatient budgeted pharmacist hours per inpatient day
(n= ) (121) (0) (26) (22) (12) (25) (12) (20) (9) (10) (11)
10. %ile 0.14 0.06 0.08 0.10 0.25 0.02 0.07 0.04 0.12 0.15
Median 0.26 0.18 0.16 0.38 0.48 0.10 0.14 0.11 0.39 0.32
90. %ile 0.51 0.34 0.35 0.72 1.06 0.55 0.24 0.32 1.71 0.64
Inpatient budgeted technician hours per inpatient day
(n= ) (120) (0) (12) (12) (< 7) (10) (8) (7) (< 7) (< 7) (< 7)
10. %ile 0.16 0.04 0.02 0.12 0.03 0.03
Median 0.32 0.16 0.11 0.54 0.15 0.13
90. %ile 0.54 0.43 0.46 2.58 1.01 0.20
Inpatient drug costs per inpatient day
(n= ) (123) (0) (26) (25) (10) (22) (20) (19) (17) (16) (11)
10. %ile $15.35 $13.41 $20.07 $37.58 $63.98 $13.60 $5.17 $4.91 $5.28 $10.98
Median $29.37 $21.06 $27.05 $107.40 $92.79 $26.24 $8.68 $10.12 $17.49 $21.19
90. %ile $96.93 $35.12 $51.45 $309.45 $147.98 $62.08 $14.34 $35.50 $37.97 $62.88
Number of inpatient beds per inpatient ADC
(n= ) (89) (0) (35) (34) (14) (38) (24) (24) (13) (12) (17)
10. %ile 7.50 12.00 10.96 10.00 4.00 8.25 10.86 11.00 3.20 6.60
Median 16.00 21.00 20.92 19.50 9.39 12.00 20.00 18.00 9.50 13.80
90. %ile 140.00 49.00 40.00 30.00 14.00 21.00 35.00 75.00 17.00 33.00
Outpatient budgeted staff pharmacist hours per 100 outpatient visits
(n= ) (69) (27) (7) (< 7) (18) (0) (< 7) (< 7) (0) (< 7) (0)
10. %ile 1.11 0.72 4.73 7.48
Median 3.44 3.07 13.33 22.47
90. %ile 16.56 7.03 16.79 90.28
Outpatient drug costs per outpatient visit
(n= ) (62) (43) (< 7) (< 7) (17) (0) (< 7) (< 7) (0) (< 7) (0)
10. %ile $3.26 $4.01 $10.52
Median $14.77 $8.65 $239.82
90. %ile $69.95 $19.01 $467.02 Base: Adult and Pediatric hospitals providing matrix data Data not shown if n <7 as 10th and 90th percentiles would not be meaningful

Hospital Pharmacy in Canada Report 2016/17 F – Pharmacy Technicians
www.hospitalpharmacysurvey.ca 48
F - Pharmacy Technicians
Douglas Doucette
As of the 2016/17 survey period, 9 of Canada’s 10 provinces had legislation in place protecting the title
Pharmacy Technician and designating pharmacy technicians as regulated health professionals. Ontario (ON) was the
first to introduce legislation covering pharmacy technicians in 20101 followed by Alberta (AB)2 and British
Columbia (BC),3 starting the transition to a regulated health profession in Canada. Nova Scotia (NS) proclaimed its
new Pharmacy Act in 2013,4 with relevant legislation being enacted in Manitoba (MB),5 New Brunswick (NB),6
Prince Edward Island (PE)7 and Newfoundland and Labrador (NL)8 in 2014 and in Saskatchewan (SK)9 in 2015.
In Quebec (QC), regulations related to the Pharmacy Act define limited the activities that a pharmacy clerk is
permitted to perform under a pharmacist’s supervision, but these regulations do not specify requirements for
education or competencies of a pharmacy clerk.10 In 2014, the Ordre des pharmaciens du Québec adopted practice
standards and competency profiles for pharmacy technical personnel and pharmacy support personnel.11 It is
anticipated that the QC Ministry of Education will evaluate these standards and enable the necessary regulatory
change to allow the term “Pharmacy Technician” to be used in that province.
The Yukon (YT), Northwest Territories and Nunavut had no legislation in place before March 31, 2017, for the
regulation of pharmacy technicians.
In 2008, the Canadian Council for Accreditation of Pharmacy Programs (CCAPP) introduced its accreditation
process for schools that offer pharmacy technician programs. As of early 2018, 38 schools in Canada and 1 school in
Qatar have been accredited by the CCAPP. 12 As of December 2017, two additional Canadian schools had received
provisional accreditation status.13
The Pharmacy Examining Board of Canada (PEBC) is the national certification body for pharmacists and
pharmacy technicians. All Canadian pharmacy technicians currently practising in the profession must pass the PEBC
Pharmacy Technician Evaluating Examination by December 31, 2018, to be eligible to apply for the Qualifying
Examination to become a regulated pharmacy technician. After this deadline, only Canadian graduates of a CCAPP-
accredited program will be eligible to apply for the PEBC Qualifying Examination. The Evaluating Examination
will be offered in three provinces in spring 2018 and four provinces in fall 2018. The Qualifying Examination will
be offered in 8 cities across six provinces in spring 2018 and in 10 cities across eight provinces in fall 2018.14 As of
January 1, 2018, there were 8,185 regulated pharmacy technicians in Canada.15
The National Association of Pharmacy Regulatory Authorities assumed responsibility for delivering the
National Pharmacy Technician Bridging Education Program in 2013.16 The program was originally developed in
Ontario in 2008 and adapted for use in Alberta and British Columbia in 2010. The program has been delivered by
authorized educational institutions, in classroom settings or online, in English since 2013. Since January 2015, a
French-language version of the National Pharmacy Technician Bridging Education Program has been available for
online delivery by BC’s Selkirk College.17,18
Much of the literature on the roles of pharmacy technicians has focused on medication distribution activities.
Recent reports from Canada and elsewhere have examined the progressive roles of competent pharmacy technicians
in direct patient care, such as obtaining best possible medication histories (BPMHs), tracking laboratory test results,
and aiding in completion of comprehensive medication reviews.19 Obtaining the BPMH was the most common role
of pharmacy technicians in the emergency department (ED), occurring at 87% of sites that responded to a Canadian
survey.20 Furthermore, in the ED, dialysis clinic and pre-operative settings, pharmacy technicians were found to
obtain BPMHs as effectively as pharmacists.21,22,23 Expansion of the role of pharmacy technicians to incorporate
obtaining BPMHs and providing other clinical support activities in ED and unit-based teams would enable
pharmacists to provide more direct patient care services.24
Expanded roles for pharmacy technicians in oncology clinics have included gathering pre-determined clinical
data, assembling patient education materials, documenting drug coverage, and providing patient medication
calendars for chemotherapy protocols. Training pharmacy technicians to perform chemotherapy order entry as
accurately and safely as pharmacists potentially allows time to be freed up for pharmacists to provide direct patient
care.25 For admitted patients, pharmacy technicians trained to support a pharmacy-managed warfarin dosing service
provided treatment recommendations similar to those recommended by clinical pharmacists.26
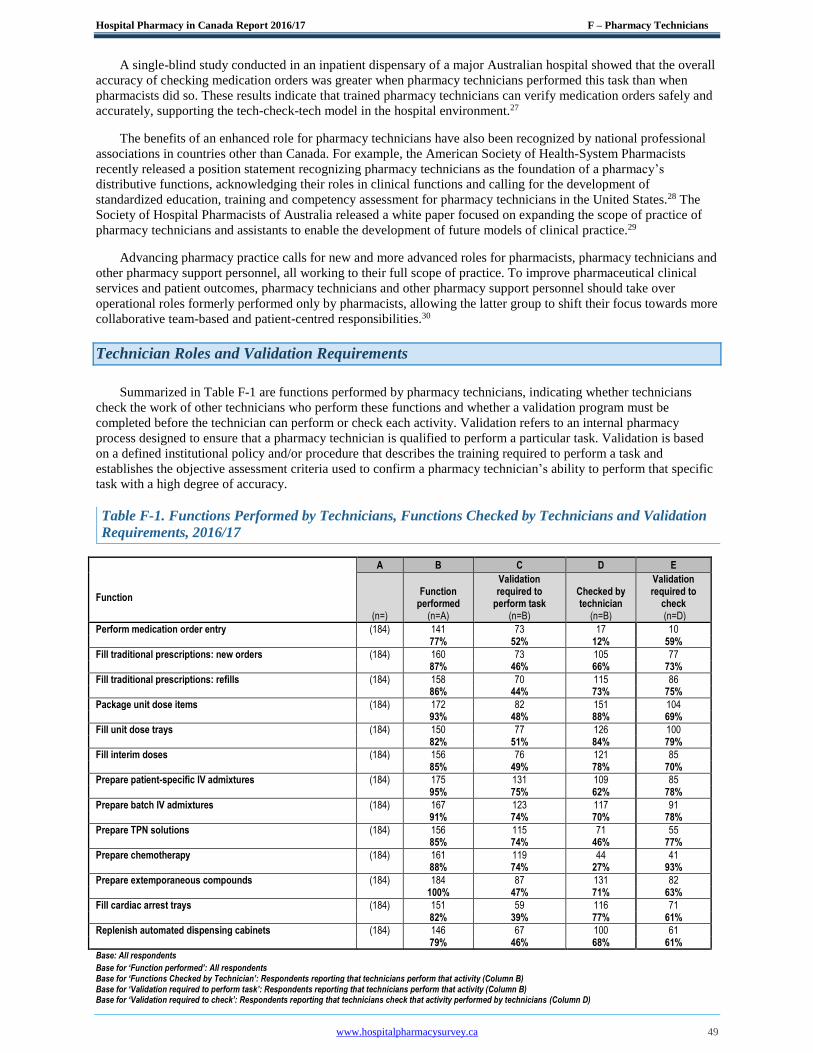
Hospital Pharmacy in Canada Report 2016/17 F – Pharmacy Technicians
www.hospitalpharmacysurvey.ca 49
A single-blind study conducted in an inpatient dispensary of a major Australian hospital showed that the overall
accuracy of checking medication orders was greater when pharmacy technicians performed this task than when
pharmacists did so. These results indicate that trained pharmacy technicians can verify medication orders safely and
accurately, supporting the tech-check-tech model in the hospital environment.27
The benefits of an enhanced role for pharmacy technicians have also been recognized by national professional
associations in countries other than Canada. For example, the American Society of Health-System Pharmacists
recently released a position statement recognizing pharmacy technicians as the foundation of a pharmacy’s
distributive functions, acknowledging their roles in clinical functions and calling for the development of
standardized education, training and competency assessment for pharmacy technicians in the United States.28 The
Society of Hospital Pharmacists of Australia released a white paper focused on expanding the scope of practice of
pharmacy technicians and assistants to enable the development of future models of clinical practice.29
Advancing pharmacy practice calls for new and more advanced roles for pharmacists, pharmacy technicians and
other pharmacy support personnel, all working to their full scope of practice. To improve pharmaceutical clinical
services and patient outcomes, pharmacy technicians and other pharmacy support personnel should take over
operational roles formerly performed only by pharmacists, allowing the latter group to shift their focus towards more
collaborative team-based and patient-centred responsibilities.30
Technician Roles and Validation Requirements
Summarized in Table F-1 are functions performed by pharmacy technicians, indicating whether technicians
check the work of other technicians who perform these functions and whether a validation program must be
completed before the technician can perform or check each activity. Validation refers to an internal pharmacy
process designed to ensure that a pharmacy technician is qualified to perform a particular task. Validation is based
on a defined institutional policy and/or procedure that describes the training required to perform a task and
establishes the objective assessment criteria used to confirm a pharmacy technician’s ability to perform that specific
task with a high degree of accuracy.
Table F-1. Functions Performed by Technicians, Functions Checked by Technicians and Validation
Requirements, 2016/17
A B C D E
Function
(n=)
Function performed
(n=A)
Validation required to
perform task (n=B)
Checked by technician
(n=B)
Validation required to
check (n=D)
Perform medication order entry (184) 141 73 17 10 77% 52% 12% 59%
Fill traditional prescriptions: new orders (184) 160 73 105 77 87% 46% 66% 73%
Fill traditional prescriptions: refills (184) 158 70 115 86 86% 44% 73% 75%
Package unit dose items (184) 172 82 151 104 93% 48% 88% 69%
Fill unit dose trays (184) 150 77 126 100 82% 51% 84% 79%
Fill interim doses (184) 156 76 121 85 85% 49% 78% 70%
Prepare patient-specific IV admixtures (184) 175 131 109 85 95% 75% 62% 78%
Prepare batch IV admixtures (184) 167 123 117 91 91% 74% 70% 78%
Prepare TPN solutions (184) 156 115 71 55 85% 74% 46% 77%
Prepare chemotherapy (184) 161 119 44 41 88% 74% 27% 93%
Prepare extemporaneous compounds (184) 184 87 131 82 100% 47% 71% 63%
Fill cardiac arrest trays (184) 151 59 116 71 82% 39% 77% 61%
Replenish automated dispensing cabinets (184) 146 67 100 61 79% 46% 68% 61% Base: All respondents Base for ‘Function performed’: All respondents
Base for ‘Functions Checked by Technician’: Respondents reporting that technicians perform that activity (Column B) Base for ‘Validation required to perform task’: Respondents reporting that technicians perform that activity (Column B)
Base for ‘Validation required to check’: Respondents reporting that technicians check that activity performed by technicians (Column D)
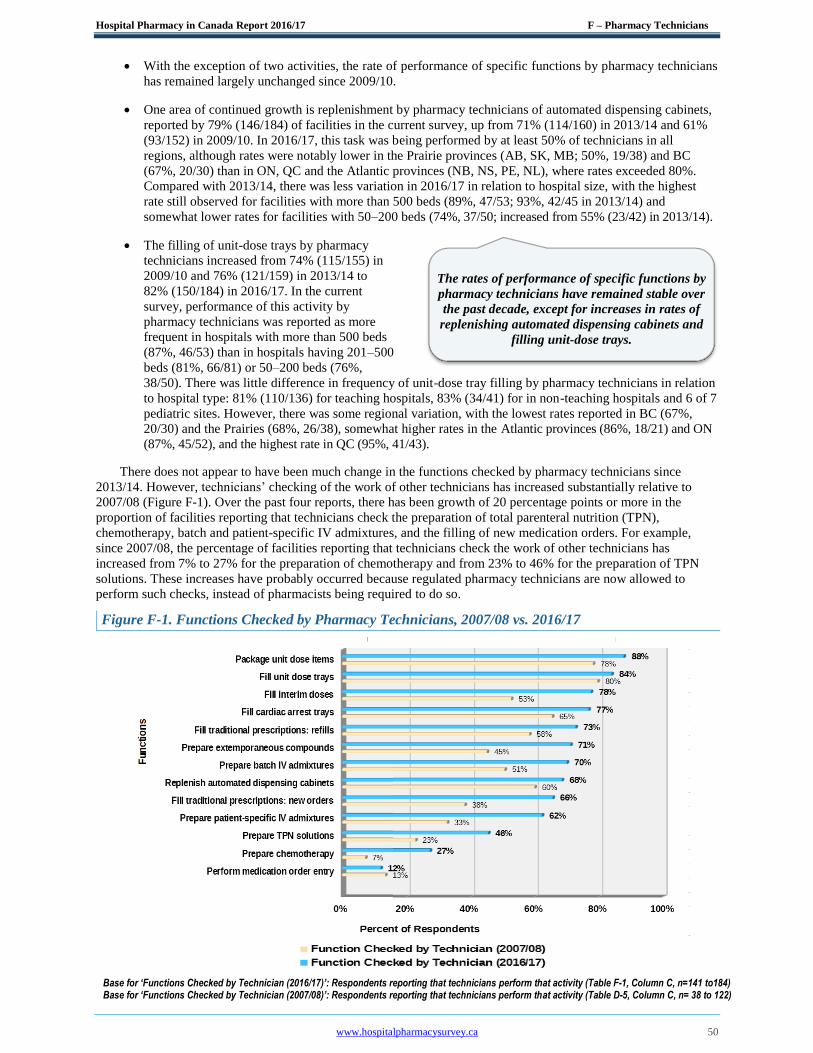
Hospital Pharmacy in Canada Report 2016/17 F – Pharmacy Technicians
www.hospitalpharmacysurvey.ca 50
With the exception of two activities, the rate of performance of specific functions by pharmacy technicians
has remained largely unchanged since 2009/10.
One area of continued growth is replenishment by pharmacy technicians of automated dispensing cabinets,
reported by 79% (146/184) of facilities in the current survey, up from 71% (114/160) in 2013/14 and 61%
(93/152) in 2009/10. In 2016/17, this task was being performed by at least 50% of technicians in all
regions, although rates were notably lower in the Prairie provinces (AB, SK, MB; 50%, 19/38) and BC
(67%, 20/30) than in ON, QC and the Atlantic provinces (NB, NS, PE, NL), where rates exceeded 80%.
Compared with 2013/14, there was less variation in 2016/17 in relation to hospital size, with the highest
rate still observed for facilities with more than 500 beds (89%, 47/53; 93%, 42/45 in 2013/14) and
somewhat lower rates for facilities with 50–200 beds (74%, 37/50; increased from 55% (23/42) in 2013/14).
The filling of unit-dose trays by pharmacy
technicians increased from 74% (115/155) in
2009/10 and 76% (121/159) in 2013/14 to
82% (150/184) in 2016/17. In the current
survey, performance of this activity by
pharmacy technicians was reported as more
frequent in hospitals with more than 500 beds
(87%, 46/53) than in hospitals having 201–500
beds (81%, 66/81) or 50–200 beds (76%,
38/50). There was little difference in frequency of unit-dose tray filling by pharmacy technicians in relation
to hospital type: 81% (110/136) for teaching hospitals, 83% (34/41) for in non-teaching hospitals and 6 of 7
pediatric sites. However, there was some regional variation, with the lowest rates reported in BC (67%,
20/30) and the Prairies (68%, 26/38), somewhat higher rates in the Atlantic provinces (86%, 18/21) and ON
(87%, 45/52), and the highest rate in QC (95%, 41/43).
There does not appear to have been much change in the functions checked by pharmacy technicians since
2013/14. However, technicians’ checking of the work of other technicians has increased substantially relative to
2007/08 (Figure F-1). Over the past four reports, there has been growth of 20 percentage points or more in the
proportion of facilities reporting that technicians check the preparation of total parenteral nutrition (TPN),
chemotherapy, batch and patient-specific IV admixtures, and the filling of new medication orders. For example,
since 2007/08, the percentage of facilities reporting that technicians check the work of other technicians has
increased from 7% to 27% for the preparation of chemotherapy and from 23% to 46% for the preparation of TPN
solutions. These increases have probably occurred because regulated pharmacy technicians are now allowed to
perform such checks, instead of pharmacists being required to do so.
Figure F-1. Functions Checked by Pharmacy Technicians, 2007/08 vs. 2016/17
Base for ‘Functions Checked by Technician (2016/17)’: Respondents reporting that technicians perform that activity (Table F-1, Column C, n=141 to184) Base for ‘Functions Checked by Technician (2007/08)’: Respondents reporting that technicians perform that activity (Table D-5, Column C, n= 38 to 122)
The rates of performance of specific functions by
pharmacy technicians have remained stable over
the past decade, except for increases in rates of
replenishing automated dispensing cabinets and
filling unit-dose trays.

Hospital Pharmacy in Canada Report 2016/17 F – Pharmacy Technicians
www.hospitalpharmacysurvey.ca 51
A trend seen in the past two reports (2011/12 and 2013/14) was that validation was less commonly required to
allow a pharmacy technician to perform a task than to check that task. The rationale for this difference would be that
a greater degree of quality control is needed where
the technician can give final approval to release a
product to a patient than is the case when the final
check of a technician’s work is carried out by a
pharmacist. However, the results of the 2016/17
survey (Figure F-2) seem to indicate a reversal of
this trend. The requirement for technician
validation to perform tasks was reported by fewer
respondents in 2016/17 than in 2013/14 (decreases
of 2 to 7 percentage points) for common activities, such as entering medication orders (decrease from 57% to 52%)
and preparing chemotherapy (decrease from 80% to 74%). Similarly, the requirement for validation to check the
work of others was reported by fewer respondents, ranging from 3 to 29 percentage points less than in 2013/14, even
for activities perceived to carry higher risk, such as the preparation of chemotherapy (decrease from 96% to 93%)
and TPN solutions (decrease from 96% to 77%). This trend reversal could be related to facilities employing
regulated pharmacy technicians to either perform work within their scope of practice or check the work of non-
regulated pharmacy technicians/assistants performing these duties. Following these trends in future surveys will
assist in measuring the impact of pharmacy technician regulation on hospital pharmacy practice.
Figure F-2. Technician Validation Requirements for Performing and Checking, 2013/14 vs. 2016/17
Base for ‘Validation required to perform task (2016/17)’: Respondents reporting that technicians perform that activity (Table F-1, Column B, n=141 - 184)
Base for ‘Validation required to check (2016/17)’: Respondents reporting that activity is checked by technicians (Table F-1, Column D, n=10 -104)
Base for ‘Validation required to perform task (2013/14)’: Respondents reporting that technicians perform that activity (Table F-1, Column B, n=114-159)
Base for ‘Validation required to check (2013/14)’: Respondents reporting that technicians check that activity performed by technicians (Table F-1, Column D, n=17-128)
The validation requirement for pharmacy
technicians checking the work of others decreased
in 2016/17 relative to the previous four survey
periods.
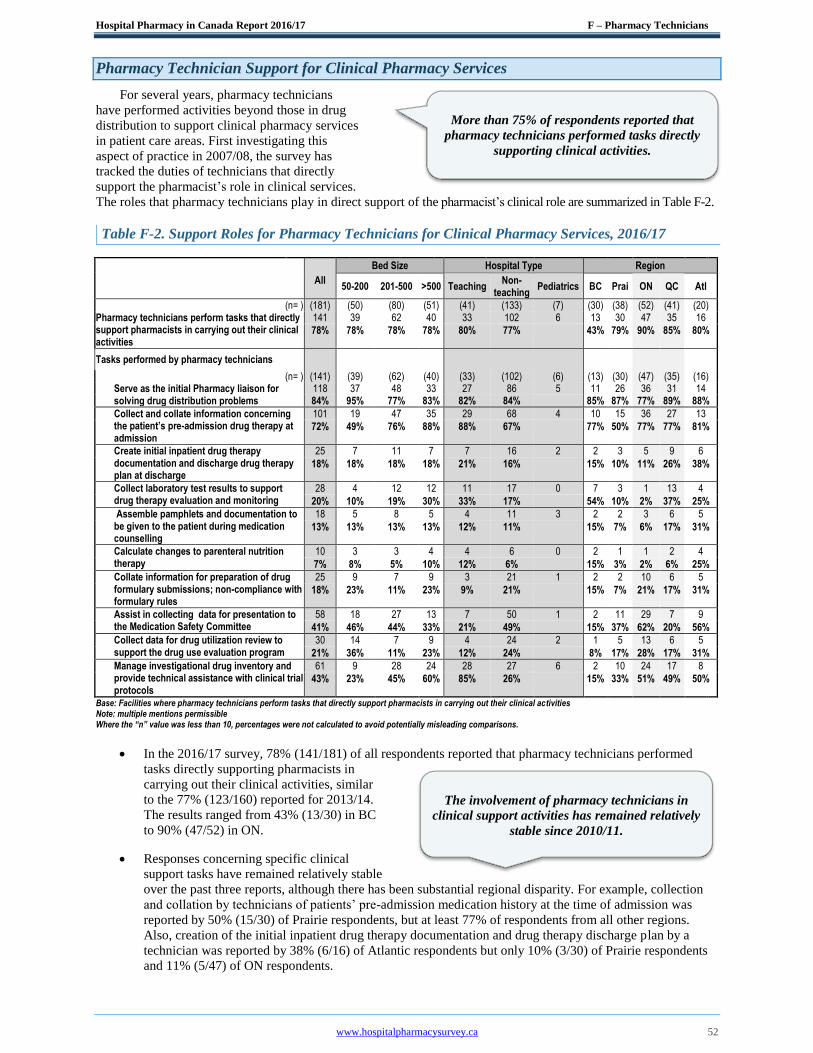
Hospital Pharmacy in Canada Report 2016/17 F – Pharmacy Technicians
www.hospitalpharmacysurvey.ca 52
Pharmacy Technician Support for Clinical Pharmacy Services
For several years, pharmacy technicians
have performed activities beyond those in drug
distribution to support clinical pharmacy services
in patient care areas. First investigating this
aspect of practice in 2007/08, the survey has
tracked the duties of technicians that directly
support the pharmacist’s role in clinical services.
The roles that pharmacy technicians play in direct support of the pharmacist’s clinical role are summarized in Table F-2.
Table F-2. Support Roles for Pharmacy Technicians for Clinical Pharmacy Services, 2016/17
All
Bed Size Hospital Type Region
50-200 201-500 >500 Teaching Non-
teaching Pediatrics BC Prai ON QC Atl
(n= ) (181) (50) (80) (51) (41) (133) (7) (30) (38) (52) (41) (20) Pharmacy technicians perform tasks that directly support pharmacists in carrying out their clinical activities
141 39 62 40 33 102 6 13 30 47 35 16
78% 78% 78% 78% 80% 77% 43% 79% 90% 85% 80%
Tasks performed by pharmacy technicians
(n= ) (141) (39) (62) (40) (33) (102) (6) (13) (30) (47) (35) (16) Serve as the initial Pharmacy liaison for solving drug distribution problems
118 37 48 33 27 86 5 11 26 36 31 14 84% 95% 77% 83% 82% 84%
85% 87% 77% 89% 88%
Collect and collate information concerning the patient’s pre-admission drug therapy at admission
101 19 47 35 29 68 4 10 15 36 27 13
72% 49% 76% 88% 88% 67% 77% 50% 77% 77% 81%
Create initial inpatient drug therapy documentation and discharge drug therapy plan at discharge
25 7 11 7 7 16 2 2 3 5 9 6
18% 18% 18% 18% 21% 16% 15% 10% 11% 26% 38%
Collect laboratory test results to support drug therapy evaluation and monitoring
28 4 12 12 11 17 0 7 3 1 13 4
20% 10% 19% 30% 33% 17%
54% 10% 2% 37% 25%
Assemble pamphlets and documentation to be given to the patient during medication counselling
18 5 8 5 4 11 3 2 2 3 6 5
13% 13% 13% 13% 12% 11% 15% 7% 6% 17% 31%
Calculate changes to parenteral nutrition therapy
10 3 3 4 4 6 0 2 1 1 2 4
7% 8% 5% 10% 12% 6%
15% 3% 2% 6% 25%
Collate information for preparation of drug formulary submissions; non-compliance with formulary rules
25 9 7 9 3 21 1 2 2 10 6 5
18% 23% 11% 23% 9% 21% 15% 7% 21% 17% 31%
Assist in collecting data for presentation to the Medication Safety Committee
58 18 27 13 7 50 1 2 11 29 7 9
41% 46% 44% 33% 21% 49%
15% 37% 62% 20% 56%
Collect data for drug utilization review to support the drug use evaluation program
30 14 7 9 4 24 2 1 5 13 6 5
21% 36% 11% 23% 12% 24%
8% 17% 28% 17% 31%
Manage investigational drug inventory and provide technical assistance with clinical trial protocols
61 9 28 24 28 27 6 2 10 24 17 8
43% 23% 45% 60% 85% 26% 15% 33% 51% 49% 50%
Base: Facilities where pharmacy technicians perform tasks that directly support pharmacists in carrying out their clinical activities Note: multiple mentions permissible Where the “n” value was less than 10, percentages were not calculated to avoid potentially misleading comparisons.
In the 2016/17 survey, 78% (141/181) of all respondents reported that pharmacy technicians performed
tasks directly supporting pharmacists in
carrying out their clinical activities, similar
to the 77% (123/160) reported for 2013/14.
The results ranged from 43% (13/30) in BC
to 90% (47/52) in ON.
Responses concerning specific clinical
support tasks have remained relatively stable
over the past three reports, although there has been substantial regional disparity. For example, collection
and collation by technicians of patients’ pre-admission medication history at the time of admission was
reported by 50% (15/30) of Prairie respondents, but at least 77% of respondents from all other regions.
Also, creation of the initial inpatient drug therapy documentation and drug therapy discharge plan by a
technician was reported by 38% (6/16) of Atlantic respondents but only 10% (3/30) of Prairie respondents
and 11% (5/47) of ON respondents.
More than 75% of respondents reported that
pharmacy technicians performed tasks directly
supporting clinical activities.
The involvement of pharmacy technicians in
clinical support activities has remained relatively
stable since 2010/11.
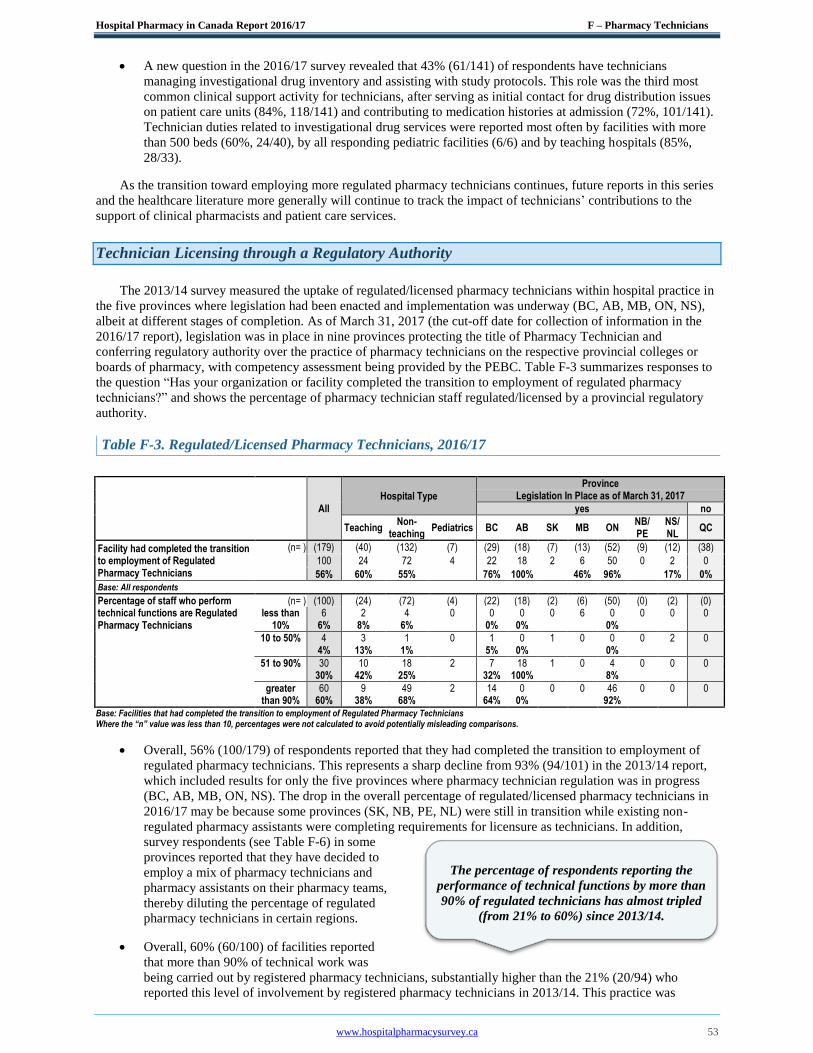
Hospital Pharmacy in Canada Report 2016/17 F – Pharmacy Technicians
www.hospitalpharmacysurvey.ca 53
A new question in the 2016/17 survey revealed that 43% (61/141) of respondents have technicians
managing investigational drug inventory and assisting with study protocols. This role was the third most
common clinical support activity for technicians, after serving as initial contact for drug distribution issues
on patient care units (84%, 118/141) and contributing to medication histories at admission (72%, 101/141).
Technician duties related to investigational drug services were reported most often by facilities with more
than 500 beds (60%, 24/40), by all responding pediatric facilities (6/6) and by teaching hospitals (85%,
28/33).
As the transition toward employing more regulated pharmacy technicians continues, future reports in this series
and the healthcare literature more generally will continue to track the impact of technicians’ contributions to the
support of clinical pharmacists and patient care services.
Technician Licensing through a Regulatory Authority
The 2013/14 survey measured the uptake of regulated/licensed pharmacy technicians within hospital practice in
the five provinces where legislation had been enacted and implementation was underway (BC, AB, MB, ON, NS),
albeit at different stages of completion. As of March 31, 2017 (the cut-off date for collection of information in the
2016/17 report), legislation was in place in nine provinces protecting the title of Pharmacy Technician and
conferring regulatory authority over the practice of pharmacy technicians on the respective provincial colleges or
boards of pharmacy, with competency assessment being provided by the PEBC. Table F-3 summarizes responses to
the question “Has your organization or facility completed the transition to employment of regulated pharmacy
technicians?” and shows the percentage of pharmacy technician staff regulated/licensed by a provincial regulatory
authority.
Table F-3. Regulated/Licensed Pharmacy Technicians, 2016/17
All
Hospital Type
Province Legislation In Place as of March 31, 2017
yes no
Teaching
Non- teaching
Pediatrics BC AB SK MB ON NB/ PE
NS/ NL
QC
Facility had completed the transition to employment of Regulated Pharmacy Technicians
(n= ) (179) (40) (132) (7) (29) (18) (7) (13) (52) (9) (12) (38)
100 24 72 4 22 18 2 6 50 0 2 0
56% 60% 55%
76% 100%
46% 96%
17% 0%
Base: All respondents
Percentage of staff who perform (n= ) (100) (24) (72) (4) (22) (18) (2) (6) (50) (0) (2) (0) technical functions are Regulated less than 6 2 4 0 0 0 0 6 0 0 0 0 Pharmacy Technicians 10% 6% 8% 6% 0% 0% 0%
10 to 50% 4 3 1 0 1 0 1 0 0 0 2 0 4% 13% 1% 5% 0% 0%
51 to 90% 30 10 18 2 7 18 1 0 4 0 0 0 30% 42% 25% 32% 100% 8%
greater 60 9 49 2 14 0 0 0 46 0 0 0 than 90% 60% 38% 68% 64% 0% 92% Base: Facilities that had completed the transition to employment of Regulated Pharmacy Technicians Where the “n” value was less than 10, percentages were not calculated to avoid potentially misleading comparisons.
Overall, 56% (100/179) of respondents reported that they had completed the transition to employment of
regulated pharmacy technicians. This represents a sharp decline from 93% (94/101) in the 2013/14 report,
which included results for only the five provinces where pharmacy technician regulation was in progress
(BC, AB, MB, ON, NS). The drop in the overall percentage of regulated/licensed pharmacy technicians in
2016/17 may be because some provinces (SK, NB, PE, NL) were still in transition while existing non-
regulated pharmacy assistants were completing requirements for licensure as technicians. In addition,
survey respondents (see Table F-6) in some
provinces reported that they have decided to
employ a mix of pharmacy technicians and
pharmacy assistants on their pharmacy teams,
thereby diluting the percentage of regulated
pharmacy technicians in certain regions.
Overall, 60% (60/100) of facilities reported
that more than 90% of technical work was
being carried out by registered pharmacy technicians, substantially higher than the 21% (20/94) who
reported this level of involvement by registered pharmacy technicians in 2013/14. This practice was
The percentage of respondents reporting the
performance of technical functions by more than
90% of regulated technicians has almost tripled
(from 21% to 60%) since 2013/14.
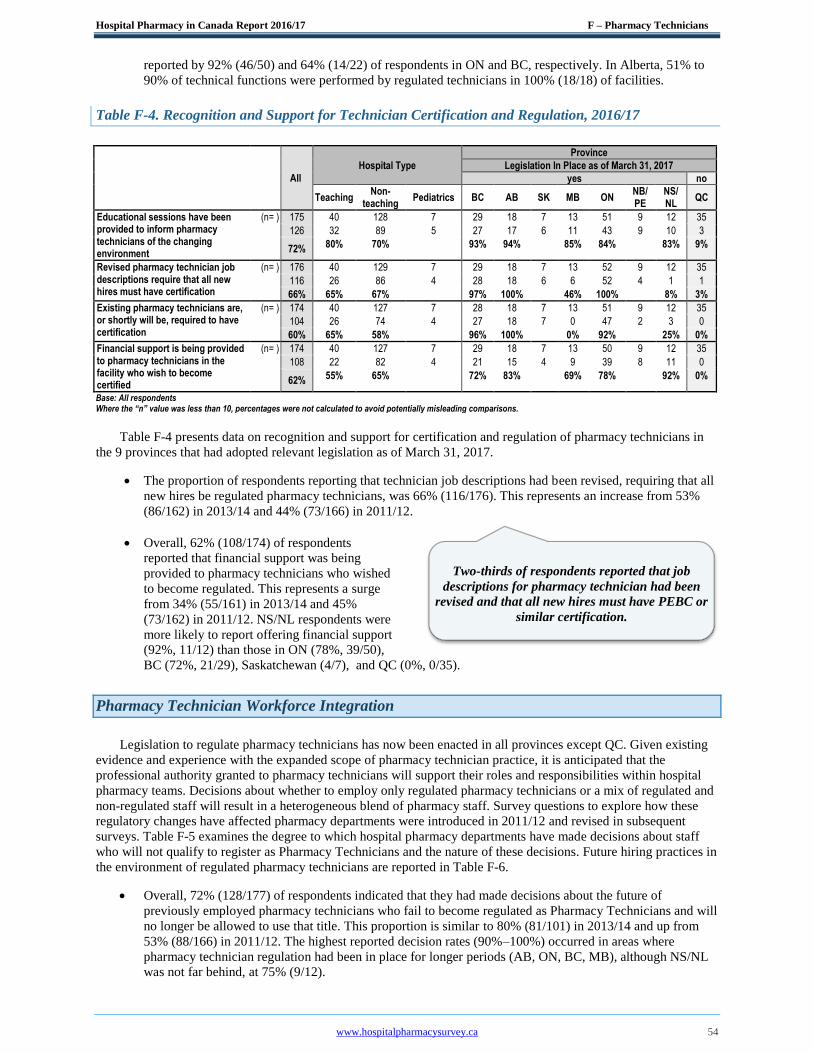
Hospital Pharmacy in Canada Report 2016/17 F – Pharmacy Technicians
www.hospitalpharmacysurvey.ca 54
reported by 92% (46/50) and 64% (14/22) of respondents in ON and BC, respectively. In Alberta, 51% to
90% of technical functions were performed by regulated technicians in 100% (18/18) of facilities.
Table F-4. Recognition and Support for Technician Certification and Regulation, 2016/17
All
Hospital Type
Province
Legislation In Place as of March 31, 2017
yes no
Teaching
Non- teaching
Pediatrics BC AB SK MB ON NB/ PE
NS/ NL
QC
Educational sessions have been provided to inform pharmacy technicians of the changing environment
(n= ) 175 40 128 7 29 18 7 13 51 9 12 35
126 32 89 5 27 17 6 11 43 9 10 3
72% 80% 70% 93% 94% 85% 84% 83% 9%
Revised pharmacy technician job descriptions require that all new hires must have certification
(n= ) 176 40 129 7 29 18 7 13 52 9 12 35
116 26 86 4 28 18 6 6 52 4 1 1
66% 65% 67% 97% 100% 46% 100% 8% 3%
Existing pharmacy technicians are, or shortly will be, required to have certification
(n= ) 174 40 127 7 28 18 7 13 51 9 12 35
104 26 74 4 27 18 7 0 47 2 3 0
60% 65% 58% 96% 100% 0% 92% 25% 0%
Financial support is being provided to pharmacy technicians in the facility who wish to become certified
(n= ) 174 40 127 7 29 18 7 13 50 9 12 35
108 22 82 4 21 15 4 9 39 8 11 0
62% 55% 65% 72% 83% 69% 78% 92% 0%
Base: All respondents Where the “n” value was less than 10, percentages were not calculated to avoid potentially misleading comparisons.
Table F-4 presents data on recognition and support for certification and regulation of pharmacy technicians in
the 9 provinces that had adopted relevant legislation as of March 31, 2017.
The proportion of respondents reporting that technician job descriptions had been revised, requiring that all
new hires be regulated pharmacy technicians, was 66% (116/176). This represents an increase from 53%
(86/162) in 2013/14 and 44% (73/166) in 2011/12.
Overall, 62% (108/174) of respondents
reported that financial support was being
provided to pharmacy technicians who wished
to become regulated. This represents a surge
from 34% (55/161) in 2013/14 and 45%
(73/162) in 2011/12. NS/NL respondents were
more likely to report offering financial support
(92%, 11/12) than those in ON (78%, 39/50),
BC (72%, 21/29), Saskatchewan (4/7), and QC (0%, 0/35).
Pharmacy Technician Workforce Integration
Legislation to regulate pharmacy technicians has now been enacted in all provinces except QC. Given existing
evidence and experience with the expanded scope of pharmacy technician practice, it is anticipated that the
professional authority granted to pharmacy technicians will support their roles and responsibilities within hospital
pharmacy teams. Decisions about whether to employ only regulated pharmacy technicians or a mix of regulated and
non-regulated staff will result in a heterogeneous blend of pharmacy staff. Survey questions to explore how these
regulatory changes have affected pharmacy departments were introduced in 2011/12 and revised in subsequent
surveys. Table F-5 examines the degree to which hospital pharmacy departments have made decisions about staff
who will not qualify to register as Pharmacy Technicians and the nature of these decisions. Future hiring practices in
the environment of regulated pharmacy technicians are reported in Table F-6.
Overall, 72% (128/177) of respondents indicated that they had made decisions about the future of
previously employed pharmacy technicians who fail to become regulated as Pharmacy Technicians and will
no longer be allowed to use that title. This proportion is similar to 80% (81/101) in 2013/14 and up from
53% (88/166) in 2011/12. The highest reported decision rates (90%–100%) occurred in areas where
pharmacy technician regulation had been in place for longer periods (AB, ON, BC, MB), although NS/NL
was not far behind, at 75% (9/12).
Two-thirds of respondents reported that job
descriptions for pharmacy technician had been
revised and that all new hires must have PEBC or
similar certification.

Hospital Pharmacy in Canada Report 2016/17 F – Pharmacy Technicians
www.hospitalpharmacysurvey.ca 55
Table F-5. Individuals Who Do Not Become Registered as Pharmacy Technicians, 2016/17
All
Hospital Type
Province
Legislation In Place as of March 31, 2017
yes no
Teaching
Non- teaching
Pediatrics BC AB SK MB ON NB/ PE
NS/ NL
QC
(n= ) (177) (40) (130) (7) (29) (18) (7) (13) (52) (9) (12) (36) Facility has made decisions concerning the future of previously employed ‘Pharmacy Technicians’ who fail to qualify for licensure
128 27 97 4 26 18 5 12 51 7 9 0
72% 68% 75% 90% 100% 92% 98% 75% 0%
Base: All respondents
Employment treatment of former pharmacy technicians who do not qualify for registration as Regulated Pharmacy Technicians
(n= ) (128) (27) (97) (4) (26) (18) (5) (12) (51) (7) (9) (0) Their employment with your facility will be terminated.
46 7 36 3 0 14 0 0 30 2 0 0
36% 26% 37% 0% 78% 0% 59%
They will be offered positions elsewhere in the organization where registration as a pharmacy technician is not required.
40 12 27 1 21 2 1 0 15 0 1 0
31% 44% 28% 81% 11% 0% 29%
They will be given a new title and continue to work in the pharmacy department.
38 8 30 0 3 2 4 12 6 5 6 0
30% 30% 31% 12% 11% 100% 12%
Not yet determined 4 0 4 0 2 0 0 0 0 0 2 0
3% 0% 4% 8% 0% 0% 0% Base: Facilities where decisions have been made re pharmacy technicians in provinces with Pharmacy Technician license legislation in place
Responsibilities of former pharmacy technicians who do not qualify for as a regulated pharmacy technician and will continue to work in the pharmacy department
(n= ) (38) (8) (30) (0) (3) (2) (4) (12) (6) (5) (6) (0) They will continue to perform the same duties, with the exception of tasks that by law can only be performed by a regulated pharmacy technician.
32 5 27 0 2 0 4 12 3 5 6 0
84% 90% 100%
They will have a new position description that limits their responsibilities to very basic activities.
6 3 3 0 1 2 0 0 3 0 0 0
16% 10% 0%
Salary treatment of former pharmacy technicians who do not qualify as a regulated pharmacy technician and will continue to work in the pharmacy department
(n= ) (37) (8) (29) (0) (3) (2) (4) (11) (6) (5) (6) (0) They will continue to be paid on the same salary scale as the regulated pharmacy technicians.
9 2 7 0 0 0 0 0 2 3 4 0
24% 24% 0%
They will be placed on a new salary scale and ‘red-circled’.
10 2 8 0 1 0 4 4 1 0 0 0
27% 28% 36%
They will be placed on a new salary scale that will pay them less.
6 3 3 0 2 2 0 0 2 0 0 0
16% 10% 0%
Not yet determined 12 1 11 0 0 0 0 7 1 2 2 0
32% 38% 64% Base: Facilities where former pharmacy technicians will be given a new title and continue to work in the pharmacy department in provinces with Pharmacy Technician license legislation in place Where the “n’ value was less than 10, percentages were not calculated to avoid potentially misleading comparisons
Of respondents reporting that their institutions had made decisions about those who fail to become
regulated as pharmacy technicians, 36% (46/128) indicated that employment of these personnel within the
facility would be terminated, 31% (40/128)
reported that these staff members would be
offered positions elsewhere in the organization
(outside pharmacy), and 30% (38/128) reported
that these personnel would be retained under a
new title, such as “Pharmacy Assistant”.
Among the respondents who reported that they
would give non-regulated staff a new title (e.g.,
Pharmacy Assistant), 84% (32/38) indicated
that those personnel would continue to perform
the same duties, with the exception of tasks that
must be only performed by a regulated pharmacy technician.
There appears to be variation in planned salaries for individuals with a new title, such as Pharmacy
Assistant. About one-quarter (24%, 9/37) of respondents reported that their institutions will pay these
Of respondents who will continue to employ non-
regulated pharmacy personnel under a new title,
84% plan to have these personnel perform the
same duties, with the exception of tasks that must
be performed only by a regulated pharmacy
technician
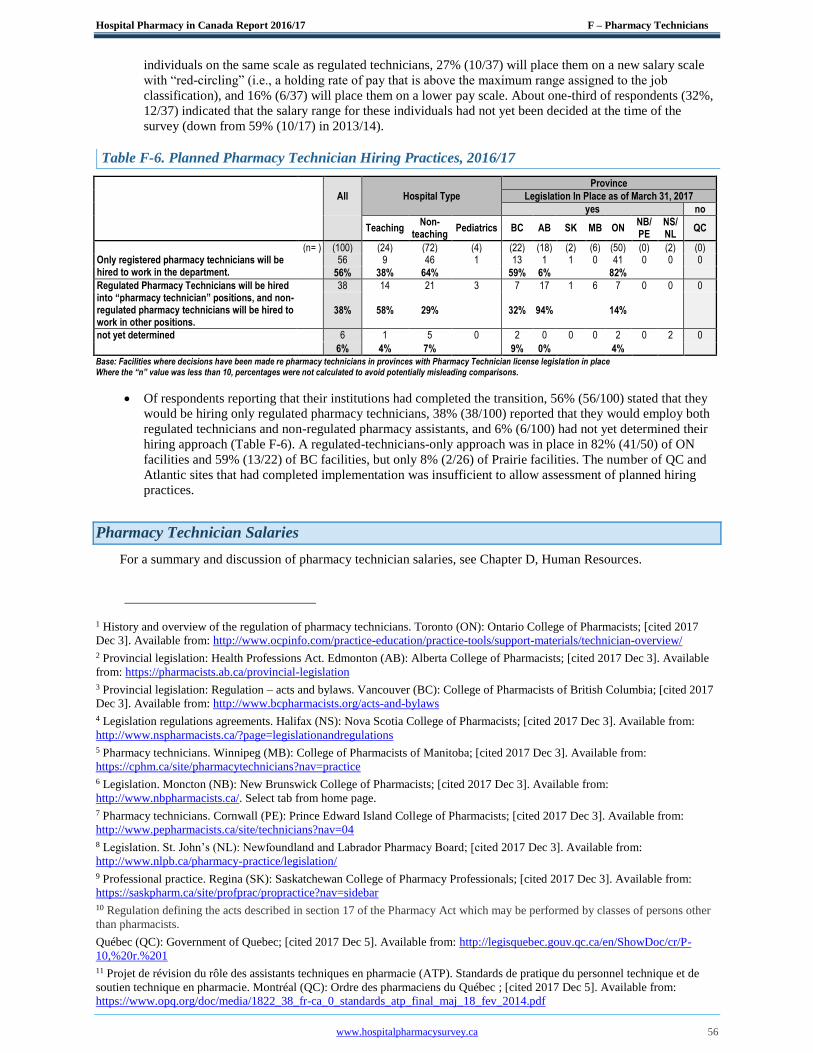
Hospital Pharmacy in Canada Report 2016/17 F – Pharmacy Technicians
www.hospitalpharmacysurvey.ca 56
individuals on the same scale as regulated technicians, 27% (10/37) will place them on a new salary scale
with “red-circling” (i.e., a holding rate of pay that is above the maximum range assigned to the job
classification), and 16% (6/37) will place them on a lower pay scale. About one-third of respondents (32%,
12/37) indicated that the salary range for these individuals had not yet been decided at the time of the
survey (down from 59% (10/17) in 2013/14).
Table F-6. Planned Pharmacy Technician Hiring Practices, 2016/17
All Hospital Type
Province
Legislation In Place as of March 31, 2017
yes no
Teaching
Non- teaching
Pediatrics BC AB SK MB ON NB/ PE
NS/ NL
QC
(n= ) (100) (24) (72) (4) (22) (18) (2) (6) (50) (0) (2) (0) Only registered pharmacy technicians will be hired to work in the department.
56 9 46 1 13 1 1 0 41 0 0 0
56% 38% 64%
59% 6%
82%
Regulated Pharmacy Technicians will be hired into “pharmacy technician” positions, and non-regulated pharmacy technicians will be hired to work in other positions.
38 14 21 3 7 17 1 6 7 0 0 0
38% 58% 29%
32% 94%
14%
not yet determined 6 1 5 0 2 0 0 0 2 0 2 0
6% 4% 7%
9% 0%
4%
Base: Facilities where decisions have been made re pharmacy technicians in provinces with Pharmacy Technician license legislation in place Where the “n” value was less than 10, percentages were not calculated to avoid potentially misleading comparisons.
Of respondents reporting that their institutions had completed the transition, 56% (56/100) stated that they
would be hiring only regulated pharmacy technicians, 38% (38/100) reported that they would employ both
regulated technicians and non-regulated pharmacy assistants, and 6% (6/100) had not yet determined their
hiring approach (Table F-6). A regulated-technicians-only approach was in place in 82% (41/50) of ON
facilities and 59% (13/22) of BC facilities, but only 8% (2/26) of Prairie facilities. The number of QC and
Atlantic sites that had completed implementation was insufficient to allow assessment of planned hiring
practices.
Pharmacy Technician Salaries
For a summary and discussion of pharmacy technician salaries, see Chapter D, Human Resources.
1 History and overview of the regulation of pharmacy technicians. Toronto (ON): Ontario College of Pharmacists; [cited 2017
Dec 3]. Available from: http://www.ocpinfo.com/practice-education/practice-tools/support-materials/technician-overview/
2 Provincial legislation: Health Professions Act. Edmonton (AB): Alberta College of Pharmacists; [cited 2017 Dec 3]. Available
from: https://pharmacists.ab.ca/provincial-legislation
3 Provincial legislation: Regulation – acts and bylaws. Vancouver (BC): College of Pharmacists of British Columbia; [cited 2017
Dec 3]. Available from: http://www.bcpharmacists.org/acts-and-bylaws
4 Legislation regulations agreements. Halifax (NS): Nova Scotia College of Pharmacists; [cited 2017 Dec 3]. Available from:
http://www.nspharmacists.ca/?page=legislationandregulations
5 Pharmacy technicians. Winnipeg (MB): College of Pharmacists of Manitoba; [cited 2017 Dec 3]. Available from:
https://cphm.ca/site/pharmacytechnicians?nav=practice
6 Legislation. Moncton (NB): New Brunswick College of Pharmacists; [cited 2017 Dec 3]. Available from:
http://www.nbpharmacists.ca/. Select tab from home page.
7 Pharmacy technicians. Cornwall (PE): Prince Edward Island College of Pharmacists; [cited 2017 Dec 3]. Available from:
http://www.pepharmacists.ca/site/technicians?nav=04
8 Legislation. St. John’s (NL): Newfoundland and Labrador Pharmacy Board; [cited 2017 Dec 3]. Available from:
http://www.nlpb.ca/pharmacy-practice/legislation/
9 Professional practice. Regina (SK): Saskatchewan College of Pharmacy Professionals; [cited 2017 Dec 3]. Available from:
https://saskpharm.ca/site/profprac/propractice?nav=sidebar
10 Regulation defining the acts described in section 17 of the Pharmacy Act which may be performed by classes of persons other
than pharmacists.
Québec (QC): Government of Quebec; [cited 2017 Dec 5]. Available from: http://legisquebec.gouv.qc.ca/en/ShowDoc/cr/P-
10,%20r.%201
11 Projet de révision du rôle des assistants techniques en pharmacie (ATP). Standards de pratique du personnel technique et de
soutien technique en pharmacie. Montréal (QC): Ordre des pharmaciens du Québec ; [cited 2017 Dec 5]. Available from:
https://www.opq.org/doc/media/1822_38_fr-ca_0_standards_atp_final_maj_18_fev_2014.pdf
Hospital Pharmacy in Canada Report 2016/17 F – Pharmacy Technicians
www.hospitalpharmacysurvey.ca 57
12 CCAPP accredits professional pharmacy degree and pharmacy technician programs. Toronto (ON): Canadian Council for
Accreditation of Pharmacy Programs; [cited 2017 Dec 4]. Available from: http://ccapp-accredit.ca/
13 International programs. Toronto (ON): Canadian Council for Accreditation of Pharmacy Programs; [cited 2017 Dec 4].
Available from: http://ccapp-accredit.ca/international-programs/
14 Pharmacy Examining Board of Canada [home page]. Toronto (ON): Pharmacy Examining Board of Canada; [cited 2017 Dec
4]. Available from: www.pebc.ca
15 National statistics. Ottawa (ON): National Association of Pharmacy Regulatory Authorities; [cited 2017 Dec 4]. Available
from: http://napra.ca/national-statistics
16 National Pharmacy Technician Bridging Education Program. Ottawa (ON): National Association of Pharmacy Regulatory
Authorities; [cited 2017 Dec 4]. Available from: http://napra.ca/national-pharmacy-technician-bridging-education-program
17 Pharmacy technician - National Bridging Education Program / Programme passerelle nationale de formation de technicien(ne)
en pharmacie. Castlegar (BC); Selkirk College; [cited 2017 Dec 4]. Available from: http://selkirk.ca/program/pharmacy-
technician-bridging-national-education-program
18 Le programme passerelle national de formation de technicien(ne) en pharmacie offert au Québec. La Dépêche [electronic
bulletin of the Ordre des pharmaciens du Québec] 2014 Jul 4 [cited 2017 Dec 4]. Available from:
https://www.opq.org/CMS/Media/1941_38_fr-CA_0_La_Depeche___Juillet_2014_2.htm
19 Koehler T, Brown A. Documenting the evolution of the relationship between the pharmacy support workforce and pharmacists
to support patient care. Res Soc Admin Pharm. 2017;13(2):280-5.
20 Wanbon R, Lyder C, Villeneuve E, Shalansky S, Manuel L, Harding M. Medication reconciliation practices in Canadian
emergency departments: a national survey. Can J Hosp Pharm. 2015;68(3):202-9.
21 Leung M, Jung J, Lau W, Kiaii M, Jung B. Best possible medication history for hemodialysis patients obtained by a pharmacy
technician. Can J Hosp Pharm. 2009;62(5):386-91.
22 Johnston R, Saulnier L, Gould O. Best possible medication history in the emergency department: comparing pharmacy
technicians and pharmacists. Can J Hosp Pharm. 2010;63(5):359-65.
23 Smith SB, Mango MD. Pharmacy-based medication reconciliation program utilizing pharmacists and technicians: a process
improvement initiative. Hosp Pharm. 2013;48(2):112-9.
24 Minard LV, Deal H, Harrison ME, Toombs K, Neville H, Meade A. Pharmacists’ perceptions of the barriers and facilitators to
the implementation of clinical pharmacy key performance indicators. PLoS One. 2016;11(4):e0152903.
25 Neville H, Broadfield L, Harding C, Heukshorst S, Sweetapple J, Rolle M. Chemotherapy order entry by a clinical support
pharmacy technician in an outpatient medical day unit. Can J Hosp Pharm. 2016;69(3):202-8.
26 Man D, Mabasa VH. Feasibility of assisted warfarin dosing by clinical pharmacy support assistants (FAST-WARD study).
Can J Hosp Pharm. 2014;67(3):220-5.
27 Hickman L, Poole SG, Hopkins RE, Walters D, Dooley MJ. Comparing the accuracy of medication order verification between
pharmacists and a tech check tech model: a prospective randomised observational study. Res Social Adm Pharm. 2017 Nov 15.
DOI: 10.1016/j.sapharm.2017.11.007 [Epub ahead of print].
28 Schultz JM, Jeter CK, Keresztes JM, Martin NM, Mundy TK, Reichard JS, et al. ASHP statement on the roles of pharmacy
technicians. Am J Health Syst Pharm. 2016:73(12):928-30.
29 Exploring the role of hospital pharmacy technicians and assistants to enhance the delivery of patient centred care. A report to
members on the findings and outcomes of the ‘Pharmacy Technician and Assistant Role Redesign within Australian Hospitals
(Redesign) Project’. Collingwood (Australia): Society of Hospital Pharmacists of Australia; 2016 Nov [cited 2017 Dec 16].
Available from: https://www.shpa.org.au/sites/default/files/uploaded-content/website-
content/pharmacy_tech_summary_report.pdf
30 Boughen M, Sutton J, Fenn T, Wright D. Defining the role of the pharmacy technician and identifying their future role in
medicines optimization. Pharmacy. 2017;5(3):40.
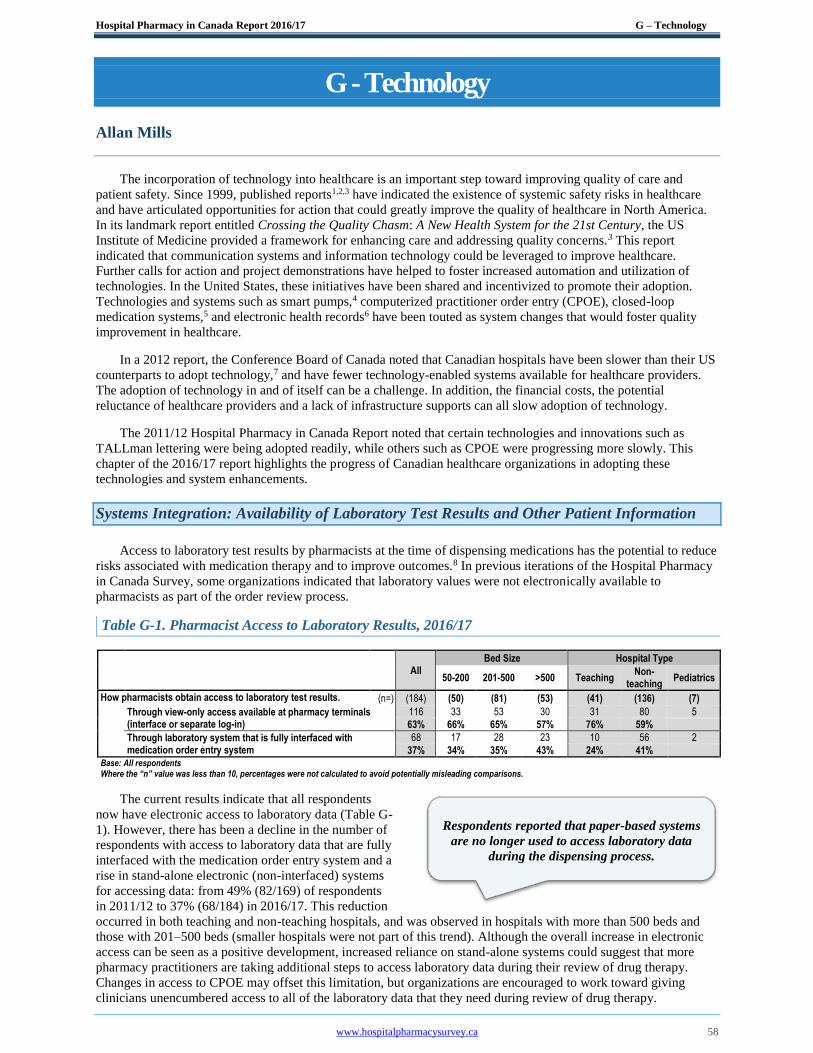
Hospital Pharmacy in Canada Report 2016/17 G – Technology
www.hospitalpharmacysurvey.ca 58
G - Technology
Allan Mills
The incorporation of technology into healthcare is an important step toward improving quality of care and
patient safety. Since 1999, published reports1,2,3 have indicated the existence of systemic safety risks in healthcare
and have articulated opportunities for action that could greatly improve the quality of healthcare in North America.
In its landmark report entitled Crossing the Quality Chasm: A New Health System for the 21st Century, the US
Institute of Medicine provided a framework for enhancing care and addressing quality concerns.3 This report
indicated that communication systems and information technology could be leveraged to improve healthcare.
Further calls for action and project demonstrations have helped to foster increased automation and utilization of
technologies. In the United States, these initiatives have been shared and incentivized to promote their adoption.
Technologies and systems such as smart pumps,4 computerized practitioner order entry (CPOE), closed-loop
medication systems,5 and electronic health records6 have been touted as system changes that would foster quality
improvement in healthcare.
In a 2012 report, the Conference Board of Canada noted that Canadian hospitals have been slower than their US
counterparts to adopt technology,7 and have fewer technology-enabled systems available for healthcare providers.
The adoption of technology in and of itself can be a challenge. In addition, the financial costs, the potential
reluctance of healthcare providers and a lack of infrastructure supports can all slow adoption of technology. The 2011/12 Hospital Pharmacy in Canada Report noted that certain technologies and innovations such as
TALLman lettering were being adopted readily, while others such as CPOE were progressing more slowly. This
chapter of the 2016/17 report highlights the progress of Canadian healthcare organizations in adopting these
technologies and system enhancements.
Systems Integration: Availability of Laboratory Test Results and Other Patient Information
Access to laboratory test results by pharmacists at the time of dispensing medications has the potential to reduce
risks associated with medication therapy and to improve outcomes.8 In previous iterations of the Hospital Pharmacy
in Canada Survey, some organizations indicated that laboratory values were not electronically available to
pharmacists as part of the order review process.
Table G-1. Pharmacist Access to Laboratory Results, 2016/17
All Bed Size Hospital Type
50-200 201-500 >500 Teaching
Non- teaching
Pediatrics
How pharmacists obtain access to laboratory test results. (n=) (184) (50) (81) (53) (41) (136) (7)
Through view-only access available at pharmacy terminals (interface or separate log-in)
116 33 53 30 31 80 5
63% 66% 65% 57% 76% 59%
Through laboratory system that is fully interfaced with medication order entry system
68 17 28 23 10 56 2
37% 34% 35% 43% 24% 41%
Base: All respondents Where the “n” value was less than 10, percentages were not calculated to avoid potentially misleading comparisons.
The current results indicate that all respondents
now have electronic access to laboratory data (Table G-
1). However, there has been a decline in the number of
respondents with access to laboratory data that are fully
interfaced with the medication order entry system and a
rise in stand-alone electronic (non-interfaced) systems
for accessing data: from 49% (82/169) of respondents
in 2011/12 to 37% (68/184) in 2016/17. This reduction
occurred in both teaching and non-teaching hospitals, and was observed in hospitals with more than 500 beds and
those with 201–500 beds (smaller hospitals were not part of this trend). Although the overall increase in electronic
access can be seen as a positive development, increased reliance on stand-alone systems could suggest that more
pharmacy practitioners are taking additional steps to access laboratory data during their review of drug therapy.
Changes in access to CPOE may offset this limitation, but organizations are encouraged to work toward giving
clinicians unencumbered access to all of the laboratory data that they need during review of drug therapy.
Respondents reported that paper-based systems
are no longer used to access laboratory data
during the dispensing process.
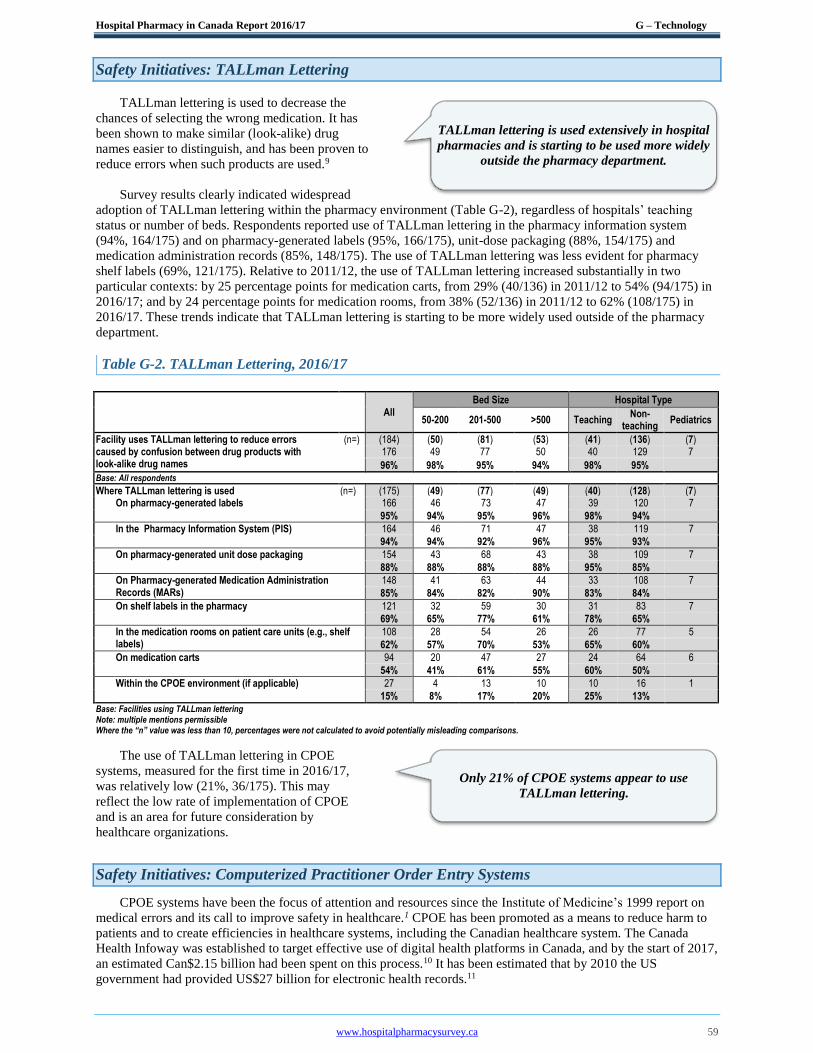
Hospital Pharmacy in Canada Report 2016/17 G – Technology
www.hospitalpharmacysurvey.ca 59
Safety Initiatives: TALLman Lettering
TALLman lettering is used to decrease the
chances of selecting the wrong medication. It has
been shown to make similar (look-alike) drug
names easier to distinguish, and has been proven to
reduce errors when such products are used.9
Survey results clearly indicated widespread
adoption of TALLman lettering within the pharmacy environment (Table G-2), regardless of hospitals’ teaching
status or number of beds. Respondents reported use of TALLman lettering in the pharmacy information system
(94%, 164/175) and on pharmacy-generated labels (95%, 166/175), unit-dose packaging (88%, 154/175) and
medication administration records (85%, 148/175). The use of TALLman lettering was less evident for pharmacy
shelf labels (69%, 121/175). Relative to 2011/12, the use of TALLman lettering increased substantially in two
particular contexts: by 25 percentage points for medication carts, from 29% (40/136) in 2011/12 to 54% (94/175) in
2016/17; and by 24 percentage points for medication rooms, from 38% (52/136) in 2011/12 to 62% (108/175) in
2016/17. These trends indicate that TALLman lettering is starting to be more widely used outside of the pharmacy
department.
Table G-2. TALLman Lettering, 2016/17
All Bed Size Hospital Type
50-200 201-500 >500 Teaching Non-
teaching Pediatrics
Facility uses TALLman lettering to reduce errors (n=) (184) (50) (81) (53) (41) (136) (7) caused by confusion between drug products with look-alike drug names
176 49 77 50 40 129 7
96% 98% 95% 94% 98% 95% Base: All respondents
Where TALLman lettering is used (n=) (175) (49) (77) (49) (40) (128) (7) On pharmacy-generated labels 166 46 73 47 39 120 7
95% 94% 95% 96% 98% 94%
In the Pharmacy Information System (PIS) 164 46 71 47 38 119 7
94% 94% 92% 96% 95% 93%
On pharmacy-generated unit dose packaging 154 43 68 43 38 109 7
88% 88% 88% 88% 95% 85%
On Pharmacy-generated Medication Administration Records (MARs)
148 41 63 44 33 108 7
85% 84% 82% 90% 83% 84%
On shelf labels in the pharmacy 121 32 59 30 31 83 7
69% 65% 77% 61% 78% 65%
In the medication rooms on patient care units (e.g., shelf labels)
108 28 54 26 26 77 5
62% 57% 70% 53% 65% 60%
On medication carts 94 20 47 27 24 64 6
54% 41% 61% 55% 60% 50%
Within the CPOE environment (if applicable) 27 4 13 10 10 16 1
15% 8% 17% 20% 25% 13% Base: Facilities using TALLman lettering Note: multiple mentions permissible Where the “n” value was less than 10, percentages were not calculated to avoid potentially misleading comparisons.
The use of TALLman lettering in CPOE
systems, measured for the first time in 2016/17,
was relatively low (21%, 36/175). This may
reflect the low rate of implementation of CPOE
and is an area for future consideration by
healthcare organizations.
Safety Initiatives: Computerized Practitioner Order Entry Systems
CPOE systems have been the focus of attention and resources since the Institute of Medicine’s 1999 report on
medical errors and its call to improve safety in healthcare.1 CPOE has been promoted as a means to reduce harm to
patients and to create efficiencies in healthcare systems, including the Canadian healthcare system. The Canada
Health Infoway was established to target effective use of digital health platforms in Canada, and by the start of 2017,
an estimated Can$2.15 billion had been spent on this process.10 It has been estimated that by 2010 the US
government had provided US$27 billion for electronic health records.11
TALLman lettering is used extensively in hospital
pharmacies and is starting to be used more widely
outside the pharmacy department.
Only 21% of CPOE systems appear to use
TALLman lettering.
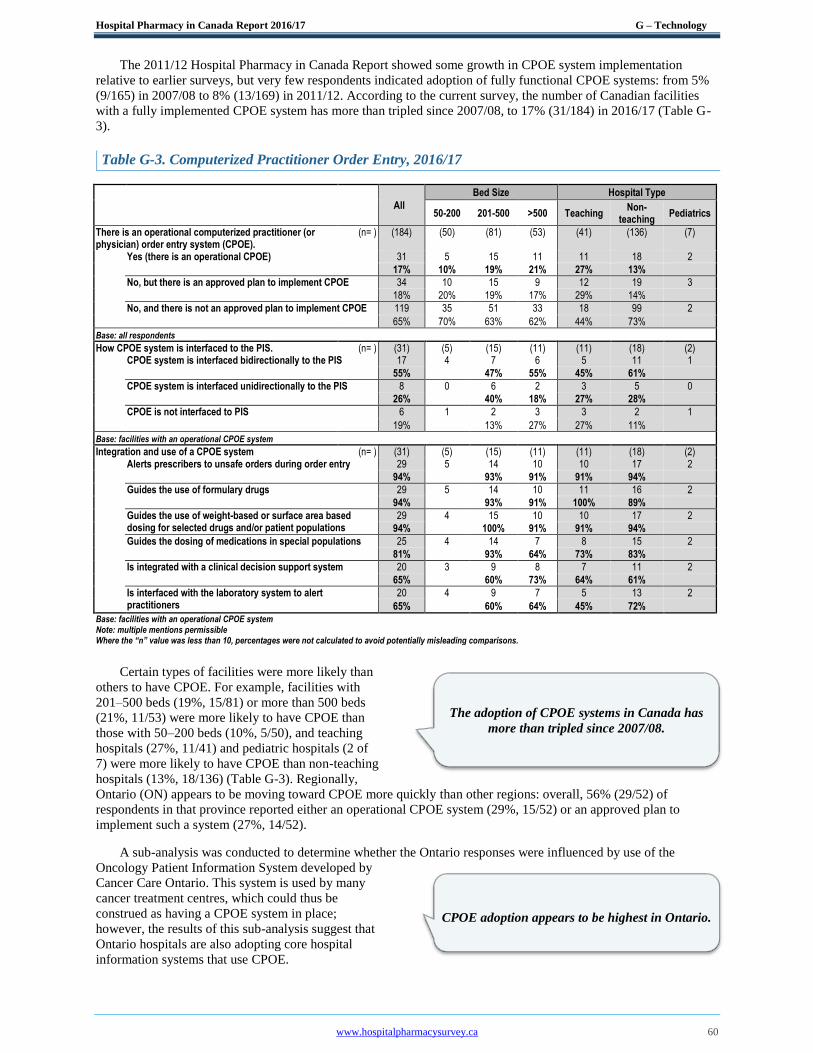
Hospital Pharmacy in Canada Report 2016/17 G – Technology
www.hospitalpharmacysurvey.ca 60
The 2011/12 Hospital Pharmacy in Canada Report showed some growth in CPOE system implementation
relative to earlier surveys, but very few respondents indicated adoption of fully functional CPOE systems: from 5%
(9/165) in 2007/08 to 8% (13/169) in 2011/12. According to the current survey, the number of Canadian facilities
with a fully implemented CPOE system has more than tripled since 2007/08, to 17% (31/184) in 2016/17 (Table G-
3).
Table G-3. Computerized Practitioner Order Entry, 2016/17
All
Bed Size Hospital Type
50-200 201-500 >500 Teaching
Non- teaching
Pediatrics
There is an operational computerized practitioner (or physician) order entry system (CPOE).
(n= ) (184) (50) (81) (53) (41) (136) (7)
Yes (there is an operational CPOE) 31 5 15 11 11 18 2
17% 10% 19% 21% 27% 13%
No, but there is an approved plan to implement CPOE 34 10 15 9 12 19 3
18% 20% 19% 17% 29% 14%
No, and there is not an approved plan to implement CPOE 119 35 51 33 18 99 2
65% 70% 63% 62% 44% 73%
Base: all respondents
How CPOE system is interfaced to the PIS. (n= ) (31) (5) (15) (11) (11) (18) (2) CPOE system is interfaced bidirectionally to the PIS 17 4 7 6 5 11 1
55% 47% 55% 45% 61%
CPOE system is interfaced unidirectionally to the PIS 8 0 6 2 3 5 0
26% 40% 18% 27% 28%
CPOE is not interfaced to PIS 6 1 2 3 3 2 1
19% 13% 27% 27% 11%
Base: facilities with an operational CPOE system
Integration and use of a CPOE system (n= ) (31) (5) (15) (11) (11) (18) (2) Alerts prescribers to unsafe orders during order entry 29 5 14 10 10 17 2
94% 93% 91% 91% 94%
Guides the use of formulary drugs 29 5 14 10 11 16 2
94% 93% 91% 100% 89%
Guides the use of weight-based or surface area based dosing for selected drugs and/or patient populations
29 4 15 10 10 17 2
94% 100% 91% 91% 94%
Guides the dosing of medications in special populations 25 4 14 7 8 15 2
81% 93% 64% 73% 83%
Is integrated with a clinical decision support system 20 3 9 8 7 11 2
65% 60% 73% 64% 61%
Is interfaced with the laboratory system to alert practitioners
20 4 9 7 5 13 2
65% 60% 64% 45% 72% Base: facilities with an operational CPOE system Note: multiple mentions permissible Where the “n” value was less than 10, percentages were not calculated to avoid potentially misleading comparisons.
Certain types of facilities were more likely than
others to have CPOE. For example, facilities with
201–500 beds (19%, 15/81) or more than 500 beds
(21%, 11/53) were more likely to have CPOE than
those with 50–200 beds (10%, 5/50), and teaching
hospitals (27%, 11/41) and pediatric hospitals (2 of
7) were more likely to have CPOE than non-teaching
hospitals (13%, 18/136) (Table G-3). Regionally,
Ontario (ON) appears to be moving toward CPOE more quickly than other regions: overall, 56% (29/52) of
respondents in that province reported either an operational CPOE system (29%, 15/52) or an approved plan to
implement such a system (27%, 14/52).
A sub-analysis was conducted to determine whether the Ontario responses were influenced by use of the
Oncology Patient Information System developed by
Cancer Care Ontario. This system is used by many
cancer treatment centres, which could thus be
construed as having a CPOE system in place;
however, the results of this sub-analysis suggest that
Ontario hospitals are also adopting core hospital
information systems that use CPOE.
The adoption of CPOE systems in Canada has
more than tripled since 2007/08.
CPOE adoption appears to be highest in Ontario.

Hospital Pharmacy in Canada Report 2016/17 G – Technology
www.hospitalpharmacysurvey.ca 61
Most of the core hospital CPOE systems were
connected to the pharmacy information system by a
bidirectional (55%, 17/31) or a unidirectional (26%,
8/31) interface. The most commonly reported
purposes of CPOE systems were to support the use
of formulary agents, to guide dosing for unsafe orders
and to guide dosing based on height or weight (each
reported by 94% of respondents, 29/31). CPOE systems were also used to support dosing guidelines for special
populations (81%, 25/31) and to provide laboratory data (65%, 20/31) and clinical decision support (65%, 20/31).
These results are similar to those from the 2011/12 survey.
Although the greater number of respondents with a
CPOE system is encouraging, it must also be noted
that 65% (119/184) of respondents reported that their
organizations had no approved plan to implement
CPOE. This result, similar to those obtained in
2011/12 (60%, 101/169) and 2009/10 (68%,
109/160), indicates that organizations with no plans to implement CPOE nearly 10 years ago have not changed their
approach in the interim. Conversely, it appears that a number of the respondents who indicated in 2011/12 that they
had an approved plan for CPOE have now completed the implementation.
By contrast, US hospitals have accelerated their use of CPOE systems. According to the 2016 survey of the
American Society of Health-System Pharmacists, most organizations (90.7%) were using CPOE systems linked to a
pharmacy information system.12 Unlike the growth in the adoption of CPOE systems in the US, it appears that the
situation in Canada remains unchanged from 2011/12, with a majority of Canadian facilities not having prioritized
CPOE systems.
Safety Initiatives: Smart Pumps
The adoption of smart pumps has increased
steadily since the 2007/08 survey, with 89%
(163/184) of current respondents indicating that they
now have this technology (Table G-4, Table G-5).
This trend is coupled with increases in the utilization
of wireless technology to upload or download smart
pump data, from 24% (30/125) in 2011/12 to 64%
(103/162) in 2016/17, and in annual updating of the
pump library, from 58% (72/125) in 2011/12 to 77%
(125/163) in 2016/17. Although there were some
regional differences in utilization, there seemed to be
no differences based on teaching status or hospital
size.
All pediatric organizations completing the
survey had fully implemented smart pumps with
universal use of wireless capabilities and annual updating of pump libraries.
Table G-4 Smart Pumps, 2016/17
All
Bed Size Hospital Type
50 - 200 201- 500 >500 Teaching
Non- teaching
Pediatrics
Hospital uses Smart pumps (n= ) (184) (50) (81) (53) (41) (136) (7) 163 44 74 45 37 119 7 89% 88% 91% 85% 90% 88% Base: All respondents
Facility used a wireless network to upload or (n= ) (162) (43) (74) (45) (36) (119) (7) download data to smart pumps 103 25 49 29 30 66 7
64% 58% 66% 64% 83% 55%
Facility reviews and updates the drug-specific pump (n= ) (163) (44) (74) (45) (37) (119) (7) programming (i.e., the pump library) at least annually 125 31 57 37 31 87 7
77% 70% 77% 82% 84% 73% Base: Facilities using Smart pumps Where the “n” value was less than 10, percentages were not calculated to avoid potentially misleading comparisons.
The use of wireless smart pumps is becoming
standard practice.
All pediatric hospitals reported the use of wireless
smart pumps.
Smart Pump use has increased over the past 10
years.
After a decade, there was no measurable change
in the number of facilities with no approved plan
to implement CPOE.
Implemented CPOE systems support safe
prescribing through dosing guidelines.
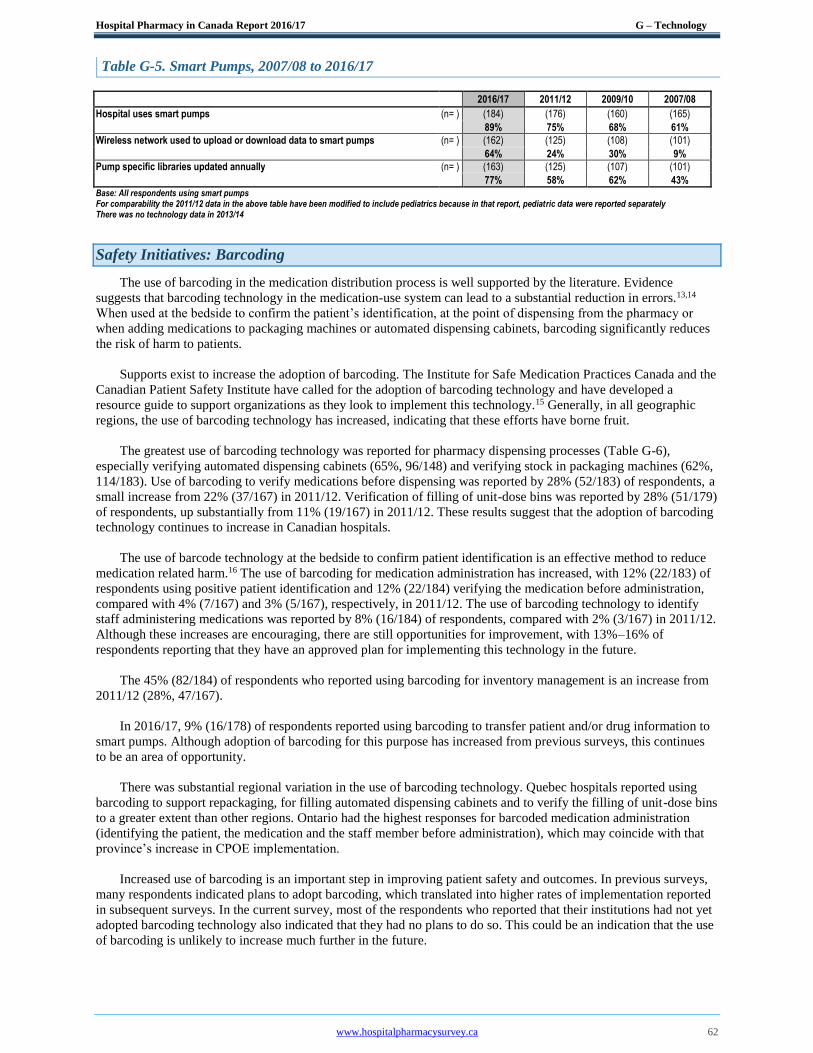
Hospital Pharmacy in Canada Report 2016/17 G – Technology
www.hospitalpharmacysurvey.ca 62
Table G-5. Smart Pumps, 2007/08 to 2016/17
2016/17 2011/12 2009/10 2007/08
Hospital uses smart pumps (n= ) (184) (176) (160) (165) 89% 75% 68% 61% Wireless network used to upload or download data to smart pumps (n= ) (162) (125) (108) (101) 64% 24% 30% 9% Pump specific libraries updated annually (n= ) (163) (125) (107) (101) 77% 58% 62% 43% Base: All respondents using smart pumps
For comparability the 2011/12 data in the above table have been modified to include pediatrics because in that report, pediatric data were reported separately There was no technology data in 2013/14
Safety Initiatives: Barcoding
The use of barcoding in the medication distribution process is well supported by the literature. Evidence
suggests that barcoding technology in the medication-use system can lead to a substantial reduction in errors.13,14
When used at the bedside to confirm the patient’s identification, at the point of dispensing from the pharmacy or
when adding medications to packaging machines or automated dispensing cabinets, barcoding significantly reduces
the risk of harm to patients.
Supports exist to increase the adoption of barcoding. The Institute for Safe Medication Practices Canada and the
Canadian Patient Safety Institute have called for the adoption of barcoding technology and have developed a
resource guide to support organizations as they look to implement this technology.15 Generally, in all geographic
regions, the use of barcoding technology has increased, indicating that these efforts have borne fruit.
The greatest use of barcoding technology was reported for pharmacy dispensing processes (Table G-6),
especially verifying automated dispensing cabinets (65%, 96/148) and verifying stock in packaging machines (62%,
114/183). Use of barcoding to verify medications before dispensing was reported by 28% (52/183) of respondents, a
small increase from 22% (37/167) in 2011/12. Verification of filling of unit-dose bins was reported by 28% (51/179)
of respondents, up substantially from 11% (19/167) in 2011/12. These results suggest that the adoption of barcoding
technology continues to increase in Canadian hospitals.
The use of barcode technology at the bedside to confirm patient identification is an effective method to reduce
medication related harm.16 The use of barcoding for medication administration has increased, with 12% (22/183) of
respondents using positive patient identification and 12% (22/184) verifying the medication before administration,
compared with 4% (7/167) and 3% (5/167), respectively, in 2011/12. The use of barcoding technology to identify
staff administering medications was reported by 8% (16/184) of respondents, compared with 2% (3/167) in 2011/12.
Although these increases are encouraging, there are still opportunities for improvement, with 13%–16% of
respondents reporting that they have an approved plan for implementing this technology in the future.
The 45% (82/184) of respondents who reported using barcoding for inventory management is an increase from
2011/12 (28%, 47/167).
In 2016/17, 9% (16/178) of respondents reported using barcoding to transfer patient and/or drug information to
smart pumps. Although adoption of barcoding for this purpose has increased from previous surveys, this continues
to be an area of opportunity.
There was substantial regional variation in the use of barcoding technology. Quebec hospitals reported using
barcoding to support repackaging, for filling automated dispensing cabinets and to verify the filling of unit-dose bins
to a greater extent than other regions. Ontario had the highest responses for barcoded medication administration
(identifying the patient, the medication and the staff member before administration), which may coincide with that
province’s increase in CPOE implementation.
Increased use of barcoding is an important step in improving patient safety and outcomes. In previous surveys,
many respondents indicated plans to adopt barcoding, which translated into higher rates of implementation reported
in subsequent surveys. In the current survey, most of the respondents who reported that their institutions had not yet
adopted barcoding technology also indicated that they had no plans to do so. This could be an indication that the use
of barcoding is unlikely to increase much further in the future.

Hospital Pharmacy in Canada Report 2016/17 G – Technology
www.hospitalpharmacysurvey.ca 63
Table G-6 Barcoding, 2016/17
All Bed Size Hospital Type Region
Uses of Barcoding and Extent of Use 50-200 201-500 >500 Teaching
Non- teaching
Pediatrics BC/YT Prai ON QC Atl
Verify stocking of automated dispensing cabinets (in facilities with ADCs)
(n= ) (148) (38) (63) (47) (37) (105) (6) (18) (24) (46) (41) (19)
Yes, we are using bar-coding for this application in 51%-100% of our facility
84 15 39 30 21 57 6 5 13 22 33 11
57% 39% 62% 64% 57% 54%
28% 54% 48% 80% 58%
Yes, we are using bar-coding for this application in <50% of our facility
12 2 6 4 4 8 0 2 2 5 1 2
8% 5% 10% 9% 11% 8%
11% 8% 11% 2% 11%
Verify stocking of automated re-packaging machines
(n= ) (183) (49) (81) (53) (40) (136) (7) (29) (39) (52) (42) (21)
Yes, we are using bar-coding for this application in 51%-100% of our facility
105 18 52 35 18 82 5 13 15 35 34 8
57% 37% 64% 66% 45% 60%
45% 38% 67% 81% 38%
Yes, we are using bar-coding for this application in <50% of our facility
9 2 2 5 3 6 0 1 1 0 3 4
5% 4% 2% 9% 8% 4%
3% 3% 0% 7% 19%
Inventory management (n= ) (184) (50) (81) (53) (41) (136) (7) (29) (39) (52) (43) (21) Yes, we are using bar-coding for this
application in 51%-100% of our facility 53 6 30 17 9 40 4 14 7 12 18 2
29% 12% 37% 32% 22% 29%
48% 18% 23% 42% 10%
Yes, we are using bar-coding for this application in <50% of our facility
29 4 9 16 7 20 2 2 6 3 15 3
16% 8% 11% 30% 17% 15%
7% 15% 6% 35% 14%
Verify filling of unit dose bins (n= ) (179) (48) (80) (51) (39) (134) (6) (28) (36) (51) (43) (21) Yes, we are using bar-coding for this
application in 51%-100% of our facility 46 9 22 15 11 32 3 1 2 17 22 4
26% 19% 28% 29% 28% 24%
4% 6% 33% 51% 19%
Yes, we are using bar-coding for this application in <50% of our facility
5 1 2 2 1 4 0 0 1 2 1 1
3% 2% 3% 4% 3% 3%
0% 3% 4% 2% 5%
Verify drug selection before dispensing from the pharmacy
(n= ) (183) (50) (80) (53) (41) (135) (7) (29) (39) (51) (43) (21)
Yes, we are using bar-coding for this application in 51%-100% of our facility
44 4 25 15 7 34 3 1 3 12 25 3
24% 8% 31% 28% 17% 25%
3% 8% 24% 58% 14%
Yes, we are using bar-coding for this application in <50% of our facility
8 0 3 5 2 6 0 0 0 4 4 0
4% 0% 4% 9% 5% 4%
0% 0% 8% 9% 0%
Verify drug selection before administration to a patient
(n= ) (184) (50) (81) (53) (41) (136) (7) (29) (39) (52) (43) (21)
Yes, we are using bar-coding for this application in 51%-100% of our facility
16 6 6 4 2 13 1 1 0 15 0 0
9% 12% 7% 8% 5% 10%
3% 0% 29% 0% 0%
Yes, we are using bar-coding for this application in <50% of our facility
6 0 5 1 3 3 0 1 0 3 2 0
3% 0% 6% 2% 7% 2%
3% 0% 6% 5% 0%
Identify the patient during medication administration
(n= ) (183) (50) (80) (53) (41) (135 (7) (29) (39) (52) (42) (21)
Yes, we are using bar-coding for this application in 51%-100% of our facility
15 5 7 3 2 13 0 1 0 14 0 0
8% 10% 9% 6% 5% 10%
3% 0% 27% 0% 0%
Yes, we are using bar-coding for this application in <50% of our facility
7 2 2 3 3 3 1 1 5 1 0 0
4% 4% 3% 6% 7% 2%
3% 13% 2% 0% 0%
Identify the staff member during medication administration
(n= ) (184) (50) (81) (53) (41) (136) (7) (29) (39) (52) (43) (21)
Yes, we are using bar-coding for this application in 51%-100% of our facility
8 2 4 2 1 7 0 0 0 8 0 0
4% 4% 5% 4% 2% 5%
0% 0% 15% 0% 0%
Yes, we are using bar-coding for this application in <50% of our facility
(8 2 3 3 4 3 1 0 6 2 0 0
4% 4% 4% 6% 10% 2%
0% 15% 4% 0% 0%
Transfer patient- and/or drug-specific information to smart pump
(n= ) (178) (48) (78) (52) (38) (133) (7) (26) (39) (52) (41) (20)
Yes, we are using bar-coding for this application in 51%-100% of our facility
8 4 1 3 3 2 3 1 5 1 1 0
4% 8% 1% 6% 8% 2%
4% 13% 2% 2% 0%
Yes, we are using bar-coding for this application in <50% of our facility
8 2 3 3 4 3 1 0 1 5 0 2
4% 4% 4% 6% 11% 2%
0% 3% 10% 0% 10% Base: All respondents
Where the “n” value was less than 10, percentages were not calculated to avoid potentially misleading comparisons.
Conclusions
The adoption of healthcare technology is believed to be an important step in improving patient care outcomes.
Quality enhancement has already been achieved by effectively incorporating technology and standardization into
care processes. Technologies such as electronic health records and CPOE are designed to effectively communicate
information and data, thus allowing the healthcare team to make informed, effective decisions regarding treatment.
Safe medication practices require the effective distribution and administration of medications, and their appropriate
utilization and monitoring; all of these steps require effective communication and reliable data.

Hospital Pharmacy in Canada Report 2016/17 G – Technology
www.hospitalpharmacysurvey.ca 64
The results highlighted here suggest that progress continues to be made in the adoption of technology as part of
pharmacy patient care processes. This progress is encouraging, especially with the adoption of medication-related
technologies beyond the walls of the pharmacy (e.g., smart pumps, TALLman lettering). Increases reported for the
use of barcoding technology and CPOE are also encouraging. Nonetheless, opportunities remain. The increase in
CPOE implementation indicates that respondents who reported in 2011/12 that they planned to implement CPOE
have carried out these plans. However, the 2016/17 data suggest that there may be few additional facilities with
plans to implement CPOE and electronic health records, making future increases less likely. Sadly, this could mean
that it will be a long time before technologies such as CPOE will be routinely used in all Canadian healthcare
facilities.
The data suggest an encouraging pattern of continued adoption of these technologies, albeit at a potentially
slower rate than previously anticipated. It is hoped that ongoing progress continues at an accelerated pace in order to
support the quality, efficiency and safety of medication systems and processes.
1 Institute of Medicine. To err is human: building a safer health system. Washington (DC): National Academy Press; 1999.
2 Baker GR, Norton PG, Flintoft V, Blais R, Brown A, Cox J, et al. The Canadian Adverse Events Study: the incidence of
adverse events among hospital patients in Canada. CMAJ. 2004;170(11):1678-86.
3 Institute of Medicine. Crossing the quality chasm: a new health system for the 21st century. Washington (DC): National
Academies Press; 2001.
4 Proceedings from the ISMP Summit on the Use of Smart Infusion Pumps: guidelines for safe implementation and use. Horsham
(PA): Institute for Safe Medication Practices; 2009 [cited 2017 Nov 13]. Available from:
https://www.ismp.org/tools/guidelines/smartpumps/printerVersion.pdf
5 Dixon BE, Zafar A. Inpatient computerized provider order entry (CPOE): findings from the AHRQ Health IT Portfolio. AHRQ
Publ No. 09-003-EF. Rockville (MD) : Agency for Healthcare Research and Quality; 2009 [cited 2017 Nov 13]. Available from:
https://healthit.ahrq.gov/sites/default/files/docs/page/09-0031-EF_cpoe.pdf
6 Menachemi N, Chukmaitov A, Saunders C, Brooks RG. Hospital quality of care: Does information technology matter? The
relationship between information technology adoption and quality of care. Health Care Manage Rev. 2008;33(1):51-9.
7 Muzyka D, Hodgson G, Prada G. The inconvenient truths about Canadian health care. Ottawa (ON): Conference Board of
Canada; 2012 [cited 2017 Nov 13]. Available from:
http://www.conferenceboard.ca/CASHC/research/2012/inconvenient_truths.aspx
8 Schiff GD, Klass D, Peterson J, Shah G, Bates DW. Linking laboratory and pharmacy: opportunities for reducing errors and
improving care. Arch Intern Med. 2003;163(8):893-900.
9 Filik R, Purdy K, Gale A, Gerrett D. Labeling of medicines and patient safety: evaluating methods of reducing drug name
confusion. Hum Factors. 2006;48(1):39-47.
10 Green M. Digital health In Canada: transforming health care through innovation [keynote presentation]. eTELEMED 2017: 9th
International Conference on eHealth, Telemedicine, and Social Medicine; Nice (France); 2017 Mar 19–23 [cited 2017 Nov 13].
Available from: https://www.iaria.org/conferences2017/fileseTELEMED17/MGreen_Keynote_eTELEMED%202017.pdf
11 Webster PC. Electronic health records a “strong priority” for US government. CMAJ. 2010;182(8):E315-6.
12 Pedersen CA, Schneider PJ, Scheckelhoff DJ. ASHP national survey of pharmacy practice in hospital settings: prescribing and
transcribing —2016. Am J Health Syst Pharm. 2017;74(17):1336-52.
13 Poon EG, Keohane CA, Yoon CS, Ditmore M, Bane A, Levtzion-Korach O, et al. Effect of bar-code technology on the safety
of medication administration. N Engl J Med. 2010;362(18):1698-707.
14 Poon EG, Cina JL, Churchill W, Patel N, Featherstone E, Rothschild JM, et al. Medication dispensing errors and potential
adverse drug events before and after implementing bar code technology in the pharmacy. Ann Intern Med. 2006;145(6):426-34.
15 Medication bar code system implementation planning: a resource guide. Toronto (ON): Institute for Safe Medication Practices
Canada; 2013 [cited 2018 Mar 16]. Available from: https://www.ismp-canada.org/barcoding/
16 Cochran GL, Jones KJ, Brockman J, Skinner A, Hicks RW. Errors prevented by and associated with bar-code medication
administration systems. Jt Comm J Qual Patient Saf. 2007;33(5):293-301.
https://www.ncbi.nlm.nih.gov/pubmed/?term=Flintoft%20V%5BAuthor%5D&cauthor=true&cauthor_uid=15159366
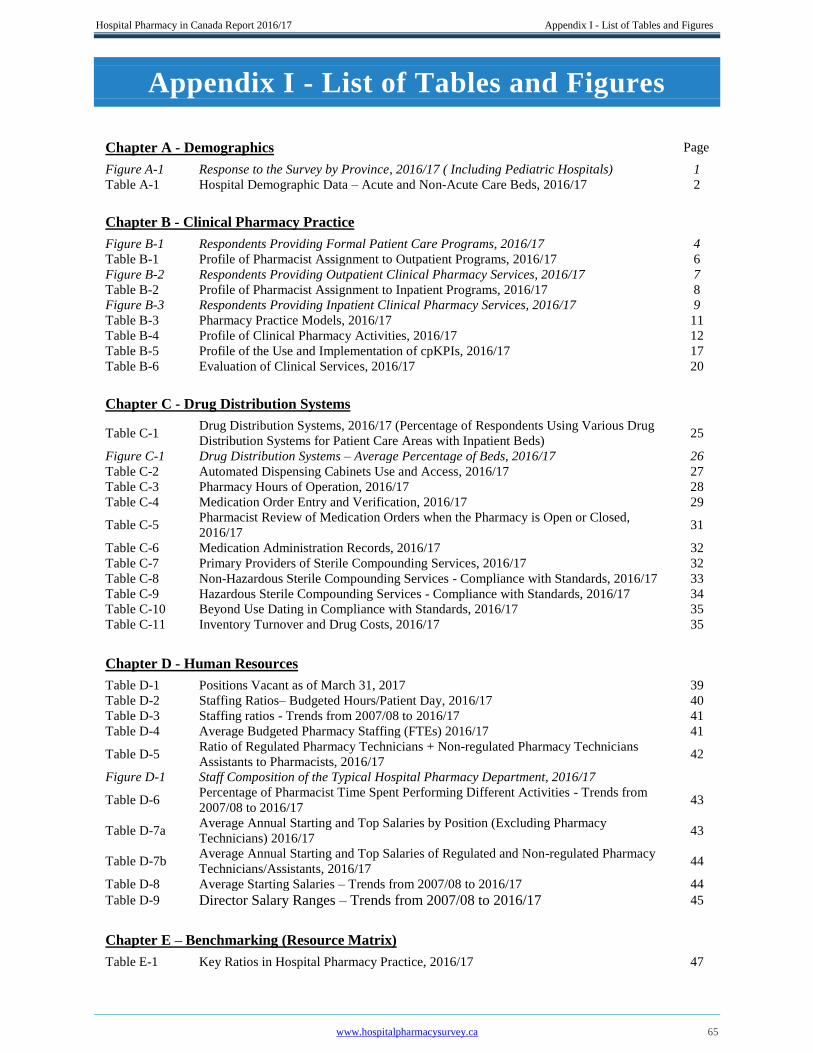
Hospital Pharmacy in Canada Report 2016/17 Appendix I - List of Tables and Figures
www.hospitalpharmacysurvey.ca 65
Appendix I - List of Tables and Figures
Chapter A - Demographics Page
Figure A-1 Response to the Survey by Province, 2016/17 ( Including Pediatric Hospitals) 1
Table A-1 Hospital Demographic Data – Acute and Non-Acute Care Beds, 2016/17 2
Chapter B - Clinical Pharmacy Practice
Figure B-1 Respondents Providing Formal Patient Care Programs, 2016/17 4
Table B-1 Profile of Pharmacist Assignment to Outpatient Programs, 2016/17 6
Figure B-2 Respondents Providing Outpatient Clinical Pharmacy Services, 2016/17 7
Table B-2 Profile of Pharmacist Assignment to Inpatient Programs, 2016/17 8
Figure B-3 Respondents Providing Inpatient Clinical Pharmacy Services, 2016/17 9
Table B-3 Pharmacy Practice Models, 2016/17 11
Table B-4 Profile of Clinical Pharmacy Activities, 2016/17 12
Table B-5 Profile of the Use and Implementation of cpKPIs, 2016/17 17
Table B-6 Evaluation of Clinical Services, 2016/17 20
Chapter C - Drug Distribution Systems
Table C-1 Drug Distribution Systems, 2016/17 (Percentage of Respondents Using Various Drug
Distribution Systems for Patient Care Areas with Inpatient Beds) 25
Figure C-1 Drug Distribution Systems – Average Percentage of Beds, 2016/17 26
Table C-2 Automated Dispensing Cabinets Use and Access, 2016/17 27
Table C-3 Pharmacy Hours of Operation, 2016/17 28
Table C-4 Medication Order Entry and Verification, 2016/17 29
Table C-5 Pharmacist Review of Medication Orders when the Pharmacy is Open or Closed,
2016/17 31
Table C-6 Medication Administration Records, 2016/17 32
Table C-7 Primary Providers of Sterile Compounding Services, 2016/17 32
Table C-8 Non-Hazardous Sterile Compounding Services - Compliance with Standards, 2016/17 33
Table C-9 Hazardous Sterile Compounding Services - Compliance with Standards, 2016/17 34
Table C-10 Beyond Use Dating in Compliance with Standards, 2016/17 35
Table C-11 Inventory Turnover and Drug Costs, 2016/17 35
Chapter D - Human Resources
Table D-1 Positions Vacant as of March 31, 2017 39
Table D-2 Staffing Ratios– Budgeted Hours/Patient Day, 2016/17 40
Table D-3 Staffing ratios - Trends from 2007/08 to 2016/17 41
Table D-4 Average Budgeted Pharmacy Staffing (FTEs) 2016/17 41
Table D-5 Ratio of Regulated Pharmacy Technicians + Non-regulated Pharmacy Technicians
Assistants to Pharmacists, 2016/17 42
Figure D-1 Staff Composition of the Typical Hospital Pharmacy Department, 2016/17
Table D-6 Percentage of Pharmacist Time Spent Performing Different Activities - Trends from
2007/08 to 2016/17 43
Table D-7a Average Annual Starting and Top Salaries by Position (Excluding Pharmacy
Technicians) 2016/17 43
Table D-7b Average Annual Starting and Top Salaries of Regulated and Non-regulated Pharmacy
Technicians/Assistants, 2016/17 44
Table D-8 Average Starting Salaries – Trends from 2007/08 to 2016/17 44
Table D-9 Director Salary Ranges – Trends from 2007/08 to 2016/17 45
Chapter E – Benchmarking (Resource Matrix)
Table E-1 Key Ratios in Hospital Pharmacy Practice, 2016/17 47

Hospital Pharmacy in Canada Report 2016/17 Appendix I - List of Tables and Figures
www.hospitalpharmacysurvey.ca 66
Chapter F – Pharmacy Technicians
Table F-1
Functions Performed by Technicians, Functions Checked by Technicians and Validation
Requirements 2016/17 49
Figure F-1 Functions Checked by Pharmacy Technicians, 2007/08 vs. 2016/17 50
Figure F-2 Technician Validation Requirements for Performing and Checking, 2013/14 vs. 2016/17 51
Table F-2 Support Roles for Pharmacy Technicians for Clinical Pharmacy Services, 2016/17 52
Table F-3 Regulated/Licensed Pharmacy Technicians, 2016/17 53
Table F-4 Recognition and Support for Technician Certification and Regulation, 2016/17 54
Table F-5 Individuals Who Do Not Become Registered as Pharmacy Technicians, 2016/17 55
Table F-6 Planned Pharmacy Technician Hiring Practices, 2016/17 56
Chapter G – Technology
Table G-1 Pharmacist Access To Laboratory Results, 2016/17 58
Table G-2 TALLman Lettering, 2016/17 59
Table G-3 Computerized Practitioner Order Entry (CPOE), 2016/17 60
Table G-4 Smart Pumps, 2016/17 61
Table G-5 Smart Pumps, 2007/08 to 2016/17 62
Tablet G-6 Barcoding, 2016/17 63
Appendices
I List of Tables and Figures 65
II Recognition List 67
III Key Ratios 69
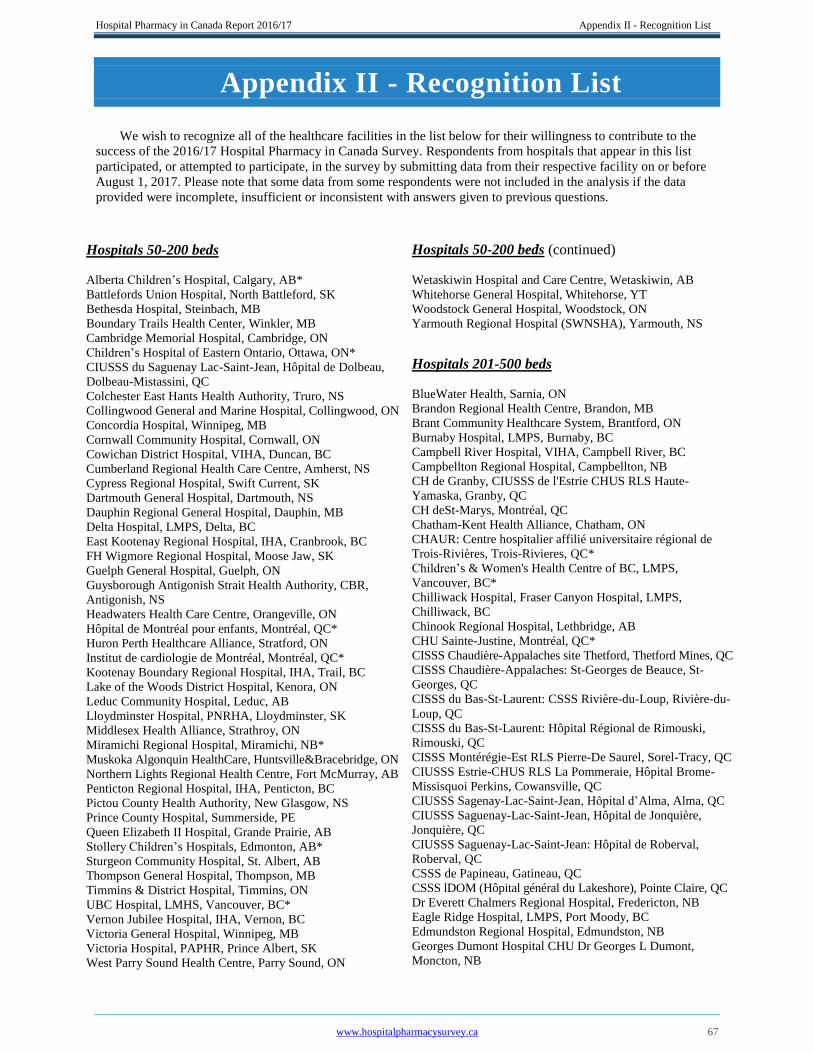
Hospital Pharmacy in Canada Report 2016/17 Appendix II - Recognition List
www.hospitalpharmacysurvey.ca 67
Appendix II - Recognition List
We wish to recognize all of the healthcare facilities in the list below for their willingness to contribute to the
success of the 2016/17 Hospital Pharmacy in Canada Survey. Respondents from hospitals that appear in this list
participated, or attempted to participate, in the survey by submitting data from their respective facility on or before
August 1, 2017. Please note that some data from some respondents were not included in the analysis if the data
provided were incomplete, insufficient or inconsistent with answers given to previous questions.
Hospitals 50-200 beds
Alberta Children’s Hospital, Calgary, AB*
Battlefords Union Hospital, North Battleford, SK
Bethesda Hospital, Steinbach, MB
Boundary Trails Health Center, Winkler, MB
Cambridge Memorial Hospital, Cambridge, ON
Children’s Hospital of Eastern Ontario, Ottawa, ON*
CIUSSS du Saguenay Lac-Saint-Jean, Hôpital de Dolbeau,
Dolbeau-Mistassini, QC
Colchester East Hants Health Authority, Truro, NS
Collingwood General and Marine Hospital, Collingwood, ON
Concordia Hospital, Winnipeg, MB
Cornwall Community Hospital, Cornwall, ON
Cowichan District Hospital, VIHA, Duncan, BC
Cumberland Regional Health Care Centre, Amherst, NS
Cypress Regional Hospital, Swift Current, SK
Dartmouth General Hospital, Dartmouth, NS
Dauphin Regional General Hospital, Dauphin, MB
Delta Hospital, LMPS, Delta, BC
East Kootenay Regional Hospital, IHA, Cranbrook, BC
FH Wigmore Regional Hospital, Moose Jaw, SK
Guelph General Hospital, Guelph, ON
Guysborough Antigonish Strait Health Authority, CBR,
Antigonish, NS
Headwaters Health Care Centre, Orangeville, ON
Hôpital de Montréal pour enfants, Montréal, QC*
Huron Perth Healthcare Alliance, Stratford, ON
Institut de cardiologie de Montréal, Montréal, QC*
Kootenay Boundary Regional Hospital, IHA, Trail, BC
Lake of the Woods District Hospital, Kenora, ON
Leduc Community Hospital, Leduc, AB
Lloydminster Hospital, PNRHA, Lloydminster, SK
Middlesex Health Alliance, Strathroy, ON
Miramichi Regional Hospital, Miramichi, NB*
Muskoka Algonquin HealthCare, Huntsville&Bracebridge, ON
Northern Lights Regional Health Centre, Fort McMurray, AB
Penticton Regional Hospital, IHA, Penticton, BC
Pictou County Health Authority, New Glasgow, NS
Prince County Hospital, Summerside, PE
Queen Elizabeth II Hospital, Grande Prairie, AB
Stollery Children’s Hospitals, Edmonton, AB*
Sturgeon Community Hospital, St. Albert, AB
Thompson General Hospital, Thompson, MB
Timmins & District Hospital, Timmins, ON
UBC Hospital, LMHS, Vancouver, BC*
Vernon Jubilee Hospital, IHA, Vernon, BC
Victoria General Hospital, Winnipeg, MB
Victoria Hospital, PAPHR, Prince Albert, SK
West Parry Sound Health Centre, Parry Sound, ON
Hospitals 50-200 beds (continued)
Wetaskiwin Hospital and Care Centre, Wetaskiwin, AB
Whitehorse General Hospital, Whitehorse, YT
Woodstock General Hospital, Woodstock, ON
Yarmouth Regional Hospital (SWNSHA), Yarmouth, NS
Hospitals 201-500 beds
BlueWater Health, Sarnia, ON
Brandon Regional Health Centre, Brandon, MB
Brant Community Healthcare System, Brantford, ON
Burnaby Hospital, LMPS, Burnaby, BC
Campbell River Hospital, VIHA, Campbell River, BC
Campbellton Regional Hospital, Campbellton, NB
CH de Granby, CIUSSS de l'Estrie CHUS RLS Haute-
Yamaska, Granby, QC
CH deSt-Marys, Montréal, QC
Chatham-Kent Health Alliance, Chatham, ON
CHAUR: Centre hospitalier affilié universitaire régional de
Trois-Rivières, Trois-Rivieres, QC*
Children’s & Women's Health Centre of BC, LMPS,
Vancouver, BC*
Chilliwack Hospital, Fraser Canyon Hospital, LMPS,
Chilliwack, BC
Chinook Regional Hospital, Lethbridge, AB
CHU Sainte-Justine, Montréal, QC*
CISSS Chaudière-Appalaches site Thetford, Thetford Mines, QC
CISSS Chaudière-Appalaches: St-Georges de Beauce, St-
Georges, QC
CISSS du Bas-St-Laurent: CSSS Rivière-du-Loup, Rivière-du-
Loup, QC
CISSS du Bas-St-Laurent: Hôpital Régional de Rimouski,
Rimouski, QC
CISSS Montérégie-Est RLS Pierre-De Saurel, Sorel-Tracy, QC
CIUSSS Estrie-CHUS RLS La Pommeraie, Hôpital Brome-
Missisquoi Perkins, Cowansville, QC
CIUSSS Sagenay-Lac-Saint-Jean, Hôpital d’Alma, Alma, QC
CIUSSS Saguenay-Lac-Saint-Jean, Hôpital de Jonquière,
Jonquière, QC
CIUSSS Saguenay-Lac-Saint-Jean: Hôpital de Roberval,
Roberval, QC
CSSS de Papineau, Gatineau, QC
CSSS lDOM (Hôpital général du Lakeshore), Pointe Claire, QC
Dr Everett Chalmers Regional Hospital, Fredericton, NB
Eagle Ridge Hospital, LMPS, Port Moody, BC
Edmundston Regional Hospital, Edmundston, NB
Georges Dumont Hospital CHU Dr Georges L Dumont,
Moncton, NB
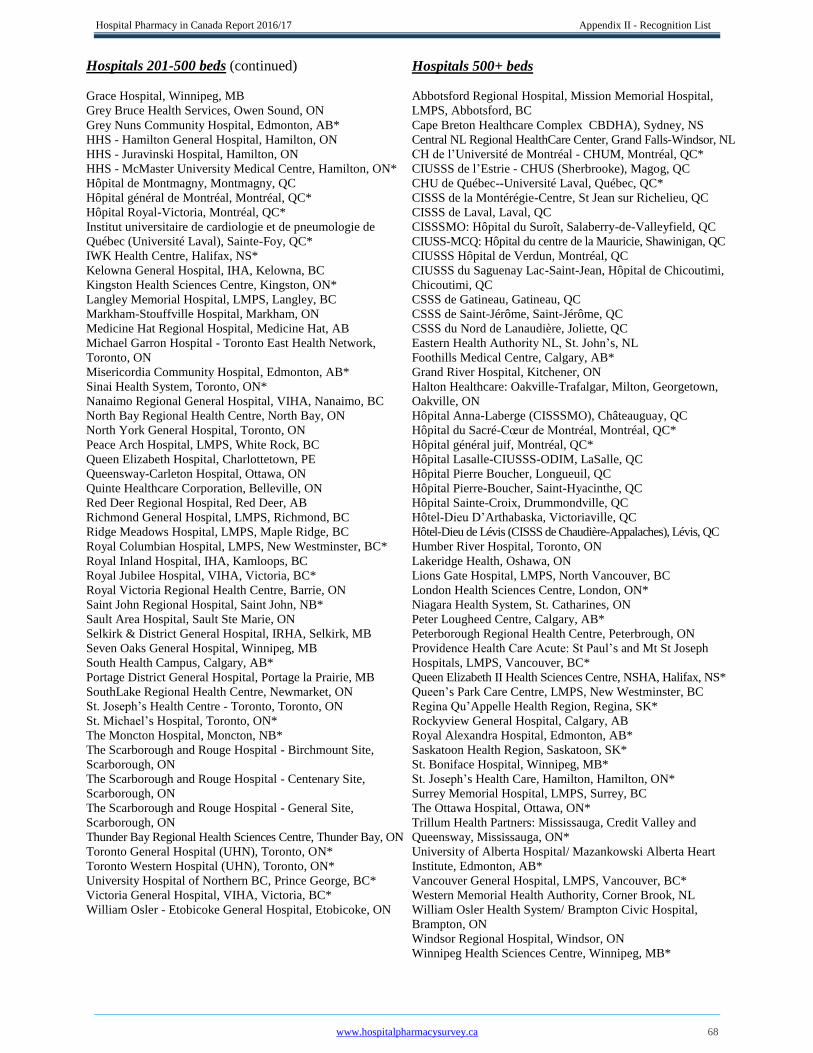
Hospital Pharmacy in Canada Report 2016/17 Appendix II - Recognition List
www.hospitalpharmacysurvey.ca 68
Hospitals 201-500 beds (continued)
Grace Hospital, Winnipeg, MB
Grey Bruce Health Services, Owen Sound, ON
Grey Nuns Community Hospital, Edmonton, AB*
HHS - Hamilton General Hospital, Hamilton, ON
HHS - Juravinski Hospital, Hamilton, ON
HHS - McMaster University Medical Centre, Hamilton, ON*
Hôpital de Montmagny, Montmagny, QC
Hôpital général de Montréal, Montréal, QC*
Hôpital Royal-Victoria, Montréal, QC*
Institut universitaire de cardiologie et de pneumologie de
Québec (Université Laval), Sainte-Foy, QC*
IWK Health Centre, Halifax, NS*
Kelowna General Hospital, IHA, Kelowna, BC
Kingston Health Sciences Centre, Kingston, ON*
Langley Memorial Hospital, LMPS, Langley, BC
Markham-Stouffville Hospital, Markham, ON
Medicine Hat Regional Hospital, Medicine Hat, AB
Michael Garron Hospital - Toronto East Health Network,
Toronto, ON
Misericordia Community Hospital, Edmonton, AB*
Sinai Health System, Toronto, ON*
Nanaimo Regional General Hospital, VIHA, Nanaimo, BC
North Bay Regional Health Centre, North Bay, ON
North York General Hospital, Toronto, ON
Peace Arch Hospital, LMPS, White Rock, BC
Queen Elizabeth Hospital, Charlottetown, PE
Queensway-Carleton Hospital, Ottawa, ON
Quinte Healthcare Corporation, Belleville, ON
Red Deer Regional Hospital, Red Deer, AB
Richmond General Hospital, LMPS, Richmond, BC
Ridge Meadows Hospital, LMPS, Maple Ridge, BC
Royal Columbian Hospital, LMPS, New Westminster, BC*
Royal Inland Hospital, IHA, Kamloops, BC
Royal Jubilee Hospital, VIHA, Victoria, BC*
Royal Victoria Regional Health Centre, Barrie, ON
Saint John Regional Hospital, Saint John, NB*
Sault Area Hospital, Sault Ste Marie, ON
Selkirk & District General Hospital, IRHA, Selkirk, MB
Seven Oaks General Hospital, Winnipeg, MB
South Health Campus, Calgary, AB*
Portage District General Hospital, Portage la Prairie, MB
SouthLake Regional Health Centre, Newmarket, ON
St. Joseph’s Health Centre - Toronto, Toronto, ON
St. Michael’s Hospital, Toronto, ON*
The Moncton Hospital, Moncton, NB*
The Scarborough and Rouge Hospital - Birchmount Site,
Scarborough, ON
The Scarborough and Rouge Hospital - Centenary Site,
Scarborough, ON
The Scarborough and Rouge Hospital - General Site,
Scarborough, ON
Thunder Bay Regional Health Sciences Centre, Thunder Bay, ON
Toronto General Hospital (UHN), Toronto, ON*
Toronto Western Hospital (UHN), Toronto, ON*
University Hospital of Northern BC, Prince George, BC*
Victoria General Hospital, VIHA, Victoria, BC*
William Osler - Etobicoke General Hospital, Etobicoke, ON
Hospitals 500+ beds
Abbotsford Regional Hospital, Mission Memorial Hospital,
LMPS, Abbotsford, BC
Cape Breton Healthcare Complex CBDHA), Sydney, NS
Central NL Regional HealthCare Center, Grand Falls-Windsor, NL
CH de l’Université de Montréal - CHUM, Montréal, QC*
CIUSSS de l’Estrie - CHUS (Sherbrooke), Magog, QC
CHU de Québec--Université Laval, Québec, QC*
CISSS de la Montérégie-Centre, St Jean sur Richelieu, QC
CISSS de Laval, Laval, QC
CISSSMO: Hôpital du Suroît, Salaberry-de-Valleyfield, QC
CIUSS-MCQ: Hôpital du centre de la Mauricie, Shawinigan, QC
CIUSSS Hôpital de Verdun, Montréal, QC
CIUSSS du Saguenay Lac-Saint-Jean, Hôpital de Chicoutimi,
Chicoutimi, QC
CSSS de Gatineau, Gatineau, QC
CSSS de Saint-Jérôme, Saint-Jérôme, QC
CSSS du Nord de Lanaudière, Joliette, QC
Eastern Health Authority NL, St. John’s, NL
Foothills Medical Centre, Calgary, AB*
Grand River Hospital, Kitchener, ON
Halton Healthcare: Oakville-Trafalgar, Milton, Georgetown,
Oakville, ON
Hôpital Anna-Laberge (CISSSMO), Châteauguay, QC
Hôpital du Sacré-Cœur de Montréal, Montréal, QC*
Hôpital général juif, Montréal, QC*
Hôpital Lasalle-CIUSSS-ODIM, LaSalle, QC
Hôpital Pierre Boucher, Longueuil, QC
Hôpital Pierre-Boucher, Saint-Hyacinthe, QC
Hôpital Sainte-Croix, Drummondville, QC
Hôtel-Dieu D’Arthabaska, Victoriaville, QC
Hôtel-Dieu de Lévis (CISSS de Chaudière-Appalaches), Lévis, QC
Humber River Hospital, Toronto, ON
Lakeridge Health, Oshawa, ON
Lions Gate Hospital, LMPS, North Vancouver, BC
London Health Sciences Centre, London, ON*
Niagara Health System, St. Catharines, ON
Peter Lougheed Centre, Calgary, AB*
Peterborough Regional Health Centre, Peterbrough, ON
Providence Health Care Acute: St Paul’s and Mt St Joseph
Hospitals, LMPS, Vancouver, BC*
Queen Elizabeth II Health Sciences Centre, NSHA, Halifax, NS*
Queen’s Park Care Centre, LMPS, New Westminster, BC
Regina Qu’Appelle Health Region, Regina, SK*
Rockyview General Hospital, Calgary, AB
Royal Alexandra Hospital, Edmonton, AB*
Saskatoon Health Region, Saskatoon, SK*
St. Boniface Hospital, Winnipeg, MB*
St. Joseph’s Health Care, Hamilton, Hamilton, ON*
Surrey Memorial Hospital, LMPS, Surrey, BC
The Ottawa Hospital, Ottawa, ON*
Trillum Health Partners: Mississauga, Credit Valley and
Queensway, Mississauga, ON*
University of Alberta Hospital/ Mazankowski Alberta Heart
Institute, Edmonton, AB*
Vancouver General Hospital, LMPS, Vancouver, BC*
Western Memorial Health Authority, Corner Brook, NL
William Osler Health System/ Brampton Civic Hospital,
Brampton, ON
Windsor Regional Hospital, Windsor, ON
Winnipeg Health Sciences Centre, Winnipeg, MB*
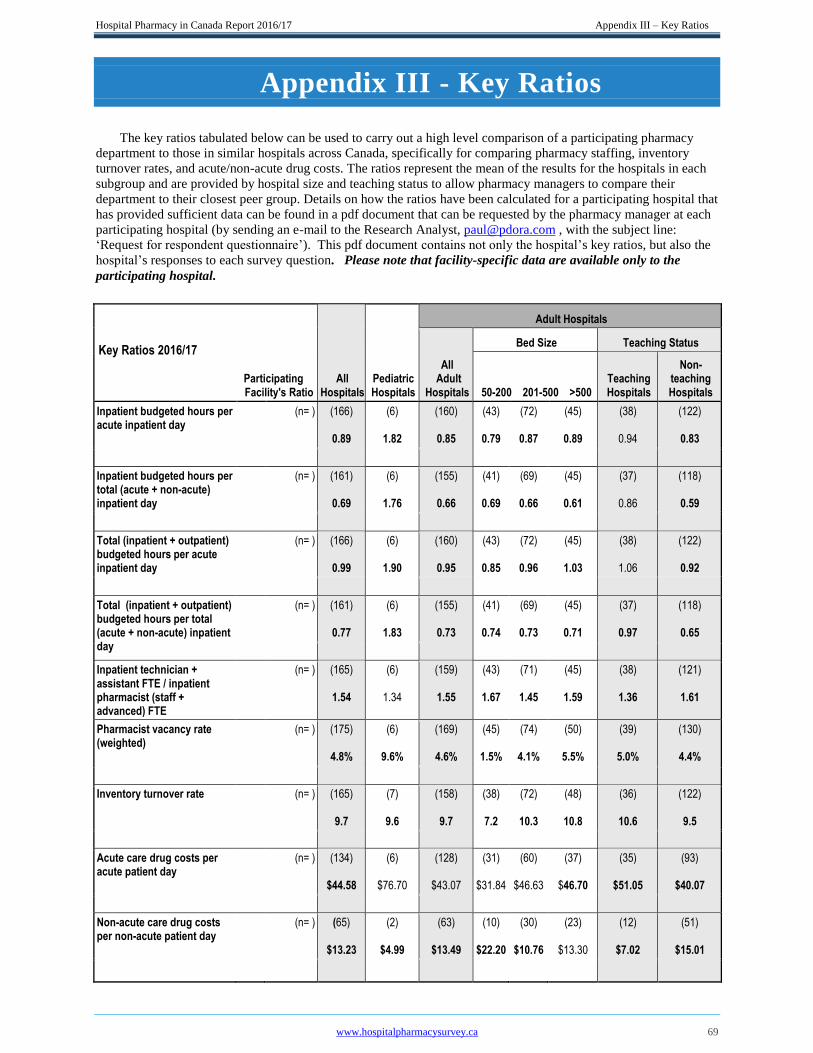
Hospital Pharmacy in Canada Report 2016/17 Appendix III – Key Ratios
www.hospitalpharmacysurvey.ca 69
Appendix III - Key Ratios
The key ratios tabulated below can be used to carry out a high level comparison of a participating pharmacy
department to those in similar hospitals across Canada, specifically for comparing pharmacy staffing, inventory
turnover rates, and acute/non-acute drug costs. The ratios represent the mean of the results for the hospitals in each
subgroup and are provided by hospital size and teaching status to allow pharmacy managers to compare their
department to their closest peer group. Details on how the ratios have been calculated for a participating hospital that
has provided sufficient data can be found in a pdf document that can be requested by the pharmacy manager at each
participating hospital (by sending an e-mail to the Research Analyst, [email protected] , with the subject line:
‘Request for respondent questionnaire’). This pdf document contains not only the hospital’s key ratios, but also the
hospital’s responses to each survey question. Please note that facility-specific data are available only to the
participating hospital.
Key Ratios 2016/17
Participating Facility's Ratio
All Hospitals
Pediatric Hospitals
Adult Hospitals
All Adult
Hospitals
Bed Size Teaching Status
50-200 201-500 >500
Teaching Hospitals
Non- teaching Hospitals
Inpatient budgeted hours per acute inpatient day
(n= ) (166)
0.89
(6)
1.82
(160)
0.85
(43)
0.79
(72)
0.87
(45)
0.89
(38)
0.94
(122)
0.83
Inpatient budgeted hours per total (acute + non-acute) inpatient day
(n= ) (161)
0.69
(6)
1.76
(155)
0.66
(41)
0.69
(69)
0.66
(45)
0.61
(37)
0.86
(118)
0.59
Total (inpatient + outpatient) budgeted hours per acute inpatient day
(n= ) (166)
0.99
(6)
1.90
(160)
0.95
(43)
0.85
(72)
0.96
(45)
1.03
(38)
1.06
(122)
0.92
Total (inpatient + outpatient) budgeted hours per total (acute + non-acute) inpatient day
(n= ) (161)
0.77
(6)
1.83
(155)
0.73
(41)
0.74
(69)
0.73
(45)
0.71
(37)
0.97
(118)
0.65
Inpatient technician + assistant FTE / inpatient pharmacist (staff + advanced) FTE
(n= ) (165)
1.54
(6)
1.34
(159)
1.55
(43)
1.67
(71)
1.45
(45)
1.59
(38)
1.36
(121)
1.61
Pharmacist vacancy rate (weighted)
(n= ) (175)
4.8%
(6)
9.6%
(169)
4.6%
(45)
1.5%
(74)
4.1%
(50)
5.5%
(39)
5.0%
(130)
4.4%
Inventory turnover rate (n= ) (165)
9.7
(7)
9.6
(158)
9.7
(38)
7.2
(72)
10.3
(48)
10.8
(36)
10.6
(122)
9.5
Acute care drug costs per acute patient day
(n= ) (134)
$44.58
(6)
$76.70
(128)
$43.07
(31)
$31.84
(60)
$46.63
(37)
$46.70
(35)
$51.05
(93)
$40.07
Non-acute care drug costs per non-acute patient day
(n= ) (65)
$13.23
(2)
$4.99
(63)
$13.49
(10)
$22.20
(30)
$10.76
(23)
$13.30
(12)
$7.02
(51)
$15.01

Hospital Pharmacy in Canada Report 2016/17 Notes
www.hospitalpharmacysurvey.ca 70
Notes
Hospital Pharmacy in Canada Report 2016/17 Notes
www.hospitalpharmacysurvey.ca 71