Hospital Cost Price and Profit Review
176
Hospital Cost, Price & Profit Review 2021 August
Transcript of Hospital Cost Price and Profit Review

Hospital Cost, Price & Profit Review
2021 August
2 | Hospital Cost, Price, and Profit Review
Table of Contents Executive Summary and Key Findings ........................................................ 4
Introduction and Purpose ........................................................................ 6
Increasing Need for Affordability Collaboration ............................................ 7
Health Care Spending, Government Programs and Coverage Trends .................... 8
Review of Colorado Hospital Finances ...................................................... 11
Colorado Hospitals are High Cost, High Price, High Profits .............................. 13
Drivers of Colorado Hospitals’ High Prices .................................................. 26
Rural Hospital Financial Struggles and Opportunity – The Time for Transformative Investment in Rural Hospitals Is Now ........................................................ 36
Community Benefit of Nonprofit Hospitals ................................................. 38
Industry Integration, Expansion and Reserve-building .................................... 45
State Cost Control Efforts and Tools ........................................................ 55
Conclusion ........................................................................................ 57
Appendix A: Methodology and Notes of Financial & Volume Indicators ............. 59
Appendix B: Glossary ........................................................................... 73
Appendix C: Peer Group Analysis ............................................................ 77
Appendix D: Federal COVID-19 Stimulus to Colorado Hospitals ...................... 173
3 | Hospital Cost, Price, and Profit Review
This report focuses on hospital costs, prices, and profits, which represent the largest component of health care spend in the state and in the nation. In September 2020, the National Academy for State Health Policy published a call to action that stated, “There is never a good time to take on hospital prices, but that task is essential if the nation is ever to get a grip on health care costs.”1 Reducing hospital operating costs and prices to national standards will benefit Colorado families, businesses and state and local governments, while also empowering our hospitals to be more adaptive through future economic challenges.
The Department of Health Care Policy & Financing (the Department or HCPF) is committed to saving people money on health care as part of Gov. Polis’ bold goal, in accordance with directives from our General Assembly, and as part of the Department’s mission: Improving health care equity, access and outcomes for the people we serve while saving Coloradans money on health care and driving value for Colorado.
On Nov. 1, 2017, the Department requested an increase in funding from the Healthcare Affordability and Sustainability (HAS) Fee Cash Fund. The Joint Budget Committee believed the state would benefit from additional resources to address hospital cost and hospital cost shift to commercial payers. Upon the direction of the General Assembly, the Department has focused resources towards transparently researching and reporting hospital costs and cost shifting to commercial payers. This report is a product of the General Assembly’s direction.
Thank You Hospitals and Health Care Providers
Throughout the novel coronavirus (COVID-19) pandemic, hospitals have provided exemplary leadership, delivered essential services during this time of need, and have come together to protect and heal our citizens in unprecedented ways. The Department echoes the public gratitude for the dedication from hospitals and their frontline workers. Hospital leaders have partnered with the state – under the leadership of Gov. Polis – on personal protective equipment (PPE), established reporting and testing protocols, shared best practices among their Chief Medical Officers on emerging treatments, and are now delivering vaccines to save lives and help Colorado restart the economy. At the same time, many hospitals have stepped up to help their local area nursing homes that struggled to keep up with outbreaks, lack of PPE, and other challenges. Several hospitals invested in public messaging on the importance of wearing masks, social distancing, and washing hands to slow the spread of COVID-19. Their aggregated, collaborative impact in protecting Coloradans against the impact of COVID-19 has been remarkable, inspirational and literally lifesaving.
1 Rakotoniaina, A., Bartlett, M., and Riley, T. (2020, September 21). Why Compare What Employers Pay to What Medicare Pays? National Academy of State Health Policy. www.nashp.org/why-compare-what-employers-pay-to-what-medicare-pays/
4 | Hospital Cost, Price, and Profit Review
Executive Summary and Key Findings An Increasing Need for Affordability Collaboration
We are in a unique time of dynamic transformation in health care. We are battling a global pandemic, driving for a better “new normal” in health care, and pursuing every reasonable avenue to drive affordability. An economic downturn makes this affordability focus even more urgent, as families struggle to keep a roof over their heads and food on the table and employers struggle to keep their doors open.
With the economic downturn, there are also a growing number of Coloradans using public health care programs, which are financed by state and federal tax dollars, creating even more pressure to improve health care affordability. Approximately, 40% of Coloradans are now covered by Medicare and/or Health First Colorado (Colorado’s Medicaid Program). With the state in a fiscal crisis, every dollar disproportionately spent on health care takes away from education, infrastructure and a host of other priorities that serve all Coloradans.
A majority of the data in this report was the most recently available, through 2018. In 2019 and 2020, the COVID-19 pandemic changed the world. The data in this report focuses on a pre-COVID-19 landscape, one that Colorado can choose to return to or choose to reform. The Department is hopeful that we can retain the partnerships and spirit of community fueled by COVID-19, which enabled frontline workers, high level hospital administrators, government leaders, and payers to collaborate to better respond to a crisis. We have shown that when we work together, so much is possible.
The Department is committed to partnering with health care providers to ensure equitable and sustainable public health care programs for our state’s vulnerable populations. The Colorado Health Institute estimated that in 2019 between 10 and 20% of Coloradans did not get care due to cost, with variations by type of care.2 When health care is unaffordable, people are less likely to seek care and more likely to become financially strained. We need to continue to work in tandem with health care providers to address the needs of our communities, with a special emphasis on improving the affordability of health care in order to improve accessibility.
Review of Colorado Hospital Finances, Cost, Price and Profits
This report compares Colorado hospitals’ price, cost, and profit to other states, illustrating that Colorado hospitals have some of the highest prices, costs and profits in the nation, and provides examples of tools and strategies to address this complex challenge.
● Colorado hospital prices ranked 6th highest in the nation in 2018 and our rate of price increases is outpacing the nation. In 2009, the average price per patient was 9.2% higher in Colorado than in the rest of the country. By 2018, the average price per patient in Colorado had increased to 22.8% higher than the national median.
2 Colorado Health Institute. (2020, February 11). 2019 Colorado Health Access Survey: Health Insurance Coverage. www.coloradohealthinstitute.org/research/2019-colorado-health-access-survey-health-insurance-coverage.

5 | Hospital Cost, Price, and Profit Review
● Hospital costs per patient in Colorado ranked 9th highest in the nation in 2018 and have consistently exceeded national averages for the last nine years. Colorado hospital cost increases are outpacing the nation, increasing an average of 3.8% a year compared to 3.1% per year for the rest of the country. A larger portion of Colorado hospital costs are for overhead costs. In 2018, overhead costs made up 28.0% of Colorado hospital costs, while the national overhead rate was 25.4% of hospital costs. Had Colorado hospitals incurred overhead at the national rate, operating expenses would be $474 million less in 2018.
● In 2018, Colorado hospitals ranked 2nd highest in the nation in total profit per patient. Colorado’s total profit per patient of $2,891 was approximately three times higher than the 2018 national median of $963. Colorado hospitals generated $1.5 billion in profits from patient services in 2018 but nearly the same amount, $1.4 billion, was generated by non-patient sources (i.e.: investment income). This $2.9 billion in 2018 profits represents a 15.6% total profit margin (15.3% when adjusted for cost of living), the highest profits in the country and significantly higher than the national median of 6.5%. Between 2008 and 2018, all of Colorado’s hospitals together generated over $16.6 billion in total profit.
For the purposes of this report, price, cost and profit are defined as noted below:
● Price is what hospitals charge, generally represented as revenue per patient. Price = Cost + Profit.
● Cost is how much the hospitals spend to operate and provide care for patients and is represented by hospital-only operating expense.
● Profit is the difference between price and cost.
Rural Hospitals, A Very Different Reality
Hospitals are not all the same. Different than their front range, large system counterparts, the state’s smaller rural hospitals have far lower margins and serve more publicly insured patients.
Rural hospitals are ripe for public investment that: (a) increases access to care for rural communities; (b) retains health care patients and the associated revenues in rural communities instead of channeling patients and revenue to front range large hospital systems; (c) stabilizes rural hospitals as a top employer in the community; (d) improves affordability capabilities; and (e) maximizes new alternate payment methodologies that reward quality outcomes while investing in rural hospital access expansion.
Community Benefit and Nonprofit Tax Exemption
Most Colorado hospitals (90%) are classified as nonprofit and therefore tax exempt. This report finds that Colorado hospitals provide less charity care than other states. It also finds that the state’s for-profit hospitals incur a similar cost related to uncompensated care as nonprofit hospitals. As they did with COVID-19, hospitals have an opportunity to better address common community investment opportunities - such
6 | Hospital Cost, Price, and Profit Review
as behavioral health access or social determinates of health including people experiencing homelessness and food insecurity through a coordinated, targeted effort.
Industry Consolidation
As of 2020, there were 45 hospitals in Colorado affiliated with eight health systems.3 In 2018, these system hospitals represented 77.1% of inpatient days, 73.3% of net patient revenue and 87.2% of net income. Colorado hospitals reported a $6.9 billion increase in capital assets from 2009 to 2018. This report finds that hospital mergers and acquisitions drive up health care costs and prices because they decrease market competition and increase hospital market power in a community. With increasing front range large system market power, hospitals have little incentive to control costs, reduce prices, increase community investments, or alter market expansion practices – presenting an opportunity for new and emerging health care policy.
State Cost Control Efforts and Tools
The state has passed a number of legislative initiaitves and invested in tools that help stakeholders better understand the cost of health care. These tools improve our ability to work together across stakeholder groups to craft data-driven strategies to save people money on health care. These tools, which include reports like this, are essential in ensuring thoughtful, evidence-based policy.
Introduction and Purpose In the 2019 legislative session, Gov. Jared Polis, Lt. Gov. Dianne Primavera and the state legislature asked the Department to examine hospital spending more closely in order to save Coloradans money on health care. We began this multi-tiered effort with extensive hospital cost analysis and the publication of the “Colorado Cost Shift Analysis Report” in January 2020. This report thoroughly debunked the concept that Medicaid and Medicare underpayments were to blame for rising hospital commercial payer prices. The Colorado Cost Shift Analysis Report identified opportunities for the state to partner with health care providers to address and lower their costs and prices to the benefit of Colorado families, employers and the state.
As more hospital transparency efforts were implemented in Colorado through legislation, the Department’s analysis has continued to improve and expand through this report, “Colorado Hospital Cost, Price and Profit Review.” This report is a comprehensive review of the Department’s analysis of pre-pandemic Colorado hospital finances to examine how the system currently incentivizes higher costs and profits. The report examines Colorado hospital Medicare Cost Report data to evaluate hospital financial health, both in an individual and systemic scope. The analysis uses self-reported data available from Colorado hospitals’ Medicare Cost Reports and compares Colorado hospitals to national hospital norms in terms of price,
3 System affiliation information obtained from 2018 Medicare Cost Report. Two additional UCHealth system hospitals, UCHealth Greeley Hospital and UCHealth Highlands Ranch Hospital, opened in 2019. SCL Health Community Hospital – Westminster closed in 2018.

7 | Hospital Cost, Price, and Profit Review
cost and profit. It also investigates nonprofit hospital community benefit requirements.
The COVID-19 pandemic created tremendous hardship for Colorado families, including maintaining affordable health care coverage. Despite improvement since the height of the pandemic, the Colorado unemployment rate is at 6.6% compared to 2.5% before February 2020, while the state works to open the economy and balance its budget given the increasing demand for public programs.4
At the same time, the pandemic provides an opportunity to examine the course of health care in Colorado, inviting us to collaboratively define and pursue a better, “new normal” in health care – one that is more affordable for Colorado families, employers and the state and sustainable for health care providers and payers. As a result of many factors related to the pandemic, annual U.S. total health care spending went down 2% between 2019 and 2020, the first-time year-over-year costs have gone down in recorded U.S. history.5 As a state, we can seize this opportunity to reassess and course correct the unsustainable nature of rising hospital prices. This work should be coordinated with other affordability efforts, such as reducing the cost of prescription drugs, investment in behavioral health and primary care, and solutions to address social determinates of health like housing, nutrition and food security.
Lastly, this report is an invitation to stakeholders to continue their use of Department resources and new tools when examining and collaborating with their local hospitals to improve affordability. In partnership with the state, communities can reimagine health care and drive a “new normal” to the betterment of communities, employers and the state.
Increasing Need for Affordability Collaboration This section discusses the growing demands of the health care industry, the growth of public programs before the COVID-19 pandemic and the financial impact to employers and Colorado families because of the COVID-19 pandemic.
Key Findings on Affordability
● Health care is projected to consume more of the U.S. dollar.
● Government programs are a large part of health care spending. Trends such as a growing senior population, growing income disparities, and the economic downturn will lead to Medicare and Medicaid enrollment growth.
● Government programs will have to improve their ability control health care costs in response to increasing enrollment, fiscal challenges, and the growing percent of federal and state budgets that those programs consume.
4 Department of Labor and Employment. (2020, December). Colorado Employment Situation www.colmigateway.com/admin/gsipub/htmlarea/uploads/Dec20PR.pdf. 5 Altman, D. (2020, December 2). COVID-19 Is Causing Health Spending To Go Down. Kaiser Family Foundation. www.kff.org/coronavirus-covid-19/perspective/covid-19-is-causing-health-spending-to-go-down/.
8 | Hospital Cost, Price, and Profit Review
● While it has not been quantified, many factors indicate that during this recession the uninsured rate has increased.
● Commercial insurance deductibles and out-of-pocket costs have become more expensive for Coloradans. Despite being a healthy state, Colorado insurance costs are higher than national averages.
● When health care is unaffordable, people are less likely to seek appropriate care and more likely to become financially strained.
o In 2019, 18.1% of Coloradans surveyed reported having trouble paying a medical bill.
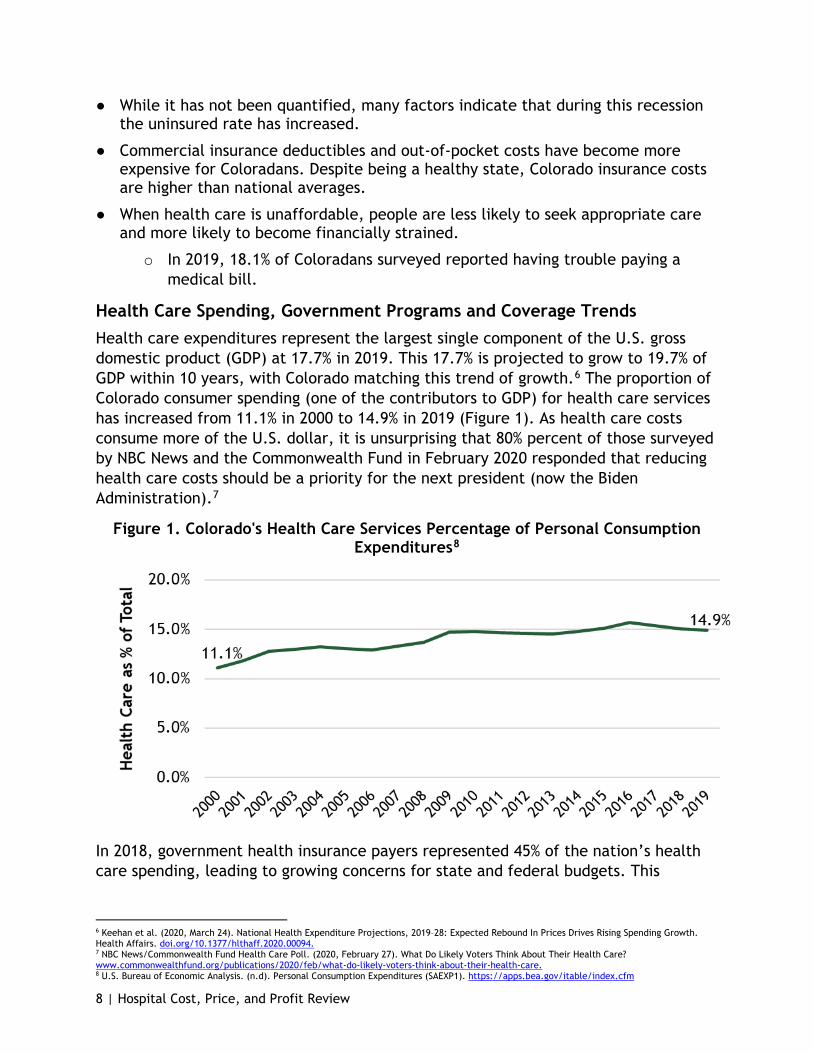
Health Care Spending, Government Programs and Coverage Trends Health care expenditures represent the largest single component of the U.S. gross domestic product (GDP) at 17.7% in 2019. This 17.7% is projected to grow to 19.7% of GDP within 10 years, with Colorado matching this trend of growth.6 The proportion of Colorado consumer spending (one of the contributors to GDP) for health care services has increased from 11.1% in 2000 to 14.9% in 2019 (Figure 1). As health care costs consume more of the U.S. dollar, it is unsurprising that 80% percent of those surveyed by NBC News and the Commonwealth Fund in February 2020 responded that reducing health care costs should be a priority for the next president (now the Biden Administration).7
Figure 1. Colorado's Health Care Services Percentage of Personal Consumption Expenditures8
In 2018, government health insurance payers represented 45% of the nation’s health care spending, leading to growing concerns for state and federal budgets. This
6 Keehan et al. (2020, March 24). National Health Expenditure Projections, 2019–28: Expected Rebound In Prices Drives Rising Spending Growth. Health Affairs. doi.org/10.1377/hlthaff.2020.00094. 7 NBC News/Commonwealth Fund Health Care Poll. (2020, February 27). What Do Likely Voters Think About Their Health Care? www.commonwealthfund.org/publications/2020/feb/what-do-likely-voters-think-about-their-health-care. 8 U.S. Bureau of Economic Analysis. (n.d). Personal Consumption Expenditures (SAEXP1). https://apps.bea.gov/itable/index.cfm
9 | Hospital Cost, Price, and Profit Review
percent is expected to reach 47% by 2028 as an aging U.S. population and growing income disparities lead to more individuals in need of this safety net coverage.6
As government programs cover more people, the financial pressure on these programs to better control health care costs increases. There are several factors necessitating an increased focus on health care affordability, including public revenue shortfalls, which increase pressure on local, state and federal budgets. In Colorado, the state has forecasted a significant decline in General Fund revenue for fiscal year (FY) 2020-21 and FY 2021-22.9 With the national debt projected to exceed GDP in 2021, it is reasonable to believe there will be a spotlight on high-ticket government programs like Medicare and Medicaid, which account for 24% of federal payments.10 Government programs will have to continue to provide coverage more efficiently in response to fiscal challenges.
Robust solutions using limited resources will require collaboration from all players in the health care industry - hospitals and other care providers, insurance carriers and their pharmacy benefit manager (PBMs), prescription drug manufacturers and others. Public and private programs will need to drive initiatives that lower health care costs in order to provide more affordable coverage, necessitating an increased focus on collaborative affordability strategy between the public and private sectors.
A Growing Demand for Government Programs Due to the Economic Downturn
Rising unemployment increased the number of people and families who qualify for public programs like Medicaid.11 While Colorado is experiencing an increase in Health First Colorado enrollment, there is concern for the growing number of uninsured Coloradans due to the economic downturn. An August 2020 survey of Coloradans who secured unemployment insurance found 19.3% of respondents did not have health insurance coverage and 46% said they were planning on remaining uninsured.12,13 In November, this survey was repeated on a smaller population of Coloradans receiving unemployment insurance. In that survey, the 46% decreased to 40%, while 82% of respondents indicated that they were going without insurance because the premiums were not affordable.
When individuals do not have health insurance, they delay care, do not fill needed prescriptions and do not schedule appropriate preventive or other needed care.14 In addition to these health-related challenges, the growing uninsured rate has the potential to increase medical bankruptcies for Colorado families while increasing bad
9 Office of State Planning and Budgeting (OSBP). (2020, June 19). OSPB June 2020 Revenue Forecast. www.leg.colorado.gov/content/ospb-june-2020-revenue-forecast. 10 Congressional Budget Office. (2020, September 2). An Update to the Budget Outlook: 2020 to 2030. www.cbo.gov/publication/56517. 11 Department of Labor and Employment. (2020). Labor Force, Employment and Unemployment for Colorado in Multiple Time Periods: 2020 Monthly Unemployment Rate. www.colmigateway.com. 12 Department of Health Care Policy & Financing. (2020, August 31). August 2020 At A Glance Newsletter. www.colorado.gov/hcpf/publications. 13 Department of Health Care Policy & Financing. (2020, June 10). State Prepares for Half Million New Medicaid Members. https://www.colorado.gov/state-prepares-half-million-new-medicaid-members. 14 Hadley, J. (2003). Sicker and Poorer - The Consequences of Being Uninsured: A Review of the Research on the Relationship between Health Insurance, Medical Care Use, Health, Work, and Income. Medical Care Research and Review, 60(2_suppl), 3S-75S. doi.org/10.1177/1077558703254101
10 | Hospital Cost, Price, and Profit Review
debt for hospitals and other providers.15 There are implications for Colorado employers who, on average, finance 69% to 76% of total annual premiums for employer-sponsored coverage.16 The unemployment rate has risen to a high of 12.1% in April 2020 down to 6.6% in February 2021 due to the economic downturn. This is logically paralleled by a loss of employer-sponsored coverage. While the uninsured rate has not been quantified through this downturn, many factors indicate that during this recession the uninsured rate has increased.
Commercial Coverage Costs and Trends
Hospital costs significantly drive health care premiums and represent the largest portion of medical expenses.17 Specifically, hospital services amounted to over 40% of total health care spending for the commercially insured.18,19 With the exception of Connect for Health Colorado, Colorado’s official health insurance marketplace, which is benefiting from the impact of reinsurance, Colorado commercial insurance costs are higher than ever before. Coloradans will face tough financial decisions as more out-of-pocket costs are passed on to them.
The annual premiums for a family have stayed between $4,300 and $5,200 since 2015, with a large jump (26%) in premiums between 2018 and 2019 to $6,200 (Figure 2). Deductibles must also be considered in family insurance costs; although average premiums dropped for families in 2018, a jump in out-of-pocket deductibles offset any family cost savings from the drop-in premiums. Lowering premiums while increasing out-of-pocket costs is a form of cost shifting and underscores why Colorado stakeholders have voiced the importance of including out-of-pocket costs in affordability definitions, analytics and policy strategies. Although Colorado’s family premiums are comparable to national premiums for most years, family deductibles have been consistently higher in Colorado. An average Colorado family who meets their deductible paid two to six percent more in premium and deductible costs than the national average. Despite being a healthy state, Colorado insurance costs are higher than national averages.20,21,22
15 Colorado Health Institute. (2020, February 11). 2019 Colorado Health Access Survey: Health Insurance Coverage. www.coloradohealthinstitute.org/research/2019-colorado-health-access-survey-health-insurance-coverage. 16 Kaiser Family Foundation’s State Health Facts. Data Source: Agency for Healthcare Research and Quality, Center for Financing, Access and Cost Trends. Medical Expenditure Panel Survey (MEPS)- Insurance Component, 2013-2018; Tables II.C.1, II.C.2, II.C.3 and Tables II.F.1, II.F.2, X.F.1, and X.F.2 www.meps.ahrq.gov/mepsweb/data_stats/quick_tables_results.jsp?component=2&subcomponent=2&year=2018&tableSeries=-1&tableSubSeries=CDE&searchText=&searchMethod=1&Action=Search. www.kff.org/state-category/health-costs-budgets/. 17 Kenneth Thorpe. (2019). What Accounts for The Growth in Private Health Insurance Spending? Partnership to Fight Chronic Disease. www.fightchronicdisease.org/what-accounts-growth-private-health-insurance-spending. 18 White and Whaley. (2020, September 18). Nationwide Evaluation of Health Care Prices Paid by Private Health Plans: Findings from Round 3 of an Employer-Led Transparency Initiative. RAND Corporation. doi.org/10.7249/RR4394. 19 Centers for Medicare and Medicaid Services. (2019). National Health Expenditure Data: Table 4. National Health Expenditures by Source of Funds and Type of Expenditures. Retrieved from www.cms.gov/Research-Statistics-Data-and-Systems/Statistics-Trends-and-Reports/NationalHealthExpendData. 20 United Health Foundation. (2020). 2020 Annual Report, State Summaries Colorado. America’s Health Rankings. www.americashealthrankings.org/learn/reports/2020-annual-report. 21 Byrnes, H. (2020, January 31). How healthy is your state? These are the 20 states that rank as the healthiest in the US. USA Today. www.usatoday.com/story/money/2020/01/31/the-healthiest-states-in-america/41041197/. 22 United Health Foundation. (2020). America's Health Rankings analysis of Centers for Medicare & Medicaid Services Office of Minority Health's Mapping Medicare Disparities (MMD) Tool and CDC, Behavioral Risk Factor Surveillance System. Available at www.americashealthrankings.orgwww.AmericasHealthRankings.org.

11 | Hospital Cost, Price, and Profit Review
Figure 2: Colorado and National Average Family Health Insurance Costs for Premiums and Deductibles23
The Colorado Health Institute (CHI) conducts a biannual survey on health care access with the following findings:
● In 2019, 18.1% of Coloradans surveyed reported having trouble paying a medical bill.
● Highlighting disparities in health care, a Black Coloradan is twice as likely to report having trouble paying medical bills.
● CHI estimated that in 2019 between 10 and 20% of Coloradans did not get care due to cost, with variations by type of care.
● About 70% of Coloradans dipped into their savings to pay medical bills and over half of Coloradans increased their personal debt by using a credit card to pay for their medical care.24
Review of Colorado Hospital Finances All Medicare certified hospitals submit Medicare Cost Reports to the federal government annually. These reports include cost information on all patient services and operating costs, not just those related to Medicare. The following section is the Department’s analysis of data reported and certified by hospitals through their 2018 Medicare Cost Reports. Our analysis compares Colorado hospitals as an aggregate with national medians and provides a peer group analysis which compares Colorado hospitals to a national peer group. Our analysis also considers key hospital characteristics, such as nonprofit or for-profit status, and how Colorado hospitals compare to other states and other hospitals of similar size. These national
23 Kaiser Family Foundation’s State Health Facts. Data Source: Agency for Healthcare Research and Quality, Center for Financing, Access and Cost Trends. Medical Expenditure Panel Survey (MEPS)- Insurance Component, 2013-2018; Tables II.C.1, II.C.2, II.C.3 and Tables II.F.1, II.F.2, X.F.1, and X.F.2 www.meps.ahrq.gov/mepsweb/data_stats/quick_tables_results.jsp?component=2&subcomponent=2&year=2018&tableSeries=-1&tableSubSeries=CDE&searchText=&searchMethod=1&Action=Search. www.kff.org/state-category/health-costs-budgets/. 24 Colorado Health Institute. (2020, February 11). 2019 Colorado Health Access Survey: Health Insurance Coverage. www.coloradohealthinstitute.org/research/2019-colorado-health-access-survey-health-insurance-coverage.

12 | Hospital Cost, Price, and Profit Review
comparisons demonstrate Colorado hospitals have historically higher costs, higher prices and higher profits compared to the nation.
The Department has made great efforts to turn the resulting information from the analysis into plain language whenever possible. The following information should help readers through this section of the report.
● Price equals net patient revenue.
● Cost equals hospital-only operating expense.
● Profit or patient service profit equals patient service margin.
More information on the methodology the Department used is in Appendix A.
Key Findings on Hospital Finances
● Colorado hospitals are high price, high cost and high profit. Colorado ranks high in price (6th in the nation), cost (9th in the nation), and total profit (2nd in the nation)
o Price: Hospital prices per patient for Colorado hospitals have been consistently higher than the country, while the rate of increase is outpacing the nation (Figure 5). In 2009, the price per patient was 9.2% higher in Colorado compared to the rest of the country; by 2018, the difference had increased to 22.8%.
o Cost: Hospital costs per patient in Colorado have consistently exceeded national values for the last nine years (Figure 8).
o Profit: In 2018, Colorado hospitals ranked 4th in patient services profits per patient (Figure 11) and 2nd in total profit per patient despite also ranking highly in terms of costs. For the ten-year period ending in 2018, all of Colorado’s hospitals together generated over $16.6 billion in total profit.
● Colorado hospitals are on the lower end for charity care compared to their peers (Colorado ranked 32nd in the nation).
● High price is more common amongst Colorado hospitals. 61.0% of Colorado hospitals had high prices compared to their national peer comparison group.
o Most rural hospitals are not represented in this assessment of price, cost, and profit because only hospitals with greater than 25 beds are reviewed.
● The drivers of high hospital prices are high costs and high profits.
o The excessive costs and profits have significant financial implications. In 2018, had Colorado hospitals had national level costs, the estimated savings to consumers, employers and payers would have been $1.3 billion. In 2018, had Colorado hospitals had national level total profits, the estimated savings would have been $1.7 billion. These two values combined result in price savings of $3.0 billion for 2018 alone.
13 | Hospital Cost, Price, and Profit Review
o Of the 25 high price hospitals, eight Colorado hospitals are high profit without high costs, 15 are high cost, and eight of that 15 are also high profit.
● Rural hospitals would benefit significantly from policy and investment attention to address rural affordability, access, outcomes, and disparities in care between rural and urban communities.
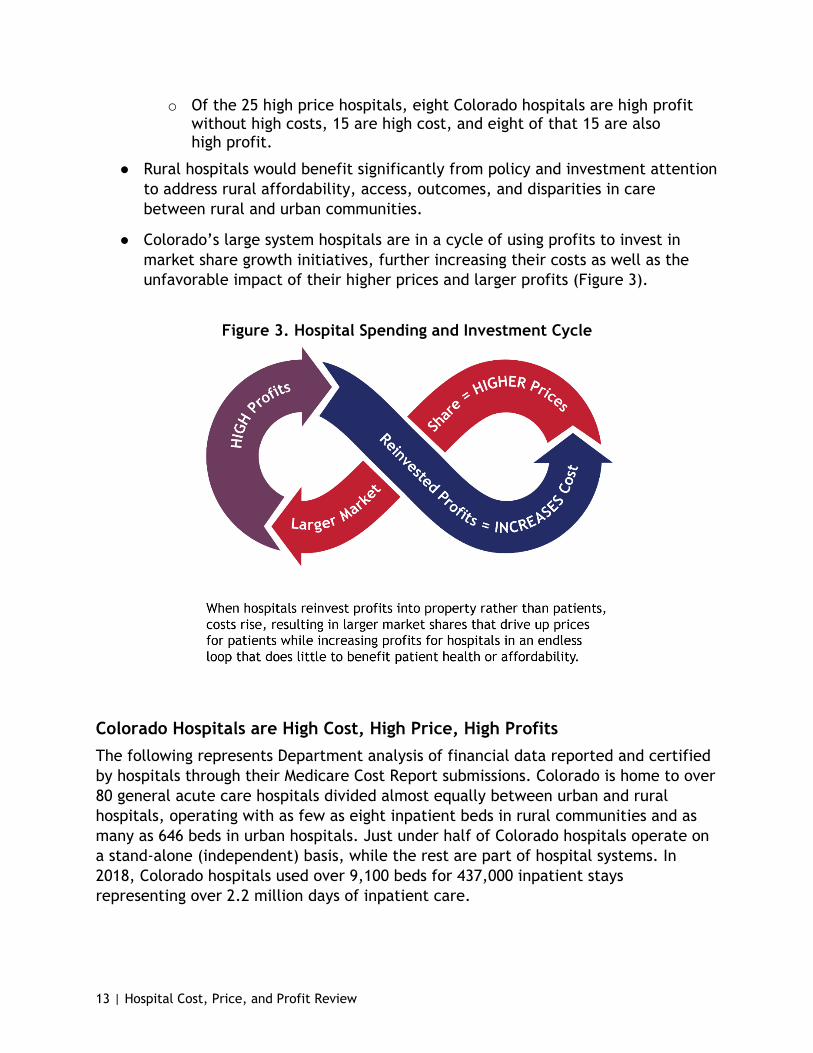
● Colorado’s large system hospitals are in a cycle of using profits to invest in market share growth initiatives, further increasing their costs as well as the unfavorable impact of their higher prices and larger profits (Figure 3).
Figure 3. Hospital Spending and Investment Cycle
Colorado Hospitals are High Cost, High Price, High Profits The following represents Department analysis of financial data reported and certified by hospitals through their Medicare Cost Report submissions. Colorado is home to over 80 general acute care hospitals divided almost equally between urban and rural hospitals, operating with as few as eight inpatient beds in rural communities and as many as 646 beds in urban hospitals. Just under half of Colorado hospitals operate on a stand-alone (independent) basis, while the rest are part of hospital systems. In 2018, Colorado hospitals used over 9,100 beds for 437,000 inpatient stays representing over 2.2 million days of inpatient care.
14 | Hospital Cost, Price, and Profit Review
Hospital Price
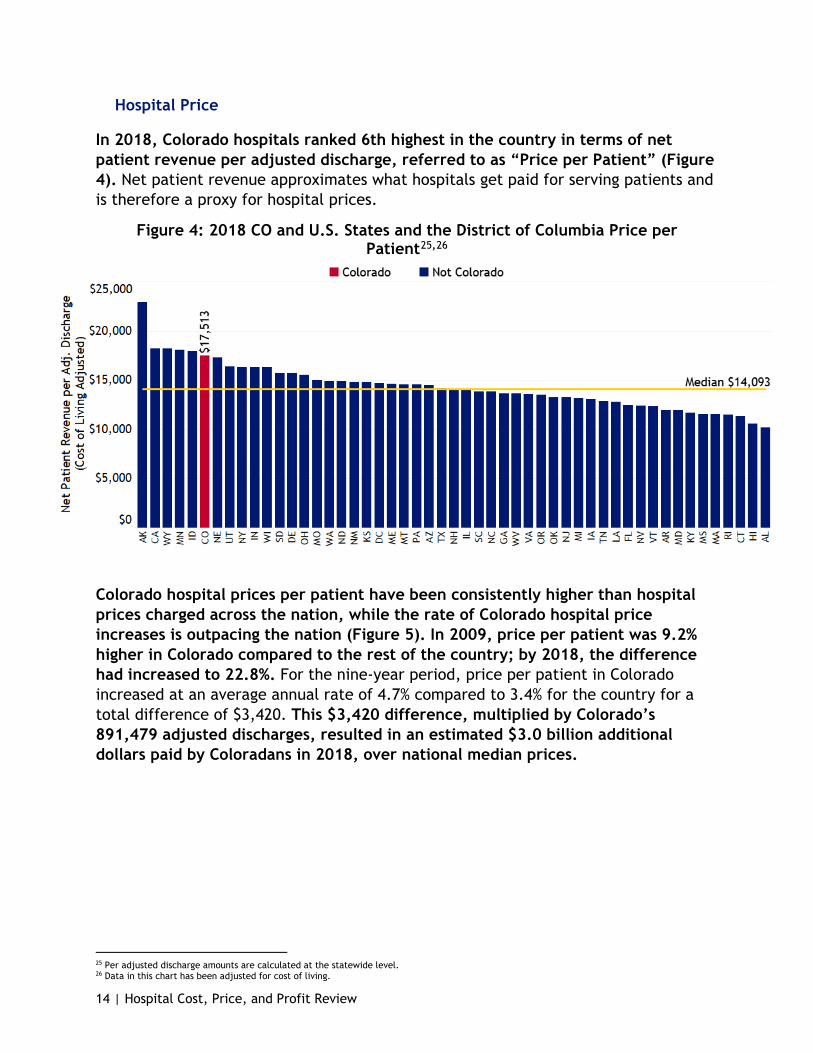
In 2018, Colorado hospitals ranked 6th highest in the country in terms of net patient revenue per adjusted discharge, referred to as “Price per Patient” (Figure 4). Net patient revenue approximates what hospitals get paid for serving patients and is therefore a proxy for hospital prices.
Figure 4: 2018 CO and U.S. States and the District of Columbia Price per Patient25,26
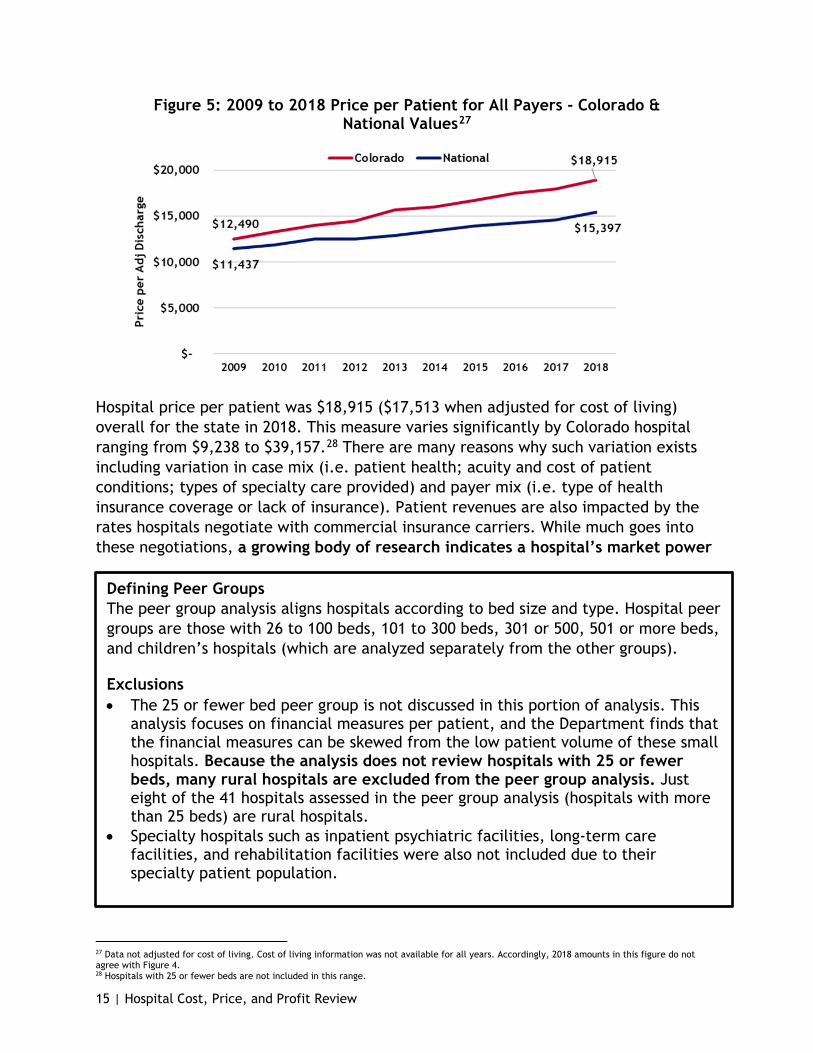
Colorado hospital prices per patient have been consistently higher than hospital prices charged across the nation, while the rate of Colorado hospital price increases is outpacing the nation (Figure 5). In 2009, price per patient was 9.2% higher in Colorado compared to the rest of the country; by 2018, the difference had increased to 22.8%. For the nine-year period, price per patient in Colorado increased at an average annual rate of 4.7% compared to 3.4% for the country for a total difference of $3,420. This $3,420 difference, multiplied by Colorado’s 891,479 adjusted discharges, resulted in an estimated $3.0 billion additional dollars paid by Coloradans in 2018, over national median prices.
25 Per adjusted discharge amounts are calculated at the statewide level. 26 Data in this chart has been adjusted for cost of living.
15 | Hospital Cost, Price, and Profit Review
Figure 5: 2009 to 2018 Price per Patient for All Payers - Colorado & National Values27
Hospital price per patient was $18,915 ($17,513 when adjusted for cost of living) overall for the state in 2018. This measure varies significantly by Colorado hospital ranging from $9,238 to $39,157.28 There are many reasons why such variation exists including variation in case mix (i.e. patient health; acuity and cost of patient conditions; types of specialty care provided) and payer mix (i.e. type of health insurance coverage or lack of insurance). Patient revenues are also impacted by the rates hospitals negotiate with commercial insurance carriers. While much goes into these negotiations, a growing body of research indicates a hospital’s market power
Defining Peer Groups The peer group analysis aligns hospitals according to bed size and type. Hospital peer groups are those with 26 to 100 beds, 101 to 300 beds, 301 or 500, 501 or more beds, and children’s hospitals (which are analyzed separately from the other groups).
Exclusions • The 25 or fewer bed peer group is not discussed in this portion of analysis. This
analysis focuses on financial measures per patient, and the Department finds that the financial measures can be skewed from the low patient volume of these small hospitals. Because the analysis does not review hospitals with 25 or fewer beds, many rural hospitals are excluded from the peer group analysis. Just eight of the 41 hospitals assessed in the peer group analysis (hospitals with more than 25 beds) are rural hospitals.
• Specialty hospitals such as inpatient psychiatric facilities, long-term care facilities, and rehabilitation facilities were also not included due to their specialty patient population.
27 Data not adjusted for cost of living. Cost of living information was not available for all years. Accordingly, 2018 amounts in this figure do not agree with Figure 4. 28 Hospitals with 25 or fewer beds are not included in this range.

16 | Hospital Cost, Price, and Profit Review
and market share is a key driver of its ability to command prices and price increase through negotiations.29,30 This quest for market leverage is also a key driver of the hospital mergers and acquisitions we have witnessed in Colorado. Market power will be discussed at length in the Industry Integration, Expansion and Reserve-building section of this report (see page 5). Additional charge-to-cost ratio analysis by National Nurses United shows hospitals with the lowest charges compared to costs are more often independent hospitals. At the same time, the 10 Colorado hospitals with the highest charge to cost ratios are charging six to 13 times their reported costs.31
Peer Group Price 2018 Comparison for Hospitals with More than 25 Beds32
The following section compares hospitals to other peer hospitals with a similar number of beds.
All 13 Colorado hospitals in the 26 to 100 bed peer group were above the national peer group median for price per patient.
● Seventeen of the 18 hospitals in the 101 to 300 bed peer group were above the 2018 national peer group median for price per patient. The only hospital under the national peer group median for price per patient was North Suburban Medical Center.
● Of the 10 hospitals in the 301 to 500 bed peer group, the 501 to 800 bed peer group and the children’s hospital peer group, six hospitals were above their national peer group median for price per patient. The four under the national peer group median for price per patient are Children’s Hospital Colorado, Denver Health Medical Center, Parkview Medical Center and The Medical Center of Aurora.
29 White, C., Bond, A. & Reschovsky, J. (2013, September 27). High and Varying Prices for Privately Insured Patients Underscore Hospital Market Power. Center for Studying Health System Change, Research Brief, Findings from HSC. www.ncbi.nlm.nih.gov/pubmed/24073466. 30 Boozary, A., Feyman, Y, Reinhardt, U. & Jha, A. The Association between Hospital Concentration and Insurance Premiums In ACA Marketplaces. Health Affairs. doi.org/10.1377/hlthaff.2018.05491. 31 National Nurses United (16 Nov. 2020). New Study - Hospitals Hike Charges by Up to 18 Times Cost. www.nationalnursesunited.org/press/new-study-hospitals-hike-charges-18-times-cost. 32 The peer group analysis groups hospitals according to bed size and type. Hospital peer groups are those with 26 to 100 beds, 101 to 300 beds, 301 or 500, 501 or more beds, and children’s hospitals. The 25 or fewer bed peer group is not discussed in this analysis. This analysis focuses on financial measures per patient, and the Department finds that the financial measures can be skewed from the low patient volume of these small hospitals. Because the analysis does not review hospitals with 25 or fewer beds, many rural hospitals are excluded from the peer group analysis.

17 | Hospital Cost, Price, and Profit Review
Figure 6: Colorado Peer Group Price Compared to National Price
Among all peer groups, all or most Colorado hospitals have higher prices than the national median (Figure 6). For an in-depth review of hospitals within the peer groups, please see Appendix C.
Patient Severity and Price
Generally, the more complex the case, the costlier it is for hospitals to treat. Case mix index (CMI) is an indicator of the average complexity of illnesses and conditions treated by a hospital. A hospital treating a larger proportion of high-complexity cases will have a higher case mix than a hospital treating patients with primarily low-complexity illnesses and conditions. Therefore, a hospital with a high case mix will generally have higher average costs and revenues per patient than a hospital with a lower-case mix.
Medicare publishes case mix information that can be used to calculate a Medicare CMI for an individual hospital, a state, or for any other grouping of hospitals. For 2018, weighted average Medicare CMI’s ranged from 1.648 at the low end in Rhode Island up to 2.155 in Washington D.C. with a median of 1.795. The Medicare CMI for Colorado for the same year was 1.993, ranking the state 3rd highest in the nation.33 This means that Colorado inpatient Medicare case mix was coded as one of the highest in the nation.
Year-over-year comparison shows Colorado’s measure of Medicare patient severity has grown the most in the nation. Colorado ranked sixteenth in Medicare CMI in 2009 and weighted average Medicare CMI has grown 21.9% between 2009 and 2018. While the Medicare CMI indicates Colorado hospitals code their patients as relatively high-complexity cases, this high-complexity designation can be made only for Medicare
33 Calculated from Centers for Medicare and Medicaid Services, FY 2020 Final Rule and Correction Notice Data Files – Case Mix Index File. Retrieved from www.cms.gov/Medicare/Medicare-Fee-for-Service-Payment/AcuteInpatientPPS/FY2020-IPPS-Final-Rule-Home-Page-Items/FY2020-IPPS-Final-Rule-Data-Files.
18 | Hospital Cost, Price, and Profit Review
patients and only for inpatient services. Medicare represented 38% of Colorado hospital discharges in 2018. The state of Colorado consistently ranks high in measures of health as Coloradans are physically active, have lower rates of risk factors like obesity and high blood pressure, and have lower rates of preventable hospitalizations compared to other states.34,35,36 There is an opportunity for a study that would compare Colorado hospital coding practices with other states’ coding practices; examining how coding practices compare among Colorado hospitals could also be beneficial and can be done by using the state’s All Payer Claims Database.
Regardless, preliminary analysis on hospital pricing adjusted for case mix using weighted average Medicare CMI does not impact Colorado’s ranking as a high hospital price state; Colorado is still consistently above the national comparisons.37
The RAND Corporation, an American nonprofit global policy think tank, released its “Nationwide Evaluation of Health Care Prices Paid by Private Health Plans” report in September 2020, comparing commercial insurance hospital price levels, variations and trends, which shed light on Colorado hospital pricing.38 The report compares prices charged to commercial insurers to those paid by Medicare from 2016 to 2018. By comparing prices on specific services, case mix is not an issue. As a result, the report demonstrates the market power aspect of hospital price setting. Commercial insurers paid Colorado hospitals 273% of what Medicare would pay for the same services (inpatient and outpatient combined) for facility-only services (which excludes the price of payments to physicians and other professional health care providers).39 National hospitals (excluding Colorado) paid 260%.39 This most recent study shows growth in the what commercial insurers pay in relation to what Medicare would pay for the same services; the publication from per year prior found that commercial insurers paid Colorado hospitals 269% for facility services.40
Hospital Cost
Historically, the hospital industry has been assumed to be a dominantly high fixed costs industry, meaning most of a hospital’s costs do not fluctuate greatly with the number of patients who are served. A hospital has a fairly high level of financial obligation or overhead, even if they do not presently have patients to pay for services.41
34 United Health Foundation. (2020). 2020 Annual Report, State Summaries Colorado. America’s Health Rankings. www.americashealthrankings.org/learn/reports/2020-annual-report. 35 Byrnes, H. (2020, January 31). How healthy is your state? These are the 20 states that rank as the healthiest in the US. USA Today. www.usatoday.com/story/money/2020/01/31/the-healthiest-states-in-america/41041197/. 36 United Health Foundation. (2020). America's Health Rankings analysis of Centers for Medicare & Medicaid Services Office of Minority Health's Mapping Medicare Disparities (MMD) Tool and CDC, Behavioral Risk Factor Surveillance System. Available at www.americashealthrankings.orgwww.AmericasHealthRankings.org. 37 As discussed, Medicare CMI is not a reflection of all populations of patient severity and this adjustment is for inpatient services alone. The Department will continue work on incorporating an appropriate adjustment for patient severity in future iterations of this analysis. 38 White and Whaley. (2020, September 18). Nationwide Evaluation of Health Care Prices Paid by Private Health Plans: Findings from Round 3 of an Employer-Led Transparency Initiative. RAND Corporation. doi.org/10.7249/RR4394. 39 The facility-only value is calculated from the supplemental data files so that it reflects prior year’s report methodology that is facility-only and does not include professional services, which are the fees or payments to physicians and other health care professionals. 40 White and Whaley. (2019). Prices Paid to Hospitals by Private Health Plans Are High Relative to Medicare and Vary Widely: Findings from an Employer-Led Transparency Initiative. RAND Corporation. doi.org/10.7249/RR3033. 41 Roberts et al. (1999, February 17). Distribution of variable vs fixed costs of hospital care. JAMA. doi.org/10.1001/jama.281.7.644.
19 | Hospital Cost, Price, and Profit Review
Hospital-only operating expenses provide insights into the hospital’s costs of providing services to patients and excludes costs related to non-patient or non-clinical expenses such as gift shops, marketing, and parking fees. Hospital-only operating expenses (hospital costs) can vary greatly from one hospital to another due to a variety of factors such as patient severity, trauma designation, specialization and geographic location. While these factors would be expected to cause differences in cost levels between individual hospitals, one would expect their impact on a state-by-state comparison to be somewhat muted since all states have a variety of hospitals with varying case mix levels and services. However, one factor that may influence state-to-state comparisons is the extent to which hospitals are incentivized to effectively manage their costs.
On average, nationwide, hospital-only operating expenses represent 80.2% of total operating expenses, but each state is unique ranging from 68.6% to 88.5%. Colorado’s proportion of total operating expenses for hospital services is 78.4%, slightly less than the nationwide value. When using a denominator to make states comparable, Colorado ranks high in hospital-only operating expenses. Moving forward, this report will refer to “hospital-only operating expenses” and “hospital-only operating expenses per adjusted discharges” as ‘costs.’
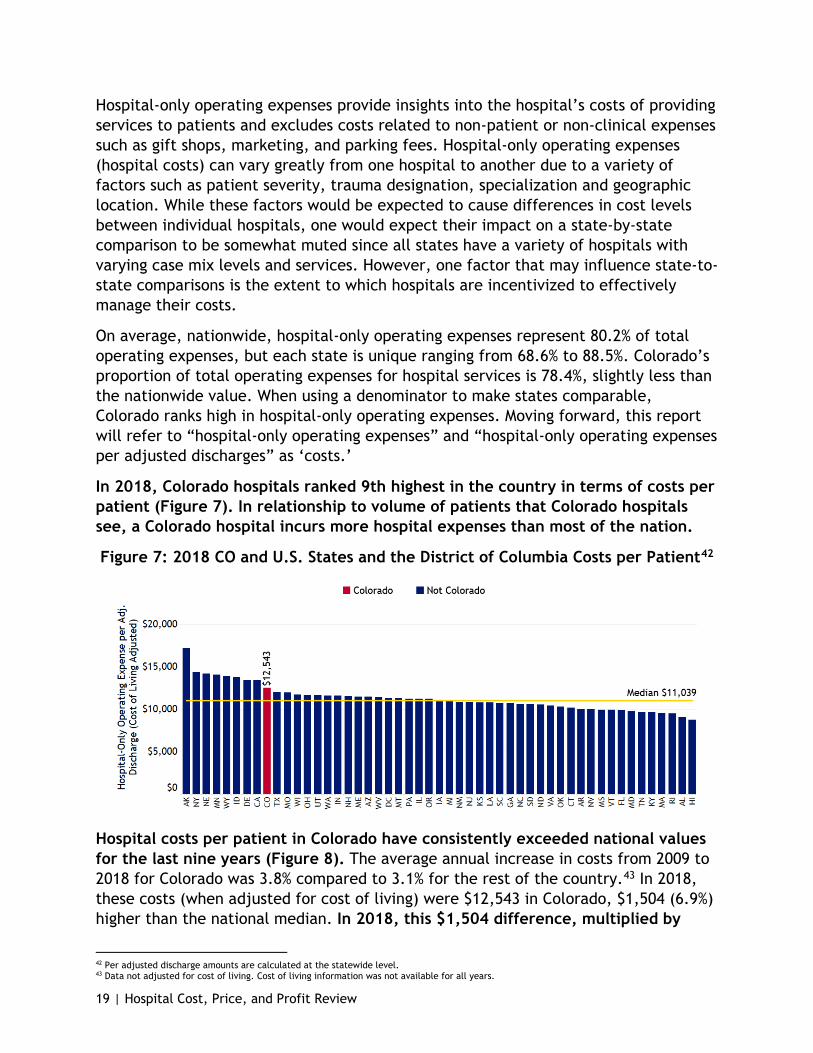
In 2018, Colorado hospitals ranked 9th highest in the country in terms of costs per patient (Figure 7). In relationship to volume of patients that Colorado hospitals see, a Colorado hospital incurs more hospital expenses than most of the nation.
Figure 7: 2018 CO and U.S. States and the District of Columbia Costs per Patient42
Hospital costs per patient in Colorado have consistently exceeded national values for the last nine years (Figure 8). The average annual increase in costs from 2009 to 2018 for Colorado was 3.8% compared to 3.1% for the rest of the country.43 In 2018, these costs (when adjusted for cost of living) were $12,543 in Colorado, $1,504 (6.9%) higher than the national median. In 2018, this $1,504 difference, multiplied by
42 Per adjusted discharge amounts are calculated at the statewide level. 43 Data not adjusted for cost of living. Cost of living information was not available for all years.
20 | Hospital Cost, Price, and Profit Review
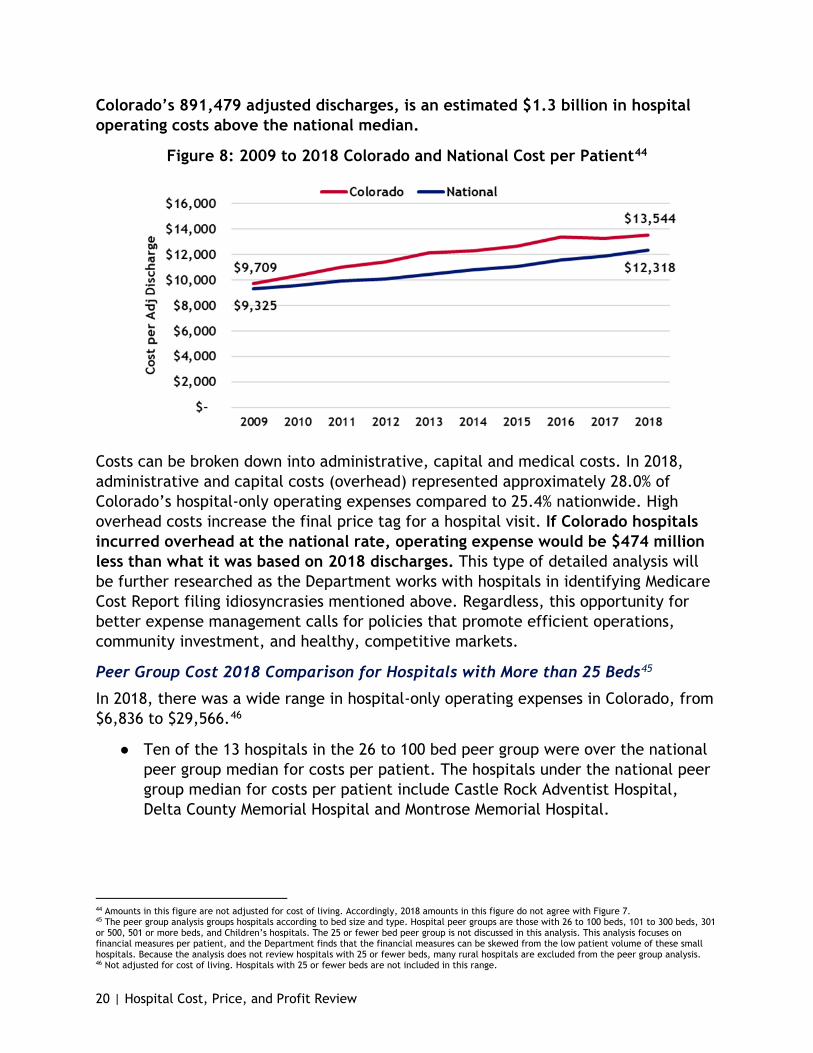
Colorado’s 891,479 adjusted discharges, is an estimated $1.3 billion in hospital operating costs above the national median.
Figure 8: 2009 to 2018 Colorado and National Cost per Patient44
Costs can be broken down into administrative, capital and medical costs. In 2018, administrative and capital costs (overhead) represented approximately 28.0% of Colorado’s hospital-only operating expenses compared to 25.4% nationwide. High overhead costs increase the final price tag for a hospital visit. If Colorado hospitals incurred overhead at the national rate, operating expense would be $474 million less than what it was based on 2018 discharges. This type of detailed analysis will be further researched as the Department works with hospitals in identifying Medicare Cost Report filing idiosyncrasies mentioned above. Regardless, this opportunity for better expense management calls for policies that promote efficient operations, community investment, and healthy, competitive markets.
Peer Group Cost 2018 Comparison for Hospitals with More than 25 Beds45
In 2018, there was a wide range in hospital-only operating expenses in Colorado, from $6,836 to $29,566.46
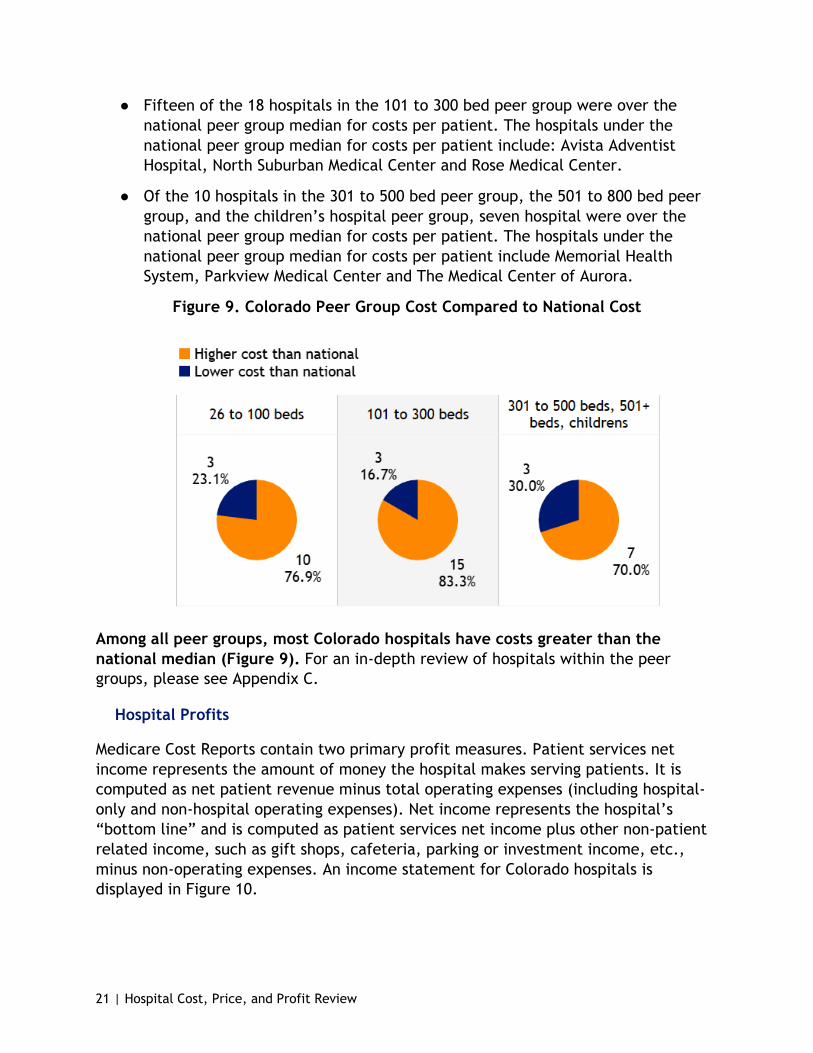
● Ten of the 13 hospitals in the 26 to 100 bed peer group were over the national peer group median for costs per patient. The hospitals under the national peer group median for costs per patient include Castle Rock Adventist Hospital, Delta County Memorial Hospital and Montrose Memorial Hospital.
44 Amounts in this figure are not adjusted for cost of living. Accordingly, 2018 amounts in this figure do not agree with Figure 7. 45 The peer group analysis groups hospitals according to bed size and type. Hospital peer groups are those with 26 to 100 beds, 101 to 300 beds, 301 or 500, 501 or more beds, and Children’s hospitals. The 25 or fewer bed peer group is not discussed in this analysis. This analysis focuses on financial measures per patient, and the Department finds that the financial measures can be skewed from the low patient volume of these small hospitals. Because the analysis does not review hospitals with 25 or fewer beds, many rural hospitals are excluded from the peer group analysis. 46 Not adjusted for cost of living. Hospitals with 25 or fewer beds are not included in this range.
21 | Hospital Cost, Price, and Profit Review
● Fifteen of the 18 hospitals in the 101 to 300 bed peer group were over the national peer group median for costs per patient. The hospitals under the national peer group median for costs per patient include: Avista Adventist Hospital, North Suburban Medical Center and Rose Medical Center.
● Of the 10 hospitals in the 301 to 500 bed peer group, the 501 to 800 bed peer group, and the children’s hospital peer group, seven hospital were over the national peer group median for costs per patient. The hospitals under the national peer group median for costs per patient include Memorial Health System, Parkview Medical Center and The Medical Center of Aurora.
Figure 9. Colorado Peer Group Cost Compared to National Cost
Among all peer groups, most Colorado hospitals have costs greater than the national median (Figure 9). For an in-depth review of hospitals within the peer groups, please see Appendix C.
Hospital Profits
Medicare Cost Reports contain two primary profit measures. Patient services net income represents the amount of money the hospital makes serving patients. It is computed as net patient revenue minus total operating expenses (including hospital-only and non-hospital operating expenses). Net income represents the hospital’s “bottom line” and is computed as patient services net income plus other non-patient related income, such as gift shops, cafeteria, parking or investment income, etc., minus non-operating expenses. An income statement for Colorado hospitals is displayed in Figure 10.

22 | Hospital Cost, Price, and Profit Review
Figure 10: 2018 Income Statement, All Colorado Hospitals47
Statement Line Colorado Net Patient Revenue $ 16,862,512,337
Hospital-Only Operating Expense 12,073,928,031 Non-Hospital Operating Expense 3,301,592,506
Total Operating Expenses 15,375,520,537 Patient Services Net Income 1,486,991,800 Patient Services Margin 8.8%
Plus: Other Non-Patient Income 1,371,040,633 Less: Other Non-Operating Expenses 8,546,621
Net Income $ 2,849,485,81248 Total Margin 15.6%
These profit measures can be expressed as margin percentages as well. Patient service margin is patient services net income divided by net patient revenue. Total margin is net income divided by the sum of net patient revenue and other income. Going forward, this report will refer to patient service net income and patient service margins as patient service profits. This report will also refer to net income and total margin as total profits.
47 Excludes psychiatric, long-term care, and rehabilitation hospitals. Total margin is 15.3% adjusted for cost of living. 48 58.2% of net income was that of nonprofit hospitals and 41.8% was that of for-profit hospitals. 87.2% of net income was that of six system hospitals and 12.8% was that of independent hospitals. Breakdowns of these income statements is in the report below.

23 | Hospital Cost, Price, and Profit Review
Figure 11: 2018 Colorado and United States Profits Per Patient49,50
Colorado’s patient service profit is $1,518 per patient, the fourth highest patient service profits in the nation.
In 2018, Colorado hospitals ranked 4th in patient services profits per patient (Figure 11) and 2nd in total profit per patient despite also ranking highly in terms of costs. This is due in large part to higher per patient prices.
In 2018, hospitals generated positive patient services profits in fewer than half of the states; in that same year, all states generated positive total profits. Colorado’s total profit per patient of $2,891 was approximately three times higher than the 2018 national median of $963. This $1,928 difference, multiplied by Colorado’s 891,479 adjusted discharges, was an estimated $1.7 billion in 2018 total profits above the national median. This illustrates the significance of non-patient revenues to hospitals’ bottom lines.
Furthermore, like hospitals in other states, Colorado hospitals have significant sources of non-patient related income. Typically, investment income is the single most significant source of non-patient related income. Colorado hospitals generated $1.5 billion from patient services in 2018 but nearly the same amount, $1.4 billion, was generated from non-patient sources. This $2.9 billion in 2018 profits represents a 15.6% (15.3% when adjusted for cost of living) total profit margin, the highest in the country and significantly higher than the national statewide median of 6.5% (still 6.5% when adjusted for cost of living, see Figure 12). For the 10-year period ending in 2018, all of Colorado’s hospitals together generated over $16.6 billion in total profit.
49 Data in figure adjusted for cost of living. 50 Per adjusted discharge amounts are calculated at the statewide level.

24 | Hospital Cost, Price, and Profit Review
Figure 12: 2018 Colorado and U.S. States and the District of Columbia Total Margin51
Peer Group Profit 2018 Comparison for Hospitals with More than 25 Beds52
Like the other variables discussed, Colorado hospitals have a wide range in total profit per patient, from as low as $1,074 to as high as $18,388.53
● Of the 13 hospitals in the 26 to 100 bed peer group, 10 were above the national peer group median for total profit per patient. The three hospitals below the national peer group median for total profit per patient include Community Hospital in Grand Junction, Delta County Memorial Hospital and St. Anthony North Health Campus.
● Fourteen of the 18 hospitals in the 101 to 300 bed peer group for 2018 were above the 2018 national peer group median for total profit per patient. The four hospitals below the national peer group median for total profit per patient include Boulder Community Hospital, Longmont United Hospital, Porter Adventist Hospital, and St. Mary Corwin Medical Center.
● Eight of the 10 hospitals in the 301 to 500 bed peer group, the 501 to 800 bed peer group and the children’s hospital peer group were above their national peer group median for total profit per patient except Parkview Medical Center and UCHealth Memorial Hospital.
51 Per adjusted discharge amounts are calculated at the statewide level and adjusted for cost of living. 52 The peer group analysis groups hospitals according to bed size and type. Hospital peer groups are those with 26 to 100 beds, 101 to 300 beds, 301 or 500, 501 or more beds, and children’s hospitals. The 25 or fewer bed peer group is not discussed in this analysis. This analysis focuses on financial measures per patient, and the Department finds that the financial measures can be skewed from the low patient volume of these small hospitals. Because the analysis does not review hospitals with 25 or fewer beds, many rural hospitals are excluded from the peer group analysis. 53 Not adjusted for cost of living. Hospitals with 25 or fewer beds are not included in this range.

25 | Hospital Cost, Price, and Profit Review
Figure 13. Colorado Peer Group Total Profit Compared to National
Among all peer groups, most Colorado hospitals have higher total profits per patient than the national median (Figure 13). For an in-depth review of hospitals within the peer groups, please see Appendix C.
Price Discrimination, Market Power and Cost Shift
Charging higher prices to commercially insured patients to offset public payer under compensation (i.e.; Medicare and Medicaid) is generically referred to as the cost shift. The importance of the concept of the cost shift in Colorado has led to the state legislature mandating the Colorado Healthcare Affordability and Sustainability Enterprise (CHASE) Board examine and report on cost shifting annually. However, the extent to which commercially insured patients pay higher prices is only partially related to cost shifting. In his paper titled “How Much Do Hospitals Cost Shift? A Review of the Evidence,” economist Austin B. Frakt distinguishes cost shifting from price discrimination.54 As explained in the paper, the practice of hospitals charging more to commercially insured patients is referred to as “price discrimination,” while hospitals charging more to these patients specifically to cover shortfalls from public programs is referred to as the cost shift.
Price discrimination is charging payers different prices for the same hospital services. It requires: • Negotiations between each
hospital or hospital system and each commercial payer are separate
• Private, confidential negotiations • Hospital market power enables
more leverage in a negotiation Price Discrimination. (n.d.). Economics Online. www.economicsonline.co.uk/Business_economics/Price_discrimination.html
54 Frakt, A. (2011, March 21). How Much Do Hospitals Cost Shift? A Review of the Evidence. The Milbank Quarterly Volume 89. doi.org/10.1111/j.1468-0009.2011.00621.x.

26 | Hospital Cost, Price, and Profit Review
Price discrimination is necessary for hospitals to cost shift; however, cost shifting is not necessary for hospitals to exercise price discrimination as it can exist independently from cost shifting. The range of prices hospitals charge insurance companies is a form of price discrimination. While hospitals have little ability to negotiate prices with public programs because Medicare and Medicaid set their own payment rates, hospitals do negotiate prices with the various commercial insurance payers. For hospitals with a high degree of negotiating leverage, such as those with a large market share or those that have purchased local physician groups, enabling them to dominate care delivery in a community, the underpayments by public programs likely have little impact on the prices charged to commercial payers. Hospitals with low market power and/or a low proportion of commercially insured patients are more likely to better adapt to the lower public program payments by managing their costs.30
Colorado hospitals exhibit a unique characteristic in that they are high price, high cost and high profit compared to hospitals in other states (see Hospital Price, Hospital Cost and Hospital Profits sections above). When compared to the rest of the country, Colorado hospitals rank 6th highest in price, 9th highest in hospital costs and 2nd highest in profit per patient, indicating they exhibit significant market power. This market power allows hospitals to increase prices and reduces their incentive to control costs, to the detriment of Coloradan families and employers. Additional analysis regarding the cost shift can be found in the Department’s January 2020 Colorado Cost Shift Analysis Report.
Drivers of Colorado Hospitals’ High Prices When analyzed as a whole, Colorado hospitals are high price, high cost and high profit, but this is not consistent on a case-by-case basis.55 To better understand the drivers of Colorado’s high prices, this section looks at the hospital level to see what is driving Colorado’s high hospital prices overall.
As discussed above, the majority (87.8%) of Colorado hospitals examined in the peer group analysis have prices above their national peer group medians (Figure 6). Expanding upon the “higher than” or “lower than” assessment of Figure 6, the Department has taken the information in the hospital-specific peer group analysis and categorized them based on their relationship to the hospital’s national peer group median.
55 This analysis is caveated by the scope of the data used, which does not account for case mix differences across the country, as well as differences in reporting. Since the Department started analyzing Medicare Cost Report data, the Department has collaborated with hospitals on best practices for interpreting their cost report data. For example, the Department is aware that Vail Valley’s adjusted discharges are understated as a result of the hospital’s reporting structure, Denver Health does not allocate all revenue and HealthONE hospitals do not include all costs in the same way as other hospitals. There is an opportunity for hospitals and the Department to collaborate on Medicare Cost Report standardization. The Medicare Cost Report data reflects what hospitals reported and certified with the federal government. The differences in reporting, and others, may affect the groupings in the analysis in this report, but the Medicare Cost Report is still the single-most comprehensive, audited, standardized, publicly available source of hospital financial and patient utilization information which the Department can use for national comparisons.
27 | Hospital Cost, Price, and Profit Review
Figure 14. Department Categorization of Hospitals Based Upon the Data’s Relationship to the Median
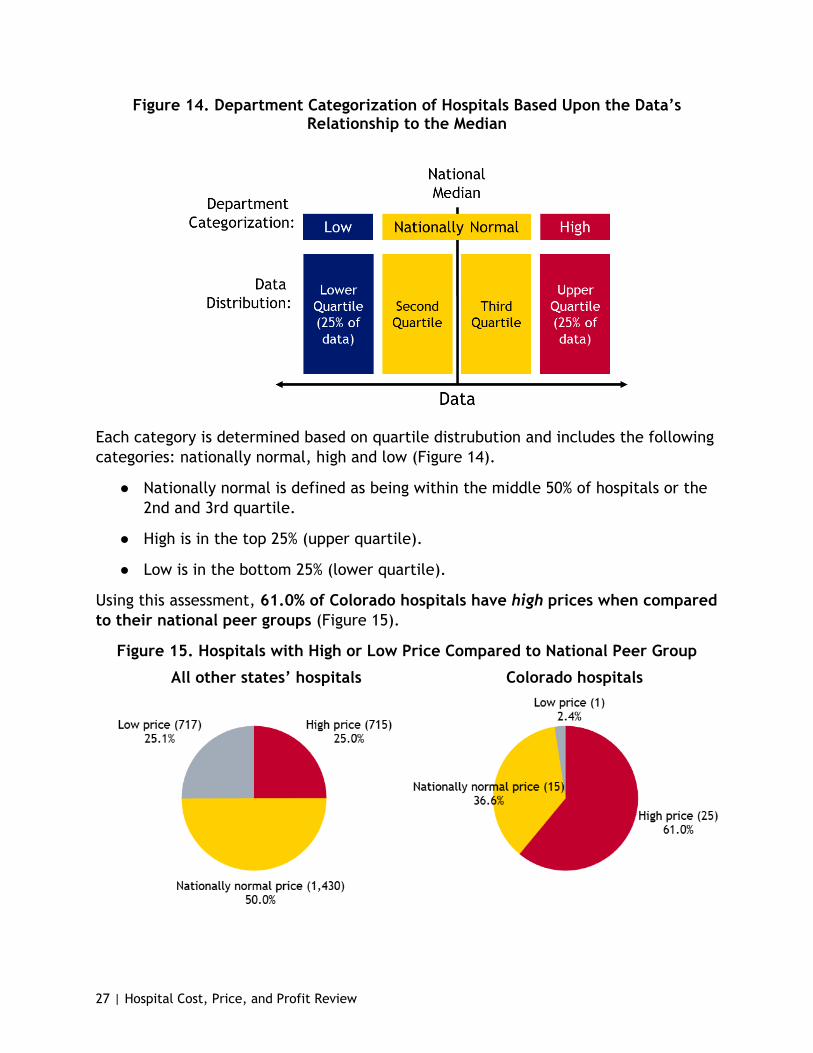
Each category is determined based on quartile distrubution and includes the following categories: nationally normal, high and low (Figure 14).
● Nationally normal is defined as being within the middle 50% of hospitals or the 2nd and 3rd quartile.
● High is in the top 25% (upper quartile).
● Low is in the bottom 25% (lower quartile).
Using this assessment, 61.0% of Colorado hospitals have high prices when compared to their national peer groups (Figure 15).
Figure 15. Hospitals with High or Low Price Compared to National Peer Group
All other states’ hospitals Colorado hospitals

28 | Hospital Cost, Price, and Profit Review
When shown across peer groups in this analysis, high prices persist relatively evenly; 61.5% of the 26 to 100 bed hospitals have substantially high prices. In the 101 to 300 bed group, 72.2% are in the upper quartile of price, while four of the 10 hospitals in the largest sized bed peer group are also in the upper quartile of price (Figure 16. High Price Hospitals (Top 25% of Hospitals in National Peer Group), Nationally Normal Price Hospitals (Middle 50% of Hospitals in National Peer Group) and Low-Price Hospitals (Bottom 25% of National Peer Group).
Figure 16. High Price Hospitals (Top 25% of Hospitals in National Peer Group), Nationally Normal Price Hospitals (Middle 50% of Hospitals in National Peer Group)
and Low-Price Hospitals (Bottom 25% of National Peer Group)
In order to lower hospital (and therefore health care) costs for Coloradans, policymakers can consider two major drivers of these high prices.
One Problem (Price), Two Sources (Costs and Profits)
As shown in this report, commercial prices are not driven by the cost shift, but by the strategic decisions made by hospital leaders or as some might call it, “price discrimination.”56,57 Expanding on this rationale, the Department offers an analysis of the distribution of hospitals with high prices in Colorado, and what may be contributing to their high prices.
As explained above, most Colorado hospitals have high prices. The Department finds there are two causes of most hospital’s high prices: high costs and high profits. These two areas also overlap, and compound, as seen in Figure 17 on the next page.
56 Department of Health Care Policy & Financing. (2020, January). Colorado Hospital Cost Shift Analysis Report January 2020. www.colorado.gov/pacific/hcpf/colorado-cost-shift-analysis. 57 Frakt, A. (2011, March 21). How Much Do Hospitals Cost Shift? A Review of the Evidence. The Milbank Quarterly Volume 89. doi.org/10.1111/j.1468-0009.2011.00621.x.
29 | Hospital Cost, Price, and Profit Review
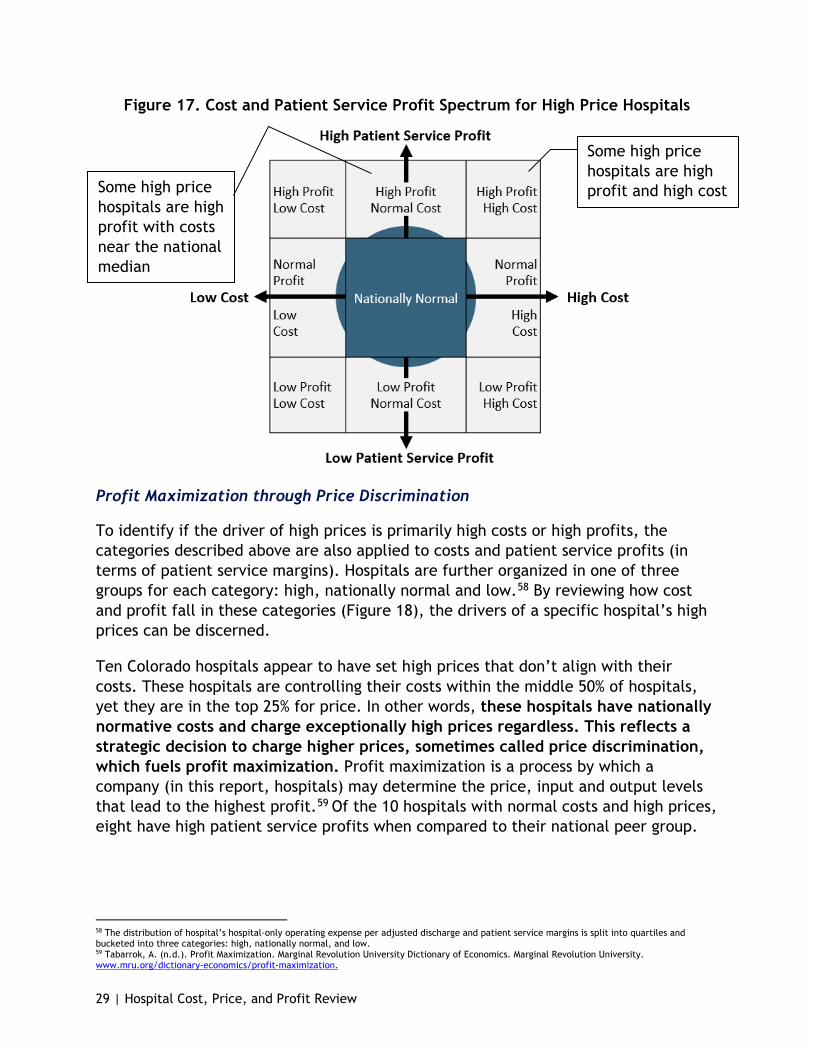
Figure 17. Cost and Patient Service Profit Spectrum for High Price Hospitals
Some high price hospitals are high profit and high cost Some high price
hospitals are high profit with costs near the national median
Profit Maximization through Price Discrimination
To identify if the driver of high prices is primarily high costs or high profits, the categories described above are also applied to costs and patient service profits (in terms of patient service margins). Hospitals are further organized in one of three groups for each category: high, nationally normal and low.58 By reviewing how cost and profit fall in these categories (Figure 18), the drivers of a specific hospital’s high prices can be discerned.
Ten Colorado hospitals appear to have set high prices that don’t align with their costs. These hospitals are controlling their costs within the middle 50% of hospitals, yet they are in the top 25% for price. In other words, these hospitals have nationally normative costs and charge exceptionally high prices regardless. This reflects a strategic decision to charge higher prices, sometimes called price discrimination, which fuels profit maximization. Profit maximization is a process by which a company (in this report, hospitals) may determine the price, input and output levels that lead to the highest profit.59 Of the 10 hospitals with normal costs and high prices, eight have high patient service profits when compared to their national peer group.
58 The distribution of hospital’s hospital-only operating expense per adjusted discharge and patient service margins is split into quartiles and bucketed into three categories: high, nationally normal, and low. 59 Tabarrok, A. (n.d.). Profit Maximization. Marginal Revolution University Dictionary of Economics. Marginal Revolution University. www.mru.org/dictionary-economics/profit-maximization.

30 | Hospital Cost, Price, and Profit Review
Figure 18: Count of Hospitals in Colorado in the Price-Cost-Profit Categories
Colorado hospitals with greater than 25 beds
High price 25
Nationally normal costs 10
High profit 8
Nationally normal profit
2
High cost 15
High profit 8
Nationally normal profit
6 Low profit
1
Not high price 16
Nationally normal costs
14 Low cost
2
See Figure 23 for hospitals that are not high price with nationally normal and low cost and how they compare in profits
See Figure 21 for hospitals that are high price with high costs and how they compare in profits
See Figure 19 for hospitals that are high price with nationally normal costs and how they compare in profits
Figure 19 (on the following page) shows the 10 high-price, nationally normal cost hospitals discussed above, by name. It is further grouped by high, normal, or low patient service profits. High prices combined with normative costs fuels larger profits, to the detriment of consumers and employers.

31 | Hospital Cost, Price, and Profit Review
Figure 19. Patient Service Profit Categories for Colorado’s High Price, Nationally Normal Cost Hospitals, Ten Hospitals [* indicates a for-profit hospital]
Cost Category High Price Hospitals System
High patient service profit
(8)
Nationally normal patient service profit
(2)
Low patient service profit
(0)
Nationally Normal Cost
Colorado Plains Medical Center* Yes
Nationally Normal Cost Littleton Adventist Hospital Centura
Adventist Yes
Nationally Normal Cost Parker Adventist Hospital Centura
Adventist Yes
Nationally Normal Cost Poudre Valley Hospital UCHealth Yes
Nationally Normal Cost Saint Joseph Hospital SCL Yes
Nationally Normal Cost Sky Ridge Medical Center* HealthONE Yes
Nationally Normal Cost
St Anthony Summit Medical Center
Centura CHI Yes
Nationally Normal Cost Swedish Medical Center* HealthONE Yes
Nationally Normal Cost Community Hospital Yes
Nationally Normal Cost Platte Valley Medical Center SCL Yes
High Costs
As shown in Figure 18, the majority Colorado hospitals are high price, high cost hospitals. Every hospital with high costs also has high prices, which is why the Department is also encouraging policy that focuses on lowering hospital costs. For these hospitals, high costs may be a challenge that can be addressed through policy to lower prices for Coloradans and our employers and to improve hospital sustainability, where appropriate.
There are inherent risks to being a high cost hospital, especially if revenues drop and expenses increase. These are the hospitals whose operations are most dependent on high hospital prices. Having high costs and reduced flexibility should be a concern, especially in times of increased utilization variability such as pandemics. Figure 20 shows a breakout of the high price hospitals nationally and in Colorado, comparing cost with patient services profit.
Unlike the national spread of hospitals in each category (cost and profit), the majority of Colorado hospitals fall within the high profit category, despite having normal or high costs. This illustrates that hospitals are making strategic pricing decisions, sometimes called price discrimination, to the detriment of Colorado families and

32 | Hospital Cost, Price, and Profit Review
employers. This is an opportunity for policymaker intervention, to requires some state intervention around high cost investments and price increases that don’t result in improved patient access, outcomes, or equity.
Figure 20: Count of National and Colorado Hospitals with High Prices in a Cost-Profit Matrix
All other state’s high price hospitals (715) Colorado high price hospitals (25)
This visual depicts the distribution of high price hospitals within a matrix of the cost and profit categories. ● The left matrix depicts the distribution of the high price national comparison group
(all state hospitals excluding Colorado) with greater than 25 beds. 715 of the 2,862 hospitals (25.0%) in the national comparison group fall within the high price category.
● The right matrix depicts the distribution of high price Colorado hospitals with greater than 25 beds. Twenty-five of the 41 Colorado hospitals with greater than 25 beds (61.0%) fall within the high price category. Colorado hospitals are disproportionately high price. Colorado hospitals are also disproportionately high profit and high cost (indicated by the higher count in the top right corner of the right matrix). Eight Colorado hospitals have high prices driven by high profits. Fifteen Colorado hospitals have high prices driven by high costs, and eight of those 15 have high prices driven by high costs and high profits.
o Five of the eight Colorado rural hospitals (62.5%) within this analysis (those rural hospitals with greater than 25 beds) fall within the high price category.
The sustainability concerns of being high cost is a nonissue for most of these high cost, high price hospitals as most (eight) of these high cost hospitals also made

33 | Hospital Cost, Price, and Profit Review
substantially high profits and six made nationally-normal profits (Figure 21). Only one of the hospitals in the high price, high cost category made low patient service profit.
Figure 21. Patient Service Profit Categories for Colorado’s High Price, High Cost Hospitals, 15 Hospitals [* indicates a for-profit hospital]
Cost Category High Price Hospitals System
High patient service profit
(8)
Nationally normal patient service profit
(6)
Low patient service
profit (1)
High Cost Mckee Medical Center Banner Health Yes
High Cost Medical Center of The Rockies UCHealth Yes High Cost Mercy Regional Medical Center Centura CHI Yes
High Cost North Colorado Medical Center Banner Health Yes
High Cost OrthoColorado Hospital Centura CHI Yes
High Cost Presbyterian St Luke’s Medical Ctr* HealthONE Yes
High Cost University of CO Hospital UCHealth Yes
High Cost Valley View Hospital Yes
High Cost Boulder Community Hospital Yes
High Cost Porter Adventist Hospital Centura Adventist Yes
High Cost St Anthony Hospital Centura CHI Yes
High Cost St Mary Corwin Medical Center Centura CHI Yes
High Cost St Mary’s Hospital & Medical Center (on the cusp of being high patient service profit)
SCL Yes
High Cost Vail Valley Medical Center Yes
High Cost Longmont United Hospital Centura CHI Yes
Profit Maximization and High Costs
Combining these two issues (high costs and high profits), eight of the high price hospitals are also categorized as high cost and high profit (Figure 21). Policymakers have a two-fold opportunity to reduce prices by driving hospital profits and costs in alignment with national peers.
Colorado hospitals are consistently far above their national peer groups in cost and/or price. Further, these high prices and high costs are not just in the top quartile of national hospitals, they also far exceed the quartile cutoff in many cases. Figure 22 depicts the variation of Colorado hospitals and summarizes the previous cost-price matrices and tables into one graph. Had the bulk of Colorado hospitals been closer to the national median in price and cost, there would be more dots (hospitals) positioned near the lines that indicate the national median. Instead, there are many
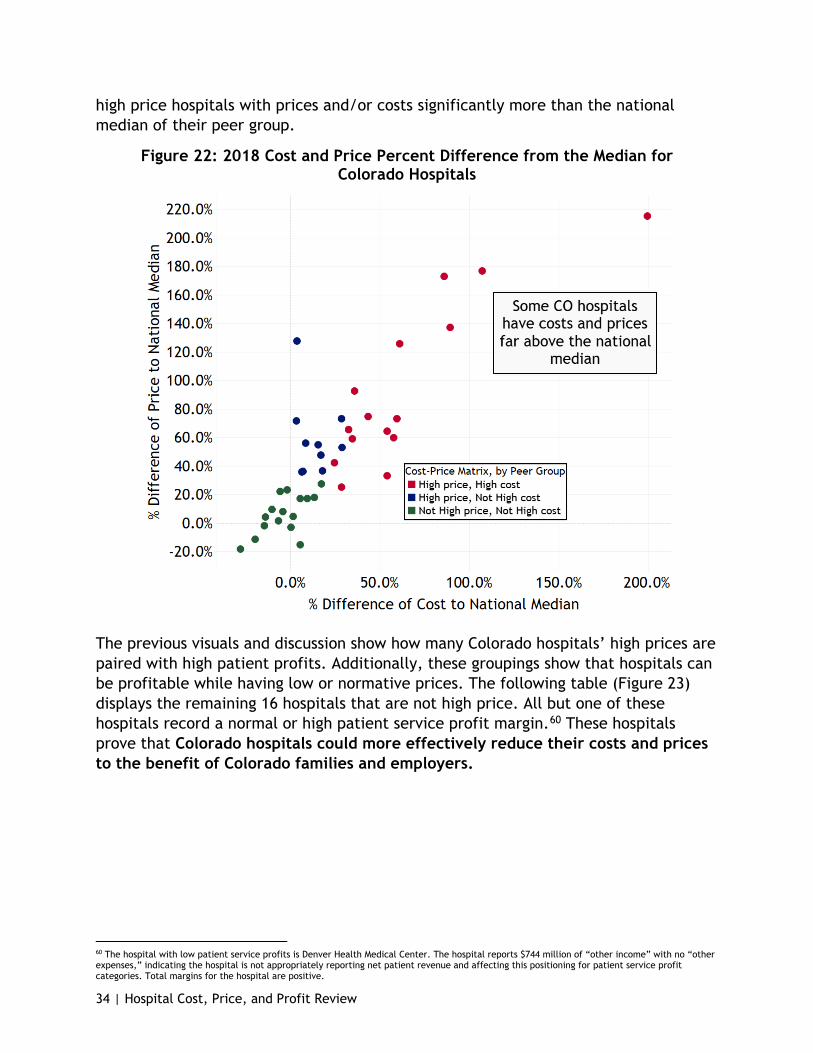
34 | Hospital Cost, Price, and Profit Review
high price hospitals with prices and/or costs significantly more than the national median of their peer group.
Figure 22: 2018 Cost and Price Percent Difference from the Median for Colorado Hospitals
The previous visuals and discussion show how many Colorado hospitals’ high prices are paired with high patient profits. Additionally, these groupings show that hospitals can be profitable while having low or normative prices. The following table (Figure 23) displays the remaining 16 hospitals that are not high price. All but one of these hospitals record a normal or high patient service profit margin.60 These hospitals prove that Colorado hospitals could more effectively reduce their costs and prices to the benefit of Colorado families and employers.
60 The hospital with low patient service profits is Denver Health Medical Center. The hospital reports $744 million of “other income” with no “other expenses,” indicating the hospital is not appropriately reporting net patient revenue and affecting this positioning for patient service profit categories. Total margins for the hospital are positive.

35 | Hospital Cost, Price, and Profit Review
Figure 23. Patient Service Profit Categories for Colorado’s Nationally Normal Cost and Low-Price Hospitals, 16 hospitals [* indicates a for-profit hospital]
Cost Category
Not high price Hospitals System
High patient service profit
Nationally normal patient
service profit
Low patient service profit
Nationally Normal Cost Good Samaritan Medical Ctr SCL Yes
Nationally Normal Cost Lutheran Medical Center SCL Yes
Nationally Normal Cost Rose Medical Center* HealthONE Yes
Nationally Normal Cost Avista Adventist Hospital Centura
Adventist Yes
Nationally Normal Cost
Castle Rock Adventist Hospital
Centura Adventist Yes
Nationally Normal Cost Children’s Hospital Colorado Yes
Nationally Normal Cost
Delta County Memorial Hospital Yes
Nationally Normal Cost Memorial Health System UCHealth Yes
Nationally Normal Cost Montrose Memorial Hospital Yes
Nationally Normal Cost Parkview Medical Center Yes
Nationally Normal Cost
Penrose/St. Francis Healthcare Centura CHI Yes
Nationally Normal Cost
San Luis Valley Reg Med Center
San Luis Valley Yes
Nationally Normal Cost
St Anthony North Health Campus Centura CHI Yes
Nationally Normal Cost
Denver Health Medical Center see footnote64 Yes
Low Cost North Suburban Medical Center* HealthONE Yes
Low Cost The Medical Center of Aurora * HealthONE Yes
High prices appear to be caused by two drivers that often layer on top of each other: high costs and profit maximization. Hospital strategic decisions to raise prices and maximize profits also raise questions about the adequacy of their investment in community benefits. This is a further opportunity for policymakers to require hospital minimums for community investment to battle the pattern of profit maximization. Recent research has shown that for-profit hospitals provide comparative community benefit as nonprofit hospitals which provides an opportunity to question the role of community benefits for both for-profit and nonprofit hospitals.61 The Department’s Medicare Cost Report analysis will continue to expand and explore this subject with stakeholder feedback.
61 Atkeson, Allie. (2020, December 4). The National Academy for State Health Policy. www.nashp.org/montana-audit-recommends-clarifying-and-strengthening-hospitals-community-benefit-and-charity-care-requirements.
36 | Hospital Cost, Price, and Profit Review
Rural Hospital Financial Struggles and Opportunity – The Time for Transformative Investment in Rural Hospitals Is Now
This report shows that Colorado hospitals in general have historically higher costs, higher prices and higher profits compared to the nation; however, this is not true for the state’s rural hospitals.
Unlike front range, large systems, rural hospitals require special attention and transformational investment. With their historic low margins, and the continued growth in public programs, rural hospitals are ripe for public investment that: (a) increases access to care for rural communities; (b) drives health care revenues into rural communities instead of channeling it to front range large hospital systems; (c.) stabilizes rural hospitals as a top employer in the community; (d) improves affordability capabilities; and (e) maximizes new alternate payment methodologies that reward affordability and quality outcomes while investing in rural hospital access expansion.
Rural hospital investments can be determined through an analysis of access needs across rural localities (i.e.: chemotherapy, cardiology, basic surgical, orthopedics, expanded primary care hours of operation, behavioral health, etc.) while also responding to changing rural demographics (i.e.: increasing 65 and older demographic and Health First Colorado membership). Alternate payment methodologies could also maximize the payments from Health First Colorado and Medicare as the primary payers for rural Colorado.
Policymakers should pay special attention to Colorado’s rural hospitals when developing health care affordability efforts, to reverse the flow of patients – and revenues - that are increasingly moving to urban markets while supporting care management capabilities and innovative transformation and payment models that allow rural patients to get care close to home. A recent Guidehouse study identified several factors contributing to the financial pressures specific to rural hospitals, with many of these factors directly impacting Colorado hospitals:62
● Losses in agriculture and manufacturing jobs have resulted in a deterioration in hospital payer mix. Rural communities now tend to be populated by either the very young or very old who are usually covered by Medicare or Medicaid.
● Many rural hospitals were built in an era when inpatient services were dominant but in recent years have seen declining inpatient volumes due to changing service offerings, patient outmigration and the modernization of hospital care in general. This leaves rural hospitals with the costs of maintaining outdated inpatient hospitals to provide primarily outpatient services.
62 Mosley, D. & Debehnke, D. (2020, April 8). 2020 Rural Hospital Sustainability Index. Guidehouse. www.guidehouse.com/insights/healthcare/2020/rural-hospital-sustainability-index.
37 | Hospital Cost, Price, and Profit Review
o This trend holds true for Colorado. In 2018 there was an average of 441 patients occupying Colorado rural hospital beds on any given day, a decline from 2009 when 519 rural hospital beds were occupied per day. Inpatient days for large rural hospitals (those with 26 or more beds) declined by 33.4%, while smaller rural hospitals (25 or fewer beds) saw an 10.1% increase in inpatient days.68
● Guidehouse found that not only are rural hospitals not able to retain medium and high need patients, 68% of low need patients - patients who could be well served at a rural hospital - opt to receive inpatient care at urban or suburban facilities.
● Many rural hospitals lack the capital needed to keep up with medical innovations.
● Like their urban counterparts, rural hospitals struggle to attract and maintain clinicians. However, the problem is much more pronounced for rural hospitals.
Just as no two rural hospitals are the same, solutions for this population will need to be addressed on a local and regional level through a variety of initiatives. Examples include a regional Centers of Excellence model that invests thoughtfully across rural hospitals to improve access to rural care by major delivery area (i.e.: behavioral health, extended primary care hours, chemotherapy, cardiology, basic surgical procedures, orthopedics, and more). Such investments will stabilize rural community tax revenues, income levels, schools, roads and more.
The Centers of Excellences model could be enabled through: (a) Hospital Transformation Program Rural Support Funding; (b) additional stimulus dollars from federal or state funds; (c.) alternative payment methodologies led by Health First Colorado; (d) grants to provide capital to help hospitals transform through the Office of eHealth Innovation in telehealth, electronic medical records, health information exchanges, and broadband.
Alternate payment methodologies – led by Health First Colorado and in collaboration with commercial payers and the Division of Insurance (DOI) – would reward the use of emerging prescriber tools to improve the affordability of prescription drugs, the expansion of primary care hours to reduce emergency room usage, the transformation of empty medical beds to much-needed behavioral health beds or outpatient specialty care such as chemotherapy and more. Investments in rural affordability and patient management capabilities managed by front range physician groups – are an opportunity to help rural hospitals thrive. There is also an opportunity to improve price analytics by using the state’s All Payer Claims Database to help establish appropriate pricing for newly created health care offerings while examining policies employed by commercial carriers that are driving advanced radiology (MRI, CAT scans, etc.) out of rural communities and to standalone urban centers.

38 | Hospital Cost, Price, and Profit Review
Through collaboration and investment, Colorado could lead the nation in favorably addressing rural affordability, access, outcomes and disparities in care. Opportunities for rural hospitals and rural communities must be considered independently from policy that is focused on urban hospital and delivery system opportunities.
Community Benefit of Nonprofit Hospitals Despite their higher profits compared to the rest of the country, most Colorado hospitals are nonprofit and have tax exempt status as a charitable organization. In theory, nonprofit hospitals are given tax-exempt status in return for the charity care and benefits they provide to their communities.
Nonprofit hospitals are coming under increased scrutiny regarding the appropriateness of the prices they charge, the level of community benefits they provide, and the value of taxes they would otherwise have to pay were it not for their tax-exempt status.63,64 To help communities evaluate this trade-off, each year nonprofit hospitals are required to quantify the dollar amount of community benefits they provide.65 However, most of what is filed as community benefit is related to uncompensated care, which includes charity care for uninsured patients and underpayment from public programs like Health First Colorado and Medicare.66 This report finds that for-profits incur a similar amount of costs related to uncompensated care. It also finds that although Colorado nonprofit hospitals are high profit, they deliver less community benefit compared to other states’ nonprofit hospitals.
Nonprofit Hospitals
A February 2020 study from Johns Hopkins Carey Business School and Johns Hopkins Bloomberg School of Public Health reported that nonprofit hospitals with strong financial performance provided disproportionately low levels of charity care. It also reported that in states that expanded Medicaid, nonprofit hospitals provided less charity care than hospitals in other states.67
Colorado expanded Medicaid coverage in January 2014 through the Affordable Care Act (ACA). Of Colorado’s 82 hospitals, 74 are nonprofit. Of the 74 nonprofits, 47 are private nonprofit hospitals while the remainder are public hospitals operating under county or other governmental entities like a health services district or authority. In 2018, nonprofit hospitals utilized around 7,400 beds for about 352,000 inpatient stays representing nearly 1.8 million days of inpatient care. Overall, in 2018 nonprofit hospitals provided 80.5% of inpatient care in the state (based on inpatient days),
63 Ofri, D. (2020, February 20). Why Are Nonprofit Hospitals So Highly Profitable?. The New York Times. www.nytimes.com/2020/02/20/opinion/nonprofit-hospitals.html. 64 Rapaport, L. (2020, February 17). Nonprofit Hospitals With Healthiest Finances Offer Little Charity Care. Reuters. www.reuters.com/article/us-health-hospitals-charity/nonprofit-hospitals-with-healthiest-finances-offer-little-charity-care-idUSKBN20B1WS. 65 Internal Revenue Service. Requirements for 501(c)(3) Hospitals Under the Affordable Care Act – Section 501(r) https://www.irs.gov/charities-non-profits/charitable-organizations/requirements-for-501c3-hospitals-under-the-affordable-care-act-section-501r 66 Ernst & Young, (2019, May), Estimates of the Federal Revenue Foregone Due to the Tax Exemption of Non-profit Hospitals Compared to the Community Benefit They Provide, 2016 – Prepared for the American Hospital Association. American Hospital Association. www.aha.org/system/files/media/file/2019/05/estimate-federal-revenue-forgone-due-to-tax-exemption-non-profit-hospitals-compared-to-community-benefit-they-provide-2016-report.pdf. 67 Bai, G. et al. (2020, February 17). Charity Care Provision by US Nonprofit Hospitals. JAMA Internal Medicine. doi.org/10.1001/jamainternmed.2019.7415.
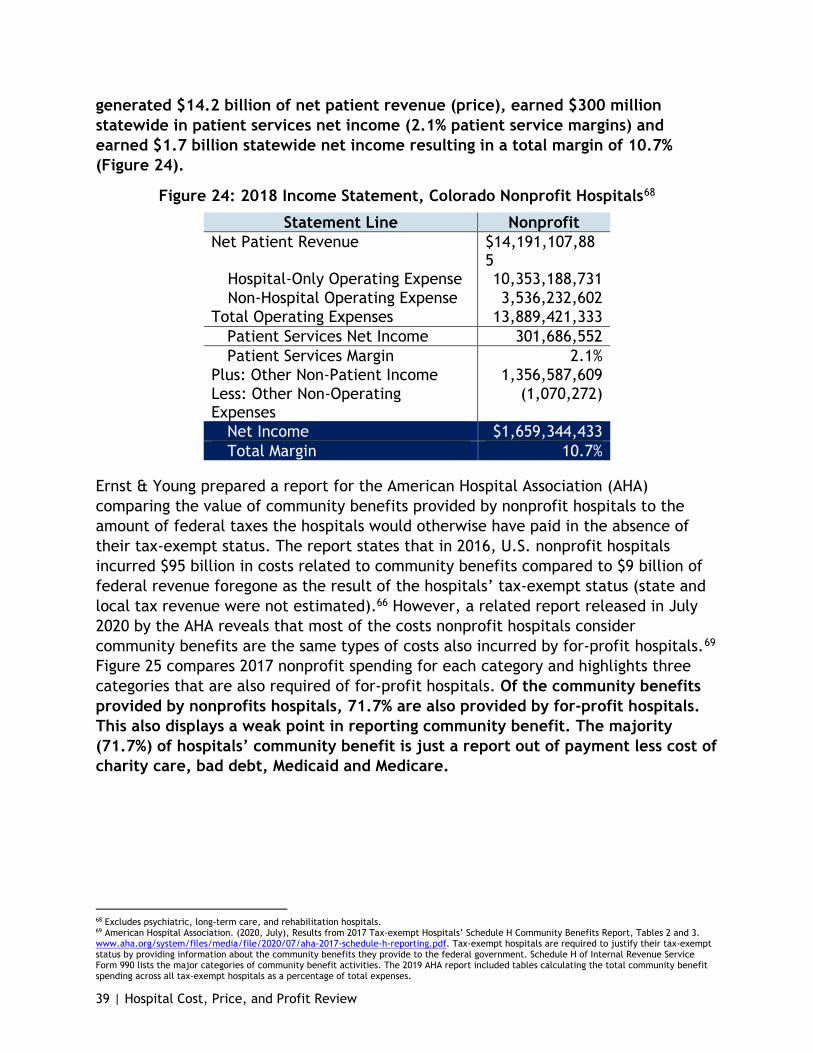
39 | Hospital Cost, Price, and Profit Review
generated $14.2 billion of net patient revenue (price), earned $300 million statewide in patient services net income (2.1% patient service margins) and earned $1.7 billion statewide net income resulting in a total margin of 10.7% (Figure 24).
Figure 24: 2018 Income Statement, Colorado Nonprofit Hospitals68
Statement Line Nonprofit Net Patient Revenue $14,191,107,88
5 Hospital-Only Operating Expense 10,353,188,731 Non-Hospital Operating Expense 3,536,232,602
Total Operating Expenses 13,889,421,333 Patient Services Net Income 301,686,552 Patient Services Margin 2.1%
Plus: Other Non-Patient Income 1,356,587,609 Less: Other Non-Operating Expenses
(1,070,272)
Net Income $1,659,344,433 Total Margin 10.7%
Ernst & Young prepared a report for the American Hospital Association (AHA) comparing the value of community benefits provided by nonprofit hospitals to the amount of federal taxes the hospitals would otherwise have paid in the absence of their tax-exempt status. The report states that in 2016, U.S. nonprofit hospitals incurred $95 billion in costs related to community benefits compared to $9 billion of federal revenue foregone as the result of the hospitals’ tax-exempt status (state and local tax revenue were not estimated).66 However, a related report released in July 2020 by the AHA reveals that most of the costs nonprofit hospitals consider community benefits are the same types of costs also incurred by for-profit hospitals.69 Figure 25 compares 2017 nonprofit spending for each category and highlights three categories that are also required of for-profit hospitals. Of the community benefits provided by nonprofits hospitals, 71.7% are also provided by for-profit hospitals. This also displays a weak point in reporting community benefit. The majority (71.7%) of hospitals’ community benefit is just a report out of payment less cost of charity care, bad debt, Medicaid and Medicare.
68 Excludes psychiatric, long-term care, and rehabilitation hospitals. 69 American Hospital Association. (2020, July), Results from 2017 Tax-exempt Hospitals’ Schedule H Community Benefits Report, Tables 2 and 3. www.aha.org/system/files/media/file/2020/07/aha-2017-schedule-h-reporting.pdf. Tax-exempt hospitals are required to justify their tax-exempt status by providing information about the community benefits they provide to the federal government. Schedule H of Internal Revenue Service Form 990 lists the major categories of community benefit activities. The 2019 AHA report included tables calculating the total community benefit spending across all tax-exempt hospitals as a percentage of total expenses.

40 | Hospital Cost, Price, and Profit Review
Figure 25: 2017 Community Benefit Categories and Percent of Total Expenses70,71
Community Benefit Category (National) Percent of total expense
Typical for
nonprofit hospitals?
Typical for for-profit hospitals?
Financial assistance, unreimbursed Medicaid, unreimbursed costs from means-tested government programs
6.4%
Medicare shortfall 3.1% Bad debt expense attributable to financial assistance 0.4%
Subtotal attributable for both nonprofit and for-profit 9.9%
Health professions education 1.7% Medical research 0.5% Cash and in-kind contributions to community groups 0.3%
Community building activities 0.1% Other (community health improvement, subsidized health) 1.7%
Total72 13.8% Percent of total that is attributable for both nonprofit and for-profit 71.7%
Per the AHA report, nonprofit hospitals provided community benefits valued at 13.8% of total expenses. Community benefit costs related to unreimbursed and uncompensated care amounted to 9.9% of total expenses or approximately 71.7% of total community benefits; these three categories - bad debt, charity care and Medicare/Medicaid shortfall - are costs incurred by both for-profit and nonprofit hospitals alike. Although for-profit hospitals are not required to report community benefits, the Medicare Cost Report requires most hospitals to report the cost of unreimbursed and uncompensated care related to Medicaid, the State Child Health Insurance Program marketed in Colorado as Child Health Plan Plus (CHP+), indigent care programs, and charity care. This information enables comparison between nonprofit and for-profit hospitals on the single largest category of community benefits.73
In 2018, Colorado hospitals reported $849.3 million in unreimbursed and uncompensated care, of which $152.4 million (17.9%) was incurred by for-profit
70 Colorado’s statewide totals do not include Children’s Hospital, which has not reported the cost of unreimbursed and uncompensated care in their cost reports since 2015. For reference, in 2015, Children’s Hospital reported a total of $55.4 million of unreimbursed and uncompensated cost of care. 71 Includes full-year cost reports and cost reports covering less than or more than one year. 72 Total does not sum due to rounding. 73 The Medicare Cost Report and IRS Form 990 require different methods of calculating unreimbursed and uncompensated care. The comparison in this report uses amounts from the Medicare Cost Report exclusively.
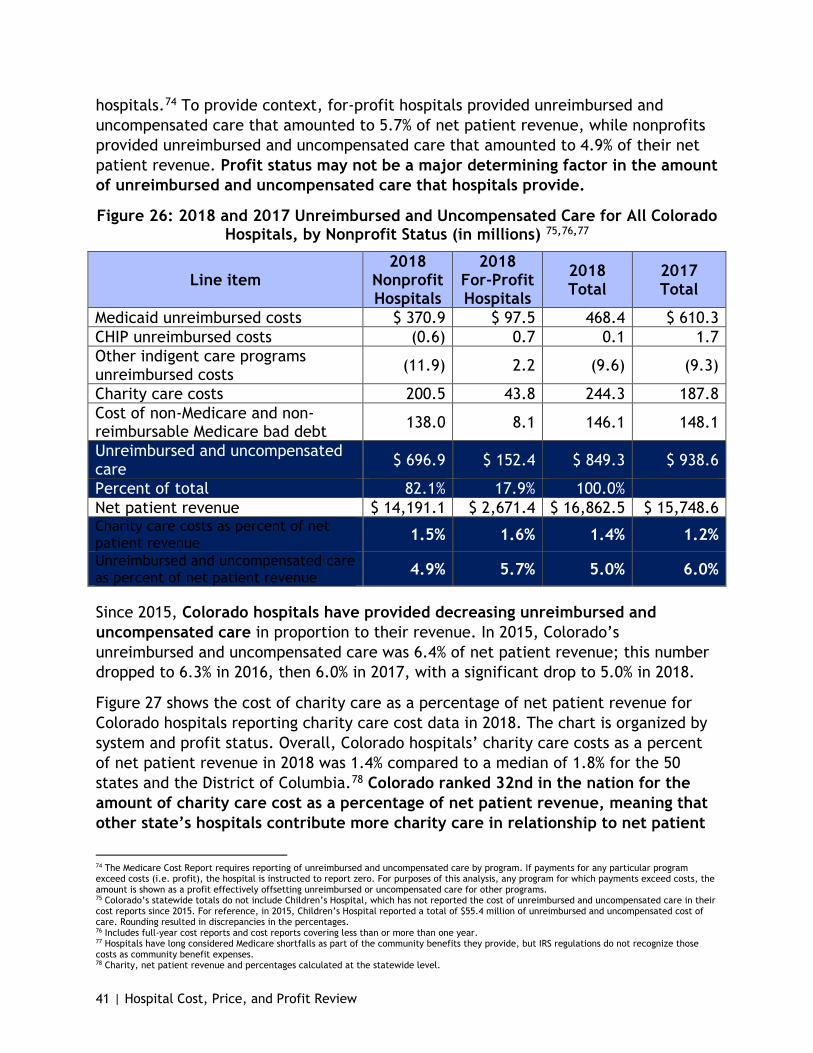
41 | Hospital Cost, Price, and Profit Review
hospitals.74 To provide context, for-profit hospitals provided unreimbursed and uncompensated care that amounted to 5.7% of net patient revenue, while nonprofits provided unreimbursed and uncompensated care that amounted to 4.9% of their net patient revenue. Profit status may not be a major determining factor in the amount of unreimbursed and uncompensated care that hospitals provide.
Figure 26: 2018 and 2017 Unreimbursed and Uncompensated Care for All Colorado Hospitals, by Nonprofit Status (in millions) 75,76,77
Line item 2018
Nonprofit Hospitals
2018 For-Profit Hospitals
2018 Total
2017 Total
Medicaid unreimbursed costs $ 370.9 $ 97.5 468.4 $ 610.3 CHIP unreimbursed costs (0.6) 0.7 0.1 1.7 Other indigent care programs unreimbursed costs (11.9) 2.2 (9.6) (9.3)
Charity care costs 200.5 43.8 244.3 187.8 Cost of non-Medicare and non-reimbursable Medicare bad debt 138.0 8.1 146.1 148.1
Unreimbursed and uncompensated care $ 696.9 $ 152.4 $ 849.3 $ 938.6
Percent of total 82.1% 17.9% 100.0% Net patient revenue $ 14,191.1 $ 2,671.4 $ 16,862.5 $ 15,748.6 Charity care costs as percent of net patient revenue 1.5% 1.6% 1.4% 1.2%
Unreimbursed and uncompensated care as percent of net patient revenue 4.9% 5.7% 5.0% 6.0%
Since 2015, Colorado hospitals have provided decreasing unreimbursed and uncompensated care in proportion to their revenue. In 2015, Colorado’s unreimbursed and uncompensated care was 6.4% of net patient revenue; this number dropped to 6.3% in 2016, then 6.0% in 2017, with a significant drop to 5.0% in 2018.
Figure 27 shows the cost of charity care as a percentage of net patient revenue for Colorado hospitals reporting charity care cost data in 2018. The chart is organized by system and profit status. Overall, Colorado hospitals’ charity care costs as a percent of net patient revenue in 2018 was 1.4% compared to a median of 1.8% for the 50 states and the District of Columbia.78 Colorado ranked 32nd in the nation for the amount of charity care cost as a percentage of net patient revenue, meaning that other state’s hospitals contribute more charity care in relationship to net patient
74 The Medicare Cost Report requires reporting of unreimbursed and uncompensated care by program. If payments for any particular program exceed costs (i.e. profit), the hospital is instructed to report zero. For purposes of this analysis, any program for which payments exceed costs, the amount is shown as a profit effectively offsetting unreimbursed or uncompensated care for other programs. 75 Colorado’s statewide totals do not include Children’s Hospital, which has not reported the cost of unreimbursed and uncompensated care in their cost reports since 2015. For reference, in 2015, Children’s Hospital reported a total of $55.4 million of unreimbursed and uncompensated cost of care. Rounding resulted in discrepancies in the percentages. 76 Includes full-year cost reports and cost reports covering less than or more than one year. 77 Hospitals have long considered Medicare shortfalls as part of the community benefits they provide, but IRS regulations do not recognize those costs as community benefit expenses. 78 Charity, net patient revenue and percentages calculated at the statewide level.

42 | Hospital Cost, Price, and Profit Review
revenue. Figure 27 highlights variation in charity care contributions by system and profit status, as a percentage of net patient revenue. Independent hospitals and some hospital systems (Banner Health and Centura Health CHI) have higher charity care cost as a percent of net patient revenue than the national median. The remaining hospital systems have a lower charity care cost compared to the national median. For-profit hospitals have a slightly higher charity care cost as a percentage of revenue than nonprofits, which is remarkable and requires further review. Overall, this chart indicates Colorado has an opportunity to increase its charity care in alignment with national norms or to lower its prices and therefore its net patient revenues, which would increase the respective percent of charity care. Recognizing Colorado hospitals have high profits, there is also an opportunity to simply repurpose their profits towards community care.
Figure 27: 2018 Charity Care Costs as a Percent of Net Patient Revenues
In the 2019 Colorado legislative session, House Bill (HB) 19-1320 was passed to increase hospital transparency. This bill addresses hospital community benefit accountability and requires hospitals to submit a community benefit implementation plan to the Department annually, while federal law requires hospitals to complete a community health needs assessment every three years. Hospitals are now required to report on matters concerning certain community benefits, costs and shortfalls in the preceding year. They are also required to convene a public meeting at least once each year to seek feedback regarding the hospital's community benefit activities during the previous year and the hospital's community benefit implementation plan for the following year.
The first year of this Hospital Community Benefit Accountability Report was published Jan. 15, 2021. Forty-seven hospitals reported overall community investment totaling $1.2 billion in 2019, with free or reduced-cost health care services making up $696 million of the reported community investments while addressing health behaviors or
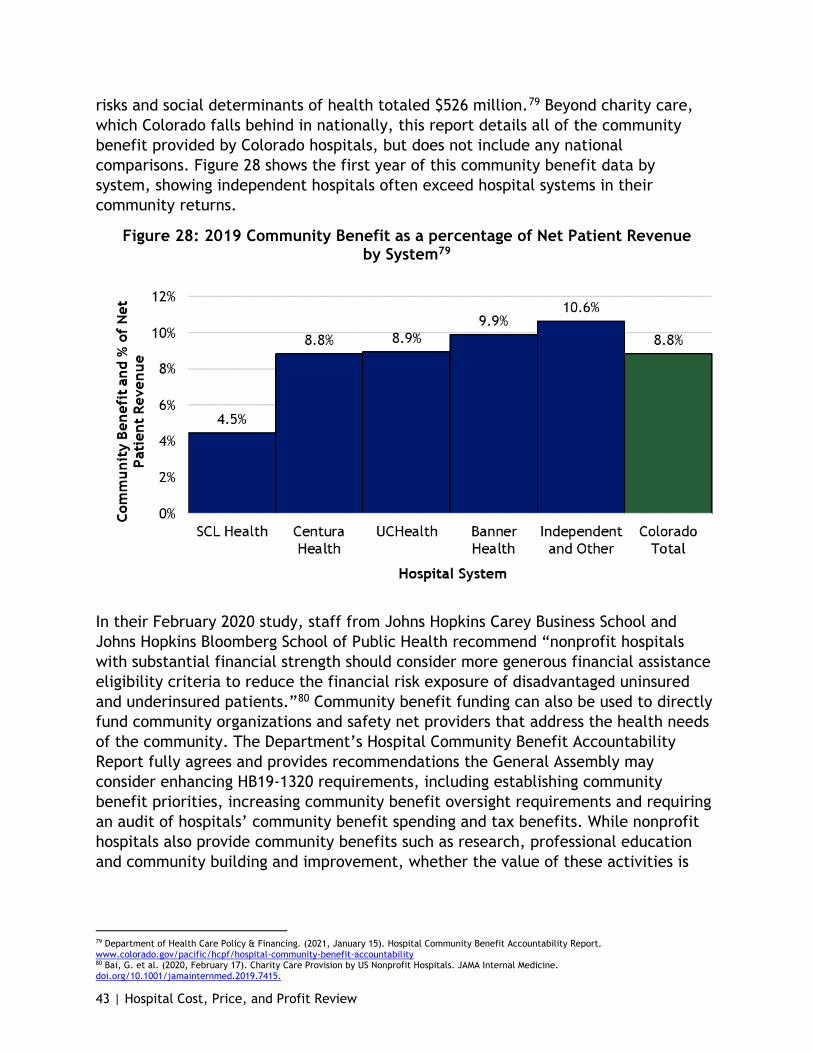
43 | Hospital Cost, Price, and Profit Review
risks and social determinants of health totaled $526 million.79 Beyond charity care, which Colorado falls behind in nationally, this report details all of the community benefit provided by Colorado hospitals, but does not include any national comparisons. Figure 28 shows the first year of this community benefit data by system, showing independent hospitals often exceed hospital systems in their community returns.
Figure 28: 2019 Community Benefit as a percentage of Net Patient Revenue by System79
In their February 2020 study, staff from Johns Hopkins Carey Business School and Johns Hopkins Bloomberg School of Public Health recommend “nonprofit hospitals with substantial financial strength should consider more generous financial assistance eligibility criteria to reduce the financial risk exposure of disadvantaged uninsured and underinsured patients.”80 Community benefit funding can also be used to directly fund community organizations and safety net providers that address the health needs of the community. The Department’s Hospital Community Benefit Accountability Report fully agrees and provides recommendations the General Assembly may consider enhancing HB19-1320 requirements, including establishing community benefit priorities, increasing community benefit oversight requirements and requiring an audit of hospitals’ community benefit spending and tax benefits. While nonprofit hospitals also provide community benefits such as research, professional education and community building and improvement, whether the value of these activities is
79 Department of Health Care Policy & Financing. (2021, January 15). Hospital Community Benefit Accountability Report. www.colorado.gov/pacific/hcpf/hospital-community-benefit-accountability 80 Bai, G. et al. (2020, February 17). Charity Care Provision by US Nonprofit Hospitals. JAMA Internal Medicine. doi.org/10.1001/jamainternmed.2019.7415.
44 | Hospital Cost, Price, and Profit Review
enough to distinguish nonprofit hospitals from their for-profit counterparts and justify their tax-exempt status deserves further consideration.
There is an opportunity to perform a review of Colorado’s large system tax-exempt hospitals, as a follow-up to this report, to provide insights into the taxes these hospitals would have paid if state or federal policy were to change in such a way that they did not meet tax exempt status compared to their community investments and charity care. Such a study could include scenarios that looked at: increased financial wealth; merger and acquisition activities and associated costs and ultimate impact on health care affordability to the community; price increases that may have fueled market share initiatives (such as M&A activities or construction) and have impacts on the community. Specifically, modeled tax revenues could be compared to a nonprofit’s actual community investments that are not also provided by for-profit hospitals. Analytics could also include scenario modeling that would consider taxes that would have been paid by these hospitals if their costs were better managed to national norms or to the costs recorded by Colorado’s for-profit hospital system (HCA Healthcare/ HealthONE). This review and report would also help inform policy that will reverse a worsening trend of decreasing charity care provided by nonprofit, tax exempt hospitals, as detailed on page .
Colorado hospitals have increasing profits, but they are not increasing their charity care programs contrary to the intention of their tax-exempt status and despite the growing demands of the communities they serve, especially in areas such as behavioral health, people experiencing homelessness, food bank support, and education. There is an opportunity to consider minimum requirements for community investment contribution levels to address this trend. There is a further opportunity to collaborate on investing an agreed upon portion of community investment dollars from each hospital into specific priorities to drive better results and outcomes. A collaborative stakeholder process could be employed to identify the priorities, consider the allocation portion and create a better, long term planning approach that is sensitive to local and statewide needs. Together, we could sequence agreed upon priorities, such as behavioral health, housing or food insecurity. Percent allocation opportunities could be established in multi-year increments to drive significant impact and results, similar to our collaborative COVID-19 response. Strong alignment between hospitals, the state and stakeholders would have optimal results and impact on targeted health and well-being opportunities compared to today's approach.
An outstanding example of this is how Colorado hospitals all collaborated with the state and each other over the last year around COVID-19 strategy. Hospitals have partnered with the state under the leadership of Gov. Polis on personal protective equipment (PPE), established reporting and testing protocols, shared best practices among their Chief Medical Officers on emerging treatments, and are now delivering vaccines to save lives and help Colorado restart the economy. At the same time, many hospitals stepped up to help their local area nursing homes that were struggling to
45 | Hospital Cost, Price, and Profit Review
keep up with the outbreaks, lack of PPE, and other challenges. Several hospitals invested in public messaging on the importance of wearing masks, social distancing, and washing hands to slow the COVID-19 spread.
Their aggregated, collaborative impact in protecting Coloradans against the impact of COVID-19 has been remarkable, inspirational and literally lifesaving. Clearly, alignment between hospitals and the state to dramatically impact a targeted health opportunity can make a meaningful difference in how the state strategically addresses its most pressing health care priorities. In the absence of the collection of tax revenues that would have been expended by Colorado’s legislature in prioritized, state initiatives, creating a multi-year plan that prioritizes community investments into targeted areas, and creates minimums around community investment levels might just be the next best thing to make a meaningful, transformative difference across Colorado’s most pressing health-related priorities.
Industry Integration, Expansion and Reserve-building Figure 3 illustrates the cycle of above-average hospital earnings driven from above-average prices used to reinvest in initiatives that enable the capture of greater market share, which leads to market power, which leads to higher prices. Popular initiatives undertaken in Colorado that enable the capture of greater market share include construction of new care delivery locations, expansion of existing facilities, expansion of services, purchase of primary care and specialty physician practices, purchase of other hospitals, and more. Most of these strategies are contrary to health care affordability goals and pose an opportunity for policymakers to craft new policy that curbs these behaviors to the betterment of Colorado families, employers and taxpayer funded programs like Health First Colorado.
Hospital Mergers, Horizontal Integration
The impact of hospital mergers and acquisitions and their impact on communities has been proven in several studies and has grown to the point that government bodies have begun to act on this market failure. Xavier Becerra, current Secretary of Health and Human Services and former California Attorney General, led California’s efforts in filing and settling a lawsuit against a large nonprofit health system in Northern California. Pointedly describing the issue, Becerra said “Sutter [Health] got big enough that it could use its market power to dominate, to dictate [prices]. It was abusing of its power.”81 Additionally, the Federal Trade Commission (FTC) has initiated a revamp of its Merger Retrospective Program with the goal of strengthening enforcement efforts.82
81 Stahl, Lesley. (2020, December 13). How A Hospital System Grew to Gain Market Power And Drove Up California Health Care Costs. CNN. www.cbsnews.com/news/california-sutter-health-hospital-chain-high-prices-lawsuit-60-minutes-2020-12-13/ 82 Federal Trade Commission Press Release. (2020, September). FTC’s Bureau of Economics to Expand Merger Retrospective Program. www.ftc.gov/news-events/press-releases/2020/09/ftcs-bureau-economics-expand-merger-retrospective-program.
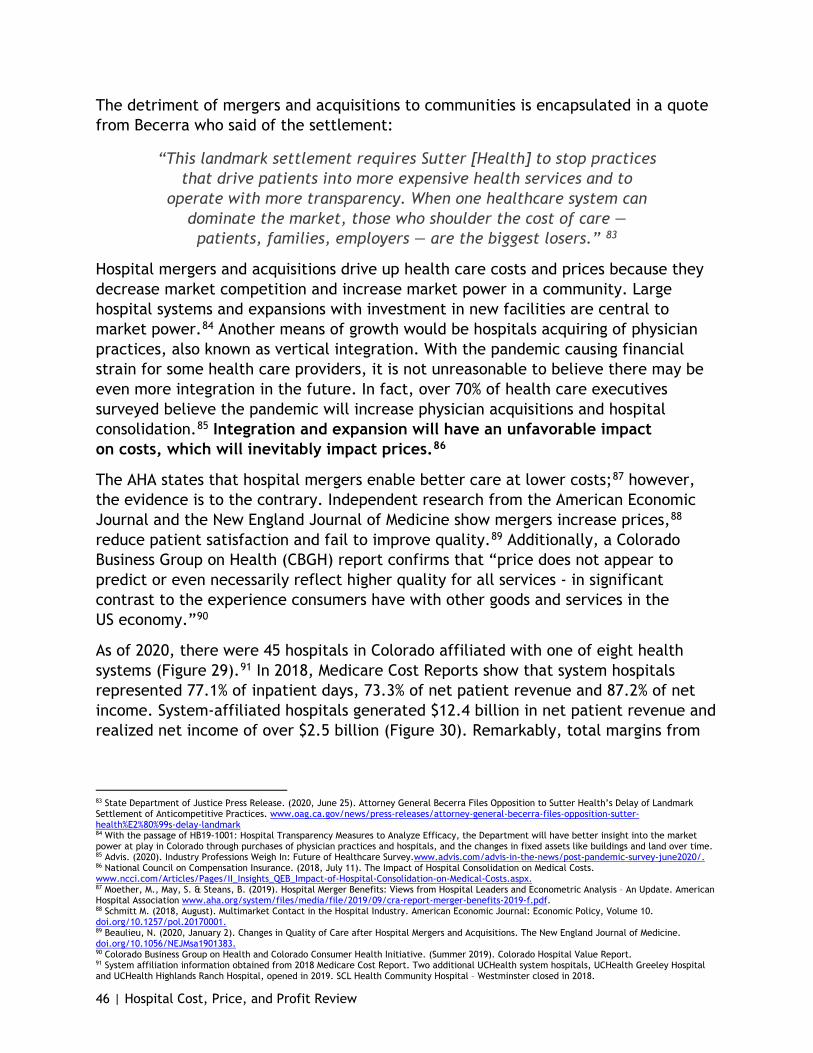
46 | Hospital Cost, Price, and Profit Review
The detriment of mergers and acquisitions to communities is encapsulated in a quote from Becerra who said of the settlement:
“This landmark settlement requires Sutter [Health] to stop practices that drive patients into more expensive health services and to
operate with more transparency. When one healthcare system can dominate the market, those who shoulder the cost of care — patients, families, employers — are the biggest losers.” 83
Hospital mergers and acquisitions drive up health care costs and prices because they decrease market competition and increase market power in a community. Large hospital systems and expansions with investment in new facilities are central to market power.84 Another means of growth would be hospitals acquiring of physician practices, also known as vertical integration. With the pandemic causing financial strain for some health care providers, it is not unreasonable to believe there may be even more integration in the future. In fact, over 70% of health care executives surveyed believe the pandemic will increase physician acquisitions and hospital consolidation.85 Integration and expansion will have an unfavorable impact on costs, which will inevitably impact prices.86
The AHA states that hospital mergers enable better care at lower costs;87 however, the evidence is to the contrary. Independent research from the American Economic Journal and the New England Journal of Medicine show mergers increase prices,88 reduce patient satisfaction and fail to improve quality.89 Additionally, a Colorado Business Group on Health (CBGH) report confirms that “price does not appear to predict or even necessarily reflect higher quality for all services - in significant contrast to the experience consumers have with other goods and services in the US economy.”90
As of 2020, there were 45 hospitals in Colorado affiliated with one of eight health systems (Figure 29).91 In 2018, Medicare Cost Reports show that system hospitals represented 77.1% of inpatient days, 73.3% of net patient revenue and 87.2% of net income. System-affiliated hospitals generated $12.4 billion in net patient revenue and realized net income of over $2.5 billion (Figure 30). Remarkably, total margins from
83 State Department of Justice Press Release. (2020, June 25). Attorney General Becerra Files Opposition to Sutter Health’s Delay of Landmark Settlement of Anticompetitive Practices. www.oag.ca.gov/news/press-releases/attorney-general-becerra-files-opposition-sutter-health%E2%80%99s-delay-landmark 84 With the passage of HB19-1001: Hospital Transparency Measures to Analyze Efficacy, the Department will have better insight into the market power at play in Colorado through purchases of physician practices and hospitals, and the changes in fixed assets like buildings and land over time. 85 Advis. (2020). Industry Professions Weigh In: Future of Healthcare Survey.www.advis.com/advis-in-the-news/post-pandemic-survey-june2020/. 86 National Council on Compensation Insurance. (2018, July 11). The Impact of Hospital Consolidation on Medical Costs. www.ncci.com/Articles/Pages/II_Insights_QEB_Impact-of-Hospital-Consolidation-on-Medical-Costs.aspx. 87 Moether, M., May, S. & Steans, B. (2019). Hospital Merger Benefits: Views from Hospital Leaders and Econometric Analysis – An Update. American Hospital Association www.aha.org/system/files/media/file/2019/09/cra-report-merger-benefits-2019-f.pdf. 88 Schmitt M. (2018, August). Multimarket Contact in the Hospital Industry. American Economic Journal: Economic Policy, Volume 10. doi.org/10.1257/pol.20170001. 89 Beaulieu, N. (2020, January 2). Changes in Quality of Care after Hospital Mergers and Acquisitions. The New England Journal of Medicine. doi.org/10.1056/NEJMsa1901383. 90 Colorado Business Group on Health and Colorado Consumer Health Initiative. (Summer 2019). Colorado Hospital Value Report. 91 System affiliation information obtained from 2018 Medicare Cost Report. Two additional UCHealth system hospitals, UCHealth Greeley Hospital and UCHealth Highlands Ranch Hospital, opened in 2019. SCL Health Community Hospital – Westminster closed in 2018.
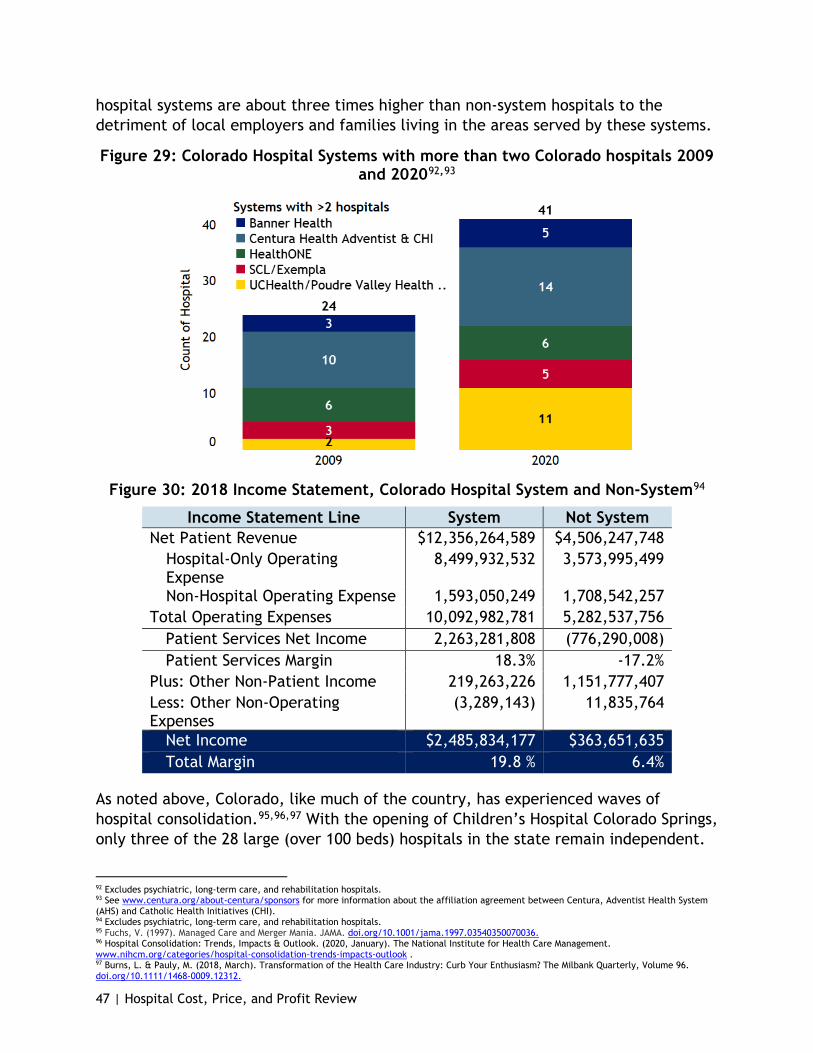
47 | Hospital Cost, Price, and Profit Review
hospital systems are about three times higher than non-system hospitals to the detriment of local employers and families living in the areas served by these systems.
Figure 29: Colorado Hospital Systems with more than two Colorado hospitals 2009 and 202092,93
Figure 30: 2018 Income Statement, Colorado Hospital System and Non-System94
Income Statement Line System Not System Net Patient Revenue $12,356,264,589 $4,506,247,748
Hospital-Only Operating Expense
8,499,932,532 3,573,995,499
Non-Hospital Operating Expense 1,593,050,249 1,708,542,257 Total Operating Expenses 10,092,982,781 5,282,537,756
Patient Services Net Income 2,263,281,808 (776,290,008) Patient Services Margin 18.3% -17.2%
Plus: Other Non-Patient Income 219,263,226 1,151,777,407 Less: Other Non-Operating Expenses
(3,289,143) 11,835,764
Net Income $2,485,834,177 $363,651,635 Total Margin 19.8 % 6.4%
As noted above, Colorado, like much of the country, has experienced waves of hospital consolidation.95,96,97 With the opening of Children’s Hospital Colorado Springs, only three of the 28 large (over 100 beds) hospitals in the state remain independent.
92 Excludes psychiatric, long-term care, and rehabilitation hospitals. 93 See www.centura.org/about-centura/sponsors for more information about the affiliation agreement between Centura, Adventist Health System (AHS) and Catholic Health Initiatives (CHI). 94 Excludes psychiatric, long-term care, and rehabilitation hospitals. 95 Fuchs, V. (1997). Managed Care and Merger Mania. JAMA. doi.org/10.1001/jama.1997.03540350070036. 96 Hospital Consolidation: Trends, Impacts & Outlook. (2020, January). The National Institute for Health Care Management. www.nihcm.org/categories/hospital-consolidation-trends-impacts-outlook . 97 Burns, L. & Pauly, M. (2018, March). Transformation of the Health Care Industry: Curb Your Enthusiasm? The Milbank Quarterly, Volume 96. doi.org/10.1111/1468-0009.12312.

48 | Hospital Cost, Price, and Profit Review
While health care reform efforts are likely behind some of the recent consolidation activity, the consolidation of Colorado hospitals into systems is clearly concurrent with higher profits as noted in Figure 30, is consistent with increased market share by these growing systems in Colorado and is further consistent with the hospital systems’ increasing market power to negotiate higher prices with commercial payers.98 Such market leverage due to mergers has advanced to the point that its impact on businesses and families drove California’s former Attorney General, as noted above, to use the court system to address and change hospitals’ anticompetitive practices.99 Colorado has this opportunity and a multitude of alternatives to address the negative impact of hospital system mergers and acquisitions on hospital prices and profits.
The dominance of hospital systems in Denver can be seen in Figure 31. In the Denver Metro area, just four hospital groups represented 85% of the hospital admissions according to a market assessment report from Catalyst for Payment Reform, an independent nonprofit corporation focused on higher-value health care.100 UCHealth has been actively expanding its health system of late. In 2015, four UCHealth hospitals spanned the Northern and Southern points of the I-25 corridor. Since then, UCHealth has opened or acquired seven hospitals in locations between the larger hospitals. With their acquisition of Yampa Valley Medical Center and construction of UCHealth Greeley, UCHealth continues to expand their northern reach west and east.
Figure 31: Health System Market-share in Denver, by 2017 Patient Admissions101
98 Abelson, R. (2018, November 14). When Hospitals Merge to Save Money, Patients Often Save More. The New York Times. www.nytimes.com/2018/11/14/health/hospital-mergers-health-care-spending.html. 99 Stahl, Lesley, (2020, December 13). How A Hospital System Grew to Gain Market Power And Drove Up California Health Care Costs. CNN. www.cbsnews.com/news/california-sutter-health-hospital-chain-high-prices-lawsuit-60-minutes-2020-12-13/ 100 Denver Area Market Assessment Report. (2019, September). Catalyst for Payment Reform. www.catalyze.org/wp-content/uploads/woocommerce_uploads/2019/09/CPR_Denver_MA_Report_WebVersion.pdf. 101 Book of Lists, Denver-Area Hospitals. Ranked by Patient Admissions in 2017. (2018, December). Denver Business Journal.

49 | Hospital Cost, Price, and Profit Review
Hospital consolidation would be beneficial if it improved efficiency through elimination of redundant services and functions. A 2018 study by the management consulting firm PwC stated that hospital consolidation has the potential to reduce costs anywhere from 15% to 30%.102 However, despite increased consolidation, hospital operating costs in Colorado are higher than the national average and have been increasing at a faster rate than the national average (Figure 8). Instead of seeing cost trends leveling off or declining during this period of rapid consolidation, Colorado’s costs grew at an accelerated rate. In 2018, hospital-only operating expenses per adjusted discharge were $12,543 in Colorado, 6.9% higher than the rest of the country.
PwC provides several reasons the mergers have not resulted in economies of scale savings including hospitals operating independently within the system, often competing against each other, and cost reduction not being a primary focus of a merger or other system affiliation. Additionally, mergers and affiliations are a competitive response to what another system may be doing.102 This seems to be the case with Colorado’s hospitals. Moreover, there is evidence that consolidation of Colorado hospitals has increased their market leverage. Using the RAND report that compares costs by procedure, the leverage hospitals have from merging can be examined without examining of patient severity.
As seen in Figure 32, hospital systems and large hospitals generally have higher prices compared to Medicare than smaller independent hospitals, with the prices for Independent hospitals averaging 218% of Medicare while the prices for system hospitals averaging 281% of Medicare. Those price differentials are reflected in the insurance premiums and self-funded claims paid by Colorado families and employers. Although the study acknowledges the claims data included in the analysis represent only a small share of the entire population of commercially insured patients, it does support the theory that market power is a principal driver of hospital prices in Colorado, employed for price discrimination beyond the cost-shift.103
102 Kaul, A., Prabha, K.R., & Katragadda,S. (2016). Size Should Matter: Five Ways to Help Healthcare Systems Realize the Benefits of Scale. Strategy&, part of the PwC network, www.strategyand.pwc.com/us/en/reports/2016/size-should-matter.pdf. 103 White and Whaley. (2020, September 18). Nationwide Evaluation of Health Care Prices Paid by Private Health Plans: Findings from Round 3 of an Employer-Led Transparency Initiative. RAND Corporation. doi.org/10.7249/RR4394.
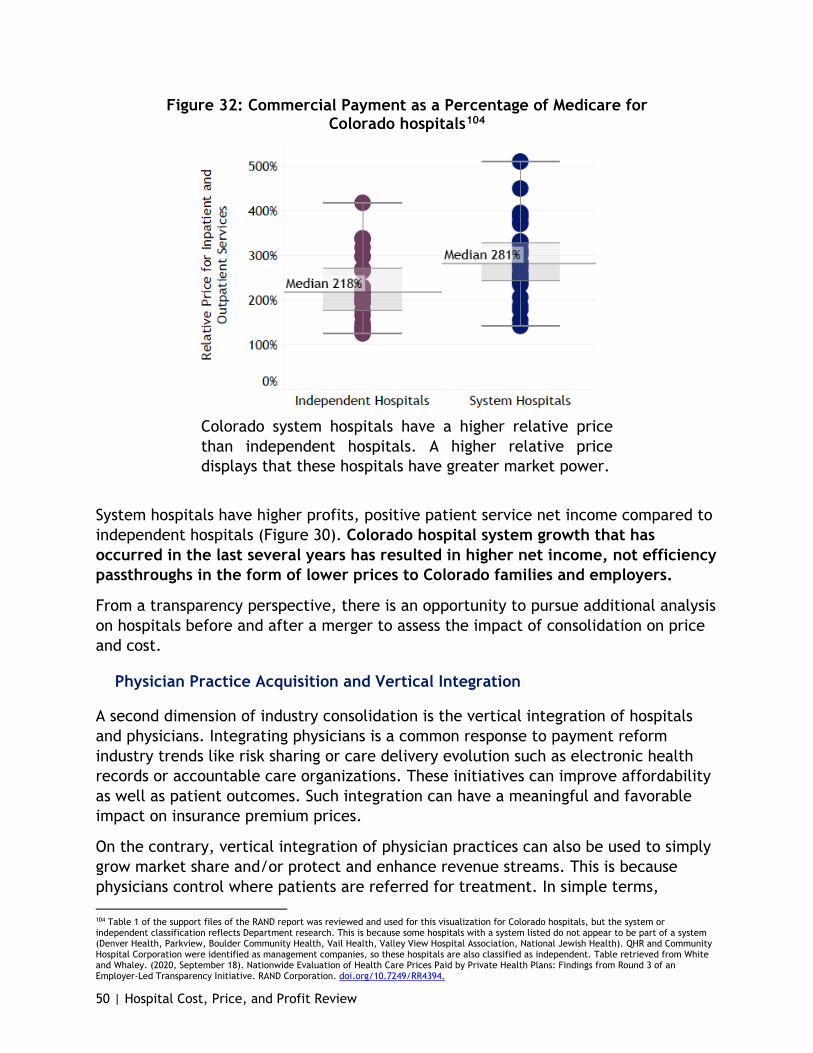
50 | Hospital Cost, Price, and Profit Review
Figure 32: Commercial Payment as a Percentage of Medicare for Colorado hospitals104
Colorado system hospitals have a higher relative price than independent hospitals. A higher relative price displays that these hospitals have greater market power.
System hospitals have higher profits, positive patient service net income compared to independent hospitals (Figure 30). Colorado hospital system growth that has occurred in the last several years has resulted in higher net income, not efficiency passthroughs in the form of lower prices to Colorado families and employers.
From a transparency perspective, there is an opportunity to pursue additional analysis on hospitals before and after a merger to assess the impact of consolidation on price and cost.
Physician Practice Acquisition and Vertical Integration
A second dimension of industry consolidation is the vertical integration of hospitals and physicians. Integrating physicians is a common response to payment reform industry trends like risk sharing or care delivery evolution such as electronic health records or accountable care organizations. These initiatives can improve affordability as well as patient outcomes. Such integration can have a meaningful and favorable impact on insurance premium prices.
On the contrary, vertical integration of physician practices can also be used to simply grow market share and/or protect and enhance revenue streams. This is because physicians control where patients are referred for treatment. In simple terms,
104 Table 1 of the support files of the RAND report was reviewed and used for this visualization for Colorado hospitals, but the system or independent classification reflects Department research. This is because some hospitals with a system listed do not appear to be part of a system (Denver Health, Parkview, Boulder Community Health, Vail Health, Valley View Hospital Association, National Jewish Health). QHR and Community Hospital Corporation were identified as management companies, so these hospitals are also classified as independent. Table retrieved from White and Whaley. (2020, September 18). Nationwide Evaluation of Health Care Prices Paid by Private Health Plans: Findings from Round 3 of an Employer-Led Transparency Initiative. RAND Corporation. doi.org/10.7249/RR4394.

51 | Hospital Cost, Price, and Profit Review
primary care physicians control the referral to specialists and specialists control referrals to acute care or procedural sites. Physicians who are employed by hospital systems are trained to, and provided tools to, refer care inside that hospital system. The more physicians a hospital system acquires, the more it controls practice patterns, referrals and market share. Of course, physician acquisition and integration can also simply be intended to acquire a high revenue or high profit practices such as those in oncology, orthopedics, or cardiology.
A recent national study by the Physicians Advocacy Institute (PAI) and Avalere Health confirms hospital employment of physicians and acquisition of physician practices is steadily growing.105 In 2012, 25.8% of all U.S. physicians were employed by hospitals while hospitals owned 13.6% of physician practices. As of January 2018, these percentages had nearly doubled to 44.0% and 31.2%, respectively.
While Colorado-specific data was not available from the study, regional information is available. In the 11-state western region, 41.2% of physicians were employed by hospitals as of January 2018, representing a 64.8% increase from July 2012. Twenty-eight percent of physician practices were owned by hospitals as of January 2018, which was a 147.8% increase from July 2012 (Figure 33). With a greater market share on physicians, there has been a shift in the services performed to the outpatient hospital setting from the office setting. While some services examined by the Health Care Cost Institute saw more or little change in care setting, services performed in an outpatient setting rose from 11.1% to 12.9% of overall services.106 Moving services into outpatient settings and reducing inpatient utilization would theoretically lower total costs of care, but any cost savings from this shift have been erased by the increasing price of outpatient care.107
Figure 33: Percent of Physicians Employed and Physician Practices Owned by Hospitals, July 2012 and January 2018, and Percent Growth108
Measure National 2012
National 2018
National Growth
West Region 2012
West Region 2018
West Region Growth
% of Hospital-Employed Physicians
25.8% 44.0% 70.8% 25.0% 41.2% 64.8%
% of Hospital-Owned Practices 13.6% 31.2% 128.7% 11.3% 28.0% 147.8%
105 Physicians Advocacy Institute. (2019, February). Updated Physician Practice Acquisition Study: National and Regional Changes in Physician employment 2012-2016. www.physiciansadvocacyinstitute.org/Portals/0/assets/docs/021919-Avalere-PAI-Physician-Employment-Trends-Study-2018-Update.pdf. 106 Hargraves, J. & Reiff, J.(2019, April 2). Shifting Care from Office to Outpatient Settings: Services are Increasingly Performed in Outpatient Settings with Higher Prices. Health Care Cost Institute. https://healthcostinstitute.org/in-the-news/shifting-care-office-to-outpatient. 107 Health Care Cost Institute. (2020). 2018 Health Care Cost and Utilization Report (Health Care Cost and Utilization Report). Health Care Cost Institute. www.healthcostinstitute.org/images/pdfs/HCCI_2018_Health_Care_Cost_and_Utilization_Report.pdf 108 Physicians Advocacy Institute. (2019, February). Updated Physician Practice Acquisition Study: National and Regional Changes in Physician employment 2012-2016. www.physiciansadvocacyinstitute.org/Portals/0/assets/docs/021919-Avalere-PAI-Physician-Employment-Trends-Study-2018-Update.pdf.
52 | Hospital Cost, Price, and Profit Review
These acquisitions came with the promise of better-coordinated care and lower costs but resulted in significantly higher prices than those not affiliated with a health system.109,110 The integration of physicians into hospitals and hospital systems, and the expansion of hospital outpatient facilities, has implications on health care costs. Delivering services in an outpatient hospital setting, when such services could have been provided from a physician’s office, serves to increase insurance premiums charged to Colorado families and employers, and in many cases out-of-pocket costs for patients as well. Specifically, hospital-employed physicians perform more services in a hospital outpatient setting rather than a non-hospital setting, which leads to billing for facility fees in additional to physician fees. For example, the Physician Advocacy Institute found Medicare pays $1,423 more for a three-day risk-adjusted cardiac imaging episode in an outpatient compared to inpatient setting.111 The Health Care Cost Institute found a diagnostic and screening ultrasound in an outpatient setting costs Medicare two times more as one in an office setting.112 There is an opportunity to study the obligations of nonprofit systems that purchase physician groups, specific to their addition of facility fees to encounters that were not accompanied by such additional fees prior to the acquisition and serve to raise the cost of care to communities, contrary to the intentions of nonprofit institutions.
These studies highlight the effects of vertical integration on physicians, patients and the overall health care system. The trend in physician employment and practice ownership is not driven solely by hospitals. These arrangements are increasingly attractive to physicians as requirements to implement and utilize electronic medical records and shift to integrated care are making it more expensive and difficult for physicians to remain independent. As the PAI study notes, “government and commercial payer payment policies increasingly favor integrated health systems and make it challenging for physician practices to remain independent.”113 Given that increasing outpatient hospital setting utilization results in higher costs for patients, employers and insurance premiums overall, there is an opportunity for policies that help physicians stay independent, ensure the efficiency intentions of vertical integration, promote competition, and enhance other avenues that help to reduce hospital prices.
Increased Capital Spending, Reserve-Building and Off-Balance Sheet Activity
The significant profits generated by Colorado hospitals over the last five to 10 years have facilitated a surge in capital asset (land, buildings, and equipment) spending. Capital assets are long-term assets with their cost spread over many years. This
109 Avalare Health. (2016, February). Medicare Payment Differentials Across Outpatient Settings of Care. Physicians Advocacy Institute. www.physiciansadvocacyinstitute.org/Portals/0/assets/docs/Payment-Differentials-Across-Settings.pdf. 110 Moether, M., May, S. & Steans, B. (2019). Hospital Merger Benefits: Views from Hospital Leaders and Econometric Analysis – An Update. American Hospital Association. www.aha.org/system/files/media/file/2019/09/cra-report-merger-benefits-2019-f.pdf. 111 Avalare Health. (2016, February). Medicare Payment Differentials Across Outpatient Settings of Care. Physicians Advocacy Institute. www.physiciansadvocacyinstitute.org/Portals/0/assets/docs/Payment-Differentials-Across-Settings.pdf. 112 Hargraves, J. & Reiff, J. (2019, April 2). Shifting Care from Office to Outpatient Settings: Services are Increasingly Performed in Outpatient Settings with Higher Prices. Health Care Cost Institute.https://healthcostinstitute.org/in-the-news/shifting-care-office-to-outpatient. 113 Physicians Advocacy Institute. (2019, February). Updated Physician Practice Acquisition Study: National and Regional Changes in Physician employment 2012-2016. www.physiciansadvocacyinstitute.org/Portals/0/assets/docs/021919-Avalere-PAI-Physician-Employment-Trends-Study-2018-Update.pdf.

53 | Hospital Cost, Price, and Profit Review
means the amounts invested in capital assets in recent years will impact annual hospital costs not just for the short term but for years to come.
Colorado hospitals reported a $6.9 billion increase in capital assets from 2009 to 2018.114 In 2009, Colorado hospitals reported $11.2 billion in capital assets compared to $18.1 billion in 2018, an overall increase of 61.8%, or average annual increase of 5.5% (Figure 34). Approximately 60% of the increase was related to land and buildings, with the remainder representing increases in equipment cost. Colorado exceeded national median growth for both land and building assets at cost and equipment assets at cost. Colorado’s land and building assets grew 58.3% while equipment assets grew 68.0%. National median growth for land and building assets is 55.5% over the period, and 41.7% for equipment assets over the period.
Figure 34: Growth of Colorado Hospitals’ Land, Buildings and Equipment at Cost, 2009 - 2018 (in millions)
The hospital systems in Colorado accounted for $4.3 billion, or 62%, of this increase in assets from 2009 to 2018. Children’s Hospital Colorado accounted for $818.1 million, or 11.7%. The remaining independent hospitals of Denver Health, Boulder Community Hospital and Parkview Medical Center accounted for $772.1 million or 11.1% (Figure ). The change in fixed assets is net of any assets sold or otherwise disposed of during the period and therefore does not necessarily reflect total additions of fixed assets over time. Total additions likely exceed the amounts shown in Figure .115 In 2018, the amount of net capital assets employed per adjusted discharge in Colorado was 4th highest in the nation.116 Colorado hospitals have more capital resources per patient, and their accompanying costs, than all but a few other states.
114 Amounts are stated at cost and are not net of any accumulated depreciation. 115 As part of the annual Medicare Cost Report, hospitals are required to report the amount of capital asset purchases, but this information has proven to be unreliable as many hospitals do not complete the applicable worksheet properly. 116 Land, buildings and equipment net of accumulated depreciation divided by adjusted discharges.

54 | Hospital Cost, Price, and Profit Review
Figure 35: Colorado Hospitals Land, Buildings and Equipment at Cost, in 2009 and 2018 (in millions)117
System or Independent118 Hospital or System 2009 2018 Increase %
Increase System SCL $1,880.7 $2,976.6 $1,095.9 58.3% System Centura CHI $1,406.7 $2,333.4 $926.7 65.9% System UCHealth $2,112.7 $2,851.3 $738.5 35.0% System Centura Adventist $626.4 $1,352.2 $725.8 115.9% System Banner Health $225.7 $725.1 $499.4 221.3% System HealthONE $1,556.3 $1,854.8 $298.5 19.2% System San Luis Valley Health $57.8 $80.5 $22.7 39.3% System Subtotal $7,866.2 $12,173.8 $4,307.6 54.8%
Large Independent Children's Hospital Colorado $818.9 $1,637.0 $818.1 99.9%
Large Independent Denver Health Medical Center $658.8 $1,108.6 $449.7 68.3%
Large Independent Parkview Medical Center $216.8 $400.6 $183.8 84.8%
Large Independent Boulder Community Hospital $312.9 $451.5 $138.6 44.3%
Large Independent Subtotal $2,007.5 $3,597.7 $1,590.2 79.2%
Other Independent Other Independent $1,339.7 $2,374.9 $1,035.2 77.3%
Total Total $11,213.4 $18,146.4 $6,933.0 61.8%
Along with more investment in capital assets, Colorado has some of the highest construction costs in the nation. In 2018, Colorado ranked 5t in the nation in hospital-only capital costs.119 Hospital-only capital costs per adjusted discharge in Colorado were $1,257 in 2018 compared to $943 for the nation overall (33% higher).
Before the pandemic, six hospitals in Colorado were expected to spend close to a billion dollars on construction for outpatient facilities in 2020.120 As discussed in the Physician Practice Acquisition and Vertical Integration section of this report, care that would otherwise be provided in a physician’s office or clinic setting billed at an outpatient facility incurs additional facility fees, increasing prices to insurance carriers, employers, consumers and Health First Colorado.
Despite the increase in construction and population growth in recent years, hospitals are not building inpatient capacity or significantly increasing access to care. The
117 For comparison purposes, hospitals that were part of a system in 2018 are assumed to have been part of that system in 2009. 118 Large independent hospitals not part of a hospital system with 101 or more beds. 119 Adjusted for cost of living. 120 Werley, J. (2019, December). Colorado hospital systems focus on outpatient construction to meet demands on capacity, lower costs. Denver Business Journal. www.bizjournals.com/denver/news/2019/12/19/colorado-hospitals-systems-focus-on-outpatient.html.
55 | Hospital Cost, Price, and Profit Review
number of available beds in Colorado increased by less than 5% from 2009 to 2018. The number of inpatient days increased by an even smaller percentage, 2.0%, resulting in a drop in statewide occupancy rates from 68.2% in 2009 to 66.6% in 2018. This is in line with the 2018 national median of 66.0%.121 Comparing growth areas for hospitals in the Denver metro area to their community health needs assessment shows significant misalignment between what hospitals are spending their money on and what the community says it needs, such as behavioral health care.
In addition to fostering increased capital spending, the net income generated by Colorado hospitals has allowed hospitals to increase cash reserves. According to Medicare Cost Report data, cash and investments held by Colorado hospitals increased from $2.7 billion in 2009 to $6.9 billion in 2018. This growth exceeds the stock market’s growth during the period and is an increase of 151.4% compared to a 103.4% increase for hospitals in the rest of the country.
The Department’s analysis as presented in this report shows hospitals are investing in their own assets instead of reducing prices or increasing their community benefit investment or charity care programs.
State Cost Control Efforts and Tools In April 2019, Gov. Jared Polis released the “Polis-Primavera Roadmap to Saving Coloradans Money on Health Care.”122 This roadmap, and its subsequent updates, outlines the Polis administration’s plan to lower health care costs. Since the roadmap’s publication, many cost control efforts have been achieved, including the passage of legislation impacting hospital prices, costs, behaviors, and transparency, such as those outlined below.
● HB19-1001 Hospital Transparency Measures to Analyze Efficacy:123 This bill mandates hospitals provide data to the Department leading to a published report on hospital finances and utilization from the Department. This report is due to the General Assembly annually on Jan. 15.
● HB19-1174 Out-of-Network Health Care Services:124 This bill includes provisions for how health insurance carriers will reimburse providers (doctors, hospitals and other health care providers) for out-of-network emergency and non-emergency care. The bill requires health insurance carriers and providers to disclose to patients the potential costs of receiving services from an out-of-network provider or facility.
121 Includes observation days. 122 Gov. Polis Unveils Roadmap to Lowering Health Care Costs. (2019, April 4). Colorado Governor Jared Polis. www.colorado.gov/governor/news/gov-polis-unveils-roadmap-lowering-health-care-costs. 123 Hospital Transparency Measures to Analyze Efficacy, HB19-1001. 2019 Regular Session. (2019). www.leg.colorado.gov/bills/hb19-1001. 124 Out-of-network Health Care Services, HB19-1174. 2019 Regular Session. (2019) www.leg.colorado.gov/bills/hb19-1174.
56 | Hospital Cost, Price, and Profit Review
● HB19-1320 Hospital Care Providers’ Accountability to Communities: 125 This bill requires greater community benefit accountability reporting from nonprofit tax-exempt hospitals. This report is due to the General Assembly annually on Jan. 15.
Department Efforts
With the support of Gov. Jared Polis, the Health Cabinet, the Office of Saving People Money on Health Care and the Colorado legislature, the Department has been tasked with a range of health care cost control efforts and reporting.
● The Hospital Transformation Program (HTP): The HTP is a five-year program that will transition hospitals from pay-for-process and reporting to a pay-for-performance structure over a five-year period. The HTP aims to improve the quality of hospital care provided to Health First Colorado members by tying provider-fee-funded hospital payments to quality-based initiatives. To be successful, hospitals must demonstrate meaningful community engagement and improvements in health outcomes over time. This program reflects strong collaboration between the Department, Colorado hospitals, and the Colorado Hospital Association. The HTP includes expectations for key activities and tracking measures, in order to be consistent across the state, while also allowing hospitals to work with their communities on the best interventions and approaches.
● Colorado Cost Shift Analysis Report: In January 2020, the Department released Colorado Cost Shift Analysis Report. The genesis of this report began in response to efforts by the CHASE Board, legislators, the Department and the Colorado Hospital Association to understand why the cost shift is not improving.126 Extensive analysis conducted by the Department illustrates that the “cost shift” is, at this point, a myth; rising hospital prices to commercial payers are not the result of underpayments by public programs but are the result of strategic decisions made by hospital leadership to achieve organizational goals such as market share expansion or increased earnings.
● Hospital Expenditure Report: The Hospital Expenditure Report is the first comprehensive dataset resulting from HB19-1001. The Colorado-specific hospital information within the yearly report and appendix tables has hospital-specific information like discharges, outpatient visits, revenue, bad debt, charity care, and operating expenses.
125 Hospital Care Providers’ Accountability to Communities, HB19-1320. 2019 Regular Session. (2019). www.leg.colorado.gov/bills/hb19-1320. 126 Department of Health Care Policy & Financing. (2020, January). Colorado Hospital Cost Shift Analysis Report January 2020. www.colorado.gov/pacific/hcpf/colorado-cost-shift-analysis
57 | Hospital Cost, Price, and Profit Review
● The Joint Budget Committee instructed the Department to continue investigating why the cost shift does not appear to be improving. As part of implementing the request the Department has created tools that analyze hospital cost, price and profit. Resulting analyses are publicly available at the Hospital Report Hub and include:
o The Hospital Cost Reporting Tool is an interactive visualization of the Medicare Cost Report dataset used within this report. The Department encourages the public to use this tool to examine their community hospitals’ costs, prices and profits.
o The Hospital Cost, Price and Profit Review is the first of future publications of the Department’s analysis of Medicare Cost Report data to illustrate how Colorado hospitals compare with the rest of the nation on key, meaningful metrics. The goal is that this analysis will help inform affordability policy and evolve with stakeholder feedback.
Please visit the Department’s Hospital Report Hub for these reports, tools and other resources on hospitals, and our Health Care Affordability Hub for other affordability strategies and information.
Conclusion The Hospital Cost, Price and Profit Review report calls attention to the hospital components associated with rising health care costs. Commercial insurance costs are high, government funded health care programs are growing, and Colorado hospitals are high cost, high price and high profit compared to other states.
A financial review of the state of the Colorado hospital industry shows the path we are on is unsustainable and this unprecedented time of pandemic, recession and social unrest is an opportunity to launch our hospital industry in a new, more sustainable direction with the goal of achieving a better normal that responds to the needs of Colorado families, employers and the state.
Hospitals, especially urban and system hospitals, have perpetuated a financial cycle that has made them high cost, requiring higher payments from health care consumers. At the same time, higher profits exist at the expense of Coloradans and employers who are forced to pay disproportionately high hospital prices, insurance premiums and out-of-pocket costs for care. In Colorado, most Colorado hospitals rank high in both cost and profits as hospitals continue to charge higher prices than needed to cover their costs – costs which exceed national averages.
High cost, price and profit are a commonality for many Colorado hospitals. The peer group analysis shows hospitals with more than 25 beds, most Colorado hospitals, are above the national averages in per-patient costs, prices, and profits. This excludes most of the rural hospitals, which are mostly under 25 beds. Rural hospitals need to

58 | Hospital Cost, Price, and Profit Review
be addressed separately from urban hospitals and solutions are ideally at the local or regional level. The rural hospital care delivery and payment system need improvement to ensure access to care while maintaining hospital viability.
Lower prices and costs seen in most states in the nation illustrate an opportunity for collaborative efforts between the state, employers, carriers and Colorado hospitals to improve hospital affordability to the benefit of Colorado families, employers and the state’s budget.
High profits have allowed hospitals to afford investments in both horizontal and vertical integration, leading to increased capital spending and fueling a quest for increased market share. This has resulted in a significant increase in the number of hospitals affiliated with one of the six (eight if hospital systems with only two hospitals are included) hospital systems in the state, as well as hospital-owned physician practices. This horizontal and vertical consolidation does not benefit Coloradans with lower prices. As Colorado hospitals have generated more profits, there has been an increase in hospital construction and other capital spending. The use of profits for reserve-building becomes questionable when compared to the alternatives – hospitals could have lowered their prices to start to drive improvements in health care affordability or they could have invested in their communities.
The criteria to maintain nonprofit, tax-exempt status is increasingly questionable. Although nonprofit hospitals do not pay taxes like other community organizations, Colorado’s for-profit hospitals incur unreimbursed and uncompensated care costs at almost the same level as their nonprofit counterparts. With so much overlap, more analysis is needed to reveal the true financial differences and responsibilities distinguishing between a “for-profit” and “nonprofit” hospital. Today a nonprofit hospital can raise its prices; increase its profits and investment capital; build, buy, and purchase other hospitals; buy physician groups to self-refer and move care to more costly outpatient hospital care; create hundreds of millions in investment earnings from retained profits; and create a mega-system structure all while being a nonprofit entity. There is an opportunity for improved policy that better defines the requirements of nonprofit, tax exempt hospital in Colorado.
This report assessed the past to better plan for the future of health care in Colorado, and to thoughtfully drive for a “new normal” in health care that benefits Coloradans, employers and the state in collaboration with our hospital partners. The Department’s goal is to share this and other hospital analysis with community leaders so they can address health care affordability in their communities with objective data while concurrently using this report to collaborate with hospital leadership to create affordability targets and strategies to achieve them. For additional tools and analyses on hospitals, please visit the Department’s Hospital Report Hub including a chart that lists out potential opportunities for addressing affordability.

59 | Hospital Cost, Price, and Profit Review Appendix A
Appendix A: Methodology and Notes of Financial & Volume Indicators Data Source This report primarily uses Medicare Cost Report information from 2009 to 2018 pulled in October 2019 to shed light on Colorado hospitals. Data in these reports are self-reported by hospitals to the Centers for Medicare and Medicaid Services (CMS). It is maintained by the federal government in the Healthcare Provider Cost Reporting Information System (HCRIS). The information below will note fields and other sources than Medicare Cost Reports.
The Medicare Cost Report is arguably the most comprehensive and standardized reporting of hospital information available to the public. As with any reporting system, it has drawbacks. Despite receiving significant scrutiny by Medicare Administrative Contractors, not all portions of the cost report are independently reviewed for accuracy and errors in reporting do occur. Further, some information useful for hospital comparisons, such as the relative complexity of the illnesses a hospital treats or information about commercial insurance business, is not available in the cost report. Despite these drawbacks, the Medicare Cost Report is a valuable tool for benchmarking and identifying trends and opportunities. Unless otherwise noted, all information in this report is derived from CMS 2018 HCRIS – October 2019 update. For comparative purposes and where possible, information in this report has been adjusted for cost-of-living differences using data from the Council for Community and Economic Research (C2ER).
Using Medicare Cost Reports, the Department of Health Care Policy & Financing (the Department) has developed a set of comparative measures to provide insight into hospital revenues, costs and net income. These measures are generally expressed on a per-patient basis, to allow for comparisons between hospitals of different sizes. This appendix describes the measures used and provides the methodology to calculate them. The set of measures include:
Hospital revenue (or price) measures
● Net patient revenue per adjusted discharge
Hospital cost measures
● Hospital-only operating expenses per adjusted discharge. This can be divided into the following three sub-categories:
o Hospital-only administrative costs per adjusted discharge

60 | Hospital Cost, Price, and Profit Review Appendix A
o Hospital-only capital costs per adjusted discharge o Medical costs per adjusted discharge
Hospital net income measures
● Patient services net income per adjusted discharge ● Patient services margin (percent) ● Net income per adjusted discharge ● Net income margin (percent)
The term hospital-only recognizes the amount of expenses can vary significantly from hospital to hospital depending on the hospitals’ activities. For example, some hospitals may be more involved in research and/or teaching, while others may incur expenses associated with the operation of various clinics or surgical centers. Others may operate large retail pharmacies or incur significant non-reimbursable costs. The challenge, therefore, is to develop measures that focus on a core set of standardized costs. Hospital-only costs exclude costs not reimbursable by Medicare and costs associated with interns and residents. While excluding these costs goes a long way towards creating a parallel comparison, other factors, such as the types of services offered by a hospital, the complexity of illnesses treated, and cost of living differences can cause variations in costs from one hospital to another.
The objective of the measurements created is to derive amounts that facilitate high-level hospital comparisons. It is recognized there are many factors that may cause differences in revenue, cost, net income, margin levels, etc., among hospitals that would otherwise appear to be similar. Therefore, caution should be exercised before drawing conclusions from information resulting from this methodology.
Data Inclusions and Exclusions
Only hospitals with cost reports covering complete years are included. Generally, a hospital is considered to have a complete year if the cost report covers a period of 364 to 368 days. Hospitals with multiple cost reports that represent a one-year period are included. Categorization by year is based on the hospital’s cost report end-date.
Hospitals for which there is no data, or for which the value is less than one in the following fields are excluded:
● Hospital-only operating expense ● Hospital-only administrative costs ● Hospital-only capital costs ● Net patient revenue ● Total operating expenses ● Total revenue (charges) ● Inpatient revenue (charges) ● Discharges
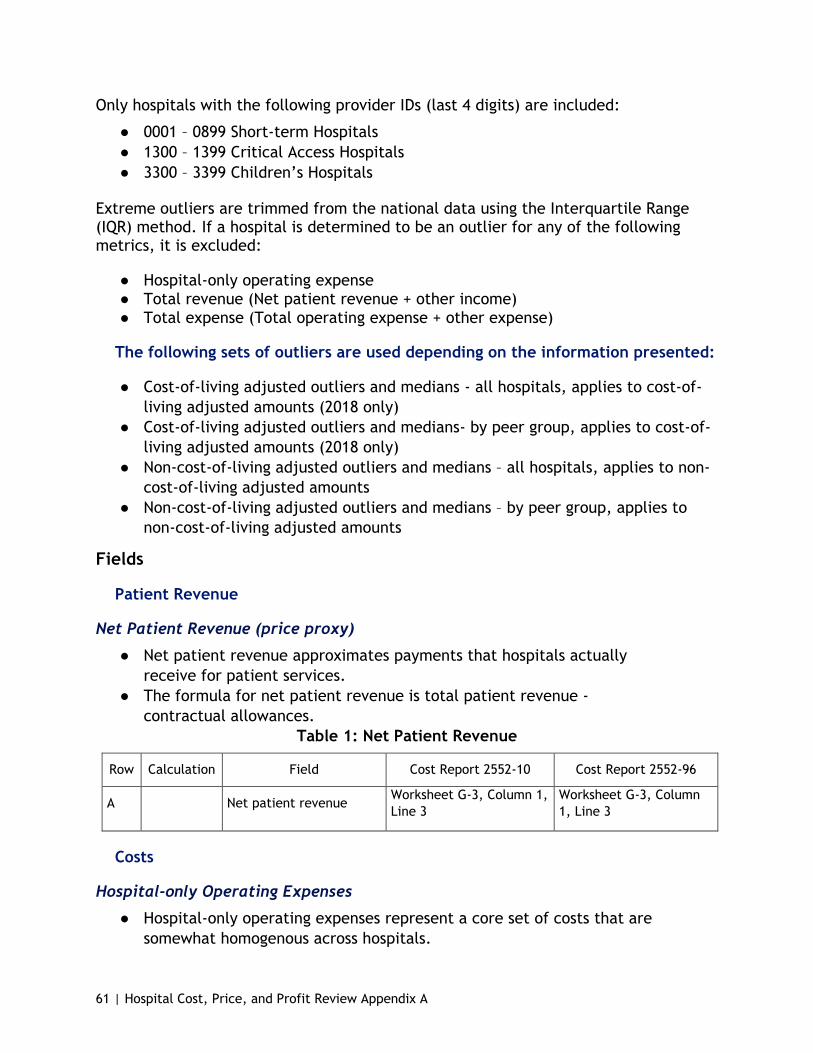
61 | Hospital Cost, Price, and Profit Review Appendix A
Only hospitals with the following provider IDs (last 4 digits) are included:
● 0001 – 0899 Short-term Hospitals ● 1300 – 1399 Critical Access Hospitals ● 3300 – 3399 Children’s Hospitals
Extreme outliers are trimmed from the national data using the Interquartile Range (IQR) method. If a hospital is determined to be an outlier for any of the following metrics, it is excluded:
● Hospital-only operating expense ● Total revenue (Net patient revenue + other income) ● Total expense (Total operating expense + other expense)
The following sets of outliers are used depending on the information presented:
● Cost-of-living adjusted outliers and medians - all hospitals, applies to cost-of-living adjusted amounts (2018 only)
● Cost-of-living adjusted outliers and medians- by peer group, applies to cost-of-living adjusted amounts (2018 only)
● Non-cost-of-living adjusted outliers and medians – all hospitals, applies to non-cost-of-living adjusted amounts
● Non-cost-of-living adjusted outliers and medians – by peer group, applies to non-cost-of-living adjusted amounts
Fields
Patient Revenue
Net Patient Revenue (price proxy)
● Net patient revenue approximates payments that hospitals actually receive for patient services.
● The formula for net patient revenue is total patient revenue - contractual allowances.
Table 1: Net Patient Revenue
Row Calculation Field Cost Report 2552-10 Cost Report 2552-96
A Net patient revenue Worksheet G-3, Column 1, Line 3
Worksheet G-3, Column 1, Line 3
Costs
Hospital-only Operating Expenses
● Hospital-only operating expenses represent a core set of costs that are somewhat homogenous across hospitals.

62 | Hospital Cost, Price, and Profit Review Appendix A
● Hospital-only operating expenses include reclassified and adjusted amounts per Worksheet A, Column 7 but exclude costs associated with Medicare non-reimbursable departments and costs associated with interns and residents.
● Any reasonable compensation equivalent (RCE) disallowance is added back.
Table 2: Hospital-Only Operating Expenses
Row Calculation Field Cost Report 2552-10 Cost Report 2552-96
A
Operating costs for reimbursable departments (excludes costs associated with interns and Residents)
Worksheet B Part I, Column 26, Line 118
Worksheet B Part I, Column 27, Line 95
B Plus RCE disallowance
Worksheet A-8-2, Column 17 for lines where the value in Column 1 is => 24 and < 99 (or Worksheet C Part I, Column 4, Line 200)
Worksheet C Part I, Column 4, Line 101 (NOTE: Worksheet A-8-2 details are not available for 2552-96 cost reports. Accordingly, Worksheet C Pt. 1, Line 101, Col. 4 is used. This method will exclude hospitals for which Worksheet C Pt. 1 is not in the HCRIS database (such as Children’s Hospital Colorado).
Hospital-only Administrative Costs (a subset of Hospital-only Operating Expenses)
● Administrative costs include a wide variety of costs including, but not limited to, the cost of executive management, legal services, accounting services, and facility administrative services.
● Administrative costs include allocations from the human resources department but exclude capital allocations.
● Estimates of the amounts of administrative costs that are associated with non-reimbursable departments and interns & residents are excluded.
● It is recognized that by including the human resources department allocation in administrative costs, a small amount of capital costs may also be included. However, this amount is not material.

63 | Hospital Cost, Price, and Profit Review Appendix A
Table 3: Hospital-Only Administrative Costs
Row Calculation Field Cost Report 2552-10 Cost Report 2552-96
A Administrative costs before allocations
Worksheet B Part I, Column 0, Line 5*
Worksheet B Part I, Column 0, Line 6*
B Plus Human resources dept. allocation
Worksheet B Part I, Column 4*, Line 5*
Worksheet B Part I, Column 5*, Line 6*
C Minus Directly allocated capital
Worksheet B Part II, Column 0, Line 5*
Worksheet B Part III, Column 0, Line 6*
D Subtotal A + B - C A + B - C
E Minus Percent allocated to interns and residents
D x (Worksheet B Pt. I, Column 5*, Line 21* and 22* divided by Worksheet B Pt. I Column 5*, Line 202)
D x (Worksheet B Pt. I, Column 6*, Lines 22* and 23* divided by Worksheet B Pt. I Column 6*, Line 103)
F Subtotal D – E D - E
G Multiplied by
Percent allocated to reimbursable departments
F x (Worksheet B Pt. I, Column 5*, Line 118 divided by Worksheet B Pt. I, Column 5*, Line 202)
F x (Worksheet B Pt. I, Col. 6*, Line 95 divided by Worksheet B Pt. I, Column 6*, Line 103)
*Includes subscripted cost centers. Calculations in rows E and G are performed at the subscripted level.
Hospital-only Capital Costs (a subset of Hospital-only Operating Expenses)
● Capital costs include depreciation on buildings and equipment, leases and rentals for the use of facilities and/or equipment, and interest incurred in acquiring land or depreciable assets used for patient care.
● Hospital-only capital costs include costs in the capital cost centers as well as all capital costs allocated directly to other departments per Worksheet B Pt. II, but exclude capital costs that are allocated to non-reimbursable departments and interns & residents.
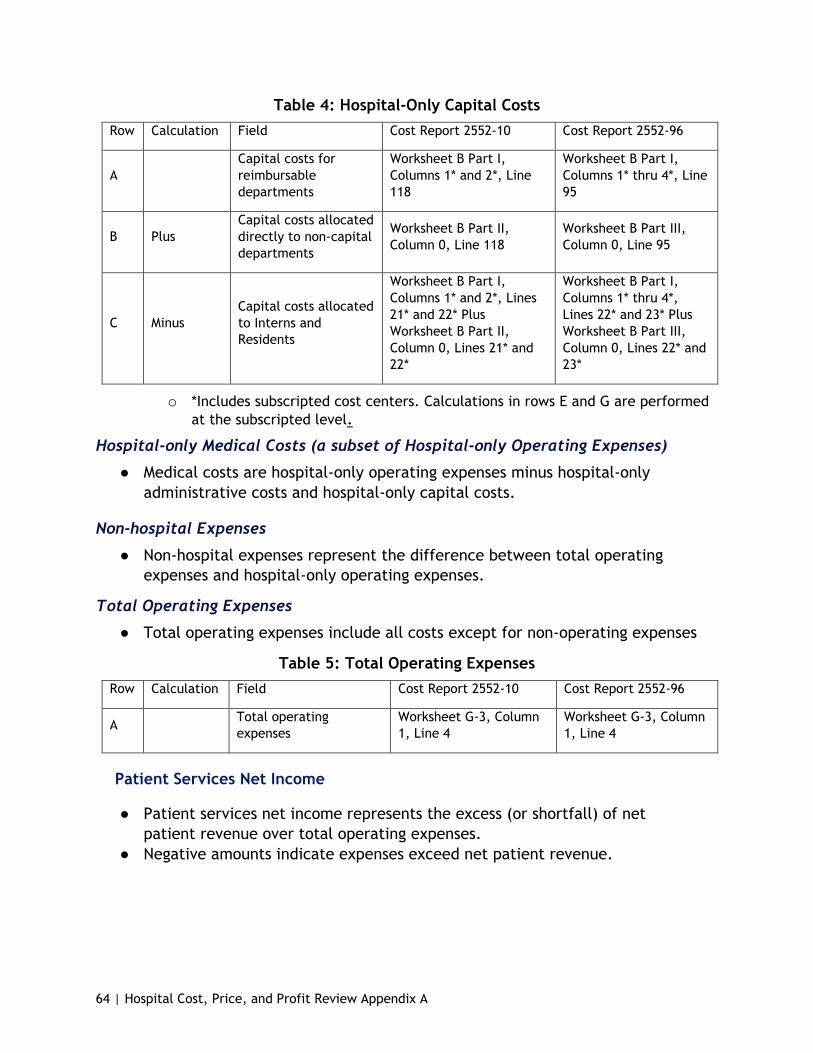
64 | Hospital Cost, Price, and Profit Review Appendix A
Table 4: Hospital-Only Capital Costs Row Calculation Field Cost Report 2552-10 Cost Report 2552-96
A Capital costs for reimbursable departments
Worksheet B Part I, Columns 1* and 2*, Line 118
Worksheet B Part I, Columns 1* thru 4*, Line 95
B Plus Capital costs allocated directly to non-capital departments
Worksheet B Part II, Column 0, Line 118
Worksheet B Part III, Column 0, Line 95
C Minus Capital costs allocated to Interns and Residents
Worksheet B Part I, Columns 1* and 2*, Lines 21* and 22* Plus Worksheet B Part II, Column 0, Lines 21* and 22*
Worksheet B Part I, Columns 1* thru 4*, Lines 22* and 23* Plus Worksheet B Part III, Column 0, Lines 22* and 23*
o *Includes subscripted cost centers. Calculations in rows E and G are performed at the subscripted level.
Hospital-only Medical Costs (a subset of Hospital-only Operating Expenses)
● Medical costs are hospital-only operating expenses minus hospital-only administrative costs and hospital-only capital costs.
Non-hospital Expenses
● Non-hospital expenses represent the difference between total operating expenses and hospital-only operating expenses.
Total Operating Expenses
● Total operating expenses include all costs except for non-operating expenses
Table 5: Total Operating Expenses Row Calculation Field Cost Report 2552-10 Cost Report 2552-96
A Total operating expenses
Worksheet G-3, Column 1, Line 4
Worksheet G-3, Column 1, Line 4
Patient Services Net Income
● Patient services net income represents the excess (or shortfall) of net patient revenue over total operating expenses.
● Negative amounts indicate expenses exceed net patient revenue.
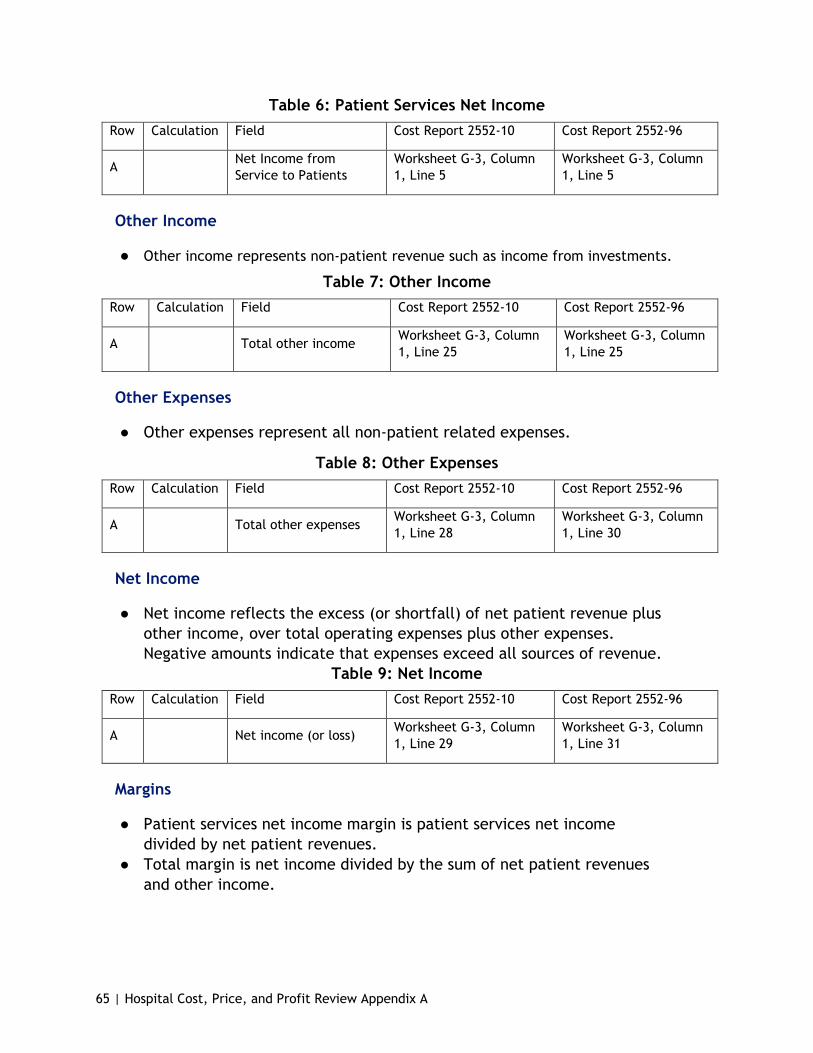
65 | Hospital Cost, Price, and Profit Review Appendix A
Table 6: Patient Services Net Income Row Calculation Field Cost Report 2552-10 Cost Report 2552-96
A Net Income from Service to Patients
Worksheet G-3, Column 1, Line 5
Worksheet G-3, Column 1, Line 5
Other Income
● Other income represents non-patient revenue such as income from investments.
Table 7: Other Income Row Calculation Field Cost Report 2552-10 Cost Report 2552-96
A Total other income Worksheet G-3, Column 1, Line 25
Worksheet G-3, Column 1, Line 25
Other Expenses
● Other expenses represent all non-patient related expenses.
Table 8: Other Expenses Row Calculation Field Cost Report 2552-10 Cost Report 2552-96
A Total other expenses Worksheet G-3, Column 1, Line 28
Worksheet G-3, Column 1, Line 30
Net Income
● Net income reflects the excess (or shortfall) of net patient revenue plus other income, over total operating expenses plus other expenses. Negative amounts indicate that expenses exceed all sources of revenue.
Table 9: Net Income Row Calculation Field Cost Report 2552-10 Cost Report 2552-96
A Net income (or loss) Worksheet G-3, Column 1, Line 29
Worksheet G-3, Column 1, Line 31
Margins
● Patient services net income margin is patient services net income divided by net patient revenues.
● Total margin is net income divided by the sum of net patient revenues and other income.
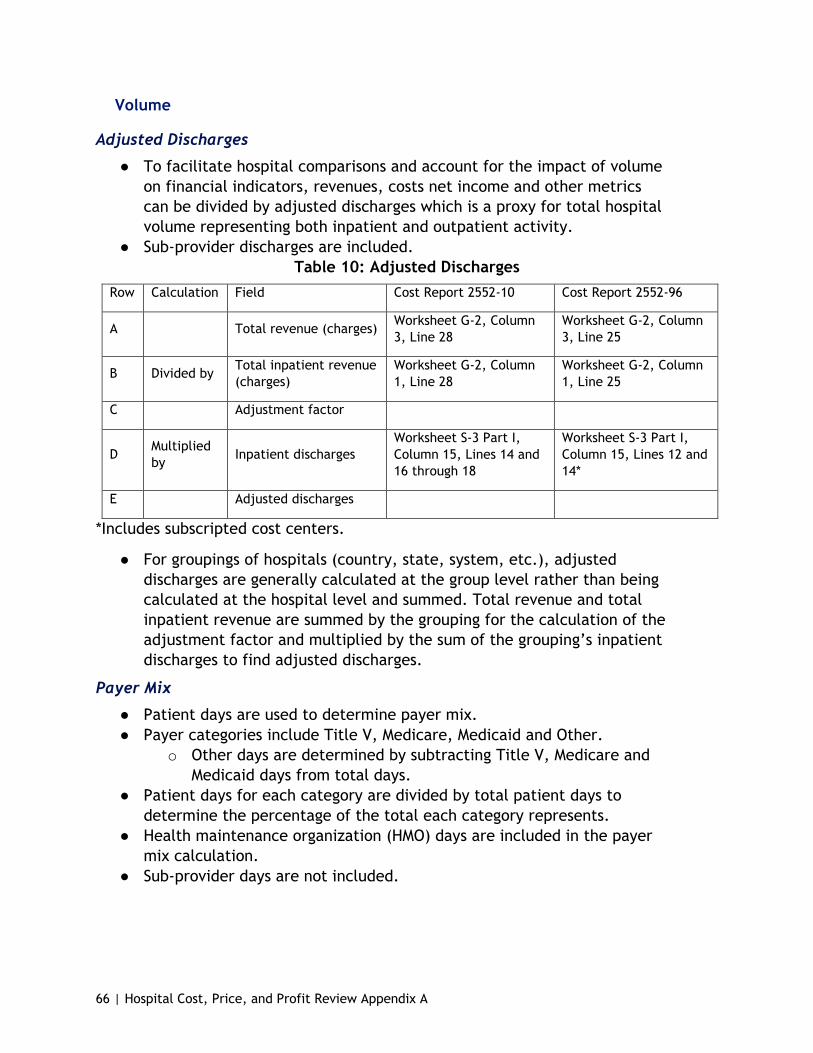
66 | Hospital Cost, Price, and Profit Review Appendix A
Volume
Adjusted Discharges
● To facilitate hospital comparisons and account for the impact of volume on financial indicators, revenues, costs net income and other metrics can be divided by adjusted discharges which is a proxy for total hospital volume representing both inpatient and outpatient activity.
● Sub-provider discharges are included. Table 10: Adjusted Discharges
Row Calculation Field Cost Report 2552-10 Cost Report 2552-96
A Total revenue (charges) Worksheet G-2, Column 3, Line 28
Worksheet G-2, Column 3, Line 25
B Divided by Total inpatient revenue (charges)
Worksheet G-2, Column 1, Line 28
Worksheet G-2, Column 1, Line 25
C Adjustment factor
D Multiplied by Inpatient discharges
Worksheet S-3 Part I, Column 15, Lines 14 and 16 through 18
Worksheet S-3 Part I, Column 15, Lines 12 and 14*
E Adjusted discharges
*Includes subscripted cost centers.
● For groupings of hospitals (country, state, system, etc.), adjusted discharges are generally calculated at the group level rather than being calculated at the hospital level and summed. Total revenue and total inpatient revenue are summed by the grouping for the calculation of the adjustment factor and multiplied by the sum of the grouping’s inpatient discharges to find adjusted discharges.
Payer Mix
● Patient days are used to determine payer mix. ● Payer categories include Title V, Medicare, Medicaid and Other.
o Other days are determined by subtracting Title V, Medicare and Medicaid days from total days.
● Patient days for each category are divided by total patient days to determine the percentage of the total each category represents.
● Health maintenance organization (HMO) days are included in the payer mix calculation.
● Sub-provider days are not included.

67 | Hospital Cost, Price, and Profit Review Appendix A
Table 11: Payer Mix Row Calculation Field Cost Report 2552-10 Cost Report 2552-96
A Title V patient days or Worksheet S-3 Part I,
Column 5, Lines 2 and 14 Worksheet S-3 Part I, Column 3, Lines 2 and 12
A Medicare patient days or
Worksheet S-3 Part I, Column 5, Lines 2 and 14
Worksheet S-3 Part I, Column 4, Lines 2 and 12
A Medicaid patients Worksheet S-3 Part I,
Column 6, Lines 2 and 14 Worksheet S-3 Part I, Column 5, Lines 2 and 12
B Divided by Total patient days Worksheet S-3 Part I, Column 8, Lines 2 and 14
Worksheet S-3 Part I, Column 6, Lines 2 and 12
Available Beds
● Beds licensed, physically set up and available for use. These are beds regularly maintained in the hospital for the use of patients, which furnish accommodations with supporting services (such as food, laundry, and housekeeping).
Table 12: Available Beds Row Calculation Field Cost Report 2552-10 Cost Report 2552-96
A Available beds Worksheet S-3, Part I, Column 3, Lines 14 and 16 thru 18
Worksheet S-3, Part I, Column 2, Lines 12 and 14.
Occupancy Rate
● Occupancy rate is determined by dividing total patient days by bed days available.
● Sub-provider inpatient days and bed days available are included. ● Observation days are included in total patient days.
Table 13: Occupancy Rate Row Calculation Field Cost Report 2552-10 Cost Report 2552-96
A Inpatient days Worksheet S-3 Part I, Column 8, Lines 14, 16 through 18 and 28
Worksheet S-3 Part I, Column 6, Lines 12, 14* and 26
B Divided by Bed days available Worksheet S-3 Part I, Column 3, Lines 14 and 16 through 18
Worksheet S-3 Part I, Column 2, Lines 12 and 14*
*Includes subscripted cost centers.

68 | Hospital Cost, Price, and Profit Review Appendix A
Unreimbursed and Uncompensated Care
● The Medicare cost report requires reporting of unreimbursed and uncompensated care by program. If payments for any particular program exceed costs (i.e. profit), the hospital is instructed to report zero. For purposes of this analysis, any program for which payments exceed costs, the amount is shown as a profit, effectively offsetting unreimbursed or uncompensated care for other programs.
● The Medicare Cost Report worksheet used by hospitals to report uncompensated care data has been subject to recent changes by the Centers for Medicare and Medicaid Services (CMS) to incorporate the data into Medicare payment policies. These changes have presented some interpretation and implementation challenges for hospitals, which may negatively impact the accuracy and consistency of the data. However, the Medicare Cost Report continues to be the most comprehensive source for uncompensated care data.
Medicaid costs over/(under) payments
Table 14: Medicaid Costs Over/Under Payments Row Calculation Field Cost Report Version 2552-10
A Medicaid costs Worksheet S-10, Column 1, Line 7
B Minus Medicaid net revenue Worksheet S-10, Column 1, Line 2
C Minus Medicaid DSH/supplemental payments
Worksheet S-10, Column 1, Line 5
Children's Health Insurance Program (CHIP) Costs over/(under) payments
Table 15: CHIP Costs Over/Under Payments Row Calculation Field Cost Report Version 2552-10
A CHIP costs Worksheet S-10, Column 1, Line 11
B Minus CHIP net revenue Worksheet S-10, Column 1, Line 9
Indigent Care Program Costs over/(under) payments
Table 16: Indigent Care Program Costs Over/Under Payments Row Calculation Field Cost Report Version 2552-10
A Indigent care program costs Worksheet S-10, Column 1, Line 15
B Minus Indigent care program net revenue Worksheet S-10, Column 1, Line 13

69 | Hospital Cost, Price, and Profit Review Appendix A
Charity Care
Table 17: Charity Care Row Calculation Field Cost Report Version 2552-10
A Charity care costs Worksheet S-10, Columns 1 and 2, Line 21
B Minus Payments on charity write-offs Worksheet S-10, Columns 1 and 2, Line 22
Non-Medicare and Non-Medicare Reimbursable Bad Debt
Table 18: Non-Medicare and Non-Medicare Reimbursable Bad Debt Row Calculation Field Cost Report Version 2552-10
A Cost of non-Medicare and non-Medicare reimbursable bad debt Worksheet S-10, Column 1, Line 29
Balance Sheet
● Land, buildings and equipment are considered capital assets and are reported on the hospital’s balance sheet at acquisition cost. Buildings and equipment are depreciated over their estimated useful lives such that, at the end of the asset’s estimated useful life, the net value of the asset is zero. Note that land is not depreciated.
● Accumulated depreciation represents the amount the assets have been depreciated since they were acquired.
● The net value of an asset equals the asset cost minus accumulated depreciation.
Land, Buildings and Equipment at Cost
Table 19: Land, Buildings and Equipment at Cost Row Calculation Field 2552-10 2552-96
A Land and buildings cost
Worksheet G, Columns 1 through 4, Lines 12, 13, 14, and 17
Worksheet G, Columns 1 through 4, Lines 12, 13, 14, and 15
B Equipment cost Worksheet G, Columns 1 through 4, Lines 19, 21, 23, 25, 27 and 29
Worksheet G, Columns 1 through 4, Lines 16, 17, 18, 19 and 20
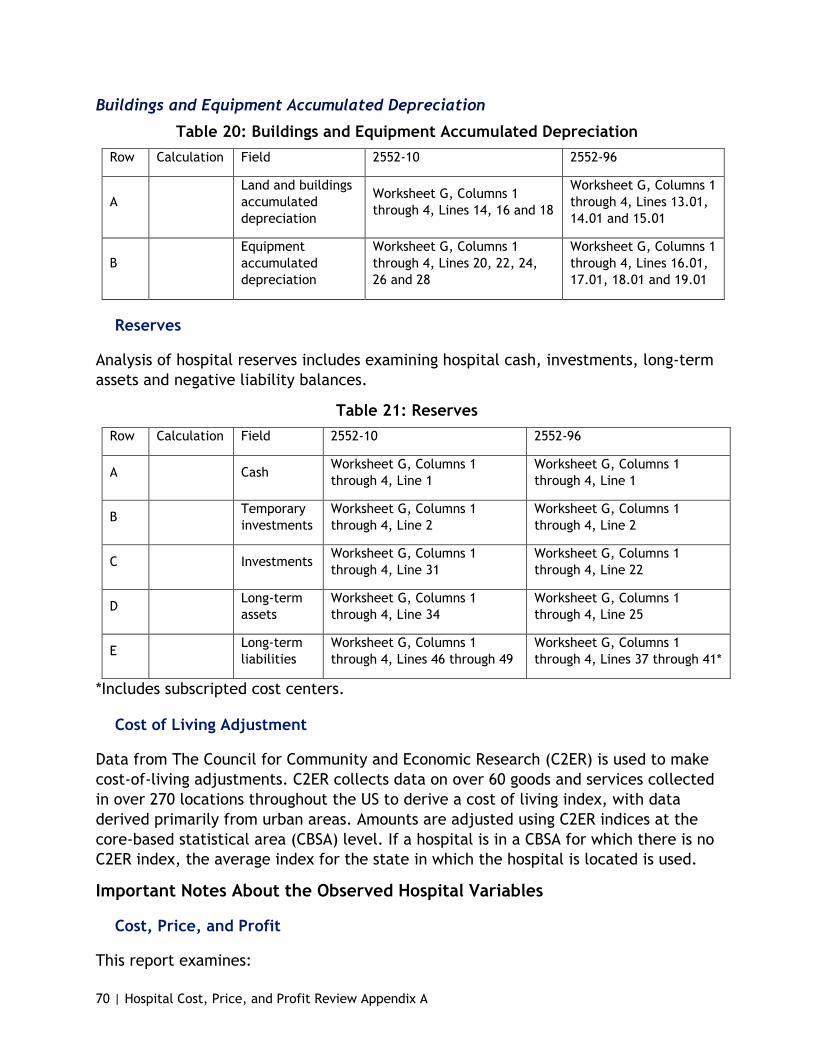
70 | Hospital Cost, Price, and Profit Review Appendix A
Buildings and Equipment Accumulated Depreciation
Table 20: Buildings and Equipment Accumulated Depreciation Row Calculation Field 2552-10 2552-96
A Land and buildings accumulated depreciation
Worksheet G, Columns 1 through 4, Lines 14, 16 and 18
Worksheet G, Columns 1 through 4, Lines 13.01, 14.01 and 15.01
B Equipment accumulated depreciation
Worksheet G, Columns 1 through 4, Lines 20, 22, 24, 26 and 28
Worksheet G, Columns 1 through 4, Lines 16.01, 17.01, 18.01 and 19.01
Reserves
Analysis of hospital reserves includes examining hospital cash, investments, long-term assets and negative liability balances.
Table 21: Reserves Row Calculation Field 2552-10 2552-96
A Cash Worksheet G, Columns 1 through 4, Line 1
Worksheet G, Columns 1 through 4, Line 1
B Temporary investments
Worksheet G, Columns 1 through 4, Line 2
Worksheet G, Columns 1 through 4, Line 2
C Investments Worksheet G, Columns 1 through 4, Line 31
Worksheet G, Columns 1 through 4, Line 22
D Long-term assets
Worksheet G, Columns 1 through 4, Line 34
Worksheet G, Columns 1 through 4, Line 25
E Long-term liabilities
Worksheet G, Columns 1 through 4, Lines 46 through 49
Worksheet G, Columns 1 through 4, Lines 37 through 41*
*Includes subscripted cost centers.
Cost of Living Adjustment
Data from The Council for Community and Economic Research (C2ER) is used to make cost-of-living adjustments. C2ER collects data on over 60 goods and services collected in over 270 locations throughout the US to derive a cost of living index, with data derived primarily from urban areas. Amounts are adjusted using C2ER indices at the core-based statistical area (CBSA) level. If a hospital is in a CBSA for which there is no C2ER index, the average index for the state in which the hospital is located is used.
Important Notes About the Observed Hospital Variables
Cost, Price, and Profit
This report examines:

71 | Hospital Cost, Price, and Profit Review Appendix A
● Hospital costs - the cost of providing services, such as operating expenses; ● Price - the net patient revenue a hospital receives for services provided; and ● Profit, net income or margin - the difference between revenue and cost.
These metrics are often expressed in a volume metric called an adjusted discharge (a proxy for per patient) and reflects patients receiving inpatient and outpatient care.
Table 22: Price or Net Patient Revenue Per Adjusted Discharge
Row Calculation Field Definitions
A Net patient revenue Net Patient Revenue approximates payments that hospitals actually receive for patient services.
B Divided by Adjusted discharges
C Net patient revenue per adjusted discharge
Net Patient Revenue, on a per-patient basis
Table 23: Cost or Hospital-Only Operating Expenses Per Adjusted Discharge
Row Calculation Field Definitions
A Hospital-only operating expense Hospital-only Operating Expenses represent a
core set of costs that are somewhat homogenous across hospitals.
B Divided by Adjusted discharges
C Hospital-only operating expense per adjusted discharge
Hospital-only Operating Expense, on a per-patient basis
Table 24: Profit or Net Income Per Adjusted Discharge
Row Calculation Field Definitions
A
Net income (or loss) Net income reflects the excess (or shortfall) of net patient revenue plus other income, over total operating expenses plus other expenses. Negative amounts indicate that expenses exceed all sources of revenue.
B Divided by Adjusted discharges
C Net income per adjusted discharge
Net Income, on a per-patient basis
Description of Adjusted Discharges, a Per Patient Proxy
When evaluating hospital performance, it is useful to state various financial measures on a per-patient basis. This is especially useful when examining trends over time or comparing one hospital to another as it eliminates the effect of patient volume fluctuations or differences. Hospitals treat a variety of individuals who are generally classified as either inpatient or outpatient. Inpatients are counted based on the

72 | Hospital Cost, Price, and Profit Review Appendix A
number of inpatient discharges whereas outpatients are counted based on the number of outpatient visits. An inpatient discharge might be equivalent to far more outpatient visits in terms of resource use or revenue generated.
Adjusted discharges is a volume measure that attempts to restate outpatient volumes as equivalent inpatient discharges. Combining these equivalent inpatient discharges with actual inpatient discharges results in adjusted discharges. An anomaly in any of the above three components can have an impact on the resulting adjusted discharges amount. This can happen in cases where the hospital has operations that are accounted for in separate entities not included in the Medicare Cost Report, such as clinics and ambulatory surgical centers. Also, as a general rule, smaller hospitals with low and variable inpatient volume and significant outpatient volumes can cause adjusted discharges to be less reliable.
Description of Hospital Peer Groups
While a comparison of Colorado hospitals to the rest of the country provides some directional information about the levels of net income and expenses, not all Colorado hospitals exhibit the same results if compared to the national average. to drill down further, hospitals are primarily grouped by size based on the number of available beds the hospitals reported on their 2018 Medicare Cost Report; additionally, two peer groups are based on the type of facility i.e. teaching and children’s hospitals. Colorado hospitals have been broken down into six peer groups: 26 to 100 beds, 101 to 300 beds, 301 to 500 beds, 501 to 800 beds, teaching hospitals, and children’s hospitals.
Effects of Case Mix on Costs and Revenue
Case mix can have a significant impact on average revenue and cost per patient. Case mix is calculated using a diagnosis related group (DRG) - a code assigned to each inpatient indicating why the patient was in the hospital. Each DRG has a weight reflecting the relative complexity of the patient’s illness. for example, the DRG weight for chest pain is only 0.7153 compared to a liver transplant which has a weight of 4.8719.127 This means treating a patient requiring a liver transplant is significantly more complex and resource-intensive than treating a patient with chest pain. Summing the DRG weights for all patients a hospital has treated and then dividing by the number of patients yields a weighted average case mix index (CMI) for the hospital. These CMIs can be used to determine which hospitals treat more complex cases and may be incurring more costs and generating more revenue as a result.
127 Calculated from Centers for Medicare and Medicaid Services, FY 2020 Final Rule and Correction Notice Data Files – Case Mix Index File. www.cms.gov/Medicare/Medicare-Fee-for-Service-Payment/AcuteInpatientPPS/FY2020-IPPS-Final-Rule-Home-Page-Items/FY2020-IPPS-Final-Rule-Data-Files

73 | Hospital Cost, Price, and Profit Review Appendix B
Appendix B: Glossary
Acquisitions - Purchase of one business enterprise by another
Affiliations or related parties - A business concern owned or controlled in whole or in part by another concern.
Allocations/ allocate - Cost allocation is a process where general costs applicable to several organizational activities are distributed (allocated) to specific activities or cost categories. for example, a hospital’s cost for its human resources department may be partially allocated to administrative costs.
Asset - Anything of value to which the firm has a legal claim. Any owned tangible or intangible object having economic value useful to the owner.
Bad debt - Services for which hospitals anticipated but did not receive payment.
Case mix index - The average relative diagnostic related group weight of a hospital’s inpatient discharges. The CMI reflects the diversity, clinical complexity, and resource needs of all the patients in the hospital. A higher CMI indicates a more complex and resource-intensive case load.
Case mix or patient mix - An indicator of the average complexity of illnesses and conditions treated by a hospital.
Cash and cash equivalents - The value of assets that can be converted into cash immediately. Usually includes bank accounts and marketable securities, such as government bonds and banker's acceptances. Cash equivalents include securities that mature within 90 days (e.g., notes).
Centers for Medicare and Medicaid Services (CMS) - Previously known as the Health Care Financing Administration (HCFA), is a federal agency within the United States Department of Health and Human Services (HHS) that administers the Medicare program and works in partnership with state governments to administer Medicaid, the Children's Health Insurance Program (CHIP), and health insurance portability standards. In addition to these programs, CMS has other responsibilities, including the administrative simplification standards from the Health Insurance Portability and Accountability Act of 1996 (HIPAA), quality standards in long-term care facilities (more commonly referred to as nursing homes) through its survey and certification process, clinical laboratory quality standards under the Clinical Laboratory Improvement Amendments, and oversight of HealthCare.gov.
Charity care - Charity care, in contrast, consists of services for which hospitals neither received, nor expected to receive, payment because they had determined, with the assistance of the patient, the patient’s inability to pay.
Cost - In this report hospital-only operating expense is used a proxy for the cost incurred by hospitals for patient services. See Appendix A: Methodology.
74 | Hospital Cost, Price, and Profit Review Appendix B
Cost center - A cost center is a function within an organization that does not directly add to profit but still costs money to operate, such as the accounting, human resources, or information technology departments. The main use of a cost center is to track actual expenses for comparison to budget.
Depreciation/ Accumulated depreciation - An accounting method of allocating the cost of a tangible or physical asset over its useful life or life expectancy. Depreciation represents how much of an asset's value has been used up. Accumulated depreciation is the cumulative depreciation of an asset up to a single point in its life.
Health Maintenance Organizations (HMO) - Organizations that provide health insurance coverage for a monthly or annual fee. An HMO limits member coverage to medical care provided through a network of doctors and other health care providers who are under contract to the HMO.
Horizontal integration - The acquisition of a business operating at the same level of the value chain in a similar or different industry.
Hospital provider fee - The Colorado Healthcare Affordability and Sustainability Enterprise (CHASE) Act of 2017 authorizes charging and collecting the health care affordability and sustainability fee from Colorado hospitals to obtain federal matching funds used to provide business services to hospitals by, amongst other services, increasing hospital reimbursement for services to Medicaid and indigent care patients, funding quality incentive payments, and increasing the number of individuals eligible for Medicaid and CHIP. The health care affordability and sustainability fee is commonly referred to as the hospital provider fee.
Hospital system - A larger corporation or organizational structure that owns, contains, or operates more than one hospital.
Indigent care program - A hospital’s charity care program that provides discounted or free health care services to low-income people and families
Managed care - A general term for the activity of organizing doctors, hospitals, and other providers into groups to improve the quality and cost-effectiveness of health care.
Medicaid - Health First Colorado (Colorado's Medicaid Program) is public health insurance for Coloradans who qualify. Health First Colorado is funded jointly by a federal-state partnership.
Medicare - Medicare is the federal health insurance program for people who are 65 or older, certain younger people with disabilities, and people with End-Stage Renal Disease.
Medicare Cost Report - Most Medicare-certified providers are required to submit an annual cost report to CMS. The cost report contains provider information such as facility characteristics, utilization data, cost and charges by cost center (in total and for Medicare), Medicare settlement data, and financial statement data. In this report,

75 | Hospital Cost, Price, and Profit Review Appendix B
Medicare Cost Report refers to the CMS 2552-10 Medicare Cost Report that hospitals are required to submit to CMS.
Negative liability balance - A negative liability typically appears on the balance sheet when a company pays out more than the amount required by a liability. Technically, a negative liability is a company asset.
Observation days - When it is not clear that an individual needs to be admitted as an inpatient in an acute care hospital, he or she may be placed “under observation” for evaluation and short-term treatment.
Price - In this report net patient revenue is used as a proxy for the payments (or price) that hospitals actually receive for patient services. See Appendix A: Methodology.
Profit - In this report, net income is used a proxy for the profit realized by hospitals. See Appendix A: Methodology.
Reclassification - A reclass or reclassification, in accounting, is a journal entry transferring an amount from one general ledger account to another. This can be done to correct a mistake; to record that long-term assets or liabilities have become current; or to record that an asset is now being used for a different purpose.
Reimbursable - Hospital expenses which are repaid.
Short-stay hospital - A hospital providing targeted care for patients requiring brief hospitalization and dischargeable as soon as clinical conditions are resolved.
Sub-provider - Hospital-based subproviders are owned by and usually co-located with the hospital. Hospital-based subproviders may include rehabilitation units, skilled nursing facility unit, and home health agencies.
Subscripted lines - On the hospital Medicare Cost Report, the standard CMS line numbers and cost center descriptions cannot be changed but hospitals may add or subscript additional lines if additional or different cost center descriptions are needed. When an added cost center description bears a logical relationship to the stand line, the added line is inserted after the standard line and identified as a numeric subscript of the immediately preceding line. for example, if two lines are added between lines 7 and 8, identify them as lines 7.01 and 7.02.
Title V - Title V Maternal and Child Health Services Block Grant Program is one of the largest Federal block grant programs and is a key source of support for promoting and improving the health of the nation’s mothers and children. The purpose of the Title V Maternal and Child Health Services Block Grant Program is to create federal/state partnerships that enable each state/jurisdiction to address the health services needs of its mothers, infants and children, which includes children with special health care needs, and their families.
Uncompensated care - Health care services provided by hospitals or health care providers that are not reimbursed. Often uncompensated care arises when people do not have insurance and cannot afford to pay the cost of care.

76 | Hospital Cost, Price, and Profit Review Appendix B
Unreimbursed care - Unreimbursed costs are related to Medicaid, Medicare, CHIP, and indigent care programs, as well as uncompensated charity care costs. Medicare unreimbursed care is sometimes looked at as its own category: Medicare shortfall.
Vertical integration - A strategy whereby a company owns or controls its suppliers, distributors, or retail locations to control its value or supply chain. Vertical integration benefits companies by allowing them to control the process, reduce costs, and improve efficiencies.
77 | Hospital Cost, Price, and Profit Review Appendix C
Appendix C: Peer Group Analysis
This section is a deep dive into hospital specific analysis using the metrics introduced on a national or Colorado basis in the body of the report.
Table of Contents
Peer Group Analysis for Colorado Hospitals 79
Scatterplots of Hospital Costs, Revenues, and Margins 97
Changes to Medians of Colorado and the Nation from 2009-2018 157
There is some truth to the statement that once you’ve seen one hospital, you’ve seen one hospital. Despite differences, benchmarking a hospital to a set of its peers is important in evaluating hospital performance and identifying opportunities for improvement. There are over 4,000 hospitals across the nation to serve as benchmarks. Choosing hospital characteristics most likely to create a useful peer group is a hospital-specific endeavor and beyond the scope of this report. Information beyond what is available in Medicare Cost Reports is needed to ensure hospitals are compared to valid peer groups. However, comparing hospitals by size and reported available beds provides useful, directional information and shows there are opportunities to reduce hospital costs, as well as costs to the overall health care system.
The following analysis is split up into sections. The Peer Group Analysis for Colorado Hospitals is a breakdown of Colorado hospitals in relationship to their national peer group. Tables and graphs are used to show how hospitals relate to the national peer groups. This section introduces the scatterplots of the following sections to analyze peer groups.
The Scatterplots of Hospital Costs, Revenues, and Margins explores the relationship between fields for the hospitals within the peer group. For example, the following scatter plot (Figure ) presents hospital-only operating expense per adjusted discharge on the horizontal axis and net income per adjusted discharge on the vertical axis. States, other than Colorado, are represented as grey data points, and Colorado is represented as the red data point. The national medians are shown as a black data point.128
128 Hospitals that are extreme outliers in hospital-only operating expense, total revenue (net patient revenue plus other income) or total expenses (total operating expenses plus other expenses) are excluded from the comparison. See the Methodology in Appendix A for further explanation on the outlier screening.
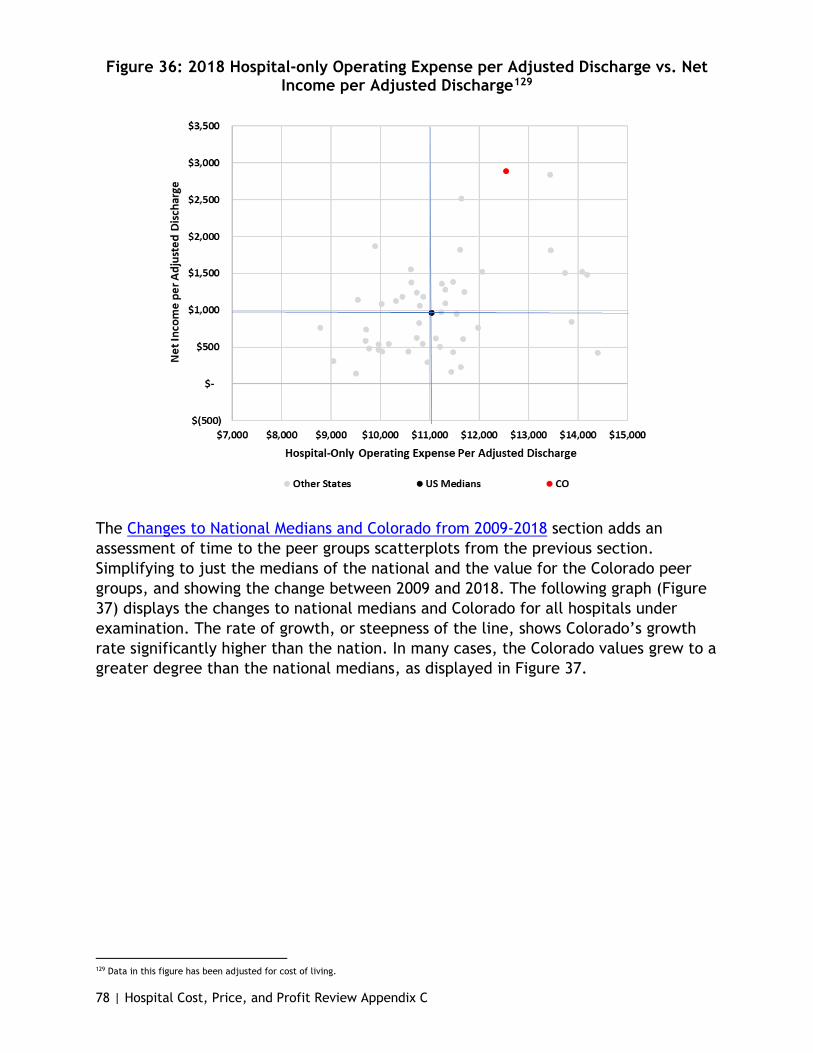
78 | Hospital Cost, Price, and Profit Review Appendix C
Figure 36: 2018 Hospital-only Operating Expense per Adjusted Discharge vs. Net Income per Adjusted Discharge129
The Changes to National Medians and Colorado from 2009-2018 section adds an assessment of time to the peer groups scatterplots from the previous section. Simplifying to just the medians of the national and the value for the Colorado peer groups, and showing the change between 2009 and 2018. The following graph (Figure 37) displays the changes to national medians and Colorado for all hospitals under examination. The rate of growth, or steepness of the line, shows Colorado’s growth rate significantly higher than the nation. In many cases, the Colorado values grew to a greater degree than the national medians, as displayed in Figure 37.
129 Data in this figure has been adjusted for cost of living.

79 | Hospital Cost, Price, and Profit Review Appendix C
Figure 37: Changes to the National Medians and Colorado from 2009 to 2018 for Hospital-Only Operating Expense and Net Income, 26 to 800 Beds
Peer Group Analysis for Colorado Hospitals
As previously discussed, Colorado hospitals are unique in that they rank highly in both expenses and net income compared to other states. This is clear in Figure . Colorado hospitals’ ability to generate high levels of net income despite high expenses is driven, in large part, by the prices they charge and therefore the revenues they generate. Colorado hospitals rank sixth highest in terms of net patient revenue per adjusted discharge in 2018.
The 25 or fewer bed peer group is not discussed in this analysis. This analysis focuses on financial measures per adjusted discharge, and the Department finds that the financial measures can be skewed from the low patient volume of these small hospitals.
26 to 100 Beds
There are 13 hospitals within Colorado that fall in the 26 to 100 bed peer group and over 950 hospitals nationwide that are a similar size in 2018.

80 | Hospital Cost, Price, and Profit Review Appendix C
Figure 38: 2018 Financial Measures, Above National Medians for 26 to 100 Beds130
Hospital Name
Hospital-only
Operating Expense
(per Adjusted
Discharge)
Net Patient
Revenue (per
Adjusted Discharge)
Net Income
(per Adjusted
Discharge)
Above National Hospital-
only Operatin
g Expense Median
Above National
Net Patient Revenu
e Median
Above National
Net Income Median
Vail Health Hospital $21,783 $27,532 $8,045 Yes Yes Yes OrthoColorado Hospital $13,777 $20,696 $5,981 Yes Yes Yes Valley View Hospital $13,534 $23,843 $3,047 Yes Yes Yes Mercy Regional Medical Center $11,716 $19,685 $3,293 Yes Yes Yes Platte Valley Medical Center $9,383 $13,326 $739 Yes Yes Yes San Luis Valley Health Regional Med Ctr $8,535 $11,105 $657 Yes Yes Yes St. Anthony Summit Medical Center $7,559 $19,878 $6,292 Yes Yes Yes Colorado Plains Medical Center $7,535 $14,969 $1,856 Yes Yes Yes Community Hospital $9,352 $15,104 $35 Yes Yes St. Anthony North Health Campus $7,973 $10,222 ($68) Yes Yes Montrose Memorial Hospital $6,971 $9,421 $331 Yes Yes Castle Rock Adventist Hospital $6,877 $10,659 $298 Yes Yes Delta County Memorial Hospital $6,537 $9,554 ($68) Yes National Median $7,277 $8,731 $178
Figure 39: Color Key for Tables
130 Data in this figure has been adjusted for cost of living.
In Figure 38, a hospital above the national median for a particular measure is indicated with a “Yes”. to indicate how much higher the hospital is above the median, color coding is used. If a hospital is above 120% of the median then it is indicated with an orange highlight. If a hospital is above 105% of the median but below 120% it is indicated with a yellow highlight. When a hospital is close or below the median (105% or less than the median) it is indicated with a blue highlight. A key to what the colors mean is above (Figure 39).
Of the 13 hospitals in the 26 to 100 Peer group, ten hospitals are over the national peer group median for hospital-only operating expenses per adjusted discharge; all hospitals are above the national per group median for net patient revenue per adjusted discharge, and ten are above the national peer group median for net income per adjusted discharge. Of the 13, eight are above on all 2018 medians.
In Figure 38, five hospitals are close to the median in terms of hospital-only operating expenses per adjusted discharge (105% or less than the median), and of those four with net patient revenue per adjusted discharge and net income per adjusted discharge above 120% of the respective 2018 medians. For instance, Castle Rock Adventist Hospital, Colorado Plains Medical Center, and St. Anthony Summit Medical Center all had relatively low expenses but net patient revenue and net income are above 120% of the respective 2018 medians or more.

81 | Hospital Cost, Price, and Profit Review Appendix C
Figure 40: 2018 Colorado Net Income Per Adjusted Discharge and National Medians, 26 to 100 Beds131
Figure 40 looks at only hospitals that are above 120% of the national peer group median for net income per adjusted discharge in 2018. The line represents the 2018 net income per adjusted discharge national peer group median for the peer group of 26 to 100 beds. Some hospitals are close to the 120% benchmark such as Castle Rock Adventist Hospital at 168% above the median, while others range in the upwards of thousands of percent: Valley View Hospital at 1716%, Mercy Regional at 1855% above the median, St. Anthony Summit Medical Center at 3544%, and Vail Health Hospital at 4532% above the median.
Mercy Regional Medical Center, OrthoColorado Hospital, Platte Valley Medical Center, Vail Health Hospital, and Valley View Hospital are above 120% of the median for all 2018 national peer group medians. Looking at Figure 38 and Figure 40, the majority of hospitals within the 2018 peer group are above the national peer group medians for at least hospital-only operating expenses and net income; and the majority (eight of 13) is above on all the metrics for 2018. Given limitations, the Department will need to do further analysis into the components of costs and determine trends that appear over the years for a better understanding.
101 to 300 Beds
There are currently 18 hospitals in Colorado with a bed size of 101 to 300 with approximately 1,200 hospitals falling in this category nationwide in 2018.
131 Data in this figure has been adjusted for cost of living.
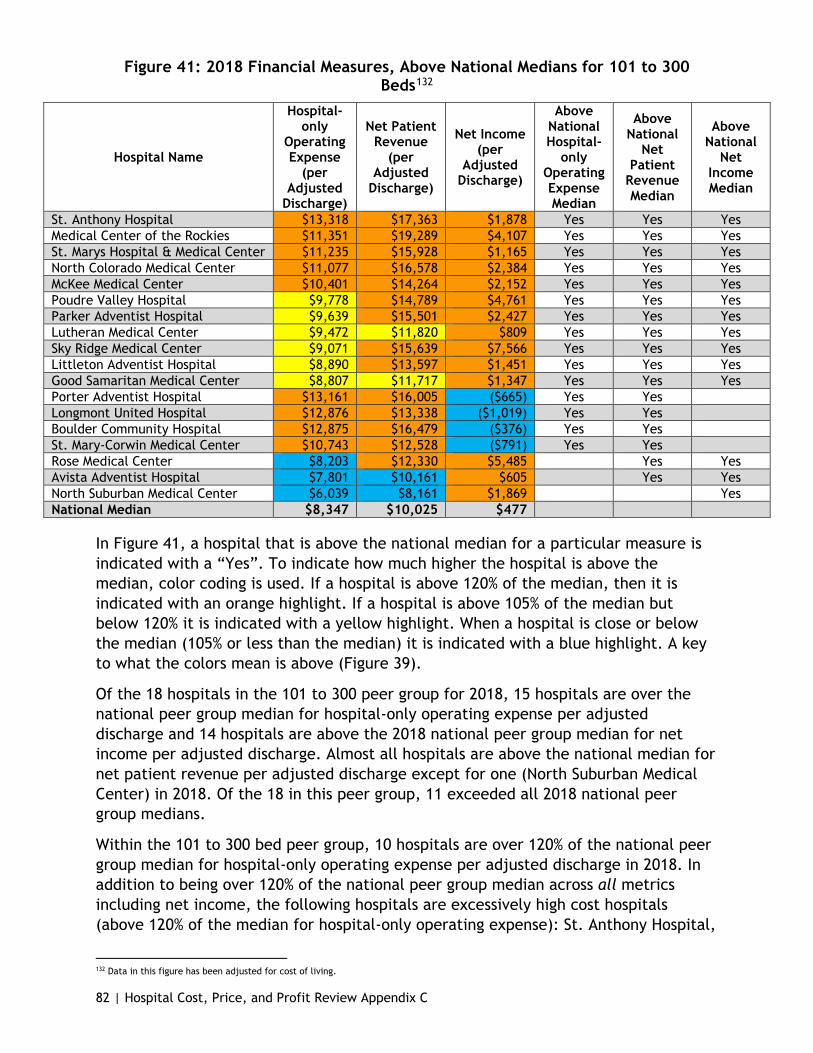
82 | Hospital Cost, Price, and Profit Review Appendix C
Figure 41: 2018 Financial Measures, Above National Medians for 101 to 300 Beds132
Hospital Name
Hospital-only
Operating Expense
(per Adjusted
Discharge)
Net Patient Revenue
(per Adjusted
Discharge)
Net Income (per
Adjusted Discharge)
Above National Hospital-
only Operating Expense Median
Above National
Net Patient
Revenue Median
Above National
Net Income Median
St. Anthony Hospital $13,318 $17,363 $1,878 Yes Yes Yes Medical Center of the Rockies $11,351 $19,289 $4,107 Yes Yes Yes St. Marys Hospital & Medical Center $11,235 $15,928 $1,165 Yes Yes Yes North Colorado Medical Center $11,077 $16,578 $2,384 Yes Yes Yes McKee Medical Center $10,401 $14,264 $2,152 Yes Yes Yes Poudre Valley Hospital $9,778 $14,789 $4,761 Yes Yes Yes Parker Adventist Hospital $9,639 $15,501 $2,427 Yes Yes Yes Lutheran Medical Center $9,472 $11,820 $809 Yes Yes Yes Sky Ridge Medical Center $9,071 $15,639 $7,566 Yes Yes Yes Littleton Adventist Hospital $8,890 $13,597 $1,451 Yes Yes Yes Good Samaritan Medical Center $8,807 $11,717 $1,347 Yes Yes Yes Porter Adventist Hospital $13,161 $16,005 ($665) Yes Yes Longmont United Hospital $12,876 $13,338 ($1,019) Yes Yes Boulder Community Hospital $12,875 $16,479 ($376) Yes Yes St. Mary-Corwin Medical Center $10,743 $12,528 ($791) Yes Yes Rose Medical Center $8,203 $12,330 $5,485 Yes Yes Avista Adventist Hospital $7,801 $10,161 $605 Yes Yes North Suburban Medical Center $6,039 $8,161 $1,869 Yes National Median $8,347 $10,025 $477
In Figure 41, a hospital that is above the national median for a particular measure is indicated with a “Yes”. To indicate how much higher the hospital is above the median, color coding is used. If a hospital is above 120% of the median, then it is indicated with an orange highlight. If a hospital is above 105% of the median but below 120% it is indicated with a yellow highlight. When a hospital is close or below the median (105% or less than the median) it is indicated with a blue highlight. A key to what the colors mean is above (Figure 39).
Of the 18 hospitals in the 101 to 300 peer group for 2018, 15 hospitals are over the national peer group median for hospital-only operating expense per adjusted discharge and 14 hospitals are above the 2018 national peer group median for net income per adjusted discharge. Almost all hospitals are above the national median for net patient revenue per adjusted discharge except for one (North Suburban Medical Center) in 2018. Of the 18 in this peer group, 11 exceeded all 2018 national peer group medians.
Within the 101 to 300 bed peer group, 10 hospitals are over 120% of the national peer group median for hospital-only operating expense per adjusted discharge in 2018. In addition to being over 120% of the national peer group median across all metrics including net income, the following hospitals are excessively high cost hospitals (above 120% of the median for hospital-only operating expense): St. Anthony Hospital,
132 Data in this figure has been adjusted for cost of living.
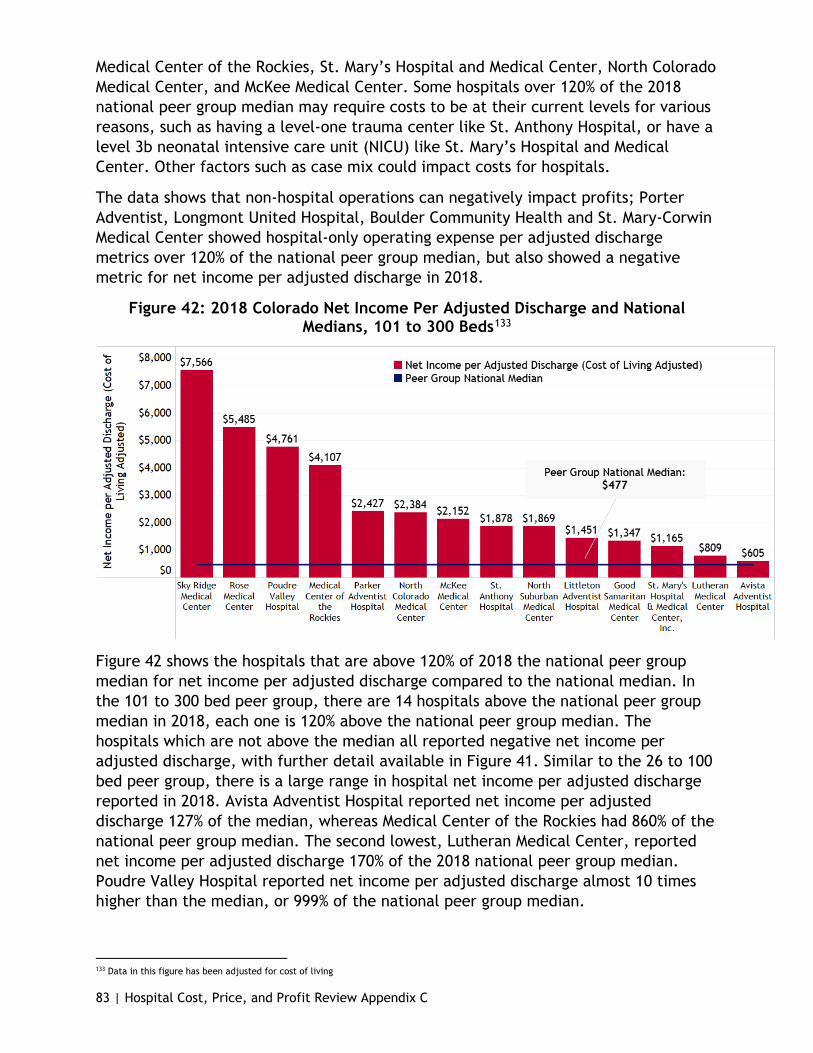
83 | Hospital Cost, Price, and Profit Review Appendix C
Medical Center of the Rockies, St. Mary’s Hospital and Medical Center, North Colorado Medical Center, and McKee Medical Center. Some hospitals over 120% of the 2018 national peer group median may require costs to be at their current levels for various reasons, such as having a level-one trauma center like St. Anthony Hospital, or have a level 3b neonatal intensive care unit (NICU) like St. Mary’s Hospital and Medical Center. Other factors such as case mix could impact costs for hospitals.
The data shows that non-hospital operations can negatively impact profits; Porter Adventist, Longmont United Hospital, Boulder Community Health and St. Mary-Corwin Medical Center showed hospital-only operating expense per adjusted discharge metrics over 120% of the national peer group median, but also showed a negative metric for net income per adjusted discharge in 2018.
Figure 42: 2018 Colorado Net Income Per Adjusted Discharge and National Medians, 101 to 300 Beds133
Figure 42 shows the hospitals that are above 120% of 2018 the national peer group median for net income per adjusted discharge compared to the national median. In the 101 to 300 bed peer group, there are 14 hospitals above the national peer group median in 2018, each one is 120% above the national peer group median. The hospitals which are not above the median all reported negative net income per adjusted discharge, with further detail available in Figure 41. Similar to the 26 to 100 bed peer group, there is a large range in hospital net income per adjusted discharge reported in 2018. Avista Adventist Hospital reported net income per adjusted discharge 127% of the median, whereas Medical Center of the Rockies had 860% of the national peer group median. The second lowest, Lutheran Medical Center, reported net income per adjusted discharge 170% of the 2018 national peer group median. Poudre Valley Hospital reported net income per adjusted discharge almost 10 times higher than the median, or 999% of the national peer group median.
133 Data in this figure has been adjusted for cost of living

84 | Hospital Cost, Price, and Profit Review Appendix C
The 101 to 300 bed peer group had three hospitals that are considered for-profit: North Suburban Medical Center, Rose Medical Center, and Sky Ridge Medical Center, all three a part of the HealthONE hospital system. Both Rose Medical Center and Sky Ridge Medical Center had net income per adjusted discharge above the 2018 national peer group median by more than one thousand percent, 1050% and 1486%, respectively. As HealthONE is a for-profit organization, one would expect that its hospitals would aim for a positive net income. And the data indicates that is partially achieved through cost control as none of the HealthONE hospitals exceed 120% of the national median for hospital-only operating expense per adjusted discharge.
As stated above in the 26 to 100 beds peer group section, with so many hospitals appearing above the 2018 national peer group medians and many of them being 120% of the median or higher, further analysis by the Department is needed in to the components that make up expenses and revenue and, specifically, how that has changed over time.
301 to 500 Beds
In 2018, eight Colorado hospitals fell within the 301 to 500 beds peer group, with roughly 470 hospitals included in this peer group nationwide.
Figure 43: 2018 Financial Measures, Above National Medians for 301 to 500 Beds134
Hospital Name
Hospital-only
Operating Expense
(per Adjusted
Discharge)
Net Patient
Revenue (per
Adjusted Discharge)
Net Income
(per Adjusted
Discharge)
Above National Hospital-
only Operating Expense Median
Above National
Net Patient
Revenue Median
Above National
Net Income Median
Children's Hospital Colorado removed from this table Presbyterian/St. Luke's Medical Center $20,989 $34,591 $16,244 Yes Yes Yes St. Joseph Hospital $11,966 $17,075 $1,583 Yes Yes Yes Swedish Medical Center $10,832 $16,990 $9,157 Yes Yes Yes Penrose-St. Francis Health Services $10,279 $13,034 $885 Yes Yes Yes Denver Health Medical Center $10,700 $10,574 $1,007 Yes Yes The Medical Center of Aurora $8,155 $11,043 $4,182 Yes Parkview Medical Center $8,655 $12,227 $769 National Median $10,124 $12,506 $848
In Figure 43, a hospital that is above the national peer group median for a measure is indicated with a “Yes”. to indicate how much higher the hospital is above the median, color coding is used. If a hospital is 120% of the median or more, it is indicated with an orange highlight. If a hospital is above 105% of the median but below 120% it is indicated with a yellow highlight. When a hospital is close or below the median (105% or less than the median) it is indicated with a blue highlight. A key to what the colors mean is above (Figure 39).
Of the eight hospitals in the 301 to 500 peer group for 2018, six hospitals are over the national peer group median for hospital-only operating expense per adjusted
134 Data in this figure has been adjusted for cost of living.
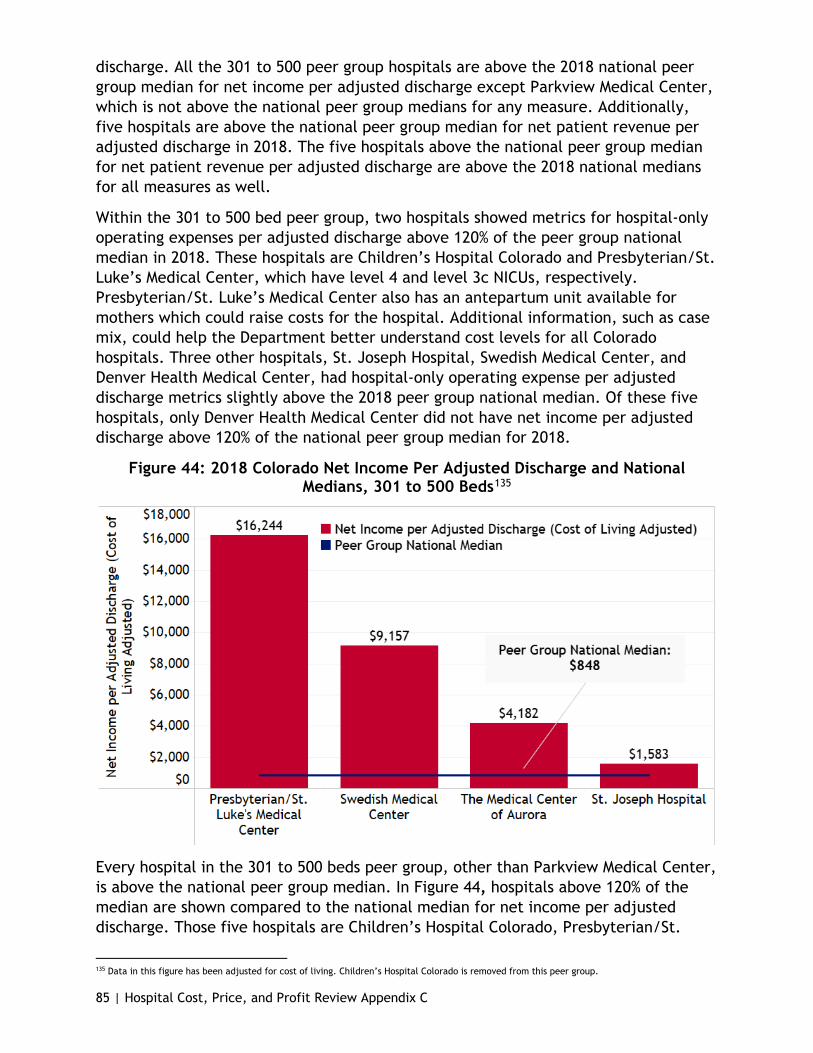
85 | Hospital Cost, Price, and Profit Review Appendix C
discharge. All the 301 to 500 peer group hospitals are above the 2018 national peer group median for net income per adjusted discharge except Parkview Medical Center, which is not above the national peer group medians for any measure. Additionally, five hospitals are above the national peer group median for net patient revenue per adjusted discharge in 2018. The five hospitals above the national peer group median for net patient revenue per adjusted discharge are above the 2018 national medians for all measures as well.
Within the 301 to 500 bed peer group, two hospitals showed metrics for hospital-only operating expenses per adjusted discharge above 120% of the peer group national median in 2018. These hospitals are Children’s Hospital Colorado and Presbyterian/St. Luke’s Medical Center, which have level 4 and level 3c NICUs, respectively. Presbyterian/St. Luke’s Medical Center also has an antepartum unit available for mothers which could raise costs for the hospital. Additional information, such as case mix, could help the Department better understand cost levels for all Colorado hospitals. Three other hospitals, St. Joseph Hospital, Swedish Medical Center, and Denver Health Medical Center, had hospital-only operating expense per adjusted discharge metrics slightly above the 2018 peer group national median. Of these five hospitals, only Denver Health Medical Center did not have net income per adjusted discharge above 120% of the national peer group median for 2018.
Figure 44: 2018 Colorado Net Income Per Adjusted Discharge and National Medians, 301 to 500 Beds135
Every hospital in the 301 to 500 beds peer group, other than Parkview Medical Center, is above the national peer group median. In Figure 44, hospitals above 120% of the median are shown compared to the national median for net income per adjusted discharge. Those five hospitals are Children’s Hospital Colorado, Presbyterian/St.
135 Data in this figure has been adjusted for cost of living. Children’s Hospital Colorado is removed from this peer group.

86 | Hospital Cost, Price, and Profit Review Appendix C
Luke’s Medical Center, St. Joseph Hospital, Swedish Medical Center, and the Medical Center of Aurora. Children’s Hospital Colorado had a 2018 net income per adjusted discharge of roughly 500% of the median, and Presbyterian/St. Luke’s Medical Center had 1916% of the median, almost 20 times greater than the 2018 national median. St. Joseph Hospital, with the lowest net income per adjusted discharge in Figure 44, is 187% of the median. Two for-profit hospitals reported net income per adjusted discharge 1080% and 499% of the median, Swedish Medical Center and The Medical Center of Aurora, respectively.
As discussed earlier in the report, certain limitations occur when comparing hospitals purely in terms of size, which for this report is done by available bed counts. for example, Children’s Hospital Colorado and Presbyterian/St. Luke’s Medical Center have facilities designed to care for children and may have very different expenses and revenues tied to that specialization. As Children’s Hospital Colorado is completely specialized, it may be appropriate to analyze Children’s Hospital Colorado as a separate category, which is done below.
Figure 45: Hospital-Only Operating Expense Per Adjusted Discharge Vs. Net Income Per Adjusted Discharge, 301 to 500 Beds, 2009 to 2018136
Figure 45 shows the change from 2009 to 2018 in Colorado state-wide net income per adjusted discharge and hospital-only operating expense per adjusted discharge compared to the national peer group medians. Looking at the rate of change, indicated by the steepness of the line, the nation and Colorado have a similar trajectory; however, looking at the overall growth and the length of the line, one can
136 Data in this figure is not adjusted for cost-of-living for 2009 nor 2018.
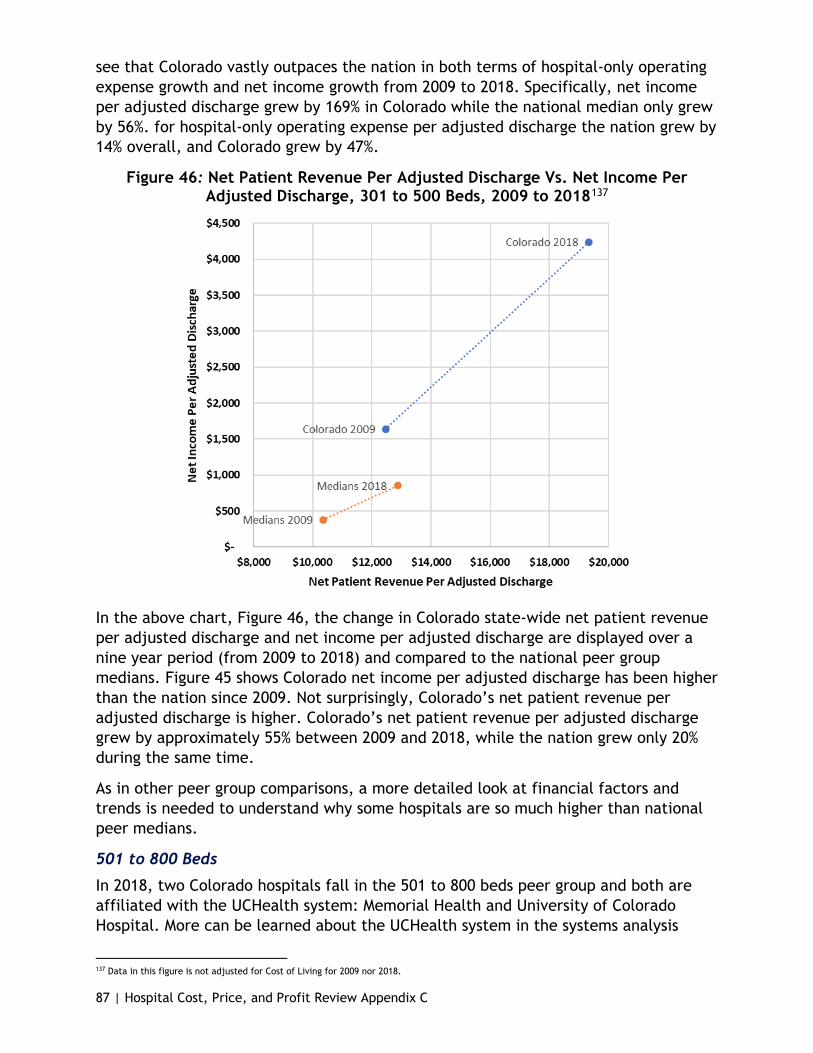
87 | Hospital Cost, Price, and Profit Review Appendix C
see that Colorado vastly outpaces the nation in both terms of hospital-only operating expense growth and net income growth from 2009 to 2018. Specifically, net income per adjusted discharge grew by 169% in Colorado while the national median only grew by 56%. for hospital-only operating expense per adjusted discharge the nation grew by 14% overall, and Colorado grew by 47%.
Figure 46: Net Patient Revenue Per Adjusted Discharge Vs. Net Income Per Adjusted Discharge, 301 to 500 Beds, 2009 to 2018137
In the above chart, Figure 46, the change in Colorado state-wide net patient revenue per adjusted discharge and net income per adjusted discharge are displayed over a nine year period (from 2009 to 2018) and compared to the national peer group medians. Figure 45 shows Colorado net income per adjusted discharge has been higher than the nation since 2009. Not surprisingly, Colorado’s net patient revenue per adjusted discharge is higher. Colorado’s net patient revenue per adjusted discharge grew by approximately 55% between 2009 and 2018, while the nation grew only 20% during the same time.
As in other peer group comparisons, a more detailed look at financial factors and trends is needed to understand why some hospitals are so much higher than national peer medians.
501 to 800 Beds
In 2018, two Colorado hospitals fall in the 501 to 800 beds peer group and both are affiliated with the UCHealth system: Memorial Health and University of Colorado Hospital. More can be learned about the UCHealth system in the systems analysis
137 Data in this figure is not adjusted for Cost of Living for 2009 nor 2018.

88 | Hospital Cost, Price, and Profit Review Appendix C
section. When compared to the 2018 nation numbers, 190 hospitals fall in the 501 to 800 bed peer group.
Figure 47: 2018 Financial Measures, Above National Medians for 501 to 800 Beds138
Hospital Name
Hospital-only
Operating Expense
(per Adjusted
Discharge)
Net Patient
Revenue (per
Adjusted Discharge)
Net Income
(per Adjusted
Discharge)
Above National Hospital-
only Operating Expense Median
Above National
Net Patient
Revenue Median
Above National
Net Income Median
University of Colorado Hospital $17,029 $25,604 $5,958 Yes Yes Yes Memorial Health System $10,228 $15,297 $852 Yes National Median $11,865 $14,679 $1,005
In Figure 47, hospitals above the national median for a particular measure are indicated with a “Yes”. to indicate how much higher the hospital is above the median, color coding is used. A hospital above 120% of the median is indicated with an orange highlight. When a hospital is close or below the median (105% or less than the median) it is indicated with a blue highlight. A key to what the colors mean is above (Figure 39).
University of Colorado Hospital is above all the national peer group medians in 2018 and had a net income per adjusted discharge metric almost 6-times the national median. University of Colorado Hospital is $17,029 for 2018 hospital-only operating expense per adjusted discharge, which is 144% of the peer group national median. Memorial Health System is below the national peer group median for the measures of hospital-only operating expense per adjusted discharges and net income per adjusted discharge, but above the national peer group median for the measure of net patient revenue per adjusted discharge in 2018 by 104%. Memorial Health System had a hospital-only operating expense per adjusted discharge of $10,228 or 86% of the 2018 peer group national median.
138 Data in this figure have been adjusted for cost of living.
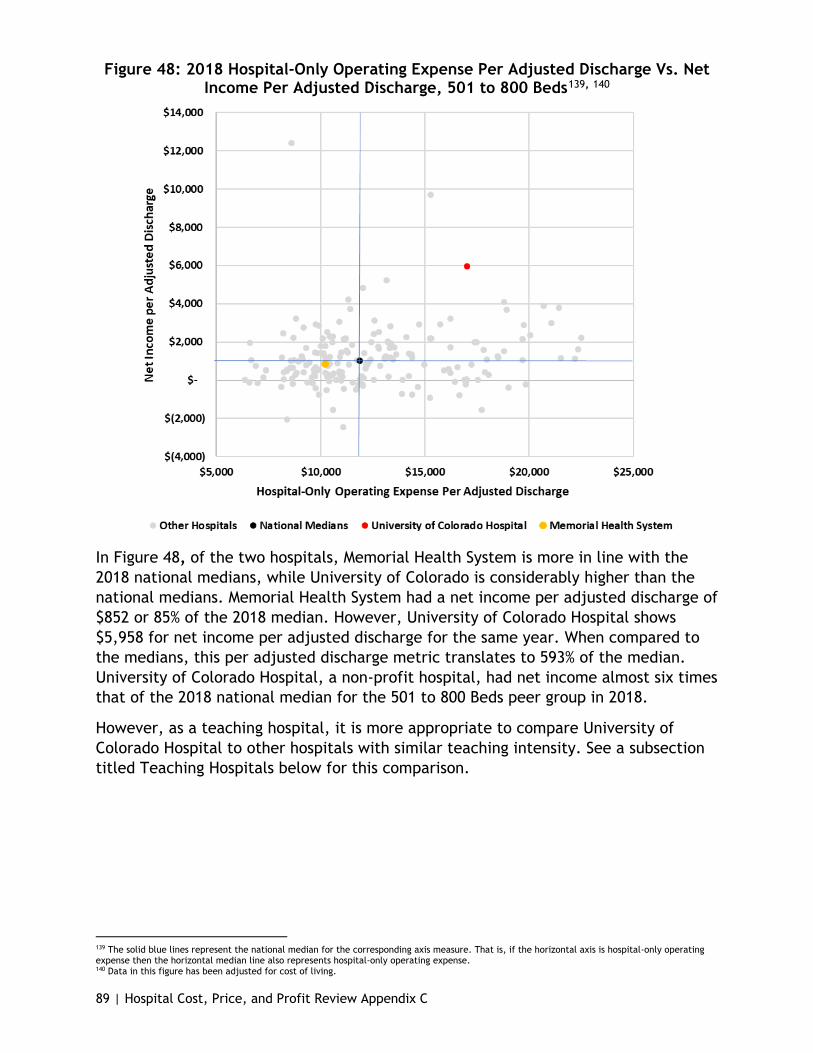
89 | Hospital Cost, Price, and Profit Review Appendix C
Figure 48: 2018 Hospital-Only Operating Expense Per Adjusted Discharge Vs. Net Income Per Adjusted Discharge, 501 to 800 Beds139, 140
In Figure 48, of the two hospitals, Memorial Health System is more in line with the 2018 national medians, while University of Colorado is considerably higher than the national medians. Memorial Health System had a net income per adjusted discharge of $852 or 85% of the 2018 median. However, University of Colorado Hospital shows $5,958 for net income per adjusted discharge for the same year. When compared to the medians, this per adjusted discharge metric translates to 593% of the median. University of Colorado Hospital, a non-profit hospital, had net income almost six times that of the 2018 national median for the 501 to 800 Beds peer group in 2018.
However, as a teaching hospital, it is more appropriate to compare University of Colorado Hospital to other hospitals with similar teaching intensity. See a subsection titled Teaching Hospitals below for this comparison.
139 The solid blue lines represent the national median for the corresponding axis measure. That is, if the horizontal axis is hospital-only operating expense then the horizontal median line also represents hospital-only operating expense. 140 Data in this figure has been adjusted for cost of living.
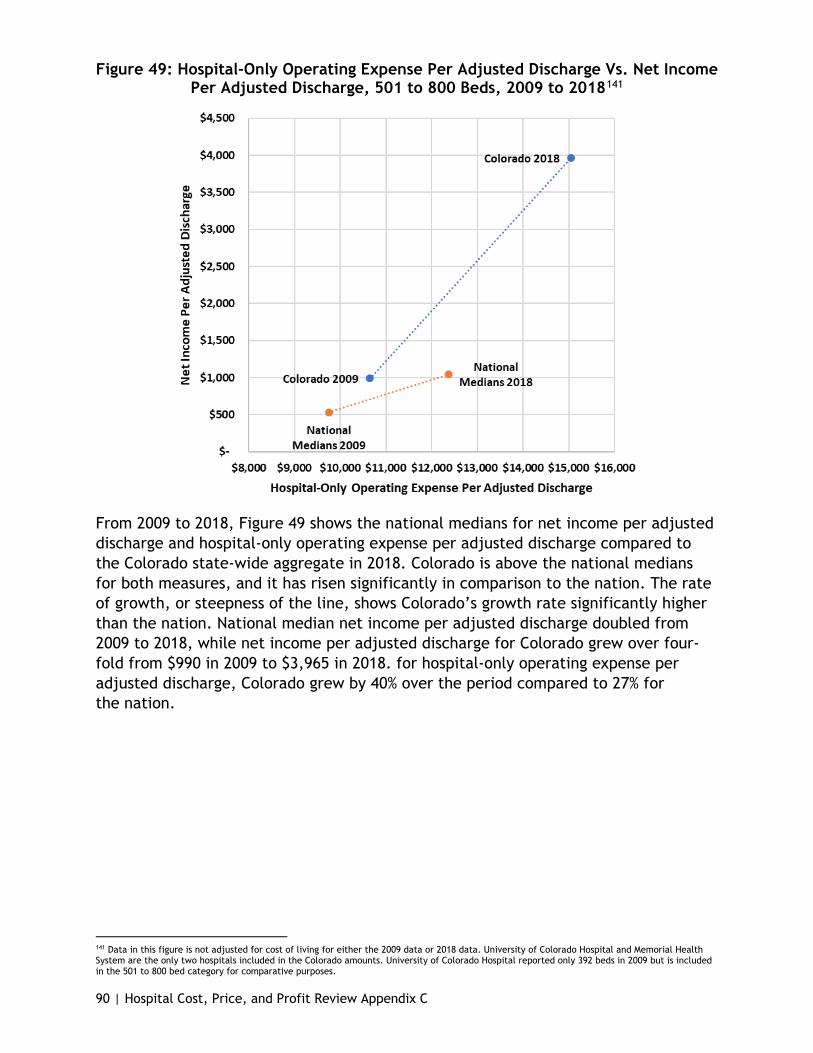
90 | Hospital Cost, Price, and Profit Review Appendix C
Figure 49: Hospital-Only Operating Expense Per Adjusted Discharge Vs. Net Income Per Adjusted Discharge, 501 to 800 Beds, 2009 to 2018141
From 2009 to 2018, Figure 49 shows the national medians for net income per adjusted discharge and hospital-only operating expense per adjusted discharge compared to the Colorado state-wide aggregate in 2018. Colorado is above the national medians for both measures, and it has risen significantly in comparison to the nation. The rate of growth, or steepness of the line, shows Colorado’s growth rate significantly higher than the nation. National median net income per adjusted discharge doubled from 2009 to 2018, while net income per adjusted discharge for Colorado grew over four-fold from $990 in 2009 to $3,965 in 2018. for hospital-only operating expense per adjusted discharge, Colorado grew by 40% over the period compared to 27% for the nation.
141 Data in this figure is not adjusted for cost of living for either the 2009 data or 2018 data. University of Colorado Hospital and Memorial Health System are the only two hospitals included in the Colorado amounts. University of Colorado Hospital reported only 392 beds in 2009 but is included in the 501 to 800 bed category for comparative purposes.

91 | Hospital Cost, Price, and Profit Review Appendix C
Figure 50: 2018 Net Patient Revenue Per Adjusted Discharge Vs. Net Income Per Adjusted Discharge, 501 to 800 Beds142, 143
In Figure 50, net patient revenue per adjusted discharge for both Memorial Health System ($5,297) and University of Colorado Hospital ($25,604) are greater than the national median of $14,679 for 2018. These metrics come to 104% and 174% above the median, respectively.
142 The solid blue lines represent the national median for the corresponding axis measure. That is, if the horizontal axis is hospital-only operating expense then the horizontal median line also represents hospital-only operating expense. 143 Data in this figure has been adjusted for cost of living.
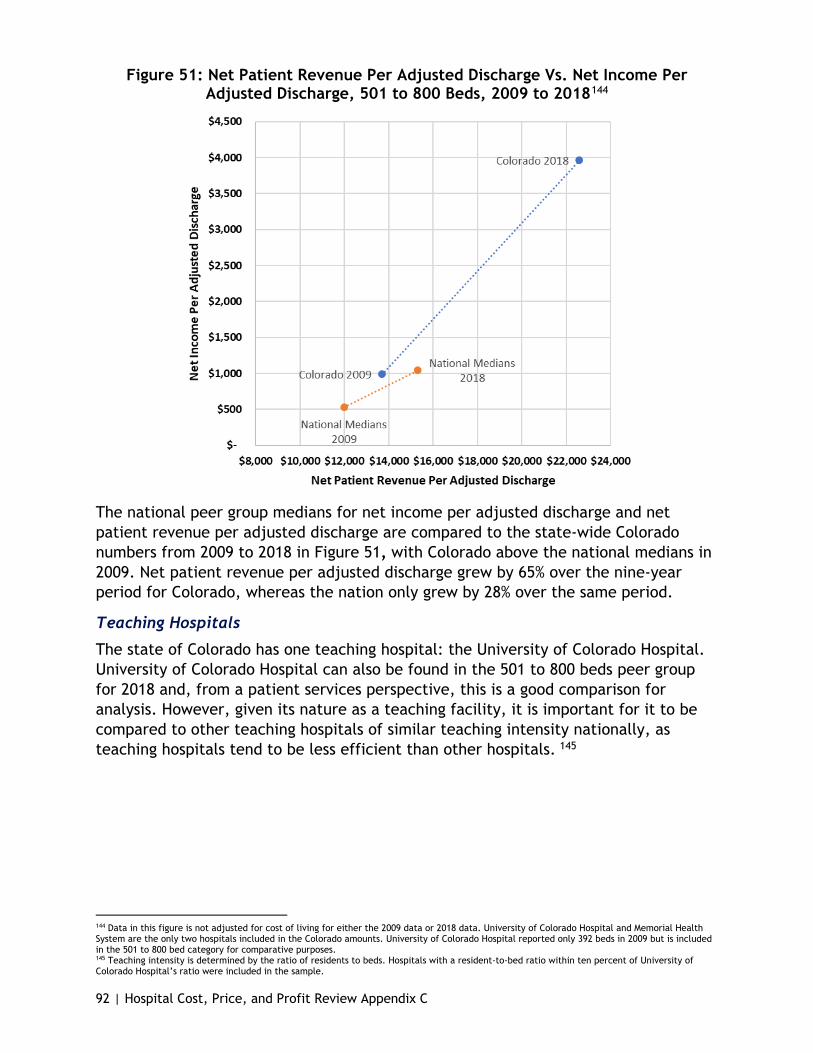
92 | Hospital Cost, Price, and Profit Review Appendix C
Figure 51: Net Patient Revenue Per Adjusted Discharge Vs. Net Income Per Adjusted Discharge, 501 to 800 Beds, 2009 to 2018144
The national peer group medians for net income per adjusted discharge and net patient revenue per adjusted discharge are compared to the state-wide Colorado numbers from 2009 to 2018 in Figure 51, with Colorado above the national medians in 2009. Net patient revenue per adjusted discharge grew by 65% over the nine-year period for Colorado, whereas the nation only grew by 28% over the same period.
Teaching Hospitals
The state of Colorado has one teaching hospital: the University of Colorado Hospital. University of Colorado Hospital can also be found in the 501 to 800 beds peer group for 2018 and, from a patient services perspective, this is a good comparison for analysis. However, given its nature as a teaching facility, it is important for it to be compared to other teaching hospitals of similar teaching intensity nationally, as teaching hospitals tend to be less efficient than other hospitals. 145
144 Data in this figure is not adjusted for cost of living for either the 2009 data or 2018 data. University of Colorado Hospital and Memorial Health System are the only two hospitals included in the Colorado amounts. University of Colorado Hospital reported only 392 beds in 2009 but is included in the 501 to 800 bed category for comparative purposes. 145 Teaching intensity is determined by the ratio of residents to beds. Hospitals with a resident-to-bed ratio within ten percent of University of Colorado Hospital’s ratio were included in the sample.
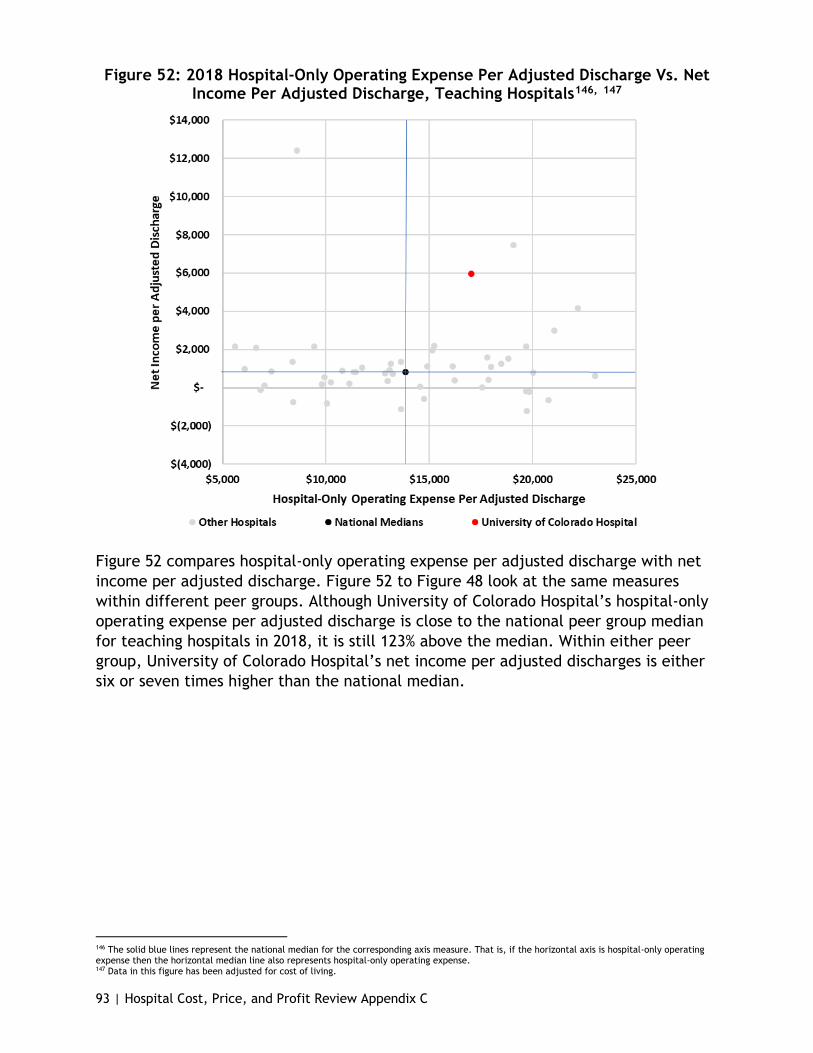
93 | Hospital Cost, Price, and Profit Review Appendix C
Figure 52: 2018 Hospital-Only Operating Expense Per Adjusted Discharge Vs. Net Income Per Adjusted Discharge, Teaching Hospitals146, 147
Figure 52 compares hospital-only operating expense per adjusted discharge with net income per adjusted discharge. Figure 52 to Figure 48 look at the same measures within different peer groups. Although University of Colorado Hospital’s hospital-only operating expense per adjusted discharge is close to the national peer group median for teaching hospitals in 2018, it is still 123% above the median. Within either peer group, University of Colorado Hospital’s net income per adjusted discharges is either six or seven times higher than the national median.
146 The solid blue lines represent the national median for the corresponding axis measure. That is, if the horizontal axis is hospital-only operating expense then the horizontal median line also represents hospital-only operating expense. 147 Data in this figure has been adjusted for cost of living.

94 | Hospital Cost, Price, and Profit Review Appendix C
Figure 53: 2018 Net Patient Revenue Per Adjusted Discharge Vs. Net Income Per Adjusted Discharge, Teaching Hospitals148, 149
Figure 53 shows University of Colorado Hospital’s net patient revenue per adjusted discharge and net income per adjusted discharge for 2018. As shown in Figure 53, University of Colorado Hospital is above the national median for both net income per adjusted discharge and net patient revenue per adjusted discharge.
Children’s Hospitals
In Figure 43, the 301 to 500 beds peer group, Children’s Hospital Colorado is the highest for hospital-only operating expense per adjusted discharge and shows a net income per adjusted discharge approximately five times the 2018 national peer group median.150 Similar to teaching hospitals, children’s hospitals are unique and should be compared to other children’s hospitals within the nation.
Per Figure 54, Children’s Hospital Colorado hospital-only operating expense per adjusted discharge line up with the national median for all children’s hospitals in 2018, but is approximately one-and-half times that of the net income per adjusted discharge median for the same year. While net income per adjusted discharge is slightly higher within the children’s hospital peer group, the range for this metric is wide for hospitals from across the nation.
148 The solid blue lines represent the national median for the corresponding axis measure. That is, if the horizontal axis is hospital-only operating expense then the horizontal median line also represents hospital-only operating expense. 149 Data in this figure has been adjusted for cost of living. 150 Children’s hospitals included in the analysis are those hospitals with Medicare provider numbers ending in 3303 through 3399.

95 | Hospital Cost, Price, and Profit Review Appendix C
Figure 54: 2018 Hospital-Only Operating Expense Per Adjusted Discharge Vs. Net Income Per Adjusted Discharge, Children’s Hospitals151, 152
When comparing Children’s Hospital Colorado to hospitals in the 301 to 500 peer group, it is not in line with the 2018 medians; however when compared to an appropriate peer group, Children’s Hospital Colorado falls much more in line with 2018 national median for hospital-only operating expense per adjusted discharge and appears more reasonable for net income per adjusted discharge. With this analysis, along with the teaching hospitals in Figure 53, it becomes evident certain hospitals will require further analysis to truly gain insights and perform appropriate peer grouping beyond size alone.
151 The solid blue lines represent the national median for the corresponding axis measure. That is, if the horizontal axis is hospital-only operating expense then the horizontal median line also represents hospital-only operating expense. 152 Data in this figure has been adjusted for cost of living.
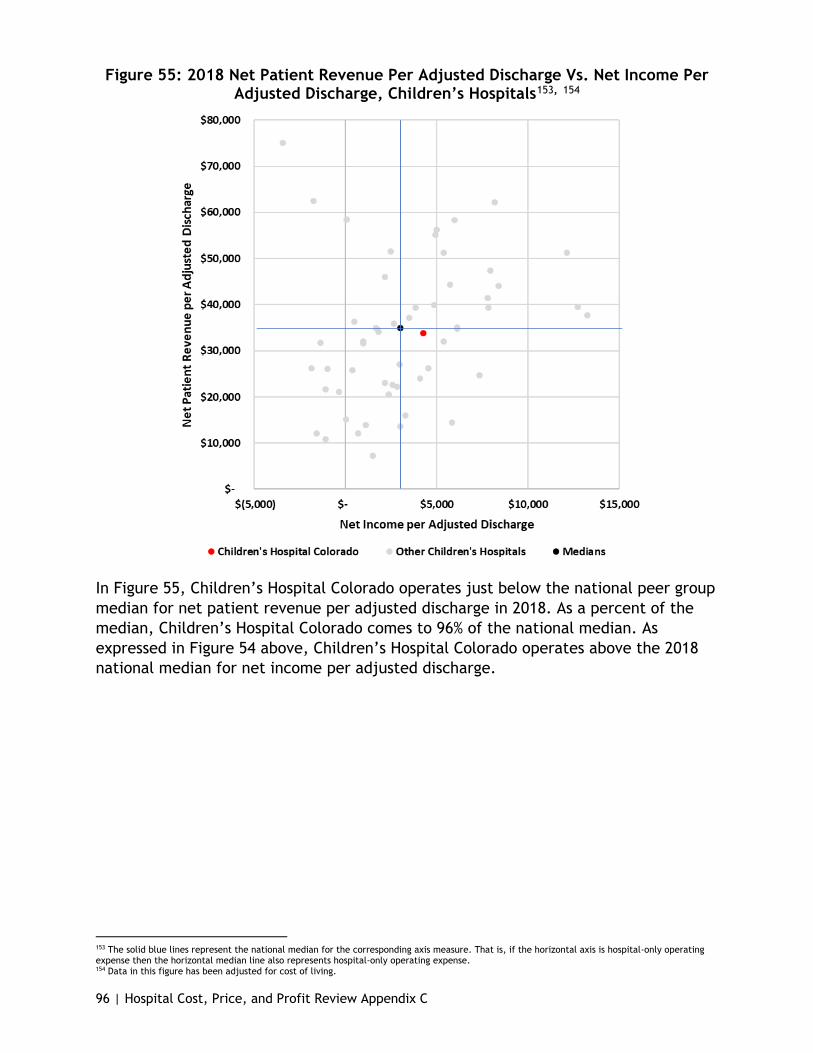
96 | Hospital Cost, Price, and Profit Review Appendix C
Figure 55: 2018 Net Patient Revenue Per Adjusted Discharge Vs. Net Income Per Adjusted Discharge, Children’s Hospitals153, 154
In Figure 55, Children’s Hospital Colorado operates just below the national peer group median for net patient revenue per adjusted discharge in 2018. As a percent of the median, Children’s Hospital Colorado comes to 96% of the national median. As expressed in Figure 54 above, Children’s Hospital Colorado operates above the 2018 national median for net income per adjusted discharge.
153 The solid blue lines represent the national median for the corresponding axis measure. That is, if the horizontal axis is hospital-only operating expense then the horizontal median line also represents hospital-only operating expense. 154 Data in this figure has been adjusted for cost of living.
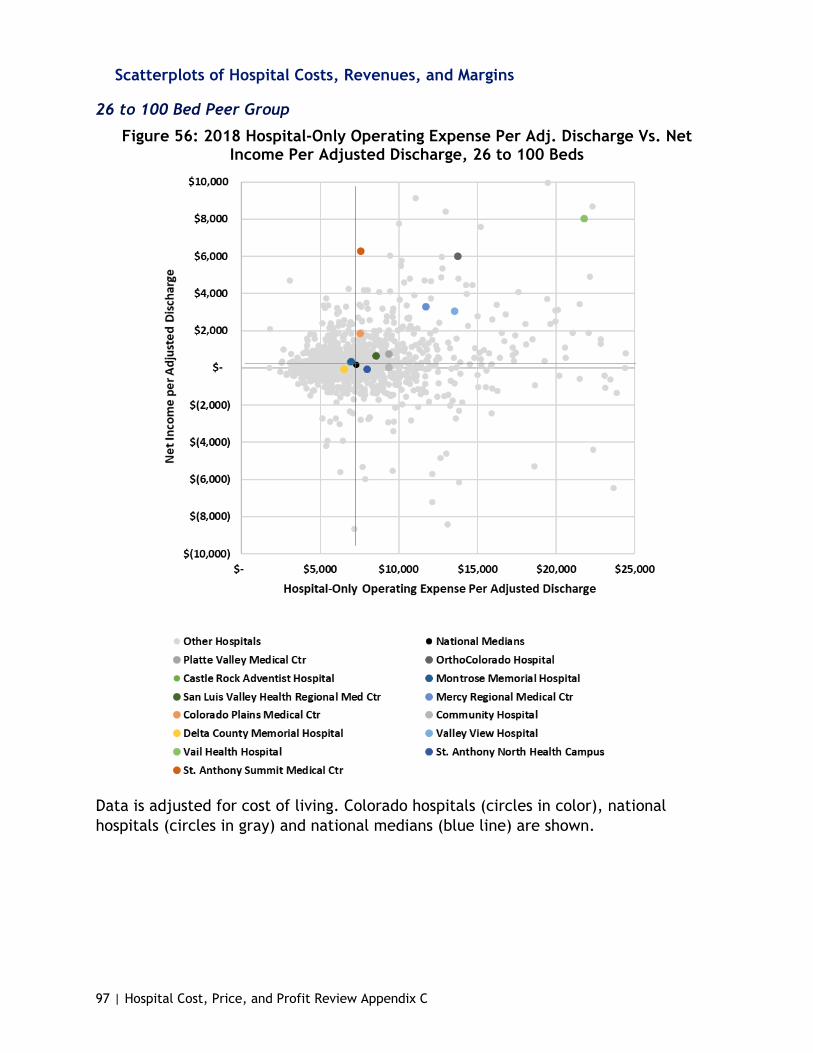
97 | Hospital Cost, Price, and Profit Review Appendix C
Scatterplots of Hospital Costs, Revenues, and Margins
26 to 100 Bed Peer Group
Figure 56: 2018 Hospital-Only Operating Expense Per Adj. Discharge Vs. Net Income Per Adjusted Discharge, 26 to 100 Beds
Data is adjusted for cost of living. Colorado hospitals (circles in color), national hospitals (circles in gray) and national medians (blue line) are shown.

98 | Hospital Cost, Price, and Profit Review Appendix C
Figure 57: 2018 Hospital-Only Operating Expense Per Adjusted Discharge Vs. Net Patient Revenue Per Adjusted Discharge, 26 to 100 Beds
Data is adjusted for cost of living. Colorado hospitals (circles in color), national hospitals (circles in gray) and national medians (blue line) are shown.
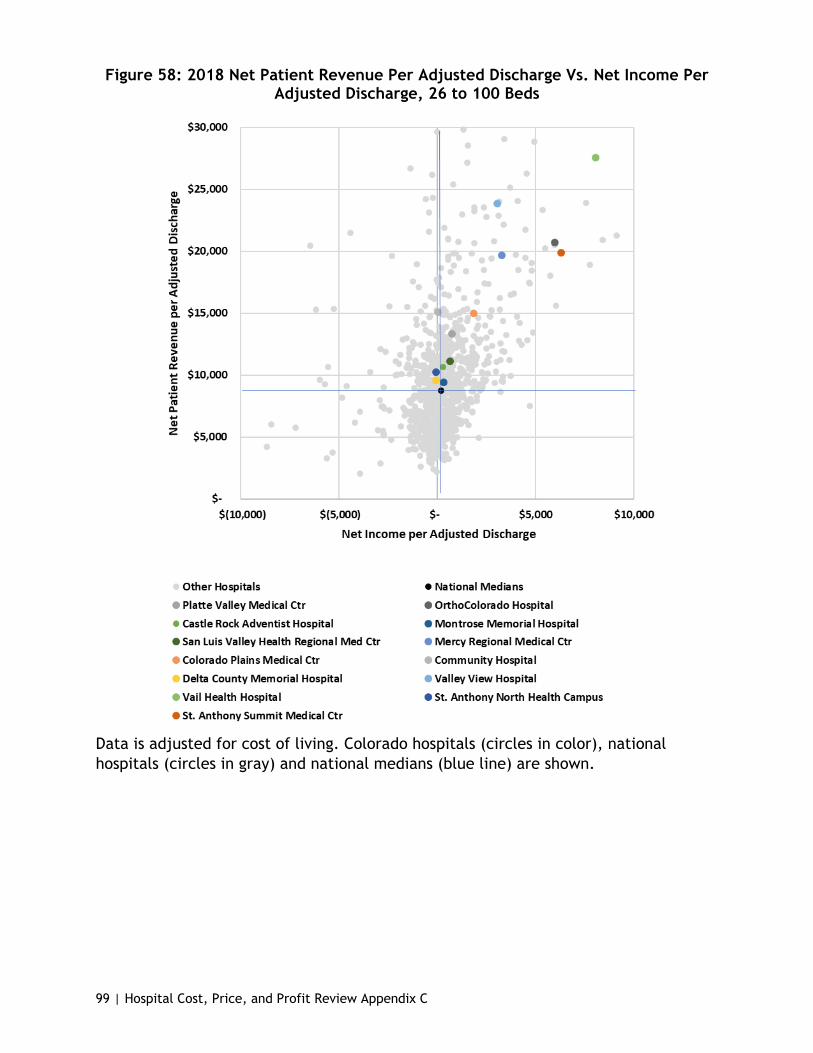
99 | Hospital Cost, Price, and Profit Review Appendix C
Figure 58: 2018 Net Patient Revenue Per Adjusted Discharge Vs. Net Income Per Adjusted Discharge, 26 to 100 Beds
Data is adjusted for cost of living. Colorado hospitals (circles in color), national hospitals (circles in gray) and national medians (blue line) are shown.
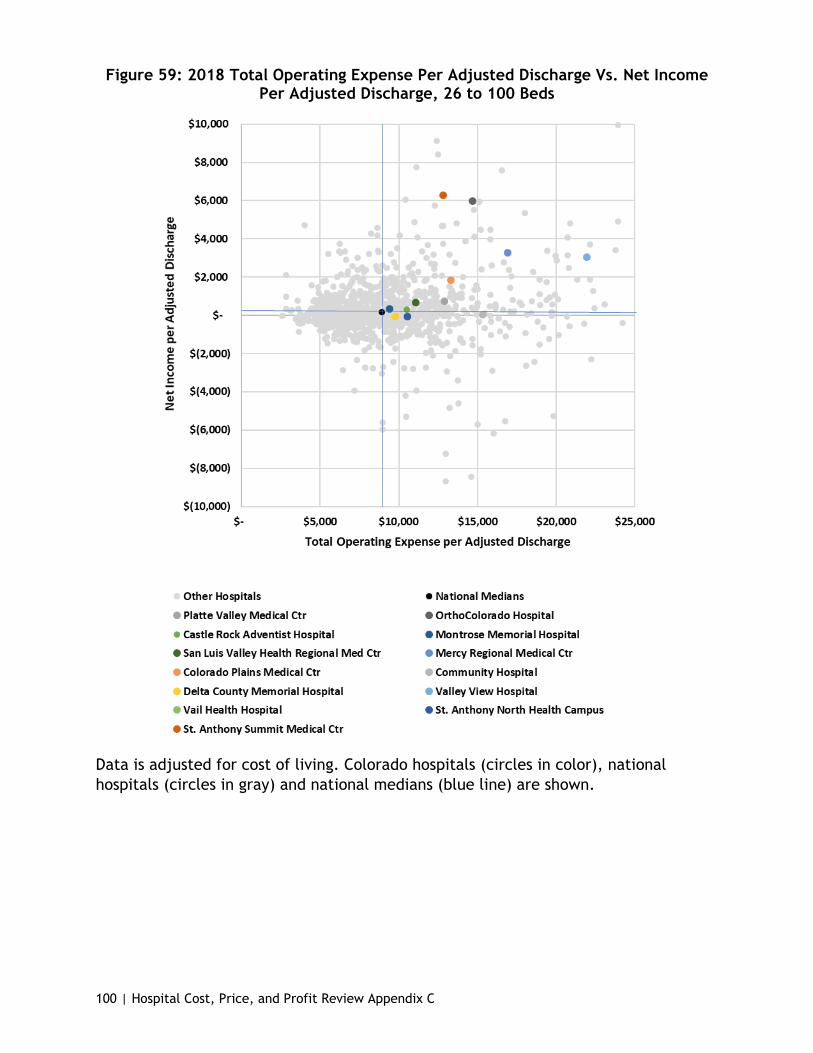
100 | Hospital Cost, Price, and Profit Review Appendix C
Figure 59: 2018 Total Operating Expense Per Adjusted Discharge Vs. Net Income Per Adjusted Discharge, 26 to 100 Beds
Data is adjusted for cost of living. Colorado hospitals (circles in color), national hospitals (circles in gray) and national medians (blue line) are shown.

101 | Hospital Cost, Price, and Profit Review Appendix C
Figure 60: 2018 Total Operating Expense Per Adjusted Discharge Vs. Net Patient Revenue Per Adjusted Discharge, 26 to 100 Beds
Data is adjusted for cost of living. Colorado hospitals (circles in color), national hospitals (circles in gray) and national medians (blue line) are shown.
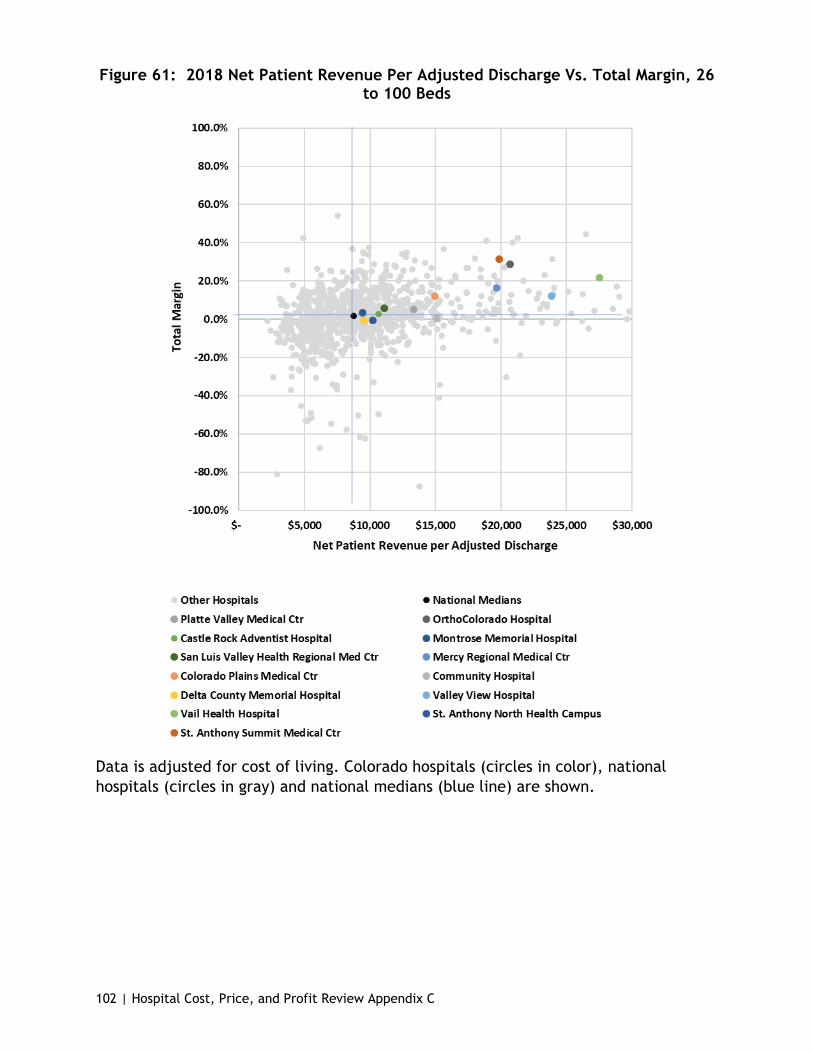
102 | Hospital Cost, Price, and Profit Review Appendix C
Figure 61: 2018 Net Patient Revenue Per Adjusted Discharge Vs. Total Margin, 26 to 100 Beds
Data is adjusted for cost of living. Colorado hospitals (circles in color), national hospitals (circles in gray) and national medians (blue line) are shown.
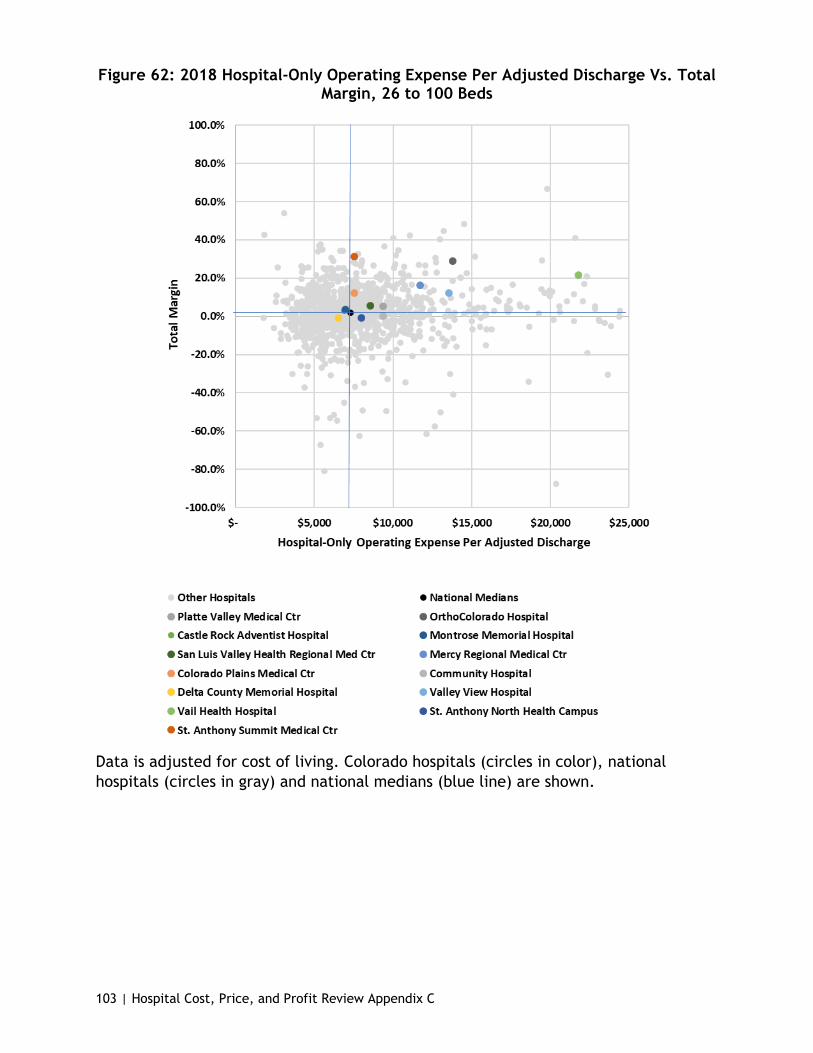
103 | Hospital Cost, Price, and Profit Review Appendix C
Figure 62: 2018 Hospital-Only Operating Expense Per Adjusted Discharge Vs. Total Margin, 26 to 100 Beds
Data is adjusted for cost of living. Colorado hospitals (circles in color), national hospitals (circles in gray) and national medians (blue line) are shown.

104 | Hospital Cost, Price, and Profit Review Appendix C
Figure 63: 2018 Total Operating Expense Per Adjusted Discharge Vs. Total Margin, 26 to 100 Beds
Data is adjusted for cost of living. Colorado hospitals (circles in color), national hospitals (circles in gray) and national medians (blue line) are shown.
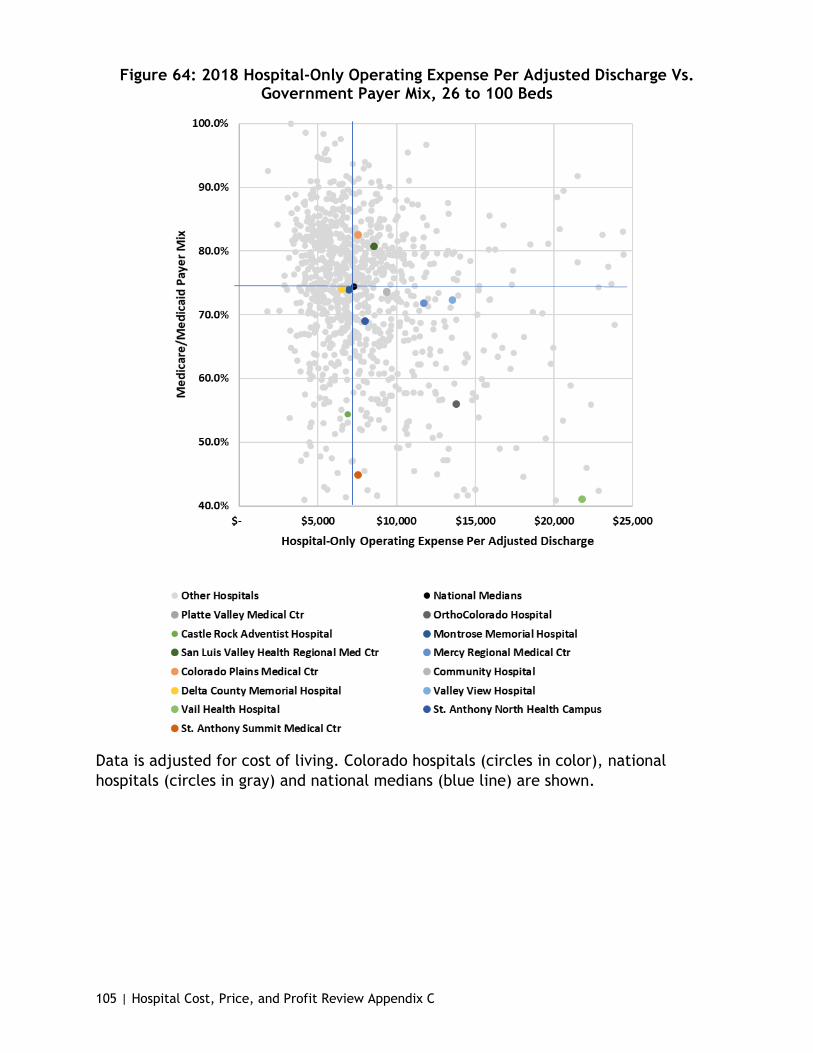
105 | Hospital Cost, Price, and Profit Review Appendix C
Figure 64: 2018 Hospital-Only Operating Expense Per Adjusted Discharge Vs. Government Payer Mix, 26 to 100 Beds
Data is adjusted for cost of living. Colorado hospitals (circles in color), national hospitals (circles in gray) and national medians (blue line) are shown.
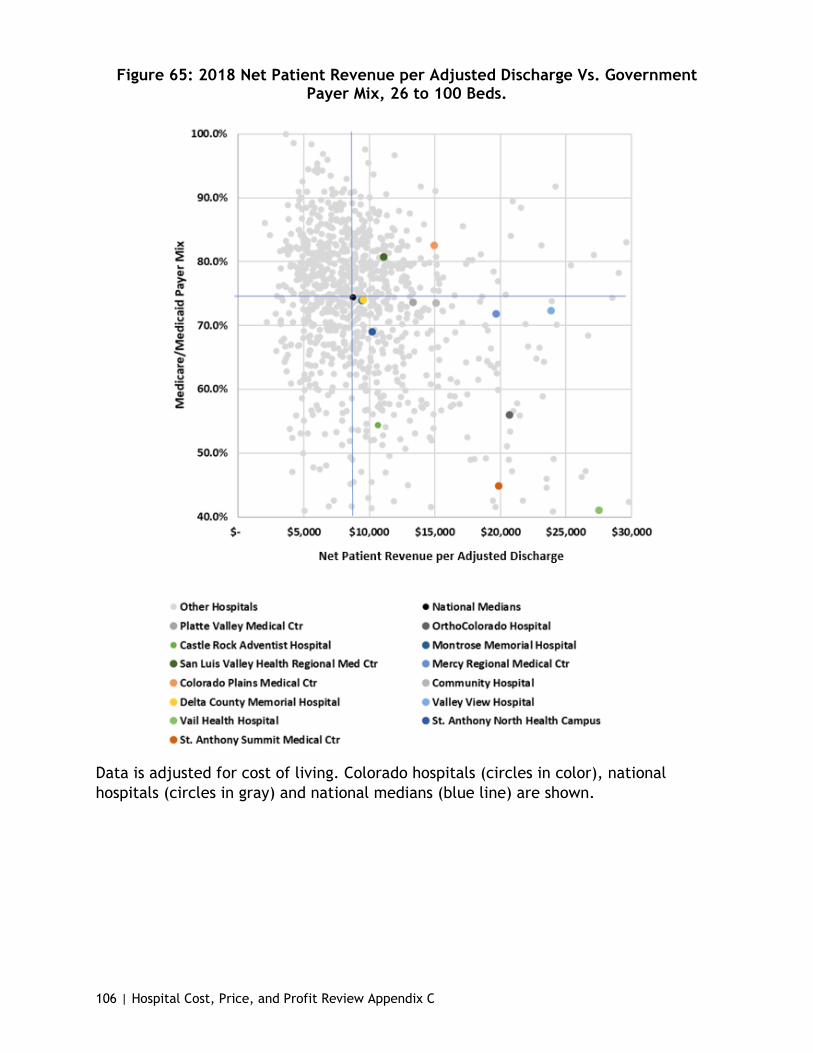
106 | Hospital Cost, Price, and Profit Review Appendix C
Figure 65: 2018 Net Patient Revenue per Adjusted Discharge Vs. Government Payer Mix, 26 to 100 Beds.
Data is adjusted for cost of living. Colorado hospitals (circles in color), national hospitals (circles in gray) and national medians (blue line) are shown.

107 | Hospital Cost, Price, and Profit Review Appendix C
101 to 300 Bed Peer Group
Figure 66: 2018 Hospital-Only Operating Expense Per Adjusted Discharge Vs. Net Income Per Adjusted Discharge, 101 to 300 Beds
Data is adjusted for cost of living. Colorado hospitals (circles in color), national hospitals (circles in gray) and national medians (blue line) are shown.
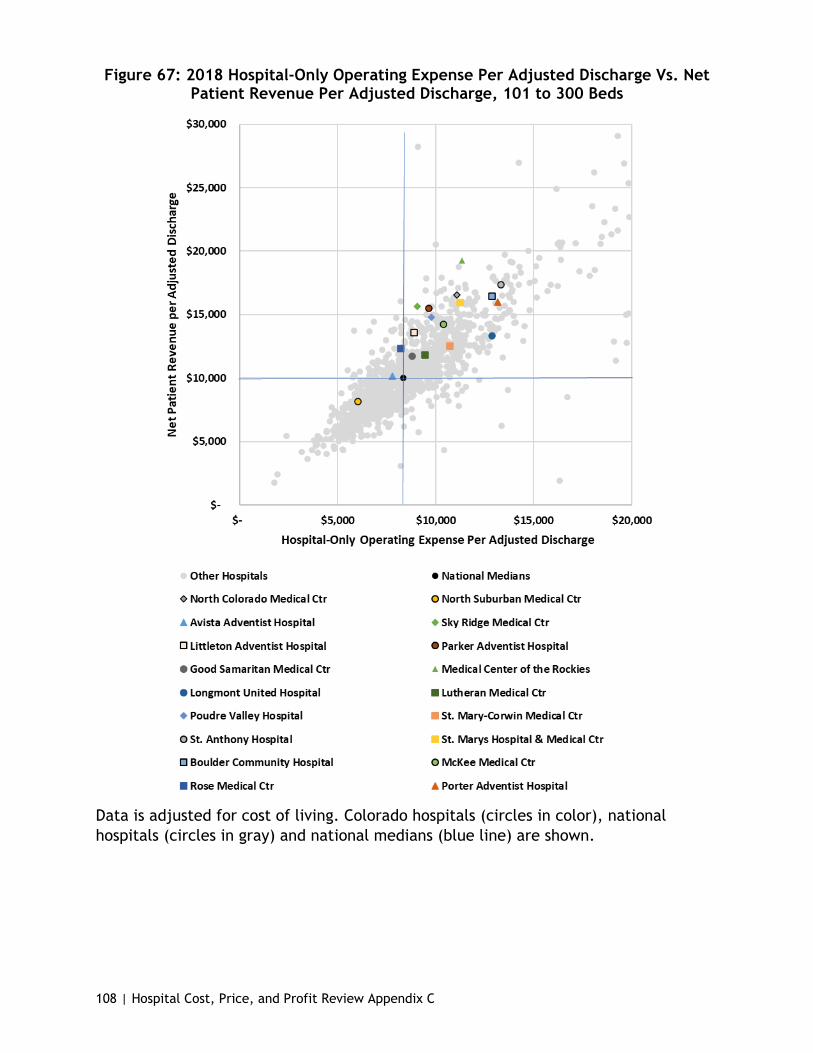
108 | Hospital Cost, Price, and Profit Review Appendix C
Figure 67: 2018 Hospital-Only Operating Expense Per Adjusted Discharge Vs. Net Patient Revenue Per Adjusted Discharge, 101 to 300 Beds
Data is adjusted for cost of living. Colorado hospitals (circles in color), national hospitals (circles in gray) and national medians (blue line) are shown.
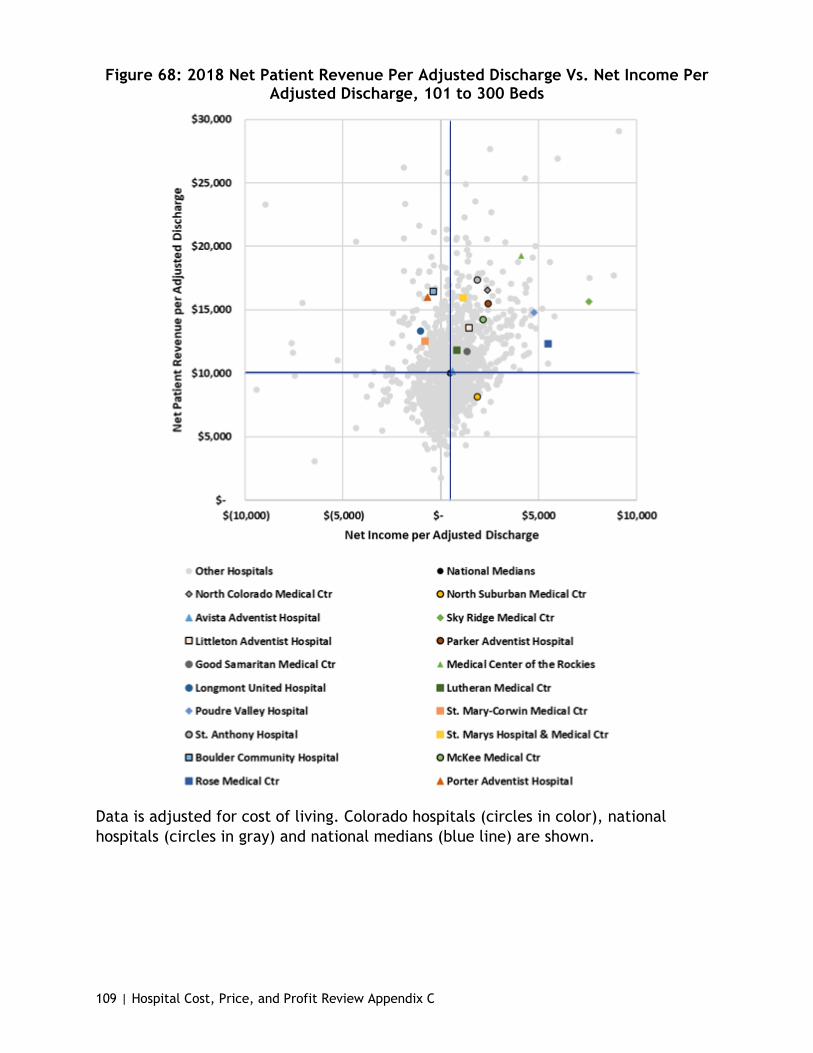
109 | Hospital Cost, Price, and Profit Review Appendix C
Figure 68: 2018 Net Patient Revenue Per Adjusted Discharge Vs. Net Income Per Adjusted Discharge, 101 to 300 Beds
Data is adjusted for cost of living. Colorado hospitals (circles in color), national hospitals (circles in gray) and national medians (blue line) are shown.

110 | Hospital Cost, Price, and Profit Review Appendix C
Figure 69: 2018 Total Operating Expense Per Adjusted Discharge Vs. Net Income Per Adjusted Discharge, 101 to 300 Beds
Data is adjusted for cost of living. Colorado hospitals (circles in color), national hospitals (circles in gray) and national medians (blue line) are shown.
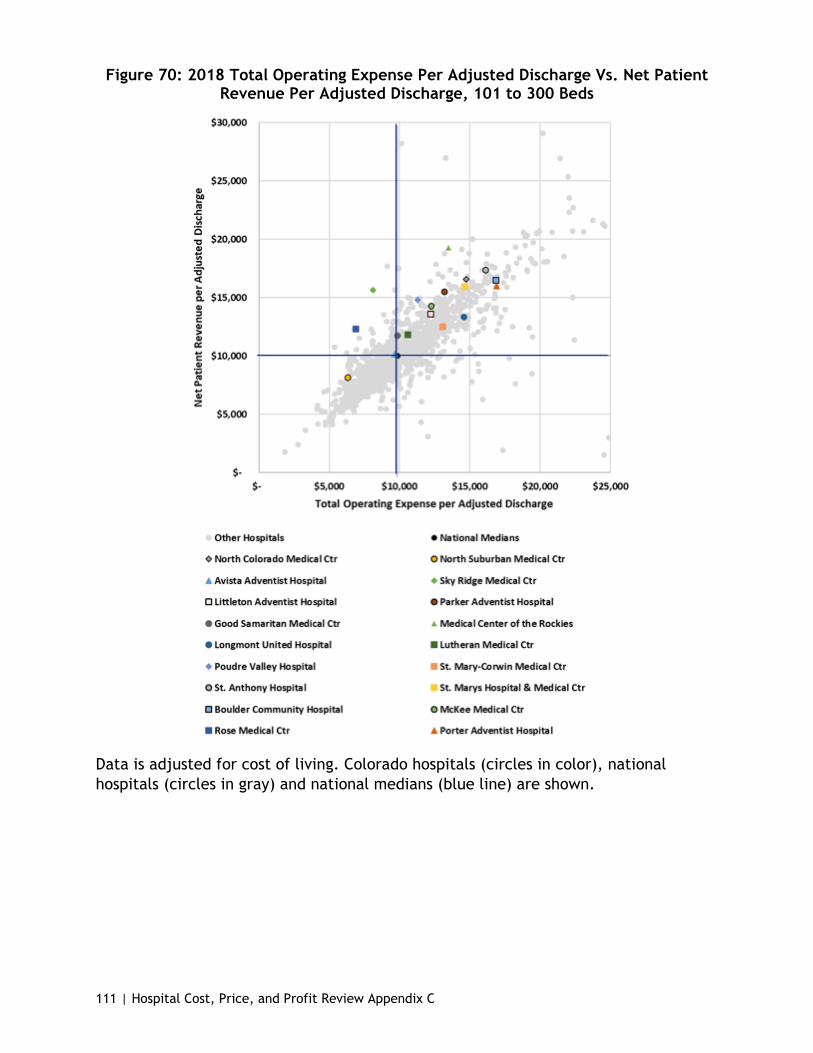
111 | Hospital Cost, Price, and Profit Review Appendix C
Figure 70: 2018 Total Operating Expense Per Adjusted Discharge Vs. Net Patient Revenue Per Adjusted Discharge, 101 to 300 Beds
Data is adjusted for cost of living. Colorado hospitals (circles in color), national hospitals (circles in gray) and national medians (blue line) are shown.
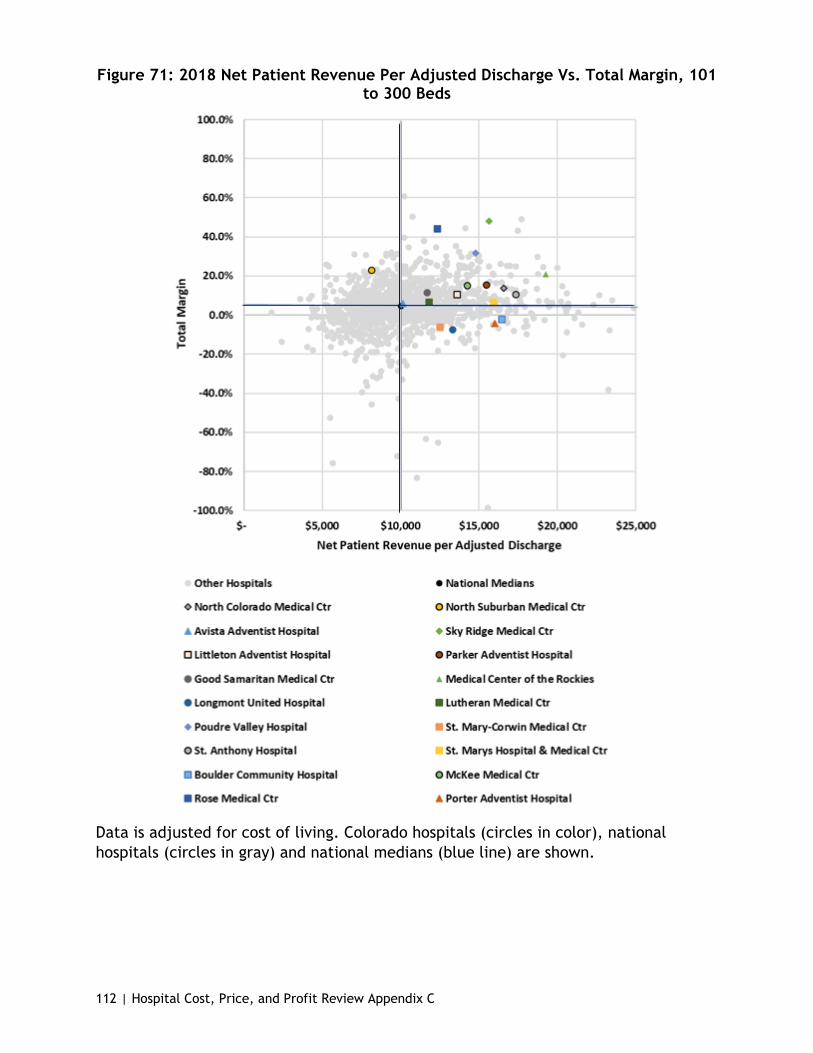
112 | Hospital Cost, Price, and Profit Review Appendix C
Figure 71: 2018 Net Patient Revenue Per Adjusted Discharge Vs. Total Margin, 101 to 300 Beds
Data is adjusted for cost of living. Colorado hospitals (circles in color), national hospitals (circles in gray) and national medians (blue line) are shown.

113 | Hospital Cost, Price, and Profit Review Appendix C
Figure 72: 2018 Hospital-Only Operating Expense Per Adjusted Discharge Vs. Total Margin, 101 to 300 Beds
Data is adjusted for cost of living. Colorado hospitals (circles in color), national hospitals (circles in gray) and national medians (blue line) are shown.

114 | Hospital Cost, Price, and Profit Review Appendix C
Figure 73: 2018 Total Operating Expense Per Adjusted Discharge Vs. Total Margin, 101 to 300 Beds
Data is adjusted for cost of living. Colorado hospitals (circles in color), national hospitals (circles in gray) and national medians (blue line) are shown.

115 | Hospital Cost, Price, and Profit Review Appendix C
Figure 74: 2018 Hospital-Only Operating Expense Per Adjusted Discharge Vs. Government Payer Mix, 101 to 300 Beds
Hospital-only operating expense is adjusted for cost of living. Colorado hospitals (circles in color), national hospitals (circles in gray) and national medians (blue line) are shown.

116 | Hospital Cost, Price, and Profit Review Appendix C
Figure 75: 2018 Net Patient Revenue Per Adjusted Discharge Vs. Government Payer Mix, 101 to 300 Beds
Net patient revenue is adjusted for cost of living. Colorado hospitals (circles in color), national hospitals (circles in gray) and national medians (blue line) are shown.

117 | Hospital Cost, Price, and Profit Review Appendix C
301 to 500 Bed Peer Group
Figure 76: 2018 Hospital-Only Operating Expense Per Adjusted Discharge Vs. Net Income Per Adjusted Discharge, 301 to 500 Beds
Data is adjusted for cost of living. Colorado hospitals (circles in color), national hospitals (circles in gray) and national medians (blue line) are shown.

118 | Hospital Cost, Price, and Profit Review Appendix C
Figure 77: 2018 Hospital-Only Operating Expense Per Adjusted Discharge Vs. Net Patient Revenue Per Adjusted Discharge, 301 to 500 Beds
Data is adjusted for cost of living. Colorado hospitals (circles in color), national hospitals (circles in gray) and national medians (blue line) are shown.

119 | Hospital Cost, Price, and Profit Review Appendix C
Figure 78: 2018 Net Patient Revenue Per Adjusted Discharge Vs. Net Income Per Adjusted Discharge, 301 to 500 Beds
Data is adjusted for cost of living. Colorado hospitals (circles in color), national hospitals (circles in gray) and national medians (blue line) are shown.

120 | Hospital Cost, Price, and Profit Review Appendix C
Figure 79: 2018 Total Operating Expense Per Adjusted Discharge Vs. Net Income Per Adjusted Discharge, 301 to 500 Beds
Data is adjusted for cost of living. Colorado hospitals (circles in color), national hospitals (circles in gray) and national medians (blue line) are shown.
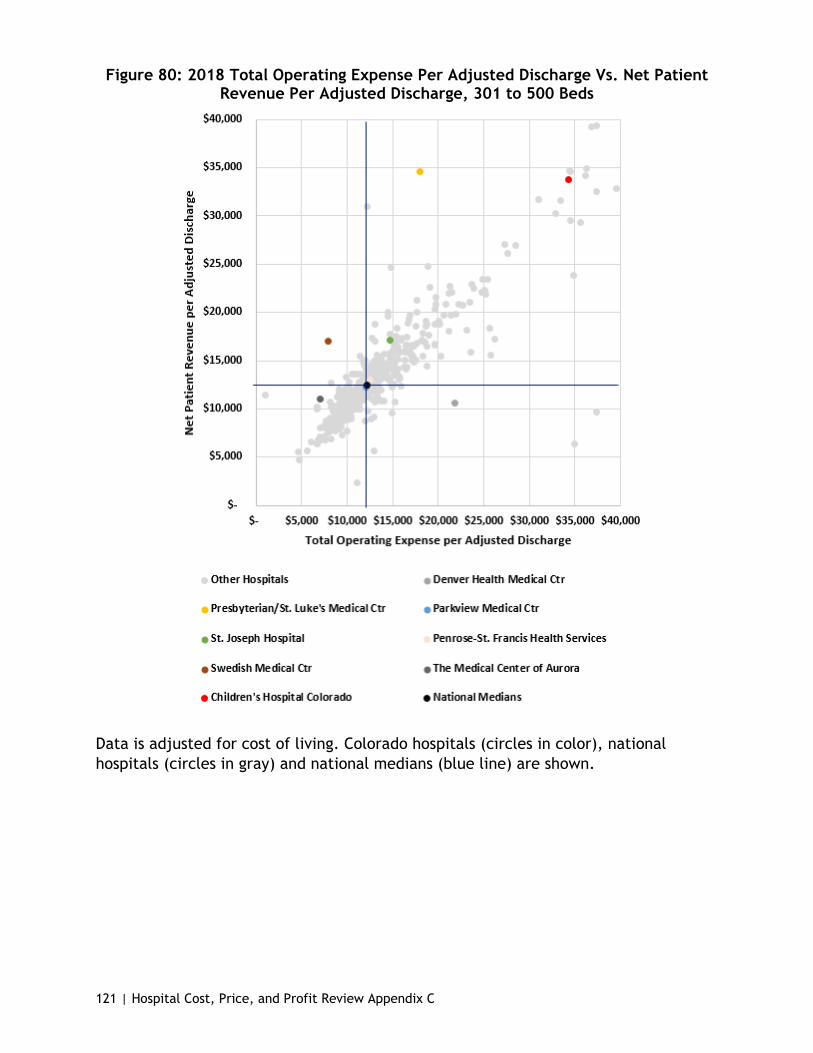
121 | Hospital Cost, Price, and Profit Review Appendix C
Figure 80: 2018 Total Operating Expense Per Adjusted Discharge Vs. Net Patient Revenue Per Adjusted Discharge, 301 to 500 Beds
Data is adjusted for cost of living. Colorado hospitals (circles in color), national hospitals (circles in gray) and national medians (blue line) are shown.
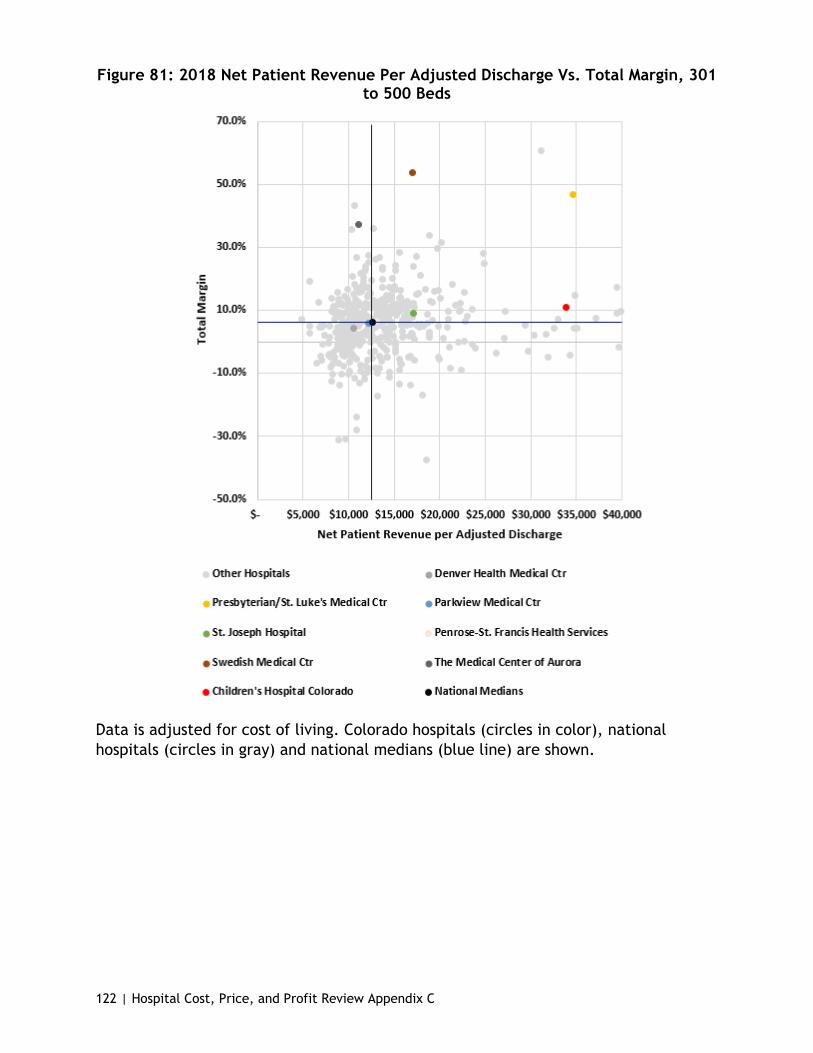
122 | Hospital Cost, Price, and Profit Review Appendix C
Figure 81: 2018 Net Patient Revenue Per Adjusted Discharge Vs. Total Margin, 301 to 500 Beds
Data is adjusted for cost of living. Colorado hospitals (circles in color), national hospitals (circles in gray) and national medians (blue line) are shown.
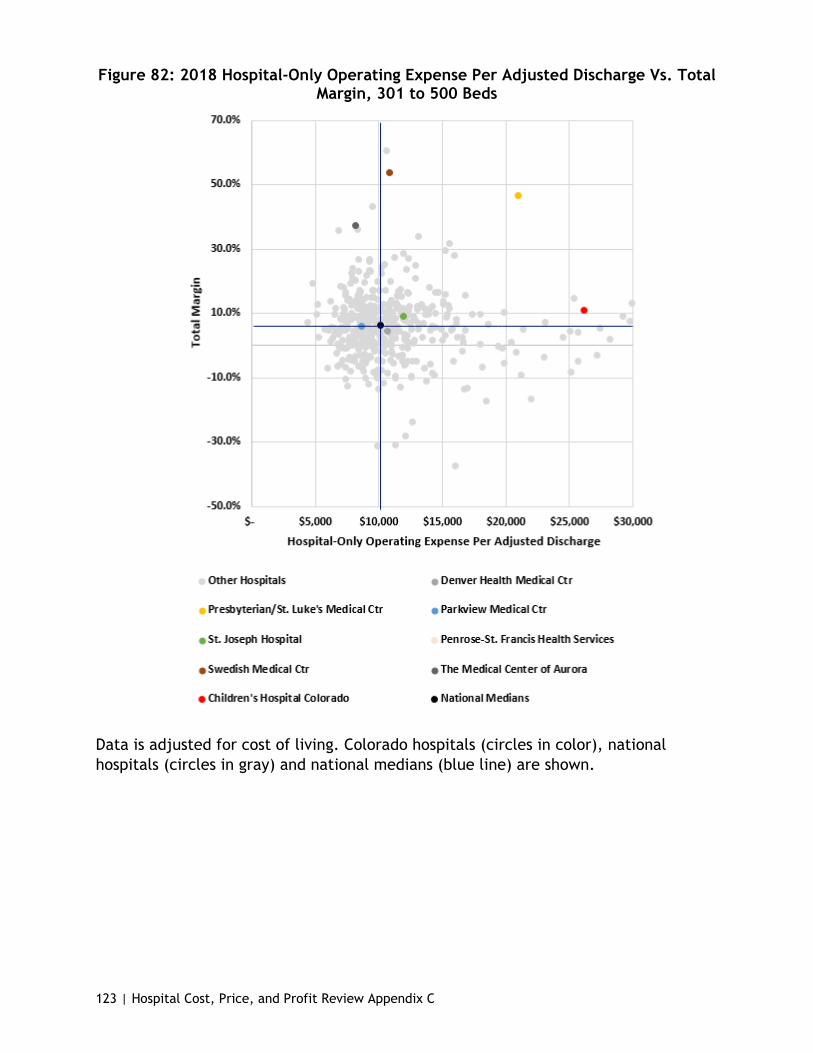
123 | Hospital Cost, Price, and Profit Review Appendix C
Figure 82: 2018 Hospital-Only Operating Expense Per Adjusted Discharge Vs. Total Margin, 301 to 500 Beds
Data is adjusted for cost of living. Colorado hospitals (circles in color), national hospitals (circles in gray) and national medians (blue line) are shown.
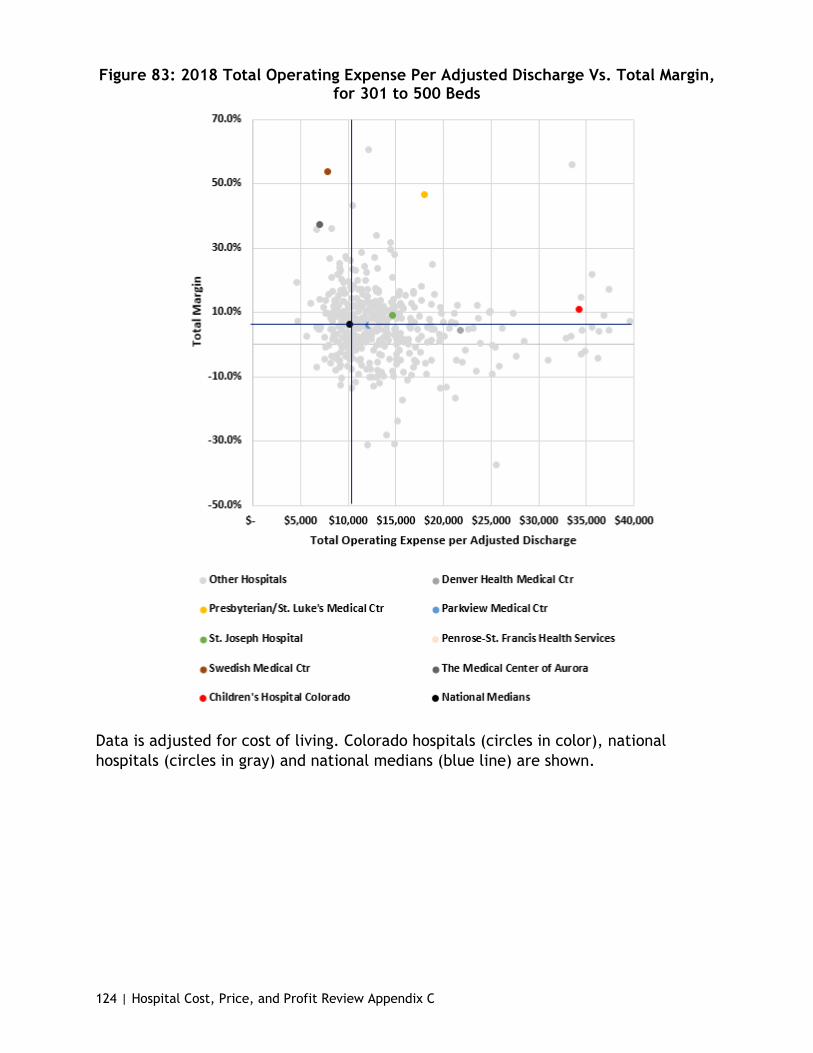
124 | Hospital Cost, Price, and Profit Review Appendix C
Figure 83: 2018 Total Operating Expense Per Adjusted Discharge Vs. Total Margin, for 301 to 500 Beds
Data is adjusted for cost of living. Colorado hospitals (circles in color), national hospitals (circles in gray) and national medians (blue line) are shown.

125 | Hospital Cost, Price, and Profit Review Appendix C
Figure 84: 2018 Hospital-Only Operating Expense Per Adjusted Discharge Vs. Government Payer Mix, 301 to 500 Beds
Hospital-only operating expense is adjusted for cost of living. Colorado hospitals (circles in color), national hospitals (circles in gray) and national medians (blue line) are shown.
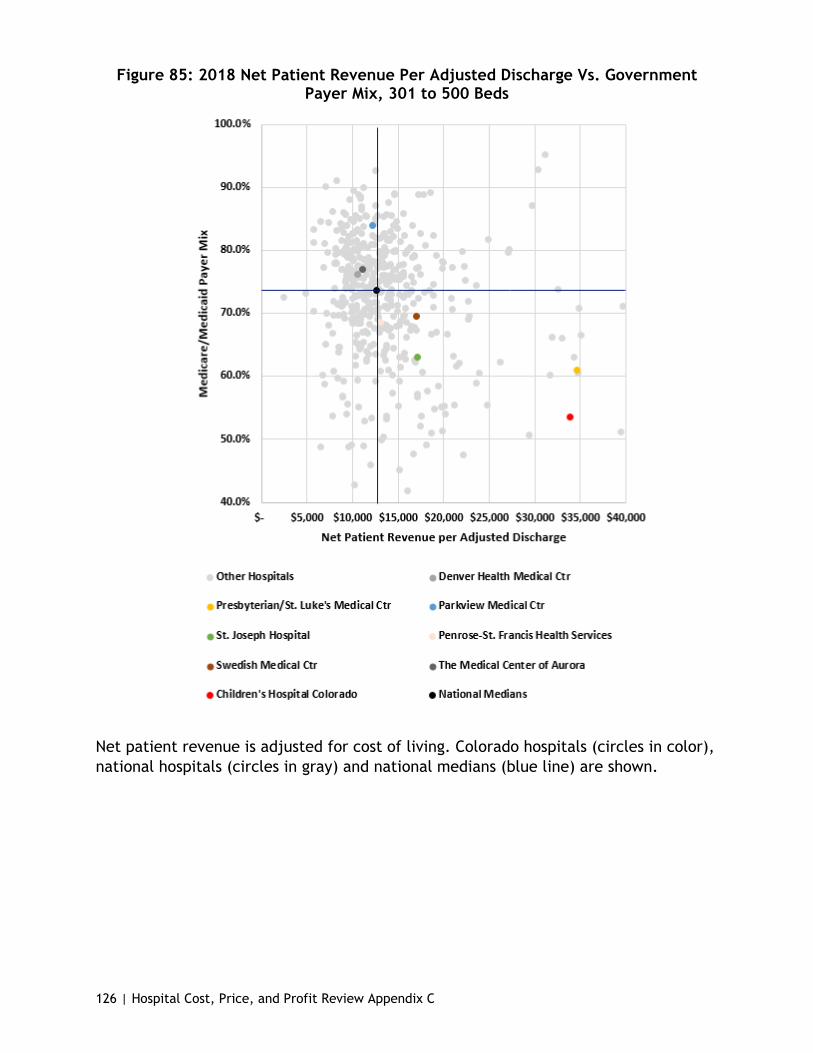
126 | Hospital Cost, Price, and Profit Review Appendix C
Figure 85: 2018 Net Patient Revenue Per Adjusted Discharge Vs. Government Payer Mix, 301 to 500 Beds
Net patient revenue is adjusted for cost of living. Colorado hospitals (circles in color), national hospitals (circles in gray) and national medians (blue line) are shown.
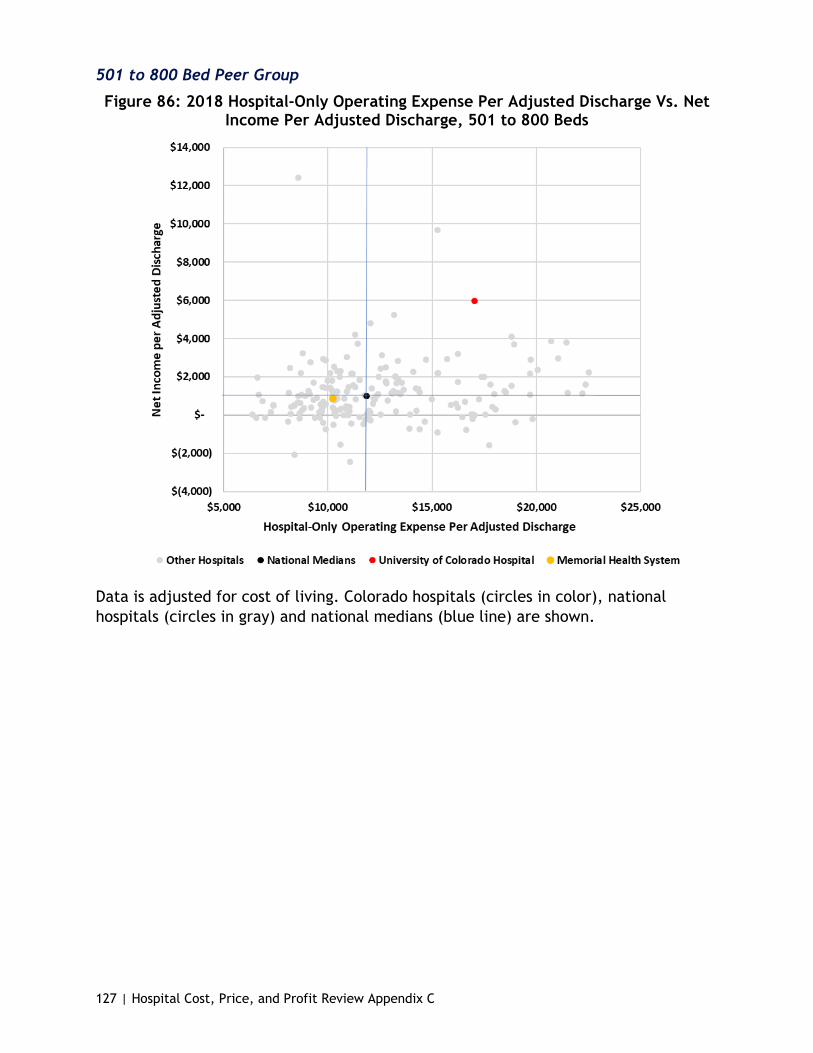
127 | Hospital Cost, Price, and Profit Review Appendix C
501 to 800 Bed Peer Group
Figure 86: 2018 Hospital-Only Operating Expense Per Adjusted Discharge Vs. Net Income Per Adjusted Discharge, 501 to 800 Beds
Data is adjusted for cost of living. Colorado hospitals (circles in color), national hospitals (circles in gray) and national medians (blue line) are shown.

128 | Hospital Cost, Price, and Profit Review Appendix C
Figure 87: 2018 Hospital-Only Operating Expense Per Adjusted Discharge Vs. Net Patient Revenue Per Adjusted Discharge, 501 to 800 Beds
Data is adjusted for cost of living. Colorado hospitals (circles in color), national hospitals (circles in gray) and national medians (blue line) are shown.
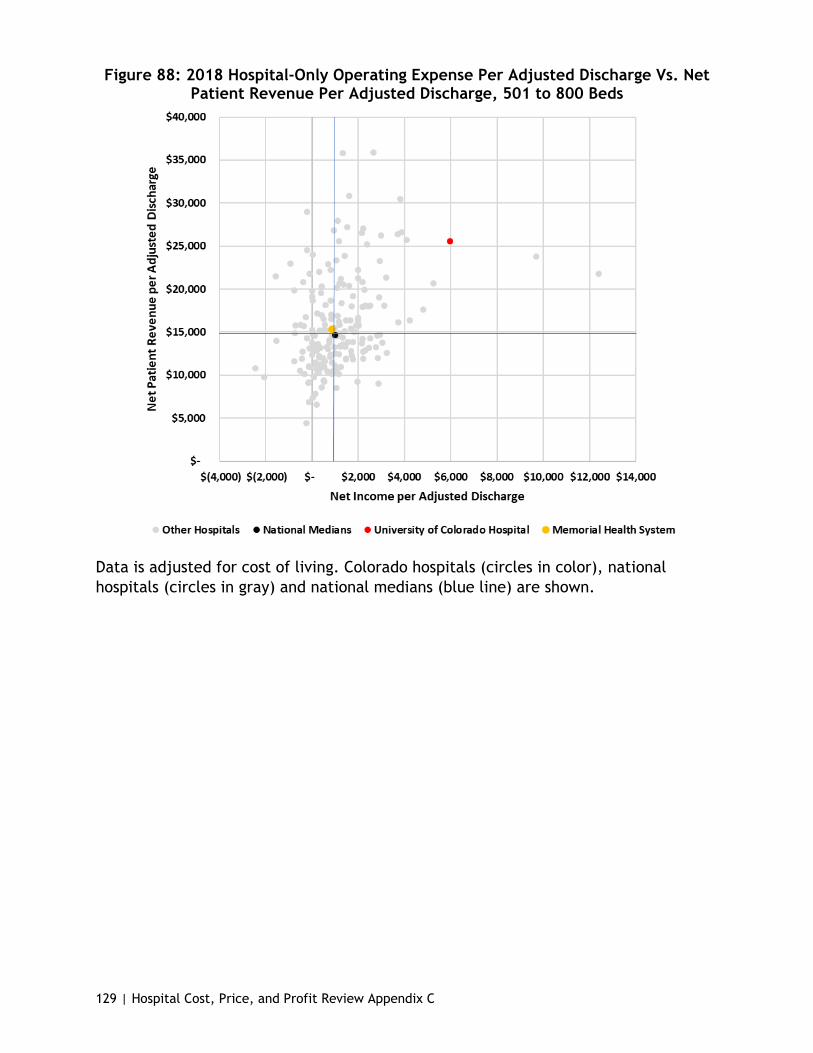
129 | Hospital Cost, Price, and Profit Review Appendix C
Figure 88: 2018 Hospital-Only Operating Expense Per Adjusted Discharge Vs. Net Patient Revenue Per Adjusted Discharge, 501 to 800 Beds
Data is adjusted for cost of living. Colorado hospitals (circles in color), national hospitals (circles in gray) and national medians (blue line) are shown.

130 | Hospital Cost, Price, and Profit Review Appendix C
Figure 89: 2018 Total Operating Expense Per Adjusted Discharge Vs. Net Income Per Adjusted Discharge, 501 to 800 Beds
Data is adjusted for cost of living. Colorado hospitals (circles in color), national hospitals (circles in gray) and national medians (blue line) are shown.
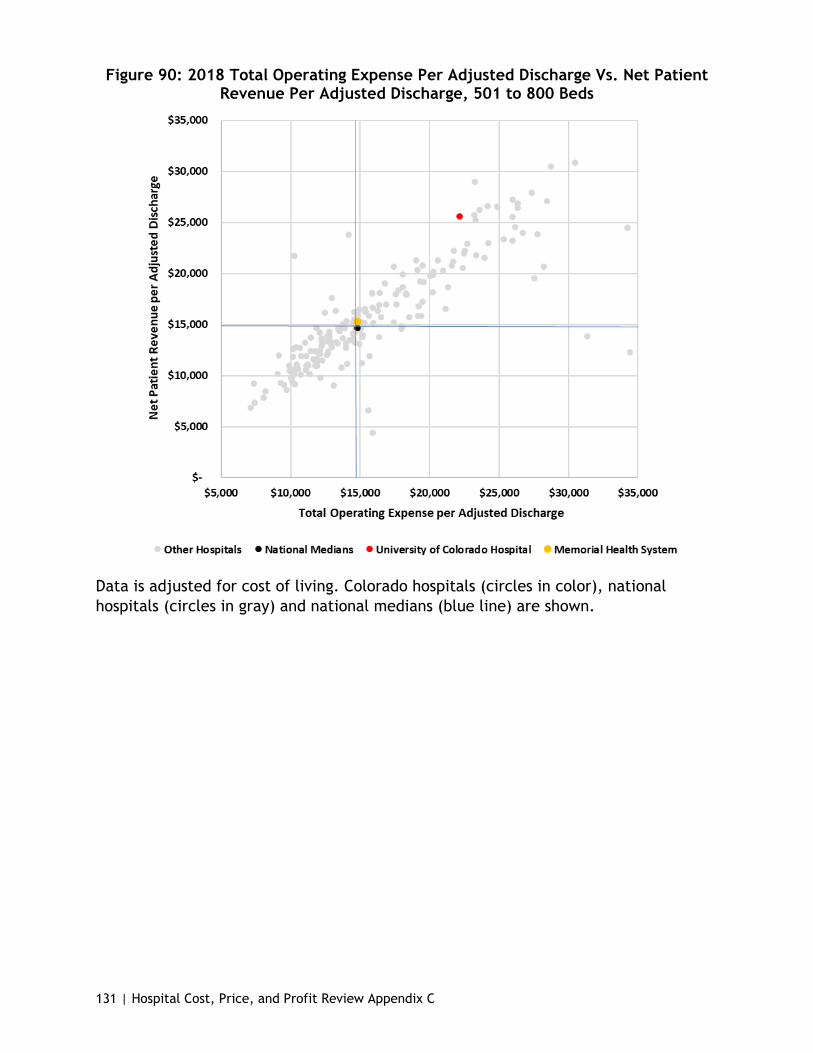
131 | Hospital Cost, Price, and Profit Review Appendix C
Figure 90: 2018 Total Operating Expense Per Adjusted Discharge Vs. Net Patient Revenue Per Adjusted Discharge, 501 to 800 Beds
Data is adjusted for cost of living. Colorado hospitals (circles in color), national hospitals (circles in gray) and national medians (blue line) are shown.
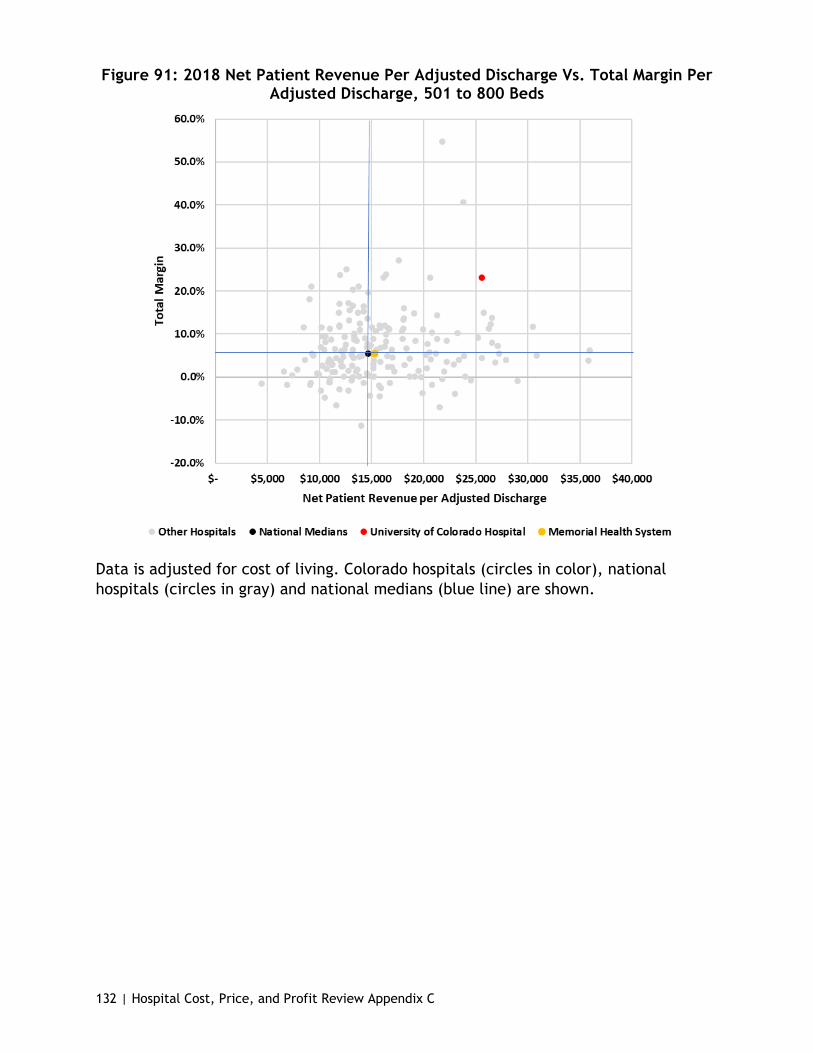
132 | Hospital Cost, Price, and Profit Review Appendix C
Figure 91: 2018 Net Patient Revenue Per Adjusted Discharge Vs. Total Margin Per Adjusted Discharge, 501 to 800 Beds
Data is adjusted for cost of living. Colorado hospitals (circles in color), national hospitals (circles in gray) and national medians (blue line) are shown.
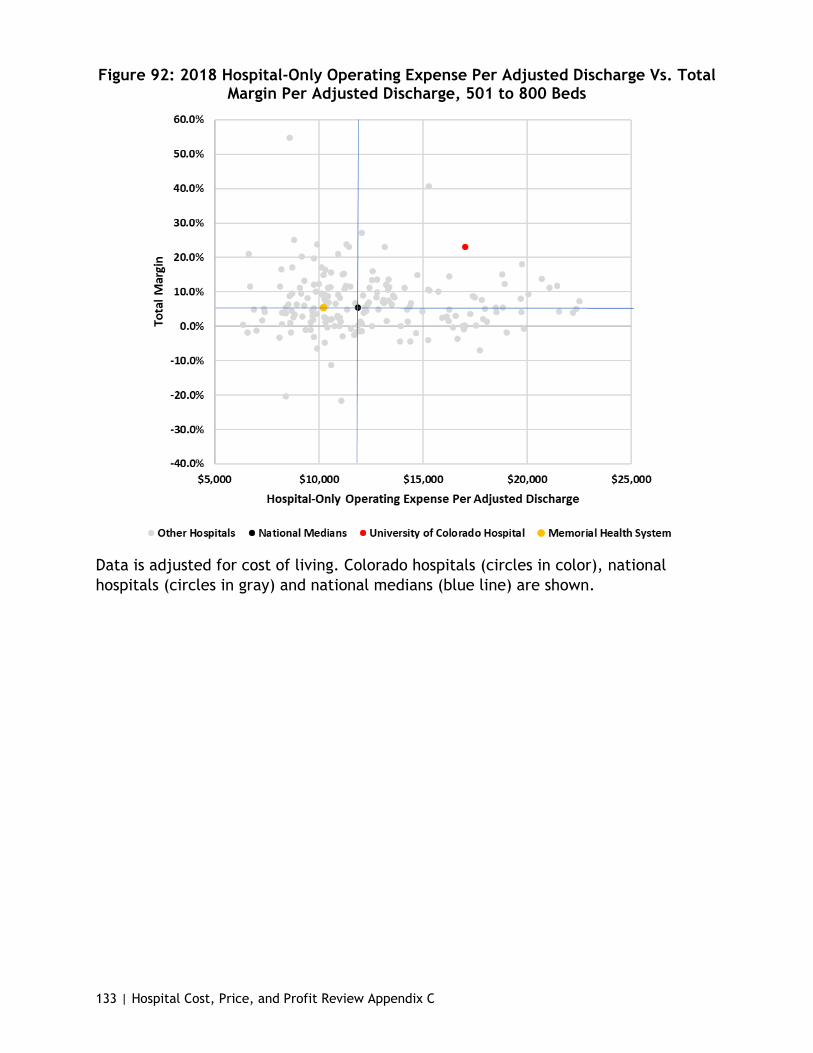
133 | Hospital Cost, Price, and Profit Review Appendix C
Figure 92: 2018 Hospital-Only Operating Expense Per Adjusted Discharge Vs. Total Margin Per Adjusted Discharge, 501 to 800 Beds
Data is adjusted for cost of living. Colorado hospitals (circles in color), national hospitals (circles in gray) and national medians (blue line) are shown.

134 | Hospital Cost, Price, and Profit Review Appendix C
Figure 93: 2018 Total Operating Expense Per Adjusted Discharge Vs. Total Margin Per Adjusted Discharge, 501 to 800 Beds
Data is adjusted for cost of living. Colorado hospitals (circles in color), national hospitals (circles in gray) and national medians (blue line) are shown.
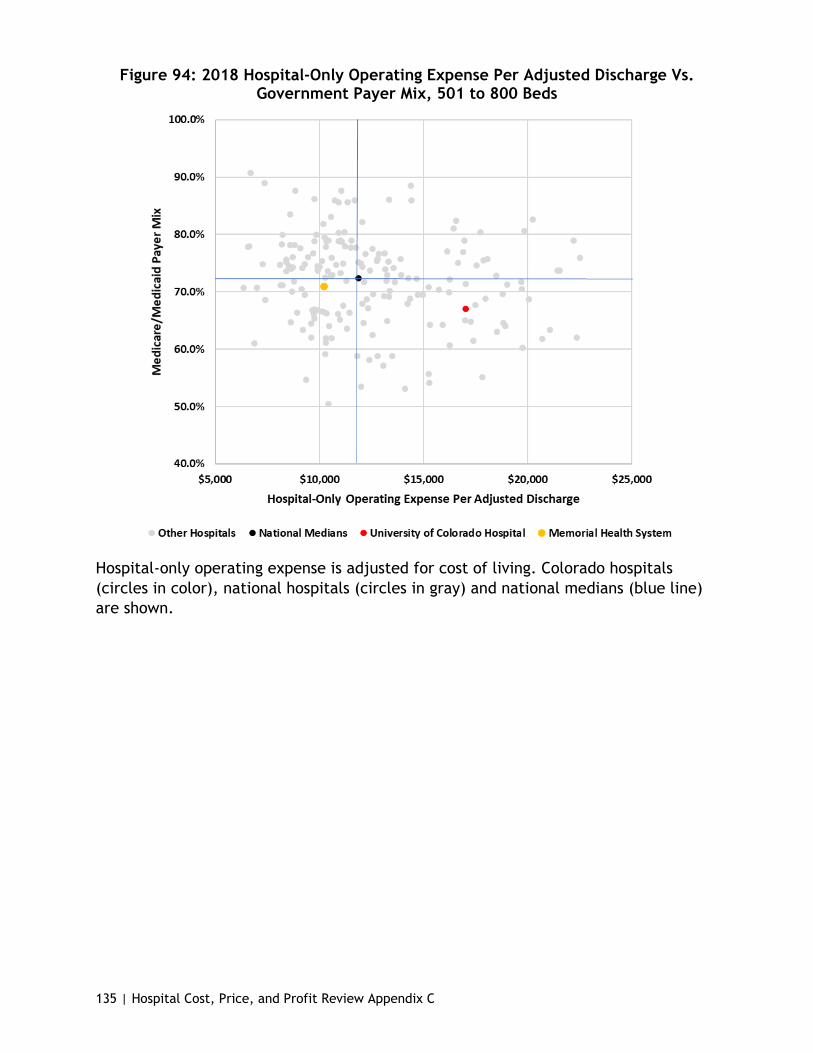
135 | Hospital Cost, Price, and Profit Review Appendix C
Figure 94: 2018 Hospital-Only Operating Expense Per Adjusted Discharge Vs. Government Payer Mix, 501 to 800 Beds
Hospital-only operating expense is adjusted for cost of living. Colorado hospitals (circles in color), national hospitals (circles in gray) and national medians (blue line) are shown.
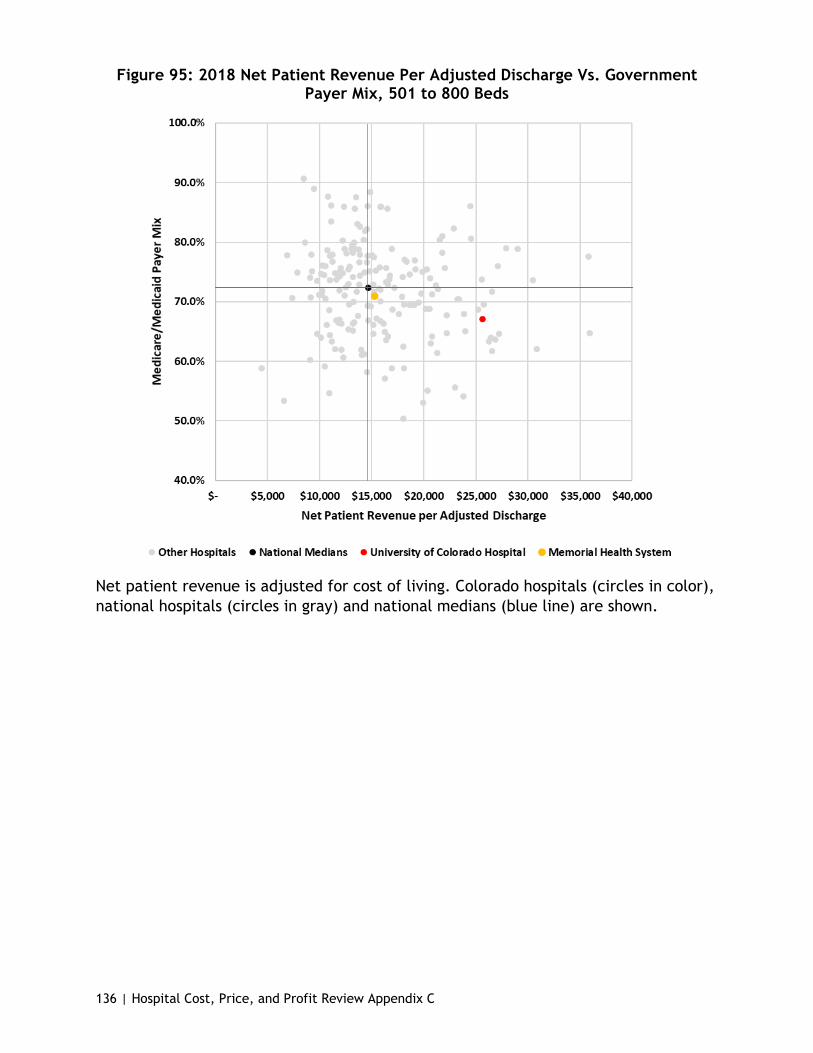
136 | Hospital Cost, Price, and Profit Review Appendix C
Figure 95: 2018 Net Patient Revenue Per Adjusted Discharge Vs. Government Payer Mix, 501 to 800 Beds
Net patient revenue is adjusted for cost of living. Colorado hospitals (circles in color), national hospitals (circles in gray) and national medians (blue line) are shown.

137 | Hospital Cost, Price, and Profit Review Appendix C
Teaching Hospitals
Figure 96: 2018 Hospital-Only Operating Expense Per Adjusted Discharge Vs. Net Income Per Adjusted Discharge, Teaching Hospitals
Data is adjusted for cost of living. Colorado hospitals (circle in color), national hospitals (circles in gray) and national medians (blue line) are shown.
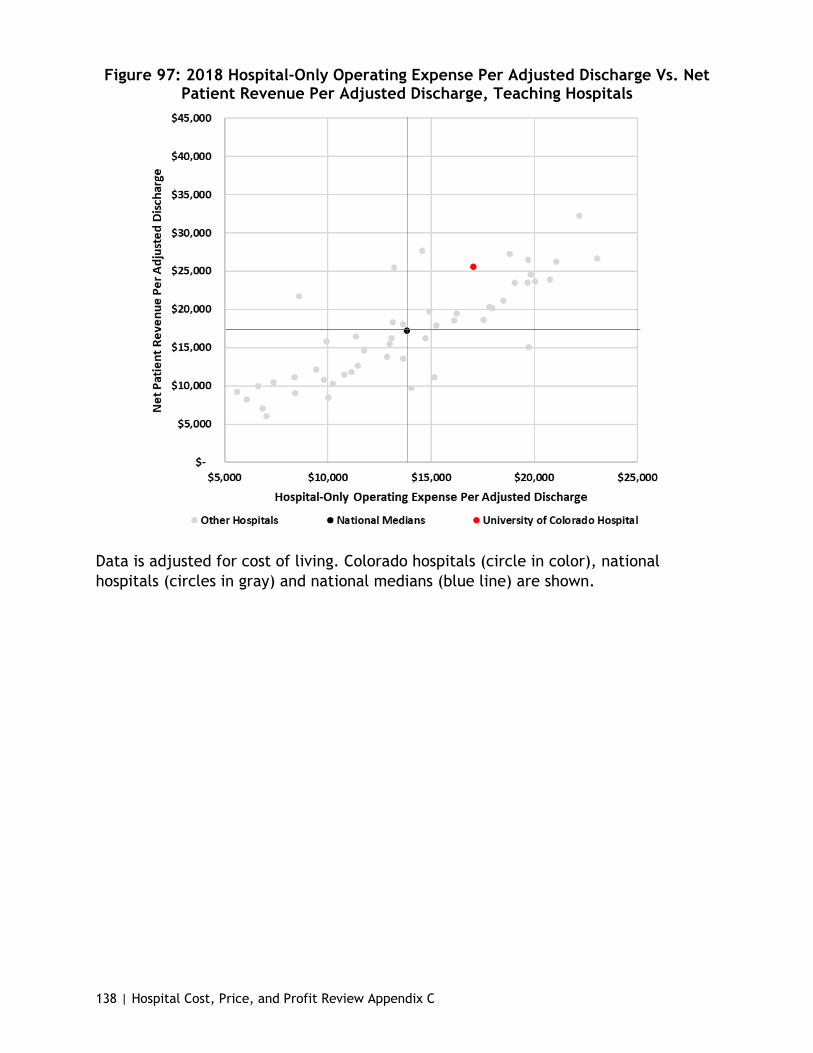
138 | Hospital Cost, Price, and Profit Review Appendix C
Figure 97: 2018 Hospital-Only Operating Expense Per Adjusted Discharge Vs. Net Patient Revenue Per Adjusted Discharge, Teaching Hospitals
Data is adjusted for cost of living. Colorado hospitals (circle in color), national hospitals (circles in gray) and national medians (blue line) are shown.
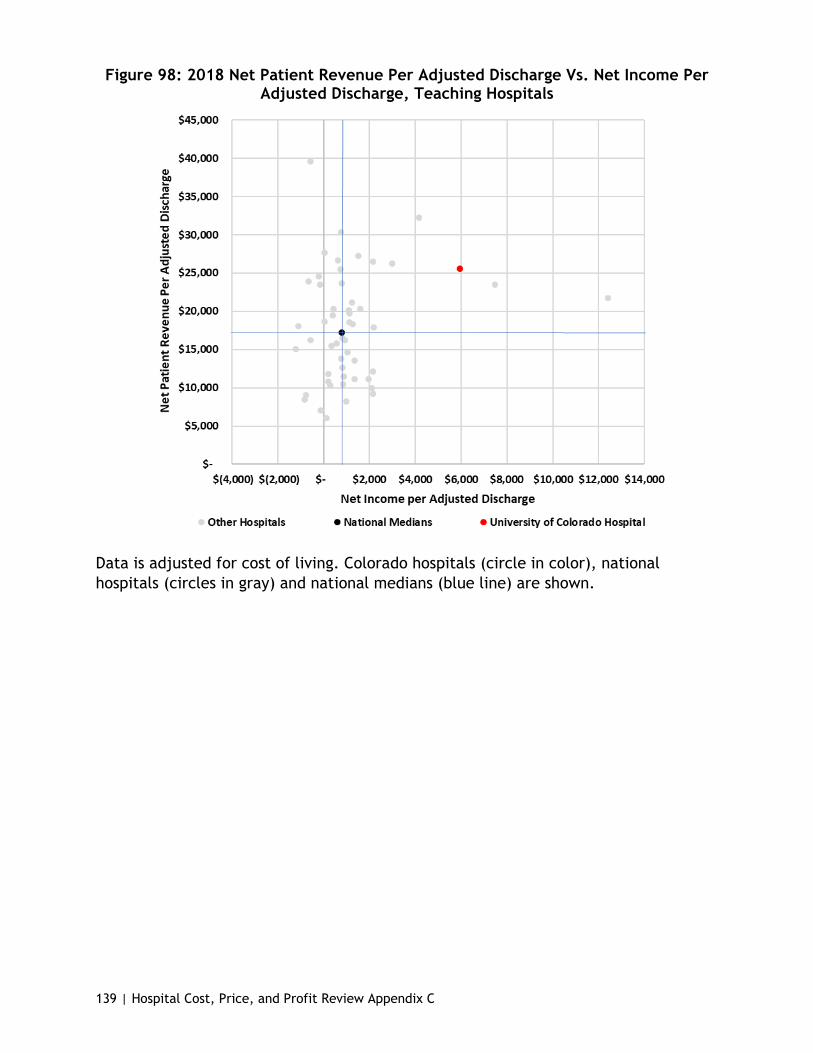
139 | Hospital Cost, Price, and Profit Review Appendix C
Figure 98: 2018 Net Patient Revenue Per Adjusted Discharge Vs. Net Income Per Adjusted Discharge, Teaching Hospitals
Data is adjusted for cost of living. Colorado hospitals (circle in color), national hospitals (circles in gray) and national medians (blue line) are shown.
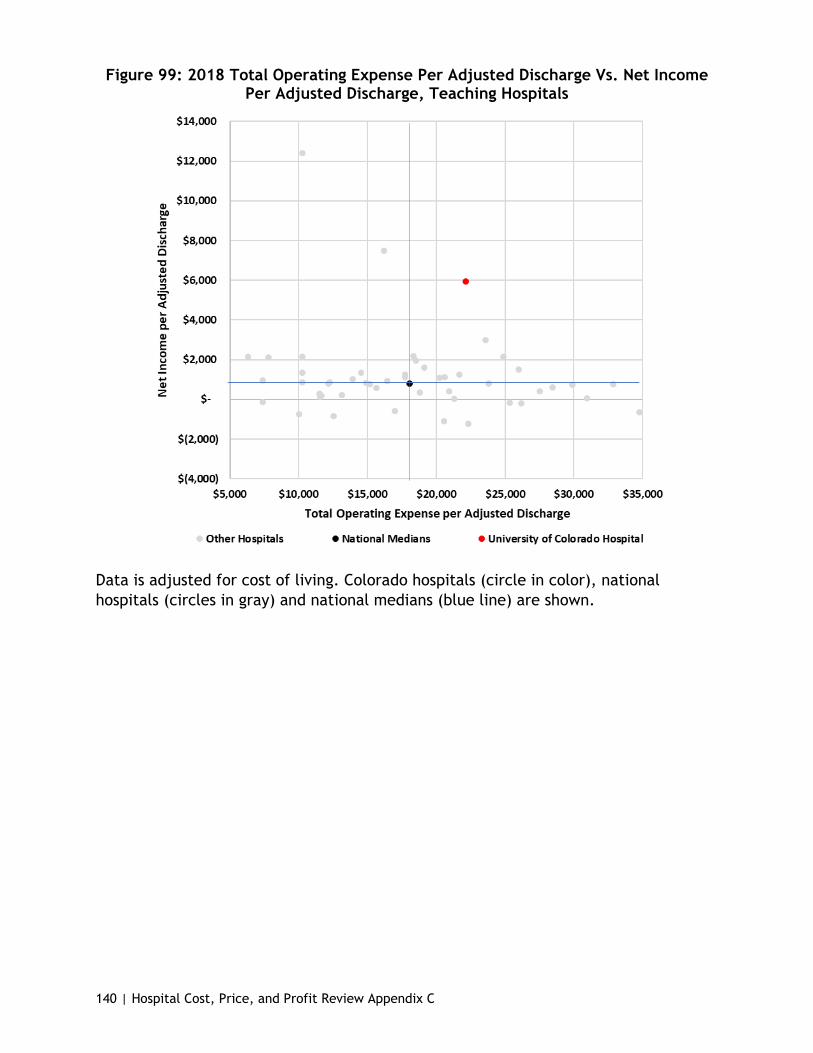
140 | Hospital Cost, Price, and Profit Review Appendix C
Figure 99: 2018 Total Operating Expense Per Adjusted Discharge Vs. Net Income Per Adjusted Discharge, Teaching Hospitals
Data is adjusted for cost of living. Colorado hospitals (circle in color), national hospitals (circles in gray) and national medians (blue line) are shown.

141 | Hospital Cost, Price, and Profit Review Appendix C
Figure 100: 2018 Total Operating Expense Per Adjusted Discharge Vs. Net Patient Revenue Per Adjusted Discharge, Teaching Hospitals
Data is adjusted for cost of living. Colorado hospitals (circle in color), national hospitals (circles in gray) and national medians (blue line) are shown.

142 | Hospital Cost, Price, and Profit Review Appendix C
Figure 101: 2018 Net Patient Revenue Per Adjusted Discharge Vs. Total Margin Per Adjusted Discharge, Teaching Hospitals
Data is adjusted for cost of living. Colorado hospitals (circle in color), national hospitals (circles in gray) and national medians (blue line) are shown.

143 | Hospital Cost, Price, and Profit Review Appendix C
Figure 102: 2018 Hospital-Only Operating Expense Per Adjusted Discharge Vs. Total Margin Per Adjusted Discharge, Teaching Hospitals
Data is adjusted for cost of living. Colorado hospitals (circle in color), national hospitals (circles in gray) and national medians (blue line) are shown.
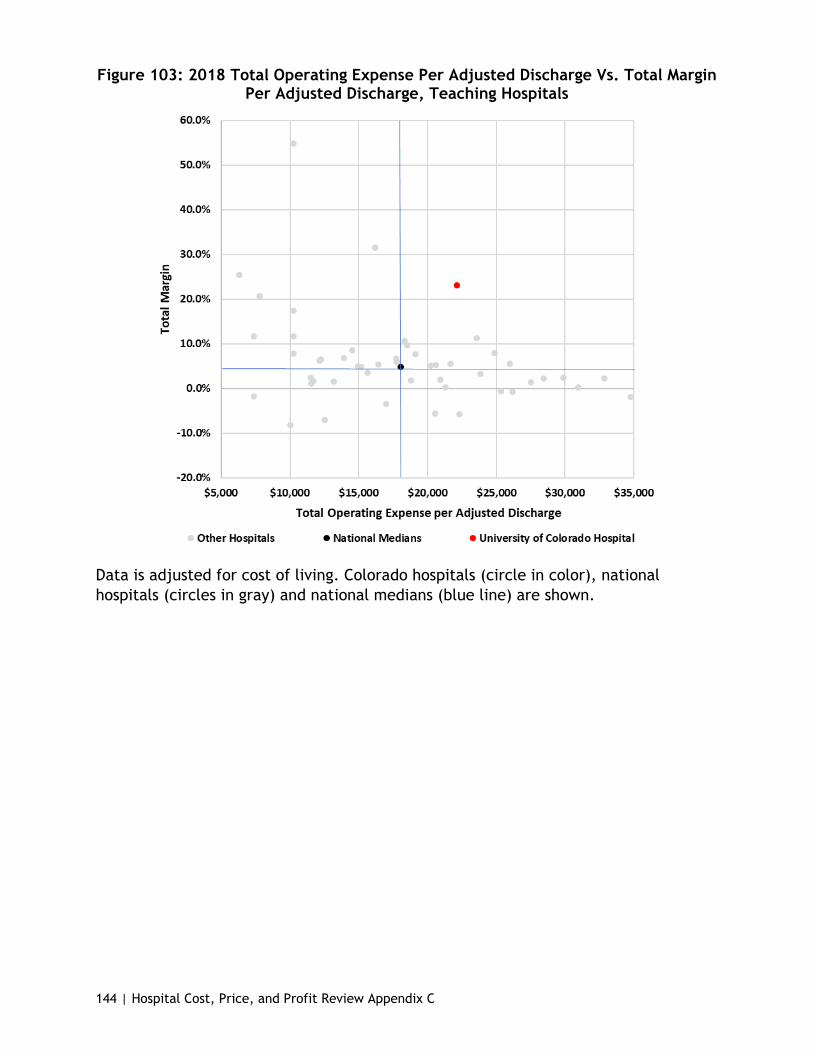
144 | Hospital Cost, Price, and Profit Review Appendix C
Figure 103: 2018 Total Operating Expense Per Adjusted Discharge Vs. Total Margin Per Adjusted Discharge, Teaching Hospitals
Data is adjusted for cost of living. Colorado hospitals (circle in color), national hospitals (circles in gray) and national medians (blue line) are shown.

145 | Hospital Cost, Price, and Profit Review Appendix C
Figure 104: 2018 Hospital-Only Operating Expense Per Adjusted Discharge Vs. Government Payer Mix, Teaching Hospitals
Hospital-only operating expense is adjusted for cost of living. Colorado hospitals (circle in color), national hospitals (circles in gray) and national medians (blue line) are shown.
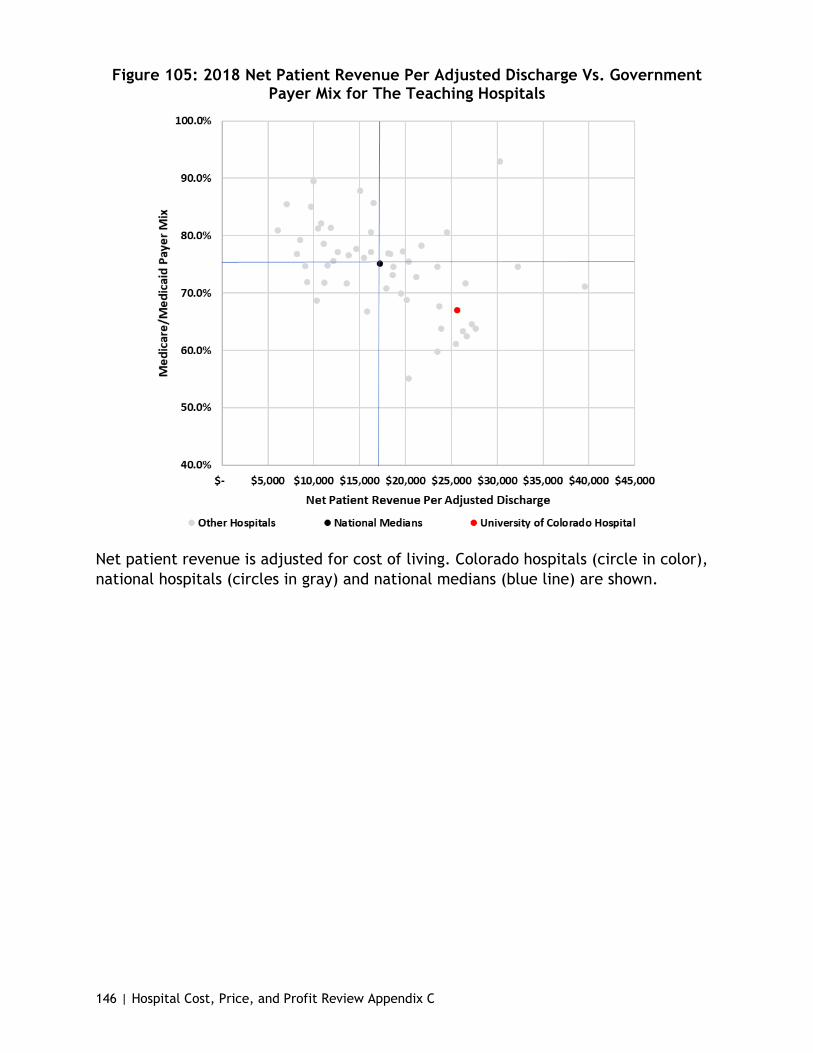
146 | Hospital Cost, Price, and Profit Review Appendix C
Figure 105: 2018 Net Patient Revenue Per Adjusted Discharge Vs. Government Payer Mix for The Teaching Hospitals
Net patient revenue is adjusted for cost of living. Colorado hospitals (circle in color), national hospitals (circles in gray) and national medians (blue line) are shown.
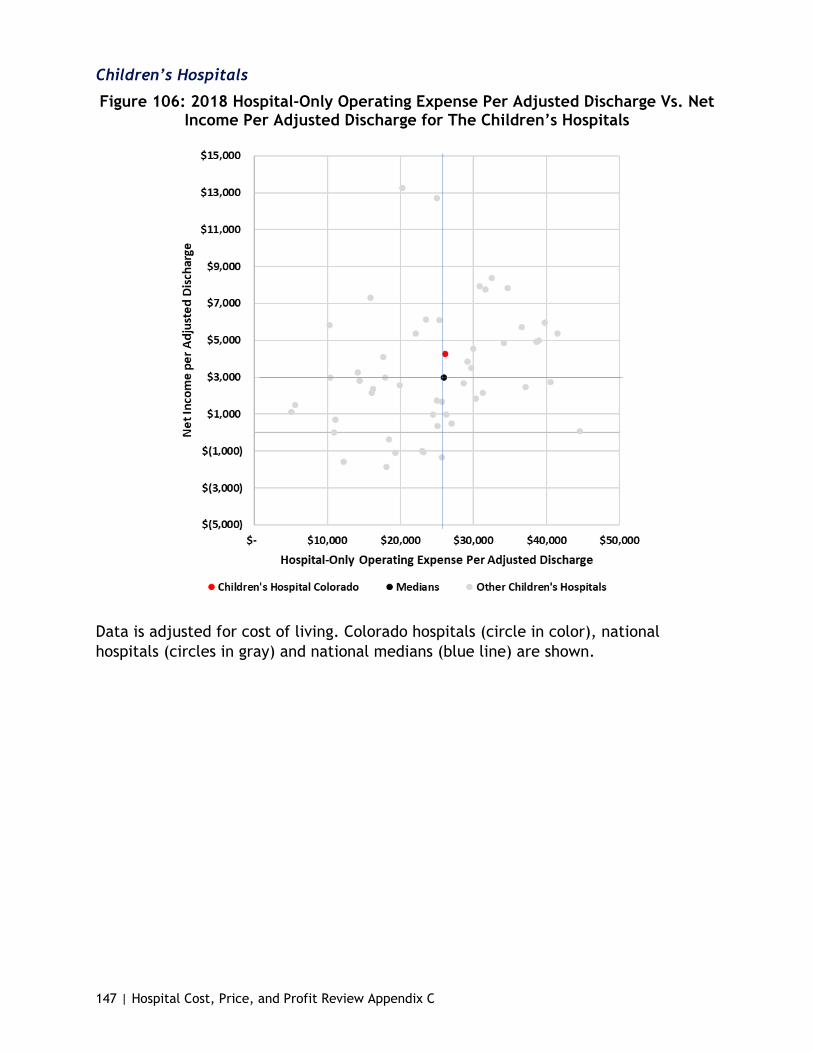
147 | Hospital Cost, Price, and Profit Review Appendix C
Children’s Hospitals
Figure 106: 2018 Hospital-Only Operating Expense Per Adjusted Discharge Vs. Net Income Per Adjusted Discharge for The Children’s Hospitals
Data is adjusted for cost of living. Colorado hospitals (circle in color), national hospitals (circles in gray) and national medians (blue line) are shown.
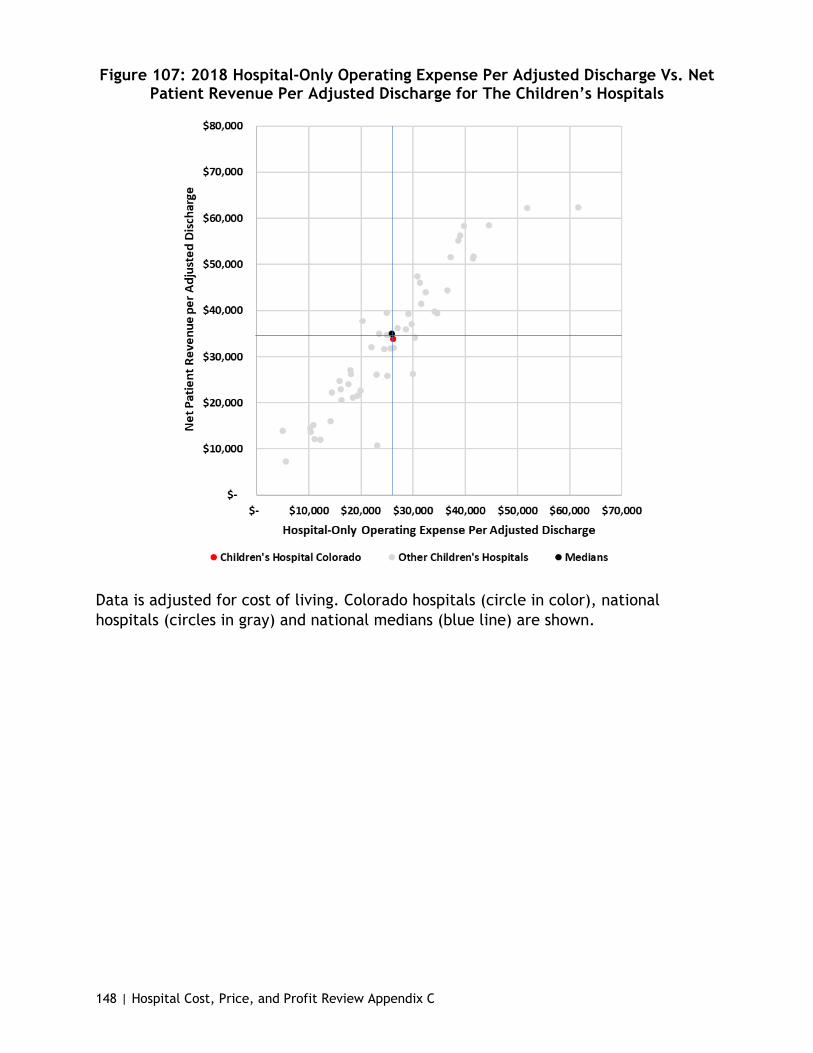
148 | Hospital Cost, Price, and Profit Review Appendix C
Figure 107: 2018 Hospital-Only Operating Expense Per Adjusted Discharge Vs. Net Patient Revenue Per Adjusted Discharge for The Children’s Hospitals
Data is adjusted for cost of living. Colorado hospitals (circle in color), national hospitals (circles in gray) and national medians (blue line) are shown.
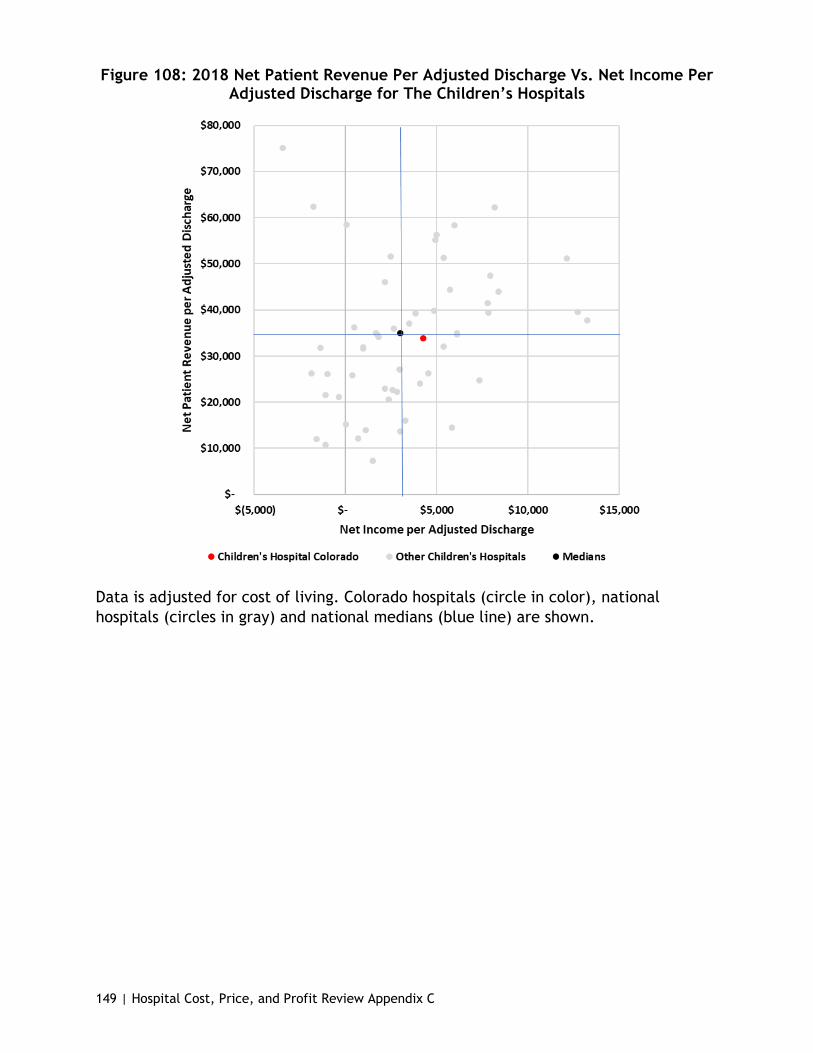
149 | Hospital Cost, Price, and Profit Review Appendix C
Figure 108: 2018 Net Patient Revenue Per Adjusted Discharge Vs. Net Income Per Adjusted Discharge for The Children’s Hospitals
Data is adjusted for cost of living. Colorado hospitals (circle in color), national hospitals (circles in gray) and national medians (blue line) are shown.

150 | Hospital Cost, Price, and Profit Review Appendix C
Figure 109: 2018 Total Operating Expense Per Adjusted Discharge Vs. Net Income Per Adjusted Discharge for The Children’s Hospitals
Data is adjusted for cost of living. Colorado hospitals (circle in color), national hospitals (circles in gray) and national medians (blue line) are shown.
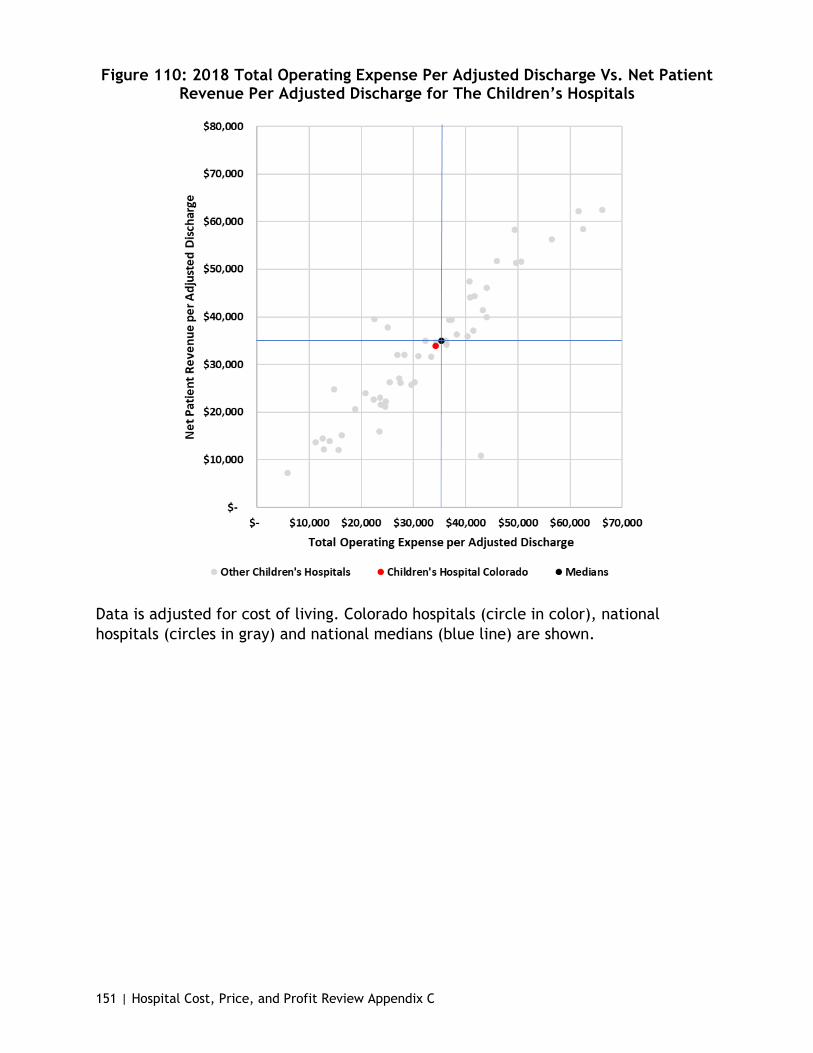
151 | Hospital Cost, Price, and Profit Review Appendix C
Figure 110: 2018 Total Operating Expense Per Adjusted Discharge Vs. Net Patient Revenue Per Adjusted Discharge for The Children’s Hospitals
Data is adjusted for cost of living. Colorado hospitals (circle in color), national hospitals (circles in gray) and national medians (blue line) are shown.
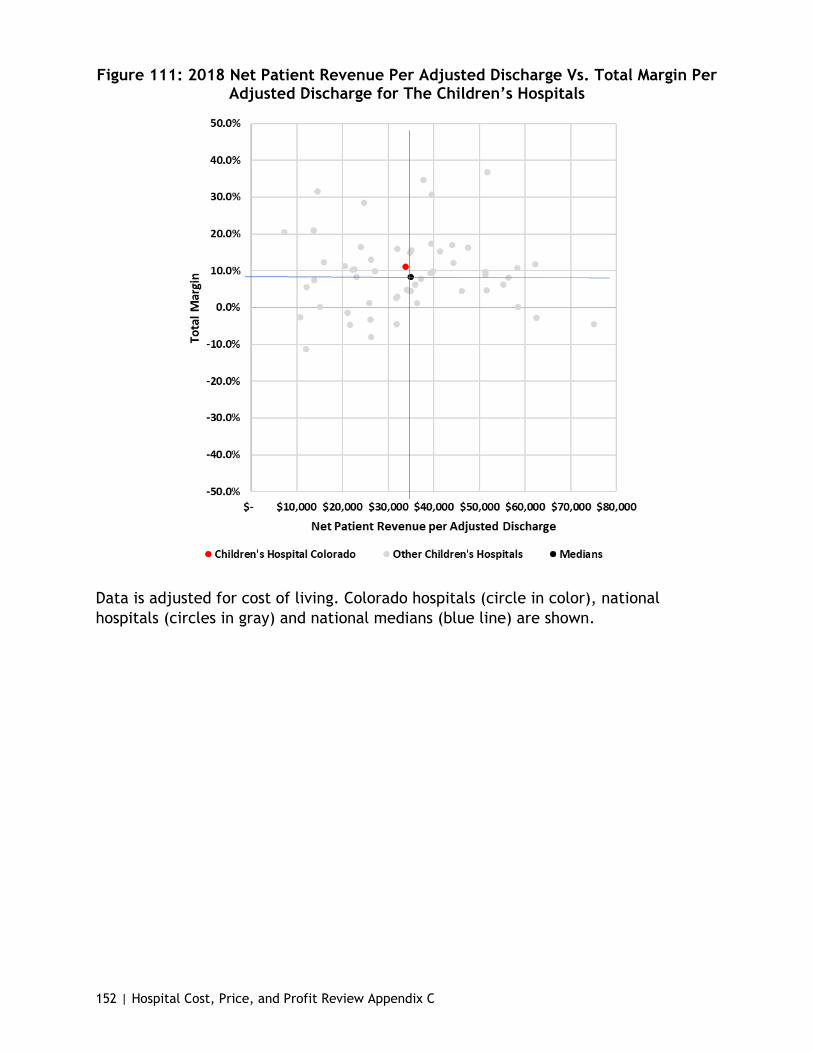
152 | Hospital Cost, Price, and Profit Review Appendix C
Figure 111: 2018 Net Patient Revenue Per Adjusted Discharge Vs. Total Margin Per Adjusted Discharge for The Children’s Hospitals
Data is adjusted for cost of living. Colorado hospitals (circle in color), national hospitals (circles in gray) and national medians (blue line) are shown.
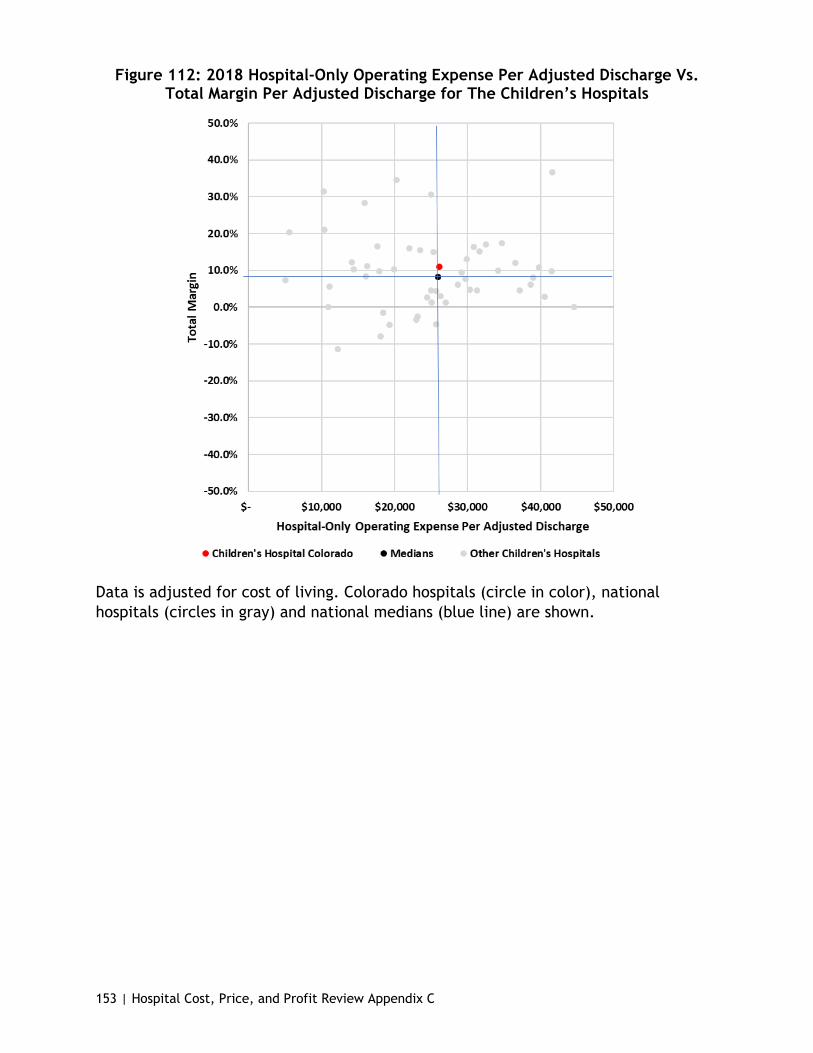
153 | Hospital Cost, Price, and Profit Review Appendix C
Figure 112: 2018 Hospital-Only Operating Expense Per Adjusted Discharge Vs. Total Margin Per Adjusted Discharge for The Children’s Hospitals
Data is adjusted for cost of living. Colorado hospitals (circle in color), national hospitals (circles in gray) and national medians (blue line) are shown.
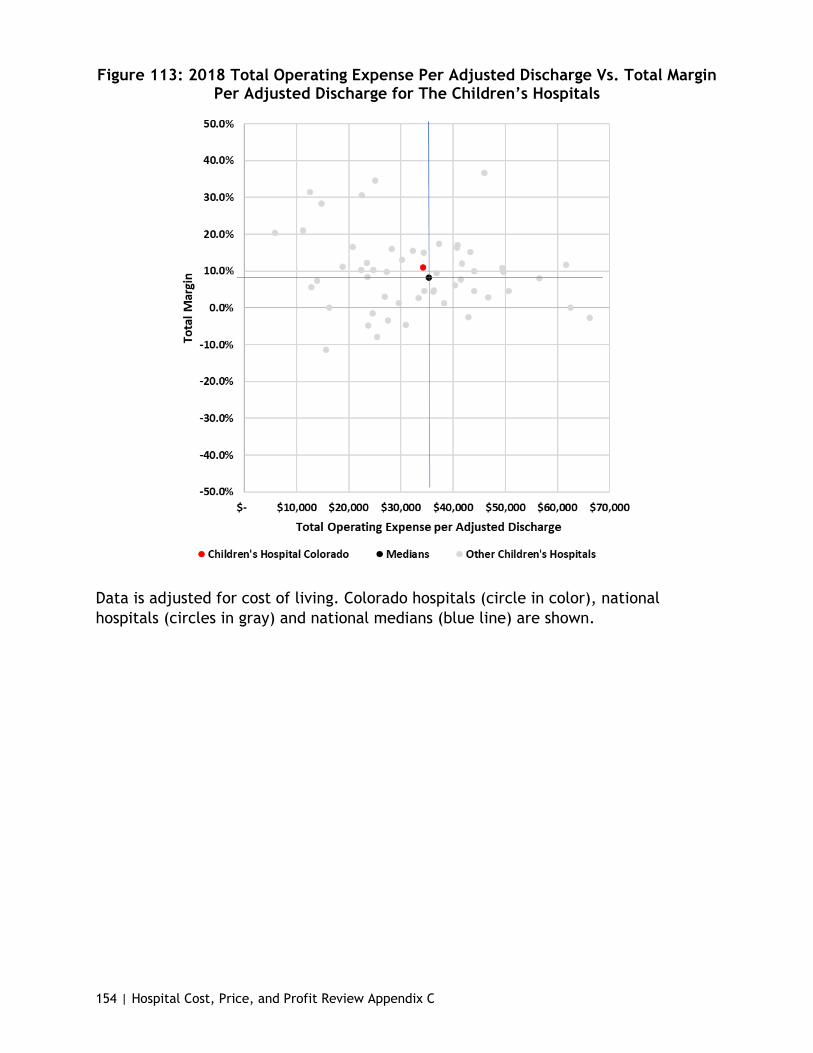
154 | Hospital Cost, Price, and Profit Review Appendix C
Figure 113: 2018 Total Operating Expense Per Adjusted Discharge Vs. Total Margin Per Adjusted Discharge for The Children’s Hospitals
Data is adjusted for cost of living. Colorado hospitals (circle in color), national hospitals (circles in gray) and national medians (blue line) are shown.

155 | Hospital Cost, Price, and Profit Review Appendix C
Figure 114: 2018 Hospital-Only Operating Expense Per Adjusted Discharge Vs. Government Payer Mix for The Children’s Hospitals
Hospital-only operating expense is adjusted for cost of living. Colorado hospitals (circle in color), national hospitals (circles in gray) and national medians (blue line) are shown.
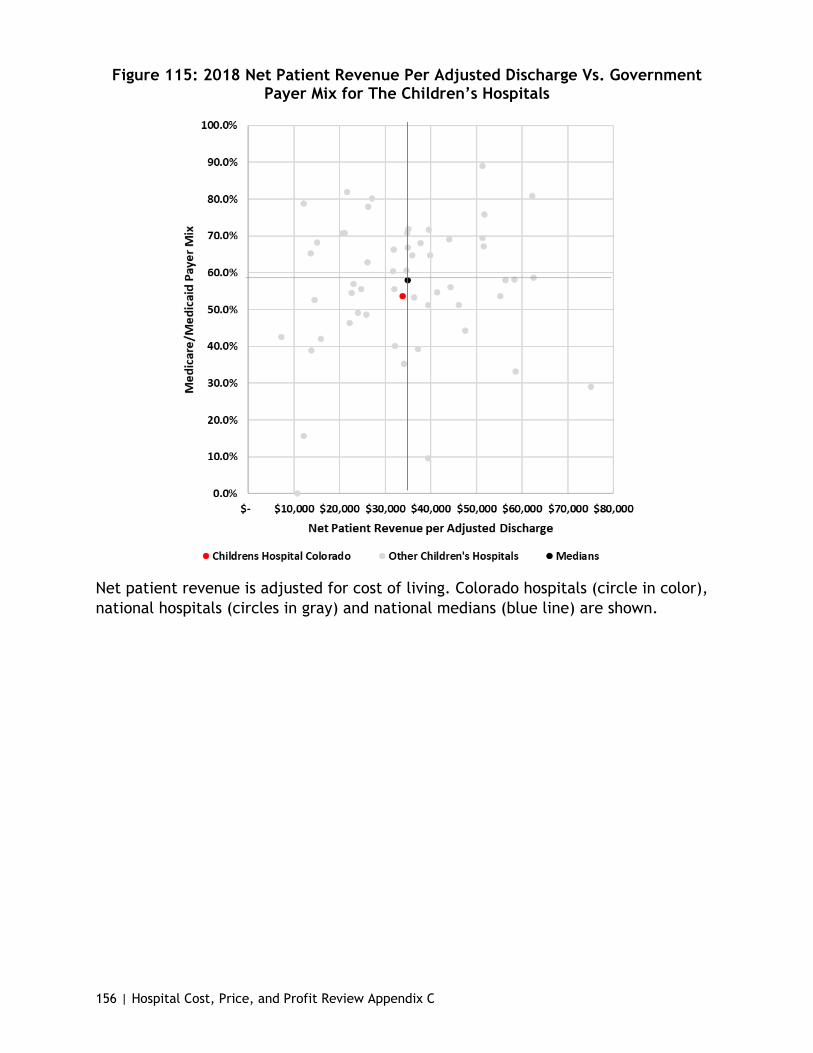
156 | Hospital Cost, Price, and Profit Review Appendix C
Figure 115: 2018 Net Patient Revenue Per Adjusted Discharge Vs. Government Payer Mix for The Children’s Hospitals
Net patient revenue is adjusted for cost of living. Colorado hospitals (circle in color), national hospitals (circles in gray) and national medians (blue line) are shown.

157 | Hospital Cost, Price, and Profit Review Appendix C
Changes to National Medians and Colorado from 2009-2018
26 to 100 Bed Peer Group
Figure 116: Changes to the National Medians and Colorado from 2009 to 2018 for Hospital-Only Operating Expense and Net Income, 26 to 100 Beds
Figure 117: Changes to the National Medians and Colorado from 2009 to 2018 for Total Operating Expense and Net Income, 26 to 100 Beds
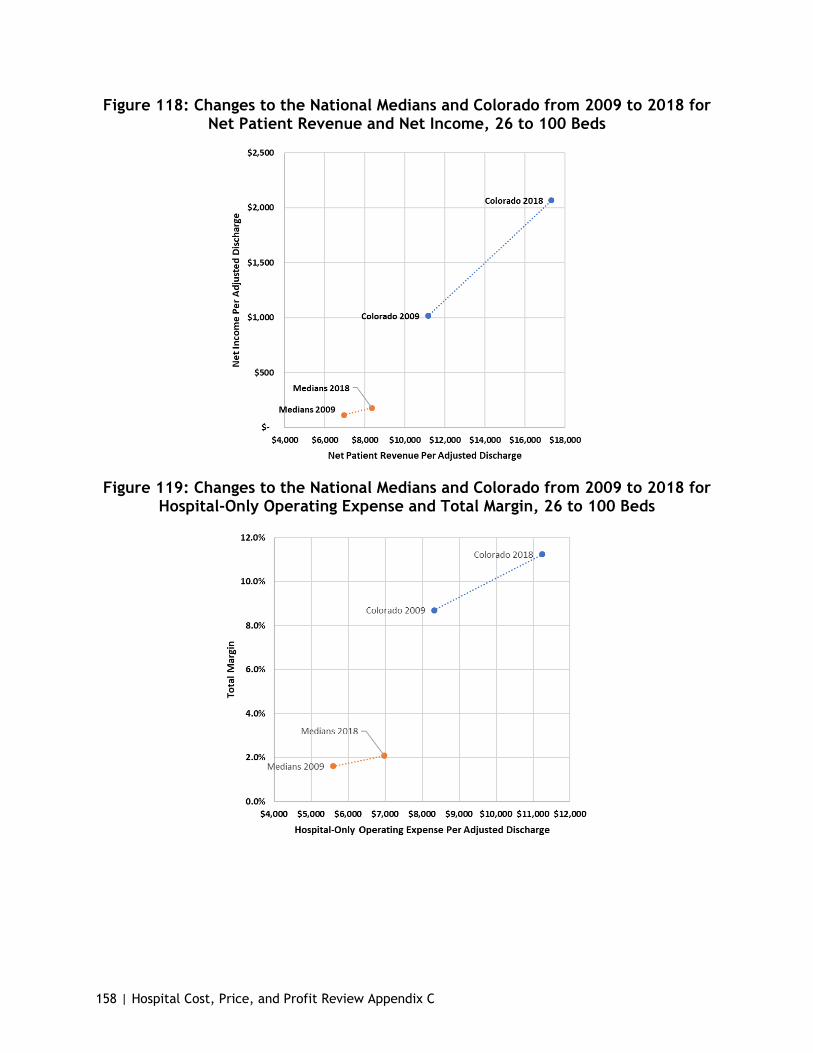
158 | Hospital Cost, Price, and Profit Review Appendix C
Figure 118: Changes to the National Medians and Colorado from 2009 to 2018 for Net Patient Revenue and Net Income, 26 to 100 Beds
Figure 119: Changes to the National Medians and Colorado from 2009 to 2018 for Hospital-Only Operating Expense and Total Margin, 26 to 100 Beds
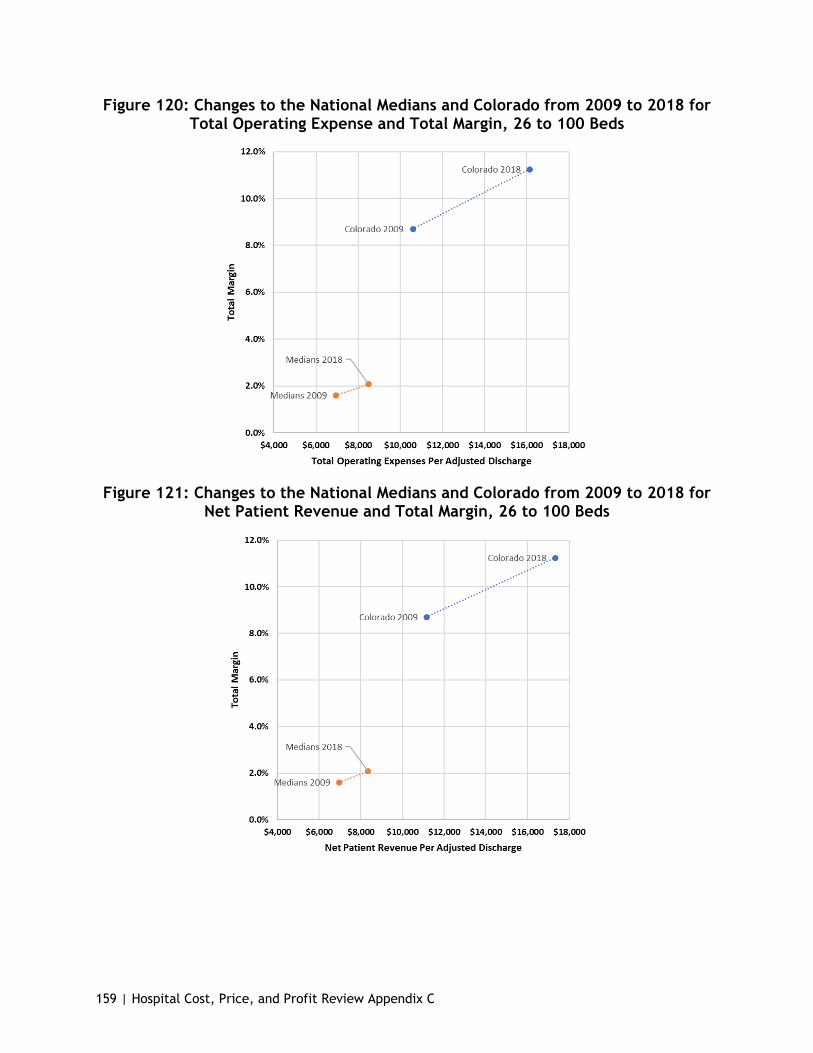
159 | Hospital Cost, Price, and Profit Review Appendix C
Figure 120: Changes to the National Medians and Colorado from 2009 to 2018 for Total Operating Expense and Total Margin, 26 to 100 Beds
Figure 121: Changes to the National Medians and Colorado from 2009 to 2018 for Net Patient Revenue and Total Margin, 26 to 100 Beds

160 | Hospital Cost, Price, and Profit Review Appendix C
Figure 122: Changes to the National Medians and Colorado from 2009 to 2018 for Hospital-Only Operating Expense and Net Patient Revenue, 26 to 100 Beds
Figure 123: Changes to the National Medians and Colorado from 2009 to 2018 for Total Operating Expense and Net Patient Revenue, 26 to 100 Beds

161 | Hospital Cost, Price, and Profit Review Appendix C
101 to 300 Bed Peer Group
Figure 124: Changes to the National Medians and Colorado from 2009 to 2018 for Hospital-Only Operating Expense and Net Income, 101 to 300 Beds
Figure 125: Changes to the National Medians and Colorado from 2009 to 2018 for Total Operating Expense and Net Income, 101 to 300 Beds
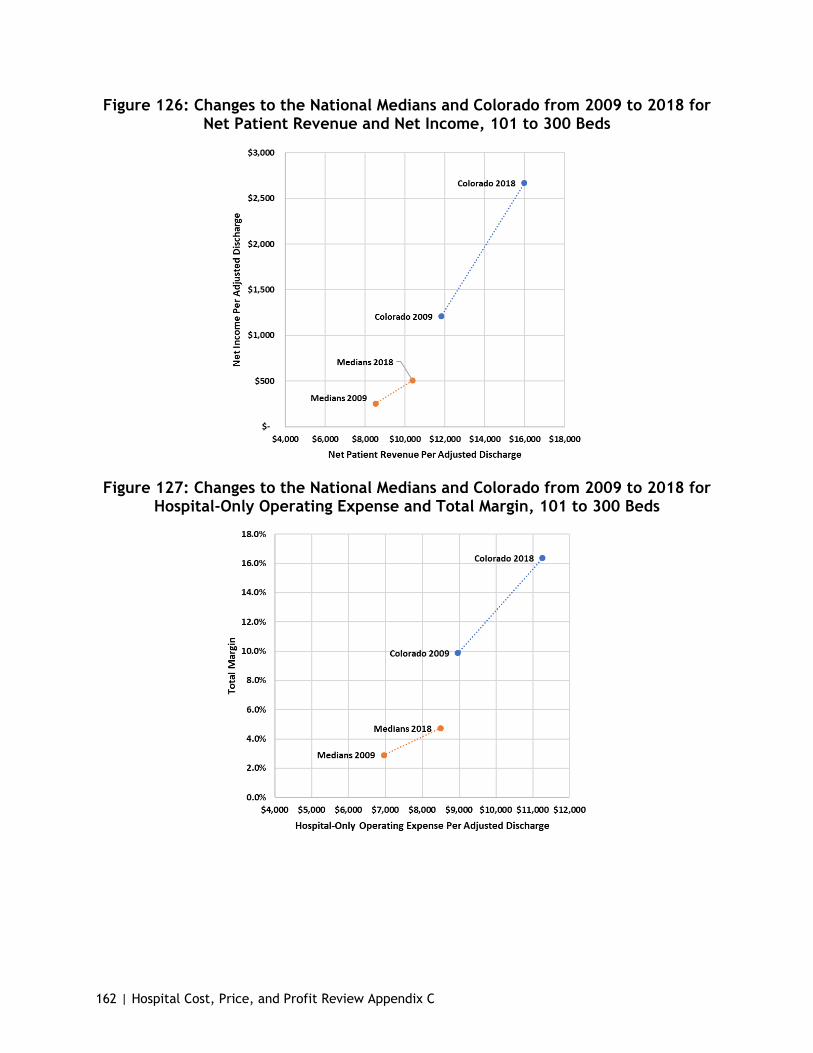
162 | Hospital Cost, Price, and Profit Review Appendix C
Figure 126: Changes to the National Medians and Colorado from 2009 to 2018 for Net Patient Revenue and Net Income, 101 to 300 Beds
Figure 127: Changes to the National Medians and Colorado from 2009 to 2018 for Hospital-Only Operating Expense and Total Margin, 101 to 300 Beds

163 | Hospital Cost, Price, and Profit Review Appendix C
Figure 128: Changes to the National Medians and Colorado from 2009 to 2018 for Total Operating Expense and Total Margin, 101 to 300 Beds
Figure 129: Changes to the National Medians and Colorado from 2009 to 2018 for Net Patient Revenue and Total Margin, 101 to 300 Beds

164 | Hospital Cost, Price, and Profit Review Appendix C
Figure 130: Changes to the National Medians and Colorado from 2009 to 2018 for Total Operating Expense and Net Patient Revenue, 101 to 300 Beds
301 to 500 Bed Peer Group
Figure 131: Changes to the National Medians and Colorado from 2009 to 2018 for Hospital-Only Operating Expense and Net Income, 301 to 500 Beds
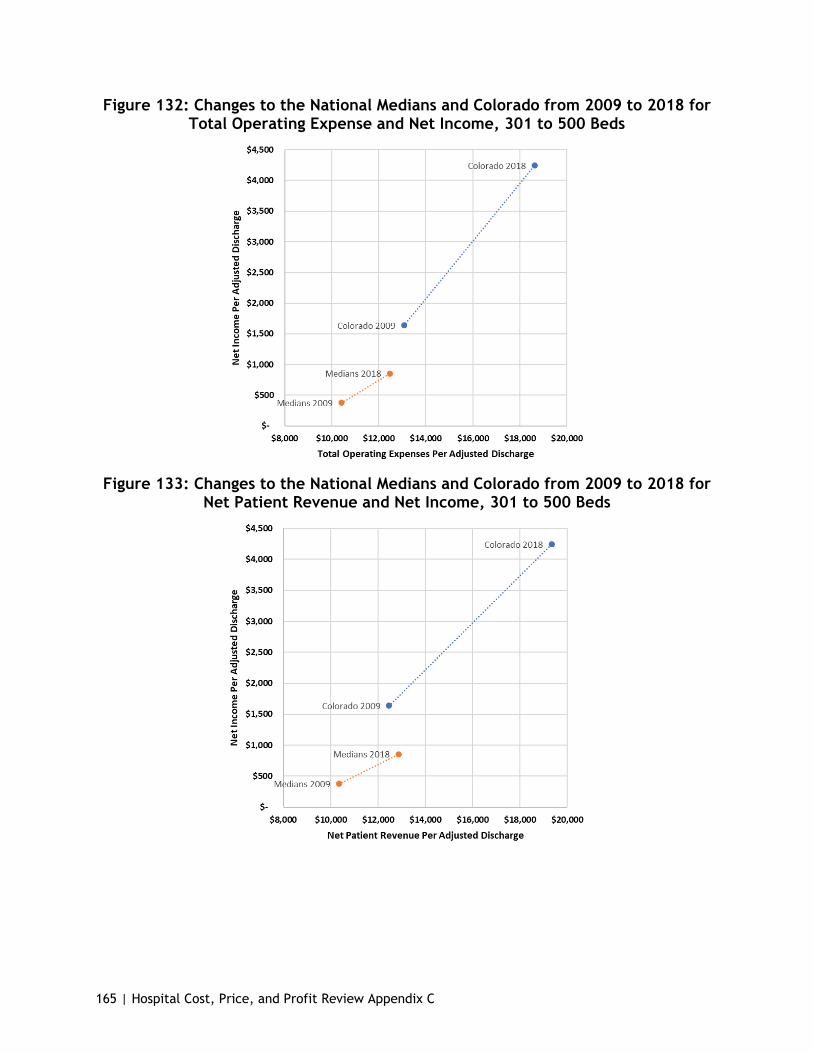
165 | Hospital Cost, Price, and Profit Review Appendix C
Figure 132: Changes to the National Medians and Colorado from 2009 to 2018 for Total Operating Expense and Net Income, 301 to 500 Beds
Figure 133: Changes to the National Medians and Colorado from 2009 to 2018 for Net Patient Revenue and Net Income, 301 to 500 Beds

166 | Hospital Cost, Price, and Profit Review Appendix C
Figure 134: Changes to the National Medians and Colorado from 2009 to 2018 for Hospital-Only Operating Expense and Total Margin, 301 to 500 Beds
Figure 135: Changes to the National Medians and Colorado from 2009 to 2018 for Total Operating Expense and Total Margin, 301 to 500 Beds
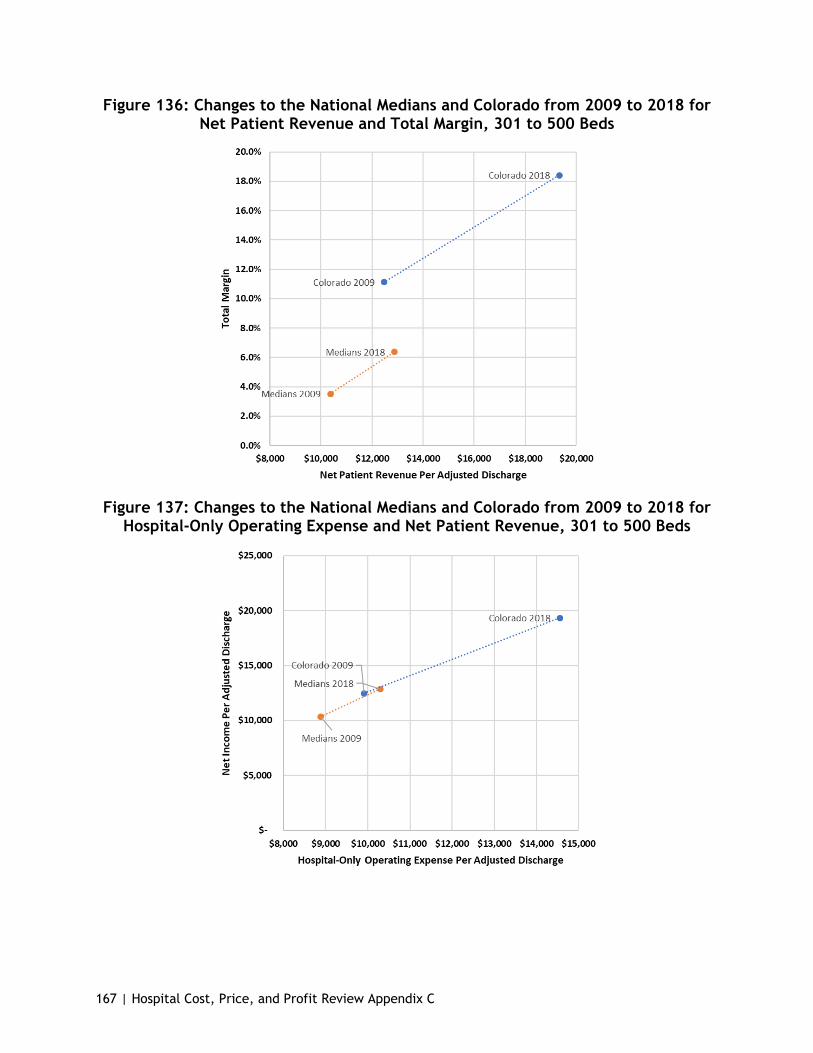
167 | Hospital Cost, Price, and Profit Review Appendix C
Figure 136: Changes to the National Medians and Colorado from 2009 to 2018 for Net Patient Revenue and Total Margin, 301 to 500 Beds
Figure 137: Changes to the National Medians and Colorado from 2009 to 2018 for Hospital-Only Operating Expense and Net Patient Revenue, 301 to 500 Beds
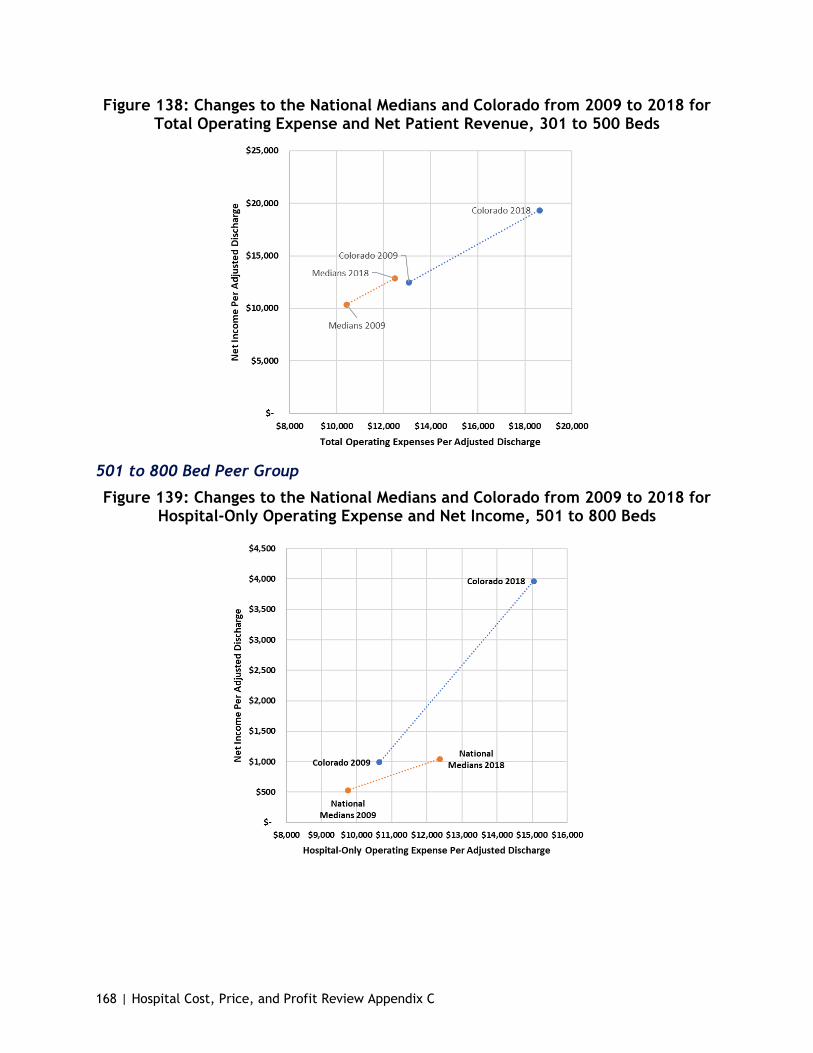
168 | Hospital Cost, Price, and Profit Review Appendix C
Figure 138: Changes to the National Medians and Colorado from 2009 to 2018 for Total Operating Expense and Net Patient Revenue, 301 to 500 Beds
501 to 800 Bed Peer Group
Figure 139: Changes to the National Medians and Colorado from 2009 to 2018 for Hospital-Only Operating Expense and Net Income, 501 to 800 Beds
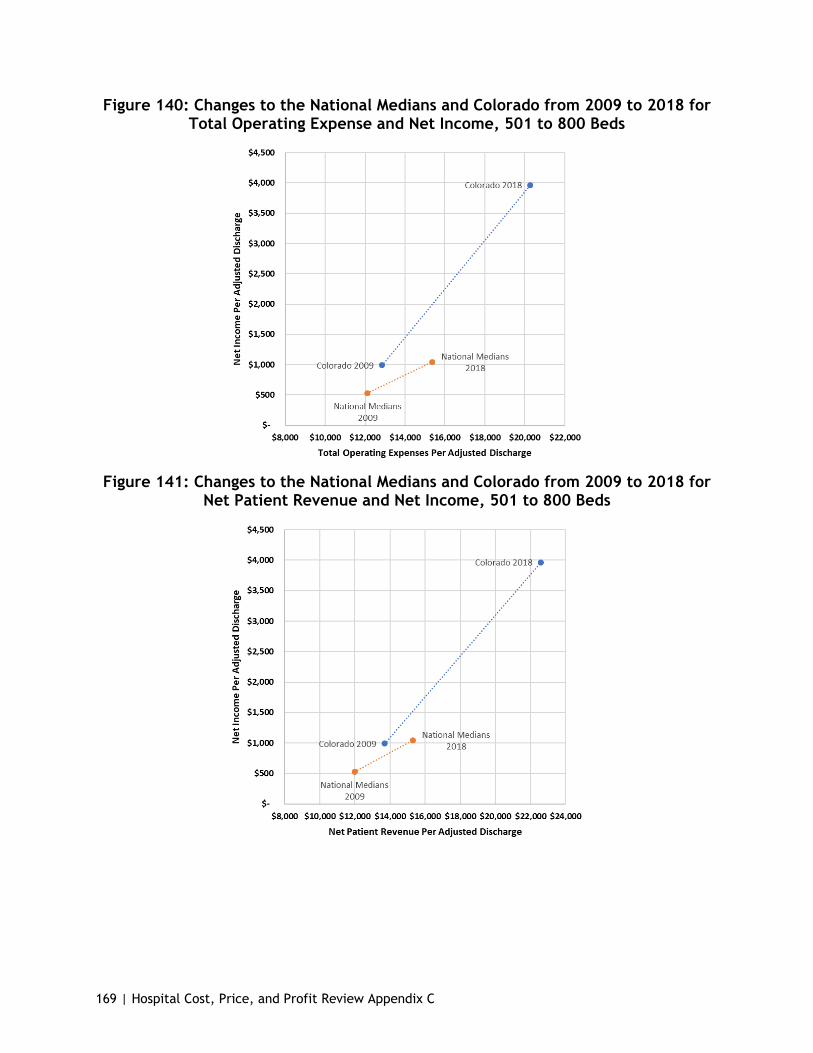
169 | Hospital Cost, Price, and Profit Review Appendix C
Figure 140: Changes to the National Medians and Colorado from 2009 to 2018 for Total Operating Expense and Net Income, 501 to 800 Beds
Figure 141: Changes to the National Medians and Colorado from 2009 to 2018 for Net Patient Revenue and Net Income, 501 to 800 Beds

170 | Hospital Cost, Price, and Profit Review Appendix C
Figure 142: Changes to the National Medians and Colorado from 2009 to 2018 for Hospital-Only Operating Expense and Total Margin, 501 to 800 Beds
Figure 143: Changes to the National Medians and Colorado from 2009 to 2018 for Total Operating Expenses and Total Margin, 501 to 800 Beds
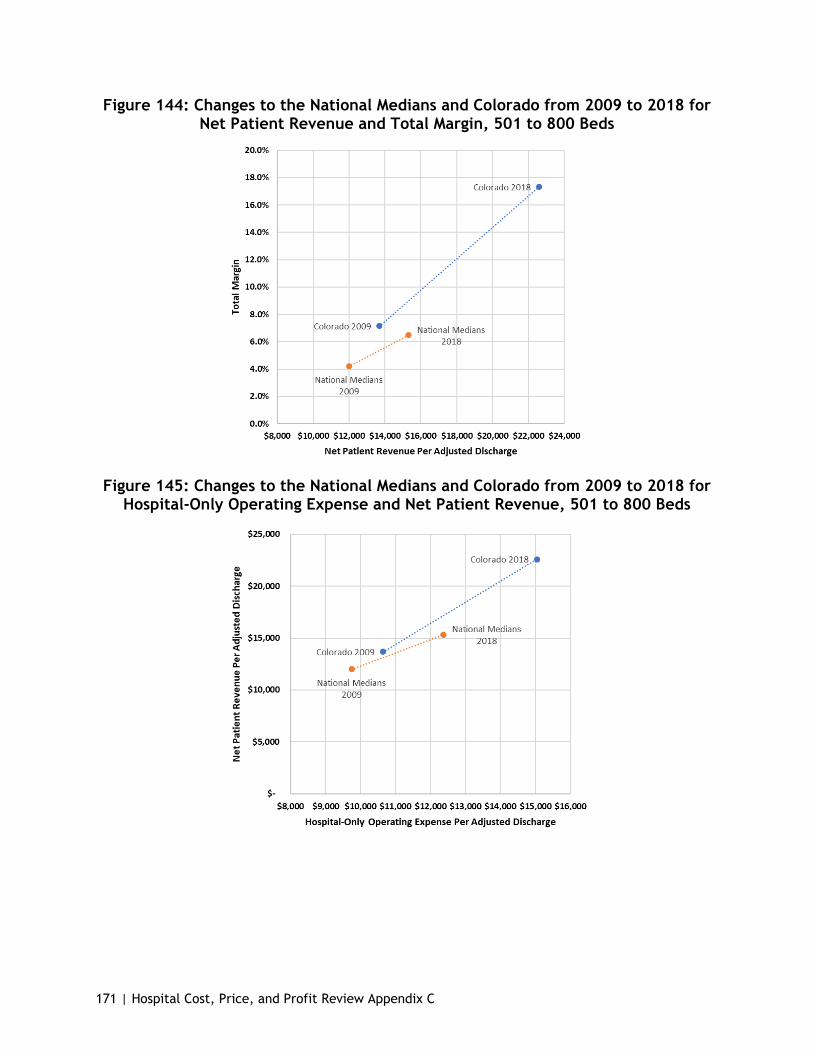
171 | Hospital Cost, Price, and Profit Review Appendix C
Figure 144: Changes to the National Medians and Colorado from 2009 to 2018 for Net Patient Revenue and Total Margin, 501 to 800 Beds
Figure 145: Changes to the National Medians and Colorado from 2009 to 2018 for Hospital-Only Operating Expense and Net Patient Revenue, 501 to 800 Beds

172 | Hospital Cost, Price, and Profit Review Appendix C
Figure 146: Changes to the National Medians and Colorado from 2009 to 2018 for Total Operating Expense and Net Patient Revenue, 501 to 800 Beds
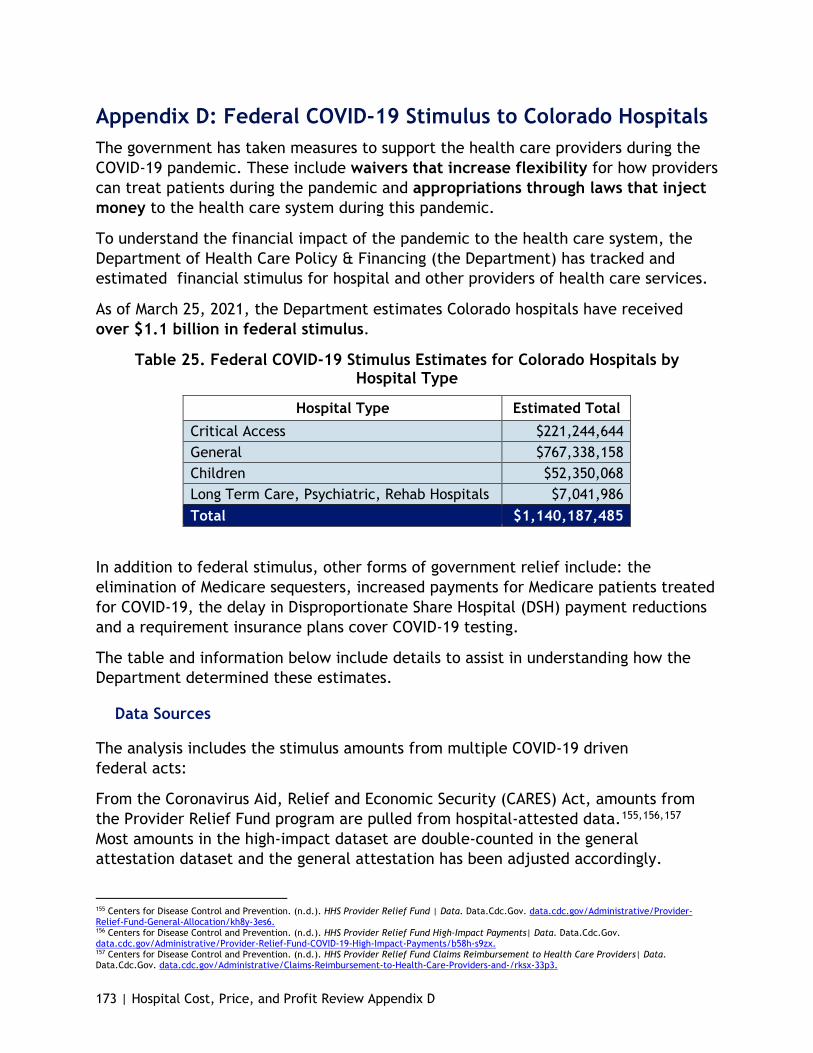
173 | Hospital Cost, Price, and Profit Review Appendix D
Appendix D: Federal COVID-19 Stimulus to Colorado Hospitals The government has taken measures to support the health care providers during the COVID-19 pandemic. These include waivers that increase flexibility for how providers can treat patients during the pandemic and appropriations through laws that inject money to the health care system during this pandemic.
To understand the financial impact of the pandemic to the health care system, the Department of Health Care Policy & Financing (the Department) has tracked and estimated financial stimulus for hospital and other providers of health care services.
As of March 25, 2021, the Department estimates Colorado hospitals have received over $1.1 billion in federal stimulus.
Table 25. Federal COVID-19 Stimulus Estimates for Colorado Hospitals by Hospital Type
Hospital Type Estimated Total Critical Access $221,244,644 General $767,338,158 Children $52,350,068 Long Term Care, Psychiatric, Rehab Hospitals $7,041,986 Total $1,140,187,485
In addition to federal stimulus, other forms of government relief include: the elimination of Medicare sequesters, increased payments for Medicare patients treated for COVID-19, the delay in Disproportionate Share Hospital (DSH) payment reductions and a requirement insurance plans cover COVID-19 testing.
The table and information below include details to assist in understanding how the Department determined these estimates.
Data Sources
The analysis includes the stimulus amounts from multiple COVID-19 driven federal acts:
From the Coronavirus Aid, Relief and Economic Security (CARES) Act, amounts from the Provider Relief Fund program are pulled from hospital-attested data.155,156,157 Most amounts in the high-impact dataset are double-counted in the general attestation dataset and the general attestation has been adjusted accordingly.
155 Centers for Disease Control and Prevention. (n.d.). HHS Provider Relief Fund | Data. Data.Cdc.Gov. data.cdc.gov/Administrative/Provider-Relief-Fund-General-Allocation/kh8y-3es6. 156 Centers for Disease Control and Prevention. (n.d.). HHS Provider Relief Fund High-Impact Payments| Data. Data.Cdc.Gov. data.cdc.gov/Administrative/Provider-Relief-Fund-COVID-19-High-Impact-Payments/b58h-s9zx. 157 Centers for Disease Control and Prevention. (n.d.). HHS Provider Relief Fund Claims Reimbursement to Health Care Providers| Data. Data.Cdc.Gov. data.cdc.gov/Administrative/Claims-Reimbursement-to-Health-Care-Providers-and-/rksx-33p3.
174 | Hospital Cost, Price, and Profit Review Appendix D
● Also from the CARES Act are Small Rural Hospital Improvement Program grants and telehealth awards.158,159
● From the Paycheck Protection Program (PPP) and Health Care Enhancement Act money was added to the Provider Relief Fund, testing capacity awards were issued and PPP loans were given out to small businesses, including some Colorado hospitals.160,161 The PPP loan data is only available in ranges and the average of the high/low amount is used. PPP loans are forgivable when meeting certain criteria and the Department believes hospitals will meet these criteria. Failure to meet these criteria or use this funding may change stimulus amounts for some hospitals.
● Funding through Federal Emergency Management Agency’s disaster relief program is also included for hospitals that have received it.162
The analysis does not include the following stimulus amounts:
● From the Coronavirus Preparation and Response Supplemental Appropriations Act grant money was distributed through the Hospital Preparedness Program; however, this is distributed to the Colorado Hospital Association and there is no way to attribute it to individual hospitals.163
This analysis does not include other stimulus sources providing short-term liquidity such as accelerated Medicare payments or payroll tax deferrals (both of which will need to be repaid later), or increased payments for COVID-19 Medicare patients.164,165,166 Additionally, there are likely small grants certain hospitals have received not reflected in this data. Hospitals are also able to return stimulus funding (as shown by HealthOne) and more hospitals choosing to do this may reduce amounts.
158 U.S. Health Resources & Services Administration. (2020, August). Coronavirus Disease (COVID-19) Information – Federal Office of Rural Health Policy. www.hrsa.gov/rural-health/coronavirus. 159 Federal Communications Commission. (2020, September 3). COVID-19 Telehealth Program | Federal Communications Commission. www.fcc.gov/covid-19-telehealth-program. 160 Bureau of Primary Health Care. (2020, May). Colorado Expanding Capacity for Coronavirus Testing Awards. www.bphc.hrsa.gov/emergency-response/expanding-capacity-coronavirus-testing-FY2020-awards/co. 161 U.S. Department of the Treasury. (n.d.). SBA Paycheck Protection Program Loan Level Data. Home.Treasury.Gov. www.home.treasury.gov/policy-issues/cares-act/assistance-for-small-businesses/sba-paycheck-protection-program-loan-level- data. 162 U.S Department of Homeland Security. Federal Emergency Management Agency. (n.d.) Daily Public Assistance Grant Awards Activity. Fema.gov/about/openfema/data-sets/fema-daily-public-assistance-grant-awards-activity. 163 U.S. Department of Health & Human Services. (n.d.). Award Information | HHS TAGGS. Taggs.Hhs.Gov. taggs.hhs.gov/Detail/AwardDetail?arg_AwardNum=U3REP200618&arg_ProgOfficeCode=255. 164 Center for Medicare and Medicaid Services. (2020). COVID Accelerated and Advance Payments by state. www.cms.gov/files/document/covid-accelerated-and-advance-payments-state.pdf. 165 Internal Revenue Service. (n.d.). Deferral of employment tax deposits and payments through Dec. 31, 2020 | Internal Revenue Service. www.irs.gov/newsroom/deferral-of-employment-tax-deposits-and-payments-through-december-31-2020. 166 American Hospital Association. (n.d.). Coronavirus Update: CMS Releases Guidance Implementing CARES Act Provisions | AHA. www.aha.org/advisory/2020-04-16-coronavirus-update-cms-releases-guidance-implementing-cares-act-provisions.

Figure 147: Federal Stimulus for COVID-19, estimates as of March 25 by Hospital Type and System
By Type
HRSA
Attestation‡
High-Impact
Payment
Uninsured
Reimbursement
PPP Loan Average SHIP Payment Telehealth/ Expanded
testing
Disaster Relief
HPP
Estimated Total†
Critical Access $146,009,640 $4,650,000 $436,839 $67,875,000 $2,698,144 $2,796 $0 $231,360 $221,244,644 General $584,139,435 $237,797,056 $28,205,257 $0 $590,219 $5,107,064 $1,108,417 $361,500 $767,338,158 Children $51,523,985 $0 $90,425 $0 $0 $807,090 $0 $7,230 $52,350,068 Long Term Care, Psychiatric, Rehab Hospitals (not broken out individually) $7,697,218 $750,000 $19,279 $0 $0 $0 $0 $79,530 $7,041,986 Sum $789,370,279 $243,197,056 $28,751,800 $67,875,000 $3,288,363 $5,916,950 $1,108,417 $679,620 $1,140,187,485
By System
HRSA
Attestation‡
High-Impact
Payment
Uninsured
Reimbursement
PPP Loan Average SHIP Payment Telehealth/ Expanded
testing
Disaster Relief
CHA HPP
Estimated Total†
Banner Health $20,076,247 $21,621,658 $1,348,788 $0 $168,634 $0 $0 $36,150 $42,916,104 Centura Health Adventist * $43,763,218 $17,950,000 $754,884 $0 $0 $0 $0 $36,150 $61,749,368 Centura Health CHI * $80,396,393 $13,800,000 $1,405,134 $0 $168,634 $0 $0 $65,070 $94,673,455 Children's Hospital Colorado $51,523,985 $0 $90,425 $0 $0 $807,090 $0 $7,230 $52,350,068
Denver Health and Hospital Authority $61,979,862 $30,578,940 $4,307,830 $0 $0 $2,739,964 $0 $7,230 $97,160,337
HealthONE (Committed to return all stimulus * funding received) $51,860,418 $49,169,702 $7,355,145 $0 $0 $0 $0 $50,610 $104,540,070
San Luis Valley * $10,219,596 $0 $62,944 $0 $168,634 $0 $0 $14,460 $10,460,017
SCL Health $49,014,967 $38,271,816 $2,268,089 $0 $0 $730,008 $0 $36,150 $89,363,367
UCHealth $189,672,550 $63,104,940 $9,133,180 $0 $168,634 $998,250 $0 $79,530 $192,706,716
Independent $230,863,042 $8,700,000 $2,025,381 $67,875,000 $2,613,827 $641,638 $1,108,417 $347,040 $302,055,354
Sum $789,370,279 $243,197,056 $28,751,800 $67,875,000 $3,288,363 $5,916,950 $1,108,417 $679,620 $1,140,187,485
o
†RHC's affiliated with hospitals have their payments lumped with the hospital
‡Some hospitals have included High-Impact Payments in their General Attestation, those numbers have been adjusted to prevent double counts
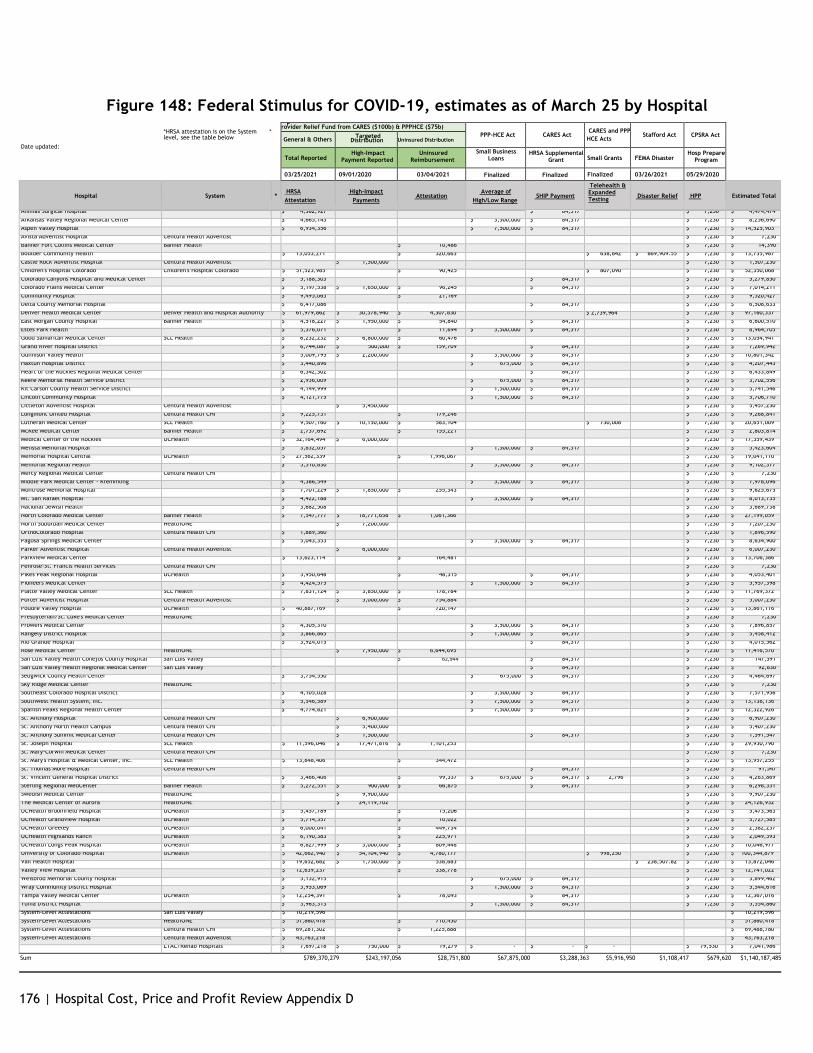
176 | Hospital Cost, Price and Profit Review Appendix D
Figure 148: Federal Stimulus for COVID-19, estimates as of March 25 by Hospital *HRSA attestation is on the System * level, see the table below
Date updated:
P rovider Relief Fund from CARES ($100b) & PPPHCE ($75b) PPP-HCE Act
CARES Act
CARES and PPP HCE Acts
Stafford Act
CPSRA Act
General & Others Targeted Distribution Uninsured Distribution
Total Reported
High-Impact Payment Reported
Uninsured Reimbursement
Small Business Loans
HRSA Supplemental Grant
Small Grants
FEMA Disaster
Hosp Prepare Program
03/25/2021 09/01/2020 03/04/2021 Finalized Finalized Finalized 03/26/2021 05/29/2020
Hospital
System
*
HRSA Attestation
High-Impact
Payments
Attestation
Average of
High/Low Range
SHIP Payment
Telehealth & Expanded Testing
Disaster Relief
HPP
Estimated Total
Animas Surgical Hospital $ 4,382,927 $ 84,317 $ 7,230 $ 4,474,474 Arkansas Valley Regional Medical Center $ 4,665,143 $ 3,500,000 $ 84,317 $ 7,230 $ 8,256,690 Aspen Valley Hospital $ 6,934,356 $ 7,500,000 $ 84,317 $ 7,230 $ 14,525,903 Avista Adventist Hospital Centura Health Adventist * $ 7,230 $ 7,230 Banner Fort Collins Medical Center Banner Health $ 10,486 $ 7,230 $ 14,390 Boulder Community Health $ 13,053,271 $ 320,663 $ 638,842 $ 869,909.55 $ 7,230 $ 13,735,987 Castle Rock Adventist Hospital Centura Health Adventist * $ 1,500,000 $ 7,230 $ 1,507,230 Children s Hospital Colorado Children s Hospital Colorado $ 51,523,985 $ 90,425 $ 807,090 $ 7,230 $ 52,350,068 Colorado Canyons Hospital and Medical Center $ 5,188,303 $ 84,317 $ 7,230 $ 5,279,850 Colorado Plains Medical Center $ 5,197,538 $ 1,650,000 $ 96,245 $ 84,317 $ 7,230 $ 7,014,211 Community Hospital $ 9,495,063 $ 21,169 $ 7,230 $ 9,520,427 Delta County Memorial Hospital $ 6,417,086 $ 84,317 $ 7,230 $ 6,508,633 Denver Health Medical Center Denver Health and Hospital Authority $ 61,979,862 $ 30,578,940 $ 4,307,830 $ 2,739,964 $ 7,230 $ 97,160,337 East Morgan County Hospital Banner Health $ 4,518,227 $ 1,950,000 $ 54,840 $ 84,317 $ 7,230 $ 6,600,510 Estes Park Health $ 5,376,071 $ 11,694 $ 3,500,000 $ 84,317 $ 7,230 $ 8,964,705 Good Samaritan Medical Center SCL Health $ 6,232,232 $ 6,800,000 $ 60,476 $ 7,230 $ 13,054,941 Grand River Hospital District $ 6,744,087 $ 500,000 $ 159,709 $ 84,317 $ 7,230 $ 7,269,942 Gunnison Valley Health $ 5,009,795 $ 2,200,000 $ 3,500,000 $ 84,317 $ 7,230 $ 10,801,342 Haxtun Hospital District $ 3,440,896 $ 675,000 $ 84,317 $ 7,230 $ 4,207,443 Heart of the Rockies Regional Medical Center $ 6,342,302 $ 84,317 $ 7,230 $ 6,433,849 Keefe Memorial Health Service District $ 2,936,009 $ 675,000 $ 84,317 $ 7,230 $ 3,702,556 Kit Carson County Health Service District $ 4,149,999 $ 1,500,000 $ 84,317 $ 7,230 $ 5,741,546 Lincoln Community Hospital $ 4,121,775 $ 1,500,000 $ 84,317 $ 7,230 $ 5,706,710 Littleton Adventist Hospital Centura Health Adventist * $ 5,450,000 $ 7,230 $ 5,457,230 Longmont United Hospital Centura Health CHI $ 9,225,731 $ 179,246 $ 7,230 $ 9,268,841 Lutheran Medical Center SCL Health $ 9,507,160 $ 10,150,000 $ 583,104 $ 730,008 $ 7,230 $ 20,651,009 McKee Medical Center Banner Health $ 2,737,692 $ 155,221 $ 7,230 $ 2,803,814 Medical Center of the Rockies UCHealth $ 32,164,494 $ 6,000,000 $ 7,230 $ 17,359,439 Melissa Memorial Hospital $ 3,832,057 $ 1,500,000 $ 84,317 $ 7,230 $ 5,423,604 Memorial Hospital Central UCHealth $ 27,562,339 $ 1,996,067 $ 7,230 $ 19,041,110 Memorial Regional Health $ 5,510,830 $ 3,500,000 $ 84,317 $ 7,230 $ 9,102,377 Mercy Regional Medical Center Centura Health CHI * $ 7,230 $ 7,230 Middle Park Medical Center - Kremmling $ 4,386,549 $ 3,500,000 $ 84,317 $ 7,230 $ 7,978,096 Montrose Memorial Hospital $ 7,701,229 $ 1,850,000 $ 255,343 $ 7,230 $ 9,625,675 Mt. San Rafael Hospital $ 4,422,188 $ 3,500,000 $ 84,317 $ 7,230 $ 8,013,735 National Jewish Health $ 3,682,508 $ 7,230 $ 3,689,738 North Colorado Medical Center Banner Health $ 7,547,777 $ 18,771,658 $ 1,061,366 $ 7,230 $ 27,199,059 North Suburban Medical Center HealthONE * $ 7,200,000 $ 7,230 $ 7,207,230 OrthoColorado Hospital Centura Health CHI $ 1,889,360 $ 7,230 $ 1,896,590 Pagosa Springs Medical Center $ 5,043,353 $ 3,500,000 $ 84,317 $ 7,230 $ 8,634,900 Parker Adventist Hospital Centura Health Adventist * $ 6,000,000 $ 7,230 $ 6,007,230 Parkview Medical Center $ 13,623,114 $ 164,481 $ 7,230 $ 13,706,386 Penrose-St. Francis Health Services Centura Health CHI * $ 7,230 $ 7,230 Pikes Peak Regional Hospital UCHealth $ 3,950,648 $ 48,315 $ 84,317 $ 7,230 $ 4,053,401 Pioneers Medical Center $ 4,424,575 $ 1,500,000 $ 84,317 $ 7,230 $ 5,957,398 Platte Valley Medical Center SCL Health $ 7,831,124 $ 3,850,000 $ 178,784 $ 7,230 $ 11,769,372 Porter Adventist Hospital Centura Health Adventist * $ 5,000,000 $ 754,884 $ 7,230 $ 5,007,230 Poudre Valley Hospital UCHealth $ 40,887,169 $ 720,147 $ 7,230 $ 13,861,116 Presbyterian/St. Luke s Medical Center HealthONE * $ 7,230 $ 7,230 Prowers Medical Center $ 4,305,310 $ 3,500,000 $ 84,317 $ 7,230 $ 7,896,857 Rangely District Hospital $ 3,866,865 $ 1,500,000 $ 84,317 $ 7,230 $ 5,458,412 Rio Grande Hospital $ 3,924,015 $ 84,317 $ 7,230 $ 4,015,562 Rose Medical Center HealthONE * $ 7,950,000 $ 6,644,695 $ 7,230 $ 11,416,570 San Luis Valley Health Conejos County Hospital San Luis Valley * $ 62,944 $ 84,317 $ 7,230 $ 147,591 San Luis Valley Health Regional Medical Center San Luis Valley * $ 84,317 $ 7,230 $ 92,830 Sedgwick County Health Center $ 3,754,550 $ 675,000 $ 84,317 $ 7,230 $ 4,464,697 Sky Ridge Medical Center HealthONE * $ 7,230 $ 7,230 Southeast Colorado Hospital District $ 4,105,028 $ 3,500,000 $ 84,317 $ 7,230 $ 7,571,956 Southwest Health System, Inc. $ 5,546,589 $ 7,500,000 $ 84,317 $ 7,230 $ 13,138,136 Spanish Peaks Regional Health Center $ 4,774,821 $ 7,500,000 $ 84,317 $ 7,230 $ 12,322,926 St. Anthony Hospital Centura Health CHI * $ 6,900,000 $ 7,230 $ 6,907,230 St. Anthony North Health Campus Centura Health CHI * $ 5,400,000 $ 7,230 $ 5,407,230 St. Anthony Summit Medical Center Centura Health CHI * $ 1,500,000 $ 84,317 $ 7,230 $ 1,591,547 St. Joseph Hospital SCL Health $ 11,596,046 $ 17,471,816 $ 1,101,253 $ 7,230 $ 29,930,790 St. Mary-Corwin Medical Center Centura Health CHI * $ 7,230 $ 7,230 St. Mary s Hospital & Medical Center, Inc. SCL Health $ 13,848,406 $ 344,472 $ 7,230 $ 13,957,255 St. Thomas More Hospital Centura Health CHI * $ 84,317 $ 7,230 $ 91,547 St. Vincent General Hospital District $ 3,466,406 $ 99,337 $ 675,000 $ 84,317 $ 2,796 $ 7,230 $ 4,263,869 Sterling Regional MedCenter Banner Health $ 5,272,551 $ 900,000 $ 66,875 $ 84,317 $ 7,230 $ 6,298,331 Swedish Medical Center HealthONE * $ 9,900,000 $ 7,230 $ 9,907,230 The Medical Center of Aurora HealthONE * $ 24,119,702 $ 7,230 $ 24,126,932 UCHealth Broomfield Hospital UCHealth $ 5,457,789 $ 15,206 $ 7,230 $ 5,473,563 UCHealth Grandview Hospital UCHealth $ 5,714,357 $ 10,022 $ 7,230 $ 5,727,585 UCHealth Greeley UCHealth $ 6,000,041 $ 449,734 $ 7,230 $ 2,382,237 UCHealth Highlands Ranch UCHealth $ 6,190,383 $ 225,971 $ 7,230 $ 2,049,393 UCHealth Longs Peak Hospital UCHealth $ 6,827,999 $ 3,000,000 $ 809,448 $ 7,230 $ 10,046,977 University of Colorado Hospital UCHealth $ 42,662,940 $ 54,104,940 $ 4,780,177 $ 998,250 $ 7,230 $ 100,344,879 Vail Health Hospital $ 19,652,682 $ 1,750,000 $ 538,683 $ 238,507.82 $ 7,230 $ 13,872,046 Valley View Hospital $ 12,639,237 $ 338,778 $ 7,230 $ 12,741,022 Weisbrod Memorial County Hospital $ 3,132,915 $ 675,000 $ 84,317 $ 7,230 $ 3,899,462 Wray Community District Hospital $ 3,953,069 $ 1,500,000 $ 84,317 $ 7,230 $ 5,544,616 Yampa Valley Medical Center UCHealth $ 12,254,391 $ 78,093 $ 84,317 $ 7,230 $ 12,367,016 Yuma District Hospital $ 3,963,313 $ 1,500,000 $ 84,317 $ 7,230 $ 5,554,860 System-Level Attestations San Luis Valley * $ 10,219,596 $ 10,219,596 System-Level Attestations HealthONE * $ 51,860,418 $ 710,450 $ 51,860,418 System-Level Attestations Centura Health CHI * $ 69,281,302 $ 1,225,888 $ 69,488,780 System-Level Attestations Centura Health Adventist * $ 43,763,218 $ 43,763,218
LTAC/Rehab Hospitals * $ 7,697,218 $ 750,000 $ 19,279 $ - $ - $ - $ 79,530 $ 7,041,986
Sum $789,370,279 $243,197,056 $28,751,800 $67,875,000 $3,288,363 $5,916,950 $1,108,417 $679,620 $1,140,187,485