Horner-Keynote-Scaling ppt - · PDF file9/21/2012 1 Scaling Up Multi‐tiered Systems of...
13
9/21/2012 1 Scaling Up Multi ‐tiered Systems of Support: L l df Sh l Wid PBIS Lessons learnedf rom School‐Wide PBIS Rob Horner, University of Oregon Goals • Defining evidence‐based practices in the era of multi‐tiered systems of support. • Implications for implementation of evidence‐ Implications for implementation of evidence based practices • Lessons learned from School‐wide PBIS implementation. Redefining Implementation and Technical Assistance • The SISEP Model • Fixsen, Blase, et. al 2005 ‐‐‐‐‐‐‐‐‐‐‐‐‐‐‐‐‐‐‐‐‐‐‐‐‐‐‐‐‐‐‐‐‐‐‐‐‐‐‐‐‐‐‐‐‐‐‐‐‐‐‐‐‐‐‐‐‐‐‐‐‐‐ • Define the “practice” with precision • Define what TA activities are needed for implementation. • Document fidelity of implementation of effective practices. • Document impact of effective practices on student outcomes. • Document system for improved efficiency that allows scaling of the effective practices
Transcript of Horner-Keynote-Scaling ppt - · PDF file9/21/2012 1 Scaling Up Multi‐tiered Systems of...

9/21/2012
1
Scaling Up Multi‐tiered Systems of Support:
L l d f S h l Wid PBISLessons learned from School‐Wide PBIS
Rob Horner, University of Oregon
Goals
• Defining evidence‐based practices in the era of multi‐tiered systems of support.
• Implications for implementation of evidence‐Implications for implementation of evidencebased practices
• Lessons learned from School‐wide PBIS implementation.
Redefining Implementation and Technical Assistance
• The SISEP Model• Fixsen, Blase, et. al 2005
‐‐‐‐‐‐‐‐‐‐‐‐‐‐‐‐‐‐‐‐‐‐‐‐‐‐‐‐‐‐‐‐‐‐‐‐‐‐‐‐‐‐‐‐‐‐‐‐‐‐‐‐‐‐‐‐‐‐‐‐‐‐
• Define the “practice” with precision
• Define what TA activities are needed for implementation.
• Document fidelity of implementation of effective practices.
• Document impact of effective practices on student outcomes.
• Document system for improved efficiency that allows scaling of the effective practices
9/21/2012
2
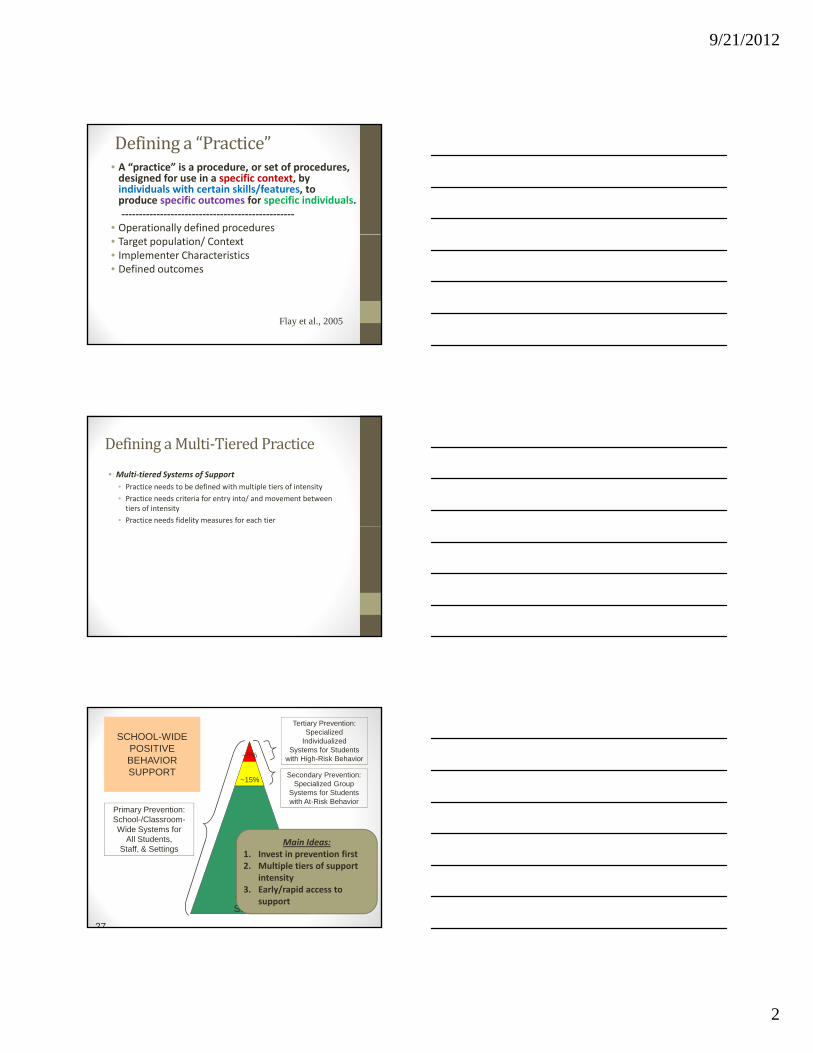
Defining a “Practice”• A “practice” is a procedure, or set of procedures, designed for use in a specific context, by individuals with certain skills/features, to produce specific outcomes for specific individuals.‐‐‐‐‐‐‐‐‐‐‐‐‐‐‐‐‐‐‐‐‐‐‐‐‐‐‐‐‐‐‐‐‐‐‐‐‐‐‐‐‐‐‐‐‐‐‐‐‐
• Operationally defined procedures• Target population/ Context• Implementer Characteristics• Defined outcomes
Flay et al., 2005
Defining a Multi‐Tiered Practice
• Multi‐tiered Systems of Support
• Practice needs to be defined with multiple tiers of intensity
• Practice needs criteria for entry into/ and movement between tiers of intensity
• Practice needs fidelity measures for each tier
Primary Prevention:S h l /Cl
Secondary Prevention:Specialized Group
Systems for Students with At-Risk Behavior
Tertiary Prevention:Specialized
IndividualizedSystems for Students
with High-Risk Behavior
~15%
~5%
SCHOOL-WIDE POSITIVE BEHAVIORSUPPORT
School-/Classroom-Wide Systems for
All Students,Staff, & Settings
~80% of Students
27
Main Ideas:1. Invest in prevention first2. Multiple tiers of support
intensity3. Early/rapid access to
support

9/21/2012
3
School‐wide Positive Behavioral Interventions and Supports (SWPBIS)
• The social culture of a school matters.
• A continuum of supports that begins with the whole school and extends to intensive, wraparound support for individual studentssupport for individual students and their families.
• Effective practices with the systems needed for high fidelity and sustainability
• Multiple tiers of intensity
What is School‐wide Positive Behavior Intervention and Support?
• School‐wide PBIS is:• A framework for establishing the social culture and behavioral supports needed for a school achieve behavioral and academic outcomes for all students.
• Evidence‐based features of SWPBISEvidence based features of SWPBIS• Prevention• Define and teach positive social expectations• Acknowledge positive behavior• Arrange consistent consequences for problem behavior• On‐going collection and use of data for decision‐making• Continuum of intensive, individual intervention supports. • Implementation of the systems that support effective practices
~15%
~5%
ESTABLISHING CONTINUUM of SWPBS
SECONDARY PREVENTION• Check in/ Check out• Targeted social skills instruction
TERTIARY PREVENTION• Function-based support• Wraparound• Person-centered planning• Check and Connect•
SECONDARY PREVENTION••
TERTIARY PREVENTION•••••
~80% of Students
• Anger Management• Social skills club• First Step to Success
PRIMARY PREVENTION• Teach SW expectations• Consistent Consequences• Positive reinforcement• Classroom Systems• Parent engagement• Bully Prevention
•••
PRIMARY PREVENTION••••••

9/21/2012
4
Experimental Research on SWPBIS
Bradshaw, C.P., Koth, C.W., Thornton, L.A., & Leaf, P.J. (2009). Altering school climate through school‐wide Positive Behavioral Interventions and Supports: Findings from a group‐randomized effectiveness trial. Prevention Science, 10(2), 100‐115
Bradshaw, C.P., Koth, C.W., Bevans, K.B., Ialongo, N., & Leaf, P.J. (2008). The impact of school‐wide Positive Behavioral Interventions and Supports (PBIS) on the organizational health of elementary schools. School Psychology Quarterly, 23(4), 462‐473.
Bradshaw, C. P., Mitchell, M. M., & Leaf, P. J. (2010). Examining the effects of School‐Wide Positive Behavioral Interventions and Supports on student outcomes: Results from a randomized controlled effectiveness trial in elementary schools. Journal of Positive Behavior Interventions, 12, 133‐148.
Bradshaw, C.P., Reinke, W. M., Brown, L. D., Bevans, K.B., & Leaf, P.J. (2008). Implementation of school‐wide Positive , , , , , , , , , ( ) pBehavioral Interventions and Supports (PBIS) in elementary schools: Observations from a randomized trial. Education & Treatment of Children, 31, 1‐26.
Bradshaw, C., Waasdorp, T., Leaf. P., (in press). Effects of School‐wide positive behavioral interventions and supports on child behavior problems and adjustment. Pediatrics.
Horner, R., Sugai, G., Smolkowski, K., Eber, L., Nakasato, J., Todd, A., & Esperanza, J., (2009). A randomized, wait‐list controlled effectiveness trial assessing school‐wide positive behavior support in elementary schools. Journal of Positive Behavior Interventions, 11, 133‐145.
Horner, R. H., Sugai, G., & Anderson, C. M. (2010). Examining the evidence base for school‐wide positive behavior support. Focus on Exceptionality, 42(8), 1‐14.
Ross, S. W., Endrulat, N. R., & Horner, R. H. (2012). Adult outcomes of school‐wide positive behavior support. Journal of Positive Behavioral Interventions. 14(2) 118‐128.
Waasdorp, T., Bradshaw, C., & Leaf , P., (2012) The Impact of Schoolwide Positive Behavioral Interventions andSupports on Bullying and Peer Rejection: A Randomized Controlled Effectiveness Trial. Archive of Pediatric Adolescent Medicine. 2012;166(2):149‐156
Number of Schools Implementing SWPBIS since 2000
10000
12000
14000
16000
18000
20000
18,276
0
2000
4000
6000
8000
10000
00 01 02 03 04 05 06 07 08 09 2010 2011 2012
Count of School Implementing SWPBIS by StateAugust, 2012
1000
1200
1400
1600
1800
13 States > 500 SchoolsIllinois
0
200
400
600
800
Alabam
a
Alaska
Arizona
Arkansas
California
Colorado*
Connecticut
Delaware
Florida*
Geo
rgia
Haw
aii
Idaho
Illinois
Indiana
Iowa*
Kansas*
Kentucky
Louisiana*
Maine
Maryland*
Massachusetts
Michigan
Minnesota
Mississippi
Missouri*
Montana*
Neb
raska
Nevada
New Ham
pshire
New Jersey*
New M
exico
New York
North Carolina*
North Dakota*
Ohio
Oklahoma
Oregon*
Pennsylvania
Rhode Island
South Carolina*
South Dakota
Tennessee
Texas
Utah*
Verm
ont
Virginia
Washington State
Washington DC
West Virginia
Wisconsin
Wyoming

9/21/2012
5
Proportion of Schools Implementing SWPBIS by StateAugust, 2012
0.5
0.6
0.7
0.8
0.9 10 states over 40% of schools
0
0.1
0.2
0.3
0.4
Alabam
aAlaska
Arizona
Arkansas
California
Colorado*
Connecticut
Delaware
Florida*
Geo
rgia
Haw
aii
Idaho
Illinois
Indiana
Iowa*
Kansas*
Kentucky
Louisiana*
Maine
Maryland*
Massachusetts
Michigan
Minnesota
Mississippi
Missouri*
Montana*
Neb
raska
Nevada
New Ham
pshire
New Jersey*
New M
exico
New York
North Carolina*
North Dakota*
Ohio
Oklahoma
Oregon*
Pennsylvania
Rhode Island
South Carolina*
South Dakota
Tennessee
Texas
Utah*
Verm
ont
Virginia
Washington State
Washington DC
West Virginia
Wisconsin
Wyoming
Implementation
• Redefining the implementation of evidence‐based practices
• Fixsen and Blase
I li i• Implications
• Train “teams” not individuals
• Train coaches and trainers for improved fidelity and sustainability
• Train evaluators to ensure data are collected and used
• Orient Leadership teams
Performance Assessment (Fidelity)
Coaching Systems Intervention
Student Benefits
© Fixsen & Blase, 2008
Training
Selection
Facilitative Administration
Decision Support Data System
Leadership AdaptiveTechnical
Effective Implementation

9/21/2012
6
Stages of Implementation
• Exploration
• Installation
• Initial Implementation
Implementation occurs in stages:
2 – 4 Yearsp
• Full Implementation
• Innovation
• Sustainability
Fixsen, Naoom, Blase, Friedman, & Wallace, 2005
Stages of ImplementationFocusFocus StageStage DescriptionDescription
Exploration/Adoption
Decision regarding commitment to adopting the program/practices and supporting successful implementation.
Installation Set up infrastructure so that successful implementation can take place and be Getting
Should we do it
supported. Establish team and data systems, conduct audit, develop plan.
Initial Implementation
Try out the practices, work out details, learn and improve before expanding to other contexts.
Elaboration Expand the program/practices to other locations, individuals, times- adjust from learning in initial implementation.
Continuous Improvement/ Regeneration
Make it easier, more efficient. Embed within current practices.
Getting it right
Making it better
Steve Goodman
The role of fidelity measures
• Measure if a practice is being used as intended.• “Certify” implementation impact…not trainers or materials
• Measuring fidelity as a Dependent Variableg y p• For research or evaluation purposes• Need for high‐quality measures of fidelity
• Measuring fidelity as part of the Independent Variable
• To assist implementation, sustainability and continuous improvement
• Need for high‐efficiency measures of fidelity

9/21/2012
7
~15%
~5%
Fidelity Measures within SWPBIS
SECONDARY &TERTIARY PREVENTION
• Individual Student System Evaluation Tool (ISSET)–RESEARCH
• Monitoring Advanced Tiers (MAT) – PROGRESS
• Benchmark of Advance Tiers (BAT) -- ANNUAL
~80% of Students
(BAT) ANNUAL
PRIMARY PREVENTION• School-wide Evaluation Tool (SET) – RESEARCH
• Team Implementation Checklist (TIC) – PROGRESS
• Benchmark of Quality (BoQ) –ANNUAL SUSTAINABILITY
Using Fidelity Data
• Assessing the extent to which we are implementing what we claim to implement
• Use of the data for decision‐making
Iowa Checklist 01-05, PK-6 % Fully & Partially Implemented
50%
60%
70%
80%
90%
100%
0%
10%
20%
30%
40%
05-A
ug-0
3
05-N
ov-0
3
23-F
eb-0
4
22-J
an-0
4
01-F
eb-0
5
02-J
un-0
5
12-A
ug-0
4
24-N
ov-0
4
01-M
ar-0
5
12-S
ep-0
2
31-O
ct-0
2
28-F
eb-0
3
21-A
pr-0
3
01-S
ep-0
3
05-N
ov-0
3
05-A
ug-0
3
11-S
ep-0
3
07-N
ov-0
3
06-F
eb-0
4
01-S
ep-0
3
01-N
ov-0
3
01-M
ar-0
4
03-A
ug-0
4
08-N
ov-0
4
08-M
ar-0
5
03-J
un-0
5
1 1 1 2 2 2 3 3 3 4 4 4 4 4 4 5 5 5 5 6 6 6 7 7 7 7
Start Up Full Implementation Start Up Part Implementation

9/21/2012
8
Applying Implementation Science to SWPBIS
•Student as unit of impact
•Whole School as unit of analysisf y
•District as unit of implementation
Leadership Team
A ti C di ti
FundingVisibility Political
SupportPolicy
Active Coordination
Training Coaching Evaluation
Local School/District Teams/Demonstrations
BehavioralExpertise
Sugai et al., www.pbis.org

9/21/2012
9
Scaling up School‐wide Positive Behavioral Interventions and Supports:The Experiences of Seven States with Documented SuccessRob Horner, Don Kincaid, George Sugai, Tim Lewis, Lucille Eber, Susan Barrett, Celeste Rossetto Dickey, Mary Richter, Erin Sullivan, Cyndi Boezio, Nancy Johnson
Exploration Installation Initial Imp Full Imp Innovation Sustainability
LeadershipTeam
Funding
Visibility
PoliticalPoliticalSupport
Policy
Training
Coaching
Expertise
Evaluation
Demos
Exploration and Adoption
Installation Initial Implementation
Full Implementation
Innovation and sustainability
oordination)
Do you have a state leadership team?
If you do, how was your first leadership team developed?
Who were members?
Who supported/lead the team through the exploration
What were critical issues that confronted the team as it began to install systems changes?
What were specific activities the team did to ensure success of the initial implementation efforts?
Did the team change personnel or functioning as the # of schools/districts increased?
What has the Leadership team done to insure sustainability?
In what areas is the State “innovating” and contributing to the research and practice of PBIS (e g linking
Lead
ership Team (co
the explorationprocess?
Was any sort of self‐assessment completed (e.g. the PBIS Implementation Blueprint Assessment)?
What was the role of State agency personnel in the exploration phase?
PBIS (e.g. linking PBIS with literacy or math)?
Descriptive Summary: Oregon
400
500
600
700
0
100
200
300
1995‐96 1996‐97 1997‐98 1998‐99 1999‐00 2000‐01 2001‐02 2002‐03 2003‐04 2004‐05 2005‐06 2006‐07 2007‐08 2008‐09 2009‐10
Exploration / Installation / Initial Imp /Full Imp & Innovate

9/21/2012
10
Descriptive Summary: Missouri
500
600
700
0
100
200
300
400
97‐98 98‐99 99‐00 00‐01 01‐02 02‐03 03‐04 04‐05 05‐06 06‐07 07‐08 08‐09 09‐10 10‐11Exploration / Installation /Initial Imp / Full Imp & Innovate
Descriptive Summary: North Carolina
700
800
900
1000
0
100
200
300
400
500
600
00-01 01-02 02-03 03-04 04-05 05-06 06-07 07-08 08-09 09-10Exploration / Installation / Initial & Full Imp / Innovate
Descriptive Summary: Colorado
500
600
700
800
0
100
200
300
400
02‐03 03‐04 04‐05 05‐06 06‐07 07‐08 08‐09 09‐10 10‐11
Exploration / Installation / Initial & Full Imp / Innovate

9/21/2012
11
Descriptive Summary: Florida
800
1000
1200
0
200
400
600
01‐02 02‐03 03‐04 04‐05 05‐06 06‐07 07‐08 08‐09 09‐10Exploration/ Installation/ Initial Imp / Full Imp / Innovate
Descriptive Summary: Maryland
600
700
800
900
0
100
200
300
400
500
1999 2000 2001 2002 2003 2004 2005 2006 2007 2008 2009 2010Exploration / Installation / Initial Imp / Full Imp / Innovate
Descriptive Summary: Illinois
1000
1200
1400
1600
0
200
400
600
800
98‐99 99‐00 00‐01 01‐02 02‐03 03‐04 04‐05 05‐06 06‐07 07‐08 08‐09 09‐10 10‐11Exploration / Installation / Initial Imp /Full Imp & Innovate

9/21/2012
12
Lessons Learned• Multiple approaches to achieving scaled implementation
• Colorado: Started with Leadership Team
• Illinois: Started with Leadership Advocates and built team only after implementation expanded.
• Missouri: Strong initial demonstrations led to strong state support
• All states began with small “demonstrations” that documented the f ibili d i f SWPBISfeasibility and impact of SWPBIS.
• Only when states reached 100‐200 demonstrations did scaling occur. Four core features needed for scaling:
• Administrative Leadership / Support/ Funding
• Technical capacity (Local training, coaching, evaluation and behavioral expertise)
• Local Demonstrations of feasibility and impact (100‐200)
• Evaluation data system (to support continuous improvement)
• Essential role of Data: Fidelity data AND Outcome data
Lessons Learned
• Scaling is NOT linear
• Sustained scaling requires continuous regeneration
• Threats to Scaling:• Threats to Scaling:
• Competing initiatives
• The seductive lure of the “new idea”
• Leadership turnover
• Legislative mandates
• Fiscal constraint
Regular Dissemination of Fidelity and Impact data is the best
“protective factor” for threats to
scaling
Lessons Learned• Scaling requires planned efficiency
• The unit cost of implementation must decrease as the number of adoptions increases.
• Shift from external trainers to within state/district trainers
• Use local demonstrations as exemplars
• Increased coaching capacity can decrease investment in training
• Improved “selection” of personnel decreases turnover and• Improved “selection” of personnel decreases turnover and development costs
• Use existing professional development and evaluation resources differently
• Basic Message: The implementation practices that are needed to establish initial exemplars may be different from the practices used to establish large scale adoption.
• Jennifer Coffey, 2008
9/21/2012
13
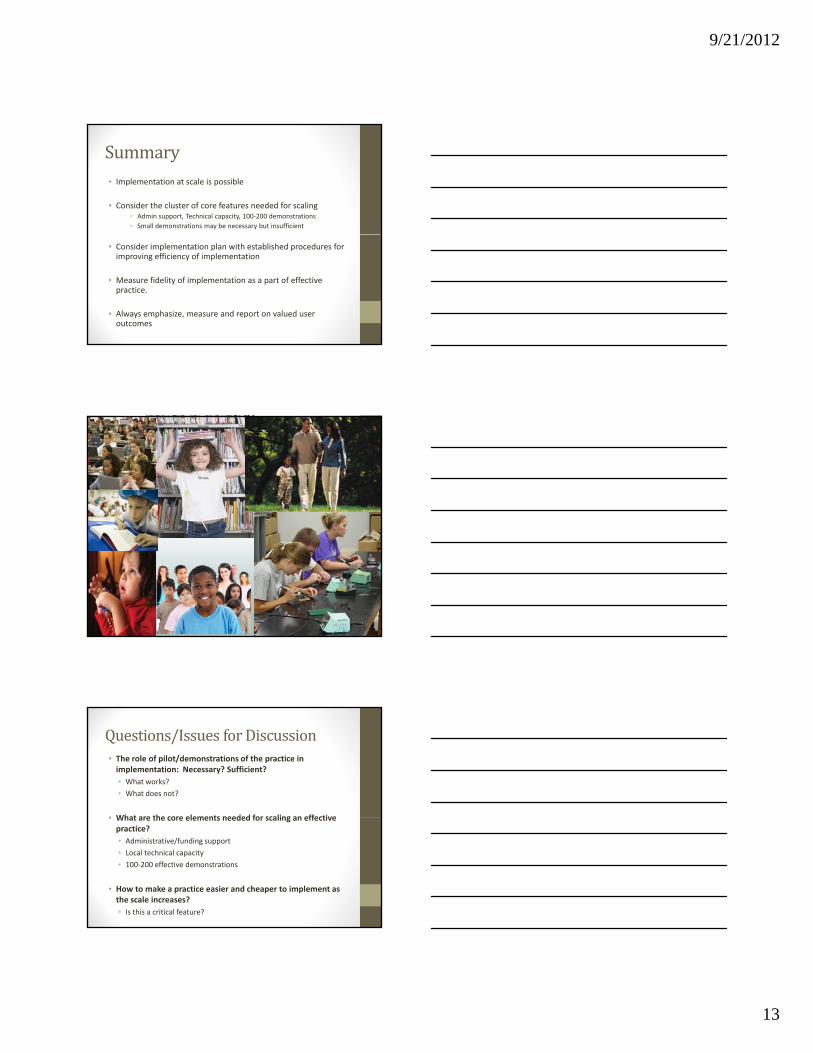
Summary
• Implementation at scale is possible
• Consider the cluster of core features needed for scaling• Admin support, Technical capacity, 100‐200 demonstrations
• Small demonstrations may be necessary but insufficient
• Consider implementation plan with established procedures for improving efficiency of implementation
• Measure fidelity of implementation as a part of effective practice.
• Always emphasize, measure and report on valued user outcomes
Questions/Issues for Discussion
• The role of pilot/demonstrations of the practice in implementation: Necessary? Sufficient?
• What works?
• What does not?
• What are the core elements needed for scaling an effective• What are the core elements needed for scaling an effective practice?
• Administrative/funding support
• Local technical capacity
• 100‐200 effective demonstrations
• How to make a practice easier and cheaper to implement as the scale increases?
• Is this a critical feature?