
HONR 229L: Climate Change: Science, Economics, and...
102
Copyright © 2017 University of Maryland. This material may not be reproduced or redistributed, in whole or in part, without written permission from Ross Salawitch. 1 HONR 229L: Climate Change: Science, Economics, and Governance Discussion #10: Climate Models: Perspective of a Social Scientist Ross Salawitch & Walt Tribett [email protected] [email protected] Class Web Site: http://www.atmos.umd.edu/~rjs/class/honr229L ELMS Page: https://myelms.umd.edu/courses/1229919
Transcript of HONR 229L: Climate Change: Science, Economics, and...

Copyright © 2017 University of Maryland. This material may not be reproduced or redistributed, in whole or in part, without written permission from Ross Salawitch. 1
HONR 229L: Climate Change: Science, Economics, and Governance
Discussion #10: Climate Models: Perspective of a Social Scientist
Ross Salawitch & Walt [email protected] [email protected]
Class Web Site: http://www.atmos.umd.edu/~rjs/class/honr229LELMS Page: https://myelms.umd.edu/courses/1229919

Copyright © 2017 University of Maryland. This material may not be reproduced or redistributed, in whole or in part, without written permission from Ross Salawitch. 2
HONR 229L: Climate Change: Science, Economics, and GovernanceAT 9, Q2: The reading states "climate can not be described in terms of the atmosphere alone".
What other components are needed to predict future climate, and which of these components was the last to be added to the computer models that predict future climate?
← Large diversity in how these are handled

Copyright © 2017 University of Maryland. This material may not be reproduced or redistributed, in whole or in part, without written permission from Ross Salawitch. 3
HONR 229L: Climate Change: Science, Economics, and GovernanceAT 9, Q2: The reading states "climate can not be described in terms of the atmosphere alone".
What other components are needed to predict future climate, and which of these components was the last to be added to the computer models that predict future climate?
← Most climate simulations use prescribedCO2, rather than CO2 found using aninteractive carbon cycle
}

Copyright © 2017 University of Maryland. This material may not be reproduced or redistributed, in whole or in part, without written permission from Ross Salawitch. 4
HONR 229L: Climate Change: Science, Economics, and GovernanceAT 9, Q2: The reading states "climate can not be described in terms of the atmosphere alone".
What other components are needed to predict future climate, and which of these components was the last to be added to the computer models that predict future climate?
← Niche area: one in which some UMDstudents are quite active

Copyright © 2017 University of Maryland. This material may not be reproduced or redistributed, in whole or in part, without written permission from Ross Salawitch. 5
HONR 229L: Climate Change: Science, Economics, and GovernanceAT 9, Q2: The reading states "climate can not be described in terms of the atmosphere alone".
What other components are needed to predict future climate, and which of these components was the last to be added to the computer models that predict future climate?
← Cryosphere is incredibly important andextremely complicated to model.Al Gore’s movies portray the cryosphereextremely well, perhaps because of greatphoto ops from the environment
Copyright © 2017 University of Maryland. This material may not be reproduced or redistributed, in whole or in part, without written permission from Ross Salawitch. 6
HONR 229L: Climate Change: Science, Economics, and Governance
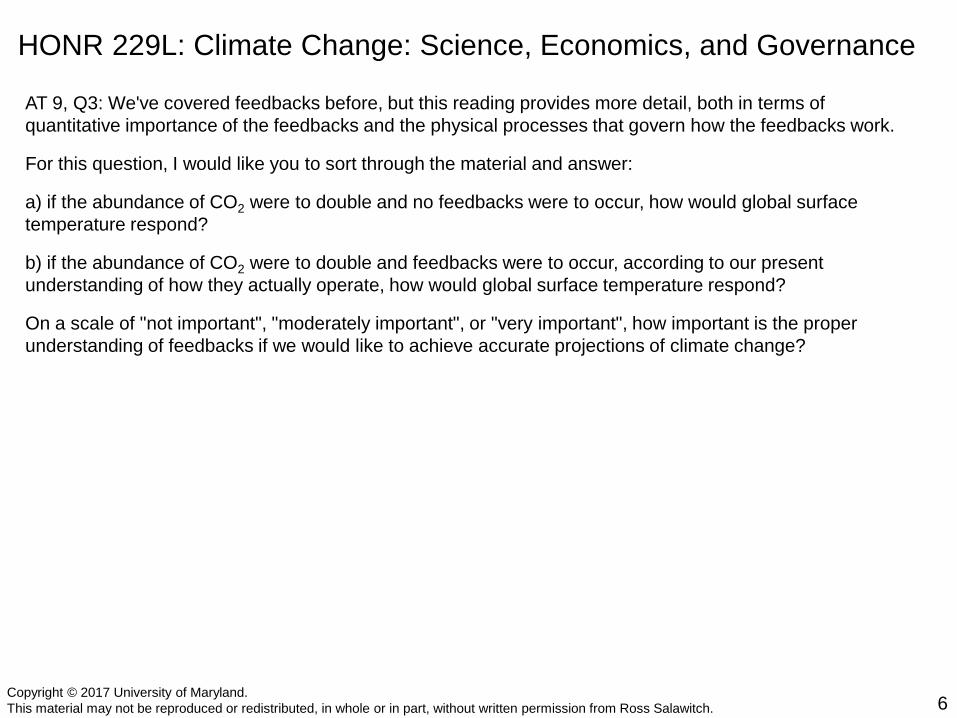
AT 9, Q3: We've covered feedbacks before, but this reading provides more detail, both in terms of quantitative importance of the feedbacks and the physical processes that govern how the feedbacks work.
For this question, I would like you to sort through the material and answer:
a) if the abundance of CO2 were to double and no feedbacks were to occur, how would global surface temperature respond?
b) if the abundance of CO2 were to double and feedbacks were to occur, according to our present understanding of how they actually operate, how would global surface temperature respond?
On a scale of "not important", "moderately important", or "very important", how important is the proper understanding of feedbacks if we would like to achieve accurate projections of climate change?

Copyright © 2017 University of Maryland. This material may not be reproduced or redistributed, in whole or in part, without written permission from Ross Salawitch. 7
Table 5.1: Changes in Global Temperature Under Various Scenarios
Houghton, Global Warming: The Complete Briefing, 2015
If CO2 were to double,and nothing else were to
occur, global climate wouldwarm by about 1.2 °C
2BB CO2 BB
2 2
T = (ΔRF ), where 0.32 K W m
T = 0.32 K W m (3.7 W m ) 1.2 K or 1.2 C
λ λ −
− −
∆ × =
∆ × = °
/
/

Copyright © 2017 University of Maryland. This material may not be reproduced or redistributed, in whole or in part, without written permission from Ross Salawitch. 8
Table 5.1: Changes in Global Temperature Under Various Scenarios
This number impliessum of all feedbacks
amplifies CO2 warmingby a factor of 1.5
Houghton, Global Warming: The Complete Briefing, 2015
2BB CO2 BB
2 2
T = (1 ) (ΔRF ), where 0.32 K W m
T = 0.32 K (1 ) W m (3.7 W m ) 3 K or 3 C
λ λ −
− −
∆ + × =
∆ + × = °1.5
feedbacks /
/

Copyright © 2017 University of Maryland. This material may not be reproduced or redistributed, in whole or in part, without written permission from Ross Salawitch.
Empirical Model of Global Climate (EM-GC)
9
Key model output parameter #1:Climate Feedback Parameter, λ, units W m−2 °C−1Feedback = 0.09
Aerosol RF 2011 = −0.1 W m−2
Key model output parameter #2:AAWR: Attributable Anthropogenic Warming Rate,
units °C / decade
After Figure 2.4Salawitch et al., Paris Climate Agreement: Beacon of Hope, 2017EM-GC described by Canty et al., ACP, 2013

Copyright © 2017 University of Maryland. This material may not be reproduced or redistributed, in whole or in part, without written permission from Ross Salawitch.
Empirical Model of Global Climate (EM-GC)
10
Key model output parameter #1:Climate Feedback Parameter, λ, units W m−2 °C−1Feedback = 0.21
Aerosol RF 2011 = −0.4 W m−2
Key model output parameter #2:AAWR: Attributable Anthropogenic Warming Rate,
units °C / decade
After Figure 2.4Salawitch et al., Paris Climate Agreement: Beacon of Hope, 2017EM-GC described by Canty et al., ACP, 2013
Copyright © 2017 University of Maryland. This material may not be reproduced or redistributed, in whole or in part, without written permission from Ross Salawitch.
Empirical Model of Global Climate (EM-GC)
11
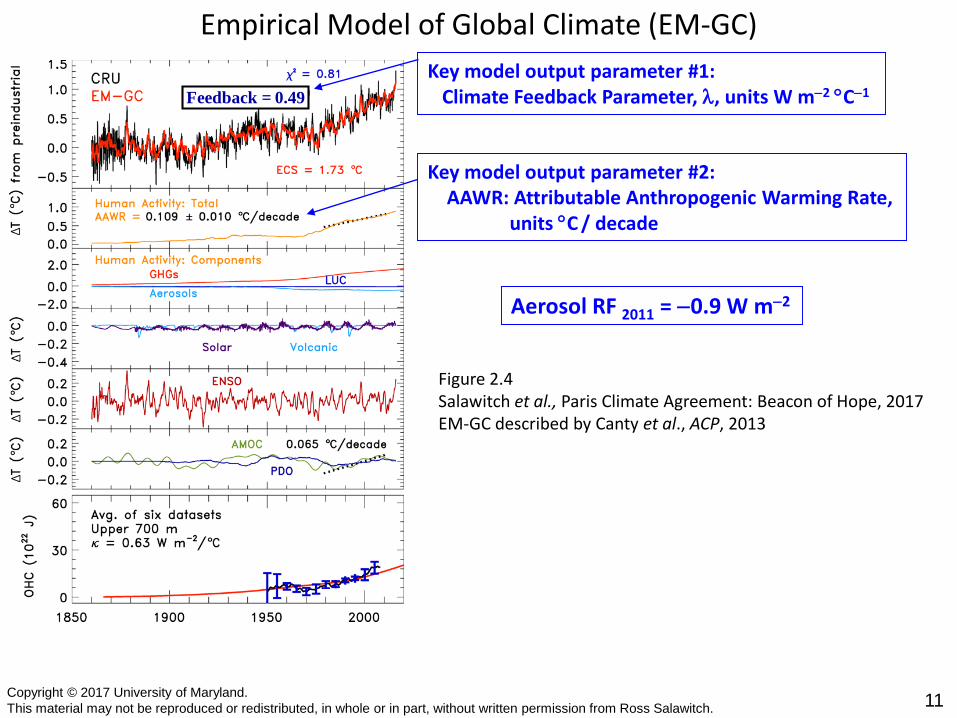
Key model output parameter #1:Climate Feedback Parameter, λ, units W m−2 °C−1Feedback = 0.49
Aerosol RF 2011 = −0.9 W m−2
Key model output parameter #2:AAWR: Attributable Anthropogenic Warming Rate,
units °C / decade
Figure 2.4Salawitch et al., Paris Climate Agreement: Beacon of Hope, 2017EM-GC described by Canty et al., ACP, 2013

Copyright © 2017 University of Maryland. This material may not be reproduced or redistributed, in whole or in part, without written permission from Ross Salawitch.
Empirical Model of Global Climate (EM-GC)
12
Key model output parameter #1:Climate Feedback Parameter, λ, units W m−2 °C−1Feedback = 1.03
Aerosol RF 2011 = −1.5 W m−2
Key model output parameter #2:AAWR: Attributable Anthropogenic Warming Rate,
units °C / decade
After Figure 2.4Salawitch et al., Paris Climate Agreement: Beacon of Hope, 2017EM-GC described by Canty et al., ACP, 2013
Copyright © 2017 University of Maryland. This material may not be reproduced or redistributed, in whole or in part, without written permission from Ross Salawitch.
Empirical Model of Global Climate (EM-GC)
13
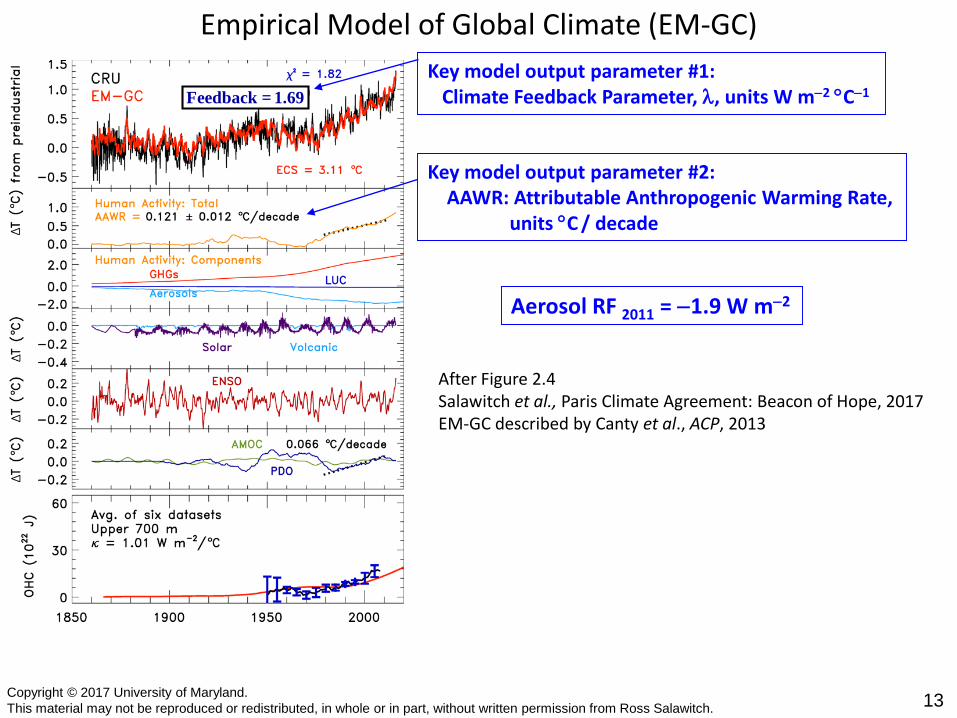
Key model output parameter #1:Climate Feedback Parameter, λ, units W m−2 °C−1
After Figure 2.4Salawitch et al., Paris Climate Agreement: Beacon of Hope, 2017EM-GC described by Canty et al., ACP, 2013
Feedback = 1.69
Key model output parameter #2:AAWR: Attributable Anthropogenic Warming Rate,
units °C / decade
Aerosol RF 2011 = −1.9 W m−2
Copyright © 2017 University of Maryland. This material may not be reproduced or redistributed, in whole or in part, without written permission from Ross Salawitch.
AAWR: Attributable Anthropogenic Warming Rate
14
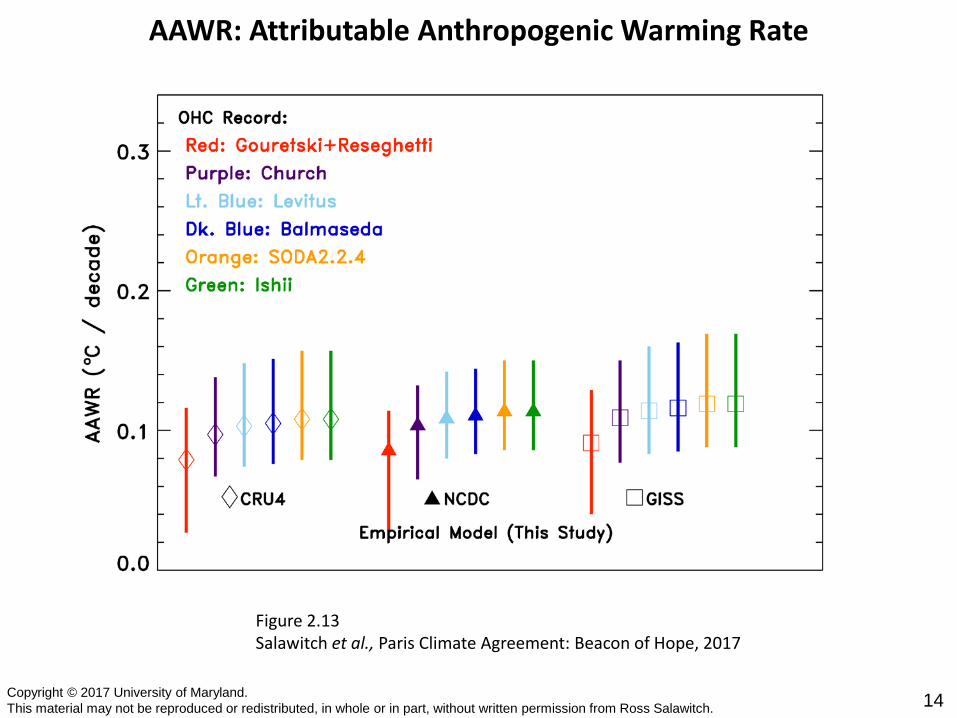
Figure 2.13Salawitch et al., Paris Climate Agreement: Beacon of Hope, 2017

Copyright © 2017 University of Maryland. This material may not be reproduced or redistributed, in whole or in part, without written permission from Ross Salawitch.
AAWR: Attributable Anthropogenic Warming Rate
15
Figure 2.13Salawitch et al., Paris Climate Agreement: Beacon of Hope, 2017

Copyright © 2017 University of Maryland. This material may not be reproduced or redistributed, in whole or in part, without written permission from Ross Salawitch. 16
HONR 229L: Climate Change: Science, Economics, and Governance
AT 9, Q1: In a few sentences, explain:
a) what is meant by an El Niño event (i.e., physically what happens in the ocean & where in the ocean does this happen?)
b) what are the weather related consequences associated with an El Niño event ?
El Niño is an event that occurs when there is a large part of the Pacific Ocean near the coast of South America that becomes warmer and lasts for [about] a year. … wind from the atmosphere creates more circulation in the water and the evaporation from the water adds a significant amount of heat into the atmosphere, which then impacts the circulation in the atmosphere.
El Niño causes a significant drop in rainfall in tropic regions, floods in some areas, and when the Kelvin wave is formed the cold kicks in.

Copyright © 2017 University of Maryland. This material may not be reproduced or redistributed, in whole or in part, without written permission from Ross Salawitch. 17
http://esminfo.prenhall.com/science/geoanimations/animations/26_NinoNina.html
La Niña conditions

Copyright © 2017 University of Maryland. This material may not be reproduced or redistributed, in whole or in part, without written permission from Ross Salawitch. 18
http://esminfo.prenhall.com/science/geoanimations/animations/26_NinoNina.html
Warming of Eastern Pacific, with consequences for global climate
El Niño conditions

Copyright © 2017 University of Maryland. This material may not be reproduced or redistributed, in whole or in part, without written permission from Ross Salawitch. 19
ENSO factors strongly into the Silver reading
Glo
bal M
ean
Sur
face
Tem
pera
ture
Ano
mal
y, °
C(r
elat
ive
to p
re-in
dust
rial)

Copyright © 2017 University of Maryland. This material may not be reproduced or redistributed, in whole or in part, without written permission from Ross Salawitch. 20
HONR 229L: Climate Change: Science, Economics, and Governance
AT 9, Q4 Describe, in a few sentences, how climate models are validated
There are three main ways climate models are validated.
The first way is that they can be run as a simulation for many years, then that information can be compared to actual climate data. In order for the model to be validated, the projections of the model must align with real life observations in terms of trends such as surface pressure and rainfall.
The second way in which models can be validated is the model can be set back to a time when conditions on Earth were drastically different. This reading highlights 9,000 years back as being a good landmark. If the model generates the conditions that existed back then, it will be validated.
The third way a climate model can be validated is that they can be run with an environmental disaster, such as a volcano. If the model can accurately predict the outcome of such a scenario, then it is validated.

Copyright © 2017 University of Maryland. This material may not be reproduced or redistributed, in whole or in part, without written permission from Ross Salawitch.
RED: EM-GC Forecasts, RCP 4.5 & RCP 8.5
21
Paris UpperLimit
Paris Goal
After Figure 2.19Salawitch et al., Paris Climate Agreement: Beacon of Hope, 2017

Copyright © 2017 University of Maryland. This material may not be reproduced or redistributed, in whole or in part, without written permission from Ross Salawitch.
GMST since Dec 2015
22
Paris UpperLimit
Paris Goal
After Figure 2.19Salawitch et al., Paris Climate Agreement: Beacon of Hope, 2017

Copyright © 2017 University of Maryland. This material may not be reproduced or redistributed, in whole or in part, without written permission from Ross Salawitch.
GMST since Dec 2015
23
Paris UpperLimit
Paris Goal
After Figure 2.19Salawitch et al., Paris Climate Agreement: Beacon of Hope, 2017
Copyright © 2017 University of Maryland. This material may not be reproduced or redistributed, in whole or in part, without written permission from Ross Salawitch.
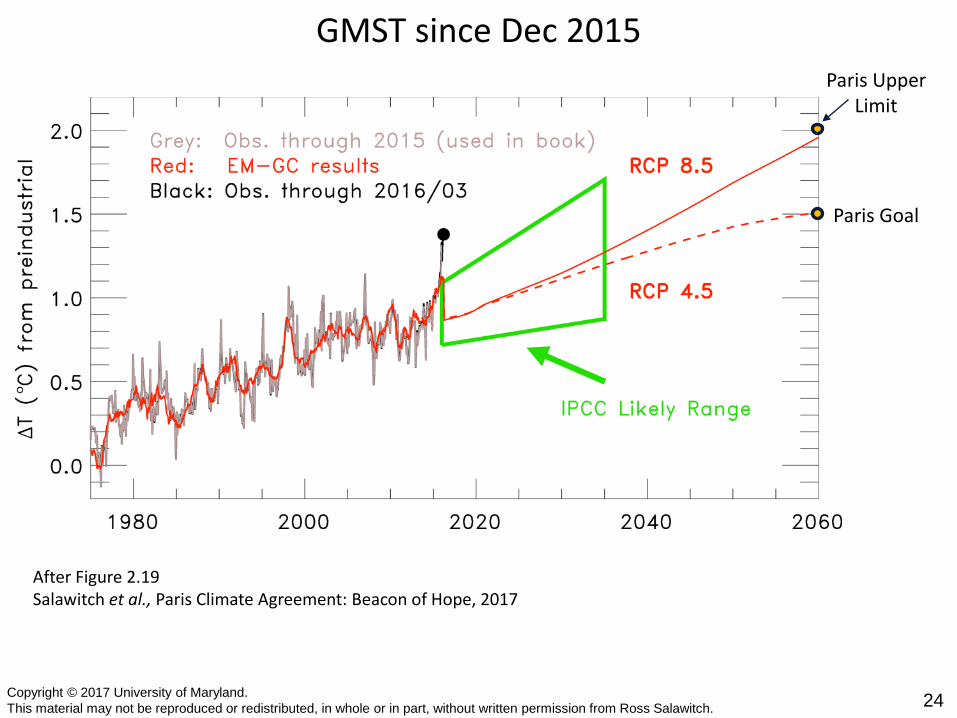
GMST since Dec 2015
24
Paris UpperLimit
Paris Goal
After Figure 2.19Salawitch et al., Paris Climate Agreement: Beacon of Hope, 2017

Copyright © 2017 University of Maryland. This material may not be reproduced or redistributed, in whole or in part, without written permission from Ross Salawitch.
GMST since Dec 2015
25
Paris UpperLimit
Paris Goal
After Figure 2.19Salawitch et al., Paris Climate Agreement: Beacon of Hope, 2017

Copyright © 2017 University of Maryland. This material may not be reproduced or redistributed, in whole or in part, without written permission from Ross Salawitch.
GMST since Dec 2015
26
Paris UpperLimit
Paris Goal
After Figure 2.19Salawitch et al., Paris Climate Agreement: Beacon of Hope, 2017

Copyright © 2017 University of Maryland. This material may not be reproduced or redistributed, in whole or in part, without written permission from Ross Salawitch.
GMST since Dec 2015
27
Paris UpperLimit
Paris Goal
After Figure 2.19Salawitch et al., Paris Climate Agreement: Beacon of Hope, 2017

Copyright © 2017 University of Maryland. This material may not be reproduced or redistributed, in whole or in part, without written permission from Ross Salawitch.
GMST since Dec 2015
28
Paris UpperLimit
Paris Goal
After Figure 2.19Salawitch et al., Paris Climate Agreement: Beacon of Hope, 2017

Copyright © 2017 University of Maryland. This material may not be reproduced or redistributed, in whole or in part, without written permission from Ross Salawitch.
GMST since Dec 2015
29
Paris UpperLimit
Paris Goal
After Figure 2.19Salawitch et al., Paris Climate Agreement: Beacon of Hope, 2017

Copyright © 2017 University of Maryland. This material may not be reproduced or redistributed, in whole or in part, without written permission from Ross Salawitch.
GMST since Dec 2015
30
Paris UpperLimit
Paris Goal
After Figure 2.19
After Figure 2.19Salawitch et al., Paris Climate Agreement: Beacon of Hope, 2017

Copyright © 2017 University of Maryland. This material may not be reproduced or redistributed, in whole or in part, without written permission from Ross Salawitch.
GMST since Dec 2015
31
Paris UpperLimit
Paris Goal
After Figure 2.19Salawitch et al., Paris Climate Agreement: Beacon of Hope, 2017

Copyright © 2017 University of Maryland. This material may not be reproduced or redistributed, in whole or in part, without written permission from Ross Salawitch.
GMST since Dec 2015
32
Paris UpperLimit
Paris Goal
After Figure 2.19Salawitch et al., Paris Climate Agreement: Beacon of Hope, 2017

Copyright © 2017 University of Maryland. This material may not be reproduced or redistributed, in whole or in part, without written permission from Ross Salawitch.
GMST since Dec 2015
33
Paris UpperLimit
Paris Goal
After Figure 2.19Salawitch et al., Paris Climate Agreement: Beacon of Hope, 2017

Copyright © 2017 University of Maryland. This material may not be reproduced or redistributed, in whole or in part, without written permission from Ross Salawitch.
GMST since Dec 2015
34
Paris UpperLimit
Paris Goal
After Figure 2.19Salawitch et al., Paris Climate Agreement: Beacon of Hope, 2017

Copyright © 2017 University of Maryland. This material may not be reproduced or redistributed, in whole or in part, without written permission from Ross Salawitch.
GMST since Dec 2015
35
Paris UpperLimit
Paris Goal
After Figure 2.19Salawitch et al., Paris Climate Agreement: Beacon of Hope, 2017
Copyright © 2017 University of Maryland. This material may not be reproduced or redistributed, in whole or in part, without written permission from Ross Salawitch.
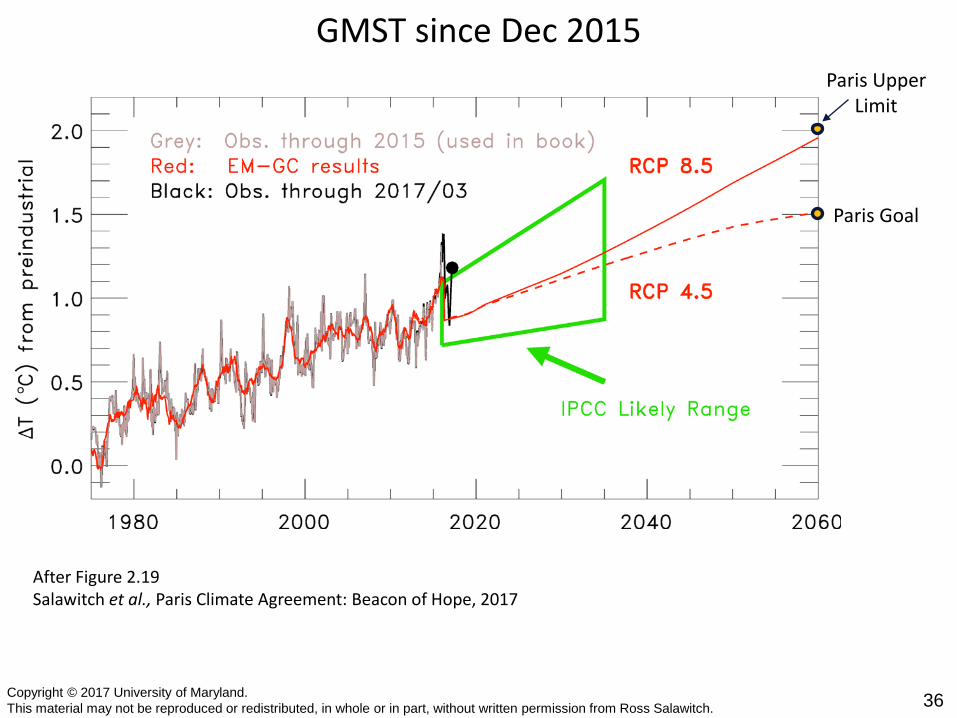
GMST since Dec 2015
36
Paris UpperLimit
Paris Goal
After Figure 2.19Salawitch et al., Paris Climate Agreement: Beacon of Hope, 2017

Copyright © 2017 University of Maryland. This material may not be reproduced or redistributed, in whole or in part, without written permission from Ross Salawitch.
GMST since Dec 2015
37
Paris UpperLimit
Paris Goal
After Figure 2.19Salawitch et al., Paris Climate Agreement: Beacon of Hope, 2017

Copyright © 2017 University of Maryland. This material may not be reproduced or redistributed, in whole or in part, without written permission from Ross Salawitch.
GMST since Dec 2015
38
Paris UpperLimit
Paris Goal
After Figure 2.19Salawitch et al., Paris Climate Agreement: Beacon of Hope, 2017
Copyright © 2017 University of Maryland. This material may not be reproduced or redistributed, in whole or in part, without written permission from Ross Salawitch.
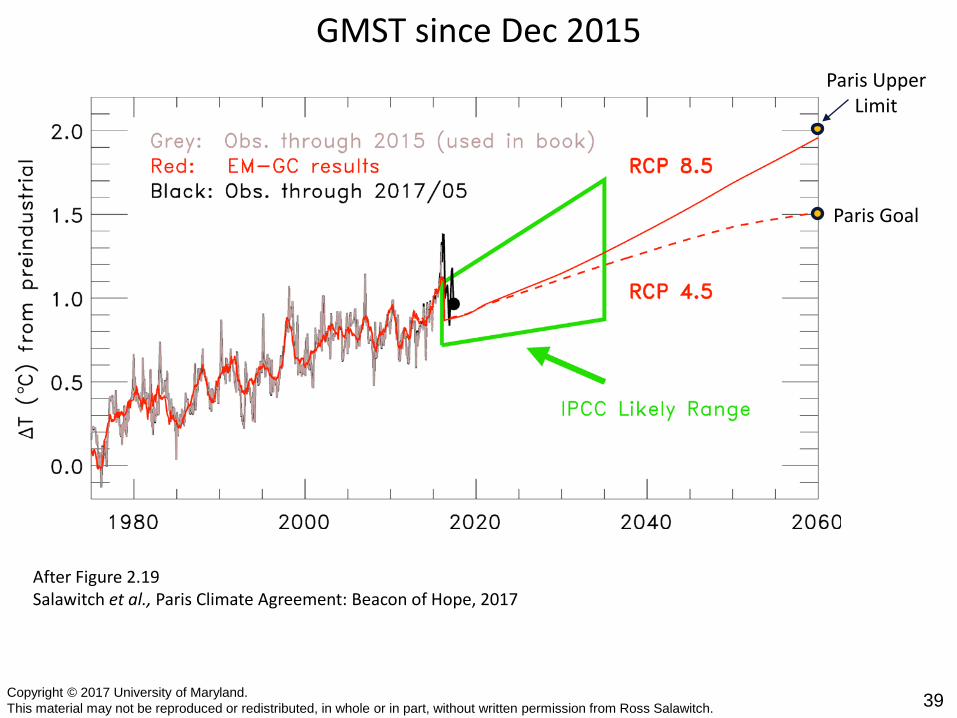
GMST since Dec 2015
39
Paris UpperLimit
Paris Goal
After Figure 2.19Salawitch et al., Paris Climate Agreement: Beacon of Hope, 2017

Copyright © 2017 University of Maryland. This material may not be reproduced or redistributed, in whole or in part, without written permission from Ross Salawitch.
GMST since Dec 2015
40
Paris UpperLimit
Paris Goal
After Figure 2.19Salawitch et al., Paris Climate Agreement: Beacon of Hope, 2017

Copyright © 2017 University of Maryland. This material may not be reproduced or redistributed, in whole or in part, without written permission from Ross Salawitch.
GMST since Dec 2015
41
Paris UpperLimit
Paris Goal
After Figure 2.19Salawitch et al., Paris Climate Agreement: Beacon of Hope, 2017

Copyright © 2017 University of Maryland. This material may not be reproduced or redistributed, in whole or in part, without written permission from Ross Salawitch.
GMST since Dec 2015
42
Paris UpperLimit
Paris Goal
After Figure 2.19Salawitch et al., Paris Climate Agreement: Beacon of Hope, 2017
Copyright © 2017 University of Maryland. This material may not be reproduced or redistributed, in whole or in part, without written permission from Ross Salawitch.
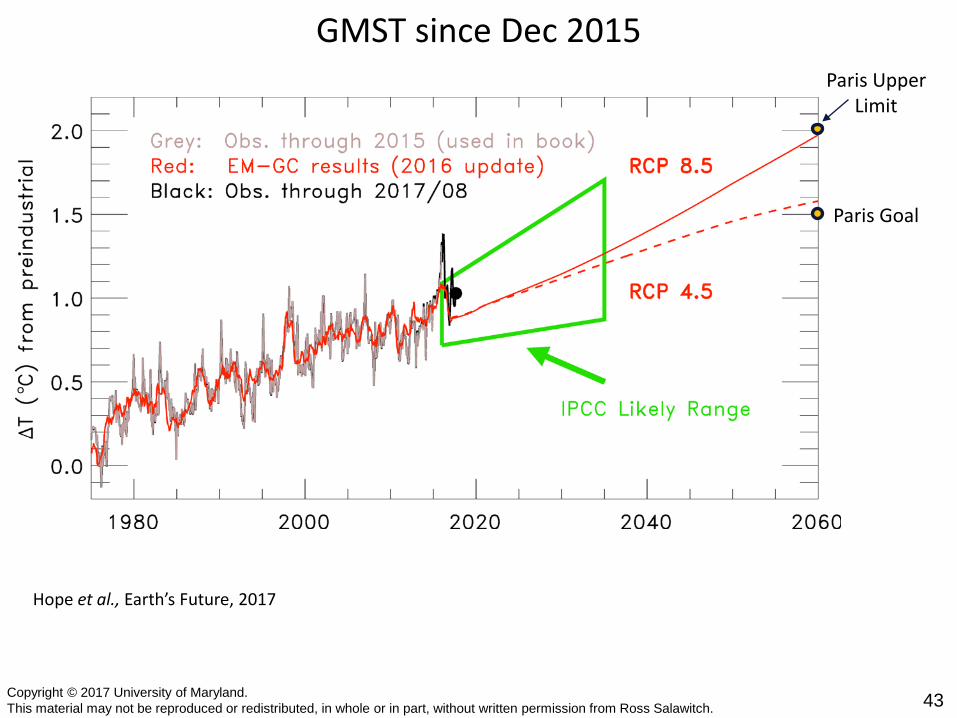
GMST since Dec 2015
43
Paris UpperLimit
Paris Goal
Hope et al., Earth’s Future, 2017
Copyright © 2017 University of Maryland. This material may not be reproduced or redistributed, in whole or in part, without written permission from Ross Salawitch.
HONR 229L: Climate Change: Science, Economics, and Governance
44
Climate Models: Perspective of a Social Scientist
Nathan Brockmeyer
9 October 2017

Copyright © 2017 University of Maryland. This material may not be reproduced or redistributed, in whole or in part, without written permission from Ross Salawitch.
IPCC Findings
45
What two findings did the IPCC say were absolutely certain?

Copyright © 2017 University of Maryland. This material may not be reproduced or redistributed, in whole or in part, without written permission from Ross Salawitch.
Finding 1
46
The IPCC stated that the greenhouse effect exists, and it warms the Earth.
How cold did the reading state the Earth would be without the greenhouse effect?

Copyright © 2017 University of Maryland. This material may not be reproduced or redistributed, in whole or in part, without written permission from Ross Salawitch.
Finding 1
47
The IPCC stated that the greenhouse effect exists, and it warms the Earth.
How cold did the reading state the Earth would be without the greenhouse effect?
-It stated that the Earth would be 0 degrees Fahrenheit without the effect.

Copyright © 2017 University of Maryland. This material may not be reproduced or redistributed, in whole or in part, without written permission from Ross Salawitch.
Finding 1
48
The IPCC stated that the greenhouse effect exists, and it warms the Earth.
How cold did the reading state the Earth would be without the greenhouse effect?
-It stated that the Earth would be 0 degrees Fahrenheit without the effect.
Does anyone know the Earth’s average annual temperature today?
Copyright © 2017 University of Maryland. This material may not be reproduced or redistributed, in whole or in part, without written permission from Ross Salawitch.
Finding 1
49
The IPCC stated that the greenhouse effect exists, and it warms the Earth.
How cold did the reading state the Earth would be without the greenhouse effect?
-It stated that the Earth would be 0 degrees Fahrenheit without the effect.
Does anyone know the Earth’s average annual temperature today?
-The average annual temperature is about 57-59 degrees Fahrenheit. This has increased even in just the past 100 years.

Copyright © 2017 University of Maryland. This material may not be reproduced or redistributed, in whole or in part, without written permission from Ross Salawitch. 50
Line of Average Temperatures, extracted for visibility
Copyright © 2017 University of Maryland. This material may not be reproduced or redistributed, in whole or in part, without written permission from Ross Salawitch.
Finding 2
51
The IPCC’s second conclusion was that humans are producing large amounts of greenhouse gases. This production of greenhouse gases is heating the climate. This in turn causes water to evaporate more, further fueling the greenhouse effect.
What is this kind of self-perpetuating behavior called? Are there some examples of the opposite kind of behavior from previous readings?

Copyright © 2017 University of Maryland. This material may not be reproduced or redistributed, in whole or in part, without written permission from Ross Salawitch.
Finding 2
52
The IPCC’s second conclusion was that humans are producing large amounts of greenhouse gases. This production of greenhouse gases is heating the climate. This in turn causes water to evaporate more, further fueling the greenhouse effect.
What is this kind of self-perpetuating behavior called? Are there some examples of the opposite kind of behavior from previous readings?
-Positive feedback

Copyright © 2017 University of Maryland. This material may not be reproduced or redistributed, in whole or in part, without written permission from Ross Salawitch.
Finding 2
53
The IPCC’s second conclusion was that humans are producing large amounts of greenhouse gases. This production of greenhouse gases is heating the climate. This in turn causes water to evaporate more, further fueling the greenhouse effect.
What is this kind of self-perpetuating behavior called? Are there some examples of the opposite kind of behavior from previous readings?
-Positive feedback
What did the reading mention as the biggest greenhouse gases, and are there any others we have talked about in previous readings that were not mentioned?

Copyright © 2017 University of Maryland. This material may not be reproduced or redistributed, in whole or in part, without written permission from Ross Salawitch.
Finding 2
54
The IPCC’s second conclusion was that humans are producing large amounts of greenhouse gases. This production of greenhouse gases is heating the climate. This in turn causes water to evaporate more, further fueling the greenhouse effect.
What is this kind of self-perpetuating behavior called? Are there some examples of the opposite kind of behavior from previous readings?
-Positive feedback
What did the reading mention as the biggest greenhouse gases, and are there any others we have talked about in previous readings that were not mentioned?
-Water vapor, CO2, CH4, CFCs, N2O, and O3

Copyright © 2017 University of Maryland. This material may not be reproduced or redistributed, in whole or in part, without written permission from Ross Salawitch.
Finding 2
55
The IPCC’s second conclusion was that humans are producing large amounts of greenhouse gases. This production of greenhouse gases is heating the climate. This in turn causes water to evaporate more, further fueling the greenhouse effect.
What is this kind of self-perpetuating behavior called? Are there some examples of the opposite kind of behavior from previous readings?
-Positive feedback
What did the reading mention as the biggest greenhouse gases, and are there any others we have talked about in previous readings that were not mentioned?
-Water vapor, CO2, CH4, CFCs, N2O, and O3
Which of these are mostly anthropogenic in origin?

Copyright © 2017 University of Maryland. This material may not be reproduced or redistributed, in whole or in part, without written permission from Ross Salawitch.
Finding 2
56
The IPCC’s second conclusion was that humans are producing large amounts of greenhouse gases. This production of greenhouse gases is heating the climate. This in turn causes water to evaporate more, further fueling the greenhouse effect.
What is this kind of self-perpetuating behavior called? Are there some examples of the opposite kind of behavior from previous readings?
-Positive feedback
What did the reading mention as the biggest greenhouse gases?-Water vapor, CO2, CH4, CFCs, N2O, and O3
Which of these are mostly anthropogenic in origin?
- CO2, CH4, CFCs, N2O, tropospheric O3

Copyright © 2017 University of Maryland. This material may not be reproduced or redistributed, in whole or in part, without written permission from Ross Salawitch. 57

Copyright © 2017 University of Maryland. This material may not be reproduced or redistributed, in whole or in part, without written permission from Ross Salawitch.
IPCC Criticism
58
What are the three types of skepticism surrounding the IPCC findings?

Copyright © 2017 University of Maryland. This material may not be reproduced or redistributed, in whole or in part, without written permission from Ross Salawitch.
Type 1
59
This type of skepticism is based on self-interest basically.
What was the example given in the reading?

Copyright © 2017 University of Maryland. This material may not be reproduced or redistributed, in whole or in part, without written permission from Ross Salawitch.
Type 1
60
This type of skepticism is based on self-interest basically.
What was the example given in the reading?
-The clearest example is fossil fuel companies, who have an interest in preserving the status quo, because it makes them money. Can you think of any other examples?

Copyright © 2017 University of Maryland. This material may not be reproduced or redistributed, in whole or in part, without written permission from Ross Salawitch.
Type 2
61
This type of skepticism is driven by groups of people that like to be contrarian.
The reading gave examples of such skeptics, from people that did not believe that smoking caused cancer, or that the ozone layer was not becoming thinner. Can you think of any examples of this in your personal life or in the world today?
Copyright © 2017 University of Maryland. This material may not be reproduced or redistributed, in whole or in part, without written permission from Ross Salawitch.
Type 3
62
This is characterized by scientific skepticism. There are scientists who disagree with some of the tenets in the IPCC findings. The reading states that scientists feel they should take these concerns into account and respect their differing points of view.
Do you agree with that?

Copyright © 2017 University of Maryland. This material may not be reproduced or redistributed, in whole or in part, without written permission from Ross Salawitch.
Type 3
63
This is characterized by scientific skepticism. There are scientists who disagree with some of the tenets in the IPCC findings. The reading states that scientists feel they should take these concerns into account and respect their differing points of view.
Do you agree with that?
-I think that dissention in the scientific community is a good thing. It pushes scientists to do their best work and provide strong evidence for their viewpoints. However, perhaps once indisputable evidence has been provided for one side or another, the community as a whole should accept that.
Copyright © 2017 University of Maryland. This material may not be reproduced or redistributed, in whole or in part, without written permission from Ross Salawitch.
Armstrong’s Principles
64
What are the three prongs of the criticism that Armstrong directed at the IPCC forecast?

Copyright © 2017 University of Maryland. This material may not be reproduced or redistributed, in whole or in part, without written permission from Ross Salawitch.
Prong 1
65
“Agreement among forecasters is not related to accuracy”Armstrong contends that agreement among forecasters may be representative of bias, just like anything else, and does not necessarily indicate the truth. The reading talks about how the IPCC tends to amalgamate various models and reduce diversity.
Do you think that independence and diversity are important in fields like this? Why?
Copyright © 2017 University of Maryland. This material may not be reproduced or redistributed, in whole or in part, without written permission from Ross Salawitch.
Prong 1
66
“Agreement among forecasters is not related to accuracy”Armstrong contends that agreement among forecasters may be representative of bias, just like anything else, and does not necessarily indicate the truth. The reading talks about how the IPCC tends to amalgamate various models and reduce diversity.
Do you think that independence and diversity are important in fields like this? Why?
-I do think that diversity is important, because sometimes one model just can’t account for everything. However, there are problems consolidating all of these independent sources to make an actual prediction.
Copyright © 2017 University of Maryland. This material may not be reproduced or redistributed, in whole or in part, without written permission from Ross Salawitch.
Prong 1
67
“Agreement among forecasters is not related to accuracy”Armstrong contends that agreement among forecasters may be representative of bias, just like anything else, and does not necessarily indicate the truth. The reading talks about how the IPCC tends to amalgamate various models and reduce diversity.
Do you think that independence and diversity are important in fields like this? Why?
-I do think that diversity is important, because sometimes one model just can’t account for everything. However, there are problems consolidating all of these independent sources to make an actual prediction.
What are some examples of times where a small minority made a big change in the scientific community? (Does not have to be climate-science related)
Copyright © 2017 University of Maryland. This material may not be reproduced or redistributed, in whole or in part, without written permission from Ross Salawitch.
Prong 2
68
The second prong of the criticism is that the complexity of the global warming problem makes it very difficult to model. Armstrong in the reading states that the more complexity that you add to models, the worse the forecast gets.
Why do you think this is?

Copyright © 2017 University of Maryland. This material may not be reproduced or redistributed, in whole or in part, without written permission from Ross Salawitch.
Prong 2
69
The second prong of the criticism is that the complexity of the global warming problem makes it very difficult to model. Armstrong in the reading states that the more complexity that you add to models, the worse the forecast gets.
Why do you think this is?
-I think that the reason the models get worse with added complexity is twofold. There is a larger chance for bugs and anomalies to derail the entire thing, and large outliers can influence the small factors necessary to make accurate predictions disproportionally.

Copyright © 2017 University of Maryland. This material may not be reproduced or redistributed, in whole or in part, without written permission from Ross Salawitch.
Prong 3
70
Armstrong states that the forecasts do not account enough for uncertainty inherent in global warming. He thinks the forecasters are overconfident.
However, the reading states that the climate forecasters are handling the uncertainty well.

Copyright © 2017 University of Maryland. This material may not be reproduced or redistributed, in whole or in part, without written permission from Ross Salawitch.
Prong 3
71
What are the three types of uncertainties in climate forecasting?

Copyright © 2017 University of Maryland. This material may not be reproduced or redistributed, in whole or in part, without written permission from Ross Salawitch.
Prong 3
72
What are the three types of uncertainties in climate forecasting?
-Initial condition uncertainty-Scenario uncertainty-Structural uncertainty
Copyright © 2017 University of Maryland. This material may not be reproduced or redistributed, in whole or in part, without written permission from Ross Salawitch.
Prong 3
73
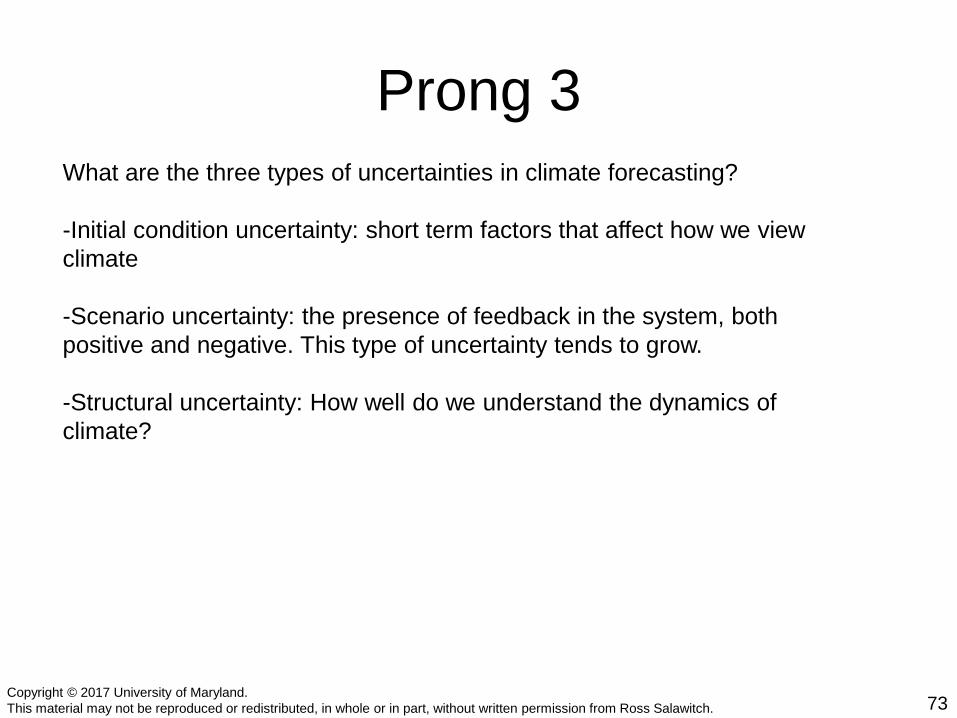
What are the three types of uncertainties in climate forecasting?
-Initial condition uncertainty: short term factors that affect how we view climate
-Scenario uncertainty: the presence of feedback in the system, both positive and negative. This type of uncertainty tends to grow.
-Structural uncertainty: How well do we understand the dynamics of climate?

Copyright © 2017 University of Maryland. This material may not be reproduced or redistributed, in whole or in part, without written permission from Ross Salawitch.
Prong 3
74
What are the three types of uncertainties in climate forecasting?
-Initial condition uncertainty: short term factors that affect how we view climate-- Examples?---El Nino? Volcanic eruptions?
-Scenario uncertainty: the presence of feedback in the system, both positive and negative. This type of uncertainty tends to grow.
-Structural uncertainty: How well do we understand the dynamics of climate?
Copyright © 2017 University of Maryland. This material may not be reproduced or redistributed, in whole or in part, without written permission from Ross Salawitch.
Prong 3
75
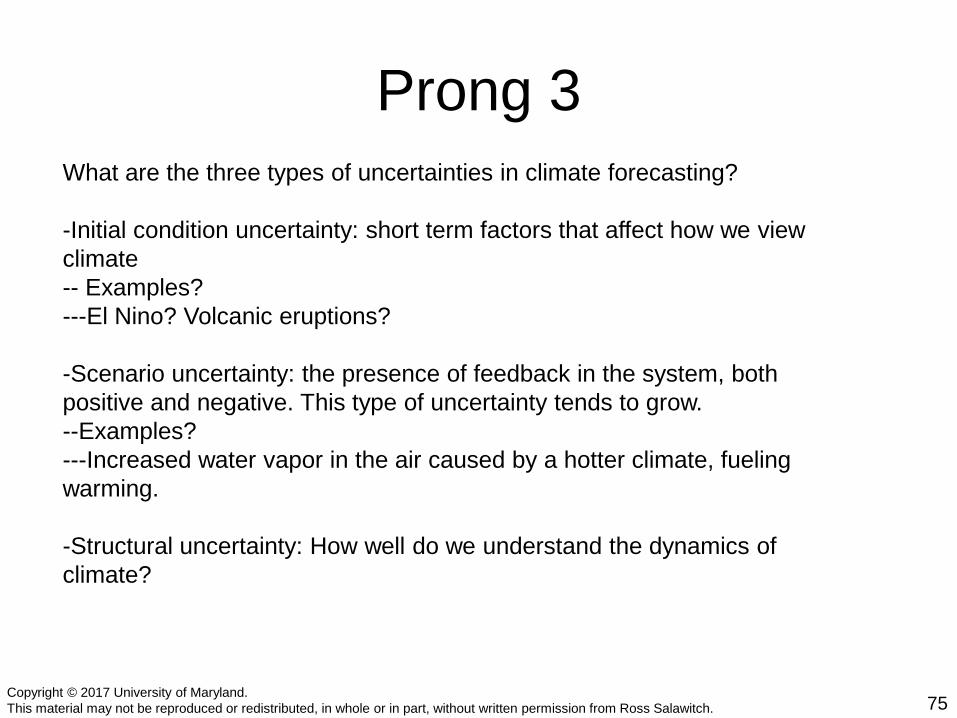
What are the three types of uncertainties in climate forecasting?
-Initial condition uncertainty: short term factors that affect how we view climate-- Examples?---El Nino? Volcanic eruptions?
-Scenario uncertainty: the presence of feedback in the system, both positive and negative. This type of uncertainty tends to grow.--Examples?---Increased water vapor in the air caused by a hotter climate, fueling warming.
-Structural uncertainty: How well do we understand the dynamics of climate?
Copyright © 2017 University of Maryland. This material may not be reproduced or redistributed, in whole or in part, without written permission from Ross Salawitch.
Prong 3
76
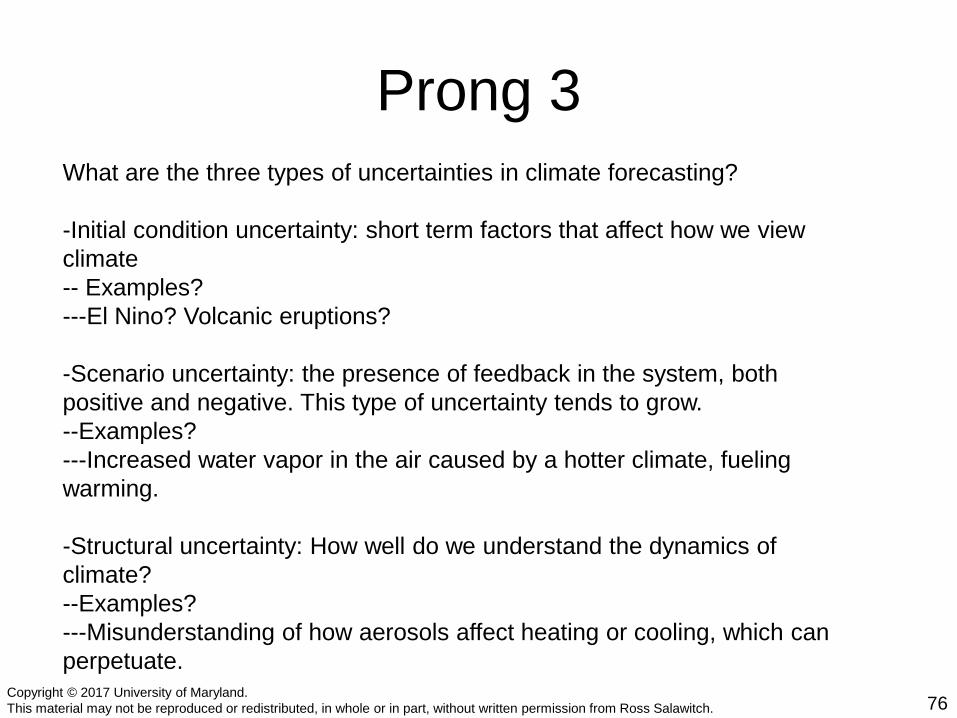
What are the three types of uncertainties in climate forecasting?
-Initial condition uncertainty: short term factors that affect how we view climate-- Examples?---El Nino? Volcanic eruptions?
-Scenario uncertainty: the presence of feedback in the system, both positive and negative. This type of uncertainty tends to grow.--Examples?---Increased water vapor in the air caused by a hotter climate, fueling warming.
-Structural uncertainty: How well do we understand the dynamics of climate?--Examples?---Misunderstanding of how aerosols affect heating or cooling, which can perpetuate.

Copyright © 2017 University of Maryland. This material may not be reproduced or redistributed, in whole or in part, without written permission from Ross Salawitch. 77

Copyright © 2017 University of Maryland. This material may not be reproduced or redistributed, in whole or in part, without written permission from Ross Salawitch.
So How Did They Do?
78
How did James Hanson and his group of six scientists fare in predicting climate changes?

Copyright © 2017 University of Maryland. This material may not be reproduced or redistributed, in whole or in part, without written permission from Ross Salawitch.
So How Did They Do?
79
How did James Hanson and his group of six scientists fare in predicting climate changes?
-Well, his predictions for Washington DC held up exactly, with 6/10 summers being considered a hot summer, just as he predicted. However, in other places, he was incorrect, which can show something about the variability of the climate.
Copyright © 2017 University of Maryland. This material may not be reproduced or redistributed, in whole or in part, without written permission from Ross Salawitch.
So How Did They Do?
80
How did James Hanson and his group of six scientists fare in predicting climate changes?
-Well, his predictions for Washington DC held up exactly, with 6/10 summers being considered a hot summer, just as he predicted. However, in other places, he was incorrect, which can show something about the variability of the climate.
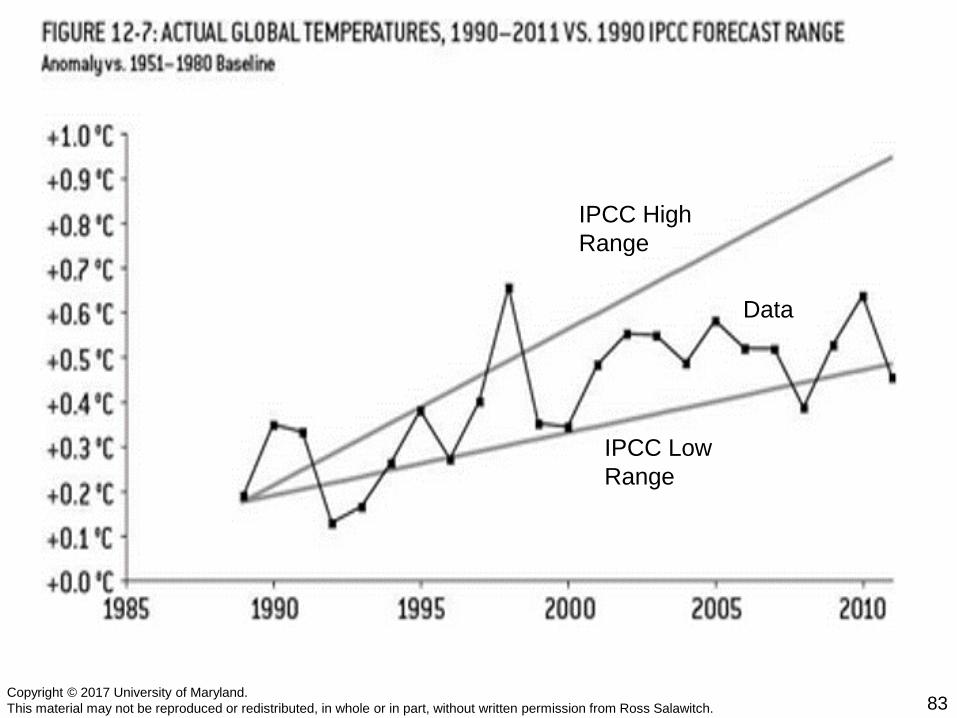
How did the IPCC in 1990 do?

Copyright © 2017 University of Maryland. This material may not be reproduced or redistributed, in whole or in part, without written permission from Ross Salawitch.
So How Did They Do?
81
How did James Hanson and his group of six scientists fare in predicting climate changes?
-Well, his predictions for Washington DC held up exactly, with 6/10 summers being considered a hot summer, just as he predicted. However, in other places, he was incorrect, which can show something about the variability of the climate.
How did the IPCC in 1990 do?
-Well, not so great. The actual rate of warming from 1990 to 2011 was about 1.2-1.5 degrees Celsius per century, which was half their likely case. So perhaps the IPCC is guessing a little high again now.
What does everyone think? Are the IPCC forecasts credible? Or do they require a bit more work?

Copyright © 2017 University of Maryland. This material may not be reproduced or redistributed, in whole or in part, without written permission from Ross Salawitch. 82
Copyright © 2017 University of Maryland. This material may not be reproduced or redistributed, in whole or in part, without written permission from Ross Salawitch. 83
IPCC High Range
IPCC Low Range
Data

Copyright © 2017 University of Maryland. This material may not be reproduced or redistributed, in whole or in part, without written permission from Ross Salawitch. 84
HONR 229L: Climate Change: Science, Economics, and Governance
Climate Models: Perspective of a Social Scientist:The Last Word
Ross Salawitch

Copyright © 2017 University of Maryland. This material may not be reproduced or redistributed, in whole or in part, without written permission from Ross Salawitch. 85
Climate Projections Driven by Prescribed GHG Levels
RCP: Representative Concentration PathwayNumber represents W m−2 RF of climate that occurs at end of this century, for each scenario
Time series of CO2, CH4, N2O as well as CFCs, O3 etc provided to climate model groups
Figure 2.1Salawitch et al., Paris Climate Agreement: Beacon of Hope, 2017

Copyright © 2017 University of Maryland. This material may not be reproduced or redistributed, in whole or in part, without written permission from Ross Salawitch. 86
In the past, tropospheric aerosols have offset GHG induced warming, but precise offset is not well known.
In the future, this “mask” is going away due to air quality concerns.
Figure 1.10Salawitch et al., Paris Climate Agreement: Beacon of Hope, 2017
Copyright © 2017 University of Maryland. This material may not be reproduced or redistributed, in whole or in part, without written permission from Ross Salawitch. 87
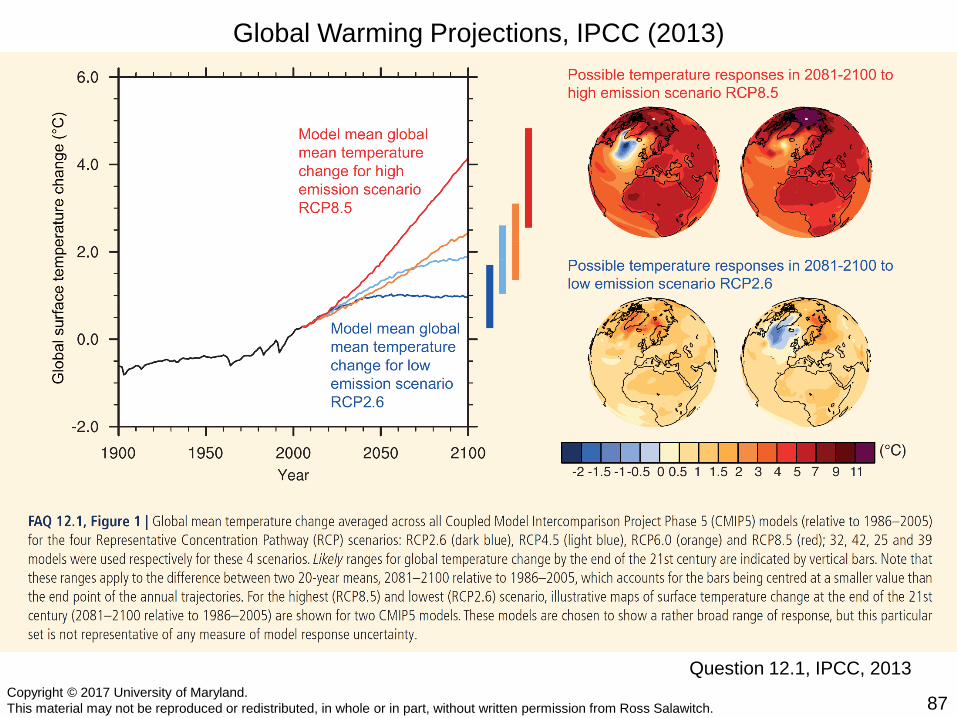
Global Warming Projections, IPCC (2013)
Question 12.1, IPCC, 2013

Copyright © 2017 University of Maryland. This material may not be reproduced or redistributed, in whole or in part, without written permission from Ross Salawitch. 88
Global Warming Projections, IPCC (2013)
Question 12.1, IPCC, 2013
Are these projections accurate ?

Copyright © 2017 University of Maryland. This material may not be reproduced or redistributed, in whole or in part, without written permission from Ross Salawitch. 89
IPCC (2013) projects 2°C rise in global mean temperature if CO2 reaches 560 ppm, twice the pre-industrial level
(CO2 reaches 560 ppm in 2053 within RCP 8.5)
Rise in global mean T, RCP 8.5,relative to 1850 to 1900 baseline:
Mean = 2.82 ± 0.41 °C
CMIP5 estimates of GMST diverge from data, past decade
ΔT : Global mean surface temperature (GMST) anomaly: i.e., rise in GMST since 1850 to 1900CMIP5: Climate Model Intercomparison Project #5: i.e., climate models used by IPCC (2013) IPCC: Intergovernmental Panel on Climate Change
Figure 2.3, Salawitch et al., Paris Climate Agreement: Beacon of Hope, 2017

Copyright © 2017 University of Maryland. This material may not be reproduced or redistributed, in whole or in part, without written permission from Ross Salawitch. 90
IPCC (2013) projects 2°C rise in global mean temperature if CO2 reaches 560 ppm, twice the pre-industrial level
(CO2 reaches 560 ppm in 2053 within RCP 8.5)
Rise in global mean T, RCP 8.5,relative to 1850 to 1900 baseline:
Mean = 2.82 ± 0.41 °C
IPCC back of the envelope projectionof “indicative likely range”of global warming, giventendency of climate modelsto run “too hot”
ΔT : Global mean surface temperature (GMST) anomaly: i.e., rise in GMST since 1850 to 1900CMIP5: Climate Model Intercomparison Project #5: i.e., climate models used by IPCC (2013) IPCC: Intergovernmental Panel on Climate Change
CMIP5 estimates of GMST diverge from data, past decade
Figure 2.3, Salawitch et al., Paris Climate Agreement: Beacon of Hope, 2017

Copyright © 2017 University of Maryland. This material may not be reproduced or redistributed, in whole or in part, without written permission from Ross Salawitch. 91
Red hatched region: likely range for annual, global mean surface temp (GMST) anomaly during 2016–2035Black bar: likely range for the 20-year mean GMST anomaly for 2016–2035
Fig 11.25b, IPCC 2013

Copyright © 2017 University of Maryland. This material may not be reproduced or redistributed, in whole or in part, without written permission from Ross Salawitch. 92
Color Bar: Probability a particular future ΔT will occur, based on the assumption that whatever value of climate feedback needed to fit past climate will persist into future
EM-GC: Empirical Model of Global Climate (i.e., Univ of Md model)CMIP5: Climate Model Intercomparison Project #5: i.e., climate models used by IPCC (2013) IPCC: Intergovernmental Panel on Climate Change
Figure 2.20, Salawitch et al., Paris Climate Agreement: Beacon of Hope, 2017

Copyright © 2017 University of Maryland. This material may not be reproduced or redistributed, in whole or in part, without written permission from Ross Salawitch. 93
Color Bar: Probability a particular future ΔT will occur, based on the assumption that whatever value of climate feedback needed to fit past climate will persist into future
EM-GC: Empirical Model of Global Climate (i.e., Univ of Md model)CMIP5: Climate Model Intercomparison Project #5: i.e., climate models used by IPCC (2013) IPCC: Intergovernmental Panel on Climate Change
Figure 2.19, Salawitch et al., Paris Climate Agreement: Beacon of Hope, 2017

Copyright © 2017 University of Maryland. This material may not be reproduced or redistributed, in whole or in part, without written permission from Ross Salawitch. 94
Figure 10, Summary for Policy Makers, IPCC (2013)
RemainingEmissions
http://www.ipcc.ch/report/graphics/images/Assessment%20Reports/AR5%20-%20WG1/SPM/thumbnail/FigSPM-10.jpg

Copyright © 2017 University of Maryland. This material may not be reproduced or redistributed, in whole or in part, without written permission from Ross Salawitch. 95
Our rendition of CMIP5 Multi-model mean
RemainingEmissions:
~1450 Gt CO2

Copyright © 2017 University of Maryland. This material may not be reproduced or redistributed, in whole or in part, without written permission from Ross Salawitch. 96
Our rendition of CMIP5 Multi-model mean & results from a recent paper
RemainingEmissions:
~2000 Gt CO2
http://www.nature.com/ngeo/journal/v10/n10/full/ngeo3031.html
Millar et al.,Nature Geoscience, 2017

Copyright © 2017 University of Maryland. This material may not be reproduced or redistributed, in whole or in part, without written permission from Ross Salawitch. 97
Our rendition of CMIP5 Multi-model mean & results from a recent paper & our own projections
RemainingEmissions:
~3200 Gt CO2
Hope et al. Earth’s Future2017
Copyright © 2017 University of Maryland. This material may not be reproduced or redistributed, in whole or in part, without written permission from Ross Salawitch. 98
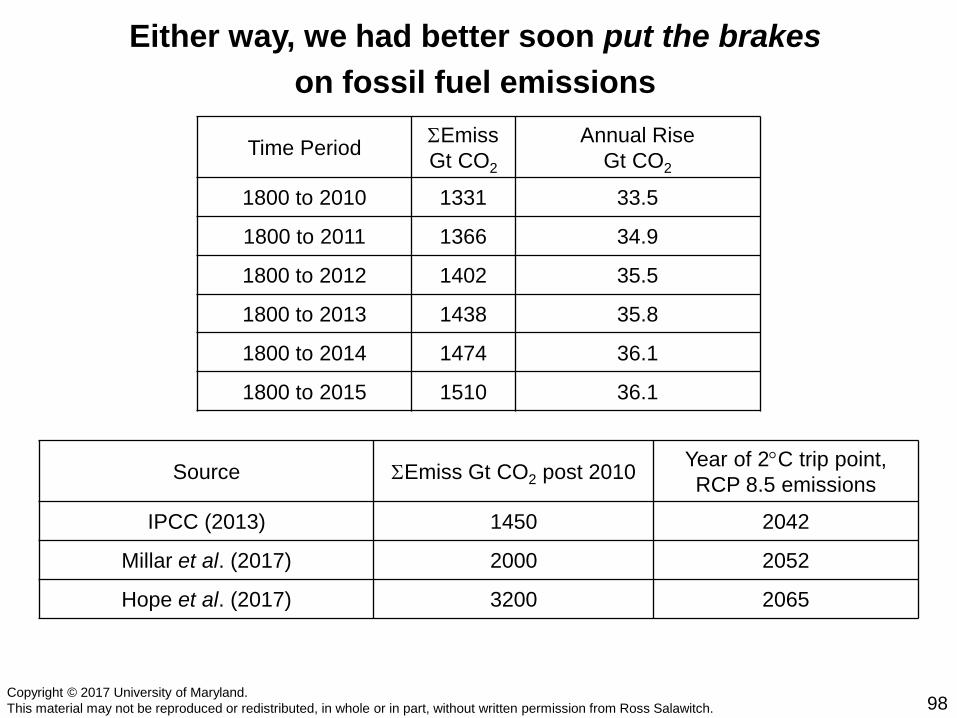
Either way, we had better soon put the brakeson fossil fuel emissions
Time Period ΣEmissGt CO2
Annual RiseGt CO2
1800 to 2010 1331 33.5
1800 to 2011 1366 34.9
1800 to 2012 1402 35.5
1800 to 2013 1438 35.8
1800 to 2014 1474 36.1
1800 to 2015 1510 36.1
Source ΣEmiss Gt CO2 post 2010 Year of 2°C trip point,RCP 8.5 emissions
IPCC (2013) 1450 2042
Millar et al. (2017) 2000 2052
Hope et al. (2017) 3200 2065

Copyright © 2017 University of Maryland. This material may not be reproduced or redistributed, in whole or in part, without written permission from Ross Salawitch.
Figure 4.2, Salawitch et al., Paris Climate Agreement: Beacon of Hope, 2017

Copyright © 2017 University of Maryland. This material may not be reproduced or redistributed, in whole or in part, without written permission from Ross Salawitch.
Figure 4.3, Salawitch et al., Paris Climate Agreement: Beacon of Hope, 2017

Copyright © 2017 University of Maryland. This material may not be reproduced or redistributed, in whole or in part, without written permission from Ross Salawitch.
CCS: Carbon Capture and Sequestration
Figure 4.5, Salawitch et al., Paris Climate Agreement: Beacon of Hope, 2017

Copyright © 2017 University of Maryland. This material may not be reproduced or redistributed, in whole or in part, without written permission from Ross Salawitch. 102
And if this is not enough to think about, how about this:
https://www.washingtonpost.com/news/energy-environment/wp/2017/10/09/pruitt-tells-coal-miners-he-will-repeal-power-plan-rule-tuesday-the-war-on-coal-is-over


