Hong Kong BUY Texwinca - Kim · PDF fileHong Kong Reinitiating Coverage 18 May 2012 Texwinca...
14
SEE APPENDIX I FOR IMPORTANT DISCLOSURES AND ANALYST CERTIFICATIONS Hong Kong Reinitiating Coverage 18 May 2012 Texwinca Defensive and recovering Reinitiate with BUY. We resume coverage on Texwinca with a BUY rating. We like the company because of its market leading position and its continuous gain of textile market share, improving profitability in both the textile and retail businesses in FY3/13 and stable dividend yield. Our target price for Texwinca is HKD10.83, implying 25% upside from the current price level. Our projected FY3/13 earnings are 7.3% ahead of the street and we believe market has yet to price in the margin recovery story. Better gross margin going forward amid stable cotton prices Cotton prices have been high at more than CNY30,000/tonne in early 2011 and have stabilized at CNY16,000/tonne in recent months. We believe gross margin from the textile business segment to improve by 1.6ppts to 20% in FY3/13 amid a more stable cotton price. Continues to gain market share in textile business. Texwinca is gaining market share at the expense of small players that are being forced out of the industry due to failure to comply with environmental regulations as well as the high volatility of cotton prices. Retail business. We expect retail sales to grow by 21%/13% in FY3/12 and FY3/13, respectively on the back of 15%/10% SSSG and 3%/3% in store expansions. While the operating margin is not currently up to par, we believe that once operating leverage kicks in, the improving operating margin will serve a re-rating catalyst. Stable dividend yield and undemanding valuation Based on its track record, the company has been generous on its dividend payout. Historic yield is 6.1% on the current share price. Management believes dividends are likely to increase. We expect yields to be 6.6%/8.0% in FY3/12 and FY3/13, assuming a 65% payout. Our target price of HKD 10.83 is pegged to a SOTP valuation, with target FY3/13 PER of 10.2x. The stock trades at 8.1x FY3/13 PER, which is undemanding. Reinitiate with BUY. Texwinca – Summary Earnings Table FYE Mar (HKDm) 2010A 2011A 2012F 2013F Revenue 10,538.0 11,861.8 13,621.4 15,110.7 EBITDA 1,185.5 495.6 721.0 917.0 Recurring Net Profit 1,007.2 1,133.2 1,203.8 1,447.9 Recurring Basic EPS (cents) 75.8 84.3 88.4 106.4 EPS growth (%) 17.0 11.2 4.9 20.3 DPS (cents) 40.0 53.0 57.5 69.1 PER 11.4 10.3 9.8 8.1 EV/EBITDA (x) 6.8 4.4 4.1 3.3 Div Yield (%) 4.6 6.1 6.6 8.0 P/BV(x) 2.9 2.1 1.9 1.7 Net Gearing (%) Net Cash Net Cash Net Cash Net Cash ROE (%) 22.2 22.0 20.6 21.8 ROA (%) 13.4 11.0 9.3 10.2 Consensus Net Profit (HKDm) N/A N/A 1,201.8 1,348.8 Source: Company data, Kim Eng Securities BUY Share price: HKD8.66 Target price: HKD10.83 Samantha KWONG [email protected] (852) 2268 0640 Stock Information Description: Texwinca is engaged in textile business since 1975. It is then entered into retail business in 1996 with its major brand Baleno. Ticker: 321 HK Shares Issued (m): 1,361 Market Cap (USDm): 1,518 3-mth Avg Daily Turnover (USDm): 1.49 HSI: 19,894 Free Float (%): 45.8 Major Shareholders: % Giant Wizard Corp 33.53 Farrow Star LTd 12.4 Fidelity Management 6.01 Key Indicators ROE – annualized (%) 22.0 Net cash (HKDm): 1,461 NTA/shr (HKD): 4.1 Interest cover (x): 55 Historical Chart Performance: 52-week High/Low HKD11.12/HKD6.80 1-mth 3-mth 6-mth 1-yr YTD Absolute (%) (7.5) (9.6) (6.4) (2.3) 0.5 Relative (%) (0.9) 1.1 (8.4) 13.9 (3.7) 5.0 7.0 9.0 11.0 13.0 15.0 17.0 19.0 May 11 Jul 11 Sep 11 Nov 11 Jan 12 Mar 12 May 12 PRICE PRICE REL. TO HANG SENG INDEX Source: Bloomberg
Transcript of Hong Kong BUY Texwinca - Kim · PDF fileHong Kong Reinitiating Coverage 18 May 2012 Texwinca...
SEE APPENDIX I FOR IMPORTANT DISCLOSURES AND ANALYST CERTIFICATIONS
Hong KongReinitiating Coverage 18 May 2012
Texwinca Defensive and recovering Reinitiate with BUY. We resume coverage on Texwinca with a BUY rating. We like the company because of its market leading position and its continuous gain of textile market share, improving profitability in both the textile and retail businesses in FY3/13 and stable dividend yield. Our target price for Texwinca is HKD10.83, implying 25% upside from the current price level. Our projected FY3/13 earnings are 7.3% ahead of the street and we believe market has yet to price in the margin recovery story.
Better gross margin going forward amid stable cotton prices Cotton prices have been high at more than CNY30,000/tonne in early 2011 and have stabilized at CNY16,000/tonne in recent months. We believe gross margin from the textile business segment to improve by 1.6ppts to 20% in FY3/13 amid a more stable cotton price.
Continues to gain market share in textile business. Texwinca is gaining market share at the expense of small players that are being forced out of the industry due to failure to comply with environmental regulations as well as the high volatility of cotton prices.
Retail business. We expect retail sales to grow by 21%/13% in FY3/12 and FY3/13, respectively on the back of 15%/10% SSSG and 3%/3% in store expansions. While the operating margin is not currently up to par, we believe that once operating leverage kicks in, the improving operating margin will serve a re-rating catalyst.
Stable dividend yield and undemanding valuation Based on its track record, the company has been generous on its dividend payout. Historic yield is 6.1% on the current share price. Management believes dividends are likely to increase. We expect yields to be 6.6%/8.0% in FY3/12 and FY3/13, assuming a 65% payout. Our target price of HKD 10.83 is pegged to a SOTP valuation, with target FY3/13 PER of 10.2x. The stock trades at 8.1x FY3/13 PER, which is undemanding. Reinitiate with BUY.
Texwinca – Summary Earnings Table FYE Mar (HKDm) 2010A 2011A 2012F 2013FRevenue 10,538.0 11,861.8 13,621.4 15,110.7EBITDA 1,185.5 495.6 721.0 917.0Recurring Net Profit 1,007.2 1,133.2 1,203.8 1,447.9Recurring Basic EPS (cents) 75.8 84.3 88.4 106.4EPS growth (%) 17.0 11.2 4.9 20.3DPS (cents) 40.0 53.0 57.5 69.1 PER 11.4 10.3 9.8 8.1EV/EBITDA (x) 6.8 4.4 4.1 3.3Div Yield (%) 4.6 6.1 6.6 8.0P/BV(x) 2.9 2.1 1.9 1.7 Net Gearing (%) Net Cash Net Cash Net Cash Net CashROE (%) 22.2 22.0 20.6 21.8ROA (%) 13.4 11.0 9.3 10.2Consensus Net Profit (HKDm) N/A N/A 1,201.8 1,348.8Source: Company data, Kim Eng Securities
BUY
Share price: HKD8.66 Target price: HKD10.83
Samantha KWONG [email protected] (852) 2268 0640
Stock Information
Description: Texwinca is engaged in textile business since 1975. It is then entered into retail business in 1996 with its major brand Baleno. Ticker: 321 HK Shares Issued (m): 1,361 Market Cap (USDm): 1,518 3-mth Avg Daily Turnover (USDm): 1.49 HSI: 19,894 Free Float (%): 45.8 Major Shareholders: % Giant Wizard Corp 33.53 Farrow Star LTd 12.4 Fidelity Management 6.01 Key Indicators
ROE – annualized (%) 22.0 Net cash (HKDm): 1,461 NTA/shr (HKD): 4.1 Interest cover (x): 55 Historical Chart
Performance: 52-week High/Low HKD11.12/HKD6.80 1-mth 3-mth 6-mth 1-yr YTD Absolute (%) (7.5) (9.6) (6.4) (2.3) 0.5 Relative (%) (0.9) 1.1 (8.4) 13.9 (3.7)
5.0
7.0
9.0
11.0
13.0
15.0
17.0
19.0
May 11 Jul 11 Sep 11 Nov 11 Jan 12 Mar 12 May 12
PRICE PRICE REL. TO HANG SENG INDEX
Source: Bloomberg
18 May 2012 Page 2 of 14
Texwinca Holdings Ltd
Textile business
Strong textile player globally. Texwinca has been engaged in the textile business since 1975. Now, it is one of the global market leaders in the knitted textile industry with a market share of approximately 4.5% in terms of revenues, according to management. The company has a large client base. Major international customers include Walmart, JC Penny, Gap, Abercrombie & Fitch, American Eagle outfitters and Uniqlo.
Figure 1: Major clients of textile business
Source: Company data, Kim Eng Securities
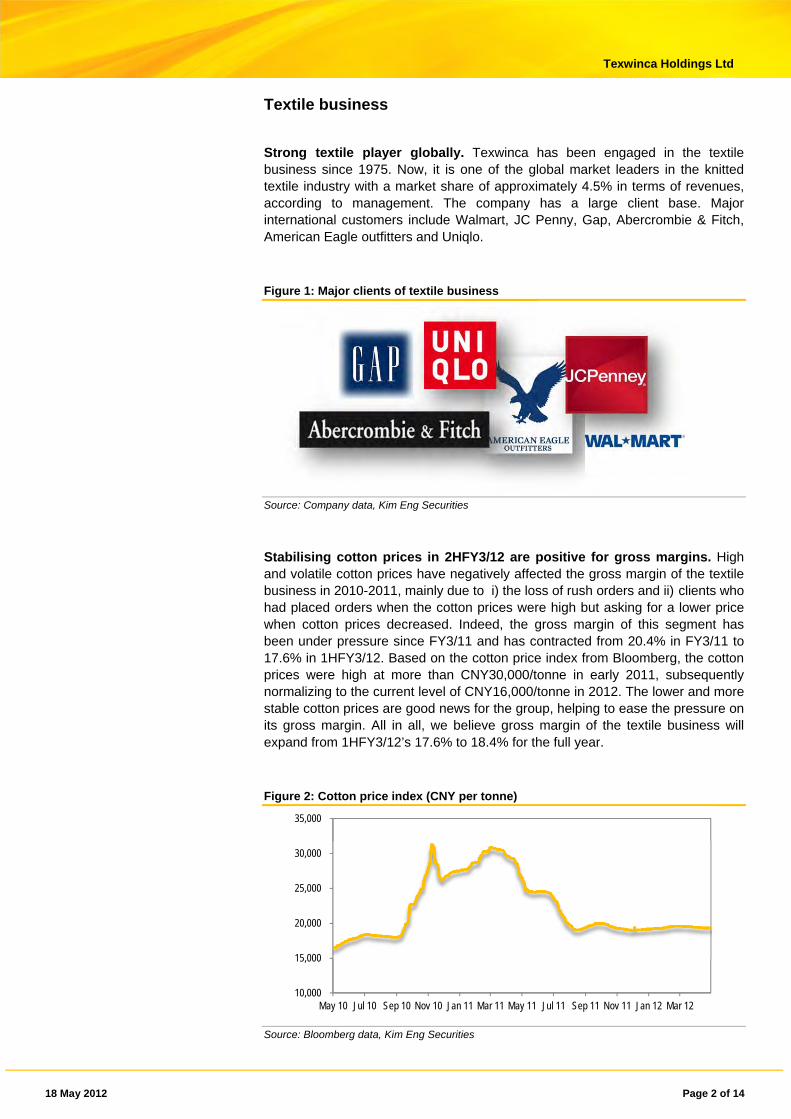
Stabilising cotton prices in 2HFY3/12 are positive for gross margins. High and volatile cotton prices have negatively affected the gross margin of the textile business in 2010-2011, mainly due to i) the loss of rush orders and ii) clients who had placed orders when the cotton prices were high but asking for a lower price when cotton prices decreased. Indeed, the gross margin of this segment has been under pressure since FY3/11 and has contracted from 20.4% in FY3/11 to 17.6% in 1HFY3/12. Based on the cotton price index from Bloomberg, the cotton prices were high at more than CNY30,000/tonne in early 2011, subsequently normalizing to the current level of CNY16,000/tonne in 2012. The lower and more stable cotton prices are good news for the group, helping to ease the pressure on its gross margin. All in all, we believe gross margin of the textile business will expand from 1HFY3/12’s 17.6% to 18.4% for the full year.
Figure 2: Cotton price index (CNY per tonne)
Source: Bloomberg data, Kim Eng Securities
10,000
15,000
20,000
25,000
30,000
35,000
May 10 Jul 10 Sep 10 Nov 10 Jan 11 Mar 11 May 11 Jul 11 Sep 11 Nov 11 Jan 12 Mar 12
18 May 2012 Page 3 of 14
Texwinca Holdings Ltd
Industry continues to undergo consolidation. The Guangdong government has been enforcing environmental protection regulations since 2006. Texwinca is one of the players in the textile industry which has an effective effluent-discharging system, enabling it to dispose of waste water in compliance with the regulations, while many small players without these systems were forced out of business. In addition, cotton prices have been very volatile since 2010, wiping out small competitors with limited cash flow and resulting in further market share gains for Texwinca.
High entry barriers. Following the implementation of the environmental regulations, entry barriers to the textile industry have become high. Start-up costs are substantial, as new entrants would require at least HKD1-2b to build their production facilities to comply with the environmental regulations.
18 May 2012 Page 4 of 14
Texwinca Holdings Ltd
Retail business
Texwinca entered the retailing business in 1996. While the company targets solely the casual wear mass market segment, it adopts a multi-branding strategy to capture sales potential in different age groups. Baleno has been the group’s core brand. As of FY3/11, Baleno accounted for 53% of the total retail revenue while Samuel & Kevin, IP Zone and ebase account for the remaining 47%.
Figure 3: Retail brands
Source: Company data, Kim Eng Securities
Good decision to exit non-profitable markets and focus on profitable China. Texwinca has a retail presence in Southeast Asia including China, Taiwan, Hong Kong & Macau, Malaysia and Singapore. However, owing to relatively weak brand equity and lack of profitability in Malaysia and Singapore, management decided to exit these two markets in 2010. Closing down all nonprofitable retail
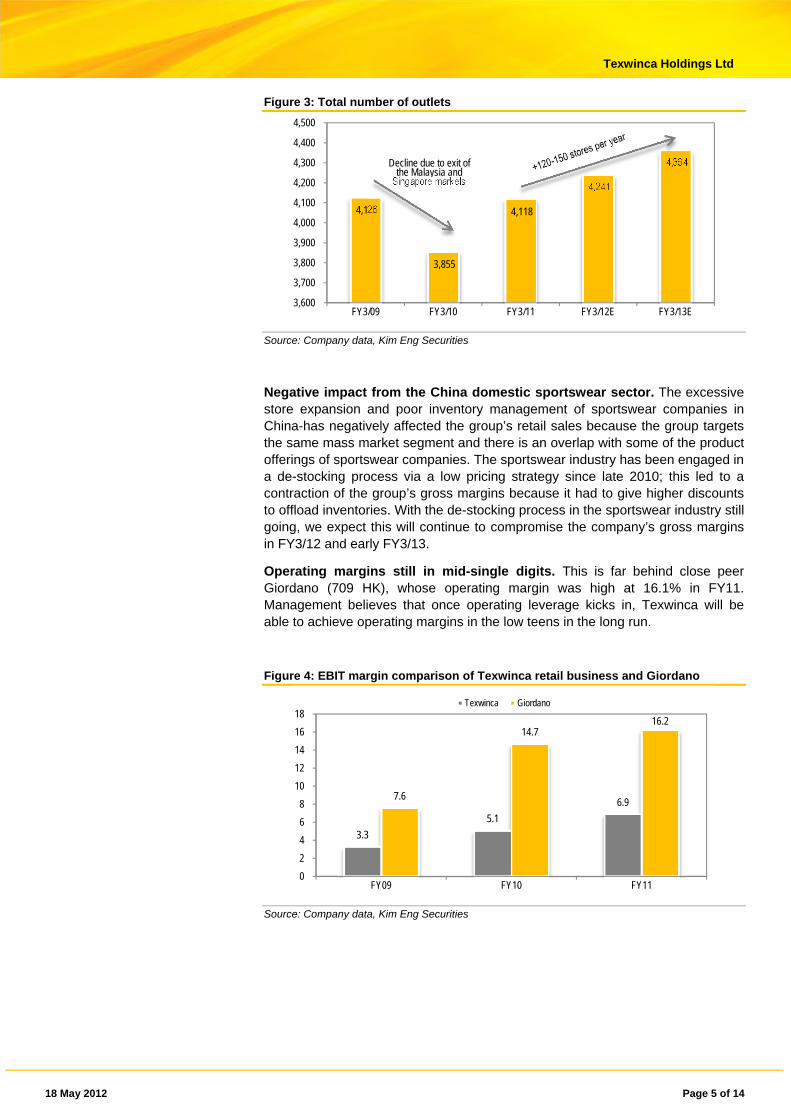
stores in both Malaysia and Singapore during late FY3/10 and early FY3/11 proved to be a good decision: SSSG surged from 3.7% in FY3/09 to 13.8% in FY3/11 while operating margins expanded from 3.3% in FY3/09 to 6.9% in FY3/11. Management continues to focus its retail presence on Mainland China and targets to add 120-150 stores per year in next few years.
Extensive network in China; adopts dual distribution model. As of FY3/11, the company has an extensive network of 3,089 stores in mainland China. The company adopts a dual distribution model, in which 82% of the outlets are self-managed while 18% are franchised. The rationale is simple: to have a better control on inventories and brand management with the self-managed retail stores while exploring regions where they have limited connections via the franchised stores.
18 May 2012 Page 5 of 14
Texwinca Holdings Ltd
Figure 3: Total number of outlets
Source: Company data, Kim Eng Securities
Negative impact from the China domestic sportswear sector. The excessive store expansion and poor inventory management of sportswear companies in China-has negatively affected the group’s retail sales because the group targets the same mass market segment and there is an overlap with some of the product offerings of sportswear companies. The sportswear industry has been engaged in a de-stocking process via a low pricing strategy since late 2010; this led to a contraction of the group’s gross margins because it had to give higher discounts to offload inventories. With the de-stocking process in the sportswear industry still going, we expect this will continue to compromise the company’s gross margins in FY3/12 and early FY3/13.
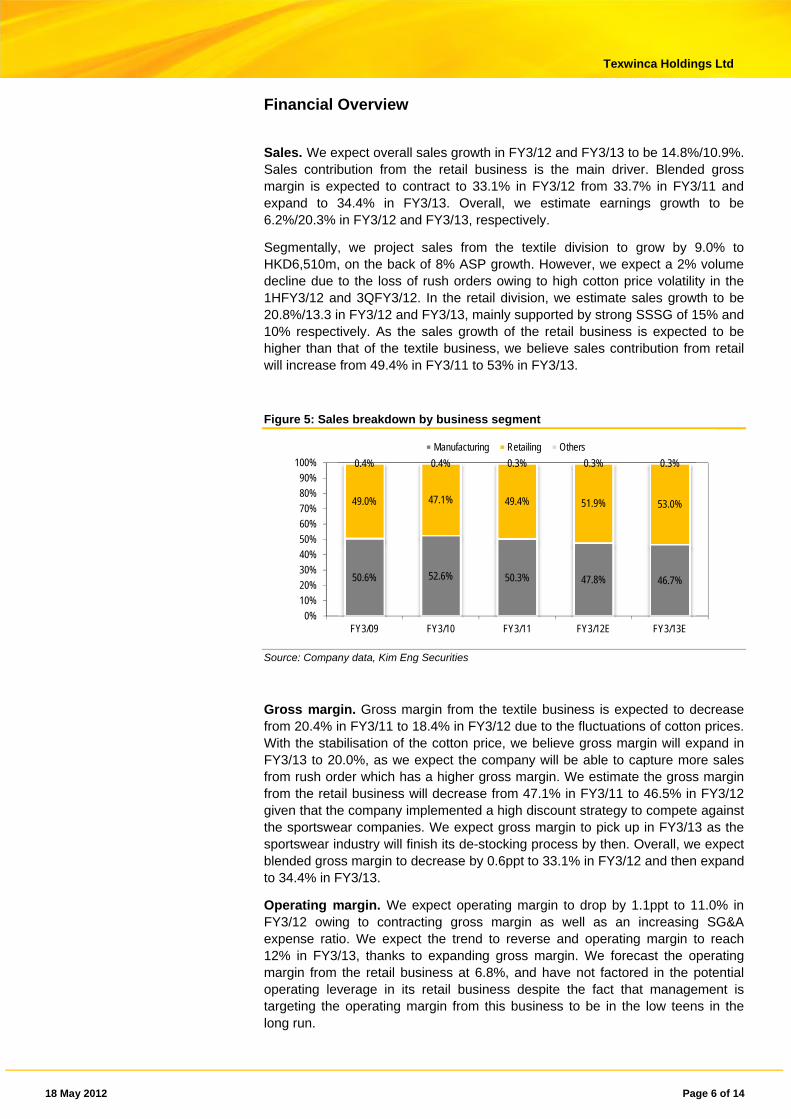
Operating margins still in mid-single digits. This is far behind close peer Giordano (709 HK), whose operating margin was high at 16.1% in FY11. Management believes that once operating leverage kicks in, Texwinca will be able to achieve operating margins in the low teens in the long run.
Figure 4: EBIT margin comparison of Texwinca retail business and Giordano
Source: Company data, Kim Eng Securities
4,126
3,855
4,118
4,241
4,364
3,600
3,700
3,800
3,900
4,000
4,100
4,200
4,300
4,400
4,500
FY3/09 FY3/10 FY3/11 FY3/12E FY3/13E
Decline due to exit of the Malaysia and
Singapore markets
3.3
5.1
6.97.6
14.716.2
0
2
4
6
8
10
12
14
16
18
FY09 FY10 FY11
Texwinca Giordano
18 May 2012 Page 6 of 14
Texwinca Holdings Ltd
Financial Overview
Sales. We expect overall sales growth in FY3/12 and FY3/13 to be 14.8%/10.9%. Sales contribution from the retail business is the main driver. Blended gross margin is expected to contract to 33.1% in FY3/12 from 33.7% in FY3/11 and expand to 34.4% in FY3/13. Overall, we estimate earnings growth to be 6.2%/20.3% in FY3/12 and FY3/13, respectively.
Segmentally, we project sales from the textile division to grow by 9.0% to HKD6,510m, on the back of 8% ASP growth. However, we expect a 2% volume decline due to the loss of rush orders owing to high cotton price volatility in the 1HFY3/12 and 3QFY3/12. In the retail division, we estimate sales growth to be 20.8%/13.3 in FY3/12 and FY3/13, mainly supported by strong SSSG of 15% and 10% respectively. As the sales growth of the retail business is expected to be higher than that of the textile business, we believe sales contribution from retail will increase from 49.4% in FY3/11 to 53% in FY3/13.
Figure 5: Sales breakdown by business segment
Source: Company data, Kim Eng Securities
Gross margin. Gross margin from the textile business is expected to decrease from 20.4% in FY3/11 to 18.4% in FY3/12 due to the fluctuations of cotton prices. With the stabilisation of the cotton price, we believe gross margin will expand in FY3/13 to 20.0%, as we expect the company will be able to capture more sales from rush order which has a higher gross margin. We estimate the gross margin from the retail business will decrease from 47.1% in FY3/11 to 46.5% in FY3/12 given that the company implemented a high discount strategy to compete against the sportswear companies. We expect gross margin to pick up in FY3/13 as the sportswear industry will finish its de-stocking process by then. Overall, we expect blended gross margin to decrease by 0.6ppt to 33.1% in FY3/12 and then expand to 34.4% in FY3/13.
Operating margin. We expect operating margin to drop by 1.1ppt to 11.0% in FY3/12 owing to contracting gross margin as well as an increasing SG&A expense ratio. We expect the trend to reverse and operating margin to reach 12% in FY3/13, thanks to expanding gross margin. We forecast the operating margin from the retail business at 6.8%, and have not factored in the potential operating leverage in its retail business despite the fact that management is targeting the operating margin from this business to be in the low teens in the long run.
50.6% 52.6% 50.3% 47.8% 46.7%
49.0% 47.1% 49.4% 51.9% 53.0%
0.4% 0.4% 0.3% 0.3% 0.3%
0%
10%
20%
30%
40%
50%
60%
70%
80%
90%
100%
FY3/09 FY3/10 FY3/11 FY3/12E FY3/13E
Manufacturing Retailing Others
18 May 2012 Page 7 of 14
Texwinca Holdings Ltd
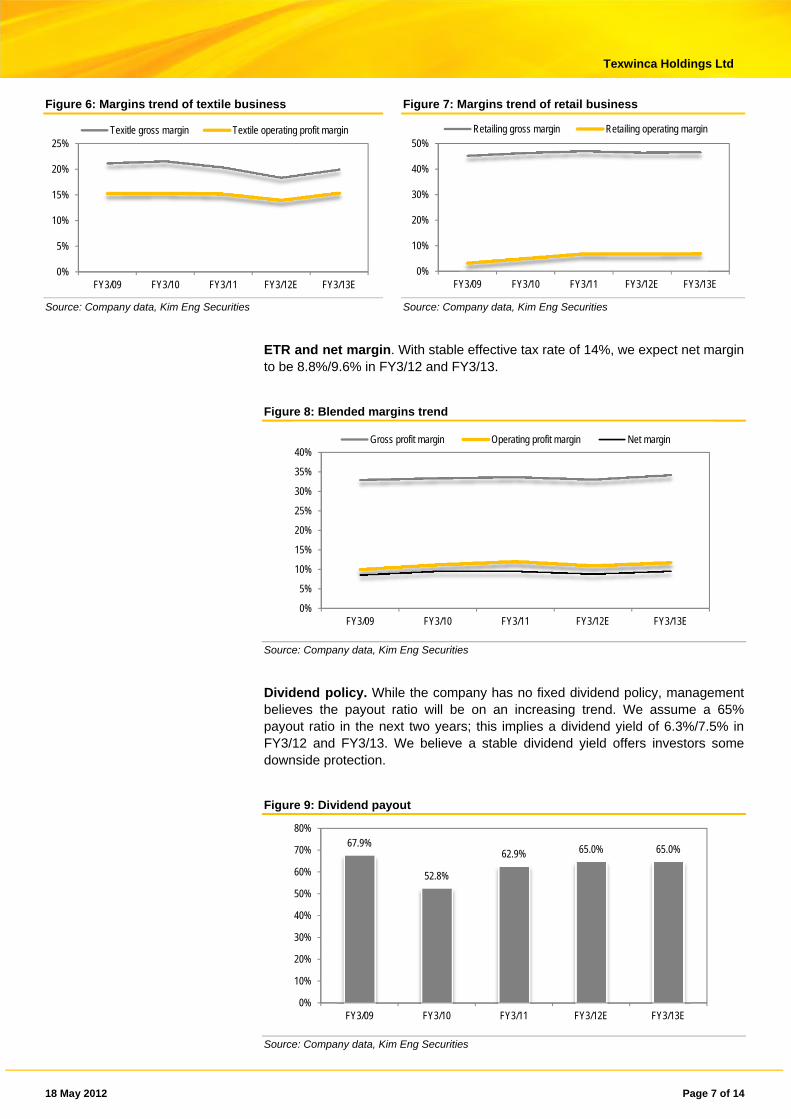
Figure 6: Margins trend of textile business Figure 7: Margins trend of retail business
Source: Company data, Kim Eng Securities Source: Company data, Kim Eng Securities
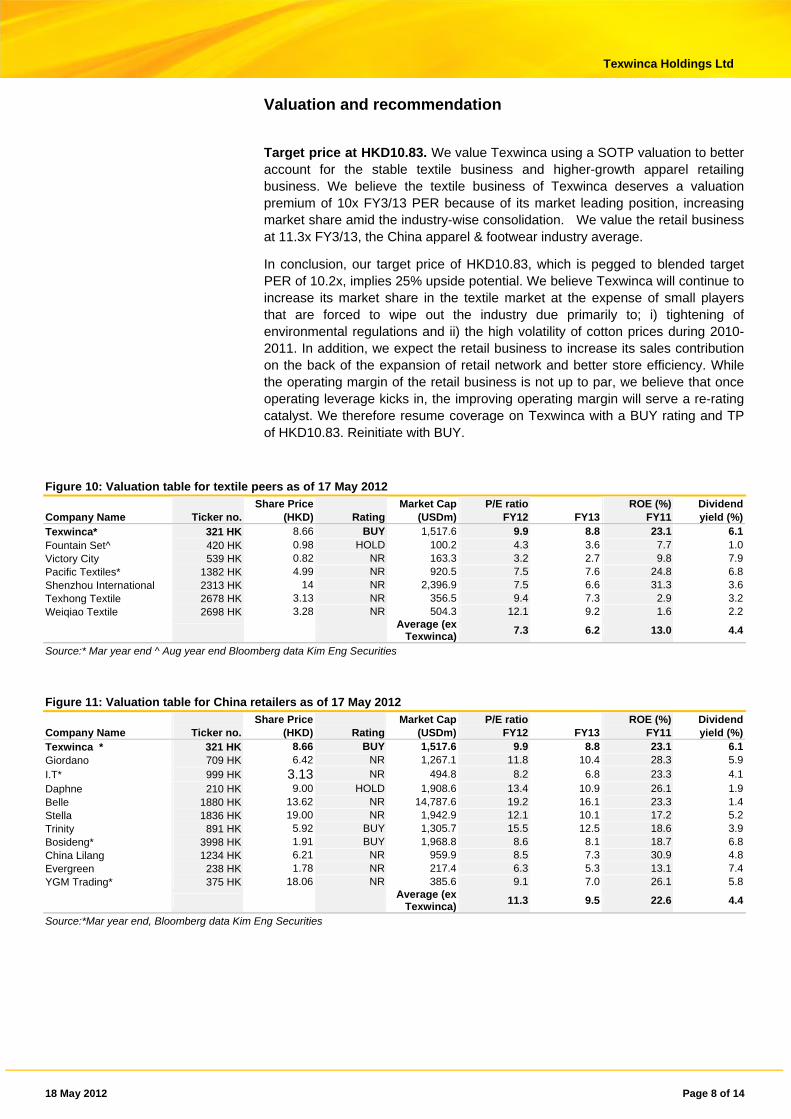
ETR and net margin. With stable effective tax rate of 14%, we expect net margin to be 8.8%/9.6% in FY3/12 and FY3/13.
Figure 8: Blended margins trend
Source: Company data, Kim Eng Securities
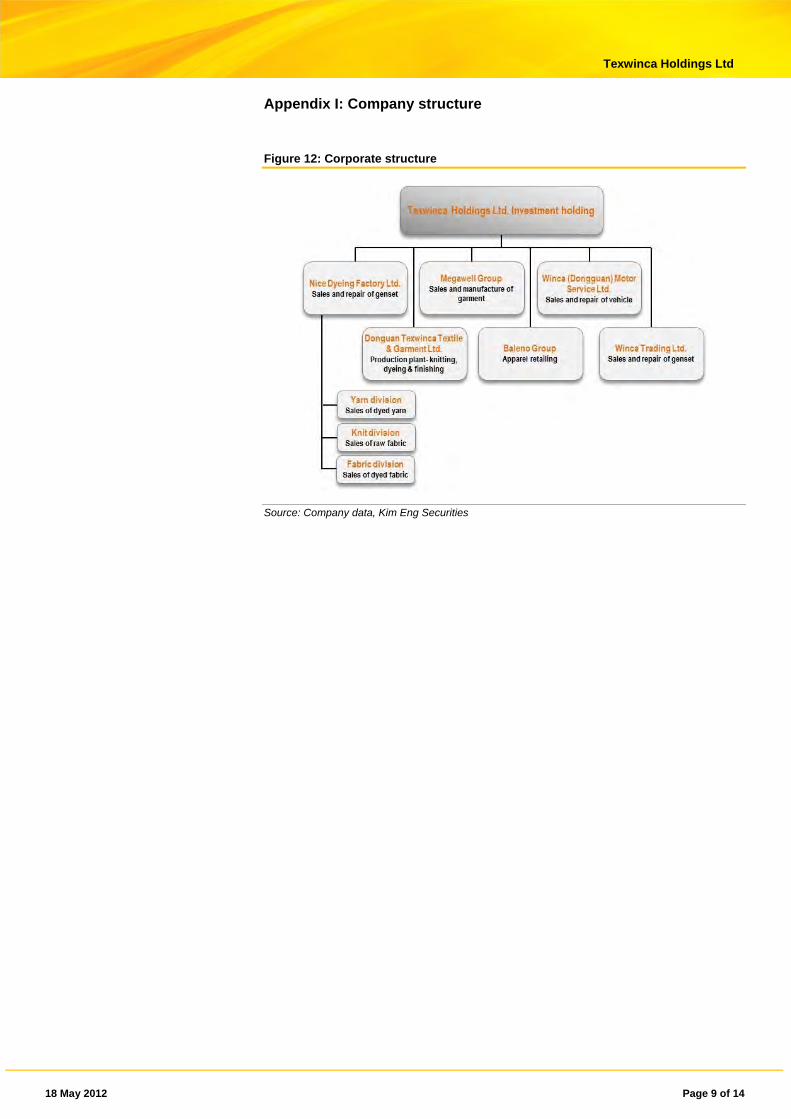
Dividend policy. While the company has no fixed dividend policy, management believes the payout ratio will be on an increasing trend. We assume a 65% payout ratio in the next two years; this implies a dividend yield of 6.3%/7.5% in FY3/12 and FY3/13. We believe a stable dividend yield offers investors some downside protection.
Figure 9: Dividend payout
Source: Company data, Kim Eng Securities
0%
5%
10%
15%
20%
25%
FY3/09 FY3/10 FY3/11 FY3/12E FY3/13E
Texitle gross margin Textile operating profit margin
0%
10%
20%
30%
40%
50%
FY3/09 FY3/10 FY3/11 FY3/12E FY3/13E
Retailing gross margin Retailing operating margin
0%
5%
10%
15%
20%
25%
30%
35%
40%
FY3/09 FY3/10 FY3/11 FY3/12E FY3/13E
Gross profit margin Operating profit margin Net margin
67.9%
52.8%
62.9% 65.0% 65.0%
0%
10%
20%
30%
40%
50%
60%
70%
80%
FY3/09 FY3/10 FY3/11 FY3/12E FY3/13E
18 May 2012 Page 8 of 14
Texwinca Holdings Ltd
Valuation and recommendation
Target price at HKD10.83. We value Texwinca using a SOTP valuation to better account for the stable textile business and higher-growth apparel retailing business. We believe the textile business of Texwinca deserves a valuation premium of 10x FY3/13 PER because of its market leading position, increasing market share amid the industry-wise consolidation. We value the retail business at 11.3x FY3/13, the China apparel & footwear industry average.
In conclusion, our target price of HKD10.83, which is pegged to blended target PER of 10.2x, implies 25% upside potential. We believe Texwinca will continue to increase its market share in the textile market at the expense of small players that are forced to wipe out the industry due primarily to; i) tightening of environmental regulations and ii) the high volatility of cotton prices during 2010-2011. In addition, we expect the retail business to increase its sales contribution on the back of the expansion of retail network and better store efficiency. While the operating margin of the retail business is not up to par, we believe that once operating leverage kicks in, the improving operating margin will serve a re-rating catalyst. We therefore resume coverage on Texwinca with a BUY rating and TP of HKD10.83. Reinitiate with BUY.
Figure 10: Valuation table for textile peers as of 17 May 2012
Share Price Market Cap P/E ratio ROE (%) Dividend Company Name Ticker no. (HKD) Rating (USDm) FY12 FY13 FY11 yield (%)Texwinca* 321 HK 8.66 BUY 1,517.6 9.9 8.8 23.1 6.1Fountain Set^ 420 HK 0.98 HOLD 100.2 4.3 3.6 7.7 1.0Victory City 539 HK 0.82 NR 163.3 3.2 2.7 9.8 7.9Pacific Textiles* 1382 HK 4.99 NR 920.5 7.5 7.6 24.8 6.8Shenzhou International 2313 HK 14 NR 2,396.9 7.5 6.6 31.3 3.6Texhong Textile 2678 HK 3.13 NR 356.5 9.4 7.3 2.9 3.2Weiqiao Textile 2698 HK 3.28 NR 504.3 12.1 9.2 1.6 2.2
Average (ex
Texwinca)7.3 6.2 13.0 4.4
Source:* Mar year end ^ Aug year end Bloomberg data Kim Eng Securities
Figure 11: Valuation table for China retailers as of 17 May 2012
Share Price Market Cap P/E ratio ROE (%) Dividend Company Name Ticker no. (HKD) Rating (USDm) FY12 FY13 FY11 yield (%)Texwinca * 321 HK 8.66 BUY 1,517.6 9.9 8.8 23.1 6.1Giordano 709 HK 6.42 NR 1,267.1 11.8 10.4 28.3 5.9I.T* 999 HK 3.13 NR 494.8 8.2 6.8 23.3 4.1Daphne 210 HK 9.00 HOLD 1,908.6 13.4 10.9 26.1 1.9Belle 1880 HK 13.62 NR 14,787.6 19.2 16.1 23.3 1.4Stella 1836 HK 19.00 NR 1,942.9 12.1 10.1 17.2 5.2Trinity 891 HK 5.92 BUY 1,305.7 15.5 12.5 18.6 3.9Bosideng* 3998 HK 1.91 BUY 1,968.8 8.6 8.1 18.7 6.8China Lilang 1234 HK 6.21 NR 959.9 8.5 7.3 30.9 4.8Evergreen 238 HK 1.78 NR 217.4 6.3 5.3 13.1 7.4YGM Trading* 375 HK 18.06 NR 385.6 9.1 7.0 26.1 5.8
Average (ex
Texwinca)11.3 9.5 22.6 4.4
Source:*Mar year end, Bloomberg data Kim Eng Securities
18 May 2012 Page 9 of 14
Texwinca Holdings Ltd
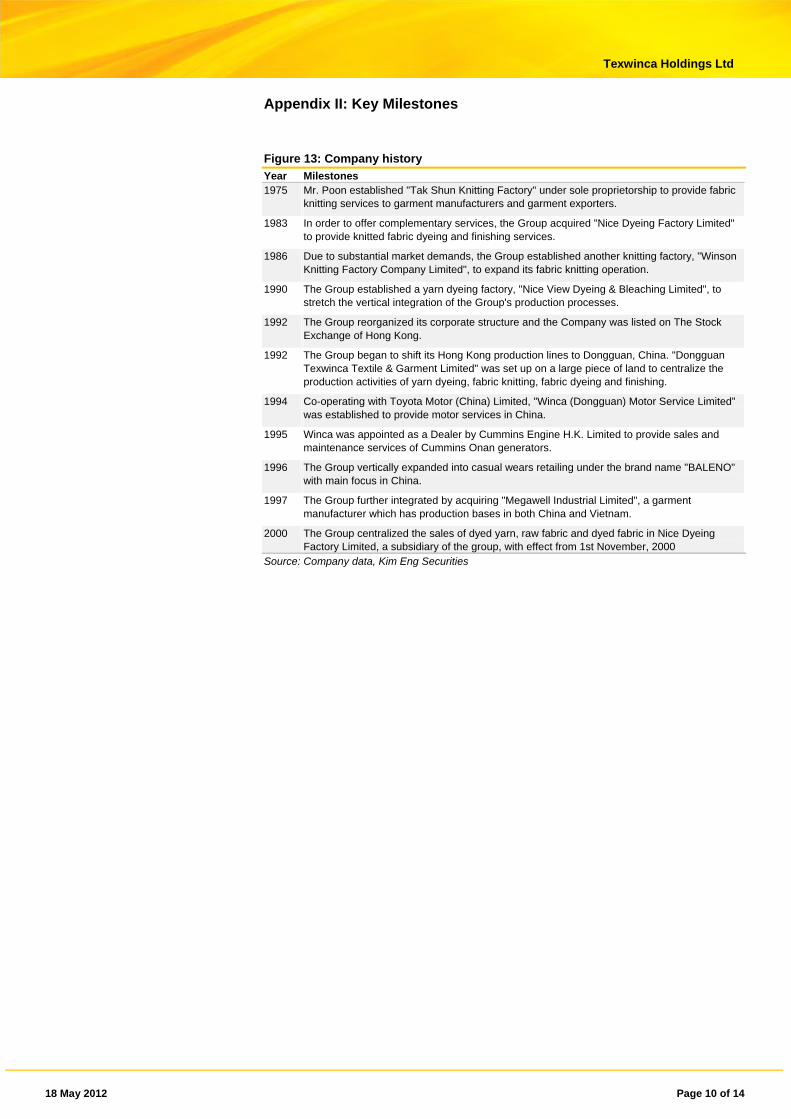
Appendix I: Company structure
Figure 12: Corporate structure
Source: Company data, Kim Eng Securities
18 May 2012 Page 10 of 14
Texwinca Holdings Ltd
Appendix II: Key Milestones
Figure 13: Company history
Year Milestones 1975 Mr. Poon established "Tak Shun Knitting Factory" under sole proprietorship to provide fabric
knitting services to garment manufacturers and garment exporters.
1983 In order to offer complementary services, the Group acquired "Nice Dyeing Factory Limited" to provide knitted fabric dyeing and finishing services.
1986 Due to substantial market demands, the Group established another knitting factory, "Winson Knitting Factory Company Limited", to expand its fabric knitting operation.
1990 The Group established a yarn dyeing factory, "Nice View Dyeing & Bleaching Limited", to stretch the vertical integration of the Group's production processes.
1992 The Group reorganized its corporate structure and the Company was listed on The Stock Exchange of Hong Kong.
1992 The Group began to shift its Hong Kong production lines to Dongguan, China. "Dongguan Texwinca Textile & Garment Limited" was set up on a large piece of land to centralize the production activities of yarn dyeing, fabric knitting, fabric dyeing and finishing.
1994 Co-operating with Toyota Motor (China) Limited, "Winca (Dongguan) Motor Service Limited” was established to provide motor services in China.
1995 Winca was appointed as a Dealer by Cummins Engine H.K. Limited to provide sales and maintenance services of Cummins Onan generators.
1996 The Group vertically expanded into casual wears retailing under the brand name "BALENO" with main focus in China.
1997 The Group further integrated by acquiring "Megawell Industrial Limited", a garment manufacturer which has production bases in both China and Vietnam.
2000 The Group centralized the sales of dyed yarn, raw fabric and dyed fabric in Nice Dyeing Factory Limited, a subsidiary of the group, with effect from 1st November, 2000
Source: Company data, Kim Eng Securities
18 May 2012 Page 11 of 14
Texwinca Holdings Ltd
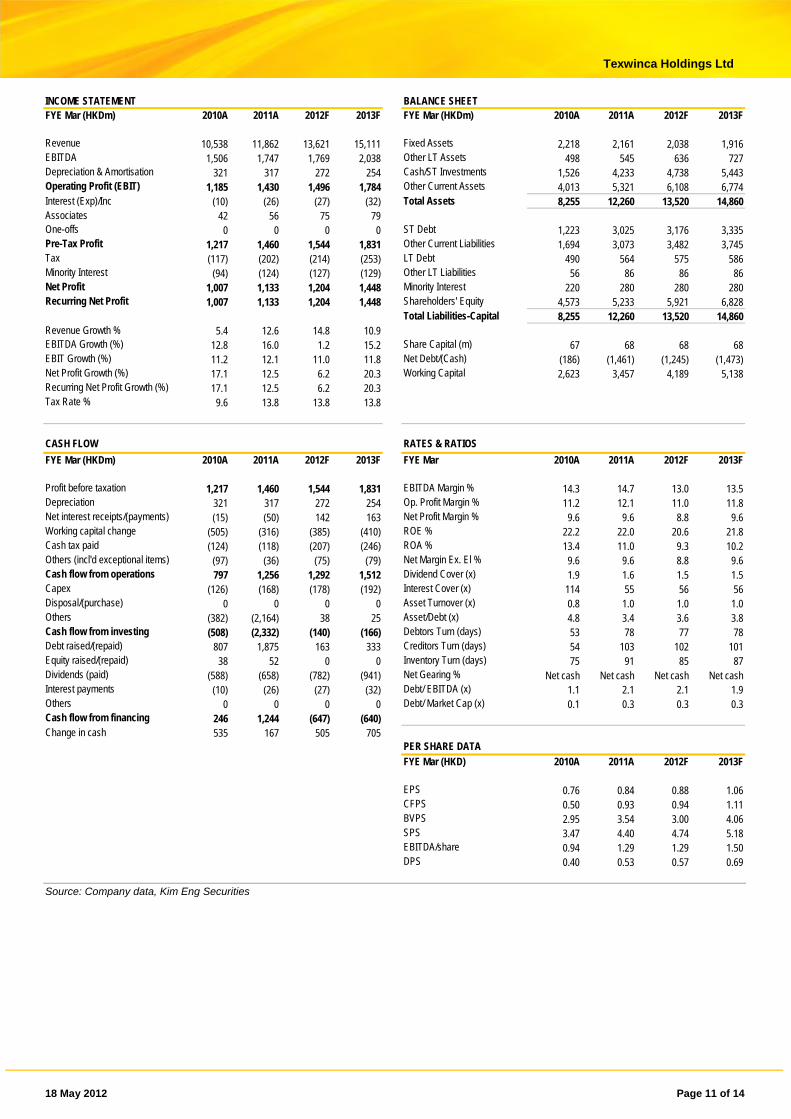
INCOME STATEMENT BALANCE SHEET FYE Mar (HKDm) 2010A 2011A 2012F 2013F
FYE Mar (HKDm) 2010A 2011A 2012F 2013F Revenue 10,538 11,862 13,621 15,111 Fixed Assets 2,218 2,161 2,038 1,916 EBITDA 1,506 1,747 1,769 2,038 Other LT Assets 498 545 636 727 Depreciation & Amortisation 321 317 272 254 Cash/ST Investments 1,526 4,233 4,738 5,443 Operating Profit (EBIT) 1,185 1,430 1,496 1,784 Other Current Assets 4,013 5,321 6,108 6,774 Interest (Exp)/Inc (10) (26) (27) (32) Total Assets 8,255 12,260 13,520 14,860 Associates 42 56 75 79 One-offs 0 0 0 0 ST Debt 1,223 3,025 3,176 3,335 Pre-Tax Profit 1,217 1,460 1,544 1,831 Other Current Liabilities 1,694 3,073 3,482 3,745 Tax (117) (202) (214) (253) LT Debt 490 564 575 586 Minority Interest (94) (124) (127) (129) Other LT Liabilities 56 86 86 86 Net Profit 1,007 1,133 1,204 1,448 Minority Interest 220 280 280 280 Recurring Net Profit 1,007 1,133 1,204 1,448 Shareholders' Equity 4,573 5,233 5,921 6,828 Total Liabilities-Capital 8,255 12,260 13,520 14,860 Revenue Growth % 5.4 12.6 14.8 10.9 EBITDA Growth (%) 12.8 16.0 1.2 15.2 Share Capital (m) 67 68 68 68 EBIT Growth (%) 11.2 12.1 11.0 11.8 Net Debt/(Cash) (186) (1,461) (1,245) (1,473) Net Profit Growth (%) 17.1 12.5 6.2 20.3 Working Capital 2,623 3,457 4,189 5,138 Recurring Net Profit Growth (%) 17.1 12.5 6.2 20.3 Tax Rate % 9.6 13.8 13.8 13.8
CASH FLOW RATES & RATIOS
FYE Mar (HKDm) 2010A 2011A 2012F 2013F FYE Mar 2010A 2011A 2012F 2013F Profit before taxation 1,217 1,460 1,544 1,831
EBITDA Margin % 14.3 14.7 13.0 13.5 Depreciation 321 317 272 254 Op. Profit Margin % 11.2 12.1 11.0 11.8 Net interest receipts/(payments) (15) (50) 142 163 Net Profit Margin % 9.6 9.6 8.8 9.6 Working capital change (505) (316) (385) (410) ROE % 22.2 22.0 20.6 21.8 Cash tax paid (124) (118) (207) (246) ROA % 13.4 11.0 9.3 10.2 Others (incl'd exceptional items) (97) (36) (75) (79) Net Margin Ex. El % 9.6 9.6 8.8 9.6 Cash flow from operations 797 1,256 1,292 1,512 Dividend Cover (x) 1.9 1.6 1.5 1.5 Capex (126) (168) (178) (192) Interest Cover (x) 114 55 56 56 Disposal/(purchase) 0 0 0 0 Asset Turnover (x) 0.8 1.0 1.0 1.0 Others (382) (2,164) 38 25 Asset/Debt (x) 4.8 3.4 3.6 3.8 Cash flow from investing (508) (2,332) (140) (166) Debtors Turn (days) 53 78 77 78 Debt raised/(repaid) 807 1,875 163 333 Creditors Turn (days) 54 103 102 101 Equity raised/(repaid) 38 52 0 0 Inventory Turn (days) 75 91 85 87 Dividends (paid) (588) (658) (782) (941) Net Gearing % Net cash Net cash Net cash Net cash Interest payments (10) (26) (27) (32) Debt/ EBITDA (x) 1.1 2.1 2.1 1.9 Others 0 0 0 0 Debt/ Market Cap (x) 0.1 0.3 0.3 0.3 Cash flow from financing 246 1,244 (647) (640)
Change in cash 535 167 505 705 PER SHARE DATA
FYE Mar (HKD) 2010A 2011A 2012F 2013F
EPS 0.76 0.84 0.88 1.06 CFPS 0.50 0.93 0.94 1.11 BVPS 2.95 3.54 3.00 4.06 SPS 3.47 4.40 4.74 5.18 EBITDA/share 0.94 1.29 1.29 1.50 DPS 0.40 0.53 0.57 0.69
Source: Company data, Kim Eng Securities
18 May 2012 Page 12 of 14
Texwinca Holdings Ltd
RESEARCH OFFICES REGIONAL
P K BASU Regional Head, Research & Economics (65) 6432 1821 [email protected]
WONG Chew Hann, CA Regional Head of Institutional Research (603) 2297 8686 [email protected]
THAM Mun Hon Regional Strategist (852) 2268 0630 [email protected]
ONG Seng Yeow Regional Products & Planning (852) 2268 0644 [email protected]
ECONOMICS Suhaimi ILIAS Chief Economist Singapore | Malaysia (603) 2297 8682 [email protected]
Luz LORENZO Economist Philippines | Indonesia (63) 2 849 8836 [email protected]
Chaiyachoke SUWISUTTANGKUL Economist Thailand (662) 658 6300 [email protected]
MALAYSIA WONG Chew Hann, CA Head of Research (603) 2297 8686 [email protected] Strategy Construction & Infrastructure Desmond CH’NG, ACA (603) 2297 8680 [email protected] Banking - Regional LIAW Thong Jung (603) 2297 8688 [email protected] Oil & Gas Automotive Shipping ONG Chee Ting (603) 2297 8678 [email protected] Plantations Mohshin AZIZ (603) 2297 8692 [email protected] Aviation Petrochem Power YIN Shao Yang, CPA (603) 2297 8916 [email protected] Gaming – Regional Media Power WONG Wei Sum, CFA (603) 2297 8679 [email protected] Property & REITs LEE Yen Ling (603) 2297 8691 [email protected] Building Materials Manufacturing Technology
LEE Cheng Hooi Head of Retail [email protected] Technicals
HONG KONG / CHINA Edward FUNG Head of Research (852) 2268 0632 [email protected] Construction Ivan CHEUNG (852) 2268 0634 [email protected] Property Industrial Ivan LI (852) 2268 0641 [email protected] Banking & Finance Jacqueline KO (852) 2268 0633 [email protected] Consumer Staples Andy POON (852) 2268 0645 [email protected] Telecom & equipment Samantha KWONG (852) 2268 0640 [email protected] Consumer Discretionaries Alex YEUNG (852) 2268 0636 [email protected] Industrial Catherine CHAN (852) 2268 0631 [email protected] Cement Anita HWANG, CFA | Jacky WONG, CFA [email protected] | [email protected] (852) 2268 0142 | (852) 2268 0107 Special Situations Quants
INDIA Jigar SHAH Head of Research (91) 22 6623 2601 [email protected] Oil & Gas Automobile Cement Anubhav GUPTA (91) 22 6623 2605 [email protected] Metal & Mining Capital goods Property Haripreet BATRA (91) 226623 2606 [email protected] Software Media Ganesh RAM (91) 226623 2607 [email protected] Telecom Contractor Darpin SHAH (91) 226623 2610 [email protected] Banking & Financial Services Gagan KWATRA (91) 226623 2612 [email protected] Small Cap
SINGAPORE Stephanie WONG Head of Research (65) 6432 1451 [email protected] Strategy Small & Mid Caps Gregory YAP (65) 6432 1450 [email protected] Technology & Manufacturing Telcos - Regional Wilson LIEW (65) 6432 1454 [email protected] Hotel & Resort Property & Construction James KOH (65) 6432 1431 [email protected] Logistics Resources Consumer Small/ Mid cap YEAK Chee Keong, CFA (65) 6433 5730 [email protected] Healthcare Offshore & Marine Alison FOK (65) 6433 5745 [email protected] Services S-chips Bernard CHIN (65) 6433 5726 [email protected] Transport Shipping Aviation
INDONESIA Katarina SETIAWAN Head of Research (62) 21 2557 1125 [email protected] Consumer Strategy Telcos Lucky ARIESANDI, CFA (62) 21 2557 1127 [email protected] Base metals Coal Oil & Gas Rahmi MARINA (62) 21 2557 1128 [email protected] Banking Multifinance Pandu ANUGRAH (62) 21 2557 1137 [email protected] Auto Heavy equipment Plantation Toll road Adi N. WICAKSONO (62) 21 2557 1130 [email protected] Generalist Anthony YUNUS (62) 21 2557 1134 [email protected] Cement Infrastructure Property Arwani PRANADJAYA (62) 21 2557 1129 [email protected] Technicals
PHILIPPINES Luz LORENZO Head of Research +63 2 849 8836 [email protected] Strategy Laura DY-LIACCO (63) 2 849 8840 [email protected] Utilities Conglomerates Telcos Lovell SARREAL (63) 2 849 8841 [email protected] Consumer Media Cement Mining Kenneth NERECINA (63) 2 849 8839 [email protected] Conglomerates Property Ports/ Logistics Katherine TAN (63) 2 849 8843 [email protected] Banks Construction
THAILAND Mayuree CHOWVIKRAN Head of Research (66) 2658 6300 ext 1440 [email protected] Strategy
Maria BRENDA SANCHEZ LAPIZ Co-Head of Research Dir (66) 2257 0250 | (66) 2658 6300 ext 1399 [email protected]
Andrew STOTZ Strategist (66) 2658 6300 ext 1399 [email protected]
Suttatip PEERASUB (66) 2658 6300 ext 1430 [email protected] Media Commerce Sutthichai KUMWORACHAI (66) 2658 6300 ext 1400 [email protected] Energy Petrochem Termporn TANTIVIVAT (66) 2658 6300 ext 1520 [email protected] Property Woraphon WIROONSRI (66) 2658 6300 ext 1560 [email protected] Banking & Finance Jaroonpan WATTANAWONG (66) 2658 6300 ext 1404 [email protected] Transportation Small cap. Suchot THIRAWANNARAT (66) 2658 6300 ext 1550 [email protected] Automotive Construction Materials Soft commodity
VIETNAM Michael KOKALARI, CFA Head of Research +84 838 38 66 47 [email protected] Strategy Nguyen Thi Ngan Tuyen +84 844 55 58 88 x 8081 [email protected] Food and Beverage Oil and Gas Ngo Bich Van +84 844 55 58 88 x 8084 [email protected] Banking Nguyen Quang Duy +84 844 55 58 88 x 8082 [email protected] Rubber Dang Thi Kim Thoa +84 844 55 58 88 x 8083 [email protected] Consumer Nguyen Trung Hoa +84 844 55 58 88 x 8088 [email protected] Steel Sugar Macro
18 May 2012 Page 13 of 14
Texwinca Holdings Ltd
Definition of Ratings Kim Eng Research uses the following rating system:
BUY Total return is expected to be above 15% in the next 12 months
HOLD Total return is expected to be between -15% to +15% in the next 12 months
SELL Total return is expected to be below -15% in the next 12 months
Applicability of Ratings The respective analyst maintains a coverage universe of stocks, the list of which may be adjusted according to needs. Investment ratings are only applicable to the stocks which form part of the coverage universe. Reports on companies which are not part of the coverage do not carry investment ratings as we do not actively follow developments in these companies. Some common terms abbreviated in this report (where they appear):
Adex = Advertising Expenditure FCF = Free Cashflow PE = Price Earnings BV = Book Value FV = Fair Value PEG = PE Ratio To Growth CAGR = Compounded Annual Growth Rate FY = Financial Year PER = PE Ratio Capex = Capital Expenditure FYE = Financial Year End QoQ = Quarter-On-Quarter CY = Calendar Year MoM = Month-On-Month ROA = Return On Asset DCF = Discounted Cashflow NAV = Net Asset Value ROE = Return On Equity DPS = Dividend Per Share NTA = Net Tangible Asset ROSF = Return On Shareholders’ Funds EBIT = Earnings Before Interest And Tax P = Price WACC = Weighted Average Cost Of Capital EBITDA = EBIT, Depreciation And Amortisation P.A. = Per Annum YoY = Year-On-Year EPS = Earnings Per Share PAT = Profit After Tax YTD = Year-To-Date EV = Enterprise Value PBT = Profit Before Tax APPENDIX I: TERMS FOR PROVISION OF REPORT, DISCLOSURES AND DISCLAIMERS Disclaimer The information, tools and material presented herein are provided for informational purposes only and are not to be used or considered as an offer or a solicitation to sell or an offer or solicitation to buy or subscribe for securities, investment products or other financial instruments, nor to constitute any advice or recommendation with respect to such securities, investment products or other financial instruments. This research report is prepared for general circulation. It does not have regard to the specific investment objectives, financial situation and the particular needs of any specific person who may receive this report. You should independently evaluate particular investments and you should consult an independent financial adviser before making any investments or entering into any transaction in relation to any securities mentioned in this report. The information, tools and material presented herein are not directed at, or intended for distribution to or use by, any person or entity who is a citizen or resident of or located in any jurisdiction where such distribution, publication, availability or use would be contrary to applicable law or regulation or which would subject Maybank Kim Eng Holdings Limited and/or its subsidiaries or affiliates (collectively “Maybank Kim Eng”) to any registration or licensing requirement within such jurisdiction. Information and opinions presented in this report have been obtained or derived from sources believed by Maybank Kim Eng to be reliable, but Maybank Kim Eng makes no representation as to their accuracy or completeness and Maybank Kim Eng accepts no liability for loss arising from the use of the material presented in this report where permitted by law and/or regulation. This report is not to be relied upon in substitution for the exercise of independent judgment. Maybank Kim Eng may have issued other reports that are inconsistent with, and reach different conclusions from, the information presented in this report. Those reports reflect the different assumptions, views and analytical methods of the analysts who prepared them. The research analyst(s) primarily responsible for the preparation of this report confirms that (a) all of the views expressed in this report accurately reflects his or her personal views abut any and all of the subject securities or issuers; and (b) that no part of his or her compensation was, is or will be, directly or indirectly, related to the specific recommendations or views he or she expressed in this report. Past performance should not be taken as an indication or guarantee of future performance, and no representation or warranty, express or implied, is made regarding future performance. Maybank Kim Eng, its directors and employees may have investments in securities or derivatives of any companies mentioned in this report, and may make investment decisions that are inconsistent with the views expressed in this report. Structured securities are complex instruments, typically involve a high degree of risk and are intended for sale only to sophisticated investors who are capable of understanding and assuming the risks involved. The market value of any structured security may be affected by changes in economic, financial and political factors (including, but not limited to, spot and forward interest and exchange rates), time to maturity, market conditions and volatility and the credit quality of any issuer or reference issuer. Any investor interested in purchasing a structured product should conduct its own investigation and analysis of the product and consult with its own professional advisers as to the risks involved in making such a purchase. General Disclosure Maybank Kim Eng and its officers, directors and employees, including persons involved in the preparation or issuance of this report, may, to the extent permitted by law, from time to time participate or invest in financing transactions with the issuer(s) of the securities mentioned in this report, perform services for or solicit business from such issuers, and/or have a position or holding, or other material interest, or effect transactions, in such securities or options thereon, or other investments related thereto. In addition, it may make markets in the securities mentioned in the material presented in this report. Maybank Kim Eng may, to the extent permitted by law, act upon or use the information presented herein, or the research or analysis on which they are based, before the material is published. One or more directors, officers and/or employees of Maybank Kim Eng may be a director of the issuers of the securities mentioned in this report. Maybank Kim Eng may have, within the last three years, served as manager or co-manager of a public offering of securities for, or currently may make a primary market in issues of, any or all of the entities mentioned in this report or may be providing, or have provided within the previous 12 months, significant advice or investment services in relation to the investment concerned or a related investment. This research report is prepared for general circulation. It does not have regard to the specific investment objectives, financial situation and the particular needs of any specific person who may receive this report. The information contained herein is believed to be reliable, its completeness and accuracy is however not guaranteed. Opinions expressed in this report are subject to change without notice, and no part of this publication is to be construed as an offer, or solicitation of an offer to buy or sell any securities or financial instruments whether referred therein or otherwise. We do not accept any liability whatsoever whether direct or indirect that may arise from the use of information contained in this report. Any transactions by US persons in any security discussed in this report must be carried out through Maybank Kim Eng Securities (USA) Inc which has distributed this report in the USA. In addition, this document has been distributed in the UK for information only and circulated only to existing customers of Maybank Kim Eng, who are not private customers as classified under FSA’s Rules.
18 May 2012 Page 14 of 14
Texwinca Holdings Ltd
Malaysia Maybank Investment Bank Berhad (A Participating Organisation of Bursa Malaysia Securities Berhad) 33rd Floor, Menara Maybank, 100 Jalan Tun Perak, 50050 Kuala Lumpur Tel: (603) 2059 1888; Fax: (603) 2078 4194
Singapore Maybank Kim Eng Securities Pte Ltd Maybank Kim Eng Research Pte Ltd 9 Temasek Boulevard #39-00 Suntec Tower 2 Singapore 038989 Tel: (65) 6336 9090 Fax: (65) 6339 6003
London Maybank Kim Eng Securities (London) Ltd 6/F, 20 St. Dunstan’s Hill London EC3R 8HY, UK Tel: (44) 20 7621 9298 Dealers’ Tel: (44) 20 7626 2828 Fax: (44) 20 7283 6674
New York Maybank Kim Eng Securities USA Inc 777 Third Avenue, 21st Floor New York, NY 10017, U.S.A. Tel: (212) 688 8886 Fax: (212) 688 3500
Stockbroking Business: Level 8, Tower C, Dataran Maybank, No.1, Jalan Maarof 59000 Kuala Lumpur Tel: (603) 2297 8888 Fax: (603) 2282 5136
Hong Kong Kim Eng Securities (HK) Ltd Level 30, Three Pacific Place, 1 Queen’s Road East, Hong Kong Tel: (852) 2268 0800 Fax: (852) 2877 0104
Indonesia PT Kim Eng Securities Plaza Bapindo Citibank Tower 17th Floor Jl Jend. Sudirman Kav. 54-55 Jakarta 12190, Indonesia
Tel: (62) 21 2557 1188 Fax: (62) 21 2557 1189
India Kim Eng Securities India Pvt Ltd 2nd Floor, The International 16, Maharishi Karve Road, Churchgate Station, Mumbai City - 400 020, India Tel: (91).22.6623.2600 Fax: (91).22.6623.2604
Philippines Maybank ATR Kim Eng Securities Inc. 17/F, Tower One & Exchange Plaza Ayala Triangle, Ayala Avenue Makati City, Philippines 1200 Tel: (63) 2 849 8888 Fax: (63) 2 848 5738
Thailand Maybank Kim Eng Securities (Thailand) Public Company Limited 999/9 The Offices at Central World, 20th - 21st Floor, Rama 1 Road Pathumwan, Bangkok 10330, Thailand Tel: (66) 2 658 6817 (sales) Tel: (66) 2 658 6801 (research)
Vietnam In association with
Kim Eng Vietnam Securities Company 1st Floor, 255 Tran Hung Dao St. District 1 Ho Chi Minh City, Vietnam Tel : (84) 838 38 66 36 Fax : (84) 838 38 66 39
Saudi Arabia In association with
Anfaal Capital Villa 47, Tujjar Jeddah Prince Mohammed bin Abdulaziz Street P.O. Box 126575 Jeddah 21352 Tel: (966) 2 6068686 Fax: (966) 26068787
South Asia Sales Trading Connie TAN [email protected] Tel: (65) 6333 5775 US Toll Free: 1 866 406 7447
North Asia Sales Trading Eddie LAU [email protected] Tel: (852) 2268 0800 US Toll Free: 1 866 598 2267
www.maybank-ke.com | www.kimengresearch.com | www.kimeng.com.hk
Regulatory Disclosures as required by the Hong Kong Securities and Futures Commission Policies of Kim Eng Securities (Hong Kong) Limited (“KESHK”): Research analysts who publish investment research are not directly supervised by, and do not report directly to, investment banking or sales and trading personnel. Research analysts’ compensation or remuneration should not be linked to any specific investment banking function or to recommendations in research. Research analysts or their associates are prohibited from dealing in the securities or any derivatives of any companies the research analysts review/analyse/cover. Research analysts or their associates are prohibited from holding any directorship or other position in any company the research analysts review/analyse/cover. Group companies of Kim Eng (inclusive of KESHK) which are carrying on a business in Hong Kong in investment banking, proprietary trading or market making or agency broking (the “Firms”) are not a market maker in the securities of the subject companies mentioned in this report. The Firms do not have any investment banking relationship with the companies mentioned in this report within the last 12 months. As of 18 May 2012, Kim Eng Securities (Hong Kong) Limited and the authoring analyst does not have interests in the said company/companies. Additional Disclaimers (for purpose of distribution in Singapore) This report has been produced as of the date hereof and the information herein maybe subject to change. Maybank Kim Eng Research Pte Ltd ("MBKERPL") in Singapore has no obligation to update such information for any recipient. Recipients of this report are to contact MBKERPL in Singapore in respect of any matters arising from, or in connection with, this report. If the recipient of this report is not an accredited investor, expert investor or institutional investor (as defined under Section 4A of the Singapore Securities and Futures Act), MBKERPL shall be legally liable for the contents of this report, with such liability being limited to the extent (if any) as permitted by law. As of 18 May 2012, MBKERPL does not have an interest in the said company/companies. Analyst Certification The views expressed in this research report accurately reflect the analyst’s personal views about any and all of the subject securities or issuers; and no part of the research analyst’s compensation was, is or will be, directly or indirectly, related to the specific recommendations or views expressed in the report. © 2012 Kim Eng Securities (Hong Kong) Limited. All rights reserved. Except as specifically permitted, no part of this presentation may be reproduced or distributed in any manner without the prior written permission of Kim Eng Securities (Hong Kong) Limited. Kim Eng Securities (Hong Kong) Limited accepts no liability whatsoever for the actions of third parties in this respect.