Honeywell Guidance Announcement Presentation
21
2009 Outlook December 15, 2008
-
Upload
finance8 -
Category
Economy & Finance
-
view
504 -
download
0
Transcript of Honeywell Guidance Announcement Presentation

2009 OutlookDecember 15, 2008
22009 Outlook
December 15, 2008
Forward Looking Statements
This report contains “forward-looking statements” within the meaning of Section 21E of the Securities Exchange Act of 1934. All statements, other than statements of fact, that address activities, events or developments that we or our management intend, expect, project, believe or anticipate will or may occur in the future are forward-looking statements. Forward-looking statements are based on management’s assumptions and assessments in light of past experience and trends, current economic and industry conditions, expected future developments and other relevant factors. They are not guarantees of future performance, and actual results, developments and business decisions may differ from those envisaged by our forward-looking statements. Our forward-looking statements are also subject to risks and uncertainties, which can affect our performance in both the near- and long-term. We identify the principal risks and uncertainties that affect our performance in our Form 10-K and other filings with the Securities and Exchange Commission.

32009 Outlook
December 15, 2008
2008 Highlights
Building Long-Term Value
Multi-Year Contract Wins
Attractive New Products
Portfolio Management
Effective Capital Deployment
Proactive Repositioning • $0.4B Actions YTD ($0.7B ‘06-’08)• Funded Through Operations / Gains
• $1.2B Acquisitions/Divestitures, Net• $1.4B Share Repurchases• $0.8B Dividends
• Norcross, Metrologic Acquisitions• Consumable Solutions Divestiture
• HTF 7500 Engine• Wireless Sensing Technology• UOP Heavy Oil Hydrocracking
• $40B+ Aerospace Programs• $0.4B+ Building Efficiency Projects• $4B+ Turbo Platforms
Key Initiative Execution• 70% Sites HOS Initiated• ERP Progress / FT Savings• VPDTM Contributions Increasing

42009 Outlook
December 15, 2008
• 6% Growth3% Acq./Div. Impact1% F/X Impact
(B) 2007 2008EAerospace $12.2 $12.7
Automation & Control 12.5 14.0
Transportation Systems 5.0 4.6
Specialty Materials 4.9 5.3
Total Sales $34.6 $36.6
EPS $3.16 $3.76 – 3.80
Free Cash Flow $3.1 $3.2
• ~20% Growth
• 100%+ Conversion
2008 Financial Summary
• 4% Growth
• 12% Growth
• 8% Decline
• 9% Growth
Very Good Year In Tough Environment

52009 Outlook
December 15, 2008
$(600)
$(300)
$-
$300
$600
2006 2007 2008 2009
Restructuring Benefits
Funded Through Operations / Gains
Restructuring Charges (’06-’08 YTD)
Projected Benefits
$M
Reported EPS Growth
31% 25% 20%

62009 Outlook
December 15, 2008
2009 Planning
Macro Assumptions Supporting Outlook
Developed Markets
Emerging Markets
Foreign Exchange
Commodities
Segment Margin• + : Net Productivity, Repo Benefits• - : Volume, FX• 1H Comps Challenging
• Nickel Down 80%+ From Peak• Natural Gas Down 55%+ From Peak
• EURO/USD $1.25• GBP/USD $1.45
• China GDP 7 to 8%• India GDP 5 to 6%
• US GDP (2)% to (1)%• EU GDP (1)% to 0%
Free Cash Flow• 100%+ Conversion• Working Capital Contribution• High Quality Earnings Stream
Global GDP 1%

72009 Outlook
December 15, 2008
Key Market Assumptions
Challenging Market Conditions$1.6B Backlog
(45)%
10%
~Flat
5%
AM: 0% to 1%OE: 15%
AM: 0% to 1%OE: (10)%*
HON4Q08E
Business 2009Drivers
2009Planning
AT&R Flight HoursOE Deliveries
(2)% to (1)%0% to 5%
B&GA TFE Flight HoursOE Deliveries
(15)% to (10)%0% to 5%
Defense DOD Budget 3%
ACS – Developed
US/EU Housing SalesUS/EU Non-ResRetrofit / RegulationIndustrial Cap/Op Ex
No RecoveryDownturnStableCautious
ACS – Emerging New Construction Moderating
TurbochargingEurope Auto ProductionEurope Diesel PenetrationSmall Engine Shift
(20)% to (10)%(1) pts(4) pts
UOP Refining / Gas / Petrochem Slowing
*Excluding CS Divestiture

82009 Outlook
December 15, 2008
2009 Financial Guidance Summary
Planning For Tough Environment In 2009
Low End High End
– Lower Global Growth
– Unfavorable Mix - Aero OE / AM, ACS Products / Solutions
– Inflation / Productivity Worse
– Lower Pension Discount Rate
– Euro < $1.25
+ Stronger Global Growth
+ Favorable Mix - Aero OE / AM, ACS Products / Solutions
+ Inflation / Productivity Better
+ Higher Pension Discount Rate
+ Euro > $1.25
Excludes impact of acquisition related costs (FAS 141(R))
Sales 33.6$ - 35.3 (8)% - (4)%Organic (LCE) (4)% - 1%
Segment Profit 4.4 - 4.8 (8)% - (0)%Segment Margin 13.2% - 13.7% 0 bps - 50 bps
Net Income 2.4 - 2.7 (14)% - (4)%
EPS $3.20 - 3.55 (15)% - (6)%
Free Cash Flow 3.0$ - 3.2 (6)% - 0%
Consolidated($B)
2009 GrowthFinancial Outlook 2009E vs. 2008E

92009 Outlook
December 15, 2008
Aerospace
Strong Franchise Executing In Slower Environment
Segment
AT&R OE
AT&R AM
B&GA OE
B&GA AM
D&S
Drivers / Risks
Deliveries 0% to 5%, CS Div. / Airline Liquidity
Flight Hours (2)% to (1)% / GDP, Inventory
Deliveries 0% to 5% / OE Production Cuts, Timing
TFE Flight Hours (15)% to (10)% / Platform Mix
Base Defense Budget / Program Mix
2009 Sales Walk
*represents midpoint of guidance range
Org. Growth
↑
↓
↔
↓
↑
Sales 12.2$ - 12.7 (4)% - 0%Segment Profit 2.3 - 2.4 (3)% - 4% Segment Margin 18.6% - 19.0% 20 bps - 60 bps
($B)2009 Growth
Financial Outlook 2009E vs. 2008ESales Growth
2008E 12.7$ 4% ATR 0.0 BGA (0.0) D&S 0.1 Organic 0.1 1%FX - 0%Acq/Div (0.3) (2)%2009E * 12.5$ (2)%

102009 Outlook
December 15, 2008
Automation And Control Solutions
Diversified, Global Portfolio
Segment
ECC
S&C
Life Safety
Security
Building Solutions
Process Solutions
Drivers / Risks
New Products / Res & Non-Res Outlook
Global Penetration / Transport, Industrial Outlook
Fire, Safety Regulations / Industrial Cap Ex
AIDC Acquisitions / Res & Non-Res Outlook
Energy Efficiency Demand / Credit Markets
Process Optimization / Customer Op Ex
2009 Sales Walk
*represents midpoint of guidance range
Org. Growth
↑
↓
↑
↓
↑
↑
Sales 13.0$ - 13.5 (7)% - (4)%Segment Profit 1.5 - 1.6 (7)% - 1% Segment Margin 11.4% - 11.8% 10 bps - 50 bps
($B)2009 Growth
Financial Outlook 2009E vs. 2008ESales Growth
2008E 14.0$ 12% Products (0.1) Solutions 0.1 Organic 0.0 0%FX (1.2) (9)%Acq/Div 0.4 3%2009E * 13.2$ (6)%

112009 Outlook
December 15, 2008
Transportation Systems
Challenging Industry Outlook
Segment
PV Turbo
CV Turbo
CPG
Friction
Drivers / Risks
New Platforms / EU OE Production, Delays
New Platforms / Global Transportation Outlook
Cost Focus / DIFM & Private Label Shifts
Cost Focus / EU OE & AM Outlook
2009 Sales Walk
*represents midpoint of guidance range
Org. Growth
↓
↓
↓
↓
Sales 3.6$ - 4.0 (22)% - (14)%Segment Profit 0.2 - 0.3 (39)% - (24)% Segment Margin 6.9% - 7.9% (200) bps - (100) bps
($B)2009 Growth
Financial Outlook 2009E vs. 2008ESales Growth
2008E 4.6$ (8)% Turbo (0.2) CPG/FM (0.2) Organic (0.4) (8)%FX (0.4) (9)%Acq/Div - 0%2009E * 3.8$ (18)%

122009 Outlook
December 15, 2008
Specialty Materials
Better Positioned Portfolio
Segment
UOP
R&C
Fluorines
Electronic
Specialty
Drivers / Risks
Refining, Petrochem, Gas / Reload Delays
Formula Pricing / Commodity Demand
Pricing Actions / Construction, Auto Outlook
Key Customer Wins / Semiconductor Cap Ex
Niche New Products / Res & Non-Res Outlook
2009 Sales Walk
*represents midpoint of guidance range
Org. Growth
↓
↓
↓
↓
↑
Sales 4.7$ - 5.1 (11)% - (3)%Segment Profit 0.6 - 0.7 (12)% - (1)% Segment Margin 13.5% - 13.9% (10) bps - 30 bps
($B)2009 Growth
Financial Outlook 2009E vs. 2008ESales Growth
2008E 5.3$ 9% UOP (0.0) Other (0.2) Organic (0.3) (5)%FX (0.1) (2)%Acq/Div 0.0 0%2009E * 4.9$ (7)%

132009 Outlook
December 15, 2008
Components Of Organic Sales
Backlog, New Products Supporting Outlook
Def
ense
&S
pace
Bui
ldin
gS
olut
ions
Pro
cess
Sol
utio
ns
Life
Saf
ety
EC
C
ATR
UO
P
BG
A
Sen
sing
&C
ontro
l
Sec
urity
CP
G/F
M
Turb
o
Oth
er S
M

142009 Outlook
December 15, 2008
2009 Sales and Segment Profit Walks
• Developed Regions (10)% to (5)%
• Emerging Regions 5% to 10%
• EURO / USD $1.25 (vs. ~$1.47 ’08)
Attainable Path To 2009 Guidance
Sales Walk
Segment Profit Walk
• Repositioning Benefits
• HOS Productivity
• Procurement Opportunities
2008E Sales OrganicGrowth
FX Acquisitions /Divestitures
2009E SalesMidpoint
~$36.6B ~(1.8)~(0.6)
$33.6B – $35.3B~0.1
2008E Sales OrganicGrowth
FX Acquisitions /Divestitures
2009E SalesMidpoint
~$36.6B ~(1.8)~(0.6)
$33.6B – $35.3B~0.1
2008ESegment Profit
Volume FX Productivity,Inflation, Net
2009ESegment Profit
Midpoint
~$4.9B~(0.2)
~(0.5) $4.4B – $4.8B~0.4
2008ESegment Profit
Volume FX Productivity,Inflation, Net
2009ESegment Profit
Midpoint
~$4.9B~(0.2)
~(0.5) $4.4B – $4.8B~0.4
152009 Outlook
December 15, 2008
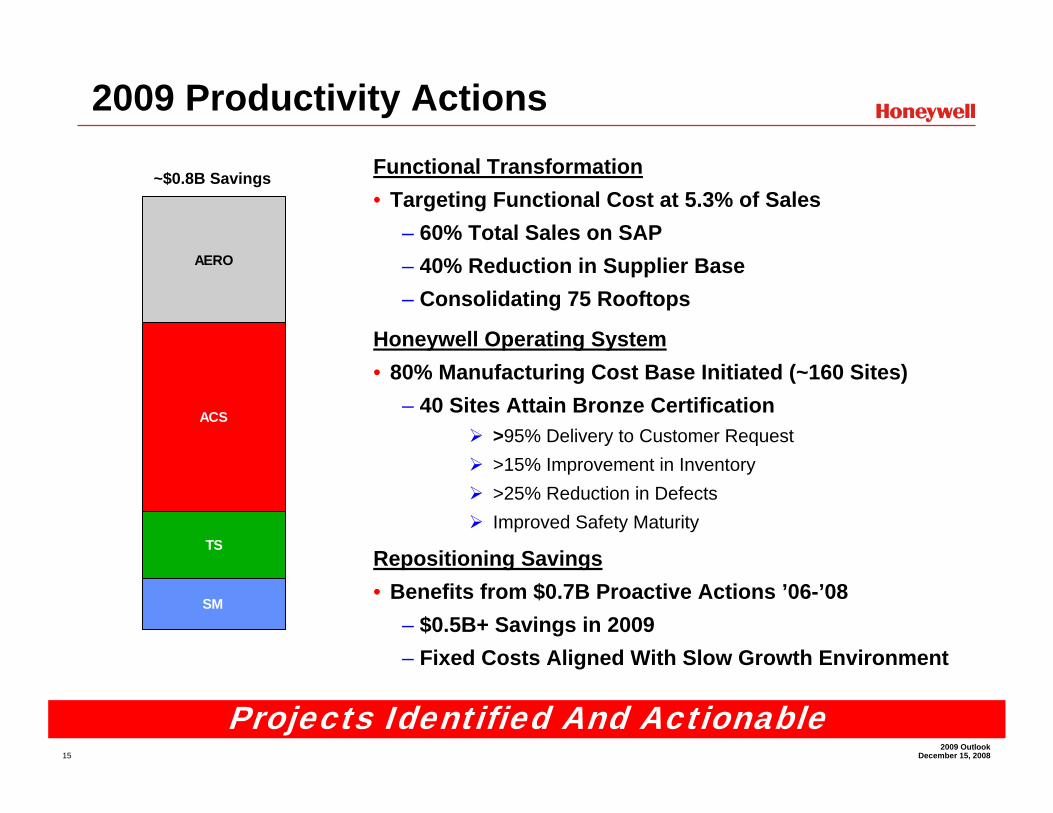
2009 Productivity Actions
Projects Identified And Actionable
AERO
SM
TS
ACS
~$0.8B Savings Functional Transformation• Targeting Functional Cost at 5.3% of Sales
– 60% Total Sales on SAP– 40% Reduction in Supplier Base– Consolidating 75 Rooftops
Honeywell Operating System• 80% Manufacturing Cost Base Initiated (~160 Sites)
– 40 Sites Attain Bronze Certification>95% Delivery to Customer Request>15% Improvement in Inventory>25% Reduction in DefectsImproved Safety Maturity
Repositioning Savings• Benefits from $0.7B Proactive Actions ’06-’08
– $0.5B+ Savings in 2009– Fixed Costs Aligned With Slow Growth Environment

162009 Outlook
December 15, 2008
Other Planning Assumptions
Pension Expense Sensitivity
U.S. Pension Plan Funding - Base Case Assumptions
• No mandatory contributions in 2009
• $1B proactive funding
– Contribution of HON Shares
2009 average diluted share count 755-760 estimated
– Over next 5 quarters starting 4Q08
7.00% 7.5% 8.0%(27%) 169 70 35
(33%) 228 130 55
(39%) 286 189 94
Rat
e of
R
etur
n
Discount RateP&L Expense ($M)
Pension ~130
OPEB ~120
Environmental ~150
Net Asbestos ~150
Repo and Other ~40
~590

172009 Outlook
December 15, 2008
2009 Summary
Preparing To Outperform Again
• Global Economic Downturn
- Biggest Impacts in US and Europe
- Slower Growth in Emerging Regions
• Achievable Top Line / Cost Management
- Demand and Foreign Currency Headwinds
- Lower Commodity Cost Opportunities
- Benefits from Ongoing Repositioning
• In-Depth Business Review Process
- Bottom-up, Top-down Planning Approach
- Delivering Margin Expansion; 100%+ Free Cash Flow Conversion
- Contingencies In Place
182009 Outlook
December 15, 2008
AppendixReconciliation of non-GAAP Measures
to GAAP Measures
192009 Outlook
December 15, 2008
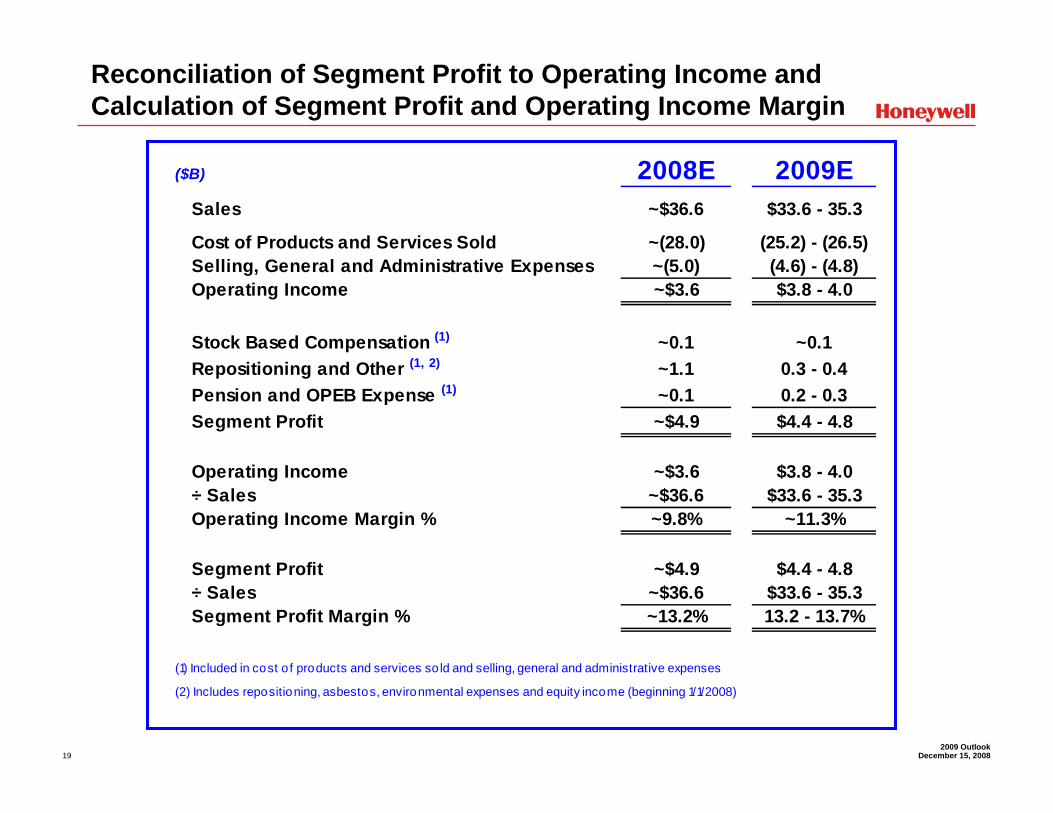
($B) 2008E 2009ESales ~$36.6 $33.6 - 35.3
Cost of Products and Services Sold ~(28.0) (25.2) - (26.5)Selling, General and Administrative Expenses ~(5.0) (4.6) - (4.8)Operating Income ~$3.6 $3.8 - 4.0
Stock Based Compensation (1) ~0.1 ~0.1Repositioning and Other (1, 2) ~1.1 0.3 - 0.4Pension and OPEB Expense (1) ~0.1 0.2 - 0.3Segment Profit ~$4.9 $4.4 - 4.8
Operating Income ~$3.6 $3.8 - 4.0÷ Sales ~$36.6 $33.6 - 35.3Operating Income Margin % ~9.8% ~11.3%
Segment Profit ~$4.9 $4.4 - 4.8÷ Sales ~$36.6 $33.6 - 35.3Segment Profit Margin % ~13.2% 13.2 - 13.7%
(1) Included in cost o f products and services so ld and selling, general and administrative expenses
(2) Includes repositioning, asbestos, environmental expenses and equity income (beginning 1/1/2008)
Reconciliation of Segment Profit to Operating Income and Calculation of Segment Profit and Operating Income Margin

202009 Outlook
December 15, 2008
($B) 2008E 2009ECash Provided by Operating Activities ~$4.0 $3.9 - 4.1Expenditures for Property, Plant and Equipment ~(0.9) ~(0.9)Free Cash Flow ~$3.2 $3.0 - 3.2
Cash Provided by Operating Activities ~$4.0 $3.9 - 4.1÷ Net Income ~$2.8 ~$2.6Operating Cash Flow Conversion % ~143% ~154%
Free Cash Flow ~$3.2 $3.0 - 3.2÷ Net Income ~$2.8 ~$2.6Free Cash Flow Conversion % ~114% ~119%(1) Excludes taxes relat ing to the sale of the Consumable Solut ions business
Reconciliation of Free Cash Flow to Cash Provided by Operating Activities and Calculation of Cash Flow Conversion
(1)

212009 Outlook
December 15, 2008

![PORQUE HONEYWELL Patrick Bogaert]. 2 HONEYWELL - CONFIDENTIAL.](https://static.fdocuments.net/doc/165x107/5665b4371a28abb57c900f84/porque-honeywell-patrick-bogaert-2-honeywell-confidential.jpg)