Multiscale modelling and homogenisation of fibre-reinforced ...
Environment Agroscope Science | No. 62 / 2018
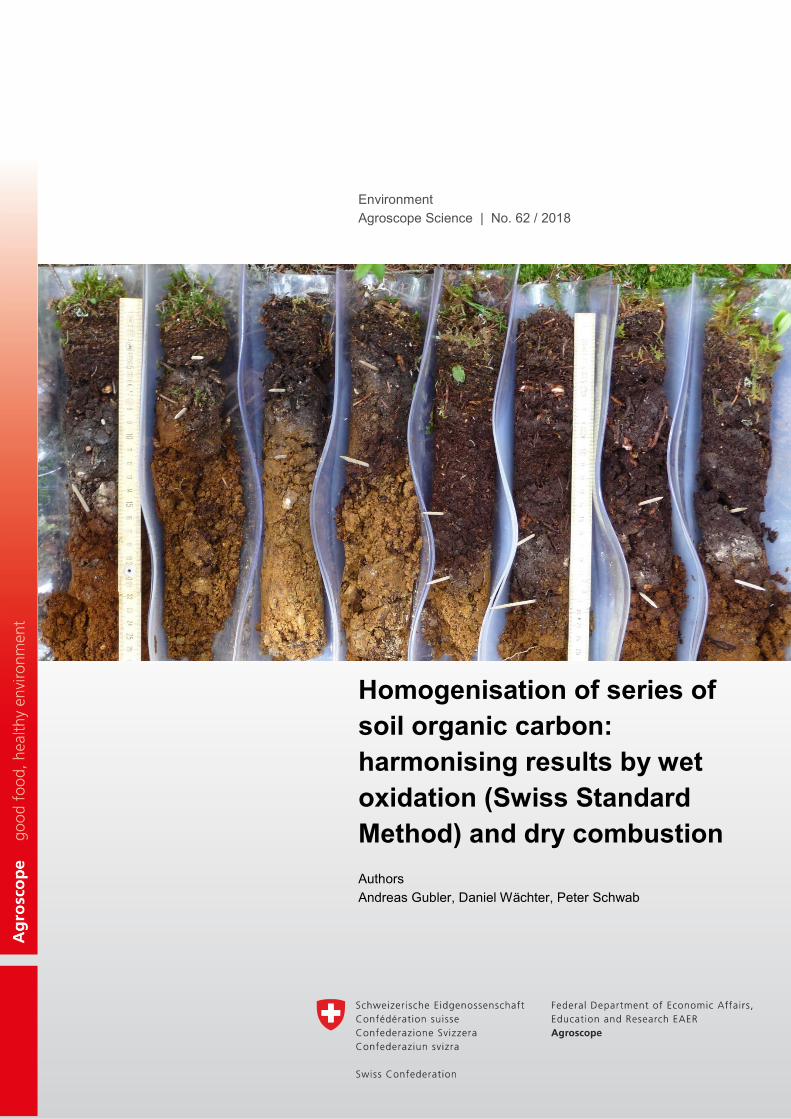
Homogenisation of series of soil organic carbon: harmonising results by wet oxidation (Swiss Standard Method) and dry combustion
Authors Andreas Gubler, Daniel Wächter, Peter Schwab
Impressum
2 Agroscope Science | No. 62 / 2018
Impressum
Editor: Agroscope Reckenholzstrasse 191 8046 Zürich www.agroscope.ch
Information: Andreas Gubler, [email protected], Swiss Soil Monitoring Network NABO Editorial: Andreas Gubler Layout: Andreas Gubler Photos: Swiss Soil Monitoring Network NABO Cover: Soil samples showing strong gradients in soil organic carbon contents Download: www.agroscope.ch/science Copyright: © Agroscope 2018 ISSN: 2296-729X ISBN: 978-3-906804-50-7
Table of contents
Agroscope Science | No. 62 / 2018 3
Table of contents
1 What means homogenisation of time series – and why is it important ...................................... 5
2 SOC series of the Swiss Soil Monitoring Network......................................................................... 5
3 Deriving conversion factors for homogenisation .......................................................................... 6
4 Conclusions and recommendations ............................................................................................... 9
5 References ......................................................................................................................................... 9
List of figures Figure 1: Evolution of soil organic carbon (SOC) contents observed for monitoring site 1: SOC contents by dry combustion, SOC by wet oxidation (Swiss Standard Method), and SOC adapted. .................................. 5
Figure 2: Comparison of soil organic carbon contents determined by dry combustion vs. contents determined by wet oxidation according to the Swiss Standard Method for soil samples of the Swiss Soil Monitoring Network (NABO). ........................................................................................................................... 6
Figure 3: Density function of conversion factors dry combustion : wet oxidation.. .......................................... 7
List of tables Table 1: Site-specific conversion factors to adapt SOC contents determined by the Swiss standard method to the level of dry combustion (CN analyser) for NABO monitoring sites. ....................................................... 8
Abstract
4 Agroscope Science | No. 62 / 2018
Abstract The Swiss Soil Monitoring Network NABO records the long-term evolution of soil organic carbon (SOC) over extended periods. Two different analytical methods were used to determine SOC, namely wet oxidation (WO) and retitration of potassium dichromate (Swiss Standard Method) and dry combustion (DC) with a CN-analyser and subtraction of inorganic carbon. Generally, the WO method generates lower SOC contents than the DC method. Therefore, SOC contents by WO must be adapted to the level of the DC method to avoid distortion of temporal evolutions. For NABO soils, conversion factors between the two methods ranged from 1.01 to 1.42 with a median of 1.18. Due to the large variation between sites, site-specific conversion factors should be used, whenever possible.
Zusammenfassung Die Nationale Bodenbeobachtung NABO erfasst die Entwicklung der Kohlenstoffgehalte im Boden über lange Zeiträume. Die Gehalte an organischem Kohlenstoff (Corg) wurden mit zwei verschiedenen Methoden bestimmt: Einerseits Nassoxidation mit Kaliumdichromat und anschliessende Retitration (Schweizer Referenzmethode gemäss FAL), andererseits Trockenveraschung im CN-Analyser und Subtraktion von anorganischem Kohlenstoff. Die FAL-Methode liefert generell tiefere Corg-Gehalte im Vergleich zur CN-Methode. Deshalb müssen Resultate der FAL-Methode auf das Niveau der CN-Methode umgerechnet werden, um Verzerrungen der zeitlichen Entwicklung zu vermeiden. Für NABO-Böden variierten die Umrechnungsfaktoren zwischen den beiden Methoden von 1.01 bis 1.42 mit Median 1.18. Aufgrund der grossen Streuung zwischen den Standorten sollten – wenn möglich – standort-spezifische Umrechnungsfaktoren verwendet werden.
Résumé L‘Observatoire national des sols NABO enregistre l’évolution des teneurs en carbone du sol sur de longues périodes. Les teneurs en carbone organique (Corg) ont été déterminées à l’aide de deux méthodes différentes: la première, par oxydation humide avec du dichromate de potassium suivie d’un nouveau titrage (méthode de référence suisse selon la FAL), la seconde par incinération à sec dans l‘analyseur CN et soustraction du carbone anorganique. La méthode FAL fournit généralement des teneurs plus faibles en Corg que la méthode CN. C’est pourquoi les résultats de la méthode FAL doivent être convertis et ramenés au niveau de la méthode CN, pour éviter les distorsions liées à l’évolution dans le temps. Pour les sols du NABO, les facteurs de conversion entre les deux méthodes variaient entre 1,01 et 1,42 avec une médiane de 1,18. Etant donné la grande disparité des sites, il est recommandé, si possible, d’utiliser des facteurs de conversion spécifiques aux sites.
What means homogenisation of time series – and why is it important
Agroscope Science | No. 62 / 2018 5
1 What means homogenisation of time series – and why is it important
Whenever data are collected over extended periods, they may be affected by changes in methodology, e.g. for chemical analyses. For instance, it is well known that different methods to analyse soil organic carbon (SOC) differ in their recovery rates (Nelson and Sommers 1996). Hence, depending on the method used we may end up with strongly differing SOC contents. Therefore, the performance of each analytical method must be considered when merging data analysed by different methods. Adapting old data to current measuring conditions is crucial to identify long-term trends correctly. This so-called homogenisation reduces artificial changes in time-series (Figure 1). This report describes how time-series of SOC collected by the Swiss Soil Monitoring Network (NABO) were homogenised.
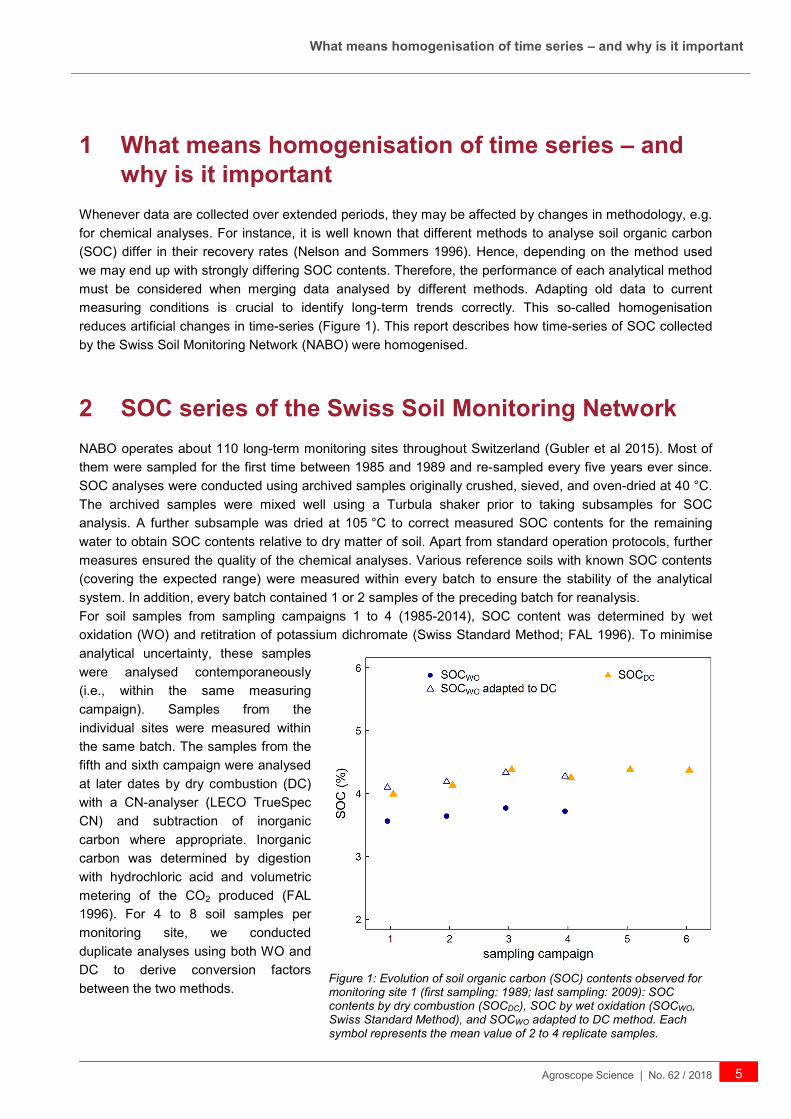
2 SOC series of the Swiss Soil Monitoring Network NABO operates about 110 long-term monitoring sites throughout Switzerland (Gubler et al 2015). Most of them were sampled for the first time between 1985 and 1989 and re-sampled every five years ever since. SOC analyses were conducted using archived samples originally crushed, sieved, and oven-dried at 40 °C. The archived samples were mixed well using a Turbula shaker prior to taking subsamples for SOC analysis. A further subsample was dried at 105 °C to correct measured SOC contents for the remaining water to obtain SOC contents relative to dry matter of soil. Apart from standard operation protocols, further measures ensured the quality of the chemical analyses. Various reference soils with known SOC contents (covering the expected range) were measured within every batch to ensure the stability of the analytical system. In addition, every batch contained 1 or 2 samples of the preceding batch for reanalysis. For soil samples from sampling campaigns 1 to 4 (1985-2014), SOC content was determined by wet oxidation (WO) and retitration of potassium dichromate (Swiss Standard Method; FAL 1996). To minimise analytical uncertainty, these samples were analysed contemporaneously (i.e., within the same measuring campaign). Samples from the individual sites were measured within the same batch. The samples from the fifth and sixth campaign were analysed at later dates by dry combustion (DC) with a CN-analyser (LECO TrueSpec CN) and subtraction of inorganic carbon where appropriate. Inorganic carbon was determined by digestion with hydrochloric acid and volumetric metering of the CO2 produced (FAL 1996). For 4 to 8 soil samples per monitoring site, we conducted duplicate analyses using both WO and DC to derive conversion factors between the two methods.
Figure 1: Evolution of soil organic carbon (SOC) contents observed for monitoring site 1 (first sampling: 1989; last sampling: 2009): SOC contents by dry combustion (SOCDC), SOC by wet oxidation (SOCWO, Swiss Standard Method), and SOCWO adapted to DC method. Each symbol represents the mean value of 2 to 4 replicate samples.
Deriving conversion factors for homogenisation
6 Agroscope Science | No. 62 / 2018
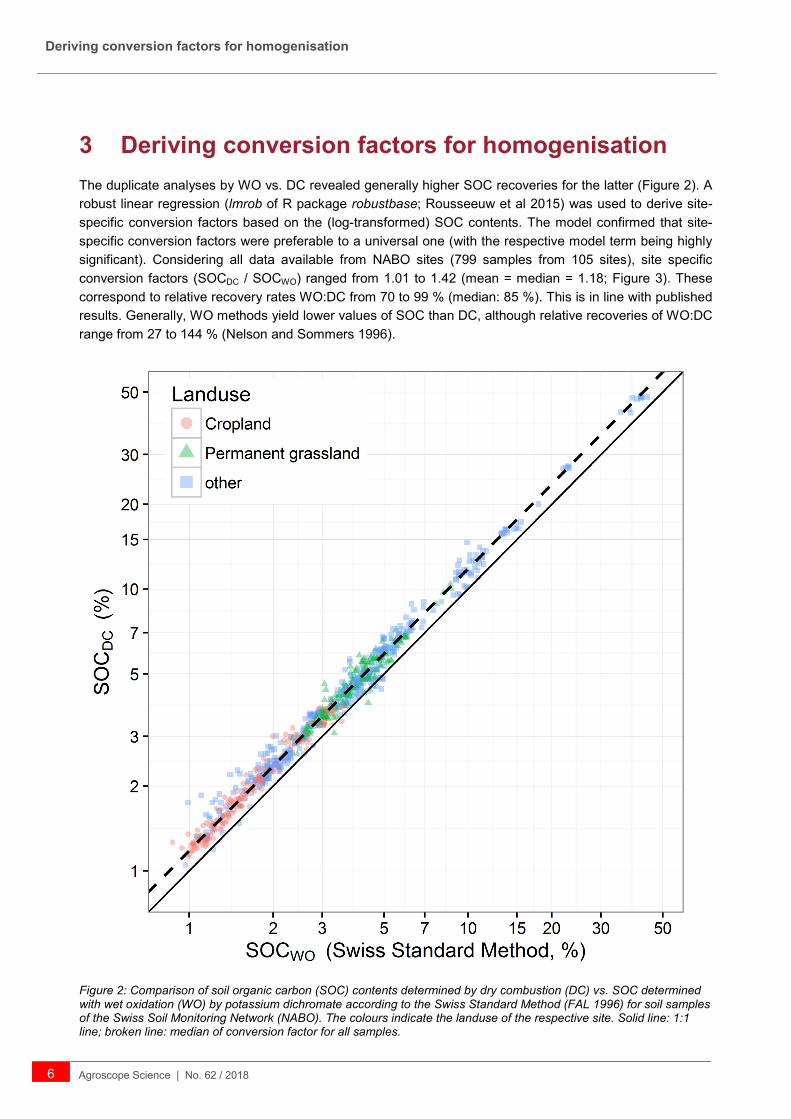
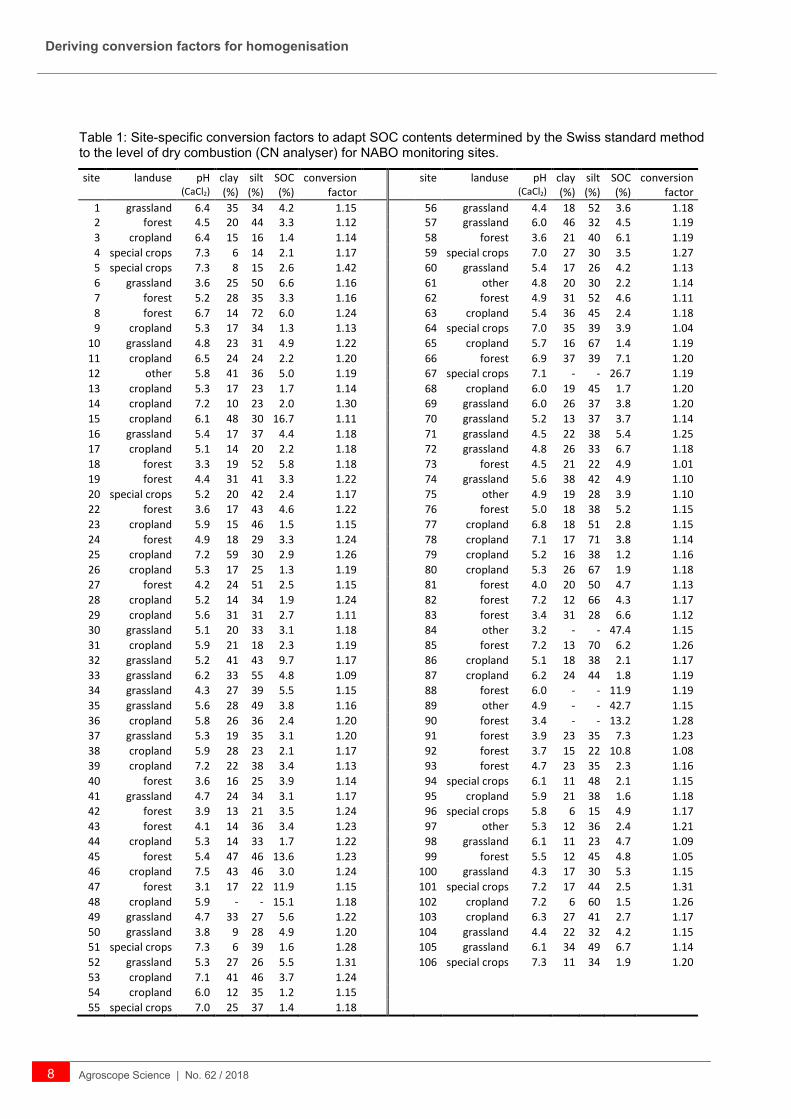
3 Deriving conversion factors for homogenisation The duplicate analyses by WO vs. DC revealed generally higher SOC recoveries for the latter (Figure 2). A robust linear regression (lmrob of R package robustbase; Rousseeuw et al 2015) was used to derive site-specific conversion factors based on the (log-transformed) SOC contents. The model confirmed that site-specific conversion factors were preferable to a universal one (with the respective model term being highly significant). Considering all data available from NABO sites (799 samples from 105 sites), site specific conversion factors (SOCDC / SOCWO) ranged from 1.01 to 1.42 (mean = median = 1.18; Figure 3). These correspond to relative recovery rates WO:DC from 70 to 99 % (median: 85 %). This is in line with published results. Generally, WO methods yield lower values of SOC than DC, although relative recoveries of WO:DC range from 27 to 144 % (Nelson and Sommers 1996).
Figure 2: Comparison of soil organic carbon (SOC) contents determined by dry combustion (DC) vs. SOC determined with wet oxidation (WO) by potassium dichromate according to the Swiss Standard Method (FAL 1996) for soil samples of the Swiss Soil Monitoring Network (NABO). The colours indicate the landuse of the respective site. Solid line: 1:1 line; broken line: median of conversion factor for all samples.
Deriving conversion factors for homogenisation
Agroscope Science | No. 62 / 2018 7
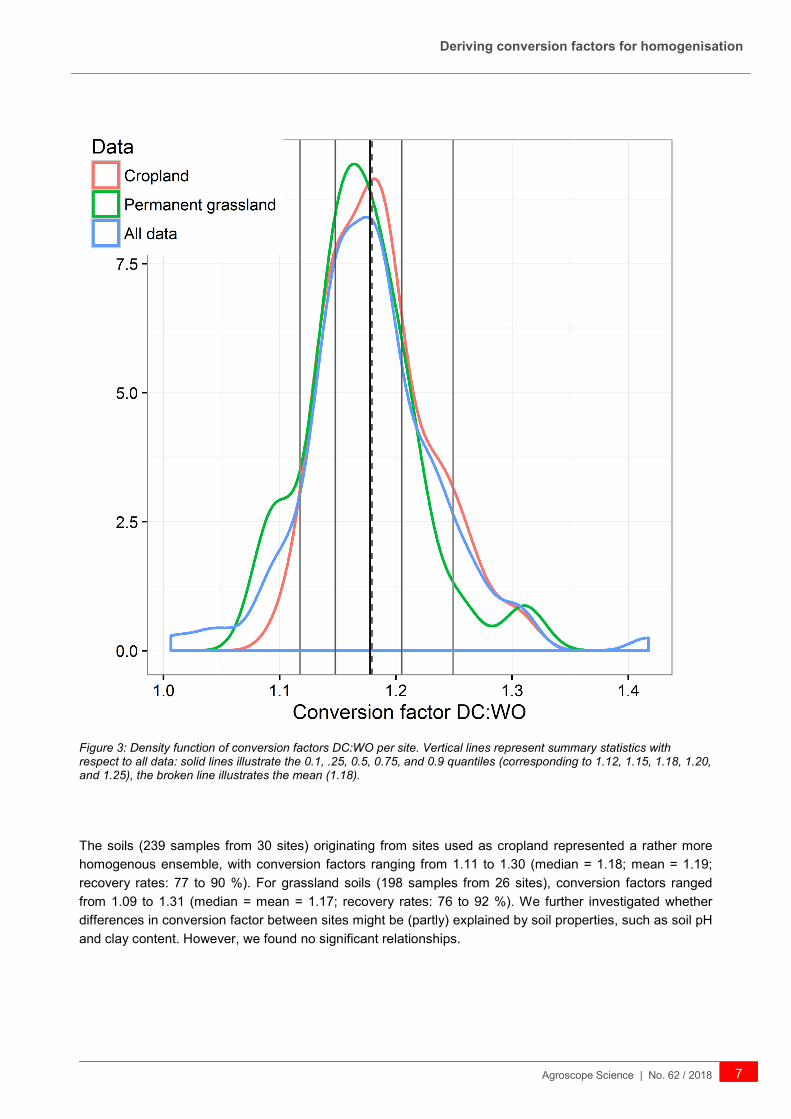
Figure 3: Density function of conversion factors DC:WO per site. Vertical lines represent summary statistics with respect to all data: solid lines illustrate the 0.1, .25, 0.5, 0.75, and 0.9 quantiles (corresponding to 1.12, 1.15, 1.18, 1.20, and 1.25), the broken line illustrates the mean (1.18).
The soils (239 samples from 30 sites) originating from sites used as cropland represented a rather more homogenous ensemble, with conversion factors ranging from 1.11 to 1.30 (median = 1.18; mean = 1.19; recovery rates: 77 to 90 %). For grassland soils (198 samples from 26 sites), conversion factors ranged from 1.09 to 1.31 (median = mean = 1.17; recovery rates: 76 to 92 %). We further investigated whether differences in conversion factor between sites might be (partly) explained by soil properties, such as soil pH and clay content. However, we found no significant relationships.
Deriving conversion factors for homogenisation
8 Agroscope Science | No. 62 / 2018
Table 1: Site-specific conversion factors to adapt SOC contents determined by the Swiss standard method to the level of dry combustion (CN analyser) for NABO monitoring sites.
site landuse pH (CaCl2)
clay (%)
silt (%)
SOC (%)
conversion factor
site landuse pH (CaCl2)
clay (%)
silt (%)
SOC (%)
conversion factor
1 grassland 6.4 35 34 4.2 1.15 56 grassland 4.4 18 52 3.6 1.18 2 forest 4.5 20 44 3.3 1.12 57 grassland 6.0 46 32 4.5 1.19 3 cropland 6.4 15 16 1.4 1.14 58 forest 3.6 21 40 6.1 1.19 4 special crops 7.3 6 14 2.1 1.17 59 special crops 7.0 27 30 3.5 1.27 5 special crops 7.3 8 15 2.6 1.42 60 grassland 5.4 17 26 4.2 1.13 6 grassland 3.6 25 50 6.6 1.16 61 other 4.8 20 30 2.2 1.14 7 forest 5.2 28 35 3.3 1.16 62 forest 4.9 31 52 4.6 1.11 8 forest 6.7 14 72 6.0 1.24 63 cropland 5.4 36 45 2.4 1.18 9 cropland 5.3 17 34 1.3 1.13 64 special crops 7.0 35 39 3.9 1.04
10 grassland 4.8 23 31 4.9 1.22 65 cropland 5.7 16 67 1.4 1.19 11 cropland 6.5 24 24 2.2 1.20 66 forest 6.9 37 39 7.1 1.20 12 other 5.8 41 36 5.0 1.19 67 special crops 7.1 - - 26.7 1.19 13 cropland 5.3 17 23 1.7 1.14 68 cropland 6.0 19 45 1.7 1.20 14 cropland 7.2 10 23 2.0 1.30 69 grassland 6.0 26 37 3.8 1.20 15 cropland 6.1 48 30 16.7 1.11 70 grassland 5.2 13 37 3.7 1.14 16 grassland 5.4 17 37 4.4 1.18 71 grassland 4.5 22 38 5.4 1.25 17 cropland 5.1 14 20 2.2 1.18 72 grassland 4.8 26 33 6.7 1.18 18 forest 3.3 19 52 5.8 1.18 73 forest 4.5 21 22 4.9 1.01 19 forest 4.4 31 41 3.3 1.22 74 grassland 5.6 38 42 4.9 1.10 20 special crops 5.2 20 42 2.4 1.17 75 other 4.9 19 28 3.9 1.10 22 forest 3.6 17 43 4.6 1.22 76 forest 5.0 18 38 5.2 1.15 23 cropland 5.9 15 46 1.5 1.15 77 cropland 6.8 18 51 2.8 1.15 24 forest 4.9 18 29 3.3 1.24 78 cropland 7.1 17 71 3.8 1.14 25 cropland 7.2 59 30 2.9 1.26 79 cropland 5.2 16 38 1.2 1.16 26 cropland 5.3 17 25 1.3 1.19 80 cropland 5.3 26 67 1.9 1.18 27 forest 4.2 24 51 2.5 1.15 81 forest 4.0 20 50 4.7 1.13 28 cropland 5.2 14 34 1.9 1.24 82 forest 7.2 12 66 4.3 1.17 29 cropland 5.6 31 31 2.7 1.11 83 forest 3.4 31 28 6.6 1.12 30 grassland 5.1 20 33 3.1 1.18 84 other 3.2 - - 47.4 1.15 31 cropland 5.9 21 18 2.3 1.19 85 forest 7.2 13 70 6.2 1.26 32 grassland 5.2 41 43 9.7 1.17 86 cropland 5.1 18 38 2.1 1.17 33 grassland 6.2 33 55 4.8 1.09 87 cropland 6.2 24 44 1.8 1.19 34 grassland 4.3 27 39 5.5 1.15 88 forest 6.0 - - 11.9 1.19 35 grassland 5.6 28 49 3.8 1.16 89 other 4.9 - - 42.7 1.15 36 cropland 5.8 26 36 2.4 1.20 90 forest 3.4 - - 13.2 1.28 37 grassland 5.3 19 35 3.1 1.20 91 forest 3.9 23 35 7.3 1.23 38 cropland 5.9 28 23 2.1 1.17 92 forest 3.7 15 22 10.8 1.08 39 cropland 7.2 22 38 3.4 1.13 93 forest 4.7 23 35 2.3 1.16 40 forest 3.6 16 25 3.9 1.14 94 special crops 6.1 11 48 2.1 1.15 41 grassland 4.7 24 34 3.1 1.17 95 cropland 5.9 21 38 1.6 1.18 42 forest 3.9 13 21 3.5 1.24 96 special crops 5.8 6 15 4.9 1.17 43 forest 4.1 14 36 3.4 1.23 97 other 5.3 12 36 2.4 1.21 44 cropland 5.3 14 33 1.7 1.22 98 grassland 6.1 11 23 4.7 1.09 45 forest 5.4 47 46 13.6 1.23 99 forest 5.5 12 45 4.8 1.05 46 cropland 7.5 43 46 3.0 1.24 100 grassland 4.3 17 30 5.3 1.15 47 forest 3.1 17 22 11.9 1.15 101 special crops 7.2 17 44 2.5 1.31 48 cropland 5.9 - - 15.1 1.18 102 cropland 7.2 6 60 1.5 1.26 49 grassland 4.7 33 27 5.6 1.22 103 cropland 6.3 27 41 2.7 1.17 50 grassland 3.8 9 28 4.9 1.20 104 grassland 4.4 22 32 4.2 1.15 51 special crops 7.3 6 39 1.6 1.28 105 grassland 6.1 34 49 6.7 1.14 52 grassland 5.3 27 26 5.5 1.31 106 special crops 7.3 11 34 1.9 1.20 53 cropland 7.1 41 46 3.7 1.24 54 cropland 6.0 12 35 1.2 1.15 55 special crops 7.0 25 37 1.4 1.18
Conclusions and recommendations
Agroscope Science | No. 62 / 2018 9
4 Conclusions and recommendations For studies assessing SOC contents over extended periods, it is common to combine data from WO and DC methods (e.g., Reijneveld et al. 2009; Heikkinen et al. 2013). In such cases, the different levels of the two methods must be taken into account to avoid distortion of temporal evolutions. When assessing repeated samplings of specific sites, it is favourable to derive a site-specific conversion factor based on duplicate analyses to adapt WO results to the level of DC. Depending on the soil, conversion factor might strongly differ between sites. However, if site-specific factors are not available, a general con-version factor of 1.18 is recommended for Swiss soils.
5 References FAL 1996 Referenzmethoden der Eidg. landwirtschaftlichen Forschungsanstalten, Zürich-Reckenholz
Gubler A, Schwab P, Wächter D, Meuli R G and Keller A 2015 Ergebnisse der Nationalen Bodenbeobachtung (NABO) 1985-2009. Zustand und Veränderungen der anorganischen Schadstoffe und Bodenbegleitparameter. Umwelt-Zustand 1507, Bern
Heikkinen J, Ketoja E, Nuutinen V and Regina K 2013 Declining trend of carbon in Finnish cropland soils in 1974-2009 Glob. Chang. Biol. 19 1456–69
Nelson D W and Sommers L E 1996 Total Carbon, Organic Carbon, and Organic Matter Methods of Soil Analysis Part 3—Chemical Methods ed D L Sparks, A L Page, P A Helmke and R H Loeppert (Madison, Wis: Soil Science Society of America) pp 961–1010
Reijneveld A, van Wensem J and Oenema O 2009 Soil organic carbon contents of agricultural land in the Netherlands between 1984 and 2004 Geoderma 152 231–8
Rousseeuw P, Croux C, Todorov V, Ruckstuhl A, Salibian-Barrera M, Verbeke T, Koller M and Maechler M 2015 robustbase: Basic Robust Statistics