HOMOGENEOUS CHARGE CATALYTIC IGNITION OF …€¦ · Research and Special Programs ... Most...
24
HOMOGENEOUS CHARGE CATALYTIC IGNITION OF ETHANOL-WATER/AIR MIXTURES IN A RECIPROCATING ENGINE Final Report KLK752A Compression Ratio and Catalyst Aging Effects on Aqueous Ethanol N09-04 National Institute for Advanced Transportation Technology University of Idaho Dan Cordon, Dr. Steven Beyerlein April 2009
Transcript of HOMOGENEOUS CHARGE CATALYTIC IGNITION OF …€¦ · Research and Special Programs ... Most...

HOMOGENEOUS CHARGE CATALYTIC IGNITION OF ETHANOL-WATER/AIR MIXTURES IN A
RECIPROCATING ENGINE
Final Report
KLK752A
Compression Ratio and Catalyst Aging Effects on Aqueous Ethanol
N09-04
National Institute for Advanced Transportation Technology
University of Idaho
Dan Cordon, Dr. Steven Beyerlein
April 2009

DISCLAIMER
The contents of this report reflect the views of the authors,
who are responsible for the facts and the accuracy of the
information presented herein. This document is disseminated
under the sponsorship of the Department of Transportation,
University Transportation Centers Program, in the interest of
information exchange. The U.S. Government assumes no
liability for the contents or use thereof.

1. Report No. 2. Government Accession
No.
3. Recipient’s Catalog No.
4. Title and Subtitle
Compression Ratio and Catalyst Aging Effects on Aqueous Ethanol: Homogeneous Charge Catalytic Ignition of Ethanol-Water/Air Mixtures in
a Reciprocating Engine
5. Report Date
April 2009
6. Performing Organization
Code
KLK752A
7. Author(s)
Cordon, Dan; Beyerlein, Dr. Steven
8. Performing Organization
Report No.
N09-04
9. Performing Organization Name and Address 10. Work Unit No. (TRAIS)
National Institute for Advanced Transportation Technology
University of Idaho
PO Box 440901; 115 Engineering Physics Building
Moscow, ID 838440901
11. Contract or Grant No.
DTRT07-G-0056
12. Sponsoring Agency Name and Address
US Department of Transportation
Research and Special Programs Administration
400 7th Street SW
Washington, DC 20509-0001
13. Type of Report and Period
Covered
Final Report: August 2007
– December 2008
14. Sponsoring Agency Code
USDOT/RSPA/DIR-1
15. Supplementary Notes:
16. Abstract
Lean ethanol-water/air mixtures have potential for reducing NOx and CO emissions in internal combustion
engines, with little well-to-wheels CO2 emissions. Conventional ignition systems have been unsuccessful at
igniting such mixtures. An alternative catalytic ignition source is being developed to aid in the combustion of
aqueous ethanol. The operating principle is homogeneous charge compression ignition inside a catalytic pre-
chamber, which causes torch ignition and flame propagation in the combustion chamber. Ignition timing can be
adjusted by changing the length of the catalytic core element, the length of the pre-chamber, the diameter of the
pre-chamber, and the electrical power supplied to the catalytic core element. To study engine operation, a 1.0L 3-
cylinder Yanmar diesel engine was converted for ethanol-water use, and compared with an unmodified engine.
Comparing the converted Yanmar to the stock engine shows an increase in torque and power, with improvements
in CO and NOx emissions. Hydrocarbon emissions from the converted engine increased significantly, but are
largely due to piston geometry not well suited for homogeneous charge combustion. No exhaust after treatment
was performed on either engine configuration. Applying this technology in an engine with a combustion chamber
and piston design suited for homogeneous mixtures has the potential to lower emissions to current standards, with
a simple reduction catalytic converter.
17. Key Words
Pollutant control, fuel systems, engine
testing, renewable fuels
18. Distribution Statement
Unrestricted; Document is available to the public
through the National Technical Information Service;
Springfield, VT.
19. Security Classif. (of
this report)
Unclassified
20. Security Classif. (of
this page)
Unclassified
21. No. of Pages
19
22. Price
…
Form DOT F 1700.7 (8-72) Reproduction of completed page authorized

Homogeneous Charge Catalytic Ignition of Ethanol-Water/Air i
Mixtures in a Reciprocating Engine
Table of Contents
Introduction ............................................................................................................................... 1
Catalytic Igniters ....................................................................................................................... 2
Engine Conversions ................................................................................................................... 4
Experimental Apparatus ............................................................................................................ 5
Engine Performance .................................................................................................................. 7
Modal Comparison .................................................................................................................. 11
Conclusion ............................................................................................................................... 16
References ............................................................................................................................... 17
Appendix ................................................................................................................................. 18
Figures
Figure 1 – Exploded view of catalytic igniter. .......................................................................... 2
Figure 2 – Flame pattern exiting pre-chamber nozzle. .............................................................. 3
Figure 3 – Experimental apparatus for engine testing. .............................................................. 6
Figure 4 – Full load BMEP for diesel and aquanol. .................................................................. 7
Figure 5 – Full load power for diesel and aquanol. ................................................................... 8
Figure 6 – Equivalence ratio for full load curves. ..................................................................... 9
Figure 7 – Performance map for diesel engine. ....................................................................... 10
Figure 8 – Performance map for aquanol engine. ................................................................... 10
Figure 9 – Mode points for comparing engines. ..................................................................... 11
Figure 10 – Efficiency in KJ/kWh. ......................................................................................... 12
Figure 11 – Equivalence ratio at each mode point. ................................................................. 13
Figure 12 – Brake specific carbon monoxide. ......................................................................... 13
Figure 13 – Brake specific hydrocarbons. ............................................................................... 14
Figure 14 – Brake specific carbon dioxide. ............................................................................. 15
Figure 15 – Brake specific oxides of nitrogen. ....................................................................... 15

Homogeneous Charge Catalytic Ignition of Ethanol-Water/Air ii
Mixtures in a Reciprocating Engine
Tables
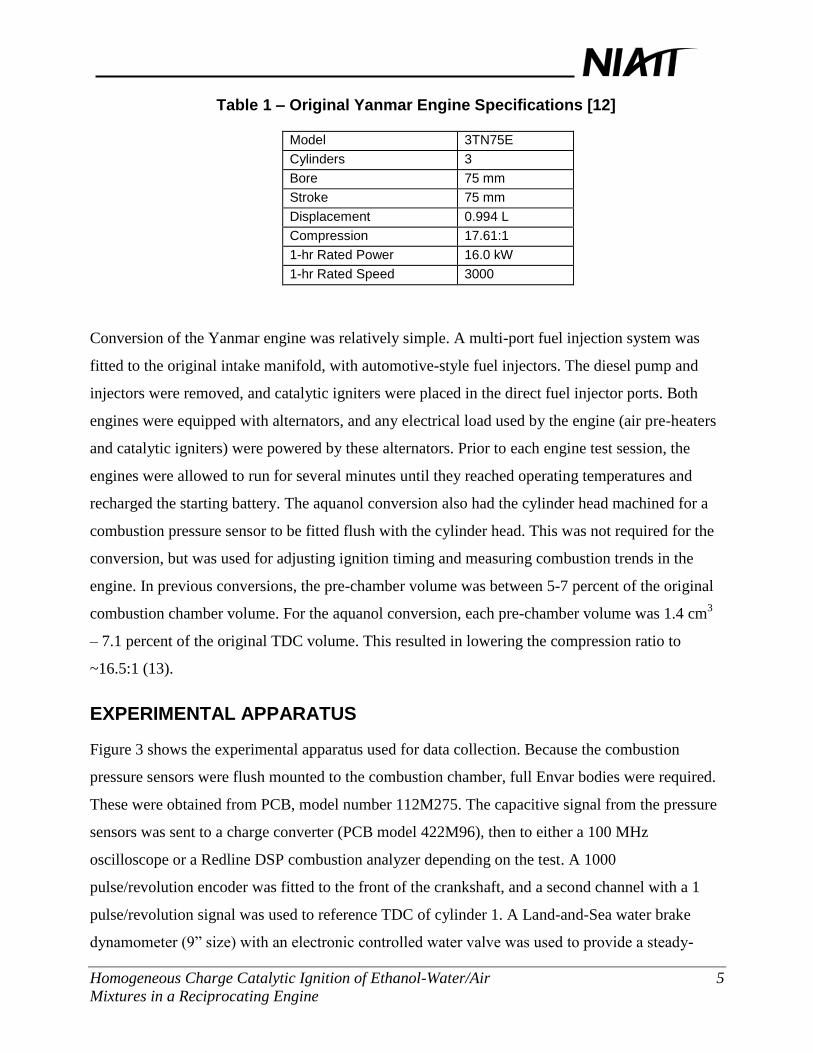
Table 1 – Original Yanmar Engine Specifications [12]. ........................................................... 5

Homogeneous Charge Catalytic Ignition of Ethanol-Water/Air 1
Mixtures in a Reciprocating Engine
INTRODUCTION
Lean burn piston engines are an avenue for reducing fuel consumption and environmental impact.
The difficulty in burning lean air/fuel mixtures spawned the development of the catalytic igniter
(1). Most homogeneous charge lean burn engines suffer from reduced power output per
displacement and incompatibility with oxidation/reduction catalysts (2). The catalytic igniter was
developed to help overcome these issues. Previous engine conversions have shown an increase in
net thermal efficiency and power output and have been able to operate under lean conditions with
reduced emissions.
The University of Idaho has been working with Automotive Resources Inc. for the past ten years
to study catalytic igniters in engines fueled by ethanol-water blends. Initially, lean ethanol
mixtures were studied, but resulted in high nitrogen oxide (NOx) emissions. Adding water to the
fuel lowered combustion temperatures and resulted in a large reduction of NOx emissions.
Mixtures of up to 50 percent ethanol and 50 percent water (by volume) have been used in test
engines. Because no noticeable benefits were noticed beyond 30 percent water, a 70/30 blend of
ethanol/water (by volume) was used in this study. This mixture is sometimes called “aquanol.”
Because ethanol readily adsorbs water, no special emulsions or processes are required to mix this
fuel.
Combusting aqueous fuel in a piston engine requires a larger ignition source than necessary for
gasoline. High-energy spark ignition systems are capable of initiating combustion, but the high
water content in the cylinder tends to quench the flame front. Past attempts at compression
ignition of aqueous fuel has been unsuccessful due to difficulties in controlling ignition timing.
Modern homogeneous charge compression ignition (HCCI) control systems may open this
opportunity in the future. Using a catalyst provides a consistent and controllable ignition source
with sufficient energy to sustain combustion of the in-cylinder mixture.
The use of water in combustion – either mixed with the fuel or injected separately – is not new,
and has been published in many papers. Cold-starting with greater than 20 percent water has not
been found in the literature. Once at operating temperatures, many engines using more than 20
percent water require significant energy for an air pre-heater in order to sustain combustion (5, 6,

Homogeneous Charge Catalytic Ignition of Ethanol-Water/Air 2
Mixtures in a Reciprocating Engine
7, and 8). Catalytic ignition has been successful with cold starting engines with as much as 50
percent water in the fuel, and the electrical energy used to heat the catalyst is 0-20W per cylinder.
CATALYTIC IGNITERS
The catalytic igniter is a self-contained ignition system that can be retrofitted to Spark Ignition
(SI) and most Compression Ignition (CI) engines. For SI engines, the catalytic igniter is located in
the spark plug hole. Conversions for CI engines must be on direct injection engines, and the
catalytic igniter is located in place of the injector. An illustration of a typical catalytic igniter is
shown in Figure 1. The igniter core is a hollow ceramic rod with a heating element embedded in
the bottom end. A coating of noble metal catalyst paste is painted over the heater element. The top
end of the tube is sealed with an electrical feed through for the heating element. This assembly is
screwed in to a brass pre-chamber. The lower end of this pre-chamber is mounted to the cylinder
head where the tip is exposed to the combustion chamber. Holes in the end of the pre-chamber
allow fresh mixture to enter and a torch-like ignition source to exit.
Figure 1 – Exploded view of catalytic igniter.
Ignition begins during the compression stroke, as soon as fresh mixture comes in contact with the
hot catalytic surface. Reduced activation energy associated with heterogeneous catalysts means
that this occurs far below the normal gas-phase ignition temperature (9). Combustion products
and intermediate species accumulate in the top of the pre-chamber above the heated catalyst.

Homogeneous Charge Catalytic Ignition of Ethanol-Water/Air 3
Mixtures in a Reciprocating Engine
After sufficient pressure and temperature from energy release and compression occur, multi-point
homogeneous ignition inside the pre-chamber results (9, 10). The combusting mixture is released
out the bottom of the pre-chamber through nozzles that direct the flame around the main
combustion chamber. This flame becomes the source of ignition for the main combustion
chamber, which burns in a typical flame propagation method. It is believed that the high energy
and large volume of this main chamber ignition source are largely responsible for stable operation
on lean ethanol-water mixtures.
In-cylinder imaging has not been captured. To approximate the flame pattern exiting the catalytic
igniter, a propane-air mixture was pumped through the top of the pre-chamber and past the hot
catalyst surface. The resulting flame pattern is shown in Figure 2. It is believed that this is similar
to what occurs in operation, but this has not yet been confirmed.
Figure 2 – Flame pattern exiting pre-chamber nozzle.
Controlling ignition timing is a critical problem with any homogeneous charge compression
ignition engine. Both Yanmar conversion engines operate without a throttle plate, so only the
amount of fuel injected determines the engine power output. Because of this, the air/fuel ratio
varies greatly over the operating range of the engine. The original diesel engine is direct injection,
and fuel burns in a diffusion method. The aquanol conversion is a premixed air/fuel mixture – fuel
is injected in the intake manifold – and operates via flame propagation.
A mathematical model was created to explore parameters that effect ignition timing with the
catalytic igniter (11). In the case of an unthrottled engine, adjustment of ignition timing

Homogeneous Charge Catalytic Ignition of Ethanol-Water/Air 4
Mixtures in a Reciprocating Engine
characteristics was best accomplished by changing the length of the ceramic core, and therefore
the position of the catalyst in the pre-chamber. Shortening the rod would move the heated catalyst
section higher in the pre-chamber, causing there to be a greater delay in the fresh mixture coming
in contact with the catalyst. This resulted in a retardation of the ignition timing. Conversely,
longer rods resulted in advancing ignition timing. The relationship between igniter core length
and ignition is not completely linear. However, in the ranges used, a core length change of 1.0mm
resulted in a ~5° change in ignition timing.
Dynamic change of the catalyst location was not possible. The final decision of igniter core length
was done by observing in-cylinder pressure traces and changing out the cores for different
lengths. Testing started with a short length so the ignition timing would be retarded and relatively
safe. The engine was run through a full load RPM sweep, and if there were no regions where
ignition was too advanced, a longer core would be installed and the engine tested again. This was
repeated until detonation was observed. The longest (most advanced timing) that did not
experience detonation was selected for this study. Ignition timing was not optimal for all
operating points, and use of a programmable heating circuit has potential to improve engine
performance and emissions.
ENGINE CONVERSIONS
Two Yanmar diesel engines were used in this work. Specifications are given in Table 1. Both
were recently rebuilt and brake-in was performed as per manufacturer recommendations. One
engine was left in original configuration to be used as a baseline comparison for this work. All
previous aquanol conversions were done on SI engines. In these conversions, the original throttle
was maintained, and engines were tuned to maintain a near-constant air/fuel ratio over the entire
operating range. In an attempt to study high compression ratios and lean combustion, the Yanmar
conversion was not fitted with a throttle. Engine output is controlled only by the amount of fuel
injected in to the intake manifold. Because the in-cylinder volume remains relatively constant,
changes in fuel injection quantity result in a wide range of homogeneous air/fuel equivalence
ratios.
Homogeneous Charge Catalytic Ignition of Ethanol-Water/Air 5
Mixtures in a Reciprocating Engine
Table 1 – Original Yanmar Engine Specifications [12]
Model 3TN75E
(S) Cylinders 3
Bore 75 mm
Stroke 75 mm
Displacement 0.994 L
Compression
Ratio
17.61:1
1-hr Rated Power 16.0 kW
1-hr Rated Speed 3000
RPM
Conversion of the Yanmar engine was relatively simple. A multi-port fuel injection system was
fitted to the original intake manifold, with automotive-style fuel injectors. The diesel pump and
injectors were removed, and catalytic igniters were placed in the direct fuel injector ports. Both
engines were equipped with alternators, and any electrical load used by the engine (air pre-heaters
and catalytic igniters) were powered by these alternators. Prior to each engine test session, the
engines were allowed to run for several minutes until they reached operating temperatures and
recharged the starting battery. The aquanol conversion also had the cylinder head machined for a
combustion pressure sensor to be fitted flush with the cylinder head. This was not required for the
conversion, but was used for adjusting ignition timing and measuring combustion trends in the
engine. In previous conversions, the pre-chamber volume was between 5-7 percent of the original
combustion chamber volume. For the aquanol conversion, each pre-chamber volume was 1.4 cm3
– 7.1 percent of the original TDC volume. This resulted in lowering the compression ratio to
~16.5:1 (13).
EXPERIMENTAL APPARATUS
Figure 3 shows the experimental apparatus used for data collection. Because the combustion
pressure sensors were flush mounted to the combustion chamber, full Envar bodies were required.
These were obtained from PCB, model number 112M275. The capacitive signal from the pressure
sensors was sent to a charge converter (PCB model 422M96), then to either a 100 MHz
oscilloscope or a Redline DSP combustion analyzer depending on the test. A 1000
pulse/revolution encoder was fitted to the front of the crankshaft, and a second channel with a 1
pulse/revolution signal was used to reference TDC of cylinder 1. A Land-and-Sea water brake
dynamometer (9” size) with an electronic controlled water valve was used to provide a steady-

Homogeneous Charge Catalytic Ignition of Ethanol-Water/Air 6
Mixtures in a Reciprocating Engine
state load for engine testing. Calibration of the dynamometer was performed before each run, and
confirmed after each run to detect signs of torque drift. Fuel flow was recorded by a Max
Machinery model 710 fuel conditioning cart with temperature corrected calibrations for both
diesel and 70/30 aquanol fuel.
Figure 3 – Experimental apparatus for engine testing.
Not shown on Figure 3 are the bungs for measuring exhaust gas temperature (EGT) and
emissions. The EGT bung was located in the exhaust manifold collector, 150-250 mm
downstream of the exhaust valve depending on the cylinder. Because of this, EGT readings are
much lower than observed with closer temperature probes. In this study, the EGTs are only used
to compare the engines to one another. The emissions collection bung was located 24” upstream
of the exhaust exit to minimize any effects from ambient air getting in to the exhaust system
between exhaust pulses. Emissions were detected by an Emissions System Inc. 5-gas analyzer,
model 5001-5. This model uses a Peltier cooler to remove water from the incoming exhaust
sample line. A NDIR sensor is used to measure CO, CO2, and HC (hexane equivalent)
concentrations. Electrochemical sensors are used to measure NOx and O2 concentrations.

Homogeneous Charge Catalytic Ignition of Ethanol-Water/Air 7
Mixtures in a Reciprocating Engine
ENGINE PERFORMANCE
BMEP and SAE corrected shaft power are shown for both the stock diesel and aquanol
conversion in Figures 4 and 5. The Yanmar spec for peak engine speed is 3000 RPM. In original
configuration, the slow burn rate of fuel keeps the engine from running beyond this speed.
However, the homogeneous mixture of the converted engine burns quite rapidly in comparison.
The converted engine was capable of much higher engine speeds, but because this was outside the
max speed rating, the aquanol engine was tuned to cut fuel for any speed over 3100 RPM. If the
rotating assembly was safe to run beyond this speed, power output from the aquanol engine may
have been higher still.
Figure 4 – Full load Brake Mean Effective Pressure (BMEP)
for diesel and aquanol.
Full Load BMEP
600
650
700
750
800
850
900
950
1500 2000 2500 3000
Engine Speed [RPM]
BM
EP
[k
Pa
]
Aquanol
Diesel

Homogeneous Charge Catalytic Ignition of Ethanol-Water/Air 8
Mixtures in a Reciprocating Engine
Figure 5 – Full load power for diesel and aquanol.
The aquanol engine had higher full load Brake Mean Effective Pressure (BMEP) and power
curves than the diesel engine. The equivalence ratio for the full load data is shown in Figure 6. It
was calculated using an equation recommended by the manufacturer of the 5-gas analyzer.
Several runs were made with the aquanol engine operating under higher equivalence ratios than
displayed in these figures. Under richer conditions the engine produced even higher torque and
power levels, but the emissions of CO increased by as much as 200 percent. Thus the engine was
de-tuned to produce reasonable emissions at the cost of peak performance.
Full Load Power
8
10
12
14
16
18
20
22
24
1500 2000 2500 3000
Engine Speed [RPM]
Po
wer
[kW
]
Aquanol
Diesel

Homogeneous Charge Catalytic Ignition of Ethanol-Water/Air 9
Mixtures in a Reciprocating Engine
Figure 6 – Equivalence ratio for full load curves.
The lower heating value for a 70/30 aquanol blend is calculated at 17.4 MJ/kg – 42 percent lower than
diesel fuel at 41.4 MJ/kg. Because of this, comparing Brake Specific Fuel Consumption (BSFC) numbers
directly would not tell the full story. Instead, net thermal efficiency was used to compare the two engines.
Based on evenly captured data over the full range of operating conditions, performance maps with lines
of constant net thermal efficiency were created. Figure 7 shows the performance map for the diesel
engine, and Figure 8 shows the aquanol engine.
Equivalence Ratio at Full Load
0.0
0.1
0.2
0.3
0.4
0.5
0.6
0.7
0.8
0.9
1.0
1500 2000 2500 3000
Engine Speed [RPM]
Eq
uiv
ale
nce R
ati
o
Aquanol
Diesel

Homogeneous Charge Catalytic Ignition of Ethanol-Water/Air 10
Mixtures in a Reciprocating Engine
Figure 7 – Performance map for diesel engine.
Figure 8 – Performance map for aquanol engine.
The diesel engine has a wide range of operation where there is high efficiency. From 2000-3000
RPM and 40-80 percent load, the engine is over 30 percent efficient. This covers nearly ¾ of the
operating range of the engine. The aquanol conversion is quite efficient at high loads (above 80
23.9
23.9
25.5
27.1
27.1
28.6
28.6
28.628.6
30.2
30.2
30.2
31.833.4
33.4
34.9
34.9
Speed RPM
To
rqu
e N
*m
Diesel Thermal Efficiency
1500 2000 2500 3000
20
30
40
50
60
10.5
10.513.2
15.9
18.621.3
21.3
24
26.7
29.4
29.4
32.1 32.132.1
34.8
34.8
34.8
Speed RPM
To
rqu
e N
*m
Aquanol Thermal Efficiency
1500 2000 2500 3000
20
30
40
50
60
70

Homogeneous Charge Catalytic Ignition of Ethanol-Water/Air 11
Mixtures in a Reciprocating Engine
percent of peak load) but efficiency continually falls with reduced load. At lower loads there is a
very lean homogeneous mixture in the cylinder. Based on emissions collected at these points,
combustion efficiency is extremely poor. When operating below 20 N*m and under 2500 RPM,
the aquanol engine is at an equivalence ratio slightly below 0.3. However, at high load across a
wide RPM range the aquanol conversion has a comparable thermal efficiency to the diesel engine.
MODAL COMPARISON
Contour plots of Brake Specific Emissions were cluttered, and some of the emissions are on
different orders of magnitude between the two engines. Instead, nine mode points based on
BMEP and engine speed were selected for comparison as shown in Figure 9. The mode points are
labeled 1-9. Mode points 1-6 correlate to the diesel engine at peak load. Aquanol data was
selected that most closely matched to the diesel engine mode points. Load point 7 represents low
load and medium speed. Load point 8 represents low load and high speed. Load point 9 is at a
medium load and speed. Brake specific emissions were calculated using the EPA 40 CFR Part 91
Section 419c. See Appendix A for a sample calculation.
Figure 9 – Mode points for comparing engines.
Efficiency maps for the whole operating range were shown in Figures 7 and 8. Figure 10 shows
efficiency at each mode point given in units of kJ/kWh. This shows the rate of fuel energy used
(mass flow * heating value) divided by the power output of the engine. Lower numbers represent
Mode Points and Net Thermal Efficiency
0
100
200
300
400
500
600
700
800
900
1000
1500 2000 2500 3000
Engine Speed [RPM]
BM
EP
[k
Pa
]
Diesel Mode Points
Aquanol Mode Points
12 3 4 5
6
7 8
9

Homogeneous Charge Catalytic Ignition of Ethanol-Water/Air 12
Mixtures in a Reciprocating Engine
higher efficiency than larger numbers. Shown in Figure 11 is the equivalence ratio for each mode
point. The diesel engine operates leaner than the aquanol engine at every mode point. Of interest
is how the two engines compare when operating under the same speed and equivalence ratio.
Mode point three of the diesel data and point seven of the aquanol data provide this comparison.
The equivalence ratio of the aquanol engine at point seven is similar to the equivalence ratio of
diesel at point three, and they are both at the same engine speed (2250 RPM). Under these
conditions the aquanol engine makes less power than the diesel engine and is also much less
efficient. The combustion efficiency of the diesel engine is quite good at this point, but the lean
homogeneous mixture does not burn very completely. This is also evident in the hydrocarbon
emissions.
Figure 10 – Efficiency in KJ/kWh.
Energy Usage Comparison
0
5000
10000
15000
20000
25000
30000
35000
1 2 3 4 5 6 7 8 9
Mode Points
Eff
icie
ncy [
kJ/k
W*h
r]
Diesel Aquanol

Homogeneous Charge Catalytic Ignition of Ethanol-Water/Air 13
Mixtures in a Reciprocating Engine
Figure 11 – Equivalence ratio at each mode point.
Carbon monoxide emissions are given in Figure 12. At the higher load points and equivalence
ratios (points 1-6) the aquanol engine produced fewer CO emissions compared to the diesel
engine. However, at the highly lean conditions of low load (points 7 and 8), the aquanol engine
produced greater amounts of CO.
Figure 12 – Brake specific carbon monoxide.
Equivalence Ratio
0.000
0.100
0.200
0.300
0.400
0.500
0.600
0.700
0.800
0.900
1.000
1 2 3 4 5 6 7 8 9
Mode Points
Ph
i
Diesel
Aquanol
Brake Specific CO Comparison
0
20
40
60
80
100
120
1 2 3 4 5 6 7 8 9
Mode Point
BS
CO
[g
m/k
W-h
r]
Diesel
Aquanol
Homogeneous Charge Catalytic Ignition of Ethanol-Water/Air 14
Mixtures in a Reciprocating Engine
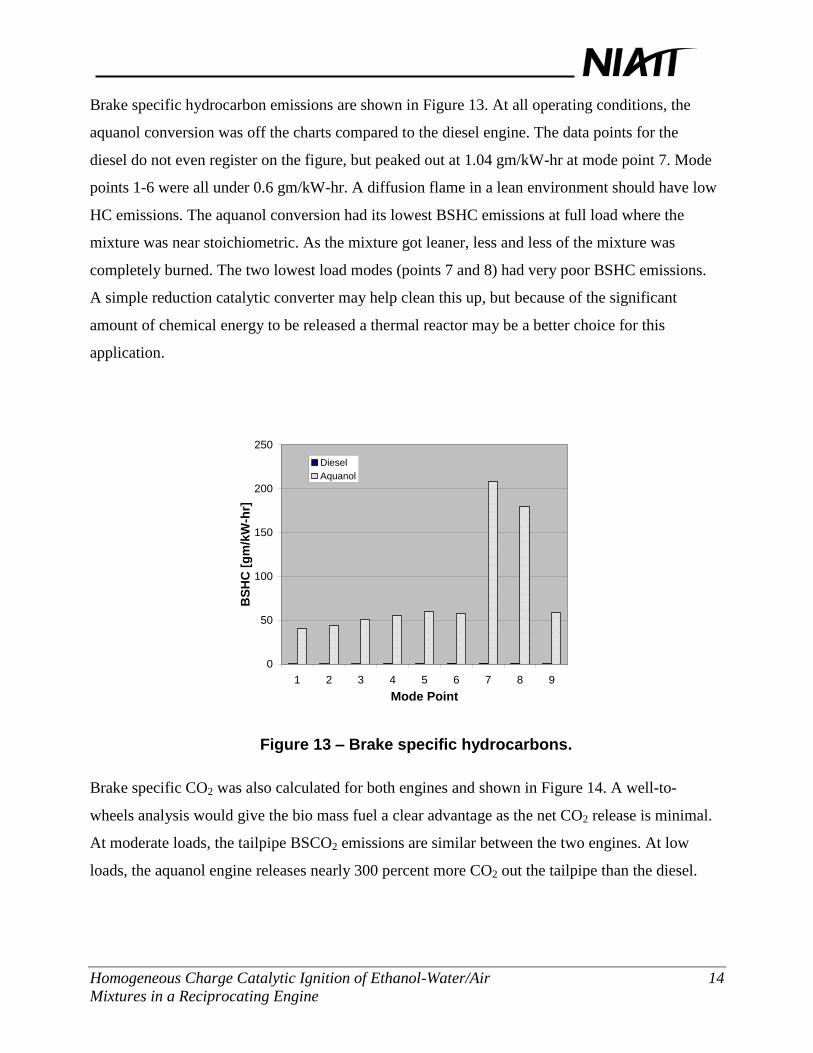
Brake specific hydrocarbon emissions are shown in Figure 13. At all operating conditions, the
aquanol conversion was off the charts compared to the diesel engine. The data points for the
diesel do not even register on the figure, but peaked out at 1.04 gm/kW-hr at mode point 7. Mode
points 1-6 were all under 0.6 gm/kW-hr. A diffusion flame in a lean environment should have low
HC emissions. The aquanol conversion had its lowest BSHC emissions at full load where the
mixture was near stoichiometric. As the mixture got leaner, less and less of the mixture was
completely burned. The two lowest load modes (points 7 and 8) had very poor BSHC emissions.
A simple reduction catalytic converter may help clean this up, but because of the significant
amount of chemical energy to be released a thermal reactor may be a better choice for this
application.
Figure 13 – Brake specific hydrocarbons.
Brake specific CO2 was also calculated for both engines and shown in Figure 14. A well-to-
wheels analysis would give the bio mass fuel a clear advantage as the net CO2 release is minimal.
At moderate loads, the tailpipe BSCO2 emissions are similar between the two engines. At low
loads, the aquanol engine releases nearly 300 percent more CO2 out the tailpipe than the diesel.
Brake Specific HC Comparison
0
50
100
150
200
250
1 2 3 4 5 6 7 8 9
Mode Point
BS
HC
[g
m/k
W-h
r]
Diesel
Aquanol

Homogeneous Charge Catalytic Ignition of Ethanol-Water/Air 15
Mixtures in a Reciprocating Engine
Figure 14 – Brake specific carbon dioxide.
Brake specific NOx emissions are shown in Figure 15. As expected, NOx from the diesel engine is
much greater than the aquanol engine. The water in the ethanol fuel was used as a means of
reducing EGTs and therefore NOx emissions. It was expected that the EGTs of the aquanol engine
would be lower than the diesel. This was not the case as the diesel EGTs ranged between 63 –
137°C, while the aquanol EGTs ranged between 170 – 255°C. The flame temperature of aqueous
ethanol is much lower than gasoline or diesel, and homogeneous charge combustion typically
have reduction in NOx emissions.
Figure 15 – Brake specific oxides of nitrogen.
Brake Specific CO2 Comparison
0
500
1000
1500
2000
2500
3000
3500
1 2 3 4 5 6 7 8 9
Mode Point
BS
CO
2 [
gm
/kW
-hr]
Diesel
Aquanol
Brake Specific NOx Comparison
0
1
2
3
4
5
6
7
8
1 2 3 4 5 6 7 8 9
Mode Point
BS
NO
x [
gm
/kW
-hr]
Diesel
Aquanol

Homogeneous Charge Catalytic Ignition of Ethanol-Water/Air 16
Mixtures in a Reciprocating Engine
CONCLUSION
The use of catalytic igniters allowed engine operation of homogeneous mixtures under very lean
conditions. The larger ignition source also made it possible to ignite an aqueous ethanol mixture
that was not possible with the original spark ignition system. The initial goal of aqueous ethanol
research was lean combustion without high NOx emissions. This has been realized in this work.
Slight increases in peak thermal efficiency were observed with the converted engine, and a
significant increase in engine torque and power output was also achieved.
Low load operation of the aquanol engine was possible at the lean limits at equivalence ratios of
0.3, but efficiency and emissions suffered greatly at low loads. Hydrocarbon cleanup is a logical
next step for this application so that emissions could be dropped down to gasoline engine
equivalents. Future work should be conducted with high compression ratios, and with a
combustion chamber geometry better suited for homogeneous charge applications. This may help
reduce some of the hydrocarbon emissions prior to exhaust after-treatment. A high-speed engine
should also be used to find the resonance time requirements for aqueous ethanol.

Homogeneous Charge Catalytic Ignition of Ethanol-Water/Air 17
Mixtures in a Reciprocating Engine
REFERENCES
1. Cherry, M., Catalytic-Compression Timed Ignition, US Patent 5 109 817, December 18,
1990.
2. Cherry, M., Morrisset, R., and Beck, N., “Extending Lean Limit with Mass-Timed
Compression Ignition Using a Plasma Torch,” Society of Automotive Engineers Paper
#921556, 1992.
3. Gottschalk, Mark A., “Catalytic Ignition Replaces Spark Plugs,” Design News, May 22,
1995.
4. Dale, J. and Oppenheim, A., “A Rationale for Advances in Technology of IC Engines,”
Society of Automotive Engineers Paper #820047, 1982.
5. Browning, L.H., and Pefley, R.K., “Kinetic Wall Quenching of Methanol Flames with
Applications to Spark Ignition Engines,” Society of Automotive Engineers Paper 790676,
1979.
6. Pischinger, F., and Kramer, K., “The Influence of Engine Parameters on the Aldehyde
Emissions of a Methanol Operated Four-Stroke Otto Cycle Engine,” Third International
Symposium on Alcohol Fuel Technology, Asilomar, CA, May 28-31, 1979.
7. Lee, W., and Geffers, W., “Engine Performance and Exhaust Emissions Characteristics of
Spark Ignition Engines Burning Methanol and Methanol Mixtures,” A.I.Ch.E. Symposium
Series #165, Vol. 73, 1977.
8. Christensen, M., and Johnasson, B., “Homogeneous Charge Compression Ignition with
Water Injection,” Society of Automotive Engineers Paper #1999-01-0182, 1999.
9. Cho, P. and Law, C., “Catalytic Ignition of Fuel/Oxygen/Nitrogen Mixtures over
Platinum,” Combustion and Flame, Vol. 66, pp. 159-170, 1986.
10. Pfefferle, L., “Catalysis in Combustion, Catalysis Reviews,” Science and Engineering
Vol. 29, pp. 219-267, 1987.
11. Cordon, D., Clarke, E., “Catalytic Igniter to Support Combustion of Ethanol- Water/Air
Mixtures in Internal Combustion Engines,” Society of Automotive Engineers Paper #
2002-01-2863, 2002.
12. Yanmar Diesel Engine Co, “Service Manual for 3TN75E Engine,” 1986
13. Clarke, E., “Characterization of Aqueous Ethanol Homogeneous Charge Catalytic
Compression Ignition,” Master’s Thesis, University of Idaho, 2001.

APPENDIX
EXAMPLE CALCULATION USING FUEL FLOW TO FIND MASS EMISSIONS
(Inputs for fuel composition are in blue. Inputs for each mode point are in yellow)
Units and Constants
Molecular Weights
Humidity Correction for NOx
Fuel Composition
Measured Engine Data
Measured Emissions Data
<--- corrected for Hexane readout
Calculated Data
Percent H2 present in exhaust (calculated)
Correction factor to correct measurements on a dry basis to a wet basis
rev 2 rad ppmMethane 1 ppmNOx 1 ppmC1 1
MCO 28.01gm
molMCO2 44.01
gm
molMNO2 46.01
gm
mol
Hspecific 3.0343gm
kgKH
1
1 0.0329 Hspecific 10.71KH 0.74
HCratio 1.75 MWfuel 12.01 1.008HCratiogm
molMWfuel 13.774
gm
mol
RPMmeasured 1750rev
minTorquemeasured 45.3925ft lbf Gfuel 7.6235
lb
hr
CO2dry 3.375% COdry .705% O2dry 15.7025%
NOxdry 371.5ppmNOx HCdry 22.256 ppmMethane
Powermeasured Torquemeasured RPMmeasured Powermeasured 11.279kW
H2dry
0.5 HCratio COdry COdry CO2dry
COdry 3 CO2dry
H2dry 0.232%
Kfactor1
1 .005 COdry CO2dry HCratio 0.01 H2dry 100 Kfactor 0.968

% Carbon
Calculated Mass Emissions
Comparing carbon flow in and carbon flow out
HCwet HCdry Kfactor HCwet 129.188ppmC1
COwet COdry Kfactor COwet 0.682%
CO2wet CO2dry Kfactor CO2wet 3.266%
NOxwet NOxdry Kfactor NOxwet 359.501ppmNOx
O2wet O2dry Kfactor O2wet 15.195%
TC COwet CO2wet
HCwet
106
100 TC 3.961
HCGfuel
T C
100
HCwet
106
HC 11.278gm
hr
COMCO
MWfuel
Gfuel
T C
100
COwet CO 1.211 103 gm
hr
CO2MCO2
MWfuel
Gfuel
T C
100
CO2wet CO2 9.11 103 gm
hr
NOxMNO2
MWfuel
Gfuel
T C
100
NOxwet
106
KH NOx 77.523gm
hr
mdot_carbon_HCHC
12.01 1.008( )gm
mol
12.01gm
molmdot_carbon_HC 10.405
gm
hr
mdot_carbon_COCO
MCO
12.01gm
molmdot_carbon_CO 519.294
gm
hr
mdot_carbon_CO2CO2
MCO2
12.01gm
molmdot_carbon_CO2 2.486 10
3 gm
hr
mdot_carbon_exh mdot_carbon_HC mdot_carbon_CO mdot_carbon_CO2
mdot_carbon_exh 3.016 103 gm
hr
mdot_carbon_fuel
Gfuel
MWfuel
12.01gm
molmdot_carbon_fuel 3.015 10
3 gm
hr