Homicide StatisticsIn Scotland, homicide includes the offences of murder and culpable homicide. In...
37
RESEARCH PAPER 99/56 27 MAY 1999 Homicide Statistics This paper is one of an occasional series, updating those issued in 1990 (Background Paper no. 263) and 1994 (Research Paper 94/15) with the latest figures for homicide offences committed in the UK. Figures for particular types of homicide, such as those involving firearms or ethnic minority victims, are presented. Some consideration of sentencing and reconvictions, and some international comparisons are included. Patsy Richards SOCIAL AND GENERAL STATISTICS SECTION HOUSE OF COMMONS LIBRARY
Transcript of Homicide StatisticsIn Scotland, homicide includes the offences of murder and culpable homicide. In...

RESEARCH PAPER 99/5627 MAY 1999
Homicide Statistics
This paper is one of an occasional series, updatingthose issued in 1990 (Background Paper no. 263) and1994 (Research Paper 94/15) with the latest figures forhomicide offences committed in the UK. Figures forparticular types of homicide, such as those involvingfirearms or ethnic minority victims, are presented.Some consideration of sentencing and reconvictions,and some international comparisons are included.
Patsy Richards
SOCIAL AND GENERAL STATISTICS SECTION
HOUSE OF COMMONS LIBRARY

Library Research Papers are compiled for the benefit of Members of Parliament and theirpersonal staff. Authors are available to discuss the contents of these papers with Membersand their staff but cannot advise members of the general public.
Users of the printed version of these papers will find a pre-addressed response form at theend of the text.
ISSN 1368-8456
Recent Library Research Papers include:
99/41 The Football (Offences and Disorder) Bill [Bill 17 of 1998-99] 14.04.99
99/42 The Road Haulage Industry: costs and taxes 19.04.99
99/43 Disability Rights Commission Bill [HL] [Bill 73 of 1998-99] 20.04.99
99/44 Unemployment by Constituency - March 1999 21.04.99
99/45 Adoption (Intercountry Aspects) Bill [Bill 18 of 1998-99] 22.04.99
99/46 Local Elections - Proposals for Reform 28.04.99
99/47 Economic Indicators 04.05.99
99/48 Kosovo: Operation "Allied Force" 29.04.99
99/49 The Northern Ireland (Location of Victims' Remains) Bill 07.05.99
[Bill 92 of 1998-99]
99/50 Scottish Parliament Elections: 6 May 1999 11.05.99
99/51 Welsh Assembly Elections: 6 May 1999 12.05.99
99/52 The local elections of 6 May 1999 17.05.99
99/53 Unemployment by Constituency - April 1999 19.05.99
99/54 Institutional Reform in the European Union 20.05.99
99/55 Wind Power (forthcoming) 26.05.99
Research Papers are available as PDF files:
• to members of the general public on the Parliamentary web site,URL: http://www.parliament.uk
• within Parliament to users of the Parliamentary Intranet,URL: http://hcl1.hclibrary.parliament.uk
Summary of main points
Homicide in England and Wales includes the offences of murder, manslaughter andinfanticide. In 1997, 738 deaths were initially recorded as homicide. This was a 9% rise from1996, exceeded this century only by 753 in 1995. Around 15% of homicides as recorded bythe police are generally reclassified as other offences following police and court action.
In Scotland, homicide includes the offences of murder and culpable homicide. In 1997, 88cases (and the same number of victims) of homicide were recorded. This compared to 119cases and 138 victims of homicide in 1996, but 1996 included the shootings at Dunblane.1997’s total was the lowest since 1990 and similar to the average level recorded in the 1980s.Since the 1960s the rate of homicide per million population has been slightly higher inScotland than in England and Wales. It is difficult to compare these rates to Northern Irelandbecause of the security situation, but figures for that country are included in this paper.
As homicide victims, the sexes differ. In England and Wales in 1997, a third of homicidevictims were female. In the early 1990s females accounted for more (around 40% of) victims.Almost four fifths of female victims and just over half of male victims knew their killer. Apresent or former partner or lover killed almost half of female victims. Around a third of menwere killed by someone they knew (but not family/partner) and another third by a stranger.
In 1997 around 8% of homicides involved firearms and almost one third a sharp weapon.Firearm use in homicide has fallen over the past few years, in common with firearm use inother offences.
While the police have identified only eight homicides over the past two years with a racialmotive, there are differences between ethnic groups regarding victim characteristics. Blackvictims are less likely than white victims to have been killed by a spouse or lover for instanceand ethnic minorities are over-represented as victims of homicide compared to thepopulation; but the numbers involved are small and could be affected by several factors.
Of cases which remain classified as homicide following police and court action, a convictionfor homicide will be obtained in around three quarters of cases and around half of homicideconvictions are today for murder, compared to only a third in 1970. Men are more likely thanwomen to be convicted, and to be convicted of murder.
On average, 61 people serving a mandatory life sentence for murder are released each year.Murderers released in 1997 on life licence had served on average just over 14 years, whileothers released on life licence served just over 13 years. Over the past decade 41 peopleoriginally convicted of homicide (13 of whom were convicted for murder) have beenreconvicted of the same offence, seven while still in custody.
The last section of this paper considers homicide rates in other countries, and by state inAmerica, where the death penalty is available and used frequently (74 times in 1997). It isvery difficult to draw conclusions concerning the effect of this on the homicide rate, however.
CONTENTS
I Homicide 7
A. Definition of the offence of homicide 7
B. Recording crimes of homicide 8
1. Offences recorded by the police 8
2. One victim, one crime? 8
3. Reclassification of homicide cases 9
II Homicides recorded 10
A. England and Wales 10
B. Scotland 12
C. Northern Ireland 14
D. Comparison of national rates and underlying crime trend 15
III Some detailed aspects of the homicide statistics 17
A. Victims 17
B. Homicide involving firearms 18
C. Homicide and ethnicity 19
IV Convictions and sentencing 22
A. Convictions 22
B. Sentences and tariffs set and served 24
C. Reconvictions 28
V International comparisons 29
A. Homicide by country and in major cities 29

B. USA 32
1. Use of the death penalty 32
2. Homicide rates 34
Appendix
Table 10a Homicide rates per 100,000 population by country 38

RESEARCH PAPER 99/56
7
I Homicide
This paper presents statistics on homicide rates in England & Wales, Scotland andNorthern Ireland since the 1940s. It follows the homicide statistics from initial recordingby the police through to final disposal by the courts. In section III some detail is given onthe victims of homicides, the use of firearms, and ethnicity and homicide. Convictionsand sentencing are considered in section IV, including the likelihood of conviction formurder versus manslaughter, sentences and tariffs set, terms served by those given lifesentences, and release and reconviction rates. The last section makes some internationalcomparisons, and considers the situation in the United States, where some states retain thedeath penalty and others do not.
For further information, the Home Office and Scottish Office publish detailed statistics onhomicide, which are available in the Library for consultation1. They include more depthon such issues as the relationship between victim and offender, method of killing, and theage and sex of victims. It should be remembered that murder is relatively rare, so largeyear-on-year variations are to be expected in the numbers of offences committed and it isunwise to place too much emphasis on the most recent year's figures.
A. Definition of the offence of homicide
In England and Wales, ‘homicide’ includes the offences of murder, manslaughter andinfanticide. In Scotland, ‘homicide’ includes murder and the offence of culpablehomicide, which is the equivalent of manslaughter. Offences of causing death bydangerous or careless driving while under the influence of drink or drugs, or deathsfollowing aggravated vehicle taking are generally not included in homicide statistics.
The offences of murder and manslaughter are common law offences, without origin instatute. However, the definition and sentencing of these offences have been modified bylegislation, which affects the statistics.
Manslaughter in England and Wales is the unlawful killing of someone without anymalice being expressed or implied. The Homicide Act 1957 introduced the concept ofconviction for manslaughter while accepting diminished responsibility, so-called 'section2' manslaughter. This defence has largely come to replace findings of insanity. Thisintroduces a discontinuity to the statistics, because it is impossible to tell whichconvictions for manslaughter after this date might previously have resulted in aconviction for murder or manslaughter, or a finding of insanity.
1 Latest editions; Homicides in Scotland 1987-1996 Scottish Office Statistical Bulletin CrJ/1997/7December 1997, supplemented by Homicides in Scotland in 1997, Scottish Office 26 November 1998and Chapter 4 of Criminal Statistics England and Wales 1997 Cm 4162 Home Office November 1998

RESEARCH PAPER 99/56
8
The 1957 Act also altered the sentencing of murder by abolishing the death penalty,which until then followed any conviction for murder with the exceptions of youngoffenders, pregnant women, or those to whom the Royal Prerogative of Mercy wasextended. For non-capital murder the punishment became life imprisonment.
The death penalty was retained however for capital murder2, and for those convicted ofmurder on a previous occasion, or convicted on the same indictment to two or moremurders done on different occasions.
This remained the situation until 1965, when the Murder (Abolition of Death Penalty) Actabolished capital punishment, making life imprisonment mandatory for all adultoffenders. In Northern Ireland, capital punishment for murder was abolished from 1973by the Northern Ireland (Emergency Provisions) Act 1973.
In Scotland, where the offence of common law culpable homicide replaces that ofmanslaughter, there has always been a concept of diminished responsibility. Thus theScottish statistics do not show a split in manslaughter offences after 1957.
B. Recording crimes of homicide
1. Offences recorded by the police
Recorded crime statistics relate to incidents as originally noted by the police. As theHome Office acknowledges, they do not show the true level of crime, since not all crimesare reported; the biennial British Crime Survey, which interviews individuals on aconfidential basis about their experiences of crime in the previous year, records far higherlevels3. In general, the less serious the offence, the less likely it is to be reported. Forhomicide however, such a serious offence, under-reporting or under-recording is likely tobe negligible.
So homicide is one of the few crimes for which recorded crime figures provide areasonably accurate measure of crime levels. However, because the statistics relate to thecrime as originally discovered, rather than the offence for which a person may be finallybrought to court or convicted, they are subject to revision. Nor do the initial recordedstatistics contain a great deal of detail concerning the offence (or of course the unknownoffender).
2. One victim, one crime?
‘Counting rules’ have been adopted to standardise the crime statistics recorded acrossforces. The old counting rules have been in place since 1980 and state that only the most
2 Murder done in the cause or furtherance of theft; by shooting or causing an explosion; resisting arrest orescaping from custody; of a police officer; or of a prison officer by a prisoner.
3 See for instance Home Office Statistical Bulletin 21/98, The British Crime Survey for a discussion

RESEARCH PAPER 99/56
9
serious offence should be recorded when several have been committed in one ‘incident’.Exceptions include the most serious offences of homicide, violence against the personand sexual offences where there is more than one victim, in which case one offence isrecorded for each victim.
The Home Office counting rules were revised in 1998, partly in an attempt to measureone crime per victim in more cases (and more closely equate BCS results with recordedcrime). Clearly this will increase recorded crime levels, and the net effect hasprovisionally been estimated by police forces to be an increase of around 20% in recordedcrime from next year4. However, the main impact will be on the fraud, theft, and criminaldamage categories. For homicide, the new rules should make little difference, apart froma switch to recording on a financial year basis. The latest recorded crime statistics for theyear to March 1998, released in October 1998, were the last under the old counting rules.
In Scotland, unlike England and Wales, a single offence is counted for each act ofhomicide, regardless of the number of victims or offenders. The Dunblane tragedy, then,was recorded as one act of homicide, whereas in England it would have resulted in therecording of 17 offences, and Lockerbie in 1988 similarly as one, rather than 270. TheScottish Office publishes the number of victims along with the number of cases to aidinterpretation.
3. Reclassification of homicide cases
A homicide case is generally presented in the official statistics against the year in whichthe police recorded it. This is not always of course the year in which the offence tookplace, the year in which the accused is brought to trial, or the year in which a person isfinally found guilty (or innocent) of homicide.
On initial recording, the single term ‘homicide’ is used. Up to 1972, offences wererecorded separately under the headings of murder, manslaughter and infanticide, but suchseparation was found to be unreliable on first recording.
After the police record an offence as homicide, the figures are generally adjusteddownwards. This happens as offences are written off by the police as 'no crime', or ascourt proceedings find that the victim committed suicide, that no offence took place orthat the case should be reclassified as a lesser offence. Of course there is also thepossibility of homicide figures being revised upwards, when previously undiscoveredcrimes come to light.
Three key terms used in this paper indicate the stage of the recording process to whichstatistics relate. There are cases initially recorded by the police as homicide, whileofficial statistics more normally relate to cases currently recorded as homicide. A
4 Source: http://www.homeoffice.gov.uk/rds/index.htm
RESEARCH PAPER 99/56
10
breakdown between murder, manslaughter and infanticide becomes available followingthe final disposal of court proceedings.
II Homicides recorded
A. England and Wales
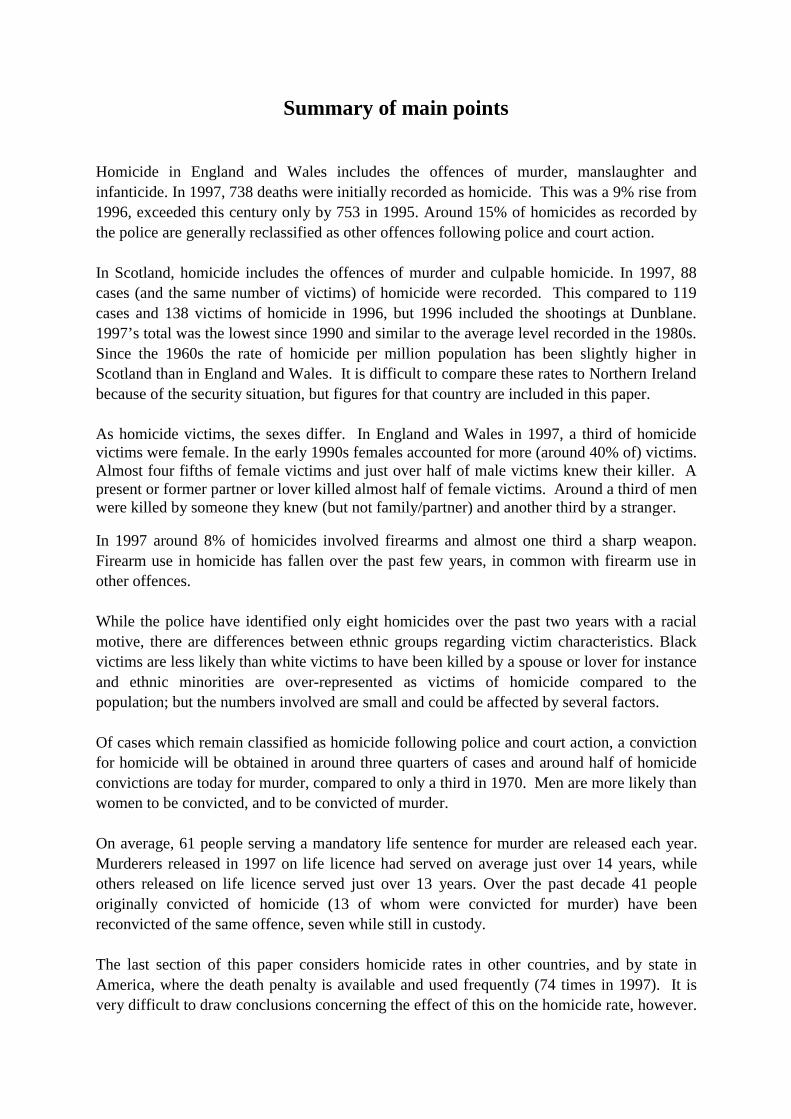
Table 1 shows offences initially recorded by the Police as homicide in England and Walessince 1946. It also shows those offences currently recorded as homicide. These figuresare summarised in the graph;
Homicide offences, England & Wales
0
100
200
300
400
500
600
700
800
1945
1947
1949
1951
1953
1955
1957
1959
1961
1963
1965
1967
1969
1971
1973
1975
1977
1979
1981
1983
1985
1987
1989
1991
1993
1995
1997
Num
ber
offences initially recorded as homicide
offences currently recorded as homicide, as at 31 July 1998
In 1997, the latest year available, 738 deaths were initially recorded as homicide. Thiswas a 9% rise from 1996, and the second highest total this century, exceeded only by 753in 1995. Not too much should be inferred from this, since these numbers are relativelysmall, so quite wide variation can occur from year to year.
As of 31 July 1998, 650 of these deaths were currently/still recorded as homicide; since aquarter of cases were still pending the figure may be further revised. Judging by recentyears, around 15% of the deaths initially recorded as homicide might be reclassified.

RESEARCH PAPER 99/56
11
�������
������ � ������������������������ ��������� � ���
��������������� ��� �
���������������������������
������ �������� � ����� ������ �������� � �����
���� ��� ��� �� ��
���� ��� ��� �� ��
���� ��� ��� �� ��
���� ��� ��� �� ��
���� ��� ��� �� ��
���� ��� ��� �� ��
���� ��� ��� �� ��
���� ��� ��� �� ��
���� ��� ��� �� ��
���� ��� ��� �� ��
���� ��� ��� �� ��
���� ��� ��� �� ��
���� ��� ��� �� ��
���� ��� ��� �� ��
���� ��� ��� �� ��
���� ��� ��� �� ������ ��� ��� �� ��
���� ��� ��� �� ��
���� ��� ��� �� ��
���� ��� ��� �� ��
���� ��� ��� �� ��
���� ��� ��� ��� ���
���� ��� ��� ��� ���
���� ��� ��� ��� ���
���� ��� ��� ��� ���
���� ��� ��� ��� ���
���� ��� ��� ��� ���
���� ��� ��� ��� ���
���� ��� ���� ��� ����
���� ��� ���� ��� ���
���� ��� ���� ��� ���
���� ��� ��� ��� ���
���� ��� ���� ��� ���
���� ��� ���� ��� ����
���� ��� ���� ��� ����
���� ��� ���� ��� ����
���� ��� ���� ��� ����
���� ��� ���� ��� ���
���� ��� ���� ��� ����
���� ��� ���� ��� ����
���� ��� ���� ��� ����
���� ��� ���� ��� ����
���� ��� ���� ��� ����
���� ��� ���� ��� ����
���� ��� ���� ��� ����
���� ��� ���� ��� ����
���� ��� ���� ��� ����
���� ��� ���� ��� ����
���� ��� ���� ��� ����
���� ��� ���� ��� ����
���� ��� ���� ��� ����
���� ��� ���� ��� ����
�� ��������������������������� !���������"���#���
�$�����%�&��������'!��������" ������������(�#���������������#��������������)�!��&��!��#���������� �#���
���"���!����"����������#������������
�������� ��� ���� ���������� ��� ���� �������� ����� ���� ����
������������������� ������������ �����������
*""��#������&���#���������!��#�� �����*""��#���#������&�����#���������!��#��
RESEARCH PAPER 99/56
12
B. Scotland
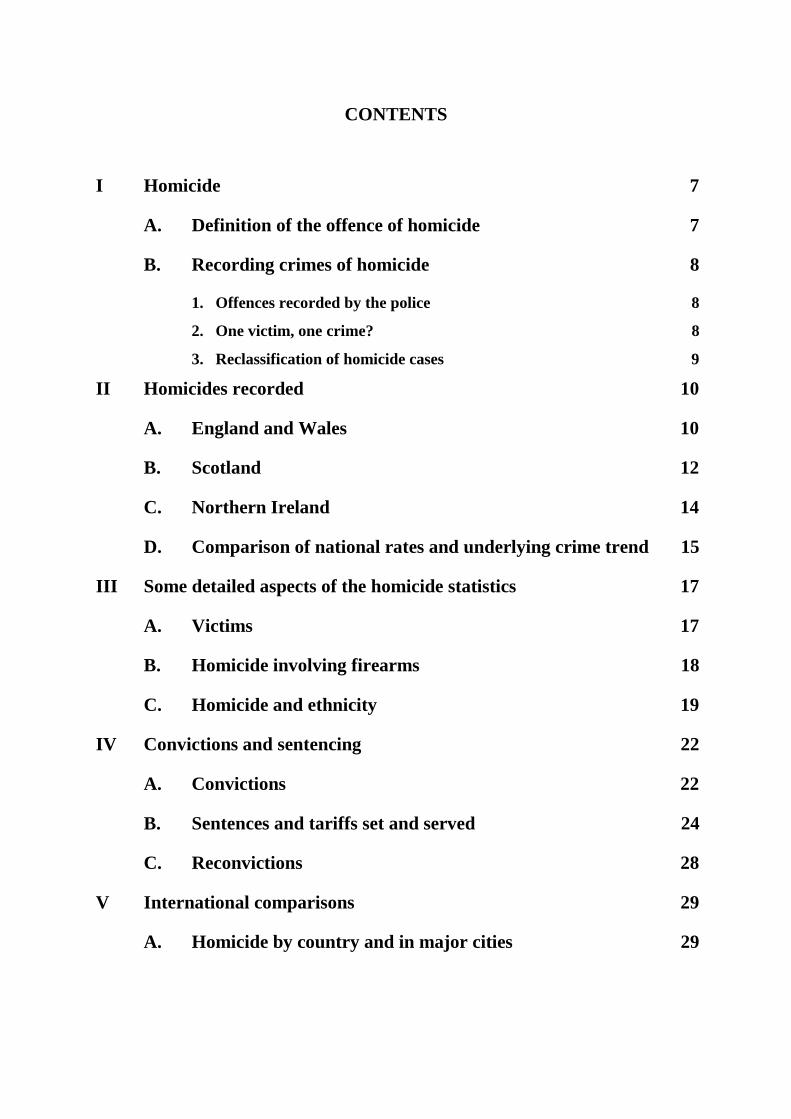
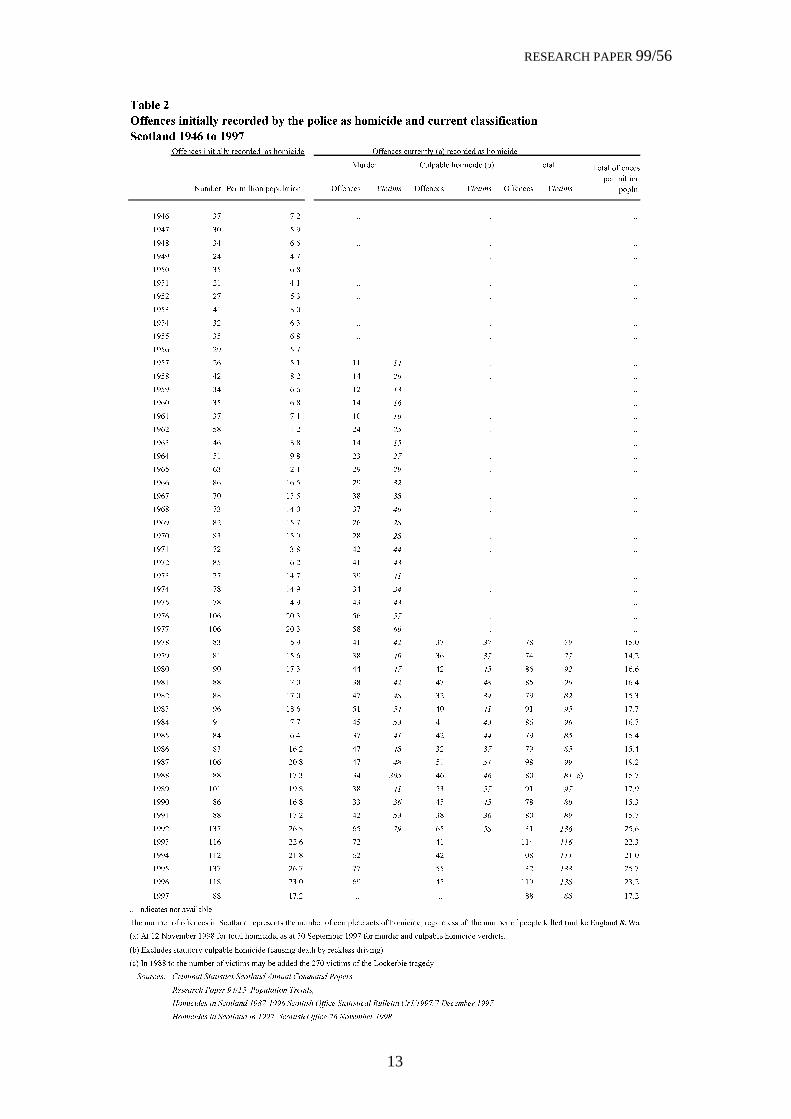
In 1997 88 cases (and the same number of victims) of homicide were recorded. Thiscompared to 119 cases and 138 victims of homicide in 1996, although 1996 included the17 victims of the Dunblane tragedy. The 1997 total was the lowest since 1990; itfollowed higher figures during the early and mid 1990s and was similar to the averagelevel recorded in the 1980s, although again, it is difficult to infer trends. Cases andvictims currently5 recorded as homicides in Scotland are shown in table 2 and in summaryin the graph.
Homicides recorded, Scotland
0
20
40
60
80
100
120
140
160
1945
1947
1949
1951
1953
1955
1957
1959
1961
1963
1965
1967
1969
1971
1973
1975
1977
1979
1981
1983
1985
1987
1989
1991
1993
1995
1997
Num
ber
currently recorded, as at November 1998
initially recorded as homicide
Since 1992 there has been an increase in the number of homicides recorded in Scotland.Most of this increase can be attributed to homicides occurring outside the City ofGlasgow but within Strathclyde. Other areas where there has been an increase in thehomicide rate include Central Region and in the City of Dundee. Generally however, thenumbers of homicides have declined in the cities and 1996 had the lowest number ofhomicides ever recorded (around a quarter of all cases) in the four cities6.
5 As of 12 November 19986 Homicides in Scotland 1987-1996 Scottish Office Statistical Bulletin CrJ/1997/7 December 1997
RESEARCH PAPER 99/56
13
�������
������ � ������������������������ ��������� � ������������������ ��� �
��������������������
������ �������� � ������ �������� ������� �������� ������� �������� �������
���� �� ��� �� �� �� �� �� ��
���� �� ��� �� �� �� �� �� ��
���� �� ��� �� �� �� �� �� ��
���� �� ��� �� �� �� �� �� ��
���� �� ��� �� �� �� �� �� ��
���� �� ��� �� �� �� �� �� ��
���� �� ��� �� �� �� �� �� ��
���� �� ��� �� �� �� �� �� ��
���� �� ��� �� �� �� �� �� ��
���� �� ��� �� �� �� �� �� ��
���� �� ��� �� �� �� �� �� ��
���� �� ��� �� � �� �� �� ��
���� �� ��� �� � �� �� �� ��
���� �� ��� �� �� �� �� �� ��
���� �� ��� �� � �� �� �� ��
���� �� ��� �� �� �� �� �� ��
���� �� ���� �� � �� �� �� ��
���� �� ��� �� �� �� �� �� ��
���� �� ��� �� � �� �� �� ��
���� �� ���� �� � �� �� �� ��
���� �� ���� �� � �� �� �� ��
���� �� ���� �� �� �� �� �� ��
���� �� ���� �� � �� �� �� ��
���� �� ���� �� � �� �� �� ��
���� �� ���� �� � �� �� �� ��
���� �� ���� �� �� �� �� ��
���� �� ���� �� � �� �� �� ��
���� �� ���� �� � �� �� �� ��
���� �� ���� �� � �� �� �� ��
���� �� ���� �� � �� �� �� ��
���� ��� ���� �� �� �� �� �� ��
���� ��� ���� �� � �� �� �� ��
���� �� ���� �� �� �� �� �� ����
���� �� ���� �� � �� �� �� �� ����
���� �� ���� �� � �� � �� � ����
���� �� ���� �� �� � �� �� ����
���� �� ���� �� � �� � �� � ����
���� �� ���� �� � �� � �� �� ����
���� �� ���� �� �� �� � �� � ����
���� �� ���� �� � �� �� �� ����
���� �� ���� �� � �� �� �� �� ����
���� ��� ���� �� � �� �� �� �� ����
���� �� ���� �� ��� �� �� �� �� ����
���� ��� ���� �� � �� �� �� �� ����
���� �� ���� �� � �� � �� �� ����
���� �� ���� �� �� �� � �� �� ����
���� ��� ���� �� �� �� �� ��� �� ����
���� ��� ���� �� �� �� �� ��� �� ����
���� ��� ���� �� �� �� �� ��� ��� ����
���� ��� ���� �� �� �� �� ��� ��� ����
���� ��� ���� �� �� �� �� ��� ��� ����
���� �� ���� �� �� �� �� �� �� ����
����� �����������!����
"#�����������������������$����� ��� ���������#��������������� ������������#��� �%���&�� ���������#������������ �� ��'� �(��'��)�&�� �*�+�
(���,�������!��������������������#��� �%����������$� ������������������� ����� ��� ����#��� ��!�� ����
(���)-�� �����������.��� ����#��� ��(�����&� ���#��.����'���� �!�&��
(���/�����������#������������!�������.����� � ��#������!���������#��0��'��������&� .
��������� ���������������������������������������������� ���
!������"��� ����#��$��� ��������%�����$�
&�������������������������'��� ��������"�())����������������*����������+#����#��,����-�������
&����������������������������$��������"�())���� �.�/��-�������
"�������������
�������
� ��
������������.������ � �����#��� � ����������������.�(�������� � ����#��� �
������1�� ��� �������2� ����#��� ��(�� �����������"���

RESEARCH PAPER 99/56
14
C. Northern Ireland
Homicides and deaths arising through the security situation are shown in table 3. Notethat not all deaths arising from the security situation are necessarily classified as murder,and that civilian victims of the security situation include members of paramilitaryorganisations;
�������
������ �� ���������� ������� ������������������� �����
������
����������
��� ����������� ���� ��� ����� ��������� ������� ��� ���������� � ������� !�! ����
"#$# % & % �� ' ' ' '
"#(& " & " �� ' ' ' '
"#(" & & & &)& ' ' ' '
"#(% * & * %)% ' ' ' '
"#(* " $ ( *)+ ' ' ' '
"#($ * $ , ()& ' ' ' '
"#(( " % * %)" ' ' ' '
"#(+ % " * %)" ' ' ' '
"#(, * " $ %)# ' ' ' '
"#(- * $ , ()& ' ' ' '
"#(# & & & &)& ' ' ' '
"#+& # * "% -)$ ' ' ' '
"#+" ( " + $)% ' ' ' '
"#+% % * ( *)( ' ' ' '
"#+* & " " &), ' ' ' '
"#+$ " & " &), ' ' ' '
"#+( " * $ %), ' ' ' '
"#++ * * + $)& ' ' ' '
"#+, ( * - ()* ' ' ' '
"#+- ( & ( *)* ' ' ' '
"#+# ( , "% ,)# "% & " "*
"#,& "$ �� "$ #)" %* & % %(
"#," "%* �� "%* ,#)# ""( $- "" ",$
"#,% *,+ �� *,+ %$()- *%" "%# ", $+,
"#,* %&& �� %&& "*")& "," ++ "* %(&
"#,$ %&( �� %&( "*$)( "++ *( "( %"+
"#,( %*- �� %*- "(+)% %"+ %& "" %$,
"#,+ %-& �� %-& "-*)- %$( %# %* %#,
"#,, ""+ , "%* -&)- +# %# "$ ""%
"#,- -% * -( (()+ (& %" "& -"
"#,# "%- - "*+ --), (" $- "$ ""*
"#-& -( - #* +&)( (& ", # ,+
"#-" #( , "&% ++)* (, %* %" "&"
"#-% ## ( "&$ +,)$ (, %- "% #,
"#-* -+ ( #" (-), $$ "( "- ,,
"#-$ +* % +( $"), *+ "# # +$
"#-( (# % +" *-)# %( + %* ($
"#-+ -( % -, (()% *, "% "% +"
"#-, "&& # "&# +#)" ++ "" "+ #*
"#-- """ ( ""+ ,*)* ($ ** + #*
"#-# +, - ,( $,)% *# "$ # +%
"##& ," "" -% (")% $# "( "% ,+
"##" ""$ , "%" ,$)- ,( "* + #$
"##% "&- * """ +-)& ,+ + * -(
"##* "&" ( "&+ +$)+ ,& - + -$
"##$ -% $ -+ (%)% (+ * * +%
"##( %% % %$ "$)$ - & " #
"##+ *( $ *# %*)* "$ " & "(
"##, $& % $% %()" ", " $ %%
"##- �� �� �� �� (* " " ((
"### �� ���� �� �� �� �� * & & *
��� ������ ���.��� �� ����������� ������������) ������ ������ ���� ��� �������� ��������� ��� ��� ���������� � �������� �� ��������)
����������������� �������������������������������������������������������������������� ������ ������������� ���������!!�"
������ ������ ���� ��� �������� ���������/������� �������� ��������

RESEARCH PAPER 99/56
15
D. Comparison of national rates and underlying crime trend
Because of the security situation, it may not be appropriate to compare the homicide rate(per million population) in Northern Ireland to the rest of the UK, but the chart does showthat until the end of the 1960s Northern Ireland experienced relatively few homicides.
After that time of course, the rate rose drastically, but recently has returned to levelscloser to those in the rest of the UK;
National homicide rates, including Northern Ireland
0
50
100
150
200
250
300
1945
1947
1949
1951
1953
1955
1957
1959
1961
1963
1965
1967
1969
1971
1973
1975
1977
1979
1981
1983
1985
1987
1989
1991
1993
1995
1997
Per
mill
ion
popu
latio
n
England & Wales Scotland Northern Ireland
Excluding the figures for Northern Ireland, during the 1940s and 1950s the rate ofhomicide was similar throughout the rest of Great Britain. In the 1960s however the ratesdiverged and today England and Wales still experience a lower rate of homicide thanScotland, as the chart on the next page shows.

RESEARCH PAPER 99/56
16
National homicide rates
0
10
20
30
40
50
60
1945
1947
1949
1951
1953
1955
1957
1959
1961
1963
1965
1967
1969
1971
1973
1975
1977
1979
1981
1983
1985
1987
1989
1991
1993
1995
1997
Per
mill
ion
popu
latio
n
England & Wales
Scotland
Offences of violence against the person per 100 population, England and Wales
This is not simply because of the Scottish practice of recording offences rather thanvictims; if this were done the discrepancy between the two would be even higher. Tocompare this to the underlying crime rate, the chart also shows (dotted line) the rate ofoffences of violence against the person (per 100 population) in England and Wales.
The rate of increase in serious crimes of violence against the person has been far greaterthan for homicide. Over the past twenty years, the average annual increase in thehomicide rate has been 2.1% a year, whereas for all serious offences of violence againstthe person the average increase has been 7.2% a year.
RESEARCH PAPER 99/56
17
III Some detailed aspects of the homicide statistics
A. Victims
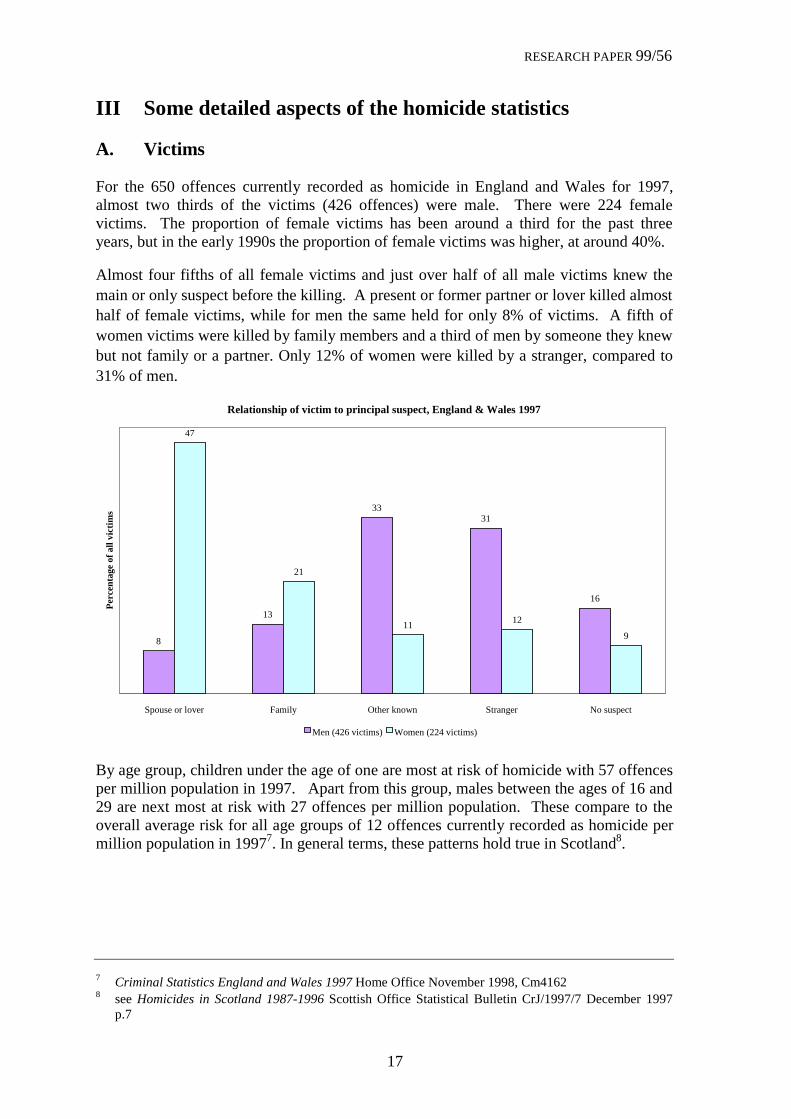
For the 650 offences currently recorded as homicide in England and Wales for 1997,almost two thirds of the victims (426 offences) were male. There were 224 femalevictims. The proportion of female victims has been around a third for the past threeyears, but in the early 1990s the proportion of female victims was higher, at around 40%.
Almost four fifths of all female victims and just over half of all male victims knew themain or only suspect before the killing. A present or former partner or lover killed almosthalf of female victims, while for men the same held for only 8% of victims. A fifth ofwomen victims were killed by family members and a third of men by someone they knewbut not family or a partner. Only 12% of women were killed by a stranger, compared to31% of men.
Relationship of victim to principal suspect, England & Wales 1997
8
13
3331
16
47
21
1112
9
Spouse or lover Family Other known Stranger No suspect
Per
cent
age
of a
ll vi
ctim
s
Men (426 victims) Women (224 victims)
By age group, children under the age of one are most at risk of homicide with 57 offencesper million population in 1997. Apart from this group, males between the ages of 16 and29 are next most at risk with 27 offences per million population. These compare to theoverall average risk for all age groups of 12 offences currently recorded as homicide permillion population in 19977. In general terms, these patterns hold true in Scotland8.
7 Criminal Statistics England and Wales 1997 Home Office November 1998, Cm41628 see Homicides in Scotland 1987-1996 Scottish Office Statistical Bulletin CrJ/1997/7 December 1997
p.7
RESEARCH PAPER 99/56
18
Between 1993 and 1997/98, five police officers were killed on duty in England andWales9. Not all cases will necessarily be determined as murder or manslaughter.
B. Homicide involving firearms
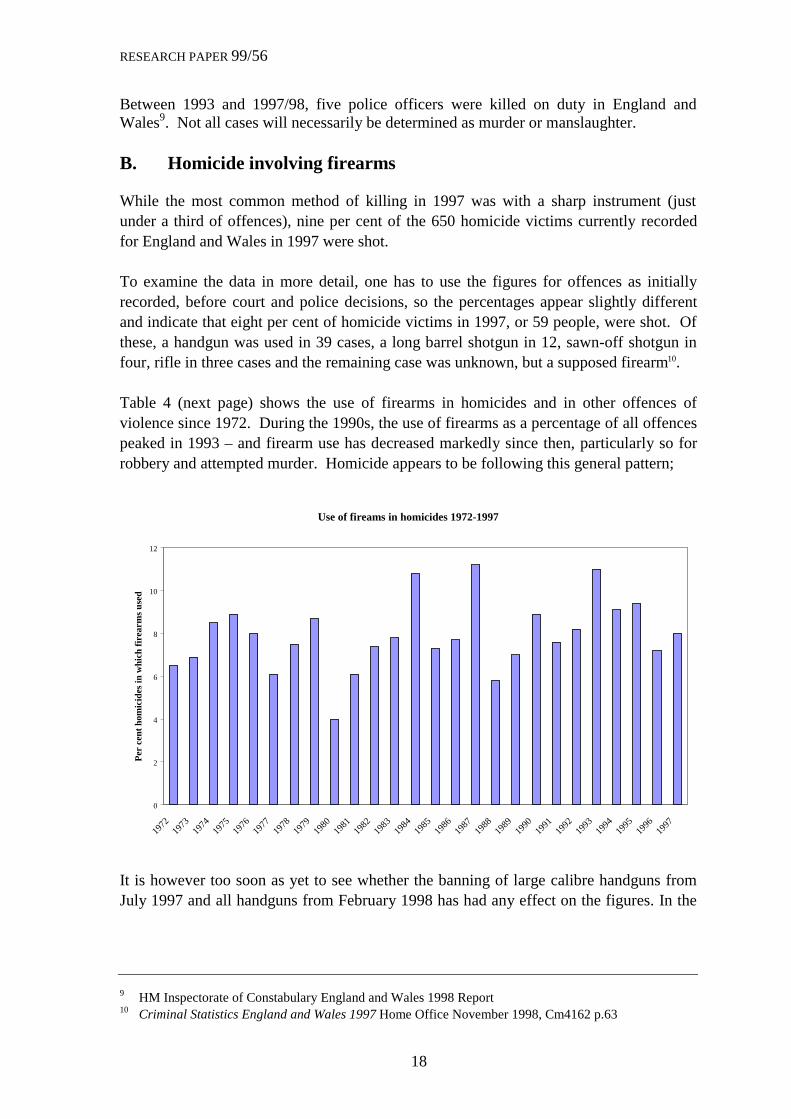
While the most common method of killing in 1997 was with a sharp instrument (justunder a third of offences), nine per cent of the 650 homicide victims currently recordedfor England and Wales in 1997 were shot.
To examine the data in more detail, one has to use the figures for offences as initiallyrecorded, before court and police decisions, so the percentages appear slightly differentand indicate that eight per cent of homicide victims in 1997, or 59 people, were shot. Ofthese, a handgun was used in 39 cases, a long barrel shotgun in 12, sawn-off shotgun infour, rifle in three cases and the remaining case was unknown, but a supposed firearm10.
Table 4 (next page) shows the use of firearms in homicides and in other offences ofviolence since 1972. During the 1990s, the use of firearms as a percentage of all offencespeaked in 1993 – and firearm use has decreased markedly since then, particularly so forrobbery and attempted murder. Homicide appears to be following this general pattern;
Use of fireams in homicides 1972-1997
0
2
4
6
8
10
12
1972
1973
1974
1975
1976
1977
1978
1979
1980
1981
1982
1983
1984
1985
1986
1987
1988
1989
1990
1991
1992
1993
1994
1995
1996
1997
Per
cen
t hom
icid
es in
whi
ch fi
rear
ms
used
It is however too soon as yet to see whether the banning of large calibre handguns fromJuly 1997 and all handguns from February 1998 has had any effect on the figures. In the
9 HM Inspectorate of Constabulary England and Wales 1998 Report10 Criminal Statistics England and Wales 1997 Home Office November 1998, Cm4162 p.63

RESEARCH PAPER 99/56
19
period nine months before July 199711 543 notifiable offences were recorded by the policein which shotguns were reported to have been used and in the period afterwards12 420were recorded. The figures for handguns were 2,200 and 1,951 respectively13.
�������
�������������� ���������������������������� ���������������� �
������������� ����������
�������������� ������������� ������ ��������������������������� ���� �� ����������
������������������������������������� � ��������������
������������
� � ������ ������� � ����� ��������
�� ! !�" " �� ����� �#$ ����� ��" $ ����� %&� ���� �#! ���� ��! % &% !%$ �#$
�� & !�$'' �� ����� !'" ���� ��&%' ����� $# ����� !'� ��� ��'$! $�% !$ �'!
�� $ !�#!# �� ����� !�$ ����� ��$& ���� '%" ���� $�" ���� ��#%� $& &$# �#$
�� % &�#%" �� ����� !�' ���� ��#&' ����� �%# ���� '"& ���� !�$#� % ' $ ' &"�
�� ' $�'&! �� ����� !! ���� !�! & ����� ��" ' ����� #�& � �� &�� � '#$ $�& !#$
�� %�&"! �� ���� !&" ����� !�!'$ ���� ��!&$ ���� ��$"# � � � &�' � %� %'' &"'
�� # %�' ! �� ���� !&� ����� !�$#" ��� � ��' ����� �� % � ��� $�!&% '" $�$ !'&
�� � '�%$ �� ���� !%% ��� !��"� ����� ��"&# ����� !��%# � ��� %�"'' '#! $'! &&
��#" '�%# �� ����� ! $ ���� !�$ � ����� ���$� ����� !�%'� � ��� %�"&! %%! '!" &#&
��#� #�"' �� ���� ! ��� !�'�� ����� ��#�& ����� &�"$' � ��� %�'!� #$' ����$ $ #
��#! #�$"" �� ���� &"# ��� !�$"$ ����� !�%'" � ��� !��% � ��� %�&& ��"'# ��%&# $%
��#& ��'� �� ���� !'� ����� !�$!� ����� ���% ����� &��$# � ��� %�$ $ �"$ ���! $%'
��#$ #�& ' � ����� &!! �� � !�&&" ����� !�"�# ����� &�$� � � � %�%$" ��$ ��!&! '�"
��#% �� $! �� ���� &%& ��� !�'%! ����� !�%&� ����� &�� � � � '�&#" ���"% ��&�" #'
��#' ��&'& �� ��� &'& ���� !�"�% � ��� !�'!� ����� $��$" � �� %�##' ���'" ��&�$ ��""&
��# ��""! �� � %"# �� � ���$$ � �� !�#&� ����� &�$%& ���� %�� ! ��!&$ ��%$& ��"%&
��## #�%!$ �� ����� %&� ���� ��#�' � ��� !�'## ����� &�!&% ���� $�#�& ��!"' ��$#$ ��"!�
��#� ��%"! �� ���� %#� ���� ����$ � ��� &�&�" � ��� &�&!� ���� %�"& ��&�& ���#& ���'�
���" �"�& & �� ����� ''& ����� ��#%% � � � &��&� � ��� &�%$$ ���� %�&#" ����& !�%& ��!'&
���� �!��!� �� ���� #'� ���� �� �% � �� %�!�' � ��� &� ���� %�$'$ ��%'� &�$&" ��'''
���! �&�&$� �� ��� � #'# �� � ��#�& � �� %�#%� � � � $�&�# ���� '�"�# ��$�$ $�"!& �� !'
���& �$�"' � ���� ��"%# ��� � �� $& ���� '�"�! � ��� $�'#% ���� '�&& ��%�! $�! & ��#'%
���$ �&��' �� ���� ��" % ���� �� #� ���� $�!&� ��� � %�$%" ���� ��'% ����" &�"# �� !%
���% �&�$&$ � ����� �#$ ����� �� � ���� $�!"' ����� %�#% ���� �%'# �#& &�&�� ��%'$
���' �&�# ' �� �� � #�" ����� !�"! ���� $�"�& ���� '��!& ���� �#�& �&& &�&$ �� #&
��� �!�$�" �� ����� '!# ����� !��$# ���� &�"!� ����� %��"' ���� �%"' %#" !�'$# ��' '
� ��()����������������������� ��� � ������� ����*!"� ��������+
����,��������� �������������������������������� ��������� ����� ������������ ���+
���������������������������������� ��� �!�����"������������ �#�$���
�� ����� ���������������-�����.�����������������������
�����/����� ��
� � ��
���������������
�������0�������
������ ��������
����
C. Homicide and ethnicity
In the two year period 1996/97 and 1997/98, the police identified eight homicides wherethere was a racial motivation. Four victims were white, one black, two Asian and one‘other’. Suspects were identified in all cases but one, where the victim was white14. Of
11 1 October 1996 to 30 June 199712 1 July 1997 to 31 March 199813 HC Deb 20 October 1998 c119w14 Statistics on Race and the Criminal Justice System, Home Office December 1998
RESEARCH PAPER 99/56
20
course, racial crime may go un-unreported, or be subsequently under-recorded. TheStephen Lawrence enquiry15 identified problems with the current definition of a ‘racialincident’ and highlighted possible discrepancies between the police and the publicperception of what constitutes racially-motivated crime in general.
From April 1996 the Home Office has included data on the ethnicity of victims andsuspects in its Homicide Index. Of the 1,227 homicides currently recorded for the years1996/97 and 1997/98, suspects were identified in 1,066 cases. An ethnic breakdown ofvictims and suspects is shown in table 5 below;
�������
����������������� ������������ ������������������������ ����
��������� ����!�����"����������"�#����� ��
���
���� ���� � �� ����� ���������
����������
�������
�������
����������
����������
� ������� �����
������� �����
�����������
���
���� � ! "# # $ ## �%! %! %% ���
��� �� �� �� �� ����
���� #& �� # # !" � #'& ��
��� �� �� �� �� ����
� �� #% ' �� � ' !$ #' $$ �
��� �� � � �� ����
����� $ ' # #! ' � % "" ��
��� �� �� � �� ����
��������� " ' ' ## #! � ' ��
��� ��� �� �� �� ����
����� �$' $$ !$ � � #('!! #!# #( $ ����
��� � � �� �� ����
)�������*�����+�+�� ����+��� ����"#�,��*�#%%�
��� ������������� � �������+� � ��� � ����������������������� � ������ �������-����+���
�� ������������������������������������������ ������������ �!����"##����$����%�������
.������ � ���
The table shows several things. First, looking at the right-hand column, 9% of all victimsof homicide are black and 6% Asian, percentages disproportionately higher than theirrepresentation in the England and Wales population (2% black, 3% Asian and 1%‘other’). Of course, this may arise through a number of factors because ethnicpopulations tend to be concentrated in urban areas.
Second, looking at the percentages of principal suspects by different ethnic groups, whileonly 8% of white victims were killed by someone from a different ethnic group, the sameproportion for other groups is more like a third. The Home Office say that this might be
15 By Sir William Macpherson of Cluny, February 1999 Cm 4262

RESEARCH PAPER 99/56
21
expected however, because ethnic minorities account for only 6% of the entirepopulation, spread unevenly across the country. This means that most white people livein areas where there are few ethnic minorities, whereas ethnic minorities live in areaswhere whites form the majority population. Thus ethnic minorities are more likely tocome into contact with whites than the reverse16.
Third, for black victims, no suspect has been identified in 42 out of 105 cases of homicide(no suspect in 40% of cases), compared to 96 cases out of 992 for white victims (nosuspect in 10% of cases). It may be dangerous to attach too much meaning to this sincethe numbers are small, but patterns across ethnic groups do seem to differ regarding therelationship of the principal suspect to the victim. The chart shows the relationship ofprincipal suspects to victims, by the ethnic group of the victim17.;
Relationship of victims to principal suspect
0%
5%
10%
15%
20%
25%
30%
35%
40%
45%
Family Spouse/lover Other known Stranger No suspect
Per
cen
t of a
ll vi
ctim
s
White (992 victims) Black (105 victims) Asian (77 victims) Other (33 victims)
16 ibid17 Cases recorded as homicide as of 31 July 1998. Note that this chart excludes 20 cases where ethnicity
was not known, and that although percentages are shown, the actual number of victims are small insome cases (total victims for each group shown in legend).
RESEARCH PAPER 99/56
22
IV Convictions and sentencing
A. Convictions
Table 6 shows the outcome of homicide proceedings (the number of people found guiltyor with a charge proven for murder or homicide) in Great Britain each year since 1946.
For the latest years, many cases are still to be decided. For example, of the 738 offencesinitially recorded as homicide in England and Wales in 1997, as at July 1998 190 courtdecisions were still pending. The full breakdown for the remainder was as follows;
• 88 offences reclassified as other than homicide• 309 cases decided at court to be homicide• In 64 cases proceedings not concluded for various reasons; the death or suicide of the
suspect (38 cases), a finding of insanity (2 cases), or the proceedings being dropped(24 cases)
• No suspects charged in 71 cases• Suspects acquitted in 16 cases
As a general rule, of the cases initially recorded as homicide, 14% will be reclassified asother than homicide, and of the remainder, the final disposals will be as follows;
• Three quarters - conviction for homicide obtained• One tenth - court proceedings dropped or not started (because of the suicide of the
suspect in around two thirds of such cases)• One eighth - no suspect
The proportion of homicide convictions that are for murder has been growing, at theexpense of convictions for section 2 manslaughter. Today, almost half of homicideconvictions are for murder and a tenth for section 2 manslaughter. By comparison, in1970 for instance, convictions for murder accounted for only a third of homicideconvictions and s.2 manslaughter one fifth. ‘Other’ manslaughter convictions havecontinued throughout to make up around 40% of all homicide convictions.

RESEARCH PAPER 99/56
23
�������
�������������� �����������������������������
���� �� �� �� �� �� �� � �� �� ��
���� �� �� �� �� �� �� � �� �� ��
��� � �� �� �� �� �� � �� �� ��
���� �� �� �� �� �� �� � �� �� ��
��� � �� �� �� �� �� � �� �� ��
���� �� �� �� �� �� �� � �� �� ��
���� �� �� �� �� �� �� � �� �� ��
���� �� �� �� �� �� �� � �� �� ��
���� �� �� �� �� �� �� � �� �� ��
���� � �� �� �� �� �� � �� �� ��
���� �� �� �� �� �� �� � �� �� ��
���� �� � �� �� �� �� �� �� � ��
��� �� � �� �� �� �� �� � � ��
���� �� � �� �� �� �� �� � � ��
��� �� � �� �� �� �� �� � � ��
���� �� � �� �� �� �� �� � � ��
���� �� � �� �� �� �� �� � � ��
���� �� � �� �� �� �� �� � � ��
���� �� � � �� �� �� �� � � ��
���� �� �� �� �� � �� � � �� ��
���� �� �� �� �� �� �� �� �� �� ��
���� �� �� �� �� ��� � �� �� �� ��
��� �� �� �� � �� �� �� �� �� ��
���� � �� �� � ��� �� �� �� �� ��
��� �� �� �� �� �� �� �� �� �� ��
���� �� �� �� �� ��� � � �� �� �
���� � �� �� � �� �� �� �� �� ��
���� � �� �� �� ��� � �� �� �� �
���� ��� �� �� �� � �� �� �� �� �
���� �� �� �� �� �� � �� �� �� �
���� � �� �� �� � � �� �� �� ��
���� ��� �� �� �� ��� � � �� �� �
��� ��� �� �� � �� �� �� �� �
���� ��� �� �� �� �� � �� �� �� �
�� �� �� �� �� � �� �� �� ��
��� ��� �� �� � �� � �� �� �� ��
��� ��� �� �� �� ��� � �� �� �� ��
��� ��� �� �� ��� � �� �� �� ��
��� ��� �� �� �� �� � �� �� �� ��
��� ��� �� �� �� �� �� �� �� �
��� � �� �� � ��� � �� �� �� ��
��� ��� �� �� � �� � �� �� �� ��
�� �� �� �� �� ��� � �� �� �
��� �� �� �� � ��� � �� �� �� ��
��� �� �� �� � �� � �� �� �� ��
���� ��� �� �� �� ��� � �� �� �� ��
���� ��� �� �� � �� � �� �� �� �
���� ��� �� �� �� �� � �� �� �� �
���� ��� �� �� �� ��� � �� �� �� ��
���� ��� �� �� �� ��� � �� �� �� ��
���� ��� �� �� �� ��� � �� �� �� ��
���� ��� �� �� � ��� � �� �� �� ��
�� ��������� ��� ���������
�� �� � ��������� ���� ��������� ! �� "#�$ ��� �%&'
�� (��� �� �)��*� ������! ����#���* �)��� ������ ��� #�+�� �� ����� ��� �)��� ������ �� �)� ���� �+ �)� �++�����
�� ���)�#*) ��#���* ����) �$ ���,����-�������� ������* .�� ����#��� �� �)� ������ ��. �#������ )������� ������ +��� ���� �)��� ��� �/��#��� )����
�������� ������ �� �������� ��������� �������� ������ ����������� �������� ���������� ���� �� ����
������� ���������� !�"���� ��� #����$ %������ &����' ( �� )* +�%� �� ���) ��,*-
� �� * ���� �� ���� ���).' � �� �* ���& ���� ��*�.
0���
�������
�#����
1#������
)������� ��
%�*���� ��� '���� ��������
2�)��
������#*)���
������� �
������#*)���
0���
�������
�#����
1������
�#����3#���� 4�+��������
3#����
��
1������
�#����

RESEARCH PAPER 99/56
24
For England and Wales, looking more closely at the outcome of proceedings by the sex ofthe suspect, in 1996 and 1995 (as noted, proceedings for 1997 are incomplete) 1,258 malesuspects and 153 female suspects were indicted for homicide. 935 male suspects (threequarters of those indicted) and 101 female suspects (two thirds of those indicted) wereconvicted of homicide18.
�������
������������� � ���������� ���������������������������������� ������� �
������� � ���������� �
������������������� ����� ���
������ ������
����� ������������� ��� � �
����� ��������!�������"#��� �� �!�
����� �������$��#��$�������"#��� ��� � �
����� �������������� ��� % &�
������ ���� ��������#��� ��� �&� ''�
��� ���� ���������� ��� ���� �������� ����� ���� ������� ������� ��
Men appear to be more likely than women to be convicted, and to be convicted of murder.An analysis of the figures for domestic homicides19 only for the past six years shows notonly that this pattern holds true but that when convicted for manslaughter, male suspectsare more likely to be given an immediate and longer sentence20. (Immediate custody andlife imprisonment is mandatory in all cases for a conviction for murder.) The next sectiondiscusses sentencing in more detail.
B. Sentences and tariffs set and served
Murder carries a mandatory life sentence, so for all the persons found guilty of murdershown in table 6, a life sentence has been passed (ie 161 persons found guilty of murderand sentenced to life imprisonment so far in 1997).
In fact of the 3,721 life sentence prisoners held in England and Wales in 1997, by far themajority - 2,984 people - were serving life sentences for murder. The life sentencepopulation in 1997 was split as follows21;
18 Criminal Statistics England and Wales 1997 Cm 4162 table 4.819 Killing of a present or former spouse, co-habitant or lover20 Criminal Statistics England and Wales 1997 Cm 4162 table 4A21 Prison Statistics England and Wales 1997 Cm 4017 table 5.2

RESEARCH PAPER 99/56
25
Life sentence prisoners 1997
2,984
222
36
75
86
141
3992
46Rape
Murder
Manslaughter
Other/attempted homicide
Other violence against the person
Other sexual offences
Other
ArsonRobbery
However, tariffs are set for convicted murderers along with other life sentence prisoners,as a period deemed necessary in custody for retribution and deterrence, and prisonerscannot expect to be released before the expiry of their tariff. For the 315 convictedmurderers for whom a tariff was set in the last twelve months for which figures areavailable, the tariff lengths set were as follows22;
Tariffs set for murderers November 1997- October 1998
2
11
9
36
16
54
29
42
41
21
8
14
2
22
8
7
8
9
10
11
12
13
14
15
16
17
18
19
20
over 20
Tariff set (years)
Number of murderers (total = 315)
22 HC Deb 12 November 1998 c258w
RESEARCH PAPER 99/56
26
The only figures available for tariffs served relate to all (mandatory and discretionary) lifesentence prisoners. Of 265 life sentence prisoners released between April 1996 andOctober 1998, three were released on expiry of their tariff, 90 within a year of tariffexpiry, and 172 more than a year after their tariffs expired23.
Manslaughter, along with the other ‘grave’ offences including serious wounding, rape,buggery, aggravated burglary and arson endangering life carries a maximum sentence oflife imprisonment.
Under the Crime (Sentences) Act 1997 life imprisonment will be the mandatory penaltywhere a person has a previous conviction for one of a number of serious sexual or violentoffences. When the changes feed through, this will increase the number of prisonersserving life for offences other than murder, changing the pie chart on the previous page ofthe life sentence population, so murderers will occupy a relatively smaller slice.
Of course some of those convicted for manslaughter do not receive a custodial sentence atall. Of the 40 people found guilty of s.2 manslaughter so far in 1997, the sentences wereas follows24
• one person was given a life sentence• ten others were given immediate custody with sentences of up to 10 years• 25 were given hospital/restriction or hospital orders• one person received a fully suspended sentence• three people were given probation/supervision
For other manslaughter convictions, the sentences were as follows
• five people were sentenced to life• four people were sentenced to over 10 years• 116 people were sentence to up to ten years• two people were given fully suspended sentences• one hospital/restriction order was made• ten people were given probation/supervision
23 HC Deb 12 November 1998 c258w24 Criminal Statistics England and Wales 1997 table 4.9

RESEARCH PAPER 99/56
27
The average sentences for persons sentenced to custody for homicide over the past fiveyears have been as follows;
�������
� ���������������������
������������������������
���� ���� ���� ���� ����
������
$���� ���������� ���� ���� ����� ����� ����
������ !��� ���� ���� ���� ���� ����
+�#������������ !��� ���� ���� ���� ���� ����
�,����������#�������������#����-#��� �"����#���������� ������� �������������(������#�����&
�������� ���!�"������!���"##$��""%&
$�#���#���� �� ��������#������"�
The average time served by life sentence prisoners increased by around 30% fromprisoners released in 1987 to those released in 1997, but the number of prisoners involvedare small in some cases and of course the circumstances of cases may very considerably;
�������
� ������� ������ ������������������������� ��� ���������������������������� �
������
'����������
.&����, ������
'����������
.&����, ������
'����������
.&����,
���� �� ���� � ���� �� ����
���� �� ���� �� ���� �� ����
���� �� ���� � ���� �� ����
���� �� ���� �� ���� �� ����
���� �� ���� �� ���� �� ����
���� �� ���� �� ���� �� ����
���� �� ���� �� ���� ��� ����
���� �� ���� �� ���� ��� ����
���� �� ���� �� ���� �� ����
���� �� ���� �� ���� �� ����
���� �� ���� �� ���� �� ����
����������������� ������"##'���()"'�� !���%*%
��������� *�!��� '���
The number of murderers released in 1997, 88, was the highest on record, but only 10discretionary lifers were released that year. From 1972 to 1997, each year an average of61 people serving a mandatory life sentence have been released on life licence25.
25 ibid, and Home Office Statistical Bulletin 2/97 (1997) Life Licensees – Reconvictions and recalls by theend of 1995

RESEARCH PAPER 99/56
28
C. Reconvictions
For all prisoners, originally sentenced for any standard list offence, the two-yearreconviction rate is around 55%, and this rate is relatively constant from year to year.The rate also varies little with the type of sentence handed out (whether a communitypenalty or custody - reconviction rates for fines and conditional discharges are lower, butthis can be put down to offence and offender characteristics). The rate of reconvictionvaries more with age (young offenders are almost twice as likely to be reconvicted) andthe type of original offence26.
For life sentence prisoners originally convicted of homicide and released on licence, thereconviction rate is far lower, and rather more variable, perhaps because of the smallernumbers involved. Over the 1970s and 80s, the two year reconviction rate for homicidelife licensees has been around 9% for reconvictions for standard list offences, with around1% of these being reconvicted for a grave offence27. Most life licensees are older whenreleased and age has little effect on reconviction rate. (For discretionary life licenceesconvicted of other offences of violence against the person such as arson or rape, two yearreconviction rates are very slightly higher.) Regarding reconvictions for homicide only,over the past decade 41 people originally convicted of homicide (13 of whom wereconvicted for murder) have been reconvicted of the same offence. Table 9 gives details.Seven people were still serving a custodial sentence for homicide when reconvicted.
������(
!���������� ���������� � ���"���������� ������������ ���������� � ��
�����������������##��������
)��� ��������� � *� �����! +�#��
��������� ���� ���� ����� ����� ������"#��� ������"#���
����� �� �� ! ��
*� �����!�������"#��� � � �
+�#���������"#��� '�
! � &
����� &� ���
��
! �
$���"����%�&��������/ ������������(�#�����������
�,�0����������������� �#��)���"�����1��"����� ��1�����!��� �������!��#��
�,�0���������������� �#���"�!��#���)!��#����������#���!�������� ������&�#���#�����"�������
#,�0���������������� �#���"�!��#���)!��#����������#���!�������� ������&��#���#�����"����������� !���
�,�0����������)����� �#����"�!��#���)!��#����������#���!�������� ������&�#���#�����"������� !���
)��� ��������� ������������� ���� ����
26 for more information see Home Office Research Findings No.90 (1999) Reconviction of offenderssentenced or released from prison in 1994
27 Home Office Statistical Bulletin 2/97 Life Licensees – Reconvictions and recalls by the end of 1995
RESEARCH PAPER 99/56
29
V International comparisons
A. Homicide by country and in major cities
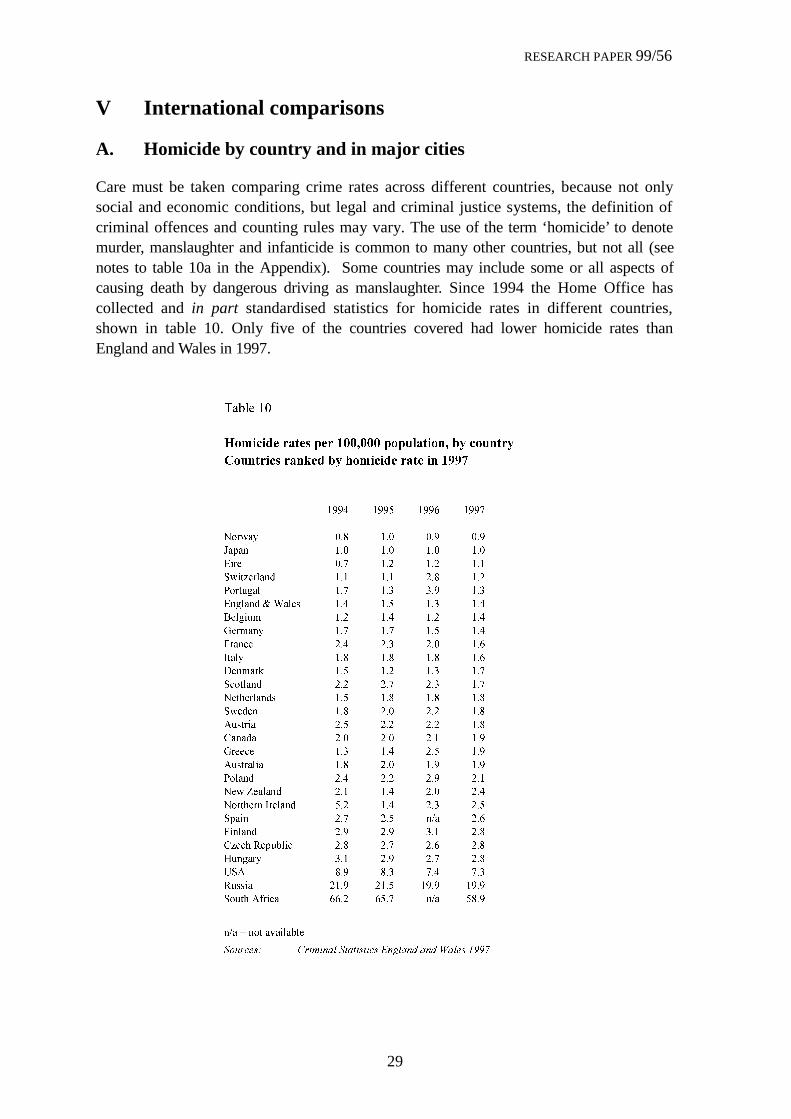
Care must be taken comparing crime rates across different countries, because not onlysocial and economic conditions, but legal and criminal justice systems, the definition ofcriminal offences and counting rules may vary. The use of the term ‘homicide’ to denotemurder, manslaughter and infanticide is common to many other countries, but not all (seenotes to table 10a in the Appendix). Some countries may include some or all aspects ofcausing death by dangerous driving as manslaughter. Since 1994 the Home Office hascollected and in part standardised statistics for homicide rates in different countries,shown in table 10. Only five of the countries covered had lower homicide rates thanEngland and Wales in 1997.
��������
!������������"���##�###�"�"$��������%����$����
&�$���������'��%������������������ (
���� ���� ���� ����
���)�& ��� ��� ��� ���
%� ��� ��� ��� ��� ���
2��� ��� ��� ��� ���
+)�3����� ��� ��� ��� ���
����� � ��� ��� ��� ���
2� ����4�5���� ��� ��� ��� ���
6� �� ��� ��� ��� ���
7�����&� ��� ��� ��� ���
/���#� ��� ��� ��� ���
0��& ��� ��� ��� ���
8�����9 ��� ��� ��� ���
+#����� ��� ��� ��� ���
���!������� ��� ��� ��� ���
+)���� ��� ��� ��� ���
$����� ��� ��� ��� ���
:������ ��� ��� ��� ���
7���#� ��� ��� ��� ���
$������ ��� ��� ��� ���
����� ��� ��� ��� ���
��)�;����� ��� ��� ��� ���
����!����0����� ��� ��� ��� ���
+ ��� ��� ��� �<� ���
/���� ��� ��� ��� ���
:3�#!�=� ��# ��� ��� ��� ���
>�� ��& ��� ��� ��� ���
?+$ ��� ��� ��� ���
=����� ���� ���� ���� ����
+���!�$"�#� ���� ���� �<� ����
�<��@�����������
�������� ��� ���� ���������� ��� ���� ����"##'�

RESEARCH PAPER 99/56
30
Table 10a in the Appendix shows these same figures together with homicide rates derivedfrom mortality statistics for earlier years. The two different methods mean that there issome discontinuity in the data.
The mortality statistics are based on registrations of deaths by cause, which are alsoimperfect. For example, they relate to year of registration, rather than year of occurrence.When homicide is suspected, the death may be (as in England and Wales) referred to acoroner which may delay registration and cause it to be labelled ‘injury by other andunspecified means’ initially. These data are therefore of more use in indicating trends.
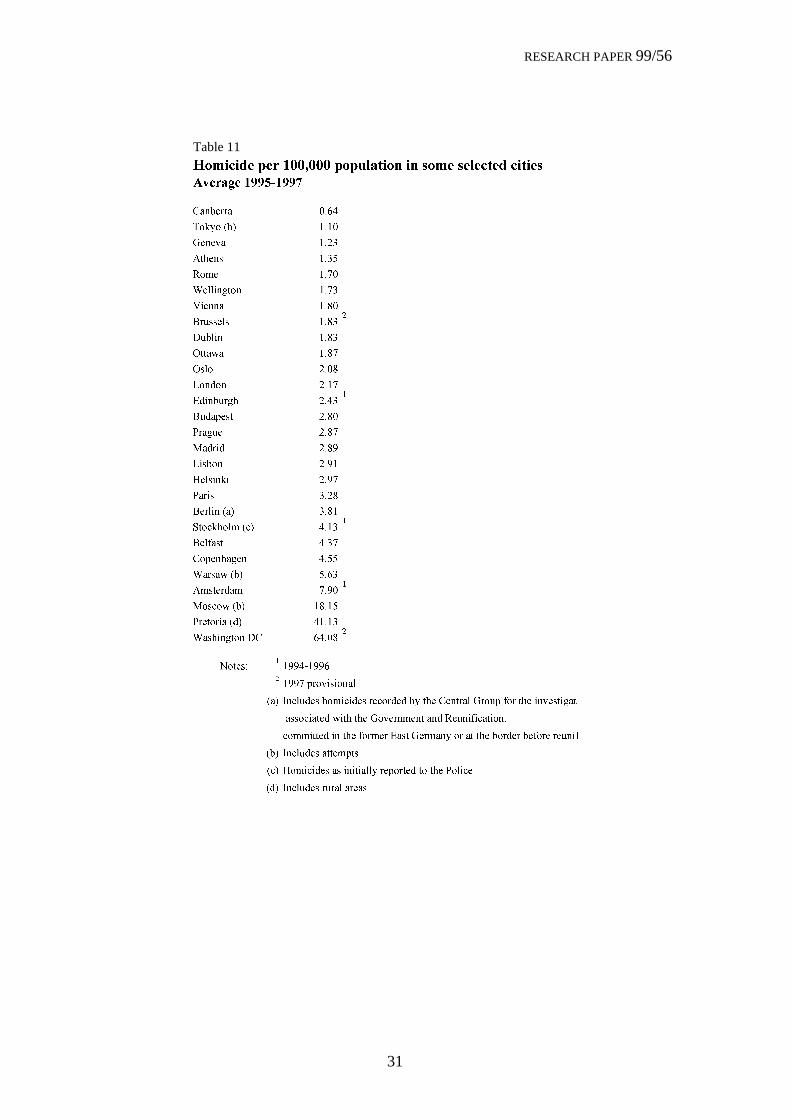
Table 11 on the next page shows homicide rate in some major cities. Again these are datacollated by the Home Office28. London and Edinburgh fall mid-table.
28 Criminal Statistics England and Wales, Cm 4162 Home Office November 1998, table 10.3
RESEARCH PAPER 99/56
31
Table 11�������������� ������������������������������������
) ����� �*� (�
:������� ����
'�9&��.�, ����
7����� ����
$�!��� ����
=��� ����
5�� ��� ����
A���� ����
6������ �����
8��� ����
*���)� ����
*�� ����
B����� ����
2����� ! �����
6��� ��� ����
��� �� ����
����� ����
B���� ����
>���9 ����
���� ����
6����.�, ����
+��#9!���.#, �����
6�"��� ����
:� ��!� �� ����
5����)�.�, ����
$�������� �����
���#�)�.�, �����
��������.�, �����
5��!� ����8: ������
�����C�����D����
������ �������
.�, 0�#�����!��#������#�������&��!��:������7��� �"����!������� ��
�����#�����)�!��!��7��������������=���"#������
#�����������!��"������2����7�����&��������!�����������"��������"
.�, 0�#���������� ��
.#, >��#����������&��� ����������!����#�
.�, 0�#���������������
RESEARCH PAPER 99/56
32
B. USA
1. Use of the death penalty
The death penalty has been available in the United States in its present form since 1976,when the Supreme Court upheld revised state capital punishment laws after ruling themunconstitutional in 1972. At the end of 1997, 38 states had capital punishment statutesbut capital offences and method of execution vary by state, while a number of Federallaws provide for the death penalty29.
Those states without a death penalty are indicated in table 12. As the table shows, sinceJanuary 1977, 432 people have been executed. 74 people in 17 states were executed in1997, all of whom were men, and 45 white, 27 black, one American Indian and oneAsian. This was 29 more people than in 1996 and the highest since 1955, when 76people were executed. Provisional figures for 1998 indicate that 68 prisoners wereexecuted.
At year end 1997, 34 states and the Federal prison system held 3,335 prisoners (including44 women) under sentence of death, 3% more than at year end 1996 and the highestnumber ever. All had committed murder. The number of prisoners on death row in eachstate is also shown in table 11. Three states – Texas, California and Florida – accountedfor 39% of America’s death row population.
Among inmates under sentence of death and with available criminal histories, 1 in 12 hada prior homicide conviction.
29 US Bureau of Justice Statistics Bulletin Capital Punishment 1997 December 1998

RESEARCH PAPER 99/56
33
Table 12
Executions by state
+�#������ ������������
2-�#��������
����
2-�#��������
������,
���������������
������#���"�����!��
��������
/������+&���� �� ��
'�-�� ��� ��� �� �� ���
A� �� ��� �� � �� ��
/���� ��� �� � � ���
������ �� �� � � ��
B������ ��� �� � ��
7��� � ��� �� � ���
$������ ��� �� � � ���
$�9������ ��� �� � � ��
+���!�:����� ��� �� � � ��
0��� ��� �� � � ���
*9�!��� �� � � � ���
$�3���� �� � � � ���
����!�:����� ��� � � ���
8��)��� �� � ��
������� �� � � ��
0������ �� � � � ��
?��!� �� � ��
:�"����� ��� � � ���
����� ��� � ��
������9� � � � ��
5��!� ��� �� � � ��
���&��� �� � � � ��
*�� �� �� � � ��
�����&���� ��� � ���
������� � � � �
5&��� � � �
:������ �� � � �
0��!� � � ��
E����#9& ��� � � ��
��)�F��9 ��� �
*!� ��� ���
'�������� �� ��
��)�%����& �� ��
8���#���"�:����� �� ����$��!�����
5����A� �� �� ����$��!�����
��)���-#� � �
A������ � ����$��!�����
��)�>�� �!�� � �
+���!�8�9��� � �
:����#�#�� �� �
0�)� �� ����$��!�����
E����� �� �
�����#!������� �� ����$��!�����
$��9� ����$��!�����
>�)� ����$��!�����
���� ����$��!�����
�#! �� ����$��!�����
�������� ����$��!�����
����!�8�9��� ����$��!�����
=!����0���� ����$��!�����
5�#���� ����$��!�����
?+�'��� ����� ��� �� �� �����
��������+��,��� �����-�������� ������,������� �� ������������"##'������!���"##$
�,�8����"������������ �������
�������!������@�+���������������!������!������!� ����&����� �������������
RESEARCH PAPER 99/56
34
2. Homicide rates
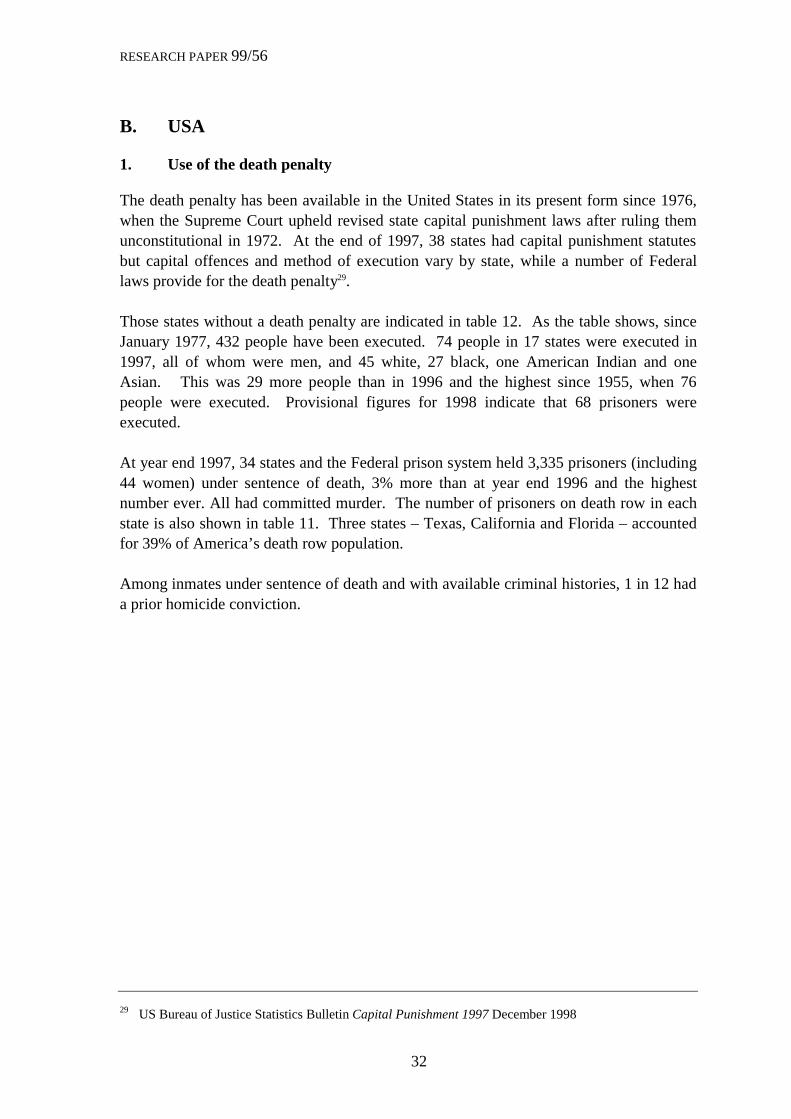
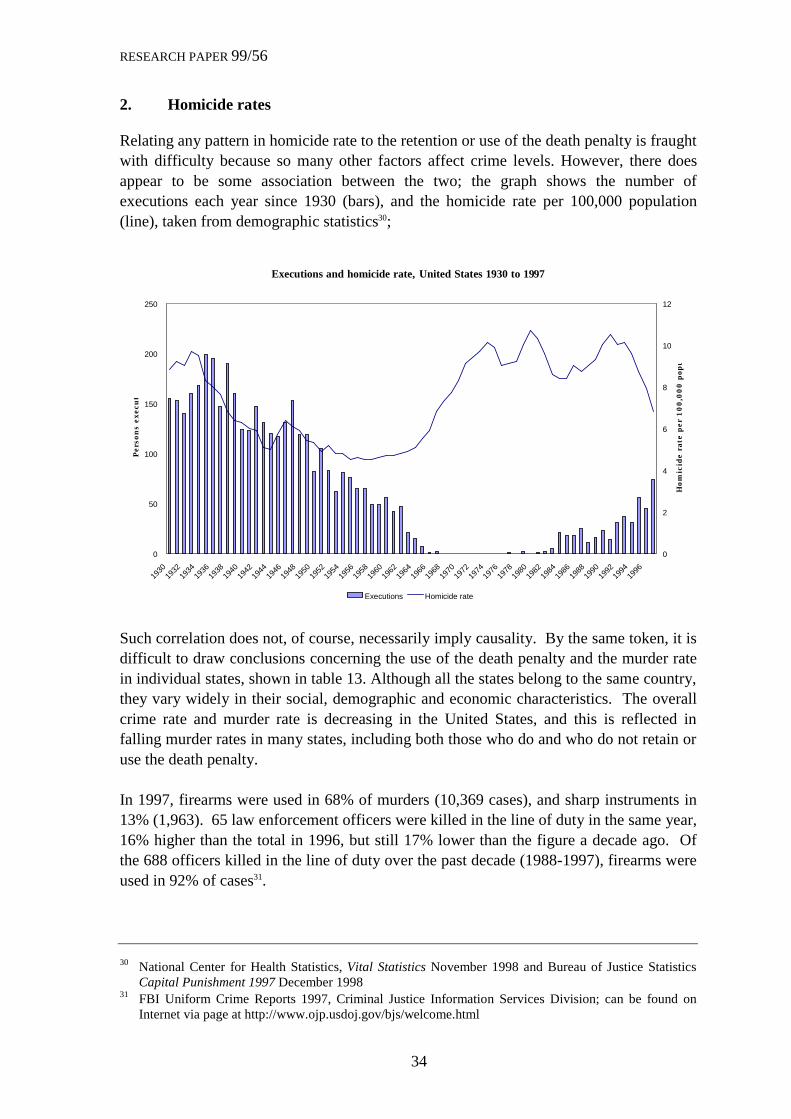
Relating any pattern in homicide rate to the retention or use of the death penalty is fraughtwith difficulty because so many other factors affect crime levels. However, there doesappear to be some association between the two; the graph shows the number ofexecutions each year since 1930 (bars), and the homicide rate per 100,000 population(line), taken from demographic statistics30;
Executions and homicide rate, United States 1930 to 1997
0
50
100
150
200
250
1930
1932
1934
1936
1938
1940
1942
1944
1946
1948
1950
1952
1954
1956
1958
1960
1962
1964
1966
1968
1970
1972
1974
1976
1978
1980
1982
1984
1986
1988
1990
1992
1994
1996
Per
sons
exec
ute
0
2
4
6
8
10
12
Hom
icid
e ra
te p
er 1
00,0
00 p
opul
Executions Homicide rate
Such correlation does not, of course, necessarily imply causality. By the same token, it isdifficult to draw conclusions concerning the use of the death penalty and the murder ratein individual states, shown in table 13. Although all the states belong to the same country,they vary widely in their social, demographic and economic characteristics. The overallcrime rate and murder rate is decreasing in the United States, and this is reflected infalling murder rates in many states, including both those who do and who do not retain oruse the death penalty.
In 1997, firearms were used in 68% of murders (10,369 cases), and sharp instruments in13% (1,963). 65 law enforcement officers were killed in the line of duty in the same year,16% higher than the total in 1996, but still 17% lower than the figure a decade ago. Ofthe 688 officers killed in the line of duty over the past decade (1988-1997), firearms wereused in 92% of cases31.
30 National Center for Health Statistics, Vital Statistics November 1998 and Bureau of Justice StatisticsCapital Punishment 1997 December 1998
31 FBI Uniform Crime Reports 1997, Criminal Justice Information Services Division; can be found onInternet via page at http://www.ojp.usdoj.gov/bjs/welcome.html
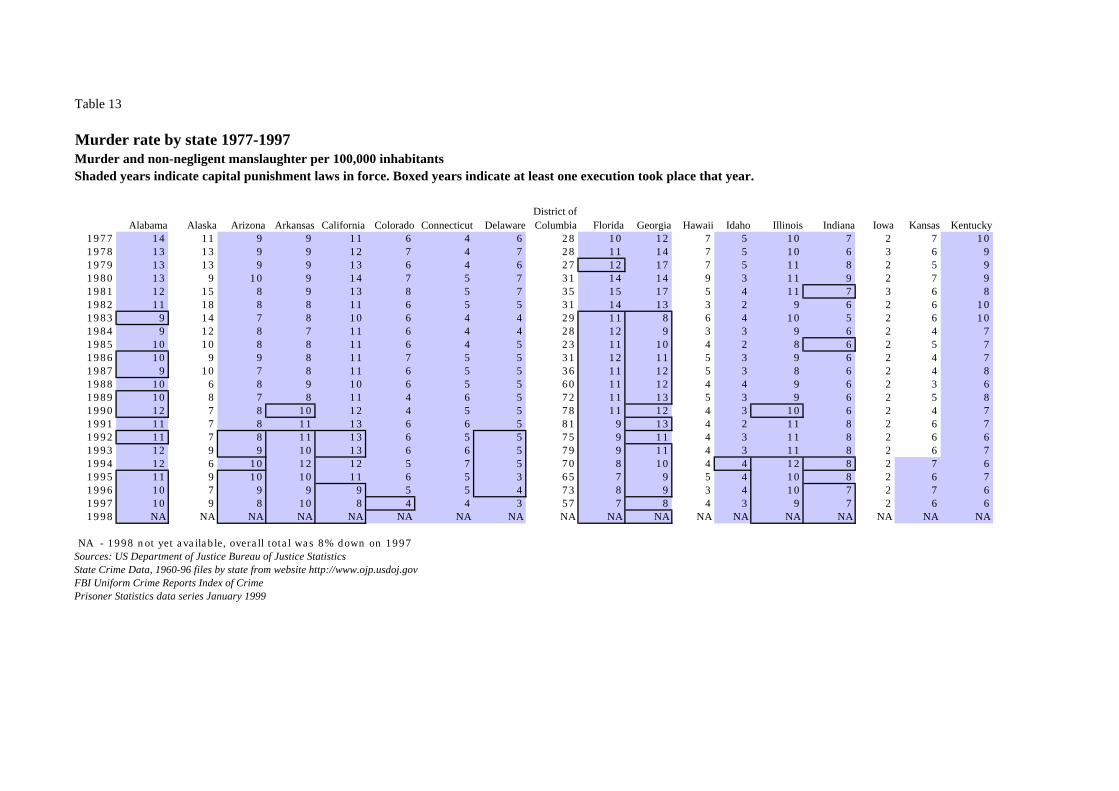
Table 13
Murder rate by state 1977-1997 Murder and non-negligent manslaughter per 100,000 inhabitantsShaded years indicate capital punishment laws in force. Boxed years indicate at least one execution took place that year.
Alabama Alaska Arizona Arkansas California Colorado Connecticut DelawareDistrict of Columbia Florida Georgia Hawaii Idaho Illinois Indiana Iowa Kansas Kentucky
1977 14 11 9 9 11 6 4 6 28 10 12 7 5 10 7 2 7 101978 13 13 9 9 12 7 4 7 28 11 14 7 5 10 6 3 6 91979 13 13 9 9 13 6 4 6 27 12 17 7 5 11 8 2 5 91980 13 9 10 9 14 7 5 7 31 14 14 9 3 11 9 2 7 91981 12 15 8 9 13 8 5 7 35 15 17 5 4 11 7 3 6 81982 11 18 8 8 11 6 5 5 31 14 13 3 2 9 6 2 6 101983 9 14 7 8 10 6 4 4 29 11 8 6 4 10 5 2 6 101984 9 12 8 7 11 6 4 4 28 12 9 3 3 9 6 2 4 71985 10 10 8 8 11 6 4 5 23 11 10 4 2 8 6 2 5 71986 10 9 9 8 11 7 5 5 31 12 11 5 3 9 6 2 4 71987 9 10 7 8 11 6 5 5 36 11 12 5 3 8 6 2 4 81988 10 6 8 9 10 6 5 5 60 11 12 4 4 9 6 2 3 61989 10 8 7 8 11 4 6 5 72 11 13 5 3 9 6 2 5 81990 12 7 8 10 12 4 5 5 78 11 12 4 3 10 6 2 4 71991 11 7 8 11 13 6 6 5 81 9 13 4 2 11 8 2 6 71992 11 7 8 11 13 6 5 5 75 9 11 4 3 11 8 2 6 61993 12 9 9 10 13 6 6 5 79 9 11 4 3 11 8 2 6 71994 12 6 10 12 12 5 7 5 70 8 10 4 4 12 8 2 7 61995 11 9 10 10 11 6 5 3 65 7 9 5 4 10 8 2 6 71996 10 7 9 9 9 5 5 4 73 8 9 3 4 10 7 2 7 61997 10 9 8 10 8 4 4 3 57 7 8 4 3 9 7 2 6 61998 NA NA NA NA NA NA NA NA NA NA NA NA NA NA NA NA NA NA
NA - 1998 not yet available, overall total was 8% down on 1997Sources: US Department of Justice Bureau of Justice Statistics State Crime Data, 1960-96 files by state from website http://www.ojp.usdoj.govFBI Uniform Crime Reports Index of CrimePrisoner Statistics data series January 1999

Table 13
Murder rate by state 1977-1997 Murder and non-negligent manslaughter per 100,000 inhabitantsShaded years indicate capital punishment laws in force. Boxed years indicate at least one execution took place that year.
Louisiana Maine MarylandMassachu
settes Michigan Minnesota Mississippi Missouri Montana Nebraska Nevada New
HampshireNew
JerseyNew
Mexico New YorkNorth
CarolinaNorth
Dakota Ohio1977 16 2 8 3 9 3 14 10 5 4 16 3 6 9 11 11 1 81978 16 3 8 4 11 2 13 10 5 3 15 1 5 10 10 11 1 71979 17 3 10 4 9 2 13 11 4 4 18 2 7 12 12 11 2 81980 16 3 10 4 10 3 15 11 4 4 20 3 7 13 13 11 1 81981 16 3 10 4 9 2 13 10 3 3 18 3 7 11 12 9 2 71982 16 2 10 4 9 2 14 10 4 2 14 2 6 12 11 9 1 61983 14 2 9 4 10 2 11 8 4 3 13 2 5 9 11 8 2 61984 13 2 8 4 10 2 10 7 4 3 11 1 5 9 10 9 1 51985 11 2 8 3 11 2 11 8 6 3 10 2 5 11 9 8 1 51986 13 2 9 4 11 2 11 9 3 3 13 2 5 11 11 8 1 61987 11 3 10 3 12 3 10 8 4 3 8 3 5 10 11 8 1 61988 12 3 10 4 11 3 9 8 3 4 10 2 5 11 13 8 2 51989 15 3 12 4 11 3 10 8 3 2 8 3 5 9 13 9 1 61990 17 2 12 4 10 3 12 9 5 3 10 2 6 9 14 11 1 61991 17 1 12 4 11 3 13 11 3 3 12 4 5 11 14 11 1 71992 17 2 12 4 10 3 12 11 3 4 11 2 5 9 13 11 2 71993 20 2 13 4 10 3 14 11 3 4 10 2 5 8 13 11 2 61994 20 2 12 4 10 3 15 10 3 3 12 1 5 11 11 11 0 61995 17 2 12 4 8 4 13 9 4 3 11 2 5 9 9 9 1 51996 18 2 12 3 8 4 11 8 4 3 14 2 4 12 7 9 2 51997 16 2 10 2 8 3 13 8 5 3 11 1 4 8 6 8 1 51998 NA NA NA NA NA NA NA NA NA NA NA NA NA NA NA NA NA NA
NA - 1998 not yet available, overall total was 8% down on 1997Sources: US Department of Justice Bureau of Justice Statistics State Crime Data, 1960-96 files by state from website http://www.ojp.usdoj.govFBI Uniform Crime Reports Index of CrimePrisoner Statistics data series January 1999

Table 13
Murder rate by state 1977-1997 Murder and non-negligent manslaughter per 100,000 inhabitantsShaded years indicate capital punishment laws in force. Boxed years indicate at least one execution took place that year.
Oklahoma OreganPennsy-lvannia
Rhode Island
South Carolina
South Dakota Tennessee Texas Utah Vermont Virginia
Washington State
West Virginia Wisconsin Wyoming US Total
1977 9 5 6 4 12 2 10 13 3 1 9 4 6 3 5 91978 8 5 6 4 12 2 9 14 4 3 9 5 7 3 7 91979 10 4 6 3 13 2 10 17 5 1 9 5 7 3 9 101980 10 5 7 4 11 1 11 17 4 2 9 5 7 3 6 101981 9 4 6 4 10 2 10 17 3 4 9 5 6 3 5 101982 11 5 6 4 11 3 10 16 3 2 7 4 5 3 9 91983 8 4 5 3 10 2 9 14 3 4 7 5 5 3 6 81984 8 5 5 3 9 2 8 13 3 2 8 5 4 2 3 81985 8 5 5 4 9 2 9 13 3 3 7 5 4 3 4 81986 8 7 6 3 9 4 10 14 3 2 7 5 6 3 5 91987 7 6 5 4 9 2 9 12 3 3 7 6 5 3 2 81988 7 5 5 4 9 3 9 12 3 2 8 6 5 3 3 81989 7 5 6 5 9 1 8 12 3 2 8 4 7 4 4 91990 8 4 7 5 11 2 10 14 3 2 9 5 6 5 5 91991 7 5 6 4 11 2 11 15 3 2 9 4 6 5 3 101992 7 5 6 4 10 1 10 13 3 2 9 5 6 4 4 91993 8 5 7 4 10 3 10 12 3 4 8 5 7 4 3 101994 7 5 6 4 10 1 9 11 3 1 9 6 5 4 3 91995 12 4 6 3 8 2 11 9 4 2 8 5 5 4 2 81996 7 4 6 3 9 1 10 8 3 2 8 5 4 4 3 71997 7 3 6 3 8 1 10 7 2 2 7 4 4 4 4 71998 NA NA NA NA NA NA NA NA NA NA NA NA NA NA NA NA
NA - 1998 not yet available, overall total was 8% down on 1997Sources: US Department of Justice Bureau of Justice Statistics State Crime Data, 1960-96 files by state from website http://www.ojp.usdoj.govFBI Uniform Crime Reports Index of CrimePrisoner Statistics data series January 1999
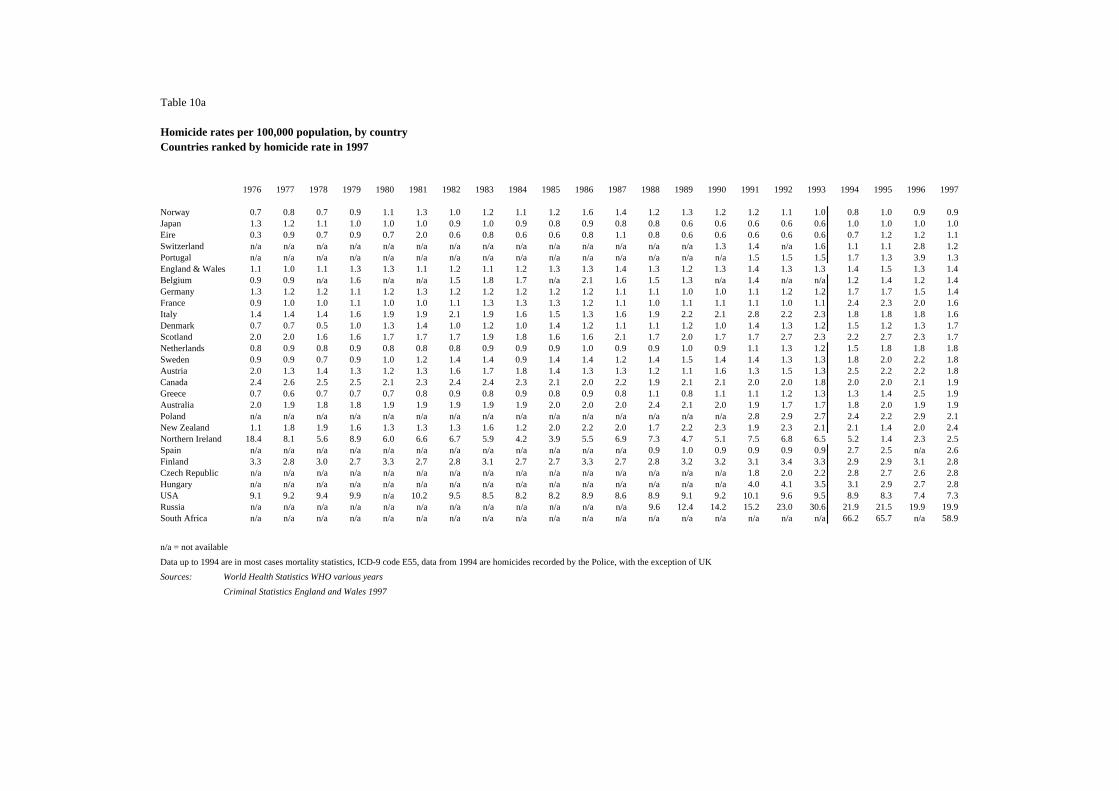
Table 10a
Homicide rates per 100,000 population, by countryCountries ranked by homicide rate in 1997
1976 1977 1978 1979 1980 1981 1982 1983 1984 1985 1986 1987 1988 1989 1990 1991 1992 1993 1994 1995 1996 1997
Norway 0.7 0.8 0.7 0.9 1.1 1.3 1.0 1.2 1.1 1.2 1.6 1.4 1.2 1.3 1.2 1.2 1.1 1.0 0.8 1.0 0.9 0.9Japan 1.3 1.2 1.1 1.0 1.0 1.0 0.9 1.0 0.9 0.8 0.9 0.8 0.8 0.6 0.6 0.6 0.6 0.6 1.0 1.0 1.0 1.0Eire 0.3 0.9 0.7 0.9 0.7 2.0 0.6 0.8 0.6 0.6 0.8 1.1 0.8 0.6 0.6 0.6 0.6 0.6 0.7 1.2 1.2 1.1Switzerland n/a n/a n/a n/a n/a n/a n/a n/a n/a n/a n/a n/a n/a n/a 1.3 1.4 n/a 1.6 1.1 1.1 2.8 1.2Portugal n/a n/a n/a n/a n/a n/a n/a n/a n/a n/a n/a n/a n/a n/a n/a 1.5 1.5 1.5 1.7 1.3 3.9 1.3England & Wales 1.1 1.0 1.1 1.3 1.3 1.1 1.2 1.1 1.2 1.3 1.3 1.4 1.3 1.2 1.3 1.4 1.3 1.3 1.4 1.5 1.3 1.4Belgium 0.9 0.9 n/a 1.6 n/a n/a 1.5 1.8 1.7 n/a 2.1 1.6 1.5 1.3 n/a 1.4 n/a n/a 1.2 1.4 1.2 1.4Germany 1.3 1.2 1.2 1.1 1.2 1.3 1.2 1.2 1.2 1.2 1.2 1.1 1.1 1.0 1.0 1.1 1.2 1.2 1.7 1.7 1.5 1.4France 0.9 1.0 1.0 1.1 1.0 1.0 1.1 1.3 1.3 1.3 1.2 1.1 1.0 1.1 1.1 1.1 1.0 1.1 2.4 2.3 2.0 1.6Italy 1.4 1.4 1.4 1.6 1.9 1.9 2.1 1.9 1.6 1.5 1.3 1.6 1.9 2.2 2.1 2.8 2.2 2.3 1.8 1.8 1.8 1.6Denmark 0.7 0.7 0.5 1.0 1.3 1.4 1.0 1.2 1.0 1.4 1.2 1.1 1.1 1.2 1.0 1.4 1.3 1.2 1.5 1.2 1.3 1.7Scotland 2.0 2.0 1.6 1.6 1.7 1.7 1.7 1.9 1.8 1.6 1.6 2.1 1.7 2.0 1.7 1.7 2.7 2.3 2.2 2.7 2.3 1.7Netherlands 0.8 0.9 0.8 0.9 0.8 0.8 0.8 0.9 0.9 0.9 1.0 0.9 0.9 1.0 0.9 1.1 1.3 1.2 1.5 1.8 1.8 1.8Sweden 0.9 0.9 0.7 0.9 1.0 1.2 1.4 1.4 0.9 1.4 1.4 1.2 1.4 1.5 1.4 1.4 1.3 1.3 1.8 2.0 2.2 1.8Austria 2.0 1.3 1.4 1.3 1.2 1.3 1.6 1.7 1.8 1.4 1.3 1.3 1.2 1.1 1.6 1.3 1.5 1.3 2.5 2.2 2.2 1.8Canada 2.4 2.6 2.5 2.5 2.1 2.3 2.4 2.4 2.3 2.1 2.0 2.2 1.9 2.1 2.1 2.0 2.0 1.8 2.0 2.0 2.1 1.9Greece 0.7 0.6 0.7 0.7 0.7 0.8 0.9 0.8 0.9 0.8 0.9 0.8 1.1 0.8 1.1 1.1 1.2 1.3 1.3 1.4 2.5 1.9Australia 2.0 1.9 1.8 1.8 1.9 1.9 1.9 1.9 1.9 2.0 2.0 2.0 2.4 2.1 2.0 1.9 1.7 1.7 1.8 2.0 1.9 1.9Poland n/a n/a n/a n/a n/a n/a n/a n/a n/a n/a n/a n/a n/a n/a n/a 2.8 2.9 2.7 2.4 2.2 2.9 2.1New Zealand 1.1 1.8 1.9 1.6 1.3 1.3 1.3 1.6 1.2 2.0 2.2 2.0 1.7 2.2 2.3 1.9 2.3 2.1 2.1 1.4 2.0 2.4Northern Ireland 18.4 8.1 5.6 8.9 6.0 6.6 6.7 5.9 4.2 3.9 5.5 6.9 7.3 4.7 5.1 7.5 6.8 6.5 5.2 1.4 2.3 2.5Spain n/a n/a n/a n/a n/a n/a n/a n/a n/a n/a n/a n/a 0.9 1.0 0.9 0.9 0.9 0.9 2.7 2.5 n/a 2.6Finland 3.3 2.8 3.0 2.7 3.3 2.7 2.8 3.1 2.7 2.7 3.3 2.7 2.8 3.2 3.2 3.1 3.4 3.3 2.9 2.9 3.1 2.8Czech Republic n/a n/a n/a n/a n/a n/a n/a n/a n/a n/a n/a n/a n/a n/a n/a 1.8 2.0 2.2 2.8 2.7 2.6 2.8Hungary n/a n/a n/a n/a n/a n/a n/a n/a n/a n/a n/a n/a n/a n/a n/a 4.0 4.1 3.5 3.1 2.9 2.7 2.8USA 9.1 9.2 9.4 9.9 n/a 10.2 9.5 8.5 8.2 8.2 8.9 8.6 8.9 9.1 9.2 10.1 9.6 9.5 8.9 8.3 7.4 7.3Russia n/a n/a n/a n/a n/a n/a n/a n/a n/a n/a n/a n/a 9.6 12.4 14.2 15.2 23.0 30.6 21.9 21.5 19.9 19.9South Africa n/a n/a n/a n/a n/a n/a n/a n/a n/a n/a n/a n/a n/a n/a n/a n/a n/a n/a 66.2 65.7 n/a 58.9
n/a = not available
Data up to 1994 are in most cases mortality statistics, ICD-9 code E55, data from 1994 are homicides recorded by the Police, with the exception of UK
Sources: World Health Statistics WHO various years
Criminal Statistics England and Wales 1997


![INDIAN PENAL CODE - mk0delhilawacad532rh.kinstacdn.com · 2 Coaching for Judicial Services, DU LLB and CLAT | INDIAN PENAL CODE [Sections 299 - 304] Section 299 Culpable homicide](https://static.fdocuments.net/doc/165x107/5e118c3955d5047319150fd7/indian-penal-code-2-coaching-for-judicial-services-du-llb-and-clat-indian-penal.jpg)