Homework: Visual Search and Interaction with the DARPA...
6
Homework: Visual Search and Interaction with the DARPA XDATA Employment Data Due: December 6 th , 2014, 12pm PT 1. Overview In this assignment you will take your Apache Solr index constructed from upstream JSON files representing job postings collected and crawled from the upstream http://www.computrabajo.com affiliate sites that primarily serve Mexico and South American countries and visualize them using the D3.js Over the course of the semester, you made contributions by developing novel approaches for deduplication of arbitrary document features; for crawling and ingesting and approaches for link-based and content-based ranking of those employment data documents and features and you have leveraged open source, and hopefully interesting technologies including Apache Tika, Apache Solr, Apache OODT, ETLLib, and other systems. The second assignment left you with a rich Apache Solr/Lucene based catalog of Employment data that you used to answer a set of challenge questions many of which were the same questions that over twenty performers at the federally funded research program called DARPA XDATA worked on this past summer. Consider yourself in nationally recognized and amazing company. In this assignment, you will leverage your Apache Solr index and the D3.js data visualization technology (http://d3js.org/) to interact and visualize your search engine data. You will leverage D3.js and the geolocation information from the data to recreate the following map:
Transcript of Homework: Visual Search and Interaction with the DARPA...
Homework: Visual Search and Interaction with the DARPA XDATA Employment Data
Due: December 6th, 2014, 12pm PT
1. Overview In this assignment you will take your Apache Solr index constructed from upstream JSON files representing job postings collected and crawled from the upstream http://www.computrabajo.com affiliate sites that primarily serve Mexico and South American countries
and visualize them using the D3.js Over the course of the semester, you made contributions by developing novel approaches for deduplication of arbitrary document features; for crawling and ingesting and approaches for link-based and content-based ranking of those employment data documents and features and you have leveraged open source, and hopefully interesting technologies including Apache Tika, Apache Solr, Apache OODT, ETLLib, and other systems. The second assignment left you with a rich Apache Solr/Lucene based catalog of Employment data that you used to answer a set of challenge questions many of which were the same questions that over twenty performers at the federally funded research program called DARPA XDATA worked on this past summer. Consider yourself in nationally recognized and amazing company. In this assignment, you will leverage your Apache Solr index and the D3.js data visualization technology (http://d3js.org/) to interact and visualize your search engine data. You will leverage D3.js and the geolocation information from the data to recreate the following map:
Employment Dataset
Description: This set consists of employment opportunities posted from http://www.computrabajo.com affiliate sites which
primarily serve Mexico and South American countries. Postings are temporary and may be taken down at any time due to a number
of factors so this data set is an attempted persistence of these postings for analysis over a long period of time. Employment analysis
can be important to determine how populations, economies, and cultures are changing and can easily complement social media
analysis.
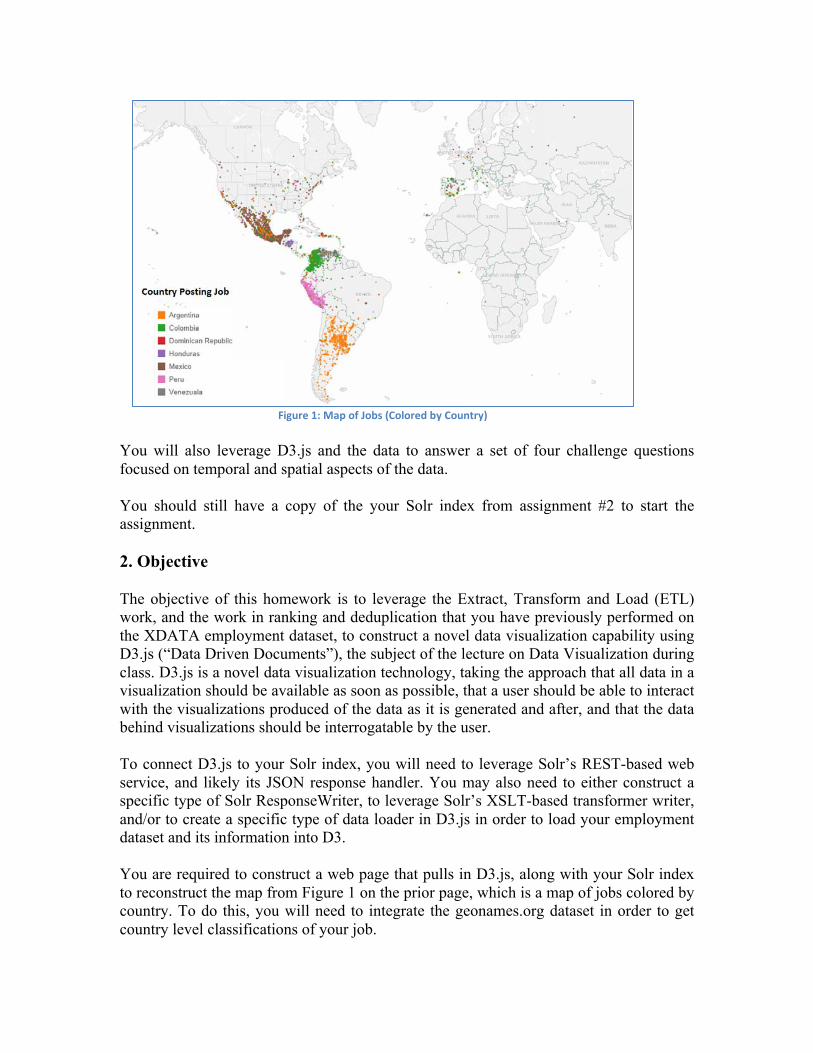
Figure 1: Map of Jobs (Colored by Country)
Background and Formats: The dataset consists of 119+ Million
jobs and is about 40 GB in size. There are approximately 2.1
Million unique jobs in the set as many records are duplicates. To
understand the dataset more thoroughly, a description of how
this data is scraped is required: Every page of job postings from
each affiliate site is parsed once per day. Each employment
record has a first-seen and last-seen date. When a posting is
seen for the first time, its first-seen and last-seen dates are set.
Then every day that the posting still appears, its last-seen date is
updated. If a posting stops appearing, it's last-seen date stops
being updated. As expected, lots of textual entries are in
Spanish. The Translated Location field is parsed out from the
data and run through a geo-fixing service to estimate a rough
latitude and longitude. When entries are missing at scale for a
given day, one can assume the scraper wasn’t running and the
entries were missed.
Data Field Example Posted Date 2012-10-23
Location Capital Federal
Department Capital Federal
Title Desarrollador plataforma SalesForce CRM.
Salary A convenir
Start Inmediato
Duration Indeterminada
Job Type Tiempo Completo
Applications Enviar Cv con Ref Desarrollador SalesForce
CRM
Company Softtek
Contact Belen Lavinia
Phone
Fax
Translated Location Buenos Aires, Argentina
Latitude -34.6037232
Longitude -58.3815931
Date First Seen 2012-10-29
URL http://www.computrabajo.com.ar/bt-ofrd-
softtek-21444.htm
Date Last Seen 2012-11-06
Table 1: Employment Data Fields
Locations: The data is available for local copy onsite, is in HDFS at “/SummerCamp2014/employment/”, and is also accessible via
the “employment_computrabajo” Hive table.
Please see the Employment Dataset Challenges Document for suggested problem sets.
You will also leverage D3.js and the data to answer a set of four challenge questions focused on temporal and spatial aspects of the data. You should still have a copy of the your Solr index from assignment #2 to start the assignment. 2. Objective The objective of this homework is to leverage the Extract, Transform and Load (ETL) work, and the work in ranking and deduplication that you have previously performed on the XDATA employment dataset, to construct a novel data visualization capability using D3.js (“Data Driven Documents”), the subject of the lecture on Data Visualization during class. D3.js is a novel data visualization technology, taking the approach that all data in a visualization should be available as soon as possible, that a user should be able to interact with the visualizations produced of the data as it is generated and after, and that the data behind visualizations should be interrogatable by the user. To connect D3.js to your Solr index, you will need to leverage Solr’s REST-based web service, and likely its JSON response handler. You may also need to either construct a specific type of Solr ResponseWriter, to leverage Solr’s XSLT-based transformer writer, and/or to create a specific type of data loader in D3.js in order to load your employment dataset and its information into D3. You are required to construct a web page that pulls in D3.js, along with your Solr index to reconstruct the map from Figure 1 on the prior page, which is a map of jobs colored by country. To do this, you will need to integrate the geonames.org dataset in order to get country level classifications of your job.
In addition to the above, you are required to answer a set of challenge questions which amount to generating specific views on your D3-based web page that show the data from your search index temporally and spatially. 3. Tasks
1. Construct a web front end in either Django, AngularJS, or some pre identified web framework that leverages D3.js to create a map-based interface to your employment data
a. The interface should directly leverage D3.js, and OpenLayers to create the Map
b. The web interface in D3.js should plug into either the Solr REST end-point and call its JSON response handler, or you should develop your own end point (see task #2)
2. Provide web-based REST access to your Solr data in a compatible way with D3.js a. You will need to ensure that D3.js can load your employment data from
your Solr index. You may be able to get the REST endpoint and JSON response writer in Solr to access the data directly from D3.js.
b. If you cannot get the existing Solr end point working, develop a new REST-based end point for Solr that simplifies the JSON output so that you can load it directly into D3.js.
c. You may need to develop an approach for loading data into D3.js. See this page from Mike Bostock (one of D3’s creators, along with Jeff Heer) for more information on loading data into D3: https://github.com/mbostock/d3/wiki/Requests
3. Develop capabilities in your D3.js based map to satisfy the following four challenge questions.
a. Visualize job postings geospatially and temporally by various attributes such as company, job type, salary, etc.
b. Visualize how companies are changing over time based on job postings. Are they growing geographically? Are the entering new domains to make money?
c. Provide a map of corporate presence across South America. Are there territories?
d. Plot and analyze the seasonal trends of different job categories. 4. Assignment Setup 4.1 Group Formation You can work on this assignment in groups sized 2-4. You may keep the same groups you had during the previous assignment. If you have any changes to your group or any questions, e-mail the graders. Gouthami Kondakindi [email protected] Preethi Ramesh [email protected];
Use subject: CS 572: Team Details Groups for your 3rd assignment must be confirmed and finalized by Thursday, November 20, 2014. 4.2 Dataset You should also have a copy of your Solr index produced in assignment #2. Groups will either have the original (reduced) dataset, or the full dataset. Start with whatever Solr index you have from assignment #2. 4.3 Downloading and Installing D3.js Download D3 from http://d3js.org/ You can find some step-by-step tutorials online for how to structure your D3.js project, for example: http://alignedleft.com/tutorials/d3/setup https://www.dashingd3js.com/d3js-first-steps https://www.npmjs.org/package/d3 (if you use NPM) http://bost.ocks.org/mike/d3/workshop Also see this great tutorial from Mike Bostock (D3’s primary creator) on his blog about making a Bubble Map in D3: http://bost.ocks.org/mike/bubble-map/ 4.4 Constructing your Map and the Backend Web Framework Ideally to construct your D3-based map, you will need to use a Web Framework or leverage some capability to access your Solr-based search index over the web and over the REST protocol. To do so, you will need to leverage Javascript (for data loading), REST (for access to your search index in Solr), and potentially a web framework for pulling it all together. You are free to use any web framework that you feel comfortable with, you must report which framework in your team’s README file. You are also free to decide whether you need to construct a web service in the particular web framework that you choose to reformat the Solr JSON output so that you can load it into D3, or if you want, to add javascript libraries to load directly into D3 and to build your map. Start small initially – load only a subset of jobs and attempt to visualize them in D3. Test how responsive the framework is. You may need to develop an approach for subsetting the full dataset, and/or for summarizing it since the data is so large. To demonstrate your Map we ask that you prepare a simple video and upload it either to YouTube and/or Vimeo and provide a link to the video in your README. The video should demonstrate the use of your map, and how you are answering each of the four challenge questions.

4.5 Submitting patches and contributing to open source Please note that if you contribute patches to D3 on Github (via pull requests), and if you contribute to OODT or Tika or Solr or ETLLib from prior assignments, you will have the opportunity to earn extra credit in a similar fashion to the prior assignment. 5. Report Write a short 4-page report describing your observations. How easy to use was D3? What was the hardest part, loading data, or visualizing it? Do NOT simply provide advantages and disadvantages from a quick Google search. You are required to think critically about this portion of the report and sincerely provide your feedback. Describe in detail how your map answers the challenge questions presented in Task #3. Specify how to use the map to visualize the results. Please also note that the graders will be given great flexibility to add/subtract from various areas of the report based on your submitted work. 6. Submission Guidelines This assignment is to be submitted electronically, by 12pm PT on the specified due date, via Gmail [email protected]. Use the subject line: CSCI 572: Mattmann: Fall 2014: DataViz Homework: <Your Lastname>: <Your Firstname>. So if your name was Lord Voldemort, you would submit an email to [email protected] with the subject “CSCI 572: Mattmann: Fall 2014: DataViz Homework: Voldemort: Lord” (no quotes).
• All source code is expected to be commented, to compile, and to run. If you created a web service, or if you have web framework code, then you should also include those source files that you added, if any. Do not submit *.class files. We will compile your program from submitted source.
• Also prepare a readme.txt containing any notes you’d like to submit.
• Do not include OODT radix and/or Solr’s deployment in your submission. We already have these.
• Please provide a link to the video illustrating your Map and the answers to the challenge questions. If you have your DataViz demo up and running on a public URL, please provide it.
• If you have used any external libraries other than D3, please note in your readme.txt a detailed explanation of how to use these libraries when evaluating your code.
• Save your report as a PDF file (Lastname_Firstname_DATAVIS.pdf) and include it in your submission.
• Compress all of the above into a single zip archive and name it according to the following filename convention:

<lastname>_<firstname>_CSCI572_HW_DATAVIS.zip
Use only standard zip format. Do not use other formats such as zipx, rar, ace, etc.
Important Note:
• Make sure that you have attached the file the when submitting. Failure to do so will be treated as non-submission.
• Successful submission will be indicated in the assignment’s submission history. We advise that you check to verify the timestamp, download and double check your zip file for good measure.
6.1 Late Assignment Policy
• -10% if submitted within the first 24 hours • -15% for each additional 24 hours or part thereof