Home range and seasonal movements of tis striata Black Sea...
16
82 Home range and seasonal movements of Black Sea Bass (Centropristis striata) during their inshore residency at a reef in the mid-Atlantic Bight Mary C. Fabrizio (contact author) 1 John P. Manderson 2 Jeffrey P. Pessutti 2 Email address for contact author: [email protected] 1 Virginia Institute of Marine Science College of William & Mary P.O. Box 1346 Gloucester Point, Virginia 23062 2 James J. Howard Marine Sciences Laboratory Northeast Fisheries Science Center National Marine Fisheries Service, NOAA 74 Magruder Road Highlands, New Jersey 07732 Manuscript submitted 21 January 2013. Manuscript accepted 11 December 2013. Fish. Bull 112:82–97 (2014). doi: 10.7755/FB.112.1.5 The views and opinions expressed or implied in this article are those of the author (or authors) and do not necesarily reflect the position of the National Marine Fisheries Service, NOAA. Abstract—Black Sea Bass (Centropris- tis striata) in the mid-Atlantic Bight undertake seasonal cross-shelf move- ments to occupy inshore rocky reefs and hardbottom habitats between spring and fall. Shelf-wide migrations of this stock are well documented, but movements and home ranges of fish during their inshore residency period have not been described. We tagged 122 Black Sea Bass with acoustic transmitters at a mid-Atlantic reef to estimate home-range size and factors that influence movements (>400 m) at a 46.1-km 2 study site between May and November 2003. Activity of Black Sea Bass was greatest and most consistent during summer but declined rapidly in September as water temperatures at the bottom of the seafloor increased on the inner shelf. Black Sea Bass main- tained relatively large home ranges that were fish-size invariant but highly variable (13.7–736.4 ha), underscoring the importance of large sample sizes in examination of population-level characteristics of mobile species with complex social interactions. On the basis of observed variations in move- ment patterns and the size of home ranges, we postulate the existence of groups of conspecifics that exhibit similar space-use behaviors. The group of males released earlier in the tagging period used larger home ranges than the group of males released later in our study. In addition, mean activity levels and the probability of movement among acoustic stations varied among groups of fish in a complex manner that depended on sex. These differ- ences in movement behaviors may in- crease the vulnerability of male fish to passive fishing gears, further exacer- bating variation in exploitation rates for this species among reefs. The vulnerability of marine and es- tuarine species to capture by recre- ational and commercial fisheries is enhanced when individuals aggre- gate during a predictable time of year. For example, the spring spawn- ing migrations of anadromous fishes, such as American Shad (Alosa sapi- dissima) and Striped Bass (Morone saxatilis), historically fueled produc- tive fisheries along the U.S. Atlantic coast (Limburg and Waldman, 2009). In the mid-Atlantic region, fishes that use inshore reefs as feeding and spawning areas between spring and fall also may increase their vulner- ability to fishing gear because in- dividuals are associated with well- defined habitat features that may be targeted by fishing operations. Management of species that ex- hibit aggregation behaviors often is dependent upon spatially explicit regulations that aim to protect differ- entially vulnerable individuals. For instance, the harvest of blue crabs is prohibited in the lower Chesapeake Bay and the adjacent coastal ocean from May through mid-September to protect spawning females (Miller et al., 2011 1 ). Similarly, marine protect- 1 Miller, T. J., M. J. Wilberg, A. R. Colton, G. R. Davis, A. Sharov, R. N. Lipcius, ed areas and reserves may be used to reduce or eliminate fishing mortal- ity on depleted stocks (e.g., the sea scallop fishery in the North Atlantic; Murawski et al., 2000). For such area closures and related spatial manage- ment approaches, many of the indi- viduals from the target population area are assumed to use protected areas and their movements away from these areas are assumed to be minimal and temporary. Therefore, to achieve management goals, protected areas or networks of reserves should be large enough to sufficiently en- compass the home ranges of individ- uals of the target populations (Mof- fitt et al., 2009). Home range and movements of mobile species can be assessed with acoustic telemetry (e.g., Dawson and Starr, 2009; Douglas et al., 2009; Meyer et al., 2009; Farmer and Ault, 2011; Knip et al., 2012). Although such techniques provide temporally G. M. Ralph, E. G. Johnson, and A. G. Kaufman. 2011. Stock assessment of the blue crab in Chesapeake Bay. Univ. Maryland Center for Environmental Sci- ence, Technical Report Series TS-614-11, 203 p. [Available at http://www.cio. noaa.gov/Policy_Programs/prplans/ ID180_Chesapeake_Blue_Crab_Assess- ment.document_final_approved.pdf.]
Transcript of Home range and seasonal movements of tis striata Black Sea...

82
Home range and seasonal movements ofBlack Sea Bass (Centropristis striata) during their inshore residency at a reef in the mid-Atlantic Bight
Mary C. Fabrizio (contact author)1
John P. Manderson2
Jeffrey P. Pessutti2
Email address for contact author: [email protected]
1 Virginia Institute of Marine Science College of William & Mary P.O. Box 1346 Gloucester Point, Virginia 230622 James J. Howard Marine Sciences Laboratory Northeast Fisheries Science Center National Marine Fisheries Service, NOAA 74 Magruder Road Highlands, New Jersey 07732
Manuscript submitted 21 January 2013.Manuscript accepted 11 December 2013.Fish. Bull 112:82–97 (2014).doi: 10.7755/FB.112.1.5
The views and opinions expressed orimplied in this article are those of the author (or authors) and do not necesarilyrefl ect the position of the National Marine Fisheries Service, NOAA.
Abstract—Black Sea Bass (Centropris-tis striata) in the mid-Atlantic Bight undertake seasonal cross-shelf move-ments to occupy inshore rocky reefs and hardbottom habitats between spring and fall. Shelf-wide migrations of this stock are well documented, but movements and home ranges of fish during their inshore residency period have not been described. We tagged 122 Black Sea Bass with acoustic transmitters at a mid-Atlantic reef to estimate home-range size and factors that influence movements (>400 m) at a 46.1-km2 study site between May and November 2003. Activity of Black Sea Bass was greatest and most consistent during summer but declined rapidly in September as water temperatures at the bottom of the seafloor increased on the inner shelf. Black Sea Bass main-tained relatively large home ranges that were fish-size invariant but highly variable (13.7–736.4 ha), underscoring the importance of large sample sizes in examination of population-level characteristics of mobile species with complex social interactions. On the basis of observed variations in move-ment patterns and the size of home ranges, we postulate the existence of groups of conspecifics that exhibit similar space-use behaviors. The group of males released earlier in the tagging period used larger home ranges than the group of males released later in our study. In addition, mean activity levels and the probability of movement among acoustic stations varied among groups of fish in a complex manner that depended on sex. These differ-ences in movement behaviors may in-crease the vulnerability of male fish to passive fishing gears, further exacer-bating variation in exploitation rates for this species among reefs.
The vulnerability of marine and es-tuarine species to capture by recre-ational and commercial fi sheries is enhanced when individuals aggre-gate during a predictable time of year. For example, the spring spawn-ing migrations of anadromous fi shes, such as American Shad (Alosa sapi-dissima) and Striped Bass (Morone saxatilis), historically fueled produc-tive fi sheries along the U.S. Atlantic coast (Limburg and Waldman, 2009). In the mid-Atlantic region, fishes that use inshore reefs as feeding and spawning areas between spring and fall also may increase their vulner-ability to fi shing gear because in-dividuals are associated with well-defi ned habitat features that may be targeted by fi shing operations.
Management of species that ex-hibit aggregation behaviors often is dependent upon spatially explicit regulations that aim to protect differ-entially vulnerable individuals. For instance, the harvest of blue crabs is prohibited in the lower Chesapeake Bay and the adjacent coastal ocean from May through mid-September to protect spawning females (Miller et al., 20111). Similarly, marine protect-
1 Miller, T. J., M. J. Wilberg, A. R. Colton, G. R. Davis, A. Sharov, R. N. Lipcius,
ed areas and reserves may be used to reduce or eliminate fi shing mortal-ity on depleted stocks (e.g., the sea scallop fi shery in the North Atlantic; Murawski et al., 2000). For such area closures and related spatial manage-ment approaches, many of the indi-viduals from the target population area are assumed to use protected areas and their movements away from these areas are assumed to be minimal and temporary. Therefore, to achieve management goals, protected areas or networks of reserves should be large enough to suffi ciently en-compass the home ranges of individ-uals of the target populations (Mof-fi tt et al., 2009).
Home range and movements of mobile species can be assessed with acoustic telemetry (e.g., Dawson and Starr, 2009; Douglas et al., 2009; Meyer et al., 2009; Farmer and Ault, 2011; Knip et al., 2012). Although such techniques provide temporally
G. M. Ralph, E. G. Johnson, and A. G. Kaufman. 2011. Stock assessment of the blue crab in Chesapeake Bay. Univ. Maryland Center for Environmental Sci-ence, Technical Report Series TS-614-11, 203 p. [Available at http://www.cio.noaa.gov/Policy_Programs/prplans/ID180_Chesapeake_Blue_Crab_Assess-ment.document_fi nal_approved.pdf.]
Fabrizio et al.: Home range and seasonal movements of Centropristis striata 83
intensive information, many acoustic studies of the home ranges of fi shes have been conducted on rela-tively small spatial scales (hundreds of meters to a few kilometers) or during brief periods of time (days to weeks) with few fi sh (typically 15 or less). These spatial and temporal scales of study may be suffi cient for elucidating the size of the home range of relatively sedentary fi shes that inhabit restricted areas, such as coral reefs. However, recent work indicates that esti-mates of home range may be larger when habitat use of a target fi sh is monitored over larger spatial scales and over longer time periods (Farmer and Ault, 2011). Furthermore, because movement behaviors may vary among individuals, large sample sizes could improve our understanding of the size of the home range for a given species.
Predictable seasonal aggregations of Black Sea Bass (Centropristis striata) occur in nearshore areas of the mid-Atlantic region. Between spring and fall, popula-tions of this species are exploited by recreational hook-and-line fi sheries, as well as by commercial pot fi sher-ies (Shepherd and Terceiro, 1994). The Black Sea Bass is a demersal species in the family Serranidae, and in-dividuals are commonly found to associate with hard-bottom structures, such as reefs, rock outcroppings, and wrecks (Steimle and Zetlin, 2000; Fabrizio et al., 2013). Along the Atlantic coast, individual fi sh undertake an-nual migrations to the middle- and outer-continental shelf during winter (Musick and Mercer, 1977; Moser and Shepherd, 2009); in the spring, Black Sea Bass mi-grate inshore, often returning to areas occupied in the previous year (Moser and Shepherd, 2009). Timing of these seasonal cross-shelf migrations varies with lati-tude, but fi sh movements are believed to be in response to changes in water temperature at the bottom of the seafl oor and in photoperiod (Moser and Shepherd, 2009; Fabrizio et al., 2013). Black Sea Bass are protogynous hermaphrodites, and larger fi sh (>450 mm total length [TL]) tend to be predominantly male (NEFSC2). During the spawning season, mature (dominant) males can be identifi ed by a bright blue hump on the nape. However, external morphological differentiation among subordi-nate males, transitional males, and females is not pos-sible for this species (NEFSC2). Because harvests are directed at larger fi sh (>250 mm TL), mature males tend to experience higher fi shing-induced mortality rates than females and less developed males.
Spatial regulations are not used currently to man-age Black Sea Bass, but a coastwide tagging study has indicated that exploitation rates among individual reefs in the mid-Atlantic region may be highly vari-able (NEFSC3). Furthermore, because Black Sea Bass
2 NEFSC (Northeast Fisheries Science Center). 2012. 53rd northeast regional stock assessment workshop (53rdSAW) assessment report. Northeast Fish. Sci. Cent. Ref. Doc. 12-05, 559 p. [Available from National Marine Fisheries Ser-vice, 166 Water St., Woods Hole, MA 02543-1026.
3 NEFSC (Northeast Fisheries Science Center). 2004. 39th northeast regional stock assessment workshop (39th SAW) as-
spawn in summer while resident at these reefs (Mu-sick and Mercer, 1977), the effect of localized fi shing on the future production of this stock is unknown. Moser and Shepherd (2009) indicate that the individuals of the mid-Atlantic stock off the coast of New Jersey are fairly sedentary while resident in inshore waters; be-cause they inferred these movements from a conven-tional tagging study, movements that occurred between the time of capture and subsequent recapture could not be discerned. Data from conventional tagging studies cannot be used to resolve movements at fi ne temporal scales (e.g., hours to days), although it is known that many fi shes display regular activity patterns that may change seasonally (Reebs, 2002).
In this study, we used acoustic tagging to investi-gate the home range and seasonal movements of Black Sea Bass during their inshore residency at a temperate reef in the mid-Atlantic Bight. We examined the effect of fi sh size, sex, and duration of occupancy on size of home ranges, and we explored the effects of sex and time on movement and activity levels of individual fi sh. We considered a range of temporal scales, from diel to those occurring over several months, to describe move-ments of fi sh on the reef.
Materials and methods
Study site and acoustic grid
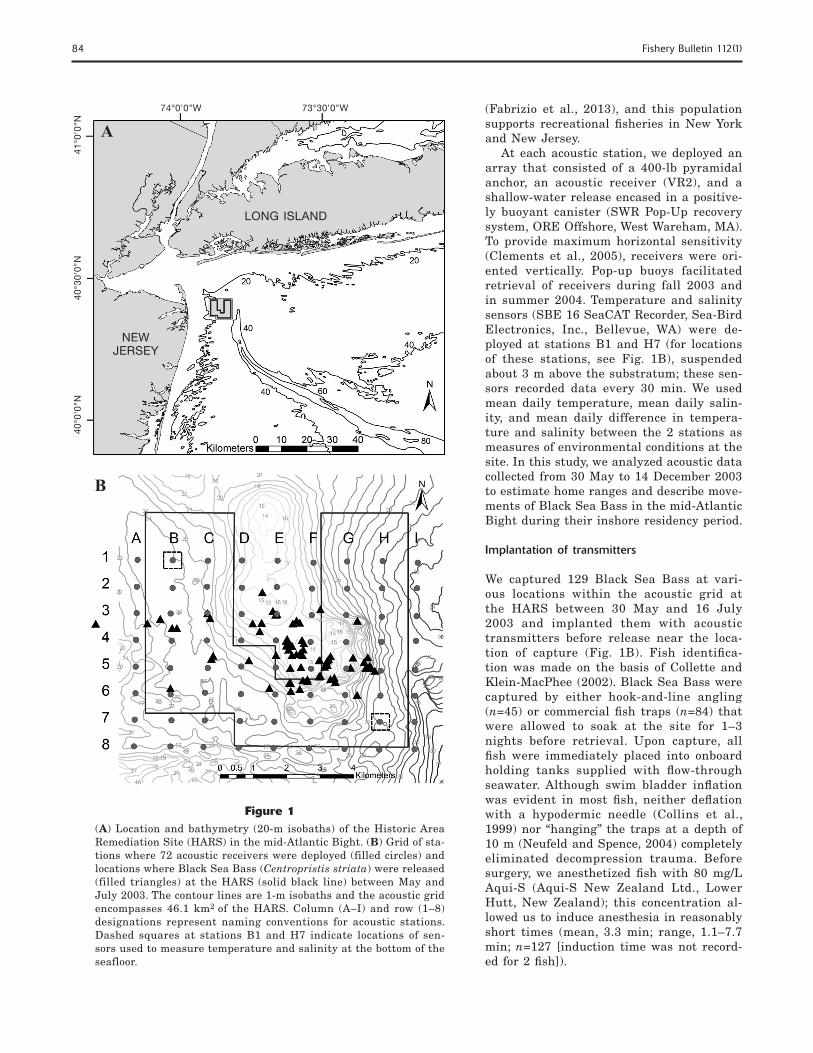
We established a 46.1-km2 grid that consisted of 72 moored receivers (model VR2, Vemco, Ltd.,4 Bedford, Nova Scotia, Canada) at 72 acoustic stations within a study site about 6.5 km off the coast of New Jersey (Fig. 1, A and B). In April 2003, adjacent receivers were placed 800 m apart because a range test conducted ear-lier at this site indicated that the effective detection range of deployed receivers was about 400 m (Fabrizio et al., 2013). Sediments at this site ranged from fi ne-grain mud to coarse-grain material, such as sand, grav-el, and rocks (Lathrop et al., 2006); rock outcrops were observed near the center of this site (Butman5). His-torically, this area comprised a number of “dump sites” used to dispose of dredged materials from the Port of New York and New Jersey, as well as of construction material and other refuse. In 1997, the 53.8-km2 area that surrounds the old dump sites was designated a Historic Area Remediation Site (HARS). This site is used by Black Sea Bass during their inshore residency
sessment summary report. Northeast Fish. Sci. Cent. Ref. Doc. 04-10a, 16 p. [Available from National Marine Fisher-ies Service, 166 Water St., Woods Hole, MA 02543-1026.]
4 Mention of trade names or commercial companies is for iden-tifi cation purposes only and does not imply endorsement by the National Marine Fisheries Service, NOAA.
5 Butman, B. 2002. Mapping the seafloor of the Historic Area Remediation Site (HARS) offshore of New York City. U.S. Geological Survey Fact Sheet 001-02, 4 p. [Available at http://pubs.usgs.gov/fs/2002/fs001-02/fs001-02.pdf.]
84 Fishery Bulletin 112(1)
Figure 1(A) Location and bathymetry (20-m isobaths) of the Historic Area Remediation Site (HARS) in the mid-Atlantic Bight. (B) Grid of sta-tions where 72 acoustic receivers were deployed (filled circles) and locations where Black Sea Bass (Centropristis striata) were released (filled triangles) at the HARS (solid black line) between May and July 2003. The contour lines are 1-m isobaths and the acoustic grid encompasses 46.1 km2 of the HARS. Column (A–I) and row (1–8) designations represent naming conventions for acoustic stations. Dashed squares at stations B1 and H7 indicate locations of sen-sors used to measure temperature and salinity at the bottom of the seafloor.
A
B
40°0
'0"N
74°0'0"W 73°30'0"W
41°0
'0"N
40°3
0'0"
N
(Fabrizio et al., 2013), and this population supports recreational fi sheries in New York and New Jersey.
At each acoustic station, we deployed an array that consisted of a 400-lb pyramidal anchor, an acoustic receiver (VR2), and a shallow-water release encased in a positive-ly buoyant canister (SWR Pop-Up recovery system, ORE Offshore, West Wareham, MA). To provide maximum horizontal sensitivity (Clements et al., 2005), receivers were ori-ented vertically. Pop-up buoys facilitated retrieval of receivers during fall 2003 and in summer 2004. Temperature and salinity sensors (SBE 16 SeaCAT Recorder, Sea-Bird Electronics, Inc., Bellevue, WA) were de-ployed at stations B1 and H7 (for locations of these stations, see Fig. 1B), suspended about 3 m above the substratum; these sen-sors recorded data every 30 min. We used mean daily temperature, mean daily salin-ity, and mean daily difference in tempera-ture and salinity between the 2 stations as measures of environmental conditions at the site. In this study, we analyzed acoustic data collected from 30 May to 14 December 2003 to estimate home ranges and describe move-ments of Black Sea Bass in the mid-Atlantic Bight during their inshore residency period.
Implantation of transmitters
We captured 129 Black Sea Bass at vari-ous locations within the acoustic grid at the HARS between 30 May and 16 July 2003 and implanted them with acoustic transmitters before release near the loca-tion of capture (Fig. 1B). Fish identifi ca-tion was made on the basis of Collette and Klein-MacPhee (2002). Black Sea Bass were captured by either hook-and-line angling (n=45) or commercial fi sh traps (n=84) that were allowed to soak at the site for 1–3 nights before retrieval. Upon capture, all fi sh were immediately placed into onboard holding tanks supplied with fl ow-through seawater. Although swim bladder infl ation was evident in most fi sh, neither defl ation with a hypodermic needle (Collins et al., 1999) nor “hanging” the traps at a depth of 10 m (Neufeld and Spence, 2004) completely eliminated decompression trauma. Before surgery, we anesthetized fi sh with 80 mg/L Aqui-S (Aqui-S New Zealand Ltd., Lower Hutt, New Zealand); this concentration al-lowed us to induce anesthesia in reasonably short times (mean, 3.3 min; range, 1.1–7.7 min; n=127 [induction time was not record-ed for 2 fi sh]).
LONG ISLAND
NEWJERSEY
Fabrizio et al.: Home range and seasonal movements of Centropristis striata 85
Transmitters (V8SC-2H, Vemco, Ltd., Bedford, Nova Scotia, Canada) were implanted in 129 anesthetized Black Sea Bass (mean size, 307 mm TL; range, 220–431 mm TL; n=129) at the study site using surgical techniques described in Fabrizio and Pessutti (2007). Dummy transmitters of the same size (30 mm long and 9 mm in diameter), shape, and weight (5 g in air, 3.1 g in water) had 100% retention rates in laboratory-held Black Sea Bass (Fabrizio and Pessutti, 2007). Trans-mitters emitted a coded acoustic signal at 69 kHz ev-ery 210 s on average (signal delay varied randomly be-tween 120 and 300 s) and had a battery life of 384 d. Surgery time averaged 4.1 min (range, 2.0–11.7 min; n=128 [surgery time not recorded for 1 fi sh]); immedi-ately after surgery, the length and sex of each fi sh was recorded. Sex determination was limited to classifi ca-tion of fi sh as either male (n=34) or fi sh of unknown sex (n=88); the latter group included females, subordi-nate males, and transitional males.
Sizes of the 2 groups overlapped: males ranged be-tween 270 and 431 mm TL, with a mean of 343.5 mm TL (+standard error of the mean [SE] 6.32) and fi sh of unknown sex ranged between 220 and 395 mm TL, with a mean of 292.6 mm TL (SE 4.50). We used ram ventilation to resuscitate fi sh in a fl ow-through seawa-ter tank onboard the vessel and released fi sh within the study site as soon as fi sh were able to swim force-fully downward. All procedures were conducted at a mean temperature of 17.8°C (range: 13.6–24.2°C) and 27.1 psu salinity (range: 22.1–31.0 psu). Of the 129 im-planted fi sh, 5 carried transmitters that malfunctioned and 2 fi sh died within hours of release, resulting in 122 live Black Sea Bass with functioning transmitters.
Home range
Home-range area, measured in hectares (ha), was cal-culated for individual Black Sea Bass with the kernel density estimator. Kernel methods provide a probabi-listic description of the space used by an organism and require a smoothing parameter to effi ciently describe the density distribution of the individual location data (Worton, 1989). We used the bivariate normal distribu-tion to estimate kernel home ranges with the adehabi-tat package in R (R Development Core Team, 2005; Ca-lenge, 2006). For each fi sh, we eliminated observations from the release date to exclude data from the period during which fi sh may have been recovering from sur-gery and excluded data from the last week of occupan-cy at the site to ensure that we considered only those fi sh that were clearly not in the process of dispersing from the study site (Fabrizio et al., 2013); as a result, 109 fi sh were retained for analysis of home range.
We used the 85% probability polygon to defi ne home-range area and investigated the effect of sex on home range through the use of an analysis of covariance with fi sh size, duration of occupancy (days), and release date as covariates. Duration of occupancy was estimated on the basis of the total number of days that the fi sh was
detected within the study site, and this estimate is likely a conservative one. In particular, fi sh captured, tagged, and released at the end of the tagging period may have previously occupied the site.
Release date was considered in the model because preliminary investigations revealed potentially sig-nifi cant variation in home-range size associated with this factor. The model, which contained only fi xed ef-fects, was fi tted using the MIXED procedure in SAS (vers. 9.3, SAS Institute, Inc., Cary, NC), and model parameters were estimated with restricted maximum likelihood (REML) (Littell et al., 2002). Examination of residuals from an initial model run indicated heteroge-neity of variance in the home-range data; we, therefore, loge-transformed home ranges and verifi ed that residu-als from this model supported the assumption of homo-geneity of variance. To test the assumption of equality of slopes for males and fi sh of unknown sex, we fi tted a model that included all possible 2-way interactions with sex (sex×duration of occupancy, sex×length, and sex×release date):
Yijk = μ +δ + γ +α i + β j + αδ( )i + αγ( )i + αβ( )ij + εijk ,
where Yijk = the natural log of the home range for the kth fi sh of the ith sex released on the jth date;
µ = the intercept; δ = the effect of duration of occupancy (days); γ = the effect of fi sh size; αi = the effect of the ith sex; βj = the effect of the jth release date; and εijk = the random unexplained error.
Indices of movement
To gauge movement of fi sh, we developed 2 indices. The binomial movement index allowed us to investigate factors associated with movement (e.g., are fi sh more likely to move during the night?), whereas the continu-ous activity index provided information on the extent of movements (e.g., how does activity level change in response to temperature?). The movement index indi-cated whether fi sh moved between adjacent acoustic stations during a given 3-h interval on a given day; this index was coded “0” (no movement) or “1.”
To minimize autocorrelations among hourly observa-tions, we considered location data during 4 time peri-ods of each day: dawn, day, dusk, and night. Dawn and dusk periods were defi ned as the 3 hours centered on the beginning and end of nautical twilight (U.S. Naval Observatory, http://aa.usno.navy.mil/faq/docs/RST_defs.php); day and night were defi ned as the 3-h periods midway between dawn and dusk or dusk and dawn. The movement index for each time period was calcu-lated daily for each fi sh between the time of tagging and 19 November 2003; after this date, fewer than 3 fi sh were detected in a given time period. In this man-ner, 24,789 observations from 121 fi sh were available
86 Fishery Bulletin 112(1)
for analysis (one fi sh was detected at the study site for <3 h and was, therefore, excluded from analysis).
The activity index was defi ned as the average num-ber of times a fi sh moved between adjacent acoustic stations per hour during a given 3-h time period (dawn, day, dusk, and night). This index was calculated for fi sh that moved at least once in a 3-h period, and values for this index ranged between 0.33 and 9. Like the move-ment index, the activity index indicated movements on the scale of about 400 m. Activity indices were calcu-lated for each time period between the time of tagging and 6 November 2003 because observations on activity levels were not temporally consecutive after this date. As before, 121 fi sh contributed information; 11,843 ob-servations were available for this index.
Analysis of movement
We used a generalized linear model to examine diel and seasonal patterns in fi sh movement and to esti-mate the probability that a fi sh moved as a function of sex, water temperature at the bottom of the seafl oor, and salinity at the bottom of the seafl oor. We did not consider effects of fi sh size because preliminary inves-tigations indicated that movement did not vary with size. Time entered the model as continuous linear, quadratic, and cubic effects and corresponded to cal-endar day (i.e., time=1 on 30 May, and time=174 on 19 November). Quadratic time effects allow the direc-tion of the response to change once (e.g., the response increases, reaches a maximum, and then decreases); cubic time effects are required when the direction of the response changes twice. All time factors were stan-dardized to remove effects of collinearity; centering the data was not effective. The effects of season (summer [30 May–7 Sep] or fall [8 Sep–19 Nov]) and time period (dawn, day, dusk, and night) also were considered.
In addition to these multiscale temporal effects, we examined the effect of release group (defi ned according to tagging date: early June, late June, or July) because preliminary modeling indicated heterogeneity of move-ments for fi sh tagged at different times. Environmental effects were characterized by water temperature and salinity measured at the bottom of the seafl oor at the study site. Specifi cally, we used mean bottom water temperature at station B1 and differences in mean wa-ter temperature and salinity at the bottom of the sea-fl oor between stations H7 and B1; these measures were estimated for each day of the study and standardized by scaling the data with the standard deviation. These environmental factors were selected because tolerance estimates for other measures (e.g., mean temperature at station H7) indicated strong collinearity with time (tolerance values <0.10) that could not be removed through standardization or centering (Quinn and Ke-ough, 2002).
Because movement indices (0, 1) were recorded daily for each fi sh during 4 time periods, we analyzed these data with a repeated-measures approach to address
the potential correlation among observations from each fi sh. Furthermore, we identifi ed individual fi sh nested within a time period as the subject for modeling the repeated measures. We fi tted the following generalized linear model to the data:
Yjklmn = μ + β j +δk + γ l + λm + τn + τn2 + τn
3 +φ +κ +α
+ interactions,
where Yjklmn = the binomial movement index of the ith fi sh of the jth sex of the kth tagging group in the lth season in the mth time period for the nth day (time);
μ = the expected response (either 0 or 1); bj = the effect of the jth sex; δk = the effect of the kth tagging group; γl = the effect of the lth season; λm = the effect of the mth time period;
τn, τn2, and τn
3 = the linear, quadratic, and
cubic effects of the nth day; φ = the effect of mean daily temperature at
station B1; κ = the effect of the mean temperature differ-
ence between stations B1 and H7; α = the effect of the mean difference in salin-
ity between stations B1 and H7; andinteractions refers to 2- and 3-way interactions between the fi xed effects.
We did not include higher-order interactions in the generalized linear model because such complexity was either unnecessary or severely reduced the precision of the estimated parameters. In this model, Yjklmn was assumed to be distributed as a binomial. The general-ized estimating equation (GEE) method was used to estimate model parameters (Liang and Zeger, 1986; Littell et al., 2002) with the GENMOD procedure in SAS (vers. 9.3).
We evaluated several covariance structures to de-scribe the potential correlation among the binomial re-sponses: independent, compound symmetry, autoregres-sive with lag 1, and m-dependent (SAS User’s Guide, vers. 9.3). For the m-dependent structure, correlations varied with the fi rst m-time intervals, but were equal to 0 after the mth interval. Because we fi tted a number of potential models, we used the information-theoretic approach to identify the most suitable model from the set of models that we considered (Burnham and An-derson, 2002).
Typically, Akaike’s information criterion (AIC) is calculated from model likelihoods, and differences in model values of AIC are used to guide model selection; the model with the lowest criterion is considered best. However, GEE methods do not use likelihoods to com-pute model parameters; instead, quasi-likelihoods are used. For GEE models, the quasi-likelihood information criterion (QIC), which is a modifi cation of the AIC, was used to select the covariance structure that best fi ts the data and to guide model selection (Pan, 2004). In
Fabrizio et al.: Home range and seasonal movements of Centropristis striata 87
keeping with this approach, we do not report P-values here but instead interpret the “importance” of factors on the basis of their contribution to the model.
Analysis of activity
We similarly modeled the effect of sex, time, release group, and environmental factors on the mean activ-ity index of those fi sh that exhibited movement, but here we used a general linear mixed model (GLMM) fi tted with the MIXED procedure in SAS (vers. 9.3; Lit-tell et al., 2002). To meet the homogeneity-of-variance assumption, the activity index was loge transformed. Individual fi sh were treated as a random factor in the model, allowing us to estimate variation among indi-viduals. As before, we modeled the effects of the fol-lowing fi xed factors on the activity of fi sh: continuous linear, quadratic, and cubic time (standardized to elim-inate collinearity), time period (dawn, day, dusk, and night), sex, season, release group, mean water tempera-ture at station B1, and mean temperature and salinity differences between stations H7 and B1 (standardized). A repeated-measures approach was used here as well, with fi sh nested within time period as the subject. We used the following repeated-measures mixed model to fi t the data:
Yi(m)jkln = μ +α i(m) + β j +δk + γ l + λm + τn + τn2 + τn
3 +φ +κ
+ α + interactions + εi(m)jklmn,
where Yj(m)jkln = the activity index of the ith fi sh of the jth sex of the kth tagging group in the lth season nested in the mth time period of the nth day (time);
μ = the expected activity index; αi(m) = the random effect of the ith fi sh nested
in the mth time period; interactions refers to 2- and 3-way interactions between the fi xed effects;
εi(m)jklmn = the random unexplained error; and other terms are as defi ned before.
We considered 2- and 3-way interactions in this model because such interactions greatly reduced the AIC; however, inclusion of more than two 3-way inter-actions or higher-order interactions resulted in severe loss of precision, and such models were abandoned. With the GLMM, we assumed that the response and the random error are normally distributed and that the variance of the response is homogeneous across the lev-els of the factors included in the model. We modeled heterogeneity in the covariance structure among dawn, day, dusk, and night in the GLMM through the use of the group option in the MIXED procedure and speci-fi ed the Kenward-Roger method for calculating degrees of freedom (Kenward and Roger, 1997). Model building followed the approach in Zuur et al. (2007) and Bolker et al. (2008): the random structure of the model (i.e., the appropriate variance-covariance structure and the
importance of the random factor) was identifi ed with REML-based estimates of AIC. Compound symmetry, autoregressive with lag 1, autoregressive moving aver-age with lag 1, and power covariance structures (Lit-tell et al., 2006) were used to model the correlations among the repeated responses. Next, using the random structure identifi ed in the previous step, we calculated AIC values for models that contained different fi xed effects, using maximum likelihood; those interactions that reduced AIC values were considered important and retained. Finally, REML was used to compute the fi nal model parameters.
Results
Acoustic data were obtained from 70 of the 72 deployed receivers and most detections occurred during the sum-mer (from 30 May to 7 September; B4 and I2 were not recovered). After September 2003, we had reduced acoustic coverage of the study area because we were unable to retrieve 12 receivers in 2004; most of these receivers were located in areas that were infrequently occupied by Black Sea Bass (Fabrizio et al., 2013). Be-tween 30 May and 14 December 2003, when the last de-tection was recorded at the site, we obtained 1,252,573 detections. Some of these detections were removed from consideration because they were redundant, occurring at the same time on adjacent receivers. Single detec-tions, which may have resulted from acoustic or envi-ronmental interference, and occurrences of less than 5 detections during a 24-h period were also removed,6 as were detections from unknown transmitters. Home-range and seasonal movement analyses were based on the resulting set of 1,007,787 detections.
Home range of Black Sea Bass during inshore residency
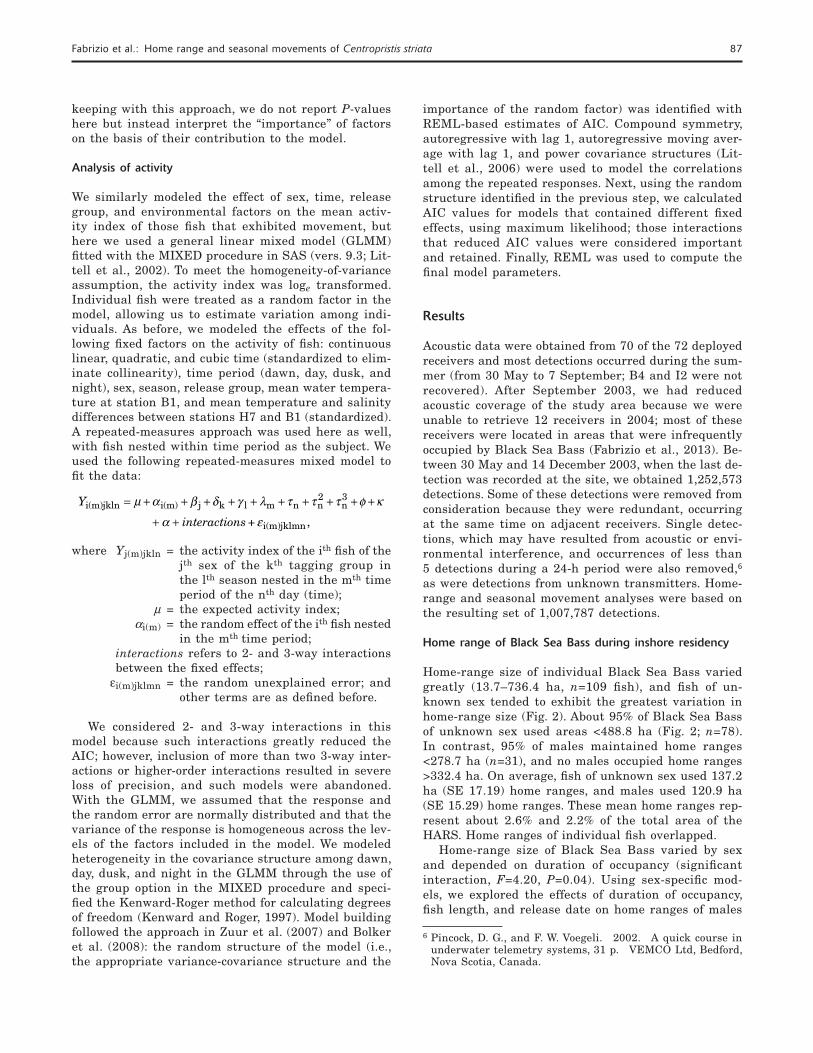
Home-range size of individual Black Sea Bass varied greatly (13.7–736.4 ha, n=109 fi sh), and fi sh of un-known sex tended to exhibit the greatest variation in home-range size (Fig. 2). About 95% of Black Sea Bass of unknown sex used areas <488.8 ha (Fig. 2; n=78). In contrast, 95% of males maintained home ranges <278.7 ha (n=31), and no males occupied home ranges >332.4 ha. On average, fi sh of unknown sex used 137.2 ha (SE 17.19) home ranges, and males used 120.9 ha (SE 15.29) home ranges. These mean home ranges rep-resent about 2.6% and 2.2% of the total area of the HARS. Home ranges of individual fi sh overlapped.
Home-range size of Black Sea Bass varied by sex and depended on duration of occupancy (signifi cant interaction, F=4.20, P=0.04). Using sex-specifi c mod-els, we explored the effects of duration of occupancy, fi sh length, and release date on home ranges of males
6 Pincock, D. G., and F. W. Voegeli. 2002. A quick course in underwater telemetry systems, 31 p. VEMCO Ltd, Bedford, Nova Scotia, Canada.
88 Fishery Bulletin 112(1)
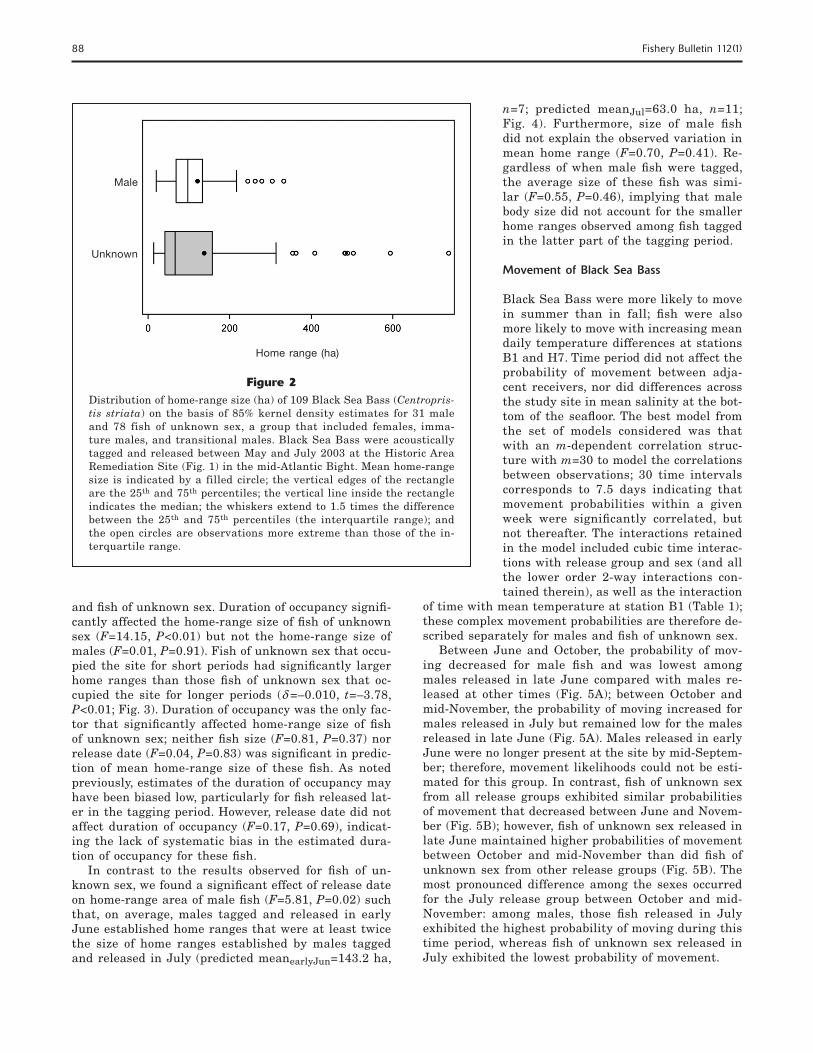
and fi sh of unknown sex. Duration of occupancy signifi -cantly affected the home-range size of fi sh of unknown sex (F=14.15, P<0.01) but not the home-range size of males (F=0.01, P=0.91). Fish of unknown sex that occu-pied the site for short periods had signifi cantly larger home ranges than those fi sh of unknown sex that oc-cupied the site for longer periods (δ =–0.010, t=–3.78, P<0.01; Fig. 3). Duration of occupancy was the only fac-tor that signifi cantly affected home-range size of fi sh of unknown sex; neither fi sh size (F=0.81, P=0.37) nor release date (F=0.04, P=0.83) was signifi cant in predic-tion of mean home-range size of these fi sh. As noted previously, estimates of the duration of occupancy may have been biased low, particularly for fi sh released lat-er in the tagging period. However, release date did not affect duration of occupancy (F=0.17, P=0.69), indicat-ing the lack of systematic bias in the estimated dura-tion of occupancy for these fi sh.
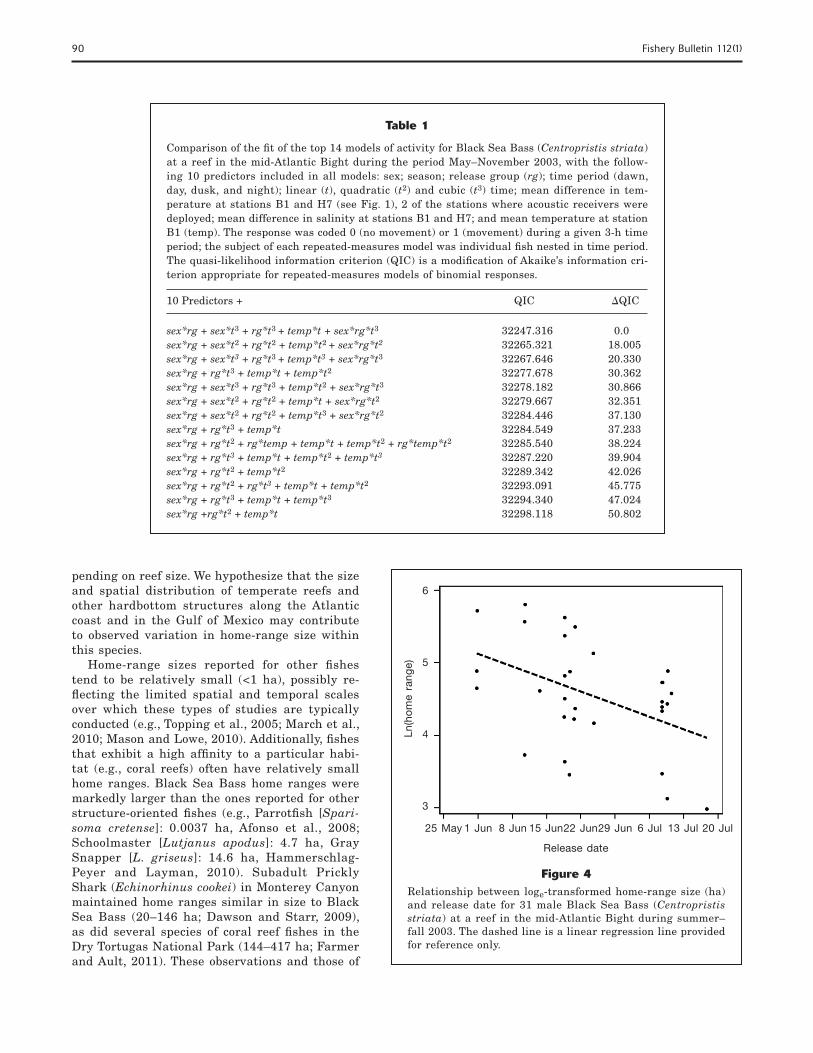
In contrast to the results observed for fi sh of un-known sex, we found a signifi cant effect of release date on home-range area of male fi sh (F=5.81, P=0.02) such that, on average, males tagged and released in early June established home ranges that were at least twice the size of home ranges established by males tagged and released in July (predicted meanearlyJun=143.2 ha,
n=7; predicted meanJul=63.0 ha, n=11; Fig. 4). Furthermore, size of male fi sh did not explain the observed variation in mean home range (F=0.70, P=0.41). Re-gardless of when male fi sh were tagged, the average size of these fi sh was simi-lar (F=0.55, P=0.46), implying that male body size did not account for the smaller home ranges observed among fi sh tagged in the latter part of the tagging period.
Movement of Black Sea Bass
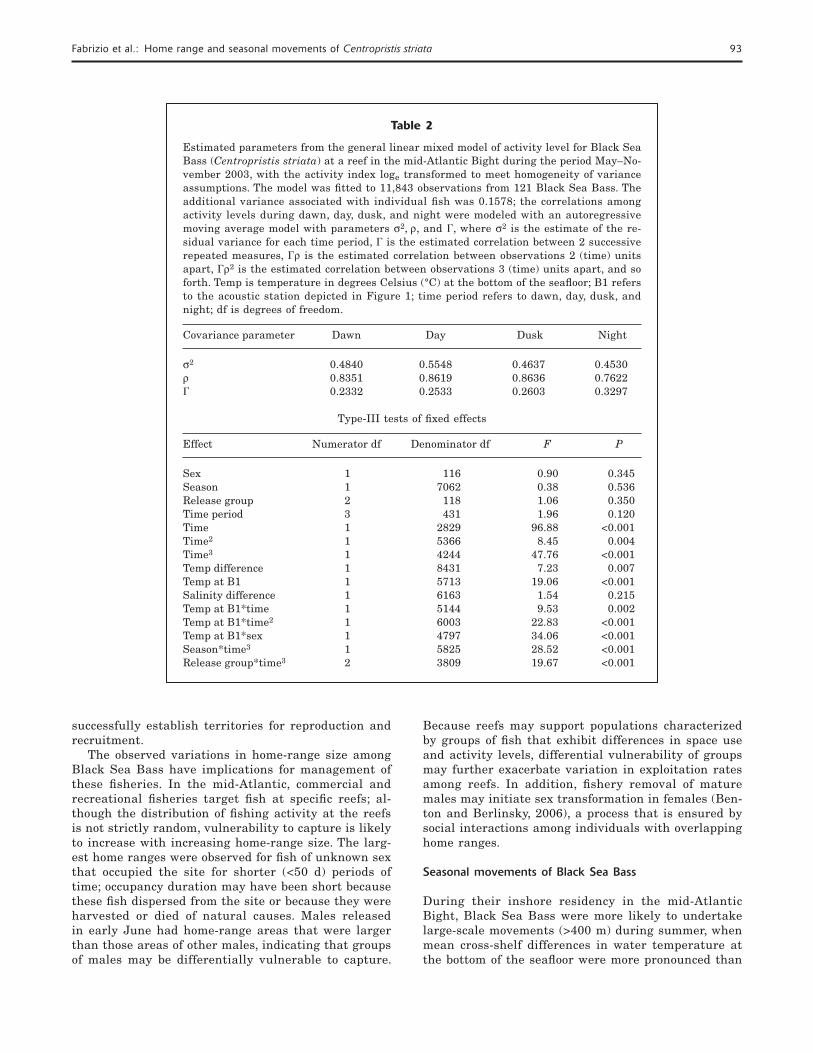
Black Sea Bass were more likely to move in summer than in fall; fi sh were also more likely to move with increasing mean daily temperature differences at stations B1 and H7. Time period did not affect the probability of movement between adja-cent receivers, nor did differences across the study site in mean salinity at the bot-tom of the seafl oor. The best model from the set of models considered was that with an m-dependent correlation struc-ture with m=30 to model the correlations between observations; 30 time intervals corresponds to 7.5 days indicating that movement probabilities within a given week were signifi cantly correlated, but not thereafter. The interactions retained in the model included cubic time interac-tions with release group and sex (and all the lower order 2-way interactions con-tained therein), as well as the interaction
of time with mean temperature at station B1 (Table 1); these complex movement probabilities are therefore de-scribed separately for males and fi sh of unknown sex.
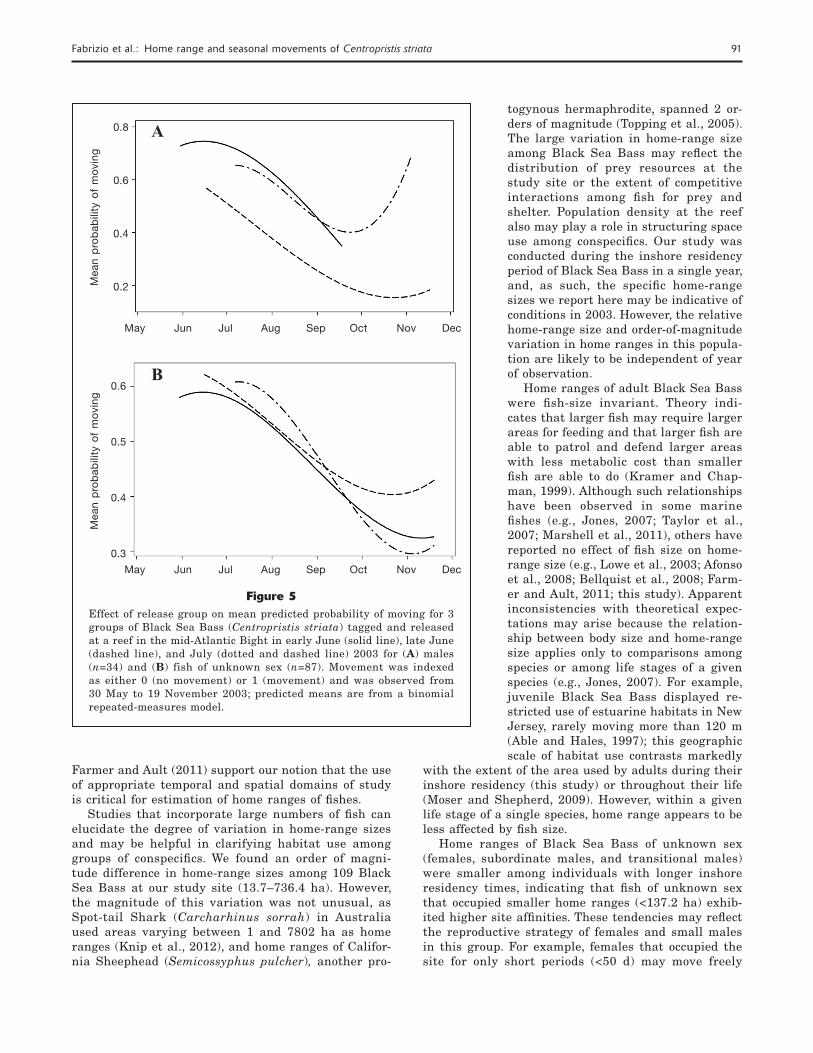
Between June and October, the probability of mov-ing decreased for male fi sh and was lowest among males released in late June compared with males re-leased at other times (Fig. 5A); between October and mid-November, the probability of moving increased for males released in July but remained low for the males released in late June (Fig. 5A). Males released in early June were no longer present at the site by mid-Septem-ber; therefore, movement likelihoods could not be esti-mated for this group. In contrast, fi sh of unknown sex from all release groups exhibited similar probabilities of movement that decreased between June and Novem-ber (Fig. 5B); however, fi sh of unknown sex released in late June maintained higher probabilities of movement between October and mid-November than did fi sh of unknown sex from other release groups (Fig. 5B). The most pronounced difference among the sexes occurred for the July release group between October and mid-November: among males, those fi sh released in July exhibited the highest probability of moving during this time period, whereas fi sh of unknown sex released in July exhibited the lowest probability of movement.
Figure 2Distribution of home-range size (ha) of 109 Black Sea Bass (Centropris-tis striata) on the basis of 85% kernel density estimates for 31 male and 78 fish of unknown sex, a group that included females, imma-ture males, and transitional males. Black Sea Bass were acoustically tagged and released between May and July 2003 at the Historic Area Remediation Site (Fig. 1) in the mid-Atlantic Bight. Mean home-range size is indicated by a filled circle; the vertical edges of the rectangle are the 25th and 75th percentiles; the vertical line inside the rectangle indicates the median; the whiskers extend to 1.5 times the difference between the 25th and 75th percentiles (the interquartile range); and the open circles are observations more extreme than those of the in-terquartile range.
Male
Unknown
Home range (ha)
Fabrizio et al.: Home range and seasonal movements of Centropristis striata 89
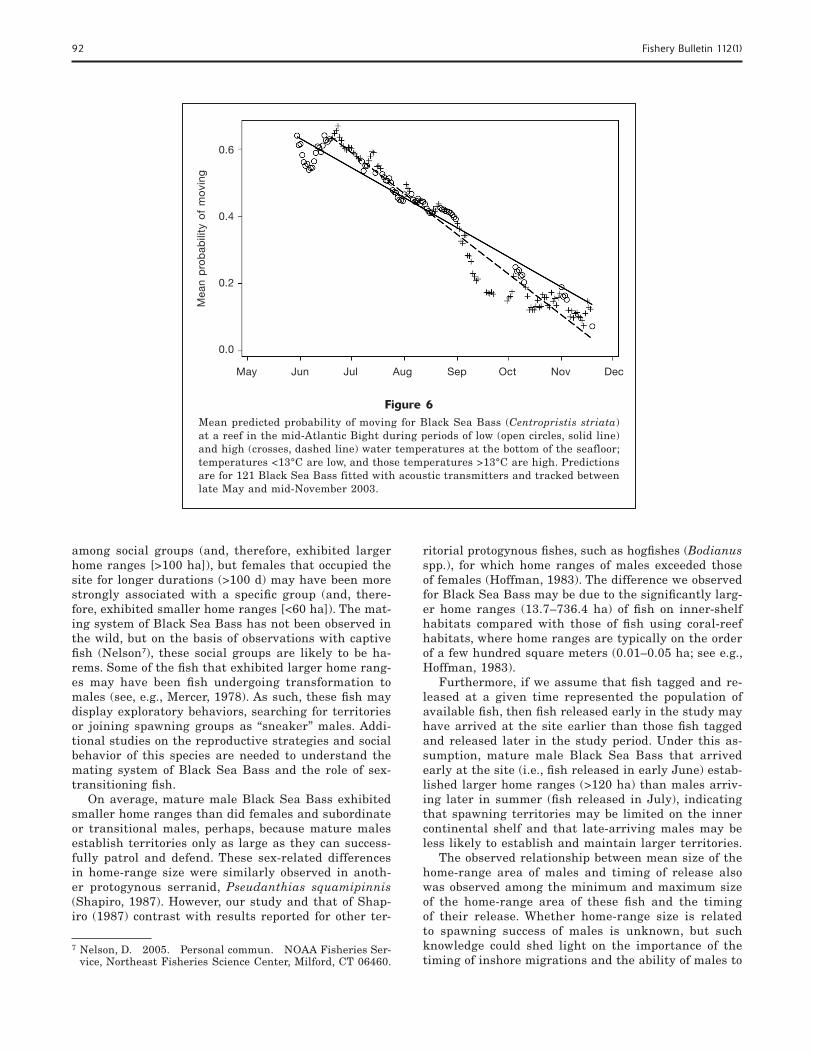
Linear changes in the probability of moving varied with water temperature at the bottom of the seafl oor at station B1; the linear decline in the likelihood of mov-ing was more rapid at higher water temperatures (i.e., temperatures exceeding 13°C; Fig. 6). These higher temperatures were observed at the site primarily dur-ing September. Generally, average water temperatures in fall exceeded those temperatures observed in sum-mer: mean temperature at the bottom of the seafl oor at station B1 was 15.58°C (SE 0.05) in fall and 12.60°C (SE=0.03) in summer.
Activity of Black Sea Bass
For fi sh that did move, the random structure of the data for the continuous activity index was best described by including the variation associated with individual fi sh in the GLMM and by modeling the correlations among observed movements across time periods and days with an autoregressive moving average structure (with lag 1). The difference in AIC between models with and without the random fi sh factor exceeded 390, indicat-ing that an important portion of the variation in the observed continuous activity index was associated with individual fi sh. Variation among individuals in activity levels accounted for 22–26% of the random variation observed during any given time period (Table 2).
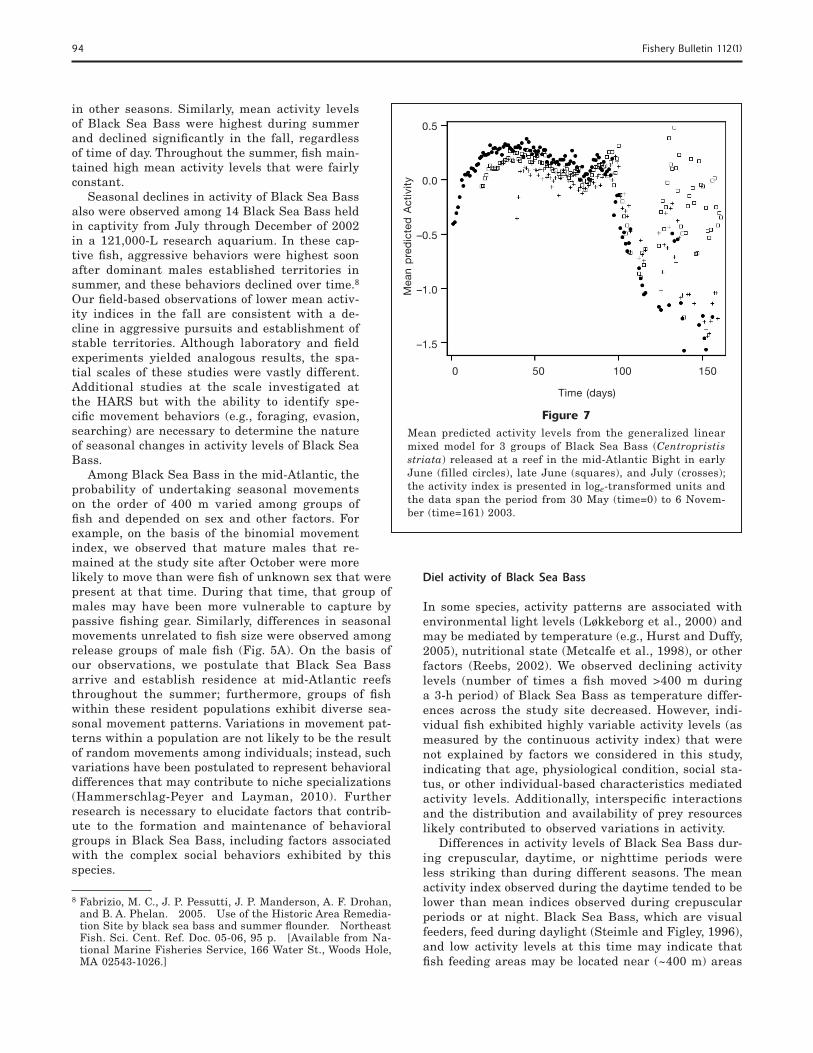
As we found when modeling the binomial probability of movement, activity levels of fi sh measured by the continuous activity index var-ied with season, time, release group, sex, and water temperature at the bottom of the seafl oor at the study site (Table 2). Activity of Black Sea Bass decreased with decreasing differences in mean temperature across the site from summer through fall; however, the remaining main effects could not be interpreted directly because of the presence of multiple 2-way interactions (Table 2). Cubic time effects on activity of Black Sea Bass varied by season and with release group (Fig. 7) such that, during summer, fi sh released in early June were consistently more active than were fi sh released in late June or July. The mean pre-dicted activity index exhibited less variation dur-ing summer than during fall (Fig. 7); in summer, activity levels seemed fairly constant, until about late August (day 90 in Fig. 7), when activity lev-els declined rapidly. Subsequently, activity levels of fi sh were highly variable and depended on re-lease group: fi sh released in late June were more active in fall than were those fi sh released earlier or later (Fig. 7).
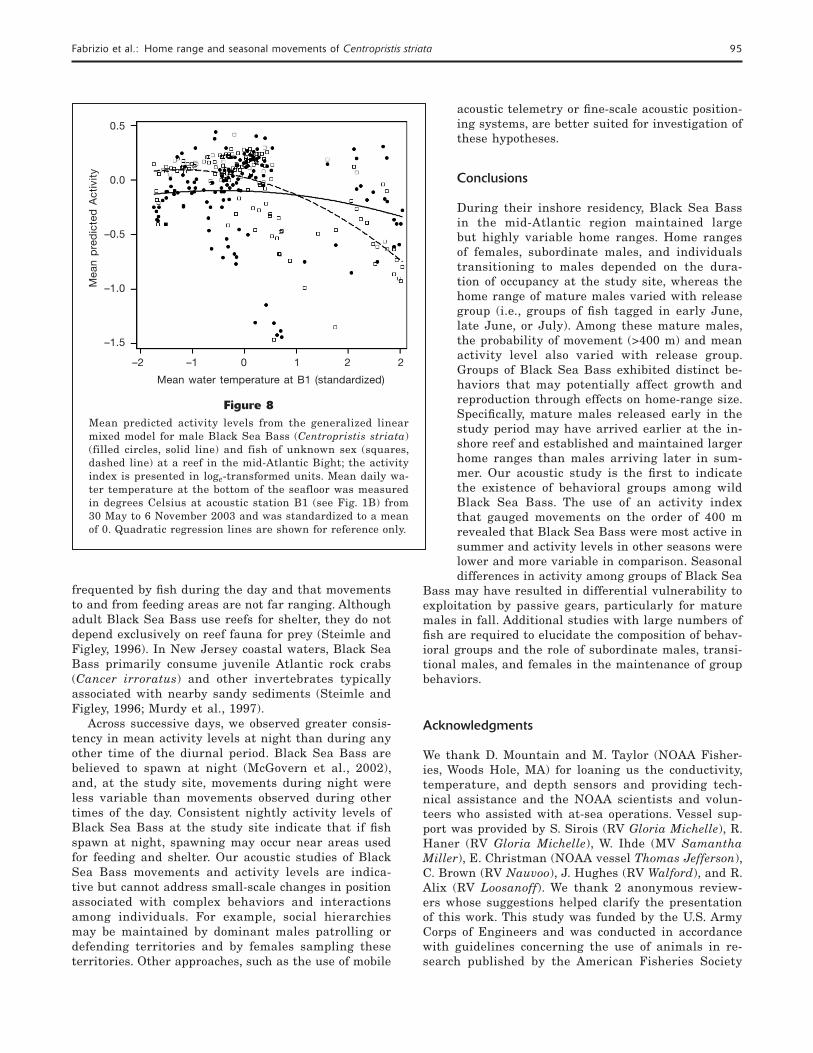
Activity levels of Black Sea Bass exhibited signifi cant linear and quadratic changes through time in response to mean temperature but these responses differed for males and fi sh of unknown sex (Fig. 8). Male fi sh appeared less responsive to temperature than fi sh of unknown sex, which ex-hibited decreasing levels of activity with increas-
ing temperature (Fig. 8). The effect of time period on activity of Black Sea Bass was marginal (Table 2), but our modeling results indicate that fi sh were slightly more active during crepuscular periods and least active during the day. Consistency of the continuous activity index during successive days was greatest at night (�=0.3297; Table 2); these responses exhibited higher correlations across time than did responses measured during other time periods.
Discussion
Home range of Black Seas Bass during inshore residency
We provide the fi rst estimates of home-range size for Black Sea Bass in the mid-Atlantic during their in-shore residency period; individuals maintained large, overlapping home ranges (13.7–736.4 ha), refl ecting the spatial extent of feeding and spawning areas. Although fi sh were detected throughout the study site, most fi sh used relatively shallow areas of coarse sediments in the central portion of the site (Fabrizio et al., 2013), indicating that the extent of suitable habitat may have restricted home ranges of these fi sh. Black Sea Bass that inhabit other temperate reefs in the mid-Atlantic region may exhibit larger or smaller home ranges, de-
Figure 3Relationship between loge-transformed home-range size (ha) and duration of occupancy for 78 Black Sea Bass (Centro-pristis striata) of unknown sex at a reef in the mid-Atlantic Bight during summer–fall 2003; these fish included females, subordinate males, and transitional males. Duration of occu-pancy was calculated as the difference between release date and date last detected at the study site in 2003; fish were released between 30 May and 16 July 2003. The dashed line is a linear regression line provided for reference only.
Ln(h
om
e ra
nge)
Duration of occupancy (d)
0 50 100 150
6
5
4
3
90 Fishery Bulletin 112(1)
Table 1
Comparison of the fi t of the top 14 models of activity for Black Sea Bass (Centropristis striata) at a reef in the mid-Atlantic Bight during the period May–November 2003, with the follow-ing 10 predictors included in all models: sex; season; release group (rg); time period (dawn, day, dusk, and night); linear (t), quadratic (t2) and cubic (t3) time; mean difference in tem-perature at stations B1 and H7 (see Fig. 1), 2 of the stations where acoustic receivers were deployed; mean difference in salinity at stations B1 and H7; and mean temperature at station B1 (temp). The response was coded 0 (no movement) or 1 (movement) during a given 3-h time period; the subject of each repeated-measures model was individual fi sh nested in time period. The quasi-likelihood information criterion (QIC) is a modifi cation of Akaike’s information cri-terion appropriate for repeated-measures models of binomial responses.
10 Predictors + QIC �QIC
sex*rg + sex*t3 + rg*t3 + temp*t + sex*rg*t3 32247.316 0.0sex*rg + sex*t2 + rg*t2 + temp*t2 + sex*rg*t2 32265.321 18.005sex*rg + sex*t3 + rg*t3 + temp*t3 + sex*rg*t3 32267.646 20.330sex*rg + rg*t3 + temp*t + temp*t2 32277.678 30.362sex*rg + sex*t3 + rg*t3 + temp*t2 + sex*rg*t3 32278.182 30.866sex*rg + sex*t2 + rg*t2 + temp*t + sex*rg*t2 32279.667 32.351sex*rg + sex*t2 + rg*t2 + temp*t3 + sex*rg*t2 32284.446 37.130sex*rg + rg*t3 + temp*t 32284.549 37.233sex*rg + rg*t2 + rg*temp + temp*t + temp*t2 + rg*temp*t2 32285.540 38.224sex*rg + rg*t3 + temp*t + temp*t2 + temp*t3 32287.220 39.904sex*rg + rg*t2 + temp*t2 32289.342 42.026sex*rg + rg*t2 + rg*t3 + temp*t + temp*t2 32293.091 45.775sex*rg + rg*t3 + temp*t + temp*t3 32294.340 47.024sex*rg +rg*t2 + temp*t 32298.118 50.802
pending on reef size. We hypothesize that the size and spatial distribution of temperate reefs and other hardbottom structures along the Atlantic coast and in the Gulf of Mexico may contribute to observed variation in home-range size within this species.
Home-range sizes reported for other fi shes tend to be relatively small (<1 ha), possibly re-fl ecting the limited spatial and temporal scales over which these types of studies are typically conducted (e.g., Topping et al., 2005; March et al., 2010; Mason and Lowe, 2010). Additionally, fi shes that exhibit a high affi nity to a particular habi-tat (e.g., coral reefs) often have relatively small home ranges. Black Sea Bass home ranges were markedly larger than the ones reported for other structure-oriented fi shes (e.g., Parrotfi sh [Spari-soma cretense]: 0.0037 ha, Afonso et al., 2008; Schoolmaster [Lutjanus apodus]: 4.7 ha, Gray Snapper [L. griseus]: 14.6 ha, Hammerschlag-Peyer and Layman, 2010). Subadult Prickly Shark (Echinorhinus cookei) in Monterey Canyon maintained home ranges similar in size to Black Sea Bass (20–146 ha; Dawson and Starr, 2009), as did several species of coral reef fi shes in the Dry Tortugas National Park (144–417 ha; Farmer and Ault, 2011). These observations and those of
Figure 4Relationship between loge-transformed home-range size (ha) and release date for 31 male Black Sea Bass (Centropristis striata) at a reef in the mid-Atlantic Bight during summer–fall 2003. The dashed line is a linear regression line provided for reference only.
25 May 1 Jun 8 Jun 15 Jun 22 Jun 29 Jun 6 Jul 13 Jul 20 Jul
6
5
4
3
Ln(h
om
e ra
nge)
Release date
Fabrizio et al.: Home range and seasonal movements of Centropristis striata 91
Farmer and Ault (2011) support our notion that the use of appropriate temporal and spatial domains of study is critical for estimation of home ranges of fi shes.
Studies that incorporate large numbers of fi sh can elucidate the degree of variation in home-range sizes and may be helpful in clarifying habitat use among groups of conspecifi cs. We found an order of magni-tude difference in home-range sizes among 109 Black Sea Bass at our study site (13.7–736.4 ha). However, the magnitude of this variation was not unusual, as Spot-tail Shark (Carcharhinus sorrah) in Australia used areas varying between 1 and 7802 ha as home ranges (Knip et al., 2012), and home ranges of Califor-nia Sheephead (Semicossyphus pulcher), another pro-
togynous hermaphrodite, spanned 2 or-ders of magnitude (Topping et al., 2005). The large variation in home-range size among Black Sea Bass may refl ect the distribution of prey resources at the study site or the extent of competitive interactions among fi sh for prey and shelter. Population density at the reef also may play a role in structuring space use among conspecifi cs. Our study was conducted during the inshore residency period of Black Sea Bass in a single year, and, as such, the specifi c home-range sizes we report here may be indicative of conditions in 2003. However, the relative home-range size and order-of-magnitude variation in home ranges in this popula-tion are likely to be independent of year of observation.
Home ranges of adult Black Sea Bass were fi sh-size invariant. Theory indi-cates that larger fi sh may require larger areas for feeding and that larger fi sh are able to patrol and defend larger areas with less metabolic cost than smaller fi sh are able to do (Kramer and Chap-man, 1999). Although such relationships have been observed in some marine fi shes (e.g., Jones, 2007; Taylor et al., 2007; Marshell et al., 2011), others have reported no effect of fi sh size on home-range size (e.g., Lowe et al., 2003; Afonso et al., 2008; Bellquist et al., 2008; Farm-er and Ault, 2011; this study). Apparent inconsistencies with theoretical expec-tations may arise because the relation-ship between body size and home-range size applies only to comparisons among species or among life stages of a given species (e.g., Jones, 2007). For example, juvenile Black Sea Bass displayed re-stricted use of estuarine habitats in New Jersey, rarely moving more than 120 m (Able and Hales, 1997); this geographic scale of habitat use contrasts markedly
with the extent of the area used by adults during their inshore residency (this study) or throughout their life (Moser and Shepherd, 2009). However, within a given life stage of a single species, home range appears to be less affected by fi sh size.
Home ranges of Black Sea Bass of unknown sex (females, subordinate males, and transitional males) were smaller among individuals with longer inshore residency times, indicating that fi sh of unknown sex that occupied smaller home ranges (<137.2 ha) exhib-ited higher site affi nities. These tendencies may refl ect the reproductive strategy of females and small males in this group. For example, females that occupied the site for only short periods (<50 d) may move freely
Figure 5Effect of release group on mean predicted probability of moving for 3 groups of Black Sea Bass (Centropristis striata) tagged and released at a reef in the mid-Atlantic Bight in early June (solid line), late June (dashed line), and July (dotted and dashed line) 2003 for (A) males (n=34) and (B) fish of unknown sex (n=87). Movement was indexed as either 0 (no movement) or 1 (movement) and was observed from 30 May to 19 November 2003; predicted means are from a binomial repeated-measures model.
Mea
n p
rob
abili
ty o
f m
ovi
ngM
ean
pro
bab
ility
of
mo
ving
May Jun Jul Aug Sep Oct Nov Dec
0.6
0.5
0.4
0.3
May Jun Jul Aug Sep Oct Nov Dec
0.8
0.6
0.4
0.2
A
B
92 Fishery Bulletin 112(1)
among social groups (and, therefore, exhibited larger home ranges [>100 ha]), but females that occupied the site for longer durations (>100 d) may have been more strongly associated with a specifi c group (and, there-fore, exhibited smaller home ranges [<60 ha]). The mat-ing system of Black Sea Bass has not been observed in the wild, but on the basis of observations with captive fi sh (Nelson7), these social groups are likely to be ha-rems. Some of the fi sh that exhibited larger home rang-es may have been fi sh undergoing transformation to males (see, e.g., Mercer, 1978). As such, these fi sh may display exploratory behaviors, searching for territories or joining spawning groups as “sneaker” males. Addi-tional studies on the reproductive strategies and social behavior of this species are needed to understand the mating system of Black Sea Bass and the role of sex-transitioning fi sh.
On average, mature male Black Sea Bass exhibited smaller home ranges than did females and subordinate or transitional males, perhaps, because mature males establish territories only as large as they can success-fully patrol and defend. These sex-related differences in home-range size were similarly observed in anoth-er protogynous serranid, Pseudanthias squamipinnis (Shapiro, 1987). However, our study and that of Shap-iro (1987) contrast with results reported for other ter-
7 Nelson, D. 2005. Personal commun. NOAA Fisheries Ser-vice, Northeast Fisheries Science Center, Milford, CT 06460.
ritorial protogynous fi shes, such as hogfi shes (Bodianus spp.), for which home ranges of males exceeded those of females (Hoffman, 1983). The difference we observed for Black Sea Bass may be due to the signifi cantly larg-er home ranges (13.7–736.4 ha) of fi sh on inner-shelf habitats compared with those of fi sh using coral-reef habitats, where home ranges are typically on the order of a few hundred square meters (0.01–0.05 ha; see e.g., Hoffman, 1983).
Furthermore, if we assume that fi sh tagged and re-leased at a given time represented the population of available fi sh, then fi sh released early in the study may have arrived at the site earlier than those fi sh tagged and released later in the study period. Under this as-sumption, mature male Black Sea Bass that arrived early at the site (i.e., fi sh released in early June) estab-lished larger home ranges (>120 ha) than males arriv-ing later in summer (fi sh released in July), indicating that spawning territories may be limited on the inner continental shelf and that late-arriving males may be less likely to establish and maintain larger territories.
The observed relationship between mean size of the home-range area of males and timing of release also was observed among the minimum and maximum size of the home-range area of these fi sh and the timing of their release. Whether home-range size is related to spawning success of males is unknown, but such knowledge could shed light on the importance of the timing of inshore migrations and the ability of males to
Figure 6Mean predicted probability of moving for Black Sea Bass (Centropristis striata) at a reef in the mid-Atlantic Bight during periods of low (open circles, solid line) and high (crosses, dashed line) water temperatures at the bottom of the seafloor; temperatures <13°C are low, and those temperatures >13°C are high. Predictions are for 121 Black Sea Bass fitted with acoustic transmitters and tracked between late May and mid-November 2003.
Mea
n p
rob
abili
ty o
f m
ovi
ng
May Jun Jul Aug Sep Oct Nov Dec
0.6
0.4
0.2
0.0
Fabrizio et al.: Home range and seasonal movements of Centropristis striata 93
successfully establish territories for reproduction and recruitment.
The observed variations in home-range size among Black Sea Bass have implications for management of these fi sheries. In the mid-Atlantic, commercial and recreational fi sheries target fi sh at specifi c reefs; al-though the distribution of fi shing activity at the reefs is not strictly random, vulnerability to capture is likely to increase with increasing home-range size. The larg-est home ranges were observed for fi sh of unknown sex that occupied the site for shorter (<50 d) periods of time; occupancy duration may have been short because these fi sh dispersed from the site or because they were harvested or died of natural causes. Males released in early June had home-range areas that were larger than those areas of other males, indicating that groups of males may be differentially vulnerable to capture.
Because reefs may support populations characterized by groups of fi sh that exhibit differences in space use and activity levels, differential vulnerability of groups may further exacerbate variation in exploitation rates among reefs. In addition, fi shery removal of mature males may initiate sex transformation in females (Ben-ton and Berlinsky, 2006), a process that is ensured by social interactions among individuals with overlapping home ranges.
Seasonal movements of Black Sea Bass
During their inshore residency in the mid-Atlantic Bight, Black Sea Bass were more likely to undertake large-scale movements (>400 m) during summer, when mean cross-shelf differences in water temperature at the bottom of the seafl oor were more pronounced than
Table 2
Estimated parameters from the general linear mixed model of activity level for Black Sea Bass (Centropristis striata) at a reef in the mid-Atlantic Bight during the period May–No-vember 2003, with the activity index loge transformed to meet homogeneity of variance assumptions. The model was fi tted to 11,843 observations from 121 Black Sea Bass. The additional variance associated with individual fi sh was 0.1578; the correlations among activity levels during dawn, day, dusk, and night were modeled with an autoregressive moving average model with parameters σ2, ρ, and �, where σ2 is the estimate of the re-sidual variance for each time period, � is the estimated correlation between 2 successive repeated measures, �ρ is the estimated correlation between observations 2 (time) units apart, �ρ2 is the estimated correlation between observations 3 (time) units apart, and so forth. Temp is temperature in degrees Celsius (°C) at the bottom of the seafl oor; B1 refers to the acoustic station depicted in Figure 1; time period refers to dawn, day, dusk, and night; df is degrees of freedom.
Covariance parameter Dawn Day Dusk Night
σ2 0.4840 0.5548 0.4637 0.4530ρ 0.8351 0.8619 0.8636 0.7622� 0.2332 0.2533 0.2603 0.3297
Type-III tests of fi xed effects
Effect Numerator df Denominator df F P
Sex 1 116 0.90 0.345Season 1 7062 0.38 0.536Release group 2 118 1.06 0.350Time period 3 431 1.96 0.120Time 1 2829 96.88 <0.001Time2 1 5366 8.45 0.004Time3 1 4244 47.76 <0.001Temp difference 1 8431 7.23 0.007Temp at B1 1 5713 19.06 <0.001Salinity difference 1 6163 1.54 0.215Temp at B1*time 1 5144 9.53 0.002Temp at B1*time2 1 6003 22.83 <0.001Temp at B1*sex 1 4797 34.06 <0.001Season*time3 1 5825 28.52 <0.001Release group*time3 2 3809 19.67 <0.001
94 Fishery Bulletin 112(1)
Figure 7Mean predicted activity levels from the generalized linear mixed model for 3 groups of Black Sea Bass (Centropristis striata) released at a reef in the mid-Atlantic Bight in early June (filled circles), late June (squares), and July (crosses); the activity index is presented in loge-transformed units and the data span the period from 30 May (time=0) to 6 Novem-ber (time=161) 2003.
Mea
n p
red
icte
d A
ctiv
ity
0 50 100 150
0.5
0.0
–0.5
–1.0
–1.5
Time (days)
in other seasons. Similarly, mean activity levels of Black Sea Bass were highest during summer and declined signifi cantly in the fall, regardless of time of day. Throughout the summer, fi sh main-tained high mean activity levels that were fairly constant.
Seasonal declines in activity of Black Sea Bass also were observed among 14 Black Sea Bass held in captivity from July through December of 2002 in a 121,000-L research aquarium. In these cap-tive fi sh, aggressive behaviors were highest soon after dominant males established territories in summer, and these behaviors declined over time.8 Our fi eld-based observations of lower mean activ-ity indices in the fall are consistent with a de-cline in aggressive pursuits and establishment of stable territories. Although laboratory and fi eld experiments yielded analogous results, the spa-tial scales of these studies were vastly different. Additional studies at the scale investigated at the HARS but with the ability to identify spe-cifi c movement behaviors (e.g., foraging, evasion, searching) are necessary to determine the nature of seasonal changes in activity levels of Black Sea Bass.
Among Black Sea Bass in the mid-Atlantic, the probability of undertaking seasonal movements on the order of 400 m varied among groups of fi sh and depended on sex and other factors. For example, on the basis of the binomial movement index, we observed that mature males that re-mained at the study site after October were more likely to move than were fi sh of unknown sex that were present at that time. During that time, that group of males may have been more vulnerable to capture by passive fi shing gear. Similarly, differences in seasonal movements unrelated to fi sh size were observed among release groups of male fi sh (Fig. 5A). On the basis of our observations, we postulate that Black Sea Bass arrive and establish residence at mid-Atlantic reefs throughout the summer; furthermore, groups of fi sh within these resident populations exhibit diverse sea-sonal movement patterns. Variations in movement pat-terns within a population are not likely to be the result of random movements among individuals; instead, such variations have been postulated to represent behavioral differences that may contribute to niche specializations (Hammerschlag-Peyer and Layman, 2010). Further research is necessary to elucidate factors that contrib-ute to the formation and maintenance of behavioral groups in Black Sea Bass, including factors associated with the complex social behaviors exhibited by this species.
8 Fabrizio, M. C., J. P. Pessutti, J. P. Manderson, A. F. Drohan, and B. A. Phelan. 2005. Use of the Historic Area Remedia-tion Site by black sea bass and summer fl ounder. Northeast Fish. Sci. Cent. Ref. Doc. 05-06, 95 p. [Available from Na-tional Marine Fisheries Service, 166 Water St., Woods Hole, MA 02543-1026.]
Diel activity of Black Sea Bass
In some species, activity patterns are associated with environmental light levels (Løkkeborg et al., 2000) and may be mediated by temperature (e.g., Hurst and Duffy, 2005), nutritional state (Metcalfe et al., 1998), or other factors (Reebs, 2002). We observed declining activity levels (number of times a fi sh moved >400 m during a 3-h period) of Black Sea Bass as temperature differ-ences across the study site decreased. However, indi-vidual fi sh exhibited highly variable activity levels (as measured by the continuous activity index) that were not explained by factors we considered in this study, indicating that age, physiological condition, social sta-tus, or other individual-based characteristics mediated activity levels. Additionally, interspecifi c interactions and the distribution and availability of prey resources likely contributed to observed variations in activity.
Differences in activity levels of Black Sea Bass dur-ing crepuscular, daytime, or nighttime periods were less striking than during different seasons. The mean activity index observed during the daytime tended to be lower than mean indices observed during crepuscular periods or at night. Black Sea Bass, which are visual feeders, feed during daylight (Steimle and Figley, 1996), and low activity levels at this time may indicate that fi sh feeding areas may be located near (~400 m) areas
Fabrizio et al.: Home range and seasonal movements of Centropristis striata 95
frequented by fi sh during the day and that movements to and from feeding areas are not far ranging. Although adult Black Sea Bass use reefs for shelter, they do not depend exclusively on reef fauna for prey (Steimle and Figley, 1996). In New Jersey coastal waters, Black Sea Bass primarily consume juvenile Atlantic rock crabs (Cancer irroratus) and other invertebrates typically associated with nearby sandy sediments (Steimle and Figley, 1996; Murdy et al., 1997).
Across successive days, we observed greater consis-tency in mean activity levels at night than during any other time of the diurnal period. Black Sea Bass are believed to spawn at night (McGovern et al., 2002), and, at the study site, movements during night were less variable than movements observed during other times of the day. Consistent nightly activity levels of Black Sea Bass at the study site indicate that if fi sh spawn at night, spawning may occur near areas used for feeding and shelter. Our acoustic studies of Black Sea Bass movements and activity levels are indica-tive but cannot address small-scale changes in position associated with complex behaviors and interactions among individuals. For example, social hierarchies may be maintained by dominant males patrolling or defending territories and by females sampling these territories. Other approaches, such as the use of mobile
Mea
n p
red
icte
d A
ctiv
ity
0.5
0.0
–0.5
–1.0
–1.5
–2 –1 0 1 2 2
Mean water temperature at B1 (standardized)
Figure 8Mean predicted activity levels from the generalized linear mixed model for male Black Sea Bass (Centropristis striata) (filled circles, solid line) and fish of unknown sex (squares, dashed line) at a reef in the mid-Atlantic Bight; the activity index is presented in loge-transformed units. Mean daily wa-ter temperature at the bottom of the seafloor was measured in degrees Celsius at acoustic station B1 (see Fig. 1B) from 30 May to 6 November 2003 and was standardized to a mean of 0. Quadratic regression lines are shown for reference only.
acoustic telemetry or fi ne-scale acoustic position-ing systems, are better suited for investigation of these hypotheses.
Conclusions
During their inshore residency, Black Sea Bass in the mid-Atlantic region maintained large but highly variable home ranges. Home ranges of females, subordinate males, and individuals transitioning to males depended on the dura-tion of occupancy at the study site, whereas the home range of mature males varied with release group (i.e., groups of fi sh tagged in early June, late June, or July). Among these mature males, the probability of movement (>400 m) and mean activity level also varied with release group. Groups of Black Sea Bass exhibited distinct be-haviors that may potentially affect growth and reproduction through effects on home-range size. Specifi cally, mature males released early in the study period may have arrived earlier at the in-shore reef and established and maintained larger home ranges than males arriving later in sum-mer. Our acoustic study is the fi rst to indicate the existence of behavioral groups among wild Black Sea Bass. The use of an activity index that gauged movements on the order of 400 m revealed that Black Sea Bass were most active in summer and activity levels in other seasons were lower and more variable in comparison. Seasonal differences in activity among groups of Black Sea
Bass may have resulted in differential vulnerability to exploitation by passive gears, particularly for mature males in fall. Additional studies with large numbers of fi sh are required to elucidate the composition of behav-ioral groups and the role of subordinate males, transi-tional males, and females in the maintenance of group behaviors.
Acknowledgments
We thank D. Mountain and M. Taylor (NOAA Fisher-ies, Woods Hole, MA) for loaning us the conductivity, temperature, and depth sensors and providing tech-nical assistance and the NOAA scientists and volun-teers who assisted with at-sea operations. Vessel sup-port was provided by S. Sirois (RV Gloria Michelle), R. Haner (RV Gloria Michelle), W. Ihde (MV Samantha Miller), E. Christman (NOAA vessel Thomas Jefferson), C. Brown (RV Nauvoo), J. Hughes (RV Walford), and R. Alix (RV Loosanoff). We thank 2 anonymous review-ers whose suggestions helped clarify the presentation of this work. This study was funded by the U.S. Army Corps of Engineers and was conducted in accordance with guidelines concerning the use of animals in re-search published by the American Fisheries Society
96 Fishery Bulletin 112(1)
and the American Society of Ichthyologists and Her-petologists. M. Fabrizio was partially supported by the Moses D. Nunnally fund. This article is contribution number 3333 of the Virginia Institute of Marine Sci-ence, College of William & Mary.
Literature cited
Able, K. W., and L. S. Hales Jr. 1997. Movements of juvenile black sea bass Centropris-
tis striata (Linnaeus) in a southern New Jersey estuary.J. Exp. Mar. Biol. Ecol. 213:153–167.
Afonso, P., J. Fontes, K. N. Holland, and R. S. Santos.2008. Social status determines behavior and habitat us-
age in a temperate parrotfi sh: implications for marine reserve design. Mar. Ecol. Prog. Ser. 359:215–227.
Bellquist, L. F., C. G. Lowe, and J. E. Caselle.2008. Fine-scale movement patterns, site fi delity, and
habitat selection of ocean whitefi sh (Caulolatilus prin-ceps). Fish. Res. 91:325–335.
Benton, C. B., and D. L. Berlinsky.2006. Induced sex change in black sea bass. J. Fish
Biol. 69:1491–1503.Bolker, B. M., M. E. Brooks, C. J. Clark, S. W. Geange, J. R.
Poulsen, M. H. H. Stevens, and J.-S. S. White.2008. Generalized linear mixed models: a practical
guide for ecology and evolution. Trends Ecol. Evol. 24:127–135.
Burnham, K. P., and D. R. Anderson.2002. Model selection and multimodel inference: a prac-
tical information-theoretic approach, 2nd ed., 488 p.Springer-Verlag, New York.
Calenge, C. 2006. The package “adehabitat” for the R software: a tool
for the analysis of space and habitat use by animals.Ecol. Model. 197:516–519.
Clements, S., D. Jepsen, M. Karnowski, and C. B. Schreck.2005. Optimization of an acoustic telemetry array for
detecting transmitter-implanted fi sh. N. Am. J. Fish. Manage. 25:429–436.
Collette, B., and G. Klein-MacPhee (eds.).2002. Bigelow and Schroeder’s Fishes of the Gulf of
Maine, 3rd ed., 748 p. Smithsonian Inst. Press, Wash-ington, D.C.
Collins, M. R., J. C. McGovern, G. R. Sedberry, H. S. Meister, and R. Pardieck.
1999. Swim bladder defl ation in black sea bass and ver-milion snapper: potential for increasing postrelease sur-vival. N. Am. J. Fish. Manage. 19:828–832.
Dawson, C. L., and R. M. Starr.2009. Movements of subadult prickly sharks Echinorhi-
nus cookei in the Monterey Canyon. Mar. Ecol. Prog. Ser. 386:253–262.
Douglas, S. G., G. Chaput, J. Hayward, and J. Sheasgreen.2009. Prespawning, spawning, and postspawning behav-
ior of striped bass in the Miramichi River. Trans. Am. Fish. Soc. 138:121–134.
Fabrizio, M. C., J. P. Manderson, and J. P. Pessutti.2013. Habitat associations and dispersal of black sea
bass from a mid-Atlantic Bight reef. Mar. Ecol. Prog. Ser. 482:241–253.
Fabrizio, M. C., and J. P. Pessutti.2007. Long-term effects and recovery from surgical im-
plantation of dummy transmitters in two marine fi shes.J. Exp. Mar. Biol. Ecol. 351:243–254.
Farmer, N. A., and J. S. Ault.2011. Grouper and snapper movements and habitat
use in Dry Tortugas, Florida. Mar. Ecol. Prog. Ser. 433:169–184.
Hammerschlag-Peyer, C. M., and C. A. Layman.2010. Intrapopulation variation in habitat use by two
abundant coastal fi sh species. Mar. Ecol. Prog. Ser. 415:211–220.
Hoffman, S. G.1983. Sex-related foraging behavior in sequentially
hermaphroditic hogfishes (Bodianus spp.). Ecology 64:798–808.
Hurst, T. P., and T. A. Duffy.2005. Activity patterns in northern rock sole are medi-
ated by temperature and feeding history. J. Exp. Mar. Biol. Ecol. 25:201–213.
Jones, K. M. M.2007. Distribution of behaviours and species interac-
tions within home range contours in fi ve Caribbean reef fi sh species (Family Labridae). Environ. Biol. Fishes 80:35–49.
Kenward, M. G., and J. H. Roger.1997. Small sample inference for fi xed effects from re-
stricted maximum likelihood. Biometrics 53:983–997.Knip, D. M., M. R. Heupel, and C. A. Simpfendorfer.
2012. Habitat use and spatial segregation of adult spot-tail sharks Carcharhinus sorrah in tropical nearshore waters. J. Fish Biol. 80:767–784.
Kramer, D. L., and M. R. Chapman.1999. Implications of fi sh home range size and reloca-
tion for marine reserve function. Environ. Biol. Fishes 55:65–79.
Lathrop, R. G., M. Cole, N. Senyk, and B. Butman.2006. Seafl oor habitat mapping of the New York Bight
incorporating sidescan sonar data. Estuar. Coast. Shelf Sci. 68:221–230.
Liang, K. Y., and S. L. Zeger.1986. Longitudinal data analysis using generalized lin-
ear models. Biometrika 73:13–22.Limburg, K. E., and J. R. Waldman.
2009. Dramatic declines in North Atlantic diadromous fi shes. BioScience 59:955–965.
Littell, R. C., W. W. Stroup, and R. J. Freund. 2002. SAS for linear models, 4th ed., 466 p. SAS Insti-
tute Inc, Cary, NC.Littell, R. C., G. A. Milliken, W. W. Stroup, R. D. Wolfi nger, and
O. Schnabenberger.2006. SAS for mixed models, 2nd ed., 814 p. SAS Insti-
tute, Inc, Cary, NC.Løkkeborg, S., K. Skajaa, and A. Fernö.
2000. Food-search strategy in ling (Molva molva L.): cre-puscular activity and use of space. J. Exp. Mar. Biol. Ecol. 247:195–208.
Lowe, C. G., D. T. Topping, D. P. Cartamil, and Y. P. Papastamatiou.
2003. Movement patterns, home range, and habitat uti-lization of adult kelp bass Paralabrax clathratus in a temperate no-take marine reserve. Mar. Ecol. Prog. Ser. 256:205–216.
Mason, T. J., and C. G. Lowe.2010. Home range, habitat use, and site fidelity of

Fabrizio et al.: Home range and seasonal movements of Centropristis striata 97
barred sand bass within a southern California marine protected area. Fish. Res. 106:93–101.
March, D., M. Palmer, J. Alos, A. Grau, and F. Cardona.2010. Short-term residence, home range size and diel
patterns of the painted comber Serrranus scriba in a temperate marine reserve. Mar. Ecol. Prog. Ser. 400:195–206.
Marshell, A., J. S. Mills, K. L. Rhodes, and J. McIlwain.2011. Passive acoustic telemetry reveals highly variable
home range and movement patterns among unicornfi sh within a marine reserve. Coral Reefs 30:631–642.
McGovern, J. C., M. R. Collins, O. Pashuk, and H. S. Meister.2002. Temporal and spatial differences in life history pa-
rameters of black sea bass in the southeastern United States. N. Am. J. Fish. Manage. 22:1151–1163.
Mercer, L. P.1978. The reproductive biology and population dynamics
of black sea bass, Centropristis striata. Ph.D. diss., 196 p.Virginia Inst. Marine Science, College of William & Mary, Gloucester Point, VA.
Metcalfe, N. B., N. H. C. Fraser, and M. D. Burns.1998. State-dependent shifts between nocturnal and di-
urnal activity in salmon. Proc. R. Soc. Lond., Ser. B: Biol. Sci. 265:1503–1507.
Meyer, C. G., T. B. Clark, Y. P. Papastamatiou, N. M. Whitney, and K. N. Holland.
2009. Long-term movement patterns of tiger sharks Galeocerdo cuvier in Hawaii. Mar. Ecol. Prog. Ser. 381:223–235.
Moffi tt, E. A., L. W. Botsford, D. M. Kaplan, and M. R. O’Farrell.2009. Marine reserve networks for species that move
within a home range. Ecol. Appl. 19:1835–1847.Moser, J., and G. R. Shepherd.
2009. Seasonal distribution and movement of black sea bass (Centropristis striata) in the Northwest Atlantic as determined from a mark-recapture experiment. J. Northwest Atl. Fish. Sci. 40:17–28.
Murawski, S. A., R. Brown, H.-L. Lai, P. J. Rago, and L. Hendrickson.
2000. Large-scale closed areas as a fi shery management tool in temperate marine systems: the Georges Bank experience. Bull. Mar. Sci. 66:775–798.
Murdy, E. O., R. S. Birdsong , and J. A. Musick.1997. Fishes of Chesapeake Bay, 324 p. Smithsonian
Inst. Press, Washington, D.C.Musick, J. A., and L. P. Mercer.
1977. Seasonal distribution of black sea bass, Centro-pristis striata, in the Mid-Atlantic Bight with comments on the ecology and fi sheries of the species. Trans. Am. Fish. Soc. 106:12–25.
Neufeld, M. D., and C. R. Spence.2004. Evaluation of a simple decompression procedure
to reduce decompression trauma in trap-caught burbot.Trans. Am. Fish. Soc. 133:1260–1263.
Pan, W.2004. Akaike’s information criterion in generalized esti-
mating equations. Biometrics 57:120–125.Quinn, G. P., and M. J. Keough.
2002. Experimental design and data analysis for biolo-gists, 537 p. Cambridge Univ. Press, New York.
R Development Core Team.2005. R. a language and environment for statistical
computing. R Foundation for Statistical Computing, Vienna, Austria. [Available from http://www.r-project.org.]
Reebs, S. G.2002. Plasticity of diel and circadian activity rhythms in
fi shes. Rev. Fish Biol. Fish. 12:349–371.Shapiro, D.
1987. Patterns of space use common to widely different types of social groupings of a coral reef fi sh. Environ. Biol. Fishes 18:183–194.
Shepherd, G. R., and M. Terceiro.1994. The summer fl ounder, scup and black sea bass
fi shery of the Middle Atlantic Bight and Southern New England waters. NOAA Tech. Rep. NMFS 122, 13 p.
Steimle, F. W., and W. Figley.1996. The importance of artifi cial reef epifauna to black
sea bass diets in the Middle Atlantic Bight. N. Am. J. Fish. Manage. 16:433–439.
Steimle, F. W., and C. Zetlin.2000. Reef habitats in the middle Atlantic Bight: abun-
dance, distribution, associated biological communities, and fi shery resource use. Mar. Fish. Rev. 62:24–42.
Taylor, M. W., S. D. Laffan, D. S. Fielder, and I. M. Suthers.2007. Key habitat and home range of mulloway Argy-
rosomus japonicus in a southeast Australian estuary: fi nding the estuarine niche to optimise stocking. Mar. Ecol. Prog. Ser. 328:237–247.
Topping, D. T., C. G. Lowe, and J. E. Caselle.2005. Home range and habitat utilization of adult Cali-
fornia sheephead, Semicossyphus pulcher (Labridae), in a temperate no-take marine reserve. Mar. Biol. 147:301–311.
Worton, B. J.1989. Kernel methods for estimation the utilization dis-
tribution in home-range studies. Ecology 70:164–168.Zuur, A., E. N. Leno, and G. M. Smith.
2007. Analysing ecological data, 672 p. Springer, New York.