Hokkaido Institute of Environ Sciences
34
Hokkaido Institute of Environ Sciences Hokkaido Institute of Environ Sciences Materials Cycle Section Research on the material cycle (N or C cycle and so on), acid rain and environmental control concerning waste management. Organization Drector ---Vice Director General Affairs Department General Affairs Section Planning and Coordination Section Environmental Protection Department Air Environment Section Water Environment Section Pollution Control Section Chemical Pollution Section I Chemical Pollution Section II Environmental Studies Department Materials Cycle Section Regional Environmental Section Environmental Engineering Section Nature Conservation Department Natural Environments Conservation Section Vegetation Section Wildlife Section Eastern Hokkaido Wildlife Research Station Southern Hokkaido Wildlife Research Station
Transcript of Hokkaido Institute of Environ Sciences

Hokkaido Institute of Environ SciencesHokkaido Institute of Environ Sciences
This Hotel
HIES
Materials Cycle SectionResearch on the material cycle (N or C cycle and so on), acid rain and environmental control concerning waste management.
OrganizationDrector ---Vice Director
General Affairs DepartmentGeneral Affairs SectionPlanning and Coordination Section
Environmental Protection DepartmentAir Environment SectionWater Environment SectionPollution Control SectionChemical Pollution Section IChemical Pollution Section II
Environmental Studies DepartmentMaterials Cycle SectionRegional Environmental Section Environmental Engineering Section
Nature Conservation DepartmentNatural Environments Conservation SectionVegetation SectionWildlife SectionEastern Hokkaido Wildlife Research StationSouthern Hokkaido Wildlife Research Station
Administrator
テキストボックス
International Workshop on Environmental Contamination by Hazardous Substances

Monitoring Site●Rishiri
●
Teshio
●Moshiri
●Ochishi▲Mashu
Snowcover sampling(60-70site)
Sapporo●

Flux Monitoring of Atmospheric Components Flux Monitoring of Atmospheric Components in Northern Forest areain Northern Forest area
Izumi Noguchi1),Tatsuya Fukazawa 2),Kentaro Takagi2),Kentaro Hayashi3),Yasumi Fujinuma4), Nobuko Saegusa5)
1)Hokkaido Inst. of Environ. Sci.,2)Hokkaido Univ.,3)National Inst. for Agro-Environ.,4)Tottori Univ.,5)National Inst. for Environ. Studies
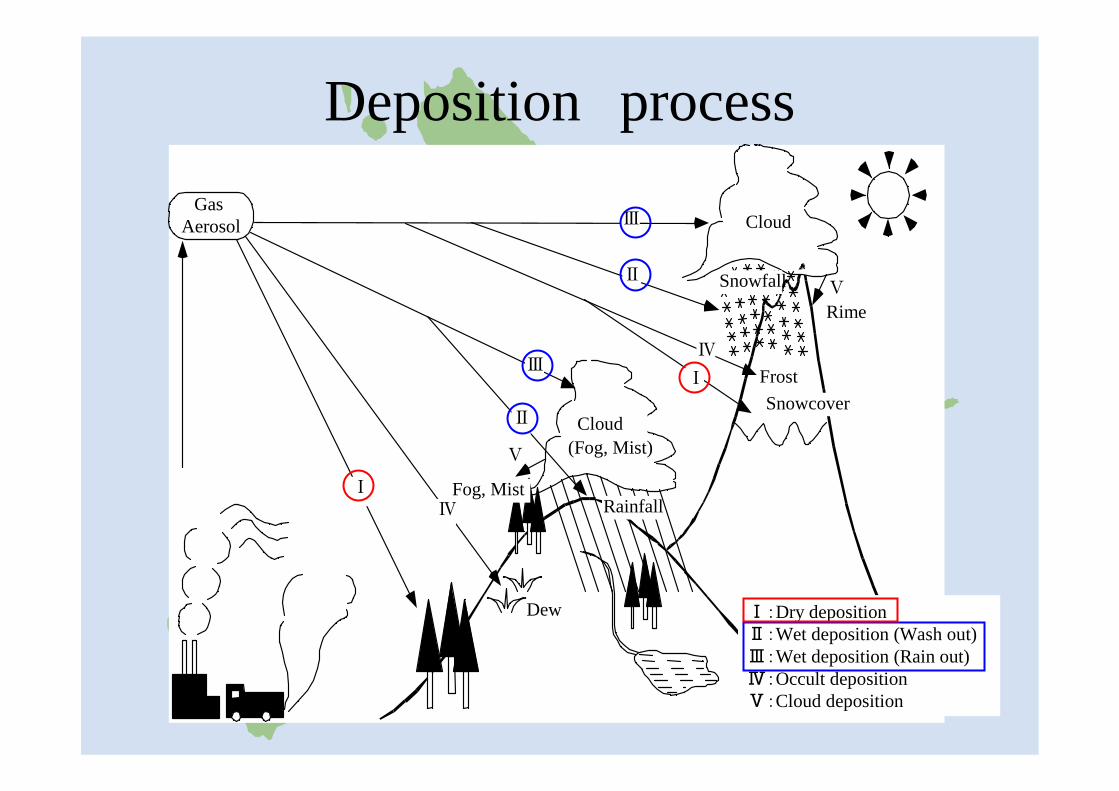
GasAerosol
Snowfall
Cloud
Ⅴ
Ⅰ
Ⅱ
Ⅲ
Ⅳ
ⅢⅣ
Ⅱ
Ⅰ
Ⅴ
Rime
Cloud (Fog, Mist)
Rainfall
Dew
Snowcover
Fog, Mist
Frost
Ⅰ:Dry depositionⅡ:Wet deposition (Wash out)Ⅲ:Wet deposition (Rain out)Ⅳ:Occult depositionⅤ:Cloud deposition
Deposition process

Gas and particle ion componentsEmission
Cloud
SO42-
SO2
NO
NO2
NO3-HNO3
HONO
NH4+NH3
Na+
Ca2+
Mg2+
Cl-
K+
SO42- NO3
- NH4+
Na+
Ca2+
Mg2+ Cl-
K+
Rain drop, Snow flake
SO42-
NO3- NH4
+
Na+
Ca2+
Mg2+
Cl-K+
Sea salt
Soil
Plant
Animal
Agri.
Volcano
Fossil fuel
Human
Lightning
Rain-out
Wash-out
Gas Particle
Wet DepositionCloud DepositionDry Deposition
Biomass
Agri.: Agriculture (fertilizer, livestock, and so on.)

Na,Cl,Mg,Ca
K
ParticleC
loud
Na,Cl,Mg,Ca,K,SO4NO3,NH4
Gas
SO2NO2NH3O3
Na,Cl,Mg,CaK,SO4
NO3,NH4
Na,Cl,Mg,CaK,SO4
NO3,NH4
Na,Cl,Mg,CaK, SO4
NO3,NH4
Na,Cl,Mg,Ca,K,SO4NO3,NH4
SO2, O3NH3 ,HCl
HONOHNO3
H2SO4HNO3,
NH4
HNO3NH3HCl
Dry D
epositionW
et Deposition
SecondaryParticle
Transport & Reaction

Emission of Hokkaido

Kosa Yellow color
NormalBlack color
8Strong sand storm
by Airmass flowMODIS, March 21, 2002
To SapporoIn March 2002, large Kosa phenomenon.First observation in Eastern Hokkaido.
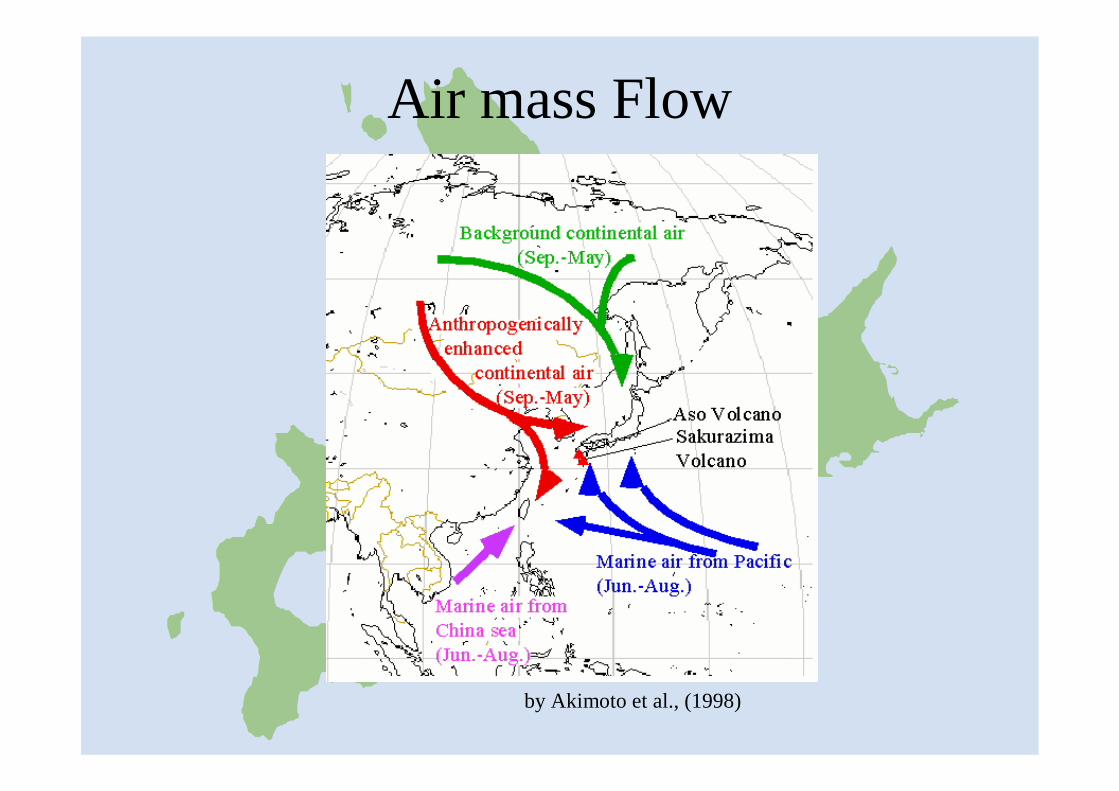
Air mass Flow
by Akimoto et al., (1998)

Emission Inventories
http://www.iiasa.ac.at/rains/meetings/ACCENT_GEIA/presentations/old/EMISSIONChinaTonooka.ppt
SO2 NOx
NMVOC NH3

Wet deposition in JapanAnnual deposition
(mmol m-2 yr-1) Region C. Prc. (mm yr-1)
nss-SO42- NO3
- NH4+
Sites
n
JS-NReRuU
761 931 974
10.1 16.6 20.3
8.812.011.8
13.716.820.6
131
JS-MReRuU
1778 1938 1494
26.3 41.0 51.4
27.829.927.3
28.537.854.4
7103
JS-WReRuU
1348 1806 1576
19.0 30.6 23.0
21.622.325.6
22.428.123.9
113
POReRuU
2083 1838 1247
23.1 25.9 27.5
18.126.229.3
18.331.635.0
69
12
SI RuU
1449 1346
23.8 27.0
19.720.7
30.526.2
47
ECReRuU
1791 1857 1676
25.5 33.7 36.1
23.918.824.2
31.334.036.1
223
SW Re 3370 37.5 28.4 32.2 6
JapanReRuU
2211 1725 1365
27.3 30.6 30.0
24.024.425.5
26.132.133.4
232929
EC SI
PO -W
JS
SW
-N
-M
Region: JS-N: Northern part of the Japan Sea area, JS-M: Central part of the Japan Sea area, JS-W: Western part of the Japan Sea area, PO: The Pacific Ocean area, SI: The Seto Inland Sea area, EC: The East China Sea area, and SW: Southwestern Islands Sea area. C.; Re: Remote site, Ru: Rural site, and U: Urban site.

Contributions of emission on precipitation components in Hokkaido

利尻の降水成分
0.00
0.20
0.40
0.60
0.80
1.00
1.20
1.40
1.60
1.80
2.00
2001 2002 2003 2004 2005 2006
沈着
量(m
mol m
-2 y
-1)
4
4.2
4.4
4.6
4.8
5
5.2
5.4
pH
札幌の降水成分
0.00
0.20
0.40
0.60
0.80
1.00
1.20
1.40
1.60
1.80
2.00
2001 2002 2003 2004 2005 2006
沈着
量(m
mol m
-2 y
-1)
4
4.2
4.4
4.6
4.8
5
5.2
5.4
pH
硫酸イオン沈着量 硝酸イオン沈着量 pH
Increasing of Sulfate & Nitrate, decreasing pH
0
5
10
15
20
25
30
1990
1992
1994
1996
1998
2000
2002
2004
2006
Year
Em
issi
ons,
Mt
SO2
NOx
(国家环境保护总局,2007;Tian et al., 2005)
Increasing trend of air pollution emission in China
13
Rishiri Sapporo
Dep
ositi
on (m
mol
m-2
y-1)
Dep
ositi
on (m
mol
m-2
y-1)
Sulfate Nitrate

Transported OzoneContributions of China and Japan are large.However, contributions of Europe and North America cannot be ignored.
Simulation results(5/8/2007)(by NIES/Kyushu Univ.)
China
Hokkaido
Transported Ozone
by Akimoto et al. (2007)

利尻のオゾン濃度
y = 0.0695x - 44.854
R2 = 0.0423
0
10
20
30
40
50
60
70
2000年
4月
2001年
4月
2002年
4月
2003年
4月
2004年
4月
2005年
4月
2006年
4月
2007年
4月
ppb
Ishii et al.(2005)
□:Increasing of injury forest
Surface OzoneEffect on Vegitation( >40ppb)
Effect on Human Health( >60ppb)
Surface ozone is shown increase trend.
Trend in Rishiri Island
Rate: 5 ppb/6 years Rishiri & Teshio area
Mashu
AreaShakotanpeninsula
Injury of Larix forest was increase in ozone high concentration area.

Stratosphere
TroposphereEmission
Transportation & Reaction
Emission
Deposition
Long-range transportation
Overview of LRTAP

Teshio Site
CC-LaG:Carbon Cycle and Larch Growth experimentSite: Teshio Experimental Forest, Horonobe, Hokkaido, Japan Location: 45deg 03' N, 142deg 06' E
Elevation: ca.70m, a.s.l.
Area:13.7 ha (Young larch plantation )
Mean annual precipitation: 1000mm
Tower(30m)
2007
Photo by NIES

Bulk Wet-only
Subject Components Height Method Sampling cycleGas SO2, HNO3, HONO, HCl, NH3
Aerosol SO42-,NO3
-,Cl-,NH4+,Na+,K+,Mg2+,Ca2+
Gas NO2, NO, O3 Auto Half-hourly
pH, EC,SO42-,NO3
-,Cl-,NH4+,Na+,K+,Mg2+,Ca2+ Wet-only Weekly
pH, EC,SO42-
,NO3-,Cl
-,NH4
+,Na
+,K
+,Mg
2+,Ca
2+ Bulk Monthly
30m&10m
AnnularDenuder
Weekly
Precipiotation Ground
Monitoring system
D1: annual denuder coated by NaFD2: annual denuder coated by Na2CO3D3: annual denuder coated by Na2CO3D4: annual denuder coated by citric acid
F1: Teflon filter for aerosol (>2.5μm)F2: Teflon filter for aerosol (PM2.5) F3: Cellulose filter impregnated K2CO3F4: Cellulose filter impregnated H3PO4
Fig. Annular Denuder system
Impactor10 m
30 m
Impactor

Objective and Subject
Main Subject of Monitoring1. SOx : SO2 (g), SO4
2-(p), SO42-(w)
2. NOy : NO, NO2, HNO3, HONO, NO3-, NO3
-
3. NHx : NH3, NH4+, NH4
+
4. O3
ObjectiveThe site aims at measurements of CO2 flux of woodland ecosystem in deciduous
larch forest. Simultaneously, the effects on carbon flux of air pollutants was observed by Hokkaido Institute of Environ Sciences.
Therefore, we have carried out the following researches;(1)Establishment of Monitoring Method for Air pollutants (2)Estimation Dry and Wet deposition(3)Interaction with Atmosphere- Forest, Atmosphere- Soil and Atmosphere-Snowcover.

Research Themes1. Development of HONO Measuring Method2. Establishment of simple and low cost measuring method3. Deposition components and Efflux components4. Interaction of HONO with Atmosphere - Forest5. Application of the Dry deposition Measurements 6. NHx Flux7. Seasonal variation of O3
concentration and AOT 40
NO3- NH4
+
Dry deposition
Gas
NO3-NO3- NH 4
+NH 4+ HNO3 HONO NH3HNO3 HONO NH3 NONO NO2NO2
Particle
3 43 4NO - NH +NO - NH +
Wet depositionPrecipitation
HONOHONO NH3NH3 N2O 3 43 4NO - NH +NO - NH +
The flux measurement method in this site was used the gradient method. Therefore, the flux values are shown as net values. It means differences between influx and efflux.
Flux = K×⊿C / ⊿ZK: Diffusion coefficient⊿C: Difference of concentration⊿Z: Difference of height
Sapporo
020406080
100120140
02/09/01
02/11/01
03/01/01
03/03/01
03/05/01
03/07/01
03/09/01
03/11/01
04/01/01
04/03/01
04/05/01
04/07/01
04/09/01
04/11/01
05/01/01
05/03/01
05/05/01
05/07/01
05/09/01
05/11/01
06/01/01
06/03/01
06/05/01
06/07/01
06/09/01
06/11/01
07/01/01
07/03/01
Conc.,
nm
ol m
-3
Annular denuder Filterpack
Moshiri
012345678
02/09/01
02/11/01
03/01/01
03/03/01
03/05/01
03/07/01
03/09/01
03/11/01
04/01/01
04/03/01
04/05/01
04/07/01
04/09/01
04/11/01
05/01/01
05/03/01
05/05/01
05/07/01
05/09/01
05/11/01
06/01/01
06/03/01
06/05/01
06/07/01
06/09/01
06/11/01
07/01/01
07/03/01
Conc.,
nm
ol m
-3
Rishiri
0
1
2
3
4
02/09/01
02/11/01
03/01/01
03/03/01
03/05/01
03/07/01
03/09/01
03/11/01
04/01/01
04/03/01
04/05/01
04/07/01
04/09/01
04/11/01
05/01/01
05/03/01
05/05/01
05/07/01
05/09/01
05/11/01
06/01/01
06/03/01
06/05/01
06/07/01
06/09/01
06/11/01
07/01/01
07/03/01
Conc.,
nm
ol m
-3
Teshio
0
1
2
3
4
5
6
02/09/01
02/11/01
03/01/01
03/03/01
03/05/01
03/07/01
03/09/01
03/11/01
04/01/01
04/03/01
04/05/01
04/07/01
04/09/01
04/11/01
05/01/01
05/03/01
05/05/01
05/07/01
05/09/01
05/11/01
06/01/01
06/03/01
06/05/01
06/07/01
06/09/01
06/11/01
07/01/01
07/03/01
Sampling finish date
Conc.,
nm
ol m
-3
30m 10m
HONO
y = 1.085x + 2.2774
R2 = 0.9018
0
30
60
90
120
150
0 50 100 150
Filter-Pack (nmol m-3)
Annual
Denude
r (n
mol m
-3)
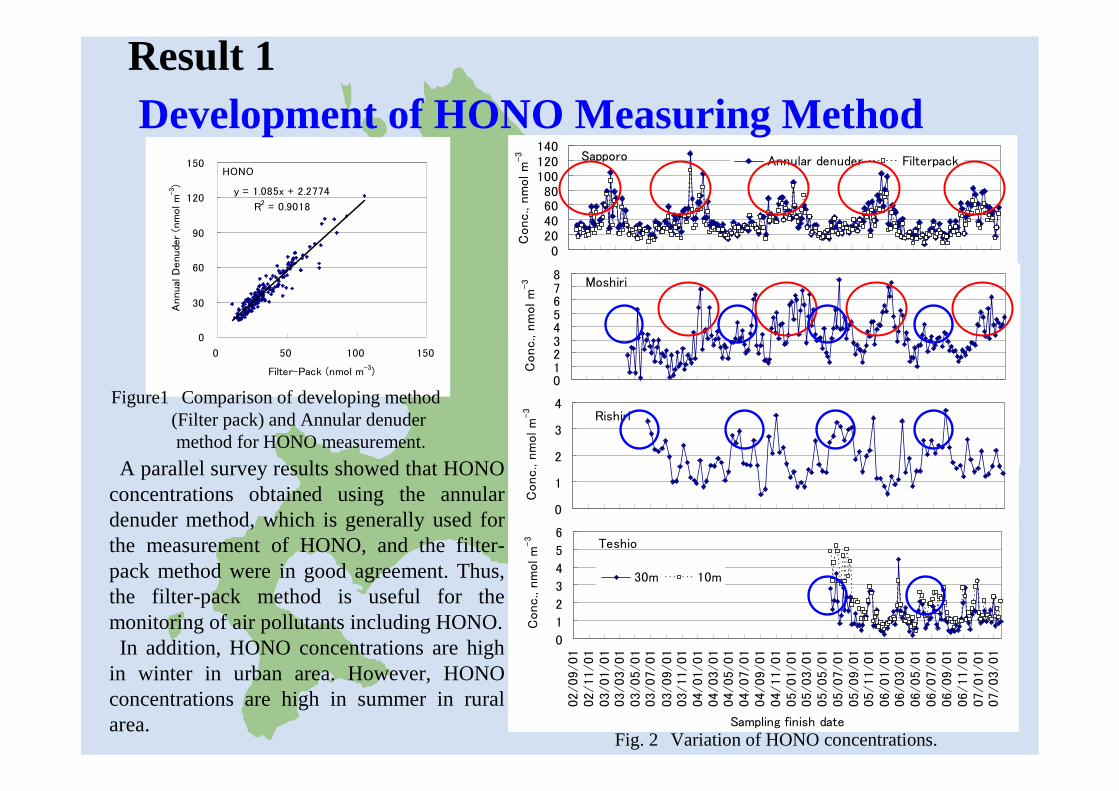
Figure1 Comparison of developing method (Filter pack) and Annular denuder method for HONO measurement.
Fig. 2 Variation of HONO concentrations.
Result 1Development of HONO Measuring Method
A parallel survey results showed that HONOconcentrations obtained using the annular denuder method, which is generally used for the measurement of HONO, and the filter-pack method were in good agreement. Thus, the filter-pack method is useful for the monitoring of air pollutants including HONO.In addition, HONO concentrations are high
in winter in urban area. However, HONO concentrations are high in summer in ruralarea.

Fig. 2 Filter pack method.
Result 2Simple and low cost method
•Concentrations of NHx(NH4++NH3) by Filter-pack
method (FP) are agree with by Annular Denuder method (AD).• Concentrations of NH3 by FP are higher than by AD.→effects of artifact→Concentrations of NH3 should be measured with more accuracy. →using by Passive sampler (PS).
I0: Teflon doughnut filter (Coarse particle )F0:Teflon filter (PM-10 )F1: Nylon filter (HNO3, HONO, SO2, NH3)F2: K2CO3 impregnated filter (SO2, HONO, HCl)F2’: K2CO3 impregnated filter (interference of HONO from NO2 )F3: H3PO4 impregnated filter ( NH3)
I0(Impactor)
To Pump
F0
Air Air
F1 F2 F2’ F3
Fig. 3 The Ogawa Passive sampler.
Fig. 1 Concentration of NH3and NHx (NH4++ NH3).
NH4++NH3
0
50
100
150
200
250
300A
pr-03
Jul-
03
Oct
-03
Jan-04
Apr
-04
Jul-
04
Oct
-04
Jan-05
Apr
-05
Jul-
05
Oct
-05
Jan-06
Apr
-06
Jul-
06
Oct
-06
Jan-07
nm
ol m
-3
FP Denuder
NH3
020406080
100120140160180
Apr-
03
Jul-
03
Oct-
03
Jan-04
Apr-
04
Jul-
04
Oct-
04
Jan-05
Apr-
05
Jul-
05
Oct-
05
Jan-06
Apr-
06
Jul-
06
Oct-
06
Jan-07
nm
ol m
-3
FP AD PS

SO2(g) and SO42-(p)
-3000-2000-1000
010002000
2005/6/1
2005/8/1
2005/10/1
2005/12/1
2006/2/1
2006/4/1
2006/6/1
2006/8/1
2006/10/1
2006/12/1
2007/2/1
2007/4/1
2007/6/1
Flu
x, μ
mol m
-2
Particle Gas
NH3(g) and NH4+(p)
-4000
-2000
0
2000
4000
2005/6/1
2005/8/1
2005/10/1
2005/12/1
2006/2/1
2006/4/1
2006/6/1
2006/8/1
2006/10/1
2006/12/1
2007/2/1
2007/4/1
2007/6/1
Flu
x, μ
mol m
-2
Particle Gas
Result 3Deposition components and Efflux components
•NH3,HONO and particulate components have a trend of efflux (Noguchi et al., 2006a; 2007b).•Particulate components would be affected by “Gas to Particle conversion”.•Wet +Dry depositions have influx trends except NHx components.•The flux of NHx should be consider with organic nitrogen compounds.
Fig. Effects of “Gas to particle conversion”
-25
-20
-15
-10
-5
0
5
10
15
20
25
Annual F
lux
(m
mol
m-2 y
-1)
Gas Particle Wet
HNO3 NO2 NO NO3-
HONO NH4+
NH3SO42-
SO2 Eff
lux
Influx
SO42-
NO3-
NH4+

Result 4 Interaction of HONO with Atmosphere - Forest
Teshio -HONO(2005.6-2006.3)
0.00
1.002.00
3.00
4.005.00
6.0005/06/0
2
05/07/0
2
05/08/0
2
05/09/0
2
05/10/0
2
05/11/0
2
05/12/0
2
06/01/0
2
06/02/0
2
06/03/0
2
06/04/0
2
nmol m
-3
10m 30m
Teshio -HONO(2005.6-2006.3)
-0.03
-0.02
-0.01
0.00
0.01
0.02
05/0
6/02
05/0
7/02
05/0
8/02
05/0
9/02
05/1
0/02
05/1
1/02
05/1
2/02
06/0
1/02
06/0
2/02
06/0
3/02
06/0
4/02
nm
ol m
-2
HONO NOx/2
Conc.
Deposition
Efflux of HONO is under 50% of NO2 deposition
・This results are agree with Hayashi and Noguchi (2006), Stemmler et al. (2006).・Diurnal variations of O3, NO, NO2, HNO3 should be analyzed not only HONO.
Stemmler et al. (2006) Nature 440, 195 – 198.
2NO2+H2O→HNO3+HONOH2O
HNO3
NO2 HONO
NO OH
Sun light
Concentrations of HONO in night time are higher than in daytime.
Oxidation

Result 5Application of the Dry deposition Measurements
• Developing the calculation program for dry deposition velocity using Inferential method..• Inferential method is useful for many species of land use not only for forest area.• However, this model should be improved for accuracy (ex. Application of Diurnal Model of
concentrations). • Thus, the calculation result is verified by the results of gradient method in Teshio site (net flux).
Calculation File for Dry deposition velocity Ver. 3http://www.hokkaido-ies.go.jp/seisakuka/acid_rain/kanseichinchaku/kanseichinchaku.htm
0
5
10
ppb
0.0
0.2
0.4
0.6
m s
-1
-50
0
50
100
150
0 2 4 6 8 10 12 14 16 18 20 22Hour
nm
ol m
-2
h-1
Avg. 75% 25%
Diffusion coefficient
Difference of O3 conc.
O3 deposition
Fig. Diurnal variation
Inferential methodDeposition = C×VdC: Concentration in the air, Vd: Depositionvelocity

Result 6 NHx Flux
Emissions of NH3Snowless season: the stomata of the larches and Sasa,the decomposition of the cut Sasa materials and soil.Snow season: Soil and Snowpack.Annual emission of 4.8 ± 0.1 kg N ha-1 yr-1, exceeded the annual wet deposition of NHX-N .
by Hayashi et al. (2008) in prep.

Result 7Variation of O3 concentration and AOT 40
●Teshio GC-Lag site
by Ishii et al. (2005)□:Damaged Larch Forest
利尻のオゾン濃度
y = 0.0695x - 44.854
R2 = 0.0423
0
10
20
30
40
50
60
702000年
4月
2001年
4月
2002年
4月
2003年
4月
2004年
4月
2005年
4月
2006年
4月
2007年
4月
ppb
O3 Conc. in RishiriA
pr. 2
000
Apr
. 200
1
Apr
. 200
2
Apr
. 200
3
Apr
. 200
4
Apr
. 200
5
Apr
. 200
6
Apr
. 200
7
0
20
40
60
80
100
120
2005/8/20
2005/9/9
2005/9/29
2005/10/19
2005/11/8
2005/11/28
2005/12/18
2006/1/7
2006/1/27
2006/2/16
2006/3/8
2006/3/28
2006/4/17
2006/5/7
2006/5/27
2006/6/16
2006/7/6
2006/7/26
2006/8/15
2006/9/4
2006/9/24
2006/10/14
2006/11/3
O3濃
度(ppb)
Using for AOT40 calc.(Day time in Apr.-Sep. )
Missing(Estimation by valid data)
O3
conc
. (pp
b)
AOT40 in Teshio: 13.5ppm h (over WHO guideline)
WHO guideline: 10 ppm h
(for protection forest)

Science Bulletin(Only related to Hokkaido Institute of Environmental Sciences)
• K. Hayashi, K. Takagi, I. Noguchi, T. Fukazawa et al. (2008)Ammoniacal nitrogen emission from a young larch ecosystem afforested after clear-cutting of a pristine forest in northernmost Japan. Water, Air and Soil pollution, in print.
• I. Noguchi et al.(2008) Effects of time resolution on the dry deposition estimating of air pollutants. Proceeding of 49th Annual Meeting of Japan Society for Atmospheric Environment, 515.
• I. Noguchi et al.(2007c) Measuring Concentrations of Nitrous Acid Gas by the Filter-Pack Sampling Method. Journal of Japan Society for Atmospheric Environment, 42, 162-174.
• I. Noguchi et al. (2007b) Deposition and efflux of nitrogen components in Northern forest site. Proceeding of 48th Annual Meeting of Japan Society for Atmospheric Environment, 568.
• I. Noguchi et al.(2007a) Sampling methods for atmospheric ammonia and particulateammonium (Annular denuder system, Filter pack and Passive sampler. Proceeding of 48th
Annual Meeting of Japan Society for Atmospheric Environment, 244-245. • I. Noguchi et al.(2006b) Concentrations of nitrous acid gas and its relationships with other
pollution components at urban and background site in Hokkaido. Proceeding of 48th Annual Meeting of Japan Society for Atmospheric Environment, 2C1024.
• I. Noguchi et al.(2006a) Ammonia gas flux including efflux from ground surface and its seasonal variation. Proceeding of 48th Annual Meeting of Japan Society for Atmospheric Environment, 2C1036.
• K. Hayashi and I. Noguchi (2006)Indirect emission of nitrous acid from grasslands indirected by concentration gradients. Journal of Japan Society for Atmospheric Environment, 41, 279-287.
• I. Noguchi, K. Matsuda (2006) Program File Development for the Estimation of Dry Deposition Velocity. Regional Scientific Workshop on Air Pollution and Acid Deposition.

Recent study (1)Improvement of accuracy for the estimation of flux
Development of estimation method of flux
①Measurement methodExpensive & complication
→low cost & simple (AD→FP+PS)
②Estimation methodFor the low time resolution components (ex. weekly), its flux can be estimated with accuracy using diurnal variation model of the diffusion coefficient and the difference of concentration.
Weekly average+ Model
y = 1.005xr = 0.913
Weekly averagey = 1.562xr = 0.906
0
30
60
90
120
150
0 30 60 90 120
Weekly deposion by accumulated half
time deposition,μmol m-2 h-1
Weekl
y de
posi
tion b
y W
eeky
conc.
avera
ge,
μm
ol m
-2 h
-1
Weekly average only Weekly average + Model
O3
Fig. Effect on weekly deposition of diurnal Model.

Recent study (2)Estimation of nitrogen cycle and of material balance
Gas
Dry deposition
NO 3-NO 3- NH 4
+NH 4+ HNO
3HONO NH
3HNO
3HONO NH
3NONO NO 2NO 2
Particle
3 43 4NO - NH +NO - NH +
Wet deposition
Precipitation
HONOHONO NH 3NH 3N2O 3 43 4
NO - NH +NO - NH +
Recent theme
Behavior of O3 and NOy related to the deposition and efflux of HONO
Elucidating of the NH3 emission system (during the preliminary survey)
Estimation of effects of “Gas to Particle conversion”
Significant references concerning the nitrogen cycle in Teshio siteHigh sensitive of Larch forest to O3 due to lack of nitrogen. (Watanabe et al., 2006)Nitrogen saturation by the effect of bamboo grass cutting in Teshio site (Fukuzawa et al.,2006)Nitrogen cycle affects on carbon cycle(Oren et al., 2001)Nitrogen flux between atmosphere and forest or soil (Noguchi et al., 2007; Hayashi et al., 2008)

Future study (1)Influence of high concentration O3 on forest
Plan of study (1)Measurement of Chlorophyll in leaf of bamboo grass and Lurch.(2)Distribution of O3 concentration
(Effect of season, altitude,location and so on)
Concentrations of O3 are high during March – May.
In addition, O3 concentration are dominated altitude in inland area.
Significant references concerning the ozone in Teshio siteTransported tropospheric O3 and its increasing trend. (K. Sudo and H. Akimoto, 2007)Relationships with Forest damage and O3 concentration. (T. Ishii et al., 2005)High O3 concentration and high AOT40 index in Teshio. (JELA,2007)High sensitive of Larch forest to O3 due to lack of nitrogen. (Watanabe et al., 2006)
Fig. Relation with O3 concentration and altitude (Ebana and Noguchi, 2008)
y = 0.0255x + 24 .46
0
10
20
30
40
50
60
0 200 400 600 800 1000
標高 m
オゾ
ン濃
度
pp
bv
O3
conc
entr
atio
n, p
pbv
Altitude, m

Flux Monitoring of Atmospheric Componentsin Teshio
Flux Monitoring
Tropospheric O3Nitrogen Cycle
Control of Forest
Monitoring of Carbon cycle
• HONO, NHx• Effects of Lightning• NO, N2O emission• Reaction of NO3
- in snowpack
• Detection of O3 influence• Distribution of O3• Interaction to snowpack• Reflection of UV at snow
surface
• Nitrogen control by bamboo grass control

Monitoring Site●Rishiri
●
Teshio
●Moshiri
●Ochishi▲Mashu
Snowcover sampling(60-70site)
Sapporo●

Thank you for your attention.Thank you for your attention.
Winter condition in Teshio