H.M.J.K. Herath...i FOREWORD Betel cultivation in Sri Lanka dates back to 340 B.C and betel holds a...
70
I Production and Marketing of Betel H.M.J.K. Herath Research Report No: 189 December 2015 Hector Kobbekaduwa Agrarian Research and Training Institute 114, Wijerama Mawatha Colombo 7 Sri Lanka
Transcript of H.M.J.K. Herath...i FOREWORD Betel cultivation in Sri Lanka dates back to 340 B.C and betel holds a...
I
Production and Marketing of Betel
H.M.J.K. Herath
Research Report No: 189 December 2015
Hector Kobbekaduwa Agrarian Research and Training Institute 114, Wijerama Mawatha
Colombo 7 Sri Lanka

II
First Published: December 2015
© 2015, Hector Kobbekaduwa Agrarian Research and Training Institute
Final Typesetting and Lay-out by: Dilanthi Hewavitharana
ISBN: 978-955-612-198-8

i
FOREWORD
Betel cultivation in Sri Lanka dates back to 340 B.C and betel holds a special cultural value in the Sri Lankan society. Betel is traditionally grown in home gardens and used for domestic needs. At present it is also cultivated as a commercial crop, mainly in Gampaha and Kurunegala districts. Sri Lanka produces good quality betel and it supplies for both domestic and foreign markets. Pakistan is known as the major importer of betel of Sri Lanka. However, betel growers have to face many difficulties both at production and marketing levels. Pest and disease attacks, high cost of production, unavailability of a proper market channel lead to less profit from betel farming and ultimately it results in less production of betel. The situation requires a proper analysis on betel production and marketing to identify the potentials and gaps in betel cultivation. Thus undertaking this form of research project which addresses the real issues faced by betel growers in Sri Lanka is appreciated. The report draws the attention of the relevant officers towards betel cultivation in Sri Lanka and helps elevate domestic farmers to the commercial level by proposing possible solutions to their issues in cultivation. Finally, it is believed that the living standards of betel growers in Sri Lanka would be upgraded and the marketing channel for betel production in the country would expand. Haputhanthri Dharmasena Director

ii
ACKNOWLEDGEMENT
We, first of all, must thank Director, Mr. Haputhanthri Dharmasena, Former Director, Mr. E.M. Abhayaratne and Deputy Director (Research) Mr. J.K.M.D. Chandrasiri of the Hector Kobbekaduwa Agrarian Research and Training Institute (HARTI) for giving us this opportunity and providing financial and other resources to encourage us towards completing this study successfully. Mrs. H.A.S.K. Sriyani, Training Officer, Mr. L.M.J.K. Lindara, Deputy Director, Chithra Malani, Research Development Assistant, Naranmala Betel Research Center, Department of Export Agriculture (DEA) are also gratefully remembered for their cooperation. Mr. S.M.A. Samarakoon, Senior Research Officer, Head of Human Resource and Institutional Development Division helped us throughout the study. Ms. Pradeepa Dembatapitiya, Statistical Assistant supported in the data analysis. Mr. E.U.A. Shantha, Statistical Officer, HARTI, Ms. M.B.A.H. Fernando and Ms. G.V. Dinesha Kumari, Casual Investigators of the project, worked hard during the field survey and data processing. Ms. C. Ramyalatha and Mrs. Dilanthi Hewavitharana of HARTI did typesetting and page setting of the report. Ms. Suharshi Perera, Editor of the institute did editing and Mr. S.A.C.U. Senanayake did proof reading of the final report. The Publication Unit of HARTI made arrangements for designing the cover page and printing of the report. We express our sincere gratitude to all of them. The success of the entire study was owing to the information provided by the betel farmers in the study areas and Agriculture Research and Production Assistants (ARPA) in the study area. We specially thank Mr.K.K.E.A.K.S Ehalawela, ARPA at the Deegalla Agrarian Service Centre for his support. The research team is extremely grateful to them and the officials of Agrarian Service Centers for sharing their experiences and spending their valuable time in this study. H M J K Herath

iii
EXECUTIVE SUMMARY Betel (Pipper betel) plays a major role in the Sri Lankan export market which contributes around Rs. 400-500 million annually. It has become one of the main income sources for many farmers in Kurunegala and Gampaha administrative districts of Sri Lanka. Since 1974, betel has gained a significant position in the export market while establishing a widely spread domestic market. Betel for export market is manly grown in Kurunegala district (65% of total betel production) and 22% of in Gampaha district. According to the statistical data, the main income source of around 25,000 to 40,000 families in Kurunegala, Gampaha and Kegalle districts is betel farming. Although the volume and corresponding value of exports from 1974 to 2005 have shown a fluctuation, it has brought in a substantial amount of foreign exchange to Sri Lanka. Although there is no accurate data on the extent of betel cultivation, evidence from various reports suggests that around 4000 - 5000 hectares of land are being used for betel cultivation. Pakistan is the major export market for Sri Lankan betel. Although betel is grown in Pakistan, consumers prefer Sri Lankan betel due to its superior quality. The main objective of this research was to identify constraints in betel productions for export marketing and to explore its developmental possibilities. The findings of the study indicate that, the average cost of cultivation of 1000 cuttings or sticks was estimated to be at Rs.167,217.00. Gampaha district is the highest in terms of cost of production (Rs.190,530) and Kurunegala district is the lowest (Rs.143,904). Cost of construction of betel field takes the highest share of production cost (25.42%) followed by land preparation and transplanting (19.64%), irrigation (19.17%), fertilizer application (17.05%), pesticides (5.46%), harvesting and crop maintenance (5.34%), packing, marketing and transport (4.66%), and weeding/inter-culturing (3.28%). The total variable production cost was estimated at Rs.167,217.00. Thus, this crop is a highly capital intensive crop. The overall analysis of costs incurred in the cultivation of betel suggests a relationship between cost and the family size, for example, cost of cultivation increases with decrease of family size. The analysis of cost of production of betel per 1000 sticks reveals that on average, the cost of production per 10,000 leaves was estimated at Rs.7,761 which varied from Rs.8,309 to Rs.5,165 across the sample districts of Kurunegala and Gampaha. The calculated data of gross income and net returns indicate that at overall level, gross income per 1000 sticks was estimated at Rs.259,432 and net income to be at Rs.92,215. The study identified three export channels; channel one is a wholesale exporter whose share is 73.46% offers a low price compared to the other but the money is paid to farmers in time. The constraints identified in this study were categorized under two sections: growers reported that disease severity was the main constraint, in terms of economic constraints, inadequate marketing facility ranked first drawing 78 per cent of the 76 growers’ concern.

iv
1 Majority of the farmers (81.3%) recommended the establishment of Dedicated Economic Centres (DECs) for betel export market (In 2004 a similar initiative was established in Apeladeniya in Kurunegala district). As shown by the construction cost of betel field constituting a significant portion of the total expenditure on production, it is necessary to develop a more economically viable method for its production (low cost technique for its construction, particularly for betel stick. Commission agents who are employed under private organisations are in control of the entire marketing system devoid of organised marketing and government machinery. Therefore, the government systems could be useful in addressing the malpractices in the current marketing system which is controlled by private traders. As a solution Sri Lankan and Pakistan governments need to introduce an e-tendering system for betel farmers (Betel Produce Marketing Committee- BPMC)).
v
LIST OF CONTENTS
Page
No.
FOREWORD i
ACKNOWLEDGEMENTS ii
EXECUTIVE SUMMARY iii
CONTENTS v
LIST OF TABLES viii
LIST OF FIGURES ix
ABBREVIATIONS x
CHAPTER ONE
Introduction
1
1.1 Background 1
1.2 Problem of Study 1
1.3 Research Objectives 5
1.4 Limitations 5
1.5 Methodology 6
1.5.1 Selection of Growers 6
1.5.2 Selection of Market Functionaries (Traders) 6
1.6 Method of Data Collection 7
1.6.1 Calculation of Costs 7
1.6.2 Method of Data Analysis 7
CHAPTER TWO
Review of Literature
9
2.1 Introduction 9
2.2 Production and Marketing of Betel 9
2.3 Betel Sticks per Acre 10
2.4 Export Quality of Betel Leaves Grading 11
2.5 The Review of India in Betel Production and Marketing 11
CHAPTER THREE
Socio-Economic Information of the Respondents
13
3.1 Introduction 13
3.2 Main Characteristics of the Family 13
vi
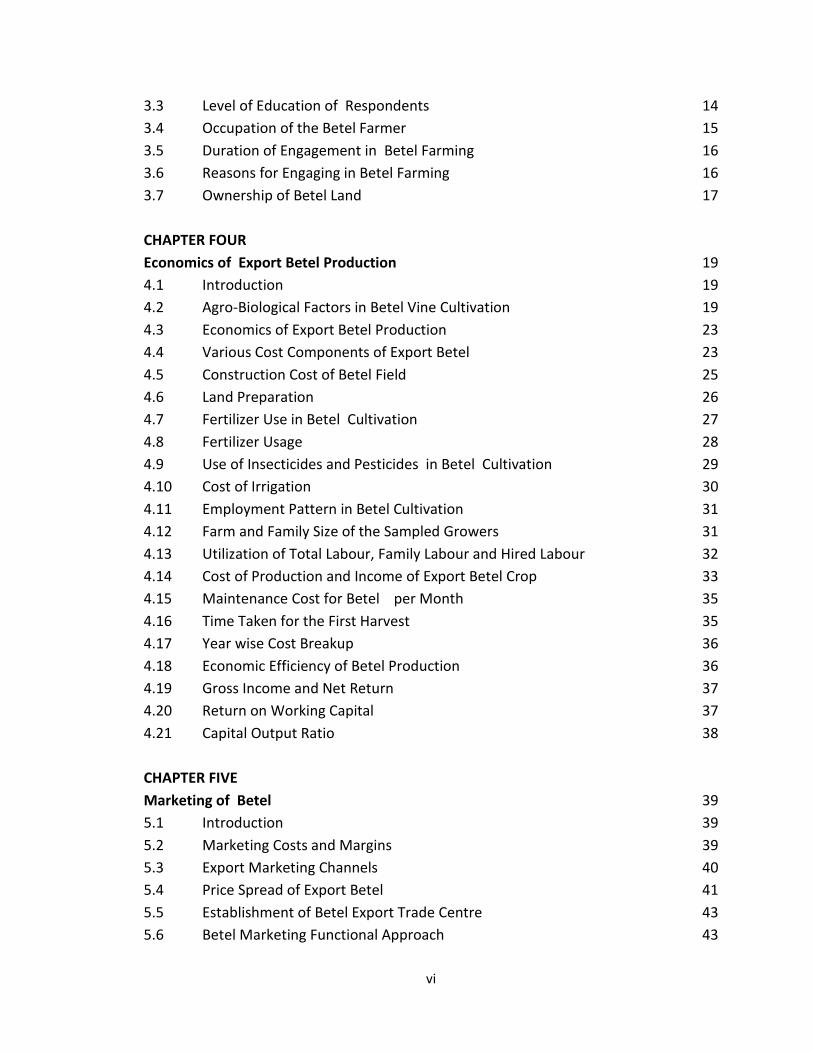
3.3 Level of Education of Respondents 14
3.4 Occupation of the Betel Farmer 15
3.5 Duration of Engagement in Betel Farming 16
3.6 Reasons for Engaging in Betel Farming 16
3.7 Ownership of Betel Land 17
CHAPTER FOUR
Economics of Export Betel Production
19
4.1 Introduction 19
4.2 Agro-Biological Factors in Betel Vine Cultivation 19
4.3 Economics of Export Betel Production 23
4.4 Various Cost Components of Export Betel 23
4.5 Construction Cost of Betel Field 25
4.6 Land Preparation 26
4.7 Fertilizer Use in Betel Cultivation 27
4.8 Fertilizer Usage 28
4.9 Use of Insecticides and Pesticides in Betel Cultivation 29
4.10 Cost of Irrigation 30
4.11 Employment Pattern in Betel Cultivation 31
4.12 Farm and Family Size of the Sampled Growers 31
4.13 Utilization of Total Labour, Family Labour and Hired Labour 32
4.14 Cost of Production and Income of Export Betel Crop 33
4.15 Maintenance Cost for Betel per Month 35
4.16 Time Taken for the First Harvest 35
4.17 Year wise Cost Breakup 36
4.18 Economic Efficiency of Betel Production 36
4.19 Gross Income and Net Return 37
4.20 Return on Working Capital 37
4.21 Capital Output Ratio 38
CHAPTER FIVE
Marketing of Betel
39
5.1 Introduction 39
5.2 Marketing Costs and Margins 39
5.3 Export Marketing Channels 40
5.4 Price Spread of Export Betel 41
5.5 Establishment of Betel Export Trade Centre 43
5.6 Betel Marketing Functional Approach 43

vii
CHAPTER SIX
The Constraints Faced by the Betel Growers
45
6.1 Introduction 45
6.2 Constraints in the Production of Betel 45
6.3 Economic and institutional Factors 46
6.4 Constraints in the Problems in Marketing of Export Quality Betel 48
6.5 Interface Marketing of Export Betel 50
CHAPTER SEVEN
Findings, Conclusion and Recommendations
Suggestion and Policy Implications
53
REFERENCE 56

viii
LIST OF TABLES
Page
No.
Table 1.1 Selection of Respondents 06
Table 3.1 Age Distribution of the Export Betel Farmers 13
Table 3.2 Distribution of Export Betel Farming by Gender 14
Table 3.3 Level of Education of Sample Farmers 15
Table 3.4 Occupation of the Betel Farmer 15
Table 3.5 Duration of Engagement in Betel Farming 16
Table 3.6 Reasons for Engaging in Export Betel Faming 17
Table 3.7 Ownership of Betel Land 17
Table 4.1 Various Cost Components of Betel Cultivation for One Year 22
Table 4.2 Percentage of Various Cost Components of Betel Cultivation 24
Table 4.3 Construction Cost of Betel Field (One year) 25
Table 4.4 Estimated Cost of Land Preparation (One year) 26
Table 4.5 Fertilizer Use in Betel Cultivation 27
Table 4.5.1 Fertilizer Usage by District 28
Table 4.6 Types of Insecticides and Pesticides Used in Betel Cultivation 29
Table 4.7 Cost of Irrigation 30
Table 4.8 Irrigation Use by District 31
Table 4.9 Operational Holding and Size of Family 32
Table 4.10 Family and Hired Labour per 1000 Sticks of Betel 33
Table 4.11 Total Expenditure and Production of Export Betel 34
Table 4.12 Maintenance Cost per 1000 Sticks per Month 35
Table 4.13 Time Taken for Harvest 36
Table 4.14 Year wise Estimated Breakup of Cost Involved in Betel
Cultivation
36
Table 4.15 Estimated Gross Income and Net Return per 1000 Sticks 37
Table 4.16 Percentage Return on Working Capital by District 37
Table 4.17 Per Capital Output Ratio 38
Table 5.1 Pattern of Betel by Channel 40
Table 5.2 The Time of Payment for Farmers 41
Table 5.3 Price Spread per 10,000 Leaves of Betel Through Various
Marketing Channels
42

ix
Table 5.4 Agreement of Establishing a Betel Export Trade Centre 43
Table 6.1 Agro Biological Factors Limiting Production 45
Table 6.2 Cost of Input and Institutional Factors Limiting Production 46
Table 6.3 The Problems in Marketing of Export Betel 49
LIST OF FIGURES
Page
No.
Figure 1.1 Betel Production Level by District for 2010 and 2011 02
Figure 1.2 Extent of Export Betel Cultivation 2002 – 2011 03
Figure 1.3 Betel Export Price and Quantity 03
Figure 4.1 Average Price of Export Betel at Kuliyapitiya Fair 34

x
LIST OF ABBREVIATIONS
AD - Anno Domino (Christian calendar concept)
ADC - Agrarian Development Center
ARPA - Agriculture Research and Production Assistant
BC - Before Christ (Christian calendar concept)
BPMC - Betel Produce Marketing Committee
DCS - Department of Census and Statistics
DEA - Department of Export Agriculture
DEC - Dedicated Economic Center
HARTI - Hector Kobbekaduwa Agrarian Research and Training Institute
RCBD - Randomized Complete Block Design

1
CHAPTER ONE
Introduction 1.1 Background The scientific name of betel is (Piper betel Linn). It belongs to the family of piperaceae, i.e. the black pepper family. It has been very intimately connected with the ancient Sri Lankan history, religion and culture as is evident in many early Sanskrit scriptures (3000 BC), such as Vedas, Ramayana, Mahabharata and Mahavamsha. Marcopolo (1295 AD) recorded the betel chewing habit of the people in Sri Lanka. It is essentially offered after meals and also during other social gatherings. Medicinal properties of betel were recognized during 600 AD when the Ayurvedic system of medicine came into practice. Betel leaves are beneficial to the throat and remove viscidity in human beings. Leaves help digestion and tend to remove the bad smell of the mouth. The juice of betel leaves is used as an adjunct to pills administered in the Ayurvedic medicines. The freshly crushed leaves are used as an antiseptic for cuts and wounds. It is also good for the respiratory system and is used in treatment of bronchitis, cough and cold (Chopra et al, 1958). The leaves of the betel plant have been traditionally used for chewing. Betel chewing is considered as a good and cheap source of dietary calcium. It increases digestive capacity when used with lime. Besides, it neutralizes the acidity and acts as a blood purifier. The main constituents of betel leaves are vitamin B and C and carotene. Betel plays a major role in the Sri Lankan export market by contributing an average of Rs.400-500 million annually and it has become the main income source for many farmers in Kurunegala and Gampaha administrative districts of Sri Lanka. Since 1974, betel has gained a significant position in the export market in addition to a well spread domestic market. Betel for export market is manly grown in Kurunegala district (65% of
total betel production) and in Gampaha district (22%) (Sumanasena et al, 2005a). According to the statistical data, around 25,000 to 40,000 families’ sole income is betel farming in Kurunegala, Gampaha and Kegalle districts. Although the volume and corresponding value of exports have shown a fluctuation from 1974 to 2005, it has brought in a substantial amount of foreign exchange to Sri Lanka (Anon, 2004). Although there are no accurate findings on the betel industry and about the extent under cultivation, 4000 - 5000 hectares have been used for the betel industry.

2
Source: Export Agriculture Department, 2013
Figure 1.1: Betel Production Level by District for 2010 and 2011 Production of betel is widespread in many districts in Sri Lanka but Kurunegala, Gampaha, Kegalle, Kalutara, Colombo, Ratnapura, Matara and Galle have more potential to grow betel. (Figure 1.1). The Export Agriculture Department took action with the funds of Secondary Perennial Crop Development Project to improve productivity with high technology by using special technical training and demonstrations. Because of that the land extent (Figure No 1.2) under betel cultivation has increased. Betel leaves were harvested at 21 day intervals as per the requirement of the export market. Leaves were categorized into four groups namely, Large peedunu kola, Small peedunu kola, Large kanda kola and Small kanda kola as per Department of Export Agriculture’s guidelines (Anon, 2004) prior to the collection of data.
0
200
400
600
800
1000
1200
Co
lom
bo
Gam
pah
a
Kal
uta
ra
Gal
le
Mat
ara
Pu
ttal
am
Ku
run
ega
la
Keg
alla
Rat
hn
apu
ra
Kan
ay
Mat
ale
Nu
war
a E
Bad
ulla
Mo
nar
agal
a
Jafn
a
Man
nar
An
ura
dh
apu
ra
Po
lon
nar
uw
a
Trin
com
ali
Bat
ical
o
Am
par
a
Ham
ban
tota
Mah
awel
i-H
Exte
nt
and
Pro
du
ctio
n h
ect
ars
Districts
2010
2011

3
Source: Export Agriculture Department, 2013
Figure 1.2: Extent of Export Betel Cultivation 2002 – 2011
The number and the weight of leaves were recorded on vine basis. Factors such as requirement of continuous supply of Nitrogen in limited quantities for optimum yield of good quality leaves (Mishra et al., 2005), and fairly high profitability from export quality betel leaves (Kalubulath) prompt farmers to apply expensive new granular form fertilizer mixtures or recommended straight betel fertilizer mixture in excess.
Source: Export Agriculture Department, 2013
Figure 1.3: Betel Export- Price and Quantity Figure 1.3 shows that from 2002 to 2007, price and the export quantity increased but after 2007 the export quantity of betel production decreased. The reason for the reduction of betel export was the production prices which overrode the market prices of
0
500
1,000
1,500
2,000
2,500
3,000
3,500
2002 2003 2004 2005 2006 2007 2008 2009 2010 2011
He
ctar
e
Year
0
100
200
300
400
500
600
700
800
0
1000
2000
3000
4000
5000
6000
Pri
ce (
Rs.
Mill
ion
s)
Qu
anti
ty (
Mt)
Year
Quantity (Mt) Price (Rs.Millions)

4
betel. As a remedial measure, in 2004 the Department of Export Agriculture and Ministry of Agriculture planned out a betel farmers’ organization under the guidance of betel crop development national programme in 2006 (“Bulath Arunella”/National Betel Development Programme 2006). Even though the Government needs to develop local and foreign market this problem has not been solved yet. However, after 2009 betel production for the export market has been increasing gradually due to establishment of farmer field demonstrations, conducting of training programmes and encouragement from the Export Agriculture Department. The department took steps under the funds provided by the “Second Perennial Crop Development Project” to improve productivity with high technology by using special technical training and demonstrations. As a result, the land extent under betel cultivation has increased. Pakistan is the major market for Sri Lankan betel though it too grows betel in the country. The consumers prefer Sri Lankan betel because of the high quality. Pakistan’s estimated daily consumption is 50 tons of betel and they produce 35 tons in their country. Fifteen tons are imported from Sri Lanka, India, Thailand and Bangladesh. Sri Lanka exports 76% of betel to Pakistan. The main reason for the preference of Sri Lankan betel is its good appearance and the taste. However, betel producers face grave problems due to price fluctuations and betel producers are losing interest following uncertain situations in the market. During this time in Sri Lanka, there is a huge increase in production; however Pakistan has less interest in Sri Lankan betel therefore the local economic level of betel has decreased gradually. Pakistan is the main importing country of our betel and the export income is gradually increasing. But there is a reduction in betel production. Failure to receive a certified price for farmers is the reason. In Pakistan, 95% of betel imports are mainly used for chewing. However, countries such as England, Canada and Japan use betel to make value added products such as tooth paste, soap and detergent. Five per cent of betel export is used for value added medicinal products. It is revealed that price of 1000 betel leaves has reduced from Rs 5000 to Rs 900 during 2-5 weeks. These price reductions may be due to monopoly of the betel market. The domestic betel value chain indicates that there are eight major actors namely input suppliers, producers, collectors, processors, wholesalers, retailers, exporters and consumers who are directly involved in the primary activities of the value chain. Chain supporters such as the Department of Export Agriculture, Export Development Board, farmer organizations, financial institutions, private sector and universities are involved in research and development, financial, marketing and extension services. Major inputs include planting material, farm machinery and dead supports for betel vines, to grow on capital, fertilizer, agro-chemical and labour provided by the Department of Export Agriculture, fellow farmers and private companies. Price fluctuation, lack of consistent supply and quality betel planting material, lack of technical and market information flow among the value chain actors are the main constraints faced by collectors and marketers.

5
1.2 Problem of Study The high cost of production, insufficient price, insufficient water, high fertilizer cost, difficulties in finding and transporting of sticks for Pandalam/supporting structure of the vine, finding of healthy disease free planting materials(tender cuttings), unavailability of an organized domestic market and organized dominant trade centre, no justifiable prices, determining the prices through bargains by middlemen are the problems faced by the farmers in betel cultivation (Rathnasoma, 2002). The growers are very much unorganized and not used to maintaining proper production and marketing statistics of their products. The traders are very much reluctant to furnish data regarding the actual price prevailing in the market and profit earned. Thus, it is very difficult to obtain accurate basic output data. Since prices of betel highly fluctuate, growers/traders are unable to provide accurate data on benefit/profit earned from its production and trade. Critical marketing problems of betel industry are fluctuation, low prices than high cost of production. Sri Lanka is recognized as one of the best producers of spices in the world. However, it was noted that there was a wide information gap among different actors of the betel value chain, hindering the achievement of the above target. Therefore, this study aims at analyzing the betel value chain, focusing on two major betel cultivating districts, namely Kurunegala and Gampaha. 1.3 Research Objectives
1. To identify constraints in betel productions for export market and explore its developmental possibilities.
2. To study the marketing of betel with reference to marketing channels and the price spread.
3. To assess the cost/benefit of betel production process. 4. To study the farmers’ views and suggestions to establish main trade centre for
exporting. 1.4 Limitations 1. The growers are very much unorganized and not used to maintaining proper
production and marketing statistics of their products. 2. The traders are very much reluctant to furnish data regarding the actual price
prevailing in the market and profit earned etc. Thus, it is very difficult to obtain fully accurate basic output data.
3. Since prices of betel highly fluctuate, growers/traders fail to supply exact data of benefit/profit earned from its production and trade.

6
1.5 Methodology 1.5.1 Selection of Growers
For the purpose of the study, Kurunegala and Gampaha districts were selected purposively, because contribution for total betel exports is 65% and 22% respectively from the two districts. In choosing the sample of betel growers an attempt was made to select the sizeable number of growers, as per the proposed study design. However it was found that the cultivation of this crop is in a very limited area and so it was very difficult to categorize the growers according to the number of betel vine sticks used which ranged between 500 to 1000 as per the records available in the respective Agrarian Development Centres. Village wise probability proportion method for the selection of ultimate growers was adopted. About 25% of the betel growers formed the sample of the study. Table 1.1: Selection of Respondents
District
Name of A.D. C. Total Number of Growers under
Each A.D.C.
Number of Respondents
Selected
Kurunegala Kuliyapitiya 120 30
Kitalawela 92 23
Yakwila 136 34
Deegalla 52 13
Alawwa 80 20
Gampaha Maradagahamula 52 13
Udugampola 28 7
Mirigama 80 20
Total 640 160 Source: Agrarian Development Centre
1.5.2 Selection of Market Functionaries (Traders) To examine the price spread of producer and retailers of betel, four POLA markets from the two districts were chosen: Kuliyapitiya, Kadanegedara, Alawwa and Narammala. The sample comprised four middlemen, and two local and two foreign exporters from each district to investigate the betel export marketing channels. 1.6 Method of Data Collection The data related to production and marketing were collected by a survey method. The reference year of the data collection was May 2012 to September 2012. Secondary

7
information related to potential, cost of production, growing areas’ agronomic practices on cultivation of betel vine, extent of crop was collected from the offices of the respective Agrarian Development Centres and districts. The marketing aspect was studied with the help of traders chosen in order to obtain information about betel production and marketing practices. The research team visited sampled areas with well structured and pre-tested questionnaire-cum-schedule for collection of desired information. The secondary data was also collected through websites, journals, and publications of the Agriculture Department and Department of Export Agriculture. 1.6.1 Calculation of Costs A. Labour Cost Three types of labour were found engaging in different activities of betel cultivation.
1. Hired Labour 2. Family Labour 3. Permanent Labour
“Hired Labour” is employed only for labour intensive activities in betel cultivation while permanent labour is engaged in all most all the activities on the basis of monthly payment. B. Land Cost The payment made by the grower, on either owned or leased individual plot was considered as the land cost. The other input costs, such as manure, fertilizer, insecticides, pesticides and irrigation were calculated on the basis of market value prevailing during the reference year. The costs of building, machinery and implements were worked out at the current market price subtracting depreciation. 1.6.2 Method of Data Analysis Garrett’s Ranking Technique (Garrett, 1969) has been applied to analyze the primary data. The respondents were asked to rank the given factors that were limiting the production of betel and also to rank the problems in marketing. The order of merit thus given by the respondents was converted into ranks by using the formula.
Present position =
Where Rij - rank given for i-th factor by j-th individual Nj-number of factors ranked by j-th individual

8
The present position of each rank thus obtained converted in to scores by referring to a table given by Garrett and Woodworth. Then for each factor, the scores of individual are added together and divided by the total number of respondents for whom the scores were added. These mean scores for all the factors are arranged in descending order, ranks are given and the most limiting factor is identified. General tabular analysis was done with the help of simple average and percentage.
9
CHAPTER TWO
Review of Literature
2.1 Introduction This chapter briefly reviews the existing literature with a focus on the subject matter dealt with in the report. There have been a few studies focusing on betel production and marketing directly or indirectly by turn of the century and many of these were reviewed before the commencement of the survey to identity the matters relevant to the study. The literature reviewed included exportable betel quality, betel leaves grading process and review of other countries’ betel production and marketing. 2.2 Production and Marketing of Betel Betel is an evergreen, perennial climber widely grown all over Sri Lanka. The commercial product is the leaf, mainly used for chewing with arecanut, slaked lime, tobacco and some other ingredients. Betel chewing habit in Sri Lanka dates back to 340 B.C and during that time betel was an item used by the prestigious society of the country. The origin of betel is believed to be in Malaysia or in the surrounding East Asian region and it is said to have been introduced to Sri Lanka and other South Asian countries by Chinese and Arab merchants. However, over ten wild varieties of betel are found in Sri Lanka. Today betel is grown for local consumption and exporting and major betel growing countries are Sri Lanka, India, Thailand and Bangladesh. Pakistan is the major importer of Sri Lankan betel. Literature on exportable betel production and marketing in Sri Lanka is scanty. It is trained on poles or trellis. The leaves of this plant are economically and medically important. Betel leaves have been traditionally used for chewing along with other condiments. This chewing combination is quid and type of ingredients used could vary from country to country. In Sri Lanka more than 12 species found are endemic. Betel is a very good cash crop and is also cultivated in some other countries such as India, Bangladesh, Pakistan, the Philippine Islands, and East Africa (Sri Lanka Spice Council, 2010). Betel is a dioecious plant grown in Sri Lanka as a cash crop (Rathnasoma and Senavirathna, 2002). Betel leaves are used for chewing (Arulmozhiyan & Thambura, 1998). Sri Lankan betel industry has a long history dating back to 340 A.D. (Rathnasoma and Senavirathna, 2002). The major betel growing districts in Sri Lanka include Kurunegala (65%) and Gampaha (22%) mainly for exporting (Sumanasena et al, 2005 a). Since 1974, betel has gained a significant position in the export market in addition to a well spread domestic market. Pakistan is the major market for Sri Lankan betel. Although the volume and corresponding value of exports have shown a fluctuation from

10
1974 to 2005, it has brought in a substantial amount of foreign exchange to Sri Lanka (Anon, 2004). Betel is a semi-woody, perennial climber. It shows dimorphic branching habit. The orthotropic vegetative branches have adventitious roots that adhere to the supports. Plageotropic axillary branches which bear fruits do not have roots (Rathnasoma and Senavirathna, 2002). Therefore, betel vines should be trained on to supports, which should be established in the field three weeks after planting. Then the arial roots of the betel vine may climb easily (Anon, 1984). In all betel-growing countries, both live and dead supports are used in betel cultivations. In India, mainly live supports such as Sesbania grandiflora and Erythrina indica are used by betel growers (Chaugule, 1960). In Sri Lanka, betel growing farmers are using “Varaniya, Kuratiya, Malkera, Kabella, Andara and Godapara” which are wild bushy type trees and most of them are found in natural forests or man made forests. Due to deforestation, availability of these sticks has reduced and the scarcity has compelled the betel growers to look for alternatives. As a result, potential materials that can be used as supports for betel vines need to be studied. Hence, the use of coir ropes, teak side branches, Kooratiya and Gliricidia sepium as supports are tested in the following experiment. Betel stem cuttings were planted in the "flat sunken" beds in size of 240cm x 120cm. There were 24 sticks for 48 vines (two betel vines per stick) in one plot and total of 216 sticks and 72 coir rope supports for the whole experiment. The betel was planted in three rows at spacing of 45cm between rows and 30cm within a row. Each plot was established 150 cm (5 feet) apart. Standard cultural practices were followed. Establishment of supports was done using Teak sticks (T1), Kooratiyta sticks (T2), Coir rope supports (T3) and Gliricidia sticks (T4) as the treatments of the experiment. The experiment was laid out in a RCBD with three replications. The data recorded were, 1) Total yield/plot/harvest (Total number of leaves), 2) Percentage of large leaves/harvest, (Leaves more than 16 cm in length and 12 cm in width were considered as large leaves) 3) Weight (g) of 100 "peedunu" leaves, and 4) Number of replacing times of supporting materials. Harvesting of leaves commenced during the 26th week after planting. After harvesting, the total number of leaves/plot was counted and fresh weight of leaves was measured using top – loading balance. Harvested leaves were sorted according to the size of the leaves and categorized as large leaves and small leaves. The percentage of large leaves was calculated. The number of replacing times of supporting materials was also recorded. Scoring index was devised to find out the best supporting material considering all the data recorded. 2.3 Betel Sticks per Acre Department of Export Agriculture (2004) on betel published by the Department of Export Agriculture has identified the number of betel sticks per acre as 4704 and the number of planting beds – 98 per acre, 48 sticks per bed in three rows, (Stick 4704 ÷ 4 = 1176 stick per acre ¼ (quarter acre).

11
2.4 Export Quality of Betel Leaves Grading The study of Sumanasena and Chandana (2005) revealed the both Kanda Kola and Peedunu Kola were significantly improved under daily irrigation (5mm per day), but no distinct change was observed on the leaf production with change of irrigation method from conventional manual splash irrigation using a domestic bucket to drip irrigation. In this study, the current fertilizer recommendation performed almost similar to the granular fertilizer in betel leaf production. Application of daily watering at approximately five mm depth equivalent for betel vines, whenever any intermittent dry spell approached five consecutive dry days or longer, seems to be advisable for continuous production of export quality betel leaves throughout the year. Betel harvest (number of leaves and fresh weight) was recorded on vine basis. Leaves were categorized into four groups as follows. Peedunu large leaves: Leaves of plageotropic branches having an approximate length of 25cm and width of 16cm at the widest point. Peedunu small leaves: Leaves of plageotropic branches having an approximate length of 18cm and width of 11cm at the widest point Kanda large leaves: Leaves of orthotropic branches having an approximate length of 20cm and width of 15cm at the widest point. Kanda small leaves: Leaves of orthotropic branches having approximate length of 12cm and width of 08cm at the widest point. Betel farmers harvest leaves at 21 days interval for export market and leaves are sorted into the above categories using above dimensions and other factors such as crispness and dark green colour by their experience. The farm gate/local market selling prices of the betel leaves are based on the above grouping. Betel leaves are the sole marketable product of betel cultivation and therefore, betel leaves were harvested during the study period. The weight of a betel leaf (as grams) is also one of the important parameters, as selling price of export quality leaves are indirectly associated with it. Even though farm gate sales are decided on the number of leaves having dark-green colour and brittleness, the real quality of Kalu Bulath is at export level. For example, a basket of 9kg having 25-28 bundles (Bulath Atha or a sheaf of 40 leaves) is considered as the best quality in comparison to a basket of 9kg having 35-40 bundles. 2.5 The Review of Indian Experiences in Betel Production and Marketing In 1978, the Government of West Bengal reported that a piece of 16.5 decimal of land under the betel cultivation was considered to be an economically viable unit for

12
sustenance of a five-member family. Saniyapan and Marimuthu (1982) conducted a comparative study and found that per acre cultivation expenses were higher in betel in comparison to banana and sugarcane. They also found that per acre income in betel cultivation was six times higher than that of banana and sugarcane. On that basis, they suggested that the crop ‘betel’ is more remunerative than banana and sugarcane. There is considerable regional disparity in betel production. In some regions of the country, this crop is very risky and unremunerative, so other horticultural plants are replacing this. Gadre and Galgalikar (1988) in their study found that the cost of establishment of betel vine bareja (Bulath Kotuwa) was maximum, followed by human labour. They have also worked out the input output ratio, which is 1:2.10. It is fairly high. Sundaram (1987) observed that betel is a highly capital and labour intensive crop. Mukherjee and Giri (1991) observed that the yield of betel leaves varied in various months of the year. It was comparatively low during the winter months than in the summer months. Cost of cultivating a hectare of betel during the first three years (since establishment), was Rs.45,000. The cost benefit ratio is 1:1.85. The marketing of betel has been wide spread and scattered throughout the country. Even in this aspect, specific studies are very limited. It is reported that there is a special betel leaves market (Anon, 1986). It was observed that some undesirable conditions prevail in the course of marketing and affect the economy of the growers and traders (Anon, 1982). Some of the constraints are monopoly of the buyers, malpractices, inadequate transport and insufficient export promotion, etc. Grade and Galgalikar (1988) examined the price spread in betel leaf, which consisted of producer, trader, agents, wholesaler, and retailers. They found that the producer’s share in the consumer’s Rupee was 45 per cent. Ghoshal , Mazumder and Acharya (2010) observed in their study that betel farmers had been exploited by several middlemen during marketing because the farmers grew the crop with their indigenous knowledge and skill and long farm experience without any knowledge of scientific techniques. According to Kaleeswari and Sridhar (2013), betel cultivation and market crisis was observed in Karur District. Primary analytical method has been used for the purpose of conducting this research. The research was conducted in Krishnarayapuram block in Kulithalai Taluk of Karur District. The sample used in this emperical study consists of 94 respondents drawn through the simple random sampling technique. Information was gathered by personal discussions with farmers through an interview schedule by adopting convenience sampling technique. The secondary data was collected through websites, journals, and publications of the Agriculture Department. Garrett’s Ranking Technique has been applied to analyze the primary data. The respondents were asked to rank of the given factors that are limiting the production of betel and also to rank the problems in marketing. The order of merit thus given by the respondents was converted into ranks by using the formula.

13
CHAPER THREE
Socio -economic Information of the Respondents 3.1 Introduction
The chapter presents the primary data on the socio-economic background of the respondents, who engage in betel farming for exports and their main characteristics. The chapter presents data related to the level of education, age distribution, gender, occupation, experiences, reasons for involving and ownership of land.
3.2 Main Characteristics of the Family The present families in betel farming are mostly extended families consisting of head of the household (mostly the farmer), housewife and 4-5 children. Sometimes households also consist of some close relatives such as parents and grandparents of the farmer. Further, results of the survey indicate that the average family size of the sample of respondent is 4.53, which is greater than the national average of 4.0 (Department of Census and Statistics, 2010). The highest average household size in the Kurunegala district is 4.8. Nearly half of the households have 4 to 5 family members while only 61% of households have more than 6 members. Table 3.1: Age Distribution of the Export Betel Farmers
Age group of the
Farmer
Kurunegala Gampaha Both Districts
Number N=120
Percentage
Number N=30
Percentage
Number N=150
Percentage
<=25 1 8 2 6.7 3 2
26<=35 13 10.8 4 13.3 17 11.3
36<=45 26 21.7 9 30 35 23.3
46<=55 39 32.5 5 16.7 44 29.3
56<=65 30 25 4 13.3 34 22.6
65<= 11 9.2 6 20 17 11.3
Total 120 100 30 100 150 100 Source: Survey data, 2013
It is important to find out about the age group of farmers in this field. Thus , the table 3.1 depicts the majority of age group of people who are involved in this industry. It is essential to discover farmers’ age and then it can be identified which age group of people are involved in this field the most. This Table 3.1 illustrates that in Kurunegala people between age 46 and 55 years (32.5%) enaged in betel production represent the prominent group. Also the group
14
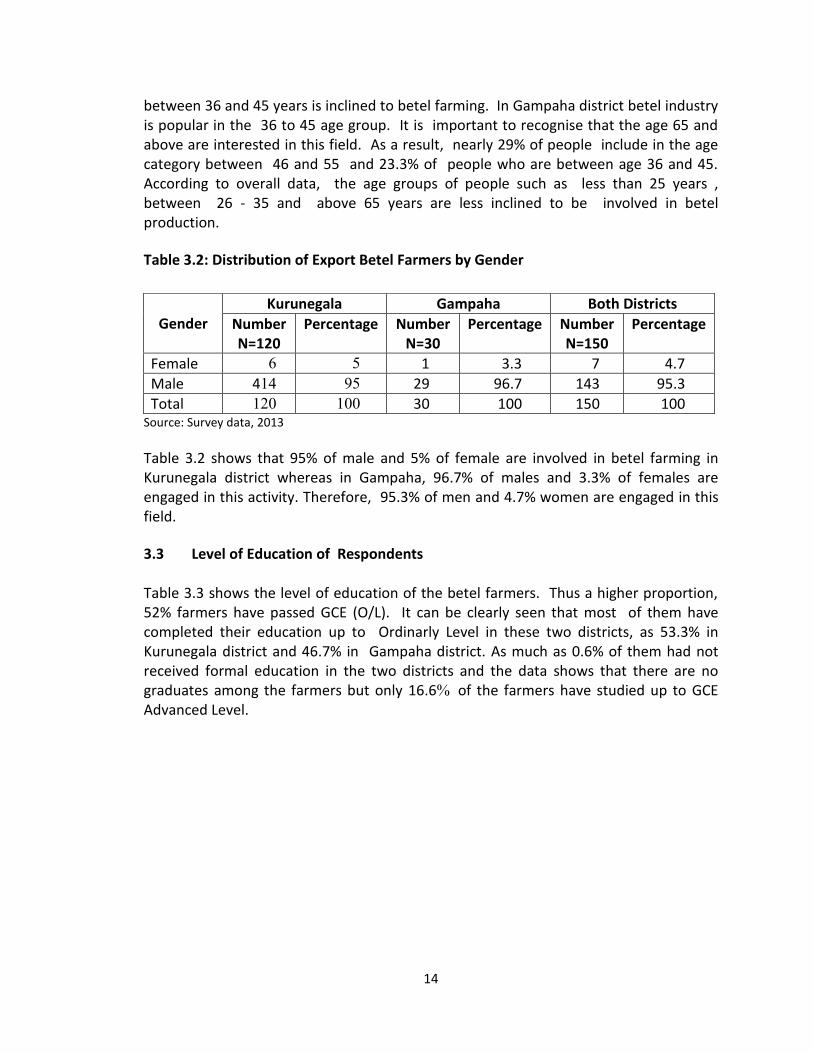
between 36 and 45 years is inclined to betel farming. In Gampaha district betel industry is popular in the 36 to 45 age group. It is important to recognise that the age 65 and above are interested in this field. As a result, nearly 29% of people include in the age category between 46 and 55 and 23.3% of people who are between age 36 and 45. According to overall data, the age groups of people such as less than 25 years , between 26 - 35 and above 65 years are less inclined to be involved in betel production.
Table 3.2 : Distribution of Export Betel Farmers by Gender
Source: Survey data, 2013
Table 3.2 shows that 95% of male and 5% of female are involved in betel farming in Kurunegala district whereas in Gampaha, 96.7% of males and 3.3% of females are engaged in this activity. Therefore, 95.3% of men and 4.7% women are engaged in this field.
3.3 Level of Education of Respondents Table 3.3 shows the level of education of the betel farmers. Thus a higher proportion, 52% farmers have passed GCE (O/L). It can be clearly seen that most of them have completed their education up to Ordinarly Level in these two districts, as 53.3% in Kurunegala district and 46.7% in Gampaha district. As much as 0.6% of them had not received formal education in the two districts and the data shows that there are no graduates among the farmers but only 16.6% of the farmers have studied up to GCE Advanced Level.
Gender Kurunegala Gampaha Both Districts
Number N=120
Percentage
Number N=30
Percentage
Number N=150
Percentage
Female 6 5 1 3.3 7 4.7
Male 414 95 29 96.7 143 95.3
Total 120 100 30 100 150 100

15
Table 3.3 : Level of Education of Sample Farmers
Level of Education
Kurunegala Gampaha Both Districts
Number N=120
Percentage
Number N=30
Percentage
Number N=150
Percentage
Not attended 1 0.8 0 0 1 0.6
Year 1-5 7 5.8 0 0 7 4.6
Year 6-11 29 24.2 9 30 38 25.3
Passed (GCE(O/L)
64 53.3 14 46.7 78 52
Passed (GCE(A/L)
19 15.8 6 20 25 16.6
Diploma 0 0 1 3.3 1 0.6
Total 120 100 30 100 150 100 Source: Survey data, 2013
3.4 Occupation of the Betel Farmer
Table 3.4 shows that more than 88.6 percent were engaged in farming. It was 90% from the Kurunegala district and 83.3% from the Gampaha district. The overall sample was 88.6%. In the Kurunegala district, 5% of farmers worked in the government sector and it was not seen that there were farmers who worked as government servants in the Gampaha district. It also shows that in the Kurunegala district 1.7 % of farmers worked in the private sector and others from the Gampaha district are self-employed and engaged in business. There are some pensioners who are involved in this field in both districts and it was 3.3%.
Table 3.4: Occupation of the Betel Farmer
Occupation
Kurunegala Gampaha Both Districts
Number N=120
Percentage
Number N=30
Percentage
Number N=150
Percentage
Farmer 108 90 25 83.3 133 88.6
Government employee
6 5 0 0 6 4
Agricultural Labourer
2 1.7 0 0 2 1.3
Self Employed 2 1.6 2 6.7 4 2.6
Pensioner 3 2.5 2 6.7 5 3.3
Total 120 100 30 100.0 150 100 Source: Survey data, 2013

16
3.5 Duration of Engagement in Betel Farming The main purpose of this reserach was to find out farmers’ betel farming experiences, their farming information which is in table 3.5 below. According to that information, four percent of farmers (4%) have experience in betel farming of above 41 years. About 31% of overall sample has between 11 and 20 years of experience. Secondly, 26% of the farmers belong to the category between 5-10 years of experience. Farmers whose experience is between years 21-30 are 26% of the sample. Betel farmers have extensive experience gained from father or grandfather. Such experience is a reason why the betel farmers do not heed the advice of the Agricultural Officers.
Table 3.5: Duration of Engagement in Betel Farming
Duration Years)
Kurunegala Gampaha Both Districts
Number N=120
Percentage
Number N=30
Percentage
Number N=150
Percentage
5<=10 28 23.33 12 40.00 40 26.67
11<=20 37 30.83 10 33.33 47 31.33
21<=30 37 30.83 2 6.67 39 26.00
31<=40 14 11.67 4 13.33 18 12.00
41<= 4 3.33 2 6.67 6 4.00
Total 120 100.00 30 100.00 150 100.00 Source: Survey data, 2013
3.6 Reasons for Engaging in Betel Farming The respondents have given more than one reason for engaging in betel farming. The table 3.6 below shows the reaons for involving in betel farming. According to the Table 3.6, 71.3% of farmers have been continuing this from generation to generation. Secondly, 67.3 % continue as a weekly income generating activity and thirdly, 64% are involved in this considering profitability. In the Gampaha district, 86.7 % of farmers have been involving in this as it is a traditional family venture. Nevertheless farmers from Gampaha district are involved in this because of convenience to practice during their free time.

17
Table 3.6: Reasons for Engaging in Export Betel Farming
Reason
Kurunegala Gampaha Total
Number N=120
Percentage
Number N=30
Percentage
Number N=150
Percentage
Traditional family occupation
81 67.5 26 86.7 107 71.3
Profitable 78 65.0 18 60.0 96 64.0
Weekly income generated
89 74.2 12 40.0 101 67.3
Convenience 33 27.5 17 56.7 50 33.3
Extra Income Source
47 39.2 8 26.7 55 36.7
Source: Survey data, 2013
3.7 Ownership of Betel Land There are two main types of land operations in two districts mainly, owner operation and operations without wages. Non-paid land operational methods are mainly based on lease, friendship and family relationship. Table 3.7 illustrates the ownership status of the betel land in both districts. Thus about 72.2% of the farmers in both districts owned betel lands and this means most farmers have at least one highland with single ownership. Information gathered on the ownership status of betel lands shows that if farmers cultivated more than one plot, they obtained the second or third plot through a friend or a relative without paying for it. Farmers have their own lands to grow betel and it is 72.7 % of the overall sample. Table 3.7: Ownership of Betel Land
Ownership
Kurunegala Gampaha Total
Number N=120
Percentage
Number N=30
Percentage
Number N=150
Percentage
Single 89 74.2 20 66.7 109 72.7
Joint 3 2.5 0 0.0 3 2.0
Non Paid 28 23.3 10 33.3 38 25.3
Total 120 100.0 30 100.0 150 100.0
Source: Survey data, 2013

18
It is shown that 72.7% of the farmers grow betel in their own land as a small scale production. The coconut cultivators in the selected area rent out their cultivated lands free of charge to betel producers and hence there is zero land cost for betel under such land plots. Approximately 25% of betel farmers in the sample cultivate in this manner. Coconut cultivators believe that intercropping betel in coconut lands leads to increasing soil fertility and it brings long-term benefits to coconut cultivation.

19
CHAPTER FOUR
Economics of Export Betel Production 4.1 Introduction In order to assess economics of betel production cost items have been grouped under two subheadings i.e., variable cost and working fixed cost. The variable cost consists of material used in the cultivation such as construction of woody sticks, Pandalam/ supporting structure of the vine, vine cutting costs, land preparation cost, fertilizer cost, plant protection cost, irrigation cost, inter-culturing cost, harvesting cost and packing cost. On the other hand, the fixed cost comprises land revenue, depreciation, and interest on fixed capital other than the land cost. 4.2 Agro-Biological Factors in Betel Vine Cultivation Climate Elevation – Betel can be successfully grown up to 1000m msl. Well-distributed annual rainfall enhances the growth of betel vines. Betel is a shade loving plant but produces better quality leaves in the wet zone and intermediate zones rather than in the dry zone. Appropriate shade levels and irrigation are essential for successful cultivation of the crop. Hot dry winds are harmful and retard the growth of the vine. The ideal weather condition for the plant is mild temperature, i.e., about 10°C in winter and about 40°C in summer for good growth of this shade loving plant. About 170cm rainfall and presence of high humidity 60 to 80% throughout the year is ideal for this crop. Below 10°C and above 40°C temperatures cause wilting. The vines grow fast and their vegetative growth is good under high humidity. The amount of air movement affects the rate of evaporation and is therefore, one of the chief factors controlling the water relations of betel vine (Sri Lanka Spice Council, 2010). Soil Betel can be successfully grown in well-drained, fertile soils in wet to dry climatic zone of Sri Lanka. Especially the lateritic and clay loam soils in Kurunegala and Gampaha districts are highly suitable for betel cultivation. Waterlogged, saline or alkali soils are not suitable for the growth of betel. However, this crop is very sensitive to saline and alkaline soils. The best performance is noticed in upland having slight alkaline to neutral soil with 07 to7.5 pH (Sri Lanka Spice Council, 2010). Field Planting Betel is usually planted in sunken beds. The field should be flat, well drained with good sun shine. The field should not have a betel cultivation infected with Bacterial Leaf Blight

20
at least for 2 years. After the land preparation, beds, usually in the size of 1.2m x 7.5m, are prepared. Bed size can vary with the space available. Adequate spacing should be left between beds to allow management practices and to control the spread of disease. Beds should be sterilized by burning straw on it. Around the cluster of beds a drainage canal of 30cm width, 60cm depth should be built. An artificial live or dead support should be provided to betel for upright climbing. Supports, called as stakes, are established in the beds at the spacing of 45cm x 45cm. Two cuttings are planted near a stake. Before planting, cuttings should be immersed in a fungicide mixture for about two minutes. Instead of beds, betel can be established as single plants. Cuttings are planted in 30cm x 30cm pits, filled with top soil and cow dung mixture, and stakes of 2-4cm diameter should be established as supports. The spacing between plants is 1.8 x 1.8cm. Either live supports of Gliricidia sepium or durable dead wood support can be used. Beds should be covered with coconut fronds or other shading material for about 4-6 weeks. Beds should be watered once or twice daily. Sprouting from cuttings starts within 20-45 days and after that shade should be removed gradually. (Department of Export Agriculture, Sri Lanka, 2013). Crop Management Fertilizer application Betel leaves are picked once in every 3-4 weeks and with that a substantial quantity of nutrients is removed from the field. Therefore application of chemical fertilizer is essential for a higher yield and better growth. Fertilizer recommendation Urea 195g Muriate of Potash 100g Triple Super Phosphate 65g Keserite 60g About 420g of the above mixture should be applied to 100 betel vines in every three weeks intervals. (Department of Export Agriculture, Sri Lanka, 2013). Organic fertilizer Initially cow dung or compost should be applied to the bed after about one month and it should be mixed well with soil without damaging the newly planted cuttings. Well composed poultry manure or goat manure can also be used for betel. Application of decomposed Glyricidia leaves is highly beneficial for better growth and a higher yield. It is generally trained either to live supports or dead supports but concrete post or coir ropes can also be used as substitutes.

21
Pruning at 1m height of the betel is preferred to increase the plageotropic branches and yield. After 1.2 m growth of the betel Trellis is established. (Department of Export Agriculture, Sri Lanka, 2013).
Standard quality specifications for export
There are no specific quality parameters for betel. But for export quality betel the following criteria is considered, Size of the leaf – At least 20cm in length and 15cm in width, Color – well matured dark Green color leaves , High pungency, Freshness of the leaves, Stem of the leaf must be 2.5-3cm (Department of Export Agriculture, 2004).
Diseases
Betel leaf blight is caused by a bacteria called Xanthomonas campestris betlicola. The disease becomes epidemic during rainy seasons. First characteristic symptom is moist oily patches on the other side of the leaves. Gradually they spread and turn brown or black. When the condition is serious these patches can spread to the stem resulting in shedding of leaves and nodes. Consequently the plant will die but the disease can easily spread into surrounding vines. No control measure has been identified other than destroying of the seriously diseased plants. Diseased and nearby plants should be burned at once. A chemical treatment can be done to control the spread. All matured leaves of the remaining vines should be removed and a chemical solution (mixture of 28g of copper based fungicide, 28g of Mancozeb and 28g of Captan dissolved in three gallons of water) should be sprayed once or twice to betel vines. The spread of disease can be controlled by lowering the application of chemical fertilizer and water for infected betel plots. Use of disease free planting material, use of an agro well or an isolated water source for irrigation and adhering to strict hygienic practices are important ways to avoid contamination. Occasional death of betel vines in a plot can be observed in some betel cultivations. The main reason for such situation is due to nematode attacks. Nematodes attack to root system cause partial destruction but secondary attacks of fungus and bacteria cause foot rot and destruction of root system causing consequently death (Sumanasena et.al, 2005).
Irrigation
Sensitivity of betel to stagnant water is well known. It needs a moist soil, but not too wet. That is to say, it requires frequent but light irrigation all-round the year. The plantation has to be located near the source of irrigation, which may be a pond, or a tank, a canal, or an irrigation well. Frequencies of irrigation depend upon intensity of light and humidity of atmosphere. During the dry season it is irrigated almost every day in the new plant and weekly in the old plant. During rainy season usually no irrigation is done, unless there are adverse climatic conditions. Excess of irrigation causes decay of roots and falling of leaves. Irrigation in betel crop was given through sprinkler or pot. The pot method is very costly because of the intensive labour use it needs (Balsubrahmanyam, 1992).

22
Harvesting In about 6 months, vines grow to a height of 150-180 cm. At this stage branching is noticed in the vines. Harvesting starts when the betel vine is grown up to 1.2-1.8m in length. Initially matured leaves (Kanda Kola) are removed in lower parts of the main stem 2-3 times. After that betel leaves are harvested both from main stem and lateral stems. For the export market, betel is harvested in three weeks’ intervals and for local market in two weeks’ intervals. Harvested betel leaves are bundled each having 40 leaves before sending them to the market. For export market those bundles are packed in specially prepared cane baskets. 4.3 Economics of Export Betel Production Cost items have been grouped under two subheadings i.e., variable cost and fixed cost. A detailed breakup of various cost components of betel production is presented in Table 4.1.The variable cost consists of the material used in the cultivation such as the fertilizer cost, plant protection cost, irrigation cost, inter-culturing cost, harvesting cost and packing cost. For evaluation of various cost items, we have assumed/estimated the following. Table 4.1: Various Cost Components of Betel Cultivation for One Year (Rs. Per 1000 sticks)
Particulars of Cost Heads
Operational or Variable Cost
Kurunegala N=120
Gampaha N=30
Average of the Districts
N=150
1 Construction Cost of Betel Field
38,677 46,410 42,483
2 Land Preparation and Vine Transplanting
33,064 32,624 32,844
3 Fertilizer Application 26,210 30,796 28,503
4 Pesticides Application 8,062 10,196 9,129
5 Irrigation Charge 13,009 51,113 32,061
6 Weeding/Inter-Culturing 5,632 5,333 5,483
7 Harvesting and Crop Maintenance
9,675 8,177 8,926
8 Packing, Marketing and Transport
9,575 6,004 7,790
Total Cost 143,904 190,530 167,217
Source: Survey data, 2013 (*All Operational or Variable Cost include family labour)

23
4.4 Various Cost Components of Export Betel The per 1000 sticks variable cost, on average, amounts to Rs.167,217 which was worked out to be 100 per cent of the total cost in cultivation of export betel. The Agrarian Development Center wise expenditure on cultivation indicates that in all the four sampled area per 1000 sticks cost varied with the situational variations. In Kurunegala and Gampha amongst the variable cost items per 1000 sticks such as the Construction Cost of Betel Field on average amounted to Rs.38,677.00 and Rs.46,410.00 respectively. Expenditure on Construction Cost of betel field was the highest in respect of all other expenditures, because it required various materials and a large number of labourers. Thus, Construction of betel field is a very costly item in the cultivation of betel crop. This structure is the prerequisite for cultivation of this crop because the crop is shade- loving and highly affected by weather conditions and air (wind) etc. The economic life of a betel field (1000 sticks) is about three years.
In the operations of land preparation and vine transplanting, generally lowering of betel vine is practiced. Expenditure in this operation varied from Rs.33,064.00 to Rs.32,624.00 in the districts – Kurunegala and Gampaha respectively. This operation constituted a higher amount of expenditure after the construction of land preparation and vine transplanting because it is the most important operation and highly labour intensive. Some farmers used machinery and others used labourers. Besides lowering the vine as one operation, it was one time expenditure in soil burning. It was equally important in the cultivation of the crop, and it is also labour intensive. Planting and covering has done at the same stage and planting is practised in morning and evening. Soon after planting, plants are covered with cadjans to protect from sun burning. But it takes a long time to find leaves for covering. However, the exact time taken was not recorded. Expenditure on fertilizer varied from Rs.26,210.00 to Rs.30,796.00 in the districts – Kurunegala and Gampha respectively. The expenditure on pesticide application varied from Rs.8,062.00 and Rs.10,196.00 in the districts– Kurunegala and Gampha respectively. There are numerous insecticides for the pests in the market. But pesticides are used when there is an outbreak of a pest attack. Betel is mostly cultivated under irrigated conditions in both districts. Thus, irrigation was an important cost item in the cultivation of betel vine. The per 1000 stick expenditure on irrigation was found to have varied from Rs.13,009.00 and Rs.51,113.00 in the districts – Kurunegala and Gampaha respectively. The higher cost incurred in irrigation may be due to the electricity cost. Further, Diesel and Glycerin pumps are used in this application hence more cost is required. Thus, the cost of irrigation was found higher in both districts. In the application of weeding/inter-culturing generally, lowering of vine is done at least three to five times a year. Expenditure in this operation varied from Rs.5,632.00 to Rs.5,333.00 in the districts – Kurunegala and Gampha respectively. This operation constituted a low amount because of intensive work of family labourers. Besides

24
lowering the vine as one operation, which was equally important in the cultivation of the crop, was addition of soil at least twice a year, which is also a labour intensive operation. Thus, the expenditure on inter-culturing, and other operations supporting of vine was also incurred by the growers. Due to a large number of vines a good number of supporting materials are required. Expenditure on harvesting and crop maintenance varied from Rs.9,675.00 to Rs.8,177.00, in the districts – Kurunegala and Gampha respectively. The higher cost of harvesting may be due to its performance by labour and this practice requires a number of labourers. Expenditure on packaging materials, marketing and maintenance of the harvested leaves varied from Rs.9,575.00 to Rs.6,004.00 in the districts Kurunegala and Gampha respectively. It is also labour intensive. The above analysis indicates that major items of expenditure in betel vine cultivation included construction cost of betel field, land preparation and vine transplanting (used machinery and some used labourers and soil burning), fertilizer and manure, agro chemicals, irrigation harvesting and packing. It is concluded from the analysis that betel though being labour intensive also requires very high capital in the production process. A detailed break-up of various cost components in percentage terms has been presented in Table 4.2 below. Table 4.2: Percentage of Various Cost Components of Betel Cultivation for a Year
(% /1000sticks)
Particulars of Cost Heads
Kurunegala N=120
Gampaha N=30
Average of the Districts
N=150
Operational or Variable Cost
Construction Cost of Betel Field 26.87 24.29 25.41
Land Preparation and Vine Transplanting
22.97 17.12 19.64
Fertilizer Application 18.21 16.16 17.05
Pesticide Application 5.60 5.35 5.46
Irrigation Charge 9.04 26.82 19.17
Weeding/Inter-Culturing 3.91 2.79 3.28
Harvesting and Crop Maintenance 6.72 4.29 5.34
Packing, Marketing and Transport 6.65 3.15 4.66
Total Cost 100.00 100.00 100.00
Source: Survey data, 2013
25
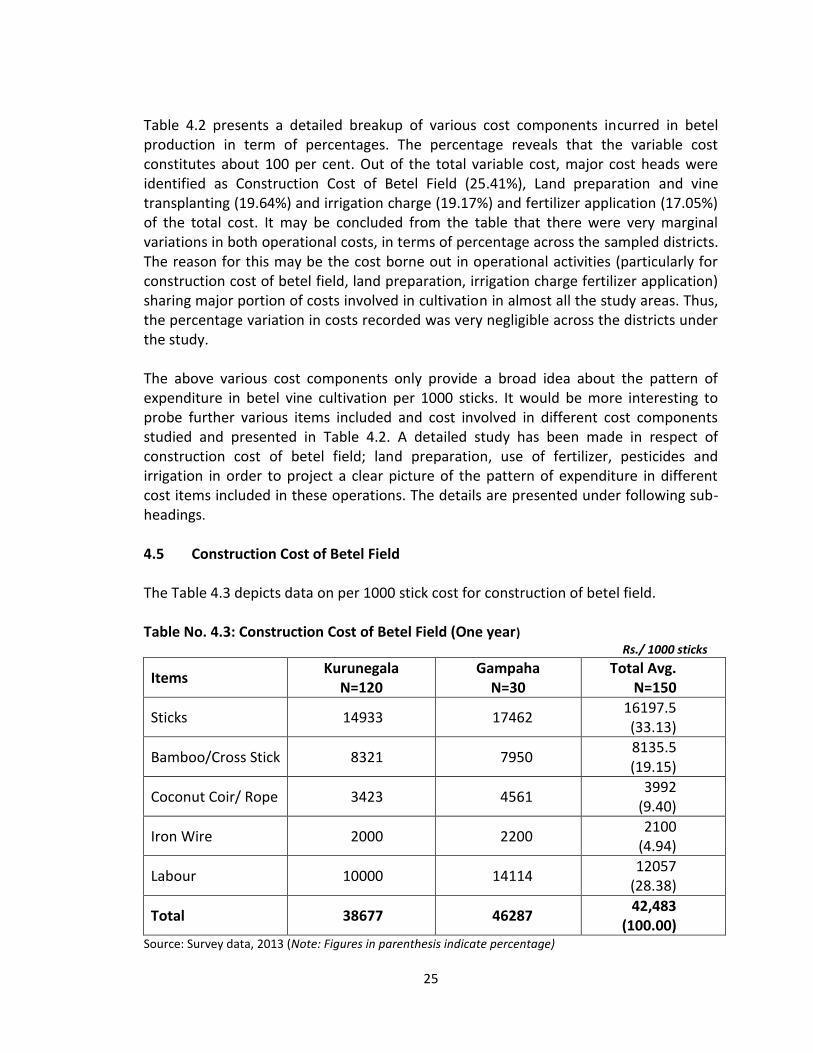
Table 4.2 presents a detailed breakup of various cost components incurred in betel production in term of percentages. The percentage reveals that the variable cost constitutes about 100 per cent. Out of the total variable cost, major cost heads were identified as Construction Cost of Betel Field (25.41%), Land preparation and vine transplanting (19.64%) and irrigation charge (19.17%) and fertilizer application (17.05%) of the total cost. It may be concluded from the table that there were very marginal variations in both operational costs, in terms of percentage across the sampled districts. The reason for this may be the cost borne out in operational activities (particularly for construction cost of betel field, land preparation, irrigation charge fertilizer application) sharing major portion of costs involved in cultivation in almost all the study areas. Thus, the percentage variation in costs recorded was very negligible across the districts under the study. The above various cost components only provide a broad idea about the pattern of expenditure in betel vine cultivation per 1000 sticks. It would be more interesting to probe further various items included and cost involved in different cost components studied and presented in Table 4.2. A detailed study has been made in respect of construction cost of betel field; land preparation, use of fertilizer, pesticides and irrigation in order to project a clear picture of the pattern of expenditure in different cost items included in these operations. The details are presented under following sub-headings.
4.5 Construction Cost of Betel Field The Table 4.3 depicts data on per 1000 stick cost for construction of betel field. Table No. 4.3: Construction Cost of Betel Field (One year)
Rs./ 1000 sticks
Items Kurunegala
N=120 Gampaha
N=30 Total Avg.
N=150
Sticks 14933 17462 16197.5 (33.13)
Bamboo/Cross Stick 8321 7950 8135.5 (19.15)
Coconut Coir/ Rope 3423 4561 3992
(9.40)
Iron Wire 2000 2200 2100
(4.94)
Labour 10000 14114 12057
(28.38)
Total 38677 46287 42,483
(100.00) Source: Survey data, 2013 (Note: Figures in parenthesis indicate percentage)

26
The Table 4.4 shows that the main item of expenditure was for sticks, which accounted for Rs.16197.5 (33.13%) on average and varied across the sampled district from Rs.14933.00 in Kurunegala to Rs.17462.00 in Gampaha. The next item was labour which accounted for Rs.12057.00 (28.38%) on average and varied from Rs.10000 in Kurunegala to Rs.14114.00 in Gampaha. The expenditure on Bamboo/Cross Stick (PANDALAM) on average was Rs.8135.00 (19.15%) followed by coconut coir/rope Rs.3992.00 (9.40%) and iron wire Rs.2100.00 (4.94%) The expenditure on above-mentioned items across the district was found very meager. Thus, the total expenditure in construction of betel field for growing per 1000 sticks of betel leaves was estimated to be Rs.42483.00 (100.00%). The district wise estimated expenditure in constructing a betel field was found to be Rs.38677.00 in Kurunegala and Rs.46287.00 in Gampaha. The variation in cost was due to location of sample area, its proximity to the town or the main road. 4.6 Land Preparation The cost incurred on different constituent items included in the preparation of land and planting vines is presented in Table 4.4. Table 4.4: Estimated Cost (Rs.) of Land Preparation (One year) Rs./ 1000 sticks
Operation Kurunegala N=120
Gampaha N=30
Total Avg N=150
Ploughing of Land 12347 11037 11692
Soil Burning (soil treatment) 4248 6458 5353
Making of Pits 4587 3859 4223
Vine Planting 1823 1123 1473
Use of Insecticide 1521 2061 1791
Labour use in other Application 8538 8086 8312
Total 33064 32624 32844 Source: Survey data, 2013
The above table shows that breakdown of expenditure of sub-items of land preparation on ploughing of land, pits making, vine cuttings, transplanting, insecticide used and labour used for controlling insects and pests, soil treatment and etc. Total cost incurred was Rs.32844.00 on average per 1000 sticks out of the total cost, the Ploughing of Land Rs.11692.00 labour use in other application Rs.8312.00, Soil Burning Rs.5353.00, making of pits Rs.4223.00, Use of Insecticide Rs.1791.00 and Vine Planting Rs.1473.00. District-wise analysis indicated total expenditure in Kurunegala was recorded at Rs.33064.00 followed by Gampaha Rs.32624.00 The analysis further indicates that lower costs were borne by Gampaha and higher cost by Kurunegala. Thus significant variations in the cost were observed. Results of the Table 4.4 further indicates that across the two sample districts, there were nominal variations in expenditure on other given items except for

27
vine planting. In order to protect vines from diseases, vines were treated with Bordeaux mixture. This mixture also treats soils before the planting of vines but only in certain cases. 4.7 Fertilizer Use in Betel Cultivation The data related to fertilizer usage was taken in betel (Export Kalubulath) growing fields during the reference period of the study. The item-wise cost presented in Table 4.5 reveals that on average per1000 sticks expenditure on fertilizer was estimated at Rs.28,503.00. Table 4.5: Fertilizer Use in Betel Cultivation
Rs./ 000 sticks
Use of Fertilizer Kurunegala N=120
Gampaha N=30
Total Avg N=150
Cow Dung 10034 11456
10745 (37.70)
Goat Manure 1761 3103
2432 (8.53)
Compost 1490 1796
1643 (5.76)
Chemical Fertilizer 7937 11139
9538 (33.46)
Labour Use 4988 3302
4145 (14.54)
Total 26210 30796
28,503 (100.00)
Source: Survey data, 2013
Out of the total, major expenditures were cow dung Rs.10,745.00 (37.70%) followed by chemical fertilizer Rs.9,538.00(33.46%), labour usage Rs.4,145.00 (14.54%), goat manure Rs.2,432.00 (8.53%) and compost Rs.1,643.00 (5.76%). The pattern of expenditure on these items of fertilizer was the same in the all four sampled areas. The total expenditure in Gampaha was estimated to be Rs.30,796.00, which was higher than in Kurunegala. It was Rs.26,210.00. The expenditure on the use of fertilizer was found more or less the same. The highest expenditure was on cow dung for all the sample villages.

28
4.5.1 Fertilizer Usage by District
Type of Fertilizer
Kurunegala Gampaha Total
Amount N = 120
Percentage (%)
Amount N = 30
Percentage (%)
Amount N = 150
Percentage (%)
Compost 17 14 03 10 20 13.3
Organic manure*
59 49 11 37 70 46.6
Goat manure 28 23 02 07 30 20
Chemical Fertilizer
120 100 30 100 150 100
Cow Dung 105 18 24 80 129 86
*Kenda/Keppetiya/Glyricidia Source: Survey data, 2013
4.8 Fertilizer Usage When studying about the betel production, another important factor is the fertilizer usage. Different fertilizer types were used in Kurunegala and Gampaha districts. All farmers (100%) used inorganic fertilizer and 13.3% of farmers used compost as a whole. Except the inorganic fertilizer, cow dung has also been used by 86% of farmers. There was a trend of using goat and poultry manure in Kurunegala district, but there was no such practice in Gampaha district. In addition, 46.6% farmers apply leaf manure: keppetiya and Giricidia (free) like green manure for betel cultivation. It is shown in Table 4.5.1. Betel farmers did not apply cow dung gathered in stock yards around Kurunegala and Gampaha areas for betel farming. Stocks in these areas are normally fed with coconut poonac and farmers believe that dung contains coconut oil, which transmits fungal diseases to betel vines. They use cow dung brought from dry zones areas such as Anuradhapua, Polonnaruwa and Vavniya, instead. It is rather expensive and increases the cost of betel production.

29
4.9 Use of Insecticides and Pesticides in Betel Cultivation Table 4.6: Types of Insecticides and Pesticides Used in Betel Cultivation
Rs./ 1000 sticks
Insecticides Kurunegala N=120
Gampaha N=30
All avg N=150
Bliox 600 702 651 (07.13)
Carbafuran 3682 5050 4366 (47.82)
Calcium 3011 3431 3221 (35.25)
Other 413 499 456 (04.99)
Spraying charges 356 514 435 (04.76)
Total 8062 10196 9129 (100.00)
Source: Survey data, 2013
Insecticides are not used by most of the farmers as leaves are taken for “chewing”. Farmers move towards the use of insecticides when an outbreak of “Firefly” and Kidewa takes places. An attempt was made to work out different insecticides and pesticides for betel. The information received from the respondent sample growers regarding demand and use of pesticides commonly practiced by them is presented in Table 4.6. The above table shows that the growers commonly used five different types of insecticides and pesticides. The categories were Carbofuran, Calcium, Bliox, and Other. On average per hectare expenditure on insecticide use was estimated at Rs.9129.00 in which major expenditure was on Carbofuran Rs.4366.00 (47.82%) followed by Calcium Rs.3221.00 (35.25%), Bliox Rs.651.00 (7.13%), other Rs.158.45 (5.39%) and others Rs.456.00 (4.99%). The spraying charge was Rs.435.00 (4.76%). The pattern of expenditure on insecticides was found almost same in all sample areas. The total expenditure in Gampaha was estimated at Rs.10196.00, which was the highest followed by Kurunegala Rs.8062.00. In the two sample districts the highest expenditure was observed in case of Cabofuran Rs.5050.00 in Gampaha districts. The second most used pesticide, which was generally used by the betel vine growers, was Calcium and its expenditure ranged between Rs.3431.00 in Gampaha to Rs.3011.00 in Kurunegala. The spraying of insecticides and pesticides was done manually, which was worked out on average of Rs.435.00. The highest charges were borne by Gampaha Rs.514.00 and the lowest by Kurunegala Rs.356.00. The above analysis, thus, concludes that there was little variation in insecticides used across the sample areas.

30
4.10 Cost of Irrigation Per 1000 stick cost of irrigation was worked out and presented in Table 4.7. In two districts the most common methods of irrigation were found in practice. One was Manual (pot method) and another was Power Water Pump. Details of the data analysis are presented in Table 4.7. Table 4.7: Cost of Irrigation Rs./ 1000 sticks
District Manual Power Water Pump
Total
Kurunegala N=120
15,066 59,778 37,422
Gampaha N=30
10,952 42,448 26,700
Total Avg N=150
13,009 51,113 32,061
Source: Survey data, 2013
The Table 4.5 shows that, the average per 1000 sticks irrigation cost was Rs.32061.00. Out of the total per 1000 sticks cost power-method of irrigation constituted a larger share of Rs.51113.00 and manual method a lower share of Rs.13009.00. District wise analysis revealed that the highest expenditure was in Kurunegala which was Rs.37422.00 and in the case of Gampaha it was Rs.26700.00. A higher expenditure was incurred in the power method and lower expenditure on the manual method. Due to larger dependence on diesel and electricity in the power method of irrigation the cost was very high, but it is interesting to note that the manual method of irrigation was also not cheaper because the high cost of labour and this method also took more time in irrigation. Though, the manual method of irrigation was proved most effective technically, very few growers were found resorting to this method of irrigation. The growers in the sampled areas, found irrigation by power method more popular and acceptable. Due to its ready availability and efficiency this method was commonly used by the growers. The growers have reported that due to high cost of labour and inconvenience in bringing water on head from tank, ponds, wells and river this practice has become less common at present.

31
Table 4.8: Irrigation Use by District
District Manual Power Water Pump
Total
Kurunegala N=120
11(9.16) 109 (90.83) 120
Gampaha N=30
6(20.00) 24(80.00) 30
Total N=150
17 133 (88.66) 150
Source: Survey data, 2013
Two types of watering are used in Kurunegala and Gampaha districts. It was found that 90.83% of the respondents used power water pump whereas 80.00% of the farmers used manual irrigation generally. The manual method of irrigation was proved most effective technically but a very few growers have resorted to this method of watering in Kurunegala (9.16%) and Gampaha (20%). When studying about the betel production another important fact is the mode of watering. Two types were used in the Kurunegala and Gampaha districts. The highest number of farmers (90.83%) use the power water pump and 80.00% of the farmers used manual watering as a whole. 4.11 Employment Pattern in Betel Cultivation The analysis of employment pattern in betel vine cultivation forms an important part of the study. The pattern of employment in cultivation of betel vine under following heads has been found. i. Operational Farm and Family Size of the Sampled Growers ii. Utilization of Family and Hired Labour 4.12 Farm and Family Size of the Sampled Growers
The village wise operational farm and size of the family were worked out and presented in Table 4.9:

32
Table 4.9: Operational Holding and Size of Family (Per Farm)
District
Name of A.D.C. Betel stick Average
Average Family Size
Kurunegala N=120
Kuliyapitiya 1600 5.45
Kitalawela 1200 4.25
Yakwila 1500 5.15
Digalla 1400 4.88
Alawwa 1100 3.87
Kurunegala Avg 1360 4.72
Gampaha N=30
Maradaghamula 1300 4.66
Udugampola 1400 4.75
Mirigama 1100 3.44
Gampaha Avg. 1266.7 4.28
Kur+Gam/2* 1313.35 4.5
Source: Survey data, 2013 (Kur+Gam/2* = Total average all areas N=150)
Table 4.9 indicates that size of farm holding an average of 1313.35 sticks. The A.D.C. wise analysis indicates that the average size of holding was the largest in Kuliyapitiya (1600 sticks), followed by Yakwila (1500 sticks), Maradagahamula (1300 sticks) and Kitalawala (1200 sticks). It means across the sample villages, the average size of betel holding, ranged between 1100 ha to 1600 sticks which is very small in size. The table further indicates that on average the family size was 4.5. The family size among the four A.C areas was found to be the largest in Kuliyapitiya (5.45), followed by Yakwila (5.15), Digalla (4.88), Udugampola (4.75), Maradagahamula (4.66) and Kitalawela (4.25) respectively. The analysis indicates a positive correlation between the size of operational holdings and the size of the corresponding family. In other words, as the size of holdings in betel cultivation increases, the family size of growers also increases. It is since betel is capital as well as a labour intensive crop. Consequently, betel farmers did prefer a large family so as to ensure a sufficient labour supply. 4.13 Utilization of Total Labour, Family Labour and Hired Labour The analysis of family and hired labour utilization has been done and presented in Table 4.10.

33
Table 4.10: Family and Hired Labour per 1000 Sticks of Betel (In Number)
District Total Labour Used Family Labour Hired Labour
Kurunegala N=120
621 (100) 494 (79.54) 127(20.46)
Gampaha N=30
632 (100) 421(66.61) 211(33.39)
Total Avg. N=150
626 (100) 457(73.01) 169(26.99)
Source: Survey data, 2013
Table 4.10 indicates that average per hectare labour utilization in the cultivation of betel was 626 man-days. Out of the total labour utilization the share of family labour was 457 (73.01%) and hired labour was 169 (26.99%). The analysis of district wise utilization of labour shows that it was the highest in Gampaha (632) followed by Kurunegala (621). The utilization of family labour across the villages reveals that the highest utilization of family labour was found in Kurunegala 494 (79.54%), followed by Gampaha 421 (66.61). In the case of hired labour utilization, Gampaha was found to have employed the highest number of labour, i.e., 211 followed by Kurunegala (20.46). The analysis reveals that the share of family labour in total utilization of labour in the cultivation of betel was found much higher in almost all the sample areas which might be since the growers mostly used family labour in almost every activity from production to marketing. The hired labour was easily available in the village. However, they preferred to work in the betel field. From the above analysis, it is clear that in betel cultivation male workers were employed in large numbers in various operations as compared to female workers for economic and large for social reasons. The lower percentage of female participation in cultivation of betel in the sample areas of Kurunegala district was due to the interesting fact that the place of betel cultivation, i.e., ‘Bulath Kotuwa’ is considered to be a sacred place. The entry of females to the betel field is believed to be an act of violation the sanctity of the place, tied up with the belief of the conservative folk society that the ‘woman is impure’. Therefore farmers believe that such entry would cause betel leaves to dry up. The myth also prevailed in the sample area of Kurunegala district, but ‘BULATH GOVISAMAJAYA’ (Betel growers’ society) of Gampaha district was not strongly opposed to women’s entry to the ‘BULATH KOTUWA’ (Betel field). The above belief is the main reason for the less participation of females in the study area. 4.14 Cost of Production and Income of Export Betel Crop In Kurunegala district, Kuliyapitiya betel fair is generally held thrice a week. In the period of surveying from June to August the average value of 1000 export Pidunu (blossomed) betel was Rs.2,500.00.

34
Figure 4.1: Average Price of Export Betel (1000 Leaves) at Kuliyapitiya Fair from 2nd
June to 25th August 2013 The cost of production of betel is an important aspect of farm economy both for its growers, as well as from the national point of view. For the individual farmer it helps him properly manage his scarce resources for getting maximum returns and from the national point of view it provides insights to the policymakers in formulating the policy, both for inputs as well as for the produce. This estimate of expenditure and income and findings have been presented in Table 4.11. Table 4.11: Total Expenditure and Production of Export Betel (Rs. 1000 sticks)
Item Kurunegala N=120
Gampaha N=30
Total Area Avg. N=150
Total Expenditure 185,541 148,893 167,217
Total Production of Betel Leaves Avg. 1 Month
25,500 23,300 24,400
Cost of Production per Leaves *20,000 1 Month
8,309 5,165 7,761
(Cost of Production per 20,000 leaves per Month (1000 sticks) Source: Survey data, 2013
The above Table 4.11 shows the total expenditure (both variable and fixed) incurred on average as Rs.167,217.00 and the total production of betel leaves per hectare and the cost of production per 20,000 leaves, on average, was Rs.24,400.00 and Rs.7,761.00 respectively. The district-wise data indicates that the total expenditure was found to be Rs.185,541.00 in Kurunegala, higher than in Gampaha where it was estimated to be Rs.148,893.00. The analysis also showed that higher expenditure led to higher production of betel leaves. In Kurunegala the total production was 25500 of betel
0
1000
2000
3000
4000
5000
6000
7000
Pid
un
u B
ete
l Rs.
Week Price 1000 Betel Leaves Average Price

35
leaves, which was higher than in Gampaha. The cost of production per 10,000 betel leaves was higher in the case of Kurunegala (Rs.8,309.00) followed by Gampaha (Rs.5,165.00). 4.15 Maintenance Cost for Betel per Month Table 4.12: Maintenance Cost for 1000 Sticks per Month (Rs. per 1000 sticks)
Input Cost Kurunegala N = 120
Expenditure (Rs.)
Gampaha N = 30
Expenditure (Rs.)
Total Expenditure
(Rs.)
Organic Fertilizer 4 times per year 203 215 209
Chemical Fertilizer 2 times per month 1103 1007 1083
Weedicide 1 time per month 224 300 234
Insecticide 1 time per month 241 199 238
Water usage (kerosene motors)
15 times per month 2600 1592 2456
Transportation 2 times per month 393 227 362
Labour 7 man days 3545 1626 2584.5
Total 8309 5165 7761.5 Source: Survey data, 2013
According to the above Table 4.12 maintenance input cost for 100 poles for a farmer who uses kerosene motor fluctuates in the following manner. Kurunegala district Rs.8,309.00, Gampaha district Rs.5,165.00 and the average in both districts Rs.7,761.50. However, the monthly input cost of a farmer who used electrical motor was lower than above values, since the farmers have to bear a higher cost for kerosene. Above labour cost and monthly input cost are considered when calculating the monthly cost per 1000 sticks. 4.16 Time Taken for the First Harvest Table 4.13 shows the time taken for reaping the first harvest of betel cultivation from the beginning. Majority of farmers in both districts take 6 months for the first harvest. When considering the whole sample, 71.33% farmers take 7 months. A very few number (10%), received their first harvest in less than five months. Accordingly the highest percentage of farmers reaps their 1st harvest in six months.

36
Table 4.13: Time Taken for Harvest
Time (Month)
Kurunegala N= 120
Gampaha N= 30
Total N= 150
Number Percentage Number Percentage Number Percentage
<=3 2 1.67 0 0.00 2 1.33
4 6 5.00 0 0.00 6 4.00
5 12 10.00 3 10.00 15 10.00
6 85 70.83 22 73.33 107 71.33
7<= 15 12.50 5 16.67 20 13.33
Total 120 100.00 30 100.00 150 100.00 Source: Survey data, 2013
4.17 Year Wise Cost Breakup The Table 4.14 reveals that out of the total expenditure about 40.20% was spent during the 1st year and the rest was spent in four consecutive years. Likewise the total income from the investment was only 37.04 per cent. Thus a loss occurred during the 1st year, which was Rs.20817.00. The data further indicates that after the 1st year, the expenditure over income was lesser and the profit showed an increase year after year while in 4th year, the profit was similar to that of the 2nd year. This occured due to full exploitation of the resources. The overall analysis indicates that in 4-years, around Rs.552,517 was earned as net profit from this venture. Thus, this is a viable enterprise for the producers. Table 4.14: Year Wise Estimated Breakup of Cost Involved in Betel Cultivation (1 to 4 Years)
(Rs. per 1000 sticks)
Year Total Expenditure Total Income Loss Profit
1st 167,217 (40.2) 146400*(37.040) 20817
2nd 73138 (17.5) 213533 (18.51) ----- 140395
3th 93138 (22.3) 276328 (23.57) 183190
4th 82524 (19.8) 311456 (20.88) 228932
Avg 416017 (100) 395200 (100.00) 20817 552517**
*Harvest after 6 months’ Income (**Total Average of Profit and Loss) Note: Figures in parenthesis indicate percentage. Source: Survey data, 2013 Data from a group of five farmers of both Districts
4.18 Economic Efficiency of Betel Production In this part of analysis, a number of profit measures have been dealt with. These profit measures: net income, farm business income, farm investment income and return on working capital are presented under sub-headings.

37
4.19 Gross Income and Net Return The gross income is the value of total output and net income is the value of differences between total revenue minus the total cost. The calculated data has been presented in Table 4.15. Table 4.15: Estimated Gross Income and Net Return per 1000 Sticks
Per 1000 Sticks (One year and six months)
District Gross Income Total Expenditure Net Return Kurunegala - N=120 276321 185541 90780 Gampaha - N=30 242543 148893 93650 Total Avg - N=150 259432 167217 92215
Source: Survey data, 2013
The Table 4.15 indicates the per hectare gross income per 1000 sticks. The average was estimated to be at Rs.259,432.00. It varied from Rs.276,321.00 in Kurunegala to Rs.242,543.00 in Gampaha. A comparatively higher gross income was found in the case of Kurunegala district sample villages than that of the Gampaha district. The main reason behind this was the Kurunegala town is situated on the main Pola (fair) connecting Kuliyapitiya, Narammala and Kadanegedara the capital town of the area, thus, growers used to receive good prices for their produce. The table further indicates that the total expenditure of all sample area farms was found to be Rs.167,217.00 which varied from Rs.185,541.00 and Rs.148,893.00 in Kurunegala and Gampaha respectively. It can be observed that on all farms area per 1000 sticks net return amounted to Rs.92,215.00 which varied from Rs.90,780.00 and Rs.93,650.00 in Kurunegala and Gampaha respectively. The higher net return was observed in the case of Gampaha, where gross incomes as well as total expenditure were also turned out to be higher. This is mainly due to better accessibility to the market. 4.20 Return on Working Capital Return per hundred rupees investment on working expenses is an important measure of farm profit specially the crop requiring higher expenses capital investment. This analysis helps provide a guideline to the grower for reallocating the farm resources for maximizing the profit. Return on expenses capital is obtained by dividing the net income by working capital expressed in percentage. The percentage return on expressed capital has been worked out and presented under Table 4.16: Table 4.16: Percentage Return on Working Capital by District per 1000 Sticks
District Net Income Rs Expenses Rs Percentage Return on Expenses
Kurunegala N=120 90,780 185,541 48.92 Gampaha N=30 93,650 148,893 62.89 Average N=150 92,215 167,217 55.14
Source: Survey data, 2013
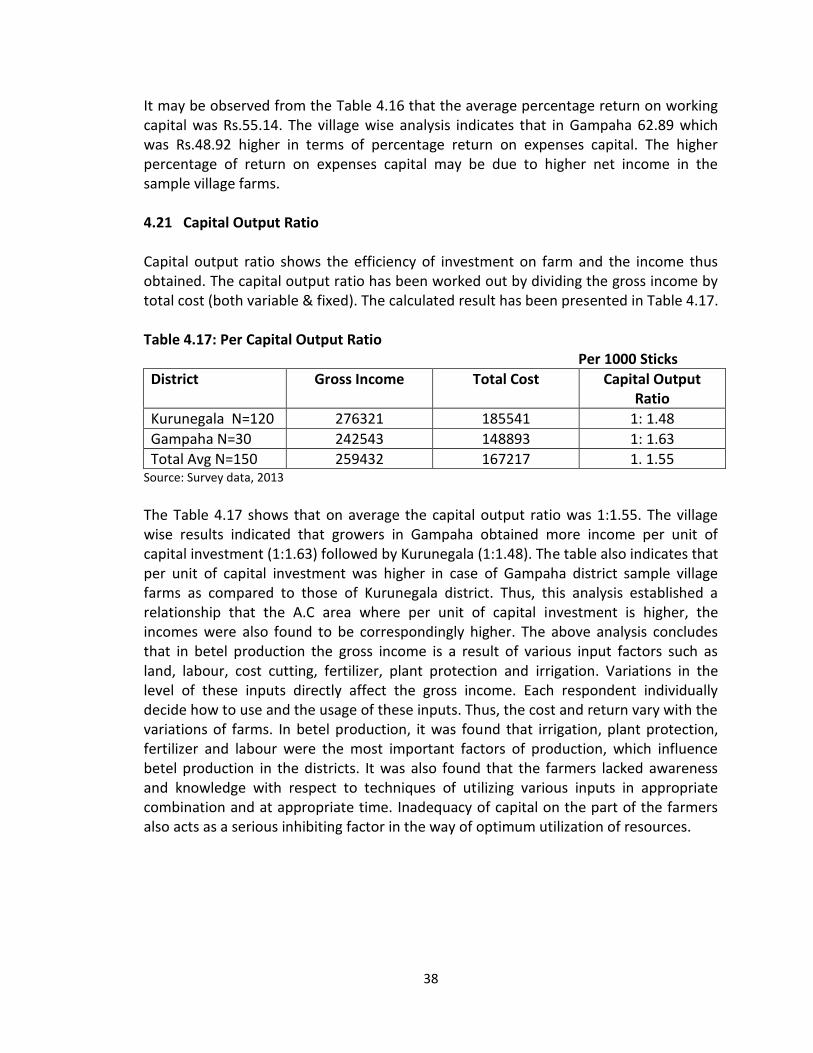
38
It may be observed from the Table 4.16 that the average percentage return on working capital was Rs.55.14. The village wise analysis indicates that in Gampaha 62.89 which was Rs.48.92 higher in terms of percentage return on expenses capital. The higher percentage of return on expenses capital may be due to higher net income in the sample village farms. 4.21 Capital Output Ratio Capital output ratio shows the efficiency of investment on farm and the income thus obtained. The capital output ratio has been worked out by dividing the gross income by total cost (both variable & fixed). The calculated result has been presented in Table 4.17. Table 4.17: Per Capital Output Ratio Per 1000 Sticks
District Gross Income Total Cost Capital Output Ratio
Kurunegala N=120 276321 185541 1: 1.48
Gampaha N=30 242543 148893 1: 1.63
Total Avg N=150 259432 167217 1. 1.55 Source: Survey data, 2013
The Table 4.17 shows that on average the capital output ratio was 1:1.55. The village wise results indicated that growers in Gampaha obtained more income per unit of capital investment (1:1.63) followed by Kurunegala (1:1.48). The table also indicates that per unit of capital investment was higher in case of Gampaha district sample village farms as compared to those of Kurunegala district. Thus, this analysis established a relationship that the A.C area where per unit of capital investment is higher, the incomes were also found to be correspondingly higher. The above analysis concludes that in betel production the gross income is a result of various input factors such as land, labour, cost cutting, fertilizer, plant protection and irrigation. Variations in the level of these inputs directly affect the gross income. Each respondent individually decide how to use and the usage of these inputs. Thus, the cost and return vary with the variations of farms. In betel production, it was found that irrigation, plant protection, fertilizer and labour were the most important factors of production, which influence betel production in the districts. It was also found that the farmers lacked awareness and knowledge with respect to techniques of utilizing various inputs in appropriate combination and at appropriate time. Inadequacy of capital on the part of the farmers also acts as a serious inhibiting factor in the way of optimum utilization of resources.

39
CHAPTER FIVE
Marketing of Betel 5.1 Introduction Any production does not become economic until it reaches the consumers and the producers get their share out of consumer’s rupee which is worth the utility of his product. In this chapter, an attempt has been made to analyze the existing export marketing (Only Pakistan) system of betel product, producer’s share in consumer’s rupee and marketing margins of various agencies involved in different marketing channels, price spread, marketing costs, and the farmer views and suggestions for establishing a main trade centre for exporting etc. The analysis is based on the information collected from the sample respondents. 5.2 Marketing Costs and Margins
The study of price spread in marketing of cash crops is important for various reasons. In order to produce more; farmers are required to invest more on inputs, which largely depend on the gain to the farming community. The main reason for a comparatively lower price obtained by the growers and higher prices paid by the consumers is due to the existence of a large number of market intermediaries resulting in a higher amount of gross marketing margins among different players. The gross marketing margin refers to the difference between the price paid by the ultimate consumers and the price received by the producers. The gross marketing margin consists of margin of various intermediaries engaged in moving the produce from the point of production to the ultimate consumers and also the marketing cost involved in the scrutiny, packaging, grading, processing, transportation, spoilage, processing as practised in a few cases and other handling activities. The term “marketing margins” refers to difference in price received and price paid for a commodity at different stages of the marketing system. The normal high marketing margin is an indicator of the efficiency of the marketing system. The large value of marketing margins is indicative of an inefficient marketing system. On the other hand, if the produce moves from the producer to the ultimate consumer at a minimum cost, the marketing system is said to be more efficient.
For calculation of the price spread, concurrent margin method was used for the purpose. The marketing margin varies on the length and type of channels through which the produce passes on to the final consumer. The important marketing channels were therefore, identified and price spread has been calculated for the major identified channels of betel marketing in both districts.

40
5.3 Export Marketing Channels The Important channels of betel marketing are given below:
1. Grower/Producer Export Wholesaler (Local buyer Only One)Export to Pakistan
2. Grower/Producer Local Wholesaler (POLA) Pakistan Wholesaler Export to Pakistan
3. Grower/Producer Local Wholesalers (POLA) Export Pakistan As per the information collected from the sample growers during the field survey it was observed that in both districts, growers were found using three above mentioned important channels through which they dispose of their produce. The proportion of the produce marketed channel wise has been presented in Table 5.1 Table 5.1: Pattern of Betel by Channel (in %)
District 1. Channel 2. Channel 3. Channel
Kurunegala N=120
59.23%
04.17%
36.60%
Gampaha N=30
92.48%
02.44%
05.08%
Average N=150
78.85%
03.31%
20.84%
Source: Survey data, 2013
The table 5.1 reveals that at overall level about 78.85 per cent of the betel produced (leaf) by the respondent were sold to local traders through channel -1. It means channel - I was identified as the most important channel through which bulk of the produce is passed (This buyer stays in Gampaha Baduragoda). District wise breakup indicated that Gampaha (92.48%) made the highest disposal through this channel followed by Kurunegala (59.23%). It was observed that in sample District of Gampaha, betel growers were using this channel comparatively less than Kurunegala sample growers. It might be due to various unexplained reasons such as, distance of market, nature of and interest rates on loan facilities provided by the intermediaries. This may be due to the fact that Kurunegala district sample areas were more distant from the betel farmer and majority of growers took assistance in cash or kind through the local traders. But export betel fetched a low price.

41
Table 5.2: The Time of Payment for Farmers
Time when they are paid
Kurunegala Gampaha Total Avg. Growers N=120
% Growers N=30
% Growers N=150
%
Time of Bargaining 63 52.5 29 96.7 92 61.3
After Sale 57 47.5 1 3.3 58 38.7
Total 120 100 30 100 150 100 Source: Survey data, 2013
The attention was also paid to the time of payment for the farmers, whether at the time of the bargain or after the bargain through different trade methods. It was revealed that 61.3% of the total sample receives their money at the time of the bargain. According (Table 5.2) to the districts, it was as higher as 96.7% in Gampaha district and it was very less in Kurunegala district. 5.4 Price Spread of Export Betel In the marketing of commodities, the difference between the price paid by consumer and the price received by the producer for an equivalent quantity of farm produce is known as price spread. It is also termed as marketing margin. The price spread of the produce marketed through different channels in the selected district is presented in Table 5.3. Table 5.3 reveals that price received by the grower per 10,000 of betel was higher in channel –3 (79.91 %). It was higher than both the channels. The situation may be due to producers acting as producer sellers themselves and sold their produce in the market and received a higher profit margin. In channel – 2 and channel – 1 the producer’s share in Pakistan Wholesalers Purchase Price rupee was 79.91 per cent and 75.43 per cent respectively. In these channels the producer’s share in consumer’s rupee was also greater than 73.46, which might be due to in both channel - 1 and 2, the produce being disposed of at the village level itself. The table further indicates that the retailer’s margin of profit was higher at 15.65 per cent in case of channel – 2 (Buyer from Pakistan). In this channel a higher retailer’s margin of profit was recorded because retailers had directly purchased the produce from the growers. In channel – 1 and 3, the retailer’s margins of profit was found to be 12.78 and 11.6 per cent. In both the channels the retailer’s margin was less because they purchased the produce after a long chain of price spread and thus profit margin gets lower down. It is also apparent from the table that the price per 10,000 leaves of betel received by the producer was Rs.23,000.00 in channel- 1; Rs.24101.00 in channel –2 and Rs.24,101.00 in channel – 3. The marketing costs incurred by the growers/local traders/retailers were Rs.12.78 in channel – 3 and Rs.15.65 in channel – I & 2. The profit margin of local trader was Rs.11.6 in channel – 3.

42
Table 5.3: Price Spread per 10,000 Leaves of Betel Through Various Marketing Channels
Particulars Channel-1 Channel-2 Channel 3
1 Price Received by Growers or Local Purchasing Price
23,000.00 (73.46)
Marketing Cost Incurred by Growers/Export 30.00 (0.10)
Packing Charge 120.00 (0.38)
Loading and Unloading Charge 220.00 (0.70)
Local Transport Charge to Airport 210.00 (0.67)
Grading and Packing (Export Basket) 321.00 (1.03)
Other Labour Charge 200.00 (0.64)
Transport Charge Airport to Pakistan 3,210.00 (10.25)
Trader’s Profit Margin (Gampaha) 4,000.00 (12.78)
2 Local Trader Selling Price Wholesalers (export) Purchase price (Pakistan Wholesaler)
24,101.00 (75.43)
Market Fee 30.00 (0.09)
Labour Charge 20.00 (0.06)
Grading and Packing 300.00 (0.94)
Transport Charge Air port to Pakistan 2,500.00 (7.82)
Export Profit Margin(Pakistan Wholesaler) 5,000.00 (15.65)
3 Local Trader Selling Price Wholesalers (export) Purchasing price (POLA)
24,101.00 (79.91)
Market Fee 30.00 (0.10)
Labour Charge 20.00 (0.07)
Grading and Packing 210.00 (0.70)
Transport Charge Airport to Pakistan 2,300.00 (7.63)
Local Wholesalers(POLA) Export Profit 3,500.00 (11.60)
Pakistan Wholesalers Purchasing Price 31,311.00 (100.00)
31,951.00 (100.00)
30,161.00 (100.00)
Source: Survey data, 2013
*Channel 1 (78.00%) buys only one export buyer * Channel 2 (3.31%) buys 3 buyers from Pakistan
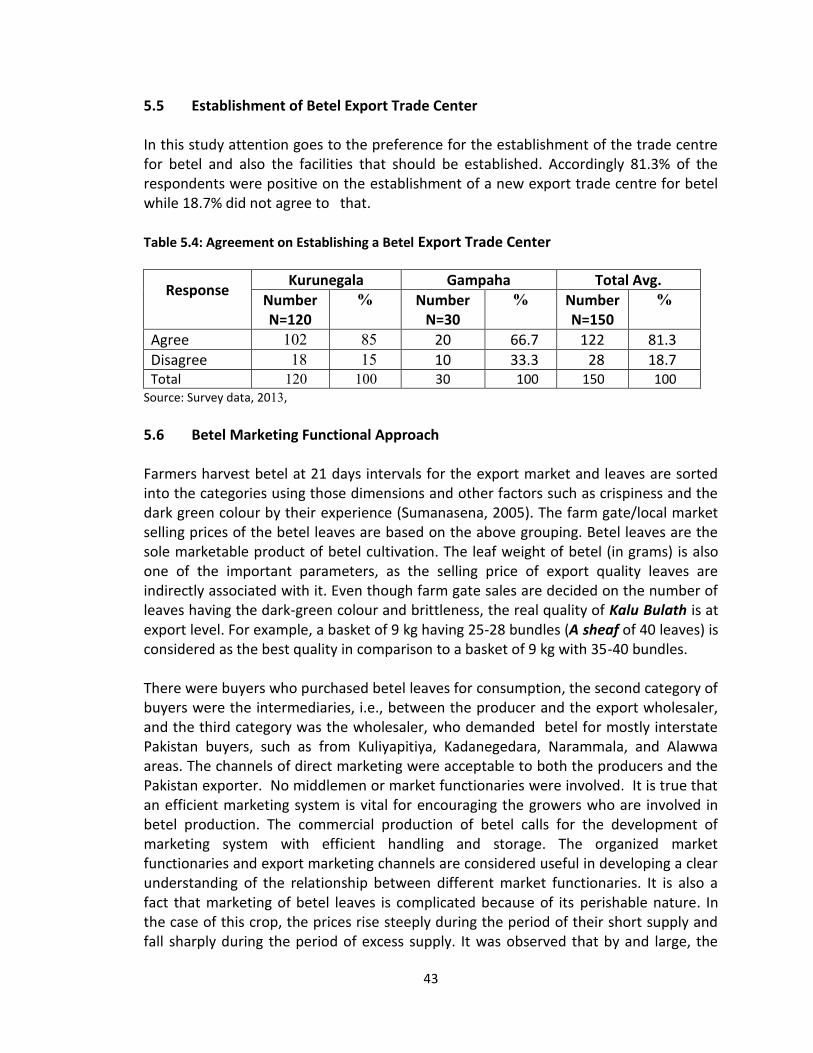
43
5.5 Establishment of Betel Export Trade Center In this study attention goes to the preference for the establishment of the trade centre for betel and also the facilities that should be established. Accordingly 81.3% of the respondents were positive on the establishment of a new export trade centre for betel while 18.7% did not agree to that. Table 5.4 : Agreement on Establishing a Betel Export Trade Center
Response
Kurunegala Gampaha Total Avg.
Number N=120
% Number N=30
% Number N=150
%
Agree 102 85 20 66.7 122 81.3
Disagree 18 15 10 33.3 28 18.7 Total 120 100 30 100 150 100
Source: Survey data, 2013,
5.6 Betel Marketing Functional Approach Farmers harvest betel at 21 days intervals for the export market and leaves are sorted into the categories using those dimensions and other factors such as crispiness and the dark green colour by their experience (Sumanasena, 2005). The farm gate/local market selling prices of the betel leaves are based on the above grouping. Betel leaves are the sole marketable product of betel cultivation. The leaf weight of betel (in grams) is also one of the important parameters, as the selling price of export quality leaves are indirectly associated with it. Even though farm gate sales are decided on the number of leaves having the dark-green colour and brittleness, the real quality of Kalu Bulath is at export level. For example, a basket of 9 kg having 25-28 bundles (A sheaf of 40 leaves) is considered as the best quality in comparison to a basket of 9 kg with 35-40 bundles. There were buyers who purchased betel leaves for consumption, the second category of buyers were the intermediaries, i.e., between the producer and the export wholesaler, and the third category was the wholesaler, who demanded betel for mostly interstate Pakistan buyers, such as from Kuliyapitiya, Kadanegedara, Narammala, and Alawwa areas. The channels of direct marketing were acceptable to both the producers and the Pakistan exporter. No middlemen or market functionaries were involved. It is true that an efficient marketing system is vital for encouraging the growers who are involved in betel production. The commercial production of betel calls for the development of marketing system with efficient handling and storage. The organized market functionaries and export marketing channels are considered useful in developing a clear understanding of the relationship between different market functionaries. It is also a fact that marketing of betel leaves is complicated because of its perishable nature. In the case of this crop, the prices rise steeply during the period of their short supply and fall sharply during the period of excess supply. It was observed that by and large, the

44
markets of betel in Kurunegala had been encompassed in a vicious circle of trading practices. The fact is that the traders control and regulate the business of this crop. The traders were wealthy and took the growers into their hold and compelled to sell their produce at a price fixed by the traders, which generally is much lower than the market prices, and the growers were, thus, deprived of a fair return. Such unscrupulous market practices were the root cause of poor economic condition of the betel growers. In the case of price spread, it was observed that there were wide variations of price received by the growers and the price paid by the final Pakistan buyers. This is mainly due to the margin enjoyed by the market functionaries, middlemen and the costs involved in secondary activities such as grading, packing, transportation, storage, handling and labour changes and market charge. Various costs involved at different levels of market functionaries and commission of the traders had, in fact, inflated the Pakistan money. Thus, a major share of Pakistan money is cornered by different market functionaries and a considerable part was found involved in the form of various service charges and marketing costs. For reducing marketing margin by eliminating middlemen, it could be suggested that the growers were, in general, unorganized and they did not make any group in the form of self-help. Betel marketing system must be improved to encourage the betel growers for higher production by undertaking larger areas under the crop such as Dedicated Economic Centers (DECs) for betel export market.

45
CHAPTER SIX
The Constraints Faced By the Betel Growers 6.1 Introduction This chapter analyses the constraints faced by the betel growers. The selected growers were asked to indicate the constraints through a suitably designed schedule. Garrett’s Ranking Technique has been applied to analyze the primary data. Information collected by interviewing the selected 150 growers was tabulated to identify the most important constraints of betel production in the sample areas. These were categorized into two broad categories i.e., agro-biological constraints and economic constraints. The agro-biological constraints included severity of diseases, rain, pests, winds, non-availability of improved vine cuttings and technique of preserving highly perishable betel leaves. The economic constraints included inadequacy of capital, high cost of construction of betel field, high cost of labour, high irrigation cost, high cost of vine cutting, high fertilizer and insecticide cost, inadequate market facilities and adverse price fluctuation. 6.2 Constraints in the Production of Betel The collected data was analyzed and average rank of all the identified constraints was determined and presented in Table 6.1. From the table it may be observed that under biological constraints growers reported a higher rank in case of severity of disease, which is the major problem in the production of betel as reported by growers. The first place is the pest and diseases according to Garrett’s Ranking technique. Therefore a large amount of betel beds are completely destroyed. There is no treatment for leaf blight, betel disease. Betel cannot be cultivated in the diseased area for another 3,4 years and due to this situation income from the betel has completely collapsed. Not only the major disease leaf blight (Mahesha, 2009), but also other pest damages and diseases have caused a less quality and a less harvest of betel. In both districts almost 98 per cent growers were using their own traditional planting material for long. Most of the farmers are growing the crop using their indigenous knowledge, skills and their past experiences. They have no awareness regarding the improved method of cultivation. Table 6.1: Agro-Biological Factors Limiting Production
Present position =
Constraints Total Score Mean Score Rank
Severity of pests and diseases 6479 68.29 1
Inadequacy of water 4842 45.33 2
Non-availability of good planting materials 4450 43.44 3
High perishability of leaves 4323 41.23 4
Severity of winds 2311 21.78 5 Source: Survey data, 2013

46
Where Rij - rank given for i-th factor by j-th individual Nj-number of factors ranked by j-th individual. (*Garrett’s Ranking Technique ) The table further indicates that the most stated constraint reported by the growers was severity of pests in betel crop. Majority of growers reported that they did not know the specific pests and pesticides. On the recommendations of the local pesticides/ insecticides sellers, they were using these chemicals on their field, which were generally not so effective. The 4th main constraint reported by growers was high perishability of the leaves. Farmers complained that due to non-availability of leaf treatment and scientific packaging facilities at the village level, a good percentage of their produce was wasted. The other major constraints include wind severity and cold waves. It is worth noting that due to use of indigenous cuttings by majority of the growers, the yield levels of different growers do not differ significantly. So water supply was given the last rank. 6.3 Economic and Institutional Factors The economic and institutional factors limiting production were listed as (1)Inadequacy of credit (2)High cost of labour (3) High Cost of field Construction (4) High cost of Irrigation (5) High cost of pesticides (6) Inadequate market (7) Fluctuations of Price. The respondents were asked to rank the five factors and the ranks given by the respondents are given in Table 6.2 Table 6.2: Cost of Input and Institutional Factors Limiting Production
Present position =
Constraints Total Score
Mean Score
Rank
Inadequacy of Credit 10290 68.6 1
High Cost of Labour 9313 62.09 2
High Cost of Stick and Lack (Field Construction) 8790 58.6 3
High Irrigation Cost 7813 52.09 4
High Cost of Fertilizer 7366 49.11 5
Inadequate Marketing Facilities 7086 47.24 6
Fluctuations of Price 6180 41.2 7
Source: Survey data, 2013 (*Garrett’s Ranking Technique) As seen from the table, inadequacy of credit was ranked by the respondents as the most pressing problem among economic and institutional factors. The betel crop required heavy capital investment, so credit availability attracts the attention of the cultivators more. During the course of investigation, it was reported that in both districts not a

47
single sample grower obtained a crop loan from the institutional agencies for cultivation of this crop. Majority of the respondents reported that they obtained loans for cultivating this crop from non-institutional agencies, such as traders, middlemen, neighbour, friends and others who exploit them by charging high interests or offering low prices for their products after harvesting. Middlemen/traders, who provide loans to the growers against the advanced sale of their products, usually offer a price much below the prevalent market price. Such practice is detrimental to their economic interest. The second rank was given to high cost of labour. The betel cultivation is highly labour intensive. The betel crop requires skilled and unskilled labour in large numbers and the labour cost for skilled labour was high and this was the problem faced by the farmers. The third rank was the high betel field construction cost. According to the Garrett’s Ranking Technique the second place is lack of betel supports and high cost for them. For example, a support of 2” radius with 6 -1/2’ length is about Rs.17-20. If such types of 1000 supports are bought, farmers have to spend Rs.17,000 - 20,000. Therefore, it has become a huge problem for the farmers. Although the betel supports were purchased, there was a scarcity due to obtaining licenses to transport betel support sticks. So farmers have to visit district officers of the Department of Forest, which is a time wasting activity. The betel crop required heavy doses of fertilizer, so even a slight rise in fertilizer price affected the farmers severely. According to the ranking, the 4th place is the lack of fertilizer. Farmers use 100% organic manure and cow dung for land preparation. However, they have to buy 250-350 kg (cubic feet 100-130) of cow dung from lorry traders at Kuliyapitiya fair and Kande Gedara fair. The cost of manure is Rs.17,000 – 20,000. Higher cost of manure and difficulty in finding fertilizer at the correct time are the other problems faced by the farmers. Betel farmers use inorganic fertilizer at 3 weeks intervals, but supply of these inorganic fertilizer also falls short from time to time. Therefore, the lack of fertilizer affects a good yield for farmers. The fourth rank is the cost and lack of water, according to the Garrett’s ranking of bête. Farmers are highly affected by water problems during June, July and August. Due to the short supply, farmers use water pumps by using electric power. Thus they have to spend much on electricity, which leads to an increase in the cost of production. Lack of water causes the size of the betel leaf to be small and a reduction in harvest. As a result, farmers have to sell betel at lower prices. The fifth rank was given to the unfavorable market condition, indicating that the farmers were more worried about conditions of production than about marketing condition. The fourth place took for grading of the betel leaves. As previously mentioned, the betel leaves are graded as Large Peedunu Kola, Small Peedunu Kola, Large Kanda kola and Small Kanda kola Sometimes they categorized the leaves according to the weights, they priced the higher weighted betel leaves at higher prices

48
and the other lower weights at lower prices. The colour is another criterion they used to determine the price. The deep green coloured Kalubulath and high water contained leaves are sold at a higher price. 6. 4 Constraints in the Problems in Marketing of Export Quality Betel For the purpose of the study, the problems in marketing were listed as (1) transport (2) too many middlemen (3) absence of grading (4) fluctuating price and (5) inadequacy of finance. The respondents were asked to rank the factors and the ranks given by them are presented in Table 6.3. It is well known that betel leaf is a highly perishable commodity and does not last long. As such, it has very low endurance level in the adverse weather. At the same time, even a little damage to leaves of betel makes it defective leading to a reduction in demand. Consequently its price declines sharply. Hence, it causes a marketing problem at an alarming scale. The marketing constraints faced by respondents are shown below.
Case Study of Betel Producers
Gaiyala, a farmer in Kurunegala district was asked about betel leaf spot disease. According to him, “it does not need a treatment, it should remain.” When asked about the reasons he further added “If treatments are found for this disease, it will be the end of our income. If this disease is eliminated every one would cultivate betel in large scale, then we can’t sell our betel, at least for 50 cents, that is why we do not want remedies for this disease, this disease protects most of the small scale betel farmers”. His opinion reflects the perception of most of the small scale betel farmers. When talking about the problems arising at sale it was found that most of the large scale export betel buyers are in Banduragoda in Gampaha district. Most of the farmers said, selling betel to Mr. Banduragoda (A person in Banduragoda area) is an easy task and, they receive money on the spot. Therefore most of the farmers prefer to sell betel to Mr. Banduragoda. The betel buyer helps both farming and family economic activities of the farmers.

49
Table 6.3: The Problems in Marketing of Export Betel
Present position =
Constraints Total Score
Mean Score
Rank
Fluctuating price 9270 61.8 1
Too many middlemen 8775 58.5 2
Inadequacy of finance 8565 57.1 3
Absence of grading 8295 55.3 4
Lack of technical know-how 8085 53.9 5
Distant market 6630 44.2 6
Lack of institutional finance 4950 33.0 7
Lack of export market center and storage facilities 4665 31.1 8
Lack of Market Information 4612 30.0 9 Source: Survey data, 2013 (*Garrett’s Ranking Technique)
The table shows that the fluctuating price commanded the greatest attention in marketing. It reveals that in the sample areas, the most serious constraints are the fluctuations in prices of betel as reported by sample growers. The second rank was given to presence of too many middlemen. In betel marketing a large number of intermediaries were involved and large margins were taken up by them. However, it was
inevitable because the produce was highly perishable and required personal care and quick handling. Inadequacy of finance was given the third rank. Betel marketing requires
heavy capital so the cultivators did not easily enter the trade activities. The high cost of transport was considered as the fourth major problem. The fifth rank was given to absence of a grading mechanism which reduces the quality of betel leaves and price. The problem of absence of an export market center and storage facilities ranked 8th was related to not receiving the cash at the time of bargaining. Majority of the vendors decide the price and they agree to pay the money later. However they delayed the payments violating the agreements. It was revealed that many vendors behave in this manner. However, even with this behavior of venders, the farmers had to sell their betel leaves to the same vendor without a change. A very few pay the money on time. Most of the farmers prefer to sell their harvest to those few vendors. But they receive a very low price.

50
6.5 Interface Marketing of Export Betel It is to be noted that despite being a highly vulnerable crop, there is no insurance facility available for the crop. Earlier, it had been the primary occupation of the traditional betel growers, but nowadays it has become a secondary occupation. So, they did not fully concentrate upon the cultivation of this crop as reported by a good number of growers in the study area. There is visibly no change (increase) in the selling prices of betel leaves for a decade whereas the cost of inputs involved in its cultivation and marketing has been gradually rising over the years. But as there is no alternative, the traditional betel growers have been continuing in the cultivation of this crop. The overall analysis concludes that marketing is the most vital constraint of the growers in the study area. Due to absence of an organized market, middlemen generally fix the prices and this
Case study of export betel vendors
Following discussions with some farmers dealing with the export market, a hierarchy for the trade of export betel leaves for Pakistan was identified. The following points were revealed in the discussion held with a vendor in Giriulla area called Mr. Mahinda. According to him, there were two methods of sending our exportable betel leaves to the Pakistan market; through the company and Pakistan vendors. CWE and Markfed were the two companies he has been introduced to. However, he used to bargain with the Pakistan vendors. He collects betel leaves from the markets as Kuliyapitiya, Kadanagedara and after then they were graded in Katunayake. A labourer receives Rs.1000 per day as wage. Then the selected betel leaves were packed in 9kg baskets and then stored in Airplanes. He said that Rs.70 is the cost per basket. It costs Rs.30 for the newspapers for wrapping. Mr. Ajith, also an export betel vendor, said that he collected leaves at home and then the suitable betel leaves were transported to Katunayake. A Pakistan vendor pays Rs.2300.00 (9kg) for a betel basket. It was also revealed that many problems occurred with Pakistan vendors with the changes in flight schedules and delays. Because of that the betel leaves may dry up. The vendor carrying the betel leaves is called “bag bai”.

51
causes adverse and unfavourable prices for the growers. During the field study, it was observed that the growers have to depend on the information provided by the traders in the sample areas. In respect of packaging and packing, traditional materials and methods are followed resulting in a damage of betel leaves during transportation. It was also observed that during peak seasons of harvesting in general and also in the case of good harvesting free from vagaries of weather and diseases or when the supply of betel exceeds its demand, downward fluctuation in its price seizes the benefits of better crop to be accrued to growers. Absence of modern preservation techniques is responsible for such situations, which discourages the growers from adopting improved farm techniques to raise their production. The commission agents, living away from the production farms play an important role and control the market to the disadvantage of the producers. It was also recorded that the price gap between assembling and consuming in the market is very high and the prices tend to increase with the increasing distance. Thus, on the basis of the above discussion, it is advisable that if proper grading of leaves is performed, improvement in packing method, establishment of cold storage linkages between growers and buyer strengthened and farmer’s co-operatives are ensured, these will provide better remunerative prices to the growers resulting in an incentive for adopting improved methods of cultivation.

52

53
CHAPTER SEVEN
Findings, Conclusions and Recommendations Findings Economics of Export Betel Production The analysis reveals that the cost of cultivation per 1000 sticks on average was estimated at Rs.167,217.00. It was the highest in Gampaha district (Rs.190,530.00) and the lowest in Kurunegala district (Rs.143,904.00). Amongst the various cost heads, expenditure on construction of betel field was found being the highest (25.42%) followed by land preparation and vine transplanting (19.64%), irrigation charge (19.17%), fertilizer application (17.05%), pesticide application(5.46%), harvesting and crop maintenance (5.34%), packing, marketing and transport (4.66%) and weeding/inter-culturing (3.28%). The total variable cost at overall level was estimated at Rs.167,217.00 (100% of the total cost). Thus, this crop is highly capital intensive. The overall analysis of costs incurred in the cultivation of betel vine could establish a relationship between the cost and family size i.e., cost of cultivation increased with decrease of family size.
Analysis revealed that on average, 626 labour days per 100 sticks were created in the cultivation of betel vine. The share of family labour (at overall level) in the cultivation of betel vine was observed to be higher 211 (33.39%) as compared to hired labour 169 (26.99%). On the whole, the cultivation of betel vine has been generating many employment opportunities and this suggests high potential of farm employment in the case of these crops in the area. It was also observed that generally out of the total of labour engaged, about 46.11% were male and 53.89% were female. The analysis of per 100 stick cost of production of betel vine reveals that on average, the cost of production per 10,000 leaves was estimated at Rs.7,761 which varied across the sample districts from Rs.8,309.00 to Rs.5,165.00 between Kurunegala and Gampaha. The calculated data of gross income and net returns indicate that at overall level, gross income per 1000 sticks was estimated at Rs.259,432.00 and the net income was to be Rs.92,215.00. On average, estimated working expenses per 1000 sticks and percentage return on working capital were at Rs.167,217.00 and 55.14% respectively. Higher return on working capital might be due to higher net income in the selected farms of sample areas.

54
As a whole, capital output ratio was estimated at 1:1.55, and this established a relationship that sample villages with higher per unit of capital investment incurred higher corresponding incomes. Thus, the above analysis established that due to lack of knowledge, betel vine growers were not able to make optimal use of labour resources in their farms. As per the information collected from the sample growers it was identified that growers were using three important channels through which they used to dispose of their produce. These channels are:
1. Grower/Producer Export Wholesaler (Local Buyer Only One)Export to Pakistan
2. Grower/Producer Local Wholesaler (POLA) Pakistan Wholesaler Export to Pakistan
3. Grower/Producer Local Wholesalers (POLA) Export Pakistan
The analysis indicated that at overall level about 78.85 per cent of produce was (both district) marketed through channel – 1 followed by 20.84 per cent by channel – 3 and 3.31 per cent by channel – 2. The price received by the growers was the highest in channel – 3 (79.91 %) followed by channel – 2 (75.43 %) and channel – 1 (73.46 %). The Channel 1 is only one export wholesale (Mr Banduragoda) buyer by low price from farmer but the payment is made on time. The analysis observed that the price per 10,000 leaves of betel received by the producer was Rs.23,000.00 in channel – 1 followed by Rs.24,101.00 in channel – 2 and Rs.24,101.00 in channel – 3, whereas in all the channels retailers’ selling price and Pakistan wholesalers purchase price was Rs.30,161.00 per 10,000 betel leaves. The survey also identified the major constraints faced by the growers in the production of betel vine. The constraints were categorized into two sections: (1) Agro-Biological: i.e., disease, pests, rains, good planting material and perishability; and (2) Economic constraints: i.e., lack of capital, high costs of labour, construction cost of betel field (for 1000 sticks = Rs.17,000-20,000), irrigation, fertilizer, insecticides, lack of developed marketing facilities and price fluctuations were taken into account. In case of agro-biological constraints, about rank 1 (high percentage), the growers reported that disease severity was the main constraint. In economic constraints, inadequate marketing facility ranked first. Besides, almost all the selected growers reported poor communication of betel export marketing information. Observations during the course of survey related to the marketing aspect revealed that a systematic marketing of betel vine did not prevail in the area. As a result the growers had to toil hard to sell their produce. It was observed that they are dictated by the terms and conditions of commission agents. Thus, they are subject to much exploitation as the monetary returns are very low. Most of farmers (81.3%) propose to establish Dedicated Economic Centres (DECs) for betel export market. (Eg. Apeladeniya in Kurunegala district in 2004).

55
Suggestions and Policy Implications On the basis of the findings of the study following suggestions emerged. 1. There is a need for supplying package of practices to the farmers of betel vine,
and similarly there is a need for demonstrations. 2. As evident in the construction cost of betel vine constituting a significant portion
of the total expenditure on production, it is necessary to develop a more economically efficient method for its production. (Low cost technique for its construction especially for betel sticks)
3. As per the survey, the commission agents, those who are employed under
private organisations, are in control of the entire marketing system - devoid of organised marketing and government machinery. Therefore, the government systems may be essential in ridding the current marketing system which is under the control of private traders, of malpractice (marketing system run by the private traders).
4. The establishment of Betel Growers’ Co-operative Societies will be a significant
step in resolving the issues. 5. The harvesting of betel needs high capital expenditure as the majority of farmers
are economically disadvantaged. Therefore, special facilities should be provided by the public sector banks and other organisations involved in this field to ensure an easy flow of loan facilities for the growing of betel.
6. It is evident that there was no proper relationship between the farmers and
researchers for logistics of betel vine production technology, which in turn influences the production of betel. Efforts should be made to establish this link.
7. The most effective form of aid is self-help. Therefore, organisation and
improvement of self help groups would be significant in solving their problems. 8. It was analysed that no attempts were made by any agency in regard to utilising
the most recent technology in either of the sample districts. It is recommended that appropriate measures in this regard should be taken immediately.
9. A large scale educational campaign targeting consumers should be launched in
regard to the health benefits and pharmaceutical value of betel vine crops. 10. A more industrious approach should be adopted in researching the industrial use
of betel leaves in the pharmaceutical industry.

56
REFERENCES Amalendu, K., (2007), Economics of Production and Marketing of Betel vine In Bihar,
Ministry of Agriculture, Government of India. Annual Report, (2005), Bihar Anknaro Mein, Directorate of Statistics, Government of
Bihar. Anon, (1982), Annual Report of the J N Krishi Vishwavidyalaya, Jabalpur, pp.18. Anon, (1986), All-India Co-ordinated Research Project on Betel vine. Annual Report,
Tech. DoC, No. 2, Indian Institute of Horticultural Research, Bangalore. Anon, (1996), Marketing of Betel leaves in India, Directorate of Marketing and
Inspection, Ministry of Rural Development, Faridabad, 1983b. Anon, (1984), Betel Growing in the Wet Zone. Home and Garden Bulletine 9,
Department of Agriculture, Publicity Division, Colombo 12. Anon, (2004), Administrative Report, Department of Export Agriculture, Peradeniya. Arulmozhiyan, R., and Thamburaj, S., (1998), Integrated Nutrient Management in Betel
Vine (Piper betle L.) for Increased Productivity. Agricultural University, Thamilnadu
Asian Tribune, (2010), Accessed at http://www.asiantribune.com/node/1943 on 25th
March, 2013. Balsubrahmanyam, V.R. (1992), “Irrigating Betel vine Plantation the Right Way,” Indian
Betel Vine (Piper betel L.) for Increased Productivity. Agricultural University, Thamilnadu. The Agricultural Society of India, Calcutta, pp.189-196.
Balasubrahamanyam, V.R., (1994), Betel vine. National Botanical Research Institute,
Lucknow, pp.6-7. Changule, B.A., (1960), Betel vine Cultivation in India. Farm Bulletin (Ed.) M G Kamathu,
Directorate of Extension, Ministry of Food & Agriculture, New Delhi. Chaurasia, R.S. and Johri J.K., (1990), Production Analysis of Betel Leaves, Agricultural
Situation in India. 44(i), pp. 23-25. Chopra, I.C., Handa, K.L. and Kapur L.D. (1958), Chopra's Indigenous Drugs of India (2nd
ed.). Academic Publishers, pp.178–179.

57
Department of Export Agriculture, (2004), Betel Cultivation and Processing. Technical Bulletin, pp.47.
Department of Export Agriculture and Ministry of Agriculture, (2006), “Bulath Arunella”
National betel development program. Department of Export Agriculture Sri Lanka, (2013), Accessed at
http://www.exportagridept.gov.lk/web/ on 22nd March, 2013. Department of Census and Statistics, (2010), Census Data. Gadre, N., A. and Galgalikar, V., D. (1988), Economic Analysis of Betel Leaf Production
and Marketing in Maharashtra. Paper presented in workshop on betel vine, Calcutta University, Calcutta.
Garrett, H., E., and Woodworth, R., S. (1969). Statistics in Psychology and Education.
Bombay, Vakils , Feffer and Simons Pvt. Ltd., pp.329. Ghoshal, R., Mazumder, G., and Acharya, S. K., (2010). Adoption behavior of betel vine
cultivation in relation to scientific practices in some selected areas of Howrah district. Agricultural Extension Dep, Bidhan Chandra Krishi Viswavidyalaya, Mohanpur, 28(4A), pp.2591-2593.
Haleem, A.S., (1995), Purana Lucknow, National Book Trust India. Hinge, B.J., and Tilekar, S.N., (1987), Economics of Production and Marketing of Betel
Horticulture. 136(4). Kaleeswari ,V., Sridhar,T., (2013), A Study on Betel Vine Cultivation and Market Crisis in
Karur District. Indian Journal of Applied Research, 3 (10).
Mahesha, L., Sigera, N., Nadugala and Amarasinghe, B.H.R.R., (2009), Diversity among different isolates of Xanthomonas campestris pv. betlicola on the basis of phenotypic and virulence characteristics. J.Natn.Sci.Foundation, Sri Lanka, 37(1),pp.77-80.
Mishra, V., Archana, M., Saifta (2005), A Study of Betel Leaf Microflora, P.G., College of Science and Education, Bhopal Govt. MLB Girls College, Bhopal. Asian J. Exp. Sci., 19(2), pp.59-62.
Monier-William, M.A., Sanskrit (1951), English Dictionary Clarendon Press, Oxford, Great
Britain.

58
Mukherjee, A. and Giri, A.K.,(1991), Sister chromatid exchange induced by ‘pan masala’ (a betel quid ingredient) in male mice in vivo, Food and Chemical Toxicology. 29(6), pp.401–403.
Rathnasoma, H.A., and Senevirathna, J.M., (2002), Technical Bulletin on Betel
Cultivation. Department of Export Agriculture, Peradeniya. Saniyapan, R. and Marimuthu, T. (1982), “Is Betel Vine Cultivation Profitable to Farming
Community”. Report on National Workshop on Betel vine, Calcutta. Sri Lanka Spice Council (2010), Accessed at
http://www.srilankanspices.com/sl_spices_betel.html on 18th February, 2013. Sumanasena, H.A., Basnayaka, B.M.S. and Fernandopulle, M.N.D., (2005), Evaluation of
Alternative Types of Supporting Materials for Betel (Piper betle L.) Cultivation, Proceedings of 5th Agricultural Research Symposium Part II, Faculty of Agriculture and Plantation Management, Wayamba University of Sri Lanka, Makandura, Gonawila.
Sumanasena, H.A., Kadigamuwa, H.M.J.J.K. and Gunathilaka, H.A.W.S. (2005), Technical
Bulletin on Betel Cultivation, Department of Export Agriculture, Peradeniya. Sumanasena, H.A., and Chandana, G.A., (2005), Effect of irrigation and fertilizer on leaf
production of betel vine. Tropical Agricultural Research and extension, 8. Sundaram, M., (1987), An Economic Analysis of Production of Betel vine in Tamil Nadu.
Agriculture Situation in India, 42(1).