HMIS Document Detailed Guide to the Automated APR ... · Homeless Services Network of Central...
26
HMIS Document Detailed Guide to the Automated APR Performance Report Homeless Services Network of Central Florida 4065-D L.B. McLeod Road Orlando, FL 32811 Phone: (407) 893-0133 Fax: (407) 893-5299 www.hsncfl.org
Transcript of HMIS Document Detailed Guide to the Automated APR ... · Homeless Services Network of Central...
HMIS Document
Detailed Guide to the Automated APR Performance
Report
Homeless Services Network of Central Florida
4065-D L.B. McLeod Road
Orlando, FL 32811
Phone: (407) 893-0133
Fax: (407) 893-5299
www.hsncfl.org

Homeless Services Network of Central Florida HMIS Department
Table of Contents HOW TO RUN THE AUTOMATED APR PERFORMANCE REPORT? ......................................................................................... 3
Step 1 : Head on to our website ........................................................................................................................................ 3
Step 2 : Expand “THE NUMBERS” tab ................................................................................................................................ 3
Step 3 : Navigate APR PERFORMANCE REPORT from HMISCFL.org ................................................................................... 3
Step 4 : Navigate to ServicePoint, Run & Download your CoC APR ................................................................................... 5
Step 5 : Upload your (Zipped) CoC APR File ....................................................................................................................... 6
Step 6: View your APR Results Navigate to the About Page for More Information ........................................................ 6
Step 7: Navigate to the About Page for More Information .............................................................................................. 7

Homeless Services Network of Central Florida HMIS Department
HOW TO RUN CoC APR?
**Refer the Guide to Running a CoC APR
HOW TO RUN THE AUTOMATED APR PERFORMANCE REPORT?
**Refer the Guide to Running the Automated APR Performance Report
HOW TO ANALYZE AND UNDERSTAND DATA ON THE AUTOMATED APR PERFORMANCE REPORT?
Once the user has completed the following process:
Running a CoC APR on ServicePoint, and
Running the Automated tool on the CoC APR
The user can now try to understand the data been presented by the automated tool using this guide.
(Note: It would be helpful if the user keeps a copy of the APR and the populated automation tool side-by-side while
referring to the guide)
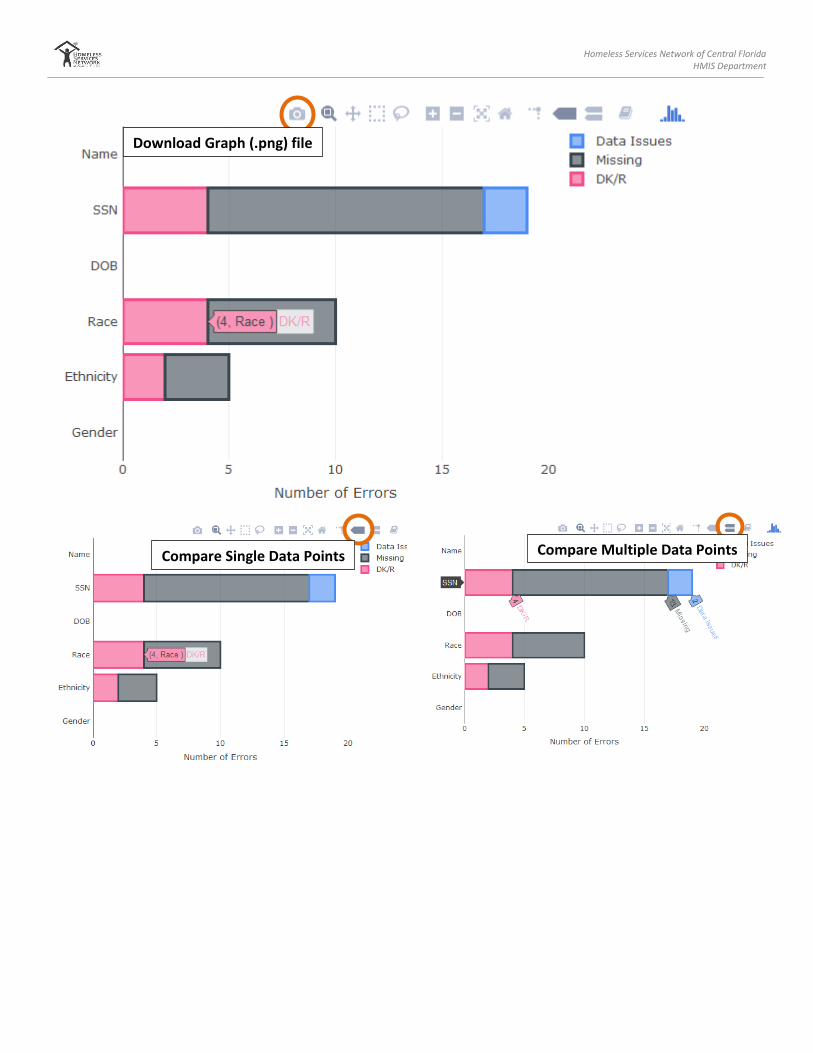
Basic Navigation Controls
In this section we see how one could interact with the graphs by just simply hovering the mouse cursor over the graphs.
While hovering over a graph, an option bar appears on the right top corner of a graph.
The highlighted items in the option bar are useful to the users. The uses of each of these options are described below:
Compare Single Data Points Compare Multiple Data Points Download Graph (.png) file
Homeless Services Network of Central Florida HMIS Department
Compare Single Data Points Compare Multiple Data Points
Download Graph (.png) file

Homeless Services Network of Central Florida HMIS Department
Summary Page
The Summary Page shows provides us with:
Provider Name.
o Q4a – Project Name
Provider’s Service Type.
o Q4a – Organization ID
Total Clients Served by the Provider for the time period the APR was run on.
o Q5a – Total Number of Persons Served
The different kinds of Provider Service Type are:
"Emergency Shelter"
"Transitional Housing"
"PH - Permanent Supportive
Housing"
"Street Outreach"
"RETIRED"
"Services Only"
"Other"
"Safe Haven"
"PH - Housing Only"
"PH - Housing with Services"
"Day Shelter"
"Homelessness Prevention"
"PH - Rapid Re-Housing"
"Coordinated Assessment"
Homeless Services Network of Central Florida HMIS Department
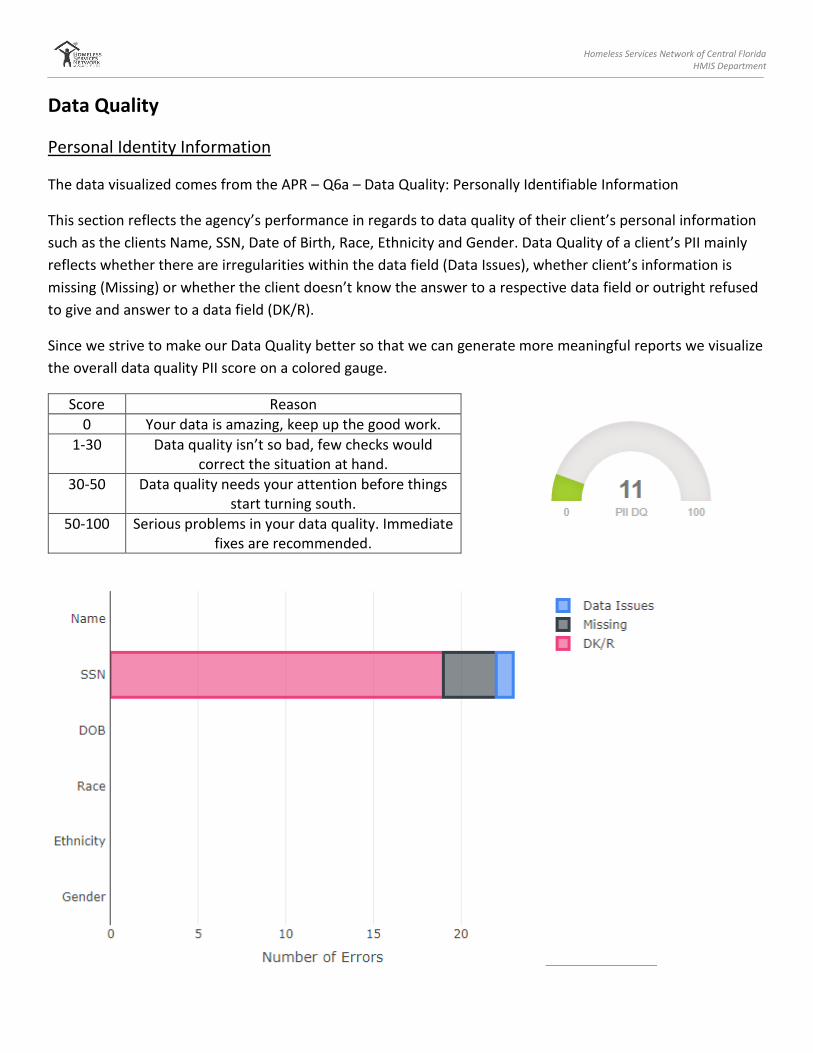
Data Quality
Personal Identity Information
The data visualized comes from the APR – Q6a – Data Quality: Personally Identifiable Information
This section reflects the agency’s performance in regards to data quality of their client’s personal information
such as the clients Name, SSN, Date of Birth, Race, Ethnicity and Gender. Data Quality of a client’s PII mainly
reflects whether there are irregularities within the data field (Data Issues), whether client’s information is
missing (Missing) or whether the client doesn’t know the answer to a respective data field or outright refused
to give and answer to a data field (DK/R).
Since we strive to make our Data Quality better so that we can generate more meaningful reports we visualize
the overall data quality PII score on a colored gauge.
Score Reason
0 Your data is amazing, keep up the good work.
1-30 Data quality isn’t so bad, few checks would correct the situation at hand.
30-50 Data quality needs your attention before things start turning south.
50-100 Serious problems in your data quality. Immediate fixes are recommended.
Homeless Services Network of Central Florida HMIS Department
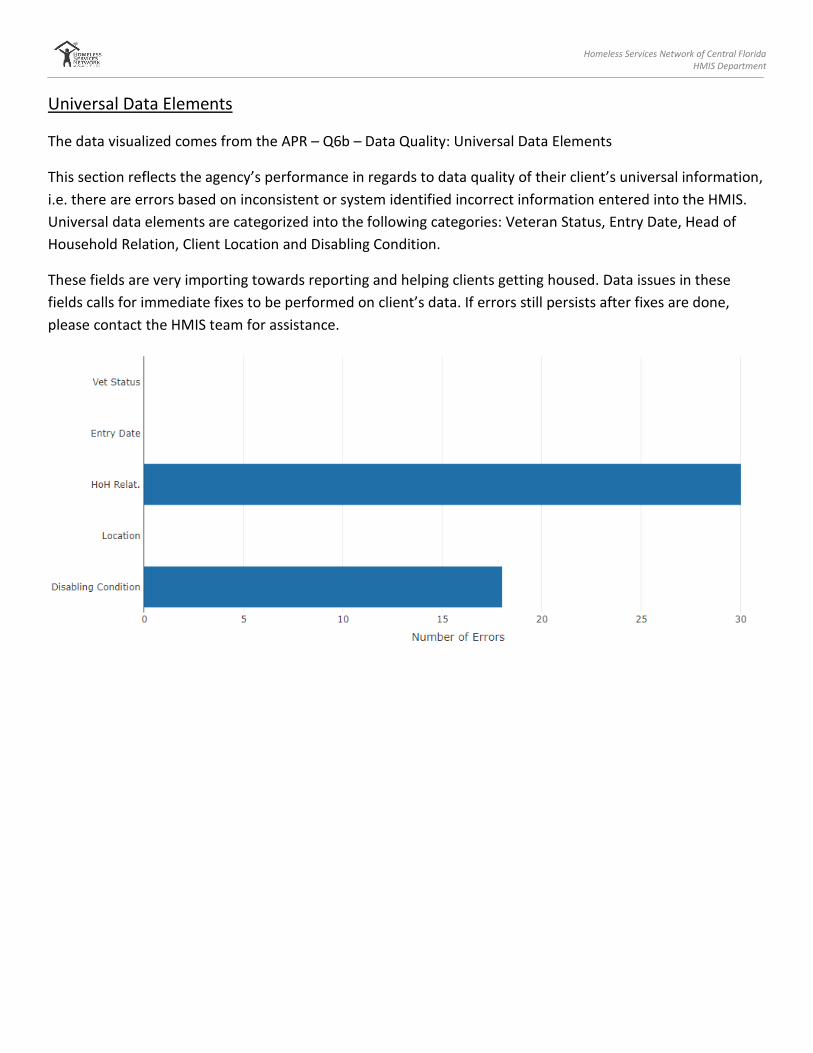
Universal Data Elements
The data visualized comes from the APR – Q6b – Data Quality: Universal Data Elements
This section reflects the agency’s performance in regards to data quality of their client’s universal information,
i.e. there are errors based on inconsistent or system identified incorrect information entered into the HMIS.
Universal data elements are categorized into the following categories: Veteran Status, Entry Date, Head of
Household Relation, Client Location and Disabling Condition.
These fields are very importing towards reporting and helping clients getting housed. Data issues in these
fields calls for immediate fixes to be performed on client’s data. If errors still persists after fixes are done,
please contact the HMIS team for assistance.
Homeless Services Network of Central Florida HMIS Department
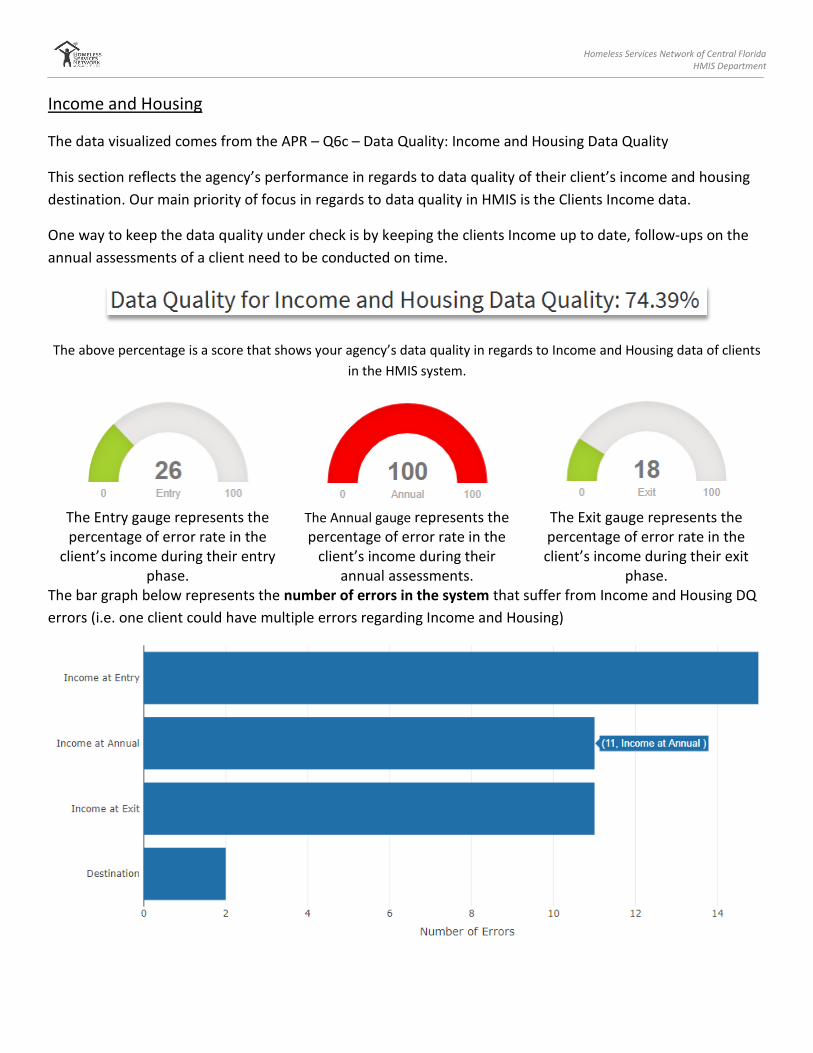
Income and Housing
The data visualized comes from the APR – Q6c – Data Quality: Income and Housing Data Quality
This section reflects the agency’s performance in regards to data quality of their client’s income and housing
destination. Our main priority of focus in regards to data quality in HMIS is the Clients Income data.
One way to keep the data quality under check is by keeping the clients Income up to date, follow-ups on the
annual assessments of a client need to be conducted on time.
The above percentage is a score that shows your agency’s data quality in regards to Income and Housing data of clients
in the HMIS system.
The Entry gauge represents the percentage of error rate in the
client’s income during their entry phase.
The Annual gauge represents the percentage of error rate in the
client’s income during their annual assessments.
The Exit gauge represents the percentage of error rate in the client’s income during their exit
phase. The bar graph below represents the number of errors in the system that suffer from Income and Housing DQ
errors (i.e. one client could have multiple errors regarding Income and Housing)
Homeless Services Network of Central Florida HMIS Department
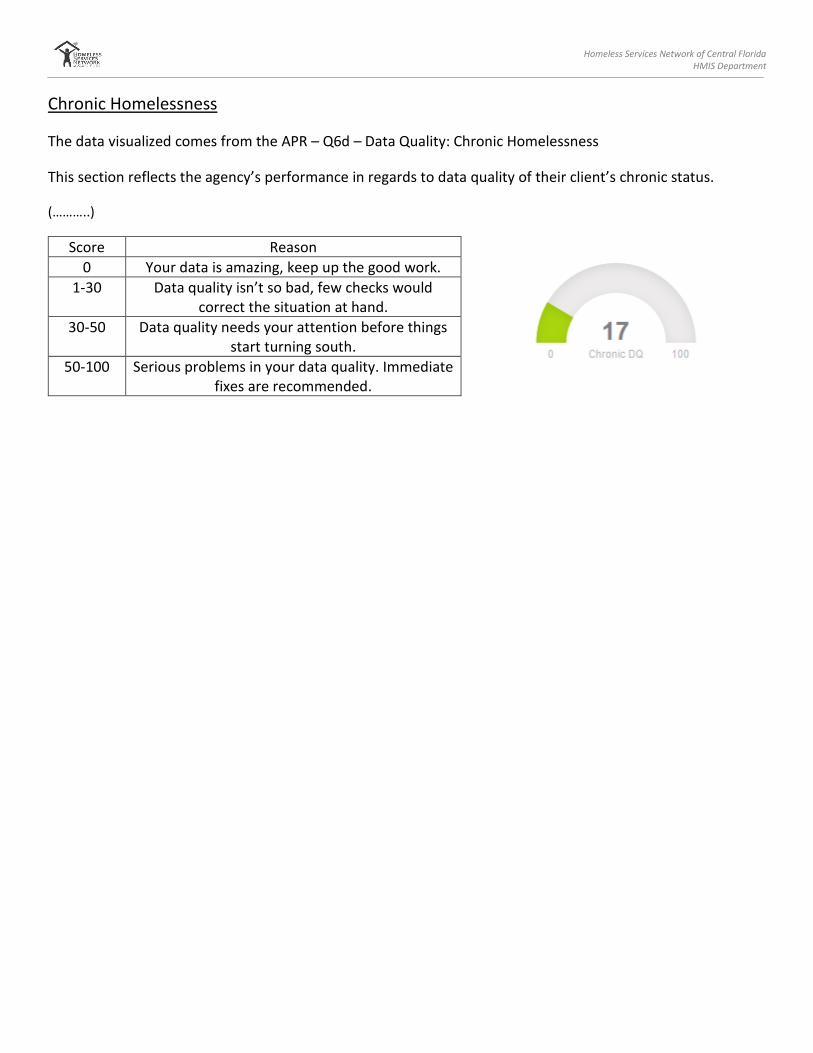
Chronic Homelessness
The data visualized comes from the APR – Q6d – Data Quality: Chronic Homelessness
This section reflects the agency’s performance in regards to data quality of their client’s chronic status.
(………..)
Score Reason
0 Your data is amazing, keep up the good work.
1-30 Data quality isn’t so bad, few checks would correct the situation at hand.
30-50 Data quality needs your attention before things start turning south.
50-100 Serious problems in your data quality. Immediate fixes are recommended.
Homeless Services Network of Central Florida HMIS Department
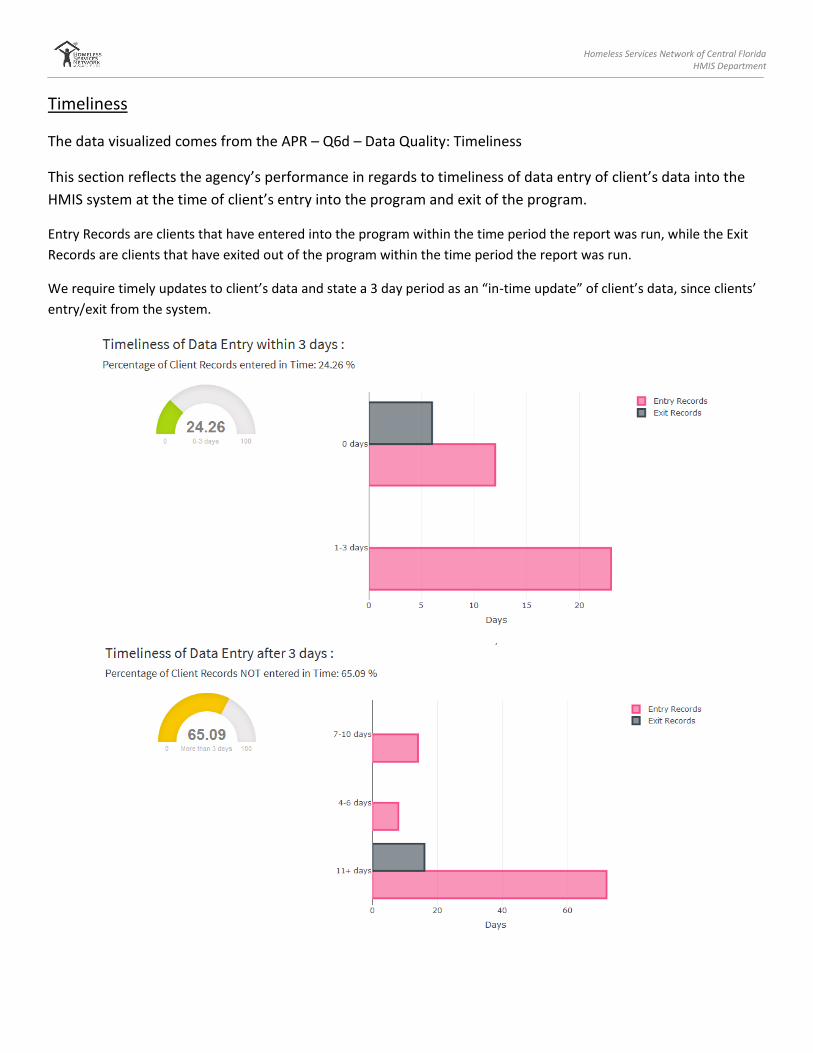
Timeliness
The data visualized comes from the APR – Q6d – Data Quality: Timeliness
This section reflects the agency’s performance in regards to timeliness of data entry of client’s data into the
HMIS system at the time of client’s entry into the program and exit of the program.
Entry Records are clients that have entered into the program within the time period the report was run, while the Exit
Records are clients that have exited out of the program within the time period the report was run.
We require timely updates to client’s data and state a 3 day period as an “in-time update” of client’s data, since clients’
entry/exit from the system.

Homeless Services Network of Central Florida HMIS Department
Clients Served
Clients Served
The data visualized comes from the APR – Q5a - Clients Served
This shows the total number of clients served for the time period of the report, out of which we visualize the
clients that are still being served by the agency versus those clients who exited from the service provided by
the agency for the time period of the report.

Homeless Services Network of Central Florida HMIS Department
Chronically Homeless Served
The data visualized comes from the APR – 26b – Number of Chronically Homeless Persons by Household
The numbers are bifurcated by client’s gender and age.
Q26c - Gender of Chronically Homeless Persons
Q26d - Age of Chronically Homeless Persons

Homeless Services Network of Central Florida HMIS Department
Unemployed Served
The data visualized comes from the APR – 16 - Cash Income - Ranges
The percentage of unemployed clients are the total adult clients served by the agency who do not have a
source of income, while the percentage of employed clients are the total adult clients served by the agency
who have a source of income or multiple sources of income.
If assessments regarding client’s income status are conducted on a regular basis, we would have more
consistent data in HMIS.
This section focuses on the adults who have a source of income and are distributed based on their income ranges (Q16)
and their sources of income (Q18)

Homeless Services Network of Central Florida HMIS Department
Client Demographics
This section shows the demographic of clients served by the agency based on generic client information like
Age, Gender, Race, and Ethnicity
Age
Clients aged 0-18 are considered as Youth, while clients aged 18-62+ are considered as Adults.
Gender
The age group are further sub grouped based on client’s gender.

Homeless Services Network of Central Florida HMIS Department
Race
Ethnicity
Homeless Services Network of Central Florida HMIS Department
Other Data
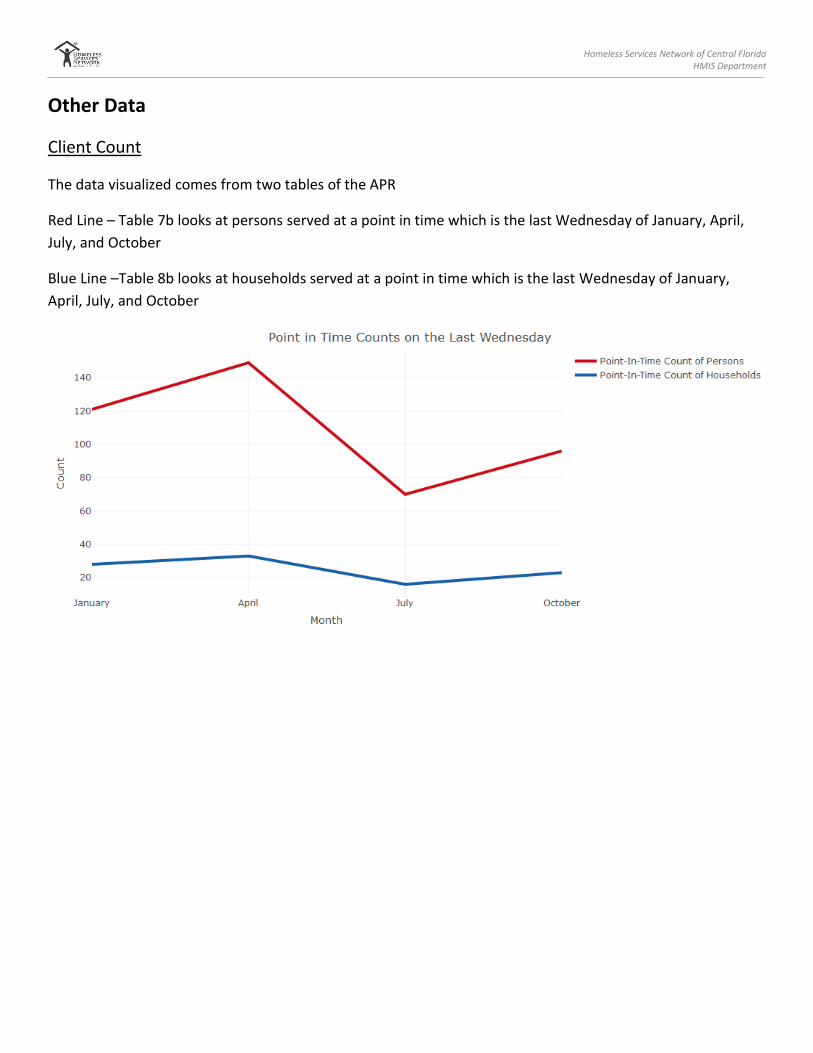
Client Count
The data visualized comes from two tables of the APR
Red Line – Table 7b looks at persons served at a point in time which is the last Wednesday of January, April,
July, and October
Blue Line –Table 8b looks at households served at a point in time which is the last Wednesday of January,
April, July, and October

Homeless Services Network of Central Florida HMIS Department
Disabilities
The data visualized comes from the APR – Q13a1 – Physical and Mental Health Conditions at Start
Recipients report on the conditions and disabilities of persons served in these tables during the reporting
period. These include: mental illness, alcohol abuse, drug abuse, chronic health condition, HIV/AIDS and
related diseases, developmental disability, and physical disability. The information on conditions are to be
based on latest project stay. A person may have more than one condition; therefore, the tables are not
unduplicated (i.e. a person may be counted as having a disability as well as Alcohol Abuse for instance).

Homeless Services Network of Central Florida HMIS Department
Living Situations
The data visualized comes from the APR – Q15 – Living Situation
The living situation table reports on the living situation of adults and heads of households immediately prior to
entering the project. The table is broken into three categories: homeless situation, institutional settings, and
other locations.
Homeless Services Network of Central Florida HMIS Department
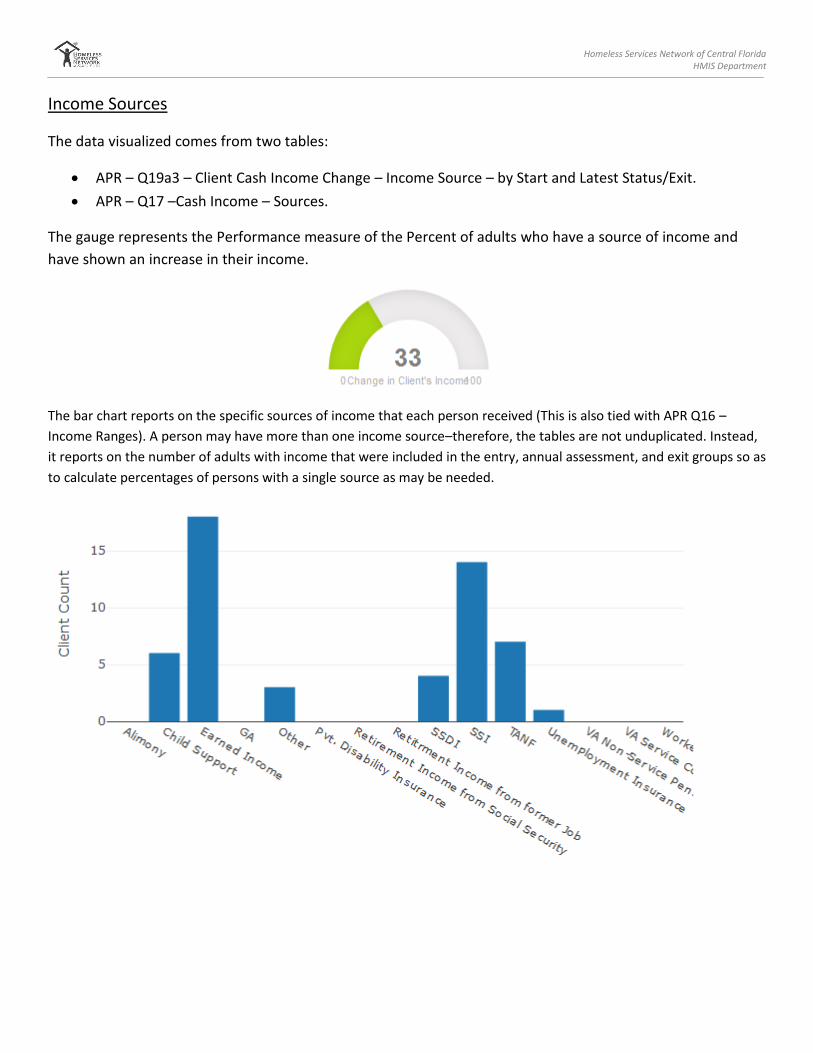
Income Sources
The data visualized comes from two tables:
APR – Q19a3 – Client Cash Income Change – Income Source – by Start and Latest Status/Exit.
APR – Q17 –Cash Income – Sources.
The gauge represents the Performance measure of the Percent of adults who have a source of income and
have shown an increase in their income.
The bar chart reports on the specific sources of income that each person received (This is also tied with APR Q16 –
Income Ranges). A person may have more than one income source–therefore, the tables are not unduplicated. Instead,
it reports on the number of adults with income that were included in the entry, annual assessment, and exit groups so as
to calculate percentages of persons with a single source as may be needed.
Homeless Services Network of Central Florida HMIS Department
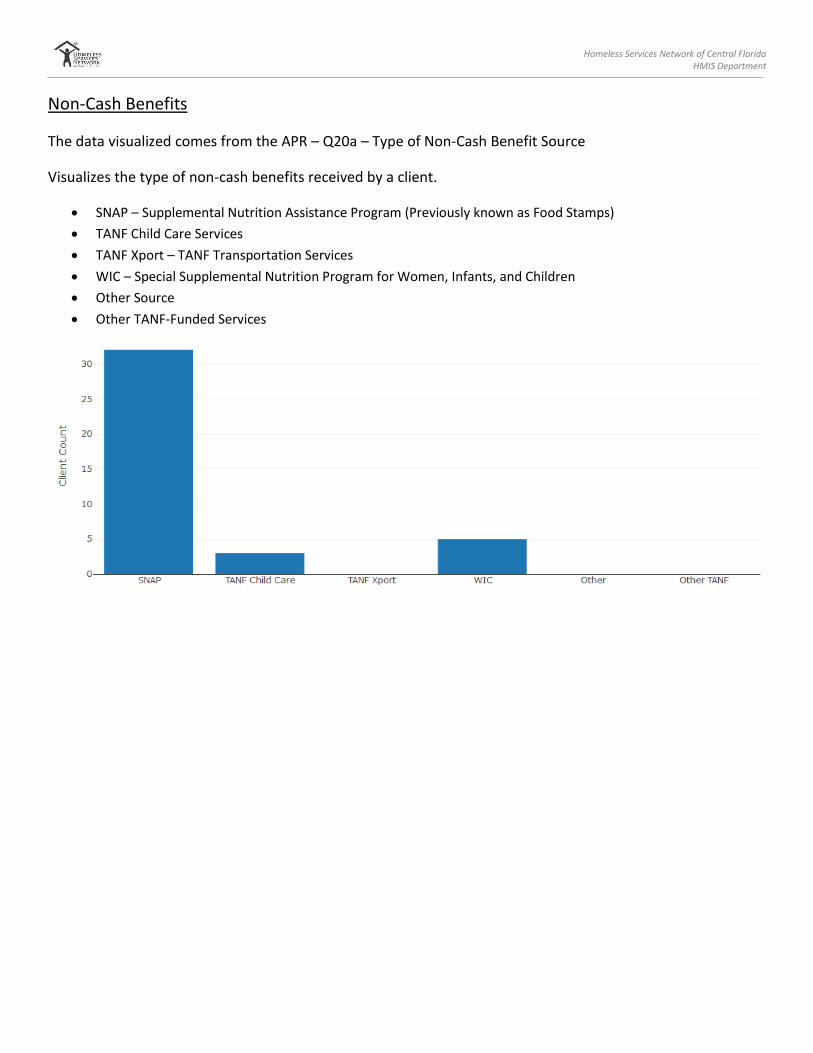
Non-Cash Benefits
The data visualized comes from the APR – Q20a – Type of Non-Cash Benefit Source
Visualizes the type of non-cash benefits received by a client.
SNAP – Supplemental Nutrition Assistance Program (Previously known as Food Stamps)
TANF Child Care Services
TANF Xport – TANF Transportation Services
WIC – Special Supplemental Nutrition Program for Women, Infants, and Children
Other Source
Other TANF-Funded Services

Homeless Services Network of Central Florida HMIS Department
Health Insurance
The data visualized comes from the APR – Q21 – Health Insurance
The table is split into two parts:
Number of Sources for Health Insurance – Whether client has health insurance or not, and if they do,
the number of sources the client is insured.
Sources of Health Insurance – Out of the clients that have health insurance, we visualize the sources of
income. The data represented here is unduplicated (i.e. a client can have multiple sources for health
insurance)
Homeless Services Network of Central Florida HMIS Department
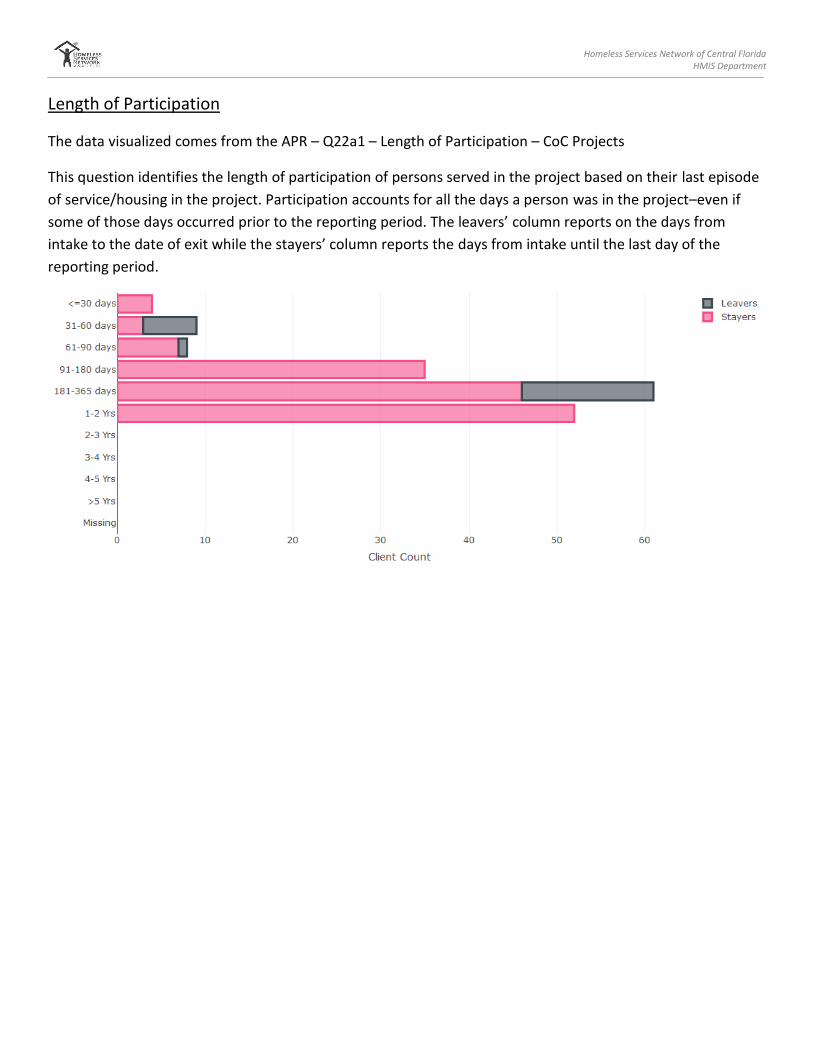
Length of Participation
The data visualized comes from the APR – Q22a1 – Length of Participation – CoC Projects
This question identifies the length of participation of persons served in the project based on their last episode
of service/housing in the project. Participation accounts for all the days a person was in the project–even if
some of those days occurred prior to the reporting period. The leavers’ column reports on the days from
intake to the date of exit while the stayers’ column reports the days from intake until the last day of the
reporting period.
Homeless Services Network of Central Florida HMIS Department
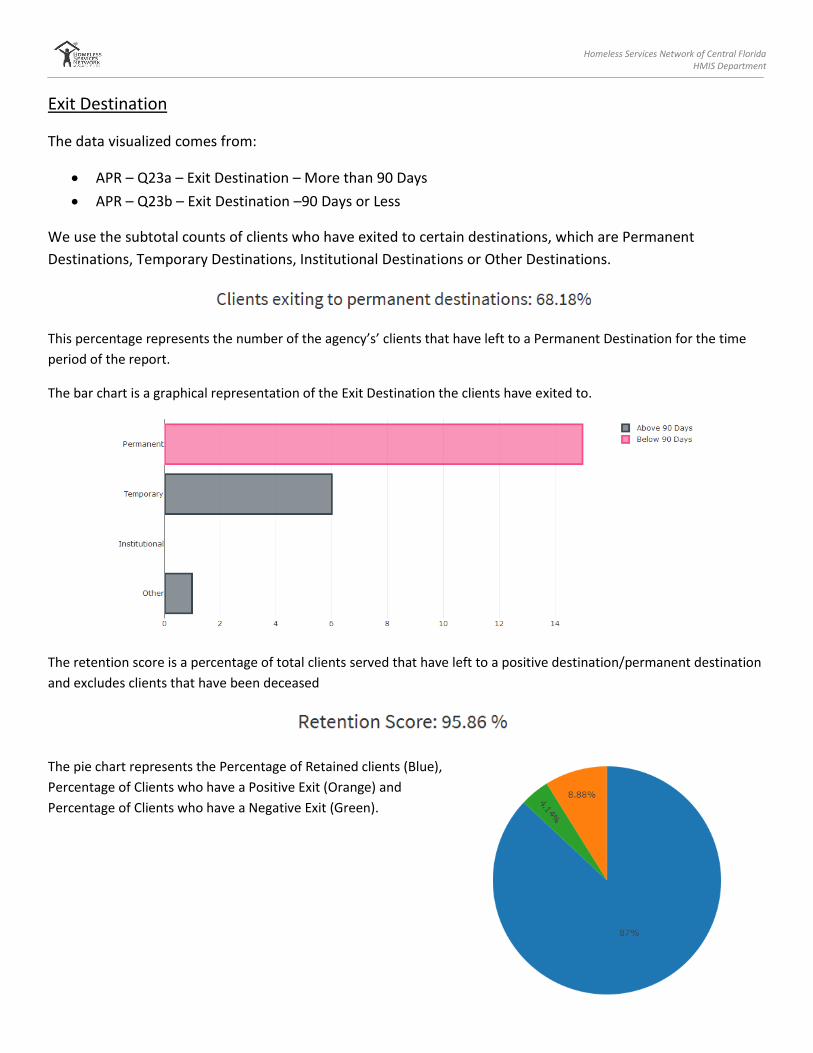
Exit Destination
The data visualized comes from:
APR – Q23a – Exit Destination – More than 90 Days
APR – Q23b – Exit Destination –90 Days or Less
We use the subtotal counts of clients who have exited to certain destinations, which are Permanent
Destinations, Temporary Destinations, Institutional Destinations or Other Destinations.
This percentage represents the number of the agency’s’ clients that have left to a Permanent Destination for the time
period of the report.
The bar chart is a graphical representation of the Exit Destination the clients have exited to.
The retention score is a percentage of total clients served that have left to a positive destination/permanent destination
and excludes clients that have been deceased
The pie chart represents the Percentage of Retained clients (Blue),
Percentage of Clients who have a Positive Exit (Orange) and
Percentage of Clients who have a Negative Exit (Green).

Homeless Services Network of Central Florida HMIS Department
Length of Time
Only shows for RRH Projects
The data visualized comes from the APR – Q22c – Length of Time between Project Start Date and Housing
Move-in Date.

Homeless Services Network of Central Florida HMIS Department
Scorecard
The scorecard is an evaluation of the Agency’s performance scored across a CoC wide benchmark. The benchmarks are
set on the Data Quality and Project Performance Measures of the Agency.
Each benchmark is further divided into different rating factors that improve Agency’s Data Quality and Project
Performance. Each rating factor is evaluated to a percentage, out of which we evaluate a score to the Agency based of a
CoC wide benchmark.
For instance, the table below shows the Agency scored a 5.2 out of 6.5 (CoC wide benchmark) on its Data Completeness
in respect to the Agency’s Data Quality.
Data Quality
Project Performance Measures

Homeless Services Network of Central Florida HMIS Department
About