
HKTDC April Fairs 2011 On-site Survey HKTDC April Fairs 2011 On-site Survey Actrium Solutions 3 May...
30
HKTDC April Fairs 2011 On-site Survey Actrium Solutions Actrium Solutions 3 May 3 May 2011 2011
-
Upload
annabella-mckenzie -
Category
Documents
-
view
230 -
download
0
Transcript of HKTDC April Fairs 2011 On-site Survey HKTDC April Fairs 2011 On-site Survey Actrium Solutions 3 May...

HKTDC April Fairs 2011
On-site Survey
HKTDC April Fairs 2011
On-site Survey
Actrium Solutions Actrium Solutions
3 May3 May 20112011

2
Methodology
Date of Fieldwork : April 13 - 28, 2011
Method : Face-to-face interview at the Exhibition Venue
Sample Size :
a. Electronics Fair 255 exhibitors; 302 buyers
b. Houseware Fair 208 exhibitors; 310 buyers
c. Gift & Premium Fair 256 exhibitors; 308 buyers

3
Key Findings Exhibitors
Key Findings Exhibitors
Impact of Japan Earthquake Impact of Japan Earthquake
4
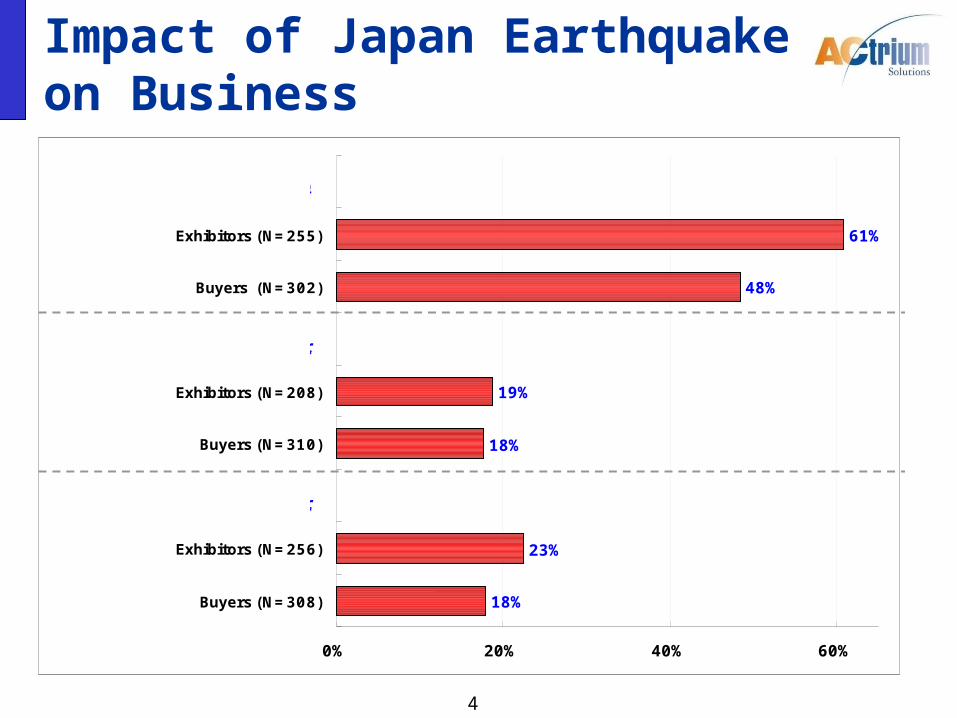
Impact of Japan Earthquake on Business
18%
23%
18%
19%
48%
61%
0% 20% 40% 60%
Buyers (N=308)
Exhibitors (N=256)
Buyers (N=310)
Exhibitors (N=208)
Buyers (N=302)
Exhibitors (N=255)
Electronics Fair (Spring Edition)
Houseware Fair
Gift & Premium Fair
5
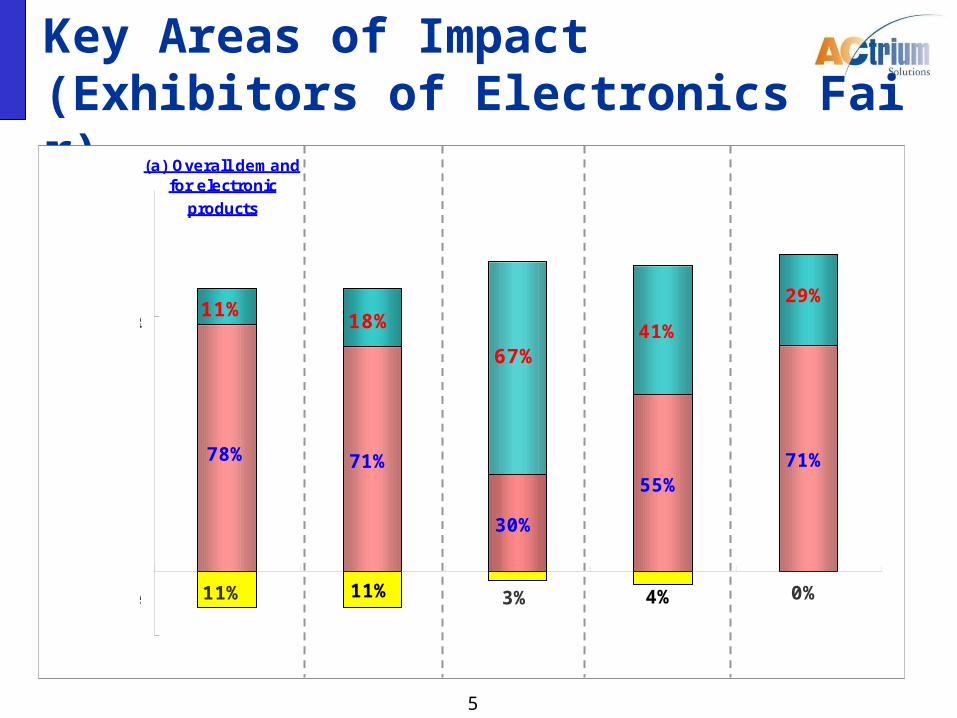
Key Areas of Impact (Exhibitors of Electronics Fair)
55%
78% 71% 71%
30%
11% 4%11% 3% 0%
18% 41%11%
29%
67%
-20%
80%
(a) Overall demandfor electronic
products
(d) FOB Sellingprice of your
products
(e) Delivery leadtime for your
products
Increase
Maintain
Decrease
(c) Sourcingprice of
your materials
Base: Exhibitors (N=155)
(b) Demand foryour products
6
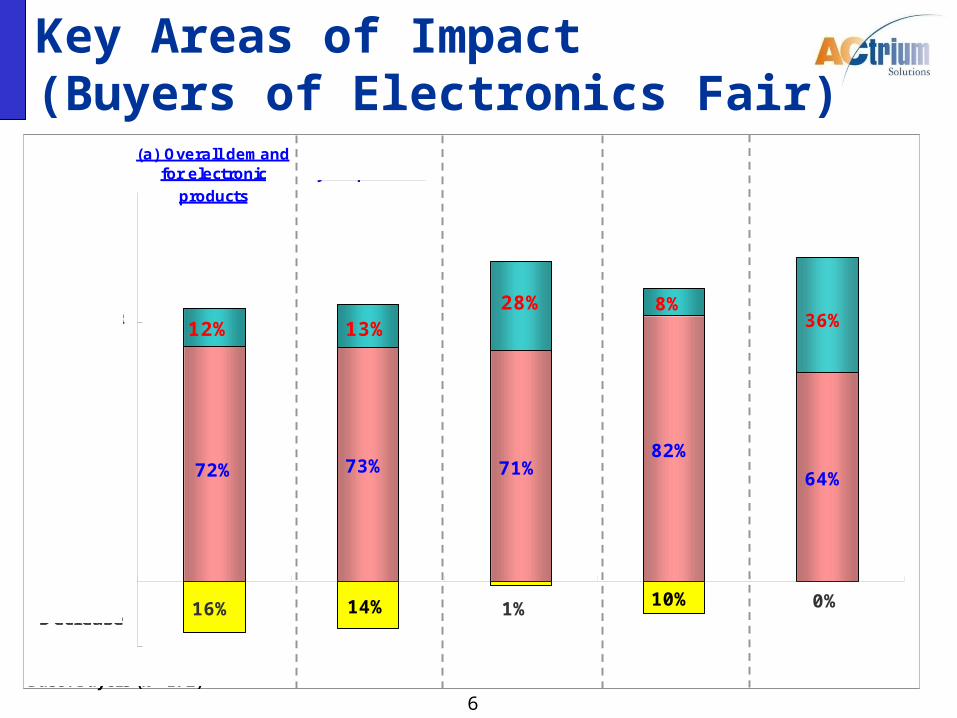
Key Areas of Impact (Buyers of Electronics Fair)
82%72% 73%
64%71%
14% 10%16% 1% 0%
13%8%
12% 36%28%
-20%
80%
(a) Overall demandfor electronic
products
(d) Retail priceof
your products
(e) Deliverylead time foryour products
Increase
Maintain
Decrease
(c) FOBsourcing price
(b) Demand foryour products
Base: Buyers (N=172)
7
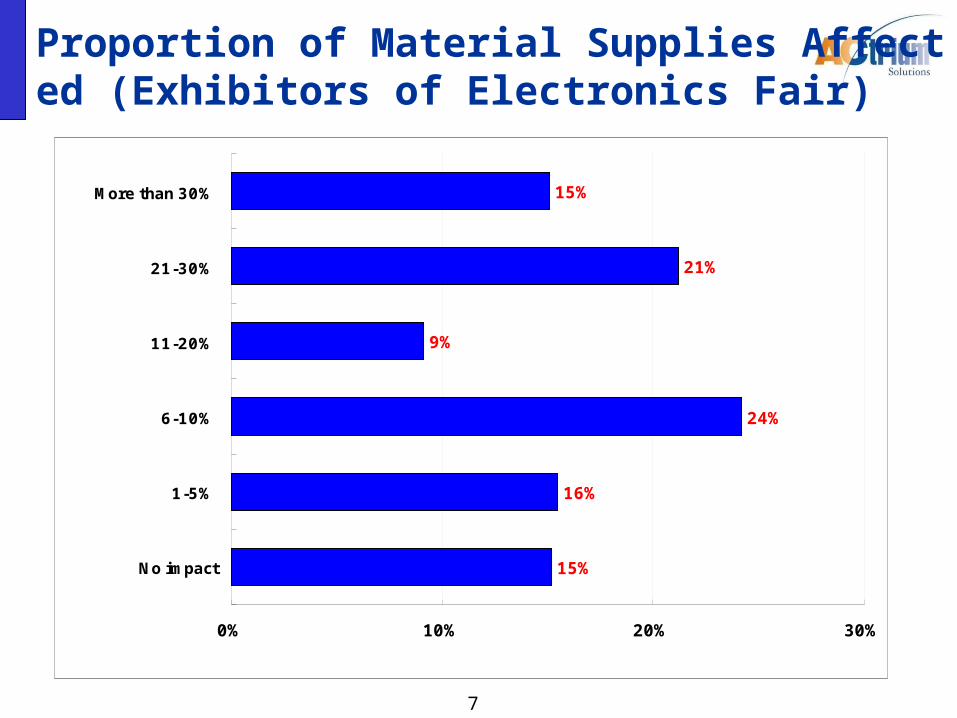
Proportion of Material Supplies Affected (Exhibitors of Electronics Fair)
15%
16%
24%
9%
21%
15%
0% 10% 20% 30%
No impact
1-5%
6-10%
11-20%
21-30%
More than 30%
Base: Exhibitors (N=66)
8
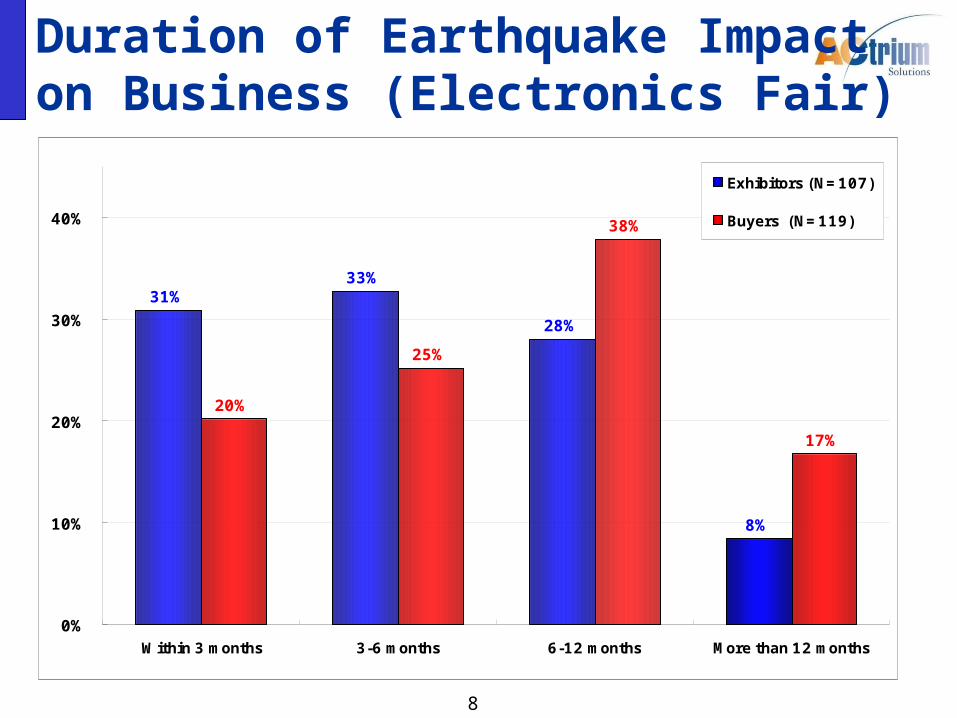
Duration of Earthquake Impact on Business (Electronics Fair)
31%33%
28%
8%
20%
25%
38%
17%
0%
10%
20%
30%
40%
Within 3 months 3-6 months 6-12 months More than 12 months
Exhibitors (N=107)
Buyers (N=119)

9
Key Findings Exhibitors
Key Findings Exhibitors
Market Outlook Market Outlook
10
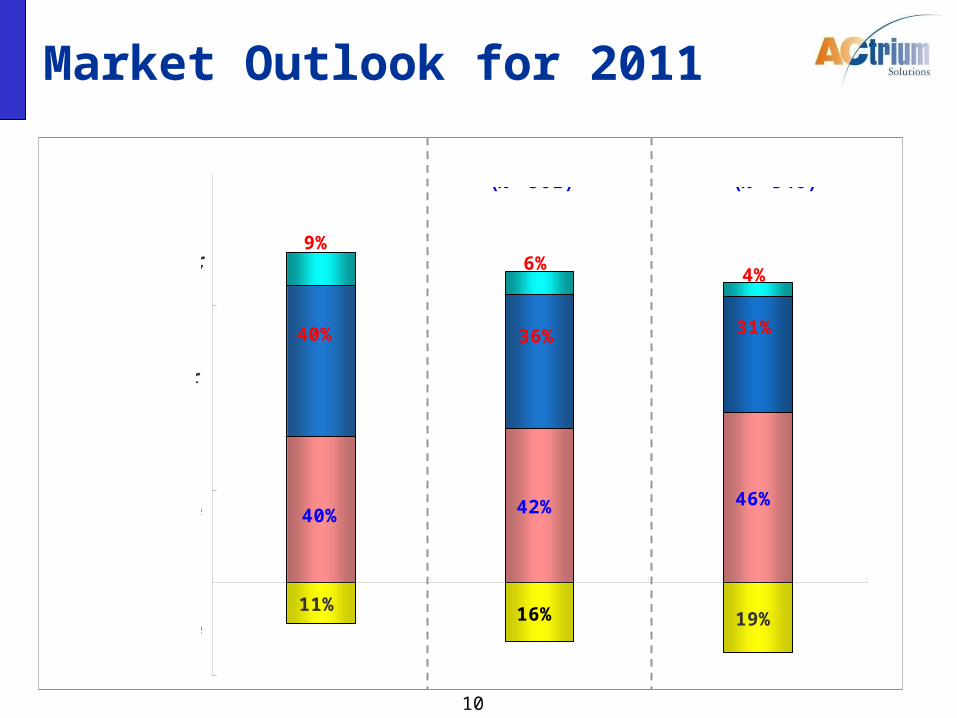
Market Outlook for 2011
46%42%40%
19%11% 16%
31%40% 36%
9%6%
4%
-25%
25%
75%
Electronics Fair(N=534)
Houseware Fair(N=501)
Gift & Premium Fair(N=546)
Much Better
The same
Worse
Better
11
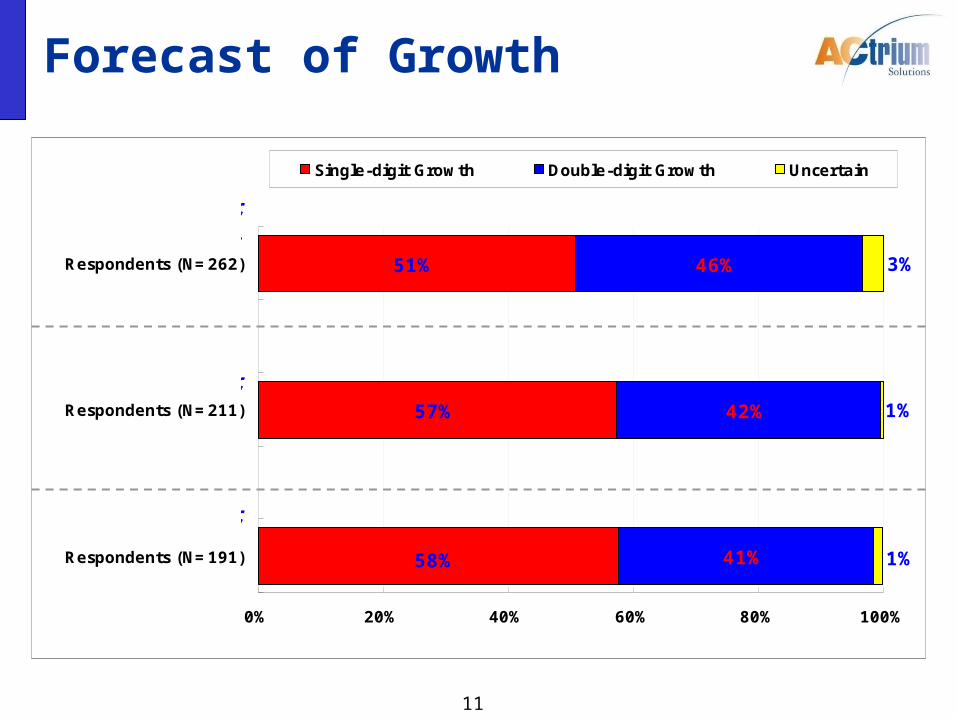
Forecast of Growth
57%
51%
41%
42%
46%
58%
1%
3%
1%
0% 20% 40% 60% 80% 100%
Respondents (N=191)
Respondents (N=211)
Respondents (N=262)
Single-digit Growth Double-digit Growth Uncertain
Electronics Fair(Spring Edition)
Houseware Fair
Gift & Premium Fair
12
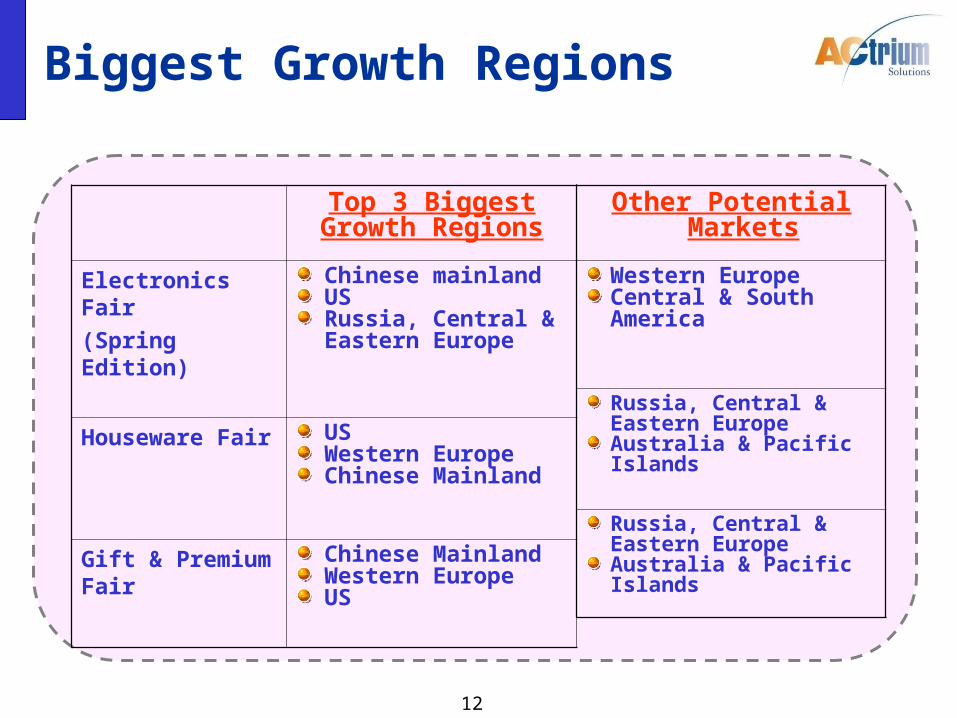
Biggest Growth Regions
Top 3 Biggest Growth Regions
Electronics Fair
(Spring Edition)
Chinese mainlandUSRussia, Central & Eastern Europe
Houseware Fair USWestern EuropeChinese Mainland
Gift & Premium Fair
Chinese MainlandWestern EuropeUS
Other Potential Markets
Western EuropeCentral & South America
Russia, Central & Eastern EuropeAustralia & Pacific Islands
Russia, Central & Eastern EuropeAustralia & Pacific Islands
13
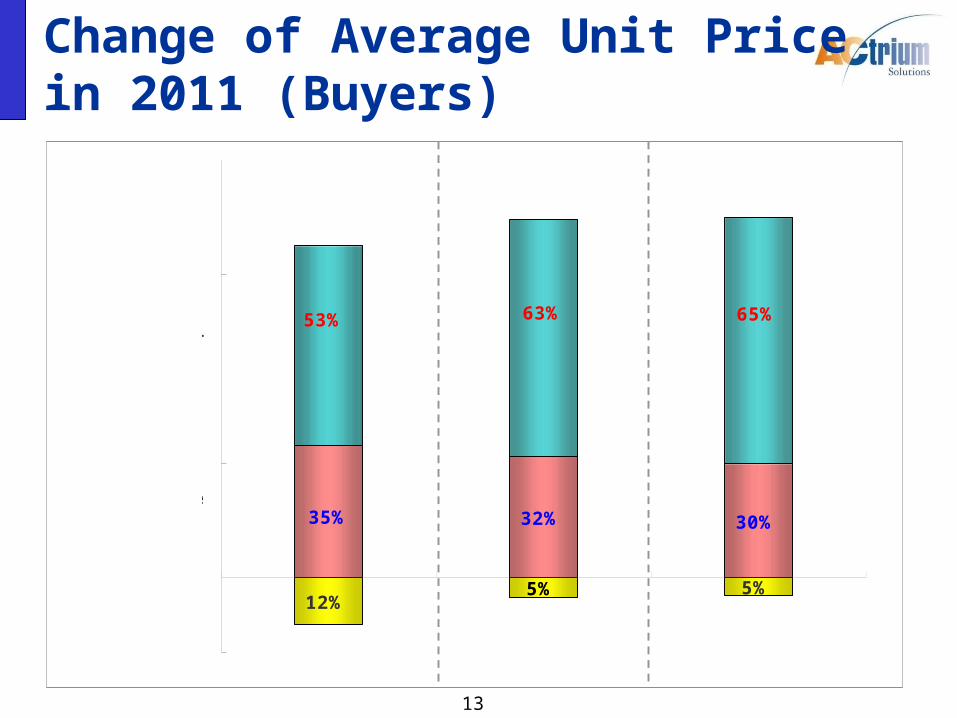
Change of Average Unit Price in 2011 (Buyers)
35% 32% 30%
5%12%
5%
63%53% 65%
-20%
30%
80%
Electronics Fair(Buyers, N=302)
Houseware Fair(Buyers, N=310)
Gift & Premium Fair(Buyers, N=308)
Increased
The same
Decreased
14
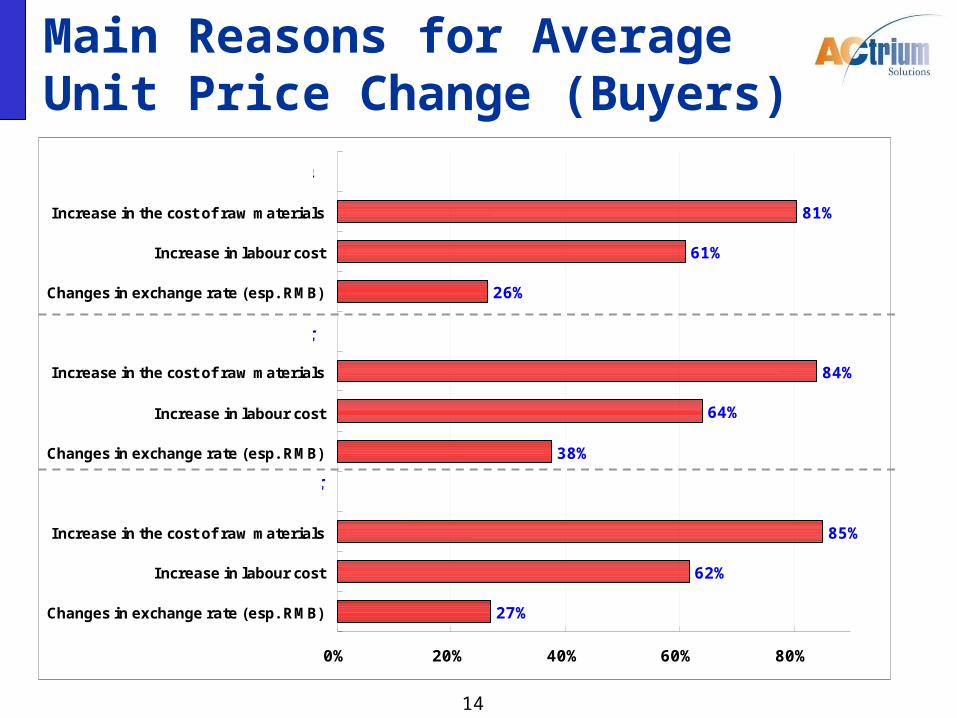
Main Reasons for Average Unit Price Change (Buyers)
27%
62%
85%
38%
64%
84%
26%
61%
81%
0% 20% 40% 60% 80%
Changes in exchange rate (esp. RMB)
Increase in labour cost
Increase in the cost of raw materials
Changes in exchange rate (esp. RMB)
Increase in labour cost
Increase in the cost of raw materials
Changes in exchange rate (esp. RMB)
Increase in labour cost
Increase in the cost of raw materials
Electronics Fair (Spring Edition)Buyers, N=159
Houseware FairBuyers, N=194
Gift & Premium FairBuyers, N=201

15
Key Findings Exhibitors
Key Findings Exhibitors
Product Trend Product Trend
16
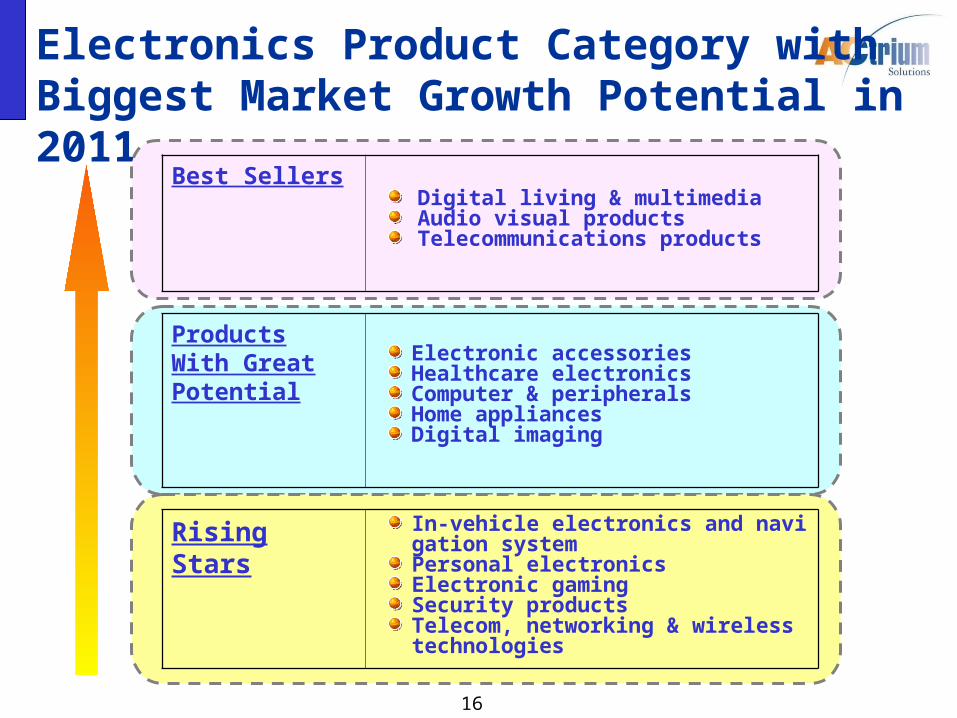
Electronics Product Category with Biggest Market Growth Potential in 2011
Best Sellers Digital living & multimedia Audio visual products Telecommunications products
Products With Great Potential Electronic accessories
Healthcare electronicsComputer & peripheralsHome appliancesDigital imaging
Rising Stars In-vehicle electronics and navigation systemPersonal electronicsElectronic gamingSecurity productsTelecom, networking & wireless technologies
17
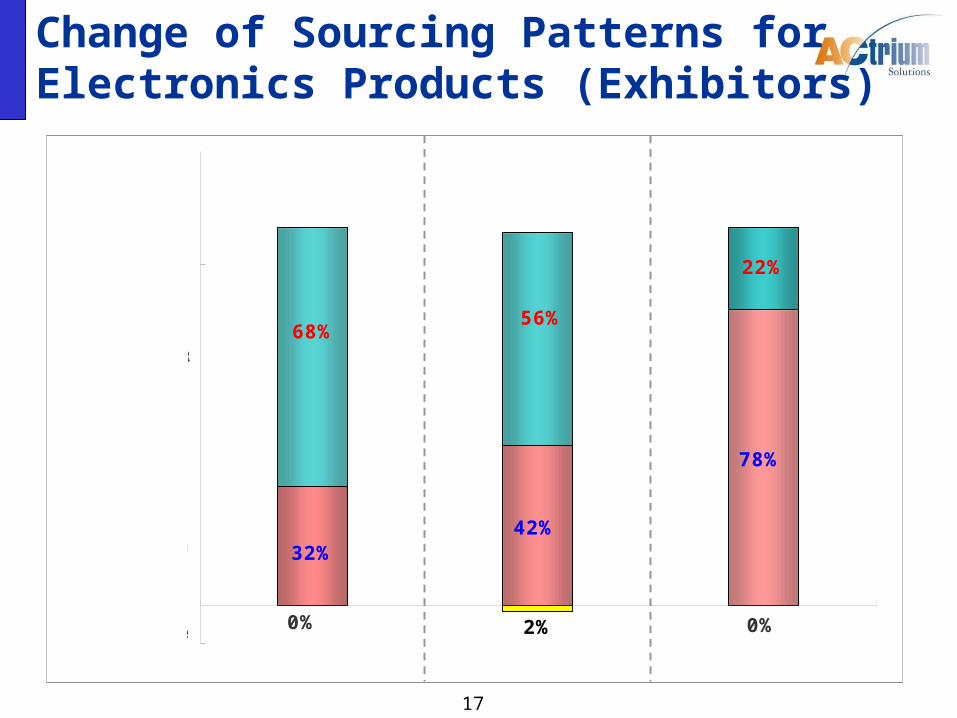
Change of Sourcing Patterns for Electronics Products (Exhibitors)
32%42%
78%
2%0% 0%
56%68%
22%
-10%
90%
Products with moreadvanced technology
(N=73)
Environmentally-friendly products
(N=66)
Silver hair products(N=23)
Increase
Maintain
Decrease
18
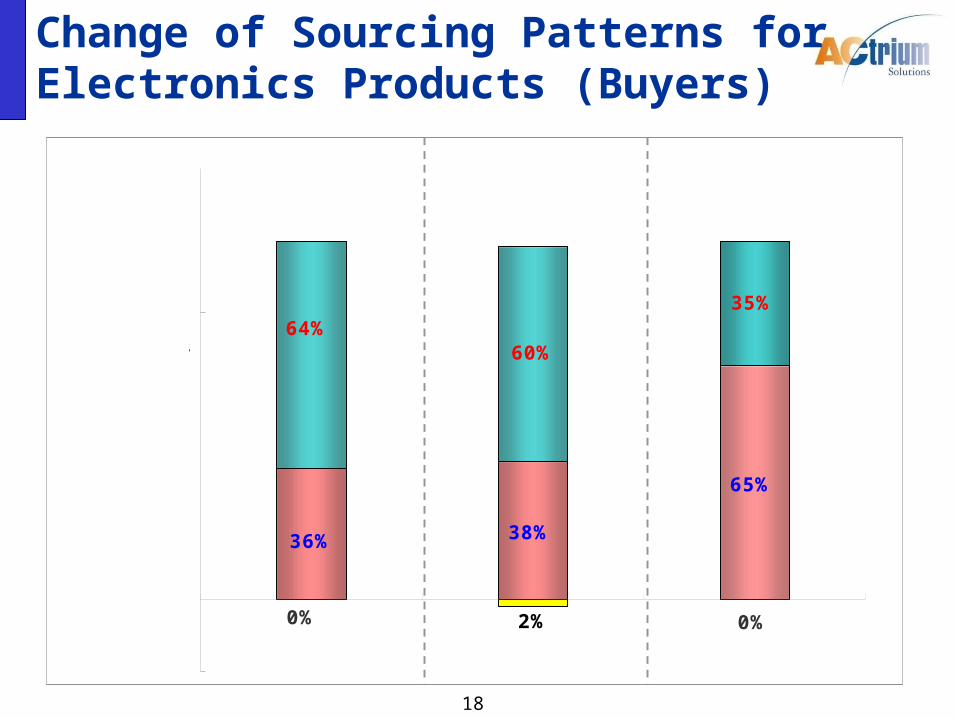
Change of Sourcing Patterns for Electronics Products (Buyers)
36% 38%
65%
2%0% 0%
60%64%
35%
-20%
80%
Products with moreadvanced technology
(N=74)
Environmentally-friendly products
(N=109)
Silver hair products(N=23)
Increase
Maintain
Decrease
19
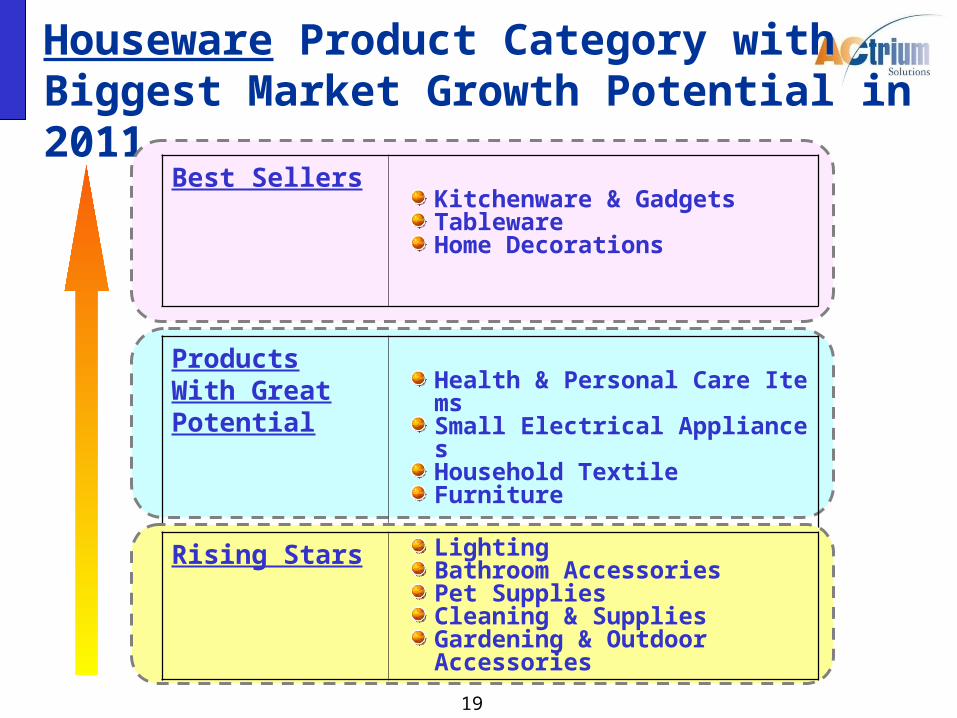
Houseware Product Category with Biggest Market Growth Potential in 2011
Best SellersKitchenware & GadgetsTablewareHome Decorations
Products With Great Potential Health & Personal Care Items
Small Electrical AppliancesHousehold TextileFurniture
Rising Stars LightingBathroom AccessoriesPet SuppliesCleaning & SuppliesGardening & Outdoor Accessories
20
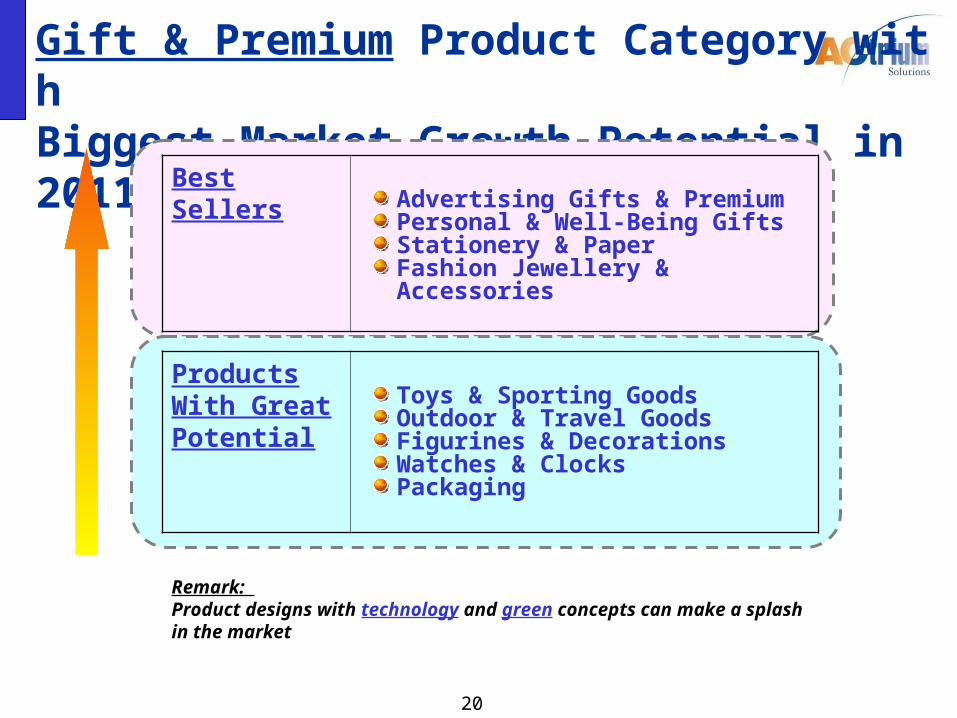
Gift & Premium Product Category with Biggest Market Growth Potential in 2011
Best SellersAdvertising Gifts & PremiumPersonal & Well-Being GiftsStationery & PaperFashion Jewellery & Accessories
Products With Great Potential
Toys & Sporting GoodsOutdoor & Travel GoodsFigurines & DecorationsWatches & ClocksPackaging
Remark: Product designs with technology and green concepts can make a splashin the market

21
Key Findings Exhibitors
Key Findings Exhibitors
Green Manufacturing(Exhibitors Only)
Green Manufacturing(Exhibitors Only)
22
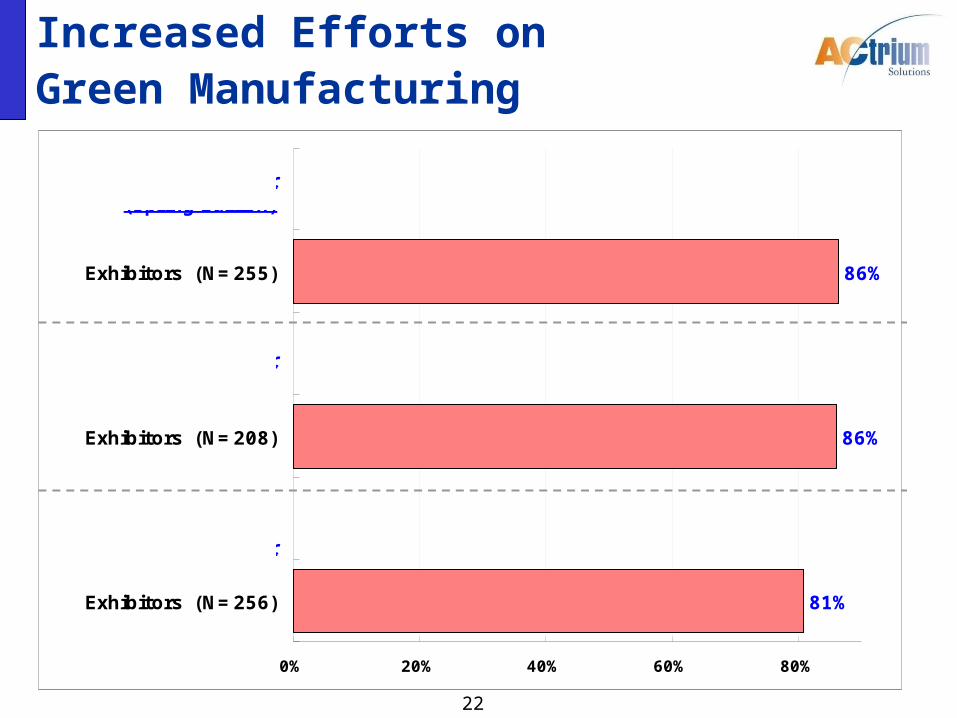
Increased Efforts on Green Manufacturing
81%
86%
86%
0% 20% 40% 60% 80%
Exhibitors (N=256)
Exhibitors (N=208)
Exhibitors (N=255)
Electronics Fair(Spring Edition)
Houseware Fair
Gift & Premium Fair
23
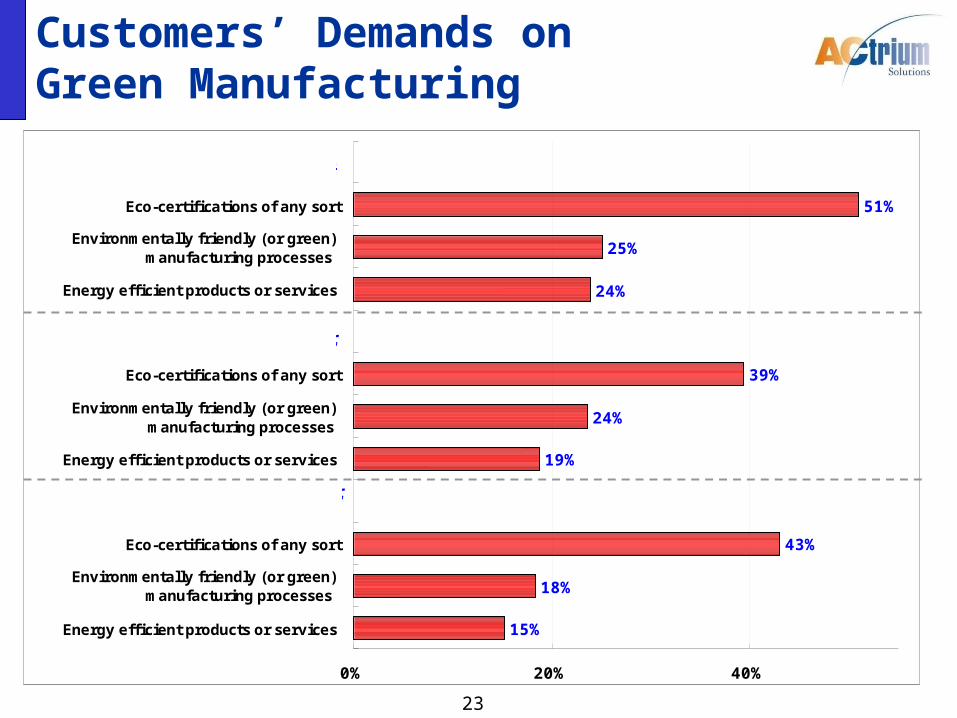
Customers’ Demands on Green Manufacturing
15%
18%
43%
19%
24%
39%
24%
25%
51%
0% 20% 40%
Energy efficient products or services
Environmentally friendly (or green) manufacturing processes
Eco-certifications of any sort
Energy efficient products or services
Environmentally friendly (or green) manufacturing processes
Eco-certifications of any sort
Energy efficient products or services
Environmentally friendly (or green) manufacturing processes
Eco-certifications of any sort
Electronics Fair (Spring Edition)Exhibitors, N=255
Houseware FairExhibitors, N=208
Gift & Premium FairExhibitors, N=256
24
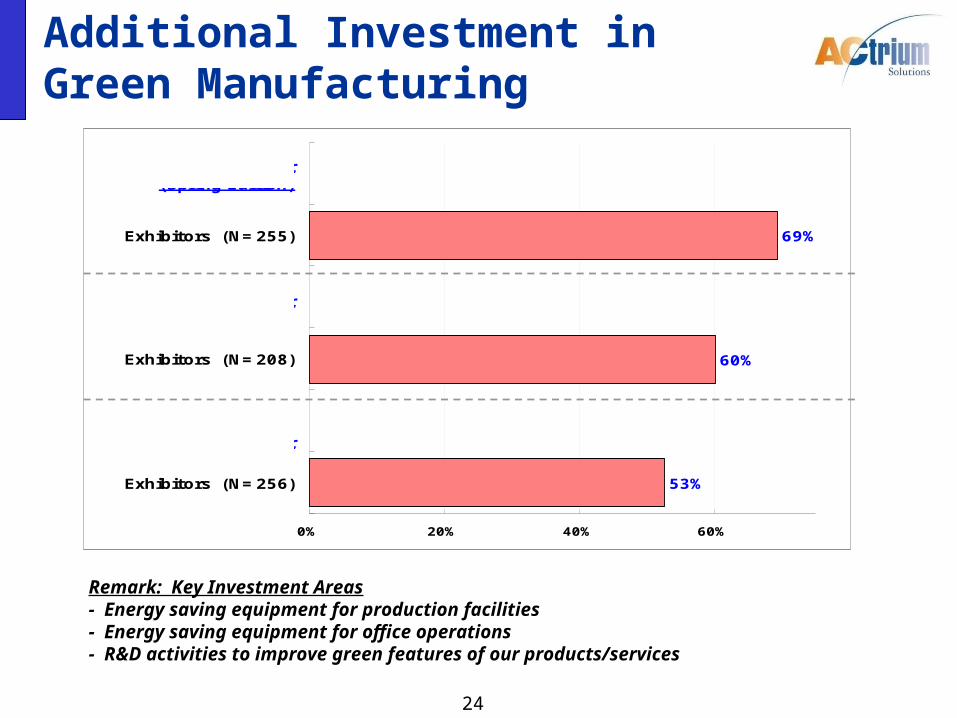
Additional Investment in Green Manufacturing
53%
60%
69%
0% 20% 40% 60%
Exhibitors (N=256)
Exhibitors (N=208)
Exhibitors (N=255)
Electronics Fair(Spring Edition)
Houseware Fair
Gift & Premium Fair
Remark: Key Investment Areas- Energy saving equipment for production facilities- Energy saving equipment for office operations- R&D activities to improve green features of our products/services

25
ConclusionConclusion
26
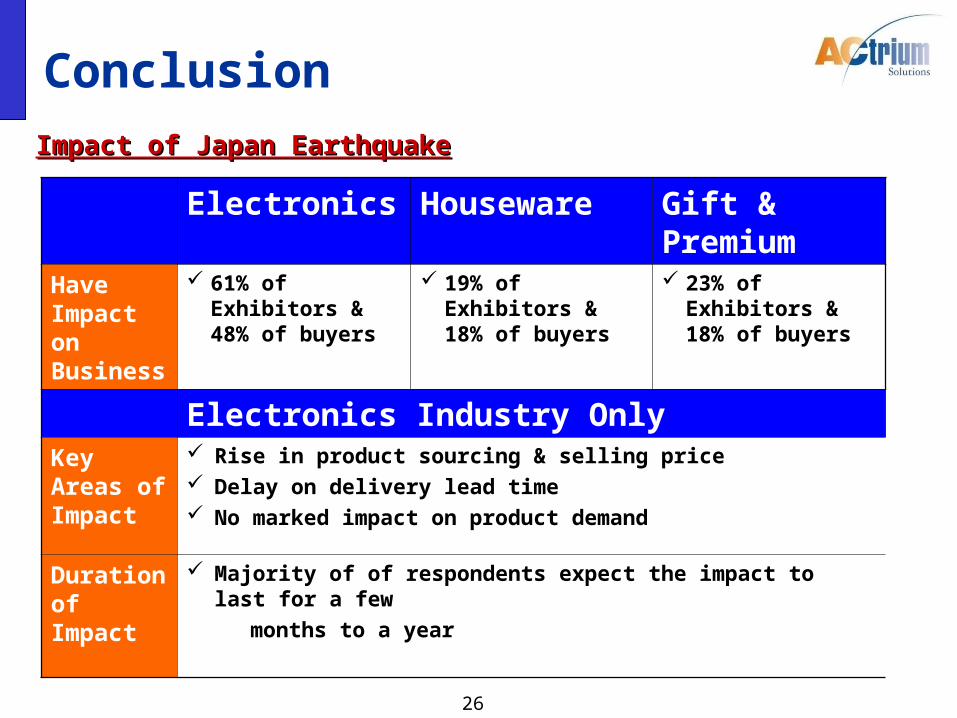
Conclusion
Impact of Japan EarthquakeImpact of Japan Earthquake
Electronics Houseware Gift & Premium
Have Impact on Business
61% of Exhibitors & 48% of buyers
19% of Exhibitors & 18% of buyers
23% of Exhibitors & 18% of buyers
Electronics Industry OnlyKey Areas of Impact
Rise in product sourcing & selling price Delay on delivery lead time No marked impact on product demand
Duration of Impact
Majority of of respondents expect the impact to last for a few
months to a year
27
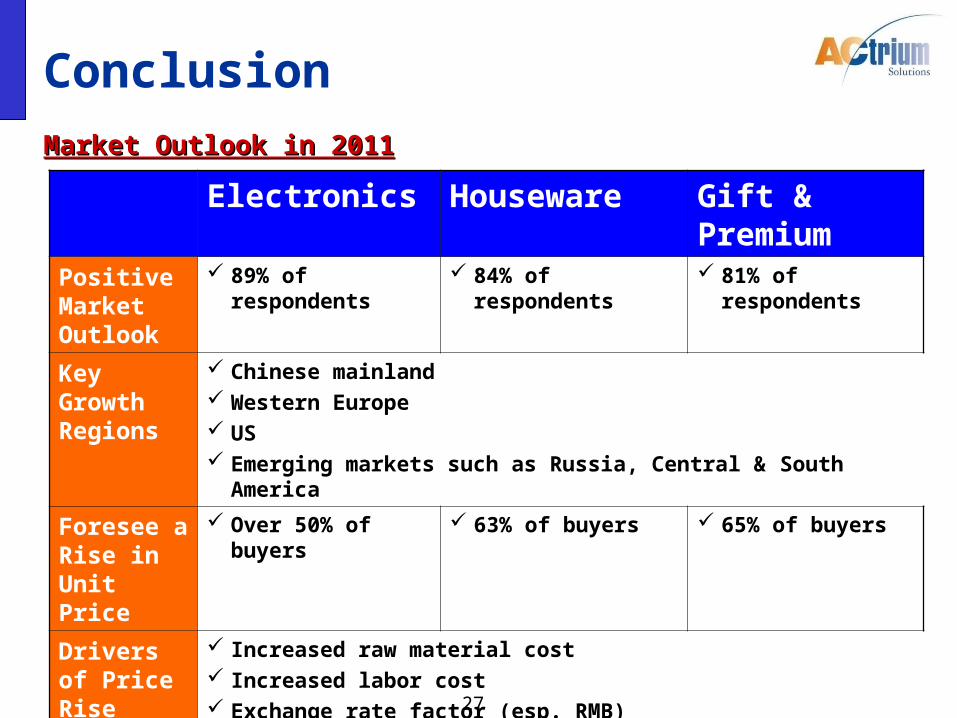
Conclusion
Market Outlook in 2011Market Outlook in 2011
Electronics Houseware Gift & Premium
Positive Market Outlook
89% of respondents
84% of respondents
81% of respondents
Key Growth Regions
Chinese mainland Western Europe US Emerging markets such as Russia, Central & South America
Foresee a Rise in Unit Price
Over 50% of buyers 63% of buyers 65% of buyers
Drivers of Price Rise
Increased raw material cost Increased labor cost Exchange rate factor (esp. RMB)
28
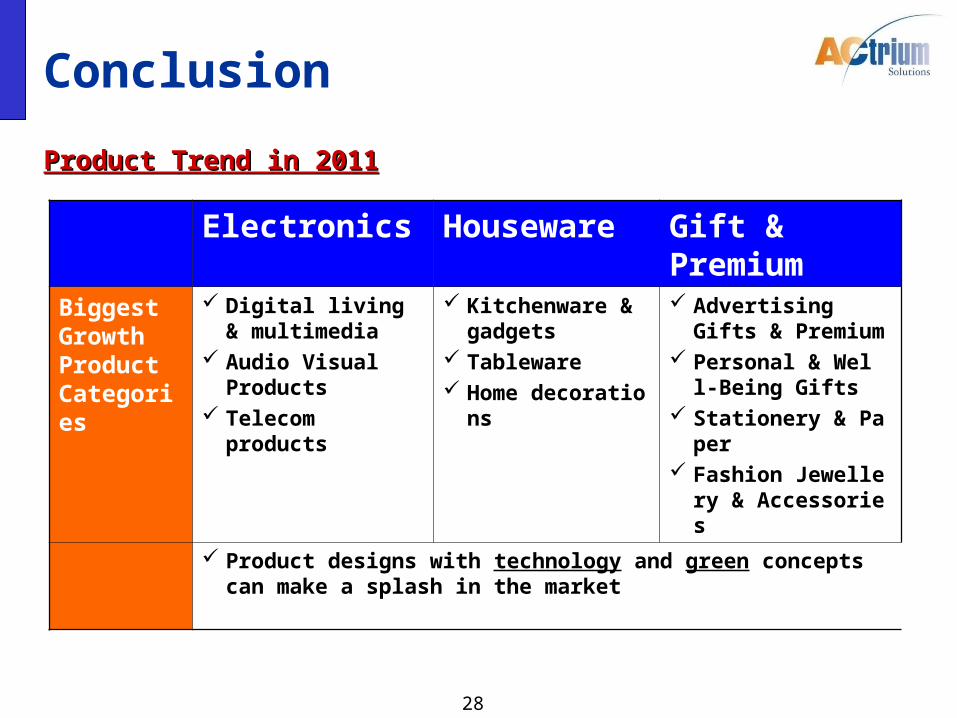
Conclusion
Product Trend in 2011Product Trend in 2011
Electronics Houseware Gift & Premium
Biggest Growth Product Categories
Digital living & multimedia
Audio Visual Products
Telecom products
Kitchenware & gadgets
Tableware Home decoration
s
Advertising Gifts & Premium
Personal & Well-Being Gifts
Stationery & Paper Fashion Jewellery
& Accessories
Product designs with technology and green concepts can make a splash in the market
29
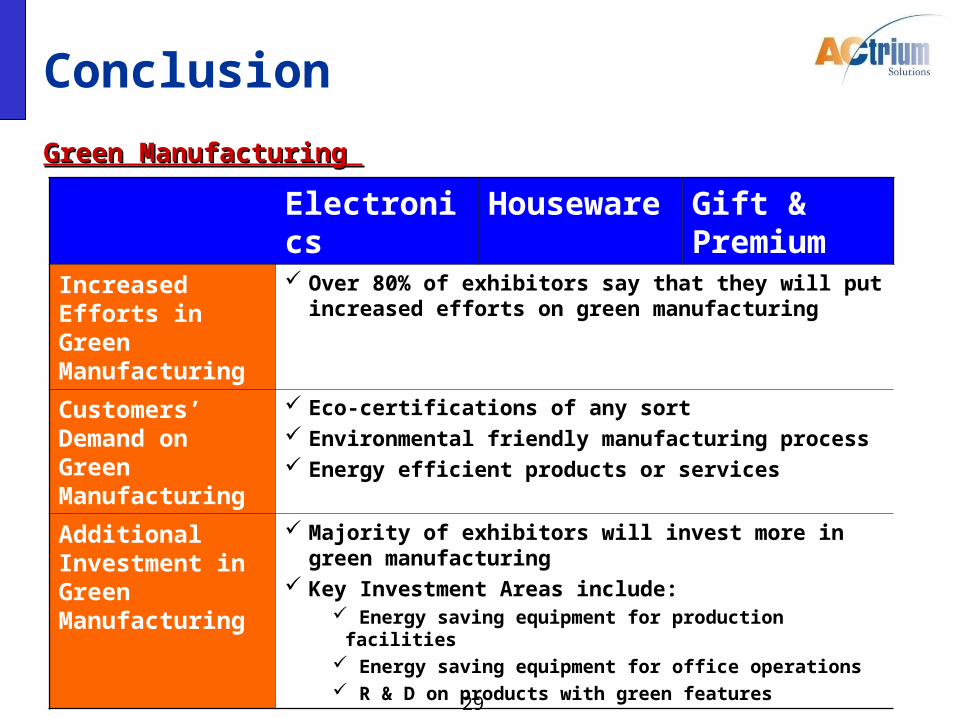
Conclusion
Green Manufacturing Green Manufacturing
Electronics Houseware Gift & Premium
Increased Efforts in Green Manufacturing
Over 80% of exhibitors say that they will put increased efforts on green manufacturing
Customers’ Demand on Green Manufacturing
Eco-certifications of any sort Environmental friendly manufacturing process Energy efficient products or services
Additional Investment in Green Manufacturing
Majority of exhibitors will invest more in green manufacturing
Key Investment Areas include: Energy saving equipment for production facilities Energy saving equipment for office operations R & D on products with green features

30
Key Findings Exhibitors
Key Findings Exhibitors
End Thank You
End Thank You