Hitachi Construction Machinery Co., Ltd. · Hitachi Construction Machinery Co., Ltd. ... its...
39
Hitachi Construction Machinery Co., Ltd. Financial Results for the Year Ended March 31, 2017
Transcript of Hitachi Construction Machinery Co., Ltd. · Hitachi Construction Machinery Co., Ltd. ... its...
Hitachi Construction Machinery Co., Ltd.
Financial Results for the Year Ended
March 31, 2017
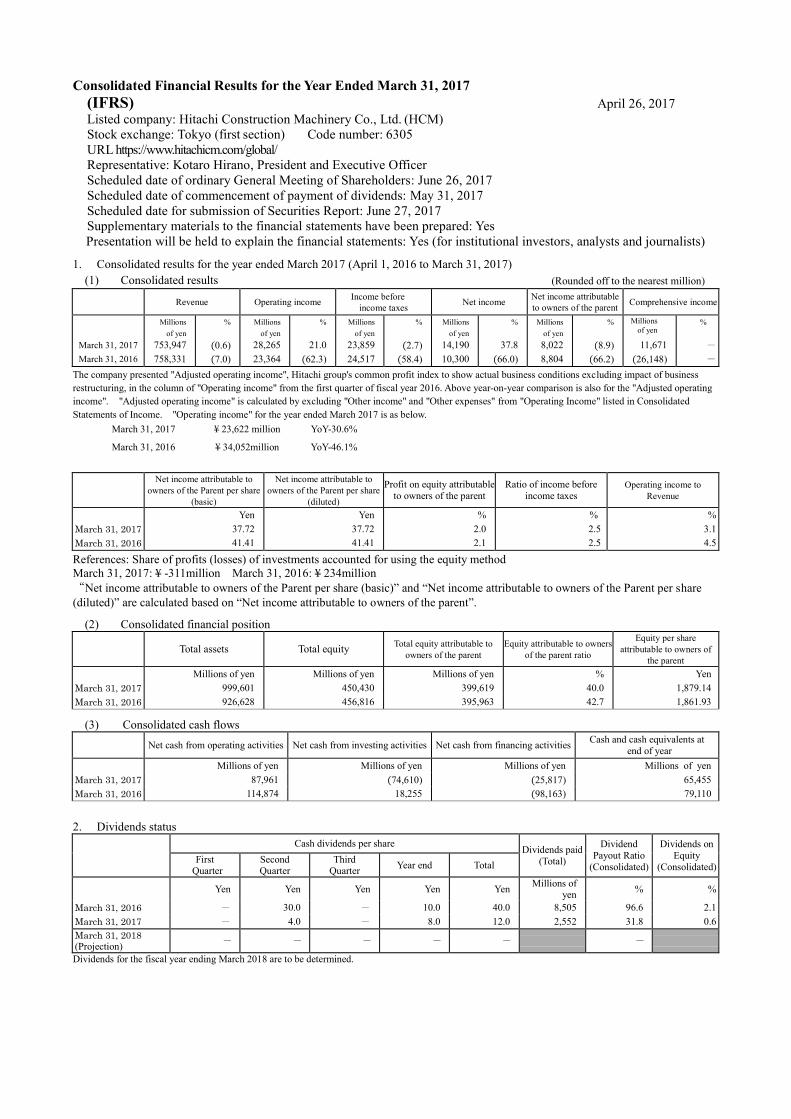
Consolidated Financial Results for the Year Ended March 31, 2017 (IFRS) April 26, 2017
Listed company: Hitachi Construction Machinery Co., Ltd. (HCM)
Stock exchange: Tokyo (first section) Code number: 6305
URL https://www.hitachicm.com/global/
Representative: Kotaro Hirano, President and Executive Officer
Scheduled date of ordinary General Meeting of Shareholders: June 26, 2017
Scheduled date of commencement of payment of dividends: May 31, 2017
Scheduled date for submission of Securities Report: June 27, 2017
Supplementary materials to the financial statements have been prepared: Yes
Presentation will be held to explain the financial statements: Yes (for institutional investors, analysts and journalists) 1. Consolidated results for the year ended March 2017 (April 1, 2016 to March 31, 2017)
(1) Consolidated results (Rounded off to the nearest million)
Revenue Operating income Income before
income taxes Net income Net income attributable
to owners of the parent Comprehensive income
Millions
of yen % Millions
of yen % Millions
of yen % Millions
of yen % Millions
of yen % Millions
of yen %
March 31, 2017 753,947 (0.6) 28,265 21.0 23,859 (2.7) 14,190 37.8 8,022 (8.9) 11,671 -
March 31, 2016 758,331 (7.0) 23,364 (62.3) 24,517 (58.4) 10,300 (66.0) 8,804 (66.2) (26,148) -
The company presented "Adjusted operating income", Hitachi group's common profit index to show actual business conditions excluding impact of business
restructuring, in the column of "Operating income" from the first quarter of fiscal year 2016. Above year-on-year comparison is also for the "Adjusted operating
income". "Adjusted operating income" is calculated by excluding "Other income" and "Other expenses" from "Operating Income" listed in Consolidated
Statements of Income. "Operating income" for the year ended March 2017 is as below.
March 31, 2017 ¥ 23,622 million YoY-30.6%
March 31, 2016 ¥ 34,052million YoY-46.1%
Net income attributable to
owners of the Parent per share
(basic)
Net income attributable to
owners of the Parent per share
(diluted)
Profit on equity attributable
to owners of the parent Ratio of income before
income taxes Operating income to
Revenue
Yen Yen % % % March 31, 2017 37.72 37.72 2.0 2.5 3.1
March 31, 2016 41.41 41.41 2.1 2.5 4.5 References: Share of profits (losses) of investments accounted for using the equity method
March 31, 2017: ¥ -311million March 31, 2016: ¥ 234million
“Net income attributable to owners of the Parent per share (basic)” and “Net income attributable to owners of the Parent per share
(diluted)” are calculated based on “Net income attributable to owners of the parent”.
(2) Consolidated financial position
Total assets Total equity Total equity attributable to
owners of the parent Equity attributable to owners
of the parent ratio
Equity per share
attributable to owners of
the parent Millions of yen Millions of yen Millions of yen % Yen March 31, 2017 999,601 450,430 399,619 40.0 1,879.14
March 31, 2016 926,628 456,816 395,963 42.7 1,861.93
(3) Consolidated cash flows
Net cash from operating activities Net cash from investing activities Net cash from financing activities Cash and cash equivalents at
end of year Millions of yen Millions of yen Millions of yen Millions of yen March 31, 2017 87,961 (74,610) (25,817) 65,455
March 31, 2016 114,874 18,255 (98,163) 79,110
2. Dividends status
Cash dividends per share Dividends paid
(Total)
Dividend
Payout Ratio
(Consolidated)
Dividends on
Equity
(Consolidated) First
Quarter Second Quarter
Third Quarter Year end Total
Yen Yen Yen Yen Yen Millions of yen % %
March 31, 2016 - 30.0 - 10.0 40.0 8,505 96.6 2.1
March 31, 2017 - 4.0 - 8.0 12.0 2,552 31.8 0.6
March 31, 2018 (Projection)
- - - - - -
Dividends for the fiscal year ending March 2018 are to be determined.
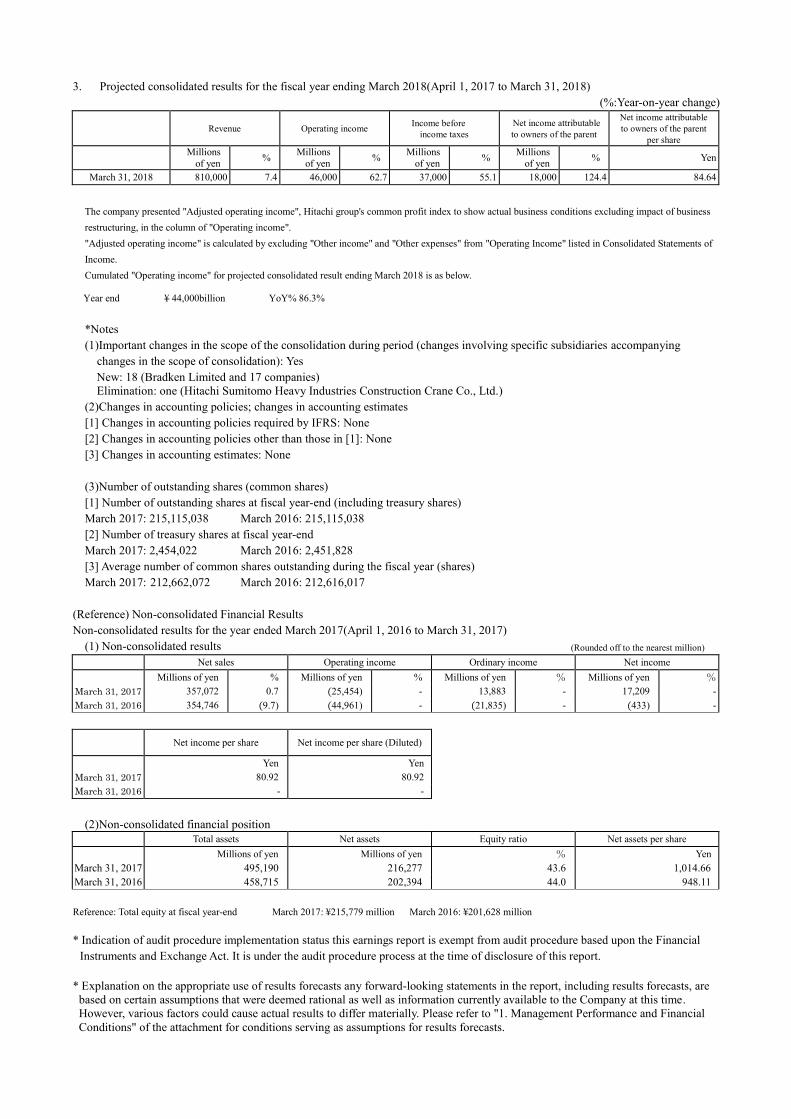
3. Projected consolidated results for the fiscal year ending March 2018(April 1, 2017 to March 31, 2018)
(%:Year-on-year change)
Revenue Operating income Income before
income taxes Net income attributable
to owners of the parent
Net income attributable
to owners of the parent
per share
Millions
of yen % Millions
of yen % Millions
of yen % Millions
of yen % Yen
March 31, 2018 810,000 7.4 46,000 62.7 37,000 55.1 18,000 124.4 84.64
The company presented "Adjusted operating income", Hitachi group's common profit index to show actual business conditions excluding impact of business
restructuring, in the column of "Operating income".
"Adjusted operating income" is calculated by excluding "Other income" and "Other expenses" from "Operating Income" listed in Consolidated Statements of
Income.
Cumulated "Operating income" for projected consolidated result ending March 2018 is as below.
Year end ¥ 44,000billion YoY% 86.3%
*Notes
(1)Important changes in the scope of the consolidation during period (changes involving specific subsidiaries accompanying
changes in the scope of consolidation): Yes
New: 18 (Bradken Limited and 17 companies)
Elimination: one (Hitachi Sumitomo Heavy Industries Construction Crane Co., Ltd.) (2)Changes in accounting policies; changes in accounting estimates
[1] Changes in accounting policies required by IFRS: None
[2] Changes in accounting policies other than those in [1]: None
[3] Changes in accounting estimates: None
(3)Number of outstanding shares (common shares)
[1] Number of outstanding shares at fiscal year-end (including treasury shares)
March 2017: 215,115,038 March 2016: 215,115,038
[2] Number of treasury shares at fiscal year-end
March 2017: 2,454,022 March 2016: 2,451,828
[3] Average number of common shares outstanding during the fiscal year (shares)
March 2017: 212,662,072 March 2016: 212,616,017
(Reference) Non-consolidated Financial Results
Non-consolidated results for the year ended March 2017(April 1, 2016 to March 31, 2017)
(1) Non-consolidated results (Rounded off to the nearest million) Net sales Operating income Ordinary income Net income Millions of yen % Millions of yen % Millions of yen % Millions of yen % March 31, 2017 357,072 0.7 (25,454) - 13,883 - 17,209 -
March 31, 2016 354,746 (9.7) (44,961) - (21,835) - (433) -
Net income per share Net income per share (Diluted)
Yen Yen March 31, 2017 80.92 80.92
March 31, 2016 - -
(2)Non-consolidated financial position Total assets Net assets Equity ratio Net assets per share Millions of yen Millions of yen % Yen March 31, 2017 495,190 216,277 43.6 1,014.66
March 31, 2016 458,715 202,394 44.0 948.11
Reference: Total equity at fiscal year-end March 2017: ¥215,779 million March 2016: ¥201,628 million
* Indication of audit procedure implementation status this earnings report is exempt from audit procedure based upon the Financial
Instruments and Exchange Act. It is under the audit procedure process at the time of disclosure of this report. * Explanation on the appropriate use of results forecasts any forward-looking statements in the report, including results forecasts, are
based on certain assumptions that were deemed rational as well as information currently available to the Company at this time.
However, various factors could cause actual results to differ materially. Please refer to "1. Management Performance and Financial
Conditions" of the attachment for conditions serving as assumptions for results forecasts.
(English translation of “KESSAN TANSHIN” originally issued in Japanese language.)
1
Index of the Attachment
1. Management Performance and Financial Conditions ……………………..……..………… 2
(1) Management Results ………………………………………………………...………………… 2
(2) Analysis of Financial Condition ……………………..………………………......…………….. 5
(3) Outlook for the Fiscal Year Ending March 31, 2018……….…........................................…..… 8
(4) Business Risks ………………………….…………………………………………...…………. 9
1
2. Our Fundamental Position Concerning Selection of Accounting Standards Policy ..……… 11
3 Consolidated Financial Statements …..…………………………………………………….. 12
(1) Consolidated Balance Sheets ………...…………………………………………………........... 12
(2) Consolidated Statements of Income…....……………………………………………………… 13
(3) Consolidated Statements of Comprehensive Income…………...……………………………… 14
(4) Consolidated Statements of Changes in Equity…………………....…………………………… 15
(5) Consolidated Statements of Cash Flows …………………………...………………………….. 17
(6) Notes on consolidated financial statements ………………………...………………………….. 18
Notes on the Preconditions for a Going Concern ………………...………………………….. 18
Important matters for compiling consolidated financial statements ………………………… 18
Segment Information ………...…………………...………………………………………… 20
Note on consolidated statements of income………....……………………………………… 23
Business Combination ………………………………..…………………………………. 24
Earnings per share ………………………………………………………………………….. 34
Important Subsequent Events …………………………………………………………….. 35
4. Others …………………………………………………………………………………………….
Changes in the Members of the Board of Directors …………………………………. 36
(English translation of “KESSAN TANSHIN” originally issued in Japanese language.) 2
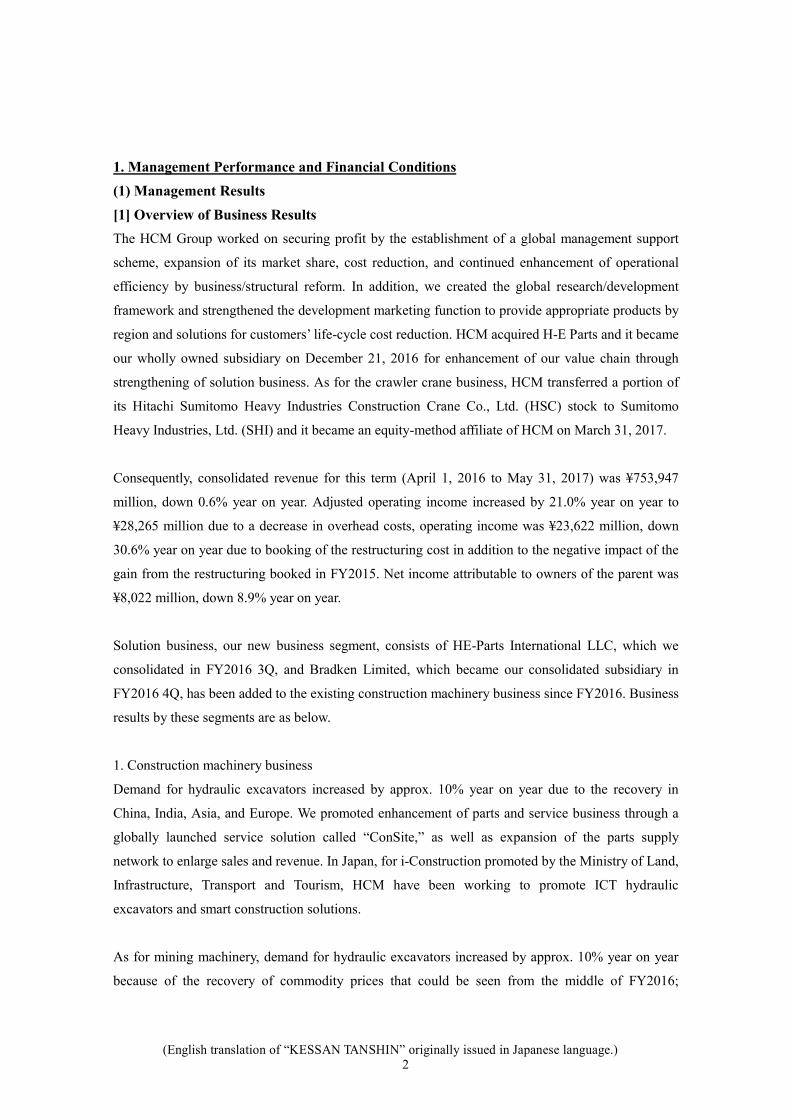
1. Management Performance and Financial Conditions
(1) Management Results
[1] Overview of Business Results
The HCM Group worked on securing profit by the establishment of a global management support
scheme, expansion of its market share, cost reduction, and continued enhancement of operational
efficiency by business/structural reform. In addition, we created the global research/development
framework and strengthened the development marketing function to provide appropriate products by
region and solutions for customers’ life-cycle cost reduction. HCM acquired H-E Parts and it became
our wholly owned subsidiary on December 21, 2016 for enhancement of our value chain through
strengthening of solution business. As for the crawler crane business, HCM transferred a portion of
its Hitachi Sumitomo Heavy Industries Construction Crane Co., Ltd. (HSC) stock to Sumitomo
Heavy Industries, Ltd. (SHI) and it became an equity-method affiliate of HCM on March 31, 2017.
Consequently, consolidated revenue for this term (April 1, 2016 to May 31, 2017) was ¥753,947
million, down 0.6% year on year. Adjusted operating income increased by 21.0% year on year to
¥28,265 million due to a decrease in overhead costs, operating income was ¥23,622 million, down
30.6% year on year due to booking of the restructuring cost in addition to the negative impact of the
gain from the restructuring booked in FY2015. Net income attributable to owners of the parent was
¥8,022 million, down 8.9% year on year.
Solution business, our new business segment, consists of HE-Parts International LLC, which we
consolidated in FY2016 3Q, and Bradken Limited, which became our consolidated subsidiary in
FY2016 4Q, has been added to the existing construction machinery business since FY2016. Business
results by these segments are as below.
1. Construction machinery business
Demand for hydraulic excavators increased by approx. 10% year on year due to the recovery in
China, India, Asia, and Europe. We promoted enhancement of parts and service business through a
globally launched service solution called “ConSite,” as well as expansion of the parts supply
network to enlarge sales and revenue. In Japan, for i-Construction promoted by the Ministry of Land,
Infrastructure, Transport and Tourism, HCM have been working to promote ICT hydraulic
excavators and smart construction solutions.
As for mining machinery, demand for hydraulic excavators increased by approx. 10% year on year
because of the recovery of commodity prices that could be seen from the middle of FY2016;
(English translation of “KESSAN TANSHIN” originally issued in Japanese language.) 3
however, demand for rigid dump trucks decreased by approx. 20% year on year. The decrease in
ultra-large machines was significant for both hydraulic excavators and rigid dump trucks. We are
focusing on expanding sales of the well-accepted AC-3 series rigid dump trucks especially the one
for trolley use or high-altitude use equipped with an advanced vehicle body stability-assist function,
in addition to offering a fleet management system and development of an autonomous haulage
system to optimize mine operation, by bringing Hitachi Group’s strengths. Furthermore, we have
been working on establishment of a highly controlled customer support system to enlarge revenue
from parts and service.
2. Solution business
This segment consists of H-E Parts and Bradken. H-E Parts provides service and solution required
for machinery or equipment for mining, crushing, and construction mainly in Australia and the US.
Bradken conducts various businesses concerning our value chain such as specialty castings for the
industrial and energy industries, and wear parts for mining fixed plants and mining mobile plants,
and it also provides maintenance and service for them.
Consolidated revenue for this term (April 1, 2016 to March 31, 2017) was ¥6,691 million, and
adjusted operating income was ¥452 million because of consolidation of H-E Parts.
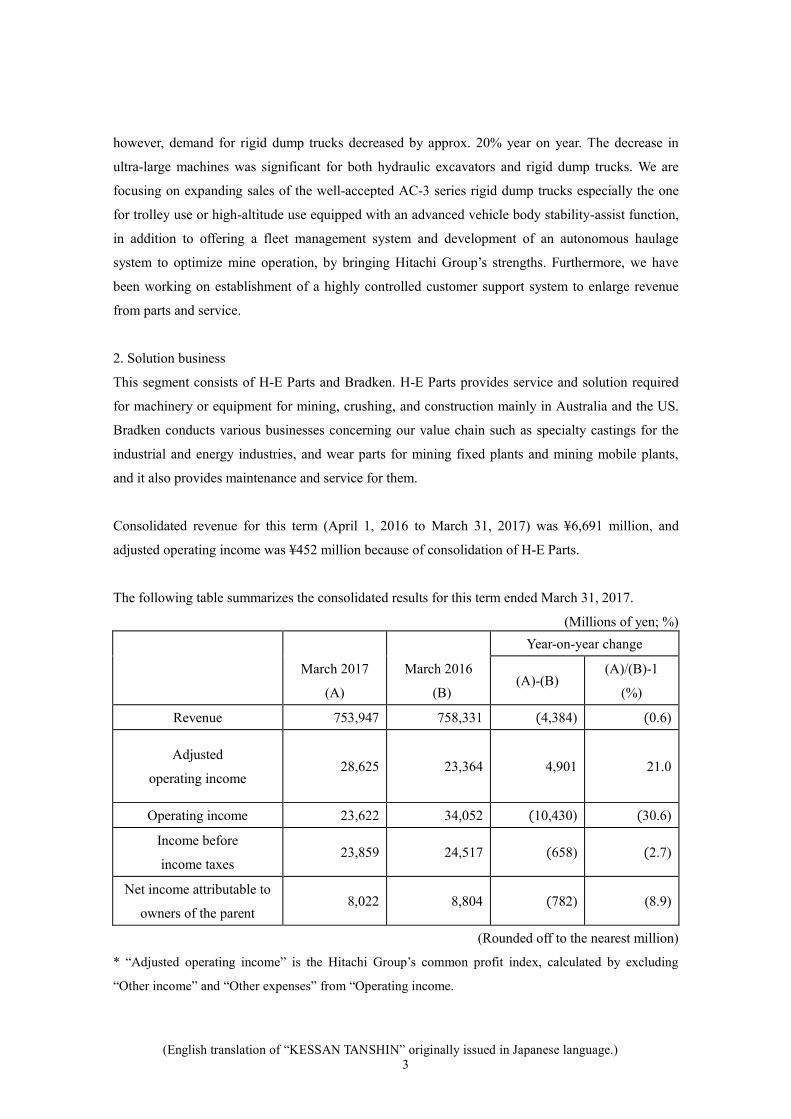
The following table summarizes the consolidated results for this term ended March 31, 2017.
(Millions of yen; %)
Year-on-year change
March 2017
(A)
March 2016
(B) (A)-(B)
(A)/(B)-1
(%)
Revenue 753,947 758,331 (4,384) (0.6)
Adjusted
operating income
28,625
23,364
4,901
21.0
Operating income 23,622 34,052 (10,430) (30.6)
Income before
income taxes 23,859 24,517 (658) (2.7)
Net income attributable to
owners of the parent 8,022 8,804 (782) (8.9)
(Rounded off to the nearest million)
* “Adjusted operating income” is the Hitachi Group’s common profit index, calculated by excluding
“Other income” and “Other expenses” from “Operating income.
(English translation of “KESSAN TANSHIN” originally issued in Japanese language.) 4
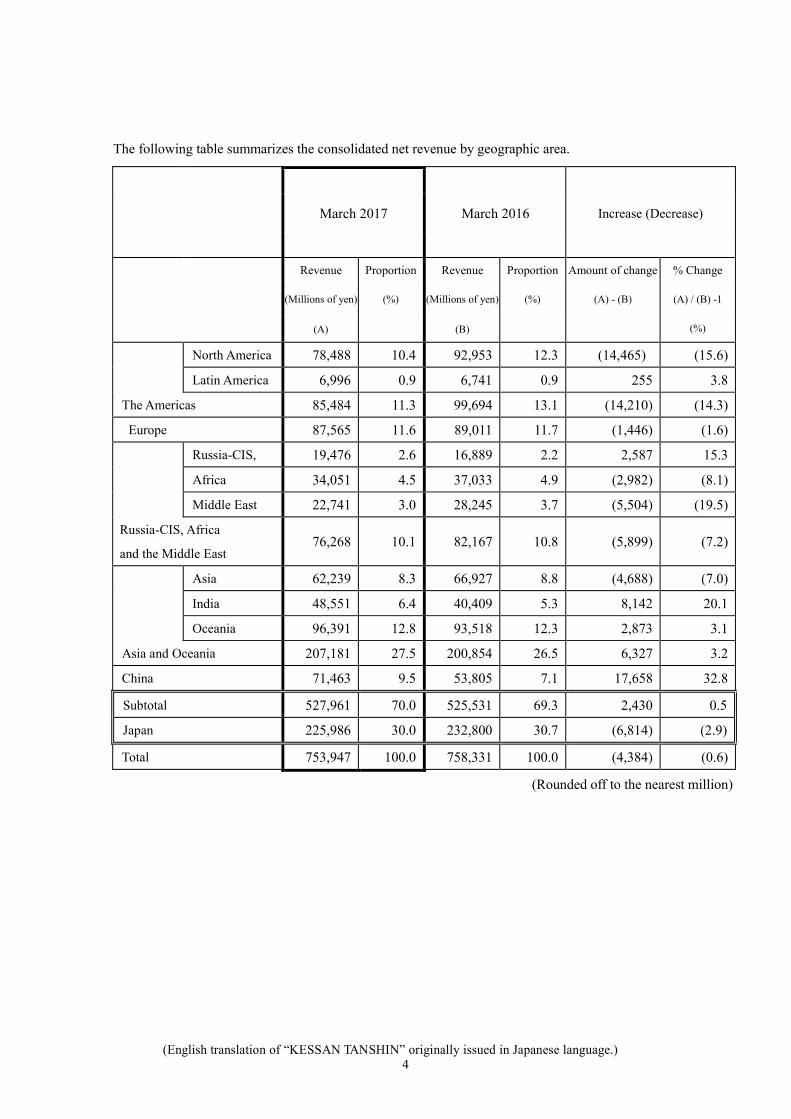
The following table summarizes the consolidated net revenue by geographic area.
Increase (Decrease) March 2017 March 2016
Revenue Proportion Revenue Proportion Amount of change % Change
(Millions of yen) (%) (Millions of yen) (%) (A) - (B) (A) / (B) -1
(A) (B) (%)
North America 78,488 10.4 92,953 12.3 (14,465) (15.6)
Latin America 6,996 0.9 6,741 0.9 255 3.8
The Americas 85,484 11.3 99,694 13.1 (14,210) (14.3)
Europe 87,565 11.6 89,011 11.7 (1,446) (1.6)
Russia-CIS, 19,476 2.6 16,889 2.2 2,587 15.3
Africa 34,051 4.5 37,033 4.9 (2,982) (8.1)
Middle East 22,741 3.0 28,245 3.7 (5,504) (19.5)
Russia-CIS, Africa
and the Middle East 76,268 10.1 82,167 10.8 (5,899) (7.2)
Asia 62,239 8.3 66,927 8.8 (4,688) (7.0)
India 48,551 6.4 40,409 5.3 8,142 20.1
Oceania 96,391 12.8 93,518 12.3 2,873 3.1
Asia and Oceania 207,181 27.5 200,854 26.5 6,327 3.2
China 71,463 9.5 53,805 7.1 17,658 32.8
Subtotal 527,961 70.0 525,531 69.3 2,430 0.5
Japan 225,986 30.0 232,800 30.7 (6,814) (2.9)
Total 753,947 100.0 758,331 100.0 (4,384) (0.6)
(Rounded off to the nearest million)
(English translation of “KESSAN TANSHIN” originally issued in Japanese language.) 5
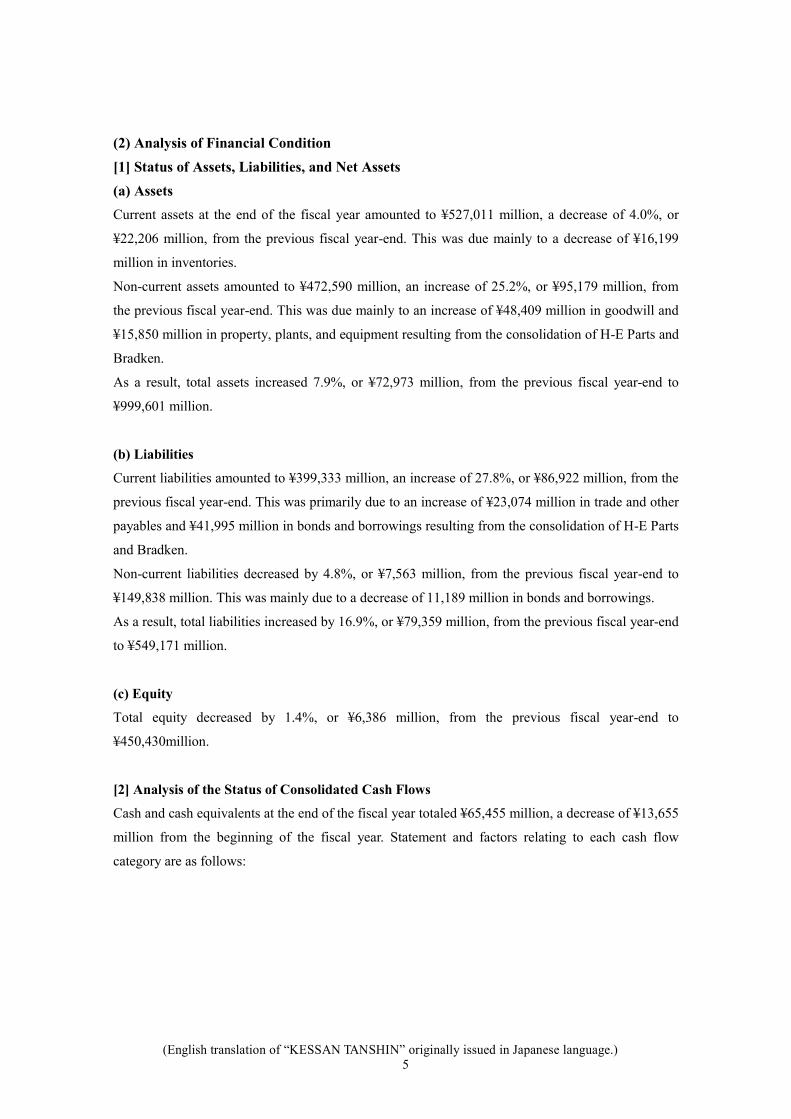
(2) Analysis of Financial Condition
[1] Status of Assets, Liabilities, and Net Assets
(a) Assets
Current assets at the end of the fiscal year amounted to ¥527,011 million, a decrease of 4.0%, or
¥22,206 million, from the previous fiscal year-end. This was due mainly to a decrease of ¥16,199
million in inventories.
Non-current assets amounted to ¥472,590 million, an increase of 25.2%, or ¥95,179 million, from
the previous fiscal year-end. This was due mainly to an increase of ¥48,409 million in goodwill and
¥15,850 million in property, plants, and equipment resulting from the consolidation of H-E Parts and
Bradken.
As a result, total assets increased 7.9%, or ¥72,973 million, from the previous fiscal year-end to
¥999,601 million.
(b) Liabilities
Current liabilities amounted to ¥399,333 million, an increase of 27.8%, or ¥86,922 million, from the
previous fiscal year-end. This was primarily due to an increase of ¥23,074 million in trade and other
payables and ¥41,995 million in bonds and borrowings resulting from the consolidation of H-E Parts
and Bradken.
Non-current liabilities decreased by 4.8%, or ¥7,563 million, from the previous fiscal year-end to
¥149,838 million. This was mainly due to a decrease of 11,189 million in bonds and borrowings.
As a result, total liabilities increased by 16.9%, or ¥79,359 million, from the previous fiscal year-end
to ¥549,171 million.
(c) Equity
Total equity decreased by 1.4%, or ¥6,386 million, from the previous fiscal year-end to
¥450,430million.
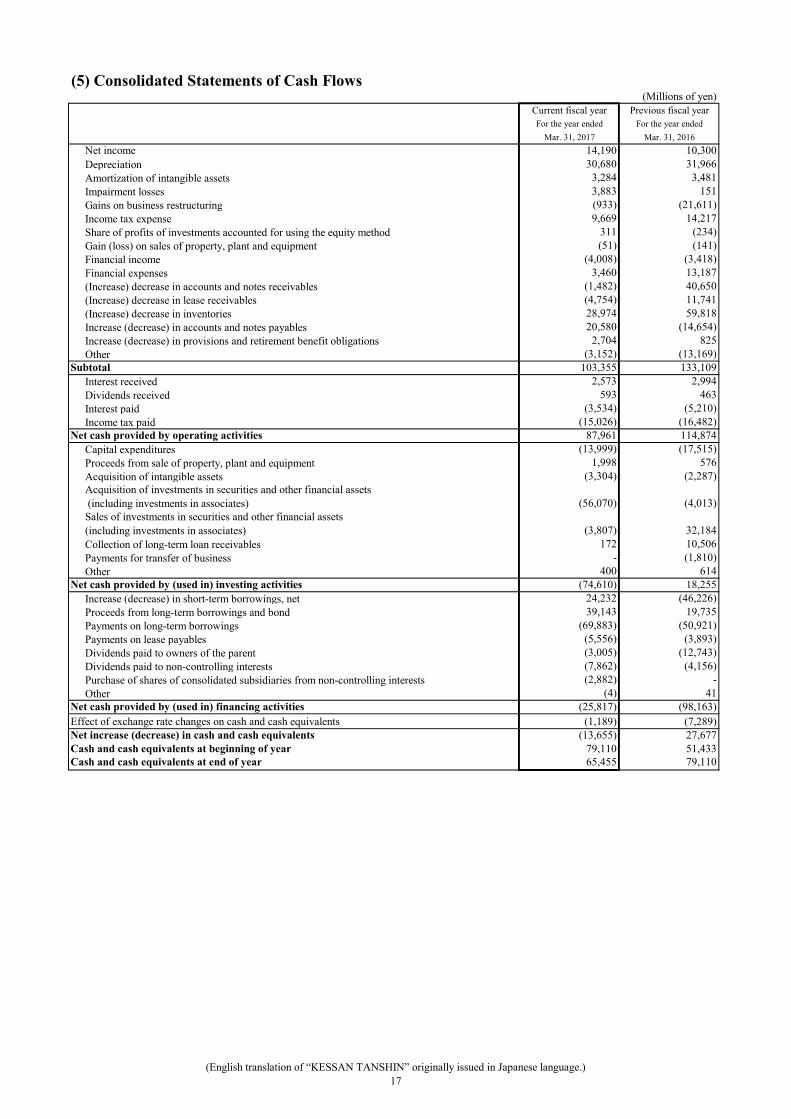
[2] Analysis of the Status of Consolidated Cash Flows
Cash and cash equivalents at the end of the fiscal year totaled ¥65,455 million, a decrease of ¥13,655
million from the beginning of the fiscal year. Statement and factors relating to each cash flow
category are as follows:
(English translation of “KESSAN TANSHIN” originally issued in Japanese language.) 6
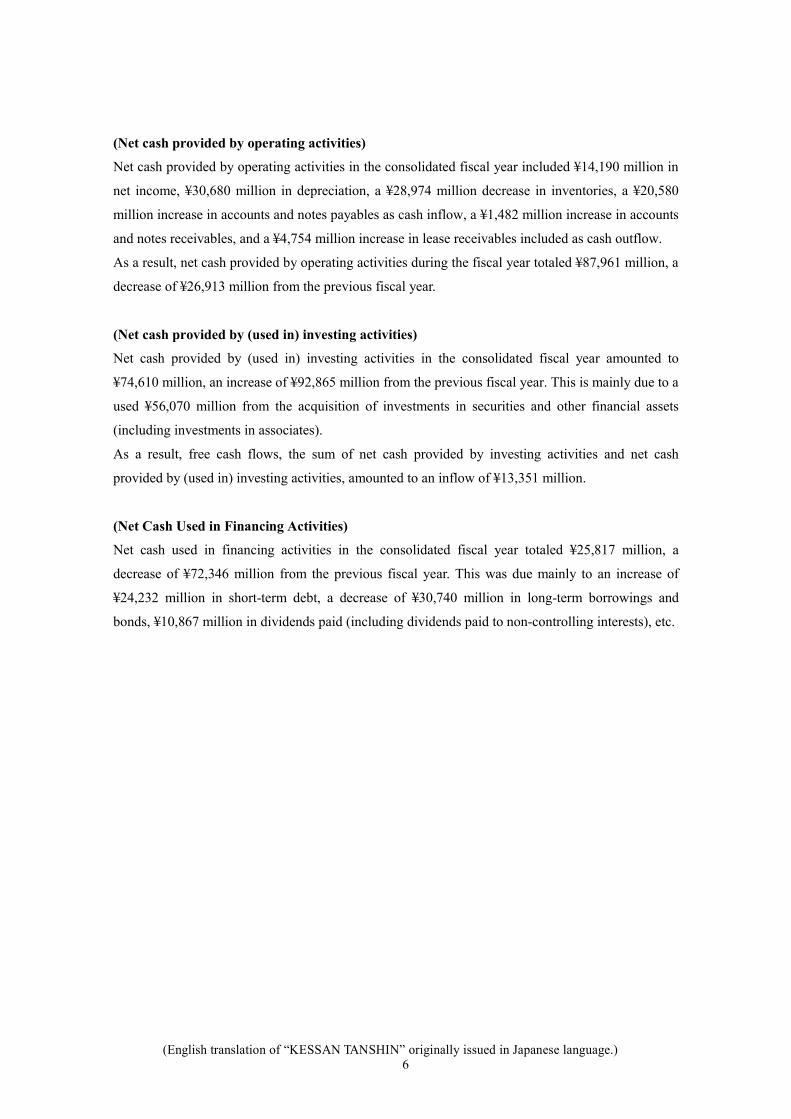
(Net cash provided by operating activities)
Net cash provided by operating activities in the consolidated fiscal year included ¥14,190 million in
net income, ¥30,680 million in depreciation, a ¥28,974 million decrease in inventories, a ¥20,580
million increase in accounts and notes payables as cash inflow, a ¥1,482 million increase in accounts
and notes receivables, and a ¥4,754 million increase in lease receivables included as cash outflow.
As a result, net cash provided by operating activities during the fiscal year totaled ¥87,961 million, a
decrease of ¥26,913 million from the previous fiscal year.
(Net cash provided by (used in) investing activities)
Net cash provided by (used in) investing activities in the consolidated fiscal year amounted to
¥74,610 million, an increase of ¥92,865 million from the previous fiscal year. This is mainly due to a
used ¥56,070 million from the acquisition of investments in securities and other financial assets
(including investments in associates).
As a result, free cash flows, the sum of net cash provided by investing activities and net cash
provided by (used in) investing activities, amounted to an inflow of ¥13,351 million.
(Net Cash Used in Financing Activities)
Net cash used in financing activities in the consolidated fiscal year totaled ¥25,817 million, a
decrease of ¥72,346 million from the previous fiscal year. This was due mainly to an increase of
¥24,232 million in short-term debt, a decrease of ¥30,740 million in long-term borrowings and
bonds, ¥10,867 million in dividends paid (including dividends paid to non-controlling interests), etc.
(English translation of “KESSAN TANSHIN” originally issued in Japanese language.) 7
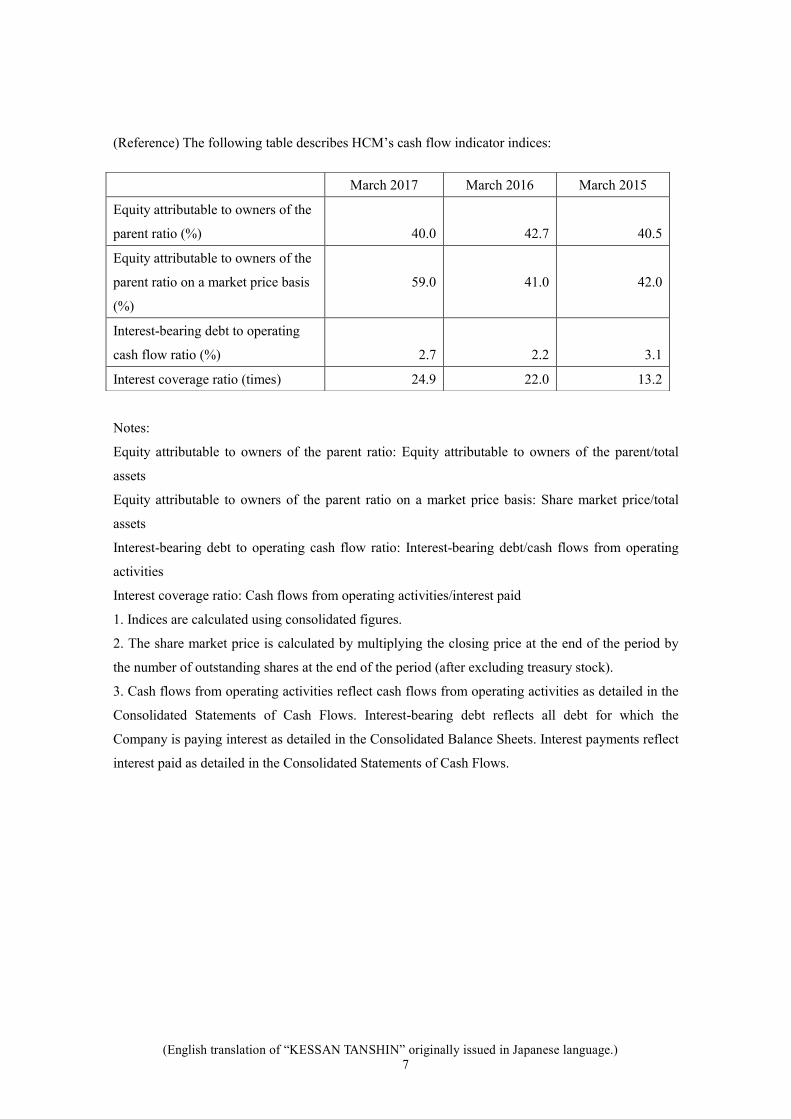
(Reference) The following table describes HCM’s cash flow indicator indices:
Notes:
Equity attributable to owners of the parent ratio: Equity attributable to owners of the parent/total
assets
Equity attributable to owners of the parent ratio on a market price basis: Share market price/total
assets
Interest-bearing debt to operating cash flow ratio: Interest-bearing debt/cash flows from operating
activities
Interest coverage ratio: Cash flows from operating activities/interest paid
1. Indices are calculated using consolidated figures.
2. The share market price is calculated by multiplying the closing price at the end of the period by
the number of outstanding shares at the end of the period (after excluding treasury stock).
3. Cash flows from operating activities reflect cash flows from operating activities as detailed in the
Consolidated Statements of Cash Flows. Interest-bearing debt reflects all debt for which the
Company is paying interest as detailed in the Consolidated Balance Sheets. Interest payments reflect
interest paid as detailed in the Consolidated Statements of Cash Flows.
March 2017 March 2016 March 2015
Equity attributable to owners of the
parent ratio (%)
40.0
42.7
40.5
Equity attributable to owners of the
parent ratio on a market price basis
(%)
59.0
41.0
42.0
Interest-bearing debt to operating
cash flow ratio (%)
2.7
2.2
3.1
Interest coverage ratio (times) 24.9 22.0 13.2
(English translation of “KESSAN TANSHIN” originally issued in Japanese language.) 8
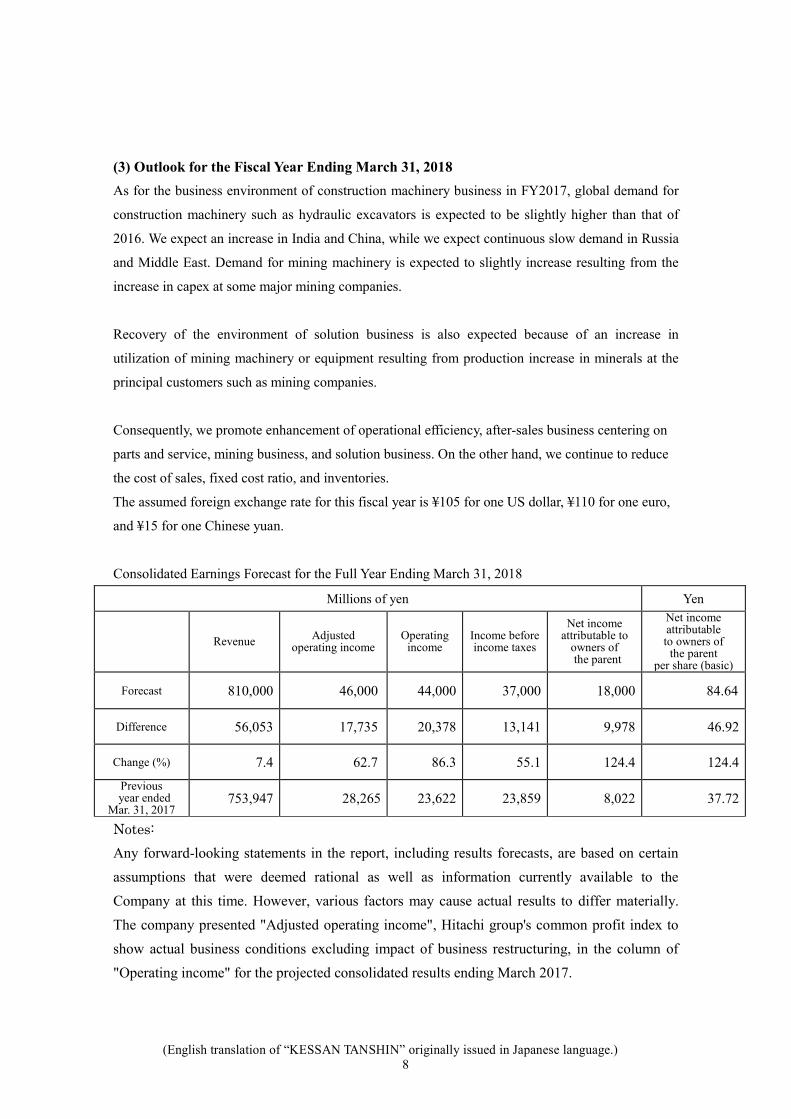
(3) Outlook for the Fiscal Year Ending March 31, 2018
As for the business environment of construction machinery business in FY2017, global demand for
construction machinery such as hydraulic excavators is expected to be slightly higher than that of
2016. We expect an increase in India and China, while we expect continuous slow demand in Russia
and Middle East. Demand for mining machinery is expected to slightly increase resulting from the
increase in capex at some major mining companies.
Recovery of the environment of solution business is also expected because of an increase in
utilization of mining machinery or equipment resulting from production increase in minerals at the
principal customers such as mining companies.
Consequently, we promote enhancement of operational efficiency, after-sales business centering on
parts and service, mining business, and solution business. On the other hand, we continue to reduce
the cost of sales, fixed cost ratio, and inventories.
The assumed foreign exchange rate for this fiscal year is ¥105 for one US dollar, ¥110 for one euro,
and ¥15 for one Chinese yuan.
Consolidated Earnings Forecast for the Full Year Ending March 31, 2018
Millions of yen Yen
Revenue Adjusted
operating income Operating
income Income before income taxes
Net income attributable to
owners of the parent
Net income attributable to owners of
the parent per share (basic)
Forecast 810,000 46,000 44,000 37,000 18,000 84.64
Difference 56,053 17,735 20,378 13,141 9,978 46.92
Change (%) 7.4 62.7 86.3 55.1 124.4 124.4
Previous year ended
Mar. 31, 2017 753,947 28,265 23,622 23,859 8,022 37.72
Notes:
Any forward-looking statements in the report, including results forecasts, are based on certain
assumptions that were deemed rational as well as information currently available to the
Company at this time. However, various factors may cause actual results to differ materially.
The company presented "Adjusted operating income", Hitachi group's common profit index to
show actual business conditions excluding impact of business restructuring, in the column of
"Operating income" for the projected consolidated results ending March 2017.
(English translation of “KESSAN TANSHIN” originally issued in Japanese language.) 9
(4) Business Risks
The HCM Group carries out its operations in regions throughout the world and executes its business
in a variety of fields such as production, sales, finance, etc. Accordingly, the HCM Group’s business
activities are subject to the effects of a wide range of risks. The HCM Group has identified the
following primary risks based on currently available information.
1. Market Conditions
Under the HCM Group’s business activities, demand is heavily affected by public investment such
as infrastructure development and private investment including the development of natural resources,
real estates, etc. Consequently, we have a risk of decline in revenue due to low factory utilization or
price decline by severe competition, resulting from significant demand decrease by sudden
fluctuation in each region.
2. Foreign Currency Exchange Rate Fluctuations
Since the sales of the HCM Group derived from outside Japan account for 70% in the fiscal year
under review, a substantial portion of its overseas sales are affected by currency fluctuations.
Appreciation of the Japanese yen against major currencies such as the US dollar, European euro, and
other currencies of emerging countries would adversely affect the HCM Group’s operational results.
The HCM Group strives to alleviate the effect of such fluctuations by enlarging the portion of local
production, increasing parts import by international procurement, and engaging in hedging activities.
However, our operational results may be adversely affected in the case thatif rates fluctuate beyond
our projected range.
3. Fluctuations in Financial Markets
The HCM Group is currently working on improvement of the efficiency of its assets to reduce its
interest-bearing debt; however, its aggregate short- and long-term interest-bearing debts were
approximately ¥249 billion as of March 31, 2017. Although the HCM Group has strived to reduce
the effect of interest rate fluctuations by procuring funds at fixed interest rates, an increase in interest
rates may increase the interest expenses, thereby adversely affecting the HCM Group’s operational
results. In addition, fluctuations in the financial markets, such as fluctuations in the fair value of
marketable securities and interest rates, may also increase the unfunded obligation portion of the
HCM Group’s pension plans or pension liabilities, which may result in an increase in pension
expenses. Such an increase in interest expenses and pension expenses may deteriorate the HCM
Group’s operational results and financial condition.
(English translation of “KESSAN TANSHIN” originally issued in Japanese language.) 10
4. Procurement and Production
Since the HCM Group’s costs for parts and materials account for a large portion of manufacturing
costs, their procurement is exposed to fluctuations in commodity prices. Price increases in
commodities may increase the manufacturing costs. Shortage of parts and materials causes difficulty
in timely procurement, and it lowers the HCM Group’s production efficiency.
In an effort to reduce any adverse effects on its business as a result of an increase in material costs,
the HCM Group plans to reduce other costs via VEC (value engineering for customers) activities,
and pass on the increase in material costs to the product prices. However, if the increases in material
prices were to exceed the HCM Group’s expectations or a prolonged shortage of materials and parts
were to occur, the HCM Group’s operational results may be adversely affected.
5. Credit Management
The HCM Group’s main products, construction machinery, are sold via sales financing, such as
installment sales, finance leasing, etc. A specialized department for financing engages in credit
management; however, occurrence of bad debt due to the deterioration of customers’ financial
condition may adversely affect the HCM Group’s operational results and financial results.
6. Public Laws and Tax Practices
The HCM Group’s business operations are required to comply with increasingly stringent political
measures, official restrictions, tax practices, legal laws and regulations, etc. For example, in the
numerous countries in which the Group operates, we are required to comply with restrictions or
regulations such as authorization for business operations and investments, as well as limitations and
rules regarding imports and exports, patents, intellectual properties, consumers, the environment and
recycling, conditions of employment, taxation, etc.
If such existing laws or regulations were to be amended or tightened, the Group may be required to
incur increased costs and to make further capital expenditures to comply with such new standards.
Such additional environmental compliance costs may adversely affect the Group’s operational
results.
7. Product Liability
While the HCM Group is making efforts to sustain and improve the quality and reliability of its
operations and products based on stringent standards established internally by the HCM Group, it
may face product liability claims or become exposed to other liabilities if unexpected defects in its
products result in accidents. If the costs of addressing such claims or other liabilities are not covered
by the HCM Group’s existing insurance policies, we may be required to bear the cost thereto, which
may adversely affect its financial condition.
(English translation of “KESSAN TANSHIN” originally issued in Japanese language.) 11
8. Alliances and Collaborative Relationships
The HCM Group has entered into various alliances and collaborative relationships with distributors,
suppliers, and other companies in its industry to reinforce its international competitiveness. Through such
arrangements, we are working to improve its product development, production, sales, and service capabilities.
The HCM Group’s failure to attain the expected results or the termination of such alliances or collaborative
relationships may adversely affect the operational results.
9. Information Security, Intellectual Property, and Other Matters
The HCM Group may obtain confidential information concerning its customers and individuals in the normal
course of its business, and also holds confidential business and technological information. We maintain such
confidential information with the utmost care. To safeguard such confidential information from unauthorized
access, tampering, destruction, leakage, or loss, the HCM Group employs appropriate safety measures,
including technological safety measures and establishment of rules to handle confidential information and
information management capabilities.
If a leak of confidential information occurred, the reputation of the HCM Group may be damaged and
customers may lose confidence in the HCM Group. In addition, our intellectual property may be infringed
upon by a third party, or a third party may claim that the HCM Group is liable for infringing upon such third
party’s intellectual property rights.
10. Natural Disasters
The HCM Group conducts its business operations on a global scale and operates and maintains development,
production, supply, and other business facilities in many countries. Natural disasters, such as earthquakes and
floods, wars, terrorist acts, accidents, or interference by third parties in regions in which the HCM Group
operates may cause damage to its facilities and disrupt operations, procurement of materials and parts or their
production, and sales and services. Such delays or disruptions may adversely affect our operational results.
2. Our Fundamental Position Concerning Selection of Accounting Standards Policy
The HCM Group has been actively promoting global business development and aims to further increase its
corporate value by building a management foundation that can accelerate management visualization and
management enhancement as well as governance reinforcement. As part of these efforts and for the purpose
of improving the international comparability of financial statements in the capital markets by introducing
IFRS, which is a global standard, and unifying the accounting methods within the Group, HCM voluntarily
adopts the International Financial Reporting Standards (IFRS) from the presentation of the consolidated
financial statements in its annual securities report for the fiscal year ended March 31, 2015.
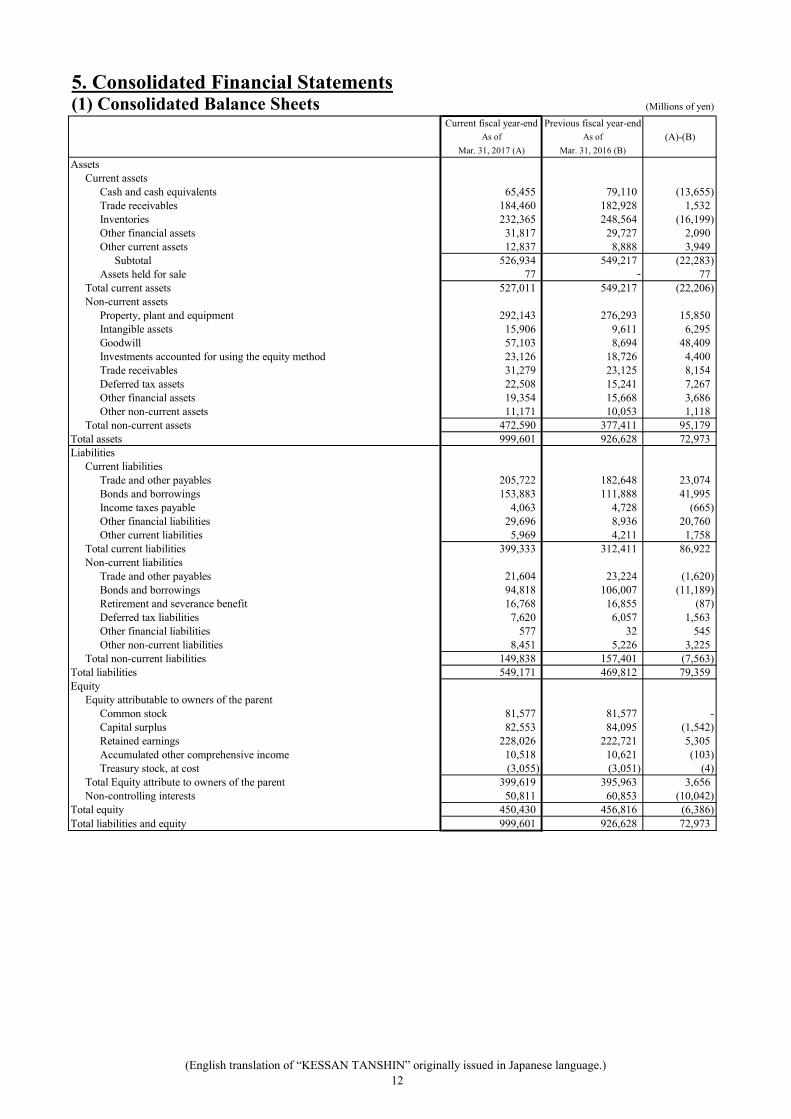
5. Consolidated Financial Statements(1) Consolidated Balance Sheets (Millions of yen)
Current fiscal year-end Previous fiscal year-end
As of As of (A)-(B)
Mar. 31, 2017 (A) Mar. 31, 2016 (B)
Assets
Current assets
Cash and cash equivalents 65,455 79,110 (13,655)
Trade receivables 184,460 182,928 1,532
Inventories 232,365 248,564 (16,199)
Other financial assets 31,817 29,727 2,090
Other current assets 12,837 8,888 3,949
Subtotal 526,934 549,217 (22,283)
Assets held for sale 77 - 77
Total current assets 527,011 549,217 (22,206)
Non-current assets
Property, plant and equipment 292,143 276,293 15,850
Intangible assets 15,906 9,611 6,295
Goodwill 57,103 8,694 48,409
Investments accounted for using the equity method 23,126 18,726 4,400
Trade receivables 31,279 23,125 8,154
Deferred tax assets 22,508 15,241 7,267
Other financial assets 19,354 15,668 3,686
Other non-current assets 11,171 10,053 1,118
Total non-current assets 472,590 377,411 95,179
Total assets 999,601 926,628 72,973
Liabilities
Current liabilities
Trade and other payables 205,722 182,648 23,074
Bonds and borrowings 153,883 111,888 41,995
Income taxes payable 4,063 4,728 (665)
Other financial liabilities 29,696 8,936 20,760
Other current liabilities 5,969 4,211 1,758
Total current liabilities 399,333 312,411 86,922
Non-current liabilities
Trade and other payables 21,604 23,224 (1,620)
Bonds and borrowings 94,818 106,007 (11,189)
Retirement and severance benefit 16,768 16,855 (87)
Deferred tax liabilities 7,620 6,057 1,563
Other financial liabilities 577 32 545
Other non-current liabilities 8,451 5,226 3,225
Total non-current liabilities 149,838 157,401 (7,563)
Total liabilities 549,171 469,812 79,359
Equity
Equity attributable to owners of the parent
Common stock 81,577 81,577 -
Capital surplus 82,553 84,095 (1,542)
Retained earnings 228,026 222,721 5,305
Accumulated other comprehensive income 10,518 10,621 (103)
Treasury stock, at cost (3,055) (3,051) (4)
Total Hitachi Construction Machinery Co., Ltd. Stock holders' equityTotal Equity attribute to owners of the parent 399,619 395,963 3,656
Non-controlling interests 50,811 60,853 (10,042)
Total equity 450,430 456,816 (6,386)
Total liabilities and equity 999,601 926,628 72,973
(English translation of “KESSAN TANSHIN” originally issued in Japanese language.)
12
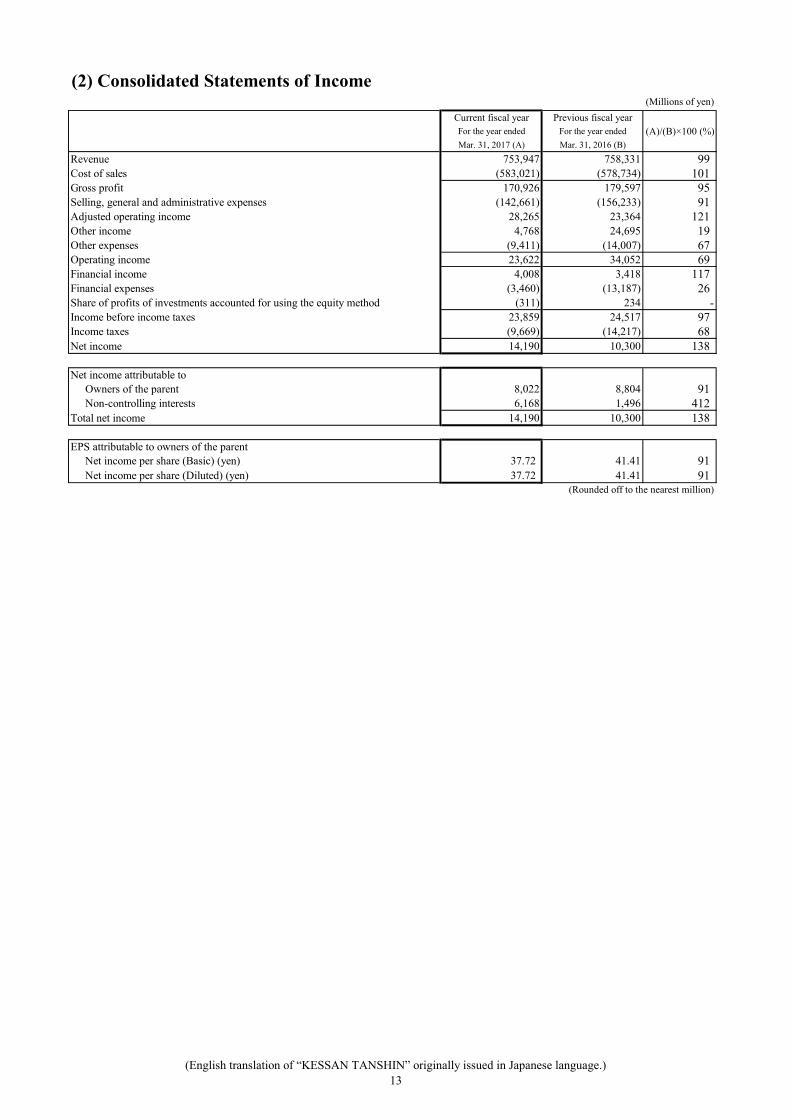
(2) Consolidated Statements of Income(Millions of yen)
Current fiscal year Previous fiscal year
For the year ended For the year ended (A)/(B)×100 (%)
Mar. 31, 2017 (A) Mar. 31, 2016 (B)
Revenue 753,947 758,331 99
Cost of sales (583,021) (578,734) 101
Gross profit 170,926 179,597 95
Selling, general and administrative expenses (142,661) (156,233) 91
Adjusted operating income 28,265 23,364 121
Other income 4,768 24,695 19
Other expenses (9,411) (14,007) 67
Operating income 23,622 34,052 69
Financial income 4,008 3,418 117
Financial expenses (3,460) (13,187) 26
Share of profits of investments accounted for using the equity method (311) 234 -
Income before income taxes 23,859 24,517 97
Income taxes (9,669) (14,217) 68
Net income 14,190 10,300 138
Net income attributable to
Owners of the parent 8,022 8,804 91
Non-controlling interests 6,168 1,496 412
Total net income 14,190 10,300 138
EPS attributable to owners of the parent
Net income per share (Basic) (yen) 37.72 41.41 91
Net income per share (Diluted) (yen) 37.72 41.41 91(Rounded off to the nearest million)
(English translation of “KESSAN TANSHIN” originally issued in Japanese language.)
13
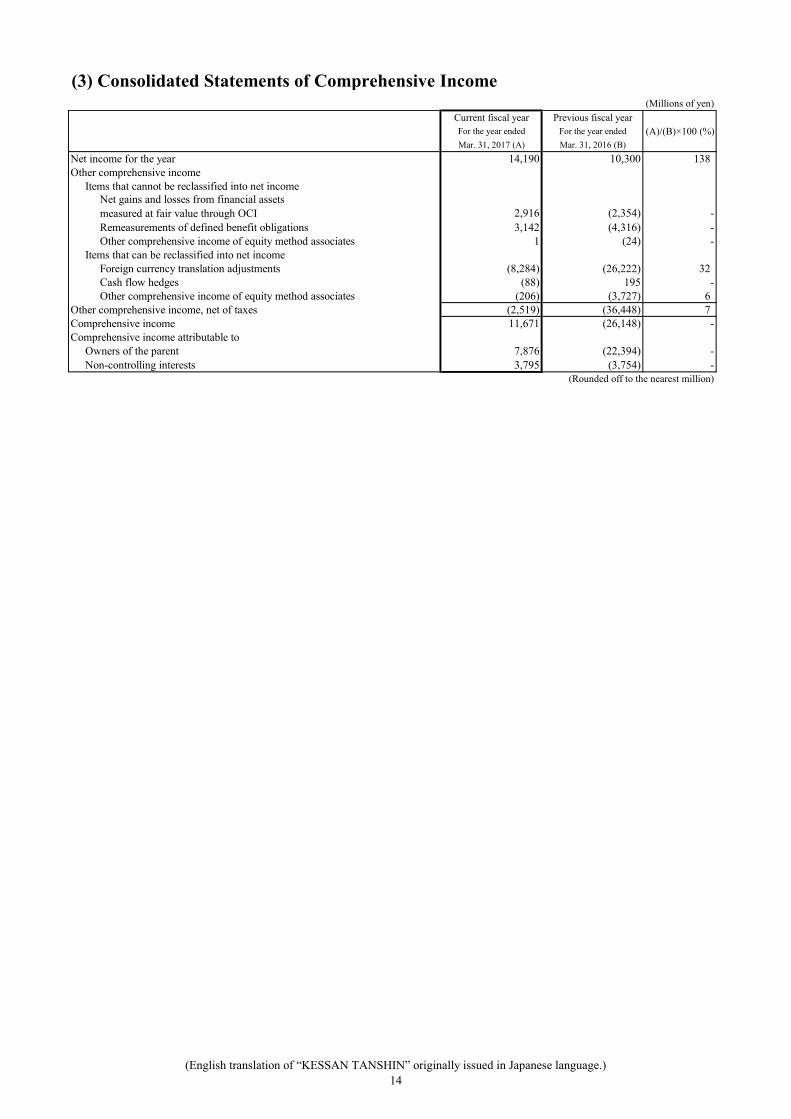
(3) Consolidated Statements of Comprehensive Income(Millions of yen)
Current fiscal year Previous fiscal year
For the year ended For the year ended (A)/(B)×100 (%)
Mar. 31, 2017 (A) Mar. 31, 2016 (B)
Net income for the year 14,190 10,300 138
Other comprehensive income
Items that cannot be reclassified into net income
2,916 (2,354) -
Remeasurements of defined benefit obligations 3,142 (4,316) -
Other comprehensive income of equity method associates 1 (24) -
Items that can be reclassified into net income
Foreign currency translation adjustments (8,284) (26,222) 32
Cash flow hedges (88) 195 -
Other comprehensive income of equity method associates (206) (3,727) 6
Other comprehensive income, net of taxes (2,519) (36,448) 7
Comprehensive income 11,671 (26,148) -
Comprehensive income attributable to
Owners of the parent 7,876 (22,394) -
Non-controlling interests 3,795 (3,754) -
(Rounded off to the nearest million)
Net gains and losses from financial assets
measured at fair value through OCI
(English translation of “KESSAN TANSHIN” originally issued in Japanese language.)
14
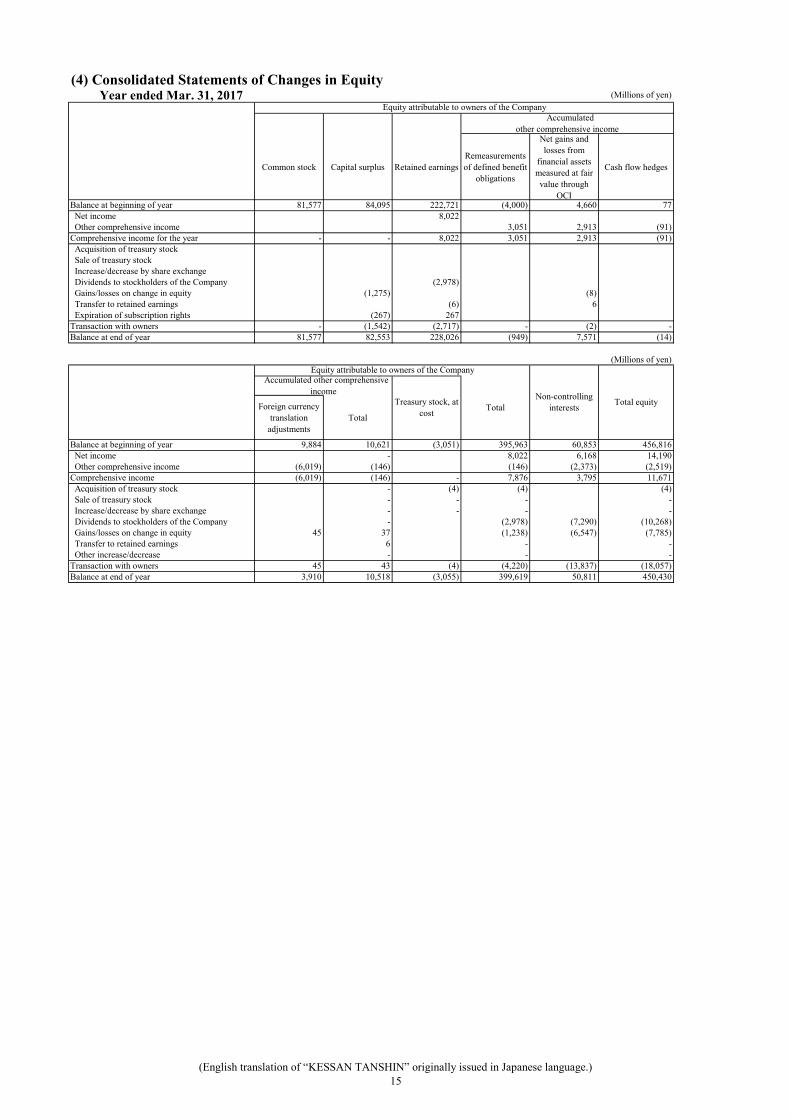
(4) Consolidated Statements of Changes in Equity Year ended Mar. 31, 2017 (Millions of yen)
Common stock Capital surplus Retained earnings
Remeasurements
of defined benefit
obligations
Net gains and
losses from
financial assets
measured at fair
value through
OCI
Cash flow hedges
Balance at beginning of year 81,577 84,095 222,721 (4,000) 4,660 77
Net income 8,022
Other comprehensive income 3,051 2,913 (91)
Comprehensive income for the year - - 8,022 3,051 2,913 (91)
Acquisition of treasury stock
Sale of treasury stock
Increase/decrease by share exchange
Dividends to stockholders of the Company (2,978)
Gains/losses on change in equity (1,275) (8)
Transfer to retained earnings (6) 6
Expiration of subscription rights (267) 267
Transaction with owners - (1,542) (2,717) - (2) -
Balance at end of year 81,577 82,553 228,026 (949) 7,571 (14)
(Millions of yen)
Foreign currency
translation
adjustments
Total
Balance at beginning of year 9,884 10,621 (3,051) 395,963 60,853 456,816
Net income - 8,022 6,168 14,190
Other comprehensive income (6,019) (146) (146) (2,373) (2,519)
Comprehensive income (6,019) (146) - 7,876 3,795 11,671
Acquisition of treasury stock - (4) (4) (4)
Sale of treasury stock - - - -
Increase/decrease by share exchange - - - -
Dividends to stockholders of the Company - (2,978) (7,290) (10,268)
Gains/losses on change in equity 45 37 (1,238) (6,547) (7,785)
Transfer to retained earnings 6 - -
Other increase/decrease - - -
Transaction with owners 45 43 (4) (4,220) (13,837) (18,057)
Balance at end of year 3,910 10,518 (3,055) 399,619 50,811 450,430
Equity attributable to owners of the Company
Equity attributable to owners of the Company
Non-controlling
interestsTotal equity
Total
Accumulated
other comprehensive income
Accumulated other comprehensive
income
Treasury stock, at
cost
(English translation of “KESSAN TANSHIN” originally issued in Japanese language.)
15
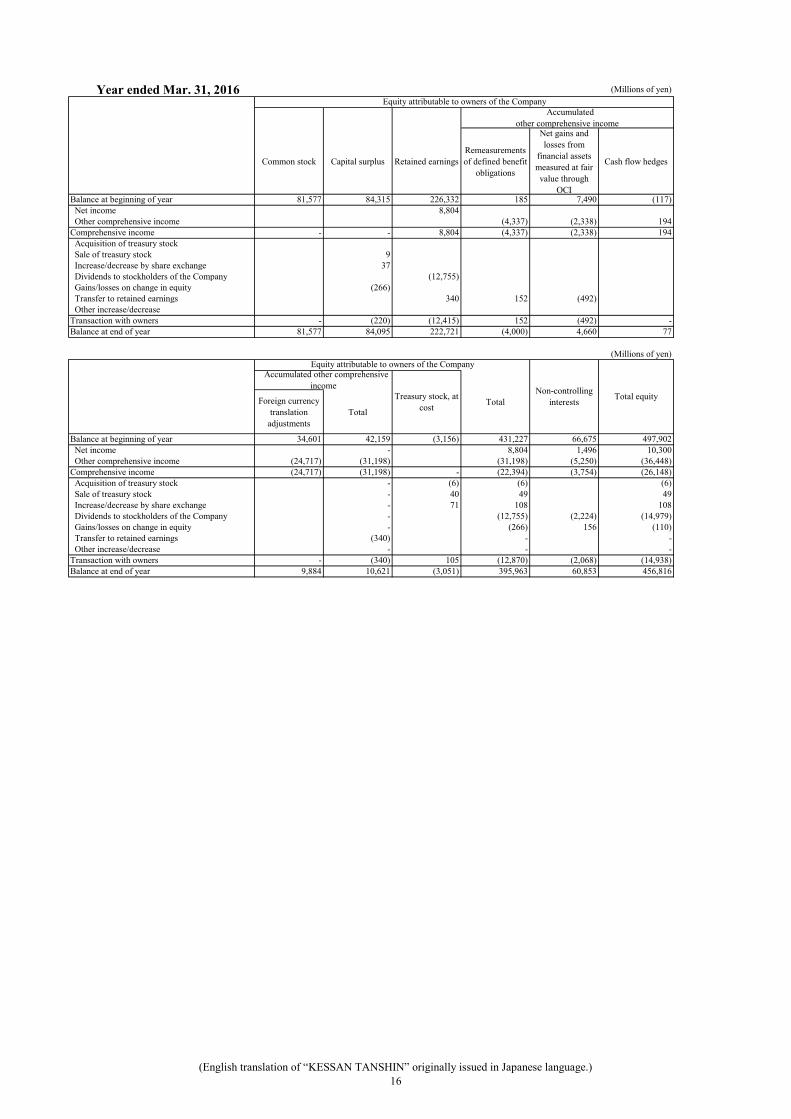
Year ended Mar. 31, 2016 (Millions of yen)
Common stock Capital surplus Retained earnings
Remeasurements
of defined benefit
obligations
Net gains and
losses from
financial assets
measured at fair
value through
OCI
Cash flow hedges
Balance at beginning of year 81,577 84,315 226,332 185 7,490 (117)
Net income 8,804
Other comprehensive income (4,337) (2,338) 194
Comprehensive income - - 8,804 (4,337) (2,338) 194
Acquisition of treasury stock
Sale of treasury stock 9
Increase/decrease by share exchange 37
Dividends to stockholders of the Company (12,755)
Gains/losses on change in equity (266)
Transfer to retained earnings 340 152 (492)
Other increase/decrease
Transaction with owners - (220) (12,415) 152 (492) -
Balance at end of year 81,577 84,095 222,721 (4,000) 4,660 77
(Millions of yen)
Foreign currency
translation
adjustments
Total
Balance at beginning of year 34,601 42,159 (3,156) 431,227 66,675 497,902
Net income - 8,804 1,496 10,300
Other comprehensive income (24,717) (31,198) (31,198) (5,250) (36,448)
Comprehensive income (24,717) (31,198) - (22,394) (3,754) (26,148)
Acquisition of treasury stock - (6) (6) (6)
Sale of treasury stock - 40 49 49
Increase/decrease by share exchange - 71 108 108
Dividends to stockholders of the Company - (12,755) (2,224) (14,979)
Gains/losses on change in equity - (266) 156 (110)
Transfer to retained earnings (340) - -
Other increase/decrease - - -
Transaction with owners - (340) 105 (12,870) (2,068) (14,938)
Balance at end of year 9,884 10,621 (3,051) 395,963 60,853 456,816
Non-controlling
interestsTotal equity
Total
Equity attributable to owners of the Company
Equity attributable to owners of the Company
Accumulated
other comprehensive income
Accumulated other comprehensive
income
Treasury stock, at
cost
(English translation of “KESSAN TANSHIN” originally issued in Japanese language.)
16
(5) Consolidated Statements of Cash Flows(Millions of yen)
Current fiscal year Previous fiscal year
For the year ended For the year ended
Mar. 31, 2017 Mar. 31, 2016
Net income 14,190 10,300
Depreciation 30,680 31,966
Amortization of intangible assets 3,284 3,481
Impairment losses 3,883 151
Gains on business restructuring (933) (21,611)
Income tax expense 9,669 14,217
Share of profits of investments accounted for using the equity method 311 (234)
Gain (loss) on sales of property, plant and equipment (51) (141)
Financial income (4,008) (3,418)
Financial expenses 3,460 13,187
(Increase) decrease in accounts and notes receivables (1,482) 40,650
(Increase) decrease in lease receivables (4,754) 11,741
(Increase) decrease in inventories 28,974 59,818
Increase (decrease) in accounts and notes payables 20,580 (14,654)
Increase (decrease) in provisions and retirement benefit obligations 2,704 825
Other (3,152) (13,169)
Subtotal 103,355 133,109
Interest received 2,573 2,994
Dividends received 593 463
Interest paid (3,534) (5,210)
Income tax paid (15,026) (16,482)
Net cash provided by operating activities 87,961 114,874
Capital expenditures (13,999) (17,515)
Proceeds from sale of property, plant and equipment 1,998 576
Acquisition of intangible assets (3,304) (2,287)
(56,070) (4,013)
(3,807) 32,184
Collection of long-term loan receivables 172 10,506
Payments for transfer of business - (1,810)
Other 400 614
Net cash provided by (used in) investing activities (74,610) 18,255
Increase (decrease) in short-term borrowings, net 24,232 (46,226)
Proceeds from long-term borrowings and bond 39,143 19,735
Payments on long-term borrowings (69,883) (50,921)
Payments on lease payables (5,556) (3,893)
Dividends paid to owners of the parent (3,005) (12,743)
Dividends paid to non-controlling interests (7,862) (4,156)
Purchase of shares of consolidated subsidiaries from non-controlling interests (2,882) -
Other (4) 41
Net cash provided by (used in) financing activities (25,817) (98,163)
Effect of exchange rate changes on cash and cash equivalents (1,189) (7,289)
Net increase (decrease) in cash and cash equivalents (13,655) 27,677
Cash and cash equivalents at beginning of year 79,110 51,433
Cash and cash equivalents at end of year 65,455 79,110
Acquisition of investments in securities and other financial assets
(including investments in associates)
Sales of investments in securities and other financial assets
(including investments in associates)
(English translation of “KESSAN TANSHIN” originally issued in Japanese language.)
17
(English translation of “KESSAN TANSHIN” originally issued in Japanese language.) 18
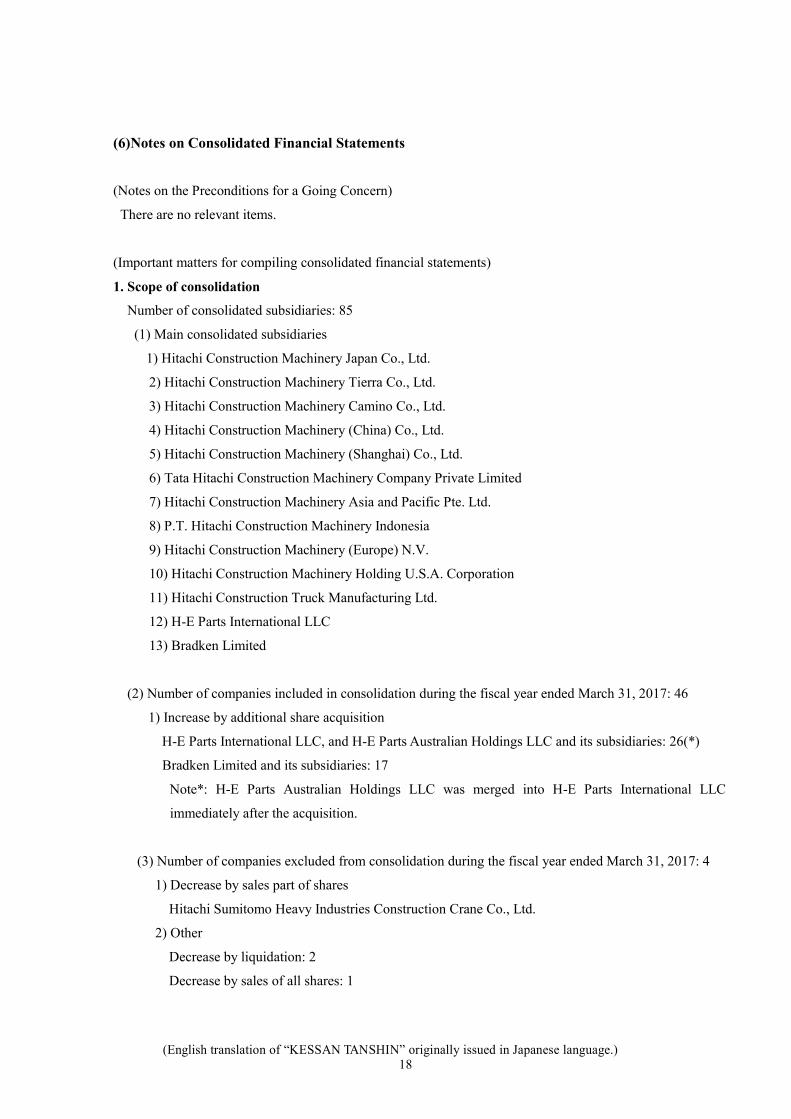
(6)Notes on Consolidated Financial Statements
(Notes on the Preconditions for a Going Concern)
There are no relevant items.
(Important matters for compiling consolidated financial statements)
1. Scope of consolidation
Number of consolidated subsidiaries: 85
(1) Main consolidated subsidiaries
1) Hitachi Construction Machinery Japan Co., Ltd.
2) Hitachi Construction Machinery Tierra Co., Ltd.
3) Hitachi Construction Machinery Camino Co., Ltd.
4) Hitachi Construction Machinery (China) Co., Ltd.
5) Hitachi Construction Machinery (Shanghai) Co., Ltd.
6) Tata Hitachi Construction Machinery Company Private Limited
7) Hitachi Construction Machinery Asia and Pacific Pte. Ltd.
8) P.T. Hitachi Construction Machinery Indonesia
9) Hitachi Construction Machinery (Europe) N.V.
10) Hitachi Construction Machinery Holding U.S.A. Corporation
11) Hitachi Construction Truck Manufacturing Ltd.
12) H-E Parts International LLC
13) Bradken Limited
(2) Number of companies included in consolidation during the fiscal year ended March 31, 2017: 46
1) Increase by additional share acquisition
H-E Parts International LLC, and H-E Parts Australian Holdings LLC and its subsidiaries: 26(*)
Bradken Limited and its subsidiaries: 17
Note*: H-E Parts Australian Holdings LLC was merged into H-E Parts International LLC
immediately after the acquisition.
(3) Number of companies excluded from consolidation during the fiscal year ended March 31, 2017: 4
1) Decrease by sales part of shares
Hitachi Sumitomo Heavy Industries Construction Crane Co., Ltd.
2) Other
Decrease by liquidation: 2
Decrease by sales of all shares: 1
(English translation of “KESSAN TANSHIN” originally issued in Japanese language.) 19
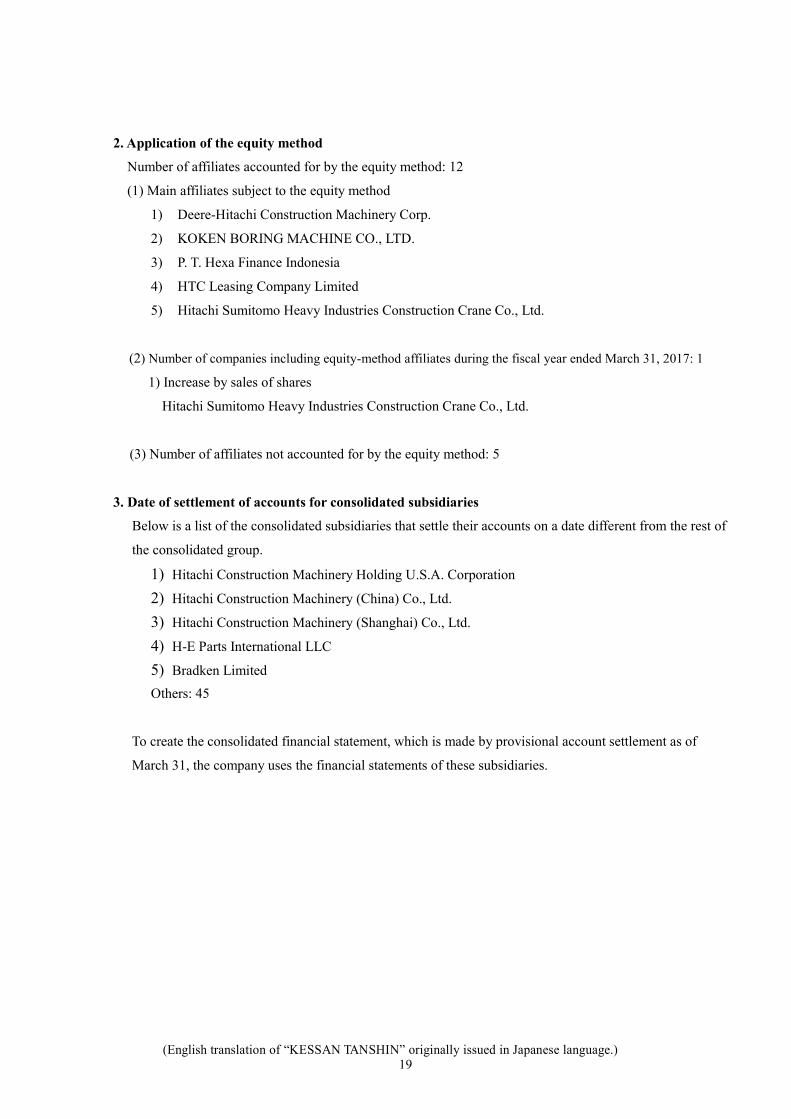
2. Application of the equity method
Number of affiliates accounted for by the equity method: 12
(1) Main affiliates subject to the equity method
1) Deere-Hitachi Construction Machinery Corp.
2) KOKEN BORING MACHINE CO., LTD.
3) P. T. Hexa Finance Indonesia
4) HTC Leasing Company Limited
5) Hitachi Sumitomo Heavy Industries Construction Crane Co., Ltd.
(2) Number of companies including equity-method affiliates during the fiscal year ended March 31, 2017: 1
1) Increase by sales of shares
Hitachi Sumitomo Heavy Industries Construction Crane Co., Ltd.
(3) Number of affiliates not accounted for by the equity method: 5
3. Date of settlement of accounts for consolidated subsidiaries
Below is a list of the consolidated subsidiaries that settle their accounts on a date different from the rest of
the consolidated group.
1) Hitachi Construction Machinery Holding U.S.A. Corporation
2) Hitachi Construction Machinery (China) Co., Ltd.
3) Hitachi Construction Machinery (Shanghai) Co., Ltd.
4) H-E Parts International LLC
5) Bradken Limited
Others: 45
To create the consolidated financial statement, which is made by provisional account settlement as of
March 31, the company uses the financial statements of these subsidiaries.
(English translation of “KESSAN TANSHIN” originally issued in Japanese language.) 20
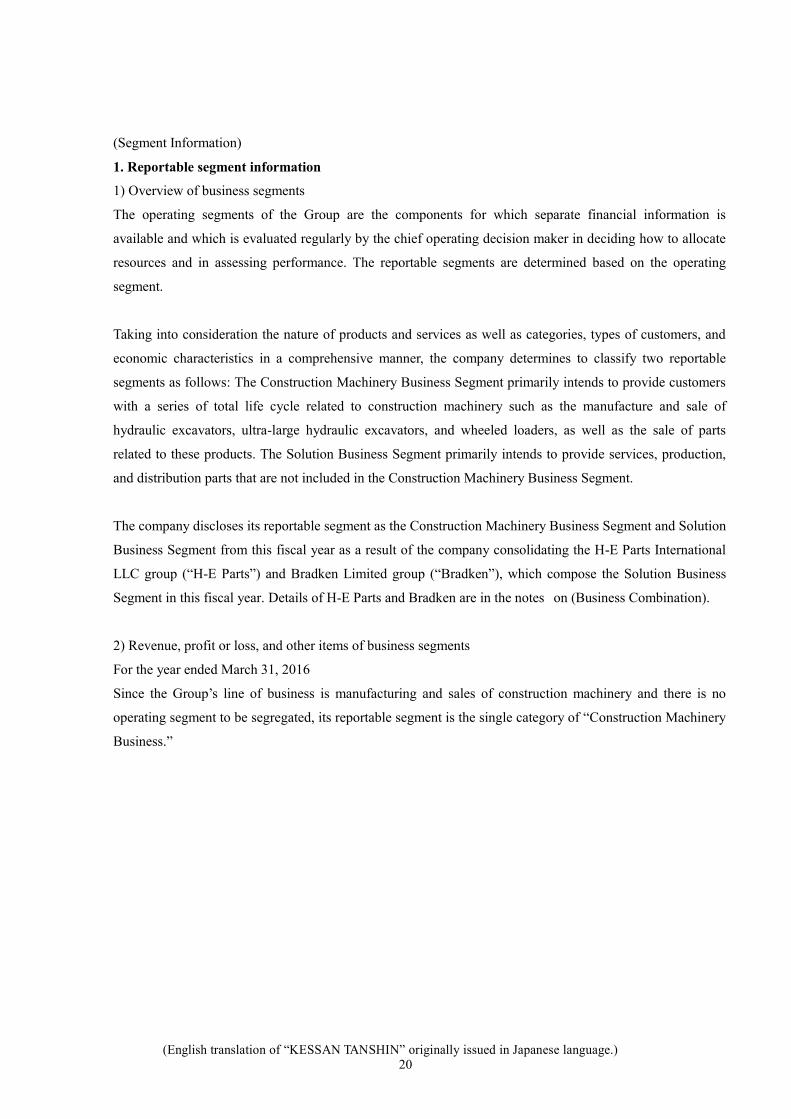
(Segment Information)
1. Reportable segment information
1) Overview of business segments
The operating segments of the Group are the components for which separate financial information is
available and which is evaluated regularly by the chief operating decision maker in deciding how to allocate
resources and in assessing performance. The reportable segments are determined based on the operating
segment.
Taking into consideration the nature of products and services as well as categories, types of customers, and
economic characteristics in a comprehensive manner, the company determines to classify two reportable
segments as follows: The Construction Machinery Business Segment primarily intends to provide customers
with a series of total life cycle related to construction machinery such as the manufacture and sale of
hydraulic excavators, ultra-large hydraulic excavators, and wheeled loaders, as well as the sale of parts
related to these products. The Solution Business Segment primarily intends to provide services, production,
and distribution parts that are not included in the Construction Machinery Business Segment.
The company discloses its reportable segment as the Construction Machinery Business Segment and Solution
Business Segment from this fiscal year as a result of the company consolidating the H-E Parts International
LLC group (“H-E Parts”) and Bradken Limited group (“Bradken”), which compose the Solution Business
Segment in this fiscal year. Details of H-E Parts and Bradken are in the notes on (Business Combination).
2) Revenue, profit or loss, and other items of business segments
For the year ended March 31, 2016
Since the Group’s line of business is manufacturing and sales of construction machinery and there is no
operating segment to be segregated, its reportable segment is the single category of “Construction Machinery
Business.”

(English translation of “KESSAN TANSHIN” originally issued in Japanese language.) 21
For the year ended March 31, 2017
(Millions of yen)
Reportable segment
Adjustments
(*1) Total
Construction
Machinery
Business
Solution
Business Total
Revenue
External customers
Intersegment transactions
747,256
-
6,691
-
753,947
-
-
-
753,947
-
Total revenues 747,256 6,691 753,947 - 753,947
Segment profit (*2) 23,066 556 23,622 - 23,622
Financial income
Financial expenses
Share of profits (losses) of
investments accounted for using
the equity method
4,008
(3,460)
(311)
Income before income taxes 23,859
Segment assets
Segment liabilities
869,218
496,489
139,696
61,995
1,008,914
558,484
(9,313)
(9,313)
999,601
549,171
Other items:
Depreciation and amortization
Impairment losses
Gain on business restructuring
Business structure reform
expenses
Investments accounted for using
the equity method
Capital expenditure
(33,847)
(3,883)
933
(479)
23,126
33,910
(117)
-
-
-
-
59
(33,964)
(3,883)
933
(479)
23,126
33,969
-
-
-
-
-
(33,964)
(3,883)
933
(479)
23,126
33,969
Note (*1): Adjustments represent eliminations of intersegment transactions.
Note (*2): Segment profit is based on operating income.
(English translation of “KESSAN TANSHIN” originally issued in Japanese language.) 22
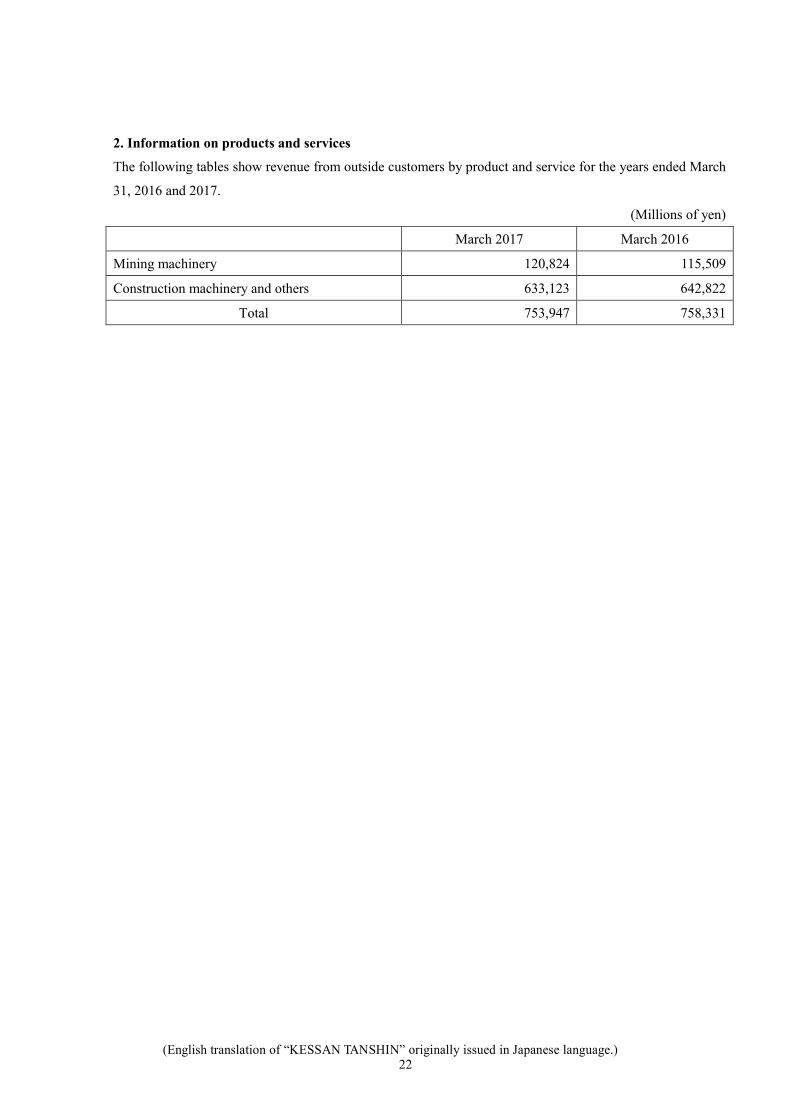
2. Information on products and services
The following tables show revenue from outside customers by product and service for the years ended March
31, 2016 and 2017.
(Millions of yen)
March 2017 March 2016
Mining machinery 120,824 115,509
Construction machinery and others 633,123 642,822
Total 753,947 758,331
(English translation of “KESSAN TANSHIN” originally issued in Japanese language.) 23
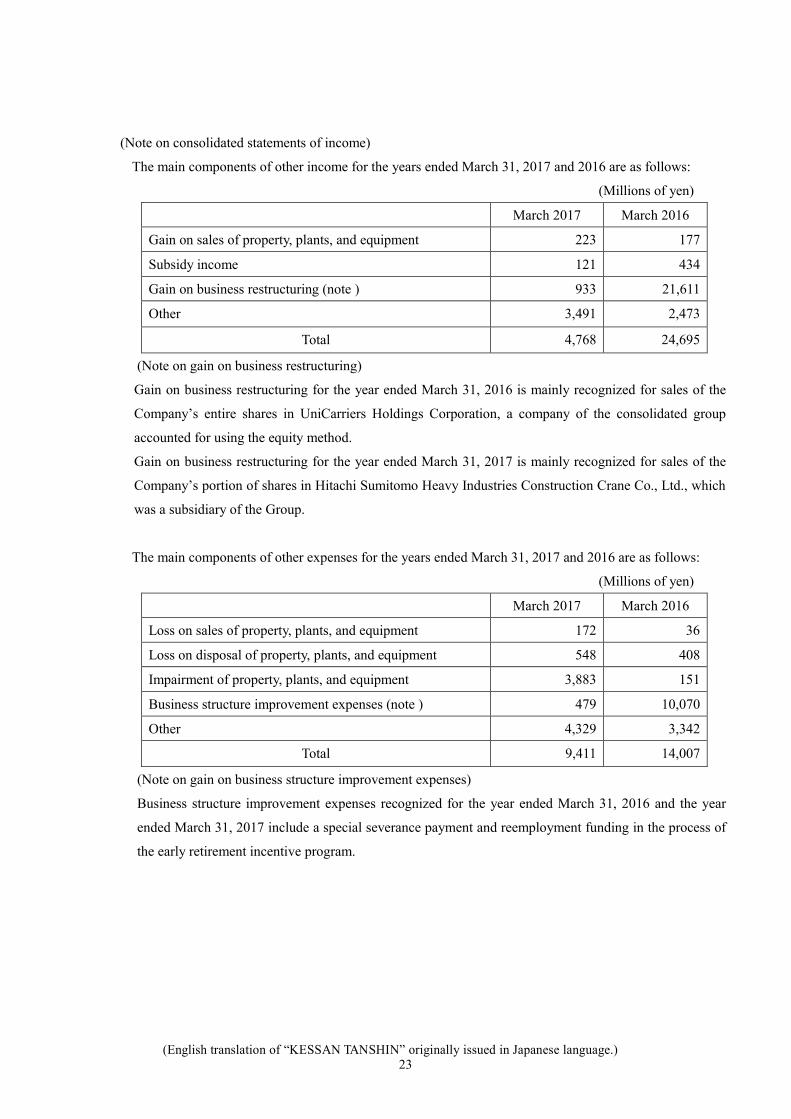
(Note on consolidated statements of income)
The main components of other income for the years ended March 31, 2017 and 2016 are as follows:
(Millions of yen)
March 2017 March 2016
Gain on sales of property, plants, and equipment 223 177
Subsidy income 121 434
Gain on business restructuring (note ) 933 21,611
Other 3,491 2,473
Total 4,768 24,695
(Note on gain on business restructuring)
Gain on business restructuring for the year ended March 31, 2016 is mainly recognized for sales of the
Company’s entire shares in UniCarriers Holdings Corporation, a company of the consolidated group
accounted for using the equity method.
Gain on business restructuring for the year ended March 31, 2017 is mainly recognized for sales of the
Company’s portion of shares in Hitachi Sumitomo Heavy Industries Construction Crane Co., Ltd., which
was a subsidiary of the Group.
The main components of other expenses for the years ended March 31, 2017 and 2016 are as follows:
(Millions of yen)
March 2017 March 2016
Loss on sales of property, plants, and equipment 172 36
Loss on disposal of property, plants, and equipment 548 408
Impairment of property, plants, and equipment 3,883 151
Business structure improvement expenses (note ) 479 10,070
Other 4,329 3,342
Total 9,411 14,007
(Note on gain on business structure improvement expenses)
Business structure improvement expenses recognized for the year ended March 31, 2016 and the year
ended March 31, 2017 include a special severance payment and reemployment funding in the process of
the early retirement incentive program.
(English translation of “KESSAN TANSHIN” originally issued in Japanese language.) 24
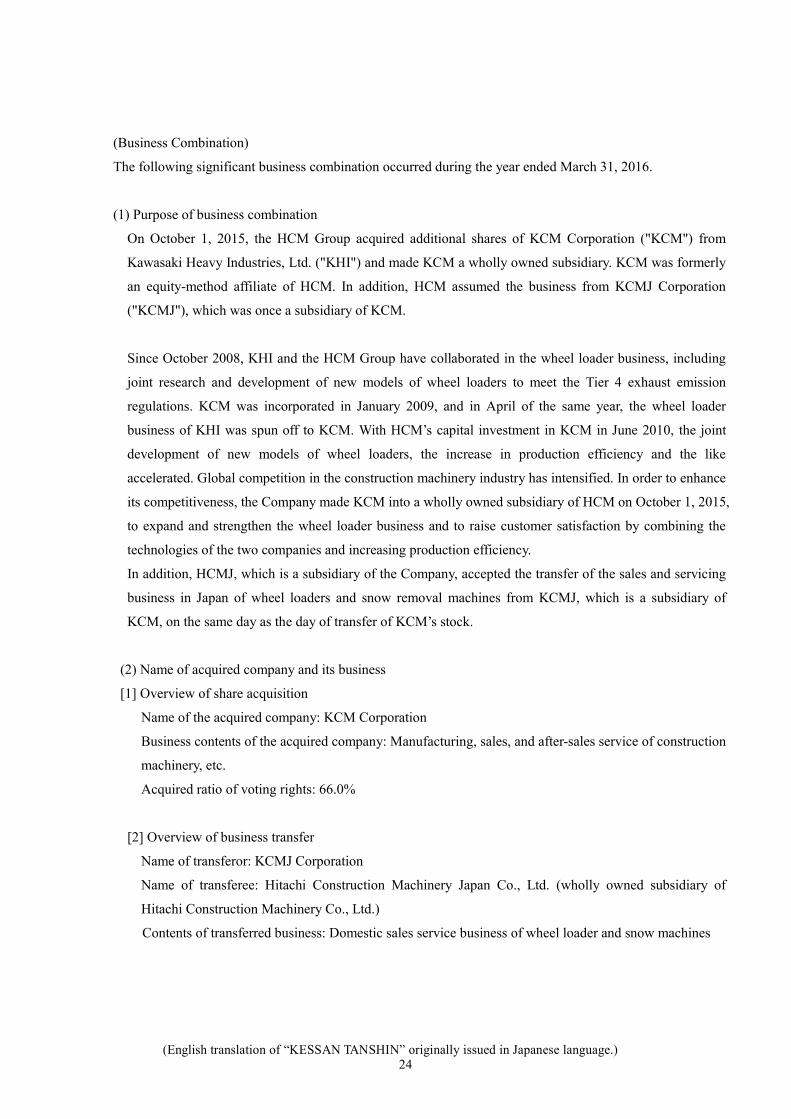
(Business Combination)
The following significant business combination occurred during the year ended March 31, 2016.
(1) Purpose of business combination
On October 1, 2015, the HCM Group acquired additional shares of KCM Corporation ("KCM") from
Kawasaki Heavy Industries, Ltd. ("KHI") and made KCM a wholly owned subsidiary. KCM was formerly
an equity-method affiliate of HCM. In addition, HCM assumed the business from KCMJ Corporation
("KCMJ"), which was once a subsidiary of KCM.
Since October 2008, KHI and the HCM Group have collaborated in the wheel loader business, including
joint research and development of new models of wheel loaders to meet the Tier 4 exhaust emission
regulations. KCM was incorporated in January 2009, and in April of the same year, the wheel loader
business of KHI was spun off to KCM. With HCM’s capital investment in KCM in June 2010, the joint
development of new models of wheel loaders, the increase in production efficiency and the like
accelerated. Global competition in the construction machinery industry has intensified. In order to enhance
its competitiveness, the Company made KCM into a wholly owned subsidiary of HCM on October 1, 2015,
to expand and strengthen the wheel loader business and to raise customer satisfaction by combining the
technologies of the two companies and increasing production efficiency.
In addition, HCMJ, which is a subsidiary of the Company, accepted the transfer of the sales and servicing
business in Japan of wheel loaders and snow removal machines from KCMJ, which is a subsidiary of
KCM, on the same day as the day of transfer of KCM’s stock.
(2) Name of acquired company and its business
[1] Overview of share acquisition
Name of the acquired company: KCM Corporation
Business contents of the acquired company: Manufacturing, sales, and after-sales service of construction
machinery, etc.
Acquired ratio of voting rights: 66.0%
[2] Overview of business transfer
Name of transferor: KCMJ Corporation
Name of transferee: Hitachi Construction Machinery Japan Co., Ltd. (wholly owned subsidiary of
Hitachi Construction Machinery Co., Ltd.)
Contents of transferred business: Domestic sales service business of wheel loader and snow machines
(English translation of “KESSAN TANSHIN” originally issued in Japanese language.) 25
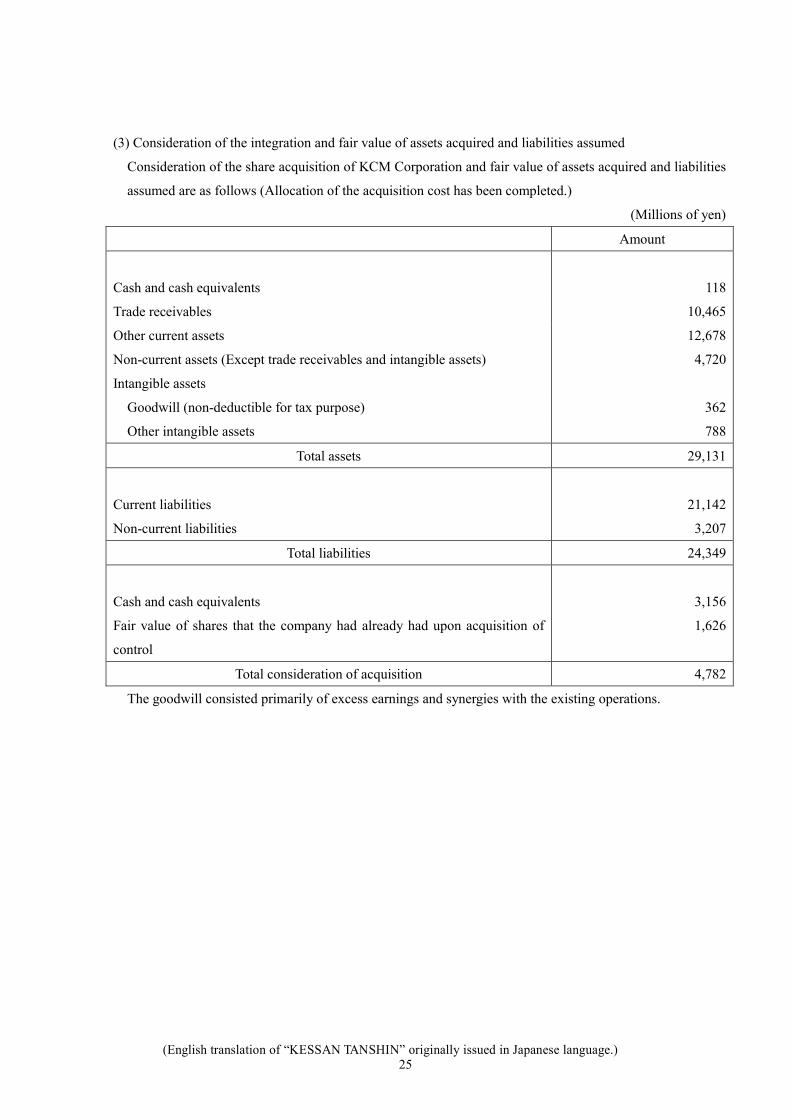
(3) Consideration of the integration and fair value of assets acquired and liabilities assumed
Consideration of the share acquisition of KCM Corporation and fair value of assets acquired and liabilities
assumed are as follows (Allocation of the acquisition cost has been completed.)
(Millions of yen)
Amount
Cash and cash equivalents 118
Trade receivables 10,465
Other current assets 12,678
Non-current assets (Except trade receivables and intangible assets) 4,720
Intangible assets
Goodwill (non-deductible for tax purpose) 362
Other intangible assets 788
Total assets 29,131
Current liabilities
21,142
Non-current liabilities 3,207
Total liabilities 24,349
Cash and cash equivalents 3,156
Fair value of shares that the company had already had upon acquisition of
control
1,626
Total consideration of acquisition 4,782
The goodwill consisted primarily of excess earnings and synergies with the existing operations.
(English translation of “KESSAN TANSHIN” originally issued in Japanese language.) 26
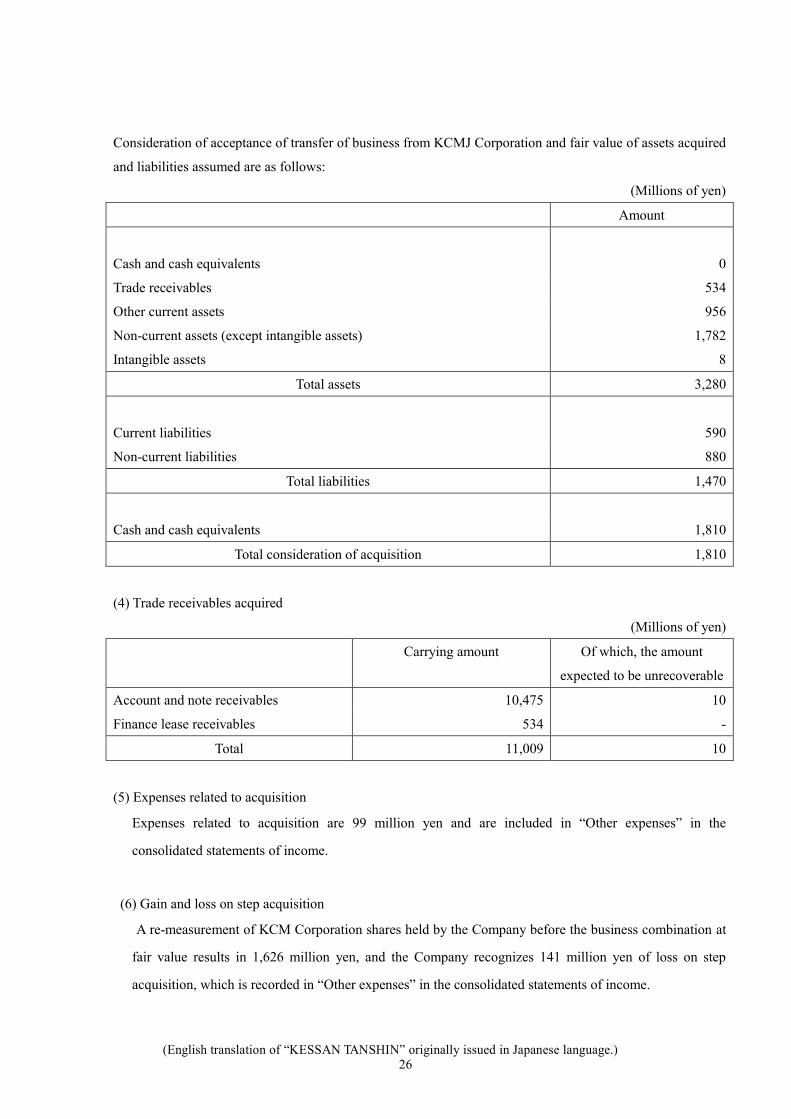
Consideration of acceptance of transfer of business from KCMJ Corporation and fair value of assets acquired
and liabilities assumed are as follows:
(Millions of yen)
Amount
Cash and cash equivalents
0
Trade receivables 534
Other current assets 956
Non-current assets (except intangible assets) 1,782
Intangible assets 8
Total assets 3,280
Current liabilities
590
Non-current liabilities 880
Total liabilities 1,470
Cash and cash equivalents 1,810
Total consideration of acquisition 1,810
(4) Trade receivables acquired
(Millions of yen)
Carrying amount Of which, the amount
expected to be unrecoverable
Account and note receivables 10,475 10
Finance lease receivables 534 -
Total 11,009 10
(5) Expenses related to acquisition
Expenses related to acquisition are 99 million yen and are included in “Other expenses” in the
consolidated statements of income.
(6) Gain and loss on step acquisition
A re-measurement of KCM Corporation shares held by the Company before the business combination at
fair value results in 1,626 million yen, and the Company recognizes 141 million yen of loss on step
acquisition, which is recorded in “Other expenses” in the consolidated statements of income.
(English translation of “KESSAN TANSHIN” originally issued in Japanese language.) 27
(7) Revenue and net income of the acquired company and transferred business
Revenue and net income generated by the acquired company and transferred business among those
figures in the consolidated statements of income are 15,910 million yen and 1,227 million yen
respectively.
(8) Revenue and net income of the HCM Group assuming that the business combination is completed at the
beginning of the fiscal year
Revenue and net income of the HCM Group assuming that the business combination is completed at the
beginning of the fiscal year are 777,247 million yen and 10,660 million yen respectively.
(English translation of “KESSAN TANSHIN” originally issued in Japanese language.) 28
The following significant business combination occurred during the year ended March 31, 2017.
(Acquisition all the shares of H-E Parts International LLC and H-E Parts Australian Holdings LLC)
On December 21, 2016, the company acquired all the shares of H-E Parts International LLC and H-E Parts
Australian Holdings LLC (collectively “H-E Parts”) that are headquartered in Delaware, United States. H-E
Parts provides solution service for mining, quarrying, construction machine, and materials processing. Also,
it develops, manufactures, sells, and repairs aftermarket parts for, among others, mining and construction
machines in Australia, USA, and other markets.
1. Purpose of business combination
Faced with uncertain market conditions, the Company has promoted its “GROW TOGETHER 2016”
Mid-term Management Plan and proactively sought to streamline management, including through
establishing a global support framework, in order to flexibly adapt to changes in the operating
environment. The Company aims to provide highly efficient solution services at low cost, enhance the
Company’s value chain, and improve business stability and profitability through the acquisition of H-E
Parts. The Company also plans to expand its solution service business by leveraging the knowledge and
expertise of H-E Parts.
2. Name of the acquired company and its business
1) H-E Parts International LLC
Name of the acquired company: H-E Parts International LLC
Business contents of the acquired company: Provider of services related to mining and construction
machines, and the manufacture, development, and sales of aftermarket parts.
Acquired ratio of voting rights: 100%
2) H-E Parts Australian Holdings LLC (*)
Name of the acquired company: H-E Parts Australian Holdings LLC
Business contents of the acquired company: Shareholding of its subsidiaries
Acquired ratio of voting rights: 100%
Note*: H-E Parts Australian Holdings LLC established as a special-purpose company to own units in
HEP Australia Holdings Pty Ltd and was merged into H-E Parts International LLC immediately after
the acquisition.
(Reference) Overview of the company owned by H-E Parts Australian Holdings LLC
Name of the company: HEP Australia Holdings Pty Ltd
Business contents of the company: Provider of services related to mining and construction machines,
and the manufacture, development, and sales of aftermarket parts.
(English translation of “KESSAN TANSHIN” originally issued in Japanese language.) 29
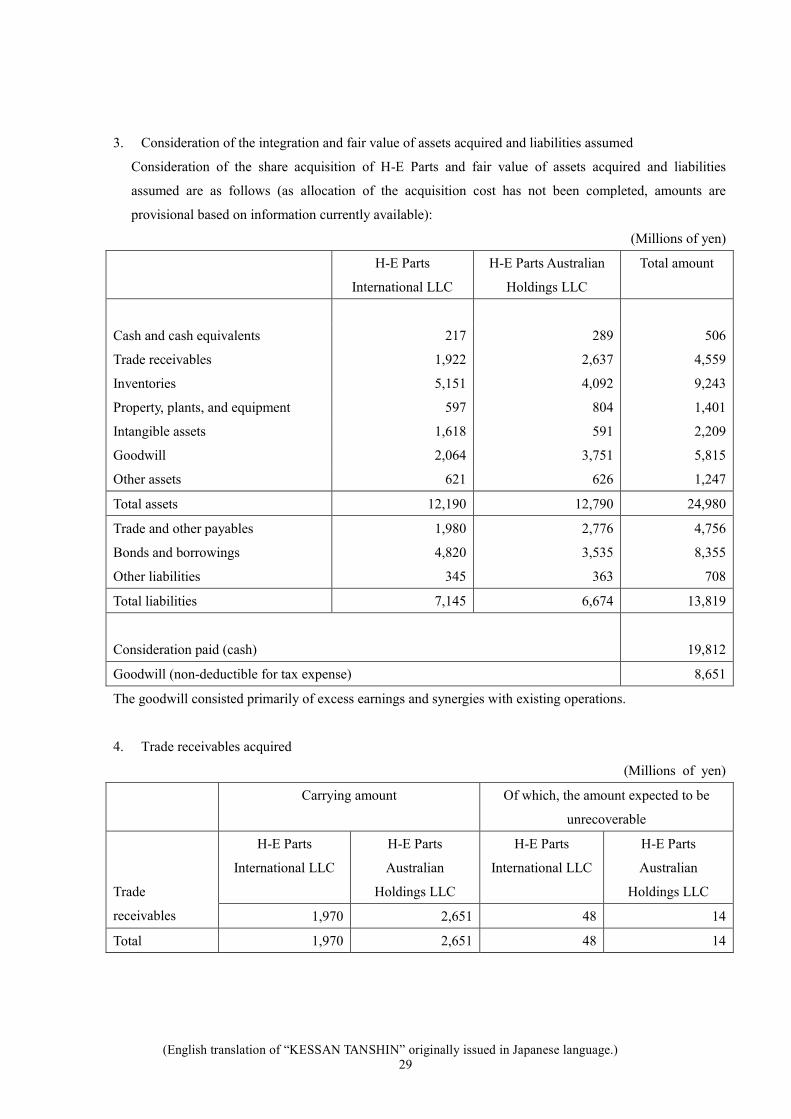
3. Consideration of the integration and fair value of assets acquired and liabilities assumed
Consideration of the share acquisition of H-E Parts and fair value of assets acquired and liabilities
assumed are as follows (as allocation of the acquisition cost has not been completed, amounts are
provisional based on information currently available):
(Millions of yen)
H-E Parts
International LLC
H-E Parts Australian
Holdings LLC
Total amount
Cash and cash equivalents 217 289 506
Trade receivables 1,922 2,637 4,559
Inventories 5,151 4,092 9,243
Property, plants, and equipment 597 804 1,401
Intangible assets 1,618 591 2,209
Goodwill 2,064 3,751 5,815
Other assets 621 626 1,247
Total assets 12,190 12,790 24,980
Trade and other payables 1,980 2,776 4,756
Bonds and borrowings 4,820 3,535 8,355
Other liabilities 345 363 708
Total liabilities 7,145 6,674 13,819
Consideration paid (cash) 19,812
Goodwill (non-deductible for tax expense) 8,651
The goodwill consisted primarily of excess earnings and synergies with existing operations.
4. Trade receivables acquired
(Millions of yen)
Carrying amount Of which, the amount expected to be
unrecoverable
Trade
receivables
H-E Parts
International LLC
H-E Parts
Australian
Holdings LLC
H-E Parts
International LLC
H-E Parts
Australian
Holdings LLC
1,970 2,651 48 14
Total 1,970 2,651 48 14
(English translation of “KESSAN TANSHIN” originally issued in Japanese language.) 30
5. Expenses related to acquisition
Expenses related to acquisition are 551 million yen and included in “Other expenses” in the consolidated
statements of income.
6. Revenue and net income of the acquired company
The revenue of the acquired company from the acquisition date to March 31, 2017 in the consolidated
statements of income is 6,691 million yen and the net income is not disclosed because it has no material
impact on the consolidated financial statements.
7. Revenue and net income of the Group assuming that the business combination is completed at the
beginning of the fiscal year
Revenue and net income of the Group assuming that the business combination is completed at the
beginning of the fiscal year are 772,826 million yen and 14,737 million yen respectively.
(English translation of “KESSAN TANSHIN” originally issued in Japanese language.) 31
(Acquisition of shares Bradken Limited)
The company commenced a share takeover offer (the “takeover offer”) for all issued common shares in
Bradken Limited (Australian Stock Exchange: BKN; Head office: Newcastle, Australia; Chairman: Phillip
Arnall; “Bradken”) on November 1, 2016. As a result of Bradken shareholders’ acceptance of the takeover
offer, Bradken became a consolidated subsidiary of the company on March 20, 2017.
1. Purpose of business combination
Demand for construction machinery and mining machinery has decelerated in China, Indonesia, the CIS, and
other emerging countries and has stagnated in advanced countries, and the market climate continues to be
austere. Faced with these conditions, the Company has promoted its “GROW TOGETHER 2016” Mid-term
Management Plan and proactively sought to streamline management, including through establishing a global
support framework, in order to flexibly adapt to changes in the operating environment.
In the future, the Company intends to pursue growth through alliances and acquisitions in its core business of
manufacturing and distributing construction and mining equipment, together with the associated value chains.
This will be combined with an ongoing focus on streamlining operations.
Bradken’s business is wide-ranging across the value chain globally. Its operations include a mining
equipment business, a business for wear parts in mining, and a maintenance service business, as well as a
manufacturing business of industrial products for mining and infrastructure. The Company believes that the
acquisition of Bradken will complement and bolster the parts service business in the Company’s mining
business and expects further improvement in business income stability and profitability through mutual
utilization of a global network.
2. Name of the acquired company and its business
Name of the acquired company: Bradken Limited
Business contents of the acquired company: Metal casting and manufacture and distribution services for
metal casting products
Acquired ratio of voting rights: 68.62%
(English translation of “KESSAN TANSHIN” originally issued in Japanese language.) 32
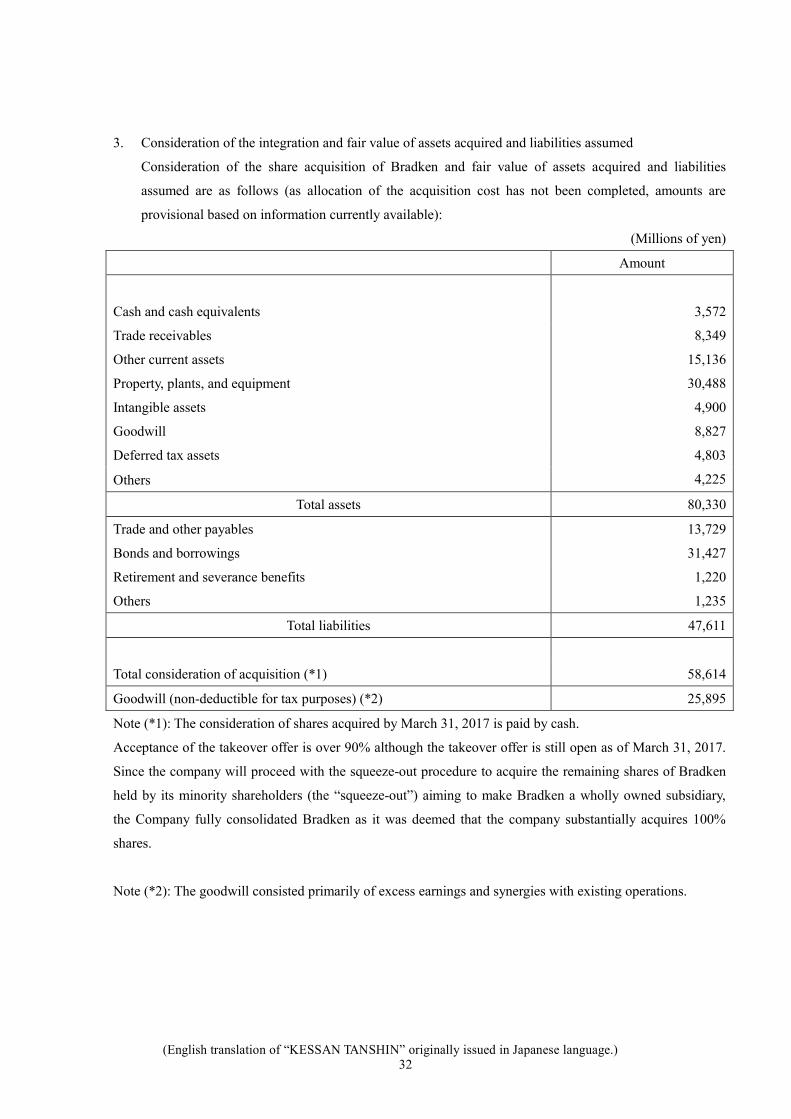
3. Consideration of the integration and fair value of assets acquired and liabilities assumed
Consideration of the share acquisition of Bradken and fair value of assets acquired and liabilities
assumed are as follows (as allocation of the acquisition cost has not been completed, amounts are
provisional based on information currently available):
(Millions of yen)
Amount
Cash and cash equivalents 3,572
Trade receivables 8,349
Other current assets 15,136
Property, plants, and equipment 30,488
Intangible assets 4,900
Goodwill 8,827
Deferred tax assets 4,803
4,225 Others
Total assets 80,330
Trade and other payables
Bonds and borrowings
13,729
31,427
Retirement and severance benefits
Others
1,220
1,235
Total liabilities 47,611
Total consideration of acquisition (*1) 58,614
Goodwill (non-deductible for tax purposes) (*2) 25,895
Note (*1): The consideration of shares acquired by March 31, 2017 is paid by cash.
Acceptance of the takeover offer is over 90% although the takeover offer is still open as of March 31, 2017.
Since the company will proceed with the squeeze-out procedure to acquire the remaining shares of Bradken
held by its minority shareholders (the “squeeze-out”) aiming to make Bradken a wholly owned subsidiary,
the Company fully consolidated Bradken as it was deemed that the company substantially acquires 100%
shares.
Note (*2): The goodwill consisted primarily of excess earnings and synergies with existing operations.
(English translation of “KESSAN TANSHIN” originally issued in Japanese language.) 33
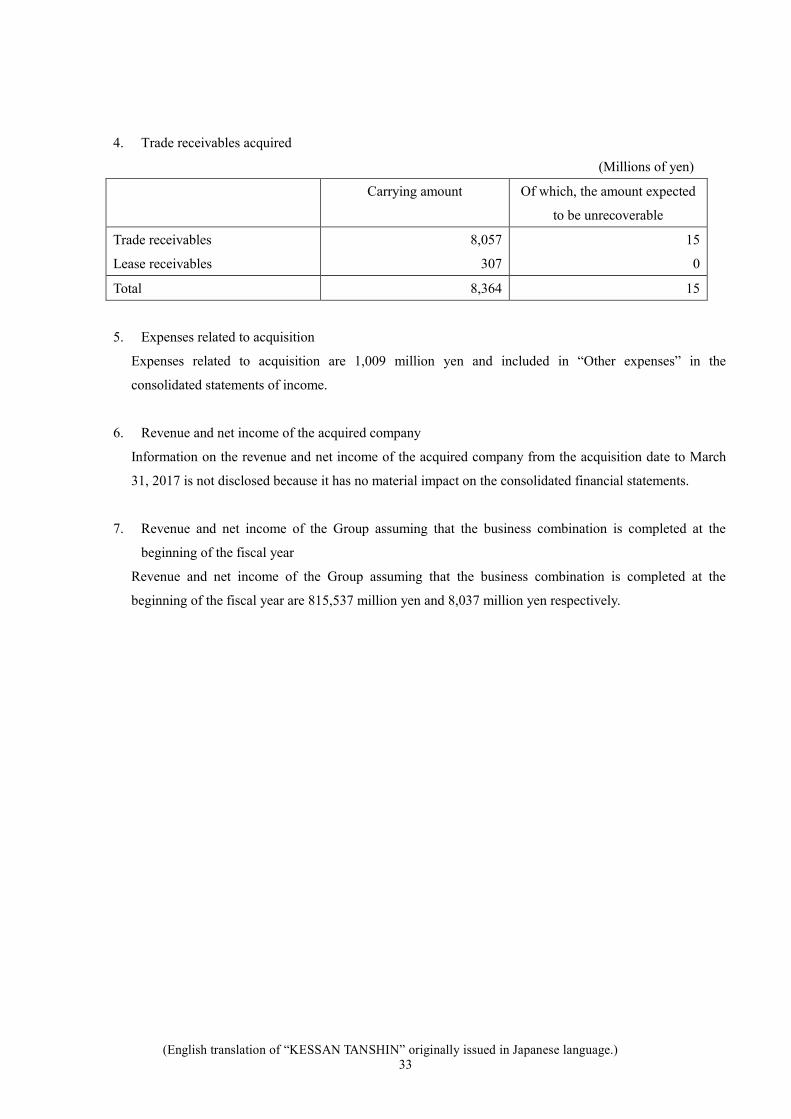
4. Trade receivables acquired
(Millions of yen)
Carrying amount Of which, the amount expected
to be unrecoverable
Trade receivables
Lease receivables
8,057
307
15
0
Total 8,364 15
5. Expenses related to acquisition
Expenses related to acquisition are 1,009 million yen and included in “Other expenses” in the
consolidated statements of income.
6. Revenue and net income of the acquired company
Information on the revenue and net income of the acquired company from the acquisition date to March
31, 2017 is not disclosed because it has no material impact on the consolidated financial statements.
7. Revenue and net income of the Group assuming that the business combination is completed at the
beginning of the fiscal year
Revenue and net income of the Group assuming that the business combination is completed at the
beginning of the fiscal year are 815,537 million yen and 8,037 million yen respectively.
(English translation of “KESSAN TANSHIN” originally issued in Japanese language.) 34
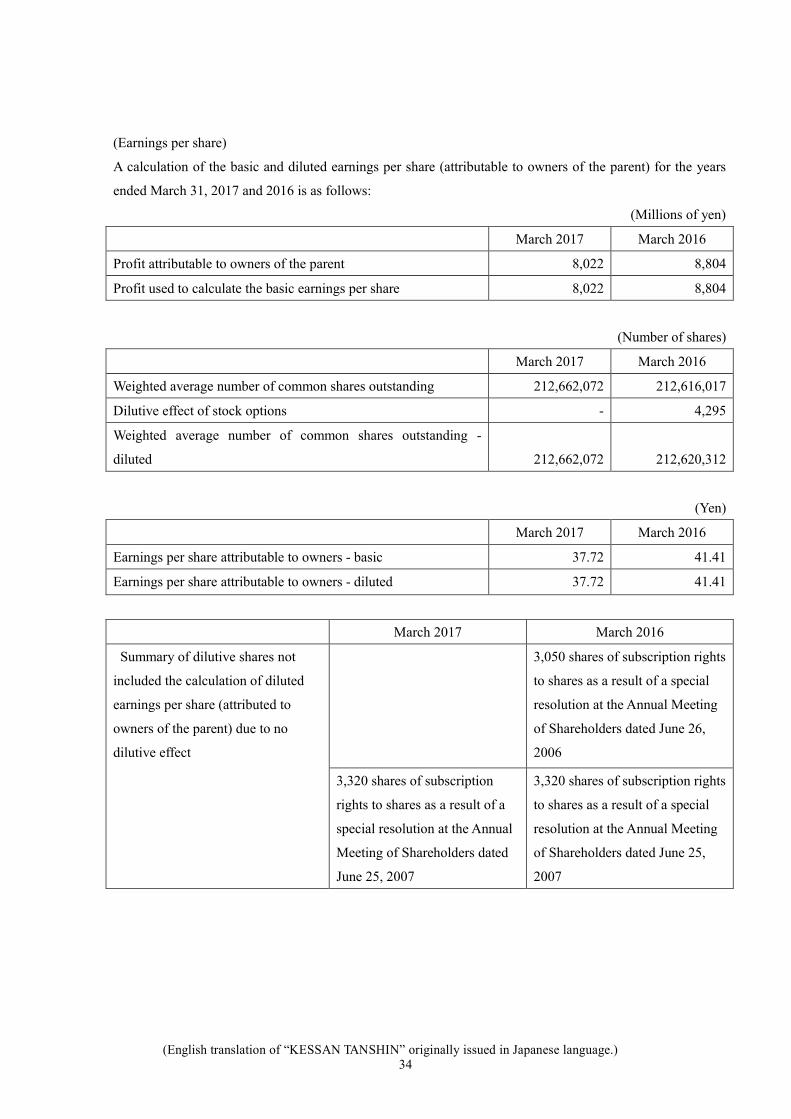
(Earnings per share)
A calculation of the basic and diluted earnings per share (attributable to owners of the parent) for the years
ended March 31, 2017 and 2016 is as follows:
(Millions of yen)
March 2017 March 2016
Profit attributable to owners of the parent 8,022 8,804
Profit used to calculate the basic earnings per share 8,022 8,804
(Number of shares)
March 2017 March 2016
Weighted average number of common shares outstanding 212,662,072 212,616,017
Dilutive effect of stock options - 4,295
Weighted average number of common shares outstanding -
diluted
212,662,072
212,620,312
(Yen)
March 2017 March 2016
Earnings per share attributable to owners - basic 37.72 41.41
Earnings per share attributable to owners - diluted 37.72 41.41
March 2017 March 2016
Summary of dilutive shares not
included the calculation of diluted
earnings per share (attributed to
owners of the parent) due to no
dilutive effect
3,050 shares of subscription rights
to shares as a result of a special
resolution at the Annual Meeting
of Shareholders dated June 26,
2006
3,320 shares of subscription
rights to shares as a result of a
special resolution at the Annual
Meeting of Shareholders dated
June 25, 2007
3,320 shares of subscription rights
to shares as a result of a special
resolution at the Annual Meeting
of Shareholders dated June 25,
2007
(English translation of “KESSAN TANSHIN” originally issued in Japanese language.) 35
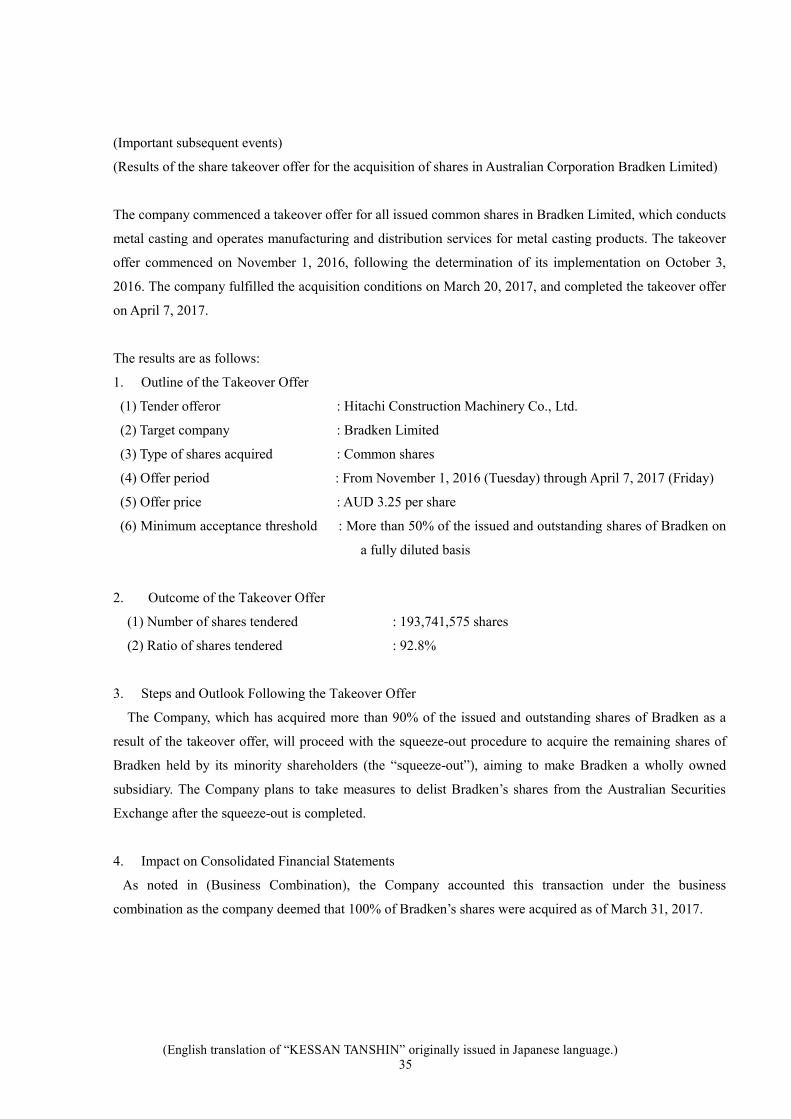
(Important subsequent events)
(Results of the share takeover offer for the acquisition of shares in Australian Corporation Bradken Limited)
The company commenced a takeover offer for all issued common shares in Bradken Limited, which conducts
metal casting and operates manufacturing and distribution services for metal casting products. The takeover
offer commenced on November 1, 2016, following the determination of its implementation on October 3,
2016. The company fulfilled the acquisition conditions on March 20, 2017, and completed the takeover offer
on April 7, 2017.
The results are as follows:
1. Outline of the Takeover Offer
(1) Tender offeror : Hitachi Construction Machinery Co., Ltd.
(2) Target company : Bradken Limited
(3) Type of shares acquired : Common shares
(4) Offer period : From November 1, 2016 (Tuesday) through April 7, 2017 (Friday)
(5) Offer price : AUD 3.25 per share
(6) Minimum acceptance threshold : More than 50% of the issued and outstanding shares of Bradken on
a fully diluted basis
2. Outcome of the Takeover Offer
(1) Number of shares tendered : 193,741,575 shares
(2) Ratio of shares tendered : 92.8%
3. Steps and Outlook Following the Takeover Offer
The Company, which has acquired more than 90% of the issued and outstanding shares of Bradken as a
result of the takeover offer, will proceed with the squeeze-out procedure to acquire the remaining shares of
Bradken held by its minority shareholders (the “squeeze-out”), aiming to make Bradken a wholly owned
subsidiary. The Company plans to take measures to delist Bradken’s shares from the Australian Securities
Exchange after the squeeze-out is completed.
4. Impact on Consolidated Financial Statements
As noted in (Business Combination), the Company accounted this transaction under the business
combination as the company deemed that 100% of Bradken’s shares were acquired as of March 31, 2017.
(English translation of “KESSAN TANSHIN” originally issued in Japanese language.) 36
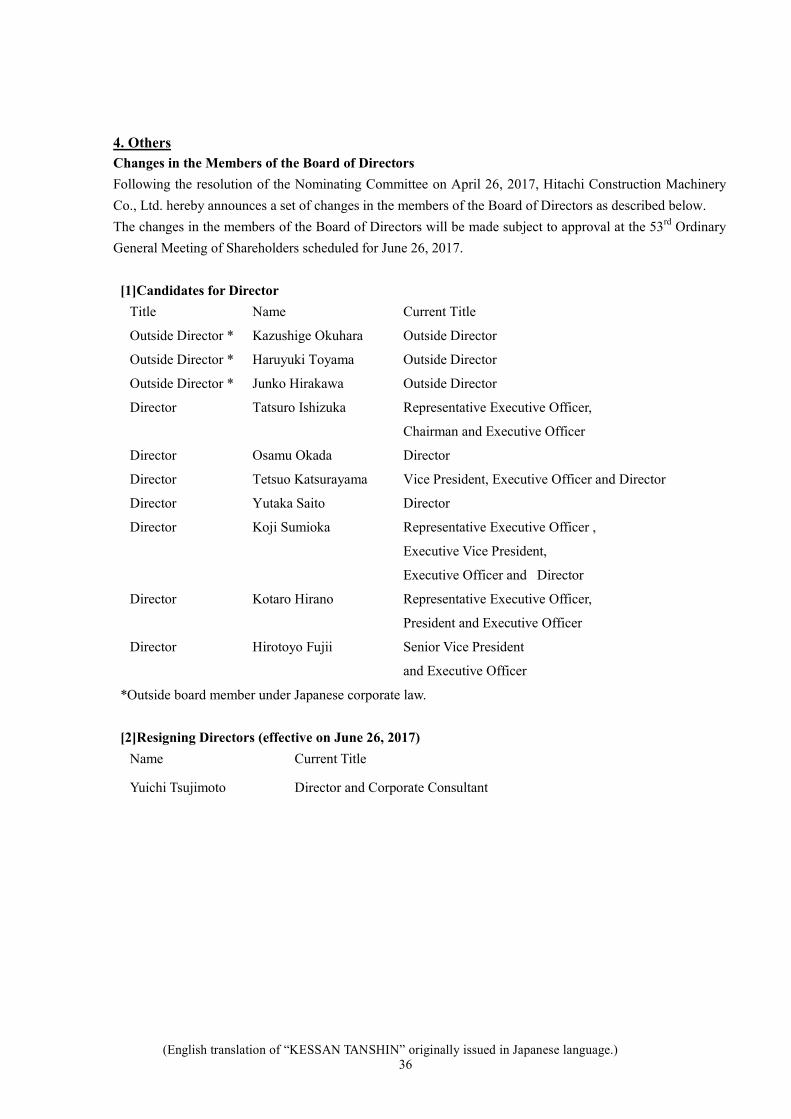
4. Others
Changes in the Members of the Board of Directors
Following the resolution of the Nominating Committee on April 26, 2017, Hitachi Construction Machinery
Co., Ltd. hereby announces a set of changes in the members of the Board of Directors as described below.
The changes in the members of the Board of Directors will be made subject to approval at the 53rd
Ordinary
General Meeting of Shareholders scheduled for June 26, 2017.
[1]Candidates for Director
Title Name Current Title
Outside Director * Kazushige Okuhara Outside Director
Outside Director * Haruyuki Toyama Outside Director
Outside Director * Junko Hirakawa Outside Director
Director Tatsuro Ishizuka Representative Executive Officer,
Chairman and Executive Officer
Director Osamu Okada Director
Director Tetsuo Katsurayama Vice President, Executive Officer and Director
Director Yutaka Saito Director
Director Koji Sumioka Representative Executive Officer ,
Executive Vice President,
Executive Officer and Director
Director Kotaro Hirano Representative Executive Officer,
President and Executive Officer
Director Hirotoyo Fujii Senior Vice President
and Executive Officer
*Outside board member under Japanese corporate law.
[2]Resigning Directors (effective on June 26, 2017)
Name Current Title
Yuichi Tsujimoto Director and Corporate Consultant