History of LVP and Contractility Indicators - SPS Home … · · 2012-12-05History of LVP and...
31
History of LVP and Contractility Indicators: How Did We Get Here? R. Dustan Sarazan, DVM, PhD Vice President & Chief Scientific Officer Data Sciences International (DSI)
Transcript of History of LVP and Contractility Indicators - SPS Home … · · 2012-12-05History of LVP and...
History of LVP and Contractility Indicators:
How Did We Get Here?
R. Dustan Sarazan, DVM, PhD Vice President & Chief Scientific Officer
Data Sciences International (DSI)

Although the general concept of contractility is often understood,
its actual measurement is fraught with problems!
Assumptions and limitations of a contractility index must be understood or misinterpretations are likely
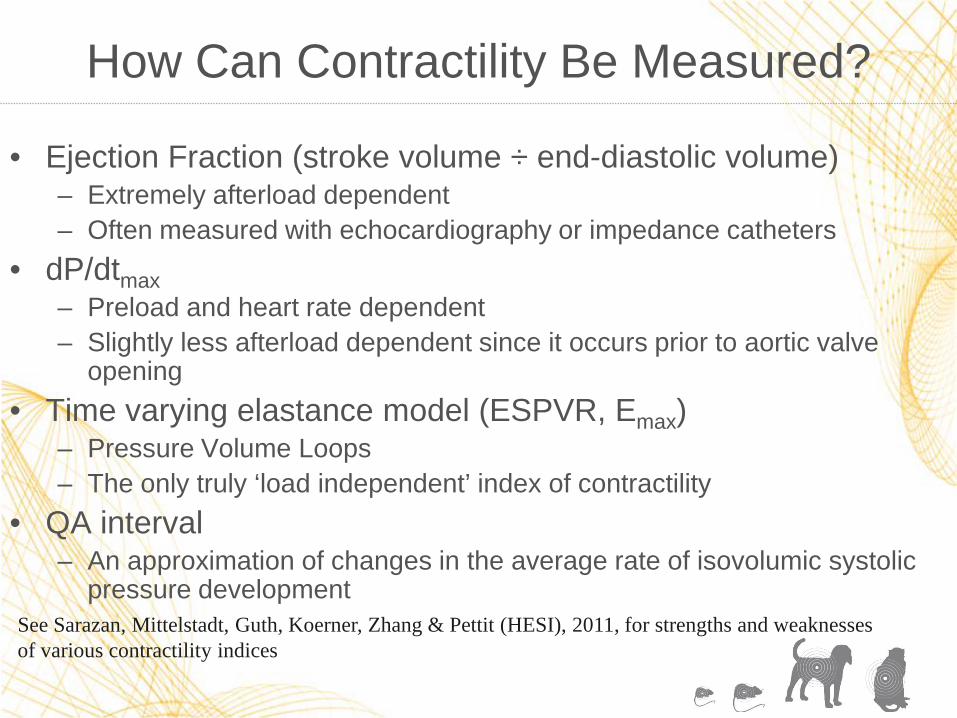
How Can Contractility Be Measured?
• Ejection Fraction (stroke volume ÷ end-diastolic volume) – Extremely afterload dependent – Often measured with echocardiography or impedance catheters
• dP/dtmax – Preload and heart rate dependent – Slightly less afterload dependent since it occurs prior to aortic valve
opening • Time varying elastance model (ESPVR, Emax)
– Pressure Volume Loops – The only truly ‘load independent’ index of contractility
• QA interval – An approximation of changes in the average rate of isovolumic systolic
pressure development See Sarazan, Mittelstadt, Guth, Koerner, Zhang & Pettit (HESI), 2011, for strengths and weaknesses
of various contractility indices

A Focus on dP/dtmax as a Contractility Index
First Derivative (dP/dt)
• Calculated as the differential (lower case ‘d’) in pressure (P) divided by the corresponding differential in time (t), over the smallest possible increment in time. • In calculus, the time increment is infinitely small
• Left Ventricular dP/dtmax is simply the largest value of dP/dt that occurs during a cardiac cycle – Occurs during ventricular systole
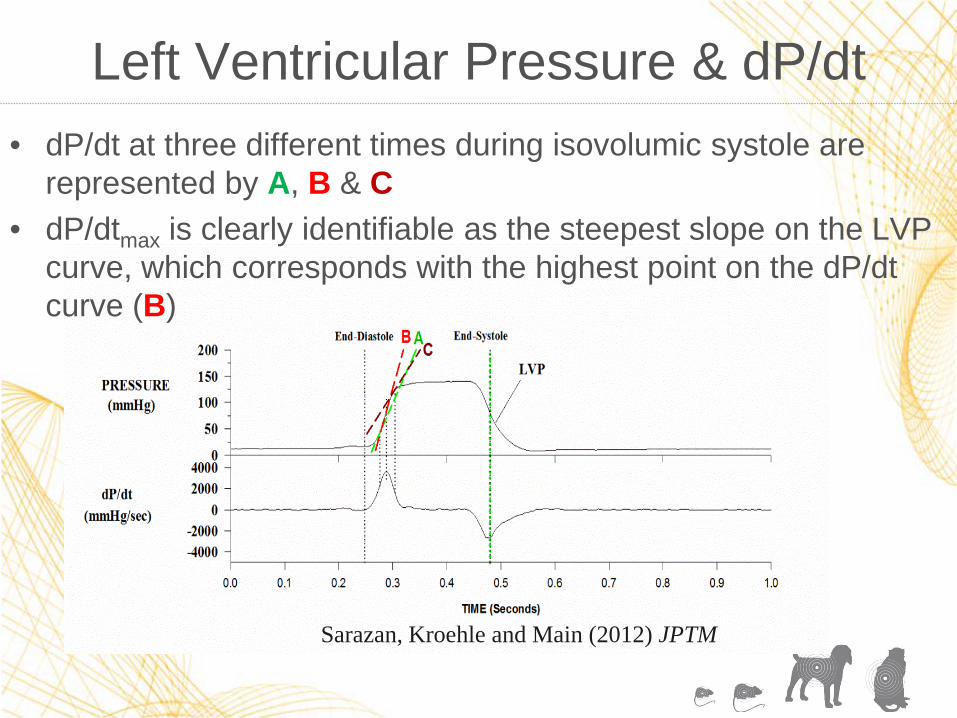
Left Ventricular Pressure & dP/dt • dP/dt at three different times during isovolumic systole are
represented by A, B & C • dP/dtmax is clearly identifiable as the steepest slope on the LVP
curve, which corresponds with the highest point on the dP/dt curve (B)
Sarazan, Kroehle and Main (2012) JPTM
Measurement Of Left Ventricular Pressure
• Digital Resolution • Frequency Response (Bandwidth) • Sample Rate
Digital Resolution (Bits)
• An analog-to-digital converter takes a large number of discrete measurements of a continuous (analog) signal at a fixed sample rate.
• The computer stores these sampled values and the times they occurred
• An approximation of the original signal can be reconstructed by interpolating what the values were between the samples.
• The faithfulness of the reconstructed signal depends on both the digital resolution (bits) and the sample rate.

12-Bit Digital Resolution V
olts
-5
-4
-3
-2
-1
0
1
2
3
4
5
��
TIME (Seconds)
0.0 0.1 0.2 0.3 0.4 0.5 0.6 0.7 0.8 0.9 1.00
2048
4096
0
50
100
150
200mmHg
212 = (12 bits) Sample Rate = 500Hz
Sarazan, Kroehle and Main (2012) JPTM
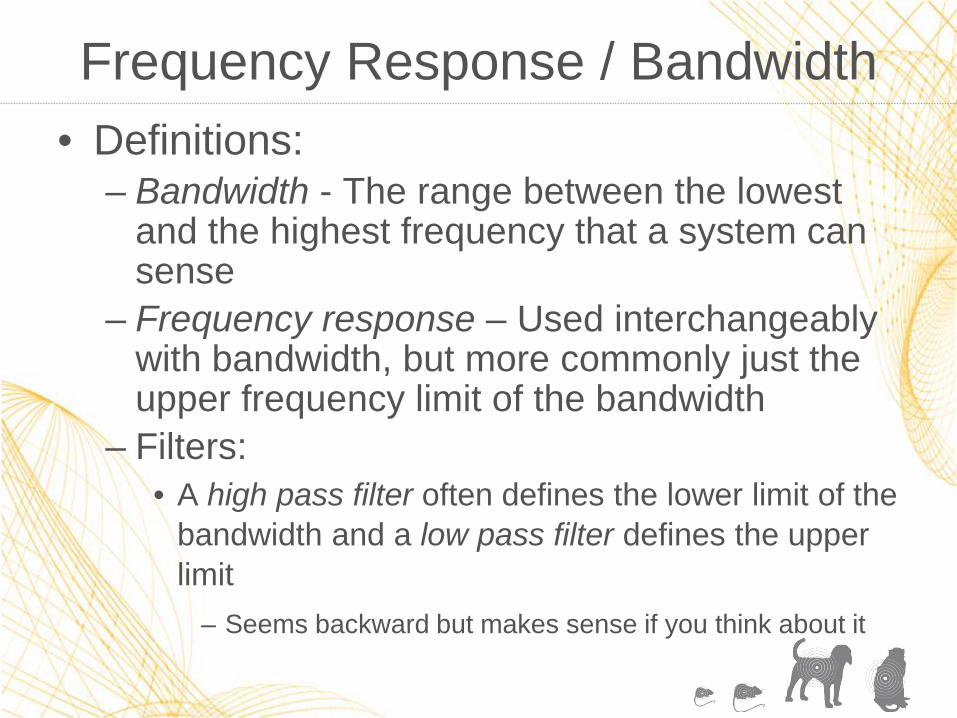
Frequency Response / Bandwidth • Definitions:
– Bandwidth - The range between the lowest and the highest frequency that a system can sense
– Frequency response – Used interchangeably with bandwidth, but more commonly just the upper frequency limit of the bandwidth
– Filters: • A high pass filter often defines the lower limit of the
bandwidth and a low pass filter defines the upper limit
– Seems backward but makes sense if you think about it
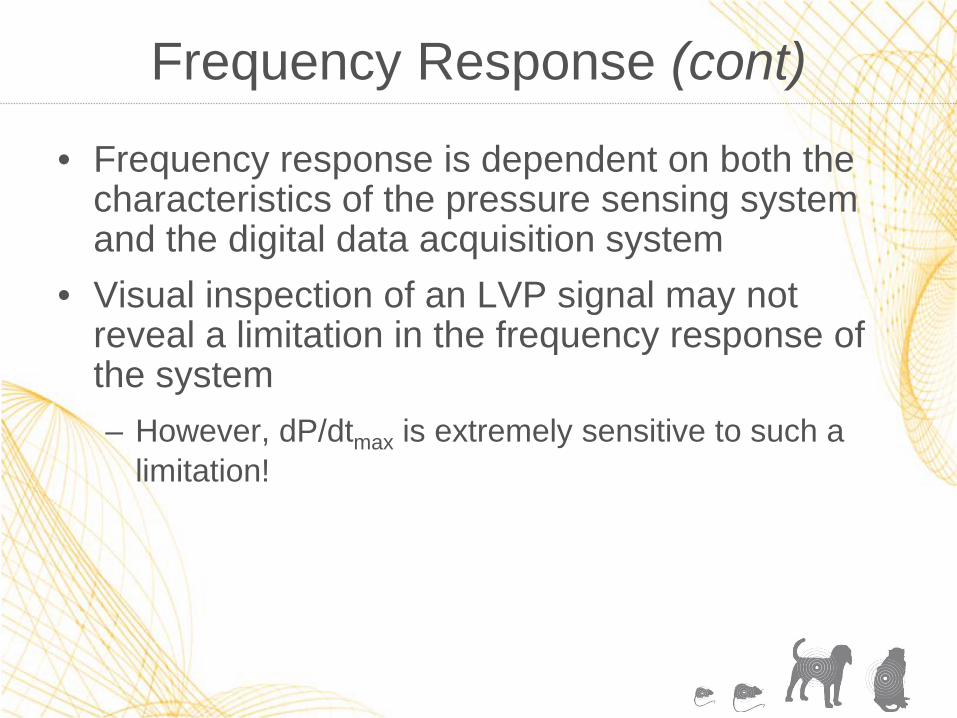
Frequency Response (cont)
• Frequency response is dependent on both the characteristics of the pressure sensing system and the digital data acquisition system
• Visual inspection of an LVP signal may not reveal a limitation in the frequency response of the system – However, dP/dtmax is extremely sensitive to such a
limitation!

Fourier Analysis (Transform)
• Definition: – A method to determine the frequency content of
complex waves by deconstructing them into a series of sine waves at different frequencies (harmonics) and amplitudes
– Also described as analyzing a signal in the frequency domain as opposed to the more common time domain
• As long as the frequency response of the recording system is higher than the highest frequency content in the signal, it can be accurately sensed, recreated and analyzed
So, What Is The Frequency Content of A Left Ventricular
Pressure Signal?
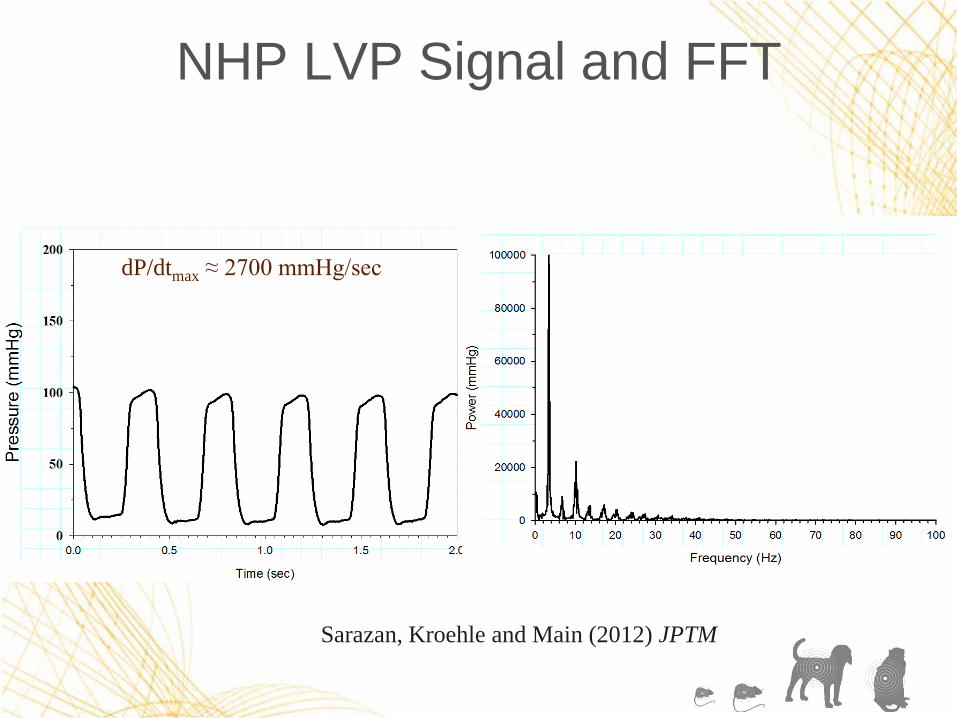
NHP LVP Signal and FFT
Sarazan, Kroehle and Main (2012) JPTM
dP/dtmax ≈ 2700 mmHg/sec
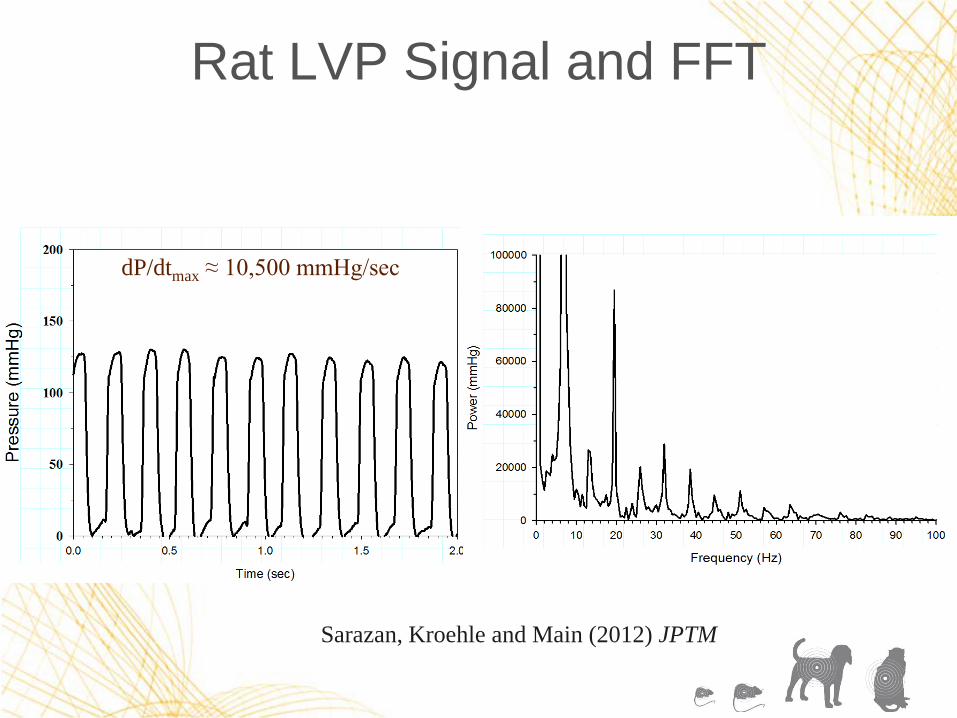
Rat LVP Signal and FFT
Sarazan, Kroehle and Main (2012) JPTM
dP/dtmax ≈ 10,500 mmHg/sec

100Hz Frequency Response Is Adequate, Even For Rodents*
*Barry, W. H., Marlon, A. M., Adams, M., & Harrison, D. C. (1975). Effect of varying differentiator frequency response on recorded peak dP/dt. Cardiovascular Research, 9, 433–439. *Sarazan, R.D., Kroehle, J.P. & Main, B.W. (2012) Left ventricular pressure, contractility and dP/dtmax in nonclinical drug safety assessment studies, Journal of Pharmacological and Toxicological Methods, 66:71-78

Is More Always Better? • Frequency response should be optimized for the signal being
measured • With analog systems, frequency response beyond the meaningful
frequency content of the signal is not problematic; only wasteful – An example is a very expensive audio entertainment system with
frequency response well beyond a human’s hearing ability • However, with digital systems, frequency response well beyond the
meaningful frequency content can be problematic in several ways: 1. High sampling rates are required, which will demand more data
storage capacity (Gigabytes, Terabytes, Petabytes) 2. Software algorithms can trigger on high frequency noise artifacts,
resulting in incorrect results 3. If the sampling rate is not at least 2X* the highest frequency contained
in the signal, incorrect information may be created through a process known as aliasing (Nyquist Theorem)

Digital Sampling Rate
• Again, the digital sampling rate must be at least 2X the highest frequency content of the signal (Nyquist rate) and ideally 5X the most important frequency content – Example: Music is digitized at 44.1kHz, slightly above
the Nyquist rate of 40kHz • Human hearing is limited to 20kHz for young, healthy people • Decreases with age • Music CDs would be inadequate for dogs

A Familiar Example of Aliasing
• So-called “wagon wheel”, or “stagecoach effect”
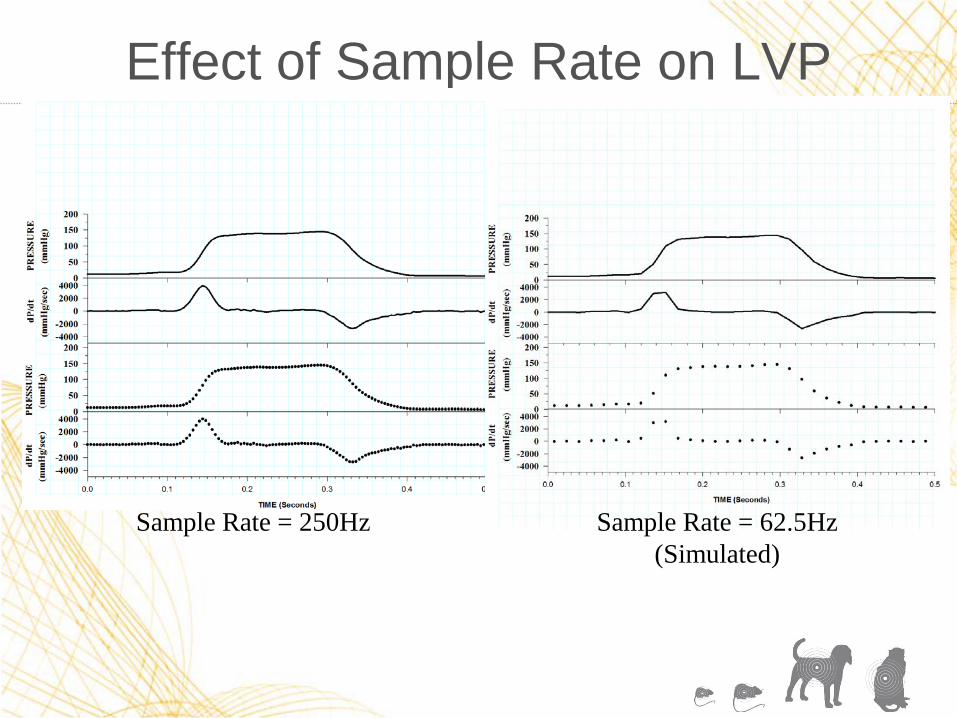
Effect of Sample Rate on LVP
Sample Rate = 250Hz Sample Rate = 62.5Hz (Simulated)

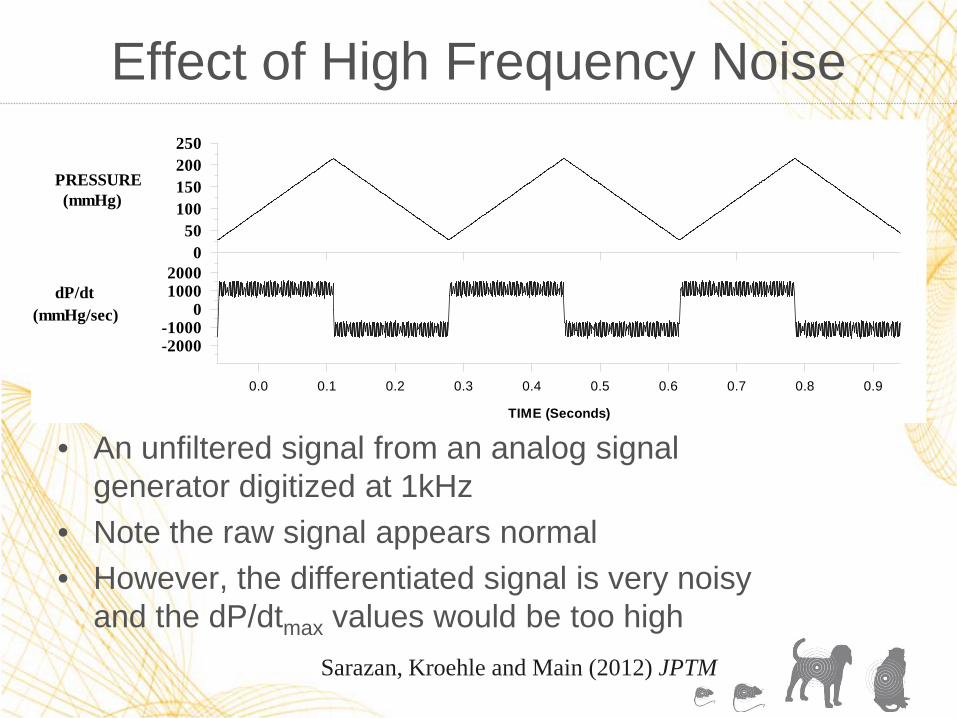
Effect of High Frequency Noise
• An unfiltered signal from an analog signal generator digitized at 1kHz
• Note the raw signal appears normal
(mmHg)PRESSURE
050
100150200250
Effect of High Frequency Noise
• An unfiltered signal from an analog signal generator digitized at 1kHz
• Note the raw signal appears normal • However, the differentiated signal is very noisy
and the dP/dtmax values would be too high
(mmHg/sec)dP/dt
(mmHg)PRESSURE
TIME (Seconds)
0.0 0.1 0.2 0.3 0.4 0.5 0.6 0.7 0.8 0.9
-2000-1000
010002000
050
100150200250
Sarazan, Kroehle and Main (2012) JPTM
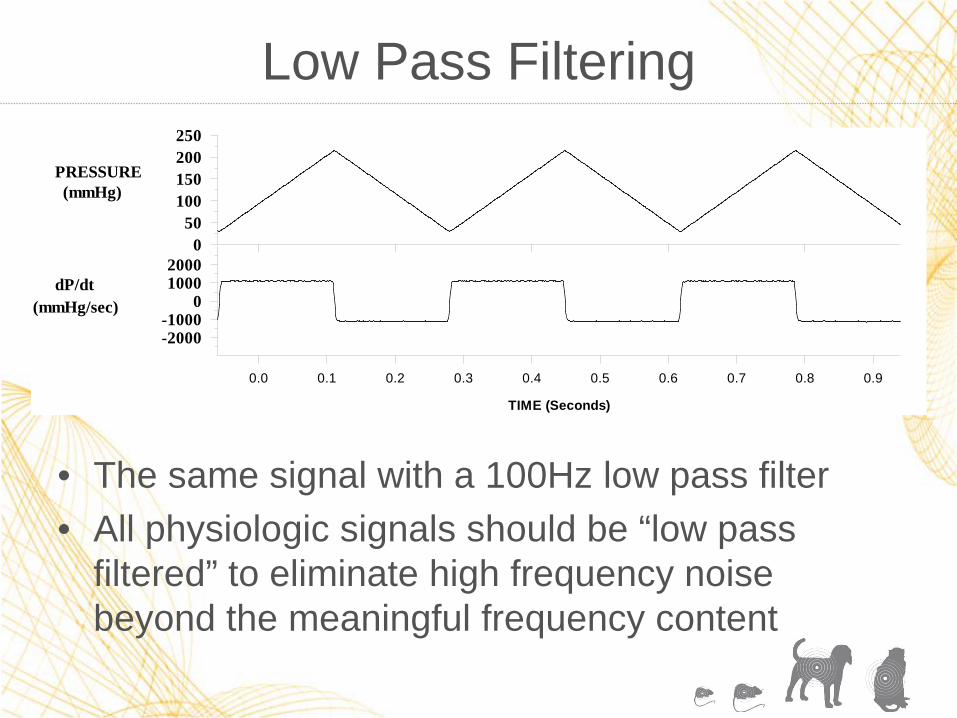
Low Pass Filtering
• The same signal with a 100Hz low pass filter • All physiologic signals should be “low pass
filtered” to eliminate high frequency noise beyond the meaningful frequency content
(mmHg/sec)dP/dt
(mmHg)PRESSURE
TIME (Seconds)
0.0 0.1 0.2 0.3 0.4 0.5 0.6 0.7 0.8 0.9
-2000-1000
010002000
050
100150200250

Conclusions On Frequency Response
• There is no useful information above 100Hz in an LVP signal – Even from normotensive rats
• Any information above 100Hz is high frequency noise that should be eliminated by a low-pass filter
• The digital sampling rate for LVP signals must be at least 200Hz or aliasing will occur – Although they are usually oversampled to improve the
fidelity of the signal
Is The Frequency Response Of Various Pressure Transducers
Appropriate For LVP Measurement?

Pressure Transducers Tested
Statham Millar
DSI

Effect Of Rate On Amplitude
DSI HD-S21 Small Animal Telemetry Device with High Frequency Pressure Sensor
mm
Hg
-30
-20
-10
0
10
20
30
1 Hz (60 beats/min) 2 Hz (120 beats/min) 5 Hz (300 beats/min) 10 Hz (600 beats/min) 20 Hz (1200 beats/min)
DSI D70-PCTP Large Animal Telemetry Device with High Frequency Pressure Sensor
Statham Pressure Transducer with 25 cm Fluid Filled PE Catheter
mm
Hg
-30
-20
-10
0
10
20
30
1 Hz (60 beats/min) 2 Hz (120 beats/min) 5 Hz (300 beats/min) 10 Hz (600 beats/min) 20 Hz (1200 beats/min)
Millar Catheter-Tipped Pressure Transducer
mm
Hg
-30
-20
-10
0
10
20
30
1 Hz (60 beats/min) 2 Hz (120 beats/min) 5 Hz (300 beats/min) 10 Hz (600 beats/min) 20 Hz (1200 beats/min)
mm
Hg
-30
-20
-10
0
10
20
30
1 Hz (60 beats/min) 2 Hz (120 beats/min) 5 Hz (300 beats/min) 10 Hz (600 beats/min) 20 Hz (1200 beats/min)

Bode Plots

Conclusions • Left ventricular dP/dtmax is a sensitive index of changes
in cardiac contractility (inotropic state) if its limitations are understood and controlled
• The highest meaningful frequency content in cardiac left ventricular pressure signals from dogs, NHPs or normotensive rats is ≤ 100 Hz
• Digital data acquisition and analysis systems are adequate to acquire and analyze cardiac LVP signals in commonly used laboratory animals – Assuming ≥ 12-bit resolution and ≥ 200 Hz sample rate
• The current commercially available small animal and large animal telemetry systems have adequate frequency response to faithfully assess the inotropic effects of drugs in laboratory animals

References • Barry, W. H., Marlon, A. M., Adams, M., & Harrison, D. C. (1975). Effect of
varying differentiator frequency response on recorded peak dP/dt. Cardiovascular Research, 9, 433–439.
• Sarazan, R.D., Mittelstadt, S., Guth, B., Koerner, J., Zhang, J. and Pettit, S. Cardiovascular Function in Nonclinical Drug Safety Assessment: Current Issues & Opportunities. Perspectives from the Health & Environmental Sciences Institute (HESI). International Journal of Toxicology, 30(3):272-86. 2011. http://www.ncbi.nlm.nih.gov/pubmed/21527643
• Sarazan, R.D., Kroehle, J.P. and Main, B.W. Left ventricular pressure, contractility and dP/dtmax in nonclinical drug safety assessment studies. Journal of Pharmacological and Toxicological Methods, 66:71-78. 2012. http://dx.doi.org/10.1016/j.vascn.2012.05.009

Thank You!