History of Flotation - AusIMM
353
HISTORY OF FLOTATION A J LYNCH, G J HARBORT & MG NELSON NUMBER 18
Transcript of History of Flotation - AusIMM

HISTORY OF FLOTATION
A J LYNCH, G J HARBORT & M G NELSON
NUMBER 18

History of Flotation
By A J Lynch, G J Harbort and M G Nelson
The Australasian Institute of Mining and Metallurgy Spectrum Series 18
ISBN 978 1 921522 26 0
Front cover images (left to right): Minerals Separation flotation cells at Kadina, South Australia, in 1911; diverter trays on the 12 cell
lead cleaner flotation bank at Zinc Corporation, Broken Hill, in 1955; an FLSmidth 300 m3 flotation cell
in Rio Tinto’s Copperton concentrator.
Published by:
THE AUSTRALASIAN INSTITUTE OF MINING AND METALLURGY Ground Floor, 204 Lygon Street, Carlton Victoria 3053 Australia
Number 18
COPYRIGHT DISCLAIMER© The Australasian Institute of Mining and Metallurgy 2010
No part of this publication may be may be reproduced, stored in a retrieval system or transmitted in any form by any means without the written consent of the publisher.
The AusIMM is not responsible as a body for the facts and opinions advanced in any of its publications.
1. Mineral Adhesion Processes Before 1900 ..............................................................1
2. Zinc and Lead Sulfi des 1902–1920 ........................................................................15
3. Copper Sulfi des 1912–1930 .....................................................................................65
4. Flotation Machines ......................................................................................................93
5. Flotation Circuits ....................................................................................................... 161
6. Industrial Minerals .................................................................................................... 189
7. Coal Flotation ............................................................................................................. 233
8. Early fl otation theory ............................................................................................... 249
Flotation After 100 Years
9. Technological Research ......................................................................................... 273
10. Circuit Control ........................................................................................................... 311
Acknowledgements ........................................................................................................ 337
Index ..................................................................................................................................... 341
C O N T E N T S

Spectrum Series 18 1
THE ANCIENT ART OF MINERAL ADHESION
Herodotus recorded in his Histories that fi ne gold was extracted from mud by stirring the mud with feathers dipped in tar. Gold adhered to the feathers:
… there is in the island a lake, from which the young maidens of the country draw up gold-dust, by dipping in the mud birds’ feathers smeared with pitch. If this be true, I know not; I but write what is said (Herodotos, c 430 BCE).
This reference was probably fact more than rumour. Another adhesion process, fi lm fl otation, was used in the great Laurion silver mines in Greece, which were particularly active during the fi fth and sixth centuries BCE and which fi nanced the growth of Athens and the Grecian wars. In the process at Laurion water was discharged into the top of a high vertical pipe and was partially emulsifi ed with air as it fell, then it fl owed in a sheet of uniform thickness across an inclined plane. Finely ground ore was distributed on the foaming water by a shaking sieve and the metallic particles were retained on the surface and were removed by a blade (Sagui, 1930).
Adhesion may also have been involved in the famed mythological story of the Golden Fleece sought by Jason and the Argonauts. The fl eece was probably an oily sheepskin to which gold adhered when it was immersed in streams containing fi ne abraded gold, which they collected as they cut through gold-bearing rocks in the steep mountains near the Black Sea (mythology often has its roots in reality). Adhesion is still used for collecting gold today although feathers and sheepskins have been replaced by amalgamation plates. These processes work because some minerals in a pulp will adhere to water repellant surfaces or gas bubbles as they collide; others will be unaffected. The adhering particles can be removed from the solid surface or the bubbles and the other particles remain in suspension.
The most important adhesion process is froth fl otation, in which minerals with water repellant surfaces adhere to air bubbles and are removed as froths. Other adhesion processes are used in industry, notably for diamond ores in which ore slurries fl ow over grease tables and the water repellent diamonds adhere to the grease, which is removed and melted to
C H A P T E R 1
Mineral Adhesion Processes
Before 1900

Spectrum Series 18
H I S T O R Y O F F L O TAT I O N
2
separate it from the diamonds. Adhesion processes were described in the 15th and 18th centuries but there was little interest in applying them to the concentration of any mineral except gold until late in the 19th century when grease tables were developed for diamond recovery and fl otation in its various forms was tested.
Muhammad ibn Mansur (1491)
In 1940 Antoine Gaudin, an outstanding fl otation scientist in the mid 20th century, told of an ancient fl otation process which was used to purify the minerals from which the pigment ultramarine was made:
Flotation and related processes are commonly regarded as contemporary developments. Unusual interest is therefore provided by the discovery of a manuscript of the fi fteenth century in which details are set forth for the concentration by oil adhesion of lapis lazuli. The manuscript was written by the Persian scholar Muhammad ibn Mansur in the year 897 of the hegira (1491 of the Christian era) … The substance that is the object of the process is the blue mineral pigment, ultramarine, until recently much used for quality printing. The name of this pigment is lajiward which has given us our word azure (Gaudin, 1940).
Lazurite and azurite were the minerals of interest; they are different shades of blue and
the objective of cleaning was to make them as pure as possible to give brightest colours
when ground for use as pigments. Table 1.1 is Gaudin’s summary of the methods described
by Muhammad to separate the valuable from the waste minerals and concentrate the pure
lazurite and azurite, which were very valuable. He concluded that selective oil-mineral
adhesion was used to concentrate the minerals and that the reagents used in the 15th century
did not differ greatly from their modern counterparts. He considered it likely that the oil-
adhering mineral which formed agglomerates was calcite in the fi rst two cases and azurite
in the last two.
Reagents Procedure Products
Pitch in linseed oil Oil-ore agglutination, kneading, washing Lazurite suspension, calcite agglutinate
Gum-mastic in olive oil Oil-ore agglutination, kneading, washing Lazurite suspension, calcite agglutinate
Resin, frankincense, olive oil or soap Bulk-oil-fl otation? Azurite fl oat, silicate suspension?
Egg yolk Oil granulation and decantation Azurite granules, silicate suspension
TABLE 1.1
Cleaning minerals by oil adhesion in the 15th century (Gaudin, 1940).
Bishop Richard Watson (1785)
In 1731 the French scientist Monsieur Petit:
… discussed the fundamental aspects of fl otation with regard to the selective adhesion of certain solid bodies to air bubbles … There was not a clear idea about the phenomenology behind fl otation. The subject was stated by researchers more as a kind of artistic or curious isolated phenomenon without realising its

Spectrum Series 18
M I N E R A L A D H E S I O N P R O C E S S E S B E F O R E 1 9 0 0
3
applicability. Besides, the diffusion of these fi ndings was scarce. As a consequence of that, knowledge about the fl otation process and other separation operations carrying similar scientifi c bases can be considered nonexistent until the second half of XIX century (Sutulov, 1963).
Petit’s reference to the fundamental aspects of fl otation may have been accidental but Bishop Richard Watson was quite deliberate in his description of froth fl otation and skin fl otation in an essay he wrote about tests he carried out on the reaction of nitric acid with lead ore from the Derbyshire mine in England (Watson, 1781–87):
Let some lead ore be reduced into a fi ne powder, put it into a narrow-bottomed ale glass, fi ll the glass three parts with water (and) a portion of the strong acid of nitre, you may judge the requisite quantity by seeing the solution commence, and you will observe the ore universally covered (by bubbles which) buoy the ore up in large tufts to the surface (p 236), and
Upon 10 ounces of lead ore, cleansed as in the preceding experiments, I poured fi ve ounces of the strongest fuming spirit of nitre; this strong acid not seeming to act upon the ore, I diluted it with fi ve ounces of water; a violent ebullition, accompanied with red fumes, immediately took place; the solution of the ore in this menstruum became manifest, and when it was fi nished there remains fl oating upon the surface of the menstruum a cake of fi ne yellow powder, perfectly resembling common sulphur (p 228).
The fi rst extract refers to froth fl otation and the second to fi lm fl otation. Watson did not
patent the idea of mineral fl otation; perhaps the deterrent was the £310 it would have cost
to fi le a patent. It would be another 100 years before similar observations were made and
became the basis of industrial processes.
Richard Watson was an adventurous scientist (Hole, 2004), the fi rst of many whose cumulative efforts made fl otation into one of the technologies which changed the world. He studied mathematics at Cambridge University and was appointed Professor of Chemistry during 1764–73 ‘without having read a syllable on the subject or seen a single experiment in it’. He salvaged his academic reputation by taking a crash course in chemistry and delivering series of lectures to students, although he was not required to do so. He was elected a Fellow of the Royal Society in 1769. In 1771 he was appointed Regius Professor of Divinity at Cambridge again without formal qualifi cations for the position. Richard Watson was intellectually a renaissance man, one of his publications being ‘an ‘Apology for Christianity’ refuting the views expressed by Gibbon in his ‘Decline and Fall’’ (Smith, 2007). In chemistry ‘he saw the need to bridge the gap between academic chemists and the artisans of industry’, arguing that ‘a man must blacken his own hands with charcoal, he must sweat over the furnace, and inhale many a noxious vapour before he can become a chemist’ (Hole, 2004). He was an authority on lead smelting (Percy, 1870) and his other research interests included coal mining and gunpowder, all relevant to Britain’s industry at the time.
He was Bishop of Llandaff in Wales during 1782–1816 but his enthusiasm for ecclesiastical matters did not seem to match his interest in science. After a confi rmation ceremony at Merthyr Tydfi l:

Spectrum Series 18
H I S T O R Y O F F L O TAT I O N
4
… he gave Richard Crawshay such good metallurgical advice that the grateful ironmaster immediately offered him £5000–£10 000 (£280 000–£560 000 in 2008 currency) for any cause he wished – an offer which the Bishop declined (Smith, 2007).
The reason for his refusal is not known but the good parishioners of the Diocese of Llandaff must still wonder at the loss of this large endowment. He was active in political disputes and suffi ciently aware of the importance of the environment to plant 322 000 larch trees locally. Many unusual scientists were to grace fl otation during the next 200 years, without them it would not have fl ourished, but it was Bishop Richard Watson who observed and wrote that heavy particles could fl oat on water when attached to gas bubbles.
FLOTATION IN THE 19TH CENTURY
William Haynes and the fi rst fl otation patent
Bishop Watson’s description of fl otation seems to have passed without notice until BHP referred to it in 1906 in their legal dispute with Charles Potter about the priority of fl otation patents (Bridges, 1920). There was no further mention of a separation process based on the surface properties of minerals until William Haynes of Holywell in north Wales was granted a patent in 1860 (Haynes, 1860). He claimed that oily surfaces have a greater affi nity for sulfi des than oxides and he proposed a method to concentrate sulfi des by adding fi ve parts of coal tar and resin to nine parts of ground ore, covering the mass with water and mixing it well. Sulfi de agglomerates fl oated and could be separated from the gangue particles, which sank. There was no record of an industrial test, perhaps because the large amount of coal tar and resin used would have been expensive. Lead mining in England, mainly in Derbyshire and Wales, was in decline at that time after 200 years of high production so it is easy to understand both William Haynes’ interest in a new method for extracting lead sulfi des and his diffi culty in fi nding money to test his ideas.
Adolph Bessel and graphite fl otation in Germany
The fi rst commercial process using froth fl otation was devised by Adolph Bessel and tested in Saxony in the late 1860s. Its objective was to remove the gangue minerals from graphite ores to improve the quality of graphite used for making crucibles and it worked because graphite is naturally water repellent. Adolph Bessel was born in Wundsdorf near Hannover in 1835 at a time when present day Germany had many provinces and 36 monarchs. He graduated in Chemistry from the University of Göttingen in 1854 and joined a factory which made refractories and crucibles, fi rst as an employee and later as a part owner. In 1864 the factory was moved to Dresden, which was an iron and steel city and also a centre of science and technology where the Polytechnic, one of Europe’s most famous technical universities, had been established in 1828.
In 1866 Adolph and his brother bought the factory and one of the problems they inherited was that the graphite ores available to them, which came from mines in Bohemia and Bavaria, contained only about 40 per cent graphite and were unsuitable for making crucibles. Based

Spectrum Series 18
M I N E R A L A D H E S I O N P R O C E S S E S B E F O R E 1 9 0 0
5
on their observations about the natural hydrophobicity of graphite they developed a process for producing high-grade graphite by mixing ground ore with water, adding oil and boiling the pulp. Graphite adhered to the bubbles and formed a concentrate on the surface of the suspension that contained about 90 per cent graphite. Their fi rst patent, dated 20 July 1877, referred to the graphite fl oating on bubbles, which were generated by boiling the suspension. Their second patent, dated 12 May 1886, referred to generating the bubbles by decomposition of limestone in an acid solution. Items of particular interest in the patents referred to the use of non-polar substances (oils) as reagents, the signifi cance of the natural hydrophobicity and the method of generation of gas bubbles, ie by boiling or by decomposition of limestone in acid solutions (Graichen et al, 1977).
The Bessel brothers were successful for three reasons: better graphite was required for making crucibles otherwise the factory would have closed, Adolph was a competent scientist and engineer well able to bring science to the solution of industrial problems, and there was an intellectual environment in the region which encouraged new ideas. Adolph’s achievements were recognised when he was awarded the ‘Wöhler Medal in Gold’ in 1878. This medal commemorated the research of Professor Wöhler, who isolated the elements aluminium, beryllium, silicon and boron and who contributed much in many other areas of chemistry. The Bessel fl otation process was ignored outside Germany until it was rediscovered when the legal battles about fl otation patents occurred a generation later.
Carrie Everson and sulfi de fl otation in the USA
About the time that Adolph Bessel was awarded the Wöhler Gold Medal, Dr and Mrs Everson in Chicago had fi rsthand experience of the diffi culty of recovering metal sulfi des. Their lesson came from a heavy investment in a wildcat mining company that failed because of low mineral recovery, so they started to think about mineral recovery processes (Anon, 1916). Carrie Everson was born in 1842 in Massachusetts and while still a student she married Dr William Everson in 1864. There were fi ve children, four of whom died before the age of 12. Carrie was interested in science and studied botany, chemistry and medicine while William had a successful medical practice. In 1878 William invested US$40 000 (about US$800 000 in 2005 currency value) in the mining company which failed and this turned Carrie’s interest to mineralogy to attempt to understand the reason (Marshall Cavendish Corporation, 2008). Her experiments showed that oils and fatty substances have a chemical affi nity for mineral particles and she developed a process to concentrate sulfi de minerals in which she ground ore to less than 150 microns, mixed it with oils or fatty substances, immersed it in water with acid and agitated it by hand to fl oat the mineral. Her 1885 patent referred to four ounces of ore, ten drams (17.7 grams) of water and two drams of acid and oil in the ratio 2:15. The mineral fl oated in a scum and could be washed from the waste. The use of acid and oil to achieve separation was important but entrained air must have been partly responsible for fl otation since insuffi cient oil was used for buoyancy. William Everson worked with Carrie in these experiments but no progress had been made in selling the process by the time he died in 1889. In 1890 Carrie was backed by Thomas Criley to carry out larger scale tests and demonstrate the process to mining companies. Successes were reported in Custer County, Colorado and in Baker City, Oregon, but Thomas Criley died before being able to negotiate the commercial use of the process.

Spectrum Series 18
H I S T O R Y O F F L O TAT I O N
6
Carrie soon put this disappointment behind her and in 1892 she and Charles Hebron
patented a process in which particles of crushed ore were coated with grease, water was
added and air was introduced to create effervescence. The particles with an affi nity for
oil fl oated with the air and others sank. Again the process gave reasonable results in a
demonstration plant but failed commercially because there was no major problem for which
it was the solution. Her patents described all the essential principles of fl otation but the costs
she incurred meant that she did not have the fi nancial support to continue her work further
so she went to Colorado to teach at the State Reformatory for Girls, and she later worked
in obstetrical nursing. Her son wrote that she was modest and declined to accept credit for
her discovery, ‘the hungry, sick and affl icted were ever in her prayers’ and her desire for
the fi nancial success of her labours was prompted by her stronger desire to be of service to
humanity (Everson, 1916). She died in 1914 knowing that her scientifi c efforts had not been
in vain and that fl otation was being used on a large scale in Montana and Arizona.
There were many myths about Carrie Everson; that she was a spinster school teacher, that
she discovered fl otation while washing sample bags for her brother and that her husband
discovered fl otation. The fact is that she was a fi ne scientist who carried out experiments in
a laboratory and had the enterprise to arrange for her conclusions to be tested in practice.
Later assessments of her work were:
All the salient methods of the fl otation method as it is used today are accurately
described in Everson’s patent, and with such clearness and distinctness that anyone
of ordinary skill in the treatment of ores can, by following the instructions in Miss
Everson’s patent, easily produce the results being secured at Broken Hill and
elsewhere. That her invention was quiescent for a number of years does not argue
any lack of completeness or perfection. The real reason for its lack of commercial
application was its startling departure from previous known methods … Her
process, therefore, met with ridicule where it needed only ordinary intelligence in
the application thereof (Hoover, 1914) and … as a metallurgist she was a quarter
of a century in advance of her profession (Megraw, 1918).
Hezekiah Bradford and fi lm fl otation
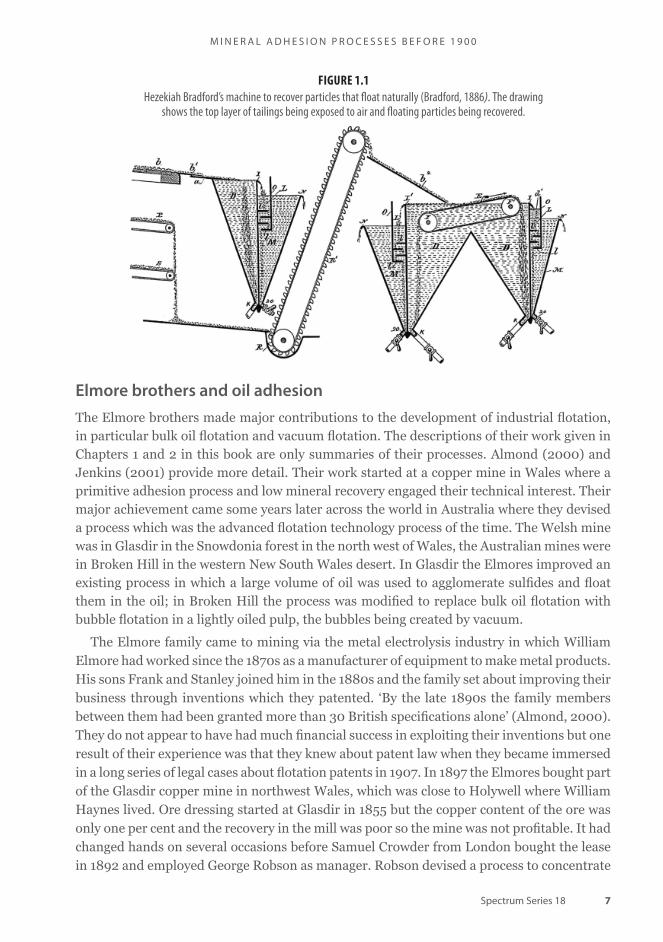
Interest in using the surface properties of minerals as a basis for concentration was increasing,
albeit slowly. In 1886 Hezekiah Bradford of Pennsylvania patented equipment (shown in
Figure 1.1) that was designed to collect valuable fi ne particles fl oating on the surface of
tailings pulps fl owing from gravity concentrators (Bradford, 1886). The fi nes which fl oated
were causing a loss of valuable minerals, in particular of very fi ne gold. Bradford commented
that these particles appeared to possess some peculiar quality which repelled the water from
their surfaces, especially when they were exposed even momentarily to atmospheric air.
There is no evidence that Bradford’s invention was used commercially; perhaps the value of
extra recovery did not cover the cost of the extra equipment, even with gold. But machines
built later by Auguste De Bavay in Australia and Arthur MacQuisten in the USA used the
same principle and were successful in recovering fi ne sulfi des.
Spectrum Series 18
M I N E R A L A D H E S I O N P R O C E S S E S B E F O R E 1 9 0 0
7
Elmore brothers and oil adhesion
The Elmore brothers made major contributions to the development of industrial fl otation, in particular bulk oil fl otation and vacuum fl otation. The descriptions of their work given in Chapters 1 and 2 in this book are only summaries of their processes. Almond (2000) and Jenkins (2001) provide more detail. Their work started at a copper mine in Wales where a primitive adhesion process and low mineral recovery engaged their technical interest. Their major achievement came some years later across the world in Australia where they devised a process which was the advanced fl otation technology process of the time. The Welsh mine was in Glasdir in the Snowdonia forest in the north west of Wales, the Australian mines were in Broken Hill in the western New South Wales desert. In Glasdir the Elmores improved an existing process in which a large volume of oil was used to agglomerate sulfi des and fl oat them in the oil; in Broken Hill the process was modifi ed to replace bulk oil fl otation with bubble fl otation in a lightly oiled pulp, the bubbles being created by vacuum.
The Elmore family came to mining via the metal electrolysis industry in which William Elmore had worked since the 1870s as a manufacturer of equipment to make metal products. His sons Frank and Stanley joined him in the 1880s and the family set about improving their business through inventions which they patented. ‘By the late 1890s the family members between them had been granted more than 30 British specifi cations alone’ (Almond, 2000). They do not appear to have had much fi nancial success in exploiting their inventions but one result of their experience was that they knew about patent law when they became immersed in a long series of legal cases about fl otation patents in 1907. In 1897 the Elmores bought part of the Glasdir copper mine in northwest Wales, which was close to Holywell where William Haynes lived. Ore dressing started at Glasdir in 1855 but the copper content of the ore was only one per cent and the recovery in the mill was poor so the mine was not profi table. It had changed hands on several occasions before Samuel Crowder from London bought the lease in 1892 and employed George Robson as manager. Robson devised a process to concentrate
FIGURE 1.1
Hezekiah Bradford’s machine to recover particles that fl oat naturally (Bradford, 1886). The drawingshows the top layer of tailings being exposed to air and fl oating particles being recovered.

Spectrum Series 18
H I S T O R Y O F F L O TAT I O N
8
the copper sulfi des by mixing oil into an ore-water pulp to agglomerate fi ne copper sulfi de particles and collect the agglomerates. The idea was good but the cost was high because three tons of oil were used per ton of ore and much oil was lost during processing. When the Elmores became part owners the oil process was more successful because they had the engineering skills to reduce oil consumption.
In 1898 Francis Elmore applied for a patent for a process in which he mixed ore ground to –0.5 mm with its own weight of oil and several times its weight of water in a slowly revolving drum and ran the mass into a spitzkasten (Elmore, 1900). The oil-sulfi de agglomerates fl oated and the gangue sank. Figure 1.2 shows the drawing of the Elmore tube in the patent and the plant built at Glasdir in which a 50 tons per day Elmore tube circuit was installed in 1899. Early results must have been encouraging since a favourable report was received from a consultant commissioned to investigate the process. The feed contained 1.12 per cent copper, 24.5 ppm silver and 1.5 ppm gold and metal recoveries in the concentrate were 70 per cent of the copper, 65 per cent of the silver and 69 per cent of the gold. The Elmore brothers treated several thousand tons of ore at Glasdir by bulk oil fl otation; it was a technical success but an economic failure because a large volume of high cost oil was required per ton of ore and the low-grade ores in Wales did not yield enough mineral concentrate to provide a reasonable profi t. Trials of the bulk oil fl otation process in other countries were also unsatisfactory economically. Despite its problems the bulk oil fl otation process was an important milestone on the road to froth fl otation.
FIGURE 1.2
A sketch of the Elmore tube in the patent (Elmore, 1900) and the plant at Glasdir where Elmore tubes were used (Jenkins, 2001).In each tube oil was mixed into the pulp, mineral sulfi des agglomerated, and the agglomerates fl oated in the low density oil.
The Elmore brothers and their colleagues set up the Ore Concentration Syndicate Ltd to sell the bulk oil process. To demonstrate it they built a plant in East London with a capacity of 25–30 tons per day (Mouat, 1996) and gave complete access to all who expressed interest as licensees. Engineers who later formed Minerals Separation visited the plant and discussed the process amicably with the inventors but they soon promoted a rival fl otation process. A disagreement about proprietary rights developed between the Elmores and Minerals Separation. This came to a head at Broken Hill and will be discussed in Chapter 2.

Spectrum Series 18
M I N E R A L A D H E S I O N P R O C E S S E S B E F O R E 1 9 0 0
9
The Elmore process was discussed at a meeting on fl otation held by the Institution of Mining and Metallurgy in London in 1900:
At that meeting several references were made to the fact that the difference in specifi c gravity between the air and the water gave a fl otative margin of 10% yet the oil was loaded to as much as 28% … Of course we see now that all of them failed at that time to detect the part played by the air which was entrained with the oil and the water while they were being mixed in a revolving drum (Rickard, 1916).
The Elmores improved fl otation at the Glasdir plant but oil was excessive and had to be reduced, so they invented a cell in which a small amount of oil was added to the ore pulp to enhance mineral-air adhesion and sulfi des were fl oated by attachment to air bubbles. They took it to Broken Hill in 1906 to test it on the mountains of zinc-rich tailings accumulated in the dumps and this work will be discussed in the next chapter.
The Institution of Mining and Metallurgy meeting on fl otation in London in 1900 increased interest in the fl otation of sulfi de ores, and one engineer who took note of the discussions was Alcide Froment who had worked with the Elmore process at the lead mines in Traversella in northern Italy. He knew the economic value of better recovery of fi ne sulfi de particles and his experiments with gas bubbles in mineral sulfi de pulps led to his conclusions that:
… sulphide particles moistened by fatty substances tend to unite as spherules and fl oat upon the surface of water and that the rapidity of the formation of the spherules and their ascension is in direct ratio to the quantity of gas produced in the pulp in a given time (Froment, 1902).
Froment’s sulfi des were collected as spherules from the surface of the pulp. His process involved mixing a small amount of oil with three parts of water and one part of ore and adding acid to generate gas. He sold his patent to Minerals Separation in late 1903 but sadly died in 1904. While the Elmores were wrestling with bulk oil fl otation in Glasdir, Arthur Cattermole in London was developing another process for concentrating sulfi des using oil. His approach was the opposite of fl otation; he added just enough oil to agglomerate fi ne sulfi de particles, which sank, then he washed away the waste and collected the agglomerates. This process will be discussed in Chapter 2; suffi ce it to write here that his process was not used at a mine in England but metallurgists were quick to test it in Broken Hill as a possible method for concentrating marmatite to avoid excessive use of acid when carbonates in the feed were high.
1900 – THE NEED FOR A NEW CONCENTRATION PROCESS
Lead had been the most widely used non-ferrous metal since Roman times and mineral processing technology in the 19th century was most advanced in lead concentration plants. The fl ow sheet of a lead ore concentration circuit in a new plant built at Clausthal in Germany and operating in 1870 is given in Figure 1.3 and the concentrator building and equipment are shown in Figures 1.4 and 1.5. In 1870 mineral processing technology had been stagnant for 300 years, the concentration processes used being the same as Agricola (1556) described 300 years previously – hand picking and gravity separation, neither of which was effi cient with fi ne particles.

Spectrum Series 18
H I S T O R Y O F F L O TAT I O N
10
FIGURE 1.3
Flow sheet of the 500 tons per day lead concentrator at Clausthal mine in 1871 (Randolph, 1877; Dennis, 1963).
FIGURE 1.4
Clausthal mine and concentrator in 1870 (Balck, 2001).
It was convenient to ignore the minerals lost in tailings while metal prices were high and metal demand low, but by 1870 metal demand was increasing due to rising population and to new uses for metals such as copper for the transmission of electricity and zinc for hot dip galvanising. The link between population and metal demand during the last 150 years is given in Table 1.2.
Meeting the demand for metals was only possible by depleting further the rich coarser-grained ores which had supplied the furnaces of the industrial revolution for many years and engineers then had no choice but to turn to the fi ne-grained, low-grade ores which they had ignored for so long. All sorts of new techniques were brought to bear in the struggle to bring these diffi cult orebodies to heel, and mining and processing technologies were transformed.

Spectrum Series 18
M I N E R A L A D H E S I O N P R O C E S S E S B E F O R E 1 9 0 0
11
FIGURE 1.5
Gravity machines and hand picking in the Clausthal concentrator in 1870 (Balck, 2001).
1850 1875 1900 1925 1950 1975 2000
Population 1270 1430 1650 1960 2400 4073 6124
Copper, kt 55 130 495 1530 2380 6740 13 200
Lead, kt 130 320 749 1410 1640 3440 3200
Zinc, kt 65 165 479 1030 1970 5010 8790
Pig iron, Mt 1.3 12.2 66.5 76.9 134 479 573
TABLE 1.2
World population (millions) and the demand for metals 1850–2000.
The story of the dramatic advances in mineral technologies between 1875 and 1900 is contained in Table 1.3, but there was a serious problem – the advances may have increased mining and processing rates but they did little to reduce the losses of fi ne sulfi de minerals in plant tailings, and fi ne-grained sulfi de ores were becoming increasingly important. The question was – could a new process be developed which was effective for concentrating fi ne particles of zinc, lead and copper minerals? Flotation turned out to be the solution, ‘It is not overstating the case to claim that fl otation’s development was of central importance to the smooth functioning of the global economy’ (Mouat, 1996).
Flotation did not happen quickly or easily. It was tried in a small way at several sites during the last quarter of the 19th century but it needed the huge fi nancial inducement of the tailings dumps at Broken Hill to draw the attention of the fi nancial and engineering worlds.

Spectrum Series 18
H I S T O R Y O F F L O TAT I O N
12
Even in 1910 after zinc minerals were fl oated successfully from tailings at Broken Hill it must have been hard for engineers to believe that a massive industry could be built on fl otation because they knew that fl otation was temperamental and could not separate the lead and zinc sulfi des, which was regarded as the most diffi cult problem encountered in concentration. In 1910 metallurgists were aware of the fl otation process but it was mysterious and there was no comprehension of the extent to which it could be used. Theodore Hoover caught the sentiment of the day well when he wrote that:
Flotation was a startling departure from previous known methods. The only previous authentic case where substances heavier than water had been made to fl oat was the occasion of Elisha’s miracle with the axe reported in the Book of Kings and mining and metallurgical engineers are not great believers in miracles (Hoover, 1914).
The miracle of 100 years ago has now become a versatile process in which billions of tonnes of ore are concentrated annually to provide feed to metal furnaces, to make fertilizers for agriculture, to purify industrial minerals, to extract waste from industrial pulps, and for many other purposes. The purpose of this book is to tell the story of how fl otation became one of the great technical achievements of the 20th century.
FLOTATION AT THE END OF THE 19TH CENTURY
By 1900 interest was growing in fl otation and 15 notes were published on the subject in technical journals during that year. This was not surprising because mineral processing was one of the main technologies of the day and there were many inventions which attracted the interest of engineers, such as cyanidation in 1889, magnetic separators in 1895, Wilfl ey vibrating tables in 1896, electrostatic separators in 1901 and many new crushing and grinding machines. But serious investment in a process which would transform an entire production system had to wait for a major economic incentive such as much better mineral recovery from a huge resource. It happened that this was exactly the problem which had been developing since 1890 in the silver–lead–zinc mines in the remote and inhospitable region of Broken Hill in western New South Wales. The ore deposits there were immense and high grade, but the sulfi de minerals which contained the metals were fi ne grained by the standards of the day and gravity concentration resulted in high metal losses in the tailings. By 1900 these losses were such a large proportion of the potential revenue that they jeopardised the future of the mines, so there was strong economic incentive to reduce them. How this led to a new process is described in Chapter 2.
1875 1900
Blasting Black powder Dynamite
Drilling Hand hammers Steam drills
Transportation Hand carts Steam shovels
Crushing/grinding Stamp mills Crushers/ball mills
Concentration Buddles/sluices Vibrating tables
TABLE 1.3
Mineral technologies in 1875 and 1900.

Spectrum Series 18
M I N E R A L A D H E S I O N P R O C E S S E S B E F O R E 1 9 0 0
13
REFERENCES
Agricola, G, 1956. De Re Metallica, Book VIII, translated from the fi rst (1556) Latin edition by H C Hoover and L H Hoover and published in 1950 (Dover Publications: New York).
Almond, J K, 2000. The Elmore Brothers and the fl otation process for separating minerals, Historical Metallurgy, 34:31–46.
Anon, 1916. Carrie Jane Billings Everson, Engineering and Mining Journal, 101(3):129–132.
Balck, F, 2001. Das Große Clausthal: Ansichteneiner Industrielandschaft und ihrer menschen in Vergansheit und Gegenwart (Verlag Fingerhut: Clausthal Zellerfi eld).
Bradford, H, 1886. Method of saving fl oating materials in ore-separation, US Patent 345951, 20 July.
Bridges, R, 1920. From Silver to Steel: The Romance of the Broken Hill Proprietary, pp 202–204 (G Robertson & Co: Melbourne).
Dennis, W H, 1963. A Hundred Years of Metallurgy, p 21 (Duckworth: London).
Elmore, F E, 1900. Apparatus for separating metallic from rocky constituents of ores, US Patent 653340, 10 July.
Everson, J L, 1916. Carrie Jane Everson, Inventor, Mining American, 15 January.
Froment, A, 1902. Improvements relating to the concentration of ores, British Patent 12778.
Gaudin, A M, 1940. Mineral concentration by adhesion in the XV century, Engineering and Mining Journal, 141(10):43–44.
Graichen, K, Hanisch, J, Schubert, H, Steiner, K-D, Tanneberger, C and Wachtler, E, 1977. Die Gebruder Bessel und die Anfange der fl otativen Aufbereitung, Neue Bergbautechnik, 7(10):October.
Haynes, W, 1860. British Patent 488 (reported in Hoover, 1914).
Herodotus, c 430 BCE. Ancient History Sourcebook – On Libya, from The Histories, Book 4, 42–43 [online]. Available from: <http://www.fordham.edu/halsall/ancient/herod-libya1.html> [Accessed: 11 July 2009].
Hole, R, 2004. Richard Watson, in Oxford Dictionary of National Biography (Oxford University Press).
Hoover, T J, 1914. Concentrating Ores by Flotation, second edition, pp 2–41 (The Mining Magazine: London).
Jenkins, P R, 2001. The Elmore Mystery: The Inventive Elmore Family and Their Role in the Development of the Flotation Process for Mineral Concentration, frontispiece (Dragonwheel Books: West Sussex).
Marshall Cavendish Corporation, 2008. Inventors and inventions [online]. Available from: <http://www.books.google.com/books?isbn 0761477640> [Accessed: 27 May 2009].
Megraw, H A, 1918. The Flotation Process, second edition, pp 5–8 (McGraw Hill Book Company: New York).
Mouat, J, 1996. The development of the fl otation process: Technological change and the genesis of modern mining 1898–1911, Australian Economic History Review, 36(1)3–31.
Percy, J, 1870. The Metallurgy of Lead, pp 214–215 (John Murray: London).
Randolph, J C F, 1877–78. The new works at Clausthal for dressing ores, AIME Transactions, 6:470– 491.
Rickard, T A, 1916. The Flotation Process, pp 9–52 (Mining and Scientifi c Press: San Francisco).
Sagui, C L, 1930. Economic geology and allied sciences in ancient times, Economic Geology, 25:65– 86.
Smith, C, 2007. Personal communication from Venerable Christopher Smith, Archdeacon of Morgannwg.

Spectrum Series 18
H I S T O R Y O F F L O TAT I O N
14
Sutulov, A, 1963. Flotacion De Minerales, p 17 (Instituto de Investigationes Tecnologicas Concepcion).
Watson, R, 1781–7. Chemical Essays (fi ve volumes), pp 228, 236.

Spectrum Series 18 15
THE SILVER–LEAD–ZINC ORE DEPOSIT AT BROKEN HILL
The Broken Hill orebody was one of the great metal deposits in the world. It was 7.5 km long,
1600 m deep, up to 250 m wide and its 284 Mt of ore contained 28 Mt of lead and 38 Mt
of zinc (Plimer, 2004). It outcropped near its centre and plunged north and south. During
1800 million years geological processes exposed the top of the orebody and the primary
sulfi des were oxidised to form a secondary zone 80–180 m deep. It was rich in cerussite
(lead carbonate) and cerargyrite (silver chloride):
The shape, the deep oxidation of the central outcropping portion and the resulting
‘broken hill’, beneath which was found the rich secondary silver, are all so much
part of the Broken Hill story (King, 1989).
Charles Rasp pegged blocks 10–16 in September 1883 and BHP was the syndicate formed
to work his leases. It started mining the outcrop on Block 13 in 1885 and other companies
soon followed by pegging adjacent leases and starting their own mines.
BHP increased ore production when the high silver content of its ore became evident and during its fi rst three years it produced seven million ounces of silver and 28 000 tons of lead.
C H A P T E R 2
Zinc and Lead Sulfides1902–1920
FIGURE 2.1
A sketch of the Broken Hill orebody (Kearns, 1982).

Spectrum Series 18
H I S T O R Y O F F L O TAT I O N
16
Its profi t exceeded £1.5 million, but the good times could not last. High volume mining depleted the ore in the rich secondary zone which contained coarse lead and silver and it had to be replaced by ore from the primary zone which contained galena and marmatite. The metal content was high but the minerals were relatively fi ne grained and the best that could be done was to recover 70 per cent of the lead, 50 per cent of the silver and ten per cent of the zinc in concentrates. The silver and zinc lost in tailings could not be separated from rhodonite and garnet by gravity. But the ore was so rich that Broken Hill became a metallurgical laboratory as companies wrestled with methods for recovering all the metals from the mined ore and the accumulated tailings. BHP was particularly active in building new and better mineral processing plants and some of the plants it built during its fi rst ten years were:
• 1886–1888: 15 blast furnaces to produce lead–silver bullion. Smelting was transferred to Port Pirie during 1892–1897 to gain better access to ship transport and to iron oxide fl uxes in the Middleback ranges.
• 1889: 300 tons per day stamp-gravity mill to upgrade the secondary ore. Galena (sg 7.5) could be recovered but silver chloride (sg 5.5) was diffi cult to separate from sphalerite (sg 4.0) and gangue minerals such as garnet and rhodonite (sg 3.5–4.2) so silver losses were high.
• 1890: 2800 tons per week amalgamation plant to recover silver from tailing. It was used from 1892–1896.
• 1894: rolls-gravity mill built to replace the 1889 mill which was destroyed by ground subsidence. Metal losses were high because the same ineffi cient gravity processes were used.
• 1897: new mill was built with capacity of 5000 tons per week to increase production of concentrate. Mill products were lead concentrate (55 per cent lead, 26 oz silver per ton), lead slime (17 per cent lead, 18 oz silver per ton) and tailings (12–17 per cent zinc).
FIGURE 2.2
The original leases in 1885 and the companies operating them in 1922. In 1885 leases 10 to 16 had thenames of the syndicate members (Tonkin, 2010).

Spectrum Series 18
Z I N C A N D L E A D S U L F I D E S 1 9 0 2 – 1 9 2 0
17
Recoveries of 70 per cent lead, 50 per cent silver and 12 per cent zinc were unsatisfactory and were not improved when the mill equipment was upgraded and the capacity expanded to 14 000 tons per week.
BHP made very large profi ts from the oxidised ores but gravity concentration of the
primary sulfi des was a dismal story despite its new concentrator (shown in Figure 2.4). Other
companies fared no better, for example Block 14 Company Ltd started mining the high-grade
carbonate ore in its upper levels in 1887 and it:
… declared its maiden dividend in 1889 and within two years had distributed
$460 000 to shareholders. Then followed a downturn while Block 14 experienced
the fi eld’s common diffi culties in the treatment of sulphide ore (Kearns, 1982).
Dr Schnabel, Royal Commissioner to the Prussian Mining Department and consultant at
Broken Hill, wrote that the only processing method which looked promising for the primary
FIGURE 2.3
Mill built by BHP in 1894 (Tonkin, 2010).
FIGURE 2.4
BHP mills: 1897 mill (left), 1894 mill (centre), Delprat shaft (rear) (BHP, 1935).

Spectrum Series 18
H I S T O R Y O F F L O TAT I O N
18
ore was roasting and leaching to extract the zinc, recovering the zinc from leach solutions
and smelting the residues to produce lead–silver bullion (Ashcroft, 1898). This process
would be tested extensively during 1895–1898.
The story of the fi rst 16 years of mining at Broken Hill is summarised in Table 2.1. There
were three phases: prosperity while oxidised ores were mined, drastic falls in profi ts when
primary sulfi des were mined due to high metal losses in gravity plant tailings, higher
mining rates to restore profi ts, which were usually unsuccessful because recoveries were not
improved. Mining the ore meant that the dumps in which metal-rich tailings were stored
became larger and they were a continuing reminder to company staff and townspeople alike
of the limitations of processing techniques. In 1904 the dumps were thought to contain
6 582 000 tons, which was an immense source of zinc sulfi de as marmatite but the actual
tonnage may have been even larger (Hoover, 1914).
1886 1888 1890 1892 1894 1896 1898 1900 1902
Total kilotons mined at Broken Hill 15 126 403 643 820 891 1424 1115
Kilotons mined at BHP 10 80 190 300 590 440 400 520 660
BHP dividends and bonuses, £A × 1000 50 370 1000 800 580 420 280 180 110
BHP dividends and bonuses per kiloton, £A 5 4.6 5.3 2.7 1 0.95 0.70 0.34 0.16
TABLE 2.1
The fi rst 16 years of mining at Broken Hill (data from BHP archives, reported in Lynch, 1987).
FIGURE 2.5
Building BHP dumps in 1905 (Kearns, 1974).
THE BROKEN HILL TAILINGS DUMPS
The marmatite in the dumps was already ground to –2 mm but it was of no value unless
it could be separated from the abundant garnet and rhodonite, which had similar specifi c
gravities to marmatite so tables and vanners did not work. By 1894 companies in Broken
Hill knew that the loss of metals to the dumps presented the dilemma that mining was
unattractive because of low prices for metals and high losses of metals in mill tailings, but

Spectrum Series 18
Z I N C A N D L E A D S U L F I D E S 1 9 0 2 – 1 9 2 0
19
mine closures were unacceptable because of the wealth in dumps and underground ore. The
search began in earnest for a new process to recover zinc, fi rst by leaching and electrolysis
as suggested by Schnabel, then by magnetic separation and fi nally by an adhesion process.
Work on bubble-mineral adhesion started in 1902 and from it came today’s fl otation process.
RECOVERING ZINC FROM THE TAILINGS DUMPS BEFORE THE USEOF FLOTATION
Leaching and electrolysis – 1895
Edgar Ashcroft was an electrical engineer from England who joined BHP in 1893 to direct the
installation of its electric light plant. He was an imaginative engineer, even a ‘metallurgical
messiah’ (Blainey, 1968), and he soon turned to the zinc problem which must have been the
talk of the day in Broken Hill. Zinc metal was made then by distillation but this was diffi cult
and expensive and European companies were considering a roast– leach–electrolysis process,
which had been discussed 50 years previously by Edouard Letrange in France (Collins, 1910)
and recommended to BHP by Dr Schnabel. Ashcroft developed and patented a Letrange-type
process but it was rejected by the BHP board. Other companies were in favour of the idea
and during 1895–6 backed Ashcroft to carry out small trials at Broken Hill and then larger
trials at Essex in England. Ferric chloride was used for leaching and apparently the results
were promising because Sulfi de Corporation (Ashcroft Process) Ltd was fl oated in London
with a capital of £1.1 million. The company spent £250 000 (about 20 million dollars in 2007
values) to build a plant at Cockle Creek near Newcastle and it purchased the Central mine at
Broken Hill (Block 9) to provide feed to the plant. This was one of the mines which had been
profi table while secondary ore was mined but which failed when it was necessary to mine
sulfi de ore (Ashcroft, 1898).
The Cockle Creek venture was a gamble. The process involved 20 operations including
roasting, leaching, fi ltration, electrolysis of the pregnant solution to produce zinc and
smelting and refi ning of the residues to produce lead–silver bullion. Scaling a new process
FIGURE 2.6
BHP offi ce and dumps in 1918 (Bridges, 1920).

Spectrum Series 18
H I S T O R Y O F F L O TAT I O N
20
from a pilot plant to a production plant always involves problems and there were many
of these at Cockle Creek, such as ferric chloride being too corrosive, requiring it to be
replaced by sulfuric acid and the roasting, leaching and electrolysis stages being diffi cult
and complicated. The money ran out before the plant operated successfully – maybe it never
would have made profi ts since the original plan assumed that the metal content of the feed
would be 45 oz silver, 30 per cent lead and 30 per cent zinc, whereas it was actually 16.5 oz
silver, 24 per cent lead and 25 per cent zinc. The owners were left with no alternative but to
close and dismantle the plant and produce lead bullion in the smelter from fresh ore. The
decision was disappointing but correct since the lead smelter worked profi tably at Cockle
Creek from 1897 to 1922.
The Ashcroft process can be regarded as an heroic failure; the problems being due more to poor planning and management and lack of capital than to poor technical decisions. In 1916 an electrolytic process developed by the Anaconda Company was used at their zinc refi nery in Great Falls, Montana, and it was this process that was installed at Risdon in Tasmania during 1917 to provide zinc, which was no longer available from smelters in Germany and Belgium due to the world war, but which was essential for munitions. After 1898 Sulphide Corporation confi ned its activities to conventional mining and milling at the Central Mine although it never lost its zest for research. This paid off fi nancially when it became a leader in the development and application of froth fl otation.
Magnetic separation – 1899
When leaching and electrolysis failed the best possibility for making a saleable zinc concentrate was magnetic separation because marmatite was slightly magnetic. In 1899 an Anglo German syndicate, Australian Metal Company, built a small plant in west Broken Hill to test magnetic separation on tailings from several mines. Some results were promising and fi ve companies installed magnets. The Cockle Creek failure did not diminish the confi dence of Sulphide Corporation in new ideas and it built magnetic separation plants in 1901 (fi ve magnets) and 1904 (22 magnets). The tailings were dried, crushed, screened and magnetic separation was applied to fractions between 0.75 mm and 180 mesh.
FIGURE 2.7
Magnetic Separation plant at the Central mine (Curtis, 1908).

Spectrum Series 18
Z I N C A N D L E A D S U L F I D E S 1 9 0 2 – 1 9 2 0
21
The magnetic separation process was fairly successful with 70 per cent of zinc recovered in a 39 per cent zinc product. The plant made a small profi t but dust created an extremely serious health hazard which could not be tolerated. When the plant was closed in 1907 because of low capacity and concern about hygiene 141 500 tons of concentrate which contained more than 55 000 tons of zinc had been produced (AusIMM Broken Hill Branch, 1930).
FLOTATION PROCESSES – 1902–08
By 1902 tailings dumps rich in zinc sulfi des were growing at the rate of 20 000 tons per week and companies were desperate to fi nd a new separation process. The time for mineral concentration by fl otation had come and research on the process was so intensive at Broken Hill that within six years several processes were operating in plants. Flotation now seems to be a simple process but during its early years it was beset with all the problems that accompany trials of every new metallurgical process. Sulman’s classifi cation (Sulman, 1919) of the fl otation processes in use and their inventors were:
• froth produced by gases other than air – Potter, Delprat, Froment;
• froth produced in a spitzkasten by an aerated pulp – Minerals Separation1;
• utilising surface tension effect at the water surface – De Bavay, Bradford, MacQuisten;
• oil employed as adhesive and buoyant medium – Elmore (at Glasdir); and
• vacuum process – Elmore (at Broken Hill).
Mineral-mineral adhesion was tested at Broken Hill in the Cattermole process (Cattermole, 1904). A small amount of oil was added to the pulp, sulfi des were granulated and the granules settled and were removed. This led by accident to froth fl otation because turbulence formed a mineralised froth, and frothing proved to be more successful than granulation. The idea that his process would separate minerals by fl oating rather than sinking must have surprised Arthur Cattermole.
Potter, Delprat and fl otation by gas bubbles
Charles Potter Block 14 put its faith in Charles Potter, a brewer with a consuming interest in inventions which included a malting process, a gas engine, a nosebag and an oxyhydrogen furnace (Davey, 1988). In 1899 he started work at his Melbourne home on a process to extract zinc from Broken Hill tailings using an approach similar to that described by Bishop Watson – add acid to the ore pulp, generate gas bubbles, form a froth of bubbles with minerals adhering to them. Potter’s patent for a fl otation process (Potter, 1904) specifi ed that one ton of sulfuric acid solution (one to ten per cent by weight or stronger if necessary) should be added to one ton of ore and heat applied to the agitated pulp. Block 14 tested Potter’s process successfully in a pilot plant at Port Adelaide where it operated a smelter.
1. A spitzkasten or a spitz is a box into which pulp fl ows from one side, separation occurs and two products form which fl ow from the other side of the box and the base. When the feed is the aerated product from a cell the froth which forms fl ows from the top and the tailings fl ow from the base.

Spectrum Series 18
H I S T O R Y O F F L O TAT I O N
22
In 1903 Block 14 built a Potter process plant at Broken Hill using a Goyder Laughton machine in which tailings were dragged by chains and scrapers through a hot acid solution in a shallow tank. Gas bubbles were formed by reaction of acid with tailings and they adhered to marmatite particles and formed a froth which was removed in launders. During four months of operation this process produced a concentrate containing 45.8 per cent zinc at 70 per cent recovery (AusIMM Broken Hill Branch, 1930). The Goyder Laughton machines must have been hard to operate and the reliability of the process improved when they were replaced with vertical tanks in which feed and acid entered at the top, formed a froth which overfl owed and the ore left was removed from the base as tailings. These tanks operated from 1903–05 and produced 12 000 tons of concentrate containing 42 per cent zinc concentrate at 78 per cent recovery. Results were good because hot acid cleaned the particle surfaces and activated the zinc, lead carbonate in tailings from secondary ore reacted with acid to provide plenty of bubbles and dumps contained residual oil from machines. When the process was used at Zinc Corporation in 1906 results were poor except for the occasion when, unknown to the metallurgists, oil was added to the pulp by operators with fl otation experience in other plants. Zinc Corporation staff eventually realised that oil enhanced the fl oatability of sulfi des, but by then Potter’s process had been replaced by the Minerals Separation process.
FIGURE 2.9
Goyder Laughton machine used initially for the Potter process at Block 14 (Jenkins, 2001). It was soon replaced by stirred tanks.
FIGURE 2.8
Flotation cell shown in Potter’s patent (Potter, 1904). It was a mechanical cell working on hotacid pulp. The stirrer (B1 ), gas heater (3) and feed and froth product launders (A1,II ) can be seen.

Spectrum Series 18
Z I N C A N D L E A D S U L F I D E S 1 9 0 2 – 1 9 2 0
23
Guillaume Delprat
The zinc problem would have been high priority for Guillaume Delprat when he was
appointed General Manager of BHP in 1899 because he had to restore company profi ts,
which were fl agging due to poor metal recoveries. His experience was unusual – fi ve years
engineering apprenticeship, two years as assistant to J Van de Waals, who was professor of
physics at the University of Amsterdam, and 20 years in the minerals industry. His research
experience told him that the solution to the zinc problem would start in the laboratory and
he was quick to observe that marmatite in tailings from dumps fl oated on water containing
dissolved sodium bisulfate while other minerals sank (Bridges, 1920). This led to the Delprat
fl otation process, which was similar in principle to the Potter process – form gas bubbles by
reaction of an acid solution with carbonate minerals, fl oat marmatite adhering to bubbles
as a frothy scum. Cold nitric acid was specifi ed in Delprat’s fi rst patent and hot salt cake
solution or sodium sulfate and sulfuric acid in the ratio 2.5:1 in his second patent (Delprat,
1903, 1904). As with Potter’s process the adhesion of marmatite to bubbles would have been
helped by hot acid cleaning the mineral surface and by oil discarded onto the dumps.
FIGURE 2.10
Guillaume Daniel Delprat, General Manager, BHP 1899–1921 (left) (BHP, 1935). Flotation cell specifi ed in patent (Delprat, 1903).Ore and acid were added via tank 1 (middle). Potter-Delprat box used in the BHP plant. Zinc recovery was about 90 per cent (right)
(Truscott, 1923).
Delprat had the resources and authority to move quickly to verify his laboratory work
and to build and operate plant circuits to produce zinc concentrate. He was not the fi rst
to operate a sulfi de adhesion process in a plant, that honour must be attributed to Frank
Elmore with his bulk oil process in Glasdir (Elmore, 1898), but he was the fi rst to make froth
fl otation work on a large scale. He had easy access to tailings in the dumps for testing and
mining, and he was assisted by excellent metallurgical staff, notably Leslie Bradford, who
contributed so much to bulk and selective fl otation during the next ten years (Lynch, 1987).
The speed with which Delprat developed and successfully operated a circuit that used an entirely new metallurgical process was unprecedented. In November 1902 he took out a British patent (which he extended to US patents in 1903 and 1904) knowing the potential value of the process ‘this process is of immensely wide application and its simplicity and cheapness are bound to cause it to replace magnetic separation’ (Bridges, 1920). By 1903 the

Spectrum Series 18
H I S T O R Y O F F L O TAT I O N
24
fi rst 50 tons of concentrate were ready for export. The early days in the fl otation plant were tough because of diffi culties with handling acid pulps in the machines and with changes in the feed due to tailings being in dumps for years. It was the same with Potter’s process at Block 14. Corrosion problems required frequent changes in the design of the machines and in the materials used in them, while changes in reagents were often required because of variations in the mineralogy and composition of the tailings and the chemistry of the mine water. Henderson (1928) wrote about some problems:
In the early stages of the Delprat process a lot of trouble was experienced with the solution. The separation would take place splendidly for a while and then gradually weaken, and fi nally no fl oat at all would result … The consultant A J De Bavay discovered that it was due to organic matter present in the feed passing into the solution and sickening it.
FIGURE 2.12
BHP fl otation process showing the Delprat frothing cell in the centre and the settling vats from which concentrates andtailings were recovered and acid solutions were recycled. Inserts show the cell and the plug (Delprat, 1907; Hoover, 1914).
FIGURE 2.11
Mining the tailings dumps at BHP by steam shovel (left), conveying mined tailings to the fl otation plant (right) (Hoover, 1914).

Spectrum Series 18
Z I N C A N D L E A D S U L F I D E S 1 9 0 2 – 1 9 2 0
25
The heart of the BHP plant was six vats that contained hot acid solutions and into each of which dump product was added at a rate of 10–12 tons per hour. Tailings were discharged at the base and the froth containing the sulfi des overfl owed the top. Corrosion due to hot acid solutions was a problem from the start and eventually all exposed parts were made of iron. The plant must have been unpleasant to operate. Super-heated steam (500°F) heated acid pulps to 200–212°F, tanks had to be repaired frequently because of corrosion by acid pulps and thin froths of zinc concentrates had to be scraped continually from the top of hot pulps. But the team was never daunted and their record of fl otation speaks for itself; 868 tons of tailings in the fi rst six months of 1904, 3500 tons per week during the next six months and 5500 tons per week by 1905. The ideal feed to give a thicker and more coherent froth was fi ne sand with a little slimes and three per cent calcite.
The BHP process worked for 20 years on dump products and plant tailings and gave an average concentrate of 47 per cent zinc at 82 per cent recovery. These results compared well with the average results of fl otation of primary ores during 50 years at Broken Hill, which were 52 per cent zinc concentrate at 90 per cent recovery. Slimes in the dumps were diffi cult to fl oat so Leslie Bradford, BHP’s chief metallurgist, devised a process in which slimes were violently agitated under pressure with acid and air, and when the pressure was released there was immediate fl otation. A 4000 tons per week plant was built which operated for some years.
Delprat’s process was overtaken by others at Broken Hill but there is no doubt that his process was the start of a metallurgical revolution which transformed the supply of base metals. He would not have led the project himself because he managed operations at both Broken Hill and Port Pirie and he was President of the Mining Managers Association at a time of serious industrial trouble, but his impatience with delays would have brought fl otation online as soon as possible. By 1911 BHP had fl oated 1 750 000 tons of tailings and made 500 000 tons of zinc concentrate, 93 302 tons in 1911 alone. The progress since mid 1904 when 287 tons of concentrate were produced in six months was remarkable.
The legal disputeDelprat’s process was patented on 28 November 1902. Charles Potter who worked next door at Block 14 considered that it infringed his fl otation patent and legal action ensued. The decision in 1907 favoured BHP because the court judged that the Potter patent made invalid claims and lacked utility, although it observed that it would have favoured Potter if the patent had not been badly drawn up. Eventually the processes were merged and BHP implicitly recognised Potter’s priority by paying him for the use of his sulfuric acid process. Potter’s legal costs were very high and it is sad to record that he died in debt a year later at the age of 49. By contrast Delprat was rewarded handsomely; he was paid £1000 by BHP for his fl otation patents and his salary was increased from £3000 to £4000. The litigation was the start of years of legal disputes which bedevilled progress in fl otation in Australia and the USA (Hoover, 1914). A notable case was the long and bitter lawsuit between the Elmore brothers and Minerals Separation, which arose from the visit by Minerals Separation engineers to the Elmore pilot plant in London. The visit was discussed in Chapter 1. It resulted in rival processes by the Elmores and Minerals Separation, which became a bonanza to lawyers

Spectrum Series 18
H I S T O R Y O F F L O TAT I O N
26
as the companies fought for their ‘rights’ in courts. Many other legal battles over patents concerning processes and reagents beleaguered mining companies and rewarded lawyers for the next 20 years. In retrospect the cost of litigation to mining and equipment companies was immense and the gains were minimal. The warning was clear – settle disputes outside the courts and stay away from the law.
Delprat – from zinc to steel
Delprat’s interest in fl otation did not extend beyond BHP and this was understandable in
1906 because BHP was the largest mine on the fi eld with the largest dumps and it operated
the biggest fl otation plant. His fl otation process changed the emphasis of BHP operations
at Broken Hill from lead and silver to zinc but he was pessimistic about the future, saying
in 1908 that the BHP mine life would not extend beyond fi ve years. Isolation was a mistake.
Flotation was changing mining operations quickly and by ignoring its evolution he missed
opportunities which other companies grasped. W S Robinson, Managing Director of Zinc
Corporation for years, wrote that:
In 1905 the BHP and the other old companies which have long since vanished from the fi eld mined more than three quarters of the ore. Those same companies also held more than three quarters of the reserves of ore which were believed to exist on the fi eld. They failed to realise that the line of lode at Broken Hill extended far to the north and south of the existing workings. They also failed to realise quickly enough the full advantages of the new fl otation process in winning money from the dumps of zinc tailings that framed the horizon of Broken Hill (Blainey, 1967).
As Delprat’s interest in the Broken Hill mine waned his relations with the unions, other
mining companies and civic groups became more abrasive and his departure for Melbourne
to build the BHP steelworks at Newcastle during 1912–15 would not have been regretted; but
his new venture took BHP to another level. The Newcastle steelworks was said to represent
Delprat’s crowning achievement on the national scene:
His vision, judgment and timing were vindicated not only by their opening in the early months of World War I but also by his choice of American rather than the cheaper but strategically vulnerable German steel-making plant (Osborne, 1981).
The new steel plant was certainly a great achievement but there can be no doubt that the
fl otation process he created was the great metallurgical development of the 20th century.
Minerals Separation, Central Mine, Cattermole’s process and froth fl otation
It was not only at BHP where efforts were made to produce zinc concentrate during 1902.
The Sulphide Corporation had been formed to fi nance and manage the ill fated Cockle
Creek venture and it bought the Central mine in 1895 to supply the ore. It leased Block 9,
which was next to the BHP leases and on which dumps had accumulated during ten
years of mining. In 1904 these dumps contained 1 600 000 tons at 22 per cent zinc and
only the BHP dumps with 2 500 000 tons at 17 per cent zinc were larger (Hoover, 1914).

Spectrum Series 18
Z I N C A N D L E A D S U L F I D E S 1 9 0 2 – 1 9 2 0
27
The managers, Charles Courtney and James Hebbard, did not hesitate to investigate new
methods to improve zinc extraction:
Not withstanding this failure (at Cockle Creek) the Corporation decided to devote special attention to methods of extracting by concentration the contents of the dumps which were fast accumulating on the mine (Hebbard, 1913).
Magnetic separators were tried, as discussed above, but it was decided that a wet process
was required to eliminate the dust hazard so a process similar to the Potter-Delprat process
was tested. The high carbonate content of the tailings caused excessive acid consumption
and their interest turned to an adhesion process patented by Arthur Cattermole in 1902
which did not require acid (Cattermole, 1904).
In this process (Figure 2.13) fi ne ground ore was mixed with four to six per cent emulsifi ed
oil and ten per cent soap (tanks B) and small granules of sulfi de minerals were formed.
Tank product was discharged into an up-current separator (G), the granules fl owed from
the base of the separator into more tanks in which the process was repeated to liberate
entrained sand which was removed in another separator (K). Separator overfl ows containing
the lighter gangue were collected in tanks J and M for discharge to waste and cleaned
granules were collected in tank L for further processing. Cattermole’s patents were bought
by Minerals Separation Ltd, which was formed in London in 1903 to develop the concept
of concentrating sulfi des by adhesion. H L Sulman, H F K Picard and J Ballot, founding
partners of Minerals Separation, were also interested in Elmore’s bulk oil process and were
given access to all details while the demonstration plant was operating in London. But rather
than license Elmore’s process they chose to walk away from it and set up another separation
process which was also based on the adhesion properties of sulfi de minerals in the presence
of oil. This created ill feeling which eventually turned into bitter and prolonged litigation
(Mouat, 1996).
FIGURE 2.13
Flow sheet in the patent for the sulfi de agglomeration process (Cattermole, 1904).

Spectrum Series 18
H I S T O R Y O F F L O TAT I O N
28
The fi rst Sulman-Picard fl otation process was described in a patent application fi led on 5 October 1903:
The present invention relates to the concentration of ores by separation of the metalliferous constituents and graphite, carbon, sulfur, and the like from gangue by means of oils, grease, tar, or any similar substance which has a preferential affi nity for metalliferous matter over gangue. According to this invention we utilize the power which is possessed by fi lms or bubbles of air or other gas of attaching themselves to solid particles moistened by oil or the like (Sulman and Picard, 1905).
Their process is shown in Figure 2.14. A is the feed tank for the ore pulp, B is the fl otation
cell, B1 is the perforated pipe in which bubbles are formed, B2 is the pipe through which
airfl ows and to which oil is added from C¹, and B4 is the froth launder.
FIGURE 2.14
Sulman-Picard process described in the patent issued on 4 July 1905 (Sulman and Picard, 1905).
The Sulman-Picard process was far sighted but Cattermole’s process took priority when managers at the Central Mine became interested in it. Minerals Separation agreed to build a demonstration plant for Cattermole’s process at the Central mine and this plant started operations in June 1904:
It was quickly demonstrated that the process was capable of making high recoveries of all the three metals from the very fi nest slimes, whether taken from the current work of the mill or from old accumulations of by-products, and also that old tailings or new crude ore were amenable to treatment with a high recovery when crushed to a certain degree of fi neness (Hebbard, 1913).
The cost initially was high because of the amount of heavy oils required, but when these
oils were replaced by oleic acid the cost was reduced and the recoveries were not affected. The
model agglomeration plant was successful and the Central mine built a plant with capacity
of 100 tons per day, which started work in July 1905, one objective being to provide data
for the design of a larger plant. An unexpected problem was that mixing the pulp to coat the
sulfi des with oil aerated the pulp and formed a froth which carried some mineral into the up-
current separator overfl ow and was discarded. This was turned to advantage when Minerals
Separation staff carried out tests in England and Australia in December 1904, which showed

Spectrum Series 18
Z I N C A N D L E A D S U L F I D E S 1 9 0 2 – 1 9 2 0
29
that reduction of oleic acid from 3.5 per cent to 0.75 per cent greatly increased the amount
of fl oat product. A plant test in September 1905 using 0.15–0.2 per cent oleic acid confi rmed
that froth fl otation would be successful and in October 1905 Courtney and Hebbard decided
to stop agglomeration and change to fl otation only, and built cells to do this. An engineer
involved in the work commented some years later that:
It might be of some interest to members to know the apparatus with which a considerable amount of data had been worked out for the fi rst froth fl otation plant at Broken Hill. It was very often with the simplest apparatus that the most important results were achieved. They had not been allowed to spend much money. They had got a beer barrel, an old engine which was taken from the old mill and which required repair, shafting and a Gabbet cone (mixing vessel). And with these they had obtained data for the design of a large plant which was extremely successful (Moulden, 1919).
The test plant for the fi rst Minerals Separation fl otation process was austere (see Figure 2.15). Cattermole’s process was not used again at Broken Hill but a form of it was revived as Trent’s process (Aplan, 1999).
FIGURE 2.15
Test plant for the Minerals Separation fl otation process at the Central mine (Curtis, 1908).
The Minerals Separation froth fl otation process was successful because so much effort
went into cell design. Each cell consisted of two parts, a mixer in which violent agitation
ensured thorough aeration of the pulp and a spitz box which received the aerated pulp and
in which the quiescent conditions allowed froth to form and to overfl ow into a launder. The
Minerals Separation cell and the experimental zinc fl otation plant are shown in Figures 2.15
and 2.16.
The Central mine built a plant for Minerals Separation to treat its own dumps and between
1907 and 1911 this plant treated 700 000 tons. The arrangement between the Central mine
and Minerals Separation was unusual. James Hebbard was Manager of the Central mine and
he controlled all mining and milling operations while Minerals Separation staff, who were
directed from London by T J Hoover, owned all fl otation patents, carried out experimental
work and provided technical advice to the mine staff. The Central mine gained the immediate

Spectrum Series 18
H I S T O R Y O F F L O TAT I O N
30
economic benefi ts of fl otation, ie better recoveries and higher grade concentrates, while
Minerals Separation was able to use the Central mine plant to train staff for consulting and
to test ideas before patenting. The links between the companies were never clearly specifi ed
(Birrell, 2000), perhaps this is the reason they worked together so well.
T J Hoover contributed greatly to fl otation, mainly through his design of the stirred, aerated cell. He graduated from Stanford University in 1901 and worked as an assayer and mine manager before being appointed General Manager of Minerals Separation from 1906–1910. He spent most of his time in London, which seemed to be a poor choice of location since his main task was to control the development of the new fl otation process that was occurring 10 000 miles away, but he contributed much to fl otation through his design of the Minerals Separation cell, which was used worldwide for years. His forthright comments would not have made him easy to work with. While Dean of Engineering at Stanford University in 1930 he wrote that ‘The human race develops by war and succeeds in war in proportion to its use of metals … The pacifi st errs in assuming that peace is desirable’. It was an imprudent comment, particularly when his brother was President of the United States. The University President had a diffi cult task to calm the uproar (Stanford Daily Online, 2001). This type of abrasive comment caused arguments with fellow Minerals Separation staff and would have disrupted many alliances, but not the alliance with James Hebbard, who believed in collaboration rather than confrontation.
Hebbard’s background was that he was born into a large family of working class parents. He could not afford to be trained as a mining engineer so he learnt by taking courses when possible and by working in several mines and as a Government Inspector of Mines. This experience gave him a comprehensive knowledge of mine operation and management and of human nature. He was canny and humane, and always to the fore in all aspects of community and mine affairs, examples being his work as a Wesleyan choirmaster and his insistence that men in the dusty magnetic separation plant at the Central mine wore respirators. His realistic attitude to industrial relations was demonstrated in 1908 when he replaced Delprat as President of the Mining Managers Association during a period of industrial turmoil and deliberately set out to change the provocative approach to the unions which Delprat pursued.
FIGURE 2.16
The mechanisms in the Minerals Separation cell (Truscott, 1923) and a sketchof the cells in the test plant built on the Central mine lease (Hebbard, 1913).

Spectrum Series 18
Z I N C A N D L E A D S U L F I D E S 1 9 0 2 – 1 9 2 0
31
He had many responsibilities in management, industrial relations and the community but nothing would distract him from ensuring the success of froth fl otation at the Central mine, least of all some adverse comments from London. Flotation was the subject of his presidential address to The Australasian Institute of Mining and Metallurgy (AusIMM) (Hebbard, 1913) and his pride in the contribution of the Central mine to its success was obviously intense. He was meticulous in understanding cause and effect in fl otation, for example he recognised that aeration is a controlling factor in fl otation rates, that fi ne grinding is essential for best results and that grinding pans were superior to wet and dry ball mills for preparing feed for fl otation. James Hebbard understood Broken Hill better than most people and it is surprising that he did not take advantage for his company of the advice he gave Minerals Separation in 1912 to lease the large deep zinc orebody at the southern end of the lode (Birrell, 2000). This became the great extension to the Zinc Corporation mine, which became the main unit in Consolidated Zinc and Conzinc Riotinto of Australia (CRA) before the formation of today’s RioTinto.
Auguste de Bavay and fi lm fl otation
Auguste de Bavay’s introduction to fl otation came when he visited BHP in 1903 to advise on the diffi culties with Delprat’s fl otation process. One result was that he became interested in fl otation and when he returned to Melbourne he devised a new separation process which was installed at the north end of the fi eld. De Bavay was the Renaissance man of Australian industry. He graduated in surveying in Belgium in 1873 and worked as a brewer and chemist there before becoming a plantation manager in Ceylon and then a brewer in Melbourne with the Victoria Parade brewery in 1884. He earned a reputation as a fi ne bacteriologist when his research into yeast cultures led to improvements in brewing technology and this was enhanced when he improved the quality of Melbourne’s water by eliminating a source of typhoid. In 1895 he was invited by Montague Cohen, fi nancier and company director, to join Foster’s as chief brewer and there he met W L Baillieu, who was a director of Fosters. Baillieu had become wealthy as a real estate agent but his real interest was mining and he knew that there were large amounts of metals in the dumps and the primary ores at Broken Hill (Parsons, 1981).
FIGURE 2.17
Amalgamated Zinc (De Bavay) plant (left) (Archbald, 1912). De Bavay cell (right) (Truscott, 1923).

Spectrum Series 18
H I S T O R Y O F F L O TAT I O N
32
When De Bavay fi nished his consultancy at BHP Cohen and Baillieu fi nanced him to work in the Foster’s laboratory on a process for fl oating sulfi de minerals. He patented a process in 1904 in which a thin fi lm of freely fl owing pulp to which oil was added was exposed to air so that contact occurred between air and particles and the fi lm then fl owed gently into water without creating turbulence (De Bavay, 1907). Sulfi des were not wetted because their surfaces were oily and they fl oated as a fi lm because they were attached to air, while the gangue particles sank because they were wetted. The concept in De Bavay’s process was similar to that in Hezekiah Bradford’s 1886 patent; in practice De Bavay’s process used two cones with the pulp being exposed to air as it fl owed down the upper cone into water contained in the lower cone. Only deslimed ore could be treated so there was a serious loss of fi ne, high-grade particles in the tailings. In 1905 the De Bavay Treatment Co was formed to install cones in the mill of North Broken Hill Ltd, of which W L Baillieu was a Director. The process was successful and the throughput was increased to ten tons per day in 1906 and then to 1700 tons per week in 1907. De Bavay’s cones made the best zinc concentrate in Broken Hill because they were more effi cient with coarse zinc, which only had to stay on the surface and did not have to rise through the froth. In 1909 Amalgamated Zinc (De Bavay’s) Ltd was formed and built a large plant that eventually treated 1.3 million tonnes of tailings in 4.5 years to produce a 48 per cent zinc concentrate at a recovery of 81 per cent zinc and 61 per cent silver. The company had purchased four million tons of tailings but production of zinc in the De Bavay cell ceased in 1917 because the castor oil it used was required for munitions. It was replaced by the Minerals Separation process, which operated until 1924 when the tailings were fi nished. So ended the De Bavay cell, an outstanding invention by a remarkable man.
De Bavay was the inventor whose ‘reputation as a scientist and the esteem of his colleagues concerned him more than the pursuit of fame or material possessions’ (Parsons, 1981). W L Baillieu was the fi nancier who backed the process and was enriched by it. Coincidentally Arthur MacQuisten and Auguste de Bavay patented similar fl otation processes in the same month. MacQuisten’s process was installed in the Adelaide mill in Nevada and the Morning mill in Idaho. This will be discussed in Chapter 3.
Elmore brothers and vacuum fl otation
By 1900 Elmore’s bulk oil process proved to be the best process for concentrating fi ne sulfi des. It was well publicised and by 1904 ten companies had bought bulk oil fl otation plants (Almond, 2000), no doubt hoping to improve recoveries. Their hopes were ill fated but the Elmores were resilient and when they became aware of the role of gas bubbles in fl otation, perhaps during discussions following the 1900 London conference on fl otation, they modifi ed their process to use a small amount of oil and aerate the pulp. They were backed fi nancially by Wernher Beit and Company, a London fi nancial group with strong investments in South African mines, which included a controlling interest in De Beers Consolidated, the world’s leading producer of diamonds. The grease tables which the De Beers company invented in 1896 for concentrating diamonds (Gemological Institute of America, 2001) by adhesion to grease were similar in concept to Elmores’ mineral-oil adhesion process and fi nance companies of the day were prepared to back promising new technologies.

Spectrum Series 18
Z I N C A N D L E A D S U L F I D E S 1 9 0 2 – 1 9 2 0
33
On 15 June 1904 Francis Elmore, who was an electro-metallurgist, patented a fl otation process using gas bubbles created by the electrolysis of water. Two months later he fi led a patent for another process using air bubbles liberated from water by vacuum (Elmore, 1908). A machine for the vacuum process was built and tested at the Falmouth Consols mine in Cornwall in 1905, and it was then taken to Australia where it was set up as a test machine in west Broken Hill on the land where the magnetic separator test plant had previously worked. The design of the vacuum cell system was unusual and refl ected the engineering skills of the Elmores. The cell was placed at the top of a siphon, the short leg of which was the feed pipe and the long legs were the concentrate and tailings pipes. The ends of the product pipes were immersed in water to prevent air breaking the siphon. The feed was mixed with oil and acid before fl owing up to the cell where the vacuum was applied; fl otation occurred immediately and the froth and sands were discharged down separate pipes. Vacuum cells were typically 1.5 m diameter, feed pipes were 8–10 m long and the building was up to 15 m high. Each cell could handle 25–40 tons per 24 hours; plant operation was entirely automatic and no desliming of the feed was required. In fact slimes were probably an excellent feed. The vacuum fl otation process was the high technology system of the day and was regarded with respect by its competitors:
This apparatus is unique in its features, and it is allowable to marvel at the ingenuity displayed in its invention.
Continuous working has shown that the plant is eminently practical; no delicate adjustments are required, wear and tear is to all intents a negligible quantity, and the excellent mechanical design and substantial construction of the apparatus have made breakages almost unknown (Hoover, 1914).
FIGURE 2.18
Design and installation of Elmore vacuum cell (left) (Truscott, 1923; Hoover, 1914). Elmore vacuum cells at Zinc Corporation(right) (Braes, 2008). The Elmore plant at Sulitjelma shown in Figure 2.24 was typical of these plants and was 16 m high.

Spectrum Series 18
H I S T O R Y O F F L O TAT I O N
34
Thirty-two Elmore units were installed in four Broken Hill plants: Pinnacles Mine (two),
Zinc Corporation Ltd (16), Block 10 Pty Ltd (four) and British Broken Hill Pty Ltd (ten). In
total they treated about one million tons of tailings (Woodward, 1965).
Zinc Corporation
In 1905 four different fl otation processes made 100 000 tons of zinc concentrate and
fl otation was shaping up as the long sought process to concentrate fi ne particles of lead and
zinc sulfi des. Its potential economic effect on the supply of metals did not pass unnoticed in
the fi nancial world:
On 2 April 1905 a special train arrived at the Sulphide Street (Broken Hill) railway station. On board were 20 well known mining men, fi nanciers, sharebrokers, and directors of a number of Broken Hill mines. The visit of this group was to have a profound effect on the future of Broken Hill and on the Australian mining industry as a whole. Included in the party were W L Baillieu, Lionel Robinson and the latter’s younger brother W S Robinson. At that time there were 6 million tons of dump material assaying 17–18% zinc located on the various mine leases and each year a further one million tons were being added to the stockpile. Following subsequent visits by many mining and metallurgical experts, including Herbert C Hoover (later to become President of USA), many of the dumps were purchased in anticipation of extracting the zinc content by processes still under trial (Kearns, 1974).
The visit was sponsored by Lionel Robinson, a Melbourne stockbroker who became wealthy
during the Broken Hill and Kalgoorlie mining booms of the 1890s and who transferred to
the London Stock Exchange in 1899. Lionel Robinson and W L Baillieu saw the potential
link between zinc extraction from the dumps and fl otation and started to consider buying
the dumps. In August 1905 Herbert Hoover visited Broken Hill and saw the dumps and
he also linked them with fl otation. The result of the visits, no doubt reached after delicate
discussions because Hoover must have been regarded as an intruder, was the formation of
the Hill Syndicate, which moved quietly to buy the dumps. By mid October it had bought
or taken options on two million tons of dumps and the rights to another two million tons of
future tailings. On 18 October 1905 Zinc Corporation was established to buy the dumps from
Hill Syndicate and to extract the zinc by fl otation. At the same time Hoover recommended
to his colleagues in London that Broken Hill South Blocks (lease 5) should be purchased and
this was done in November. During April to November engineers and stockbrokers had set in
place a system to change the future of Broken Hill – dumps were bought, a mining lease was
negotiated and money became available to mine the dumps and build a fl otation plant. The
next steps were to choose the right process and make zinc concentrates. It all seemed easy
because of the success of BHP and Central mine with similar dumps, but there was no hint
of the diffi cult times which lay ahead. The roller coaster of events during the next two years
involving high fi nance, the stock exchange, sabotage and eventual success was described by
Nash (1983) and Mitchell (1911). The following comments are based on their papers.

Spectrum Series 18
Z I N C A N D L E A D S U L F I D E S 1 9 0 2 – 1 9 2 0
35
By late 1905 Zinc Corporation had raised £350 000 (£1000 in 1905 was equivalent to
US$142 982 in 2008). Its estimated expenses were £95 000 immediately for the fi rst payment
for dumps, periodic payments to cover future dump purchases and payments for building
and operating the fl otation plants. Its plans were to build two plants – an experimental plant
to test the Potter, Minerals Separation and Elmore processes, followed by a large central
plant, which would use the most promising process (Mitchell, 1911).
In February 1906 the experimental plant was built and the Potter process was ready to go.
By April its results looked good but within two months it was a failure despite the fact that
Leslie Bradford (who knew the process well, having worked on the Delprat process from its
beginning) had been head-hunted from BHP and was Chief Metallurgist (Scott, 1987). The
failure was an early indication that fl otation could be temperamental and diffi cult to operate
and that its success was highly dependent on the feed.
A new manager was appointed, the process was modifi ed and in mid October 1906 a test was carried out in which 81 per cent of the zinc was recovered from 1300 tons of tailings. This was most encouraging, but unknown to the manager an operator had tipped oil into the fl otation process because it was commonly used in other fl otation plants. By then Bradford, who would have realised what had happened, had returned to BHP and the improved result was attributed to the plant changes. On the basis of this result the share capital was increased to £500 000 to pay for expansion.
In early January 1907 the share price rose as the larger plant came online, but in late
January it plummeted when the plant failed, perhaps because no oil was added. In March
the Potter process was replaced by the Minerals Separation process and by mid June this
also was a failure, probably because aeration was occurring through a vortex and this was
ineffi cient. Shares in Zinc Corporation sank in a year from £2.5 to £0.05. The only possibility
left to F A Govett, Chairman of the Board, was the expensive Elmore vacuum process.
Zinc Corporation’s fi nancial position on 30 July 1907 was dire. It was £30 000 in debt, tailings purchases would cost £90 000 in 1908, and the construction of an Elmore plant of even half the required capacity would cost £50 000. F A Govett strove mightily to put the funds together to avoid insolvency, but by the time the Elmore plant was completed in late February 1908 the Zinc Corporation defi cit exceeded £85 000 and the payment for tailings was due.
Metallurgical success came at last when the Elmore plant started operating and zinc
recovery immediately rose from 72 per cent to 88 per cent. Zinc recovery continued at this
rate, although the concentrate grade was low and had to be improved by burning off the
oil and tabling the concentrate. The dark months of failed processes and scarce fi nancial
reserves were over and Zinc Corporation was earning £4000 per month, a profi t which
increased when the improved Minerals Separation process, which used the new Hoover
cell, replaced the Elmore process in 1911. Mineral recovery from the low-grade tailings was
increased by four per cent (Braes, 2008). Improvements continued; by 1911 the zinc mill had
a capacity of 29 000 tons of residues per month and the company built a sulfuric acid plant
to supply an essential reagent.

Spectrum Series 18
H I S T O R Y O F F L O TAT I O N
36
The Mining Magazine (Anon, 1911a) commented on Zinc Corporation’s tumultuous life:
Some surprise has been caused by the policy recently adopted by the Zinc Corporation, whereby the Elmore fl otation plant is gradually to be replaced by that of the Minerals Separation company. The reason for this move lies below the surface. The new plant has not been adopted because of its superior technical results or in order to avoid patent litigation, though the ostensible reason, which may or may not be incidentally a suffi ciently good one, is that the remaining dump material is more amenable to the action of the new plant. The real cause is to be sought further afi eld. When the Zinc Corporation adopted the Minerals Separation process four or fi ve years ago, a clause in the agreement provided that no other similar process should ever be used. The directors of the Zinc Corporation threw the process out in a few weeks and adopted the Elmore instead. The presence of this unfortunate clause was repeatedly pointed out to them, and now that the Minerals Separation process has been improved and has done good work at the Sulphide Corporation, the Minerals Separation people have been able to press the matter home.
Despite all the problems, the Zinc Corporation had been kept alive by the steady hand and fi nancial genius of its Chairman, F A Govett, and the persistence of its manager, Deane Mitchell, who commented succinctly on the working conditions that exacerbated the technical diffi culties:
At this period and for some further time feeling ran high between different process companies, and doubtless, as an outcome of this feeling, the Zinc Corporation’s experimental work was subjected to many unfavourable arguments of an extremely substantial nature, such as a varied assortment of scrap iron dropped into agitators, gearing or pump sumps (Mitchell, 1911).
It was not that fl otation failed, rather that the company did not have the process skills held by BHP, Central mine and Amalgamated Zinc. The lesson was not forgotten; Zinc Corporation soon became known for its high technical skills in all aspects of mining and processing. The 1905 decision by Baillieu, Robinson, Hoover and colleagues to invest heavily in a zinc production system based on untried fl otation processes had been precipitate, ill planned, poorly implemented, yet eventually was a great success. The plant which Govett and Hoover built was a foundation stone for a company which became an integral part of Rio Tinto, which is one of today’s leading mining companies.
Sulfuric acid plants
Sulfuric acid was an essential reagent in the various fl otation processes at Broken Hill from 1904 because it cleaned the surfaces of the zinc minerals and reacted with carbonates in the tailings to produce gas bubbles. Consumption was 15–40 pounds per ton while the dumps were being processed and several companies built their own acid plants to ensure supply. Chamber acid plants were built by BHP, Zinc Corporation and Broken Hill South, and contact acid plants by Central mine and Amalgamated Zinc (De Bavay). Imported sulfur was used at fi rst, then furnaces were built to roast zinc concentrates and produce calcine and

Spectrum Series 18
Z I N C A N D L E A D S U L F I D E S 1 9 0 2 – 1 9 2 0
37
sulfur dioxide. By 1927 most dumps were exhausted so the demand for acid declined, acid plants were closed and all acid for the fl otation circuits came from the BHP plant. When acid circuits were converted to alkaline circuits in 1930 acid production in Broken Hill ceased.
THE FLOTATION PROCESS IN 1909
By 1909 spectacular progress had been achieved in fl otation technology, although the industrial process was only six years old and the number of people involved in its development at the mine sites was relatively small. It moved so quickly since the fi rst laboratory experiments at BHP in 1902 that in 1909 374 000 tons of zinc concentrate were produced from tailings dumps, and mines at Broken Hill was producing one third of the world’s zinc.
Process Per cent of concentrates Total tons concentrate
1908 1913 1908–13
Potter-Delprat 41.6 21.5 463 000
De Bavay 20.0 35.1 582 000
Minerals Separation 27.4 43.4 1 075 000
Elmore 11.0 - 193 000
TABLE 2.2
Performance of fl otation processes at Broken Hill (Hines and Vincent, 1962).
Technological change of great magnitude such as fl otation does not happen easily; it requires skills in engineering, management and fi nance, but even with these in abundance diffi culties are often encountered. Deane Mitchell, General Manager of Zinc Corporation during the dark months of the company and its later success, wrote about the signifi cance of fl otation (Mitchell, 1911):
The introduction of these processes into large plants has resulted in great mechanical perfection, and the credit for the success of fl otation as a new factor in metallurgy is as much assignable to the operators of these large units as to any or all of the patentees.
James Hebbard (1913) agreed:
It is, the writer believes, quite unique in the history of concentration that so far-reaching and extensive a development should have reached its present state of perfection in so short a space of time, and more wonderful still that it should prove applicable in an equally masterly manner to so many other classes of ores.
W S Robinson, long time Managing Director of Zinc Corporation, emphasised economics and the importance of the fi nancier in the progress of fl otation:
… no metallurgical development of the last 50 years … added so much to the wealth of the world as the fl otation process … the part our group played was mostly due to W L Baillieu whose belief in the success of fl otation never wavered (Blainey, 1967).

Spectrum Series 18
H I S T O R Y O F F L O TAT I O N
38
It was strange that in an industry in which technical information has always circulated quickly there was little interest by North American companies in 1911 in applying fl otation in their plants, although companies in other countries were quick to test it. T A Rickard referred to this when he commented that the MacQuisten cell and other fl otation activities in the USA in 1911:
… were mere ripples on the calm surface of American apathy which twenty years ago gave no promise of the full tide of metallurgic advance that since then has swept over base-metal mining in our country (Rickard, 1932).
In 1909 the task of concentrating fi ne particles of sulfi de minerals was still only part fi nished even though Broken Hill had become a major zinc producer because of fl otation. By then, four different types of machines were being used to fl oat zinc from tailings; oleic acid was the oil favoured as a collector and frother fl otation was carried out in an acid pulp and the Minerals Separation process, which did not require slimes to be rejected, was proving its superiority. Flotation was an unfi nished process because only a bulk concentrate could be made, not separate concentrates of zinc and lead sulfi des. In the case of the dumps a saleable zinc concentrate could be made because insuffi cient lead was present to attract high penalties from smelters, but when fresh primary ore was processed, the slimes produced during gravity plant operation were high in lead, and the fl otation concentrates, which contained lead and zinc, were diffi cult to sell because of high smelting costs. Consequently it was necessary to develop a selective process to produce separate concentrates and that project became the topic of intensive research.
SELECTIVE FLOTATION
The turmoil which accompanied the early years of fl otation had abated by 1909 and discussions at technical meetings of The Australasian Institute of Mining and Metallurgy indicate that there was even some degree of collaboration between companies. It was known that the key to selective fl otation was fl otation rates; the question was – could advantage be taken of this and minerals be fl oated sequentially, removing fi rst the fast fl oating mineral as a concentrate and then the slow fl oating? Maybe this could be done by careful control of the operating variables or by changing the mineral surfaces to enhance fl otation rate differences. Several companies set up research departments to look for the solution and the competitive atmosphere must have made Broken Hill an exciting place for metallurgists, far removed from the hostile atmosphere of previous years. But the problem was tough and it still took four years to develop a selective fl otation process. During this time the Minerals Separation Company changed its emphasis from producing minerals by processing dumps to fl otation support services such as the sale of fl otation chemicals and cells, and consulting. It backed its new role by purchasing relevant patents and aggressively defending them. Its success turned it into a strong international company.
Horwood process
The fi rst fl otation process to produce a zinc-rich concentrate and lead-rich tails at Broken Hill was patented in 1909 by Edward James Horwood (Horwood, 1909). He joined BHP in

Spectrum Series 18
Z I N C A N D L E A D S U L F I D E S 1 9 0 2 – 1 9 2 0
39
1886 as a surveyor and was appointed Manager in 1906 so he saw the changes in fortune of BHP when secondary ore was mined profi tably, then was replaced by less profi table primary ore, then was profi table again when fl otation of dumps became a viable process. He knew that galena oxidised more rapidly than marmatite and he developed a process in which a mixed lead–zinc concentrate made from gravity plant slimes by fl otation was roasted at 400–500°C to form lead sulfate on the surface of galena and prevent it fl oating, while marmatite was not affected. Flotation of the roasted ore gave a zinc-rich froth and a lead-rich tails. Zinc Corporation tested this process for 16 months during 1913–4 with some success; the feed was 38.8 per cent zinc and 15.5 per cent lead, the zinc-rich concentrate contained 47.5 per cent zinc at 77 per cent recovery and the lead-rich tailings contained 34.2 per cent lead at 65 per cent recovery. But metal losses during drying and roasting were high and the process was discontinued. It was also tested at three small plants in the USA (Crabtree and Vincent, 1962), apparently without success.
Lyster process
Jim Lyster was a carpenter who worked for some years on the goldfi elds in Western Australia. In May 1907 he joined Zinc Corporation as foreman of the team building the new mill and was appointed superintendent of the mill when it was complete (Fairweather, 2000). Zinc Corporation started mining and processing underground ore in 1911 but only a lead–zinc concentrate could be made from slimes. Lyster was not satisfi ed with this low value product and when he saw the galena-rich froth which formed on the top of some processing machines he realised that freshly ground galena fl oated faster than marmatite and he patented the idea of fl oating the galena after grinding using a frother (Lyster, 1912). He set up a circuit at Zinc Corporation in which clean untarnished galena mixed with neutral or alkaline water from the mine was fl oated with a little eucalyptus oil, emphasising that the water should not be acid.
The cells used by Jim Lyster were Bradford-type cells (see later section on Leslie Bradford’s sulfur dioxide and copper sulfate processes) in which oil and air were mixed intimately with the pulp in a pump, and pump discharge entered a separator box in which a galena-rich froth was formed and overfl owed to a launder. Tailings entered the next pump/separator box unit in a sequence of eight units. After lead had been removed from the pulp marmatite was fl oated
FIGURE 2.19
Cell used by Jim Lyster at Zinc Corporation (left) (Hoover, 1914). Cells in series (right) (AusIMM Broken Hill Branch, 1930).

Spectrum Series 18
H I S T O R Y O F F L O TAT I O N
40
as a low-grade concentrate that was cleaned on gravity tables. The intensive mixing created a froth in the fi rst cell that was one metre high. This cell was the fi rst of the high intensity cells, which became widely used 60 years later and which also increased fl otation rates and produced copious froths. Lyster’s process operated from September 1912 to June 1924 and was the fi rst differential fl otation process. It made a concentrate containing 54.9 per cent lead at 82.4 per cent recovery from slimes containing 12.4 per cent lead and 8.8 per cent zinc (AusIMM Broken Hill Branch, 1930). His success in producing lead and zinc concentrates from the deleaded tailing contrasted with the lamentable technical failures that had almost destroyed Zinc Corporation during 1906–8. It contributed to increased metal production at Zinc Corporation and was the fi rst of the company’s many technical achievements.
Owen process and the Cascade cell
The Junction North mine had leases next to North Broken Hill Ltd but its ore reserves were small and were diffi cult to process because of high content of rhodonite. Research was necessary to produce saleable concentrates and the company spent heavily on expensive experiments. T M Owen was mill superintendent at Junction North and he patented a selective fl otation process in June 1913:
I have discovered that by introducing a stream of minutely divided air bubbles into the pulp at or near the bottom of the separating vessel and by regulating the said stream of air bubbles it is possible to obtain successive fl oat concentrates (such as galena), and then of the less readily fl oated sulphides (such as blende) (Woodward, 1965).
Owen recognised the importance of airfl ow in controlling the quality of concentrates. Junction North may have been a small company with limited resources but there was no lack of ideas.
On 30 July 1914 H V Seale (Junction North) and W Shellshear (Minerals Separation) patented a cascade machine in which pulp was elevated to the top of six pots in echelon and was aerated as it dropped between pots with the formation and overfl ow of froth. The cascade cells built at Junction North required little energy and were used in various forms in Broken Hill for several years. Research at Junction North did not stop at cells, it continued to fl otation chemicals. In September 1918 company staff wrote that:
FIGURE 2.20
Zinc Corporation in 1912 (left) (Archbald, 1912) and 1920 (right).

Spectrum Series 18
Z I N C A N D L E A D S U L F I D E S 1 9 0 2 – 1 9 2 0
41
… the addition of elemental sulphur to a fl otation mass exalts the tendency of sulphides and certain other metalliferous substances to separate from each other and from gangue when the mass is submitted to fl otation treatment (Palmer, Seale and Nevett, 1918).
This foreshadowed the use of xanthates, which were patented in the USA in 1923 and
which transformed sulfi de fl otation technology.
In 1916 Broken Hill South formed a committee to choose a fl otation process for their slimes and the Owen process was selected. This process made a concentrate containing 60 per cent lead at 84 per cent recovery from slimes containing ten per cent lead. Its success in a rival mill was a measure of the value of Owen’s contributions to fl otation.
Leslie Bradford’s sulfur dioxide and copper sulfate processes
Leslie Bradford joined BHP at Broken Hill in 1898 (Fairweather, 1993). He was described as ‘gently spoken, sensitive and withdrawn, enthusiastic and intense’ and his career as an engineer, manager, entrepreneur and unlikely gambler can be described as unique. He led the team of metallurgists who made Delprat’s process a commercial success, he was BHP’s expert witness in the long legal dispute over Delprat’s and Potter’s patents, he contributed much to steelmaking technology when he was transferred to BHP’s Newcastle steelworks, he was General Manager of BHP for eight years and he established two companies concerned with products of steelworks – Bradford Insulation, which used steel slag as insulation and Bradford Kendall, which became a leading foundry. Technology was logical and predictable to a scientist such as Leslie Bradford but funding was a problem in those diffi cult times so he funded Bradford Kendall by punting on a racehorse which had four straight wins, reinvesting gains each time on the next race. The decision about making the fi nal wager must have been diffi cult.
FIGURE 2.21
Inventions at Junction North mine. Air added to the impellor (left)(Owen, 1913) and cascade cell (right) (Seale and Shellshear, 1914).

Spectrum Series 18
H I S T O R Y O F F L O TAT I O N
42
Bradford’s fi nest achievement in fl otation was using activators and depressants to make separate lead and zinc concentrates, although his honorary Fellowship of the Sydney Technical College – a rare award – was given for his original research in the steel industry. He had worked with Horwood on the depression of galena by mild roasting and two years later he found that the same effect of ‘deadening’ galena without affecting blende could be obtained by fl oating a lead–zinc concentrate in a slightly acid solution of common salt (Bradford, 1913a). When the galena could not be fl oated he activated and fl oated the zinc sulfi de by adding copper sulfate (Bradford, 1913b) and this was one of the most important discoveries in selective sulfi de fl otation. His discovery was not patented in North America where John Myers’ US patent for copper sulfate had priority, although Myers’ patent was granted several months after Bradford’s Australian patent.
Bradford’s next conclusion was that sulfur dioxide generated directly from sulfur or from reducing salts such as thiosulfates or sulfi tes depressed marmatite (Bradford, 1915). This led to a circuit in which marmatite in gravity plant tailings was depressed by sulfur dioxide, galena was fl oated and then marmatite was fl oated from deleaded tailings after activation by copper sulfate. Metabisulfi te is still used for zinc depression while fl oating copper and/or lead minerals. BHP used Bradford’s processes for several years to process slimes in their dams. The profi t was large and was welcome in BHP since capital was required for the steelworks being built at Newcastle. When the dumps were fi nished BHP modifi ed its plant circuits to eliminate vanners and use only jigs and fl otation cells.
The copper sulfate and sulfur dioxide processes marked the end of Leslie Bradford’s period as a mineral processing engineer; few other metallurgists have made contributions to fl otation technology of similar magnitude. He was transferred to the Newcastle steelworks in 1915 and appointed Manager in 1924. In 1940 he became Acting General Manager of BHP when Essington Lewis was appointed Director General of Munitions to prepare Australia for World War II and he guided the Company during diffi cult wartime years. BHP’s fi nal contribution to fl otation at Broken Hill was to use hydrogen sulfi de to prepare 500 000 tons of oxidised lead slimes containing 8.5 per cent lead for fl otation. Recovery was 75 per cent in 43 per cent lead concentrate, a good result for oxidised slimes and a suitable fi nish to a memorable period of technical achievement.
FIGURE 2.22
Flotation cell used for selective fl otation in the BHP plant (AusIMM Broken Hill Branch, 1930).

Spectrum Series 18
Z I N C A N D L E A D S U L F I D E S 1 9 0 2 – 1 9 2 0
43
The role of Minerals Separation in developing the fl otation process
By 1910 Minerals Separation had grown from a small consultancy formed in England in 1903 to a company which was processing tailings at Broken Hill in association with the Central Mine and making fl otation cells for use in the Minerals Separation process licensed by other mines. It was not interested in underground mining and when the directors found that high-grade dumps for processing were not easy to acquire they made the decision to cease processing and concentrate their activities on consulting and selling cells and fl otation chemicals. They established research and testing laboratories in England, Broken Hill and Melbourne to improve the process and test it on other ores. They were able to use the plant at the Central mine at Broken Hill as a training ground for metallurgists assigned to take fl otation technology to North and South America.
Flotation cellsThe Minerals Separation cell was widely used in fl otation circuits and was the model for cells made by other manufacturers. Its main features were intensive mixing and addition of air at the impeller. Three reasons for its success were:
1. air was broken up by the impeller and turbulence in the pulp into fi ne bubbles which
enhanced the fl otation rates of slimes in particular,
2. the intensive mixing caused particles to contact air bubbles and adhere to them, and
3. intense agitation emulsifi ed the oils and improved their coatings on sulfi des.
Hot pulps helped this, particularly when it reduced the viscosity of heavy mineral oils.
Flotation chemicalsThe usual Minerals Separation fl otation conditions from its early days were a hot pulp which was slightly acidic and oleic acid added as an oil. Chemical additives became important when differential fl otation was investigated and some Minerals Separation discoveries which assisted this were:
• The use of oil of the eucalyptus tree, which was plentiful in Broken Hill, as a frother. Minerals Separation’s metallurgist Henry Lavers discovered this during his experiments in Broken Hill and the patent was taken out by Lavers and General Manager Howard Greenway in 1909 (Greenway and Lavers, 1913). It had the unusual advantage that its medicinal value reduced stomach upsets amongst mill operators. It was still used as a frother, but probably less as a medicine 60 years later.
• Chromium salts, which prevent the fl otation of some sulfi des. This discovery was patented by Lowry and Greenway in 1912 and heralded the use of chemical depressants in fl otation. It is surprising that Minerals Separation seemed to make little use of this discovery at the time and left the fi eld open to Leslie Bradford of BHP, who made the idea of depression and activation a reality. Minerals Separation was unable to persuade Bradford to sell them his patents, which was an unfortunate decision for him since he failed to win rights to patent fees during a later trip to the USA. Potassium dichromate was used at Broken Hill in the 1950s to depress galena while chalcopyrite was being fl oated from lead concentrate.

Spectrum Series 18
H I S T O R Y O F F L O TAT I O N
44
• Potassium ethyl xanthate as a collector for sulfi de minerals. This was a discovery by Minerals Separation metallurgists in the USA and is discussed in Chapter 3, suffi ce it here to write that soluble xanthates improved sulfi de fl otation greatly and were used at all Broken Hill mines.
By 1911 Minerals Separation had become the leader in fl otation technology at Broken Hill and the Hoover cell was becoming popular because it could profi tably handle lower grade ores and the slimes inevitably produced during grinding. De Bavay’s cell could not handle slimes and Elmore’s vacuum cell could not make a profi t on lower grade ores. In 1912 a new company, Minerals Separation and De Bavay Processes Pty Ltd, was formed to control the patents owned by Minerals Separation and Amalgamated Zinc (De Bavay). The Elmore brothers faded from the scene in Broken Hill when the Minerals Separation cell replaced the vacuum cell at Zinc Corporation, although their cells were used in other countries for many more years. By 1915, when the separation of galena from marmatite was an accepted process, the only signifi cant patents Minerals Separation did not own were those held by Leslie Bradford at BHP. Minerals Separation installed fl otation circuits in several small plants in Australia outside Broken Hill during 1911–14 with reasonable success, but its interest had by then turned to the low-grade copper mines in North America and its next move was to the Braden mine in Chile, which was part of the copper empire controlled by the Guggenheim brothers.
LEGACIES OF FLOTATION RESEARCH AT BROKEN HILL
The value of a new technology can be assessed in terms of its permanence and its legacies and fl otation ranks high on both scales. It started with a few ideas in 1902 and it transformed the mining industry in 15 years, a remarkably short time. There was no precedent, every ore had its own problems, every problem had to be solved on the spot, and knowledge had to be accumulated slowly. At Broken Hill the plants became research laboratories and the results were always on view because the dumps, which were the sites of the research programs, dominated the town. Six years after Delprat’s fi rst observation in the laboratory that marmatite would fl oat on gas bubbles Broken Hill was producing one third of the world’s zinc, in another six years minerals were being activated and depressed and preferential fl otation had become a reality. The legacies of the 12 year research and development program were a strong mining industry at Broken Hill, which continued for another 100 years, a revitalised base metal mining industry worldwide, downstream processing of minerals in Australia including a zinc manufacturing industry and a steelworks, and a culture of research in the minerals industry that has served Australia well to the present day. These will be discussed.
Downstream processing
When the world war started in 1914 there was little secondary industry in Australia and during 1915–1920 Broken Hill companies chose to use the wealth generated by fl otation to build downstream processing plants.
In 1915 BHP purchased a steelworks in the USA and rebuilt it in Newcastle, New South Wales. The iron ore which fed it came from deposits in South Australia which were being mined to provide fl ux minerals for BHP’s Port Pirie lead smelter and the coal came from
Spectrum Series 18
Z I N C A N D L E A D S U L F I D E S 1 9 0 2 – 1 9 2 0
45
local mines. Leslie Bradford was transferred to Newcastle from Broken Hill to solve the serious technical problems which were encountered and the research skills he had developed in the fl otation plant served him well despite the diffi culties of the tasks (Scott, 1987). The steelworks and the satellite companies which were built in Newcastle formed the leading industrial complex in Australia for many years.
In 1916 the Collins House Group (North Broken Hill, Broken Hill South, Amalgamated Zinc (De Bavay’s) and Zinc Corporation) established an electrolytic zinc refi nery in Risdon, Tasmania, using products from Broken Hill and Port Pirie. It was a case of the Ashcroft process revisited. The failure of the electrolytic zinc process at Cockle Creek in 1897 became Anaconda Corporation’s success when it found zinc ore in Montana and built a zinc fl otation plant in 1911. Metallurgists from Anaconda and Cominco developed an electrolytic process for making zinc and plants were built in 1915. This persuaded the Collins House Group, led by W L Baillieu, to form the Electrolytic Zinc Company to make zinc in Tasmania where there was ample hydro electricity. Herbert Gepp, formerly at Broken Hill, was given the task of building the plant at Risdon. In six years he built a pilot plant to produce 99.95 per cent zinc using hydro power (1917), then a ten tonne plant (1918–20), then a 100 tonne plant (1922). The task was comparable to the creation of the Newcastle steel industry, but the technical problems were greater and brought Electrolytic Zinc to the brink of failure (Kennedy, 1981). W L Baillieu pledged the family fortunes in 1920 to support the project and his insight proved to be correct because the time he won with the injection of money allowed the problems to be fi xed and the plant to operate successfully (Poynter, 1979). It was similar to his support of fl otation at Broken Hill when Zinc Corporation was fl oundering and required more time to fi x its problems.
Gepp and Baillieu brought the culture of research to Electrolytic Zinc and Gepp established a strong research department at Risdon. He retained Sir David Masson, Professor of Chemistry at the University of Melbourne, as a consultant and this link eventually led to a style of research collaboration that was suited to the small and isolated scientifi c community that existed in Australia.
Collaborative research
When fl otation had become a routine process Broken Hill companies realised that better results could be obtained by knowing more about the process itself and about the ores which were being processed. They took the unusual step of establishing collaborative research programs in these areas.
Flotation researchIn 1929 Ian Wark started research at the University of Melbourne on the principles of mineral fl otation, supported fi nancially by mining companies in the Collins House Group. At the time it was generally accepted that the contact angle between the bubble and the mineral was a measure of the strength of adhesion, but data available were scattered and unreliable. He developed an experimental technique to provide accurate, reliable and reproducible data by scrupulously cleaning and polishing the surfaces of the mineral specimens before immersing them in water and contacting them with air bubbles. He used this procedure to examine

Spectrum Series 18
H I S T O R Y O F F L O TAT I O N
46
quantitatively the effects of collectors, activators and modifi ers on the contact angle and out of this came the contact-no-contact curves that were a guide to the chemical environment for best separation effi ciency. He had one assistant supported by the companies, a part time assistant supported by the university, and his accommodation at the University was spartan, but the quality of his research was so high that he was able to add much to the understanding of how fl otation worked. His book, Principles of Flotation, became a valuable addition to the libraries of companies and metallurgists and did much to build a solid foundation for future cooperative research programs between universities and mining companies.
Mineragraphy researchWhile fl otation research was fl ourishing in the University of Melbourne’s chemistry department the mineragraphy group, which was also supported by the mining industry, was fl ourishing next door in the geology department. It was led by Dr Frank Stillwell, who was appointed to the department in 1924 and was joined by Dr Austin Edwards in 1934. They became skilled in the diffi cult art of polishing before the advent of diamond pastes and in microscopy and microchemical tests. They applied their skills to resolving the basic ore mineralogy of Australian ore deposits with much of their work being directed to ore benefi ciation in association with the university ore dressing laboratory.
AMIRAThe mineragraphy and fl otation programs at the University of Melbourne demonstrated what could be done by scientists working at a university in association with the minerals industry. When the fi rst post World War II minerals boom occurred and better processes and equipment were required the scene was set for a venture into collaborative research and the initiative was taken by Maurice Mawby, Managing Director of CRA Ltd. Mawby was born and educated in Broken Hill where he worked at the Junction North mine from 1922–28 and studied metallurgy and geology at night at the Technical College. He moved to Zinc Corporation where his interest in applied research led to many improvements in milling performance. His continuing support of research as Managing Director of CRA Ltd brought economic benefi ts to the company because it improved the quality of its core technologies in geology, mining, mineral processing and smelting. He carried his interest in research into the wider industry and became President of the Australian Mineral Industries Research Association (AMIRA) when it was founded in 1959. AMIRA’s objectives were to identify problems and match them with existing research facilities in projects sponsored by interested companies. This concept proved to be very successful and now extends worldwide. It is an unexpected and very important legacy of the fl otation work which was so successful 50 years previously.
FLOTATION AT BROKEN HILL AFTER 1915
By 1915 there had been 13 years of intensive research and development at Broken Hill and the successes achieved after the early tumultuous years led to fl otation being accepted as a conventional concentration process. Interest then turned to improving mineral recoveries and concentrate grades and to reducing costs. One problem was that pyrite was activated

Spectrum Series 18
Z I N C A N D L E A D S U L F I D E S 1 9 0 2 – 1 9 2 0
47
in acid circuits and fl oated with marmatite, albeit at slower rates, and this was one reason to change to an alkaline circuit. Jim Lyster must have known that alkaline circuits reduced the pyrite problem since his 1912 preferential fl otation process required an alkaline or neutral pulp. In 1930 the circuit at Zinc Corporation was changed from acid to alkaline and concentrate grades improved (Nevett, 1930). Gradually gravity–fl otation circuits in mills along the line of lode were replaced with all fl otation circuits but there were no more major technological advances until the 1960s when Broken Hill metallurgists contributed to the post World War II surge of technical progress in fl otation, notably in on-stream analysis.
THE EXPANDING MARKET FOR FLOTATION
By 1910 the Minerals Separation process had become the preferred fl otation process at Broken Hill because the fi ne bubbles created by intensive mixing could recover sulfi de slimes coming from the grinding circuit product better than competing processes. It was time for Minerals Separation to look at the market for fl otation beyond Broken Hill. Copper sulfi des beckoned with the immediate targets being central Queensland, where W L Baillieu and W S Robinson had fi nancial interests in copper mines, and North America, where porphyry copper deposits of low-grade, fi ne-grained ores had to be mined because the rich ores were being exhausted. In 1910 Minerals Separation installed fl otation cells at Great Fitzroy Mines Ltd in central Queensland but the venture failed, perhaps because of poor grinding, and the mine was closed. Fortunately for Minerals Separation Adam Boyd, manager of Mount Morgan Ltd, which was mining a large copper–gold deposit nearby, had worked at Broken Hill and had seen the benefi ts of fl otation. He was not daunted by the failure at Great Fitzroy because he knew that the process was temperamental and his confi dence was rewarded when the 600 tons per day Minerals Separation fl otation circuit, which he built after successful tests in 1912, eventually recovered 93 per cent of the copper and 80 per cent of the gold (Kerr, 1982).
Flotation was also tried in other small copper mines in Australia during 1911–12 with variable but generally good results. One location was the Devon mine at Kadina near Adelaide where the rich copper ore mined for many years was exhausted and low-grade ore was being mined. Eucalyptus oil and sulfuric acid were the reagents used. Minerals Separation actively
FIGURE 2.23
Minerals Separation fl otation cells at Kadina, South Australia, in 1911 (Drexel, 1982).
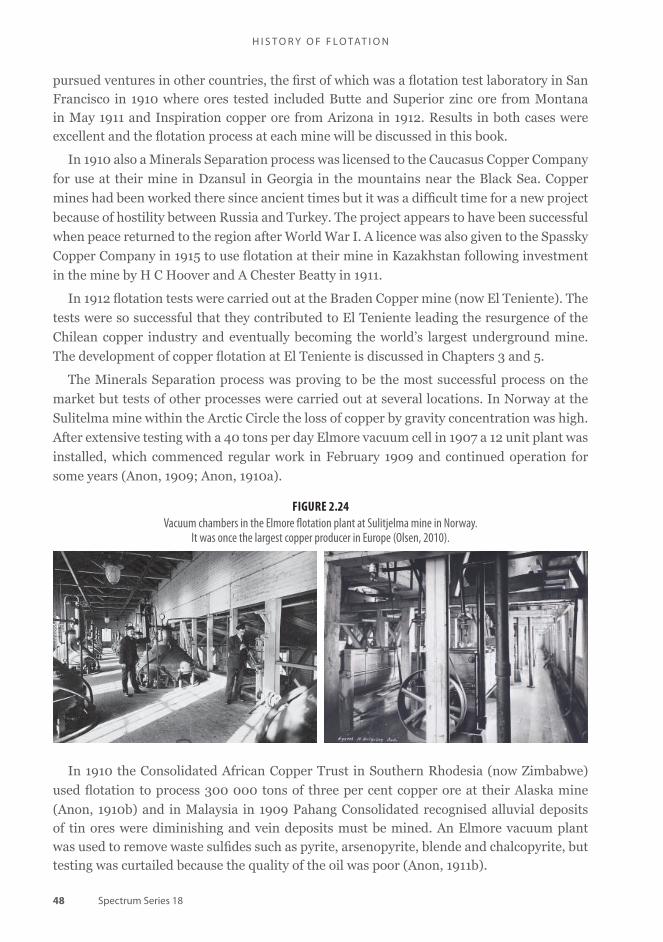
Spectrum Series 18
H I S T O R Y O F F L O TAT I O N
48
pursued ventures in other countries, the fi rst of which was a fl otation test laboratory in San Francisco in 1910 where ores tested included Butte and Superior zinc ore from Montana in May 1911 and Inspiration copper ore from Arizona in 1912. Results in both cases were excellent and the fl otation process at each mine will be discussed in this book.
In 1910 also a Minerals Separation process was licensed to the Caucasus Copper Company
for use at their mine in Dzansul in Georgia in the mountains near the Black Sea. Copper
mines had been worked there since ancient times but it was a diffi cult time for a new project
because of hostility between Russia and Turkey. The project appears to have been successful
when peace returned to the region after World War I. A licence was also given to the Spassky
Copper Company in 1915 to use fl otation at their mine in Kazakhstan following investment
in the mine by H C Hoover and A Chester Beatty in 1911.
In 1912 fl otation tests were carried out at the Braden Copper mine (now El Teniente). The
tests were so successful that they contributed to El Teniente leading the resurgence of the
Chilean copper industry and eventually becoming the world’s largest underground mine.
The development of copper fl otation at El Teniente is discussed in Chapters 3 and 5.
The Minerals Separation process was proving to be the most successful process on the
market but tests of other processes were carried out at several locations. In Norway at the
Sulitelma mine within the Arctic Circle the loss of copper by gravity concentration was high.
After extensive testing with a 40 tons per day Elmore vacuum cell in 1907 a 12 unit plant was
installed, which commenced regular work in February 1909 and continued operation for
some years (Anon, 1909; Anon, 1910a).
FIGURE 2.24
Vacuum chambers in the Elmore fl otation plant at Sulitjelma mine in Norway.It was once the largest copper producer in Europe (Olsen, 2010).
In 1910 the Consolidated African Copper Trust in Southern Rhodesia (now Zimbabwe)
used fl otation to process 300 000 tons of three per cent copper ore at their Alaska mine
(Anon, 1910b) and in Malaysia in 1909 Pahang Consolidated recognised alluvial deposits of tin ores were diminishing and vein deposits must be mined. An Elmore vacuum plant was used to remove waste sulfi des such as pyrite, arsenopyrite, blende and chalcopyrite, but testing was curtailed because the quality of the oil was poor (Anon, 1911b).

Spectrum Series 18
Z I N C A N D L E A D S U L F I D E S 1 9 0 2 – 1 9 2 0
49
T Inouye described the zinc mining preparations of the Mitsui company in Japan. The ore was dressed in jigs, Wilfl ey tables and buddles, lead and zinc concentrates being obtained together with zinc middlings. These middlings were sent to fl otation plant, which was based on the modern Potter process, that is, using hot acid and a small amount of heavy oil. The zinc content was thereby raised from 20 to 45 per cent and the fi nal tailing assays fi ve to six per cent (Anon, 1912).
FLOTATION OF ZINC AND LEAD ORES IN NORTH AMERICA
Black Rock mine, Butte and Superior Company, Montana
The fi rst fl otation plant in the USA was at the zinc mine of Butte and Superior Company in Montana (Hines and Vincent, 1962). This was not surprising because froth fl otation was known to work on zinc ore and the process tested at Butte and Superior was similar to the Minerals Separation process because it was designed by a former Minerals Separation employee. Minerals Separation itself was not involved, except in a dispute about patents and their disappointment must have been bitter. Butte and Superior was one of many mining companies working in Butte in 1900 and in 1906 it started to explore the Black Rock mine, which was located in the heart of Butte Hill. Zinc was discovered and in 1909 the Basin gravity plant, which was 15 miles away, was leased to process the ore.
FIGURE 2.25
Flotation cells used in Basin mill (left) (Fuerstenau, 1962). A sketch of the rougher–cleaner circuit in theBasin mill given in Hyde’s patent (right) (Hyde, 1912). This was the fi rst froth fl otation circuit in the USA.
The best results obtained by gravity processing of the Black Rock ore were only moderate, 63.2 per cent zinc recovery in a 49.1 per cent zinc concentrate. By 1911 one million tons of ore containing 21.7 per cent zinc and 7.9 oz silver had been proved and a sample was sent to the Minerals Separation laboratory in San Francisco to test its response to fl otation. This laboratory was set up in 1910 and was the fi rst venture by Minerals Separation in North America. T J Hoover had appointed fellow Stanford University graduates Edward Nutter and James Hyde to Minerals Separation North America; Nutter as chief engineer based at the laboratory and Hyde to work in Mexico.
In March 1911, after both Nutter and Hyde had been trained in the Minerals Separation fl otation technique, Hoover and Hyde had a dispute with company directors and resigned;

Spectrum Series 18
H I S T O R Y O F F L O TAT I O N
50
Hyde to become a consultant for Butte and Superior and Hoover to work as a company director and consultant before returning to Stanford University, where he became Dean of Engineering. Nutter and Hyde competed for the fl otation consultancy at Butte and Superior and separately predicted that the process would be successful. James Hyde won the contract to build a plant in the Basin mill to fl oat 50 tons of ore per day and in August 1911 he operated the fi rst froth fl otation process in the USA on gravity slimes containing 92 per cent –150 mesh. Typical Minerals Separation practice was followed, oleic acid was the frother-collector, the pulp was acid and the fl otation cells appeared to be clones of the Minerals Separation cell. Hyde was the fi rst to use cleaner cells to produce high-grade concentrates and to return cleaner tails to the middle of the rougher bank, as shown in the sketch in the patent.
Flotation results at Butte and Superior were good enough for a 1200 tons per day gravity–fl otation plant to be built at Butte in June 1912. The ore proved to be ideal for fl otation and in 1915 when the plant was running well it processed 522 300 tons of 17.2 per cent zinc ore and made 53.6 per cent zinc concentrate at 92.2 per cent recovery. Several engineers who would become famous gained experience at Butte and Superior, one eminent engineer being John Myers, who moved to American Zinc in Tennessee and found there that zinc would not fl oat in a wooden cell but would fl oat in a copper-lined cell. In 1914 he patented the use of copper sulfate to activate zinc one year after Leslie Bradford gained a similar patent in Broken Hill.
Flotation was also used by the Timber Butte Mining and Milling Company, which had a
15 per cent zinc deposit adjacent to the Butte and Superior deposit. The ores were similar in
metallurgical properties and in 1914 the company built a plant to process 600 tons of ore per
day using Minerals Separation cells in rougher and cleaner circuits and gravity concentrators.
The Timber Butte concentrator was typical of mills built in mountainous regions at the
time; the ore was crushed and hauled up 220 ft, then the pulp fl owed by gravity through
grinding mills and concentrating machines to the product bins and tailings dam. Selective
fl otation was introduced at Timber Butte in 1919 to give higher grade concentrates,
the depressant for sphalerite in the lead circuit used at the time was sodium sulfi de but
sodium cyanide replaced it in 1922 (Sheridan and Griswold, 1922) and became the standard
depressant for sphalerite and pyrite.
FIGURE 2.26
Butte and Superior plant in Montana (Megraw, 1918).

Spectrum Series 18
Z I N C A N D L E A D S U L F I D E S 1 9 0 2 – 1 9 2 0
51
Missouri lead–zinc ores
Flotation then moved from the zinc ores in Montana to the lead–zinc ores in Missouri. Lead mining had been carried out in small mines in Missouri since the mid 18th century and during the next 100 years they produced suffi cient metal to meet the small national demand, which in 1827 was only 10 000 tons. But economic growth and the Civil War increased the demand and in 1900 343 000 tons of lead was produced in the USA with most of it coming from the Missouri region. St Joe Lead Company was formed in 1864 to operate lead mines in Missouri and it became the main lead producer in the USA. The ores contained coarse particles of galena and sphalerite in a dolomitic limestone and were easy to concentrate, but even with this advantage the company had fi nancial problems as it coped with decreasing ore grades, increasing feed rates and metal loss in gravity machine tailings. In 1913 St Joe modernised the mining and milling system and introduced fl otation.
Fifty years later St Joe was milling ore with the same circuit and obtaining excellent results. The company was a leader in technical progress and the fi rst all-fl otation mill in Missouri appears to have been the Federal mill built by ASARCO and bought by St Joe in 1923. When St Joe’s Indian Creek mill started operations in 1953 it was the fi rst windowless
FIGURE 2.27
Timber Butte mill (top) (ARTBYOXO, 2008). Mill layout using gravity fl ow. Flotation cells are in section two (bottom) (Simons, 1916).

Spectrum Series 18
H I S T O R Y O F F L O TAT I O N
52
mill illuminated by indirect lighting. This may have helped operators control the fl otation process visually at a time when on-stream analysis was not available, but windowless mills did not become a fashion.
Cominco
The fi rst fl otation plants operated on copper, lead and zinc ores in which the valuable sulfi de minerals were coarse grained and fl oated rapidly. Then an investigation started into the fl otation of ore from Cominco’s huge lead–zinc deposit (the Sullivan ore), which was near Kimberley, British Columbia, and which had been mined for some years with mediocre results. This was a massive sulfi de ore containing 13.6 per cent galena, 14.4 per cent marmatite, one per cent pyrite and 61 per cent pyrrhotite. The minerals were fi ne grained and intimately associated, unlike the porphyry copper and Missouri lead ores in which the valuable sulfi des were coarser and responded well to fl otation. Laboratory fl otation tests were promising and a pilot mill was built at Trail in 1920 for testing fl ow sheets and reagents. It had a capacity of 1100 tons per day; testing continued for three and a half years and 1 076 368 tons of ore were fl oated. A differential fl otation process was proved and a 3500 tons per day plant was built, which commenced operation in August 1923 (Diamond, 1928).
The fl ow sheet was the most complex used in fl otation plants at the time, particular features being that the ore was ground to 87 per cent passing 75 microns in open circuit rolls and three stages of ball mills and classifi ers, lead and zinc roughing was carried out in 18 cell Minerals Separation machines and both concentrates were cleaned twice to give high-grade products (69 per cent lead and 49 per cent zinc), lead cleaner tails were returned to primary grinding and a separate zinc middling plant was used to regrind and fl oat zinc cleaner tails. Much attention was given to the best method of processing middlings:
… we can return lead middling to the original grind, even to the extent of a high percentage of the total lead circulating, and maintain good results. Not so with zinc middling, particularly if the zinc content of feed is high. It is our opinion that the ideal disposal for middling is to separate units for retreatment of middling products (Diamond, 1928).
With the successful operation of the new Sullivan mill Cominco showed that separate concentrates could be made from fi ne-grained polymetallic ores by using circuits which were more complex than those required for simpler ores. During the next 20 years the feed rate
Per cent metal Per cent recovery
Lead Zinc Lead Zinc
Mill feed 2.70 0.22 100 100
Jig concentrate 78.0 0.30 8.0 -
Lead concentrate 79.0 1.30 90.0 21.0
Zinc concentrate 3.50 52.0 - 65.0
Tailing 0.05 0.03 2.0 14.0
TABLE 2.3
Results of the gravity–fl otation circuit at St Joe Lead Co Indian Creek division (Tveter and McQuiston, 1962).
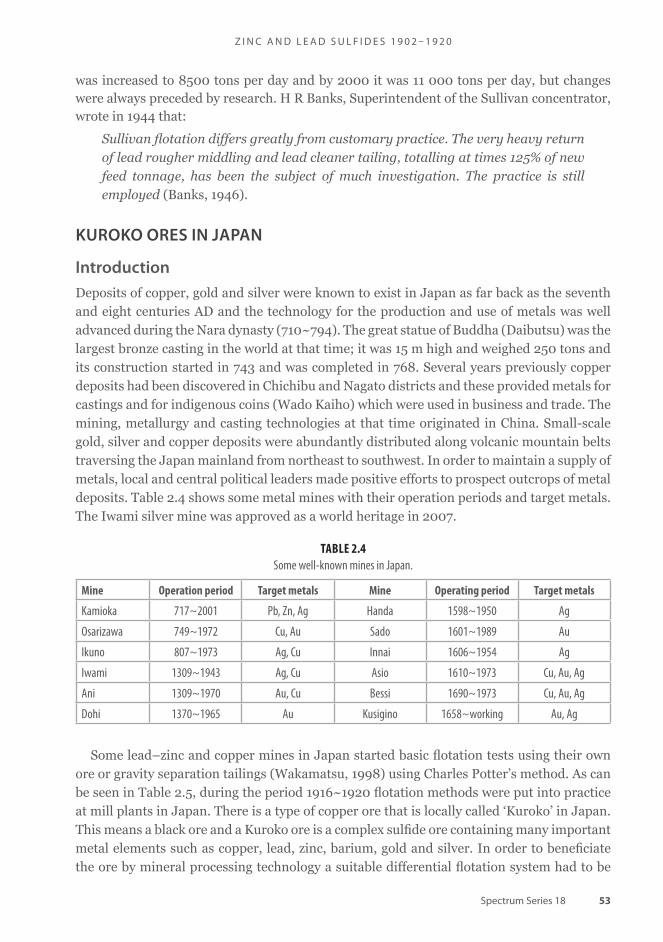
Spectrum Series 18
Z I N C A N D L E A D S U L F I D E S 1 9 0 2 – 1 9 2 0
53
was increased to 8500 tons per day and by 2000 it was 11 000 tons per day, but changes were always preceded by research. H R Banks, Superintendent of the Sullivan concentrator, wrote in 1944 that:
Sullivan fl otation differs greatly from customary practice. The very heavy return of lead rougher middling and lead cleaner tailing, totalling at times 125% of new feed tonnage, has been the subject of much investigation. The practice is still employed (Banks, 1946).
KUROKO ORES IN JAPAN
Introduction
Deposits of copper, gold and silver were known to exist in Japan as far back as the seventh and eight centuries AD and the technology for the production and use of metals was well advanced during the Nara dynasty (710~794). The great statue of Buddha (Daibutsu) was the largest bronze casting in the world at that time; it was 15 m high and weighed 250 tons and its construction started in 743 and was completed in 768. Several years previously copper deposits had been discovered in Chichibu and Nagato districts and these provided metals for castings and for indigenous coins (Wado Kaiho) which were used in business and trade. The mining, metallurgy and casting technologies at that time originated in China. Small-scale gold, silver and copper deposits were abundantly distributed along volcanic mountain belts traversing the Japan mainland from northeast to southwest. In order to maintain a supply of metals, local and central political leaders made positive efforts to prospect outcrops of metal deposits. Table 2.4 shows some metal mines with their operation periods and target metals. The Iwami silver mine was approved as a world heritage in 2007.
Mine Operation period Target metals Mine Operating period Target metals
Kamioka 717~2001 Pb, Zn, Ag Handa 1598~1950 Ag
Osarizawa 749~1972 Cu, Au Sado 1601~1989 Au
Ikuno 807~1973 Ag, Cu Innai 1606~1954 Ag
Iwami 1309~1943 Ag, Cu Asio 1610~1973 Cu, Au, Ag
Ani 1309~1970 Au, Cu Bessi 1690~1973 Cu, Au, Ag
Dohi 1370~1965 Au Kusigino 1658~working Au, Ag
TABLE 2.4
Some well-known mines in Japan.
Some lead–zinc and copper mines in Japan started basic fl otation tests using their own ore or gravity separation tailings (Wakamatsu, 1998) using Charles Potter’s method. As can be seen in Table 2.5, during the period 1916~1920 fl otation methods were put into practice at mill plants in Japan. There is a type of copper ore that is locally called ‘Kuroko’ in Japan. This means a black ore and a Kuroko ore is a complex sulfi de ore containing many important metal elements such as copper, lead, zinc, barium, gold and silver. In order to benefi ciate the ore by mineral processing technology a suitable differential fl otation system had to be

Spectrum Series 18
H I S T O R Y O F F L O TAT I O N
54
developed and in this section the history of fl otation for the treatment of complex sulfi de Kuroko ores is reviewed, focusing on mill plants at Kosaka and Hanaoka mines, Dowa Mining Company. Kuroko ores were particularly diffi cult to fl oat and research programs to achieve good results continued over many decades.
Kuroko deposits and minerals
The deposits of Kuroko are generally found only in the region of ‘green tuff’, which is a submarine pyroclastic rock in northern part of Honshu Island, especially in Hokuroku district of Akita prefecture. They belong to the type of volcanogenic massive sulfi de ore deposit (VMSO) that are mostly stratiform accumulations of sulfi de minerals that precipitate from hydrothermal fl uid at or below the sea fl oor in a wide range of ancient geological settings (Mizuta and Ishiyama, 2003). The ore is a very fi ne-grained intergrowth of chalcopyrite, galena, sphalerite, pyrite, barite and gold and silver minerals with gangue minerals such as quartz, gypsum and clay minerals. It was so sticky that clay was washed out with a drum scrubber followed by screens. The slime fraction from the washing section was generally thickened and treated through a slime-process circuit including cyclones, decanters and fl otation. The products of the slime-process circuit were fed to the appropriate section of the principal concentration circuit, with the tailing being discarded to the dam.
According to the mineral assemblage, Kuroko deposits are locally classifi ed into three types, as follows:
1. Kuroko (in narrow sense black ore): this is black compact ore containing dark iron-rich sphalerite, galena, barite and minor quantities of chalcopyrite, pyrite and tetrahedrite.
2. Oko (yellow ore): this is characterised by a yellow colour resulting from the abundant presence of chalcopyrite and pyrite. Sphalerite and galena are rare.
3. Keiko (siliceous ore): this is compact siliceous ore containing chalcopyrite and pyrite in impregnated form.
Major Kuroko deposits found by Dowa Mining Company in Hokuroku district are listed in Table 2.6.
Flotation of Kuroko ores at Hanaoka mine
Tests were carried out for Kuroko fl otation at Hanaoka mine using Doyashiki ore as a test
sample in the period of 1928~1930. In November 1930 the Kamiyama mill was built using
Mine Flotation
~1901 Kamioka Pb–Zn mine Basic tests by Potter’s method to zinc on middling product of gravity separation
1909 Akenobe Cu mine Basic tests by Potter’s method for copper ore
1916 Asio Cu, Ikuno Ag–Cu mines Plant practice of copper fl otation
1917 Kamioka Pb–Zn mine Plant practice of zinc fl otation
1917, 1919 Hitachi, Osarizawa Cu mines Plant practice of copper fl otation
TABLE 2.5
Important years in the history of mineral fl otation in Japan.

Spectrum Series 18
Z I N C A N D L E A D S U L F I D E S 1 9 0 2 – 1 9 2 0
55
a differential fl otation circuit and this was the fi rst use of Kuroko fl otation in plant practice
(Orii, 1963). For the fi rst two months in 1930 the mill produced copper–lead and zinc
concentrates, then the copper–lead separation circuit was added to the mill early in 1931. In
the 1931 circuit copper–lead bulk concentrate was fi rst recovered with xanthate as a collector
at pH 10~11, then it was refl oated adding NaCN to depress copper minerals. The froth
product was the lead concentrate and the tailings product was the copper concentrate. Zinc
concentrate was produced by refl oating bulk fl otation tailings with copper sulfate added as
an activator. Table 2.7 shows a fl otation result at the Kamiyama mill in 1932. The Kamiyama
mill plant started to recover barite concentrate from the zinc fl otation tailings with fatty acid
as a collector in 1935. Barite fl otation performed well with 95.3 per cent BaSO4 concentrate
and 95.5 per cent BaSO4 recovery.
Kuroko deposit Year of discovery (closing) Mine Company
Motoyama 1861 (1946) Kosaka Fujita, Dowa
Doyashiki 1915 (1975) Hanaoka Fujita, Dowa
Uchinotai 1959 (1989) Kosaka Dowa Mining Co
Uwamuki 1962 (1989) Kosaka Dowa Mining Co
Matsumine 1963 (1995) Hanaoka Dowa Mining Co
Fukazawa 1969 (1995) Hanaoka Dowa Mining Co
Ezuri 1976 (1995) Hanaoka Dowa Mining Co
TABLE 2.6
Major Kuroko deposits (Dowa Mining Company, 1985).
Material Grade (%) Recovery (%)
Copper Lead Zinc Copper Lead Zinc
Feed 2.24 10.0 22.0 100 100 100
Copper concentrate 6.85 - - 72.1 - -
Lead concentrate - 68.2 - - 46.8 -
Zinc concentrate - - 49.1 - - 43.6
TABLE 2.7
Flotation of Kuroko ore in the Kamiyama mill in 1932.
Flotation of Oko ores
The Doyashiki mill was built at Hanaoka mine in 1943. The mill had a fl otation section
for treating only Oko ( yellow ore), which was operated for 17 years, 1943~1960. Oko ore
consisted mainly of chalcopyrite and pyrite and straight differential fl otation was used.
Copper minerals were fl oated using xanthate as a collector in alkaline slurry of pH 8~12,
with lime controlling the pH and depressing pyrite present. Then the pyrite concentrate was
recovered in acidic slurry at pH 4~5.

Spectrum Series 18
H I S T O R Y O F F L O TAT I O N
56
Oko ore – copper–zinc selective fl otation with hot pulp
At the Doyashiki mill Oko ore was fl oated for years using a simple fl ow sheet but in the course
of operation the zinc content of the copper concentrate increased because of geological
variation in the feed ore. The copper smelter required lower zinc in the concentrate so it was
necessary to develop a fl otation process to separate copper and zinc and to add this circuit
to the mill. A research team was organised to study copper–zinc selective fl otation and basic
research was conducted about two points:
1. decomposition or removal of the collector coverage on copper and zinc mineral surface, and
2. use of oxidising agents or heat treatment and its effect on the fl otation of each mineral (Orii, 1963).
As a result of research work, the following treatment was developed for the copper–zinc bulk concentrate to produce separate copper and zinc concentrates.
Step 1: Copper–zinc bulk concentrate was subjected to oxidising treatment in the atmosphere for a few days.
Step 2: Copper minerals were depressed in hot pulp or by heat treatment and sphalerite was fl oated.
For Step 1 a special space was prepared at Doyashiki mill to provide suffi cient atmospheric
oxidation for the copper–zinc bulk concentrate. It was an unusual process, which was only
possible because of the small volume of concentrate. For Step 2 the oxidised copper–zinc
bulk concentrate was repulped at 45~60°C and sphalerite was fl oated as a froth product
with controlled addition of xanthate and copper sulfate. The pulp was kept hot by steam
Material Grade (%) Recovery (%)
Copper Zinc Sulfur in pyrite Copper Zinc Sulfur in pyrite
Feed 1.37 1.47 29.6 100 100 100
Copper concentrate 16.8 - - 80.5 - -
Zinc concentrate - 54.5 - - 56.4 -
Sulfur in pyrite concentrate - - 49.3 - - 89.8
TABLE 2.9
Flotation of Oko ore in the Doyashiki mill in 1967 (Dowa Mining Company, 1985).
Material Grade (%) Recovery (%)
Copper Sulfur in pyrite Copper Sulfur in pyrite
Feed 1.98 23.2 100 100
Copper concentrate 10.6 - 91.5 -
Sulfur in pyrite concentrate - 49.3 - 58.7
TABLE 2.8
Flotation of Oko ore in the Doyashiki mill in 1954 (Dowa Mining Company, 1985).

Spectrum Series 18
Z I N C A N D L E A D S U L F I D E S 1 9 0 2 – 1 9 2 0
57
injection. The circuit was put into practice at the mill in 1961, producing three kinds of such
concentrates as copper, zinc and pyrite (py).
The Doyashiki mill closed in 1975 because the ore deposit was exhausted.
Flotation of Kuroko ore at Kosaka mine
Copper–lead bulk fl otation using SO2 gas as a main conditioning agentThe Motoyama ore deposit of Kosaka mine was discovered in 1861 as shown in Table 2.6. In the early years of mining the Kosaka mine was operated successfully as a silver mine because the alteration zone of the deposit was excavated, but as the mining activity progressed toward deeper levels the main metal production of the deposit became copper in place of silver. In 1898 Kosaka mine was one of the largest copper mines in Japan. After World War II a systematic and extensive prospecting project was carried out in the Kuroko zone including the outer area of the Motoyama deposit. The Uchinotai ore deposit, which was comparable to the Motoyama deposit, was discovered in 1959, followed by another ore deposit named Uwamuki in 1962. Basic research on differential fl otation of the Kuroko ore was conducted at Kosaka mine in 1960. The aim of research was to establish a new fl otation reagent system without using any cyanides and using a high pH range for the fl otation pulp at the fi rst copper–lead bulk fl otation circuit. As a result of the research it was concluded that a bulk concentrate of copper minerals and galena should be fl oated with diethyl-dithiophosphate as a collector at pH 4~5.5 after conditioning with SO
2 gas injection (Kubota, Otsuka and
Nakamura, 1961). The Uchinotai mill plant was built in 1962 and Kuroko treatment by fl otation started with the SO
2 gas method being successfully applied to recover the copper–
lead bulk concentrate.
Copper–lead separation fl otation using steam injectionA study was carried out to develop new fl otation reagent systems without using any cyanides. It was found from a series of Kuroko fl otation investigation at Kosaka mine that galena could be completely depressed with no reagent additions, by raising the pulp temperature above 60°C using steam injection. The collector adsorbed on the galena surface was removed, but that on the chalcopyrite surface remained. Preferential oxidation of the galena surface at high temperature was thought to be the mechanism for depression (Kubota et al, 1975) and an improved fl ow sheet for Kuroko fl otation was developed and put into practice at Uchinotai mill plant in 1968. Copper, lead, zinc, pyrite and barite concentrates were produced. The Uchinotai mill closed in 1989 because the ore deposits were exhausted.
Flotation at the Matsumine mill, Hanaoka mine
The Matsumine ore deposit, Hanaoka mine, was discovered in June 1963 and the Fukazawa and Ezuri ore deposits were found in 1969 and 1976 respectively. In order to treat the Kuroko from these deposits the Matsumine mill was constructed at Hanaoka mine in 1966. The fl ow sheet of the fl otation section at the mill plant, shown in Figure 2.28, became the basic fl otation method for Kuroko treatment in Japan. Flotation reagents were mainly controlled using online X-ray fl uorescence analysers (Kanazawa, Ohida and Iwano, 1980).
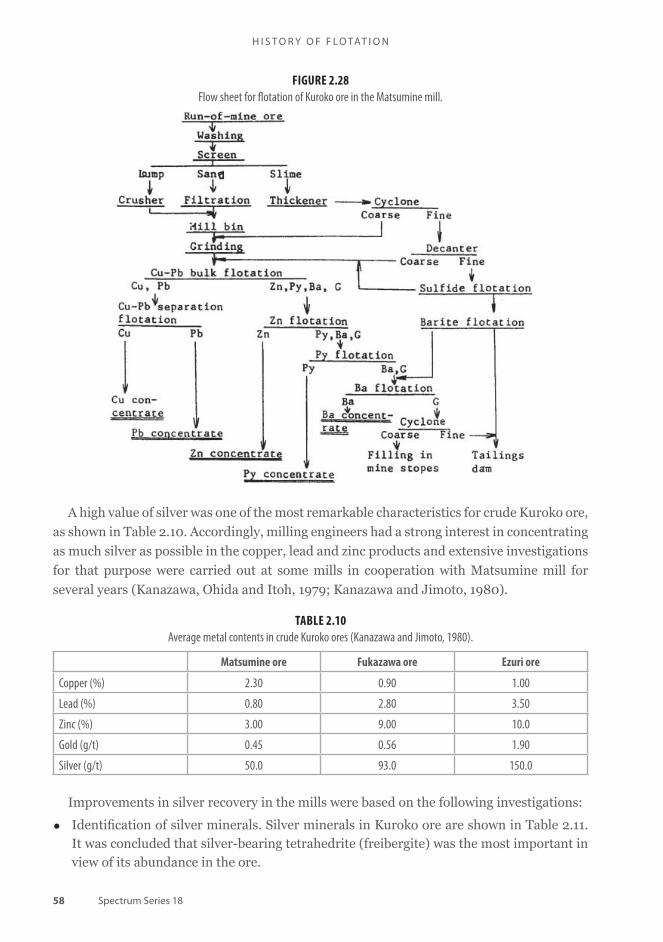
Spectrum Series 18
H I S T O R Y O F F L O TAT I O N
58
A high value of silver was one of the most remarkable characteristics for crude Kuroko ore,
as shown in Table 2.10. Accordingly, milling engineers had a strong interest in concentrating
as much silver as possible in the copper, lead and zinc products and extensive investigations
for that purpose were carried out at some mills in cooperation with Matsumine mill for
several years (Kanazawa, Ohida and Itoh, 1979; Kanazawa and Jimoto, 1980).
Matsumine ore Fukazawa ore Ezuri ore
Copper (%) 2.30 0.90 1.00
Lead (%) 0.80 2.80 3.50
Zinc (%) 3.00 9.00 10.0
Gold (g/t) 0.45 0.56 1.90
Silver (g/t) 50.0 93.0 150.0
TABLE 2.10
Average metal contents in crude Kuroko ores (Kanazawa and Jimoto, 1980).
FIGURE 2.28
Flow sheet for fl otation of Kuroko ore in the Matsumine mill.
Improvements in silver recovery in the mills were based on the following investigations:
• Identifi cation of silver minerals. Silver minerals in Kuroko ore are shown in Table 2.11. It was concluded that silver-bearing tetrahedrite (freibergite) was the most important in view of its abundance in the ore.

Spectrum Series 18
Z I N C A N D L E A D S U L F I D E S 1 9 0 2 – 1 9 2 0
59
• Distribution of silver mineral particles in the fl otation concentrates and tailings. Investigations at Matsumine mill indicated that main silver minerals in the concentrates were stromeyerite, polybasite, pearceite and freibergite. Among them stromeyerite was the most abundant mineral.
• Flotation behaviour of main silver minerals in relation to that of each of the copper, lead and zinc minerals. Stromeyerite was mostly in the copper and lead concentrates. It tended not to be depressed by sulfur dioxide.
The results obtained through this study presented suitable information to improve the fl otation reagent systems for the recovery of silver minerals together with copper, lead and zinc concentrates.
Conclusion
The fl ow sheet used successfully at the Matsumine mill is given in Figure 2.28. This fl ow sheet was the fi nal result of many investigations and plant trials carried out by Dowa Mining Company during a long research program on Kuroko ores. The program was carried out mainly at the Kosaka and Hanaoka mines. Kuroko developments in Japan ceased with the close of Matsumine mill operation in 1995.
REFERENCES
Almond, J K, 2000. The Elmore Brothers and the fl otation process for separating minerals, Historical Metallurgy, 34:31–46.
Anon, 1909. Mining Magazine, 1(1):63.
Anon, 1910a. Mining Magazine, 2(2):377–378.
Anon, 1910b. Mining Magazine, 3(4):290.
Anon, 1911a. Mining Magazine, 4(3):163.
Anon, 1911b. Mining Magazine, 4(1):77–78.
Anon, 1912. Mining Magazine, 7(2):149.
Aplan, F F, 1999. The historical development of coal fl otation in the United States, in Advances in Flotation Technology (eds: B J Parekh and J D Miller), pp 276-278 (Society for Mining, Metallurgy and Exploration: Littlet).
Archbald, E A, 1912. Souvenir of Broken Hill Silver, Lead and Zinc Mines 1887–9 and 1912.
Minerals Formula Minerals Formula
Electrum Au, Ag Polybasite (Ag,Cu)16
Sb2S
11
Argentite Ag2S Pearceite (Ag,Cu)
16As
2S
11
Jalpaite CuAg3S
2 Pyrargyrite Ag3SbS
3
Stromeyerite CuAgS Proustite Ag2AsS
3
Mckinstryite Cu0.8
Ag1.2
S Freibergite (Cu,Ag)12
(As,Sb)4S
13
Sternbergite AgFe2S
3 Native silver Ag
TABLE 2.11
Silver minerals identifi ed in Kuroko ore.

Spectrum Series 18
H I S T O R Y O F F L O TAT I O N
60
ARTBYOXO, 2008. Private communication with Robert J Corbett Estate.
Ashcroft, E A, 1898. The treatment of Broken Hill sulphide ores by wet extraction processes, Transactions of the Institution of Mining and Metallurgy, 6:282–337.
AusIMM Broken Hill Branch, 1930. The development of processes for the treatment of crude ore, accumulated dumps of tailings and slime at Broken Hill, New South Wales, AusIMM Proceedings, 80:379–444.
Banks, H R, 1946. Experience with fl otation machines at the Sullivan concentrator, AIME Transactions, 169:424-428.
BHP, 1935. The BHP Review Jubilee Number: Fifty Years of Industry and Enterprise 1885–1935 (The Broken Hill Proprietary Company: Melbourne).
Birrell, R W, 2000. The Role of Minerals Separation Ltd in the Development of the Flotation Process, Australian Mining History Monographs Number 7 (Zlota Press: Bendigo).
Blainey, G, 1967. If I Remember Rightly: The Memoirs of W S Robinson, 1876–1963 (ed: G Blainey), p 40 (Cheshire: Melbourne).
Blainey, G, 1968. The Rise of Broken Hill, p 68 (Macmillan: Melbourne).
Bradford, L, 1913a. Australian Patent 6463/12 (reported in AusIMM Broken Hill Branch, 1930).
Bradford, L, 1913b. Improvements in the separation of metalliferous sulphides, Australian Patent 8123/1.
Bradford, L, 1915. Improvements in the separation of mixed metallic sulphides, Australian Patent 11253/13.
Braes, J R, 2008. Personal communication.
Bridges, R, 1920. From Silver to Steel: The Romance of the Broken Hill Proprietary, pp 202–204 (G Robertson & Co: Melbourne).
Cattermole, A E, 1904. Separation of the metallic constituents of ores from gangue, US Patent 763260.
Collins, H F, 1910. The Metallurgy of Lead, p 496 (Charles Griffi n and Company: London).
Crabtree, E H and Vincent, J D, 1962. Historical outline of major fl otation developments, in Froth Flotation. 50th Anniversary Volume (ed: D W Fuerstenau), pp 39–54 (American Institute of Mining, Metallurgical and Petroleum Engineers: New York).
Curtis, L S, 1908. The History of Broken Hill, pp 42, 67, 73 (Fearson’s Printing House: Adelaide).
Davey, C J, 1988. Potter, Charles Vincent, in Australian Dictionary of Biography, vol 11, pp 264–265 (Melbourne University Press: Melbourne).
De Bavay, A J F, 1907. Process of separating zinc blende by fl otation, US Patent 864597.
Delprat, G D, 1903. Extraction of zinc, lead and silver sulfi ds from their ores, US Patent 735071.
Delprat, G D, 1904. (Broken Hill Proprietary Company) Apparatus for use in certain processes of extracting sulfi ds from ores, US Patent 763663.
Delprat, G D, 1907. Presidential Address – Ore treatment at the Broken Hill Proprietary mine, Transactions of the Australasian Institute of Mining Engineers, vol XII, paper 158, pp 1-29.
Diamond, R W, 1928. Ore concentration practice of the Consolidated Mining and Smelting Company of Canada, in Flotation Practice, papers and discussions presented at meetings held in Salt Lake City, August 1927, and New York, February 1928, pp 95–106 (American Institute of Mining and Metallurgical Engineers: New York).
Dowa Mining Company, 1985. Centennial publication, History of Dowa Mining Company, vol 1, Mining and Metallurgical Activity.
Drexel, J F, 1982. Mining in South Australia. A Pictorial History, special publication no 3, p 72 (Department of Mines and Energy: Adelaide).

Spectrum Series 18
Z I N C A N D L E A D S U L F I D E S 1 9 0 2 – 1 9 2 0
61
Elmore, F E, 1900. Apparatus for separating metallic from rocky constituents of ores, US Patent 653340, 10 July.
Elmore, F E, 1908. Process for separating fi nely divided material, US Patent 826411.
Fairweather, D F, 1993. Bradford, Leslie (Les) 1878–1943, in Australian Dictionary of Biography, vol 13, pp 242–243 (Melbourne University Press: Melbourne).
Fairweather, D F, 2000. Lyster, Fleury James (Jim) 1872–1948, in Australian Dictionary of Biography, vol 15, pp 144–145 (Melbourne University Press: Melbourne).
Fuerstenau, D W, 1962. Frontispiece in Froth Flotation. 50th Anniversary Volume (ed: D W Fuerstenau) (American Institute of Mining, Metallurgical and Petroleum Engineers: New York).
Gemological Institute of America, 2001. The optics of a dirty diamond [online]. Available from: <http://www.gia.edu/diamondcut/10_learn_more.html> [Accessed: 27 May 2009].
Greenway, H H and Lavers, H, 1913. Minerals Separation Limited, Ore concentration, US Patent 1064723.
Hebbard, J, 1913. Evolution of Minerals Separation process on Central Mine, AusIMM Proceedings, 10:75–128.
Henderson, E T, 1928. The history of ore treatment processes in Broken Hill, AusIMM Proceedings, 72:99–112.
Hines, P R and Vincent, J D, 1962. The early days of froth fl otation, in Froth Flotation. 50th Anniversary Volume (ed: D W Fuerstenau), pp 11–38 (American Institute of Mining, Metallurgical and Petroleum Engineers: New York).
Hoover, T J, 1914. Concentrating Ores by Flotation, second edition (The Mining Magazine: London).
Horwood, E J, 1909. British Patent 1789 (reported in Hoover, 1914, p 37).
Hyde, J M, 1912. Art of concentration of mineral substances, US Patent 1022085, 2 April.
Jenkins, P R, 2001. The Elmore Mystery: The Inventive Elmore Family and Their Role in the Devel-opment of the Flotation Process for Mineral Concentration, p 93 (Dragonwheel Books: West Sussex).
Kanazawa, T and Jimoto, T, 1980. Present practice in Matsumine mill, Journal of the Mining and Metallurgical Institute of Japan, 96:245–251.
Kanazawa, T, Ohida, K and Itoh, Y, 1979. Silver minerals and their fl oatability at Matsumine mill, Journal of the Flotation Research Association of Japan, 26(3):117–127.
Kanazawa, T, Ohida, K and Iwano, K, 1980, On-line analysis at Matsumine mill plant, Journal of the Flotation Research Association of Japan, 27(1):21–25.
Kearns, R H B, 1974. Broken Hill 1894–1914, p 35 (Broken Hill Historical Society: Broken Hill).
Kearns, R H B, 1982. Broken Hill: A Pictorial History, p 234 (Investigator Press: Adelaide).
Kennedy, B E, 1981. Gepp, Sir Herbert William (Bert) (1877–1954), in Australian Dictionary of Biography, vol 8 (Melbourne University Press: Melbourne).
Kerr, J D, 1982. Mount Morgan: Gold, Copper and Oil, pp 149–152 (J D & R S Kerr: Brisbane).
King, H F, 1989. The Rocks Speak (The Australasian Institute of Mining and Metallurgy: Melbourne).
Kubota, T, Otsuka, T and Nakamura, I, 1961. Flotation of Kuroko ore, Journal of the Mining and Metallurgical Institute of Japan, 77:729–734.
Kubota, T, Yoshida, M, Hashimoto, S and Shimoiizaka, J, 1975. A new method for copper–lead separation by raising pulp temperature of the bulk fl otation, in Proceedings XI International Mineral Processing Congress (IMPC), Cagliari, pp 623–637.
Lynch, A J, 1987. Leslie Bradford Golden Jubilee Oration, pp 1-20 (The Australasian Institute of Mining and Metallurgy: Melbourne).
Lyster, F J, 1912. Commonwealth Patent 5040 (recorded in AusIMM Broken Hill Branch, 1930).
Megraw, H A, 1918. Frontispiece, in The Flotation Process (McGraw-Hill Book Company: New York).

Spectrum Series 18
H I S T O R Y O F F L O TAT I O N
62
Mitchell, D P, 1911. Flotation at Zinc Corporation Ltd, Engineering and Mining Journal, 19 November, 92:994–997.
Mizuta, T and Ishiyama, D, 2003. Geological and geochemical features of Kuroko-type volcanogenic massive sulfi de ore deposits in Japan, Mongolian Geoscientist, 22:29~40.
Mouat, J, 1996. The development of the fl otation process: Technological change and the genesis of modern mining 1898–1911, Australian Economic History Review, 36(1):3–31.
Moulden, J G, 1919. Discussion on paper by W Broadbridge entitled Froth fl otation: Application and infl uence on modern concentration and smelting, Transactions of the Institution of Mining and Metallurgy, 29:264–265.
Nash, G M, 1983. The Life of Herbert Hoover: The Engineer 1874–1914, vol 1, pp 350–380 (W W Norton: New York).
Nevett, R D, 1930. Changing over from acid to alkaline circuits in fl otation practice at the mill of the Zinc Corporation Limited, Broken Hill, New South Wales, Australia, AusIMM Proceedings, 80:343–353.
Olsen, K, 2010. Sulitjelma Historielag, private communication.
Orii, M, 1963. Flotation of complex sulfi de ore at Hanaoka mine – Cu/Zn separation, Journal of the Mining and Metallurgical Institute of Japan, 79:466~476.
Osborne, G, 1981. Guillaume, Daniel Delprat (1856–1937), in Australian Dictionary of Biography, vol 8 (Melbourne University Press: Melbourne).
Owen, T M, 1913. Commonwealth Patent 9381 (reported in AusIMM Broken Hill Branch, 1930).
Palmer, T H, Seale, H V and Nevett, R D, 1918. Australian Patent 8533 (reported in AusIMM Broken Hill Branch, 1930).
Parsons, G, 1981. De Bavay, Auguste Joseph Francois (1856–1944), in Australian Dictionary of Biography, vol 8 (Melbourne University Press: Melbourne).
Plimer, I, 2004. Broken Hill – 120 years of mining. Is the end in sight? Focus, 132(May–June), Journal of the Australian Academy of Technelogical Sciences and Engineering (Melbourne).
Potter, C V, 1904. Process of separating metals from sulfi d ores, US Patent 776145.
Poynter, J R, 1979. Baillieu, William Lawrence (1859–1936), in Australian Dictionary of Biography, vol 7 (Melbourne University Press: Melbourne).
Rickard, T A, 1932. Man and Metals: A History of Mining in Relation to the Development of Civilization, p 404 (McGraw Hill Book Company: New York).
Scott, S, 1987. Supplementary notes to Leslie Bradford Golden Jubilee Oration, pp 21–40 (The Australasian Institute of Mining and Metallurgy: Melbourne).
Seale, H V and Shellshear, W, 1914. Australian Patent 14038 (reported in AusIMM Broken Hill Branch, 1930).
Sheridan, G E and Griswold, G G, 1922. Concentration of ores, US Patent 1427235.
Simons, T, 1916. The concentrator of the Timber Butte Milling Co Butte, Mont, AIME Transactions, 54:910–931.
Solomon, R J, 1988. The Richest Lode Broken Hill 1883–1988 (Hale and Iremonger: Sydney).
Stanford Daily Online, 2001. <http://daily.stanford.edu/article/2001/11/28/theHistoryOfStanford’sROTCOpposition> [page no longer available].
Sulman, H L, 1919. Flotation, Transactions of the Institution of Mining and Metallurgy, 29:44–204.
Sulman, H L and Picard, H F K, 1905. Ore concentration, US Patent 793808.
Tonkin, B, 2010. Maps of leases, held in Archives Section, Broken Hill City Library.
Truscott, S J, 1923. A Textbook of Ore Dressing, pp 393–416 (McMillan and Co: London).

Spectrum Series 18
Z I N C A N D L E A D S U L F I D E S 1 9 0 2 – 1 9 2 0
63
Tveter, E C and McQuiston Jr, F W, 1962. Plant practice in sulfi de mineral fl otation, in Froth Flotation. 50th Anniversary Volume (ed: D W Fuerstenau), pp 382–415 (American Institute of Mining, Metallurgical and Petroleum Engineers: New York).
Wakamatsu, T, 1998. History of ore fl otation development in Japan and its future prospect, J Resource Processing Soc Japan, 41(2):64~68.
Woodward, O H, 1965. A Review of the Broken Hill Lead-Silver-Zinc Industry, second edition (ed: K P W Parsons), pp 78–99 (The Australasian Institute of Mining and Metallurgy, Broken Hill Mining Managers Association: Melbourne).

Spectrum Series 18 65
COPPER IN 1900
Copper has been used for ornamental, domestic and military purposes for thousands of years,
but smelting was slow and expensive and the tons of copper produced worldwide before the mid
19th century was too small to support substantial copper-based industries. Large boulders of
copper metal were discovered in the ancient copper mining area of Upper Michigan in the mid
19th century and industries based on metallic copper, brass and bronze were then developed in
the USA. In the late 1870s deposits of ores containing up to 15 per cent copper were discovered
in Butte, Montana and Bisbee, Arizona, and by the late 1880s the USA, with plenty of copper
available and the industries anxious to use it, had become the leading producer of copper in
the world. By that time high-quality copper for the new electric power industry was being
produced in the USA in electrolytic refi neries and copper production was growing at 5.8 per
cent annually. Even the rich deposits in Upper Michigan, Montana and Arizona could not
support this indefi nitely and other sources of copper had to be found.
Ira Joralemon (1973) described progress in copper mining:
The United States had all the luck in fi nding new copper mines for forty or fi fty years. In 1870 this country produced only about an eighth of the copper used in the world. By 1910 it was turning out three fi fths of the enormously increased output. The old mines in Germany, Spain, Japan and South Africa that had supplied the world with copper for hundreds of years increased production when electricity made copper really worth mining, but for more than a generation no really great ore body was found outside of the United States. It is no wonder that the American Copper Kings looked on the world as their plaything. The luck was too good to last. The cycle of American copper discoveries ended in 1913.
The discoveries of rich copper deposits in the USA may have ended in 1913 but interest
in copper remained high and companies moved to offshore opportunities, especially in
Latin America. There were also the porphyry coppers, which presented diffi cult technical
challenges but which would come to dominate copper production. Advances in both mining
and milling technologies have been necessary to exploit the porphyry coppers so there will
be references to mining in the discussion of copper fl otation.
C H A P T E R 3
Copper Sulfi des 1912–1930

Spectrum Series 18
H I S T O R Y O F F L O TAT I O N
66
THE PORPHYRY COPPERS
The essential characteristics of the deposits that are universally, if not quite precisely, designated as Porphyry Coppers, are: their huge size, particularly with respect to horizontal dimensions; the relative uniformity with which the copper minerals are disseminated throughout the mass; and the low average per-ton copper content of the exploitable ore (Parsons, 1933a).
There were two serious problems in exploiting the porphyry coppers:
1. mining cost was high because mining methods were selective, labour-intensive and wasteful of the mineral; and
2. ores required fi ne grinding to liberate copper sulfi des and gravity machines did not concentrate fi ne particles effi ciently.
Both problems had to be solved to ensure an adequate supply of copper from porphyries.
Copper ore had been mined at Bingham Canyon since the 1860s with intermittent success
and when Boston Consolidated Gold and Copper Mining Company claimed in 1898 to have
found 291 million tons of 0.75–2.5 per cent copper ore at Bingham Canyon many asserted
that it would be impossible to mine and treat ore in Utah that contained less than two per
cent copper. Daniel Jackling, a metallurgical engineer from Missouri who was working in
a local mineral processing plant, was not impressed by the sceptics. In 1903 when he was
given the task of building a 300 tons per day mill to process two per cent copper ore he
persuaded the owners to mine and mill 5000 tons per day using high capacity production
systems never before tried. Jackling knew that the keys to profi table mining of porphyry
copper ores were high throughput, cheap mining and effi cient processing, and in planning
the mine he looked beyond conventional mining techniques. Steam shovels had been used
since 1902 for stripping overburden from haematite ores at the Mesabi Range in Minnesota
FIGURE 3.1
USA copper production 1875–1925 (Richter, 1927).

Spectrum Series 18
C O P P E R S U L F I D E S 1 9 1 2 – 1 9 3 0
67
and since 1904 for mining copper ores at Rio Tinto in Spain, so he visited the Mesabi Range
to observe the surface mining system in operation. He must have realised the potential of
surface mining because he adapted the principles to the porphyry copper ore at Bingham
Canyon. The system he introduced was to mine the shallow overburden by steam shovels,
load it onto wagons driven by steam engines and transport it to the waste dumps. Then the
same shovels and wagons were used to mine the ore and deliver it to the mill for processing.
The equipment used at the start of mining is shown in Figure 3.2. Stripping the overburden commenced at Bingham Canyon in 1906 and Jackling’s prediction that the cost per ton would be low was verifi ed in 1907 when two per cent copper ore, which had previously been regarded as waste because it was not economic, was mined and concentrated profi tably. His company, Utah Copper, built a gravity mill in 1907 at Magna near Bingham Canyon with 6000 tons per day capacity and a similar 3000 tons per day mill was built nearby at Arthur by Boston Consolidated in 1909. The mills worked well in conjunction with the open pit mine in creating the large profi ts – even at 60 per cent recovery the mine made large profi ts on one per cent ore – but they did highlight the problem, which was a high loss of copper in the gravity plant tailings, mainly in very fi ne particles.
FIGURE 3.2
The start of open pit mining at Bingham Canyon (Utah Historical Society, 2009).
As the pit developed the two main companies working at Bingham Canyon, Boston Consolidated and Kennecott Utah Copper Corporation, became a single unit and it was so profi table that its mining capacity was doubled and redoubled (Utah History, 2008) despite the low recoveries. The pros and cons of open pit mining were soon recognised. When selective mining was possible the open pit system was fl exible in terms of ore grade and output, but both were more diffi cult to control with underground mass mining. In addition the open pit system was not always possible since thick overburden or an unsuitable shape

Spectrum Series 18
H I S T O R Y O F F L O TAT I O N
68
of the orebody made ‘power shovel’ mining too expensive (Parsons, 1933c). Five companies with suitable deposits of porphyry coppers followed Jackling’s lead and the mines and mills that were built in Nevada, Arizona and at Chuquicamata in Chile to process low-grade ores were very profi table despite high mineral losses in gravity tailings.
The alternative to power shovel mining was underground caving and this also had its pros and cons. It was suitable for large, uniform orebodies that were extensive both laterally and vertically, and which contained many large and small fracture planes at diverse angles so that the ore would break into small pieces when caving by gravity. Selective mining was not possible with caving and the entire ore in a block was extracted, with some unavoidable dilution. Mining engineers at several companies, including Braden in Chile and Inspiration in Arizona, planned their mines using caving techniques. The Braden ores, which were the fi rst copper ores fl oated on a large scale, were in the rim of the crater of an extinct volcano; they outcropped at 3000 m but the large masses of ore were much lower. It was decided to mine them by caving so that the broken ore fl owed down several hundred metres to adits, from which the ore was transported to the concentrator. A sketch of the mine after some years of operation is given in Figure 3.4, which shows the system by which the ore moved from the stopes in the upper horizon to the haulage adits. Caving at Braden was low cost but there was still the problem of low recovery in the gravity separators.
The 250 tons per day gravity mill built at Braden in 1906 is shown in Figure 3.5. It was an up-to-date mill with the best equipment but throughput was small, recovery was low and the warning was clear – increase the revenue or close the mine. How the Braden company increased the revenue, partly by higher feed rate and partly by using the new and still mysterious fl otation process, is discussed in a later section.
Open pit mining companies hesitated to modify plants to try and solve the metallurgical problem of poor recovery because their revenues and profi ts were high due to high throughputs and these were not to be jeopardised by changes in milling practice. It was the underground mining companies which looked for a solution, probably because mining
FIGURE 3.3
Boston Consolidated’s Arthur mill in 1914 (Parsons, 1933b).

Spectrum Series 18
C O P P E R S U L F I D E S 1 9 1 2 – 1 9 3 0
69
costs were higher and additional revenue from the mill was essential. Process engineers were aware of the fl otation process that was developing at Broken Hill and during 1912 to 1914 a few managers of mines did take the risk of installing a fl otation circuit, notably at Braden in 1912 and Inspiration in 1914. The circuits were so successful that there was rapid acceptance of the ‘upside-down’ fl otation process. It was installed in many other plants and the amount of copper ores fl oated at plants in western USA went from a few tons during 1906–14 to 20 million tons in 1918 and 50 million tons in 1929 (Crabtree and Vincent, 1962). Flotation was a spectacular success and, as at Broken Hill, the success was due to the vision, skills and persistence of a small number of people.
FIGURE 3.4
Braden mine showing ore fl ow from the upper horizons to the haulage adits (Parsons, 1933d).
FIGURE 3.5
The fi rst mill at El Teniente built in 1906 (Parsons, 1933e). ‘Pueblo Hundido’ was thefi rst camp of El Teniente that was located close to the main portal of the mine.

Spectrum Series 18
H I S T O R Y O F F L O TAT I O N
70
CHRONOLOGY OF FLOTATION IN THE USA DURING 1906–1925
The chronology of progress in fl otation in the USA during the period 1906–1918 is given below:
1. 1906 i. MacQuisten tubes for fi lm fl otation installed in the Adelaide mill, Nevada, to concentrate copper ore.
ii. Application by Dudley Norris for a patent on a fl otation column to work at high altitudes. It was the fi rst column.
2. 1907 i. Flotation cell (probably the MacQuisten tube) tested by John Callow in the 250 tons per day gravity mill at the Braden mine (now El Teniente), Chile.
3. 1911 i. MacQuisten tubes installed in the Morning mill, Idaho, for concentration of lead–zinc ore.
ii. J M Hyde built a 50 tons per day fl otation plant for lead–zinc ore at the Butte and Superior mine in Montana.
4. 1912 i. 400 tons per day Minerals Separation fl otation system installed in the old concentrator at Braden, Chile.
5. 1913 i. 50 tons per day gravity–fl otation test plant built at Inspiration Company in Arizona.
ii. Callow pneumatic cells used at National Copper Company, Idaho.
iii. Six 600 tons per day Minerals Separation fl otation units installed in the 3000 tons per day concentrator at Braden, Chile.
6. 1914 i. 600 tons per day gravity–fl otation test plant built at Inspiration Company, Arizona.
ii. Minerals Separation cells, Flinn Towne columns, Callow pneumatic cells tested in the Anaconda concentrator in Montana.
7. 1915 i. 15 000 tons per day gravity–fl otation concentrator built at Inspiration Company.
ii. 3000 tons per day gravity–fl otation circuit built at Britannia copper mine, Canada.
iii. Gravity–fl otation circuit installed at St Joe Lead Company lead–zinc mine in Missouri.
8. 1916 i. First all-fl otation plant built at Engels copper mine, California.
9. 1917 i. First chemical collector, alpha-naphthylamin, patented by HP Corliss of Metals Recovery.
10. 1918 i. 600 tons per day differential fl otation process for complex ores installed at Cominco Ltd plant in Canada.
APPLICATION OF FLOTATION TO COPPER SULFIDES
Companies mining sulfi de ores knew about froth fl otation since its early days at Broken Hill but hesitated to use it because of its novelty. Then came its successes with zinc ores in

Spectrum Series 18
C O P P E R S U L F I D E S 1 9 1 2 – 1 9 3 0
71
Montana in 1912 and copper ores in Chile in 1912 and Arizona in 1914. Managers quickly recognised that fl otation would change the economics of companies that were mining porphyry coppers by improving recoveries and the growth of fl otation became explosive as many banks of fl otation cells were installed in copper sulfi de plants in western USA. Growth of fl otation at mines meant growth in the service industries. Inventors built new fl otation machines to fl oat copper sulfi des and other sulfi de minerals, chemists developed better fl otation reagents and fl otation technology moved to a new level of effi ciency as the machines and reagents were tested extensively in plants and the process became better understood. Hines and Vincent (1962) emphasised the importance of fl otation when they recorded the differences in copper recovery between gravity only and gravity plus fl otation circuits using data from the six main porphyry copper plants. Of the companies mentioned in Table 3.1 Inspiration used fl otation with some gravity concentration to catch coarse copper in gravity tails, the others used gravity concentration only. It was the increase of up to 20 per cent in recovery – suspected but unproven in 1911 – which was the incentive for inventors, mining companies, chemists and cell manufacturers.
The new fl otation machines included tubes for fi lm fl otation, cells for pneumatic fl otation and fl otation columns.
Utah Chino Ray Nevada Miami Inspiration
Year 1913 1915 1915 1915 1915 1915
Tons ore milled per day 25 000 7357 7805 8442 2816 15 000
Average per cent Cu in ore 1.25 2.16 1.67 1.54 2.47 1.70
Average per cent oxide Cu in ore 0.06 - 0.17 - 0.39 0.22
Average per cent Cu in
concentrate
17.31 21.55 19.29 7.77 38.55 32.67
Total per cent Cu recovered 63.95 66.59 64.11 70.18 64.54 79.59
Total per cent sulfi de Cu
recovered
- - - - 76.8 86.56
TABLE 3.1
Comparison of copper recoveries at Inspiration, which used fl otation, and other porphyrycopper plants, which used only gravity concentration (Crabtree and Vincent, 1962).
MacQuisten tubes and fi lm fl otation
Copper mining had been carried out near Golconda, Nevada, since the 1870s and in 1897 Scottish interests organised the Adelaide Star Mines Ltd to work the Adelaide and other copper mines in the region (Nevada Division of Environmental Protection, 2008). Unsatisfactory results with gravity machines led to a shutdown of the mill and most of the mines by the spring of 1900, but in 1907 the mill reopened with additional equipment only to close again in 1910 after additional losses were sustained. It was probably the new MacQuisten fl otation tubes that gave the Scottish entrepreneurs the incentive to reopen the mill and its demise would have been due to the failure of the tubes to recover copper profi tably. Arthur MacQuisten was an engineer living in Glasgow, Scotland, who patented a skin fl otation process in 1905 that was similar to de Bavay’s process (Hofstrand, 1913). It used a rotating

Spectrum Series 18
H I S T O R Y O F F L O TAT I O N
72
tube to present particles in the pulp to air and then to the surface of a quiescent pulp. Tubes were 2 m long and 0.3 m diameter with an internal helix which advanced 0.1 m every turn. In operation the pulp was deslimed, passed through a dilute sulfuric acid bath to prevent gangue from fl oating and then it was mixed with oil and soap at the entry to the tubes. The pulp half fi lled each tube and particles were dragged by the helix above the waterline during rotation, exposed to air and fell back into the water. Sulfi des fl oated on the water and were discharged from the top of each tube, and gangue was discharged from the bottom. MacQuisten’s tube was similar to the Elmore tube used at Glasdir but the separating mechanism was different, in his tubes particles fl oated because their surfaces became water repellent when exposed to air, not because they were buoyed by the low specifi c gravity oil as at Glasdir.
When the Adelaide mill was rebuilt in 1906 100 MacQuisten tubes were installed to concentrate 125 tons per day of three per cent copper ore.
FIGURE 3.6
MacQuisten fl otation tube: patent (left) (Macquisten, 1907); operating (right) (Fahrenwald, 1917).
The economics of the process must always have been doubtful because ore grade was low and slimes were rejected so the owners would have been disappointed but probably not surprised when it failed. The Morning mill in Mullan, Idaho, was a better prospect. In 1911 248 tubes were used to concentrate lead and zinc sulfi des in Wilfl ey table tailings; they operated until 1920 and produced a 48 per cent zinc concentrate from deslimed feed with a recovery up to 85 per cent (Taggart, 1945). But they had the same problem as de Bavay’s cones; loss of minerals occurred during desliming. In 1921 the mine was operated by the Federal Mining and Smelting Company and the tubes were replaced by centrifugal and pneumatic bubble column machines (Taggart, 1927), which produced good quality zinc and lead concentrates at high recoveries. The results were better than any results that could be expected from the tubes and they sounded the death knell for fi lm fl otation.
Callow cells and pneumatic fl otation
The Callow pneumatic cell, which competed with mechanical cells in the fl otation cell market in the USA for many years, came from ideas which were probably developed by John Callow while he worked on the MacQuisten tube in his workshop in Salt Lake City. A circuit of Callow cells is shown in Figure 3.7. John Callow was one of the great innovators in fl otation

Spectrum Series 18
C O P P E R S U L F I D E S 1 9 1 2 – 1 9 3 0
73
technology and his work is discussed further in Chapter 4. His plan was to introduce air through a porous mat in the base and form small bubbles which agitated the pulp and adhered to sulfi de particles, lifting them to the surface as a froth (Callow, 1914). Typical cells were 9 ft long and 2 ft wide with a sloping base 20 in deep at the shallow end and 45 in deep at the discharge end. The porous base was made of four thicknesses of loosely woven canvas twill supported by perforated metal and was fed by 4–5 psi air fl owing through valves, which could be controlled to maintain correct froth height. The froth was typically 15 in deep.
The fi rst installation of Callow cells was in a 500 tons per day gravity–fl otation mill at the National Copper Company, Mullan, Idaho, which started operation in April 1914. Tails from gravity machines were reground and fl oated in eight parallel rougher cells followed by two cleaner cells. Results must have been good since he persuaded engineers at Inspiration Copper to include his cell in their test program, which preceded the design of the commercial mill. Again the cells were successful and within 18 months 680 Callow cells with a combined capacity of 25 000–28 000 tons per day were either operating or being installed in plants.
A problem with Callow cells was that an impervious crust formed on the stationary mat; this was overcome in a Callow-MacIntosh cell by using a rotating mat with the crust being removed every revolution. Callow cells recovered fi ne particles effi ciently but were less successful with particles coarser than 200 microns and plant circuits often contained both Callow cells for fi nes and Wilfl ey tables to concentrate coarser particles. Flow sheets varied with ore type, fl otation usually being applied to primary slimes and reground table tails.
Callow-MacIntosh cells were installed at Mount Isa in 1931 to fl oat lead sulfi des and carbonates but the recovery of metal was only 75 per cent (Chaput and Kennedy, 1992). The reasons were that grinding was poor because of hard chert bands in the carbonates, residence times were low because of the low per cent solids in the classifi er product, and the water contained high dissolved metals including abraded grinding media. It was a warning to metallurgists that complex ores, which had to be ground fi ne to liberate the minerals, would not be easy to concentrate. Pneumatic cells were replaced at Mount Isa with subaeration mechanical cells in July 1938. The Mount Isa experience was a setback for pneumatic cells
FIGURE 3.7
John Callow in 1930 (left) (Berkman, 2007). Callow pneumatic cells in a circuit (right) (Callow, 1917).

Spectrum Series 18
H I S T O R Y O F F L O TAT I O N
74
FIGURE 3.8
Callow-MacIntosh cells (left) (Richards and Locke, 1940). Callow-MacIntosh circuit at Mount Isa in 1930 (right) (Berkman, 2007).
FIGURE 3.9
Forrester cells: air tubes (left) (Forrester, 1927); frothing section (middle) (Taggart, 1945); cells at Broken Hill (right) (Braes, 2010).
but they were still being used in the 1950s in mills built to concentrate coarse-grained, free milling sulfi de ores, particularly in copper and nickel mines in Canada. The interest in fl otation led to other types of pneumatic machines being built in the 1920s, notably the airlift machines of which the Forrester cell shown in Figure 3.9 was the earliest.

Spectrum Series 18
C O P P E R S U L F I D E S 1 9 1 2 – 1 9 3 0
75
Other airlift machines were similar in design but there were minor modifi cations. Airlift machines were open troughs into which low pressure air entered through a line of vertical pipes 20–30 mm diameter set about 100 mm apart. The air acted as an airlift pump and at the same time formed a froth with particles to which bubbles attached. There was no limit to the cell length and 30 m machines were not uncommon. Airlift machines were suitable for fi ne ground ores which fl oated readily with soluble collectors, such as the porphyry coppers fl oated with xanthates. They were not suitable for ores which were ground coarsely or required intense agitation, but they were used widely in mills for many years after their invention in 1925.
Pneumatic cells competed with mechanical cells for many years and each had its supporters, depending on ore types, mineral contents and the cost of power. But by the late 1950s mechanical cells had become the popular choice because they were simple to install and operate, and results were as good as for any other type. They remained unchallenged for decades. Pneumatic and mechanical cells are discussed in more detail in Chapter 4.
Flotation columns
The drawings in patents for the early columns are given in Figure 3.10. Dudley Norris of New York patented the fi rst fl otation column in 1907 to overcome a problem he observed to exist with the Elmore vacuum cell at the Magistral mine, Zacatecas, Mexico, which he owned (Rickard, 1916). The mine was at an elevation of 4000 m and insuffi cient air was dissolved in the water at this altitude to fl oat the mineral when it precipitated as bubbles. The concept used by Norris was to operate two tanks (shown in Figure 3.10), tank 10 to prepare aerated water and tank 1 in which pulverised ore with added oil collided with rising bubbles in
FIGURE 3.10
Early fl otation columns: Norris (1907) (left); Towne and Flinn (1919) (middle); Cole (1921) (right).

Spectrum Series 18
H I S T O R Y O F F L O TAT I O N
76
the aerated water and sulfi des fl oated. Tailings were discharged through pipe 2 and froth concentrate overfl owed into launder 5 (Norris, 1907).
In 1913 Robert Towne and Frederick Flinn from Bubble-Column Corporation in New York applied for a patent on a fl otation column which had controlled feed and discharge, and air entering the column through a porous medium at the base (Towne and Flinn, 1919). Their design was based on extensive studies of the mechanisms at work in the column, including the drainage of waste minerals from the 12–18 inch high froth layer. Patents describing improvements to the cell were taken for some years, the last patent being awarded in 1921. The machine was tested successfully in small capacity circuits at several plants including Inspiration, Morenci and Cananea in Mexico, but its small size and problems with sanding and blockage of the air holes led to its demise.
The designs of the Norris and the Towne and Flinn cells indicated that their inventors had a good understanding of fl otation, but they could not ensure that their columns would be in plants long enough to be modifi ed to correct problems because they did not appear to have a close association with operating companies. Some companies did design and build their own columns with some success, notably Inspiration Copper and Arizona Copper. The experience of Arizona Copper is interesting. In 1913 the company decided to remodel and enlarge its 20 year old Morenci concentrator. David Cole was the consultant and having heard of the fl otation experiments at Inspiration he arranged for:
… a small can of cresylic acid to drip into the tailings launder at a point where the tailings made the initial plunge into the creek bed. The results were instantaneous and very gratifying. Black froth began to collect in eddies and fl oat downstream for a few yards to a second plunge where we were greatly surprised to fi nd that it became white again … the reason was fi nally located as being the effect of the town sewer (Cole, 1917).
Cole tested a Towne Flinn column with good metallurgical results but found problems with capacity and air blockage. Then he built his own column in which air entered through holes in pipes which were covered with porous cotton blankets to avoid incrustation and blockage rather than through carborundum disks (Cole, 1921). The small Cole column worked well and larger columns were built which handled 390 tons per day and which produced concentrates containing 28 per cent copper at a recovery of 85 per cent. His column was part of a comminution–classifi cation–fl otation system in which pulp containing fi ne ore was added to the fi rst column, froth overfl owed into a launder and a classifi er at the bottom of the column sent coarse particles in the tailing for regrinding and fi ne particles to the next column in the series. Concentrate was produced from all columns and tailings from the last column.
The early columns were innovative and ahead of their time but interest did not continue because of operational problems. It would be 40 years before it was renewed.
COPPER FLOTATION – THE EARLY PLANT CIRCUITS
The demand for copper grew rapidly in the USA early in the 20th century and fl otation was the essential process in extracting it from its ores. Flotation became a great process because of copper in the USA but it took years to travel from Broken Hill, and even then copper fl otation went via Chile.

Spectrum Series 18
C O P P E R S U L F I D E S 1 9 1 2 – 1 9 3 0
77
Braden Copper mine, Chile (now El Teniente)
The fi rst large copper company to use fl otation was Braden Copper Company, which had
been mining a huge porphyry copper deposit 200 km south of Santiago in Chile since 1904
(see section on the porphyry coppers). Braden Copper started processing ore on 1 June 1906
in a mill with a capacity of 250 tons per day. Feed and concentrate contained 3.3 per cent and
20 per cent copper respectively and recovery of copper was 45–55 per cent. These results
did not cover the high capital cost and the continuing costs of mining and processing in the
diffi cult terrain and still make a reasonable profi t. In 1907 the ‘Callow’ cell was evaluated
as a unit to improve the recovery – it may have been a MacQuisten tube since Callow was
working on it at the time or it may have been a version of the pneumatic cell which predated
his patents. Results must have been unsatisfactory since the tubes were not used in the plant.
In 1909 Braden Copper decided to expand the mine and build a new and larger plant to
increase revenue and make the enterprise more profi table, but the cost of building in the
steep mountains where access was so diffi cult and snowfall was very high was too much for
the owners and the Guggenheim family took a large fi nancial interest. This family company
had immense investments in lead–zinc and copper mines and smelters in the USA, notably
in Alaska and in the giant Utah Copper Corporation near Salt Lake City, and it invested in
Braden Copper so that it could participate in the exploitation of the great copper deposits in
Chile. The company investigated froth fl otation to improve recovery and the fi rst fl otation
circuit at El Teniente was described by Codelco-Teniente engineers (Araneda Osés Octavio
Andrés, 2008):
The fi rst Concentrator in Teniente started the operation on the fi rst of June, 1906
with an initial capacity of 250 tons per day. Main components were: 2 Mc Cully
spinning crusher cylinders : 4 Hardinge grinding mills : Chilean Mills : Gravity
Concentrator machines. The concentration method by gravity recovered between
45 and 55% of copper. Flotation concentration was still in the experimental
stage in the United States and England and oil fl otation was incorporated in the
circuit (date uncertain) as a complement to the gravity concentration. In 1907 the
Callow system was evaluated (the results are unclear). Furthermore, Chalmers
and Williams automatics sample systems were installed for the mineral and the
tailings, to identify where the losses were produced. At the beginning of 1912 an
experimental unit of frother fl otation was introduced from the English Minerals
Separation Company. The experimental tests with 27 tons indicated that with
this new technology it was possible to recover 80% of the copper, while with
gravity concentration it was 51.4%. The good results allowed the incorporation of
6 fl otation units between 1912 and 1913. The Chilean Mills were eliminated, giving
exclusivity to the Hardinge mills. The second Concentrator, with a 3000 ton per
day capacity, started up on the 16th of November 1912. The fl otation process
required 3.2 kilograms of sulphuric acid per ton. In 1915 a sulphuric acid plant
was installed with high sulphur levels. Its capacity was 25 to 30 tons per day, and
the fl otation process required only 12.5 tons per day. The idea was to operate an

Spectrum Series 18
H I S T O R Y O F F L O TAT I O N
78
industrial lixiviation plant, but the cost was too high so it did not prosper. The
available reagents at that time were principally mineral oils used as collectors
and cresylic acid as frother. These collectors were used in different periods until
the consolidated use of dicresyl dithiophosphate in the end of the second decade.
These reagents were refi ned until the use of xantho-formate collectors of Minerec
Company, in combination with Accelerator Powell frother, which was a mix
containing cresylic acid. The whole fl otation concentration process was done in
an acid environment.
Further details are given in Chapter 4. The gravity mill which started operating at Sewell
on 3.34 per cent copper ore in 1906 recovered ~50 per cent of the metal in a 20 per cent
copper concentrate and the additional 30 per cent of copper recovered from the gravity plant
tailings by a 400 tons per day Minerals Separation fl otation unit left no doubt about the
economic value of the process.
The six 600 tons per day units installed in the new plant in 1913 (see Figure 3.11) fl oated the
entire gravity plant tailings and recovered the chalcocite. The cells which were built locally
from wood and the Hardinge grinding mills are shown in Figure 3.12. Flotation improved
recovery in the new mill by 20–30 per cent and the new Sewell plant became the fi rst of
today’s great copper fl otation plants.
FIGURE 3.11
The second mill at El Teniente, which was 3000 tons per day capacity. The circle shows the Sewell mill area.
Flotation in the new mill at El Teniente was followed by its use at Inspiration Consolidated
in Arizona. Flotation not only improved copper recovery, it used machines which occupied
relatively little space compared with large gravity equipment, which was a bonus in hilly
regions. Its success at El Teniente must have encouraged Minerals Separation as it planned
to introduce fl otation to the copper mines in the USA.

Spectrum Series 18
C O P P E R S U L F I D E S 1 9 1 2 – 1 9 3 0
79
FIGURE 3.12
Wooden fl otation cells and Hardinge grinding mills in the 3000 tons per day mill.
FIGURE 3.13
The Superior mill, which handled ores from both the Engels and Superior mines in California, started in 1919. This mill was 40 m high and designed to use gravity fl ow. It was typical of many mills of the time and a feature of these mills was the long stairways,
which provided access to the mill for people and supplies. The fl otation cells photo was taken in 1915 at the original Engels Mill (Lamb, 2010).
Engels Copper Mining Company, California – the fi rst all-fl otation circuit
The Engels Copper Mining Company was incorporated in June 1901 to mine ore in north-east California that contained copper sulfi des and magnetite. Engels mill was the fi rst all-fl otation mill in the USA. The ore had to be ground to 95 per cent –100 mesh to liberate the copper sulfi des and gravity processes were ineffective at this size. Flotation was the only alternative and a mill was built in 1914 using the Minerals Separation process to concentrate the copper. The copper in the feed and concentrate were 3.8 per cent and 40 per cent respectively and recovery was 84 per cent.
From 1914 until July 1930 when operations were suspended due to the low price of copper, approximately 4 700 000 tons of ore were mined from the Engels mines and 80 000 tons of copper were produced. A feature of the fl otation process at Engels mill was that two pine oil frothers were used, one gave a brittle froth and the other a tough froth and the proportions were changed according to the ore being treated (Taggart, 1945). Edward Nutter, who was Chief Engineer of Minerals Separation North America from 1910–1942 contributed much to the success of this fl otation plant as he did for many fl otation circuits installed in the USA during his tenure of the position.

Spectrum Series 18
H I S T O R Y O F F L O TAT I O N
80
Britannia Mining Company, British Columbia – fl otation in Canada
The Elmore bulk oil process was installed at the Le Roi mine in Rossland, British Columbia, in 1903 and at the Massey mine in Ontario in 1904, but in each case it was closed within two years (Moore, 1941). Britannia Mining Company was a customer for the Minerals Separation process. The company started mining a rich chalcopyrite ore in British Columbia in 1890 and built a 200 tons per day gravity plant in 1904.
By 1912 the high-grade ore, which had been mined for 20 years, was fi nished and copper
ore had to be mined from the large low-grade deposit, which was only marginally profi table
using gravity concentration (Mullan, 2008). Considerable capital was required to improve
the mining and processing system and it was decided to take the opportunity to build a new
concentrator with capacity of at least 2000 tons per day, using fl otation to improve copper
recovery. The fl otation tests at the Minerals Separation laboratory in San Francisco were
successful and a new 3000 tons per day plant using Minerals Separation cells was operating
by 1915. Copper recovery was high and by the late 1920s the plant capacity had increased
to 6500 tons per day. The fl otation circuit at Britannia included Forrester airlift cells and
separate banks to fl oat sands and slimes (Taggart, 1945) and it made a 25 per cent copper
concentrate from 0.8 per cent copper feed at a recovery of 90 per cent. Flotation restored
the company to prosperity and during 70 years it produced 500 000 tons of copper and large
amounts of silver, gold, lead and zinc. By 1918 six other copper plants in British Columbia
were also using fl otation and by 1930 fl otation was the key technology in processing plants
for copper and nickel ores.
Inspiration Consolidated Copper Company, Arizona – the 15 000 tons per day plant
Obtaining high recoveries at reasonable cost from low-grade porphyry copper ores in high capacity plants was the dream that metallurgists and staff at the Inspiration Consolidated Copper Company made a reality at its ore deposit in Arizona. A sketch of the deposit showing
FIGURE 3.14
New fl otation mill (foreground) and old gravity mill at Brittania in 1912 (Djingheuzian, 1957).

Spectrum Series 18
C O P P E R S U L F I D E S 1 9 1 2 – 1 9 3 0
81
the locations of Inspiration Consolidated and Miami Copper is given in Figure 3.15. Three of the companies leasing parts of the deposit, Inspiration, Keystone and Live Oak, formed Inspiration Consolidated and the deposit was fi nally held by two companies, Inspiration Consolidated and Miami Copper. The Inspiration section contained 98 million tons of 1.63 per cent copper ore, the Miami Copper section was about the same size but was higher grade and easier to grind. In 1911 Inspiration started to construct a gravity plant to process their ore but its fi nancier W B Thompson realised that he could not provide the immense investment required and he sold the mine in 1912 to Anaconda Company.
FIGURE 3.15
The Inspiration and Miami properties and orebodies in Arizona (Parsons, 1933f).
Dr Louis Ricketts became the consulting engineer for the project. He graduated from Princeton University in 1883 and entered the mineral industry where he soon found that the metallurgical practices were outdated and ineffi cient. As a consultant he built or renewed many concentrators, smelters and leaching plants in Arizona and northern Mexico, and managed mines and plants on several occasions to bring his projects to completion. Parsons (1933g), who was an objective observer of events and people, wrote that:
Dr Ricketts success refl ects more than skill in mining and treating copper ore; quite as important is his fl air for organisation, for selecting, training and inspiring his assistants and associates.
Anaconda hired Dr Ricketts for the Inspiration project and after he had examined the data available he concluded that:
… the mill Thompson’s engineers had planned would not recover enough of the copper. To the horror of the stockholders, he threw away one million dollars’ worth of mill construction and spent a year and another million dollars experimenting (Joralemon, 1973).
The 600 tons per day mill in which this work was carried out was of such high quality that it was described by the consultant David Cole (inventor of the Cole Bergman column)

Spectrum Series 18
H I S T O R Y O F F L O TAT I O N
82
as the Mecca of mill men and metallurgists (Cole, 1917). Flotation tests on the Inspiration ore started in the Minerals Separation laboratory in 1912 and the decisive test showed 87 per cent recovery in 15 per cent copper concentrate from two per cent copper ore.
In early 1913 Louis Ricketts built a 50 tons per day mill in which 10 ton samples of ore from many sections of the orebody were tested and results were good enough to build the 600 tons per day mill in early 1914, a mill in which metallurgical effi ciency was the important factor and expense was of secondary importance. Variables investigated during long test campaigns included different types of mills and classifi ers in grinding circuits, gravity and fl otation machines in different circuits for concentration, reagents and points of addition in the fl otation circuits, and the recovery of non-sulfi de copper minerals. Even the vexed question of how to treat slow-fl oating middlings was considered with the conclusion that ‘middlings are sent back for retreatment mainly because the designer does not know anything better to do with them’ (Gahl, 1917). The Callow pneumatic cell was tested thoroughly in the Inspiration test mill and found to be better than the Minerals Separation cell for the Inspiration ore, leading to robust competition between the two manufacturers.
The work in the test mill led to a fl ow sheet being used in the 15 000 tons per day plant,
which used Marcy ball mills and Dorr classifi ers for grinding, rougher and cleaner circuits
for fl otation and double deck Deister tables for scavenging coarse copper from fl otation
tailings. The capacity of each line in the plant was to be 900 tons per day and there were
to be 18 lines. Four of the lines used Callow cells, 13 lines used Inspiration cells which were
modifi ed Callow cells, and the other line used Minerals Separation cells. The 15 000 tons per
day plant was operating by 1915 and recovered 80 per cent of total copper and 90 per cent
of sulfi de copper in 30 per cent copper concentrate from one per cent copper in the ore. Its
capacity was soon increased to 21 000 tons per day. The high price of copper in 1915 and the
high capacity of the mill ensured that it was the most successful copper mill ever built at that
time (Joralemon, 1973).
The investigation by Louis Ricketts was a textbook example of how to apply a promising but unproven process to a diffi cult ore; it could only have been done by a company with the resources of Anaconda. Hines and Vincent (1962) left no doubt of the signifi cance of the work: ‘the total effect on the thinking of the mining industry was enormous even if the industry was slow in accepting all the new ideas’. At the other end of the orebody Miami Copper in 1911 was milling 3000 tons per day of 2.5 per cent copper ore in a gravity circuit at a large profi t. But the high ore grade could not last and recovery decreased with lower grades. In late 1913 a Minerals Separation machine was tested on reground middlings from gravity machines with satisfactory results and by 1919 an all-fl otation circuit was in use. Typical recovery was 90 per cent of sulfi de copper and 80 per cent of total copper in 34 per cent copper concentrate from 0.7 per cent copper feed. When Callow cells were used the recovery increased and average costs of copper produced decreased $0.758 per ton of ore.
The rapid expansion of copper fl otation
By 1914 mining companies were no longer apathetic about fl otation. Results in the Basin mill, the Inspiration mill and the old mill at Braden were persuasive, particularly for slimes.

Spectrum Series 18
C O P P E R S U L F I D E S 1 9 1 2 – 1 9 3 0
83
The Anaconda Company, which had a controlling interest in Inspiration Copper and backed Dr Rickett’s fl otation work, had a particular interest. It had mined copper ore in Butte, Montana, for decades but by 1913 the incredibly rich ore had gone and the remaining ore, which contained only fi ve per cent copper, was hauled by electrifi ed railway 40 km to Washoe in the town of Anaconda and milled in a gravity plant. There was the usual problem of low recovery and Anaconda installed Minerals Separation cells in the plant in May 1914 to attempt to improve recovery. Different circuits, different chemicals, different machines were tested and eventually it was decided to convert the plant into eight gravity–fl otation sections, each with a capacity of 2000 tons per day (Mathewson, 1915). Callow cells were used to fl oat the primary slimes, which were 20 per cent of total ore, and the reground table tailings were fl oated by Minerals Separation cells. The main copper minerals in these tailings were all sulfi des – chalcocite, bornite, enargite – and typical recovery of copper was 96 per cent in 28 per cent copper concentrate from 5.5 per cent copper feed. The copper content of the feed at Washoe was high, by contrast the porphyry copper ore at Inspiration and Miami ore contained ~1 per cent copper in sulfi des and some oxidised copper minerals. Comparison of results showed that fl otation in all three concentrators increased copper recovery by more
FIGURE 3.16
The 15 000 tons per day Inspiration plant in Arizona (Kenyon Burch, 1917; Parsons, 1933h).

Spectrum Series 18
H I S T O R Y O F F L O TAT I O N
84
than ten per cent with no additional costs involved, indicating that copper fl otation was fl exible and could be adapted to many different ores. The story was confi rmed in many other large metal sulfi de concentrators:
By 1914 42 mining companies were operating or experimenting with the fl otation process … the list increased in 1915 to include most of the principal copper and lead mines (Hines and Vincent, 1962).
In three years froth fl otation had changed the copper mining industry and had set the
scene for the high capacity plants which would supply copper and other base metals in ever
increasing amounts. It was also applied on a large scale to industrial minerals.
FLOTATION CHEMICALS
It could never have been anticipated when froth fl otation was fi rst used in the Basin mill in
1911 that 15 million tons of copper ore would be fl oated in the USA in 1916. Each ton required
the use of expensive chemicals and a lucrative market emerged in the production of fl otation
oils, which came mainly from high temperature processing of wood, coal or petroleum. An
estimate of their consumption in 1916 is given in Table 3.2.
Monthly tons Monthly use of fl otation oils – pounds
Ore type Jan 1916 Dec 1916 Wood creosote/
pine oil
Coal creosote/
tar
Petroleum
Copper 1 248 000 1 942 000 477 000 1 080 000 1 780 000
Zinc 248 000 350 000 323 000 57 000 198 000
Lead 115 000 136 000 125 000 9000 600
Gold/silver 45 700 123 000 50 000 32 000 13 000
TABLE 3.2
Monthly use of fl otation oils in the USA (adapted from Fahrenwald, 1917).
The market for oils may have been large but there was little knowledge about them so the
AIME convened a meeting in September 1916 to discuss them. The problem was described
in one paper:
The testing of fl otation oils has occupied a large part of the time of the testing departments of various companies using the fl otation process in the benefi ciation of their ores. The great differences in ores and in oils has made such work necessary, as it has not been able to select the oil best suited for the purpose without trial of many kinds. In fact individual shipments of fl otation oils from the same manufacturer will often differ so radically that the mill men have been forced to test every lot of fl otation oil before its use in the mills (Palmer, Allen and Ralston, 1917).
The oils were insoluble in water and worked by spreading thinly on the surfaces of the
minerals to which they could attach and creating a water repellent surface which enhanced

Spectrum Series 18
C O P P E R S U L F I D E S 1 9 1 2 – 1 9 3 0
85
bubble-mineral adhesion. Oils commonly used were coal tar, creosote and pine oil, which
were readily available, and there were wide variations in the amounts used for different ores;
no doubt local costs were a factor. These variations in reagent costs were not satisfactory to
mining companies so they supported research programs on the role of oils as collectors and
frothers (Nutter, 1916) and on the possibility of extending the range of oils which could be
used by making them from different natural products, eg sage (Clevenger, 1917). The scope
of these programs soon widened from oils alone to chemicals that could assist separation
in fl otation processes and many chemicals were identifi ed. For example, soluble sulfi des
and hydrosulfi des were patented for fl oating copper oxides and carbonates (Martin, 1917),
frothers with collecting properties such as oleic acid were patented for fl oating non-silicates
(Christensen, 1923) and sodium cyanide was patented as a depressant for sphalerite and
pyrite in lead and copper circuits (Sheridan and Griswold, 1922). When these chemicals
became available selective fl otation became a viable process for many sulfi de ores.
Also of concern were the high royalties being charged by Minerals Separation for use
of their process. These royalties could be greatly reduced if fl otation oils that were made
chemically could be used. Consequently companies collaborated to establish the Metals
Recovery Company to formulate ‘chemical collectors’ for sulfi des. This company was based at
the Mellon Institute in Pittsburgh and its scientists worked quickly on formulating chemical
collectors. In 1917 the fi rst chemical collector, alpha-naphthylamin, was patented (Corliss,
1917) and it was used for several years in the fl otation of copper sulfi des (Taggart, 1945).
Then organic nitrogen-sulfur compounds were patented (Perkins and Sayre, 1921) which
selectively modifi ed the surfaces of sulfi de minerals and enhanced mineral-bubble adhesion.
With that advance the scientists were approaching the goal of chemical collectors that were
selective for sulfi des but that had no frothing properties. The research of the Metals Recovery
Company seemed to attract little attention but it established a research culture with practical
outcomes which contributed much to the success of fl otation.
Minerals Separation responded to this threat with its own research program and in 1925
its chemists Cornelius Keller and Carl Lewis were awarded patents for the use of sodium and
potassium xanthates as collectors (Keller, 1925; Lewis, 1925). The xanthate family turned out
to be very good chemical collectors since xanthates were inexpensive, soluble in water and
fl ow rates of solutions could be controlled easily. They could be used in low concentrations of
20–40 grams per ton, which was less than monolayer coverage, and they were collectors for
few minerals other than sulfi des. Within one year of the patent xanthates were being used by
mining companies worldwide and they had turned the potential loss of Mineral Separation’s
natural oil market into a major share of the market for chemical collectors. Xanthates were
collectors for all sulfi des but they also had the characteristic that the recovery of pyrite could
be reduced by keeping the pulp pH in the range 9–12, usually with lime. The xanthate–lime–
pine oil reagent regime developed for porphyry copper ores became standard for many years.
A few years later another family of collectors for sulfi des was patented which would also win
a good share of the market: dithiophosphates, which were known as Aerofl oat collectors
(Whitworth, 1936). These were soluble in water, not as powerful as xanthates but they

Spectrum Series 18
H I S T O R Y O F F L O TAT I O N
86
provided some selectivity in sulfi de fl otation because they were effective for some sulfi des
but less effective for others such as pyrite. With these collectors available metallurgists could
use water soluble collectors with different strengths and no frothing properties, and frothers
with no collecting properties. Reagent regimes for particular ores could then be selected
by laboratory and plant tests. An indication of the success of programs on reagents is that
xanthates, aerofl oats, sodium cyanide, copper sulfate and lime are still commonly used in
sulfi de fl otation, 80 years after patents were issued. They turned the bulk fl otation process
that started at Broken Hill into a process that could be used for the selective concentration
of sulfi de minerals in any ore.
Reviews of the uses of chemicals in fl otation have been published since the early years of
fl otation (for example An Occasional Contributor, 1916; Taggart, 1928; Gaudin, 1928). By the
1930s the range of chemicals available ensured that fl otation could be used for many products
and a review of the process with emphasis on the important physiochemical characteristics of
reagents was published in Industrial and Engineering Chemistry (De Witt, 1940). Research
has continued without pause on fl otation chemicals and progress is discussed regularly at
mineral processing conferences (for example Nagaraj and Ravishankar, 2005).
LITIGATION
Litigation was an unfortunate but perhaps necessary part of the growth of fl otation in the USA. The new process of fl otation involved the transfer of technology from Australia rather than new process development in the USA and the agent for the transfer was the aggressive Minerals Separation Company. There was a reason for its aggression – its staff in England and Australia had done much of the work to develop the process and, after its early excursion into dump processing, it had decided that its business was licensing its process worldwide and making its profi ts from the royalties. Consequently it improved the process by the efforts of its own staff and by purchasing patents from others, and all improvements were patented. The opinion of the Directors must have been that patent infringement could destroy their business and that litigation was the only method of enforcing the patents. Consequently the company pursued litigation relentlessly. Royalties for consumables were a particular matter of concern. In Australia Broken Hill companies had little objection to paying royalties because the benefi ts were so great but in the USA royalties for using fl otation with copper ore were much higher because the tons processed were high, so attempts were made by some companies to fi nd ways around the patents. These led to long periods of litigation.
The key Minerals Separation patent was USP 835120 in which it was written that:
We have found that if the proportion of oily substance be reduced – say to a fraction of 1% of the ore – granulation ceases to take place and after vigorous agitation there is a tendency for a part of the oil coated metalliferous matter to rise to the surface of the pulp in the form of a froth or a scum (Sulman, Picard and Ballot, 1906).
Minerals Separation was quick to react to any perceived infringement. The case between
James Hyde and Minerals Separation about whether fl otation at the Basin mine infringed

Spectrum Series 18
C O P P E R S U L F I D E S 1 9 1 2 – 1 9 3 0
87
this patent started in 1911. On 11 December 1916 the US Supreme Court upheld the patent on
three of the claims but restricted the use of the patent to less than one per cent of oil (Hines
and Vincent, 1962), a restriction which was easily avoided. The courts must have been
bewildered by arguments at times, for example was the same process involved in producing
tough froths on Minerals Separation cells and fragile froths on Callow cells? Litigation about
fl otation continued for some years but even antagonists grow weary and hostilities ceased by
1922. Minerals Separation apparently received large damages.
THE LEGACIES OF COPPER FLOTATION
Electricity
The most important legacy of copper fl otation, and of fl otation technology in general, was
that it made a reliable and low cost source of copper available to the electricity industry.
Electricity was the key to industrial growth after 1900 and copper was the key to the growth
of electricity because its properties as a ductile and durable electrical conductor made it the
most suitable material available for the transmission of power. The economist F E Richter
had no doubt about the importance of fl otation to the copper industry and, implicitly, to the
national economic welfare:
It is desirable to note here that, part from any other factors that made possible the profi table operation of the porphyries, no such success could have been attained, but for the discovery and application of oil fl otation … Oil fl otation was all important because it called for and made possible exceedingly fi ne grinding; and only such grinding enabled milling losses from the very low grade and extremely disseminated ores to be kept within such bounds as to make the exploitation of the porphyries feasible (Richter, 1927).
Electricity generation started in New York in 1882 and its explosive growth in the USA
from 1902–1942 is given in Table 3.3.
Year Population (million) Electricity (billion kwh) kWh per capita
1902 79.4 4.5 60
1907 87.5 10.6 121
1912 95.1 17.9 188
1917 102.2 33.2 325
1922 109.9 43.3 394
1927 113.2 74.0 626
1932 124.6 78.0 626
1937 129.0 115.7 897
1942 132.6 188.6 (est) 1417
TABLE 3.3
Electricity generation in the USA 1902–1942 (Neil, 1942).

Spectrum Series 18
H I S T O R Y O F F L O TAT I O N
88
By 1925 copper fl otation was a stable and predictable process and this ensured that the price of copper would only rise and fall slowly. Figure 3.17 shows that it rose slowly during 1920–70 and fell slowly during 1970–2000, despite the continuing decrease in the copper content of the ores being mined. Flotation enabled virtually unlimited copper to be produced at reasonable cost from low-grade, fi ne-grained ores and this made electricity widely available in most countries, thereby improving the quality of life for countless people. Because of this fl otation was one of the most important developments in the industrial world in the 20th century.
Education and research
A strong network of University Mining Schools had been established in the USA during the 1880s and 1890s to support the industry but, with the exception of MIT where the redoubtable R H Richards led the program and compiled the complete story of mineral processing as it was at the time, there was little research in mineral processing. Then came fl otation in 1912 and immediately there was excitement and controversy. Robert Anderson from Missouri School of Mines discussed the impact of research on fl otation at an American Institute of Mining, Metallurgical and Petroleum Engineers (AIME) meeting in Arizona in September 1916 (Anderson, 1917):
Upon scanning the literature, it is found that the fl otation investigations have, in the main, dealt with a solution of the problems which accrue to practise; until recently no attempt was made to remove the diffi culties in the way of the formulation of a consistent and harmonious theory. Of late this phase of the work has been receiving considerable attention … in this line of inquiry there has been a steady progression of thought and a remarkable increase in knowledge in the past few years.
Anderson’s paper attracted comment by O C Ralston from US Bureau of Mines (USBM) ‘That is just the trouble – the progression has been mainly in thought and too little in
0
5001000
15002000
1890 1930 1970 2010Year
US
Cop
per
Prod
uctio
n, k
tons
0
20004000
60008000
1890 1930 1970 2010Year
Cop
per V
alue
,98
$/to
n
1950 20001900 1950 20001900
FIGURE 3.17
Production and price of copper in the USA during 1900–2000 (US Geological Survey, 2006).
The production and pricing of copper in the USA during 1900–2000 are shown in Figure 3.17 (US Geological Survey, 2006). Production of copper increased consistently during the entire period as would be expected because of population growth and its price fell dramatically when fl otation started to supplant gravity as the main concentration process during 1916–20.

Spectrum Series 18
C O P P E R S U L F I D E S 1 9 1 2 – 1 9 3 0
89
laboratory investigation’ (Anderson, 1917). This exchange suggests that in 1916 the stage was set for a major study of the principles and practice of fl otation and during following years many able scientists led this study in universities and the USBM. They built strong research groups which advanced the understanding of fl otation and gave good support to the companies by providing them with trained specialists. Notable among the scientists were O C Ralston from USBM, A F Taggart and N Arbiter from Columbia University, A W Fahrenwald from the Idaho School of Mines and A M Gaudin from universities in Montana and Utah and MIT. In Australia I W Wark established a major study of the principles of fl otation at the University of Melbourne, which was supported by several mining companies. Research is discussed in Chapter 10; suffi ce it to write here that fl otation gave an impetus to education and research programs in university mineral processing departments which continued for many years. By 1980 the interest in universities in mineral resources was turning to environmental engineering and the demise of the USBM in 1995 was a signal that public funds to support mineral technology would be reduced. After 1995 the Department of Energy funded a few programs on fl otation technology and the National Science Foundation supported research on surface chemistry but the great years of fl otation research had passed.
AFTER 1925
Companies in the USA may have had little interest in fl otation when it was being developed in Broken Hill but its success in the USA after 1911 opened the fl oodgates of enthusiasm. Ten years after fl otation-gravity circuits were used to concentrate porphyry copper ore at Inspiration Copper 30 million tons of copper ore were being fl oated annually and it had become the process of fi rst choice for concentrating copper sulfi des, in particular the fi nes. Arbiter (1999) listed the capacities of the nine largest fl otation plants in 1927, which fl oated a total of 100 000 tons per day. Interest faded in gravity concentration of coarse particles during the next 20 years as grinding and fl otation circuits improved. Flotation continued to
Plant Tons/day Process Cells*
Utah Magna 25 000 All fl oat Janney
Inspiration 18 350 Float-gravity Inspiration air
Anaconda 15 000 Gravity-fl oat Minerals Separation
Chino 12 000 Gravity-fl oat Janney
Braden 10 000 Gravity-fl oat Minerals Separation
Miami 7000 All fl oat Air cells
Morenci 4500 Gravity-fl oat Duplex air
Copper Queen 4800 Gravity-fl oat Inspiration air
Moctezuma 3000 All fl oat Minerals Separation
* See Chapter 4 for descriptions of cells. The Janney cell was similar in concept to the original minerals separation cell. It had a
stirred compartment and two spitzkastens in which air baskets were placed to maintain bubble columns. The air cells were
Callow-type machines or airlift machines.
TABLE 3.4
The nine largest copper fl otation plants in 1927 (Arbiter, 1999).

Spectrum Series 18
H I S T O R Y O F F L O TAT I O N
90
expand, in 1945 the nine largest plants fl oated 200 000 tons per day of copper ore (40 per cent by pneumatic machines) and by 1972 the total tons per day of the largest nine plants had increased to 650 000 (100 per cent by mechanical machines) (Arbiter, 1999).
Kennecott’s Magna and Arthur plants were the leading large fl otation plants. They started life at 6000 and 3000 tons per day in 1907 and 1909, by 1926 their combined capacity was 50 000 tons per day, by 1943 it was 70 000 tons per day, and by 1950 it was 110 000 tons per day. At that time Magna had 60 ball mills and Arthur had 65, most mills being 2 m diameter and 3 m long. The fl otation circuit in each plant had more than 1000 two cubic metre cells, and the workforce in each plant exceeded 1000. This type of plant could not continue; the current machines were too small to grind and fl oat the ores in the high capacity plants that would be established in the post war years and larger machines must be built or copper production would decline, which would not be acceptable.
By 1950 there had been similar expansions in capacity at El Teniente where the 3000 tons per day plant built in 1915 was fl oating 30 000 tons per day in 1947. Larger machines were built and by 2008 mines in Chile processing ore from the immense deposits of porphyry coppers were fl oating 250 000 tons per day in single plants. Flotation would not be restricted to sulfi des, after all it had started with graphite ore in Germany in 1877. The increasing use of industrial minerals such as phosphates led to the process being extended to these minerals and it was not long before fl otation circuits were being used to concentrate non-sulfi des such as limestone, fl uospar, potash, fl uorite, coal and graphite. With coal and iron ores the application of fl otation was slow at fi rst but in time they both became large users of the process. By 1960, 48 years after the Basin plant started, 202 fl otation plants were operating in the USA on various minerals and were processing 200 million tons of material (Merrill and Pennington, 1962).
Copper has been the bellwether metal for fl otation circuits for 100 years and the major changes that occurred in copper fl otation circuits after 1960 were made possible by application of advances in mathematics, computer software and mechanical and electrical engineering to the requirements of fl otation cells and circuits. From the 1970s better materials of construction, new design techniques and compact electric motors enabled much larger equipment to be built, and better pumps meant that it was possible to replace the unwieldy mechanical classifi ers with hydrocyclones. At the same time there were improvements in the methods of operation of both mechanical and pneumatic cells and better measuring instruments were being designed to provide the basis for accurate process control. With circuits using new and larger equipment the operating cost per ton was much smaller, there was no loss of metallurgical effi ciency and high-quality controllers enhanced the ability of operators to handle the huge fl ows through the machines. Flotation would continue to be applied to an ever widening range of minerals and other products and these applications will be discussed in later chapters.
REFERENCES
Anderson, R J, 1917. The fl otation of minerals, AIME Transactions, 55:527–544 and discussion by O C Ralston, pp 544–546.
An Occasional Contributor, 1916. Oils used in the fl otation process, in The Flotation Process (ed: T A Rickard), pp 60–64 (Mining and Scientifi c Press: San Francisco).
Spectrum Series 18
C O P P E R S U L F I D E S 1 9 1 2 – 1 9 3 0
91
Araneda Osés Octavio Andrés, 2008. Teniente concentrator Codelco Chile – Technology used in the fi rst years of operation, personal communication.
Arbiter, N, 1999. Development and scale-up of large fl otation cells, in Advances in Flotation Technology (eds: B K Parekh and J D Miller), pp 345–352 (Society of Mining Engineers: Denver).
Berkman, D A, 2007. Making the Mount Isa Mine 1923–1933 (The Australasian Institute of Mining and Metallurgy: Melbourne).
Braes, J R, 2010. Personal communication.
Burch, K H, 1917. Mine and mill plant of the Inspiration Consolidated Copper Co, AIME Transactions, 55:707–740.
Callow, J M, 1914. Ore concentrating apparatus, US Patent 1104755.
Callow, J M, 1917. Notes on fl otation, AIME Transactions, 54:3–25.
Chaput, D and Kennedy, K H, 1992. The Man from ASARCO: A Life and Times of Julius Kruttschnitt, p 140 (The Australasian Institute of Mining and Metallurgy: Melbourne).
Christensen, N C, 1923. Process of concentrating oxidised ores and minerals, US Patent 1467354.
Clevenger, G H, 1917. Flotation process of concentrating, US Patent 1212130.
Cole, D, 1917. The advent of fl otation in the Clifton–Morenci district, Arizona, AIME Transactions, 55:656–671.
Cole, D, 1921. Apparatus for separating or concentrating ores, US Patent 1375211.
Corliss, H P, 1917. Flotation of minerals, US Patent 1228183.
Crabtree, E H and Vincent, J D, 1962. Historical outline of major fl otation developments, in Froth Flotation. 50th Anniversary Volume (ed: D W Fuerstenau), pp 39–54 (American Institute of Mining, Metallurgical and Petroleum Engineers: New York).
De Witt, C C, 1940. Froth fl otation concentration, Industrial and Engineering Chemistry, 32(5):652–658.
Djingheuzian, L E, 1957. History of milling in Canada, in The Milling of Canadian Ores, p 31 (Northern Miner Press Ltd: Toronto).
Fahrenwald, A W, 1917. Testing for the Flotation Process (John Wiley and Son: New York).
Forrester, D L, 1927. Flotation method and apparatus, US Patent 1646019.
Gahl, R, 1917. History of the fl otation process at Inspiration, AIME Transactions, 55:576–645.
Gaudin, A M, 1928. Flotation mechanism, A discussion of the function of fl otation reagents (with discussion), in Flotation Practice, papers and discussions presented at meetings held in Salt Lake City, August 1927, and New York, February 1928, pp 50–77 (American Institute of Mining and Metallurgical Engineers: New York).
Hines, P R and Vincent, J D, 1962. The early days of froth fl otation, in Froth Flotation. 50th Anniversary Volume (ed: D W Fuerstenau), pp 11–38 (American Institute of Mining, Metallurgical and Petroleum Engineers: New York).
Hofstrand, O B, 1913. The Macquisten-tube fl otation process, AIME Transactions, 43:692–7.
Joralemon, I B, 1973. Copper. The Encompassing Story of Mankind’s First Metal, pp 234–244 (Howell-North Books: Berkeley).
Keller, C H, 1925. Froth fl otation concentration of ores, US Patent 1554216.
Lewis, C P, 1925. Concentration of ores, US Patent 1554220.
Macquisten, A P S, 1907. Process for separating solids, US Patent 865194.
Martin, R B, 1917. Ore concentration, US Patent 1236856.
Mathewson, E P, 1916. Flotation at Washoe reduction works, Anaconda, in The Flotation Process (ed: T A Rickard), pp 106–110 (Mining and Scientifi c Press: San Francisco).
Spectrum Series 18
H I S T O R Y O F F L O TAT I O N
92
Merrill, C W and Pennington, J W, 1962. The magnitude and signifi cance of fl otation in the mineral industries, in Froth Flotation. 50th Anniversary Volume (ed: D W Fuerstenau), pp 55–90 (American Institute of Mining, Metallurgical and Petroleum Engineers. New York).
Moore, E S, 1941. American Infl uence in Canadian Mining, p 102 (University of Toronto Press: Toronto).
Mullan, M, 2008. Britannia – The story of a British Columbia mine – From mining resource to heritage resource [online], BC Museum of Mining. <http://www.empr.gov.bc.ca/mining/Geolsurv> [Accessed: May 2008, no longer available].
Nagaraj, D R and Ravishankar, S A, 2005. Flotation reagents – A critical overview from an industry perspective, in Proceedings Centenary of Flotation Symposium (ed: G J Jameson), pp 1005–1006 (The Australasian Institute of Mining and Metallurgy: Melbourne).
Neil, C E, 1942. Entering the seventh decade of electric power – Some highlights in the history of electrical development, Edison Electric Institute Bull, September, pp 321–333.
Nevada Division of Environmental Protection, 2008. Golconda General Improvement District Phase 1 Improvements [online]. Available from: <http://www.ndep.nv.gov/bffwp/golconda.htm> [Accessed: 1 July 2008].
Norris, D H, 1907. Apparatus for separating the metallic particles of ores from the rocky constituents thereof, US Patent 873586.
Nutter, E H, 1916. Concentration of ores, US Patent 1170665.
Palmer, R C, Allen, G L and Ralston, O C, 1917. Some miscellaneous wood oils for fl otation, AIME Transactions, 55:646–655.
Parsons, A B, 1933. The Porphyry Coppers, 1933a, pp 1–2; 1933b, p 81; 1933c, p 389; 1933d, p 150; 1933e, p 146; 1933f, p 242; 1933g, p 240; 1933h, p 248 (American Institute of Mining, Metallurgical and Petroleum Engineers: New York).
Perkins, C L and Sayre, R E, 1921. Flotation of minerals, US Patent 1364307.
Richards, R H and Locke, C E, 1940. Textbook of Ore Dressing, p 257 (McGraw Hill Book Company: New York).
Richter, F E, 1927. The copper mining industry in the United States 1845–1925, The Quarterly Journal of Economics, 41(2):236–291.
Rickard, T A, 1916. The Flotation Process, pp 47, 267 (Mining and Scientifi c Press: San Francisco).
Sheridan, G E and Griswold, G G, 1922. Concentration of ores, US Patent 1427235.
Sulman, H F, Picard, H F K and Ballot, J, 1906. Ore concentration, US Patent 835120.
Taggart, A F, 1928. Flotation reagents, in Flotation Practice, papers and discussions presented at meetings held in Salt Lake City, August 1927, and New York, February 1928, pp 40-49 (American Institute of Mining and Metallurgical Engineers: New York).
Taggart, A F, 1945. Handbook of Mineral Dressing, section 12, pp 12–58 (John Wiley & Sons, Inc: New York).
Towne, R S and Flinn, F B, 1919. Process for separating ore materials from each other, US Patent 1295817.
US Geological Survey, 2006. Copper statistics [online]. Available from: <http://minerals.usgs.gov/minerals/pubs/commodity/copper/>.
Utah History, 2008. Copper mining [online]. Available from: <http://www.media.utah.edu/UHE/c/COPPERMINE.html> [Accessed: 21 October 2009].
Whitworth, F T, 1936. Flotation reagents, US Patent 2038400.

Spectrum Series 18 93
THE INFLUENCE OF RISING COPPER PRODUCTION
The main interest in � otation at Broken Hill during 1902–15 was in making the process work.
Plant metallurgists had little time to worry about the subtleties of the process and the reason
that it worked well with the different types of cells (Potter-Delprat, Minerals Separation, De
Bavay and Elmore vacuum) was that the sul� des � oated readily. It was the trials of different
cells at Zinc Corporation in 1908–09 that proved to be decisive in establishing the Minerals
Separation mechanical cells as the most ef� cient machines and in 1910 the company started
selling the entire � otation process, including cells, reagents and know-how, to all interested
customers. As mentioned in Chapter 3 the � rst competition for the Minerals Separation cell
came in 1913 when John Callow patented a pneumatic cell and Robert Towne and Frederick
Flinn patented a pneumatic column. All three machines were tested in � otation circuits at
Inspiration and Anaconda in 1914 and all gave good results, although a machine designed
by Inspiration engineers was used in the large plant. Mechanical and pneumatic cells could
hardly have been more different. Agitation in the Minerals Separation cells was so intense
that the heavy natural oils used as collectors were broken up and coated the particles well.
Tough froths were formed which produced concentrates with high recoveries but low grades
because there was little drainage from the froths. Agitation in the Callow cells was gentle, the
natural oils were not mixed well, froths were more fragile and high-grade concentrates could
be produced by sprinkling froths with water to assist drainage of gangue. Pneumatic columns
gave similar results to Callow cells but sanding problems occurred and they were discarded.
The success of � otation at Inspiration and Anaconda led to its widespread use with different
sul� de ores and to chemists and engineers making new reagents and new cells. Changes in
the demand for base metals, and the associated changes in � otation machine design, are
shown in Tables 4.1, 4.2 and 4.3. The boom in � otation in the 1920s was led by the copper
companies in the USA because of the need for more copper in the electrical industry but
it ended when the market for copper fell in 1929. Attention turned to circuit optimisation,
which gave quick but small economic returns in preference to innovation, which gave larger
but longer term returns. Thirty years would pass before the copper price would again support
the development of new cells.
C H A P T E R 4
Flotation Machines

Spectrum Series 18
H I S T O R Y O F F L O TAT I O N
94
1924–30 1931–40 1941–50 1951–60 1961–70 1981–90 2000–04
Production (Mt) 1.07 0.68 1.08 1.19 1.44 1.29 1.45
Unit value ($98/t) 3440 2452 2841 4006 4108 2897 1810
TABLE 4.1A
Copper production during 1924–2004. USA annual average copper production and value per ton 1924–2004.
1930 1940 1950 1960 1970 1976 1980 1995 1997 2002 2004
Copper (Mt) 1.61 2.40 2.38 3.94 5.90 7.26 7.20 10.0 11.5 13.6 14.6
Max cell size (m³) 3 16 38 60 100 160 200 300
TABLE 4.1B
Copper production during 1924–2004. World copper production and the maximumsize of mechanical fl otation cells 1960–2004. Cell data are for Outotec cells.
TABLE 4.2
Growth in demand for metals and minerals for which fl otation was used as part of the production process 1950–2000.
Metal/mineral 1950 1960 1970 1980 1990 2000
Copper (Mt) 2.4 3.9 5.9 7.2 9.0 12.5
Zinc (Mt) 2.0 2.8 5.7 6.1 7.0 8.9
Lead (Mt) 1.6 2.4 3.4 3.5 3.3 3.2
Phosphate (Mt) 23.4 41.8 95.1 147 162 132
Potash (Mt) 3.1 9.1 18.2 27.9 27.5 27.0
TABLE 4.3
Largest copper fl otation plants in 1945 (Arbiter, 1999)*.
Plants Ton/day Machines
Morenci 45 000 432 Fagergrens
Utah Magna 35 000 590 Fagergrens
Utah Arthur 31 000 590 Fagergrens
New Cornelia 20 000 Hunt Air
Andes Copper 16 500 Callow Air
Miami 17 000 Miami Air
Chino 17 500 Southwestern Air
Anaconda 15 000 75 Minerals Separation
Nevada Consolidated 12 000 Air cells
Mufulira 8000 90 Agitairs
Brittania 6000 Forrester Air
* Several of these plants were subsequently increased in size.

Spectrum Series 18
F L O TAT I O N M A C H I N E S
95
By the end of World War II in 1945 mechanical cells were by far the most widely used type of � otation cell, although some Callow pneumatic cells and other airlift cells were still being used. The large copper plants of the day contained so many 2–2.5 m3 cells that there were concerns about the cost of building and operating new plants of similar or larger size. In 1960 the shadows cast by depression and war had gone and it was time for manufacturers to start designing larger mechanical cells and to investigate again the possibilities presented by machines with different � otation intensities. These were:
• Low-intensity machines such as columns, in which bubbles are large and � otation rates are low.
• Medium-intensity machines such as mechanical cells, in which bubbles are smaller and � otation rates are higher than in conventional columns by factors of 1.2–1.5.
• High-intensity machines, which are columns in which very small bubbles are formed and mixed intensively with pulp. Flotation rates are higher by factors of 2.0–4.0 than in mechanical cells.
Work on new mechanical and pneumatic cells started in the 1960s and the � rst models of large mechanical cells were installed in plants a few years later. The success of large mechanical cells at Bougainville Island heralded a change in the concept of high volume � otation; no more plants would be built with hundreds of small cells and the high capacity plants of the future would have relatively few large cells with much less � oor space, simpler operational control and lower costs of auxiliary equipment and instruments. The 1970s became the transition years for mechanical cells, during which large cells were built, tested in plants and compared with old, lower capacity machines. The new pneumatic cells that were tested took longer to � nd their places in the armoury of � otation equipment, but this did occur when their advantages became evident for some applications. During the early part of the 20th century, when the � otation process started, dozens of machines were patented, and certainly many more were tested and used in processing plants around the world. In 1914, Hoover listed 156 patents in the area, which he believed embodied 35 truly novel ideas. Nonetheless, by about 1947, three machine types – Denver, Fagergren and Galigher (Agitair) – dominated the market. The � rst part of this chapter follows the development of small � otation machines during 1910–1960, the second part is concerned with the larger machines used from the 1970s.
SURVEY OF EARLY MACHINE INSTALLATIONS
The American Institute of Mining, Metallurgical, and Petroleum Engineers held symposia
on ‘Flotation Practice’ in Salt Lake City in August 1927 and New York in February 1928.
Fahrenwald (1928) gave a detailed description of practice at 14 mills in the Coeur d’Alene
district of northern Idaho, summarised in Table 4.4.
The predominance of four machine types – Minerals Separation, Callow, O&D and
Fahrenwald – is evident. It is clear that this survey did not include all the mills in the district:
Fahrenwald reported that, although his design was only two years old, a total of 300 of
Fahrenwald machines were installed.

Spectrum Series 18
HIS
TO
RY
OF
FLO
TAT
ION
96
Company Mill t/d
Machine type and number in use
Minerals
Separation
Callow O & D Fahrenwald MacIntosh Hearing Hercules Parker K & K
Hecla Mining Old Gem 800 8 8
Hecla Mining Jig Tails 575 24
Callahan Zinc-Lead Galena 150 10
Federal Mining and Smelting Morning 1200 16 39 60
Federal Mining and Smelting Page 275 16 4 3
Bunker Hill and Sullivan Mining and Concentrating Old West n/a 2 1 6
Bunker Hill and Sullivan Mining and Concentrating South 300 30 4
Bunker Hill and Sullivan Mining and Concentrating El Hambra n/a 10
Bunker Hill and Sullivan Mining and Concentrating Sweeney 200 20 3
Hays Hays n/a 32
Constitution Mining and Milling Pine Creek 150 6 4 3 3
Hercules Hercules n/a 10 12 2
Ore-Idaho Mining and Milling Snow Storm 80 8
Total machines in operation 84 53 66 116 3 11 2 6 3
Number of mills using each machine type 6 4 2 7 1 4 1 1 1
TABLE 4.4
Flotation machines in the Coeur d’Alene district, 1927.
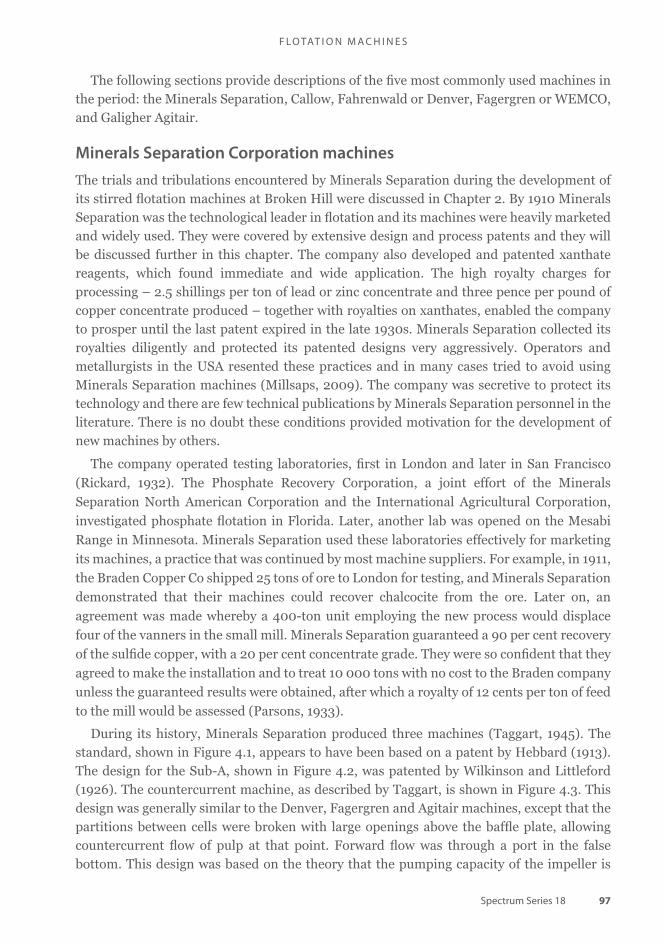
Spectrum Series 18
F L O TAT I O N M A C H I N E S
97
The following sections provide descriptions of the � ve most commonly used machines in the period: the Minerals Separation, Callow, Fahrenwald or Denver, Fagergren or WEMCO, and Galigher Agitair.
Minerals Separation Corporation machines
The trials and tribulations encountered by Minerals Separation during the development of its stirred � otation machines at Broken Hill were discussed in Chapter 2. By 1910 Minerals Separation was the technological leader in � otation and its machines were heavily marketed and widely used. They were covered by extensive design and process patents and they will be discussed further in this chapter. The company also developed and patented xanthate reagents, which found immediate and wide application. The high royalty charges for processing – 2.5 shillings per ton of lead or zinc concentrate and three pence per pound of copper concentrate produced – together with royalties on xanthates, enabled the company to prosper until the last patent expired in the late 1930s. Minerals Separation collected its royalties diligently and protected its patented designs very aggressively. Operators and metallurgists in the USA resented these practices and in many cases tried to avoid using Minerals Separation machines (Millsaps, 2009). The company was secretive to protect its technology and there are few technical publications by Minerals Separation personnel in the literature. There is no doubt these conditions provided motivation for the development of new machines by others.
The company operated testing laboratories, � rst in London and later in San Francisco
(Rickard, 1932). The Phosphate Recovery Corporation, a joint effort of the Minerals
Separation North American Corporation and the International Agricultural Corporation,
investigated phosphate � otation in Florida. Later, another lab was opened on the Mesabi
Range in Minnesota. Minerals Separation used these laboratories effectively for marketing
its machines, a practice that was continued by most machine suppliers. For example, in 1911,
the Braden Copper Co shipped 25 tons of ore to London for testing, and Minerals Separation
demonstrated that their machines could recover chalcocite from the ore. Later on, an
agreement was made whereby a 400-ton unit employing the new process would displace
four of the vanners in the small mill. Minerals Separation guaranteed a 90 per cent recovery
of the sul� de copper, with a 20 per cent concentrate grade. They were so con� dent that they
agreed to make the installation and to treat 10 000 tons with no cost to the Braden company
unless the guaranteed results were obtained, after which a royalty of 12 cents per ton of feed
to the mill would be assessed (Parsons, 1933).
During its history, Minerals Separation produced three machines (Taggart, 1945). The standard, shown in Figure 4.1, appears to have been based on a patent by Hebbard (1913). The design for the Sub-A, shown in Figure 4.2, was patented by Wilkinson and Littleford (1926). The countercurrent machine, as described by Taggart, is shown in Figure 4.3. This design was generally similar to the Denver, Fagergren and Agitair machines, except that the partitions between cells were broken with large openings above the baf� e plate, allowing countercurrent � ow of pulp at that point. Forward � ow was through a port in the false bottom. This design was based on the theory that the pumping capacity of the impeller is

Spectrum Series 18
H I S T O R Y O F F L O TAT I O N
98
usually greater than the feed rate, and that at least some of the excess capacity could be effectively used for countercurrent recirculation of pulp. The Sub-A Minerals Separation mechanical cell set the standard for all later mechanical cells; it was a remarkable invention at a time when � otation was unknown.
Minerals Separation ceased operation in 1942 when its key patents expired. The Coeur d’Alene Hardware Company sold a machine based on the Sub-A design and other machines were still in use for sul� de cleaning at Bancroft Mines’ Konkola Mill in 1963 (Barlin and Keys, 1963) and for scavenging at the Silver Summit Mill in northern Idaho in 1966 (Beall, 1966).
FIGURE 4.1
Minerals Separation standard machine.
FIGURE 4.2
Minerals Separation Sub-A machine.
FIGURE 4.3
Minerals Separation countercurrent machine.
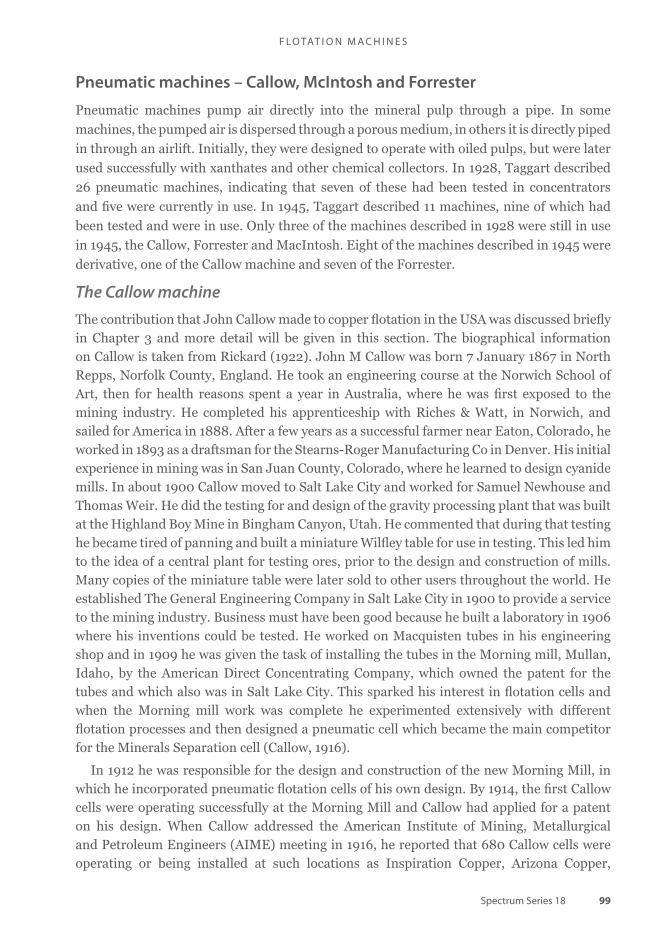
Spectrum Series 18
F L O TAT I O N M A C H I N E S
99
Pneumatic machines – Callow, McIntosh and Forrester
Pneumatic machines pump air directly into the mineral pulp through a pipe. In some
machines, the pumped air is dispersed through a porous medium, in others it is directly piped
in through an airlift. Initially, they were designed to operate with oiled pulps, but were later
used successfully with xanthates and other chemical collectors. In 1928, Taggart described
26 pneumatic machines, indicating that seven of these had been tested in concentrators
and � ve were currently in use. In 1945, Taggart described 11 machines, nine of which had
been tested and were in use. Only three of the machines described in 1928 were still in use
in 1945, the Callow, Forrester and MacIntosh. Eight of the machines described in 1945 were
derivative, one of the Callow machine and seven of the Forrester.
The Callow machineThe contribution that John Callow made to copper � otation in the USA was discussed brie� y in Chapter 3 and more detail will be given in this section. The biographical information on Callow is taken from Rickard (1922). John M Callow was born 7 January 1867 in North Repps, Norfolk County, England. He took an engineering course at the Norwich School of Art, then for health reasons spent a year in Australia, where he was � rst exposed to the mining industry. He completed his apprenticeship with Riches & Watt, in Norwich, and sailed for America in 1888. After a few years as a successful farmer near Eaton, Colorado, he worked in 1893 as a draftsman for the Stearns-Roger Manufacturing Co in Denver. His initial experience in mining was in San Juan County, Colorado, where he learned to design cyanide mills. In about 1900 Callow moved to Salt Lake City and worked for Samuel Newhouse and Thomas Weir. He did the testing for and design of the gravity processing plant that was built at the Highland Boy Mine in Bingham Canyon, Utah. He commented that during that testing he became tired of panning and built a miniature Wil� ey table for use in testing. This led him to the idea of a central plant for testing ores, prior to the design and construction of mills. Many copies of the miniature table were later sold to other users throughout the world. He established The General Engineering Company in Salt Lake City in 1900 to provide a service to the mining industry. Business must have been good because he built a laboratory in 1906 where his inventions could be tested. He worked on Macquisten tubes in his engineering shop and in 1909 he was given the task of installing the tubes in the Morning mill, Mullan, Idaho, by the American Direct Concentrating Company, which owned the patent for the tubes and which also was in Salt Lake City. This sparked his interest in � otation cells and when the Morning mill work was complete he experimented extensively with different � otation processes and then designed a pneumatic cell which became the main competitor for the Minerals Separation cell (Callow, 1916).
In 1912 he was responsible for the design and construction of the new Morning Mill, in which he incorporated pneumatic � otation cells of his own design. By 1914, the � rst Callow cells were operating successfully at the Morning Mill and Callow had applied for a patent on his design. When Callow addressed the American Institute of Mining, Metallurgical and Petroleum Engineers (AIME) meeting in 1916, he reported that 680 Callow cells were operating or being installed at such locations as Inspiration Copper, Arizona Copper,

Spectrum Series 18
H I S T O R Y O F F L O TAT I O N
100
Anaconda Copper, Magma Copper, Silver King, Daly-Judge, Duquesne and El Rayo, processing 25 000 to 28 000 tons per day (Callow, 1916). It was a remarkable achievement and in recognition of this the AIME presented its prized James Douglas Gold Medal to John Michael Callow in 1926. The citation read ‘For distinguished services in the concentration of ores, particularly in methods of � otation’.
His inventions went beyond pneumatic � otation; he was the holder of seven US patents relating to mining and mineral processing. He designed and patented the Callow cone, the Callow tank and the Callow screen, which is a travelling belt of screen cloth. The latter two inventions were licensed to the Galigher Machinery Co, as manufacturer and agent. Mr Callow remained in Salt Lake City until his return to England to retire in 1933, where he continued as president of General Engineering until 1940. Strictly speaking, the Callow cell was not the � rst pneumatic cell, but it was relatively inexpensive and simple to operate. Furthermore, because of a difference in the consistency of the froth product, it was thought that the Callow machine did not violate the Minerals Separation patents, but the courts later ruled that this was not the case. The patent for the original Callow cell was issued in 1915 and improved designs were patented in 1920 and 1921. Simply, the cell was a trough with a porous medium at the bottom, through which air was forced under pressure. The patent allowed for any type of porous medium, from porous brick to cocoa matting. Suspension of solids was apparently maintained by the � ow velocity of the slurry through the cell. In later designs, each cell was divided into several sections. Figure 4.4 shows the design from Callow’s 1915 patent. Interestingly, this patent also shows a discharge box with a dart valve and a level control mechanism, features still found in modern � otation circuits.
FIGURE 4.4
Original Callow pneumatic machine (Callow, 1915).
Callow cells with porous concrete bottoms were installed at the Ray Concentrator in Arizona in 1917. In 1924, they were replaced with a modi� ed design called the Chino cell, which used mat bottoms of heavy cotton. These cells were 15 feet long, 30 inches wide and 24 inches deep at the shallow end, with a bottom slope of one-half inch per foot. Cells of this design were used for roughing and two stages of cleaning.

Spectrum Series 18
F L O TAT I O N M A C H I N E S
101
In 1955, the plant was updated and new Callow cells of the Chino type were installed as roughers, with ten rows of cells, each with four cells in series. Each cell was approximately 30 feet long, 30 inches wide, 24 inches deep at the shallow end and 38 inches deep at the discharge weir. The porous medium was a four-ply, cotton fabric. Fagergren cells were used in all three cleaning stages. This � otation circuit used lime as a pulp conditioner and operated at a high pH, so precipitation of lime on the mats shortened their effective operating life. Various methods of preventing deposition of the lime scale were tried, but none was entirely satisfactory. Various methods for removing the scale were tested, including application of dilute hydrochloric acid and scraping and brushing the mats by hand. The acid treatment was fairly successful, but the brushing and scraping by hand proved too laborious. Eventually, the scale was removed by brushing the mats at least once a week with a motor-driven, wire brush. Rows to be reconditioned were shut down so that necessary mat changes could be made, and the remaining mats were thoroughly brushed and tested before being placed in service at the end of the shift. All new mats were soaked with fuel oil to retard the precipitation of lime within the pores of the mat. Two men on day shift were employed to maintain the mats in good operating condition. With the mats in good condition, one � otation operator per shift could handle the entire roughing circuit by adjusting the amount of air applied and occasionally removing accumulated sand by means of a punch stick (Sewell, 1955). The Callow cells at Ray were in operation as late as 1972 (Bassarear, 1985).
The operation and maintenance of Callow machines was dif� cult. Operators carried a large wooden pole, called the plunger, with which they would regularly and repeatedly ‘thump’ the blanket to dislodge the lime deposits thereon. Frank Millsaps, a metallurgist who worked with Callow cells in several small mills, reports that Callow cell operators walked with a permanent lean to the side – the side on which they carried the plunger (Millsaps, 2009). The General Engineering Company also developed and sold � otation chemicals (Oldright, 1924) and � otation machines besides the Callow. When the MacIntosh machine, described below, was patented in 1926, it was licensed to General Engineering and became known as the Callow-Macintosh machine. General Engineering also sold the Pan American machine, patented by Drake in 1939. Lionel Booth and Jack Thompson worked at General Engineering before designing the Agitair mechanism. (The Pan American and Agitair machines are described below.) The GECO mechanical cell was introduced in 1934 (Gayford, Heginbotham and Hamilton, 1937). Taggart (1945) gives costs for two � otation machines offered by GECO, designated ‘MacIntosh’ and ‘mechanical’. It is not clear when General Engineering ceased business. The 1940 membership roster for the AIME shows as members John M Callow, of General Engineering Co and Michael J Callow, of British GECO, both in London. In 1961, Michael J and J M Callow are listed as employees of British Geco Engineering Co Ltd in Edenbridge, United Kingdom. In 1970, M J Callow was listed as an ‘independent’ member, residing in Surrey.
The MacIntosh machineLike the Callow machine, the MacIntosh dispersed air into the slurry through a canvas blanket. However, the MacIntosh blanket was � tted around a horizontal rotor. Particles on the portion of the blanket on the bottom of the turning rotor were to some extent removed.

Spectrum Series 18
H I S T O R Y O F F L O TAT I O N
102
Some early reports indicated that the MacIntosh machine used less power than the Callow. In 1929, MacIntosh cells replaced ‘Inspiration-type Callow cells’ at the Phelps Dodge New Cornelia operation in Ajo, Arizona. In 1957, MacIntosh cells were reported in operation at � ve Canadian mines, Gaspe Copper, Flin Flon, Creighton, Normetal and Campbell Chibougamau (Convey et al, 1957).
FIGURE 4.5
The MacIntosh machine (MacIntosh, 1926).
FIGURE 4.6
MacIntosh machines at Gaspe Copper, 1957.
FIGURE 4.7
Close-up of MacIntosh machine at Gaspe Copper, 1957.
The Forrester machineThe Forrester cell, shown in Figure 4.8, was developed in 1924 at Phelps Dodge’s Old Dominion Mill in Globe, Arizona. It was soon adopted at the company’s operations in Bisbee and Morenci, and at Nevada Consolidated Copper in McGill, Nevada (Mohr, 1927).

Spectrum Series 18
F L O TAT I O N M A C H I N E S
103
The Forrester and its successors (Hunt, Hunt-Dunn, Southwestern, Steffensen and others) were airlift machines. Because they had no blankets, airlift cells did not have the blinding problems associated with Callow cells. The Forrester cells at Peñoles, Mexico, were replaced in 1942 (Symonds, 1942). In 1943, unsuccessful tests of MacIntosh and Forrester cells were conducted at the Sullivan concentrator in Idaho, and Southwestern cells were in use at the London mill of Tennessee Copper (Banks, 1946; Myers and Lewis, 1943). Forrester machines were reported in operation at Britannia Copper in Canada in 1957 (Convey et al, 1957). In 1916, Southwestern cells were installed at the Chino Copper Co in New Mexico. In 1966, rougher duty at Chino was performed by 16 rows of Southwestern cells, with three, 27-foot cells per row, one row of 14, 66-in Fagergren cells and one row of 20, No 48 Agitair cells (Gibson and Trujillo, 1966).
‘Airlift’ cells of unspeci� ed type were reported in use at Mulu� ra and Roan Antelope in 1948 (White and Adair, 1948; Goldick, 1948). The Steffensen airlift machine shown in Figure 4.9 was developed in Cornwall and used in coal cleaning plants in the USA and Great Britain (Zimmerman, 1950). Figure 4.9 is an illustration prepared in 1951 by the Western Machinery Company (WEMCO), who after 1948 sold the Steffensen machine in the USA.
While the Minerals Separation machines and the various pneumatic machines were in use into the latter half of the last century, after about 1935 the Fahrenwald (Denver), Galigher
FIGURE 4.8
The Forrester machine, 1927.

Spectrum Series 18
H I S T O R Y O F F L O TAT I O N
104
Agitair and Fagergren (WEMCO) machines were much more widely used. This is re� ected in a survey of papers published by the AIME and the Southern African Institute of Mining and Metallurgy, for the period 1916 through 1972, summarised in Table 4.5. The table shows the number of references to each type of machine in a given period. Of course, this summary does not give a complete picture of worldwide installations of the various machines, but it does give a good indication of the trends in utilisation.
FIGURE 4.9
The Steff ensen machine.
Minerals Separation
Standard Sub-A Callow Denver1 WEMCO2 Agitair
1916–1926 1 4 1
1927–1936 5 4 6 3 3
1937–1946 1 1 4 8 1
1947–1956 1 12 11 5
1957–1966 1 9 12 8
1966–1972 4 8 7
1. Denver includes Fahrenwald.
2. WEMCO includes Fagergren.
TABLE 4.5
Numbers of articles describing various fl otation machine types.
Mechanical cells
During the 1930s the mechanical cell market was dominated by three manufacturers, Fagergren-WEMCO, Denver Equipment Company and Galigher-Agitair. FLSmidth now owns the companies which built the Fagergren-WEMCO and Galigher-Agitair cells, and Metso owns Denver Equipment Company.

Spectrum Series 18
F L O TAT I O N M A C H I N E S
105
The Fahrenwald machine and Denver Equipment Company
Arthur W FahrenwaldArthur W Fahrenwald was born in Yankton County, South Dakota, in 1890, of immigrant parents from Norway, he attended the South Dakota School of Mines, receiving a BS degree in Metallurgical Engineering in 1916. From 1915 to 1917, he taught at the New Mexico School of Mines. In 1919 he joined the US Bureau of Mines Field Station at the University of Idaho. He was appointed to the faculty of the School of Mines at the University of Idaho in 1929, and was Dean of the School of Mines and Director of the Idaho Bureau of Mines and Geology from 1934 to 1954. He retired in 1960 and died in 1983. Fahrenwald designed the Fahrenwald Hydraulic Classi� er in 1920 and the Fahrenwald Sub-A � otation machine in 1923. By the mid-1950s, Denver Equipment Company had sold over 35 000 units of their Sub-A machine to 4800 plants worldwide. Flotation machines incorporating Fahrenwald’s concepts are still being manufactured. He was awarded 17 patents related to crushing, grinding and � otation.
History of the Denver Equipment CompanyThe Denver Equipment Company (Denver) was founded in 1927 by Arthur C Daman and his associates, Bruce C Davey, Frank Briber, Leland H Logue, Victor Johnson and Josiah G Holland. Daman and Briber had worked together at Stearns Rogers, which owned General Iron Works, the manufacturer of a wide range of mineral processing equipment. Within a few years, control of the company had passed to Daman, who was president, Logue, who was vice president of production and engineering, and Holland, who was vice president and legal counsel. Mr Daman was the dominant � gure in the company for 40 years. He patented almost 50 inventions, but almost all were licensed to a separate company, the Mining and Process Patent Company, allowing Daman to collect royalties from Denver. Daman’s � rst patent, in 1925, was for a � otation machine very similar to the Minerals Separation standard machine. His second, in 1927, was an oil feeder for � otation machines.
In 1936, Denver built a new building, which included a test laboratory. Lab testing and � ow sheet design became one of the important marketing tools of the company, and it prospered by developing and sharing technical information. A company magazine, the DECO Trefoil, was published monthly or bi-monthly. Each number included a � ow sheet with detailed explanation and a pull-out ‘Engineering’ section, with detailed technical information on a selected concentrator plant or an aspect of mineral processing. In 1937, Denver acquired manufacturing facilities in Colorado Springs, Colorado, which provided an excellent site for testing and demonstrating � otation machines. Tests were usually done using a mixture of foundry sand and pyrite (Seeton, 2009).
The Denver Sub-AThe � rst machine manufactured by Denver was the Sub-A � otation cell. This machine was based on a patent licensed from Arthur W Fahrenwald (1922) which had already been used extensively in the Coeur D’Alene mining district in Idaho. Apparently there was no concern with using the same name as the Minerals Separation ‘Sub-A’ machine. In much of the literature, early Denver machines are referred to as ‘ Denver (Fahrenwald)’ cells. The

Spectrum Series 18
H I S T O R Y O F F L O TAT I O N
106
machines described in the � rst patents of both Fahrenwald (1922) and Daman (1925) seem to be derivative of the Minerals Separation Sub-A machine (Hebbard, 1913), as shown in Figure 4.10. All of them contemplated operation of the cells in rows.
FIGURE 4.10
Early cell designs: Hebbard (left) (Minerals Separation), Daman (middle), Fahrenwald (right).
The differences, as re� ected in the patent claims, are summarised:
• The Hebbard machine was patented � rst, in 1913. Its major innovation was placing the
spitzkasten (froth chamber) on the same level as the mixing vessel. In previous Minerals
Separation machines, the spitzkasten was below the mixing vessel. It also included a
provision (J) for returning froth from the froth launder to the mixing vessel.
• The Daman machine has a covered impeller (18) and a paddle for froth removal (29). It
has a complex system for returning froth either upstream or downstream in a row of cells,
a manual system for removing sands from the bottom of the froth chamber and a bypass
pipe with a valve (not shown in the � gure) to allow transfer of some of the sand to the next
cell downstream. Finally, the Daman machine included a pipe (40) for introduction of air
to the mixing chamber. However, the direction of this air� ow was against the � ow of the
aerated pulp to the froth chamber.
• The Fahrenwald machine included two distinct innovations. First, the froth chamber is
separated from the mixing chamber only by a baf� e (20). Second, the pulp is maintained
in continuous circulation while at the same time being subjected to aeration. Third, air
is introduced directly to the impeller mechanism, through a ‘casing’ around the impeller
shaft.
Figure 4.11 shows the next generation of patents, � led by Fahrenwald in 1927 (Fahrenwald,
1934) and Daman in 1928 (Daman, 1934a, 1934b) appear to have been in� uenced by the
Minerals Separation Sub-A machine, for which the US patent was issued in 1926. The
Fahrenwald design shows a feed box (3) and an over� ow for froth (6), both of which became
standard features. The design also included a standpipe (12) through which air could be
drawn into the impeller, and the impeller rotated inside a four-vane stator (not shown).

Spectrum Series 18
F L O TAT I O N M A C H I N E S
107
The Daman design shows an impeller (16) in a cast bowl (11). Above the impeller is a shroud (18), and the patent discusses the concept of recirculation of part of the pulp through the shroud. It also shows optional perforations (19) in the standpipe (13), which are said to allow additional recirculation if desired. In addition, machines could be � tted with pipes (not shown) that allowed the return of middlings from the bottom of the froth launder to the standpipe. This
design, with some variations, became the standard Denver Sub-A machine.
The Sub-A allowed the recycle of pulp (middlings) without sumps and pumps. It was also capable of highly selective � otation, as is needed in the separation of copper and molybdenum. Originally, the Sub-A was operated in a ‘cell-to-cell’ con� guration, in which the reagent addition to each cell, and the levels in that cell, were controlled separately. The cell-to-cell installations were attractive because they allowed great � exibility, were very selective and made high-grade concentrates. However, as plants got larger, small improvements in recovery became much more signi� cant. Also, it was important for the � otation sections in the larger plants to accommodate variations in the � ow from grinding. Thus the open-cell or ‘hog-trough’ designs, introduced in the late 1940s, became more popular. There were many variations in the Sub-A design. The company’s slogan was, ‘No yearly models, but continually improving’.
With the cooperation of the US Bureau of Mines, special machines, called the Lasseter type, were designed for coal � otation. These had chain-driven froth paddles to remove the large froth volumes, as shown in Figure 4.12. By 1953, there were three types of mechanisms. The ‘super rougher’, introduced in 1954, featured low pulp level, adjustable froth depth, double froth over� ow, controlled feed to the agitation chamber and an adjustable sand relief opening. Daman had strong opinions about process design, one of which was that the mineral should be recovered as soon as it is liberated. A single, Sub-A machine was often used in a ball mill/classi� er circuit to recover the liberated, coarse mineral before further processing.
FIGURE 4.11
Second-generation machines by Fahrenwald (left), Daman (right).

Spectrum Series 18
H I S T O R Y O F F L O TAT I O N
108
The Denver Unit Cell, shown in Figure 4.13, was introduced in the early 1940s and was very successful. Many unit cells were installed at ball mill discharges, sometimes in series with a jig. This idea reappeared many years later in a modi� ed form and was called � ash � otation.
FIGURE 4.13
The Denver unit cell, 1953.
FIGURE 4.12
Lasseter-type Sub-A machine.
The Denver DR*The Denver Sub-A, in open cell design, was tested against WEMCO machines at White Pine Copper. The WEMCO machines produced lower-grade tailings. It was noted that larger cells showed some size segregation, with larger particles near the bottoms of the cells. The Denver DR design was developed in the early 1960s by Arthur Daman Jr and Leland Logue, assisted by Frank Seeton (Logue and Daman, 1968; Seeton, 2009). The intent of the design
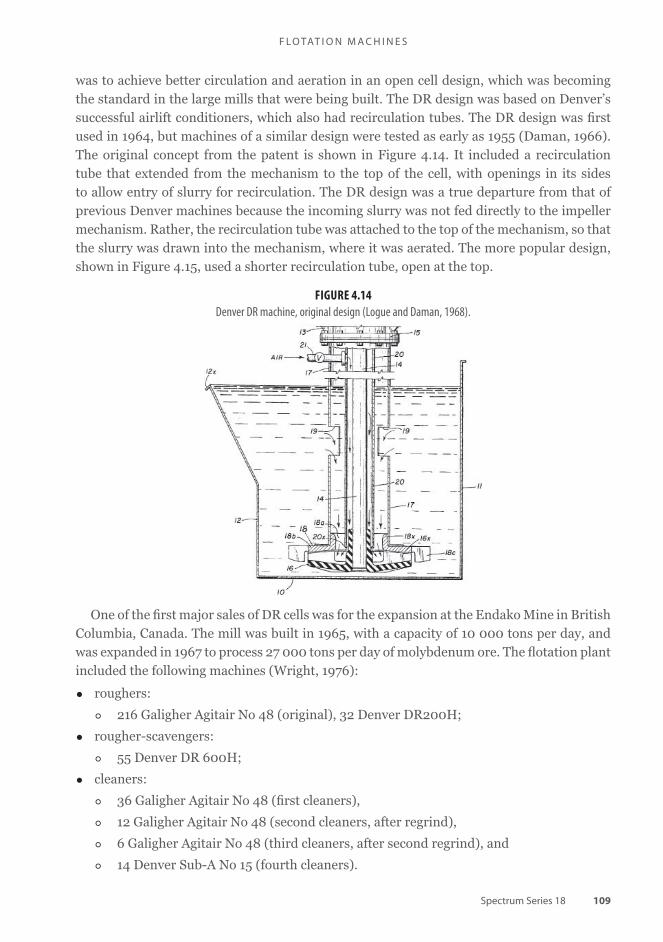
Spectrum Series 18
F L O TAT I O N M A C H I N E S
109
was to achieve better circulation and aeration in an open cell design, which was becoming the standard in the large mills that were being built. The DR design was based on Denver’s successful airlift conditioners, which also had recirculation tubes. The DR design was � rst used in 1964, but machines of a similar design were tested as early as 1955 (Daman, 1966). The original concept from the patent is shown in Figure 4.14. It included a recirculation tube that extended from the mechanism to the top of the cell, with openings in its sides to allow entry of slurry for recirculation. The DR design was a true departure from that of previous Denver machines because the incoming slurry was not fed directly to the impeller mechanism. Rather, the recirculation tube was attached to the top of the mechanism, so that the slurry was drawn into the mechanism, where it was aerated. The more popular design, shown in Figure 4.15, used a shorter recirculation tube, open at the top.
FIGURE 4.14
Denver DR machine, original design (Logue and Daman, 1968).
One of the � rst major sales of DR cells was for the expansion at the Endako Mine in British Columbia, Canada. The mill was built in 1965, with a capacity of 10 000 tons per day, and was expanded in 1967 to process 27 000 tons per day of molybdenum ore. The � otation plant included the following machines (Wright, 1976):
• roughers:
� 216 Galigher Agitair No 48 (original), 32 Denver DR200H;
• rougher-scavengers:
� 55 Denver DR 600H;
• cleaners:
� 36 Galigher Agitair No 48 (� rst cleaners),
� 12 Galigher Agitair No 48 (second cleaners, after regrind),
� 6 Galigher Agitair No 48 (third cleaners, after second regrind), and
� 14 Denver Sub-A No 15 (fourth cleaners).

Spectrum Series 18
H I S T O R Y O F F L O TAT I O N
110
The 200H model was two 100-cubic-foot tanks joined with no partition, and � tted with two mechanisms. The 600H was similar, with two 300-cubic-foot tanks and two mechanisms. The DR machine quickly gained wide acceptance. The concept was so popular that a phosphate plant in Florida modi� ed their Sub-A cells by cutting the heads off oil drums and attaching those drums to the tops of the diffuser plates in the Sub-A mechanisms (Seeton, 2008). When larger machines were designed, as described below, they used the DR design. The Denver Equipment Company was purchased by Joy in 1967, and Arthur Daman died the next year. Joy had a different approach to technology development and marketing and many of the long-time Denver employees left the company in the next few years. Later, much of the mineral processing technology developed by Denver, including � otation machines, was sold by Joy to Sala, which became Svedala. The 1996 Svedala handbook shows Sub-A and DR machines that are unchanged from the Denver designs. In yet another merger, some of Svedala’s technology was transferred to Metso. The current Metso � otation machines are thus the successor to the long line Denver � otation machines.
The Agitair machine and the Galigher Company
In 1932, Jack Thompson and Lionel Booth were both working for J M Callow at the General Engineering Company in Salt Lake City, Utah. General Engineering produced both the Callow and the Pan American � otation machines. The Pan American machine (Drake, 1939) is shown in Figure 4.16. Although the Callow machine had been fairly successful in the 1920s, by this time it had been displaced by mechanical cells, and the Pan American machine had not achieved wide acceptance.
FIGURE 4.15
Denver DR machine, later, simplifi ed design.

Spectrum Series 18
F L O TAT I O N M A C H I N E S
111
Thompson and Booth left General Engineering and formed a partnership known as Booth Thompson Metallurgical Company. They reworked the basic design of the Pan American cell, reducing its depth and designing a new stator, which they called a bubble peeler in the literature. The new machine was called the BT � otation cell (Millsaps, 2009). The patent application, which carried only Booth’s name, was � led in 1932. The design is shown in Figure 4.17.
FIGURE 4.16
Pan American cell (Drake, 1939).
FIGURE 4.17
Original Agitair cell (Booth, 1936).
Magma Copper Company in Superior, Arizona, expressed an interest in replacing their Callow cells with the BT cells. Jack Thompson was also able to persuade the Anaconda Company to install a row of BT cells for comparison with the Callow cells they were using. Because Booth Thompson had no manufacturing facilities they contracted with the Galigher Machine Shop, a blacksmith shop and machine shop in Salt Lake City, to fabricate the cells. Galigher had a history of manufacturing newly-invented mineral processing equipment, and had been the manufacturer and licensee for J M Callow’s early inventions, before Callow formed his own company. When Booth’s patent issued in 1936, it was licensed to the Galigher Company. About this time Phelps Dodge built a 5000 tons per day pilot plant at Morenci. They invited each manufacturer of � otation cells to install and operate a row of cells, for comparison. The feed was switched from bank to bank so that each test group received about the same feed over an extended period of time. The Galigher cells under these conditions proved far superior to any of their competitors. They showed better recovery and consumed less power. The head of the Fagergren team convinced the manager of the test

Spectrum Series 18
H I S T O R Y O F F L O TAT I O N
112
program that the difference was in the operators, and Phelps Dodge decided to run a test using their own personnel to operate the machines, with the manufacturers’ representatives off the premises. The Phelps Dodge operators had no experience with any machines except the Fagergrens, which required little attention besides feed and reagent control. Under these conditions the Fagergrens won the evaluation, and Phelps Dodge bought them for Morenci.
The original BT cells, as shown in Figure 4.18, had some operating problems. First, they were an ‘outside air’ machine, with the air inlet in the bottom of the cell so the air would be released under the impeller. The air valve had a nasty habit of getting clogged, causing the cell to ‘go � at’ and requiring the operator to crawl under the machine to unplug the valve. The froth level control was also tedious. Each cell had a variable tailings gate that had to be individually set to control � ow to the next cell in the row. Both of these problems were solved in the early 1940s. The level control was improved by incorporating a small hole near the bottom of the cell in the tailings gate area to allow an amount of tails to move. This was similar to the sand passage in the Denver Sub-A machine. Dart valves were used to control cell level. The air inlet problem was corrected initially by incorporating a hollow shaft for the impeller drive, with air supplied through a swivel connection at the top of the shaft. Later, a special bearing housing was developed that allowed air to be supplied through the housing to a slotted shaft. Figure 4.18 shows a large Agitair machine from a 1987 brochure. By the 1960s, Galigher offered three impeller designs and three stabiliser designs for the Agitair machine, each intended for different conditions. Those designs are shown in Figure 4.19. The Anaconda Company was one of the biggest users of Agitair cells. At one time the president of Galigher, Johnny Potts, had a permanent of� ce in Butte.
FIGURE 4.18
Large Agitair machine.
Figure 4.20 shows the Agitair cells installed at the Anaconda concentrator in Montana. Agitair cells were also installed at Anaconda’s plants in Chile, Chuquicamata and Salvador.
The Galigher Company expanded into pumps, buying the US rights to the VacSeal pump from an English company. They also established an engineering department, a metallurgical

Spectrum Series 18
F L O TAT I O N M A C H I N E S
113
FIGURE 4.19
Agitair impellers and stabilisers.
FIGURE 4.20
Galigher Agitair cells at Anaconda.
consulting group, a metallurgical test laboratory and a subsidiary rubber fabrication company. In the late 1940s they established a mill supply branch. All of these developments tended to increase the sales of the Agitair � otation cell.

Spectrum Series 18
H I S T O R Y O F F L O TAT I O N
114
Table 4.6 shows design details of Agitair cells introduced through 1972. The metallurgical consulting group included ten well-recognised men. One was stationed in Australia, one in Chile, one in Canada and one in South Africa; the rest were available on demand from Salt Lake City. The engineering department not only designed machines for manufacturing, but also designed entire plants for customers. While none of these units showed pro� ts as separate cost centres, each contributed greatly to the Galigher Company sales because in their contact and work with customers they always recommended Galigher equipment and generally sold it.
Model1 Year2 Tank size (in)3
W × LL × D
Impeller
diameter
(in)
Cell
volume
(ft3)
Tip Vel
(ft/min)
Air
ft3/min
hp4 Feed rate5
t/d
8 1932 8 × 8 × 8 4.5 0.3 930–1700 2 0.3 20
12 12 × 12 × 12 7.5 1.0 840–1700 7 2 20
15 15 × 15 × 15 7.5 1.6 840–1700 10 2 35
24 1933 24 × 24 × 27 12.5 10 1000–1430 20 3 300
36 1934 36 × 36 × 30 17.5–18.25 22.5 900–1475 40 5 600
48 × 40 1939 48 × 48 × 30 26.5–27 40 1000–1440 60–75 9–12 2000
48 × 50 48 × 48 × 40 27 50 1000–1440 60–75 9–12 5000
60 × 60 60 × 60 × 30 27 60 1050–1250 125–140 14–17 3000
60 × 75 60 × 60 × 36 27 75 1050–1250 125–140 14–17 3000
60 × 100 60 × 60 × 48 27 100 1170–1250 125–140 14–17 3000
78 × 150 78 × 78 × 48 27–30 150 1170–1250 140–200 19–20 4000
96 × 200 96 × 96 × 40 Four 27 200 1050–1170 240–300 20–22 10 000
120 × 300 1964 120 × 120 × 36 Four 27 300 1170 400–500 28–30 15 000
120 × 400 120 × 120 × 48 Four 27 400 1170 400–500 28–30 20 000
90A × 300 120 × 90 × 52 40 300 1200–1450 350 25–30 20 000
120A × 400 120 × 120 × 52 40 400 1200–1450 400 25–30 20 000
120A × 500 144 × 120 × 54 40 500 1200–1450 400 30–40 24 000
144 × 500 1972 144 × 144 × 54 Four 27–30 650 1170–1270 600 30–35 24 000
120 × 800 240 × 120 × 52 Two 40 850 1200–1450 800 50–60 48 000
1. Model number designated lip length × volume.
2. Year is shown when known.
3. W = width, LL = lip length, D = depth at froth lip.
4. Horsepowers for models through the 78 × 150 are for a two-cell unit.
5. Throughput is based on 30 – 35 per cent solids.
TABLE 4.6
Galigher cells introduced through 1972 (modifi ed from Dreyer, 1976).
In the late 1950s Baker Oil Tools purchased the Galigher Company. For several years Galigher continued to operate independently, but by the early 1970s Baker began making changes. Galigher’s president was replaced by an individual unfamiliar with the minerals

Spectrum Series 18
F L O TAT I O N M A C H I N E S
115
industry. The engineering group was spun off in 1972, bought by Abe Matthews in 1979, and closed in 1984. The mill supply business was closed and the metallurgical consulting group was operated as an independent cost centre, and the long-time employees eventually sought work elsewhere. In the early 1980s, the metallurgical lab was spun off as Dawson Metallurgical Laboratories, under the direction of Harmel ‘Bull’ Dawson. That company, now owned by FLSmidth Co, is still in business.
Baker Oil Tools merged with the Hughes Drilling Company and became Baker Hughes. Baker Hughes management determined that Galigher did not � t their business model and began disassembling the company. The pump business was merged with Ashe Pump, also owned by Baker Hughes, and most of the rest of the Galigher Company was sold to the Western Machinery Company (WEMCO). WEMCO manufactured the Fagergren cell, which had been renamed the WEMCO cell. Because of the obvious competition between the two products, Western Machinery did not actively promote the Agitair machine and sales dropped rapidly. WEMCO was eventually purchased by Envirotech, who also purchased the EIMCO Process Equipment Company, and the WEMCO mineral processing equipment was placed under EIMCO’s management. Ironically, Baker Hughes later purchased Envirotech, and thus became the owner of both � otation cell technologies – Agitair and WEMCO. Baker Hughes sold EIMCO Process Equipment to G L & V, a Canadian company, in 2001. G L & V had also purchased Dorr Oliver and joined the two companies as Dorr Oliver EIMCO. In 2007, FLSmidth purchased the mineral processing portion of Dorr Oliver EIMCO, combined that company with FLSmidth’s existing subsidiary, FFE Minerals, and formed FLSmidth Minerals. FLSmidth Minerals now owns the technology for Agitair and WEMCO machines, as well as the recently designed Dorr-Oliver and Xcell machines.
Lionel BoothLionel Booth, inventor of the Agitair machine, did not stay long with the Galigher Company. According to Frank Millsaps (2009), who knew Booth well, ‘He was a great inventor, but not a very good businessman’. Booth remained in Salt Lake City and continued to work as a metallurgist and designer of � otation equipment. The Booth Co advertised regularly in Mining Engineering from 1960 to 1969, offering engineering services, metallurgical testing, the Booth two-impeller � otation machine and equipment for metallurgical test laboratories. In the September 1964 issue of Mining Engineering, the Booth Co advertised a 200-ft3 machine. This appears to have been the � rst, single-mechanism machine of this size. Bassarear (1985) reported that, in 1972, two copper concentrators were using the large Booth machines: Bethlehem Copper, in British Columbia, Canada, used three 200-ft3 machines for treatment of scavenger tails, and Toquepala, in Peru, was testing a ten-cell row of 225-ft3 Booth machines, in competition with an eight-cell row of 200-ft3 Agitair cells and a ten-cell row of 300-ft3 Fagergren cells.
The Fagergren and WEMCO machines
The third major machine type used during the period 1925–1970 was developed by William Fagergren and marketed � rst by American Cyanamid Co, then by Western Machinery Co or WEMCO.

Spectrum Series 18
H I S T O R Y O F F L O TAT I O N
116
William Fagergren
William Fagergren was born at Salt Lake City, Utah, on 18 February 1886, to Swedish
immigrants Carl Johan and Lovisa Soderberg Fagergren. He was their thirteenth and youngest
child. Early in his life, Fagergren worked with his brother-in-law, Ernest Gustav Peterson,
and others in the construction and operation of mineral processing mills, where he learned
carpentry, timber construction and the overall mechanical aspects and equipment of such
mills. In 1912 and 1913, Fagergren assisted Ernest Peterson in the construction of the Butte &
Superior Mill in Butte, Montana. Peterson was Master Mechanic at the Arthur Plant of Utah
Copper Co when Daniel C Jackling asked him to go to Butte in 1912 to construct that mill,
the � rst � otation mill in the USA for the differential separation of a lead–zinc ore. When that
job was � nished, Fagergren moved with his wife and two children to Basin, Montana. There
he worked at the Basin Reduction Co plant, which was under lease to the Butte & Superior
Copper Co. Here many of the early developments in the � otation process were taking place.
Fagergren returned to Utah in 1914. Based on their experience in Montana, he and William
D Green developed and designed a subaerated � otation machine, which was patented in
1916. This machine was used for differential � otation of lead and zinc from the tailings of the
US mill in Midvale, Utah. This was reportedly the � rst application of differential � otation in
the USA. According to family tradition, the rights to the 1916 patent were sold to Minerals
Separation for $2000. Fagergren on his own then developed and patented his horizontal all-
cast iron � otation machine. The lead–zinc mill of Combined Metals Reduction Co, south of
Tooele at Bauer, Utah, was equipped completely with these machines, and was the � rst plant
in the USA for differential � otation of run-of-mine, lead–zinc ore. Senator Clark’s Ophir Hill
Consolidated mill at Ophir, Utah, also installed this machine, as did other mills in Idaho and
Nevada. In the early 1920s, the Fagergren Flotation Machine Co was established, with of� ces
and a laboratory in Salt Lake City.
By 1926, Fagergren had moved and re-established his facilities as the Universal Engineering Co. Here he built a number of machines in a cascade series design with timber tanks and cast-iron mechanical parts. During the winter of 1927–28, the detail and assembly drawings for the six-foot series machine were completed by Fagergren’s nephew, Ernest Clarence Peterson, in his room at a boarding house in Tooele, Utah. At that time, Fagergren was temporarily pinch-hitting as mill superintendent for the Combined Metals Reduction Co at their Bauer Plant, where his old friend, Johnny Green was the plant metallurgist. During the Great Depression, Fagergren’s new company suffered, along with all other businesses. Fortunately, in the depths of this decline, Hudson Bay Mining & Smelting Co had just completed a new mining, milling, smelting and electrolytic zinc re� ning complex at Flin Flon, Manitoba, and were experiencing dif� culties in the milling and � otation separations of their talc-laden, copper–zinc–gold ores. The president and vice president in charge of operations at Flin Flon, ‘Hardrock’ Channing and Bob Phelan, were old friends of Fagergren, and Phelan wired Fagergren to come and assist them. He had also wired Anaconda and others for help, but Anaconda declined to advise or offer any metallurgists. Fagergren wired Phelan that he and his nephew, Ernest C Peterson, were available. (Western Union refused to send the collect telegram because to cut expenses in that stringent time Fagergren had

Spectrum Series 18
F L O TAT I O N M A C H I N E S
117
removed the telephone and directory listing of Universal Engineering. However, Postal Telegraph took the collect wire without question.) Bob Phelan accepted the offer and asked Fagergren and Peterson to report as soon as possible.
During the preceding year, Fagergren had conceived the idea of putting the principles of his cast-iron horizontal machine into a vertical arrangement, but with a completely new idea featuring a rubber-covered rotor with vaned impellers top and bottom to induce and mix air from above into the ore pulp circulated from below and to force the mixture through a stator into the frothing chamber of the cell proper. He built a small test cell of this design in stainless steel, using a direct-connected motor taken from a Hoover vacuum cleaner. ‘We took this test machine with us to Flin Flon and there proved its ef� ciency and beautiful performance against the then-common test machines’. Fagergren returned to Salt Lake City in February 1931 to begin the commercial development of this machine in sizes suitable for plant use. With the assistance of the Lundin & May Foundry & Machine Co in Salt Lake City, the large-scale design and shop development of this new � otation machine took place during the summer and fall of 1931. At this same time, the small test cell that was demonstrated in Flin Flon was in working display, with a white pine-oil froth, in the window of the J A Hogle brokerage � rm on Main Street in Salt Lake City. On 5 May 1932, Fagergren licensed all but his earliest US patent to the American Cyanamid Co of New York. Cyanamid actively assisted Fagergren in gaining foreign patents for his inventions, and license agreements were signed on 24 May 1935, for 13 foreign patents, 19 May 1936 for 14 additional foreign patents and 1 October 1937 for Japanese patents.
As is related in the next section of this chapter, American Cyanamid was already involved in the supply and marketing of mining and milling chemicals, so the acquisition of a � otation machine was a natural extension of its business. Cyanamid actively promoted the Fagergren machine, and issued the following sublicenses in that interest:
• to Sumitomo Heavy Industries in 1937 for manufacture, distribution and sales to applications besides cement;
• to FLSmidth in 1938 for manufacture, distribution and sales to cement and non-metallic applications;
• to the Dorr Company in 1946 for manufacture, distribution and sales to applications besides cement;
• to the Hoffman Machine Co in 1946 for manufacture, distribution and sales in appli-cations for treating lubricating coolants; and
• again to FLSmidth in 1947 for manufacture, distribution and sales for treating metallic ores.
Peterson conducted large-scale tests of the vertical Fagergren machine in the western porphyry copper mills during 1934–35, including several month-long tests in the Magna Mill of Utah Copper Division of Kennecott Copper Corp. Just prior to the licensing with American Cyanamid, Fagergren had made an agreement with Utah Copper to develop and adapt the machine to its operations on a shop-right basis. Although this did not earn a royalty, it was a great advertisement and endorsement to the � otation world. This work was going on during 1934 and 1935. In an experimental � otation section at the Magna mill, Kennecott

Spectrum Series 18
H I S T O R Y O F F L O TAT I O N
118
placed a clear glass side in one of the steel Fagergren machines, so that the action and bubble formation could be observed. The air mixing was reportedly so intense that bubbles grew on the glass from pinpoint size much like the carbon dioxide bubbles in a highly charged soda water.
Sometime after joining with American Cyanamid, Fagergren developed a laboratory test
machine. It had an integrally-mounted, stainless steel mechanism and a belted motor drive
on a vertical standard that lifted up and out at 45°, for easy washing and cleaning, from a
heavy removable clear glass bowl moulded with a smooth bottom and a front over� ow lip.
This was the � rst laboratory cell in which the mechanism could be mechanically removed
and washed completely clean to assure a fully accountable test tailing. This test machine was
able to show copper recoveries ten per cent to 15 per cent higher than other test machines
when treating refractory ores, and also showed much higher precious metals recoveries. The
WEMCO test machine, of essentially the same design, is still sold by FLSmidth Minerals.
William Fagergren died of an unexpected heart attack on 17 August 1940. His personality
and approach to his profession is captured nicely in this incident recorded by his nephew:
Ernest Clarence Peterson: One day Dad (Ernest Gustav Peterson) took me with him to the mill. After being shown around, I was seated at a desk in his of� ce and, to keep me occupied, he gave me several multiplication problems. About the time this was � nished and I was looking for something more to do, Uncle Will came by to see me and gave me another task in multiplication but with a multiplicand and a multiplier each with seven or more signi� cant � gures.
On 10 May 1948, William Fagergren’s widow, Ardella Cannon Fagergren, transferred all patent licenses from American Cyanamid to the Western Machinery Co, of San Francisco, California.
American Cyanamid CoAmerican Cyanamid was founded in 1907 by Frank Washburn, a Cornell-educated civil engineer. Cyanamid is a compound of lime, carbide and nitrogen that is suitable for use in fertiliser. In 1916, Washburn traded holdings in American Cyanamid for stock in Ammo-Phos, a company owned by James Duke (of Duke University). This arrangement provided American Cyanamid with an inexpensive supply of phosphoric acid. Phosphoric acid, combined with the nitrogen in cyanamid, produces ammonium phosphate, a good plant food. By 1922, the company needed to � nd uses for its two principal raw materials, calcium cyanamid and phosphate rock, in less cyclical industries. Fortunately, while the economic aftermath of World War I had reduced the demand for fertilisers, it had increased the demand for cyanide, formerly supplied by Germany. At the time, cyanide was principally used in the extraction of gold and silver from their ores. American Cyanamid began to manufacture cyanide from cyanamid, thereby broadening its market by supplying mining companies with a necessary chemical. The company also started to produce hydrocyanic acid, an important ingredient in vulcanising rubber.
By 1929 American Cyanamid had 30 subsidiaries and was one of the most diversi� ed companies in the chemical industry, producing heavy chemicals, sulfuric acid, dyes and

Spectrum Series 18
F L O TAT I O N M A C H I N E S
119
mining chemicals. Chemical companies as a whole weathered the Depression well in comparison with other businesses. In the mid-1930s, direct sales to consumers in drugs and plastics helped to offset the sharp decline in the industrial demand for American Cyanamid’s products. In World War II the company’s pharmaceutical division supplied typhus vaccine, gangrene anti-toxin and surgical sutures.
Fagergren machines
The Fagergren machine patented in 1920 is shown in Figure 4.21. It employed a horizontal
mechanism rotating at 200 rpm for agitation and aeration. The mechanism had an impeller
at each end, connected by transverse wooden slats (17), which were placed at an angle to the
axis of the mechanism. The impeller vanes (16) drew air from the ends of the supply pipes
(31) into the interior of the mechanism, and forced it out through the spaces between the
slats. The rotation of the mechanism also agitated the pulp as it entered from the feed pipe
(35), and mixed the pulp with the air emerging from the mechanism’s interior. The aerated
pulp, still in a turbulent condition, rose into the pocket (47) then descended between the two
baf� es (23 and 24) onto the shield (19), which directed it back to the passage (22) for return
to the mechanism. Return of pulp to the mechanism was controlled by a manual valve (26).
The froth rose to the top of the machine and � owed over into the launders (37).
FIGURE 4.21
The 1920 Fagergren machine (Margetts and Fagergren, 1920).
This Fagergren machine was similar to the Kraut machine shown in Figure 4.22, for which
a patent was issued in 1919.
The next Fagergren machine, patented in 1929, is shown in Figure 4.23. It was designed
to overcome the short-circuiting experienced in the 1920 machine. Here the mechanism was
all cast-iron, and the metal rods (which replaced the earlier slats) ran parallel to the axis of
the mechanism. This machine was con� gured with a step-down launder (30), into which the
aerated pulp was discharged through the opening (59). As the pulp � owed down the launder,
its � ow into succeeding machines was controlled by placing stoppers in the appropriate
inlets and outlets.

Spectrum Series 18
H I S T O R Y O F F L O TAT I O N
120
FIGURE 4.22
The Kraut machine (Kraut, 1927).
FIGURE 4.23
The 1929 Fagergren machine (Fagergren, 1929).
Figure 4.24 shows the machine licensed to American Cyanamid, patented in the USA in 1934. The patent shows several possible con� gurations for invention, only two of which appear in Figure 4.24. The mechanism of this machine rotated around a vertical axis and both the rotor and stator were made of metal bars, with what was called a squirrel cage design. All con� gurations included a feed inlet (38 in the � gure on the left and 42 on the right) that delivered material directly to the bottom of the mechanism under a false bottom (32 or 37). Air was drawn into the top of the impeller through a hood (35 or 86) that connected to a standpipe.
Again, feed � owed directly to the impeller, under a false bottom. The level of the froth was controlled by over� ow weirs. Figure 4.25 shows the machine patented in 1936; it was also licensed to American Cyanamid. This design featured all steel construction and could be adjusted by handwheels. The patent included two con� gurations, one with the mechanism in a square tank, the other with the mechanism at one end of a rectangular tank. The latter was intended for applications where a longer time was required for adequate froth separation, and allowed for recirculation of pulp through openings (5) on the cell � oor. This machine was later offered with a cylindrical tank, to provide a greater lip length for froth removal. As mentioned previously, Fagergren machines were installed in the concentrators of Kennecott Copper Corporation. Figure 4.26 shows one of these installations. Note the direct-drive mechanisms, with one motor on each cell.

Spectrum Series 18
F L O TAT I O N M A C H I N E S
121
An explanatory drawing of the 1936 Fagergren machine is shown in Figure 4.27, as it appeared in a 1950 sales brochure produced by Western Machinery Co. By this time, the design included a belt drive mechanism.
In the early 1950s, Fagergren machines became very popular. They provided ef� cient aeration and excellent pulp suspension and were simple to operate. For many years, the machines were sold under the name ‘FAG’, but by 1956 they were called ‘WEMCO Fagergren’ or ‘WEMCO FAG’ machines. In 1956, an advertisement in Mining Engineering magazine stated that ‘… half the material in the world treated by � otation is treated in WEMCO Fagergren machines’. Figure 4.28 shows the installations of WEMCO machines from 1948 to 1975.
FIGURE 4.24
The 1934 Fagergren machine, licensed to American Cyanamid (Fagergren, 1934).
FIGURE 4.25
The 1936 Fagergren machine (Fagergren, 1936).

Spectrum Series 18
H I S T O R Y O F F L O TAT I O N
122
FIGURE 4.26
Fagergren machines at Kennecott Copper Corp.
FIGURE 4.27
Explanatory drawing of the Fagergren mechanism and a 1956 WEMCO FAG machine.
FIGURE 4.28
Installations of Fagergren and WEMCO machines, 1948–1975.

Spectrum Series 18
F L O TAT I O N M A C H I N E S
123
WEMCO recognised the need to make improvements, and in 1969 the new ‘1 + 1’ machine was introduced. The patent for this machine was issued in 1970 to William H Reck and licensed to Arthur G McKee Co, of Cleveland, Ohio. McKee, a large engineering and construction � rm, purchased WEMCO in 1964. The 1 + 1 machine, shown in Figure 4.29, retains some features of the late-model Fagergren machines – the false bottom (3), the draft tube through which air is drawn into the rotor (14) and the sloping sides (10). However, the mechanism is changed signi� cantly. The squirrel-cage rotor and stator are replaced by a vane-type rotor (28), with a ‘star’ cross-section and a stator or disperser (12) with oval perforations. Both rotor and stator are constructed with rubber or a similar material over a steel frame. The rotor is designed so its vanes can � ex under load. The patent speci� cally states that:
… exceptionally advantageous results are obtained when the length of the rotor is essentially equal to its diameter, so that the rotor may be termed a ‘1 + 1’ rotor.
FIGURE 4.29
The WEMCO 1 + 1 machine (Reck, 1970).
Above the stator is an optional hood (26), which is said to improve the � ow of aerated pulp in the machine. Interestingly, the Reck patent makes no reference to any of the Fagergren patents as prior art.
When WEMCO introduced larger machines, all were of the 1 + 1 type. The next two � gures are from a WEMCO sales brochure prepared in the early 1970s.
Figure 4.30 shows a schematic diagram of the 1 + 1 machine indicating � ow patterns and functions of important components. Figure 4.31 shows a WEMCO 1 + 1, model 120 machine, which has a volume of 300 ft3. An early installation of WEMCO model 120 machines was at ASARCO’s Silver Bell copper concentrator in Arizona. The text accompanying Figure 4.30 in the brochure states that the 32 WEMCO cells:
… replaced 144 smaller cells, have a connected horespower less than one-half that connected to the smaller [previous] cells, occupy less than two-thirds the � oor space required by the smaller cells, provide additional rougher � otation capacity, and simplify operation of [the] � otation plant.
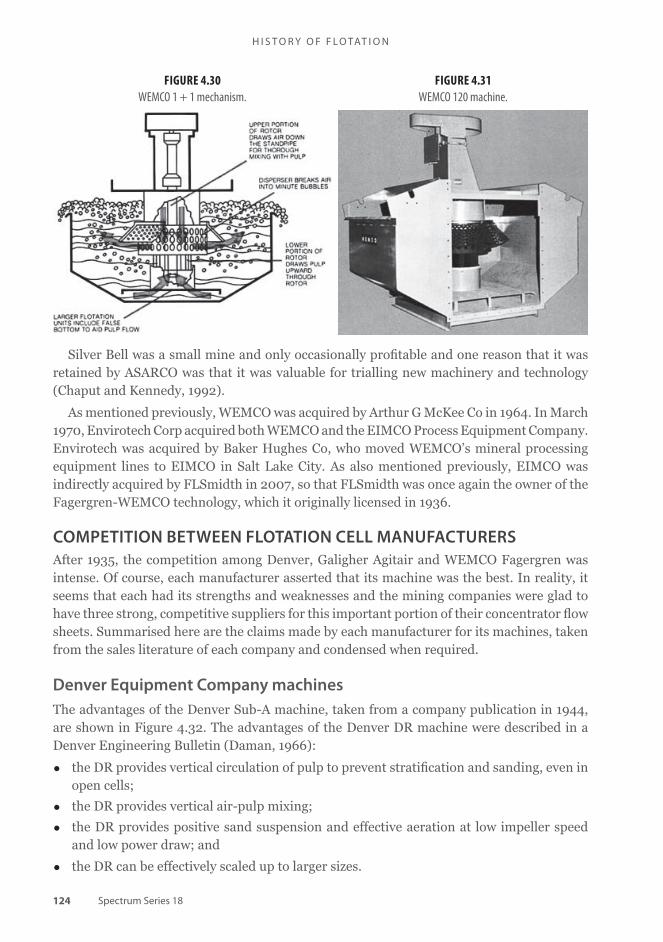
Spectrum Series 18
H I S T O R Y O F F L O TAT I O N
124
FIGURE 4.30
WEMCO 1 + 1 mechanism.
FIGURE 4.31
WEMCO 120 machine.
Silver Bell was a small mine and only occasionally pro� table and one reason that it was retained by ASARCO was that it was valuable for trialling new machinery and technology (Chaput and Kennedy, 1992).
As mentioned previously, WEMCO was acquired by Arthur G McKee Co in 1964. In March 1970, Envirotech Corp acquired both WEMCO and the EIMCO Process Equipment Company. Envirotech was acquired by Baker Hughes Co, who moved WEMCO’s mineral processing equipment lines to EIMCO in Salt Lake City. As also mentioned previously, EIMCO was indirectly acquired by FLSmidth in 2007, so that FLSmidth was once again the owner of the Fagergren-WEMCO technology, which it originally licensed in 1936.
COMPETITION BETWEEN FLOTATION CELL MANUFACTURERS
After 1935, the competition among Denver, Galigher Agitair and WEMCO Fagergren was intense. Of course, each manufacturer asserted that its machine was the best. In reality, it seems that each had its strengths and weaknesses and the mining companies were glad to have three strong, competitive suppliers for this important portion of their concentrator � ow sheets. Summarised here are the claims made by each manufacturer for its machines, taken from the sales literature of each company and condensed when required.
Denver Equipment Company machines
The advantages of the Denver Sub-A machine, taken from a company publication in 1944, are shown in Figure 4.32. The advantages of the Denver DR machine were described in a Denver Engineering Bulletin (Daman, 1966):
• the DR provides vertical circulation of pulp to prevent strati� cation and sanding, even in open cells;
• the DR provides vertical air-pulp mixing;
• the DR provides positive sand suspension and effective aeration at low impeller speed and low power draw; and
• the DR can be effectively scaled up to larger sizes.
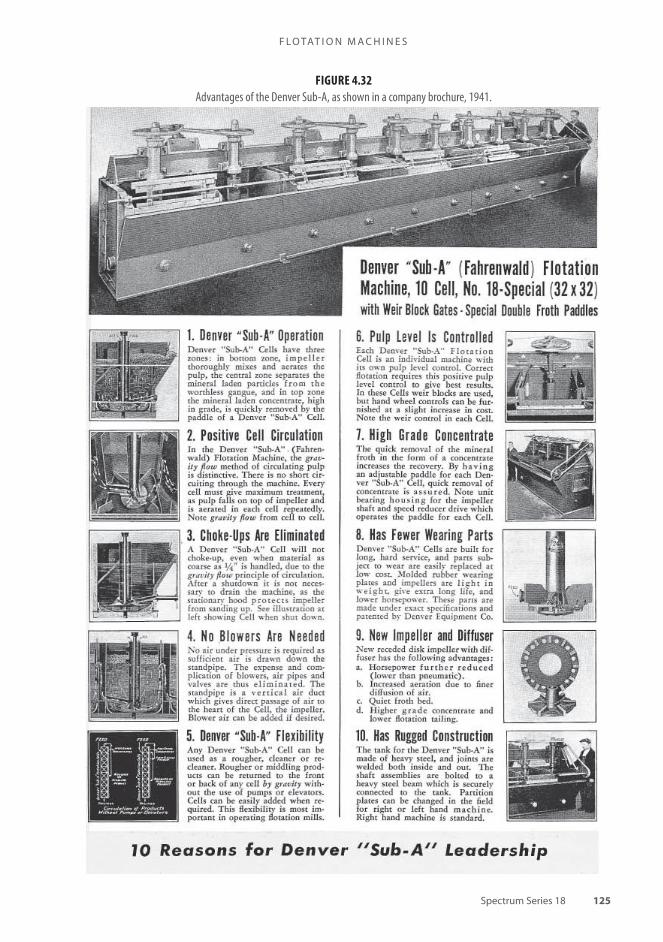
Spectrum Series 18
F L O TAT I O N M A C H I N E S
125
FIGURE 4.32
Advantages of the Denver Sub-A, as shown in a company brochure, 1941.

Spectrum Series 18
H I S T O R Y O F F L O TAT I O N
126
Galigher Agitair machines
The advantages of the Agitair machine as described here are summarised from an internal company document. The document is undated, but appears to be from the mid-1960s (McDonald, 2009). Of particular interest is the comparison, favourable of course to the Agitair, made with Denver and WEMCO. This document is reproduced in full here, not because its claims are believed to be any more accurate than those of the other manufacturers, but to give an idea of the intense competition among the companies.
1. Denver and WEMCO provide a single cell design in each size for all applications. We believe that the variety of ores and applications demands that consideration be given to the customer’s particular requirements. Thus, in each size we offer three different impeller-stabilizer types, each having its own particular agitation-aeration characteristics and two different tank designs. Therefore, we are able to recommend a machine virtually custom designed for a user’s expected application.
2. Depending on the customer’s installation requirements, we can supply single cell or double cell units for � eld bolting, or multiple cells completely assembled ready for placement (within shipping limitations).
3. The Agitair mechanism design permits removal of rotating wear components without disturbing drive components or air piping. This maintains factory-preset alignment and reduces downtime by 60–70%.
4. All operating tolerance adjustments can be made without draining the machine.
5. Close operating tolerances are not required to maintain performance; thus, ef� ciency is not impaired as wear occurs.
6. Because supercharged air is introduced underneath the impeller, the Agitair Flotation Machine is not as sensitive to the air� ow versus impeller speed relationship. Metallurgical performance is therefore maintained under widely varying feed conditions.
7. Level control is measured in a quiet zone (the junction and discharge box) between the last cell and the tailing over� ow weir by a bubble tube. Denver resistance probes are subject to fouling and both Denver and WEMCO locate their sensing devices in the turbulent last cell.
Agitair versus WEMCO
The main advantages of the Agitair machine over WEMCO machines are the items of control present in Agitairs and lacking in WEMCO. These control features are:
1. Positive Individual Cell Air Control
2. Complete Cell Bank Air Control
3. Pulp Depth Control
4. Individual Cell Froth Control
5. Control of Agitation and Air Dissemination
6. Counter Current Froth Flow

Spectrum Series 18
F L O TAT I O N M A C H I N E S
127
It is through these controls that the Agitair machine can be adapted to produce optimum metallurgy for different types of ores, deslimed sands, and slimy pulp. Coarse pulps require a maximum of agitation and a minimum of air, Fine pulp and slimes do best with a maximum of air and a minimum of agitation. Nonmetallic minerals require large volumes of material to be � oated in the initial cells and close control on the � nal cells to insure the ultimate high purity of product. Every ore and practically every operation has its own peculiarities that must be considered to give the optimum results.
The WEMCO control for moving off froth is to add additional frother and to move the pulp level to within ¼ inch of the cell lip. Such practice usually results in low-grade concentrates or high frother consumption. Many operations report frother consumptions in Agitairs at half of that for the WEMCO machines.
The Agitair air-controlled agitation permits the circulation of coarse feed and deslimed sands. The WEMCO cell has never been successful in this application. In general, � ne grinds are necessary for successful WEMCO cell operation. The presence of coarse material in the WEMCO cell tends to build up in the bottom and sides of the cell. Often times it is necessary to dig out WEMCO cells when cyclone classi� ers plug off or if grind is coarse or feed has a high speci� c gravity. Agitairs will move coarse or heavy mineral on through the cells.
Agitair and WEMCO are about equal in power consumption for the various equivalent machine sizes. In general, Agitair impellers and stabilizers will last 3 to 5 years, while WEMCO’s impeller lasts 18 months. Agitair machines will hold high metallurgical recoveries up to the destruction of the wearing parts. WEMCO’s metallurgical results fall off rapidly with wear.
Agitair cells are more effective as cleaners than WEMCOs because of the controls listed above. Agitairs can be operated so that froths can move counter current to pulp � ow. This technique permits the production of higher concentrate grades and in many cases, allows for the drop out of mechanically entertained, barren, gangue minerals.
Agitair versus Denver
The main advantage of the Agitair over the Denver cells is metallurgical performance. Over the years, competitive tests have shown that Agitair rows are able to treat higher tonnages at equal metallurgy or produce higher recoveries and grades at equal tonnages. We have observed in competitive tests that Denver units require at least 1½ to 2 times the � otation time (volume capacity) to emulate the metallurgy of Agitairs.
The Denver cell compared to the Agitair is rather sluggish as evidenced by the fact that Denver usually speci� es froth paddles for most operations, even for normally free � owing sul� de � oats. Although Denver makes a supercharged cell, the ability of the Denver impeller stabilizer to disseminate air is minimal. The DR principal does not improve on this.

Spectrum Series 18
H I S T O R Y O F F L O TAT I O N
128
In the deep Denver cells there has been a problem with circulation. In cases where there is occasional over sized material, Denver units show extremely high wear and metallurgy drops off. Several properties have indicated a complete replacement of Denver cell parts within a year’s operating time compared to 3 years or more for Agitair. Changing a Denver impeller is a real ‘chore’ as compared to Agitair change outs. Some operations say they can change six Agitairs for one Denver. The Denver unit requires constant adjustment wear parts to maintain performance.
Because of the sluggish nature of the Denver cell, it tends to � oat the free mineral better than middlings. This gives the illusion that it is a good cleaner. In reality, the Denver cell used as a cleaner drops out middlings and slow-� oating minerals to an extent that high circulating loads are built up. It is not unusual to see operations that have 100 to 200 percent of the mineral loads circulating. Ultimately, these circulating loads result in higher tails and lower recoveries. Agitairs have been used in many operations as cleaners and equal the Denver grade with fewer cells and equal or higher recovery.
The Denver cell has trouble on deslimed sand � otation. In the places where they have been tried in competition with Agitairs, they have not shown the recovery of the Agitairs. They have also shown high wear of moving parts because it is necessary to rotate their mechanisms faster to achieve circulation and aeration. Denver’s recent development is for a deep cell to provide for retention time (volume capacity) and minimize � oor space requirements. At some mills, these cells are showing high wear and low metallurgical recoveries because of solids strati� cation. One thing to be remembered is that the deep Denver cell requires blower fan pressure of 3–4 psig. The Agitair maximum is 2.5 psig, which results in a blower, which oftentimes is a third of Denver’s unit. Higher pressures equate to line losses and coupling problems. High elevations compound blower problems and aspiration type cells must be operated at higher speeds.
We believe that mineral recoveries are best made in somewhat longer rows than does Denver. Experience has shown that increasing cell depths for retention only is redundant. In a way, the � otation process might be likened to the half-life of radioactive decay; that is, each cell removes residual values. You would not expect the same recovery from one large cell that you would from a series of smaller cells in a row of equal total volume. Over the years, we have converted many Denver cells to Agitairs.
WEMCO Fagergren machines
A 1938 publication by American Cyanamid lists the following bene� ts for the Fagergren machine.
Due to the design of its rotor and stator, the Fagergren Flotation Machine possesses two outstanding characteristics, ef� ciency of aeration and positive pulp recirculation, which account for several important operating advantages:

Spectrum Series 18
F L O TAT I O N M A C H I N E S
129
• Speed of Float: The superior aeration and more-positive pulp circulation of the Fagergren Flotation Machine give it greater metallurgical capacity per cubic foot of volume. Thus, the Fagergren Machine has a higher SPEED of FLOAT and will handle MORE TONNAGE than other machines of the same volumetric capacity. As a result, when a given number of cubic feet of Fagergren Machine replaces the same volume of older type machine, a substantial step-up in mill tonnage occurs. Or where out put is � xed by the remainder of the mill equipment, a smaller volume of Fagergren Machines are adequate to do the job.
• Lower Power Consumption: The high metallurgical capacity of Fagergren Flotation Machines naturally results in low power consumption per ton of ore treated. The shallow pulp column with which the machine operates is another feature which contributes to its economy of power.
• Lower Operating and Maintenance Costs: In view of its high metallurgical capacity and low power consumption, it naturally follows that the cost of operating the Fagergren Flotation Machine is extremely low. Maintenance costs are so low as to be considered negligible by many operators. All wearing parts are covered with the highest grade of wear-resistant rubber to give them unusually long life.
• Unit Design: Each Fagergren Flotation Machine is a separate unit – complete
with its own source of power and having feed and discharge boxes. Thc � exibility
in � ow scheme possible with a set of Fagergren Flotation Machines is at once
apparent. Machines can be rearranged easily and quickly to accommodate
changes in mill and metallurgical conditions. Many of our older customers have
found it necessary to remodel their mills, or change their � ow scheme in order
to conform to changes in the ore body, economic conditions, or both. Due to the
unit design of the Fagergren Flotation Machine it was possible to make these
changes at a minimum cost and loss of time.
• Simplicity of Construction: The simplicity of construction of the Fagergren Machine is readily apparent from a study of its design. It consists of four main parts; a steel tank, a rotor, a stator and a source of power. The rotor is the only moving part, and is assembled simply by threading the motor shaft onto the motor shaft extension. The machine needs no bearing, the motor bearings being suf� ciently rugged to support the rotor. An important detail of construction is the ease with which a motor-rotor assembly may be removed. To inspect a rotor it is necessary to remove only four nuts and hoist the motor-rotor assembly. Another assembly can be dropped into place in a few minutes. During this time, the remainder of the machines may be left in operation. It is not necessary to shut off the feed, for the pulp will run freely through the shut-down machine.
• Installation: The unit design and simplicity of construction of the Fagergren
Machine are factors which save much in cost of installation as compared with
other machines which are assembled in the mill. The machines are easy to
unload and set up and require only a simple foundation. A string of Fagergren
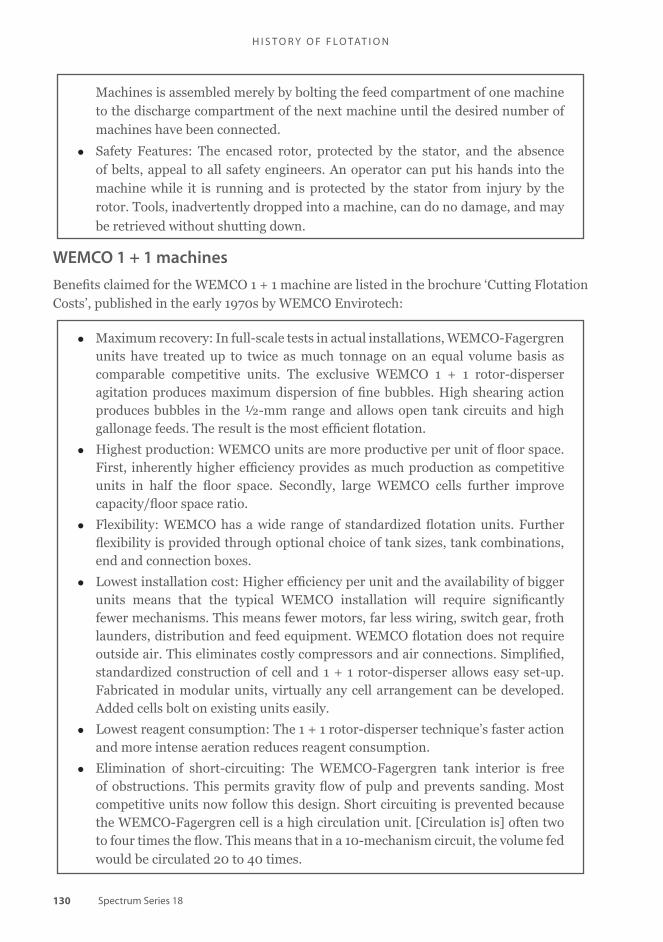
Spectrum Series 18
H I S T O R Y O F F L O TAT I O N
130
Machines is assembled merely by bolting the feed compartment of one machine to the discharge compartment of the next machine until the desired number of machines have been connected.
• Safety Features: The encased rotor, protected by the stator, and the absence of belts, appeal to all safety engineers. An operator can put his hands into the machine while it is running and is protected by the stator from injury by the rotor. Tools, inadvertently dropped into a machine, can do no damage, and may
be retrieved without shutting down.
• Maximum recovery: In full-scale tests in actual installations, WEMCO-Fagergren units have treated up to twice as much tonnage on an equal volume basis as comparable competitive units. The exclusive WEMCO 1 + 1 rotor-disperser agitation produces maximum dispersion of � ne bubbles. High shearing action produces bubbles in the ½-mm range and allows open tank circuits and high gallonage feeds. The result is the most ef� cient � otation.
• Highest production: WEMCO units are more productive per unit of � oor space. First, inherently higher ef� ciency provides as much production as competitive units in half the � oor space. Secondly, large WEMCO cells further improve capacity/� oor space ratio.
• Flexibility: WEMCO has a wide range of standardized � otation units. Further � exibility is provided through optional choice of tank sizes, tank combinations, end and connection boxes.
• Lowest installation cost: Higher ef� ciency per unit and the availability of bigger units means that the typical WEMCO installation will require signi� cantly fewer mechanisms. This means fewer motors, far less wiring, switch gear, froth launders, distribution and feed equipment. WEMCO � otation does not require outside air. This eliminates costly compressors and air connections. Simpli� ed, standardized construction of cell and 1 + 1 rotor-disperser allows easy set-up. Fabricated in modular units, virtually any cell arrangement can be developed. Added cells bolt on existing units easily.
• Lowest reagent consumption: The 1 + 1 rotor-disperser technique’s faster action and more intense aeration reduces reagent consumption.
• Elimination of short-circuiting: The WEMCO-Fagergren tank interior is free of obstructions. This permits gravity � ow of pulp and prevents sanding. Most competitive units now follow this design. Short circuiting is prevented because the WEMCO-Fagergren cell is a high circulation unit. [Circulation is] often two to four times the � ow. This means that in a 10-mechanism circuit, the volume fed would be circulated 20 to 40 times.
WEMCO 1 + 1 machines
Bene� ts claimed for the WEMCO 1 + 1 machine are listed in the brochure ‘Cutting Flotation Costs’, published in the early 1970s by WEMCO Envirotech:

Spectrum Series 18
F L O TAT I O N M A C H I N E S
131
• Low labor cost: Pneumatic systems often require frequent adjustment of air in each cell. Surge conditions cause problems. WEMCO � otation machines do not require outside air. The � exible rotor adjusts to load conditions. In some installations, WEMCO has operated with one-� fth the labor time of pneumatic machines.
• Low maintenance cost: At one time, rotor-stator � otation required more maintenance than pneumatic, but this disadvantage was offset by far greater productivity. WEMCO developed a one-piece rotor, one piece disperser that has replaced a complex energizer mechanism of many pieces. Now WEMCO can claim lowest upkeep per ton of solids treated.
• Rapid mechanism change: The WEMCO � otation mechanism may be replaced without shutting off the � ow. The complete mechanism assembly lifts out as a unit, and [a] spare assembly drops in place. No adjustment [is] necessary.
• Flotation leadership: WEMCO-Fagergren is handling more tonnage than any other � otation machine in the world (over 1.5 million tons per day). Units are in operation in the 27 mining states and some 30 foreign countries. A leader, WEMCO is dominant in virtually every industry using � otation. For example, in the coal industry, WEMCO provides more � otation than all competition combined. WEMCO units handle 90% of all iron ore � otation. WEMCO’s repeat business has broken all previous records. WEMCO has never had to withdraw a � otation machine from the market.
• Low power transmission loss: The average power loss of units in current service is 15–25%. WEMCO’s model 120 has reduced loss to 5–8%. This is far less than pneumatic-type machines where compressing, transmission and distribution of air reduce ef� ciency.
• Highest relative capacity: An oversize container may increase storage volume, but it does not increase � otation capacity. For example, a competitive mechanical/pneumatic-type � otation unit of 94 cubic feet barely matches the production rate of WEMCO’s standard Model 66, a cell of only 60 cubic feet. As WEMCO has scaled up size, it has scaled up performance. But this is not true of all � otation machines.
Comment
There is no doubt that the � erce competition among three � nancially strong and technically competent companies improved the quality of � otation cells and of � otation technology in general. It was the representatives of those companies who were their � ag bearers, they travelled the mining world and were a main source of technical communication in those pre-satellite days. In those days there were very few technical meetings other than an annual national conference and meetings at local branches of Institutes, and the representatives were a main source of guidance for cell development. But World War II brought new communication technology and changed attitudes and ideas of engineers from remote and isolated locations as they met engineers from different industries in the armed services and exchanged experiences. At the end of the war there was new impetus in the development of � otation technology. The cells built after the 1960s will be discussed in the next section.

Spectrum Series 18
H I S T O R Y O F F L O TAT I O N
132
THE NEED FOR LARGER FLOTATION MACHINES
An article in the Engineering and Mining Journal of January 1944 addressed the needs of the mining industry as the world emerged from World War II:
One demand for the future will certainly be for � otation cells of larger individual capacity. Consider the new Morenci concentrator of Phelps Dodge Corp. Here, before a recent expansion in capacity, there were operating 332 Fagergren cells, 240 of them (the roughers) 66 in square and 240 of them (the cleaners) 56 in square. Each cell has its own motor, a vertical-type gear motor with the impeller mounted directly on the extended slow-speed shaft. There are 332 motors, shafts, bearings, impellers, and gears, to look after, lubricate, and replace, to say nothing of all the incidental wiring, switches, and launder connections.
These cells were selected for the Morenci job on the basis of lengthy competitive tests on Morenci ore by all the leading types of � otation machines, and the Fagergren machine proved to the satisfaction of the management that it was the best then available for treating Morenci ore. Therefore it is no detraction of this machine to say that before many years the use of 332 � otation cells to treat 25,000 tons of copper ore daily seem somewhat ridiculous. It is as though instead of using four 300-ft. thickeners for tailings disposal, Morenci had installed 200 thickeners, each one 14 ft in diameter.
It is not beyond the abilities of present-day metallurgists to design a mechanical cell so large that 30 roughers and 10 cleaners like it could handle 25,000 tons daily of Morenci’s ore. When machines like that are built one may expect a considerable drop in the ‘Power’ item under � otation costs.
If this seems visionary to you, remember that if Dodge had had to use Morenci � otation machines of the original MS type, at least 1,000 cells would have been required to provide a capacity equal to the 332 Fagergren cells. The change to fewer, larger units is not possible – it is inevitable.
The need was recognised, but larger cells were not introduced for almost 20 years. In 1944, the largest Denver cell was the No 30 Sub-A, which had a volume of 100 cubic feet.
Figure 4.33, from a 1941 Denver brochure, shows a photo of six No 30 machines, with the statement, ‘These are the largest type mechanical machines built’.
The Sierrita mill in Arizona was designed in 1967 to process ore containing 0.24 per cent copper and 0.016 per cent MoS
2 at a capacity of 90 000 tons per day. The � otation plant
shown in Figure 4.34 included 776 cells, as detailed below:
• copper circuit:
� 480 roughers, Denver DR No 30, each 100 ft3;
� 126 cleaners, Denver DR No 24, each 40 ft3; and
� 36 recleaners, Denver DR No 24, each 40 ft3;
• molybdenum circuit:
� 40 roughers, Denver DR No 30, each 100 ft3;
� 30 cleaners, Denver DR No 24, 40 ft3;
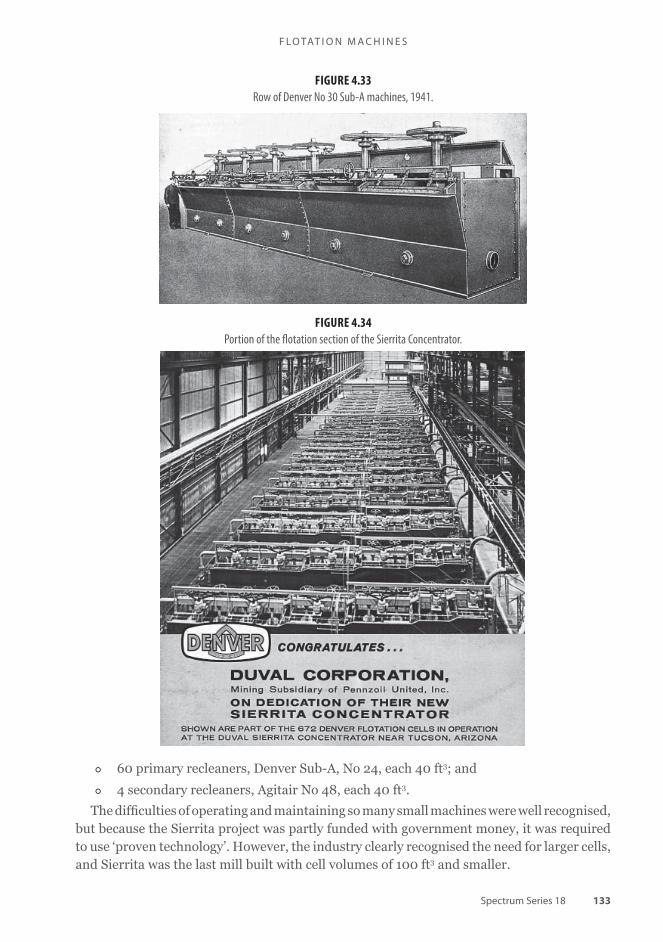
Spectrum Series 18
F L O TAT I O N M A C H I N E S
133
� 60 primary recleaners, Denver Sub-A, No 24, each 40 ft3; and
� 4 secondary recleaners, Agitair No 48, each 40 ft3.
The dif� culties of operating and maintaining so many small machines were well recognised, but because the Sierrita project was partly funded with government money, it was required to use ‘proven technology’. However, the industry clearly recognised the need for larger cells, and Sierrita was the last mill built with cell volumes of 100 ft3 and smaller.
FIGURE 4.33
Row of Denver No 30 Sub-A machines, 1941.
FIGURE 4.34
Portion of the fl otation section of the Sierrita Concentrator.

Spectrum Series 18
H I S T O R Y O F F L O TAT I O N
134
Month
(where known)
Year Supplier Model Volume ft3 Number of
mechanisms
1950 WEMCO 66 61 1
~1962 WEMCO 66D 100 1
~1962 Galigher 96 200 4
1964 Galigher 120 300 4
September 1964 Booth 200 200 1
1967 Denver DR 200H 200 2
1967 Denver DR 600H 600 2
April 1969 WEMCO 120 300 1
February 1970 Denver DR 200 200 1
February 1970 Denver DR 300 300 1
February 1970 Denver DR 400H 400 2
May 1970 WEMCO 144 500 1
1972 Galigher 144 650 1
February 1973 Galigher 164 1000 1
TABLE 4.7
Development of larger fl otation machines.
INCREASING THE SIZE OF MECHANICAL MACHINES
Progress with larger � otation machines was steady but slow, as shown in Table 4.7. Denver introduced a 200 ft3 DR cell at Duval Esperanza. It was run in competition with the biggest Agitairs and except for a slight amount of short-circuiting in the Denver cell, performance was comparable. For a while DECO sold a 200 ft3 machine with two mechanisms, with a baf� e between mechanisms to minimise short-circuiting. This was called the 200H (for horizontal).
After the success at Esperanza, Anaconda was interested in the larger machines. Denver designed a 300 ft3 machine that was demonstrated with considerable fanfare at the 1970 AIME annual meeting in Salt Lake City. Frank Seeton, staff member at Denver, commented that, ‘This machine � tted lots of � ow sheets ... and was installed at such sites as Bougainville and Henderson’ (Seeton, 2009). In the 1960s all cell manufacturers were interested in building larger cells but there was uncertainty about how to scale-up to larger cells. Even in 2003, ‘design and scale-up is still mainly based on empirical rules’ (Yianatos, 2003).
Denver, Agitair and WEMCO had different approaches to the design of larger cells and these will be discussed. By this time Outokumpu, a small mining company in Finland, was designing and building � otation machines and their approach to larger cells will also be discussed.
Denver Equipment Company
Denver took a cautious approach to scaling up their mechanical cells. The company had real
concern about whether it would be possible to make mechanisms powerful enough to make

Spectrum Series 18
F L O TAT I O N M A C H I N E S
135
the bigger cells work properly (Seeton, 2009). This scepticism was also re� ected in the design
at Sierrita, where Duval was forced to use the traditional, ~100 cubic foot machines because
that was ‘proven technology’, as required by their government subsidy. Denver’s approach
to building large cells started with joining two smaller cells and removing the intermediate
wall. The � rst of these large cells was the Denver DR 600 (17 m3), in which two Denver DR
300 cells were joined back-to-back so that there were two mechanisms per cell. In 1967 DR
600s were installed in a new molybdenum mine at Endako, British Columbia, and in 1972
the 90 000 tons per day plant built by CRA to process porphyry copper ore on Bougainville
Island started with 108 Denver DR 600 cells in the rougher-scavenger banks. The success of
both installations was a high point for Denver Equipment Company as a cell manufacturer.
A few years later Denver was taken over by JOY Manufacturing Company and its � otation
cell business declined.
Galigher Agitair
Galigher Company responded quickly to the demand for larger Agitair cells and their
approach was similar to Denver’s, scale up existing machines but not far enough to risk
failure. The company built larger cells in three stages:
1. increases in tank and impeller size and motor power while using a single impeller,
2. increase tank size again by joining cells so that one tank would hold several impellers, and
3. increase impeller size again and redesign cell � ttings so that there would be one impeller per tank.
Throughput was increased at each stage and it was found that little change was required
in the � oor area although the circuit capacity was much larger. For example the height of the
2 m3 Agitair cell was increased by 50 per cent in 1964 and this increased the cell volume to
3 m3, then four impellers were installed in one large tank and the cell volume was increased
again to 15 m3. By 1975 two Agitair impellers were working in a 30 m3 tank (Dreyer, 1976)
and then they were replaced by one larger impeller. The 30 m3 Agitair was the biggest the
company made. The fate of the Galigher Company has been discussed; it contributed much
to � otation technology but the sale of the company in the late 1950s and its reorganisation in
the early 1970s terminated further development of Agitair cells.
Large cells built by WEMCO Fagergren
The manufacturers of WEMCO machines responded to market demand for larger machines
by designing larger and larger models of the successful 1 + 1 design, as shown in Figure 4.35.
In 1996, the WEMCO SmartCell™ was tested at the Copperton Concentrator, then
owned by Kennecott Copper Co. This machine featured a cylindrical tank with a volume
of approximately 125 m3. The mechanism design was essentially the same as in the large 1
+ 1 machines, but the bottom portion of the draft tube was expanded to increase pumping
capacity.

Spectrum Series 18
H I S T O R Y O F F L O TAT I O N
136
In 2003, FLSmidth installed the � rst 257 m3 SmartCells™. Scale up of this machine was
based on hydrodynamic analysis and some modelling with computational � uid dynamics
(CFD). Since 2004, FLSmidth Minerals (FLSM) have been developing proprietary CFD
models with the Center for Advanced Separation Technologies (CAST), a partnership among
seven mining schools in the USA. With the results from the CFD modelling, FLSM designed
the SuperCell™, which includes a category of large cells starting at a 300 m3 capacity. Two
SuperCells™ were tested in 2009 at the Copperton Concentrator, now owned by Rio Tinto
(Lelinski et al, 2009). These machines use a universal tank that can be � tted with any of the
three mechanisms manufactured by FLSM.
Flow sheet development for this large-scale test was based on results of laboratory-
scale � otation kinetics tests and plant audits. FLSM’s standard scale-up methods were
used to determine the expected unit grade-recovery curve, which formed the basis of the
performance guarantee. Rio Tinto conducted third-party � ow sheet simulations of the bulk
� otation circuit using SGS’s FLEET modelling system.
The scale-up design of the SuperCells™ started with the CFD modelling of the existing
equipment, followed by the company’s conventional scale-up procedure based on
dimensionless and hydrodynamic analysis. The parameters from the conventional scale-up
and data from the CFD of existing equipment were used to develop CFD models of the newly
designed machines. The outputs from the CFD models of all three SuperCells™ were used
to verify the critical parameters of the newly designed cells. The new parameters were again
incorporated into the dimensionless and hydrodynamic models and corrected parameters
fed back into the CFD.
FIGURE 4.35
Improved WEMCO machine, ca 1976.
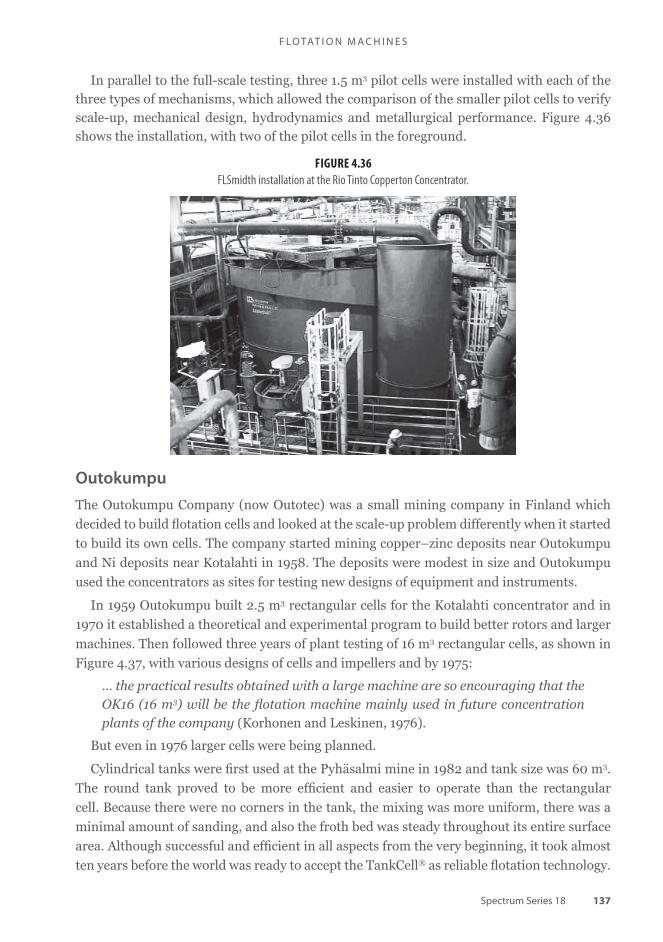
Spectrum Series 18
F L O TAT I O N M A C H I N E S
137
In parallel to the full-scale testing, three 1.5 m3 pilot cells were installed with each of the three types of mechanisms, which allowed the comparison of the smaller pilot cells to verify scale-up, mechanical design, hydrodynamics and metallurgical performance. Figure 4.36 shows the installation, with two of the pilot cells in the foreground.
FIGURE 4.36
FLSmidth installation at the Rio Tinto Copperton Concentrator.
Outokumpu
The Outokumpu Company (now Outotec) was a small mining company in Finland which
decided to build � otation cells and looked at the scale-up problem differently when it started
to build its own cells. The company started mining copper–zinc deposits near Outokumpu
and Ni deposits near Kotalahti in 1958. The deposits were modest in size and Outokumpu
used the concentrators as sites for testing new designs of equipment and instruments.
In 1959 Outokumpu built 2.5 m3 rectangular cells for the Kotalahti concentrator and in
1970 it established a theoretical and experimental program to build better rotors and larger
machines. Then followed three years of plant testing of 16 m3 rectangular cells, as shown in
Figure 4.37, with various designs of cells and impellers and by 1975:
… the practical results obtained with a large machine are so encouraging that the OK16 (16 m3) will be the � otation machine mainly used in future concentration plants of the company (Korhonen and Leskinen, 1976).
But even in 1976 larger cells were being planned.
Cylindrical tanks were � rst used at the Pyhäsalmi mine in 1982 and tank size was 60 m3.
The round tank proved to be more ef� cient and easier to operate than the rectangular
cell. Because there were no corners in the tank, the mixing was more uniform, there was a
minimal amount of sanding, and also the froth bed was steady throughout its entire surface
area. Although successful and ef� cient in all aspects from the very beginning, it took almost
ten years before the world was ready to accept the TankCell® as reliable � otation technology.

Spectrum Series 18
H I S T O R Y O F F L O TAT I O N
138
The early round cells were large machines and it was obvious that further increase in size would require accurate modelling of � uid � ows and power consumption, also of the mechanical aspects of the structures. Better control systems would also have to be developed to ensure stable operation of circuits using these cells because instability would give poor results and would be dif� cult to remove with the large � ows. Cell design moved from simple geometric scale up, which was suitable for small cells, to a combination of this approach and the advanced mathematical techniques such as computational � uid dynamics, which were then becoming available. Control systems were provided by the instrument division of Outokumpu. In 1995 the � rst 100 m3 cells were installed at the Los Colorados Concentrator at the Escondida mine in Chile. By 1997 160 m3 cells were being used in plants with the � rst installation at Chuquicamata in Chile.
A new approach was applied in 2002 when Outokumpu Technology started to develop the TankCell®-200. Using detailed mechanical measurements and analysis, it was possible to develop a machine that was signi� cantly bigger than anything so far, but with a lower vibration level than a cell of half the size. This was naturally bene� cial for the lifetime of mechanical components due to lower stress levels. The � rst installation took place at Century Mine in Australia. In 2007 the world’s largest mechanical � otation cells, with 300 m³ of capacity, were installed at Macraes Gold Mine in New Zealand. By 2000 Outokumpu had considerable experience with operating large cells and some of the important variables were discussed (Bourke, 2002):
• Energy available for 100–160 m3 cells is in the range 0.8–1.1 kW/m3. It must be suf� cient to suspend particles, disperse air and transfer particles from pulp to froth. Too much energy causes particle detachment, too little reduces the probability of attachment (this also applies to the larger 200 m3 and 300 m3 cells).
• A maximum lip loading of 1.5 tons of froth per metre per hour is generally accepted as reasonable although this is empirical. High froth loads can be handled by internal or external launders and froth crowders built into cells.
FIGURE 4.37
Outotec OK-16 and OK-3 machines used for copper roughing and cleaning at Hammaslahti mill in 1976.

Spectrum Series 18
F L O TAT I O N M A C H I N E S
139
• Five cells are regarded as a minimum for rougher–scavenger applications, although the residence time and cell size must be taken into account. Suf� cient cells must be used in a circuit to avoid mineral loss by short circuiting.
Comment
Cell design during the � rst 60 years of � otation was based on experience and intuition; there
was no alternative. By the mid-1960s digital computers had become available and computer-
based techniques were being developed to design mechanical cells to handle a wide variety of
feed conditions with minimum operator intervention – an approach which was different from
the early Minerals Separation and Denver machines, which were each controlled individually
to optimise grade and recovery. This change was made because responding to ore changes
in high capacity circuits was regarded as less important than consistency of production. An
important feature of the high capacity � otation circuits was that they were often preceded
by semi-autogenous grinding (SAG) mills, which produced considerable � uctuations in the
downstream � ow rates and cell levels. Level controllers and circuit control systems had to be
able to handle these ef� ciently.
Where the maximum cell size will � nish is not known; suf� ce it to write that the effect of cell size on metallurgical ef� ciency is still being assessed. But whatever the result the economics of the mine and plant dictates that 150 to 300 m3 cells, and perhaps larger, are here to stay.
FLASH FLOTATION ( UNIT CELLS)
The concept of � oating coarse, high-grade particles as soon as possible, which is now called � ash � otation, was investigated at North Broken Hill in 1933:
During August, 1932, the writer conducted an experiment in the mill with the object
of testing the ef� ciency of direct � otation upon the ball mill discharge. For this
purpose an 8-cell � otation unit and vortex mixer were commissioned. The depth
of cells was 3 ft 6 in and the spindle speed of impellers 570 rpm. The impellers
were adjusted at 1.25 in from cell bottoms, excepting those in Nos 1, 2 and 3 cells,
which were set at 3 in, 2 in, and 2 in respectively. An 85-hp motor supplied the
power required to operate the cell impellers and the impeller in the vortex mixer.
Compressed air was delivered to the cells in the usual manner. The water used
for the crushing circuit was mine ground water, but ordinary crushing circuit
water was used for the last eight hours of the 30-hour run. The discharges from
the ball mills delivered to two 4-in. Wil� ey sand pumps, which pumped them to
the vortex mixer. Granular plant lead circuit water was added to the pumps to
make the density of the feed to the plant to be 3 water to 1 solids by weight. The
reagents which were added at the vortex mixer were potassium ethyl xanthate,
eucalyptus oil and soda ash. The xanthate was added in the form of a 3% solution
and the soda ash in the form of a 10% solution. The arrangement of the � otation
unit was such that the concentrate from cells Nos. 1, 2 and 3 were delivered direct

Spectrum Series 18
H I S T O R Y O F F L O TAT I O N
140
to the lead concentrate Dorrco � lters; No. 4 cell concentrate could go either to the
Dorrco � lter or could join the lead middling, produced from cells Nos. 5, 6, 7 and 8.
The lead middling was delivered by means of a pump to the lead concentrate
retreatment unit of the granule lead � otation plant, and the deleaded tailing was
pumped to the dewatering classi� ers of the same plant. The rate of feed through
the unit was estimated at 40 tons per hour for the whole run. The result of the run
was highly satisfactory and con� rmed the view that the ball mill discharge could
be successfully treated direct by � otation (Garrett, 1933).
Despite its success North Broken Hill did not use the process, probably because the company already made a high-grade lead concentrate, but the test demonstrated that � otation of coarse particles was possible.
Cominco started using coarse � otation in 1949 to provide coarse galena for its heavy medium separation plant:
The coarse lead circuit was put in at the same time as a major upgrade at the Sullivan in about 1948 which involved the use of a rod mill, cyclone classi� cation, and the sink-� oat plant to increase mill throughput and to allow for the ef� cient treatment of pillar reclaim feed which incorporated a signi� cant amount of coarse back� ll dilution. The rod mill discharge was scalped in a Maxwell unit cell and then cleaned in Denver 30 (?) � oat cells. There were no special modi� cations made to either the Maxwell cell or the cleaner cells to accommodate the relatively coarse feed (Fairweather, 2009).
Rougher � otation was carried out in a Maxwell ‘unit cell’. The origin of the name is unknown but it soon came to denote a cell in which coarse particles were � oated within the grinding circuit. In 2000 Cominco still � oated coarse particles using a 3 m by 3.7 m Denver Tank Cell, but the feed was primary ball mill discharge containing 45 per cent –200 mesh and was � ner than rod mill discharge, which contained 30 per cent –200 mesh and six per cent +10 mesh. A 50 per cent lead concentrate was produced by a rougher and a cleaner cell. Denver Equipment Company saw the potential for unit cells and they became part of Denver’s armoury of equipment. The diagrams in Figure 4.38 are taken from Mineral Processing Flowsheets (Denver Equipment Company, 1966), which was published by the company in 1962 and which, at a cost of US$10, could be found in almost all mill of� ces.
Denver’s selling slogan for the unit cell was ‘Recover your mineral as coarse as possible and as soon as it is free’. It claimed that a unit cell in a lead mill would handle –6 mm ore and often recover up to 70–80 per cent of the lead. Unit cells had limited application but where conditions were right they were valuable. Coarse particle � otation is now described as � ash � otation, machines to � oat coarse particles have been improved and the huge expansion of � otation during 1980–2000 has led to the installation of some large � ash � otation circuits.
PNEUMATIC CELLS
Pneumatic cells were used by James Lyster and Leslie Bradford at Broken Hill, in which very small bubbles were made which created deep froths in the early cells in banks. It is likely that the inventors, who were very perceptive metallurgists, recognised the link between bubble

Spectrum Series 18
F L O TAT I O N M A C H I N E S
141
FIGURE 4.38
Sketches of the Denver unit cell in a circuit and of its operating principle(Denver Equipment Company, 1966). The process is now referred to as fl ash fl otation.
size and � otation rates but did not wish to pursue it since their objectives were to make high-grade lead and zinc concentrates. Renewed emphasis on cell design after 1960 led to a classi� cation of columns, mechanical cells and intensely stirred cells as:
• low-intensity machines in which bubbles are large and � otation rates are low,
• medium-intensity machines in which bubbles are smaller and � otation rates higher by 1.2–1.5, and
• high-intensity machines in which bubbles are very small and � otation rates higher by a further 2–4.
After 1970 there was considerable progress with the development of all classes of machines.
The pneumatic cells which were invented by John Callow and � rst used by him at National Copper Company in Idaho in 1913 had no stirrers and were low intensity machines in which particles in the pulp were kept in motion by rising bubbles of air. Sul� de minerals could attach to these bubbles and be removed as froths. The gangue and composite particles that were entrained in the froth or not strongly attached to bubbles would fall back into the pulp. Figure 4.39 shows the difference in froth concentration between the deeper froths in Callow pneumatic machines and the more shallow froths in Minerals Separation mechanical machines. The early pneumatic machines were either cells that were rectangular tanks high enough to allow the formation of a relatively deep froth or columns that were tall tubes with much deeper froths. The Callow cells used at Inspiration in 1916 were the former type, the Towne and Flinn column and other columns tested in Arizona during 1916–18 were the latter type. Fortunately for the inventors of pneumatic machines the copper sul� des in the porphyry coppers responded well to � otation and large particles were not a problem because � ne grinding was necessary for liberation of the sul� des.
The Callow-MacIntosh cells were installed at Mount Isa in 1930 to � oat lead concentrates from large deposits of � ne-grained, complex sul� de ores, but they failed to deliver the

Spectrum Series 18
H I S T O R Y O F F L O TAT I O N
142
recoveries of lead or silver expected from the extensive test program and they could not handle the required throughput. It was a timely warning that low intensity cells did not � oat � ne particles well and that some ores would present dif� culties in � otation for even the most experienced metallurgists. Callow-MacIntosh cells were used in several plants built in Canada after World War II to concentrate easy � oating copper ores (Convey et al, 1957) and they operated successfully for many years, for example at Gaspe Copper they were only replaced by mechanical cells in 1976 (Pickett, 1978).
Pneumatic columns designed by Towne and Flinn and Cole and Bergman (see Chapter 3)
were tested at Inspiration and other porphyry copper mines during 1916–20. Their deep
froths would have produced high concentrate grades when there were no operating problems
but the sanding, channelling and plugging of air diffusers (Hollingsworth and Sapp, 1968)
would have interrupted production. Delays can never be tolerated in plants so interest
in pneumatic columns faded and it was the 1960s before they were considered seriously
again. In retrospect the decision to abandon columns was premature. Their inventors were
perceptive and innovative engineers who were moving quickly to improve their columns
by understanding how � otation worked. If they had been given a little more time and some
support by mining companies it is likely that the operating problems would have been solved
and columns would have been widely used in � otation circuits from 1920. Robert Towne
and Frederick Flinn in particular added much to the knowledge of � otation because they
investigated and reported on many aspects of the process. Their conclusions were that oil
increased the bubble-forming capacity of cells, oily particles stabilised the froth and particles
not physically attached to bubbles in the froth settled back into the pulp column (Towne and
Flinn, 1919).
FIGURE 4.39
Diff erences in concentration of copper sulfi des in a deep froth in aCallow cell and a shallow froth in a mechanical cell (Taggart, 1945).

Spectrum Series 18
F L O TAT I O N M A C H I N E S
143
FLOTATION COLUMNS REVISITED
Flotation columns were the � rst venture into the uncertain territory of non-mechanical � otation machines after World War II, at least since they were discarded 40 years previously.
Pneumatic machines designed since the 1960s have been counter-current (bubbles and particles collide as they � ow in different directions) and co-current (bubbles and particles enter the machine in the same direction and collide during intensive mixing). The difference between counter current and co-current machines is shown in Figure 4.40. In the columns designed in the 1960s water was added to the froth to displace entrained gangue and it became the ‘key feature which permits high upgrading’ (Finch and Dobby, 1990). Previous attempts had been made to increase concentrate grades by spraying water on the froth of stirred cells (Klassen and Mokrousov, 1963) but it was the deep froths and the froth washing systems in the columns in the 1960s that enabled best use to be made of columns (Bennett and Dell, 1963; Boutin and Tremblay, 1963, 1964; Hukki, 1967; Hollingsworth and Sapp, 1968).
FIGURE 4.40
Counter-current (Canadian column) (left) and co-current (Jameson cell) (right) pneumatic fl otation machines (Yianatos, 2003).
DEVELOPMENTS PRIOR TO THE CANADIAN COLUMN
The prelude to development of what is considered the modern � otation column occurred almost simultaneously in a number of areas. These included column � otation in the phosphate � otation plants of Florida, the installation of � otation columns in China in a variety of duties and the almost parallel developments occurring in Canada. In the � eld of pneumatic � otation machines this period was to be dominated by developments in Australia and Germany.
Early Chinese columns
The � rst modern � otation columns were installed in China in 1961 to treat copper ore.
During the next ten years they found applications in the � otation of lead, zinc, molybdenum,
pyrite, � uorite, graphite, phosphate and iron ore. In copper, lead and zinc � otation they were
used as roughers, scavengers and cleaners. For coal and iron ore � otation they were installed

Spectrum Series 18
H I S T O R Y O F F L O TAT I O N
144
in both roughing and cleaning duties. In direct contrast to later column circuit design they
were used as roughers and scavengers for tin, tungsten and complex sul� de � otation, with
mechanical cells being used in the cleaning duties. Typically, columns varied in height from
seven to nine metres in roughing, six to eight metres in scavenging and � ve to seven metres
for cleaner � otation operations. Designs during the period were numerous. One of the more
commonly installed � otation columns had a cylindrical lower section and a square upper
section to enhance concentrate removal. Aerator designs included:
• the standing-pipe sparger in which a multitude of perforated pipes stood vertically in the base of the column and were connected to a compressed air supply,
• the porous membrane spargers in which porous hose or gravel was arranged in the base of the � otation column and compressed air was forced through the media to generate bubbles, and
• cyclone aerators and air-water spargers in which a pulp stream was pumped tangentially into the aerator where it mixed with compressed air in a nozzle and the highly aerated mixture was sparged into the column.
Numerous dif� culties were encountered with the early Chinese columns, including aerator
blockages and � uctuating metallurgical performance. By the 1980s most of the installations
had been discontinued (Hu and Liu, 1988).
Early phosphate columns
Phosphate ores are friable and it was thought that slimes were generated in � otation circuits
using agitation and subaeration � otation cells and caused higher reagent consumption and
higher losses to tailing. Clinton Hollingsworth, working for the Smith-Douglass Company in
the mid 1950s, began to investigate � otation with aeration that would minimise agitation.
The Smith-Douglass Company manufactured phosphate-based fertilisers from phosphate
ore mined in Florida between 1945 and 1985 and understood the need to optimise its � otation
machines. Hollingsworth’s 1953 � otation cell design consisted of a long, shallow tank, which
had a porous bottom. Water was forced upward through the porous membrane into the pulp,
which was aerated by introducing air at points above the porous membrane. In an initial de-
sliming stage without air or reagents the water entering through the bottom of the cell was
used to remove slimes from the feed. In the � otation stages the water increased pulp � uidity,
reducing sanding and providing more ef� cient aeration (Hollingsworth, 1954). Within one
year the design had been modi� ed to produce a � otation column that maintained the porous
base for water addition but added air through a series of spargers inserted through the
column wall at three vertical locations. Each sparger consisted of a rubber hose into which a
multitude of needle-like perforations were made to generated bubbles when compressed air
was supplied (Hollingsworth, 1956).
Extensive trials showed that sliming problems were solved but that the sparger created
large air bubbles, limiting performance. Modi� cations were made and a sparger was built
which contained a venturi-like constriction tube through which water � owed and produced
suf� cient suction to induce the air required for � otation with a small bubble size. There was

Spectrum Series 18
F L O TAT I O N M A C H I N E S
145
no need for compressed air. The volume of air induced was determined by the angle of the
liquid stream entering the constriction zone. The patented design is shown in Figure 4.41
(Hollingsworth and McDonald, 1960). In late 1964 the Borden Chemical Company
purchased Smith-Douglass and actively encouraged the continuing development of the
� otation column (Shirley and Vernon, 1968). Perhaps the most signi� cant achievement was
that of Hollingsworth and Sapp (1968), who extensively redesigned the column. The aeration
unit became external to the column and was provided with a stop-gate to prevent plugging
on shutdowns. Wash water was introduced to the top of the froth to improve concentrate
grade and numerous feed and tailing arrangements were evaluated. For larger columns
baf� es were installed to prevent short circuiting and air diffusers were installed to give even
air dispersion.
FIGURE 4.41
Phosphate fl otation column of the Smith-Douglass Company showing the generalarrangement and the venturi-type aerator (Hollingsworth and McDonald, 1960).
By the late 1970s a number of equipment companies were showing interest in the � otation
column. One of these was the Deister Concentrator Company, which was started by German
immigrant Emil Deister who had taken up the study of ore separation. He would soon
patent his own equipment, the � rst being a centrifugal separator that extracted gold from
mercury amalgam. A true inventor, he reportedly built his � rst gravity separating table in
his basement, which was praised in Taggart’s Handbook of Ore Dressing. In 1906 he set up
business as the Deister Concentrator Company, only to sell his share in 1912 and form the
rival Deister Machine Company. For over half a century the Deister Concentrating Company
built a business on the basis of its shaking tables, but in the late 1970s it expanded into
hydrocyclones, screens and � otation columns (Anon, 2007).
Their initial column development was with the assistance of Clinton Hollingsworth and
showed little change from the earlier Borden Chemical design, with a 2 m diameter prototype
tested at the Tenoroc phosphate plant in Florida. The results were suf� ciently encouraging

Spectrum Series 18
H I S T O R Y O F F L O TAT I O N
146
that in 1978 Deister Concentrator Company obtained exclusive licence to manufacture and
market the Flotaire column. This would lead to developments by Donald Zipperian over
the next 20 years. The � rst development relocated the frother addition point from the
column feed into the water jet used to aspirate air into the aerator. By 1985 a � ow stream of
pressurised air was being used to aspirate water and frother into the venturi area, producing
a highly aerated, low water volume stream of aerated water to the column. This solved some
of the previous designs’ problems with high water dilution. Later Deister columns combined
internal spargers with the external aerators and provided submerged wash water addition
(Hollingsworth, 1984; Zipperian, 1983, 1987, 1992).
Between 1978 and 1984, 16 Deister Flotaire columns were installed in eight phosphate
recovery plants in Florida, including Haynesworth in 1978; the Big Four mine, Nichols mine
and Prairie mine in 1979; Fort Meade Mine in 1980; and Fort Lonesome and Gardiner mines
and the Hopewell mine in 1984. By 1986 there were also 16 Diester columns operating in
base metals operations in the USA. This included nine in copper cleaning duties, one in
coal, two as molybdenum cleaners, one producing lithium concentrates and three operating
in gold circuits as both cleaners and scavengers. Another operated in Sweden as a zinc
sul� de cleaner. Within another ten years the total number of Deister � otation columns in
operation had increased to over 50 (Rubenstein, 1995). In 2001 an extensive study by the
Florida Institute of Phosphate Research found the Diester column to be among the best
performing � otation machines for phosphate � otation (Zipperian and Svensson, 1988;
Gruber and Kelahan, 1988; Sanders and Williamson, 1996; Gruber et al, 2001). This may
have represented the peak for the company. To quote new owners, the Sherman Group:
… was an industry leader until the early 1990s when the company went through a long period of reorganization and relocations. After leaving Fort Wayne in 1998, Deister Concentrator moved to Chicago, IL; then to Kaiser, WV; and then to Knoxville, TN, the last stop before returning to Ft Wayne. Along the way, Deister lost its employee base and many of its customers, and its reputation suffered … Deister Concentrator was once the leader in the ore separation industry, and it is our goal to re-establish that reputation (Deister Concentrator Company, 2008).
Canadian or conventional column
The Column Flotation Company of Canada Ltd was a leader in column design and operation. It was established to develop and market the invention of Boutin and Tremblay, in which spray water washed the froth and the bubble size was about 1600 microns (Boutin and Wheeler, 1967). The two inch and then the 12 inch models worked well � oating silica from haematite at the Iron Ore Company of Canada but the company decided not to proceed with � otation. A 36 inch column was then installed in a copper sul� de plant and the inventor’s hopes were high, but it was a ‘mechanical disaster’ (Wheeler, 1988). During the next several years the column was developed further. Suf� cient wash water was added to generate a condition called ‘positive bias’, which was de� ned as occurring when the � ow of slurry in the tailings was higher than the � ow in the feed (Wheeler, 1983). In addition, control of the wash water was perfected to achieve the best point on the grade-recovery curve. Results looked

Spectrum Series 18
F L O TAT I O N M A C H I N E S
147
good but the metallurgical fraternity (there were few lady metallurgists then) was sceptical and it was 17 years before the company installed its � rst commercial column � otation circuit at Les Mines Gaspé (Cienski and Cof� n, 1981). After 1981 progress was rapid and a scale-up procedure for columns was developed, which was used for the � rst time to design the columns at Mount Isa Mines (Dobby and Finch, 1986; Espinosa-Gomez et al, 1989). By the early 1990s other companies were marketing � otation columns based on the Boutin-Tremblay design, which was becoming known as the conventional or Canadian column.
In Brazil � otation of iron ore in mechanical cells started in 1977 and during 1986–1989
SAMARCO investigated the use of columns. They were successful and conventional columns
became widely used. Their success had two outcomes:
1. iron ore companies started to use columns in a variety of circuits in combination with high intensity magnetic separators and � ne screens; and
2. the Brazilian phosphate industry, which is very large, found that by use of columns they could considerably reduce the high loss of phosphates in slimes.
In 2004 flotation engineers from the Federal University of Minas Gerais in Brazil
wrote that:
Nowadays, column � otation treats 75 million tons per year in terms of � otation feed, only in the iron ore and phosphate � otation plants … All new iron ore concentrator circuits commissioned since 1990 incorporated column only technology in rougher, cleaner, scavenger columns only con� guration. Columns were also utilized in conjunction with mechanical cells in a large circuit that performs the cleaning stage of rougher concentrates produced in Jones wet high intensity magnetic separators … to existing circuits, especially at the cleaner stage … At an important (phosphate) concentrator, 64 mechanical cells were replaced by 6 columns, operating in rougher only con� guration, except for the coarse apatite tailings fraction that is reground for further liberation prior to a second � otation stage (Araújo, Viana and Peres, 2005).
It is estimated that there are 3000 columns installed worldwide, about 30–40 per cent
being homemade, ranging from the minerals industry to the offshore oil industry (� otation
capacity in the oil industry may actually exceed that in the minerals industry). Froth washing
and good engineering had turned the failure of columns in the 1920s into success in the
1990s. A feature of columns is that they are well mixed so they tend to lose a small fraction
of � oatable minerals in tailings because they are not retained in the cell long enough to
� oat. Consequently, columns tend to be used in series with mechanical cells to avoid ‘short
circuiting’ and ensure maximum mineral recovery.
HIGH INTENSITY MACHINES
In 1913 Tom Owen at the Junction North mine in Broken Hill and Leslie Bradford at BHP claimed separate patents in which � otation rates were enhanced by the use of very � ne bubbles. Owen’s idea was to introduce air into the cell at the impeller to create minute bubbles that would � oat galena in preference to marmatite by enhancing the difference

Spectrum Series 18
H I S T O R Y O F F L O TAT I O N
148
in their natural � otation rates. He sold the patent to Minerals Separation, which used a modi� cation of his technique in their subaeration cell. Owen’s cell would not be described as a high intensity cell today but it was certainly a high intensity machine for its time. At the same time Leslie Bradford was developing the idea of producing lead concentrate by using sulfur dioxide to depress marmatite and to do this he designed a cell in which he mixed air, gas and pulp in an external pump and discharged the pulp containing minute bubbles into the tank. He used nine cells in a series; the lead concentrate, which was removed from the � rst cell, had formed a deep froth that then became shallower and was only a skin by the last cell. Bradford’s cell was similar in principle to the Davcra cell and other high intensity cells that were built 50 years later, but its success in 1913 seems to have passed with little notice, probably because BHP was the only company at Broken Hill which did not sell its patents to Minerals Separation, nor did it attempt to use its cells in any plant except its own. Jim Lyster used a similar cell at Zinc Corporation in his 1912 selective � otation process. These cells continued to make money for Zinc Corporation and BHP for some years. But by 1934 BHP had departed from Broken Hill and Zinc Corporation had become interested in an all-� otation process using mechanical cells. The idea of high intensity cells was set aside and it remained dormant for 30 years.
Intensive mixing of pulps with air creates very small bubbles and ensures rapid collisions between particles and bubbles. These produce high � otation rates of � ne particles and � otation columns built to achieve this are described as high-intensity machines. These columns can work with forced air (eg Davcra, Bahr and Microcel machines) or with induced air (eg Jameson and XPM/FJC machines). These machines were found to be particularly suitable for coal slurries in which a high proportion of the solids in the pulp are � oated and high � otation rates and froth removal rates are required for maximum ef� ciency.
Davcra cell
The � rst high-intensity machine reported after World War II was the Davcra cell, which was
devised by Bill Davis at the Zinc Corporation in Broken Hill and tested there in the early
1960s. The Davcra cell (Davis, 1969) as shown in Figure 4.42, was based on the assumption
that mineral recovery depended mainly on the characteristics of the intensely mixed zone
and it was thought that a better mixer would improve recovery and reduce the number of
cells required. The mixer chosen was a liquid/gas mixing nozzle through which the liquid
was pumped, vanes within the nozzle causing the liquid to swirl. Gas was introduced from a
pipe passing along the axis of the nozzle and exiting into the swirling liquid just before the
nozzle exit. Nozzle discharge impacted on a baf� e plate, a heavy froth was produced and
tailings were discharged through a standpipe to maintain pulp level.
Initial results were exciting with lead recovery exceeding 80 per cent. Increasing the froth column height and washing the froth achieved the target grade and recovery with three or four cells compared with 14 cells then in use (Cusack, 1968). The Davcra cell was the � rst cell in a new generation of � otation machines, it was successful in a few plants but was unconventional and for that reason it was not accepted readily. However, it paved the way for the new high intensity machines, which improved the � otation of coal in particular.

Spectrum Series 18
F L O TAT I O N M A C H I N E S
149
Bahr and Ekof cells
Modern � otation machine developments in Germany commenced in the 1950s and centred on pneumatic � otation cells. In the ensuing decades signi� cant work was conducted by Bergbauforschung GmbH, the Technical University of Clausthal, the Technical University of Berlin and KHD Humbolt Wedag. Individuals who were to have a pre-eminent role in this development included Albert Bahr, Wolfgang Simonis and Rainer Imhof, amongst others. Early work by KHD focused on ‘cyclone � otation’, where compressed air was forced through porous walls of the � otation tank to generate bubbles. The pulp was fed tangentially into the cell for contacting with the air. Following extensive laboratory and pilot tests an apparently workable design had been developed by 1961 (Salzmann and Koch, 1964). A production unit was installed in 1965 into the Lüderich lead–zinc � otation plant. Its success was not overwhelming, with problems with blockages in the porous medium and this line of development was discontinued (Cordes, 1997).
In the early 1970s a program on high-intensity � otation cells commenced at the Technical University of Clausthal in Germany under the direction of Professor Bahr. Early machines from this program are shown in Figure 4.43. The Bahr cell, which was invented in 1974, was a � otation column fed by a high-pressure air–pulp mixture. This cell started a trend to combine the best ideas of columns (froth washing) and high-intensity cells (high � otation rates of � nes) into single machines. The Bahr cell used aerator units, which were located
FIGURE 4.42
Drawing of the Davcra cell in the patent (Davis, 1969).

Spectrum Series 18
H I S T O R Y O F F L O TAT I O N
150
beneath the main � otation tank. All pulp was pumped through these units, compressed air � owed through annular rings via channels into the pulp and the pulp was aerated and entered the tank vertically (Cordes, 1997). Mineralised froth was formed and was removed through external and internal launders.
Production units of the Bahr cell were successfully installed at a number of plants, including Dorfner Kaolin in Germany, which secured its exclusive use in kaolin � otation, the Iscor Durnacol coal plant in South Africa, several coal operations in Germany and an iron ore plant in Chile (Ventert and van Loggerenbergt, 1992; Imhof et al, 2005, 2007). Since its development, variations of the Bahr cell have been produced by different manufacturers under several names, including Eko� ot, Pneu� ot, All� ot and Imho� ot. The main changes have been in the aeration system to enhance pulp aeration and mixing.
The Eko� ot or Ekof � otation cell is interesting in � otation history because the brand name was � rst used in Germany in the 1920s to identify a pneumatic cell developed for coal � otation – the ‘Wunschschäumer’, then its use continued through changes in the structure and ownership of the cell, and today it is the oldest brand name for � otation cells. In the early 1980s KHD worked with the Technical University of Berlin on the concept of free jet � otation machines. Pulp was pumped through a nozzle and air was entrained in the nozzle discharge and broke into � ne bubbles when it mixed with the pulp (Heintges, Alizadeh and Simonis, 1984; Alizadeh and Simonis, 1985). A downcomer carried the aerated mixture into the main � otation tank, the immersion depth of the downcomer was used to vary bubble size distribution and the air entrainment rate was adjusted by varying the nozzle feed pressure. A � otation machine was then built which was marketed by the Ekof Company, which was a KHD subsidiary. In the aeration system of the machine compressed air passed through a
FIGURE 4.43
The original Ekof and Bahr fl otation cells (Imhof, 1993).

Spectrum Series 18
F L O TAT I O N M A C H I N E S
151
In May 1987 two parallel 4.5 m Ekof cells with the tangential feed design were comm-issioned at the Pittston/Clinch� eld Coal operations in the USA and treated 1600 m3 per hour, followed by two 5.1 m cells operating in series at Fechner in Germany, which treated 800 m3 per hour of coal tailing (Imhof, 1988; Ekof, 1988). In the mid 1990s the Ekof cell became known as the Pneu� ot cell and design changes led to the aeration unit (self aerating or compressed air) feeding into a vertical downcomer, which discharged into a ring that distributed the highly aerated pulp evenly across the cell cross-section. Within a few years the vertically fed cell would dominate Pneu� ot design.
Imhof was the patented inventor of both the Eko� ot and Pneu� ot types of pneumatic � otation. In 1999 he acquired the commercial rights to his patents from KHD and proceeded to market his pneumatic � otation technology with the name of Imho� ot through Maelgwyn Mineral Services Ltd. In 2001 Imhof developed the Imho� ot G-Cell, where the pulp is introduced into the cell tangentially and at speed. This generates an increased centrifugal force which accelerates the separation of the froth from the tailings phase and thereby considerably reduces the size of cell required compared to a vertically fed cell. An increasing number of operations have included the G-Cell in their � otation plants, including the treatment of kaolin at the Dorfner plant in Germany (Battersby et al, 2007) and for molybdenum recovery at Los Pelambres in Chile (Sanchez-Pino et al, 2009).
XPM and FJC cells
In China, Professor Wu Dawei and colleagues from the Tangshan Guohua Technology Co Ltd developed jet � otation cells and started using them in an industrial plant in 1967. It was known as the XPM cell and was used in many plants; then design changes were made
FIGURE 4.44
A later version of the Bahr cell.
FIGURE 4.45
The Pneufl ot machine.
series of discs with gaps of 50 to 75 �m and merged with the pulp in a high velocity region of the nozzle discharge, and the highly aerated mixture � owed to the � otation tank, which it entered tangentially, creating a slow swirling motion in the pulp. The concentrate was removed through a central launder. Recent machine designs based on these principles are shown in Figures 4.44 and 4.45.

Spectrum Series 18
H I S T O R Y O F F L O TAT I O N
152
and it became known as the FJC jet � otation cell in the 1980s (Wu and Ma, 1998). Further improvements have led to a third generation of � otation cells.
The FJC machine shown in Figure 4.46 is similar to a mechanical � otation machine with the pulp entering the agitated tank through a conventional feed box, but the rotating mechanisms are replaced by jets of pulp and air which form ‘aeration-agitation’ zones. It works by part of the aerated pulp in each cell being drawn into a circulating pump, which is under a false bottom built into the cell. The air-pulp mixture is pressurised and some air is dissolved, and the aerated pulp is then pumped into a mixing chamber that is under a negative pressure so that it mixes with more air sucked in via an inlet pipe. The total air-pulp mixture is ejected through nozzles at high velocity onto a false bottom, which disperses it uniformly. Air is precipitated from the pulp as it passes from high to low pressure and microbubbles are liberated in the nozzle discharges. Fine particles attach quickly to microbubbles and further bubble mineralisation occurs in the pulp. Froth forms rapidly and is removed by scrapers. Tailings � ow to the next compartment. Pulp that does not return to the pump will � ow to the next compartment. Machines typically have four compartments.
FIGURE 4.46
FJC fl otation machine – bank of cells and the nozzles (Wu, 2007). 1 – aeration-agitation mechanism, 2 – trough, 3 – froth scraping mechanism, 4 – discharge mechanism, 5 – pulp level regulating mechanism, 6 – feed box, 7 – false bottom, 8 – tailings box.
By 2006, four years after the prototype of the latest cell made its debut, 145 FJC series jet � otation cells of varying sizes had been installed in 130 coal preparation plants in China, located in 17 coal-producing provinces and autonomous regions of the country (Wu, 2007). The volumes of the cells range from 4–30 m3. Improvements in the aeration-agitation mechanism are continuing (Wu et al, 2010).
Dispersed air fl otation machine
By the 1970s � otation had extended far beyond minerals and some limitations were becoming
apparent, for example the high � uid turbulence at the impellers tended to break relatively
weak � ocs formed when cleaning wastewater.
Vernon Degner and William Colbert of Envirotech Corporation patented a machine (shown in Figure 4.47), which contained no moving parts and in which particles or liquids attached to gas bubbles and the froth was removed from a quiescent zone by skimming (Degner and Colbert, 1980). The liquid � owing through pipe 19 and the air through pipe 22 mixed in pipe 20 and were discharged into the tank. It was a modern version of the Lyster and Bradford cells.

Spectrum Series 18
F L O TAT I O N M A C H I N E S
153
FIGURE 4.47
Dispersed air fl otation machine (Degner and Colbert, 1980).
Jameson cell
The Jameson cell (Figure 4.48) was another non-mechanical � otation machine that was to
see wide use in industry. In 1985 Mount Isa Mines commissioned Professor Graeme Jameson
of the University of Newcastle to commence a project to improve the sparger design in the
� otation column cleaners in their zinc circuit, resulting in the downcomer development.
Initially thought of as a new sparger design for a tall column (Harbort, 1992), it was soon
realised that equivalent performance could be achieved in a short tank design, now known
as the Jameson cell (Jameson, 1988; Jameson et al, 1988). In 1989 two 1.9 m diameter
Jameson cells were installed in the Mt Isa lead–zinc concentrator (Harbort, 1992) and two
units in the Hilton lead–zinc concentrator. In 1989, test work was conducted at the Peko
Wallsend copper concentrator in Tennant Creek, which resulted in two 1.4 m diameter cells
being installed in December 1989 in a � nal cleaner role (Jameson, Harbort and Riches,
1991; Harbort, 1992). The most signi� cant Jameson cell installation of this period was
at Newlands coal preparation plant, where in 1988–89 six 1.5 m by 3.5 m � otation cells
were commissioned. Its operating principles have been discussed by numerous authors
(eg Jameson, 1988; Jameson et al, 1988; Evans, Atkinson and Jameson, 1995). The three
zones are the downcomer or mixing zone, in which there is high-intensity contacting
between bubbles and particles, the tank pulp or pipe � ow zone and the tank froth or
disengagement zone. Feed pulp is pumped into the downcomer through an ori� ce plate,
creating a high-pressure jet. The plunging jet of liquid shears then entrains air that has been
naturally aspirated. Because of a high mixing velocity and a large interfacial area, there is
rapid contact and collection of particles. In the Jameson cell the downcomer operates under
a vacuum, which results in a high-intensity contact residence time that varies from one to ten
seconds. In the tank pulp zone mixing continues and there is further particle-bubble contact
and adhesion during a residence time of two to � ve minutes, and in the tank froth zone there
is a quiescent region in which froth forms and over� ows and wash water can be added to
reduce entrainment. Mean bubble diameter in the Jameson cell is 300 microns compared
with 1000 microns for conventional cells.

Spectrum Series 18
H I S T O R Y O F F L O TAT I O N
154
FIGURE 4.48
Jameson cell.
Since its invention in 1986, there have been more than 250 Jameson cells installed in many coal, industrial mineral and metalliferous ore applications. The main use of the Jameson cell is for the recovery of � ne coal; it is also widely used to remove organics in solvent extraction/electrowinning applications. In base metal processing it is used to recover high � otation rate particles rapidly, leaving the slow � oating particles to be recovered in conventional cells. The Jameson cell is considerably smaller than mechanically agitated cells or � otation columns for similar capacity � otation operations. The number of Jameson cells installed increased rapidly and by 1994 it had become the dominant non-mechanical � otation cell in use for mineral froth � otation (Harbort, Jackson and Manlapig, 1994). It was to remain in this position until 1999 and during this � ve year period represented approximately 41 per cent of installed ‘column’ � otation capacity. Installations of note were the Philex Mining copper cleaning and roughing circuits and the Maricalum Mining copper cleaning and roughing circuits in the Philippines and the Alumbrera copper cleaner circuit in Argentina (Harbort, Sevilliano and Chui, 1994; Harbort, Murphy and Budod, 1997; Murphy et al, 2000). It was also during this time that the Jameson cell achieved almost total dominance in the Australian coal industry (Murphy et al, 2000).
Microcel
The Microcel � otation machine (Figure 4.49) was developed by Professor Roe-Hoan Yoon and
his colleagues at Virginia Tech, Blacksburg, Virginia, USA, with the intention of producing
smaller air bubbles than in conventional columns (Yoon, Adel and Luttrell, 1992). The feed
slurry enters the Microcel column below the froth layer to encounter a rising stream of small
air bubbles, termed ‘microbubbles’, introduced at the base of the column cell. The small air
bubbles are generated by withdrawing part of the slurry from the lower part of the column
by means of a centrifugal pump and returning the slurry back to the column after aeration.
The aeration is achieved by pumping the slurry through static in-line mixers, attached on

Spectrum Series 18
F L O TAT I O N M A C H I N E S
155
the outside wall of the column, while injecting compressed air to the slurry before the slurry
enters the in-line mixers. The static mixers are designed to provide a high energy dissipation
rate, which is essential for producing small bubbles. The unique bubble generation system
not only produces small air bubbles but also allows bubble-particle interactions to occur
under a highly turbulent condition, both of which are useful for � ne particle � otation. The
mineralised froth formed on top of the pulp is washed with water to reduce entrainment and
the washed froth over� ows into a launder. The operation of the Microcel has been described
in several publications (eg Phillips et al, 1997; Brake, 1998). The � rst commercial plant was
installed at the Pittston Company at Middle Fork, Virginia, and early other installations
in the USA included the Holston and Lady Dunn Operations. In 1995, the � rst Microcel
installation was made in Australia at the Peak Downs operations (Brake, 1998). There are
more than 100 installations in mineral and coal plants worldwide.
REFERENCES
Alizadeh, A and Simonis, W, 1985. Flotation of � nest and ultra-� nest size coal particles, Aufbereitungs Technik, 6:363–366.
Anon, 2007. Coming full circle (company overview), The News-Sentinel, 13 March.
Araújo, A C, Viana, P R M and Peres, A E C, 2005. Flotation machines in Brazil – Column versus mechanical cells, in Proceedings Centenary of Flotation Symposium, pp 187–192 (The Australasian Institute of Mining and Metallurgy: Melbourne).
Arbiter, N, 1999. Development and scale-up of large � otation cells, in Advances in Flotation Technology (eds: B J Parekh and J D Miller), pp 345–352 (Society of Mining, Metallurgy and Exploration: Littleton).
Wash Water Inlet
Pressure Transducer
Frother Inlet
Inlet from Pump
Control Valve
Tailing Outlet
Outlet to Pump Air Inlet
Air Manifold
Bubble Generators
Slurry Manifold
Feed Inlet
Froth Product
Wash Water Distributor
SlurryAir
MicrobubbleSuspension
FIGURE 4.49
Microcel.

Spectrum Series 18
H I S T O R Y O F F L O TAT I O N
156
Banks, H R, 1946. Experience with � otation machines at the Sullivan concentrator, AIME Transactions, 169:424-428.
Barlin, B and Keys, N J, 1963. Concentration at Bancroft, Mining Engineering, 15(9):47–53.
Bassarear, J H, 1985. Tabulation of operating data for copper � otation mills, in Mineral Processing Handbook (ed: N L Weiss), pp 14C-1–14C-42 (Society for Mining, Metallurgy and Exploration: Littleton and American Institute of Mining, Metallurgical and Petroleum Engineers: New York).
Battersby, M J G, Imhof, R M, Fletcher, M G and Puder, F, 2007. The ef� cient recovery of kaolin from a hydrocyclone plant middlings stream utilising Imho� ot G-cell pneumatic � otation, presented to SME 2007 Annual Meeting, St Louis, 26–28 February.
Beall, J V, 1966. Coeur D’Alene pro� le – 1966 – Introduction, Minerals Engineering, 28:164–178.
Bennett, A J R and Dell, C, 1963. Improvements in or relating to methods of and apparatus for separating and/or concentrating particles in liquid suspensions, GB Patent GB926172, 15 May.
Booth, L E, 1936. Aerating machine, US Patent 2055065, 22 September.
Bourke, P, 2002. Personal communication.
Boutin, P and Tremblay, R J, 1963. Froth � otation method with counter-current separation, US Patent 3339730.
Boutin, P and Tremblay, R J, 1964. Method and apparatus for the froth � otation of ores, GB Patent GB970841, 23 September.
Boutin, P and Wheeler, D A, 1967. Column � otation development using an 18 inch pilot unit, Canadian Mining Journal, 88:94–101.
Brake, I R, 1998. The development and commissioning of a new Microcel column � otation circuit for BHP Coal’s Peak Downs coal preparation plant, in Proceedings XIII International Coal Preparation Congress (eds: A C Partridge and I R Partridge), pp 767–776 (Australian Coal Preparation Society: New South Wales).
Callow, J, 1915. Ore-� otation apparatus, US Patent 1124856, 12 January.
Callow, J M, 1916. Notes on � otation, AIME Transactions, pp 3–24.
Chaput, D A and Kennedy, K, 1992. The Man from ASARCO: A Life and Times of Julius Kruttschnitt, p 86 (The Australasian Mineral Heritage Trust of The Australasian Institute of Mining and Metallurgy: Melbourne).
Cienski, T and Cof� n, V L, 1981. Column � otation operation at Mines Gaspé molybdenum circuit, in Proceedings 13th Annual Meeting of the Canadian Mineral Processors, January, pp 240–262.
Convey, J, McLachlan, G C, Carter, J M, Wright, H M, Banks, H R and Airey, H T, 1957. The Milling of Canadian Ores, Chapter 7 (Northern Miner Press Limited: Toronto).
Cordes, H, 1997. Development of pneumatic � otation cells to their present day status, Mineral Processing Journal, 2(Feb):69–82.
Cusack, B L, 1968. The development of the Davcra � otation cell, in Broken Hill Mines – 1968 (eds: M Radmanovitch and J T Woodcock), pp 481–487 (The Australasian Institute of Mining and Metallurgy: Melbourne).
Daman, A C, 1925. Flotation machine, US Patent 1556083, 6 October.
Daman, A C, 1934a. Flotation machine, US Patent 1942803, 9 January.
Daman, A C, 1934b. Flotation machine, US Patent 1985153, 18 December.
Daman Jr, A C, 1966. Development and theory of the D-R* Denver Flotation Machine (Denver Bulletin No F10–B121). Deco Trefoil, Nov–Dec, pp 9–16.
Davis, W J N, 1969. Method and apparatus for froth � otation, US Patent 3446353, 27 May.
Degner and Colbert, 1980. Dispersed air � otation machine, US Patent 4226706.
Deister Concentrator Company, 2008. <http://www.coalpeople.com/Article_Deister.pdf> [Accessed: 10 June 2009, no longer available].

Spectrum Series 18
F L O TAT I O N M A C H I N E S
157
Denver Equipment Company, 1966. Mineral Processing Flowsheets, pp 52–53 (Denver Equipment Company: Denver).
Dobby, G S and Finch, J A, 1986. Flotation column scale-up and modelling, CIM Bull, 79(889):89–96.
Drake, L D, 1939. Method and apparatus for diffusion control, US Patent 2128445, 28 February.
Dreyer, J P, 1976. The development of AGITAIR � otation machines, Journal of the Southern African Institute of Mining and Metallurgy, June, pp 445–447.
Ekof, 1988. Pneumatic � otation, Erz- und Kohle� otation, GmbH promotional brochure.
Espinosa-Gomez, R, Johnson, N W, Pease, J D and Munro, P D, 1989. The commissioning of the � rst � otation columns at Mount Isa Mines Limited, in Processing of Complex Ores (eds: G S Dobby and S R Rao) (Pergamon Press: New York).
Evans, G M, Atkinson, B W and Jameson, G J, 1995. The Jameson cell, in Flotation Science and Engineering (ed: K A Matis), pp 331–363 (Marcel Dekker: New York).
Fagergren, W, 1929. Apparatus for circulating and distributing � otation pulp, US Patent 1736073, 19 November.
Fagergren, W, 1934. Aerating machine, US Patent 1963122, 19 June.
Fagergren, W, 1936. Aerating machine, US Patent 2054249, 15 September.
Fahrenwald, A W, 1922. Flotation apparatus, US Patent 1417895, 30 May.
Fahrenwald, A W, 1928. Flotation practice in the Coeur d’Alene district, Idaho, AIME Transactions, pp 107–132.
Fahrenwald, A W, 1934. Machine for � otation of ores, US Patent 1984366, 18 December.
Fairweather, M, 2009. Personal communication.
Finch, J A and Dobby, G S, 1990. Column Flotation (Pergamon Press: Oxford).
Garrett, J E, 1933. Flotation of unclassi� ed ball mill discharge for the recovery of the lead and zinc concentrates, The AusIMM Proceedings, 92:475–499.
Gayford, E, Heginbotham, J H and Hamilton, P D P, 1937. Flotation of minerals, US Patent 2073148, 9 March.
Gibson, W A and Trujillo, A D, 1966. From Indian scrapings to 85-ton trucks: The development of Chino, Minerals Engineering, 28:54–60.
Goldick, M R, 1948. Description of concentrating operations, Roan Antelope Copper Mines Limited, Northern Rhodesia, in Mining Technology, vol XII, technical paper 2251 (American Institute of Mining, Metallurgical and Petroleum Engineers: New York).
Gruber, G A, El-Shall, H, Svoronos, S and Abdel-Khalek, N, 2001. Bubble generation, design modelling and optimization of novel � otation columns for phosphate bene� ciation, Final report: Vol II, Florida Institute of Phosphate Research, FIPR project number 95-02-111, September.
Gruber, G A and Kelahan, E, 1988. Flotaire cell applications, in Phosphate Flotation, Column Flotation ’88 – Proceedings of an International Symposium (ed: K V S Sastry), Chapter 20 (Society of Mining, Metallurgy and Exploration: Littleton).
Harbort, G J, 1992. Jameson Cell development and applications, presented to AMMTEC Flotation Colloquium, Perth (unpublished).
Harbort, G J, Jackson, B R and Manlapig, E V, 1994. Recent advances in Jameson � otation technology, Minerals Engineering, 7(2/3):319–332.
Harbort, G J, Murphy, A S and Budod, A, 1997. Jameson Cell developments at Philex Mining Corporation, in Proceedings Sixth Mill Operators’ Conference, pp 105–114 (The Australasian Institute of Mining and Metallurgy: Melbourne).
Harbort, G J, Sevilliano II, A C S and Chui, A V, 1994. Optimisation of the Philex Mining Corporation concentrator with the Jameson Cell, in Proceedings Fifth Mill Operators’ Conference, pp 37–42 (The Australasian Institute of Mining and Metallurgy: Melbourne).

Spectrum Series 18
H I S T O R Y O F F L O TAT I O N
158
Hebbard, J, 1913. Apparatus for ore concentration, US Patent 1064209, 10 June.
Heintges, S, Alizadeh, A and Simonis, W, 1984. Process and � otation cell for � otation of coal and ore (translation from German) German Patent 3140966 A1.
Hollingsworth, C A, 1954. Concentration of minerals, US Patent 2753045.
Hollingsworth, C A, 1956. Concentration of minerals, US Patent 2758714.
Hollingsworth, C A, 1984. Concentration of minerals by � otation apparatus, US Patent 4431531.
Hollingsworth, C A and McDonald, C J, 1960. Concentration of comminuted materials, US Patent 2938629.
Hollingsworth, C A and Sapp, B L, 1968. Concentration of minerals, US Patent 3371779.
Hu, W and Liu, O, 1988. Design and operating experiences with � otation columns in China, in Proceedings Column ’88 – International Symposium on Column Flotation (ed: K V Sastry), pp 35–42 (Society for Mining, Metallurgy and Exploration: Littleton).
Hukki, R T, 1967. Froth � otation apparatus, GB Patent GB105891415, February.
Imhof, R, 1988. Pneumatic � otation – A modern alternative, Aufbereitungs-Technik, 29 Jahrgand, Heft 8, pp 451–458.
Imhof, R, Battersby, M, Parra, F and Sanchez-Pino, S, 2005. The successful application of pneumatic � otation technology for the removal of silica by reverse � otation at the iron ore pellet plant of Compañía Minera Huasco, Chile, in Proceedings Centenary of Flotation Symposium, pp 861–867 (The Australasian Institute of Mining and Metallurgy: Melbourne).
Imhof, R, Fletcher, M, Vathavooran, A and Singh, A, 2007. Application of IMHOFLOT G-Cell centrifugal � otation technology, Journal of the Southern African Institute of Mining and Metallurgy, 107(Oct):623–631.
Imhof, R M, 1993. Five years of Eko� ot: Pneumatic � otation on the march, Aufbereitungs Technik, 34(6):263–268.
Jameson, G J, 1988. A new concept in � otation column design, in Proceedings Column ’88 – International Symposium on Column Flotation (ed: K V Sastry), pp 281–289 (Society for Mining, Metallurgy and Exploration: Littleton).
Jameson, G J, Belk, M, Johnson, N W, Espinosa-Gomez, R and Andreaditis, J P, 1988. Mineral � otation in a high intensity column, in Proceedings Chemeca ’88, 16th Australian Conference on Chemical Engineering, Sydney, pp 507–10.
Jameson, G J, Harbort, G and Riches, N, 1991. The development and application of the Jameson Cell, in Proceedings Fourth Mill Operators’ Conference, pp 45–50 (The Australasian Institute of Mining and Metallurgy: Melbourne).
Klassen, V I and Mokrousov, V A, 1963. An Introduction to the Theory of Flotation, p xiv (Butterworths: London).
Korhonen, O and Leskinen, T, 1976. The use of large OK-16 � otation machines at the concentrators of Outokumpu Oy, Journal of the Southern African Institute of Mining and Metallurgy, June, pp 433–438.
Kraut, M, 1927. Flotation apparatus, US Patent 2074403, 23 March.
Lelinski, D, Gordon, I, Weber, A, Dabrowski, B, Traczyk, F, Dunn, M and Newman, R, 2009. Commissioning of the Supercells™ – World’s largest � otation machines, in Proceedings PROCEMIN 2008, VI International Mineral Processing Seminar (GECAMINE: Santiago).
Logue, L H and Daman Jr, A C, 1968. Aerating assembly for froth � otation cells, US Patent 3393802, 23 July.
MacIntosh, J C, 1926. Flotation apparatus, US Patent 1608896, 30 November.
Margetts, I R and Fagergren, W, 1920. Flotation machine, US Patent 1361342, 7 December.

Spectrum Series 18
F L O TAT I O N M A C H I N E S
159
McDonald, R, 2009. Personal communication.
Millsaps, F, 2009. Personal communication.
Mohr, E H, 1927. The Forrester cell installation at the Nevada Consolidated Copper Co’s McGill concentrator, AIME Transactions, pp 194–201.
Murphy, A S, Honaker, R, Manlapig, E S V, Lee, D J and Harbort, G J, 2000. Breaking the boundaries of Jameson cell capacity, in Proceedings Eighth Australian Coal Preparation Conference (ed: W B Membrey) (Australian Coal Preparation Society: Nelson Bay).
Myers, J F and Lewis, F M, 1943. Flotation machines at the Tennessee Copper Company, in Mining Technology, vol VIII, technical paper 1680, March.
Oldright, G L, 1924. Present trend in treatment of complex ores, AIME Transactions, pp 471–485.
Parsons, A B, 1933. The Porphyry Coppers, pp 154–156 (American Institute of Mining, Metallurgical and Petroleum Engineers: New York).
Phillips, D I, Yoon, R, Luttrell, G H, Fish, L and Toney, T A, 1997. Installation of 4 meter diameter Microcel � otation columns at LadyDunn preparation plant, in 14th International Coal Preparation Exhibition and Conference, Lexington, pp 115–132.
Pickett, D E (ed), 1978. Milling Practice in Canada (Canadian Institute of Mining and Metallurgy: Montreal).
Reck, W H, 1970. Flotation apparatus and process, US Patent 3491880, 27 January.
Rickard, T A, 1922. Interviews with Mining Engineers, pp 135–150 (Mining and Scienti� c Press: San Francisco).
Rickard, T A, 1932. The History of American Mining, pp 397–414 (American Institute of Mining, Metallurgical and Petroleum Engineers: New York).
Rubenstein, J B, 1995. Column Flotation: Processes, Designs, Practices, pp 254–255 (Gordon and Breach: Yverdon).
Salzmann, G and Koch, W, 1964. Froth-� otation apparatus, Australian Patent Speci� cation 275365.
Sanchez-Pino, S, Sanchez-Baquedano, A, Imhof, R M and Battersby, M J G, 2009. Pilot plant testing and the successful commercial installation of Imho� ot G-cell pneumatic � otation for molybdenum concentrate cleaning at Los Pelambres in Chile, presented to Flotation ’09 MEI Conference, Cape Town, 9–12 November.
Sanders, G J and Williamson, M M, 1996. Coal � otation technical review, ACARP report C4047.
Seeton, F, 2008. Personal communication.
Seeton, F, 2009. Personal communication.
Sewell, G P, 1955. Design and operation of Callow-type � otation cells at Kennecott’s Hayden concentrator, Minerals Engineering, 17:1112–1114.
Shirley, L E and Vernon, R O, 1968. Mineral industry of Florida, Bureau of Mines: Minerals Yearbook Area Reports: Domestic 1964 (1968), pp 273–294.
Symonds, I M, 1942. Milling methods at the lead–zinc concentrator of Compañia Minera de Peñoles, SA, at Avalos, Zacatecas, Mexico, AIME Transactions, pp 623–635.
Taggart, A F, 1945. Handbook of Mineral Dressing, sections 12–53 (John Wiley & Sons, Inc: New York).
Towne, R S and Flinn, F B, 1919. Process for separating ore materials from each other, US Patent 1295817.

Spectrum Series 18
H I S T O R Y O F F L O TAT I O N
160
Ventert, P E and van Loggerenbergt, C, 1992. Modi� cations to the coal-preparation circuit at the Grootegeuk coal mine to improve its ef� ciency, Journal of the Southern African Institute of Mining and Metallurgy, 92(2):53–61.
Wheeler, D A, 1983. Column � otation seminar, Column Flotation Co of Canada, McGill University, Montreal, 25 March.
Wheeler, D A, 1988. Historical view of column � otation development, in Proceedings Column ’88 – International Symposium on Column Flotation (ed: K V Sastry), pp 3–4 (Society for Mining, Metallurgy and Exploration: Littleton).
White, J and Adair, R B, 1948. Mulu� ra Copper Mines Limited, Concentrator, Northern Rhodesia, AIME Transactions, 1949:67–78.
Wilkinson, E W and Littleford, J W, 1926. Flotation machine, US Patent 1588077, 8 June.
Wright, J D, 1976. A review of plant practice at Endako Mines, in Flotation A M Gaudin Memorial Volume (ed: M C Fuerstenau), vol 2, pp 1200–1214.
Wu, D, 2007. Personal communication.
Wu, D and Ma, L, 1998. XPM-series jet � otation machine, in Proceedings XIII International Coal Preparation Congress (eds: A C Partridge and I R Partridge), pp 737–745 (Australian Coal Preparation Society: New South Wales).
Wu, D, Yuyu, Z G, Zhu, J and Jiang, M, 2010. A novel type of jet coal flotation machine, in Proceedings 16th International Coal Preparation Conference (Coal Preparation Society of America and the International Organizing Committee of the ICPC: Lexington).
Yianatos, J B, 2003. Design, modelling and control of � otation equipment, in XXII International Mineral Processing Congress (eds: L Lorenzen, D J Bradshaw, C Aldrich, J J Eksteen, M Wright and E Thom), pp 59–68 (Southern African Institute of Mining and Metallurgy: Johannesburg).
Yoon, R, Adel, G T and Luttrell, G H, 1992. Apparatus and process for the separation of hydrophobic and hydrophilic particles using microbubble column � otation together with a process and apparatus for the generation of microbubbles, US Patent 5167798.
Zimmerman, R E, 1950. Flotation, in Coal Preparation – 1950 (ed: D R Mitchell), pp 570–587 (American Institute of Mining, Metallurgical and Petroleum Engineers: New York).
Zipperian, D E, 1983. Froth � otation apparatus with water recovery and method, US Patent 4394258.
Zipperian, D E, 1987. Floatation apparatus for concentration of minerals from high water content aqueous slurries, US Patent 4639313.
Zipperian, D E, 1992. Froth � otation apparatus, US Patent 5078921.
Zipperian, D E and Svensson, U, 1988. Plant practice of the Floataire column � otation machine for metallic, non-metallic and coal � otation, in Column Flotation ’88, Proceedings of an International Symposium on Column Flotation (ed: K V S Sastry), pp 43–54 (Society for Mining, Metallurgy and Exploration: Littleton).

Spectrum Series 18 161
INTRODUCTION
In the fl otation process at Glasdir the ore passed through the rotating Elmore tubes, which operated in open circuit and the sulfi de minerals that fl oated were apparently dried and sold without further processing. No doubt the high cost of oil required to make each tube work ensured that few tubes were used and that the operation was kept simple. But the huge amounts of minerals in the tailings at Broken Hill and the lower reagent costs of fl otation made the idea of improving some streams by reprocessing attractive and circuits slowly became more complex. The evolution of fl otation circuits will be discussed in this chapter.
THE FIRST CIRCUITS – 1902–1914
BHP 1902
The fl otation plant that BHP built in 1902 used Delprat-Potter cells in open circuit.
The variables that could be controlled in the BHP plant were feed rate, acid addition and temperature, although the main concern of the operators in the early days would have
C H A P T E R 5
FIGURE 5.1
BHP: the fi rst sulfi de fl otation circuit (AusIMM Broken Hill Branch, 1930).
Flotation Circuits

Spectrum Series 18
H I S T O R Y O F F L O TAT I O N
162
been in ensuring that feed from the tailings dumps contained minimum plant matter and rubbish, such as wood and scrap iron.
Amalgamated Zinc ( De Bavay’s) 1910
This plant used six De Bavay machines in series.
The De Bavay fl otation circuit was much larger and more complicated than the BHP circuit and it gave the best results of all the circuits at Broken Hill. The concentrate from the last machine was reground and recycled to the fl otation circuit feed, which set the precedent for future fl otation circuits.
FIGURE 5.2
De Bavay plant: the fi rst circuit with a recycling stream (AusIMM Broken Hill Branch, 1930).

Spectrum Series 18
F L O TAT I O N C I R C U I T S
163
Cleaner and regrind circuits 1911–1914
In 1911 James Hyde introduced the concept of cleaner cells to upgrade zinc concentrates at the Black Rock zinc mine of the Butte and Superior Company in the USA (Hyde, 1912). Leslie Bradford used them for the same purpose at BHP in 1912 as part of his sulfur dioxide process, in which zinc was depressed in lead fl otation and then fl oated in a rougher-cleaner circuit. The Timber Butte Milling Company mine, which was on an adjoining lease to the Black Rock mine, also used cleaning. At Timber Butte the plant feed containing 18.5 per cent zinc was fl oated in an 11 cell Minerals Separation machine, the concentrate from cells 1–6 was refl oated in cleaner cells, and the concentrate from cells 7–11 was combined with cleaner tails for regrinding and return to the circuit feed (Simons, 1917). The circuits at Butte and Superior Company and at Timber Butte Milling Company were discussed in Chapter 2 and the success of rougher-cleaner fl otation in those plants led the way to modern circuits. The term rougher appears to have been fi rst used at Timber Butte.
HIGH CAPACITY CIRCUITS FOR LOW-GRADE ORES – 1914–1970
The porphyry coppers were discussed in Chapter 3 with particular reference to the link between mining and fl otation. More details about circuits will be given in this chapter. The signifi cance of 1970 is that pre-1970 there were only small cells; post-1970 large cells were used and this changed circuits greatly.
Anaconda Copper Company – Mills at Inspiration and Butte
The Anaconda Company produced huge tonnages of copper from its rich deposits at Butte
in the late 19th century. When the high-grade ore was fi nished an ore dressing mill was
built at Washoe to produce concentrates from lower grade ores. The mill had eight sections,
each processing 2000 tons per day of ore. Concentration was by gravity, with multi-deck
revolving round tables being used to produce concentrate from slimes in the fi nal processing
stage. Round tables were a form of buddles and were the most effective gravity concentrator
for slimes, but even with these the recovery of copper was only 60 per cent. The success of
fl otation at the nearby Basin zinc mine in 1911, and at Braden in Chile in 1912, would have
encouraged the Anaconda staff to build a pilot mill to investigate fl otation for the Inspiration
deposit in Arizona, which Anaconda part-owned, and to test fl otation on the slime and
gravity mill tailing at its Washoe mill.
Inspiration Copper CompanyThe development program at the Inspiration Copper Company, which started in the pilot mill in 1913 and continued in the new large mill in 1915, set the standard for sulfi de fl otation circuits. Design work on the gravity concentrator by the former leaseholders was well advanced in 1911 when Anaconda took control and their consultant, Dr Louis Ricketts, reviewed the design:
He did not think the mill Thompson’s engineers had planned would recover enough of the copper. To the horror of the stockholders, he threw away one million

Spectrum Series 18
H I S T O R Y O F F L O TAT I O N
164
The experimental program was meticulously carried out and the results of the new mill were excellent. Dr Ricketts recognised from his tests on the porphyry copper ore that chalcopyrite in the grinding circuit product could be divided into high-grade particles, which fl oated quickly, lower grade composite particles, which fl oated slowly and gangue particles, which did not fl oat. Consequently his fl otation circuit had a rougher bank to make a high-grade product, a cleaner bank to reject entrained gangue and slow-fl oating particles from the rougher concentrate and a retreatment bank to reclaim the fi ne, slow-fl oating chalcopyrite particles that remained in the rougher tailing. The cleaner tailing was pumped back to the roughers, and the feed to the retreatment bank was fi ne particles from rougher tailings that had been classifi ed in downstream separators. He also introduced the idea of using many small cells, which could be arranged in a circuit to suit the ore.
Dr Ricketts’ plant contained 18 sections; each section operated at 900 tons per day and parallel banks were included where necessary. Callow, Inspiration and Minerals Separation cells were used in different sections, the Callow section contained eight rougher, four cleaner and 16 retreatment cells, and other sections had equivalent fl otation capacity (Burch, 1917; Gahl, 1917). A question which perplexed the metallurgist-in-charge, Dr Gahl, was whether it was wise to send middling particles in the cleaner tailings back to the head of the rougher machine for retreatment:
In the little time at our disposal it proved impossible to substitute something better, but the chances are that the same holds true of fl otation that is true for water concentration; viz. that middlings are sent back for retreatment mainly because the designer does not know anything better to do with them (Gahl, 1917).
FIGURE 5.3
Inspiration and Callow fl otation systems at Inspiration (Burch, 1917).Sands from the drag classifi er went to tables where additional copper was recovered.
dollars’ worth of mill construction and spent a year and another million dollars experimenting. Then, he built the fi rst mill that used the new fl otation process (Joralemon, 1973).

Spectrum Series 18
F L O TAT I O N C I R C U I T S
165
The middlings were a mixture of composite sulfi de particles that required further grinding and other slow-fl oating minerals that contained copper. Many years would elapse before there was a good understanding of how to treat middling particles in grinding and fl otation circuits. The type of circuits at Inspiration – rougher and cleaner cells for the fast-fl oating fraction and retreatment cells for the slow-fl oating middlings – were used in other early fl otation plants in the USA and became the general model for fl otation circuits, although individual circuits varied according to the nature of the ore.
By 1924 Keller and Lewis had patented xanthates, which were soluble collectors and selective for sulfi des, and these had an immediate impact on the fl otation of porphyry coppers. At Inspiration the original reagents, coal tar and pine oil, were replaced by lime, xanthate and pine oil and the metallurgical emphasis, which had been on optimising the circuits, turned to optimising the reagents and their addition points in the circuits. By 1927 conclusions at Inspiration were that (Ruggles and Adams, 1928):
• lime is necessary but the smallest amount necessary to give faint alkalinity should be used,
• xanthate should be added to fl otation cells rather than the ball mills, and
• pine oil should be added to the return water circuit.
Anaconda’s Washoe millIn parallel with the work at Inspiration an extensive test program on fl otation started in 1914 in the Washoe mill on slimes from the gravity plant (2.2–2.6 per cent copper; 90–95 per cent –67 microns) and deslimed mill tailing (0.6 per cent copper; 5–10 per cent –250 microns). The objective was to decide if fl otation gave better results on these streams than the round tables on which Anaconda had done much work. A large variety of fl otation oils was tested on mixtures of slimes and mill tailings using different circuits and different fl otation machines, including Callow cells, Minerals Separation cells and Towne-Flinn columns (Laist and Wiggin, 1917). The conclusion was that the slimes and mill tailings could be concentrated more effi ciently in fl otation cells than on the round tables (Taggart, 1945). Consequently, banks of fl otation cells were installed in all eight sections of the 16 000 tons per day plant.
FIGURE 5.4
The grinding and fl otation fl oors in the concentrator at Inspiration (Burch, 1917).

Spectrum Series 18
H I S T O R Y O F F L O TAT I O N
166
Each circuit contained four Minerals Separation machines with 15 cells in each machine. Concentrates from the fi rst three cells were the fi nal product, from the next six cells were cleaned in Callow cells and from the last six cells were added to Callow cell tails and recycled to rougher feed (Mathewson, 1916). Success of fl otation at Inspiration and Washoe must have removed any concerns about high-capacity fl otation circuits because many others were built during the next decade.
Utah Copper Company and Kennecott Copper Corporation
Daniel Jackling’s plan for a high capacity mine at Bingham Canyon mine had to include a concentration plant and a 300 tons per day pilot plant was built at Copperton in 1904. Like all concentrators at the time processing was by grinding and gravity separation. The fl oor area was large, the capacity was low but results were good by the standards of the time.
In 1908 and 1909 two larger gravity mills were built to concentrate the Bingham Canyon ore; a 6000 tons per day mill by Utah Copper at Magna, which is 15 miles from Salt Lake City, and a 3000 tons per day mill by Boston Consolidated, three miles from Magna. In 1910 the companies merged and the smaller mill was remodelled and named the Arthur mill.
The success of fl otation in 1916 at Inspiration and at the Kennecott plant at Braden in Chile led to fl otation circuits being installed at Arthur in 1918 and Magna in 1922, and for the next 40 years they were regularly expanded, becoming recognised as the great fl otation mills of the world. The capacities of each mill were increased to 40 000 tons per day in 1923 and to 50 000 tons per day in 1926 (Barker, 1928). In 1936 circuits were installed to fl oat molybdenum as a by-product; in 1952–53 copper scavenger circuits were added to recover additional copper; in 1966 fl otation capacities in each mill were increased to 54 000 tons per day, fed partly by a crushing and grinding plant constructed at nearby Bonneville, and in 1971 tailings retreatment circuits were added to each plant. By this time each concentrator contained 1040 cells; there were 616 in the rougher banks, 336 in the scavenger banks, 18 in the cleaner banks and 70 in the molybdenum banks. There were 65 ball mills at Arthur and 60 at Magna, and mechanical classifi ers were used with each ball mill to control the
FIGURE 5.5
The original gravity concentrator built at Copperton in 1904 (Parsons, 1933).

Spectrum Series 18
F L O TAT I O N C I R C U I T S
167
particle size. Ball mills were about two metres in diameter and three metres long and fl otation cells were about 2.5 m3. Almost 2000 people were employed across the two mills; in the Magna mill alone the four shifts each had fi ve supervisors, seven operators in the crushing plant, seven operators on the roll fl oor, four operators in the grinding plant, six operators in copper fl otation and fi ve operators in molybdenum fl otation. There was a large maintenance crew and laboratory staff worked round-the-clock. The concentrators were colossal by the standards of the time, as can be seen from the fl ow sheet of the rougher-cleaner-scavenger circuits at Magna (Figure 5.6).
FIGURE 5.6
Flow sheet of fl otation circuit in Kennecott Utah’s 54 000 tons per day Magna concentrator (Kennecott Copper Corporation, 1975).
The Arthur and Magna mills were the great concentrators of their day but the cost of
1000 operators per mill was too high and eventually they were taken out of service. The
Arthur mill was closed fi rst and the Magna mill was mothballed in 2001. By then the new
concentrator built at Copperton was operating with a feed rate higher than the combined
rates of Arthur and Magna. The new Copperton concentrator is discussed later in this chapter
in the Kennecott Utah Copper section.
The last giant concentrator in which small cells were used was at Duval’s Sierrita mine,
which was built late in the 1960s. It contained 776 cells in the copper and molybdenum
circuits and processed 90 000 tons of ore per day containing 0.32 per cent copper and

Spectrum Series 18
H I S T O R Y O F F L O TAT I O N
168
0.03 per cent Mo. Duval did not want to use small cells but government funding was
involved and acceptance of these funds carried the requirement that the company should
use proven technology. The Sierrita concentrator marked the end of the era of small cells;
even when further economies of scale were taken into account, the size had been reached
at which costs were too high and had to be reduced by using larger cells and less circuits.
It was known in the 1950s that many more 100 000+ tons per day plants would be required
and manufacturers were starting to design larger cells. Eventually they would be built and
would lead to compact circuits with capacities that could not have been dreamt of years ago
in Broken Hill, or perhaps even in Inspiration.
International Nickel Company of Canada, Copper Cliff
The success of high capacity copper fl otation plants in the USA set the precedent for large plants in other countries and for other metals. Nickel in Canada was an example. Nickel concentration in 1952 required many circuits and machines and the fl ow sheet of the Copper Cliff concentrator is shown in Figure 5.7. It was typical of its time because of the large number of small mills and small cells used. The origin of the mine was that copper sulfi des were discovered at Sudbury, Ontario, in 1883 while the Canadian Pacifi c Railway (Wikipedia, 2009a) was being built. The ore deposit turned out to be large and rich in both nickel and copper and the fi rst shipment of ore was sent to a smelter in July 1901. In 1902 the International Nickel Company Ltd was created and in 1916 the International Nickel Company of Canada Ltd was incorporated as the operating company in Copper Cliff (Wikipedia, 2009c) near Sudbury. It became known as INCO. A gravity concentrator was built soon after mining started.
World production of nickel in 1903 was 10 200 tons and increased very slowly until the start of World War II. It was 21 800 tons in 1932 and 120 000 tons in 1937, then it rapidly increased because of its use of alloy steels, rising to 320 000 tons in 1960 and to 1 010 000 tons in 1991. The main source of nickel was the INCO mines at Copper Cliff near Sudbury and a 30 000 tons per day fl otation plant was built to produce concentrates. The ore contained three per cent copper in chalcopyrite, two per cent Ni in pentlandite and 15 per cent S mainly in pyrrhotite, with the penlandite being fi nely disseminated in pyrrhotite. Bulk fl otation of sulfi des followed by cleaning produced two concentrates containing 29 per cent copper and 4.85 per cent Ni respectively. Equipment in INCO’s 1952 concentrator included:
• 34 ball mills,
• 340 Denver DR-30 fl otation cells,
• 138 GECO 20' fl otation machines, and
• 64 GECO 12' fl otation machines.
GECO machines were pneumatic machines made by John Callow’s General Engineering
Company.
The INCO concentrator at Sudbury was one of the great fl otation concentrators built in
the mid 20th century. INCO also built three other concentrators for their mines, which were
on the rim of the Sudbury basin, but the high operating costs and decreasing ore grades

Spectrum Series 18
F L O TAT I O N C I R C U I T S
169
resulted in the consolidation of all milling into the Clarabelle concentrator, with a capacity of 36 300 tons per day. Costs were reduced in the late 1990s by using a semi-autogenous grinding (SAG) mill circuit and replacing half of the 528 Denver DR-30 cells (2.83 m3 per
cell) with 48 Denver 38 m3 cells.
LOW TO MEDIUM CAPACITY CIRCUITS FOR HIGHER GRADE ORES – 1925–1965
The circuits that have been discussed so far were chosen to illustrate the progress of
fl otation during 50 years, from simple ores in low capacity circuits to low-grade ores in high
FIGURE 5.7
Flow sheet from 1952 of the production of copper and nickel concentrates by INCO from the complex ore atSudbury, Ontario (originally published in Deco Trefoil, house magazine of Denver Equipment Company).

Spectrum Series 18
H I S T O R Y O F F L O TAT I O N
170
capacity circuits, and to complex, multi-mineral sulfi de ores. By 1965 fl otation was a mature
technology, although cells were still only 2 m3 in volume, and most of the plants worldwide
in which sulfi de ores were fl oated successfully worked on higher grade ores and had feed
rates in the low to medium range, up to several thousand tons per day. There were also many
fl otation plants for industrial minerals. Usually sulfi de minerals responded well to fl otation,
although no ores were identical and every ore presented its own problems in terms of grade
and recovery of valuable minerals that entered the concentrates. Often these problems were
not easy to solve because simple chemical analysis was the only technique available to give
some insight into the reasons for the problems. Systematic methods for diagnosing the
reasons for problems and for defi ning possible corrective actions were starting to emerge
from investigations, but it would be many years before these were proven and widely
available. Some current methods for problem solving are discussed in Chapter 10.
In 1960 the main variables in circuit design were grind size and residence times. When
these were chosen from laboratory and pilot plant tests there could be a variety of circuits
depending on the choice made by the design engineer. But the objective was common –
produce a high-grade concentrate and a low-grade tailing as soon as possible and recycle
the middlings to some intermediate point in the circuit, with or without regrinding, from
which they would eventually enter the concentrate or tailing. Denver Equipment Company
had extensive fi les of information about mineral processing plants and it published fl ow
sheets that were typical for lead–zinc and copper sulfi de ores in the 1950s (see Figure 5.8).
Signifi cant variations from these fl ow sheets did occur because of unusual ores, but they
were the exception rather than the rule. Pneumatic cells were still used in some circuits,
particularly in Canada (for example Wearing and Coleman, 1957), but they would fade from
the scene, at least until their revival 25 years later.
FIGURE 5.8
Typical fl ow sheets for lead–zinc ores (note the unit cell) and for copper ores in the 1950s (Denver Equipment Company, 1962).

Spectrum Series 18
F L O TAT I O N C I R C U I T S
171
Examples of medium capacity (3000 tons per day) circuits
Two medium sized circuits in which 3000 tons per day of ore were fl oated in the 1950s will be discussed briefl y as an example of operations at the time. The circuits were at New Broken Hill Consolidated (NBHC) in Broken Hill, which fl oated ore containing 12.9 per cent lead and 12.2 per cent zinc, and Gaspe Copper mines in Newfoundland, which fl oated ore containing 2.05 per cent copper. Mechanical cells were used for roughing and two stages of cleaning in both the lead and zinc circuits in the NBHC mill, while Gaspe Copper used pneumatic cells for roughing and mechanical cells for cleaning. In each circuit there was some regrinding of cleaner tails. Photos of the fl otation fl oors are shown in Figure 5.9. These circuits were typical of concentrators in the mid 20th century – there were many small cells, many pumps and large fl oor areas. The metallurgical performance of these circuits was controlled by operators who walked the fl otation and pump fl oors and observed cell conditions, in particular the appearance and velocity of the froths, and the mineral content of the tailings. They carried out rapid wet assays when necessary and occasionally used a panning dish to diagnose problems. Reagents were added through devices that could be manually controlled, air was controlled by valves unless it was self induced, and pulp level and froth depth were controlled by moveable gates. Many fl otation banks had dual launders and diverter trays. The launders were connected to different points in the circuit, ie one scavenger concentrate launder could be connected to cleaner feed and the other to rougher feed, and a tray would move a cell concentrate between launders.
FIGURE 5.9
Flotation fl oors of 3000 tons per day circuits in the 1950s. Mechanical cells at Broken Hill (left)(Braes, 2008). Pneumatic cells at Gaspe Copper (right) (Wearing and Coleman, 1957).
In the 1950s there were few online instruments available to detect changes that affected fl otation performance; the bubble tube to measure pulp density of circulating loads was perhaps the most informative. Getting the best out of fl otation circuits was an art that only skilled operators knew; consequently, they were highly valued and often stayed with their companies for many years. Some ambitious operators who wished to demonstrate their skills to their managers realised that middlings streams could be manipulated to their advantage. Using manual control of air and diverter plates they could hold problem particles inside the middlings recycling streams for hours so that only high-quality concentrates and tailings

Spectrum Series 18
H I S T O R Y O F F L O TAT I O N
172
would be produced during their shift. The immediate assay results for the shift refl ected well on these operators, but of course the high circulating load of problem particles could not continue indefi nitely and had to be released to concentrate or tailings, giving assay results for the next shift which refl ected poorly on its operator. Pride was involved, not fi nancial incentive.
In the late 1950s some companies tested sensors and local controllers that were successful in other process industries, such as level controllers, magnetic fl ow meters and gamma density gauges. These trials laid the foundation for the process control studies in the 1960s which improved mill performance (Behrend, 1978) and led to the well-instrumented and controlled concentrators that are discussed later in this chapter. The main problem in process control in the 1960s was with online measurements of metals in pulps. Rapid knowledge of feed and tailings assays was crucial for accurate control of fl otation circuits, but measuring them was diffi cult because the physics was not straight forward and mineral slurries were a tough environment for scientifi c instruments to give reliable and accurate data. Slurries were abrasive and destroyed immersed probes, and the particles blocked any aperture used for sampling tubes taking pulp to external instruments. These problems were solved in time but they were the main reasons why full automatic control systems came later to mineral processing than to other process technologies.
Flotation of diffi cult ores in small plants in remote locations
Not all advances in fl otation came from metallurgists in companies working on large or rich orebodies, many came from metallurgists working alone in the fi eld or in small groups. Professor Maurice Rey from the Schools of Mines at Liege, Belgium, and Paris, France, worked on the fl otation of diffi cult ores, mainly in Africa, for more than 40 years and he described some of his experiences in a series of papers entitled ‘Memoirs of Milling and Process Metallurgy’ (Rey, 1979). Not surprisingly unconventional ideas were often tested and produced results that were good enough to make the mines profi table. Some examples taken from the memoirs are:
• At the Soldado mine in Chile the bornite and chalcopyrite were fi nely disseminated in very hard siliceous gangue and the coarse primary grinding gave poor recoveries. A technique was devised to fl oat the middlings in the tailings but cell turbulence had to be minimised to reduce sanding problems and particles were fl oated as a layer and removed by a skimmer.
• At the Kipushi mine in Katanga the large copper–zinc orebody contained chalcocite, covellite and chalcopyrite. Copper in the sphalerite–covellite ore was dissolved by cyanide so it was necessary to devise a reverse fl otation process for this ore in which sphalerite was fl oated ahead of the covellite.
• Selectivity of lead–zinc separation was affected by grinding in a steel mill. The abraded iron depressed the galena slightly and the sphalerite more strongly and conditions had to be controlled to allow for this.
• In Katanga laboratory tests were carried out daily to provide a basis for plant control.
Every small mine has its own story of success and failure in fl otation and these stories will not be discussed further in this book, suffi ce it to write that fl otation technology has profi ted much from the achievements of metallurgists working in these mines.

Spectrum Series 18
F L O TAT I O N C I R C U I T S
173
Reagents
Reagents were the part of fl otation circuit operation and were investigated intensively
during the 1920s and 1930s. They had been investigated to some extent at Broken Hill
during 1902–1910 but most companies were mainly concerned with the practicalities of
mining the dumps and keeping the diffi cult fl otation process operating successfully using
reagents that worked most of the time. Reagents were more important after 1910 when
larger quantities of primary ores were fl oated and galena and marmatite had to be separated
by exploiting their differences in fl otation rates. The Minerals Separation Company, with
directors who were skilled scientists, recognised the importance of reagents in fl otation
and included them in its patents, thereby generating continuing revenue from royalties
on the sale of oils. When fl otation proved to be successful with copper sulfi des in the USA
in 1915 the circuits that were installed in plants used large amounts of oils (see Chapter 3)
and some of the companies objected to paying considerable royalties for natural oils, which
came from local products. Consequently they carried out research programs to test the
effi ciency of natural products that were not patented as collectors and frothers, and they
also made chemical compounds for this purpose. In an interview with T A Rickard in 1922
John Callow spoke about reagents:
Question: By the way, you recognise the great number of possible fl otation agents, and I presume that you tried most of them yourself?
Answer: Yes. I have tried every likely fl otation agent and a great number of unlikely ones, either in our laboratory in Salt Lake City or at our research department in the Mellon Institute in Pittsburgh. They would number many hundreds. From all those mentioned in the many patents and from others, my opinion is that it is only a matter of time when ‘oil’ (as we call it) may have to take second place as a fl otation agent (Rickard, 1922).
How right John Callow was! Reagents were investigated in the USA from the start of copper fl otation and in 1925 Cornelius Keller and Carl Lewis from the Minerals Separation Company were granted patents for the use of xanthates as collectors. It was the most important advance in fl otation since Delprat’s observation in 1902 that sulfi des could be fl oated. Xanthates proved to be selective for sulfi des and unlike natural oils were soluble, so their addition rates could be controlled precisely. Xanthates quickly captured the market and they still dominate it 80 years later. The xanthate–lime–pine oil reagent regime proved to be so valuable with porphyry coppers that it underpinned the growth of porphyry copper mining.
Chemical companies and the US Bureau of Mines (USBM) continued their research on
reagents because the growing industrial capacity of the USA during World War II increased
the demand for many minerals. Flotation was the best process for concentrating them and
many reagents had to be developed to make fl otation work successfully for many different
minerals and ores. Reagents were required for specifi c purposes. In 1944 a summary of
the characteristics and uses of 154 fl otation reagents was published by Denver Equipment
Company (Gisler, 1944) and an excerpt is given in Table 5.1.

Spectrum Series 18
H I S T O R Y O F F L O TAT I O N
174
Flotation reagent data
Reagent Description Usual method
of feeding
Usual
quantity
fed lbs/ton
Approx
price
US$/lb
Uses
Thiocar-
banilide
A white fl uff y powder
insoluble in water.
Dry to
grinding mill
0.05–0.10 0.24 A good promoter for lead, copper
and silver ores. Excellent for
selective fl otation of sulfi des.
Thiocar-
banilide
125
A cream to white dry powder. Dry or S–10%
slurry
0.05–0.10 0.30 Same general use as thiocarbanilide
but easily wettable and more
dispersible.
Tri-sodium
phosphate
Na3PO4. Water soluble. White
solid.
5–10%
solution
0.50–3.00 0.03 An alkaline detergent and water
softener useful in fl otation of non-
metallics.
Triton K-60 Dimethyl cetyl benzyl
ammonium chloride. Aqueous
solution.
Undiluted 0.10–0.30 0.50 A cationic reagent. Collector for non-
metallic minerals.
Trostol A crude tall oil product.
Approx 48% resin acids and
52% fatty acids.
Undiluted or
emulsion
0.50–2.50 0.02 A substitute for oleic and other fatty
acids as a collector for non-metallic
minerals.
TT mixture Made by dissolving not more
than 15% thiocarbanilide in
hot orthotoluidine.
Undiluted
(hot)
0.25–0.50
mixture
0.20 A good promoter of lead, copper and
silver ores. Thiocarbanilide solubility
increased in this form.
Turkey red
oil
Sulphated castor oil. Viscous. Undiluted or
emulsion
0.50–1.50 0.10 Promoter and frother similar in
action to oleic acid.
Ultrawet A petroleum monosulfonate.
Brown to cream colored
fl akes.
10–20%
solution
0.05–0.30 0.35 A wetting and dispersing agent. Also
an excellent frother-collector for talc
and steatite.
Ultrawet 40 A clear amber aqueous
solution approx 40%
ultrawet.
10–20%
solution
0.10–0.60 0.10 Same as ultrawet. Aqueous solution
more readily available at present.
Wattle bark
extract
A tannin product similar to
Quebracho.
5–10%
solution
0.05–0.30 0.10 Calcite depressant when fl oating
fl uorite with fatty acids.
Xanthate
Z-3
C2H5OSC2K. Potassium ethyl
xanthate. Yellowish gray
pellets.
10% solution 0.05–0.30 0.14 One of the most widely used
collectors for bulk fl otation of copper
and other complex sulfi des.
Xanthate
Z-4
C2H5OSC2NA. Sodium ethyl
xanthate. Pale yellow pellets.
10% solution 0.05–0.30 0.14 Same as Z-3 but preferred by some
on account of its higher xanthate
content.
Xanthate
Z-5
(C2H5)2CHOS2K. Potassium
amyl xanthate. Yellowish
brown pellets.
10% solution 0.05–0.30 0.26 A powerful collector and fl occulator
for fl otation of slow fl oating and
semi-oxidised sulfi des.
TABLE 5.1
This extract illustrates the type of information available about reagents for fl otation circuits in the mid 20th century(extract from Mineral Processing Flowsheets, published by Denver Equipment Company in 1962).

Spectrum Series 18
F L O TAT I O N C I R C U I T S
175
Clearly the comprehensive work on reagents carried out by USBM and many companies and research institutes during 30 years had established an excellent database for making choices of the reagent types and quantities that should be used for specifi c tasks.
Economics of circuits using larger cells
The economic case for high capacity circuits having larger and fewer fl otation cells seemed to be indisputable in the 1950s, but it would not be proved until they were installed in plants. Rinne and Peltola (2007) discussed the life cycle costs of larger fl otation machines in terms of energy effi ciency and selection of the optimum equipment size for a fl otation plant requiring 1800 m3 of fl otation volume. Relative investment, energy, reagent and maintenance costs are presented in Figure 5.10.
Six possible scenarios were examined:
1. 50 rows of 12 3 m3 cells,
2. 18 individual 100 m3 cells in two rows of nine,
3. nine 200 m3 cells as a single line of nine,
4. nine 200 m3 cells with variable-speed drive mechanisms enabling fi ve per cent lower rotation speed,
5. six 300 m3 cells as a single line of six, and
6. six 300 m3 cells with variable-speed drive mechanisms enabling fi ve per cent lower rotation speed.
Reagent Description Usual method
of feeding
Usual
quantity
fed lbs/ton
Approx
price
US$/lb
Uses
Xanthate
Z-6
C51111OCS2K. Potassium
pentasol amyl xanthate.
Grayish pellets.
10% solution 0.01–0.20 0.26 Collector power of the same order
as Z-S. Excellent for metallic gold
arseno-pyrite, and slow fl oating
sulfi de minerals.
Xanthate
Z-8
C4H9OSC2K. Potassium butyl
xanthate. Dark yellow pellets.
10% solution 0.01–0.20 0.22 Superior to Z-9 in collecting power.
Excellent for tarnished sulfi de
minerals or metallics.
Xanthate
Z-9
C3H7OSC2K. Potassium
isopropyl xanthate. Slightly
yellow gray pellets.
10% solution 0.05–0.30 0.18 Collector for lead-zinc-iron sulfi de
ores. Superior collecting power and
selectivity toward pyrite in cleaner
circuits.
Yellow
dextrine
A yellow amorphous powder.
A starch product.
10% solution 0.10–0.30 0.07 Slime and insoluble depressant
in fl otation of copper and other
metallic sulfi des. Add to cleaners.
Zinc hydro-
sulfi te
A water soluble white
powder.
10% solution 0.50–2.50 0.10 Depressant similar in action to
sodium sulfi te. Best in acid circuit.
Zinc sulfate A white granular, water
soluble powder.
5–10%
solution
0.50–1.50 0.05 Depressant for pyrite and sphalerite
in selective fl otation of lead, zinc,
and copper ores.
TABLE 5.1 CONT...

Spectrum Series 18
H I S T O R Y O F F L O TAT I O N
176
The trend towards larger units is obvious when looking at the comparison. As presented
in Figure 5.10, the larger cells have signifi cant advantages in capital costs. If fi ve 300 m3
cells are selected instead of 18 100 m3 cells, the initial investment cost is approximately
50 per cent lower. The economic advantages also continue in areas such as maintenance,
instrumentation and building costs since there are fewer units and the required footprint
is smaller. If the mixer speed is reduced by fi ve per cent the energy cost will reduce by
15 per cent, since the power consumption of a mixer is proportional to the third power
of the rotational speed. By the mid 1960s it was clear that fl otation machines larger than
those in common use would be available for use in new circuits and that most circuits in
the future would contain fewer cells and banks than current circuits of the same capacity.
The instruments required to control these circuits were ready for use after a long period of
development. Flotation circuits of the 1970s and later will be discussed in the next section.
FLOTATION CIRCUITS AFTER 1970
The link between copper production and the size of fl otation cells
The demand for copper grew strongly during the 20th century because of its use in the
electricity and building industries. The tonnes of copper ore processed through grinding
and fl otation circuits grew even faster because decreasing grade meant that more ore had to
be fl oated to produce the same tonnage of copper. The links between copper produced, ore
grade and tons fl oated are shown in Figure 5.11. The signifi cance of 1970 is that large mills
and cells were introduced about that time.
More fl otation capacity is used for copper sulfi des than for any other ore so it is not
surprising that the increasing size of grinding mills and fl otation cells has been driven by
the need to process increasing amounts of copper sulfi de ores. This turns attention to Chile
where copper fl otation started and where copper production grew rapidly from the 1960s.
3 m3 cells 100 m3 cells 200 m3 cells200 m3 cells,optimizedrotation
300 m3 cells300 m3 cells,optimizedrotation
94.3 7.5 8.7 9.1 7.8 8.325.7 23.3 21.3 21.3 19.3 19.351.9 12.2 9.4 9.0 9.9 9.692.4 57.0 53.0 45.5 39.4 33.8264.4 100.0 92.3 84.9 76.5 71.1LCC
Investment costsReagentsMaintenanceEnergy
0.0
50.0
100.0
150.0
200.0
250.0
300.0264.4
100.0 92.3 84.9 76.5 71.1
FIGURE 5.10
Relative life cycle costs for fl otation cell selection based on total cell volume of 1800 m³.

Spectrum Series 18
F L O TAT I O N C I R C U I T S
177
The USA was the centre of copper production and fl otation technology during 1915–1965 for several reasons:
• the demand for copper by its electrical and manufacturing industries was high,
• it had large reserves of accessible porphyry copper ores,
• fl otation was essential for producing copper concentrates from these ores, and
• the industry was served by progressive companies that manufactured chemicals and equipment for fl otation and grinding and carried out extensive research work to support their own products.
The spectacular growth in the demand for copper worldwide from 1970 (see Figure 5.11) and the depletion of reserves in the USA meant that Chile became the leader in copper production because of its huge reserves of low-grade porphyries.
The decline and rise of copper in Chile is part of the story of copper fl otation. Chile was the largest copper producer in the world from the 1850s to 1880s when world consumption was estimated to average 200 000 tons per year, but its share declined from 30 per cent in 1879 to fi ve per cent in 1902 when world consumption was 555 000 tons. The decline in Chile from 51 803 tons in 1869 to 20 253 tons in 1892 (Wikipedia, 2009b) was due to the depletion of high-grade reserves and the growth of nitrate mining in the Atacama desert which took the capital and the skills that might have been available for copper mining. El Teniente’s successful venture into fl otation in 1912 and the start of copper oxide leaching at Chuquicamata in 1915 renewed Chile’s copper industry and it grew to the point at which it consistently produced 11–13 per cent of world output, rising from 363 000 tonnes in 1950 to 1 068 000 tonnes in 1980. In 1976 the state-owned Corporacion Nacional del Cobre de Chile (Codelco) was formed to manage production from its main mines El Teniente, Chuquicamata and Andina, and in the late 1970s foreign companies started to invest in copper mining. By 1998 Chile had 34 per cent of the world’s reserves of copper and produced 30 per cent of the world’s copper. Figure 5.12 shows how Chile became the world leader in copper production during the 1990s and also shows the link between world copper production and maximum cell size.
0
5
10
15
20
25
Year
World production(Million tonnes)
Tonnes milled(x100Million)
Averageoregrade(% Cu)
FIGURE 5.11
Copper produced, ore fl oated and grade of copper ore mined during 1880–2007.

Spectrum Series 18
H I S T O R Y O F F L O TAT I O N
178
Circuits used in copper plants after the introduction of larger fl otation cells in 1972 will be described in case studies. The plants discussed are at Bougainville Island in Papua New Guinea, where the fi rst large cells were used in a plant that fl oated 90 000 tons per day, and at Bingham Canyon in the USA and El Teniente in Chile, where large cells added a new chapter to the story of fl otation processes that had been operating in those plants for 70 years.
Bougainville Copper Limited
Bougainville Copper Ltd was the fi rst company to build a high capacity fl otation circuit using
cells that were much larger than those previously used. In 1964 porphyry copper ore was
discovered at 600 m elevation in a mountainous region on Bougainville Island and drilling
indicated 900 million tons of ore assaying 0.48 per cent copper and 0.55 grams per ton of
gold. Profi table operation required that mining and milling should be high capacity and that
large equipment should be used. Consequently the 90 000 tons per day plant, which started
in April 1972, was the largest copper concentrator to be designed and constructed at the same
time. The fl ow sheet of the fl otation circuit is shown in Figure 5.13. The equipment in the
concentrator was the largest used in the world at the time – eight ball mills (5.5 m by 6.4 m,
4250 hp) for grinding and 108 Denver 17 m³ cells for rougher and scavenger fl otation. The
big ball mills did not perform to plan so an extra mill was installed to achieve the required
feed rate. Cells used in the 1972 circuit were as shown in Table 5.2.
The Denver 600-H-D-R cells, which were back-to-back Denver 300 cells with two
mechanisms, operated effi ciently from the start. With their success the era of large fl otation
cells had arrived and the maximum size was then increased systematically, reaching
300 m3 by 2006. The capacity of the Bougainville concentrator continued to increase and
by 1989 150 000 tons per day of ore were being processed in 13 primary mills and four
additional rougher banks, which each consisted of nine Outokumpu OK38 cells. Operations
at the Bougainville concentrator confi rmed that high capacity plants and large processing
equipment were the future for porphyry copper ores. The plant site is shown in Figure 5.14.
The building was 310 m long by 40 m wide and the tons per day per square metre was much
higher than could be obtained with small cells, which is always important in diffi cult terrains.
0
6000
12000
18000
1940 1960 1980 2000 2020
Years
Copp
erProd
uction
,Th
ousand
Tonn
es
0
20
40
60
ChileanParticipation,%
World
Chilean
Chilean Participation
0
100
200
300
400
0
4
8
12
16
Maxim
umCellSizeCo
pper
Prod
uction
Year
Copper production (Mt)
Maximumcell size (m³)
FIGURE 5.12
The rise of Chile as a copper producer (left). Copper production and maximum size of fl otation cells (right).

Spectrum Series 18
F L O TAT I O N C I R C U I T S
179
KENNECOTT UTAH COPPER
The growth of the Magna and Arthur plants from a combined capacity of 9000 tons per day
in 1910 to 110 000 tons per day in 1960, with the addition of molybdenum fl otation circuits,
was discussed in an earlier section on the Utah Copper Company and Kennecott Copper
Corporation. The high capacity in the 1930s was timely since it enabled Kennecott Utah
FIGURE 5.13
The fl otation circuit at Bougainville during plant start-up in 1972 (Tilyard, 1978).
Cells Size m3 Number Banks
Rougher-scavenger 17 108 6
Cleaner 1.8 39 3
Recleaner 2.8 26 2
Tertiary cleaner 5.7 13 1
Davcra no 480 1
Scavenger retreatment Converted tertiary cleaners
Scavenger-cleaners 2.8 52 4
TABLE 5.2
The cells used in fl otation circuits at Bougainville Copper Ltd in 1972 (Tilyard, 1978).
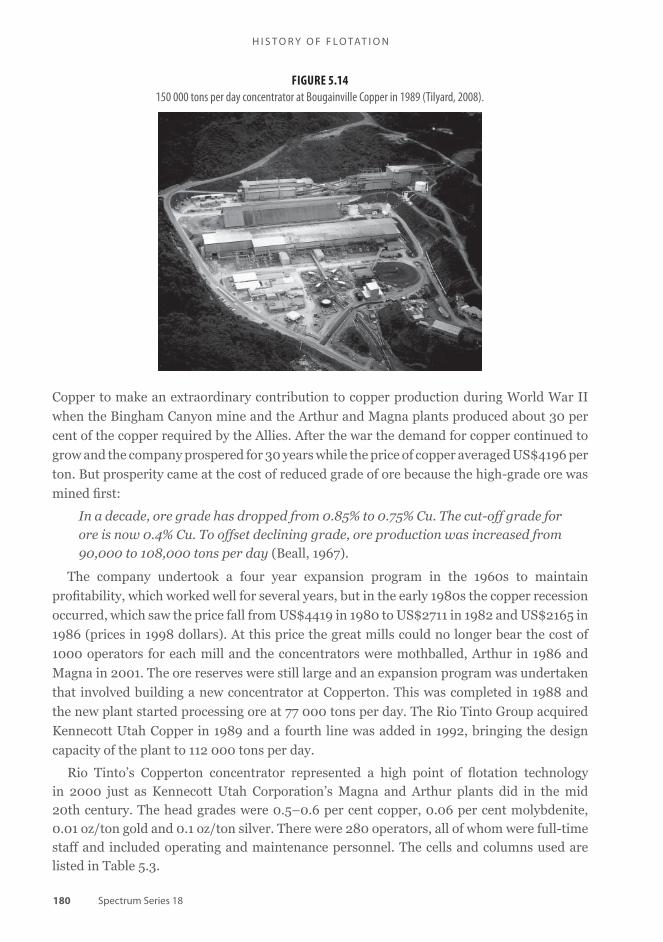
Spectrum Series 18
H I S T O R Y O F F L O TAT I O N
180
Copper to make an extraordinary contribution to copper production during World War II
when the Bingham Canyon mine and the Arthur and Magna plants produced about 30 per
cent of the copper required by the Allies. After the war the demand for copper continued to
grow and the company prospered for 30 years while the price of copper averaged US$4196 per
ton. But prosperity came at the cost of reduced grade of ore because the high-grade ore was
mined fi rst:
In a decade, ore grade has dropped from 0.85% to 0.75% Cu. The cut-off grade for ore is now 0.4% Cu. To offset declining grade, ore production was increased from 90,000 to 108,000 tons per day (Beall, 1967).
The company undertook a four year expansion program in the 1960s to maintain
profi tability, which worked well for several years, but in the early 1980s the copper recession
occurred, which saw the price fall from US$4419 in 1980 to US$2711 in 1982 and US$2165 in
1986 (prices in 1998 dollars). At this price the great mills could no longer bear the cost of
1000 operators for each mill and the concentrators were mothballed, Arthur in 1986 and
Magna in 2001. The ore reserves were still large and an expansion program was undertaken
that involved building a new concentrator at Copperton. This was completed in 1988 and
the new plant started processing ore at 77 000 tons per day. The Rio Tinto Group acquired
Kennecott Utah Copper in 1989 and a fourth line was added in 1992, bringing the design
capacity of the plant to 112 000 tons per day.
Rio Tinto’s Copperton concentrator represented a high point of fl otation technology in 2000 just as Kennecott Utah Corporation’s Magna and Arthur plants did in the mid 20th century. The head grades were 0.5–0.6 per cent copper, 0.06 per cent molybdenite, 0.01 oz/ton gold and 0.1 oz/ton silver. There were 280 operators, all of whom were full-time staff and included operating and maintenance personnel. The cells and columns used are listed in Table 5.3.
FIGURE 5.14
150 000 tons per day concentrator at Bougainville Copper in 1989 (Tilyard, 2008).

Spectrum Series 18
F L O TAT I O N C I R C U I T S
181
Ore processing at Bingham Canyon has travelled a long distance from the original small
gravity mill built at the start of open pit mining in 1905. Milestones along the way included:
• the 300 tons per day gravity mill proved that the copper minerals could be concentrated by gravity, albeit with low recovery;
• the ‘twin’ plants at Magna and Arthur and power shovel mining in the open pit operated together and produced high throughputs and high profi ts;
• fl otation improved recoveries by 20 per cent;
• the plants grew incrementally to 50 000 tons per day each; and
• new circuits were devised to fl oat molybdenite from copper tailings and copper from plant tailings.
EL TENIENTE
By the end of the 20th century many of the world’s great copper fl otation plants were located
in Chile. Flotation at El Teniente in 1912 was discussed briefl y in Chapter 3 because it was at
El Teniente that copper fl otation started on an industrial scale. That circuit set the precedent
for large-scale copper fl otation; it has continued without pause at El Teniente and its extensive
use in Chile by many mining companies led to Chile becoming a world leader in fl otation and
to the process emerging as one of the world’s great technologies. The El Teniente plants will
be discussed in this section to recognise the historic contribution of the Braden company and
Codelco El Teniente to copper fl otation during 100 years.
William Braden, an American mining engineer, started the El Teniente mine in 1904 and
built a gravity mill to process 250 tons per day in 1906. It was located between the Teniente
and Coya rivers to ensure a supply of water for gravity concentrators and was 2.5 km from
the mine. The plan was to commission the mill on 1 June 1906 and the deadline was met
despite the fact that the equipment had to be shipped to Valparaiso from the USA, taken by
two rail systems to Santiago and the mine region, and hauled by muscle power up slopes
of 45° to a 2400 m high site. Ore was transported to the mill from the mine by overhead
buckets. The mill had a workforce of 100 people and from the fi rst day of operation it worked
continuously. But copper recovery was only 50 per cent from 3.4 per cent copper ore and not
much profi t would have been made because the revenue was small and expenses were high
in that remote and mountainous region.
Bulk fl otation Moly plant
Roughers 6 rows – 69 × 300 ft3 (85 m3) 7 × 500 ft3 + 4 × 300 ft3
Rougher-cleaner columns 2 – 4.5 m × 9.5 m
Cleaner cells 10 × 500 ft3
Cleaner columns 4 – 4.5 m × 9.5 m (2 stages) + 2 × 300 m3 13 × 3 ft, 11 × 5 ft, 1 × 7 ft (6 stages)
Mechanical scavenger cells 6 – 130 m3 tank cells 10 × 180 ft3
TABLE 5.3
Flotation cells and columns at Rio Tinto’s Copperton concentrator (Kashuba, 2008).

Spectrum Series 18
H I S T O R Y O F F L O TAT I O N
182
In 1912 Marcus Chiapponi, the engineer who advised William Braden to invest in El Teniente, recommended that fl otation should be investigated and tests in London showed that it increased recovery by 20 per cent. This prediction became reality when a Minerals Separation plant was installed in 1912 to fl oat 400 tons per day of ore. The predicted
FIGURE 5.15
Evolution of fl otation at Bingham Canyon: 300 tons per day gravity plant built in 1903 (top left),Arthur 1918 (top right), Arthur 1963 (middle), Copperton plant in 2007 (~120 000 t/d) (bottom).

Spectrum Series 18
F L O TAT I O N C I R C U I T S
183
improvement in recovery was achieved, the plant was expanded to 600 tons per day and in 1913 a new mill was built further up the mountain with 3000 tons per day capacity. Both fl otation and gravity circuits were used for concentration, the new plant containing six 600 tons per day fl otation units.
Electric power was a problem but the Chilean engineers were resourceful. They built a reservoir 3 km from the mill and brought water from it in 22 inch diameter pipes to a location where a 350 m high waterfall could be built and the falling water used to drive two 42 inch diameter Pelton wheels, which each provided 330 horsepower to the mill and to the town of Sewell. The Pelton wheels and the Hardinge ball mills used in the gravity concentrator were both recent inventions and their use indicates that interest in better technology was part of the engineering culture at El Teniente from the start of operations. The metallurgical results achieved at Sewell before and after the use of fl otation are recorded in Table 5.4. The increase from 59.4 per cent in 1912 in a gravity-only plant to 79.0 per cent in 1916 in a gravity–fl otation plant left no doubt that concentration in the future would include fl otation. The fl otation circuit in the 3000 tons per day plant consisted of Minerals Separation cells built from wood, and grinding was carried out in the Hardinge ball mills and Chilean roller mills. Dorr classifi ers had recently been invented but classifi cation was not used immediately at El Teniente so the mill feed would have contained coarse middling particles, which would have affected results adversely.
The plant built in 1913 was used for many years, although circuits were expanded and equipment was changed to handle the continuing increase in throughput. There was a sharp fall in the price of copper in 1914 but the mill kept operating, although foreign experts were
FIGURE 5.16
Flotation circuits in the new Copperton plant of Kennecott Utah Copper.

Spectrum Series 18
H I S T O R Y O F F L O TAT I O N
184
FIGURE 5.17
Hardinge ball mills and Minerals Separation fl otation cells operating at El Teniente in 1939.
Tonnage Head Concentrate Tail
Year Annual Daily % Cu % Cu % Insol % Cu % Recovery
1911 49 650 136 2.97 16.20 1.33 60.0
1912 363 905 997 2.58 17.65 1.30 59.4
1913 785 075 2151 2.25 17.15 0.73 67.6
1914 900 299 2464 2.12 16.33 29.6 0.52 72.6
1915 1 195 858 3276 2.11 18.34 25.2 0.48 76.3
1916 1 362 629 3733 2.13 19.51 23.4 0.45 79.0
1917 1 799 694 4931 2.32 21.44 22.0 0.43 81.6
1918 1 962 955 5378 2.48 21.18 21.9 0.44 83.9
1919 1 176 794 3534 2.16 20.21 21.1 0.40 83.0
TABLE 5.4
Metallurgical results at El Teniente before and after the use of fl otation in 1913 (Sutulov, 1978).
sent home. In 1915 a sulfuric acid plant was built to ensure its continuous supply, although the plan to use surplus sulfuric acid to leach ores never eventuated. As at Broken Hill the sulfur gases came from roasting concentrates.
Flotation was soon recognised to be the key to the future of El Teniente; without it the growth of copper production, which occurred after 1915, would not have been possible. At that time El Teniente was the major copper producer in Chile and because of the success of fl otation the company led the resurgence of the industry. Eventually all sulfi de plants in Chile were designed around the fl otation circuits.
In the 1950s the Minerals Separation cells in the El Teniente mill were replaced by 60 ft3 Fagergren cells and by 1965 the company was fl oating 30 000 tons per day of ore and producing 90 000 tons per annum of copper. The steep mountainside containing the mill and the town of Sewell was crowded, as shown in Figure 5.18, and there was no scope for further expansion. Access to the mill and town by 14 000 residents was restricted with no roads in the town and travel being by foot or by the moving walkway shown on the right side of the photo. Another increase in production was planned in 1965 and it was clear

Spectrum Series 18
F L O TAT I O N C I R C U I T S
185
FIGURE 5.18
The evolution of the copper fl otation plant at El Teniente. Sewell in 1970 (top). The mill operated at full capacity with no scope for building expansion. Sewell was known as the town of stairs; it was so steep that roads for motorised transport were out of the
question. A moving bridge on railway on the right provided transport of heavy equipment up the mountain. In 2010, 20 mills in the plant ground 15 000 tons per day of ore effi ciently and without control instruments. Colon concentrator in 2008 (bottom). The
process in the older building (lower right) uses conventional ball mills and fl otation cells; the process in the newer building (centre) uses SAG and tower mills, columns and conventional fl otation cells.
Period 1901–1925 1926–1950 1951–1975 1976–2000
Cu produced (×103 Mt) 1754 8397 14 781 45 760
* Mining started at Chuquicamata in 1915 but it was 1951 before fl otation and smelting were introduced.
TABLE 5.5
Production of copper in Chile in 25 year periods from 1901 to 2000* (Sutulov, 1978; Cochilco, 2010).

Spectrum Series 18
H I S T O R Y O F F L O TAT I O N
186
MUESTRAS COLA FLOT. PRIMARIA
A ANALIZADORDE LEYES (Ef)
A ANALIZADOR DE LEYES ( E f )
RECHAZO 3
A ESPESADORES DE RELAVES
A ANALIZADORDE LEYES ( E f )
CONCENTRADO A PLANTAFLOTACION SELECTIVA
RECHAZO 1A FLOT. PRIMARIA
RECHAZO 2A REMOLIENDA
RECHAZO 3A COLA FINAL
MUESTRAS COLAFLOT. LIMPIEZA
MUESTRA CONC.FINAL
MUESTRAS CONC.FLOT. PRIMARIABANCOS 1-2 / 3-4
MUESTRACOLA BARRIDO
MUESTRACOLA FINAL
ANALIZADORDE LEYES
DE MOLIENDA SAG 2
AGUA
LECHADA DE CAL
RECHAZO 1
A ANALIZADORDE LEYES (Ef) A ANALIZADOR
DE LEYES (Ef)
CELDAS DE FLOTACION PRIMARIA320-CF-01 / 28
PRIMARY FLOTATION
CONCENTRATE REGRINDING
HIDROCICLONES320-CS-09
HIDROCICLONES320-CS-08
HIDROCICLONES320-CS-07
BOMBA320-PP-37
BOMBA320-PP-38
BOMBA320-PP-39
MOLINO VERTICAL320-ML-10
MOLINO VERTICAL320-ML-09
MOLINO VERTICAL320-ML-08
BOMBA320-PP-34 / 36
BOMBA320-PP-31 / 32
BOMBA320-PP-33 / 35
ANALIZADOR EN LINEA
ANALIZADOR EN LINEA
ANALIZADOR EN LINEA
ANALIZADOR EN LINEA
SCAVENGERFLOTATION
CELDAS DE FLOTACION320-CF-29 / 42
CAJON320-DI-07
CAJON320-ZM-13
CORTADOR DE MUESTRAS320-SA-03
A ANALIZADORDE LEYES (Ef)
CAJON320-DI-09
BOMBA320-PP-29 / 30
ANALIZADOR EN LINEA
CORTADOR DE MUESTRAS320-SA-04
COLECTOR
BOMBA320-PP-19 BOMBA
320-PP-20
BOMBA320-PP-21
CAJON320-DI-12
CELDAS COLUMNAS320-CM-03 / 04
CELDAS COLUMNAS320-CM-01 / 02
CLEANER FLOTATION
COMPRESOR320-CP-05 / 07
BOMBA DE PISO320-PP-23 / 24
CAJON320-ZM-09
CORTADOR DE MUESTRAS320-SA-02
DE MOLIENDA SAG 1
CORTADOR DEMUESTRAS320-SA-01
CAJON320-DI-05
ANALIZADOR EN LINEA
ANALIZADOR EN LINEA
CAJON320-ZM-07
BOMBA DEPISO320-PP-25 / 26
CAJON320-DI-11
MUESTRA ALIMENTACION FLOTACION PRIMARIA
320-ZM-04 / 05 / 06
A ANALIZADORDE LEYES (Ef)
OPERACION NORMAL PLANTA DE FLOTACION COLECTIVA SAG, AREA 320
FIGURE 5.20
The fl otation circuits at Colon.
FIGURE 5.19
The grinding circuits in the Sewell (15 kilotons per day) and Colon (126 kilotons per day) concentrators. At Colon 47 kilotonsper day is ground in ball mills in the old concentrator and 65 kilotons per day in SAG mills in the new concentrator.

Spectrum Series 18
F L O TAT I O N C I R C U I T S
187
that this could only be achieved by moving the plant from Sewell. Consequently, a new concentrator was built at Colon, which was several kilometres distant from Sewell and in a less mountainous terrain. The township was also moved to the city of Rancagua. A project of this magnitude could only happen in stages over a long period and in 2005, when it was complete, 140 000 tons per day of ore could be fl oated in circuits equipped with SAG, ball and tower mills for grinding and mechanical cells and columns for fl otation. The production of copper ore at Colon by 2007 was 500 000 tons per annum. The Colon concentrators and fl ow sheets are shown in Figures 5.19 and 5.20.
REFERENCES
AusIMM Broken Hill Branch, 1930. The development of processes for the treatment of crude ore, accumulated dumps of tailing and slime at Broken Hill, New South Wales, AusIMM Proceedings, 80:380–444.
Barker, E E, 1928. Flotation and the Utah copper mine, in Flotation Practice, papers and discussions presented at meetings held in Salt Lake City, August 1927, and New York, February 1928, pp 19-20 (American Institute of Mining, Metallurgical and Petroleum Engineers: New York).
Behrend, G M, 1978. Mill instrumentation and process control in the Canadian mining industry, in Milling Practice in Canada, pp 23–44 (Canadian Institute of Mining and Metallurgy: Montreal).
Braes, J R, 2008. Personal communication.
Burch, H K, 1917. Mine and mill plant of the Inspiration Consolidated Copper Co, AIME Transactions, 55:707–740.
Cochilco (Comision Chilena del Cobre), 2010. Producion Mundial y Chilena de Cobre de Mina Porcentaje y Tonelaje.
Denver Equipment Company, 1962. Mineral Processing Flowsheets, pp 30, 102 (Denver Equipment Company: Denver).
Gahl, R, 1917. History of the fl otation process at Inspiration, AIME Transactions, 55:576–645.
Gisler, H J, 1944. Flotation reagents, Deco Trefoil, September, pp 3–12 (Denver Equipment Company: Denver).
Hyde, J M, 1912. Art of concentration of mineral substances, US Patent 1022085, 2 April.
Joralemon, I B, 1973. Copper. The Encompassing Story of Mankind’s First Metal, pp 234–244 (Howell-North Books: Berkeley).
Kennecott Copper Corporation, 1975. Kennecott Copper Corporation, fl ow process data, Utah Copper Division (unpublished).
Laist, F and Wiggin, A E, 1917. Flotation concentration at Anaconda, Mont, AIME Transactions, vol 55.
Mathewson, E P, 1916. Flotation at Washoe reduction works, Anaconda, in The Flotation Process (ed: T A Rickard) (Mining and Scientifi c Press: San Francisco).
Parsons, A B, 1933. The Porphyry Coppers, p 71 (American Institute of Mining, Metallurgical and Petroleum Engineers: New York).
Rey, M, 1979. Memoirs of milling and process metallurgy: 2 – Flotation of sulphide ores, Transactions of the Institution of Mining and Metallurgy, March, pp C1–C6.
Rickard, T A, 1922. Interviews with Mining Engineers, pp 134–147 (Mining and Scientifi c Press: San Francisco).
Rinne, A and Peltola, A, 2007. On lifetime costs of fl otation operations, paper presented at Flotation ’07 Conference, Cape Town, November (Minerals Engineering).

Spectrum Series 18
H I S T O R Y O F F L O TAT I O N
188
Ruggles, G H and Adams, H F, 1928. Recent fl otation practice at Inspiration, Arizona, in Flotation Practice, papers and discussions presented at meetings held in Salt Lake City, August 1927, and New York, February 1928, pp 133–150 (American Institute of Mining, Metallurgical and Petroleum Engineers: New York).
Simons, T, 1917. The concentrator of the Timber Butte Milling Co, Butte, Mont, AIME Transactions, 55:910–931.
Sutulov, A, 1978. Chilean Mining (Mining and Metallurgical Research Center: Santiago).
Taggart, A F, 1945. Handbook of Mineral Dressing, pp 11–130 (John Wiley & Sons, Inc: New York).
Tilyard, P A, 1978. Bougainville Copper Limited fl otation circuit: Recent improvements and current investigations, Transactions of the Institution of Mining and Metallurgy, 87:C5–15.
Tilyard, P A, 2008. Private communication.
Wearing, T R and Coleman, R L, 1957. Gaspe Copper Mines Ltd, in The Milling of Canadian Ores, p 186 (Sixth Commonwealth Mining and Metallurgical Congress: Canada, printed by Northern Miner Press Ltd: Toronto).
Wikipedia, 2009a. Canadian Pacifi c Railway [online]. Available from: <http://en.wikipedia.org/wiki/Canadian_Pacifi c_Railway>.
Wikipedia, 2009b. Chilean nationalization of copper [online]. [Accessed: 24 October 2009]. Available from: <http://en.wikipedia.org/wiki/Chilean_nationalization_of_copper>.
Wikipedia, 2009c. Urban neighbourhoods of Sudbury [online]. Available from: <http://en.wikipedia.org/wiki/Copper_Cliff,_Ontario#Copper_Cliff>.

Spectrum Series 18 189
INTRODUCTION
Non-metallic minerals cover a wide range of minerals which are used in many applications. Many of the production processes involve fl otation. Major milestones in the history of industrial mineral fl otation are given in Table 6.1.
C H A P T E R 6
Industrial Minerals
Year Mineral Comments
1877 Graphite Bessel bulk oil process
1914–1918 Graphite Widespread adaptation and growth of graphite fl otation
1916 Limestone Accidental fl otation of calcium carbonate from zinc carbonate with oleic acid
1921 Fluorspar Intermittent commercial operation by Consolidated Mining and Smelting Co
1921 Phosphate Walter and Edwin patent
1924 Copper carbonate Sulman and Edser patent for fl otation with fatty acids
1925 Limestone Recovery of limestone from iron ore tailings with oleic acid and cresol
1927 Phosphate Phosphate Recovery Corp successful fl otation trials
1927 Fluorite Laboratory fl otation by US Bureau of Mines and Franklin Fluorspar Company
1928 Phosphate First pilot operation by International Minerals and Chemicals Corp, Florida
1928 Barite New Jersey Zinc Company patent by Borcherdt
1929 Phosphate First commercial fl otation plant
1929 Manganese Flotation of rhodochrosite by Anaconda Company
1929 Fluorite Flotation in Russia. Commercial fl otation by Aluminium Company of America
1929–1932 Graphite Collapse of graphite fl otation during the Great Depression
1932 Potash Weinig fl otation process
1932 Limestone Valley Forge Cement Company experimental program
1932 Feldspar Soap fl otation
1932 Quartz Soap fl otation
1932 Mica Soap fl otation
TABLE 6.1
Major milestones in the history of industrial mineral fl otation.

Spectrum Series 18
H I S T O R Y O F F L O TAT I O N
190
The fl otation of industrial minerals had the highs and lows that were always part of new
fl otation processes, but space requires that only a few minerals can be discussed. Those
reviewed in this chapter are graphite and talc, which are natural fl oaters; limestone and iron
ore, which are high volume minerals; phosphate and potash, which are agricultural minerals,
and feldspar, barite and fl uorspar, which are widely used in secondary industry. There was a
20 year gap between the fl otation of industrial and sulfi de minerals, with industrial minerals
following a similar timeline to that of coal. The reasons for the gap can be attributed to the low
value of industrial minerals, which could not handle the cost of fl otation, and the prior need
to develop reagents for the variety of sulfi de minerals that were available. The low value of
industrial minerals meant that only high-grade deposits were mined and mining operations
were often in the hands of men with signifi cant practical ability but little or no technical or
other training. They had little money to spend on plant, equipment or new technologies such as
fl otation, and there was little transfer of knowledge between the ‘metals’ and the ‘non-metals’.
Industrial minerals have been classifi ed in many ways, as oxides, carbonates, silicates, non-metallic minerals, construction minerals, etc. These classifi cations have in some part
Year Mineral Comments
1933 Limestone Breerwood limestone fl otation patent for manufacture of cement
1933 Manganese Flotation of manganese oxide by Cuban Manganese Corp
1933 Phosphate Crago patent
1933 Barite Flotation in French Morroco using corn oil
1934 Limestone Commercial limestone fl otation by Valley Forge Cement Company
1934 Iron ore Gaudin patent for fl otation of haematite
1934–1935 Mineral sands Patents by Corbett and Zircon Rutile
1935 Talc Industrial fl otation by Valley Forge Cement Company
1935 Mica Industrial fl otation by Valley Forge Cement Company
c 1935 Mineral sands Commercial fl otation plants in Australia
1936 Spodumene Laboratory fl otation by US Bureau of Mines
1940 Potash Commercial operation by Potash Company of America
1942 Phosphate First commercial Crago fl otation plant
1944 Magnesite Weinig patent by Basic Magnesite Inc
1945 Iron ore De Vaney patent for magnetite fl otation
1946 Feldspar First commercial fl otation plant
1954 Iron ore First all fl otation plant by Humboldt Mining Company
1956 Bauxite Russell and Kennedy patent
1961 Kaolin Greene et al patent for carrier fl otation
Engelhard Corporation commence commercial operation using carrier fl otation
1969 Kaolin English China Clay International develop carrierless fl otation
1985 Kaolin Freeport Kaolin TREP fl otation process
TABLE 6.1 CONT
Spectrum Series 18
I N D U S T R I A L M I N E R A L S
191
been responsible for the varied history of industrial mineral fl otation since engineers have tended to concentrate on individual minerals when developing plant processing systems. To quote Nagaraj, Day and Gorken (1999):
The practice of nonsulfi de minerals fl otation can best be characterized as an
evolutionary blend of scientifi c theory and art. Although extensive fundamental
studies have been carried out in the past several decades, and signifi cant theoretical
aspects have been developed, plant practice has developed as an art form, often
ahead of the theory, which is somewhat in contrast to sulfi de minerals fl otation.
A paradox is that minerals rejected to tailing in sulfi de fl otation often represented the valuable mineral to be recovered as industrial minerals, and new reagents were necessary to fl oat them. The selectivity of sulfi de fl otation improved when soluble anionic collectors such as xanthates or phosphocresylates were developed, and attempts could then be made to recover industrial minerals using soaps or fatty acids as collecting agents. This procedure worked well for calcite, dolomite and other minerals that could form insoluble soap fi lms. The development of long-chain anionic and cationic reagents provided the fi nal stage in the successful fl otation of industrial minerals (Ralston, 1937).
World history has played its part in industrial mineral fl otation. World War II saw a
major increase in research on the fl otation of minerals, which had a strategic value in the
war effort, for example strontium salts found many vital wartime uses, one being the use of
strontium oxalate in tracer bullets to control the burning rate of the tracer mixture. It was
shown possible to produce a high-grade concentrate of celestite at high recovery by a simple
roughing and cleaning operation with sodium silicate, oleic acid and pine oil (Ralston, 1937).
Recent technological advances that require new substances or higher purity additives have also been a driving force in industrial mineral fl otation. A current objective in industry is ensuring that the quality of mineral products meet very stringent specifi cations, a few examples being alkaline processes for paper making, which require calcium carbonate with high brightness and uniform particle size; advances in the paint, adhesives, and sealants industry, which demand much better mineral products for pigments, extenders and fi llers; high-performance abrasives; ultrafi ne particles processed to closely defi ned particle sizes; permanent magnetic materials; and high-purity quartz for fi bre optics and electronics (Nagaraj, Day and Gorken, 1999).
NATURAL FLOATERS – GRAPHITE AND TALC
Graphite
Graphite and talc are naturally hydrophobic and can be classifi ed as ‘natural fl oaters’. They respond to almost any type of fl otation reagent, and have been concentrated by fl otation since the earliest days of the process. In fact, as described in Chapter 1, graphite was the fi rst mineral fl oated on a commercial scale. It was an important mineral then but it is far more important now because of its use in numerous industrial products including refractories, crucibles and lubricants. It is also troublesome in many fl otation pulps because it rubs on

Spectrum Series 18
H I S T O R Y O F F L O TAT I O N
192
other minerals and gives them a coating that causes natural fl otation. Until World War I graphite fl otation was a bulk oil process and then interest turned to froth fl otation. It may have been true that ‘The best concentration process for graphite ores is without doubt the froth fl otation process’ (Von Der Weid, 1946), but froth fl otation was not without its diffi culties. It was successful as a roughing process but the repeated recleaning process necessary to make refi ned graphite using soluble reagents and depressants was never properly worked out (Ralston, 1937). A variety of machines was used for graphite fl otation in its early years when bulk oil, froth fl otation and fi lm fl otation processes were used. The fi lm fl otation cells were cones with peripheral overfl ows in which dried ore was distributed onto the surface of the water by rotating disks with no reagents being added. Flake graphite fl oated as a fi lm with some fi ne silica and dewatering screens separated the fl ake. Unit capacities were low but good results were obtained (Barr, 1946). Pneumatic cells were preferred to agitated cells by some companies for froth fl otation due to concerns that the latter would break up larger fl ake, but since the 1980s the ease with which graphite is fl oated has led to the increasing use of fl otation columns.
As with many low value industrial minerals, graphite was highly susceptible to economic downturns. During the 1920s most operations were profi table, with concentrates selling for nine to ten cents per pound; however, with the fall in prices that accompanied the Great Depression many operations in the USA became uneconomical and were closed down, in particular those which used the more expensive bulk oil process. There were intermittent attempts to revive the graphite industry in the late 1930s but the last operation in Alabama where graphite mining had been strong, closed in 1953 and graphite mining in the USA ceased in 1980.
Germany, the fi rst country to fl oat graphite, has continued the long tradition of graphite fl otation to this day. The Bavaria area supposedly produced graphite that was made into
0
500
1,000
1,500
2,000
2,500
3,000
3,500
4,000
4,500
5,000
1900 1910 1920 1930 1940 1950 1960 1970 1980 1990 2000Year
Mar
ket P
rice
(199
8 U
S$
/ t)
0
200,000
400,000
600,000
800,000
1,000,000
1,200,000
Wor
ld G
raph
ite P
rodu
ctio
n (t)
Market Price World Production
FIGURE 6.1
World production and market price of graphite during the 20th century.

Spectrum Series 18
I N D U S T R I A L M I N E R A L S
193
the crucibles of alchemists during the Middle Ages. Graphitwerk Kropfmuhl started mining graphite ore in Bavaria in 1870 to produce graphite for use in crucibles, pencils and lubricants and eventually achieved grades up to 93 per cent carbon by processing the ore through a number of grinding and fl otation stages. The simplicity of graphite fl otation allowed it to be installed in many countries with good reserves of graphite ore, whether or not they had a tradition of skills in mineral processing technology. In one mine in Madagascar crude ore averaging ten per cent carbon was crushed through roll crushers and after classifi cation the –6.35 mm material was fl oated with pine oil in roughing and cleaning stages to produce a concentrate of 80 to 84 per cent carbon. Reground and fl oated concentrates could achieve 90 per cent carbon grade.
Talc
Talc has been a valuable commodity for over 100 years, with a current world production rate of nine million tonnes per annum. Uses of ground talc and pyrophyllite are ceramics (33 per cent), paint (20 per cent), paper (16 per cent), roofi ng (eight per cent), plastics (fi ve per cent), rubber (three per cent), cosmetics (one per cent) and miscellaneous (14 per cent) (Virta, 2008). But talc is a contaminant in many fl otation processes, reducing the quality of concentrate in base metals operations and causing viscous slag complications in smelting plants. Talc, like graphite, is naturally fl oating and responds to almost any type of fl otation reagent, so its concentration by fl otation has been attempted in an ad hoc manner since the early years. Until the 1930s little or no attempt was made to concentrate talc rock by ore dressing methods, the customary method of preparation being selective mining when necessary, followed by crushing and grinding dry to 200-mesh or fi ner by pebble mills in closed circuit with air separators. In certain instances a moderate degree of concentration was obtained by rejecting the separator tailings. Although the talc recovery was low the procedure was justifi ed because it enabled the operator to meet demands for specifi c grades. The disposal of the separator tailings containing 30 to 40 per cent talc became an increasingly serious issue as the demand for the higher grades increased, because in some instances as much as three tons of talc rock was required to produce one ton of the desired grade concentrate. The two tons accruing as a low-grade product had relatively little value and were diffi cult to market (Gnam and Cornthwaite, 1937).
Flotation promised a means to eliminate undesirable impurities from the rejected material and yield a product from higher grade talcs with better texture and ‘feel’. To fl oat talc was easy; to produce a high-quality concentrate was another matter. In the early 1930s in England, the General Electric Company successfully separated talc and magnesite in a soapstone by fl otation using terpineol with oleic acid and lead nitrate, which formed hydrophobic lead oleate. The concentrate contained 97.5 per cent talc and 2.5 per cent magnesite. In the African Sudan, Tanganyika Concessions Ltd is reported to have produced talc concentrates from magnesite-talc rock (Emery and Stoddard, 1935). By 1935 the benefi ciation of non-metallics was becoming so important that it was natural that the talc industry started to show serious interest in fl otation. The Eastern Magnesia Talc Company at Johnson, Vermont, began experiments with froth fl otation in 1934 and in cooperation with the Bureau of Mines developed a reclamation process to recover talc from waste material. The history

Spectrum Series 18
H I S T O R Y O F F L O TAT I O N
194
of talc mining in the area dated back over 100 years, with soapstone being quarried in the 1800s for stoves and heating utensils, and production of talc powder beginning in 1904. The fl otation plant reprocessed both plant and accumulated tailing at the rate of 30 tons a day. The talc was so fl oatable with ordinary fl otation reagents that the depression of magnesite that occurred with the talc was critical and with wet grinding it was possible to make 90–95 per cent talc concentrate by using pine oil and kerosene through a wide pH range of 5.5 to 12, with sodium silicate depressing the magnesite. Eventually, froth fl otation made possible the economical recovery of 95 per cent talc from dry plant tailings. Meanwhile, in Canada, the Canadian Department of Mines successfully reduced the lime content of a soft white talc containing dolomite from 5.7 per cent to less than 0.5 per cent by fl otation, using soda ash in the pebble mill and potassium xanthate and water glass in a subaeration fl otation cell (Emery and Stoddard, 1935; Gnam and Cornthwaite, 1937).
One of the more fascinating talc fl otation studies of the 1930s was by the Bureau of Mines in cooperation with the W H Loomis Talc Company on the fi brous and foliated talc ores of the Gouverneur district in New York. Three types of ores were tested including tremolite talc, limy talc and green talc. The ores containing fi brous talc and tremolite and calcite were diffi cult to separate; those containing foliated talc and quartz were easy to fl oat. Different fl otation reagents were required for the various ores, pine oil for foliated talc and amines for the fi brous talc, and high talc content products were separated from each of the ore types. Around the same time Ralston and others noted that the separation of talc, clay and pyrophyllite improved when they had been attrition scrubbed before fl otation, probably because attrition removed ‘smears’ of soft mineral from the gangue material (Johnson and Warner, 1940). By 1944 there was only one company in the USA using fl otation to increase the grade of talc in concentrate but new uses for talc, such as radio insulators, were encouraging other companies to investigate the fl otation of domestic talc (Johnson and Marsh, 1946).
0
50
100
150
200
250
300
350
400
1900 1910 1920 1930 1940 1950 1960 1970 1980 1990 2000
Year
Mar
ket P
rice
(199
8 U
S$ /
t)
0
2,000,000
4,000,000
6,000,000
8,000,000
10,000,000
12,000,000
Wor
ld T
alc
Prod
uctio
n (t)
Market Price World Production
FIGURE 6.2
World production and market price of talc during the 20th century.

Spectrum Series 18
I N D U S T R I A L M I N E R A L S
195
In 1962 Finland began investigating the use of talc as a substitute for imported kaolin in
the Finnish paper industry. An open pit mine was developed in 1968 by Suomen Talkki Oy in
deposits near Sotkamo, central Finland, and production began in mid-1969 at an initial rate
of 200 000 tons of crude ore and 70 000 tons of concentrate annually. Initially, three fi ller
grades of talc were produced from a concentrate containing 95 per cent talc (Klinger, 1970).
In China during the 1980s fl otation was also introduced for the concentration of talc when
the Pfi zer Company established a joint venture with Heicheng Talc Company in Liaoning to
construct a plant to produce 100 000 tons per year of talc for plastic coatings (Chin, 1986).
Although treatment of talc by fl otation has been highly successful over the years, it is still
often considered unprofi table as markets may be too small and revenue generation too low.
The diffi cult economics of talc fl otation has seen a lot of fl otation operations shut down,
including the Johnson operation in Vermont, which played such an important role in the
history of talc fl otation.
HIGH VOLUME MINERALS – LIMESTONE AND IRON ORE
Limestone
Ralston (1937) recalled his early experience with limestone fl otation, or perhaps more correctly the diffi culties the unintentional fl otation of limestone could cause. In 1916 while working on zinc carbonate ores he asked a co-worker to try to fl oat zinc carbonate with oleic acid, which would form a zinc oleate fi lm, and learned to his annoyance that the calcium carbonate in the ore was even more willing to form a calcium oleate fi lm, which made it fl oatable.
Oscar Lee in 1929 published what appears to be the fi rst paper on limestone fl otation. In it he described the results of his work during the previous year on the removal of limestone from log-washer overfl ow resulting from the treatment of red iron ores of Alabama. He fl oated the limestone using a 50:50 mixture of oleic acid-cresol as both collector and frother and obtained a concentrate carrying 93 per cent of the calcium carbonate of the ore and assaying 48 to 50 per cent CaO.
Although there were no doubts that limestone could be recovered by froth fl otation it was a product with too low a value to arouse interest in processing for many years and no one thought seriously of fl oating it in the early days of froth fl otation. In the 1930s, however, there was an increasing demand for cement of different chemical and physical characteristics for different kinds of structures and many engineers started to ask for specifi c cements of certain defi nite chemical analyses that they thought were best for their particular jobs. Typically, limestone producers had blended lower quality product produced locally with higher quality material, often transported from some distance, in order to meet specifi cations. With the changing demand thought was given to removing the undesirable aluminates and silicates from the local supply of impure limestone available from a company’s property and it was realised that this could be achieved by centrifugal sedimentation and froth fl otation (Sprague, 1947). Miller and Breerwood (1938) discussed the pros and cons of limestone fl otation. The main

Spectrum Series 18
H I S T O R Y O F F L O TAT I O N
196
advantage was that minerals such as silica, mica and iron oxides would be rejected in the concentrate and this would reduce the energy required for grinding before and after the kilns, and eliminate some problems in the kilns. The main disadvantage was the additional capital and operating costs of the new process. They considered that the advantages far exceeded the disadvantages and that froth fl otation could be used in practically every limestone plant. The fi rst commercial limestone fl otation plant was commissioned in 1934 at Conshohocken, Pennsylvania, USA by the Valley Forge Cement Company, in their wet raw material grinding plant. Williams and Darby (1938) commented on its immediate success:
The application of fl otation to the preparation of cement slurry at the plant of the Valley Forge Cement Co. is a striking example of how a method developed by one industry may be adapted with profi t by another.
Progress from concept to completion at Conshohocken was achieved in a relatively short two years, largely through the enthusiasm of C H Breerwood, who conceived the idea that if it were possible economically to separate the individual minerals such as calcite, quartz, mica and pyrite he could then recombine them in other proportions to yield different types of cement of constant chemical and physical characteristics. Laboratory fl otation studies started in 1932; their success led to larger scale trials within the plant itself using a classifi er to deslime several tonnes of slurry, and fl otation of the rake product in batches in a 24 inch Fagergren fl otation machine. A continuous pilot plant was operated for six weeks in which 3–6 tons per day of deslimed limestone (12–24 tons of fresh feed) were fl oated testing various reagent schemes and fl ow sheets. The results were good enough for the Valley Forge Company to put into operation a plant capable of treating 700 tons of slurry per day on 15 March 1934. The slimes formed in grinding were separated in a classifi er and not treated by fl otation; the collector for the coarse fraction was oleic acid, the frother was cresylic acid and the circuit was four roughers and three cleaners with two recleaners when required.
60.00
80.00
100.00
120.00
140.00
160.00
180.00
200.00
1900 1910 1920 1930 1940 1950 1960 1970 1980 1990 2000
Year
Mar
ket P
rice
(199
8 U
S$ /
t)
0
500,000,000
1,000,000,000
1,500,000,000
2,000,000,000
2,500,000,000
3,000,000,000
Wor
ld C
emen
t Pro
duct
ion
(t)
Market Price World Production
FIGURE 6.3
World production and market price of cement during the 20th century.

Spectrum Series 18
I N D U S T R I A L M I N E R A L S
197
The Valley Forge Cement Company patented the process (Breerwood, 1933) and stayed at the forefront of development of limestone fl otation for many years. In 1935 it was credited as being the fi rst operation to use amines to fl oat mica and talc in the earliest commercial application of cationic collectors (Crabtree and Vincent, 1962) and these reagents rapidly became an integral part of the fl ow sheet (Williams, 1946). The process was used extensively with the argillaceous limestone of the Lehigh Valley.
By 1936 there were pilot or commercial fl otation plants operating in several countries
and Ralston (1937) predicted that ‘limestone processing is likely to take a place second only
to phosphate concentration as a leading application of fl otation to the technology of non-
metallic minerals’. The prediction may have been overly optimistic but the use of fl otation in
the limestone industry was rapidly established. Froth fl otation equipment was added to the
plant of the National Portland Cement Co at Brodhead, Pennsylvania, in 1939, but of particular
importance was the new wet-process plant of Universal Atlas Cement Co at Northampton,
PA, which started operation in 1943 and in which raw materials were fl oated so that most
types of gray cement could be made from rock of the plant quarry (Moyer and Balser, 1945).
Limestone fl otation was also used in other countries where there were specifi c requirements.
In Chile, industrial development by 1953 had increased the demand for Portland cement
so the domestic shortage was reduced by erection of a plant near Polpaico, about 30 miles
north of Santiago, which used fl otation to correct the composition of its raw materials (North
and Balser, 1956). In Iceland, the Government Cement Works at Akranes started a cement
plant in 1961. The 600 000-barrel plant was supplied with shell sand containing 80 per cent
calcium carbonate, which was dredged from 140 feet deep in nearby Faxa Bay and upgraded
by fl otation. Production by 1962 exceeded consumption by 100 000 to 160 000 barrels
(West and Lindquist, 1962). Substantial amounts of limestone are processed worldwide by
fl otation, but this is only a small fraction of the amount of the total limestone produced
for the cement industry. Flotation will, however, remain a critical part of many limestone
circuits to achieve specifi ed grades for downstream treatment processes.
Iron ore
In the early years of fl otation numerous attempts were made to concentrate iron ores by froth fl otation to produce higher quality smelter feed stock and reduce smelting cost. These failed to achieve commercially practical results. Low-grade iron ore was considered to be a high volume, low value product, which was effectively separated by gravity, magnetic and electrostatic techniques. It was not until the late 1920s that fl otation test work on iron ore and reverse fl otation of silica from iron ore began. Some of the projects are discussed:
• Antoine Gaudin tried fl oating haematite from siliceous gangue (Gaudin, 1934) and discovered that by using terpineol and sodium oleate as reagents the process was successful at selected pHs. He also found that by using activators such as ferric chloride and copper sulfate he could fl oat gangue materials away from the haematite. This provided the initial basis for both direct and reverse fl otation of iron ore.
• Around the same time Floyd Weed experimented on the Birmingham Red Ores of Alabama, which averaged only 36 per cent Fe. The fl otation reagents were a colloidal

Spectrum Series 18
H I S T O R Y O F F L O TAT I O N
198
dispersion of triethanolamine, linseed oil and oleic acid. The ore was conditioned with sodium silicate as a dispersant and fl oated at between 20 and 30 per cent solids. A rougher concentrate was produced, which was refl oated in cleaners to produce a 60–62 per cent Fe concentrate (Weed, 1935).
• In 1931 fl otation was used with the red iron ores in the Mesabi district to make a saleable product from 17 per cent Fe wastes. The concentrate contained 57 per cent iron, recovery of iron was 67 per cent and the estimated cost of the process was US$51.30 per ton. The conclusion was that fl otation could turn 220 million tons of non-merchantable haematite ore into valuable ore and it was predicted that fl otation would be important in iron ore processing (Adams, Kobey and Sayrei, 1931).
In 1930 iron ore fl otation was looking promising, particularly as the average annual tonnage of high-grade iron ore mined in the USA during the last 20 years was 60 million tons and it was becoming necessary to fi nd new sources of ore. Then the Great Depression struck, demand plummeted and the average annual tonnage dropped to 23 million tons during the next fi ve years. There would have been little commercial interest in fl otation for the next 15 years because of the Depression and the World War, but staff of the Michigan College of Mining and Technology were not daunted and in the late 1930s they commenced studies of the fl otation of oxidised iron ores as a means of concentrating the large reserves of low-grade iron ore in Michigan. Their work was comprehensive and their conclusions were that massive and specular haematite were readily fl oatable with fatty acid soaps, in particular sodium oleate, and magnetite could be fl oated with the same reagents. Some separation was possible by depression with an acid or a base. The scene was set for a resurgence of interest in iron ore fl otation.
A few iron ore fl otation plants were operating in the early 1940s but fl otation was a somewhat hit and miss affair. Julius Clemmer and Ballard Clemmons in their 1945 patent discussed some diffi culties they encounted at Birmingham, Alabama:
A satisfactory fl otation method for the recovery of hematite and rejection of the silica in the red iron ores or concentrator fi nes was sought. Flotation of the iron oxides from the silica with anionic collectors, and fl otation of the silica from the iron ores failed to give the desired results. Much of the silica fl oated with the hematite when using anionic collectors and gave low grade iron concentrates. The silica, predominantly quartz, was apparently activated to anionic fl otation due to the presence of lime salts in the ore. Attempts to deactivate the silica and prevent its fl otation with the hematite were not successful. Reversing the separation and fl oating the silica from the iron oxides with cationic collectors were not encouraging. The contaminated silica was reluctant to fl oat with cationic collectors and much remained in the iron product. Neither of the methods customarily employed on iron ores was satisfactory, and other means of perfecting the separation was sought.
Clemmer and Clemmons embarked on a test campaign to study numerous red iron ores from the Birmingham district and developed a reverse fl otation process, fl oating gangue to concentrate and recovering high-grade iron in the tailing. Their method consisted of

Spectrum Series 18
I N D U S T R I A L M I N E R A L S
199
conditioning the pulp with metal salts such as lead nitrate or zinc sulfate at a pH of 10 to 11 to activate the silica. Dispersants such as dextrin and collectors such as sodium oleate were used and silica fl oated rapidly. Pilot plant results were even better than laboratory results.
Prompted by the dwindling reserves of direct shipping and easily concentratable ores in the Lake Superior district, and the increasing demand for steel during and following World War II, fl otation of oxidised iron ores received considerable attention as a primary means of concentration. The reverse fl otation of silica from magnetite iron ores began in 1931 when Pickands Mather & Co, in conjunction with Bethlehem Steel Corporation and the Youngstown Sheet and Tube Company became interested in processing lean taconite ores in Northern Minnesota and formed the Erie Mining Company in 1940 to further develop the project. A pilot-scale laboratory was established in 1942 and it was found that magnetite had a tendency to fl oat with silica and be lost. By 1943 a method had been devised to fl oat gangue from magnetite using aliphatic amines as collector, MIBC as frother and sodium silicate as magnetite depressant (de Vaney, 1945). In 1946 Erie began testing the laboratory fl ow sheet with commercial-size equipment and during 1954–57 a commercial plant was built with an annual pellet production capacity of 7.5 million tons. The Erie plant and associated infrastructure was built for approximately US$350 million and was one of the largest capital projects ever undertaken in the USA at that time. Erie used anionic fl otation for treatment of about one-fi fth of its total magnetite concentrate and silica content was reduced from 11 to fi ve per cent (Wells, 1963).
Cleveland-Cliffs Inc, North America’s leading producer of iron ore pellets, was also
associated with iron fl otation in North America from its earliest days. Cleveland-Cliffs’
predecessor, the Cleveland Iron Mining Company, was established in 1846 by a group of
investors, led by Samuel L Mather, an attorney, to produce iron ore in the Marquette Range
of Michigan’s Upper Peninsula. The venture was for many years a losing proposition and
Cleveland Iron Mining was only able to survive these diffi cult formative years through a
‘unique fi nancial device’ – they printed up scrip known as ‘Iron Money’ in one-, two-, three-
and fi ve-dollar denominations and met their fi nancial commitments with these ‘IOUs’ until
the company’s cash fl ow stabilised. In 1891, the company merged with the Iron Cliffs Mining
Company to form the Cleveland-Cliffs Iron Company.
The onset of the Great Depression saw Cleveland-Cliffs with a heavy debt load and they decided to sacrifi ce all but their domestic iron ore reserves to keep the company alive. Part of this strategy was the upgrading of abundant low-quality ores into material useful to the steel industry. In 1949 Cleveland-Cliffs Iron Co erected a modern research laboratory at Ishpeming, Michigan, which had as a prime objective the development of feasible means to concentrate the non-magnetic lean ores of the area. Several technically feasible methods were devised and fl otation was chosen for use in a commercial operation. Cleveland-Cliffs Iron, with Ford Motor Company, formed the Humboldt Mining Company and the fi rst all-fl otation iron ore plant was commissioned in 1954 (Forbes, 1956). Petroleum sulfonate was the collector but it was later changed to soap fl otation. The operation was so successful that a second plant was installed in 1956 at Republic, Michigan (Crabtree and Vincent, 1962; Federal Reserve Bank Minneapolis, 1953). Initial capacity was 400 000 tons per year and

Spectrum Series 18
H I S T O R Y O F F L O TAT I O N
200
fl otation with petroleum sulfonate was used to make iron concentrate, which was reground, sparged with steam to raise the temperature to 150°F, and refl oated. Silica content was reduced from seven to fi ve per cent with little loss of iron (Wells, 1963). Other iron ore fl otation plants built by Cleveland-Cliffs Inc were:
• The US$50 million Empire mine complex at Palmer, Michigan, which commenced operation in 1964. Cationic fl otation was used to remove silicates, the initial annual capacity was 1.2 million tons of pellets containing 63 per cent iron, and the fi nal capacity was eight million tons of magnetite pellets per year (Klyce, 1966).
• The Tilden Mine, which began operations in 1974 and by 1979 was producing eight million tons per year. It also used cationic collector fl otation to remove silicates and produce an iron rich tailing. This became the standard process for fl oating iron ores in the USA.
Method of benefi ciation Percentage of iron ore treated
Magnetic separation only 41.6
Flotation following magnetic separation 51.2
Flotation only 6.3
Gravity concentration <1
TABLE 6.2
Benefi ciation methods commonly associated with iron ores and the percentage of ore treated by each method.
In 1975 Cleveland-Cliffs started using fl occulated fl otation (Iwasaki, 1981), which had
been developed in the mid-1960s (Frommer and Colombo, 1966). It involved selective
fl occulation of the iron ore, removal of the silicates from the supernatant liquor and fl otation
of the underfl ow to remove silicates. By 1990 fl otation was the dominant iron ore treatment
method in the USA (US Environmental Protection Agency, 1994). The iron ore industry in
Minnesota and Michigan now uses cationic silica fl otation for the removal of locked silica
from magnetic taconite concentrates at a rate of 40 million tons per annum (Iwasaki, 1999).
The USA led the development of iron ore fl otation in the fi rst 25 years of its history but Brazil has been a leader in the last 25 years. Iron ore dominates the use of fl otation in Brazil with 70 million tons per annum of ore being processed to produce 48 million tons per annum of concentrate for pellet production (Araújo, Viana and Peres, 2005). All iron ore fl otation operations utilise reverse fl otation, fl oating quartz impurities and producing iron rich tailings. The fi rst company to operate a fl otation plant to treat haematite ores in Brazil was SAMARCO in 1977 but other iron ore operations were reluctant to use fl otation until Vale (formerly CVRD) added fl otation to its high intensity magnetic separation unit in Itabira in 1986 and started a fl otation plant in Timbopeba in 1988. Samitri also included a fl otation circuit at the Alegria Mine (Araújo and Peres 1995). Vale is now the leader in iron ore fl otation in Brazil with some fi ve concentrators treating 4500 tons per hour of fl otation feed. SAMARCO operates the largest iron ore fl otation plant at Germano, treating 3200 tons per hour by fl otation. The Vargem Grande, Pico and Casa de Pedra plants also operate iron ore fl otation circuits. Brazil has been instrumental in bringing column fl otation to the iron ore industry. In 1986 SAMARCO initiated an extensive column fl otation test program with

Spectrum Series 18
I N D U S T R I A L M I N E R A L S
201
a 1.2 m, home-made fl otation column. Currently 80 per cent of Brazil’s iron fl otation plants utilise column fl otation in cleaning roles, with the Germano plants also treating iron ore slimes in a column only circuit. The country has also followed the trend to larger fl otation cells with the Germano plant installing 160 m3 WEMCO fl otation cells.
The future development of iron ore fl otation may well rest with the nations of the CIS (formerly the Soviet Union). On 13 December 2006 a newly-constructed fl otation facility was launched at the Mikhailovsky GOK iron ore mining and processing enterprise managed by Metalloinvest Management Company, in Russia. The fl otation plant was introduced in the framework of a large-scale modernisation program. The importance the company gave to iron ore fl otation is shown by Maxim Gubiev, CEO of Metalloinvest Management Company during the opening ceremony of the fl otation facility:
Today’s launch of a fl otation facility at Mikhailovsky GOK is a landmark, since it paves the way for further technological development of the enterprise. Without this step we wouldn’t have qualitative changes and value-added iron-rich production. The new fl otation facility places MGOK to leading positions not only in terms of production quality, but in terms of potential for further development, which is huge (Mikhailovsky GOK, 2006).
The fl otation capacity enabled production of 4.4 million tons per annum of high-quality concentrate, suitable for manufacturing pellets high in iron content (66.5 per cent) and low in silica content (4.5 to fi ve per cent). The total capital expenditure on the project is estimated to more than $1 billion (Metalloinvest Management Company, 2007). Preceding Mikhailovsky was the Kovdorsky GOK mining complex on the Kola peninsula in Western Russia, where in the 1970s reverse fl otation of apatite and baddeleyite from iron ore tailing commenced. The operation now produces 5.7 million tons per annum of iron ore concentrates (Moore, 2005).
AGRICULTURAL MINERALS – PHOSPHATE AND POTASH
Phosphate
In 1937 Ralson commented that the fl otation of phosphates was by far the greatest application
of the process to non-metallics. Based on the tonnage of concentrate produced this is still the
case today:
There are approximately 40 million tons per year of phosphate rock produced in the United States, half of it by fl otation. The bulk of this is used to produce diammonium phosphate, an essential ingredient in the commercial fertilizer mixes used by the thriving US agricultural community (Wiegel, 1999).
Prior to the use of froth fl otation phosphate was recovered as either lumps or pebbles by size separation processes. They worked well because most of the phosphate grains were larger than quartz grains, and grains which were the same size and had similar specifi c gravities were rejected as ‘debris.’ It was the ‘debris’ that created the need for phosphate fl otation.
One of the early publications on froth fl otation of phosphates was by Broadbridge and Edser (1925), who used oleic acid as a collector to fi lm calcium phosphate with calcium

Spectrum Series 18
H I S T O R Y O F F L O TAT I O N
202
oleate and sodium silicate to defl occulate slimes. Their process was termed ‘soap fl otation’ and their US patent unleased a fl ood of patents relating to phosphate fl otation over the next ten years, many of which were assigned to Minerals Separation North America and the Phosphate Recovery Corporation. This fl ood of patents ensured that phosphate fl otation was at times contentious, with inventors resorting to the courts to settle intellectual ownership. John Burrows, vice president of International Agricultural Corporation, was in charge of phosphate rock operations and knew that better technology could solve phosphate processing problems, so in 1926 he commenced an investigation into methods of recovering fi ne phosphate from the debris. In 1927 fl otation tests on –28 mesh, deslimed, Tennessee brown phosphate were successful (Martin, 1934; Barr, 1946) and this was the start of an active research program on phosphate fl otation, which led to the construction by Phosphate Recovery Corporation – later International Minerals and Chemical Corporation – of a series of fl otation plants to process the debris. The pilot plant was built at Mulberry, Florida, and the third plant in the series was reported to be the largest industrial mineral fl otation operation in the world. Initially the fl otation machines were those designed for sulfi des but there were numerous diffi culties with the relatively coarse, fast fl oating feed and the design was changed to discharge concentrates at both sides and use higher speed impellers.
The understanding of phosphate fl otation had grown signifi cantly by the 1940s. The metallurgical advantage of separating fl otation plant feed into several size fractions had been recognised by most producers, more selective circuits were in use, and the Crago process was introduced in which phosphates in sized feed were fl oated using fatty acid as collector, the concentrate was conditioned with sulfuric acid to remove collector, and silicate impurities were fl oated using amine collectors. This process was to become standard for phosphate fl otation (Crabtree and Vincent, 1962). Good recovery and economic reagent costs required conditioning of the pulp at high per cent solids so the process involved single-stage reagent
0.00
50.00
100.00
150.00
200.00
1900 1910 1920 1930 1940 1950 1960 1970 1980 1990 2000
Year
Mar
ket P
rice
(199
8 U
S$
/ t)
0
20,000,000
40,000,000
60,000,000
80,000,000
100,000,000
120,000,000
140,000,000
160,000,000
180,000,000
Wor
ld P
hosp
hate
Pro
duct
ion
(t)
Market Price World Production
FIGURE 6.4
World production and market price of phosphate during the 20th century.

Spectrum Series 18
I N D U S T R I A L M I N E R A L S
203
addition, fl otation, tailings dewatering and conditioning at high per cent solids before the second stage of fl otation (Le Baron, 1946). By 1960 15 fl otation plants were in operation treating phosphate ore in the USA. Of total phosphate production 35 per cent came from fl otation concentrate, with amines and fatty acids, assisted by kerosene and fuel oil being the standard reagent scheme. The process developed for phosphate froth fl otation at this time and refi ned over the following decades was fully described by Wiegel (1999).
In Russia the importance of fertilisers put emphasis on processes to fl oat apatite and phosphorites. Mixed carboxylic acids formed by oxidation of petroleum jelly were found to make desirable substitutes for oleic acid and selective fl otation of four phosphates – apatite, podolite, staffelite and kurskite – was achieved. By the 1930s apatite and phosphorites were being concentrated by fl otation (Ralston, 1937), one Russian plant being reported in 1931 to process 650 tonnes per day in each of two fl otation lines, with an additional fi ve lines in construction to provide fl otation capacity of 4500 tonnes per day (Williams and Darby, 1938). Large deposits of apatite were discovered in 1924 in the Kola peninsula by Academician A E Fersman and mining started in 1931 with the concentration circuit consisting of triple-stage crushing, single-stage grinding, fl otation roughing and several stages of fl otation cleaning. During following years several plants with capacities of 1.0–1.5 million tons per annum were built in the Kola peninsula, a plant of particular interest being at the Kovdor iron ore mining and benefi ciation complex, where an apatite-baddeleyite fl otation plant was commissioned in 1975 to process tailings from the wet magnetic separation process at the iron ore benefi ciation plant. During 1981–85 the Kovdor complex produced fi ve million tons of apatite concentrate totalling 1.6 million tons of P
20
5. In 2000, the Kola Peninsula
produced more than 90 per cent of Russia’s phosphate output (Levine and Wallace, 2000).
By 1970 phosphate fl otation was well developed and many countries were building
fl otation plants to produce about one million tons per annum of concentrate from phosphate
rock. In Brazil fi ve companies were fl oating phosphate ores by 1995 – Arafertil, Copebrás,
Fosfertil, Goiásfertil and Serrana – and particular attention was given to improving the
technology. For example at the Brazilian phosphate operations of Bunge Ltd only the coarse
phosphate fraction was recovered from the commencement of operations in 1977 to 1984.
Then a mechanical cell fl otation plant was installed to treat the slimes and achieved a ten
per cent increase in overall plant phosphate recovery. In 1992 columns were introduced
to fl oat fi ne particles and the mechanical cells were used for coarse particles. Bunge Cajati
operated a fl otation circuit consisting of columns only for the ultrafi nes and mechanical cells
for the coarser sizes; Bunge Fosfertil in Catalao operated three circuits, each one fl oating a
different size range: coarse, fi nes and ultrafi nes, and Bunge Tapira operated two fl otation
circuits, which used mechanical cells for coarse particles and scavenger units and columns
for ultrafi ne particles (Araújo and Peres, 1995; Araújo, Viana and Peres, 2005).
Where sulfi de mineral fl otation has seen ever increasing sizes of fl otation machines, up to
300 m3, fl otation cells in the phosphate industry have not exhibited the same increases. The
large proportions of solids in the fl otation froth have dictated that mechanical fl otation cell
sizes up to only 20 m3 have been used in the roughers, and 4 m3 in the cleaners. In general,
as fl otation feed particle size increases, cell size decreases, with 2 m3 cells not uncommon

Spectrum Series 18
H I S T O R Y O F F L O TAT I O N
204
for coarse-particle fl otation. The interest in columns for phosphate fl otation temporarily
subsided in the 1980s and 1990s but recently it has been rejuvenated with the outstanding
example of columns being substituted for mechanical cells occurring in Brazil. Currently
80 per cent of Brazilian phosphate operations operate with column fl otation and some
72 000 tons per day are treated in column-only circuits (Araújo, Viana and Peres, 2005).
Other notable instances of column use in phosphate fl otation include the Apatit operations
in Russia and the Shenlongjia Mineral Company’s operations in China (Canadian Process
Technologies, 2006), as well as developments by the Florida phosphate producers in the
USA (Gruber and Kelahan, 1988).
Potash
During the 19th century the use of potash was limited to the manufacture of gunpowder, glass, soft soap, chemical and pharmaceutical preparations. The small consumption was supplied by wood ashes, the calcined residue from beet sugar manufacture, kelp ash and ‘suint’ – the sweat of sheep recovered in scouring wool. The discovery c 1858 by Justus von Liebig that potash salts present in soil constitute essential plant food, which is exhausted by continuous cultivation, led to a vast new use for potash (Hedges, 1935b). A skilful marketing exercise created a demand for potash fertiliser that brought astounding growth to the infant potash industry. Coincidentally, the discovery of large deposits of soluble potash salts at Stassfurt rapidly led Germany to dominate the new potash fertiliser market. This dominance lasted until 1914, when the advent of World War I saw an embargo placed on German exports. This resulted in a chronic shortage of potash and severely infl ated prices. Opportunists moved into potash production and by 1918 128 producers were operating in the USA alone. The signing of the armistice in November 1918 brought the potash expansion to a sudden halt. Prices for potash halved and by 1919 nearly all the potash plants in the USA had closed.
0
1,000
2,000
3,000
4,000
5,000
6,000
7,000
8,000
1900 1910 1920 1930 1940 1950 1960 1970 1980 1990 2000Year
Mar
ket P
rice
(199
8 U
S$
/ t)
0
5,000,000
10,000,000
15,000,000
20,000,000
25,000,000
30,000,000
35,000,000
Wor
ld P
otas
h P
rodu
ctio
n (t)
Market Price World Production
FIGURE 6.5
World production and market price of potash during the 20th century.

Spectrum Series 18
I N D U S T R I A L M I N E R A L S
205
Potash prices fl uctuated over the next ten years, before plummeting again with the arrival of the Great Depression. The early 1930s witnessed unprecedented shrinkage in world potash markets in response to severe drought (Hedges, 1935a), leading to the Great Potash Price War of 1934 and 1935. During this time Spanish producers launched an aggressive sales campaign, dropping potash prices by some 15 per cent. The Franco-German Potash Cartel responded in kind, offering a further 15 per cent discount to customers who did not buy Spanish potash. The USSR also began exporting low cost potash onto the world market from its operations at Berezniki (Hedges, 1935a). With low prices and a gloomy future research into potash production also dwindled. Forced by reduced funds to conduct severe retrenchments in all directions, the three USA government agencies responsible for the infant potash industry ceased undertaking further projects. This is the background to the fi rst tentative steps towards potash fl otation.
In the USA a joint program between the US Bureau of Mines and the Potash Company
of America led to crude potash ore from New Mexico containing about 40 per cent sylvite
(KCl) and 60 per cent halite (NaCl) being fl oated in saturated brine solution using crude oil
and sulfated alkyl alcohol as reagents. The concentrate contained 95 per cent KCl (Hedges,
1935a). A full-scale fl otation plant of the Potash Company of America commenced operation in
October 1935, producing approximately 70 000 tons per annum, and its capacity was doubled
in 1937 (Hedges, 1937). The operation made use of the Weinig separation process, which
was essentially soap fl otation involving coconut oil soap, oleates and oleic acid. It had been
improved so that high-grade concentrates of potassium chloride remained suspended in the
liquor, and most of the sodium chloride and other impurities were fl oated off (Weinig, 1938).
In 1940 in Utah, Bonnerville Ltd also commenced potash fl otation using a different methodology. Production was via evaporation ponds where the KCl and NaCl was precipitated. At the end of the harvesting season the crystals were hauled to the mill and separated by fl otation (Hedges, 1943). Bonnerville Ltd also put signifi cant effort into the development of fl otation reagents for potash (Ferris, 1943, 1944; Weiner, 1943, 1945).
At the same time the US Potash Company was testing the US Bureau of Mines scheme of fl oating sylvite away from halite. Sodium octadecyl sulfate was used as both frother and collector, potassium chloride was fl oated and sodium chloride and impurities left behind. In 1940, the potash fl otation plant of International Minerals and Chemical Corporation, Carlsbad, New Mexico, was brought into operation. The original fl otation section contained all Fagergren fl otation machines arranged as roughers, cleaner and recleaner. In 1942 a cell using an 18-in turbo-mixer impeller designed for sewage aeration was developed and in November 1943 fi ve turbo-impellers were installed in a trough-type machine to operate in parallel with Fagergren roughers (Barr, 1946). There was never a shortage of ideas for new cells.
The war years helped stabilise potash prices through restricted European production and increased use in the armaments industry. Another effect of the war was felt by the Potash Company of America and was the loss to the company of coconut oil soap, its previously imported principal fl otation agent. Adversity brought invention and alternatives were developed (Johnson and Warner, 1943). By the 1960s fl otation of potash had become widespread and production had increased dramatically with applications in Europe, Russia

Spectrum Series 18
H I S T O R Y O F F L O TAT I O N
206
and Canada, as well as those in the USA. In 1960 60 per cent of potash production in the USA came from fl otation in seven plants using amine collectors to fl oat the sylvite (Merrill and Pennington, 1962).
In Canada about 70 per cent of the total potash, and almost 90 per cent of fertiliser grade potassium chloride, is produced by froth fl otation, crystallisation being used mainly to produce industrial grade and specialty fertiliser grade potash. Potash was discovered in Saskatchewan in the early 1940s while drilling for oil. The fi rst conventional mine started production in 1962, and in 1964 the fi rst solution mine was started near Belle Plaine. By 1971, all ten mines now existing in Saskatchewan were in operation and by 1987 total capacity was 3.4 million tons per annum. The process involved desliming, separate addition of reagents (pea or wheat starch, amine hydrochloride, process oil and methyl isobutyl carbinol (MIBC)) to the coarse and fi ne fractions and fl oating the combined slurries in roughers and cleaners. At New Brunswick carboxymethyl cellulose is used as a depressant for insoluble material with hydrogenated tallow amine as a collector and MIBC as frother (Gauthier, Patterson and Owen, 2000).
USSR became a major user of fl otation for potash treatment very quickly. In 1987 extraction and processing of potash was occurring in the Urals, Byelorussia and the Ukraine in 11 mines and benefi ciation plants at the rate of about 70 million tons per year. Beloruskali is the largest venture in the world for producing potash fertilisers, its history dates back to 1949 when the Starobin potash ore deposits were discovered 130 km south of the city of Minsk. In 1963 the fi rst potash plant was put into operation; later plants were operating in 1965 and 1969. When the fourth plant was brought online in 1979 the production capacity was 5.5 million tons per annum. All fl otation plants operate a standard amine fl oat (Levine, 1987; Moore, 2005).
The history of potash fl otation is intertwined with that of the Dead Sea Works, although it was many years after that company began producing potash before fl otation was installed. Moshe Novomeysky had been an engineer in Siberia before emigrating to Palestine in the 1920s. There, Novomeysky recognised the vast mineral potential of the Dead Sea, particularly the possibility of producing bromine and potash from the Dead Sea water, and was granted a concession for processing chemicals from the Dead Sea by the British authorities in 1927. He founded Palestine Potash Ltd in that year and began construction of a plant in Kalia, along the Dead Sea’s northern shore. Palestine Potash began producing bromine in 1931. The following year, the company launched potash production as well. By 1934, seeking expansion, Novomeysky decided to establish a new, larger plant in Sdom, on the southern shore of the Dead Sea. By 1936, when that plant began production, the company was turning out 80 000 tons of potash per year. By World War II the operation was producing about 50 per cent of Britain’s potash requirements and about 80 per cent of the requirements of the British Dominions (excluding Canada). During the Israeli War of Independence, the Kalia site was destroyed, and production at the Sdom site was also interrupted, not to resume again until 1954. By then, the company had taken on a new name, Dead Sea Works Ltd and had come under the control of the Israeli government. By the end of 1954, potash production had risen to more than 100 000 tons per year, but the company was operating at a loss. In 1955 an ambitious expansion drive began. Backed by the Israeli government, the Dead Sea Works (DSW) expansion involved building a 20 km dam across the Dead Sea, creating an

Spectrum Series 18
I N D U S T R I A L M I N E R A L S
207
evaporation bed of more than 100 km2. Accompanying the construction of the dam was the development of a modern plant that produced potash using a hot crystallisation process. This expansion enabled the company to boost its production to more than 400 000 tons per year in the early 1960s, more than 800 000 tons by the end of the decade, and more than 1.2 million tons by the early 1970s. The fi rst stage expansion included a 400 000-ton potash refi nery and ore-working line, with fl otation capacity of 200 000 tons KCl per year. DSW closed its 200 000-tons-per year fl otation potash plant in April 1985 owing to large stocks and the depressed world fertiliser market (Woodmansee, 1969b; Kornhauser, 1985), although they were to re-open within several years.
Another fertile ground for the growth of potash fl otation was Morocco. In late 1966 Morocco signed an agreement with Interexport of Belgrade, Yugoslavia and Centrozap of Warsaw, Poland, for development and exploitation of a deposit with known reserves of 200 million tons of carnallite. Studies indicated that potash of 90.95 per cent purity could be prepared from the ore by fl otation and crystallisation (Stipp, 1969). For some countries potash fl otation and production would be a saviour to their struggling economies. This was the case in Ethiopia. The Dallol potash deposits were worked on a small scale from 1915 to 1929 by an Italian concern. The new attempt to work them called for an expenditure of Eth$37 million, in addition to the Eth$5 million already invested. It involved the construction of a treatment plant at Dailol, including grinding, fl otation cells, large centrifuges and necessary infrastructure. Construction started in the latter part of 1963, with production beginning in 1965 with an initial annual output of 300 000 metric tonnes of exportable potash (Murdock, 1964).
The potash industry that greeted the 21st century was far different to the industry as it was 70 years earlier, when the fi rst faltering steps towards potash fl otation were being taken. As shown in Table 6.3, production had increased 20 fold from 1931 (Hedges, 1935a) to 2005 (Stone, 2006), with some 80 per cent of potash now produced through fl otation at some point in its processing.
Germany’s dominance as a potash producer has shown a signifi cant decline. Although slow on the initial uptake of fl otation the country soon made up for lost ground and became an
Production 1931 Production 2005
Country kt K20 eq Country kt K
20 eq
Germany 964 Canada 10 600
France 308 Russia 6240
United States 88 Belarus 4920
Russia 75 Germany 3660
Poland 53 Israel 2220
Spain 28 China 1500
India 3 Jordan 1080
Palesine 3 United States 816
TABLE 6.3
Increase in potash production from 1931 to 2005.

Spectrum Series 18
H I S T O R Y O F F L O TAT I O N
208
innovator in terms of new fl otation machines for potash cleaning. The sole potash producer, K+S Kali GmbH, produces potash from six mines, with the majority of production through froth fl otation (Stone, 2007).
In the USA most potash production still comes from the birth place of potash fl otation – southeastern New Mexico, where two companies operated three mines. New Mexico sylvinite and langbeinite ores were benefi ciated by fl otation, dissolution-recrystallisation, heavy-media separations, or combinations of these processes, and provided more than 70 per cent of total US producer sales. In Utah, which has three operations, one company extracted underground sylvinite ore by deep-well solution mining. Solar evaporation crystallised the sylvinite ore from the brine solution, and a fl otation process separated the potassium chloride from by-product sodium chloride. Two companies processed surface and subsurface brines by solar evaporation and fl otation to produce potassium chloride (Searls, 2005). To paraphrase Strathdee, Gotts and McEachern, 2007:
Improvements have been made to potash fl otation during 40 years of operation, but the basic process remains unchanged from the industrial practice fi rst developed in Europe and the United States.
Flotation is still conducted either through the fl otation of KCl, or alternatively through reverse fl otation with fl otation of NaCl in saturated brine solutions. The direct fl otation route has become by far the more common, still using tallow and hydrogenated tallow fatty amines in the form of acids salts as collectors, various depressants and MIBC as frother. The reverse fl otation route makes use of alkyl-morpholins to fl oat NaCl from the brines and is used in operations in Israel and Jordan (Peres et al, 2007).
Flotation machines have traditionally remained relatively small mechanical fl otation cells with rotating paddles used to remove the concentrate. This is due to the coarse nature of potash concentrate with particles of several millimetres in size fl oating to concentrate, and the relatively weak attachment of amine collectors. In slimes fl otation alternative fl otation machines have been used since the 1990s.
The future of potash development is likely to centre on reagents. Complaints from mill staff have led to an ongoing search for a less volatile frother than MIBC. In addition, concerns over the use of extender oils are leading to investigation into other alternatives. During the last 15 years a new cation collector was found for the fl otation of halite – alkylmorpholine. Its application made it possible to develop a new low energy volume process for the processing of carnallite ore and sedimentary salts using reverse fl otation for halite. The Dead Sea Co and Arab Potash Co plants have begun using it for the production of potash and it is being studied for processing of carnallite ore from the Upper Kama deposits in Russia (Titkov, Sabirov and Novoselov, 2005).
MINERALS FOR SECONDARY INDUSTRY – FELDSPAR, BARITE, FLUORSPAR AND KAOLIN
Feldspar
The feldspars and feldspathoid minerals have great industrial importance, but until the 1940s had resisted attempts at concentration by froth fl otation or any other method. The

Spectrum Series 18
I N D U S T R I A L M I N E R A L S
209
approaching exhaustion of many of the high-grade feldspar quarries that were close to the markets was the driving force to fi nd a means of separating feldspar from quartz and mica. Some progress was made during 1932 toward the development of fl otation to remove quartz from feldspar with laboratory experiments, conducted by H G Iverson at the engineering experiment station of the University of Utah. Iverson had only indifferent success by using terpineol as frother and sodium oleate as collector. However, by adding a very small amount of lead nitrate, the feldspar was fi lmed with lead oleate and fl oated well (Rogers and Galiher, 1933). In Germany, Krupp Grusonwerk conducted extended fl otation tests on the possibility of recovering feldspar from German granites by this method and obtained spar suitable for ceramic uses and glass batches. By 1935 they were determining the commercial viability of a production operation (Metcalf, 1936).
In the earlier years of the feldspar industry neither producers nor consumers paid much
attention to exact specifi cations, but as the ceramic and glass industries began to insist
upon rigid chemical control of batch ingredients defi nite standards were developed for
alumina, lime and alkali content, as well as stricter limits for iron. To meet these conditions
the feldspar mills were remodelled; laboratory control was introduced and arrangements
were made for stocking different grades of spar and blending them into products of known
and guaranteed composition. By 1938 there was continuous experimentation into feldspar
fl otation and it was found to be well suited for the purifi cation of feldspar, quartz, clay, talc,
nephelite, spodumene and other ceramic raw materials. Cationic reagents, such as certain
substituted ammonium compounds and nitrogen bases, were useful for selectively fi lming
feldspar. In Germany the recovery and separation of mica and feldspar from the gangue
rocks was achieved by a fl otation process in which carbolic acid or creosote oil, a higher
aliphatic acid, and a terpineol, were used together as fl otation agents (Metcalf, 1939).
0.00
20.00
40.00
60.00
80.00
100.00
120.00
140.00
160.00
180.00
200.00
1900 1910 1920 1930 1940 1950 1960 1970 1980 1990 2000
Year
Mar
ket P
rice
(199
8 U
S$
/ t)
0
2,000,000
4,000,000
6,000,000
8,000,000
10,000,000
12,000,000
14,000,000
16,000,000
18,000,000
Wor
ld F
elds
par P
rodu
ctio
n (t)
Market Price World Production
FIGURE 6.6
World production and market price of feldspar during the 20th century.
Spectrum Series 18
H I S T O R Y O F F L O TAT I O N
210
Froth fl otation of feldspar to remove closely combined quartz has been perfected by the US Bureau of Mines. The fi rst commercial installation of the process was the Golding-Keene Co plant at Keene, New Hampshire, where increasing proportions of quartz were being found in mining. The mill was damaged by a hurricane in September 1938 but was partly rebuilt the following spring and again placed in operation. However, a new body of high-grade feldspar at the mine had made operation of the fl otation plant unnecessary by 1940. A second mill for separating feldspar from quartz was also soon under construction at the Erwin (Tenn) plant of the Consolidated Feldspar Corporation and similar plants were being planned by several other companies (Metcalf, 1940). In the USSR, on the far-northern Murrnansk coast of the Kola Peninsula, reverse fl otation of nepheline tailings or waste from the fl otation of apatite at Kirovsk was used to produce a feldspathic tailing product.
By the 1940s the gradual exhaustion of the higher-grade deposits and the relatively high cost of the small-scale mining practiced in many feldspar operations encouraged new enterprises utilising larger-scale operations into feldspar production. Considerable research was undertaken into the extraction of feldspar from lower grade materials and into the recovery of feldspar as a by-product of other mining or processing operations, one example being its recovery from feldspathic waste from titanium operations (Metcalf, 1941). The Consolidated Feldspar Corporation, after successful preliminary tests, commenced a new fl otation plant at Kona, North Carolina, to treat ore where the mica and quartz in the rock were so intimately associated with the feldspar that separation could be effected only by fl otation (Metcalf, 1945). At Rochester, New York, preliminary fl otation tests of nepheline by the Canadian Bureau of Mines led to fl otation tests on a semi-commercial scale during 1943. The entire Rochester mill was converted to fl otation the following year (Metcalf, 1946). The success in these operations was spectacular and led Robert Metcalf of the US Bureau of Mines to boldly declare:
The widespread distribution of feldspar in rock of a type similar to alaskite, such as granite, points to an almost unlimited reserve, which with the development and perfection of fl otation separation would become presently available. The more general application of fl otation presages also a radical change in mining methods—the ultimate substitution, in large part, of large-scale quarrying for the hand operation of many comparatively small, isolated pits.
A fl urry of companies proceeded to install feldspar fl otation circuits over the next fi ve years, with production increasing sharply and by 1950 the US Government was quoting fi gures on the production of feldspar with the notation ‘includes fl otation’. The late 1940s provided a sound footing for feldspar fl otation in the USA and the 1950s represented a time of growth and rationalisation, with companies that operated successful fl otation circuits becoming take-over targets. The quantity of feldspar produced by fl otation continued to increase and in 1958 constituted nearly 60 per cent of the entire US output (de Polo and Tucker, 1959). In 1952 International Minerals and Chemical Corp, recognising the importance of fl otation in feldspar and with its vast experience in both potash and phosphate fl otation, formed a Consolidated Feldspar Department and began acquisitions. It quickly moved to modernise and improve its new plants in North Carolina and Tennessee. The capacity of its Spruce Pine, North Carolina fl otation mill was increased 50 per cent and new equipment for feldspar

Spectrum Series 18
I N D U S T R I A L M I N E R A L S
211
fl otation was installed at Kona (Gunsallus and Uswald, 1956). The next rationalisation of feldspar production interests occurred in 1955 when Feldspar Corporation purchased several companies and expanded production (Gunsallus and Uswald, 1958). When a new 7000-ton-a-month fl otation plant was built in 1960 its fi ve plants were producing a third of the USA’ feldspar (de Polo and Tucker, 1961).
With increasing confi dence companies began to fl oat harder-to-treat feldspathic ores. Flotation plants were built using different sources of feed, such as pegmatites (Gunsallus and Uswald, 1958), beach sands and alaskatite (de Polo and Tucker, 1958). Flotation circuits were extended to make valuable by-products, for example the Feldspar Corporation produced both glass and pottery grade feldspars with high-quality mica and silica as by-products; Paco Products Corporation fl oated screenings from a granite quarry to produce feldspar and ground silica; and Northwest Defense Materials Inc produced potash feldspar as a by-product of beryllium fl otation. With fl otation heralding a new method of feldspar production some of the old established methods of treatment such as hand picking disappeared (de Polo and Tucker, 1960, 1961).
The feldspar fl otation revolution was soon felt across Europe:
• In Finland a $2.5 million feldspar fl otation plant was built at Kimito (Kemiö) by Lohjan Kaikkitehdas Oy to annually produce 70 000 tons of high-purity feldspar.
• In Norway a fl otation plant to produce potassium and sodium feldspar and quartz was completed at Lillesand in mid-1968 by the H BjØrum company in association with Belgian and West German fi rms, initial production was 50 000 tons of feldspar and 25 000 tons of quartz annually and by 1972 this had increased to 43 500 tons of sodium feldspar, 24 000 tons of potassium feldspar and 29 500 tons of quartz (Klinger, 1970, 1972).
• In Sweden fl otation was used in 1976 to separate feldspar from scheelite to replace the wet-mechanical concentration that had been used previously (Huvos, 1976).
• In Austria, Quanzwerke GmbH, part of the Quarzwerke Group of the Federal Republic of Germany, operated two plants which mined fl uvial Ohgocene deposits with high feldspar and silica sand contents. The plants had a washing capacity of about 300 000 tons and a fl otation capacity of 130 000 tons (Rabchevsky, 1983).
• In Serbia, feldspar, mica and quartz are obtained from the Vidovacki Krs pegmatite deposit near Prokuplje. They are processed by fl otation with an annual yield of 50 000 tons of feldspar, 36 000 tons of quartz and 14 000 tons of muscovite concentrates (Monthel et al, 2000).
• In the 1980s Turkey produced feldspar fl otation concentrates with a major expansion occurring in 1987 when a new fl otation plant in southwestern Anatolia came in operation (Connor, 1986b).
Flotation to produce feldspar concentrates is one of the most widely used applications of fl otation to industrial minerals.
Barite
Barite’s uses are numerous, with its major consumption being as a weighting material in oil-well drilling muds to confi ne oil and gas to their required levels and prevent blow-outs. Barite is also used as a fi ller, extender or weighting agent in products such as paints, plastics and

Spectrum Series 18
H I S T O R Y O F F L O TAT I O N
212
rubber. Because it blocks X-ray and gamma-ray emissions, it is used as aggregate in high-density concrete for radiation shielding around X-ray units in hospitals, nuclear powerplants and university nuclear research facilities. Ultrapure barite consumed as a liquid is used as a contrast medium in medical X-ray examinations. It is the raw material for barium chemicals, such as barium carbonate, which is an ingredient in faceplate glass in the cathode-ray tubes of televisions and computer monitors (Miller, 2008). One of the earliest mentions of the use of fl otation for barite was in French Morocco, using corn oil as a collector c 1933. During the 1930s the US Bureau of mines undertook signifi cant work on the fl otation of barite. The words of Tyler and Stoddard in 1934 seem almost prophetic:
Flotation has wrought revolution in the concentration of sulphide ores of various metals but has been adapted less readily to the benefi ciation of nonmetallic minerals. The time has come, however, when barite can be cleaned economically by fl otation. No known technical barrier exists for a commercial treatment plant for the removal of iron and silica, where these can be liberated within the limits of ordinary fi ne grinding.
They added the cautionary note that separation of fl uorite from barite presented some diffi culties but confi dently expected that these could be overcome by differential fl otation (Tyler and Stoddard, 1934). Work on the differential fl otation of barite was to start in 1934 with Ringe and Bierbrauer, from Germany, which at the time was also involved in the fl otation of barium minerals. Their specifi c interest was in the utilisation of low-grade and off-grade material such as witherite, and their work achieved separation of barite from dolomite.
In 1935 Crago and Motsinger were granted a United States patent for the fatty-acid fl otation of barite ores, desliming being a requirement. The fi rst barite fl otation plant in the USA was built by Magnet Cove Barium Corporation and went into operation on 3 June 1940 with a capacity of 30 tons of product per day, which was increased to 125 tons product per
0.00
50.00
100.00
150.00
200.00
250.00
300.00
1900 1910 1920 1930 1940 1950 1960 1970 1980 1990 2000
Year
Mar
ket P
rice
(199
8 U
S$
/ t)
0
1,000,000
2,000,000
3,000,000
4,000,000
5,000,000
6,000,000
7,000,000
8,000,000
9,000,000
Wor
ld B
arite
Pro
duct
ion
(t)
Market Price World Production
FIGURE 6.7
World production and market price of barite during the 20th century.

Spectrum Series 18
I N D U S T R I A L M I N E R A L S
213
day by mid 1945 (Norman Jr and Lindsey, 1943). The revival of well drilling in the last few months of 1943 placed considerable strain on facilities for grinding barite and led to Magnet Cove Barium Corporation building a second plant. Production at Magnet Cove would last until the late 1970s.
It was not long before barite fl otation spread around the world. In the Philippines barite was produced on Luzon IsIand in 1956 for the domestic oil drilling market, the plant had been built to process copper ore but the low grade made copper fl otation uneconomical (Schreck and Foley, 1959). US barite companies also moved offshore, taking their fl otation technology with them. A good example of this was Ireland, where Magnet Cove Barium Corp and Silvermines Lead and Zinc Co entered an agreement where Magnet Cove would develop and treat barite deposits near Ballynoc.
In Germany barite was recovered by fl otation during processing of lead–zinc–copper ore at the Rammelsberg mine near Goslar in 1961. Other innovations were the 1963 patent of Scbranz using a fatty acid alcohol phosphate ester salt to separate barite and fl uorite and the fl otation process, which reportedly increased both the purity and yield of barite recovered while processing an iron-manganese ore in eastern Germany. By 1970 Germany became Western Europe’s largest barite producer, a position it held for more than 15 years. By 1985 Sachtleben Bergbau GmbH, a subsidiary of Metallgesellschaft, was the major producer, with mines at Dreislar in the Harz Mountains and Clara in the Black Forest area (Skow and Schreck, 1963; Huvos, 1973; Rabchevsky, 1987).
In Bulgaria the introduction of fl otation caused a virtual revolution in the barite industry. Historically large lumps of barite were hand sorted and smaller size barite was benefi ciated by gravity methods. This was replaced in 1958 when the Stara Zagora and the Negushevo fl otation plants were put into operation. At Stara Zagora potash soap was used as a frother and collector, sodium silicate depressed quartz and slime, and roughing and four stages of cleaning were used. The process at Negushevo was essentially the same. Concentrate from Stara Zagora averaged about 94 per cent BaSO
4 with 81 per cent recovery and from
Negushevo about 95 per cent BaSO4 with 82.5 per cent recovery (Schreck and Roman, 1961).
Russia was slow in its introduction of barite fl otation and in the mid 1960s only two-thirds of the country’s barite consumption was produced domestically. Barite was mined by open pit and underground methods and fl otation was used at some mines. This changed in 1965 when the second and third stages of the Kentau concentrator were put into operation and its fl otation plant became the largest barite concentrator in the country. By 1974 the main centre of the former Soviet Union barite production by fl otation was Georgia, with an increasing output as a by-product from fl otation of tailings at the Achisay polymetallic complex in Kazakhstan (Karpinsky, 1980).
Some barite was produced through fl otation by companies mining primarily polymetallic and lead–zinc deposits and some was produced at barite-only deposits; however, the concentrates produced by fl otation at non-ferrous metallurgical enterprises were typically of low quality owing to the presence of fl otation reagents for the sulfi de fl otation. By 2000 new barite fl otation plants were coming online in Khazakhstan and Georgia and production was increasing from the treatment of polymetallic ore tailing (Strishkov, 1976; Levine and Wallace, 2004).

Spectrum Series 18
H I S T O R Y O F F L O TAT I O N
214
Barite was produced by fl otation in small amounts in Italy, Belgium and Romania (Klinger, 1969; Keyes, 1981; Huvos, 1974), but France was more heavily involved. The combined exploration efforts of Societe des Mines de Garrot Chaillac (SMGC) and BRGM resulted in a barite deposit in 1974 that was estimated to contain four million tons of recoverable ore. Production started in 1975, at a rate of 100 000 tons of concentrate per year with 80 per cent of the recovery by fl otation. It expanded and by 1983 was the largest French producer at about 100 000 tons per year of barite concentrate. A fl otation plant at Berthohene, Aveyron, also produced 35 000 tons per year of concentrates averaging 90 per cent BaSO
4 (Shekarchi, 1974; Sondermayer, 1983).
In the modern era of globalisation and multinational mining companies it is easy to forget that the success of fl otation is as important to small operations as it is to large. If there is one application that should be remembered in the history of fl otation as a shining example of success in adversity it is that of an almost insignifi cant barite mine in the small nation of Swaziland. A small production of barite was achieved at the Londosi mine operated by Barytes but by the mid 1970s the operation was in decline, producing only 200 tons in 1975. Treatment was by dry benefi ciation with possible use of fl otation. Before implementation of the fl otation plant the company declared bankruptcy, leading to the closure of the mine, situated in the northwestern Londosi River Valley. The Government commenced negotiations with IMCO Services, a subsidiary of Halliburton Co (USA), for reopening the mine. Proven reserves were 25 000 tons of barite, with estimated reserves of 300 000 tons within the lease area. A plant with a 2000 tons-per-month capacity consisting of gravity-separation and fl otation facilities commenced operation successfully in 1976.
With 95 per cent of barite used as a weighting agent in gas and oil-well drilling fl uids its value is heavily tied to oil drilling, and the recent surge in oil prices has seen a renewed interest in barite production. Since 2000 Kazakhstan and China become the world’s dominant barite producers, now accounting for 50 per cent of production.
Fluorspar
Historically the steel industry is the chief consumer of fl uorspar. Fluorspar is used as a fl ux in basic open-hearth and basic electric steel furnaces; a comparatively small quantity is employed in Bessemer-steel furnaces. The second largest use is in the manufacture of hydrofl uoric acid, which is utilised to make artifi cial cryolite and aluminium fl uoride (aluminium raw materials), refrigerating media and insecticides. Hydrofl uoric acid is also used in electrolytic refi ning and pickling of metals, electroplating operations, processing of high-octane gasoline, etching of glassware, frosting electric light bulbs, as an aid in straw-bleaching processes and for many other purposes.
Before the introduction of froth fl otation fl uorspar concentration was achieved by gravity. The coarser sizes presented relatively little diffi culty, with good recoveries being obtained with jigs and tables, but sizes smaller than ten mesh could not be successfully treated by gravity methods. Tailings accumulating as waste contained a large percentage of fl uorspar and from the 1920s attempts were made to use froth fl otation to recover fl uorspar in tailings from jigs and tables. Richards and Locke (1925) described a commercial fl uorspar fl otation plant that was operated intermittently at Trail, BC, Canada, between 1921 and 1925 by the

Spectrum Series 18
I N D U S T R I A L M I N E R A L S
215
Consolidated Mining and Smelting Co and which produced a small tonnage of concentrate. Flotation was carried out with oleic acid and soda ash at 80°C in Callow cells, the feed assayed 66 per cent CaF
2 and the concentrate contained 92 per cent CaF
2 and three per cent SiO
2.
Testing for fl uorspar fl otation in Russia began in 1929 and it was used commercially during the same year. One of the fi rst publications on fl uorspar fl otation was by Coghill from USBM and Greeman from Franklin Fluorspar Company, who used fl otation to upgrade ore from open-hearth furnace spar to acid grade (85 per cent to over 95 per cent CaF
2). They
worked with siliceous spar of low calcite content and used oleic acid, soap, sodium silicate and pine oil as reagents. This led to the fi rst commercial application of fl uorite fl otation in the USA in 1929 by the Aluminum Company of America.
In the 1930s research continued on the fl otation of fl uorite; one of the vexatious issues being its separation from calcite. Moser in Germany obtained an 88.7 per cent CaF concentrate from a 20 per cent CaF, 80 per cent CaCO
3 ore using chromic nitrate as a calcite
depressant, sodium oleate as a fl uorite collector, and pH of 7.4 (Mitchell, Gross and Oehler, 1939). During the 1930s many patents were lodged relating to fl uorspar fl otation, notably by Aluminum Company of America, which was a leader in fl uorspar fl otation research and patents. Their 1930 patent (Greeman and Williams) claimed that the removal of slimes was necessary for satisfactory fl otation of fl uorspar from calcite and that an excellent fl uorspar concentrate could be made using oleic acid, cresylic acid and proper modifying reagents.
The Franklin Fluorspar Company (a subsidiary of the Aluminum Company of America) commenced operation of a continuous fl uorspar fl otation plant at Rosiclare, Illinois, USA, in 1929, which initially produced acid grade fl uorspar at a rate of 800 tons per month and was soon increased (Davis, 1937). At this time the major fl uorspar producers in the world were the USA, Germany, France, the United Kingdom and Spain, with froth fl otation plants operating in each country.
0
100
200
300
400
500
600
1900 1910 1920 1930 1940 1950 1960 1970 1980 1990 2000
Year
Mar
ket P
rice
(199
8 U
S$
/ t)
0
1,000,000
2,000,000
3,000,000
4,000,000
5,000,000
6,000,000
Wor
ld F
luor
spar
Pro
duct
ion
(t)
Market Price World Production
FIGURE 6.8
World production and market price of fl uorspar during the 20th century.

Spectrum Series 18
H I S T O R Y O F F L O TAT I O N
216
The USA was the largest user of fl uorspar fl otation, in the ten years since fl uorspar fl otation had commenced at Rosiclare there were numerous new fl otation plants (Davis and Trought, 1939). One plant was the Mahoning Mining plant, which used three banks of fl otation machines to treat 200 tons of lead–zinc–fl uorspar ore per day, one each for lead, zinc and fl uorspar. Annual fl uorspar production by fl otation was 3464 tons of high-grade concentrates and 602 tons of metallurgical-grade fl uorspar. By 1938 rationalisation began with the takeover of La Purisima Fluorspar Company by General Chemical Company, which was a large consumer of acid grade fl uorspar. It rapidly tripled mill capacity. Total output of fl uorspar fl otation concentrates from 1929 through 1938 in the USA was 50 552 short tons, in 1939 annual output was 22 450 short tons and in 1940 this almost doubled to 41 467 short tons (Davis and Trought, 1940).
During World War II major emphasis was placed on increasing the supply of materials considered critical to the war effort; these included fl uorspar, which was essential in the expanded operations at steel mills and the increased production of hydrofl uoric acid, which was used in the manufacture of artifi cial cryolyte (an aluminium raw material). Production of fl uorspar by fl otation increased to meet these demands. There were also developments in aviation-gasoline manufacture in which hydrogen fl uoride was the catalyst instead of the usual sulfuric acid; in aerosol dispensers for protection from malaria mosquitoes; and in Freon for refrigeration. These enhanced the demand for acid-grade fl uorspar so that in 1943 its consumption was only slightly less than production during the latter half of the year.
At this time the outlook for the postwar market for fl uorspar was encouraging with steel production expected to remain high until the demand for commodities not manufactured during the war was satisfi ed. Some authorities predicted a postwar demand for fl uorite equal to about 60 to 75 per cent of the wartime production, others predicted that it would be permanently expanded over its prewar status (Davis, 1945). Consequently, the United States Government initiated an extensive US Bureau of Mines research program directed toward the more effective utilisation of mineral resources. Research into the recovery of fl uorite fell in the province of the Metallurgical Branch, whose activities embraced the separation of diffi cult-to-treat ores, the production of pure metals from domestic deposits, the exploitation of marginal ore reserves, the recovery of secondary metals and the improvement of industrial metallurgical practice of the time.
A major research program on fl uorite was conducted with Minerva Oil Company of Illinois, which was a signifi cant fl uorite producer. The company operated a 200-ton fl otation plant near Cave-In Rock, Illinois, and produced zinc concentrate and fl uorite concentrates of ceramic and metallurgical grades. The ceramic concentrate contained up to 96.5 per cent CaF. The process was complex, oil-bearing shale was fl oated and rejected, sphalerite was fl oated as a saleable product, then fl uorite was fl oated from the fi rst four cells of a rougher circuit and cleaned six times in cleaner cells, and multi-stage cleaning was used for fl uorite concentrate fl oated from the last two cells of the rougher circuit (O’Meara, 1946). Some acid-grade fl uorite could be made before producing ceramic and metallurgical grades.
During the 1940s there was considerable work on reagents to fl oat fl uorite. By this time there were many installations to recover fl uorite by fl otation but the separation of fl uorite

Spectrum Series 18
I N D U S T R I A L M I N E R A L S
217
from calcite and similar minerals remained as vexing as it had been in the 1930s. The Cyanamid Ore Dressing Laboratory conducted considerable fl otation work on fl uorspar and fl uorite ores from various sources, using new and old reagents, and developing methods for producing acid-grade concentrates. In 1943 Robert Booth and Joseph Carpenter from American Cyanamid Company listed some methods which achieved acceptable results. Elevated pulp temperatures apparently aided the dispersion of reagents and improved their selectivity, in fact without heating an acceptable concentrate was very diffi cult to obtain and could only be achieved with excessive reagent consumption, so the pulp was heated to 80–100°F although this was expensive and optimum temperature diffi cult to maintain during cold weather. Booth and Carpenter (1946) tried to overcome these diffi culties with the use of sulfonated acids. A major area of reagent investigation since the 1950s has been the search for more effective depressants to enhance separation of fl uorite from calcite (Nagaraj, Rothenburg and Lambert, 1988).
By 1944 the production of fl uorspar fl otation concentrates in the USA had increased to 156 672 tons, representing almost 40 per cent of total fl uorspar production. There were several new or planned fl uorspar fl otation plants (Davis and Greenspoon, 1946). The end of World War II saw reduced steel production and fl uorspar consumption, and the consumption of acid-grade fl uorspar in the manufacture of hydrofl uoric acid declined abruptly, although this was offset somewhat by an increase at glass plants. It was not until 1951 that the production levels of the mid-1940s were reached again (Davis and Greenspoon, 1948; Davis, 1954).
In the latter half of the 1940s consolidation of the fl uorspar industry in the USA occurred, with mine closures, expansions and takeovers and the 22 fl uorspar producers in 1948 (Davis, 1950) were reduced to 17 by 1950. There was an increasing trend toward the use of heavy-media and fl otation processes for treating fl uorspar since they enabled lower grade ore to be mined and treated more economically than with jigs, and they achieved higher recoveries and higher grade concentrates. These processes made it possible to produce thousands of tons of concentrates from material that had been considered waste; in fact, since fl otation was applied to the treatment of fl uorspar in the USA in 1929, a large tonnage of concentrates has been recovered from tailings resulting from other milling operations. For example, Alco Minerals acquired a property near Salem, Kentucky, rehabilitated the mill, added a battery of fl otation cells and processed tailings from the Klondike, Davenport, Blue, Franklin and other mines.
The years 1956 and 1957 represented the peak of fl uorspar fl otation production in the USA, which then entered a period of long-term decline, due partially to the depressed state of the steel industry and partially to diminished demand in the chemical industries. By 1960 only six plants were producing fl otation concentrates in any signifi cant quantity and it is perhaps poignant that the Rosiclare operations of the Aluminum Company of America, which had been at the forefront of fl uorspar fl otation ceased operations on 1 August 1965 (Kuster, 1963; Peterson, 1965; Briggs, 1966).
The use of fl otation for fl uorspar recovery increased on the world stage in the early 1950s and the dominance of the USA was replaced by that of Western Europe. In France there were fi ve fl uorspar fl otation plants in 1963 and it was estimated that of the 1962 output, 65 000 tons was 98 per cent CaF
2 fl otation concentrate and the remainder was cleaned and

Spectrum Series 18
H I S T O R Y O F F L O TAT I O N
218
cobbed ore containing about 60 per cent CaF2
(Nahai, 1964). In the following years there would be more development of fl uorspar fl otation in France, the total acidspar and metspar capacities rising to 130 000 and 25 000 tons per year respectively. Denam Anzin Mmeraux with mining operations at Prades (Pyrenees Orientales) supplied 75 000 tons per year of fl uorspar to the acidspar plant at nearby Olette and 50 000 tons per year to the metspar pelletising plant at Ria. By the mid 1970s production of marketable fl uorspar in France was 300 000 tons per year.
Across the English Channel, the march of fl otation in the early 1960s would see the production of fl uorspar rapidly double, placing the United Kingdom among the world’s leading producers of fl uorspar. Flotation concentrates came largely from old lead mines reopened for fl uorspar, ie from veins in the lead–mining areas containing mainly fl uorspar and from dumps from old lead workings. The bulk of the acid-grade fl uorspar came from Derbyshire, largely from the Glebe mine and from two fl otation plants that were constructed in Weardale (Davis, 1968). The completion by Glebe Mines Ltd of the new Cavendish gravity–fl otation plant at Eyam, Derbyshire, for the treatment of ores from the Ladywash mine resulted in a major jump in production in 1965.
By 1971 fl uorspar production ranged from small, two-man mines to one of the world’s
largest fl uorspar mining operations conducted by Laporte Industries Ltd. Laporte was
destined to become the United Kingdom’s largest producer of fl uorspar with both acid and
metallurgical fl uorspar produced in the central Cavendish mill. The C E Guilin group of
companies, Europe’s largest fl uorspar producer, commissioned an 80 000-tons-per-year
acid grade fl otation plant late in 1971. Within fi ve years a number of older operations were
becoming marginal. The Hopton, Derbyshire, fl otation plant southwest of Matlock was shut
down in 1976 but was purchased and re-equipped by Dresser Minerals International to
produce about 80 000 tons per year of acid-grade fl uorspar product. Renamed the Ryder
Point plant it recommenced operations in 1978, recovering barite and lead–zinc concentrates
in addition to fl uorspar, but was shut down in 1982. The disappearance of Dresser Minerals
left only two British producers of fl uorspar: Laporte Industries, with a 120 000-tons-per-
year plant at Stoney Middleton, near Sheffi eld and Minworth Ltd, with its two 80 000-tons-
per-year fl otation plants in Weardale. Laporte was also a major consumer of acidspar at
its Rotherham-based fl uorine chemical plant (Gowen, 1967; Reno, 1971; Keyes, 1977;
Karpinsky, 1984).
During 1969 Italian fl uorspar production was dominated by two companies – Montecatini-Edison and Mineraria Silius of the C E Giulini group, with both companies expanding production, including fl otation capacities. Minerania Silius used heavy-medium-separation to improve the grade of ore trucked to the fl otation plant at Assemini and constructed a palletising plant at Assemini to produce pellets of metallurgical-grade fl uorspar (Sondermayer, 1969; Kuklis, 1971). Flotation was also used to fl oat fl uorite from cryolite. Greenland was a major source of cryolite, which was essential in the electrolytic reduction process for aluminium, but by the 1950s fl uorite had become a major impurity in the cryolite. It was discovered that it could be removed by fl otation but that maintaining the concentration of sodium fl uoride in water used for fl otation between 1 and 9 g/L was critical
Spectrum Series 18
I N D U S T R I A L M I N E R A L S
219
for effective separation (Goldenhar, Mockrin and Doorley, 1960). Other European nations also implemented fl otation to either supplement or commence their fl uorspar industries.
In Sweden imports of fl uorspar in 1972 were about 40 per cent less than in 1971 due to the start-up of fl uorspar production at the Ysxjöberg mine in mid-1972. Annual output of fl uorspar at Ysxjöberg was about 5500 tons of fl otation concentrate, of which about 3000 tons was used in the manufacture of welding rods and 2500 tons was used in the manufacture of steel (Klinger, 1972).
The rapid industrialisation of Czechoslovakia’s steel and chemical industry saw the country consuming 100 000 tons of fl uorspar annually in 1968. About half of this requirement was satisfi ed by several small mines in northern Bohemia producing metallurgical fl uorspar concentrated by gravity separation. In 1969 a new acid grade fl uorspar fl otation plant commenced operation at Sobedruky, allowing the country to eventually become self suffi cient in fl uorspar by 1985 (Michalski, 1970; Karpinsky, 1980).
Germany fl oated fl uorspar in connection with several barite operations. The Clara fl uorspar-barite mine and fl otation plant were at Wolfach in the Black Forest and produced several barite products, as well as acid-grade fl uorspar and minor amounts of ceramic-grade fl uorspar, but by 2004 the only fl uorspar fl otation plant operating in Germany was at Karlsruhe.
The USSR became a major producer of fl uorspar in the 1970s; estimated levels of fl uorspar output for 1976 being 490 000 tons, increasing to 540 000 tons in 1980. Mined ore contained 20–45 per cent CaF
2 and hand picking, heavy media and fl otation were used for
concentration (Huvos, 1973; Strishkov, 1976; Karpinsky, 1980; Rabchevsky, 1985). During the 1980s problems with inadequate production of fl otation reagents adversely affected fl uorspar fl otation, but by 2002 it was producing 169 000 tonnes of fl uorspar concentrate, with the JSC Yaroslavsky GOK operations accounting for 70–80 per cent. Production began there in 1964 and by 1988 processing capacity had increased to 1.5 million tons per annum of ore. Production peaked in 1988 with output at 350 000 tonnes, it stopped in 1997 when bankruptcy procedures were initiated, began again in 1998, but was put on standby during 2003 due to weak sales linked to the increasing supply of lower price Mongolian concentrate. Russia’s second largest producer of fl uorspar concentrate is JSC Zabaikalsky GOK. Fluorspar is obtained as a by-product of the company’s main products – tantalum, niobium and lithium concentrates – but decreasing demand for rare metal concentrates in the early to mid-1990s forced Zabaikalsky to begin production of the concentrate using fl uorspar from the Egitinsky deposit. Other producers also had diffi cult economic times in the late 1990s.
Fluorspar fl otation successfully bridged the Mediterranean Sea into North Africa by 1967. The Hamman Zriba mine, located 70 km south of Tunis, was discovered in 1966 and was producing 25 000 tons per year of acid-grade fl uorspar in the early 1970s in a plant containing 12 fl otation cells (Woodmansee, 1969a; Shekarchi, 1976). In Morocco the El Hammam fl otation plant had a capacity of 110 000 tons per annum.
South Africa followed the example of other nations in producing fl uorspar by fl otation. In 1968 production was largely lump metallurgical grade fl uorspar, but because of the higher unit value of acid grade fl uorspar, the problem of upgrading large resources in the Marico

Spectrum Series 18
H I S T O R Y O F F L O TAT I O N
220
district, western Transvaal, received much attention. These deposits are associated with dolomite, which was considered to ‘frustrate’ fl otation. At the time the largest producer of acid-grade fl uorspar was the Kromdrai mine of Vergenoeg Mining Co, which produced 2200 tons of 97 per cent CaF
2 concentrate per month in a newly commissioned fl otation
mill. In 1972, the South African fl uorspar industry commenced an expansion in acid-grade production to meet anticipated growth in world demand and fl uorspar fl otation capacity was increased 69 per cent to 287 000 tons during the period 1972 to 1974. In Namibia in 1988 Okoruso Holdings commissioned a 50 000 tons per annum fl otation plant, which was doubled in 1997 after purchase of the plant by the Solvay Group of Brussels (Woodmansee, 1970; Jolly and Murchison, 1972).
Kenya also used fl otation for fl uorspar production, although with many trials and
tribulations. The Fluorspar Company of Kenya was established in 1971 to develop the fl uorite
deposits of the Kerio Valley and by 1973 was mining 26 733 tons of fl uorspar per annum.
In 1974 a mill was built to process acid-grade fl uorite by fl otation and produce 400 tons
of fl uorite concentrate per day, but it would not be until 1986 that low-phosphorus, high-
quality fl uorspar was produced successfully. The key was the development of an economically
feasible process for reducing phosphorus impurities in the concentrates, which had been
as high as 0.5 per cent phosphorus pentoxide. By the use of various reagents to depress
apatite in the fl otation circuit, Robertson Research showed that the phosphorus pentoxide
content could be lowered to less than 0.10 per cent. It also showed that extra cleaning of
the concentrates was required so the cleaning circuit was expanded in 1986 from six to
nine stages. Then the fl otation circuit was expanded by 50 per cent to achieve production of
approximately 64 000 tons of acid-grade fl uorspar per annum (Reed and Clarke, 1973; Jolly
and Willard, 1975; Connor, 1986a, 1986b).
With the decline in fl uorspar production in the USA and continued strong demand for the mineral Mexico began to increase production. In 1968 Asarco Mexicana SA completed its fl uorspar plant at Parral, Chihuahua, which at 77 000 tons of acid-grade fl uorspar annually from mill tailings was reportedly the largest fl uorspar fl otation plant in the world. The nation’s production of fl uorspar continued to grow at a furious rate and by 1973 the largest fl uorspar mine in the country was Las Cuevas mine, in San Luis Potosi. During 1974 Mexican producers won a 28 per cent increase in the price for fl uorspar and production was further expanded during 1975 when Industria Minera Mexico SA, announced plans for a new fl uorspar fl otation mill in Santa Barbara, Chihuahua, with a monthly production capacity of 15 000 tons. By 1980 Mexico had the world’s largest production capacity for fl uorspar and accounted for about 20 per cent of world output. It was the country’s second most valuable non-metallic mineral product, after sulfur. Fluorspar was also recovered as a by-product of sulfi de ore concentrators at Minera San Francisco del Oro and Zinc de Mexico (Ashley, 1970; Hague and Ashley, 1973; DeFilippo, 1974; Martino, 1980).
Countries of South America were to follow Mexico’s example. In Argentina in 1971, Kaiser Minera Argentina, SA announced its intention to construct a 100 000 tons per year fl otation and heavy media separation plant at Puerto Madrin; Ducilo SAIC indicated plans for the construction of a fl otation plant in Chubut Province; and in 1981 fl uorspar mining

Spectrum Series 18
I N D U S T R I A L M I N E R A L S
221
began in Rio Negro Province with a 150 000 tons per year project that included milling and fl otation. Most of Brazil’s fl uorspar was mined in Santa Catarina where three fl otation mills operated with a combined capacity of 35 000 tons per year. The largest mill, with a capacity of 25 000 tons, came on stream in mid-1972 (Velasco, 1981; Wessel, 1973).
Fluorspar fl otation started in South East Asia in 1971 with the construction of a fl uorspar heavy media and froth fl otation plant in Thailand. The acid-spar produced by Thai Fluorite Processing Company Ltd in Petchaburi Province came from the only fl uorspar froth fl otation plant in Southeast Asia (Wood, 1971; Willard, 1974).
In Mongolia more than 60 fl uorspar deposits and about 300 prospects have been discovered, mainly in the central and eastern provinces. Estimated reserves are about 18 million tons of fl uorspar. Three large joint-ventures with Russia have operated successfully since the end of 1970, and about 860 000 tons of fl uorspar are mined annually at Bor-Ondor and fl oated in a circuit using columns and pneumo-mechanical cells, with polyacrylamide, fatty acid, calcinated soda and sulfuric (aluminium?) as reagents. Concentrate production was over 120 000 tons (Wu, 1998). The fl uorite fl otation plant of the Inner Mongolia Xiangzhen Mining Company had rougher and scavenger fl otation, and six stages of cleaning fl otation, recovery was 83 per cent and the grade of fl uorite concentrate exceeded 95 per cent. In 2006, a new concentrator with the design capacity of 200 000 tonnes per year was built just next to the fl uorite mine with rougher and scavenger fl otation and eight stages of cleaner fl otation. Production was expected to be 100 000 tons per annum of fl uorite concentrate in 2009.
The world recession of the early 1990s had a dire impact on fl uorspar with dramatic decreases in the market price and production. Many fl otation operations were forced to shut down and the value of the by-products saved others. By 2000 the landscape of fl uorspar producers had again changed, with China producing over 50 per cent of the world’s fl uorspar. In the 1980s 80 fl uorspar fl otation plants were reportedly operating in China, although ten years later the number was 40. By contrast, in 2003 the USA produced less than one per cent of world fl uorspar (Anon, 2005).
In the last several decades there have been signifi cant investigations into the use of columns for the fl otation of fl uorite, although there has been very little movement away from small volume subaeration mechanical fl otation cells. One noted variation from this trend was the installation of a 2.44 m diameter Canadian Process Technologies’ external aeration column for fl uorite treatment at the Nossa Senhora do Carmo operation in Brazil in 2006 (Canadian Process Technologies, 2006).
Kaolin
The fl otation of kaolin clays is considered by many to be a recent addition to the history of fl otation. Kaolin (literally ‘white hill’) takes its name from the mountain in China from which European manufacturers of ceramics originally obtained their supplies of the raw material. The increasing demand for ceramics in Europe stimulated a search for raw materials and by the early 18th century many china clay deposits had been located in Europe. In the United Kingdom high-quality china clay deposits were discovered in Cornwall in the middle of the 18th century and these created the United Kingdom’s china clay industry. In the fi rst half

Spectrum Series 18
H I S T O R Y O F F L O TAT I O N
222
of the 19th century, production of china clay was in the hands of many small proprietors, some of whom owned the land on which the mine lay and some of whom leased it. Some consolidation took place later in the century but the industry was severely affected by World War I.
Kaolin is a white pigment and its whiteness, brightness and platy shape makes it useful as coatings and fi llings for paper and board, and for many other industrial products. The fi neness of kaolin provided an exceptional challenge to fl otation; the dewatering cost was high so air blowing was used for concentration and fl otation has only been practiced during the last 50 years. The goal of fl otation is to remove coloured impurities; a novel carrier fl otation process was fi rst used then carrierless fl otation techniques were developed. Collector chemistry was based on fatty acids and recently hydroxamates have been successfully used. A fl otation separation method was developed in the late 1920s and early 1930s in North Carolina for producing high-quality kaolin (Hardy, 2008). Carolina Kaolin Inc was founded by a group of businessmen to expoit the process and a processing plant was constructed in 1935 at the School House Mine. The product quality improved and Carolina Kaolin issued a 1937 brochure extolling the virtue of their product (Presnell, 2005). The US Bureau of Mines began investigating fl otation of kaolin (Tyler and Metcalfe, 1934) and showed that complete removal of coarse mica and quartz was necessary to achieve effective fl otation (Wilson and Cunliffe, 1933). Through the 1920s the kaolin industry faced the diffi culties caused by the slump that followed the postwar boom and excess capacity resulted in fi erce price-cutting. During the Great Depression the china clay industry was severely affected; production fell in the United Kingdom by 34 per cent between 1929 and 1931 and remained below the 1929 level throughout the 1930s. The effect was even more severe in the USA.
Flotation of kaolin and clays until the 1960s was limited and only partially successful. Some effort was made to eliminate impurities by oiling and fl oating them, and amines were used to fl oat clays, although impurities also fl oated. Spurred by the high cost of high-quality imported clays from England, Edgar Brothers of New Jersey began serious investigation into clay fl otation. In 1939 they discovered that sulfi te waste liquor from the manufacture of paper pulp was a remarkable fl otation agent for kaolin, as ‘evidenced by the fact that the bubbles of the froth are generally milky with clay (and clay alone) throughout their area …’ (Phelps, 1941). Within a year they were attracting attention with their clay fl otation process. Crude clay, containing 25 per cent solids was mixed with sulfi te waste liquor at a rate of 35 lb/t of clay, rougher concentrate was recleaned through Callow cells three times, with dilution water progressively added until the last concentrate was only 1.5 per cent solids. The process produced a concentrate of ‘Satin’ grade, with particles no larger than three microns. Recoveries were about fi ve per cent and dewatering was time consuming (Lane and Phelps, 1941). By 1946 they had moved away from direct fl otation of the clays and were focused on fl oating the impurities. Using soda ash as a pH modifi er, sodium silicate as a dispersant, and an emulsion of a fatty acid and fatty acid amine, coconut oil fatty acid amine, they were able to remove coloured impurities, giving a high brightness tailing (Leck, 1951). The methods pioneered by Edgar Brothers Company were effective in coarser sized clays, but with particle sizes of only several micrometres it was only ‘mediocre’. Within 15 years the company’s work would be largely forgotten by fl otation history, replaced by a new method of clay/kaolin fl otation.

Spectrum Series 18
I N D U S T R I A L M I N E R A L S
223
A sequence of events during the next 20 years led to an innovative fl otation method. Up
to 1930 distillation was used almost exclusively to refi ne crude oil to gasoline and other
products, then catalytic converters were used, which converted a higher percentage of crude
oil to gasoline and resulted in gasoline having higher octane numbers. The initial catalysts
were various synthetic types of aluminosilicates. In the early years of World War II, Wright
W Gary experimented with bentonite and a successful catalyst was developed from bentonite
and produced in a plant in California. A few years later David Lilienthal assembled Minerals
and Chemicals Corporation and attempted to use kaolins as the feed stock for the manufacture
of catalysts because they contained no iron to poison catalytic activity. A commercial product
was developed and manufactured in Georgia (Grim, 1988).
In the 1950s Minerals and Chemicals Corporation, still a small kaolin producer, merged with the powerful trading fi rm Philipp Brothers and within several years would patent the process of carrier fl otation for kaolin that would revolutionise the kaolin industry. Kaolin clay was slurried with sodium silicate as a dispersant and conditioned with tall oil and calcium carbonate. Fine impurities such as iron-anatase ‘ piggy back’ the calcium carbonate and fl otation was with tall oil (Basillio and Mathur, 2006). This process was the fi rst successful anatase-removal process used with kaolin on a large scale (Willis, Mathur and Young, 1999). Rollien Wells and Earl Hayes of the US Bureau of Mines (1961) described it as ‘A fl otation process, yet too new for proper evaluation …’ Minerals and Chemicals Philipp had great confi dence in their development, building a US$2 million plant at McIntyre, Georgia, USA, to produce kaolin. The plant, which was the fi rst to use ultrafl otation, commenced operations in 1962. By 1966, the company’s sales had reached US$709 million and it merged with Engelhard Industries in September 1967. English China Clay International (ECCI) developed the fi rst carrierless fl otation process for removal of impurities from kaolin (Cundy, 1969). The two essential features of this process were high-energy scrubbing of the kaolin slurry at 40–60 per cent solids and the presence of activator ions such as calcium. The scrubbing action, according to Cundy, cleaned the minerals of their contaminants and high-speed agitation probably led to surface coating of only the anatase particles and to selectivity. The collector-coated anatase particles may be selectively coagulated under the high-speed agitation, which effectively increases the particle size and allowed fl otation. In the ECCI process, the kaolin crude is conditioned with oleic acid and calcium salts under alkaline conditions. The fl otation solids are reduced to 15–20 per cent, and standard subaeration fl otation cells are used to remove the coloured impurities (Willis, Mathur and Young, 1999).
English China Clays was a company with a long history in the industry. In 1919, the three
largest clay producers in Cornwall merged to form English China Clays Ltd (ECC), which
had an annual output three times the tonnage of its nearest competitor. Over the next
decade ECC increased its dominance of the industry by further acquisitions and mergers
and a research department was established, initially to work on fl otation/fractionating clay
particles to produce the more highly refi ned product required by paper manufacturers. One
of the most signifi cant developments was carrierless fl otation of kaolin.
Historically Czechoslovakia was the third major kaolin producer in the world, with the USA and the United Kingdom. By 1969 the country had a developed kaolin industry

Spectrum Series 18
H I S T O R Y O F F L O TAT I O N
224
satisfying domestic consumption requirements and exporting 150 000–200 000 tons. The bulk of kaolin production is derived from deposits at Karlovy Vary, Plzen and Podborany. Construction of the Bozicany kaolin fl otation plant started in 1968 and commenced production in 1972, and there were several other fl otation plants (Michalski, 1970).
Freeport Kaolin had been a producer of kaolin since the 1960s and had years of experience in sulfur fl otation through the Freeport Sulfur Company. The titanium removal and extraction process (TREP) was developed at Freeport Kaolin and is a carrierless fl otation that uses oleic acid as a conditioning reagent in the presence of a calcium activator under acidic conditions (Young, Morris and Brooks, 1985). A major improvement of the TREP over the previous kaolin fl otation processes was fl otation at the same high solids as during conditioning, ie in excess of 25 per cent.
Until the 1980s kaolin fl otation was based on the use of the fatty acid or tall-oil type of
collectors that require the use of activator cations. The presence of activator ions made the
process sometimes diffi cult to control because of the necessity to maintain a proper balance
between the amounts of collector and activator added. It was therefore desirable to have a
collector for coloured impurities that does not require activators. Yoon and Hilderbrand
(1994) fi rst patented a successful kaolin fl otation process based on hydroxamate collectors.
The hydroxamate collectors can be used effectively at pH values above six, at which the
dispersion of clay is readily achieved. The amounts of these reagents required for fl otation
are considerably less than those typically used in the conventional tall oil fl otation process.
Also, the hydroxamate collectors possess frothing properties so that no frothers may be
necessary for fl otation. The commercial introduction of hydroxamate collectors to the
TREP process in the late 1990s resulted in signifi cant improvements in the plant. The
overall plant process is simplifi ed by switching from the cumbersome Ca activation system
to hydroxamates only and, more importantly, the number of conditioners is reduced by
half, providing substantial energy and maintenance savings of about 50 per cent (Gorken,
Perez and Ravishankar, 2005).
REFERENCES
Adams, A S, Kobey, S M and Sayrei, M J, 1931. Flotation of hematite a laboratory success, Engineering and Mining Journal, 132:53–55.
Anon, 2005. Fluorspar, Natural Environment Research Council, British Geological Survey.
Araújo, A C and Peres, A E C, 1995. Froth Flotation: Relevant Facts and the Brazilian Case, pp 20–29 (CETEM/CNPq: Rio de Janeiro).
Araújo, A C, Viana, P R M and Peres, A E C, 2005. Flotation machines in Brazil – Column versus mechanical cells, in Proceedings Centenary of Flotation Symposium, pp 187–192 (The Australasian Institute of Mining and Metallurgy: Melbourne).
Ashley, B E, 1970. Mineral industry of Mexico, in Bureau of Mines: Minerals Yearbook Area Reports: International 1968, pp 507–516.
Barr, J A, 1946. Machines for nonmetallic fl otation, AIME Transactions, pp 429–439.
Basillio, C and Mathur, S, 2006. Kaolin fl otation practice, in Froth Flotation – A Century of Innovation (eds: M C Fuerstenau, G J Jameson and R-H Yoon) (Society for Mining, Metallurgy and Exploration: Littleton).

Spectrum Series 18
I N D U S T R I A L M I N E R A L S
225
Booth, R B and Carpenter, J E, 1946. Benefi ciation of fl uorite, US Patent 2419770.
Breerwood, C H, 1933. Manufacture of cement, US Patent 1931921.
Briggs, R C, 1966. Fluorspar and cryolite, in Bureau of Mines: Minerals Yearbook Metals and Minerals (Except Fuels) 1965, vol I, pp 413–426 (United States Government Printing Offi ce: Washington).
Broadbridge, W and Edser, E, 1925. Production of fertiliser material, US Patent 1547732.
Canadian Process Technologies, 2006. Installation list, updated 6 March 2006.
Chin, E, 1986. Mineral industry of China, in Bureau of Mines: Minerals Yearbook Area Reports: International 1981, pp 197–222.
Clemmer, J B and Clemmons, B H, 1945. Flotation of iron ore, US Patent 2383467.
Connor, K, 1986a. Mineral industry of other East African countries, in Bureau of Mines: Minerals Yearbook Area Reports: International 1985, pp 987–1006.
Connor, K, 1986b. Mineral industry of Turkey, in Bureau of Mines: Minerals Yearbook Area Reports: International 1986, pp 851–858.
Crabtree, E M and Vincent, J D, 1962. Historical outline of major fl otation developments, in Froth Flotation. 50th Anniversary Volume (ed: D W Fuerstenau), pp 39–54 (The American Institute of Mining, Metallurgical and Petroleum Engineers: New York).
Cundy, E K, 1969. Separation of mineral fi nes by means of fl otation, German Patent 1912306.
Davis, H W, 1937. Fluorspar and cryolite, in Minerals Yearbook 1937 (ed: H H Herbert), pp 1337–1351 (US Bureau of Mines).
Davis, H W, 1945. Fluorspar and cryolite minerals, in US Bureau of Mines Yearbook 1945.
Davis, H W, 1950. Fluorspar and cryolite, in Minerals Yearbook 1948 (ed: H H Herbert), pp 525–544 (US Bureau of Mines).
Davis, H W, 1954. Fluorspar and cryolite, in Minerals Yearbook 1951 (ed: P W McGann), pp 574–591 (US Bureau of Mines).
Davis, H W and Greenspoon, G N, 1946. Fluorspar and cryolite, in Minerals Yearbook 1944 (ed: E W Pehrson), pp 1399–1422 (US Bureau of Mines).
Davis, H W and Greenspoon, G N, 1948. Fluorspar and cryolite, in Minerals Yearbook 1946 (ed: E W Pehrson), pp 507–524 (US Bureau of Mines).
Davis, H W and Trought, M E, 1939. Fluorspar and cryolite, in Minerals Yearbook 1939 (ed: H H Herbert), pp 1281–1295 (US Bureau of Mines).
Davis, H W and Trought, M E, 1940. Fluorspar and cryolite, in Minerals Yearbook 1940 (ed: H H Herbert), pp 1295–1312 (US Bureau of Mines).
Davis, L E, 1968. Mineral industry of California, in Bureau of Mines: Minerals Yearbook Area Reports: Domestic 1964, pp 157–214.
De Filippo, R J, 1974. Mineral industry of Mexico, in Bureau of Mines: Minerals Yearbook Area Reports: International 1974, pp 637–650.
de Polo, T and Tucker, G E, 1958. Feldspar, nepheline syenite, and aplite, in Minerals Yearbook Metals and Minerals (Except Fuels) 1956, pp 465–473 (Bureau of Mines).
de Polo, T and Tucker, G E, 1959. Feldspar, nepheline syenite, and aplite, in Minerals Yearbook Metals and Minerals (Except Fuels) 1958, pp 427–435 (Bureau of Mines).
de Polo, T and Tucker, G E, 1960. Feldspar, nepheline syenite, and aplite, in Minerals Yearbook Metals and Minerals (Except Fuels) 1959, pp 433–452 (Bureau of Mines).
de Polo, T and Tucker, G E, 1961. Feldspar, nepheline syenite, and aplite, in Minerals Yearbook Metals and Minerals (Except Fuels) 1960, pp 451–458 (Bureau of Mines).
de Vaney, F D, 1945. Benefi ciation of magnetite concentrates by fl otation, US Patent 2388471.

Spectrum Series 18
H I S T O R Y O F F L O TAT I O N
226
Emery, A H and Stoddard, B H, 1935. Talc and ground soapstone, in Minerals Yearbook 1935 (ed: O E Kiessling), pp 953–962 (Bureau of Mines).
Federal Reserve Bank Minneapolis, 1953. Taconite: Source of tomorrow’s steel, in Federal Reserve Bank Minneapolis monthly review supplement, pp 1–14.
Ferris, L W, 1943. Method of treating potassium chloride concentrates, US Patent 2336854.
Ferris, L W, 1944. Method of treating sodium chloride tails, US Patent 2340523.
Forbes, J M, 1956. Iron ore, in Minerals Yearbook Metals and Minerals (Except Fuels) 1953, pp 545– 574 (US Bureau of Mines).
Frommer, D W and Colombo, A F, 1966. Process for improved fl otation treatment of iron ore by selective fl occulation, US Patent 3292780.
Gaudin, A M, 1934. Method of fl oating of hematite, US Patent 1979324.
Gauthier, R, Patterson, W and Owen, R, 2000. PCS potash – New Brunswick Division, in Canadian Milling Practice – CIM Special Volume 49 (ed: B Damjanovic), pp 241–242.
Gnam, C A and Cornthwaite, M A, 1937. Talc, pyrophyllite, and ground soapstone, in Minerals Yearbook 1937 (ed: H H Hughes), pp 1329–1335 (Bureau of Mines).
Goldenhar, L E, Mockrin, I and Doorley Jr, F M, 1960. Flotation separation of cryolite and fl uorite, US Patent 2965231.
Gorken, A, Perez, W and Ravishankar, S A, 2005. Flotation purifi cation of kaolin clay with hydroxamate collectors, in Proceedings Centenary of Flotation Symposium, pp 757–762 (The Australasian Institute of Mining and Metallurgy: Melbourne).
Gowen, J B, 1967. Mineral industry of the United Kingdom, in Bureau of Mines: Minerals Yearbook Area Reports: International 1965, pp 707–730.
Grim, R E, 1988. The history of the development of clay mineralogy, Clays and Clay Minerals, 36(2):97–101.
Gruber, G A and Kelahan, E, 1988. Flotaire cell applications, in Phosphate Flotation, Column Flotation ’88 – Proceedings of an International Symposium, Chapter 20 (Society for Mining, Metallurgy and Exploration: Littleton).
Gunsallus, B L and Uswald, F P, 1956. Feldspar, nepheline syenite, and aplite, in Minerals Yearbook Metals and Minerals (Except Fuels) 1953, pp 441–451 (Bureau of Mines).
Gunsallus, B L and Uswald, F P, 1958. Feldspar, nepheline syenite, and aplite, in Minerals Yearbook Metals and Minerals (Except Fuels) 1955, pp 441–450 (Bureau of Mines).
Hague, J M and Ashley, B E, 1973. Mineral industry of Mexico, Bureau of Mines: Minerals Yearbook Area Reports: International 1973, pp 607–621.
Hardy, M C, 2008. Remembering Avery County: Old tails from North Carolina’s Youngest County, p 41 (The History Press).
Hedges, J H, 1935a. Potash, in Minerals Yearbook 1934 (ed: O E Kielssling), pp 1031–1046 (US Bureau of Mines).
Hedges, J H, 1935b. Potash, in Minerals Yearbook 1935 (ed: O E Kielssling), pp 1137–1164 (US Bureau of Mines).
Hedges, J H, 1937. Potash, in Minerals Yearbook 1937 (ed: H H Hughes), pp 1381–1398 (US Bureau of Mines).
Hedges, J H, 1943. Potash, in Minerals Yearbook 1943 (ed: H H Hughes), pp 1451–1464 (US Bureau of Mines).
Huvos, J B, 1973. Mineral industry of East Germany, in Bureau of Mines: Minerals Yearbook Area Reports: International 1973, pp 321–334.

Spectrum Series 18
I N D U S T R I A L M I N E R A L S
227
Huvos, J B, 1974. Mineral industry of Romania, in Bureau of Mines: Minerals Yearbook Area Reports: International 1974, pp 773–791.
Huvos, J B, 1976. Mineral industry of Sweden, in Bureau of Mines: Minerals Yearbook Area Reports: International 1976, pp 973–988.
Iwasaki, I, 1981. Selective fl occulation, magnetic separation and fl otation of ores, US Patent 4298169.
Iwasaki, I, 1999. Iron ore fl otation – Historical perspective and future prospects, in Advances in Flotation Technology (eds: B K Parekh and J D Miller), pp 231–243 (Society for Mining, Metallurgy and Exploration: Littleton).
Johnson, B L and Marsh, D I, 1946. Talc, pyrophyllite, and ground soapstone, in Minerals Yearbook 1944 (ed: E W Pehrson), pp 1389–1398 (Bureau of Mines).
Johnson, B L and Warner, K G, 1940. Talc, pyrophyllite, and ground soapstone, in Minerals Yearbook 1940 (ed: H H Hughes), pp 1321–1331 (Bureau of Mines).
Johnson, B L and Warner, K G, 1943. Potash, in Minerals Yearbook 1942 (ed: E W Pehrson), pp 1447–1461 (Bureau of Mines).
Jolly, J H and Murchison, R G, 1972. Mineral industry of the Republic of South Africa, in Bureau of Mines: Minerals Yearbook Area Reports: International 1972, pp 699–722.
Jolly, J L W and Willard, D G, 1975. Mineral industry of Kenya, Tanzania, and Uganda, in Bureau of Mines: Minerals Yearbook Area Reports: International 1975, pp 597–614.
Karpinsky, T, 1980. Mineral industry of Czechoslovakia, in Bureau of Mines: Minerals Yearbook Area Reports: International 1980, pp 283–298.
Karpinsky, T, 1984. Mineral industry of the United Kingdom, in Bureau of Mines: Minerals Yearbook Area Reports: International 1984, pp 875–892.
Keyes, W F, 1977. Mineral industry of the United Kingdom, in Bureau of Mines: Minerals Yearbook Area Reports: International 1977, pp 1033–1056.
Keyes, W F, 1981. Mineral industry of Belgium-Luxembourg, in Bureau of Mines: Minerals Yearbook Area Reports: International 1981, pp 121–139.
Klinger, F L, 1969. Mineral industry of Italy, in Bureau of Mines: Minerals Yearbook Area Reports: International 1967, pp 389–409.
Klinger, F L, 1970. Mineral industry of Finland, in Bureau of Mines: Minerals Yearbook Area Reports: International 1968, pp 227–236.
Klinger, F L, 1972. Mineral industry of Norway, in Bureau of Mines: Minerals Yearbook Area Reports: International 1972, pp 615–631.
Klyce, D F, 1966. Mineral industry of Michigan, 1964, Annual Statistical Summary 3 (Bureau of Mines: Minneapolis).
Kornhauser, B A, 1985. Mineral industry of Israel, in Bureau of Mines: Minerals Yearbook Area Reports: International 1985, pp 469–472.
Kuklis, A, 1971. Mineral industry of Italy, in Bureau of Mines: Minerals Yearbook Area Reports: International 1971, pp 443–463.
Kuster, W V, 1963. Fluorspar and cryolite, in Minerals Yearbook Metals and Minerals (Except Fuels) 1962, volume I, pp 561–583 (Bureau of Mines).
Lane, G J and Phelps, D S, 1941. Fractionation of clay, US Patent 2249570.
Le Baron, L, 1946. Effect of various fl owsheets on effi ciency of phosphate recovery at Peace Valley, Florida, AIME Transactions, pp 607–613.
Leck, T G, 1951. Flotation process for whitening clay, US Patent 2569680.
Levine, R M, 1987. Mineral industry of USSR, in Bureau of Mines: Minerals Yearbook Area Reports: International 1987, pp 877–914.

Spectrum Series 18
H I S T O R Y O F F L O TAT I O N
228
Levine, R M and Wallace, G J, 2000. The mineral industries of Armenia, Azerbaijan, Belarus, Kazakhstan, Moldova, Russia, Tajikistan, Turkmenistan, Urkraine, and Uzbekistan, in US Geological Survey Minerals Yearbook – 2000, pp 3.1–3.48.
Levine, R M and Wallace, G J, 2004. The mineral industries of the Commonwealth of Independent States – Armenia, Azerbaijan, Belarus, Georgia, Kazakhstan, Kyrgyzstan, Moldova, Russia, Tajikistan, Turkmenistan, Ukraine, and Uzbekistan, in US Geological Survey Mineral Yearbook – 2004.
Martin, H S, 1934. Milling methods and costs at the No 2 concentrator of the Phosphate Recovery Corporation, AIME Transactions, 109:339–353.
Martino, O, 1980. Mineral industry of Mexico, in Bureau of Mines: Minerals Yearbook Area Reports: International 1980, pp 659–678.
Merrill, C W and Pennington, J W, 1962. The magnitude and signifi cance of fl otation in the mineral industries of the United States, in Froth Flotation. 50th Anniversary Volume (ed: D W Fuerstenau), pp 55–90 (American Institute of Mining, Metallurgical and Petroleum Engineers: New York).
Metalloinvest Management Company, 2007. Company profi le, p 20.
Metcalf, R W, 1936. Feldspar, in US Minerals Yearbook 1936 (eds: O E Kiessling and H H Hughes), pp 981–987 (Bureau of Mines).
Metcalf, R W, 1939. Feldspar, in US Minerals Yearbook 1939 (ed: H H Hughes), pp 1297–1307.
Metcalf, R W, 1940. Feldspar, US Minerals Yearbook 1940 (ed: H H Hughes), pp 1353–1362.
Metcalf, R W, 1941. Feldspar, US Minerals Yearbook Review of 1940 (ed: E W Pehrson), pp 1313–1322.
Metcalf, R W, 1945. Feldspar, US Minerals Yearbook 1943 (ed: E W Pehrson), pp 1463–1473.
Metcalf, R W, 1946. Feldspar, US Minerals Yearbook 1944 (ed: E W Pehrson), pp 1423–1433.
Michalski, B, 1970. Mineral industry of Czechoslovakia, in Bureau of Mines: Minerals Yearbook Area Reports: International 1968, pp 221–226.
Mikhailovsky GOK, 2006. Mikhailovsky GOK introduces fl otation technology, press release, 15 December 2006.
Miller, B L and Breerwood, C H, 1938. Flotation processing of limestone, AIME Transactions, 129:195–215.
Miller, M M, 2008. Barite, in US Geological Survey Minerals Yearbook – 2008, pp 9.1–9.8 (US Department of the Interior).
Mitchell, D R, Gross, H E and Oehler, H E, 1939. Froth fl otation of fl uorspar, AIME Transactions, 134:89–101.
Monthel, J, Vadala, P, Leistel, J M and Cottard, F, 2000. Mineral Deposits and Mining Districts of Serbia (Republic of Serbia, Ministry of Mines and Energy).
Moore, P, 2005. Russia’s mineral might, Industrial Minerals, June, pp 30–39.
Moyer, F T and Balser, E V, 1945. Cement, in Minerals Yearbook 1943 (ed: E W Pehrson), pp 1241–1278 (Bureau of Mines).
Murdock, T G, 1964. Ethiopia, in Bureau of Mines: Minerals Yearbook Area Reports: International 1963, pp 903–910.
Nagaraj, D R, Day, A and Gorken, A, 1999. Nonsulfi de minerals fl otation: An overview, in Advances in Flotation Technology (eds: B K Parekh and J D Miller), pp 245–256 (Society for Mining, Metallurgy and Exploration: Littleton).
Nagaraj, D R, Rothenburg, A S and Lambert, A S, 1988. Flotation benefi ciation process for non-sulfi de minerals, US Patent 4720339.

Spectrum Series 18
I N D U S T R I A L M I N E R A L S
229
Nahai, L, 1964. Mineral industry of France, in Bureau of Mines: Minerals Yearbook Area Reports: International 1963, pp 429–495.
Norman, Jr, J and Lindsey, B S, 1943. Flotation of barite from Magnet Cove, Arkansas, AIME Transactions, pp 540–544.
North, O S and Balser, E V, 1956. Cement, in Bureau of Mines: Minerals Yearbook Metals and Minerals (Except Fuels) 1953, pp 279–313.
O’Meara, R G, 1946. Laboratory benefi ciation of fl uorite ore from the Minerva Oil Company, Eldorado, Illinois, AIME Transactions, pp 308–317.
Peres, A E C, Araújo, A C, El-Shall, H, Zhang, P and Abdel-Khalek, N A, 2007. Plant practice: Nonsulfi de minerals, in Froth Flotation. A Centenary of Innovation (eds: M C Fuerstenau, G Jameson and R-H Yoon), pp 845–868 (Society for Mining, Metallurgy and Exploration: Littleton).
Peterson, E C, 1965. Fluorspar and cryolite, in Bureau of Mines: Minerals Yearbook Metals and Minerals (Except Fuels) 1964, vol I, pp 489–505 (United States Government Printing Offi ce: Washington).
Phelps, D S, 1941. Treatment of clay by fl otation, US Patent 2249569.
Presnell, L, 2005. Mines, miners, and minerals of western North Carolina: Western North Carolina’s hidden mineralogical treasures, p 85 (World Comm: Alexander, North Carolina).
Rabchevsky, G A, 1983. Mineral industry of Austria, in Bureau of Mines: Minerals Yearbook Area Reports: International 1983, pp 79–92.
Rabchevsky, G A, 1985. Mineral industry of the German Democratic Republic, in Bureau of Mines: Minerals Yearbook Area Reports: International 1985, pp 333–344.
Rabchevsky, G A, 1987. Mineral industry of the German Democratic Republic, in Bureau of Mines: Minerals Yearbook Area Reports: International 1987, pp 325–338.
Ralston, O C, 1937. Froth fl otation and agglomerate tabling of non-metallic minerals, CIMM Transactions, vol XL, pp 691–726.
Reed, A H and Clarke, R G, 1973. Mineral industry of Kenya, Tanzania, and Uganda, in Bureau of Mines: Minerals Yearbook Area Reports: International 1973, pp 533–545.
Reno, H T, 1971. Mineral industry of the United Kingdom, in Bureau of Mines: Minerals Yearbook Area Reports: International 1971, pp 873–885.
Richards, R H and Locke, C E, 1925. Progress in ore dressing and coal washing, Min Ind, pp 776–778.
Rogers, H O and Galiher, C, 1933. Feldspar, in US Minerals Yearbook 1932-33 (ed: O F Kiessling), pp 735–743.
Schreck, A E and Foley, J M, 1959. Barite, in Bureau of Mines: Minerals Yearbook Metals and Minerals (Except Fuels) 1958, pp 197–208.
Schreck, A E and Roman, V M, 1961. Barite, in Bureau of Mines: Minerals Yearbook Metals and Minerals (Except Fuels) 1960, pp 223–234.
Searls, J P, 2005. Potash, in US Geological Survey, Mineral Commodity Summaries, January 2005, pp 126–126.
Shekarchi, E, 1974. Mineral industry of France, in Bureau of Mines: Minerals Yearbook Area Reports: International 1974, pp 321–342.
Shekarchi, E, 1976. Mineral industry of Tunisia, in Bureau of Mines: Minerals Yearbook Area Reports: International 1976, pp 1041–1048.
Skow, M L and Schreck, V R, 1963. Barite, in Bureau of Mines: Minerals Yearbook Metals and Minerals (Except Fuels) 1962, pp 273–288.
Sondermayer, R V, 1969. Mineral Industry of Italy, in Bureau of Mines: Minerals Yearbook Area Reports: International 1969, pp 401–418.

Spectrum Series 18
H I S T O R Y O F F L O TAT I O N
230
Sondermayer, R V, 1983. Mineral industry of France, in Bureau of Mines: Minerals Yearbook Area Reports: International 1983, pp 257–272.
Sprague, L G, 1947. The new cement plant of the Universal Atlas Cement Company at Northampton, Pennsylvania, AIME Transactions, pp 440–449.
Stipp, H E, 1969. Mineral industry of Morroco, in Bureau of Mines: Minerals Yearbook Area Reports: International 1967, pp 527–535.
Stone, K, 2006. Potash, in Canadian Minerals Yearbook 2005, Minerals and Metals Sector, pp 42.1–42.13 (Natural Resources Canada).
Stone, K, 2007. Potash, in Canadian Minerals Yearbook 2006, pp 42.1–42.14 (Minerals and Metals Sector, Natural Resources Canada).
Strathdee, G, Gotts, B and McEachern, R, 2007. Potassium fl otation practice, in Froth Flotation: A Centenary of Innovation (eds: M C Fuerstenau, G Jameson and R-H Yoon), pp 533–543 (Society for Mining, Metallurgy and Exploration: Littleton).
Strishkov, V V, 1976. Mineral industry of the USSR, in Bureau of Mines: Minerals Yearbook Area Reports: International 1976, pp 1065–1134.
Titkov, S, Sabirov, R and Novoselov, V, 2005. The fl otation of water-soluble minerals — Peculiarities and new technologies, in Proceedings Centenary of Flotation Symposium, pp 795–802 (The Australasian Institute of Mining and Metallurgy: Melbourne).
Tyler, P M and Metcalf, R W, 1934. Clay, in US Minerals Yearbook 1934 (ed: O E Kiessling), pp 873–887 (United States Government Printing Offi ce: Washington).
Tyler, P M and Stoddard, B H, 1934. Barite and barium products, in US Minerals Yearbook 1934 (ed: O E Kiessling), p 1017 (United States Government Printing Offi ce: Washington).
US Environmental Protection Agency, 1994. Technical resource document – Extraction and benefi ciation of ores and minerals, vol 3 – Iron, EPA 530-R-94-030, pp 2-1–2-20 (US Environmental Protection Agency, Offi ce of Solid Waste, Special Waste Branch: Washington).
Velasco, P, 1981. Mineral industry of Argentina, in Bureau of Mines: Minerals Yearbook Area Reports: International 1981, pp 61–78.
Virta, R L, 2008. Talc and pyrophyllite, US Geological Survey, Mineral Commodity Summaries, January 2008.
Von Der Weid, F C, 1946. Treatment and concentration of the graphite ores of Sao Fidelis, Brazil, AIME Transactions, 169:602–606.
Weed, F, 1935. Concentrating iron ores by froth fl otation, US Patent 2014405.
Weiner, N, 1943. Flotation process, US Patent 2329149.
Weiner, N, 1945. Flotation process, US Patent 2382360.
Weinig, A J, 1938. Flotation process, US Patent 2105295.
Wells, R R, 1963. Review of metallurgical technology, in Bureau of Mines: Minerals Yearbook Metals and Minerals (Except Fuels) 1962, pp 65–78 .
Wessel, F W, 1973. Mineral industry of Brazil, in Bureau of Mines: Minerals Yearbook Area Reports: International 1973, pp 161–176.
West, J M and Lindquist, A H, 1962. Cement, in Bureau of Mines: Minerals Yearbook Metals and Minerals (Except Fuels) 1961, pp 391–429.
Wiegel, R L, 1999. Phosphate rock benefi ciation practice, in Advances in Flotation Technology (eds: B K Parekh and J D Miller), pp 213–218 (Society for Mining, Metallurgy and Exploration: Littleton).
Willard, D G, 1974. Mineral industry of Thailand, in Bureau of Mines: Minerals Yearbook Area Reports: International 1974.

Spectrum Series 18
I N D U S T R I A L M I N E R A L S
231
Williams, J C, 1946, Cationic fl otation of cement rock, AIME Transactions, pp 543–547.
Williams, J C and Darby, G M, 1938. Discussion on fl otation processing of limestone, AIME Transactions, 129:215–216.
Willis, M J, Mathur, S and Young, R H, 1999. Kaolin fl otation: Beyond the classical, in Advances in Flotation Technology (eds: B K Parekh and J D Miller), pp 219–229 (Society for Mining, Metallurgy and Exploration: Littleton).
Wilson, H and Cunliffe, J A, 1933. Refi ning of Pacifi c Northwest kaolins by air fl otation: Journal of the American Ceramic Society, 16(3):154–162.
Wood, H B, 1971. Mineral industry of Thailand, in Bureau of Mines: Minerals Yearbook Area Reports: International 1971, pp 793–806.
Woodmansee, W C, 1969a. Mineral industry of Tunisia, in Bureau of Mines: Minerals Yearbook Area Reports: International 1967, pp 757–763.
Woodmansee, W C, 1969b. Mineral industry of Israel, in Bureau of Mines: Minerals Yearbook Area Reports: International 1967, pp 381–388.
Woodmansee, W C, 1970. Mineral industry of the Republic of South Africa, in Bureau of Mines: Minerals Yearbook Area Reports: International 1968, pp 631–653.
Wu, J C, 1998. The mineral industry of Mongolia, pp 1.1–1.6 [online]. Available from: <http://minerals.usgs.gov/minerals/pubs/country/1999/9319099.pdf>.
Yoon, R H and Hilderbrand, T M, 1994. Purifi cation of kaolin clay by froth fl otation using hydroxamate collectors, US Patent 85-28840-2167687.
Young, R H, Morris, H H and Brooks, R L, 1985. Method of treating clay to improve its whiteness, US Patent 4492628.

Spectrum Series 18 233
RESISTANCE TO FLOTATION IN THE COAL INDUSTRY
Flotation was developed in 1902 to concentrate zinc sulfi des that were contained in tailings
dumps at Broken Hill. By 1915 it was being used to concentrate copper sulfi des in low-grade
ores in Chile, Arizona and Montana, but it was 1920 before it was seriously considered for
separating coal from minerals in the fi ne sizes that gravity processes could not handle. Part
of the delay was because coal mining engineers did not realise that fl otation could work
on coal. ‘In earlier days it was believed that only sulphide or metallic minerals could be
separated by fl otation’ (Zimmerman, 1948). Even when this misconception was known to
be incorrect there was still substantial lag in the introduction of froth fl otation to the coal
industry, one reason being that it was not a method used historically for coal preparation
(Ashmead, 1921).
Coal preparation in the early 1800s consisted essentially of miners rejecting small
pieces of coal while they loaded lumps of coal into wheelbarrows. By 1830 there was some
preparation of coal on the surface, but this consisted of little more than breakage of large
lumps by men with hammers and coarse sizing. The only impurities removed were those
the men picked out by hand. Even the introduction of mechanisation in the 1850s led only
to increased throughput via breakage and size segregation, and there was little emphasis on
recovery or grade control. By the end of the century most coal preparation plants still used
dry treatment methods such as spiral pickers, which depended on differences in coeffi cient
of friction between shale and coal as sized particles slid down a spiral. Wet preparation of
coal using jigs, tables and dense media separation was still in its infancy.
A number of coal mine owners bemoaned the slow technological pace of change and recognised that methods used in metalliferous operations could have a place in the coal industry. For example Francis Peabody, who started Peabody Coal Company in the 1880s with $100, a wagon, two mules and a partner whom he soon bought out, observed in 1918 that:
As we study the old laborious methods of our fathers and compare them with present-day practice, we realise we have not improved coal mining methods at a pace equivalent to other industries (Peabody, ~1995).
C H A P T E R 7
Coal Flotation

Spectrum Series 18
H I S T O R Y O F F L O TAT I O N
234
This situation was soon to change, particularly in Europe where large coal mines had been operating for many decades and the mines were ready for technological change.
The reasons for the use of fl otation in coal processing circuits were markedly different
to those for base metals. Rather than being governed by economic considerations as at
Broken Hill, environmental issues played a major role, particularly in the United Kingdom
(Macpherson, 1962). The extensive use of dry coal treatment methods resulted in substantial
generation of dust and this exacerbated the problem of pneumoconiosis, which was prevalent
in underground coal mines. The legislation enacted to suppress coal dust often required
the extensive use of water underground, which caused increases in the moisture content
of run-of-mine coals and decreases in the effi ciencies of the dry cleaning plants. This led to
the replacement of plants using dry coal cleaning processes with coal washeries using wet
processes, from which there were large outfl ows of dirty waters that polluted streams and
watercourses. The loss of fi nes in the wastewater had several adverse effects:
• it represented a signifi cant loss of revenue,
• it caused deterioration in the structure of the cokes that could be produced, and
• it seriously polluted local watercourses.
For both environmental and economic reasons it was timely to use froth fl otation as part
of coal processing systems. In the 1920s the fi nes problem was more urgent in Europe than
in the USA because coal mining in European mines was mainly carried out underground
in thin seams, and the mechanised mining techniques that were used generated a high
proportion of fi nes. In the USA the thick seams that were commonly mined created much
smaller amounts of fi nes per ton of coal so the incentive to use coal fl otation to recover fi nes
was much weaker there than in Europe.
THE EARLY YEARS OF COAL FLOTATION 1915–1930
By the end of the 19th century coal was the main source of energy for industry, railroads and domestic heating in the wealthier countries. Coal production was rising rapidly as demand rose, for example in the USA 205 million tons were mined in 1900 and this increased to 600 million tons by 1916. The fi nes per ton in the USA may have been small because of the thickness of the seams but the total volume of fi nes was high, so there was good reason to fi nd a process to separate coal and minerals in the fi ne sizes. Two research groups at universities took up the challenge; one was the fl otation chemicals group at Mellon University in Pittsburgh, which was established by the Metals Recovery Company to develop chemical collectors for sulfi des, and the other was at the University of Washington in Seattle, where a collaborative program was set up by the university and the US Bureau of Mines (USBM). The Pittsburgh group was close to large coal mines and it is not surprising that one of its early patents was concerned with concentrating bituminous coal by fl otation (Bacon, 1920). The process was simple; crush the coal to less than 0.3 mm, add 1–1.5 lbs per ton of pine oil and fl oat the coal using a Callow cell. Results were good but the low value of coal meant that the economic incentive to use fl otation was not strong and the high cost of dewatering coal concentrate was also a deterrent. In Seattle, the University–USBM joint coal fl otation

Spectrum Series 18
C O A L F L O TAT I O N
235
program continued from 1918 to 1940. It succeeded because engineers in the program worked closely with plants, and in time the unit became pre-eminent in coal fl otation (Aplan, 1999).
In Europe there was major impetus to use fl otation in coal preparation circuits in the
immediate post World War I years because of high fi nes in the coal mined from thin seams.
In 1920 an extensive experimental program was carried out at Skinningrove Iron Co near
Newcastle in the United Kingdom to fl oat fi ne coal and reject the clay in tailings using standard
Minerals Separation cells with their separate mixing and frothing boxes. The objective was
to improve the coke made for the iron furnaces and several small coal washers were built to
evaluate the fl otation process when used with coal plant rejects such as crushed coking coals,
washery wastes, fi ne coal sludges and dump wastes. Reagents were generated locally since
the water used for washing naphthalene from coke oven gas contained suffi cient chemicals to
fl oat the coal. Flotation was carried out at 15–20 per cent solids on coal screened at 2.5 mm,
low ash fi nes were fl oated in the fi rst cells, then paraffi n was added and bone coal containing
12–15 per cent ash was fl oated in the remaining cells. The result of the program was that coal
recovery by fl otation was high, the coke made from the concentrates had physical strength
that was beyond the experience of the management, and the process was easy to operate. The
conclusion was unambiguous:
The extraordinary fl exibility of the fl otation method of washing coal, which permits the treatment of all grades of fuel down to the smallest dust, will, in our opinion, become an asset of national importance. There is no pit heap containing coal, or washery heap, or fi ne dust, or other colliery waste, from which the coal cannot be completely recovered by this method of treatment (Bury, Broadbridge and Hutchinson, 1920–21).
The outcome was the construction of a 600 tons per day coal fl otation plant in Wales.
Coal mining engineers in Europe were becoming more familiar with fl otation and it
prospered, with plants for cleaning –0.5 mm coking coal by froth fl otation being built in
Spain and France in 1920, Great Britain in 1922 and Belgium and Germany in 1923 (Chapman
and Mott, 1928). In 1925 one million tons of coal were fl oated in Europe and in 1927 this
tonnage was fl oated in Great Britain alone. By then plants were operating in Saxony, Silesia,
Westphalia and Saar in Germany, and fl otation was expanding in Spain and France.
In the USA the thick coal seams, which only produced a small fraction of fi nes per tonne
during breakage and transport, meant that there was little interest by local coal companies
in fl otation in the early 1920s, but the topic was kept alive by the university groups in Seattle
and Pittsburgh and by individual engineer-inventors, who realised that coal fi nes would be
important in the future. Patents were taken out on the use of fl otation to separate minerals
from coal and to reclaim coal from dumps and sludges, for example by Lindell Bates, who
pulverised Pennsylvania anthracite to liberate the minerals and then fl oated the coal as a
high-grade product (Bates, 1925), and by Eltoft Wilkinson of Minerals Separation, who used
xanthate as a collector to extract coal from domestic ashes in dumps in Brooklyn (Wilkinson,
1928). A commercial coal fl otation plant did operate in Snoqualmie, Washington, in 1926
to treat washery sludge but it was small and worked intermittently for only a short time

Spectrum Series 18
H I S T O R Y O F F L O TAT I O N
236
(Aplan, 1999). But the apathy of coal companies towards fl otation in the early 1920s would
change as fi nes in mined coal increased, and it would become an important process for
recovering high-grade coal fi nes by the end of the decade.
In Canada a 50 tons per day plant was built on Vancouver Island in 1922 to treat high ash sludge and other washery products. It operated with two to ten per cent solids in the pulp, which was low but would have reduced entrainment and improved the quality of the product (Peterson, 1922).
Flotation cells
The cells used for coal fl otation in its early years were discussed by Chapman and Mott (1928). Some cells were used because they were known to fl oat sulfi de minerals so they were considered sure to work, others because they used compressed air for mixing and aeration and this was available at the mines.
Cells adapted from sulfi de fl otationThe starting point for fl oating coal was to use cells that were known to work. They will be mentioned in this chapter although they have already been discussed.
The most important of the early cells was the standard Minerals Separation cell, which was the cell used when trials of coal fl otation were carried out at Skinningrove. In this cell air was beaten into the pulp by vigorous agitation and the aerated pulp was discharged into a spitzkasten in which the froth rose to the surface of a quiescent pulp. In some cases with coal a double spitz was used to assist in the removal of the voluminous froth. By 1928 36 Minerals Separation circuits had been installed in coal plants, with capacities ranging from fi ve to 30 tons per hour. Fourteen circuits were in Spain, 12 in Germany, two in Belgium, one in France and seven in the United Kingdom.
FIGURE 7.1
Cells used for sulfi des, which were applied to coal in the 1920s (Chapman and Mott, 1928)Standard Minerals Separation Cell (left), Elmore vacuum cell (middle), Callow fl otation cell (right).

Spectrum Series 18
C O A L F L O TAT I O N
237
Another cell used for coal was the Elmore vacuum fl otation cell which, like the Minerals Separation cell, was fi rst used on sulfi de tailings at Broken Hill. Modifi cations were required to make the machine suitable for coal fl otation (Elmore, 1929) since the high fl uid velocities and turbulence tended to detach the coarser coal particles from air bubbles. The design was altered so that the horizontal base of the original separating chamber was replaced by an inverted cone. The Elmore vacuum process had only limited success with sulfi de ores but it was widely used in England for many years to fl oat coal because the power required was low; the froth was easy to dewater and coarse particles up to 4.8 mm could be fl oated.
The Callow pneumatic cell was also used to fl oat coal (Callow, 1921). Air was forced under pressure through the canvas bottom of the cells and formed bubbles that attached to and fl oated coal particles in the pulp. It had a quiescent contacting zone that was considered ideal for recovery of coarser coal since particles did not detach from the bubbles, but it tended to struggle with the high mass recoveries often required in coal fl otation.
Cells built for coal fl otationThe Ekof fl otation cell was the fi rst froth fl otation machine to be built in Germany. It was based on the patents of G Gröndal and was manufactured by Erz and Kohlen-Flotation. It used compressed air injected directly into the coal pulp for agitation and aeration. The feed and tailings sections (a, e) and the aeration (b, c) and froth launder (d) systems, are shown in the sketch in Figure 7.2. Numerous Ekof plants operated in Germany with cells having a treatment rate of up to 12 tons per hour of raw slurry. Ekof is the only brand name of the pre-1920 fl otation cells that remains active today.
The Humbolt cell was another German invention that also used compressed air for mixing and aeration. The compressed air impacted on an impingement plate and provided agitation before the aerated pulp entered a frothing chamber from which the concentrate overfl owed. Other cells using compressed air were:
• The Kleinbentinck fl otation apparatus, which was invented by the chief engineer of the Dutch State Mines. It was a subaeration machine and was used in numerous coal washeries in Holland and France. The capacities of the cells varied from ten to 15 tons per hour.
• The Coppèe fl otation apparatus, in which the coal-water-oil mixture was admitted to a mixing chamber and compressed air used for agitation and aeration. The aerated pulp fl owed to a frothing chamber where more air was added. The froth was collected into the froth overfl ow launder.
• The Electro-Osmose fl otation cell, which consisted of a vessel to which feed and compressed air were admitted at the base. A rotating mixer entrapped and agitated the coal and air. The froth rose through calming plates before overfl owing into a launder.
Reagents
The reagents used in the early years of coal fl otation were taken from existing fl otation chemicals, the economics of coal fl otation did not encourage expenditure on reagent research. Cresol (cresylic acid) or creosote oil were commonly used as frothers and kerosene,

Spectrum Series 18
H I S T O R Y O F F L O TAT I O N
238
paraffi n oil, gas oil or tar oils as collectors (Chapman and Mott, 1928). Pine oil, diesel oil and oils derived from shale, coal or vegetable sources were also used (Bacon, 1920). Eucalyptus oil, for a period extensively used for base metals fl otation, is also referred to by Bates (1925) as a coal reagent. Xanthates were found to produce low ash coal concentrates at high recovery of combustibles (Wilkinson, 1928; Kühlwein, 1928), although their use never became widespread, perhaps because of high cost. It was claimed that xanthates kept clay in suspension and that this reduced the ash content of the product.
COAL FLOTATION 1930–1960
The 1930s provided a period of unprecedented growth in coal fl otation in Europe. According to Ralston (1937), ‘a few coal-fl otation plants are operating in nearly every major coal mining country’. In 1933 there were 60 coal fl otation plants in Europe – 20 each in Germany and Spain and six in England – and there was one plant in the USA (Mayer, 1933).
In Holland the Dutch State Mines had been established in 1902 to improve the effi ciency of coal mining and processing and under the guidance of its management the coal industry
FIGURE 7.2
Cells built for coal fl otation (Chapman and Mott, 1928), Ekof cell (top left),Kleinbentinck cells (top right), Elektro-Osmose cell (bottom left), Coppee cell (bottom right).

Spectrum Series 18
C O A L F L O TAT I O N
239
had become a major user of fl otation, including the development of their own cell. In the 1920s the Dutch State Mines was reported to operate the three largest coal fl otation plants in the world; the Maurits mine, which produced 1500 dry tons of coal per day by fl otation, and the Emma and Hendrik mines, which produced 900 and 700 dry tons of coal per day respectively. Because of their success Dutch State Mines coal operations were required to use fl otation on their washery wastes. Coal fl otation was gaining momentum.
In the late 1940s in England the National Coal Board established the use of fl otation. In the Durham Division of the National Coal Board only 430 tons of coal were produced by fl otation in 1947, which represented less than one per cent of total coal production, but by 1962 11 per cent of total coal production was made by fl otation (Macpherson, 1962). In India fl otation was applied to the hard-to-treat coals, while in Germany 43 froth fl otation plants were operating by 1962, each treating between 40 and 120 tons per hour. These plants made up one quarter of all German washeries, treating 3.5 per cent of the run-of-mine coal produced (Sallman, 1962).
In the USA major coal fl otation work was conducted by the Pittsburgh Coal Company (Davis, 1948). Pittsburgh Coal was established in 1881 and became a large coal producer, but the weakness of the coal market after World War I caused fi nancial problems and to correct these problems the company decided to improve their production systems, including the use of fl otation. From 1930 to 1935 extensive test work was undertaken on reagents and types of fl otation machines on a small scale, and from 1932 to 1944 mill-size subaeration cells were tested in various confi gurations in a preparation plant. The company owned several preparation plants and in 1932 a fl otation circuit commenced operation in one plant using subaeration machines, which was followed by circuits in other plants. The circuits worked on fi nes (–300 micron) in wash water, which were thickened and fl oated in rougher-cleaner circuits using cresylic acid, kerosene and spray oil. Typical results were seven per cent ash product from 16 per cent ash feed with 87 per cent recovery (Aplan, 1999). Cleaner cells were found to reduce pyrite in the product. From 1935 to 1944 fl otation was used in coal washeries and was only discontinued when strip mining of a high clay coal made fl otation diffi cult. The development work on fl otation at the Pittsburgh Coal Company showed that –300 micron coal could be handled effectively by fl otation in a rougher-cleaner circuit. It was a major advance in coal fl otation and the publications from the work would have been important when decisions were being made by other companies about using coal fl otation circuits.
In 1939 the Pennsylvania Power and Light Company started to investigate the use of fl otation to clean coal rejects deposited in the Susquehanna River during many years of operation and eventually built a large fl otation plant. Material was dredged at 4000 tons per day, screened and classifi ed and the fi nes were fl oated at 2500 tons per day. Pine oil and fuel oil were the reagents, and a 16 per cent ash product and 68 per cent ash tailings were made from a 31 per cent ash feed. Coal fl otation circuits at this time were similar to base metal circuits, ie roughers, scavengers and cleaners, but the trend was moving towards open circuit roughing at low pulp densities as had been carried out on Vancouver Island 20 years previously. In 1945 Lehigh Navigation Coal Company built a 90 tons per hour fl otation plant at its Tamaqua Colliery to remove coal from the anthracite plant wastewater and its accumulated silt banks (Parton and Rupert, 1948). Reagents were pine oil and fuel oil, the

Spectrum Series 18
H I S T O R Y O F F L O TAT I O N
240
conditioning and fl otation times were very long and the recovery of coal was excellent. There was increasing rationalisation of the wide variety of coal fl otation reagents, with a tendency towards quality control rather than just cost of reagent. Cresol, the impure product of coal making, appeared to be a cheap and readily available frother, but experience did show it had several problems:
• it absorbed strongly onto coal surfaces, which meant that large addition rates were used; and
• commercial grades used for frothing had collecting powers that varied widely.
Pine oil also suffered due to variation in quality and collecting power.
These issues saw both cresol and pine oil increasingly replaced with MIBC (methyl iso-butyl carbinol). Diesel oil became the dominant collector, with kerosene being used to a lesser extent. The wide variety of machines in plant fl otation circuits also diminished. The older plants in Europe still used the Minerals Separation standard fl otation cells and an assortment of pneumatic cells, but subaeration machines had become the choice for newer washeries (Sallman, 1962) and by the 1960s the subaeration fl otation machine had become the dominant coal fl otation machine, following the trend in metalliferous fl otation. Among the major equipment suppliers of the time were the Denver Equipment Company, Unifl oc Limited and Knapp and Bates (Macpherson, 1962).
COAL FLOTATION 1960–1975
The year 1960 saw coal fl otation in Europe at its apex, with the next 40 years representing a period of decline. This coincided with a major increase in coal fl otation in the USA, the period from 1960 to 1965 in particular showing unprecedented growth. In 1960 the number of coal washeries using fl otation in the USA numbered 31, with an annual output of 2.8 million short tons. By 1965 this had more than doubled to 69, as had annual output, which increased to 7.0 million short tons. This frenzied activity had moderated by 1975, when 78 coal fl otation plants were producing some eight million short tonnes of coal per annum (Arbiter et al, 1985). The issue that became very important in the 1960s was the environment, because the fi ne coal and clay contaminated streams or formed sludge ponds, which could not be dewatered. Engineers anticipated these problems; they had used fl otation 20 years previously to remove fi ne coal from washery discharge streams, ash dumps and sludge ponds, and from the 1960s they increasingly used it to make a valuable product from –0.5 mm coal.
This period also saw an increase in coal production in Canada. One operation of historical interest is that of Cardinal River Coals in Alberta. The operation was developed c 1912 to mine coal for heating and steam generation and was used extensively by the railways for their steam locomotives. In 1955, the mine was decommissioned as the demand for coal for these purposes had declined. In 1960 the mine was re-commissioned to provide metallurgical coking coal for customers in Japan, utilising a fl otation circuit containing WEMCO and Denver subaeration fl otation cells.
Australia, like the USA, was slow in its adoption of coal fl otation, with the 1960s also being a watershed decade. At the start of the decade coal production by fl otation was insignifi cant; however, by 1970–71 fl otation circuits were operating in 16 coal washeries.

Spectrum Series 18
C O A L F L O TAT I O N
241
Even so coal fl otation was still not considered to be profi table by many operations (Sanders and Williamson, 1996). In terms of fl otation machine design subaeration fl otation cells were dominant. These machines were being developed with an increasingly varied array of impeller designs and tank geometry. Table 7.1 provides an indication of the various fl otation machines installed within the Australian coal industry.
Manufacturer No of banks No of cells Total volume
Wemco 35 156 1612
Denver 41 185 1481
Unifl oc 16 55 725
Warman 7 38 115
Outokumpu 2 8 128
Davcra 2 4 96
TABLE 7.1
Flotation machines installed in the Australian coal industry (Nicol et al, 1989).
COAL FLOTATION AFTER 1975
Cells
The year 1975 represented another pivotal time for coal fl otation with the ‘oil crisis’ occurring. This, together with substantial increases in coal prices saw an upsurge in the money being invested in coal fl otation research. Over the years gradual dissatisfaction with mechanically agitated fl otation cells had been growing and one major goal of research was the development of more effi cient fl otation machines. Initially this centred around the ‘Canadian’ column of Boutin and Tremblay (1963, 1964); however, its success in metalliferous fl otation was not matched in coal fl otation. Other column fl otation machines also met with mixed success in the coal industry. The Flotaire column marketed by the Deister Corporation had some success with its fi rst installation in coal in Pennsylvania in 1987, but it was not until the advent of the Jameson cell, Microcel, Ekof cell and XPM cell in the 1990s that a defi nite departure was made from the dominance of mechanically agitated fl otation machines. The feature of these cells was that they contained intensely mixed zones in which collisions between particles and fi ne bubbles considerably increased the fl otation rates of the fi ne particles. These cells were discussed in Chapter 4 but they will be mentioned again in this chapter because their main use is for coal fl otation.
Ekof cellBy the 1990s this cell had changed greatly since the original cell was developed in the 1920s and it was operating in a number of designs. In the Ekofl ot tangential pneumatic fl otation cell either compressed or naturally aspirated air contacted the coal pulp in an external aerator and the aerated mixture then entered the tank areas through pipes designed to impart a tangential motion to the pulp. In another design the air–coal slurry mixture was mixed in an external aerator before entering a vertical downcomer and being discharged into the fl otation
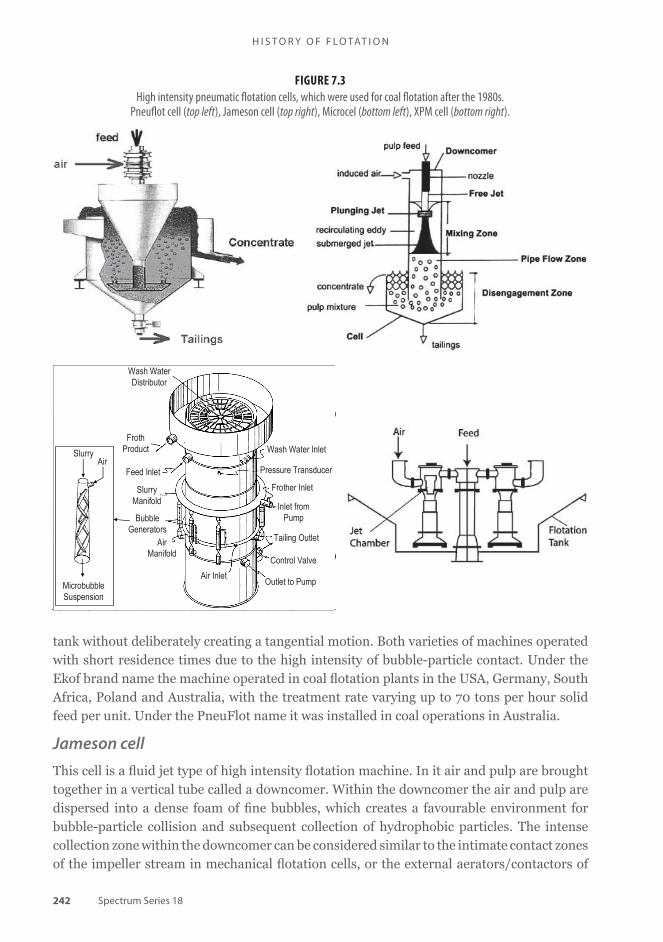
Spectrum Series 18
H I S T O R Y O F F L O TAT I O N
242
tank without deliberately creating a tangential motion. Both varieties of machines operated with short residence times due to the high intensity of bubble-particle contact. Under the Ekof brand name the machine operated in coal fl otation plants in the USA, Germany, South Africa, Poland and Australia, with the treatment rate varying up to 70 tons per hour solid feed per unit. Under the PneuFlot name it was installed in coal operations in Australia.
Jameson cellThis cell is a fl uid jet type of high intensity fl otation machine. In it air and pulp are brought together in a vertical tube called a downcomer. Within the downcomer the air and pulp are dispersed into a dense foam of fi ne bubbles, which creates a favourable environment for bubble-particle collision and subsequent collection of hydrophobic particles. The intense collection zone within the downcomer can be considered similar to the intimate contact zones of the impeller stream in mechanical fl otation cells, or the external aerators/contactors of
FIGURE 7.3
High intensity pneumatic fl otation cells, which were used for coal fl otation after the 1980s.Pneufl ot cell (top left), Jameson cell (top right), Microcel (bottom left), XPM cell (bottom right).
Wash Water Inlet
Pressure Transducer
Frother Inlet
Inlet from Pump
Control Valve
Tailing Outlet
Outlet to Pump Air Inlet
Air Manifold
Bubble Generators
Slurry Manifold
Feed Inlet
Froth Product
Wash Water Distributor
SlurryAir
MicrobubbleSuspension

Spectrum Series 18
C O A L F L O TAT I O N
243
other high intensity fl otation machines (Harbort, 2006). The concept for the Jameson cell was developed by Graeme Jameson of the University of Newcastle and the technology was developed for commercial application by Mount Isa Mines Limited (Jameson, 1990). It is used extensively in both the Australian and USA coal industries.
Microcel
The design of this cell is that of an externally aerated column. One of the major reasons for
its success in coal fl otation was its froth wash washing system, which was reported to give
signifi cantly better concentrate qualities. It was developed by Roe Han Yoon at the Virginia
Polytechnic Institute and State University, USA, with the fi rst commercial plant installed
at the Pittston Company at Middle Fork, Virginia. Other operations in the USA included
the Holston and Lady Dunn Operations. In 1995 the fi rst Microcel installation was made in
Australia at the Peak Downs operations (Brake, 1998).
XPM cell
A wide variety of fl otation machines have also been developed in China. The XPM series jet
fl otation machines are probably the best known non-subaeration machines developed by
Chinese researchers. The XPM fl otation machine is open-fl ow fed, in a similar manner to
a bank of mechanical fl otation cells. Rather than utilising a rotating mechanism they make
use of a liquid-air two phase jet, within ‘aeration-agitation’ mechanisms, arranged in series
down the bank. Part of the pulp within each cell is drawn into a circulating pump, which
pressurises the liquid before squirting the pulp from a conical jet. It is suggested that the
negative pressure in the jet chamber results in air entrainment and that the rapid decrease
in pressure after the jet chamber results in dissolved air separating out to form microbubbles
(Wu and Ma, 1998).
Technology
The interest in better coal fl otation was worldwide. During the 1990s the South African coal fl otation industry saw extensive use of the Multotech turbo column. In the United Kingdom fl otation circuits using column fl otation for the treatment of very fi ne coal were installed at the Gascoigne Wood coal preparation plant in 1997 (Budge et al, 2000). At its peak the plant throughput was 2000 tons per hour, but the mine is now closed.
The degree of coal fl otation equipment change varied from country to country, with the most dramatic change being seen in Australia. Prior to 1988 coal fl otation in Australia was almost exclusively the domain of subaeration, mechanical fl otation machines. The expansion of the fl otation circuit at Port Kembla in 1986 for example (Horrocks et al, 1988) details increases in both the number and size of mechanical fl otation cells, with no mention of alternative machines being considered. Circuits typically included a roughing bank, with a single reagent addition, or roughing and scavenging, with multiple reagent additions. In some cases separate fl otation banks were used for fi ne and coarse fl otation (Nicol and Bensley, 1988). An average fl otation bank consisted of four to fi ve fl otation cells, with each machine having an average volume of 10 m3. The machines used either induced air or forced

Spectrum Series 18
H I S T O R Y O F F L O TAT I O N
244
air, with WEMCO and Denver being the dominant suppliers. One common feature was the use of paddles to enhance froth removal, another was the extensive use of MIBC as frother and diesel as collector.
The dominance of mechanical fl otation cells in Australia continued until the 1990s, at which time the technology used in coal fl otation underwent a fundamental change. This period of innovation can be considered to have started in 1987 with the trial of a 1.7 m diameter fl otation column at the Riverside Coal Preparation Plant (Bensley et al, 1988). This was followed in 1989 by the installation of a coal slimes Jameson cell fl otation circuit at the Newlands Coal Mine (Jameson, Goffi net and Hughes, 1991). Another milestone in Australian coal fl otation occurred in 1995, with the introduction of the Microcel fl otation column to the Peak Downs Coal Preparation Plant (Stone, Brake and Eldridge, 1995). The period also witnessed the trials of other fl otation technologies including the Centrifl oat (Brake et al, 1993), Turbofl oat (Firth and Ofori, 1999) and Ekof cells (Imhof, Hohmeister and Brown, 1995). The size of material being treated by fl otation increased to 0.375 mm (wedge wire) and in some cases 0.5 mm (wedge wire). The number of rougher–scavenger circuits decreased, with an increased use of single stage roughing circuits. Wash water was extensively used. Reagents, however, showed little change, with MIBC and diesel remaining dominant. Since the year 2000 there has also been renewed interest in mechanical cell manufacturers. The change that occurred in the type of machines in use in Australia during 1980 to 2005 is shown in Table 7.2.
1980 1985 1990 1995 2000 2005
Mechanical 100 96 94 60 42 50
Column 1 1 20 27 27
Jameson 3 5 20 31 23
TABLE 7.2
Changing percentage of installed capacity during 1980 to 2005.
Outokumpu has recently completed a number of design changes specifi cally targeting coal
fl otation (Bourke, 2004; Bourke and Taylor, 2005). Both WEMCO and Metso Minerals also
resumed activity in the industry. Also of interest is the entry of the G-cell and the Imhof cell.
As mentioned earlier the two decades from 1980 to 2000 have seen a major geographical
shift in countries using coal fl otation. Much of this is due to the changes in coal producing
countries, with some of the previously large producers, such as the United Kingdom,
France, Holland and Spain, declining due to diversifi cation of power sources or closure of
uneconomic coal production. Another major change has been the breakup of the former
Soviet Union, from which Russia, Kazakhstan and Ukraine are now actively restructuring
their coal industries, including introduction of or modernisation of coal fl otation circuits.
Other formally controlled economies such as China and Poland are also doing the same.
In China the coal industry comprises 94 state-owned, large-scale operations, over 2500
mines under the ownership and management of individual provinces and over 75 000 small
mines operated by townships. Up until the mid-1980s, the state administration maintained

Spectrum Series 18
C O A L F L O TAT I O N
245
tight control of the industry and the level of investment. Coal preparation plants were
historically of a very basic design using local technology. Since the mid-1990s there has been
a move to loosen state control and a number of large mine groupings have been set up as self-
managed companies. This has resulted in a drive to produce coal of consistent quality and
increased use of fl otation. Froth fl otation is used in 14 per cent of coal preparation plants for
meeting specifi cations for coking coal and steaming coal which is exported, but it plays little
part in the upgrading of coal for domestic, industrial and power generation use.
India had been one of the earliest countries to test froth fl otation and install frotation
circuits, with approximately 50 per cent of coal fl otation plants dating to pre-1970. Froth
fl otation is commonly employed to clean –0.5 mm coking coal, which represents 24 coal
preparation plants. There is a beginning trend to upgrade old fl otation circuits with new
equipment.
In the United Kingdom, the late 1980s and early 1990s saw a trend away from coal
fl otation. This was due to the increased cost of fi ne coal recovery as well as the diminishing
importance of the coal industry. The country’s annual coal production has been in long-term
decline and overall coal production has dropped from 128 Mt (1980) to 40 Mt (1998). In
2000, there were only 15 operating coal fl otation plants in the United Kingdom and fl otation
of coal had been delegated to a relatively minor role.
In 1995 there were 345 coal preparation plants in the USA, of which 110 (32 per cent) employed fl otation (Aplan, 1999). A signifi cant driver for the increased use of fl otation was environmental legislation.
Traditionally, coal benefi ciation in the Republic of South Africa has been kept to the minimum, but in response to the demands of the increasingly important export market, it has been necessary to introduce more widespread coal preparation.
In Australia in 2005 there were 81 coal operations and 36 operated fl otation circuits, predominantly treating coal for metallurgical coke purposes.
REFERENCES
Aplan, F F, 1999. The historical development of coal fl otation in the United States, in Advances in Flotation Technology (eds: B K Parekh and J D Miller), p 274 (Society for Mining, Metallurgy and Exploration: Littleton).
Arbiter, N, Cooper, H, Fuerstenau, M C, Harris, C C and Kuhn, M C, 1985. Section 5 – Flotation, Part A – Introduction, in SME Mineral Processing Handbook, p 5-2 (Society for Mining, Metallurgy and Exploration: Littleton).
Ashmead, D C, 1921. Advances in the preparation of anthracite, AIME Transactions, 66:422–513.
Bacon, R F, 1920. Flotation of coal, US Patent 1329493.
Bates, L T, 1925. Method of separating ash from coal by fl otation, US Patent 1552197.
Bensley, C, Roberts, T, Nicol, S and Lamb, R, 1988. Column fl otation: The development of the Tower fl otation cell, in Proceedings Fourth Australian Coal Preparation Conference, Gladstone, pp 153–169 (Australian Coal Preparation Society: New South Wales).
Bourke, P, 2004. Rotor for fl otation mechanism and method for directing material fl ow in fl otation machine, US Patent 6772885.

Spectrum Series 18
H I S T O R Y O F F L O TAT I O N
246
Bourke, P and Taylor, D, 2005. Flotation machine US Patent, 6926154.
Boutin, P and Tremblay, R J, 1963. Froth fl otation method with counter-current separation, US Patent 3339730.
Boutin, P and Tremblay, R J, 1964. Method and apparatus for the froth fl otation of ores, GB Patent GB970841, 23 September.
Brake, I R, 1998. The development and commissioning of a new Microcel column fl otation circuit for BHP Coal’s Peak Downs coal preparation plant, in Proceedings XIII International Coal Preparation Congress (eds: A C Partridge and I R Partridge), pp 767–776 (Australian Coal Preparation Society: New South Wales).
Brake, I R, Graham, J N, Madden, R G and Drummond, R B, 1993. Centrifl oat pilot scale trial at Goonyella coal preparation plant, in Proceedings Sixth Australian Coal Preparation Conference (ed: J Davis), Mackay, 6–9 September (Australian Coal Preparation Society: New South Wales).
Budge, G, Brough, J, Knight, J, Woodruff, D and McNamara, L, 2000. Review of the worldwide status of coal preparation technology, Department of Trade and Industry’s cleaner coal technology programme, report coal R199 DTI/pub URN 00/1205.
Bury, E, Broadbridge, W and Hutchinson, A, 1920–21. Froth fl otation as applied to the washing of industrial coal, Transactions of the Institution of Mining and Metallurgy, 60:243–253.
Callow, J M, 1921. Pneumatic fl otation cell and method, US Patent 1366766, 25 January.
Chapman, W R and Mott, R A, 1928. The Cleaning of Coal, p 398 (Chapman and Hall: London).
Davis, D H, 1948. Froth fl otation of 48 mesh bituminous coal slurries, AIME Transactions, 177:320–337.
Elmore, F E, 1929. Separation of minerals by fl otation, US Patent 1706281.
Firth, B A and Ofori, P K, 1999. Apparatus and method for selective separation of hydrophobic material, US Patent 5855769.
Harbort, G, 2006. A study of the hydrodynamics, bubble-particle interaction and fl otation within the high intensity zone of a fl otation machine and its implication for fl otation cell design, PhD thesis, University of Queensland, Brisbane.
Horrocks, K R S, Ellison, J F, Watts, G and Messiter, S, 1988. Modernisation of the coal preparation facilities at the Port Kembla plant of BHP Steel International, in Proceedings Fourth Australian Coal Preparation Conference (ed: P Holtham), pp 3–27 (Australian Coal Preparation Society: New South Wales).
Imhof, R M, Hohmeister, S and Brown, J V, 1995. Developments in EKOF pneumatic fl otation technology, in Proceedings Seventh Australian Coal Preparation Conference (ed: J Smitham) (Australian Coal Preparation Society: New South Wales).
Jameson, G J, 1990. Column fl otation method and apparatus, US Patent 4938865.
Jameson, G J, Goffi net, M and Hughes, D, 1991. Operating experiences with Jameson cells at Newlands Coal Pty Ltd, in Proceedings Fifth Australian Coal Preparation Conference (ed: P J Lean), pp 146–158 (Australian Coal Preparation Society: New South Wales).
Kühlwein, F L, 1928. Process of obtaining high grade products from raw coal, US Patent 1660009.
Macpherson, H, 1962. Froth fl otation in Durham Division of the National Coal Board, AIME Transactions, 223:7–14.
Mayer, E W, 1933. Why and when to use fl otation process, Coal Age, 38(10):333–334.
Nicol, S K and Bensley, C N, 1988. Recent developments in fi ne coal preparation in Australia, in Proceedings Industrial Practice of Fine Coal Processing (eds: R R Klimpel and P T Luckie), pp 147–152 (Society for Mining, Metallurgy and Exploration: Littleton and American Institute of Mining, Metallurgical and Petroleum Engineers: Littleton).

Spectrum Series 18
C O A L F L O TAT I O N
247
Nicol, S K, Smitham, J B, Bensley, C N and Clarkson, C J, 1989. Coal Flotation Practice, Department of Primary Industries and Energy commissioned study, vol 1.
Parton, W J and Rupert, C D, 1948. The operation of a froth fl otation pilot plant on washery-water solids, AIME Transactions, 177:292–307.
Peabody, F, ~1995. Peabody Coal Company [online]. Available from: <http://www.fundinguniverse.com/company-histories/Peabody-Coal-Company-Company-History.html> [Accessed: 17 July 2008].
Peterson, P E, 1922. Clean Vancouver Island coals by fl otation process, Coal Age, 21(6):243–4.
Ralston, O C, 1937. Froth fl otation and agglomerate tabling of non metallic minerals, CIMM Transactions, 40:697.
Sallman, K, 1962. Present state of coal fl otation in West Germany, AIME Transactions, 220:107–110.
Sanders, G J and Williamson, M M, 1996. Coal fl otation technical review, ACARP report C4047.
Stone, R G, Brake, I R and Eldridge, G, 1995. Development of a new column fl otation circuit for Peak Downs coal preparation plant, in Proceedings Seventh Australian Coal Preparation Conference (ed: J Smitham), pp 145–156 (Australian Coal Preparation Society: New South Wales).
Wilkinson, E W, 1928. Treatment of fi ne coal, US Patent 1667277.
Wu, D and Ma, L, 1998. XPM-series jet fl otation machine, in Proceedings XIII International Coal Preparation Congress (eds: A C Partridge and I R Partridge), pp 737–745 (Australian Coal Preparation Society: New South Wales).
Zimmerman, R E, 1948. Flotation of bituminous coal, AIME Transactions, 177:338-355.

Spectrum Series 18 249
INTRODUCTION
As is often the case with industrial technology, the theory of froth � otation developed more
slowly than its successful practice. Early patents for � otation processes were characterised by
Rickard (1916, p 33) and others as ‘skin � otation’ (Bradford, 1885; Macquisten, 1907; Wood,
1913) and ‘oil � otation’ (Robson and Crowder, 1894; Elmore, 1898). These processes did not
directly acknowledge the role of air bubbles in the process; in fact some took speci� c steps to
exclude air. However, at the Glasdir Mine in Wales, where the Elmore bulk-oil process was
in use, an observant metallurgist noted that the actual mineral load carried by the oil was
2.5 times the theoretical load, and concluded that this probably resulted from the effects of
the entrained air that resulted from the agitation of the pulp with oil (Rickard, 1916).
This incident is typical. For the next 25 years, engineers and scientists struggled to enunciate theories that matched the numerous observations being made in mills and laboratories throughout the world. It was not until the fundamentals of atomic physics and surface chemistry were understood that a coherent theoretical explanation was possible. The development of � otation technology and the underlying theory took place in parallel with the development of the understanding of atomic structure and the nature of chemical bonds.
Thomson discovered the electron in 1898 and proposed a spherical model of the atom in 1902. Rutherford’s experiments indicating the approximate sizes of nuclei were conducted in 1910, and Bohr proposed the orbital model of the hydrogen atom in 1912. Lewis described the concept of the covalent bond in 1923, Schrödinger’s particle-wave model of the atom was presented in 1927 and the Lewis-Langmuir model, with a shared electron pool, was fully expounded in 1939 (Asimov, 1966).
An understanding of the structure of water was also developing at the same time. By 1933,
the existence of bond angles in tri-atomic molecules was recognised, and attempts had been
made to calculate that angle for the water molecule, with estimates ranging from 102 to
111° (Van Vleck and Cross, 1933). By 1947, the bond angle was reported at 105°, and the
polarity of the molecule was well understood (Pauling, 1947). The presently accepted value,
104.523°, was measured at the National Bureau of Standards in the USA in 1952 (Eisenberg
and Kauzman, 1969).
C H A P T E R 8
Early Flotation Theory
Spectrum Series 18
H I S T O R Y O F F L O TAT I O N
250
EARLY THEORIES
Richards, 1903–1909
One of the � rst modern reference books on the subject of mineral processing was Ore Dressing, by Robert H Richards of the Massachusetts Institute of Technology. The � rst two volumes, published in 1903, were reissued in 1906 (Richards, 1906). The 1906 edition discusses only the Elmore bulk-oil process (Richards, 1903). Two additional volumes were issued in 1909 (Richards, 1909), in which the ten pages of discussion on � otation describe several processes, including the Elmore vacuum process, the Potter Delprat process, the De Bavay process, the MacQuisten tube and the Minerals Separation process. All of these rely on the presence of gas bubbles, and the last is the forerunner of the modern � otation process.
Richards offers only brief theoretical explanations for the � otation process. He notes that the most easily � oated sul� des, molybdenite and stibnite, are the most greasy, and that they are wetted with dif� culty. He cites the work of Swinburne and Rudorf (1906), showing that the addition of acid in the � otation of certain sul� des (Potter, 1902) generates bubbles by the liberation of carbon dioxide as the acid reacts with the carbonates present. He also points out the observation of Huntington (Anon, 1906) that, when a bubble comes into contact with a particle in a way that causes a relatively large surface of the bubble to be in contact, the particle will be � oated, and the less the wetting the greater will be the force required to detach the bubble. Thus he recognised the importance of surface wetting, while not understanding the phenomenon.
The brief article by Swinburne and Rudorf (1906) cited by Richards is of further interest. The authors note the importance of surface tension and adhesion in � otation, and explain how the contact angle relates to these phenomena. They go on to discuss the attachment of gas bubbles to solid particles, noting that bubbles attach most readily to ‘greasy’ sul� des like galena, and speculate that bubble attachment requires the presence of gas on the surface of a particle. These surface gases, which appear in later theoretical discussions, are described as ‘… solid solutions, occlusions, condensations, or whatever they may be …’.
Louis, 1909
Another mineral processing handbook, published in 1909, is The Dressing of Minerals, by H Louis of the University of Durham (Louis, 1909). Flotation is discussed in the last section of a chapter entitled ‘Pneumatic Separation. Magnetic Separation. Electrostatic Separation. Separation by Surface Tension.’ The eight-page discussion cites only patents as references. The discussion of the patented ‘Lake process’ (Froment, 1902) is indicative of the theoretical explanations for � otation given by both Louis and Richards:
1. Natural sulphides moistened by a fatty substance have a tendency to unite in spherules and � oat on the surface of the water.
2. This tendency is retarded by speci� c weight, and opposed by the gangue, which imprisons the moistened sulphides in a pulverulent mass.
3. If a gas is liberated, bubbles become covered with an envelope of sulphides, which rise to the surface of the liquid, where they form a kind of metallic magma.

Spectrum Series 18
E A R LY F L O TAT I O N T H E O R Y
251
4. The formation of these metallic spherules is singularly active if the gas is in a nascent state.
Although Louis’ discussion of � otation theory is brief, he appears to grasp the important difference in wettability that leads to selectivity in bubble attachment. The discussion of the Lake process is concluded with the following commentary:
The inventor has stated the principles of his process clearly enough, though he does not seem to have appreciated how largely the effects are due to surface tension. It is apparently because the adhesion of water to the gangue is stronger than to the metallic sulphides that the bubbles of gas adhere more � rmly to the latter, being as it were forced against them by the tension of the water. The effect of the oil seems to be to accentuate this action by increasing the repulsion due to the surface tension of the latter.
Hoover, 1912
By 1912, the practice of � otation was suf� ciently widespread to justify a book on the subject, Concentrating Ores by Flotation (Hoover, 1912). Theodore J Hoover, its author, is notable for a number of reasons, besides being the brother of Herbert C Hoover, the 31st president of the United States. In 1906, he was employed by Minerals Separation Ltd. This company owned a number of the patents relating to the � otation process, and sought to collect a royalty of one shilling per ton of ore treated by any process employing agitation and oil for the production of froth. Hoover left Minerals Separation in 1910, apparently with some discontent. Two of the chapters of his book are devoted to a description of the patents relating to � otation, and the litigation surrounding the enforcement of those patents. Much of that litigation resulted from the efforts of Minerals Separation to collect royalties. In the second edition of Concentrating Ores by Flotation (Hoover, 1914), one 12-page chapter is entitled ‘Theories’ Hoover expresses reservations regarding current theories of � otation, stating that:
There has been no satisfactory theory yet propounded as to why acid does promote the preferential adhesion of water to gangue particles, and probably also at the same time the preferential adhesion of oil to sulphides, and for the present commercial purposes it does not seem necessary to do more than record this important fact.
Nonetheless, after a discussion of surface tension and adhesion, Hoover cites the work of Mickle (1912a) as a theoretical basis for � otation. As abstracted in the Engineering and Mining Journal (Mickle, 1911a, 1912b), Mickle’s work consists almost entirely of careful experiments and empirical observations based on those experiments. Hoover summarises Mickle’s conclusions by stating that there are:
1. Forces acting on the surface of a liquid, the resultant of which tends to prevent rupture of the surface.
2. Forces acting at the surfaces of all substances, and especially at the surfaces of sulphide particles, which cause � lms of gases resisting displacement to adhere to their surfaces.
3. Forces acting at the surfaces of sulphides that cause these surfaces to show a preferential adhesion to oil.

Spectrum Series 18
H I S T O R Y O F F L O TAT I O N
252
4. Forces acting at the surfaces of gangue minerals that cause these surfaces to show a preferential adhesion to water, and especially to acidi� ed water.
Rickard, 1916
By 1916, the legal controversies surrounding � otation had expanded to include theoretical explanations of the process. In that year, the Mining and Scienti� c Press of San Francisco published The Flotation Process (Rickard, 1916). Although Thomas A Rickard, editor of the Press, is shown as the author, this book is actually a compilation of 37 articles by 32 authors, all of which appeared in the Press from June 1915 to March 1916. Fourteen of these articles deal with theoretical explanations of the � otation process. The prevalent approach in all of these articles is best described by a statement made by the author of one of them, W H Coghill, who states that ‘… in the science of � otation the metallurgical engineer faces problems in physics and chemistry that are absolutely new to him’ (p 157). The lead chapter (and the last to be written), is a sort of summary introduction by Rickard (pp 9–59). As noted above, Rickard divides the existing � otation processes into three categories, described as follows:
• Film � otation, typi� ed by the Wood and Macquisten processes, is attributed to effects of surface tension, in which non-wetted sul� de particles � oat on the ‘skin’ of the water. There is no recognition of the inherent hydrophobicity of sul� des, but it is noted that these minerals ‘… attach � lms of air to themselves’. The Macquisten process also uses acid and oil; the former is recognised as a producer of gas, in reaction with carbonates, when present.
• Oil � otation, in which particles are coated with oil, and rise to the surface as a result of lower speci� c gravity, is typi� ed by the Elmore bulk-oil process. Oil was speci� cally not emulsi� ed. This required large amounts of oil: theoretically, for zinc-blende with a speci� c gravity of four, � otation by bulk oil required the use of 6.7 parts of oil by weight to one part by weight of blende.
• Bubble levitation, in which bubbles generated by chemical reaction, or formed by the introduction of air, attach to particles and carry them to the surface of the mix, typi� ed by the Potter, Delprat, DeBavay and Elmore vacuum processes, and most importantly by the Sulman-Picard process, owned by Minerals Separation Ltd. Air could be introduced through the bottom of the vessel (usually through a canvas), by entrainment by an impeller, or by escape from solution in the water – for example, under vacuum (p 33).
The phenomenon of hydrophobicity is recognised: It is noted that these sul� de minerals ‘… attach � lms of air to themselves’. Nevertheless, the term ‘hydrophobicity’ is not used; its importance is not fully understood, nor is its relation to surface chemistry noted, as shown in the following extract:
Air has a marked adhesiveness for metallic surfaces: this attachment is supposed to be enhanced by the presence of oil or grease on the metallic surface. In other words, the metallic surface, such as that of a sulphide mineral, when in the presence of both oil and water, will exhibit a preference for oil. Hence the sulphide is not wetted. This characteristic is less marked on the part of the heavy silicates, such as rhodonite or garnet, and still less evident in the case of the lighter silicious minerals, such as quartz or orthoclase (Mickle, 1911b).

Spectrum Series 18
E A R LY F L O TAT I O N T H E O R Y
253
While space does not permit a detailed explication of all the theories presented in Rickard’s
book, a brief summary of � ve of the chapters provides some understanding of the thinking of
leading engineers at the time by examining two theories.
The theory of nascent and occluded gasIn a chapter entitled ‘Why is Flotation’, C T Durell (pp 135–143) asserts that the secret to
� otation lies in two phenomena: ‘(1) nascent gas is expelled from the liquid to be readily
attached to solids for � otation; and (2) dissolved gas is expelled from the solids so that
gas bubbles may be easily attached to them’. In item (1), Louis’ concept of ‘nascent gas’
reappears. Durell goes on to argue that sul� de minerals occlude gases more readily than
other solids because they are ‘… changed near the surface to sulphates, carbonates, oxides,
etc …’ so that ‘… chemical affnity assists sulphides in adsorbing oxygen or carbon dioxide’.
Durell recognises the relationship of the contact angle (which he calls ‘the angle of hysteresis’)
as ‘… the potent factor for selective � otation’, but is convinced that this is because this angle
characterised solids that more effectively occlude gas on their surfaces.
O C Ralston challenges Durell in a chapter called ‘Why Do Minerals Float?’ (pp 175–
186). Ralston objects to Durell’s ‘loose’ usage of ‘… some rather obscure scienti� c terms’,
namely ‘nascent gas’ and ‘occlusion’ and points out that, since Durell’s hypothesis does not
require the presence of oil, Durell must explain the use of oil in � otation or abandon the
hypothesis. Ralston then states that � otation, by the attachment of particles to bubbles,
may be explained by ‘… two hypotheses which seem to be equally possible … inter-facial
tensions, and … the electrical charges residing on suspended particles’. The measurement of
contact angles by Minerals Separation Ltd is mentioned (Sulman, 1912). However, Ralston
does not discuss the interactions of charged particle surfaces and polar molecules; rather, he
discusses attractions of particles and bubbles in terms of electrostatics, making an analogy to
the Cottrell precipitation process used for recovery of solids from gas streams.
Durell responds to Ralston in ‘Flotation Principles’ (pp 319–334). He states that the release
of occluded gas from solid surfaces is aided by the presence of electrolytes in the water. This
supposedly creates osmotic pressure that can drive gas out of the particles. Durell also states
that most oils aid in � otation by:
• forming � lms around mineral particles, thus decreasing adhesion of water for those particles;
• increasing the cohesive force of the mineral particles for one another; and
• toughening bubbles by forming � lms of oil around them.
The electrical theoryThe supposed electrostatic effect in bubble-particle attachment is further developed by T M Bains Jr in the chapter ‘The Electrical Theory of Flotation – I’ (pp 225–230). Bains reasons as follows:
1. Ores containing valuable minerals or metals that are good conductors are the only ones that are suitable for � otation.

Spectrum Series 18
H I S T O R Y O F F L O TAT I O N
254
2. To buoy these conductors it is necessary to supply enough electri� ed bubbles from below to � oat particles of the conductors that are attracted; hence the smaller the bubble, the better the result, the amount of gas being the same.
3. Some dielectric � uid is necessary to cover the conductor or the bubble, to prevent the dissipation of the electric charge. The thinner the � lm of dielectric and the greater its dielectric strength, the greater the effective attractive force and the more permanent will be the froth.
4. Some material must be added to the water to increase its conductivity, to obtain a clean concentrate; acids in small quantity are now used.
‘The Electro-Statics of Flotation’ (pp 335–343), by F A Fahrenwald, is a simple and direct response to Bains. Fahrenwald � rst notes that the electrostatic force between two charged bodies, for example a bubble and a particle, is effectively neutralised when the charged bodies are surrounded by a conductor, in this case water. Fahrenwald considers a 60 mg particle of galena; this particle will weigh 52 mg in water, and will thus be buoyed only by a bubble of 52 mm3 or larger. He shows that the electrostatic force required to attach this particle to a bubble is 25.9 electrostatic units (cgs). He then cites experiments showing that such a charge will discharge through air at a distance of about 0.2 cm, with a discharge potential of 7770 volts, and notes that such discharges are not observed in breaking froths. Fahrenwald concludes by describing experiments in which ground galena was poured between the two plates of an electrostatic machine. In air, the galena particles were de� ected toward one of the plates. In water there was no de� ection.
From the foregoing discussion it is seen that, in considering the process of � otation, well-quali� ed individuals could deduce some of the pertinent phenomena, but were unable to fully understand the process in fundamental terms. This situation is described very nicely by Ralston:
The literature on the theory of � otation has been enriched, of late, by the views of a number of excellent mining engineers who unfortunately were tyros in physical chemistry and physics. Hence the obscurity and mystery with which the process is supposed to be surrounded (Ralston, 1916).
Truscott , 1923
S J Truscott’s A Textbook of Ore Dressing was published in 1923 (Truscott, 1923). Truscott recognises several factors as being essential features of the � otation process, discussing the hydrophobicity of sul� des, the af� nity of oils and other agents for these particles, raising their hydrophobicity and the use of frothing agents to form a surface froth. Additionally, the modifying effects of some acids, alkalis and salts are noted.
Truscott’s discussion of � otation machines is here summarised brie� y. Machines are subdivided into mechanical, pneumatic and cascade devices. The Minerals Separation mechanical cell has a clear mixer-settler design, and intense agitation is recognised to promote particle-bubble contact. Froth is removed by a mechanical skimmer, but it is also found that, if froth builds high enough, it may over� ow of its own accord. The need for lower pulp densities, required for the treatment of slimes as compared to that of sands, is also

Spectrum Series 18
E A R LY F L O TAT I O N T H E O R Y
255
noted. Simple rougher-cleaner arrangements are illustrated. An advantage noted for the mechanical machines is their ability to use thick, unre� ned, and thus cheap oils.
The principal example of a pneumatic cell is the Callow cell, in which air is dispersed under pressure through a porous canvas mat. The Callow cell process diagram for the � rst time shows a dedicated, custom-purpose conditioning tank. Cascade cells have a low intensity of agitation, and froth generated is generally ‘evanescent and meagre’ as a result of which froth crowding was introduced in such devices.
Truscott’s explication of theory begins with a discussion of reagents. Ordinarily, it is said,
the oil added is a mixture of soluble and insoluble fractions, the soluble fraction providing
the frothing action, while the insoluble portion helps to form an elastic and coherent froth,
acting as a collecting agent. Usually, the amount required for � otation is, reportedly,
approximately 0.1 per cent, by mass, although it is recognised that concentrate grades bene� t
if less is added. Some oil may be added in the grinding step already.
Frothers are described as ‘effervescing’ or ‘aeration’ agents, and the reader is instructed
that the term ‘frother’ is incorrect, as no stable froth would be generated without the bubbles
being stabilised by particle attachment. The principal agents are soluble oils, oil fractions,
wood distillates and tar derivatives. Of these agents, particularly the tars and thick oils may
be used as collecting agents, ‘by strengthening the froth’ – it is clear that mineral-speci� c
action is not yet fully conceptualised. Thus, ‘Generally speaking, froth � otation, being air
� otation, depends primarily upon the effervescing-agent and only to a secondary extent
upon the other agents’.
It is, however, already found that mixtures of agents are generally cheaper and more consistent – but not stated to be more effective – than single agents. The return of tailings water is recommended to recycle reagents.
The use of sulfuric acid as a modi� er is said to be effective by increasing gangue
hydrophobicity, acting as a dispersant, while also reducing froth volumes. Electrolytic
action is suspected in sphalerite � otation, and possibly the removal of iron oxide coatings.
The action of caustic soda and sodium carbonate is likened to the actions just described for
sulfuric acid. Potassium cyanide ‘… has not in general been found of any bene� t in � otation’.
Modi� er action is generally described as an effect on hydrophobicity or tendency of minerals
to � occulate – depressants are not mentioned!
Differential � otation is achieved by manipulating reagents, reagent dosages and froth over� ow. However, it is noted that sulfur dioxide ‘deadens the sul� des in succession’ – this being introduced for sphalerite depression at Broken Hill in 1916, as the Bradford sulfur dioxide process. The action of sulfur dioxide is, however, not yet understood. Differential � otation is also practiced by ‘fractional roasting’, or ‘fractional hydrochemical action’; according to the Horwood process, introduced at Broken Hill in 1909, a lead–zinc concentrate was roasted to sulfatise the galena, allowing selective sphalerite � otation from the calcine. Hydrometallurgical pretreatments proposed include ferric chloride conditioning (Mickle, 1912a) and other such more or less selective mineral surface modi� ers, but none of these systems was proven commercially.

Spectrum Series 18
H I S T O R Y O F F L O TAT I O N
256
Conditioning of oxidised ore with sul� de was � rst practiced at Magma Copper by injecting hydrogen sul� de gas into pulp, test work on dry ore conditioning having been shown to result in a wasteful, near quantitative sul� dation of oxidised copper minerals, rather than merely forming a surface coating (Callow, 1917). Although other mines preferred soluble alkaline sul� des, Magma returned to using the gas, after a brief spell of trying the alkaline salts. In oxide � otation, operations are successful using:
… sodium oleate or a soap solution together with a curdling agent, ammoniacal liquor, for instance, the resultant curdle being selectively adsorbed by the oxide-ore particles.
It is already recognised that reagents are potentially effective when their surface deposition is still incipient, it being speculated that this may be caused by ‘a re-arrangement of the electrostatic forces’.
Wettings of minerals, and the measurement of contact angles, are discussed in some detail, but it is argued that the surface tension on particles thus measured does not directly disclose the essential relationships between mineral � oatabilities. Discussion progresses to edge angles and suspensory angles and particle suspension on the water surface. The example is given of coarse quartz being suspended on the water surface, while � ne quartz cannot be suspended, the reason being given that in the case of � ner quartz, incipient solution reduces interfacial tension. Aging effects are recognised, and it is suggested that the mechanism is the adsorption of gases from the ambient air.
The discussion of contact angles, curiously for the modern reader, extends also to oil-sul� de, oil-water and oil-water-sul� de systems. However, the observation is made that ‘It apparently requires something conceivably approaching a mono-molecular � lm to increase the � oatability of a particle …’. It is thus clear that, despite the discussions on contact angles involving an oily phase, the formation of such a distinct organic phase is to be avoided, if the particles are to � oat – indicating the progress from the thinking of Cattermole and Elmore.
Indirectly, some reference is suspected to zeta potentials:
Acting as an electrolyte, and conceivably resulting in the adsorption of positive ions upon the mineral surface, sulphuric acid has sometimes … been essential to � otation.
Reference is made to the electrochemical series, in the potential selection of a suitable additive for affecting the mineral surface. Apparently, no special frother-only reagents are used yet, at the time of writing, suitable frothing being obtained as a result of the oil (mix)-mineral interaction.
Simons, 1924
The book Ore Dressing Principles and Practice, by T Simons of the Montana School of Mines, was published in 1924 (Simons, 1924). Simons states that all � otation processes depend on the buoyant effect of air bubbles, and classi� es the processes by their respective methods of bubble generation: agitation, pressurised air, or entrainment by � uid � ow. Simons states that the theory of � otation is still not well understood, but is known to be related to physics, not chemistry. His discussion of the theoretical basis of � otation is best summarised by the following statement:

Spectrum Series 18
E A R LY F L O TAT I O N T H E O R Y
257
Perhaps the most puzzling phenomena of � otation are the observed selective
af� nity of oil and air for the sulphide minerals and the total or partial lack of
such af� nity for the gangue minerals … A drop of water placed on a clean quartz
particle spreads out in a thin � lm. It wets the quartz. Placed on a clean galena
particle it remains in the shape of a globe, slightly � attened by the force of gravity.
On the other hand a drop of � otation oil � attens if placed on a particle of galena
but maintains its globular shape if placed on a piece of quartz.
It is thus clear that Simons understands the ‘what’ of variable wettability, but not the ‘why’.
THE BEGINNING OF MODERN THEORIES – 1922–1939
Fuerstenau (1999a, p 14) states that:
The broad period of the 1930s decade was one of pronounced advancement in � otation fundamentals and particularly in delineating the chemical aspects of � otation, largely through the seminal contributions of Gaudin, Wark, and Taggart.
Taggart, 1921–1927
Taggart’s � rst book, Manual of Flotation Processes (Taggart, 1921) was, as its title implies,
primarily a manual of process practice, with little discussion of theory. In 1923, Taggart and
Gaudin published ‘Surface Tension and Adsorption Phenomena in Flotation’ (Taggart and
Gaudin, 1923). This paper is primarily a detailed description of a series of measurements
of surface tensions and adsorptions, by methods now obsolete. However, there is some
discussion of chemical phenomena that were becoming known at that time. There is a
prescient discussion of Langmuir’s observation that molecules are not equidimensional, and
other research showing that the non-homogeneous structure of some molecules results in:
… � elds of force that extend beyond the limits of the molecule, so that their behaviour toward molecules of similar or different constitution differs according to the atoms or radicals involved.
Langmuir’s work (Langmuir, 1920) showed that the contact angle on a solid in water was
changed by the adsorption of a monolayer of oleic acid. Further, the orientations of molecules
in a � lm of oleic acid on water are described, noting that the ‘… polar carboxyl radical is
toward the water and the hydrocarbon chain is toward the air’. This shows the beginning
of an understanding of the importance of surface phenomena in � otation theory. However,
D W Fuerstenau (1999a, p 8) suggests that, because Langmuir’s paper was published ‘… by
the Faraday Society, and not in a metallurgical journal, his ideas never reached those in the
� eld at the time’.
It is interesting to note that the early work of Taggart and Gaudin was apparently done
in support of the ongoing litigation over � otation patents. In the written discussion of this
paper, R C Canby, of Wallingford, Connecticut, makes the following statement:

Spectrum Series 18
H I S T O R Y O F F L O TAT I O N
258
Personally, I cannot but regret that the facts of this paper, together with many other facts so well demonstrated by Professor Taggart and his assistants, which because of the settlement of the � otation litigation, for which this work was done, have become largely academic, could not have found the use for which they were intended.
This may be an example in which an extensive litigation, although painful and deleterious
in many ways, resulted in progress in scienti� c understanding. A similar thing occurred
during the so-called ‘Apex Wars’ in Butte, Montana, described vividly in Romantic Copper –
Its Lure and Lore by I B Joralemon (1942), in which legal disputes over mining claims led to
the development of important understanding of orebody formation and geology.
Taggart’s Handbook of Ore Dressing was published in 1927. It became a standard reference
worldwide, and Taggart published similar volumes for many years (Taggart, 1927, 1945,
1950, 1951, 1964). The discussion of � otation theory in the � rst edition is summarised here.
General conceptsIn the preface to the 1927 handbook, Taggart refers to the physical principles of � otation being as important as knowledge of the legal pitfalls. Taggart de� nes � otation as:
… a method of wet concentration of ores in which separation of mineral from gangue is effected by causing the mineral to � oat at or above the surface of a body of liquid pulp while the gangue becomes or remains submerged.
Distinction is made between � lm oil-buoyancy and froth � otation, of which only the latter
is still of commercial importance by this time.
Differences in mineral � oatability are explained as differences in their resistance to
wetting, as illustrated by the contact angles of gas-liquid-solid systems. A connection is
made with optical re� ective properties: the angle is generally larger for materials of metallic
luster, than for those of vitreous or earthy luster. Existence of a contact angle is at this time
still challenged by some physicists, or, at least, it is argued that a zero angle exists in three
phase contact with a truly clean solid. Although Taggart supports this, he points out that in
practice such cleanliness does not exist, and contact angles are a practical, and exploitable,
phenomenon. He consequently gives a list of measured contact angles for various minerals
in ‘plain’ water. However, it is noted that the order of � oatability of the minerals as found in
practice differs from the order thus inferred, although taking into account the hysteresis of
the contact angle measurement, as argued by Sulman, gives a somewhat better predictability.
The same table is given for acidi� ed water, and again for oiled minerals in acidi� ed water.
This theory of � otation was cited in a number of lawsuits brought by Minerals Separation.
Processes and machines
Taggart describes the various, early � otation processes, many of which were no longer in use
by the time of the � rst handbook. Froth � otation processes are classi� ed into pulp-body and
bubble-column processes. For the pulp-body processes, gas bubbles may be generated by
chemical reaction, pressure reduction, boiling or agitation.

Spectrum Series 18
E A R LY F L O TAT I O N T H E O R Y
259
For the generation of mineral-bubble contact, Taggart argues for the selective diffusion of carbon dioxide towards hydrophobic surfaces, as well as physical collision between mineral and bubbles, giving instructions for an illustrative experiment in support. It is pointed out that, in the Plus-Pressure (1906) and Vacuum (1906) processes, gas bubbles form preferentially on oiled surfaces. Development of pressure-reduction processes stopped with the introduction of agitation-froth processes, but it is Taggart’s belief that their potential is equal to that of such processes. Boiling, although resulting in acceptable froths, never became a practical process. However, the Potter-Delprat process is, strictly speaking, a boiling process.
In agitation-froth machines, it is argued, water is supersaturated with gas by the action of a rotor, while simultaneously such gas is preferentially precipitated onto the mineral. Mechanically entrained bubbles are, it is said, largely lost to the process, rising to the surface of the pulp without much use. Impeller speeds, vacuum generation and froth formation times are discussed in the light of this view – it is explicitly argued that ‘coursing bubbles in a pulp’ do not adhere to sul� de particles. The 1906 patent of Sulman, Picard and Ballot states the same view.
The � rst markedly superior � otation process, based on agitation-froth principles, was that by Hoover, patented in 1910. The patent shows three stage agitation, followed immediately by separation in a spitzkasten, introducing the feed below the pulp-froth interface. The Minerals Separation machine also displays this mixer-settler design. The Janney machine, patented in 1916 (Janney, 1916), is considered to be the best agitation-froth device at the time. It includes pulp recirculation and froth-separation zones on opposite sides of a single mixing chamber. Many devices were patented subsequently, on the same set of basic design principles. In pulp-body concentration processes, there is a marked concentration of oil in the froth. In bubble-column processes, substantially all concentration is said to be performed in a froth column above and � oating on a body of pulp, in contrast with the gas precipitation mechanism argued for pulp-body processes, thus explaining the air consumption, which is 20 to 100 times higher than that in pulp-body processes. In contrast with pulp-body processes, the froth is fragile and evanescent.
Separation is said to only begin at the bottom of the pulp column, and gangue-mineral separation is based on differential drainage of the phases from the froth – the particles are nowhere � rmly adherent to the bubbles, as in pulp-body processes. The process is likened to hydraulic classi� cation, and all that is required is a rising column of bubbles. Mineral particles must be precontacted with some selective agent, while the bubble column is maintained by adding a suitable stabilising agent. Despite this argument, the particle-bubble adhesion mechanism is not yet de� nitely known to be different than that in pulp-body processes.
Air can be introduced in three fundamentally distinct ways; in pneumatic, plunging stream or cascade and centrifugal machines. The most successful pneumatic cell is the Callow cell, in which the porous cell bottom slopes towards a tailings valve, thus avoiding the sanding problems encountered in other designs. Patented in 1915, the Callow cell combined a porous bottom with vigorous agitation of the pulp. Many pneumatic cell designs followed. In 1918, Armstrong (Armstrong, 1918) for the � rst time patented ‘restricting froth over� ow’ – what we would call froth crowding today, on a Callow cell, to create a deeper froth, and thus a cleaner concentrate.

Spectrum Series 18
H I S T O R Y O F F L O TAT I O N
260
Cascade machines effect aeration by causing a stream of water or pulp to plunge into a body of pulp. Various devices were developed, involving high-pressure jets and settling/separation zones. Performance did not, however, warrant the cost or complexity of such devices, and it appears that efforts in this line of devices lasted only a few years.
Centrifugal bubble-column, or subaeration, machines introduce air into pulp by the centrifugal force of a rapidly revolving impeller device. Although their use has been limited, as compared to agitation-froth and pneumatic machines, they have always enjoyed some attention. The Owen (1915) subaeration machine is striking in its simplicity and vaguely modern appearance. The Ruth (1923) machine, although still retaining de� ned aeration and separation zones, is not unlike today’s laboratory � otation cells.
Many designs incorporate more than one of the design philosophies discussed so far. Some designs combine violent agitation chambers with deep froth settling zones, as per the bubble-column approach. Examples include the designs by Kohlberg and Kraut (1916), Ziegler (1919), and the somewhat overengineered design by Gross, Akins and Bucher (1921), in which a spiral pump chamber occupies the major portion of the � otation device. The Janney mechanical-air machine (1923) combines agitation-froth and pneumatic principles. Some designs went too far to even be tested on a commercial operation, and Taggart discusses these under the heading ‘miscellaneous processes and apparatus, none of which … carries on its face any promise of success …’.
Flotation reagentsTaggart’s handbook provides one of the � rst extensive discussions of � otation reagents. Reagent addition was generally done into mixing vessels, or into the agitated sections of � otation cells. Atomisation of reagents into the air stream was also tried, for example by Moffatt (1921). Scott (1918, 1921) even goes as far as adding a gas into the air stream as a � otation reagent. He gives acetylene as an example.
Taggart gives a long list of � otation reagents mentioned in the patent literature. Some exotic examples include ‘black liquor’ (US Patent 1412215), caramel (US Patent 1499872), illuminating gas (US Patent 1261303), lavender oil (US Patent 1064723) and thorium chloride (US Patents 1425185 and 1425186). Xanthates are already mentioned as well (seven patents), but more interest is still given to the oils – for example, ‘oil’ (90 patents), ‘mineral oils’ (26 patents) and eucalyptus oil (26 patents).
Taggart classi� es the � otation agents as follows: frothing agents, collecting agents, depressing agents, dispersion agents and conserving agents.
Regarding the frother, Taggart reports that when more frother is added at the beginning of the � oat, recovery increases and the grade decreases. The higher the recovery, the lower the sensitivity of the recovery to increasing the frother dosage; the � ner the ore, the lower the amount of frother required. In the vast majority of � otation operations, pine oil or a creosote is used as frothers.
Collectors are explained as wetting certain minerals in preference to others, causing
the wetted minerals to preferentially precipitate gas from supersaturated gas solutions, or
causing them to attach to the interface between aqueous solution and frothing agent, at the
froth surface. Distinction is made between incompletely soluble collectors, such as oils and

Spectrum Series 18
E A R LY F L O TAT I O N T H E O R Y
261
fatty acids, and adsorbing collectors, including alpha-naphtyl-amine, thiocarbanilid and
xanthates. Regarding these, it is recognised that ‘… the molecules are de� nitely oriented
with respect to the adsorbing surface … such that the water-repelling end of the molecule is
away from the solid’. This orientation of the molecules determines the � otation behaviour
of the particles. These agents are reportedly present as a monolayer, which is generally
not complete, such that their use is generally at only about a tenth of that used for the
incompletely soluble agents. Schwarz (1905) discusses sul� dation before collector addition.
For oxide minerals, this has not been widely commercially applied.
Although the chemicals are recognised to be preferable over oils, given their accurate speci� cation and generally superior results, their cost, availability and unsettled patent situations count against them.
The relationship among collector dosage, pulp density and feed grade is discussed, but no � rm conclusion can be stated. Prior to November 1923, the basic agitation-froth patent restricted those wishing to escape its use to oil dosages over one per cent by weight of the ore – the royalties demanded often made it attractive to use more rather than less reagent! The patent holders then claimed that the amount of reagent over one per cent was inactive, and that their patent would still be infringed if more than one per cent reagent were used. This strange period from the history of � otation also sees Ray Consolidated Copper Co design a � ow sheet ‘for operations with more than 20 lb of oil per ton’.
Dispersion is known to be necessary to remove adhering slimes (� ne gangue particles)
from valuable minerals. Agents in common use include sulfuric acid, lime, copper sulfate,
soda ash and sodium silicate. Interestingly, organic agents (glue, albumen, etc) have
been proposed, but found little or no commercial use, although some oils reportedly have
a marked dispersive effect. Some depressants were found to act by dispersion, others by
selective chemical reaction, and some evidence was found for action involving preferential
deposition of an agent onto gangue. The action of a combination of potassium cyanide
and zinc sulfate in lead–zinc circuits is explained by the prevention of gangue deposition
on galena, while sphalerite and pyrite remain heavily slime coated. The action of copper
sulfate in such circuits is explained along similar lines. Given this explanation, Taggart is
nevertheless aware of copper’s function as an activator, although he does not use this term.
Conserving agents are used to protect other reagents from attack by substances in the ore or pulp. No particular chemistry or mechanism is proposed for this. Examples given include iron precipitation by sodium hydroxide and pH adjustment with lime. It is not clear how this class of reagent is further de� ned.
The optimum size range for � otation is de� ned as about 30 to 250 microns, preferably 30 to 120 microns. The agitation-froth processes recover more coarse material, and the bubble-column processes more � ne material. Over time, grinds have tended � ner, partly because of recognised coarse losses, partly because of the steady adoption of pneumatic machines. It has been shown that coarser particles cannot be carried by the bubbles, but the reason for the loss of small particles is not de� nitely known. Flocculation is suspected to play a role. In practice, the slime content of � otation feed is managed below a given threshold level, sometimes involving fairly elaborate mixing in the mill bins.

Spectrum Series 18
H I S T O R Y O F F L O TAT I O N
262
For control of the reagent dosage with changes in feed, no satisfactory method has yet been found. An apparatus for continuous measurement of pulp alkalinity has been reported (McLeod, 1922), but the extent of its use is not known. It uses a � lter, connected by a � exible tube with a glass tube, coated inside with fused phenolphtalein, connected with a vacuum bottle. The redness of the water dripping into the bottle is an indicator of pulp alkalinity. Monitoring pulp density is recommended, either with a hydrometer or by noting the height to which water rises in a small glass tube mounted inside a � otation cell. Regarding residence times, it is said that many cells are fed far below the maximum rate, and Taggart does not dwell long on this subject. Water quality is recognised as being important, but only in broad terms. It is argued that it is important that water quality should preferably not � uctuate.
Flotation practiceFlotation is advocated as the sole method of mineral recovery if mineralisation is � ne, and the difference in speci� c gravity between the sul� de and the gangue is not great. Otherwise, it is to be used in conjunction with gravity recovery methods. Differential � otation is said to be achieved by manipulating frothing intensity, sul� de � lming and the adsorption of gangue on sul� de surfaces. The action of sodium cyanide, sodium sul� de, copper sulfate, sulfur dioxide, zinc sulfate and other reagents is explained by the latter mechanism. Test work identifying which minerals are slime coated and which ones are not, using various reagents, is reported.
Differential � otation may be facilitated by prereacting the ore. Fractional roasting was tried, but was never applied on a large scale, and by Taggart’s time, such processes were no longer practiced. Wet chemical processes of this kind were commercially more successful. Sul� dising is classi� ed with these processes, as practiced by Pellegrin (1917) and Smith (1923). Another method of effecting differential � otation is by adding an agent that renders a particular mineral only temporarily non-� oatable, for example, the depression of sphalerite with permanganate or sulfur dioxide gas (Bradford, 1918). A great deal of effort is reported under this heading in the differential � otation of lead–zinc ores. Finally, differential � otation has been attempted by careful control of the � otation parameters, so as to maximise the differences in � otation kinetics between the various minerals of interest. Flotation times and reagent dosages are phased, so as to achieve the desired selectivity. Borcherdt (1923) proposes that the stage-wise removal (and return) of colloids allows differential � otation. For example, a � rst quantity of colloids may be removed by � otation with frother only, followed by addition of a collector and mineral recovery, another stage of frother-only � otation, etc. The guiding principle given is that the colloidal inhibitory agent will adsorb onto surfaces of opposite polarity, on which basis the colloid addition or its removal should be decided upon.
In 1928, Taggart presented a talk entitled ‘Flotation Reagents’ to the New York Section of the American Institute of Mining, Metallurgical and Petroleum Engineers (Anon, 1928). This discussion of how � otation reagents function gives a good indication of the extent of the current theoretical understanding. There is a clear understanding of how oil collection functions:
… in froth � otation, the collecting oil smears the sul� de surfaces (and not the gangue surfaces) with a minute � lm of oil and renders the surface in such a condition that air will thereafter displace water from it.

Spectrum Series 18
E A R LY F L O TAT I O N T H E O R Y
263
Detailed discussion of the ideal chemical properties and structure for soluble collectors shows that the function of both types of reagents was well understood, but the underlying surface chemistry is not mentioned. A similar discussion of frothers shows an understanding of the required dual nature of frother molecules: Taggart says that one part of the molecule must be ‘water-repellent’, while the other must be ‘water-avid’. Finally, a section on inorganic reagents states that:
The best we can do on this subject is to set forth certain experimental facts and put forward one or two hypotheses that are not too discordant therewith.
The later works of Taggart continue the excellent descriptions of operating practices and plant layouts. However, by about 1930 theoretical explanations on � otation became divided into two camps, led respectively by Taggart and his former associate, Antoine M Gaudin. As noted by M C Fuerstenau:
… the chemical theory [was] espoused by Taggart and his coworkers (Arbiter, delGuidice, Hassialis, Ince, Kellogg, Knoll and Taylor) and what might be termed a general adsorption theory [was] espoused by Gaudin, Wark, Langmuir, and others.
The chemical theory explained many observed phenomena, but failed to describe others (Fuerstenau, 1999b, p xiii).
Wark, 1934
Beginning in 1932, Ian W Wark and his colleagues undertook a systematic study of the chemical and physical phenomena involved in � otation. This work, conducted at the University of Melbourne, was sponsored by several mining companies. Wark and his colleagues published two important series of articles: ‘The Physical Chemistry of Flotation’, in three parts, appeared in the Journal of Physical Chemistry in 1933, and addressed such topics as the formation of bubbles, contact angles, the formation and stability of air-mineral aggregates, and the effect of collector composition on contact angles; ‘The Principles of Flotation’, also in three parts, appeared in the AIME Transactions in 1934, and addressed the actions of xanthates and sulfur-bearing collectors as in� uenced by various ‘other reagents’. Wark’s book, Principles of Flotation, appeared in 1938 (Wark, 1938). A revised edition, co-authored by K L Sutherland, was published in 1955 (Sutherland and Wark, 1955). By 1938, the two con� icting approaches to � otation theory, chemical theory and general adsorption theory, were well developed. Wark was de� nitely in agreement with the latter. Because that approach is described in detail below in the summary of Gaudin’s work, the summary of Wark’s book is somewhat abbreviated.
Wark begins the discussion of � otation theory by noting that the study of adsorption at solid surfaces is in its infancy, and that investigators in � otation have outstripped those in adjacent � elds of surface chemistry. He points out that � otation is dependent on oriented adsorption of the soluble collector, that an air bubble cannot make contact with the surface of a solid immersed in water, unless a collector is present, and that this contact is limited by the contact angle. Wark presents a detailed discussion of the ‘tenacity of adhesion’ in terms of surface tension. This discussion is closely similar to Ralston’s early discussion in ‘Why Do Minerals Float?’ (cited in Rickard, 1916), based on the work of Reinders.

Spectrum Series 18
H I S T O R Y O F F L O TAT I O N
264
Wark describes the measuring of contact angles as conducted in his laboratory, and notes that such measurements are very dif� cult to make. He mentions the confusion that arises from use of the terms ‘hydrophobic’ and ‘hydrophilic’ and asserts that these terms should be reserved for colloids. He further comments that some authors have said that � otation is impossible unless the contact angle is greater than 90 degrees, and goes on to state that:
The true criterion for � otation is that the contact angle is � nite, which corresponds to some measure of replacement of water by air …
Wark also discusses in detail the ‘modern theories of adsorption’, which arise from studies of surface chemistry, starting with Langmuir in 1912 and summarised by Adam in 1930. In discussing the ‘chemical theory’ propounded by Taggart and others, Wark emphasises the distinction between adsorption and chemical reaction, stating that ‘... the former is con� ned to the surface, whereas the latter proceeds to completion until it is hindered by the formation of a surface � lm’. Wark includes several chapters on the actions of various � otation reagents, summarised brie� y by the excerpts below:
Collectors, all of which possess both polar and non-polar groups, and all of which must be adsorbed to be effective, fall within three main classes:
a. Oils.
b. Acids containing a hydrocarbon group, and the potassium and sodium salts of these acids.
c. Bases containing a hydrocarbon group, and the salts of these bases—usually chlorides or iodides.
Frothers – No dissolved substance greatly in� uences the properties of the surface of water unless it is adsorbed in that surface: therefore only substances that are adsorbed lead to the production of stable froths … only substances that change the surface tension of water appreciably can be frothers … Not every substance that is a good frother is suitable for � otation purposes. The desiderata for a good frother for selective � otation are:
1. It must be cheap.
2. It must be effective in low concentrations.
3. It must not also be a collector.
Activators – In general the activators are inorganic ions or cations which so alter the surface of a mineral that it can more readily adsorb a collector (p 107).
Depressants…are usually inorganic anions which prevent the adsorption of a collector by some minerals but not by others.
Wark recognises the importance of xanthates as collectors, and discusses them in some detail. His summary of the action of xanthates in the � otation of sul� des is of interest:
… sulphide minerals immersed in water possess no inherent � oatability … their surfaces tend to become oxidized and carbonated, and it is accepted universally that the oxidized surface � lm exhibits a zero contact angle and thus that the oxidized mineral will not � oat without collectors … the bulk of the evidence indicates that [unchanged sulphide surfaces] have a zero angle of contact. The evidence

Spectrum Series 18
E A R LY F L O TAT I O N T H E O R Y
265
as to whether the sulphide surface itself can react with or adsorb xanthates is con� icting, but the balance seems to be greatly in favour of the conclusion that it can. There is no doubt that an oxidized surface � lm reacts with xanthate to give insoluble heavy metal xanthate, but whether this is responsible for � otation or whether it hinders � otation is doubtful. The author inclines to the view that it is a hindrance.
Wark speci� cally addresses the chemical theory of � otation, and shows that the action of collectors cannot be explained solely by considering solubility. He points out that this is especially clear in the study of the adsorption of compounds other than xanthates.
Gaudin, 1939
Antoine M Gaudin was initially a collaborator with Taggart in studying � otation. However, as noted above, he later became in some ways Taggart’s competitor in writing handbooks, and in propounding competing theoretical explanations of � otation. His handbook, Principles of Mineral Dressing, � rst published in 1939 (Gaudin, 1939), and reprinted in 1950, summarises the more extensive material in his textbook, Flotation, published in 1932 (Gaudin, 1932), with a second edition in 1957.
Gaudin considers � otation as one member of the group of processes based on selective adhesion, including grease-deck concentration and bulk-oil � otation. To some extent, enough organic liquid is added to form a distinct phase. Three forms are distinguished, corresponding closely to those identi� ed by Rickard in 1916:
• froth � otation, or � otation proper – small particles and bubbles are made to form agglomerates, lighter than pulp;
• skin � otation – adhesion between a free water surface and particles, usually larger than those in froth � otation; and
• agglomeration – loose agglomerates are formed between bubbles and particles, heavier than water, but lighter and coarser than the tailings particles.
Gaudin recognises that most minerals, if suitably protected from contamination, adhere
to water, not air. He cites several factors in this phenomenon, including surface energy,
surface tension, adsorption, contact angle, polarity, surface reactivity and surface condition.
He notes that no direct measurement of the surface energy of solids is available. Indirect
measurements are not wholly trustworthy. Surface tension measurement of liquids has
recently been improved, having been theoretically imperfect and giving but relative values,
‘… by the laborious method of numerical integration’.
The types of ‘linkage’ between atoms – electrovalent, covalent, coordinate, metallic – are discussed, noting that this may in� uence � oatability. Natural � oatability is also addressed – the phenomenon is said to be agreed upon for hydrocarbons, and for graphite, due to contamination with organic substances (which are removed only with great dif� culty). There is still disagreement on the natural � oatability of native sulfur.
Acquired � oatability is achieved by coating particles with a non-polar � lm. Collectors create heteropolar, monomolecular � lms – sometimes incompletely monomolecular. A

Spectrum Series 18
H I S T O R Y O F F L O TAT I O N
266
molecular barrier is created between mineral and water, and a molecular bridge between gangue and water; for example, by the presence of silicate ions on quartz, on which water molecules adsorb. Gaudin presents an extensive discussion regarding contact angles and the maximum particle size that can be � oated. Maximum contact angle is dependent upon length of carbon chain, independent of substrate or composition of the polar part of the collector.
Adhesion between particles and bubbles is argued to be achieved through collision – hence, better recovery of all minerals is obtained in thicker pulps. Taggart’s theory that concentration proceeds differently in pneumatic (preferential, intermittent adhesion at bubble walls) and in agitation machines (permanent adhesion in air) is said to have been rendered largely circumstantial with the introduction of modern � otation reagents.
Following this line of argument, Gaudin explains that the coarsest particles � oat � rst, in line with the direct-encounter hypothesis of gas-solid attachment. Fine particles are not only slow to � oat, but as they are � ner, they become almost unresponsive to reagents, while gangue particles are more and more activated at � ner sizes. The poor � otation of � ner particles occurs not only because of collision considerations, but also because they ‘have older surfaces ... more extensively affected by ions derived from other minerals, oxygen or water’.
Gaudin notes that only two theories of collector action survive, chemical reaction and
adsorption. In non-sul� de minerals, a ‘crust’ forms, which must be relatively thick to be
effective. Regarding sul� de minerals, elucidation of the mechanism by which xanthates work
is still ongoing. The theory of adsorption-solubility is favoured, in which surface solubility
of a collector is somewhat less than its solubility in bulk water; this surface solubility being
dependent on the substrate, the collector and counter ions present. Collectors are understood
to work in three ways: they provide adsorbed ions, eliminate precipitating ions from solution
and provide adequate concentrations in solution.
The function of positive-ion collectors and non-ionised collectors still awaits proper explanation.
Regarding pH control, Gaudin notes that pH determines the competition for mineral surfaces by OH, reduces the concentration of soluble species and precipitates soluble salts so that they consume less collector. He observes that practical depressants in sul� de � otation function at least partly due to the release of hydroxyl ions. Many depressants’ actions have not been fully explained. Also, the action of sodium silicate is yet to be investigated with care. For activation, the example of copper activation of sphalerite is given, thus: ZnS + Cu2+ = CuS + Zn2.
CONCLUSIONS
The history of the understanding of � otation theory can be traced back to early observations
on the wetting of sul� des by oils. In its mechanical aspects, astute observation led to the
introduction of air to the oiled pulp, which in turn allowed dramatic decreases in reagent
requirements. In its chemical aspects, through chance or insight it will never be clear, the

Spectrum Series 18
E A R LY F L O TAT I O N T H E O R Y
267
recognition of xanthates as sul� de collectors provided much needed control and consistency.
Finally, in its economic viability, it was given vital impetus by the requirement to exploit
disseminated copper sul� de deposits, richer deposits having become more and more
exhausted.
Understanding has always trailed practice, being pulled forward, rather than pushing the application of the art in plant practice. In a large part, the development of � otation theory could not be completed until an understanding of the supporting theories of physics and chemistry was in place.
In exploring the future of � otation, it is good to be aware of the efforts of our predecessors, and to remain open to the observations and problems they sought to address in their now half forgotten theories – among these the selective gas precipitation theory of Taggart, skin- and oil-� otation processes and the various inventive approaches for treating slimes, before the advent of effective depressants. As we see today, � otation practice is still ahead of our understanding, as in the case of ever larger � otation cell designs, and the application of � otation in a wide range of applications, and at ever � ner particle sizes. Going forward, we may yet discover some of the footsteps of our predecessors.
REFERENCES
Anon, 1906. Paper presented to the Faraday Society by A K Huntington, abstracted in Electrochemical and Metallurgical Industry, IV:49–51.
Anon (AIME), 1928. Flotation Practice, papers and discussions presented at meetings held in Salt Lake City, August 1927, and New York, February 1928, pp 40–49 (American Institute of Mining and Metallurgical Engineers: New York).
Armstrong, C J B, 1918. Process of and apparatus for concentrating ores, US Patent 1269150, 11 June.
Asimov, I, 1966. Understanding Physics, Volume III, The Electron, Proton, and Neutron, pp 1–108 (Walker & Company: New York).
Borcherdt, W O, 1923. US Patent 1446375, 20 February.
Bradford, H, 1886. Method of saving � oating materials in ore-separation, US Patent 345951, 20 July.
Bradford, L, 1918. US Patent 1274505, 6 August.
Callow, J M, 1917. Notes on � otation, AIME Transactions, LV:676-727.
Eisenberg, D and Kauzman, W, 1969. The Structure and Properties of Water, p 4 (Oxford University Press: Oxford).
Elmore, F E, 1898. British Patent 21948, 18 October.
Froment, A, 1902. Improvements relating to the concentration of ores, British Patent 12778.
Fuerstenau, D W, 1999a. The froth � otation century, in Advances in Flotation Technology (eds: B K Parekh and J D Miller), pp 3–22 (Society for Mining, Metallurgy and Exploration: Littleton).
Fuerstenau, M C, 1999b. Froth � otation: The � rst ninety years, in Advances in Flotation Technology (eds: B K Parekh and J D Miller), pp xi–xxxiii (Society for Mining, Metallurgy and Exploration: Littleton).
Gaudin, A M, 1932 (second edition, 1957). Flotation, 552 p (McGraw-Hill: New York).
Gaudin, A M, 1939. Principles of Mineral Dressing, 554 p (McGraw-Hill: New York).
Gross, F D, Akins, R P and Bucher, J W, 1921. Flotation apparatus and process, US Patent 1401535, 27 December.

Spectrum Series 18
H I S T O R Y O F F L O TAT I O N
268
Hoover, T J, 1912. Concentrating Ores by Flotation, 221 p (The Mining Magazine: London).
Hoover, T J, 1914. Concentrating Ores by Flotation, second edition, 261 p (The Mining Magazine: London).
Janney, T A, 1916. Ore concentrating apparatus, US Patent 1167076, 4 January.
Joralemon, I B, 1942. Romantic Copper – Its Lure and Lore, 294 p (D Appleton-Century: New York).
Kohlberg, F B and Kraut, M, 1916. Flotation machine, US Patent 1174737, 7 March.
Langmuir, I, 1920. The mechanism of surface phenomena in � otation, Trans Faraday Society, 15:62.
Louis, H, 1909. The Dressing of Minerals, 544 p (Longmans, Green, & Co: New York).
Macquisten, A P S, 1907. Process for separating solids, US Patents 865194, 3 September.
Macquisten, A P S, 1907. Apparatus for separating solid particles from each other, US Patents 865195, 3 September.
McLeod, B A, 1922. A continuous alkalinity indicator for � otation pulp, Engineering and Mining Journal – Press, 114:991.
Mickle, K A, 1911a. Experiments on mineral � otation, Engineering and Mining Journal, XCII:307–311.
Mickle, K A, 1911b. Proceedings of the Royal Society of Victoria, XXIV, part 2 (cited in Rickard, 1916, p 73; title not given).
Mickle, K A, 1912a. Australian Mining Standard, XLVII, pp 333, 357, 381, 403 (cited in Hoover, 1914, p 73; title not given).
Mickle, K A, 1912b. The � otation of minerals, Engineering and Mining Journal, XCIV:71–76.
Moffatt, D D, 1921. Ore concentration, US Patent 1400308, 13 December.
Owen, T M, 1915. Apparatus for the concentration of ore, US Patent 1155836, 5 October.
Pauling, L, 1947. General Chemistry, p 129 (W H Freeman and Company: San Francisco).
Pellegrin, A L, 1917. Process of treating ores, US Patent 1233398, 17 July.
Potter, C V, 1902. British Patent 1146, 15 January.
Ralston, O C, 1916. Discussion in response to R J Anderson, The Flotation of Minerals, AIME Transactions, LV:527–546.
Richards, R H, 1903. Ore Dressing, � rst edition (Mc-Graw Hill: New York).
Richards, R H, 1906. Ore Dressing, Volumes I and II, second edition (Mc-Graw Hill: New York).
Richards, R H, 1909. Ore Dressing, Volumes III and IV, � rst edition, second impression, pp 1555–1565 (McGraw-Hill: New York).
Rickard, T A, 1916. The Flotation Process, pp 24–26 (Mining and Scienti� c Press: San Francisco).
Robson, G and Crowder, S, 1894. Separation of metals or metallic compounds from ores or other substances, British Patent 427, 8 January (see also Robson, G, 1897. US Patent 575669, 19 January).
Ruth, J P Jr, 1923. Flotation apparatus, US Patent 1445042, 13 February.
Schwarz, A, 1905. Process of concentrating ores, US Patent 807501, 19 December.
Scott, W A, 1918. Concentration process, US Patent 1261303, 2 April.
Scott, W A, 1921. Ore concentration process, US Patent 1365281, 11 January.
Simons, T, 1924. Ore Dressing Principles and Practice, pp 182–199 (McGraw-Hill: New York).
Smith, R V, 1923. Method of recovering zinc from lead zinc ores, US Patent 1452662, 24 April.
Sulman, H A, 1912. Transactions of the Institute of Mining and Metallurgy (cited in Rickard, 1916, p 182; title not given).

Spectrum Series 18
E A R LY F L O TAT I O N T H E O R Y
269
Sutherland, K L and Wark, I W, 1955. Principles of Flotation, 489 p (The Australasian Institute of Mining and Metallurgy: Melbourne).
Swinburne, J and Rudorf, G, 1906. The Physics of Ore Flotation, p 126 (Mining and Scienti� c Press: San Francisco).
Taggart, A F, 1921. Manual of Flotation Processes, 181 p.
Taggart, A F, 1927. Handbook of Ore Dressing, pp 779–904 (John Wiley & Sons, Inc: New York).
Taggart, A F, 1945 (second edition, 1950). Handbook of Mineral Dressing, Ores and Industrial Minerals (John Wiley & Sons, Inc: New York).
Taggart, A F, 1951 (second edition, 1964). Elements of Ore Dressing, 595 p (John Wiley & Sons, Inc: New York).
Taggart, A F and Gaudin, A M, 1923. Surface tension and adsorption phenomena in � otation, AIME Transactions, LXVIII:479-535.
Truscott, S J, 1923. A Textbook of Ore Dressing, 680 p (McMillan and Co: London).
Van Vleck, J H and Cross, P C, 1933. A calculation of the vibration frequencies and other constants of the H
2O molecule, Journal of Chemical Physics, 1:357–361.
Wark, I W, 1938. Principles of Flotation, 346 p (The Australasian Institute of Mining and Metallurgy: Melbourne).
Wood, H E, 1913. The Wood � otation process, AIME Transactions, XLIV:684-701.
Ziegler, W L, 1919. Flotation apparatus and process, US Patent 1324139, 19 December.

Flotation has been an integral part of mineral processing for the past hundred years. There are some who would describe it as a mature technology, while others would see it as continually evolving. Perhaps a good question to ask is, what would be the impression of operators from the mid-20th century entering a fl otation plant of the 21st century? They would enter the plant and sniff the air. The smell of reagents would be slightly diff erent, but still familiar. They would look at the feed grade and note that it was low, remembering that the managers in those days constantly spoke of declining feed grades and the need for more effi ciency. Certainly they would look at the concentrate grades and recoveries and if truth be told would probably mumble, ‘They were better in my day!’ They would look at the large fl otation cells towering above them and say, ‘Well, they are just big tanks after all, I remember in my day …’ Knowingly they would add ‘I bet they are a nightmare to unbog’.
When they entered the control room though, their eyes would open wide in awe. They would pinch themselves – were they in a science fi ction movie at the local drive-in, or in a fl otation plant? The digital age we live in was not predicted – the ability to control nearly every aspect of operation, to see recoveries immediately, to watch grades rise and fall in real time. These were things not even imagined. Perhaps they would hear about a scanning electron microscope that looked at particles that the eye could not see. They would look out a window and see a mill that ‘did not turn’ generating ‘slimes’ – the horror of operators. In disbelief they would hear that those slimes were fl oated successfully. Of course, being crusty old operators they would mumble, ‘You should be getting better grades and recoveries’, but the glint of awe would remain in their eyes.
The history of fl otation is increasingly turning to those peripheral items that enhance performance, or enable performance. They might not be fl otation machines or reagents, but they have become so successfully intertwined with fl otation that they have become part of its history. The next two chapters review some of those items that enhance fl otation, items that would bring the look of awe to that 20th century operator’s eyes.
Flotation After 100 Years

Spectrum Series 18 273
INTRODUCTION
There have been several themes of research in fl otation technology during its fi rst 100 years of industrial practice. For the fi rst 15 years research was concerned with making the process work, there was no precedent and the idea of fl oating high specifi c gravity minerals on water seemed to fl out the laws of physics. Success with the copper porphyries led to ten years of intense activity concerned with fl otation cells and chemicals, and to the application of fl otation to a variety of ores. Then followed 25 years of research concerned with understanding and improving the process. Techniques for measurement and analysis were simple by present day standards but the engineers of the time used these techniques to forge a good understanding of the basis of fl otation, and of its scope and limitations. By 1950 fl otation was a mature technology and the emphasis in research had turned to plant optimisation to take into account the problems created by changing ores. The style of research that is now used in mineral processing plants will be discussed in this chapter by reference to the lead–zinc ore at Mount Isa Mines Limited (MIM). This ore has been long recognised as diffi cult and variable so it is an appropriate example to cover the development and application of research techniques.
The chapter starts with a historical summary that covers the development of ideas and techniques since 1950. There is then is a discussion of a short-term decline that occurred in the performance of the lead–zinc concentrator, which started in 1980–81, followed by corrective steps. Finally there is a discussion of a long-term decline, which occurred in the performance of the same concentrator. Both physical and chemical aspects of the process are covered in the historical summary and in the examples. Particular emphasis is given to liberation. Traditionally the attention to liberation has been qualitative, by contrast it is treated quantitatively in this chapter.
TECHNOLOGICAL RESEARCH AFTER 1950
Background
Around 1950 traditional chemical assaying methods provided elemental assays of sampled streams because they were the only practical and cheap techniques to defi ne the results
C H A P T E R 9
Technological Research

Spectrum Series 18
H I S T O R Y O F F L O TAT I O N
274
of the process. In general, these elemental assays provided indicators of the performance of the valuable minerals and, to an extent, the sulfi de gangue minerals, often with little or no information on the non-sulfi de gangue minerals. The main change since 1950 is that most elemental assays are now provided by instrumental methods of analysis, and not by traditional ‘wet’ methods. The result is that a wider range of elemental assays are now available at low cost and these elemental assays are more likely to provide indirect indicators of the performance of sulfi de and non-sulfi de gangue minerals in sulfi de fl otation systems. There have been several changes in the ability to provide mineral assays since 1950. Two important examples are assays from quantitative X-ray diffraction and assays as a by-product of liberation data collected from an automated scanning electron microscope. These microscopes can also be used to provide assays of individual minerals, such as when:
• the valuable element exists in a range of minerals, eg copper in more than one mineral (chalcocite, native copper, bornite and chalcopyrite), and only the total copper assay is known by assaying for the element copper;
• there is no suitable ‘proxy’ elemental assay for an important non-sulfi de gangue mineral from elemental assays, eg MgO can be a misleading proxy for the troublesome naturally hydrophobic mineral, talc, as MgO can exist in several minerals besides talc in a given ore;
• there is no suitable ‘proxy’ elemental assay for some clay minerals, which can affect pulp dispersion and viscosity; and
• the use of various elemental assays is unreliable in calculating the assays of the iron sulfi de gangue minerals, pyrite and pyrrhotite, via conversion equations.
Plant-based research
Since 1950 there have been improvements in the options available for collection of plant data in surveys. Kelsall (1961) was infl uential early in this period in conducting surveys of fl otation banks and detailed analysis of the mineral data on an overall and sized basis. Since approximately 1990, the physical tasks in conducting plant surveys have become more diffi cult, arising from rapid increase in the size of the fl otation equipment and a reluctance to allow for surveying requirements in the detailed design of the plants containing these much larger fl otation cells.
After conducting a survey, the fi rst step is to establish the internal consistency and quality of the survey and the resulting samples by establishing a solid and water balance at the ‘unsized’ level. An informed decision can then be made about incurring the cost of sizing the samples and analysing the size fractions at various additional levels of detail (Greet, 2009). The mineral recovery–size analysis technique for diagnosis of process weaknesses in industry was championed by the CSIRO Division of Mineral Engineering from the 1960s under the infl uence of Dr Kelsall (eg Cameron et al, 1971) and some other sites (research and companies) made use of the technique when needed, without necessarily publishing results. Trahar and Warren (1976) commented that ‘the fi rst detailed study of the effect of particle size was made by Gaudin et al (1931)’ on a number of sulfi de ores and they listed various authors who had made use of mineral recovery–size analysis from 1950 to 1975, although most were for analysis of samples from laboratory batch tests and not industrial survey samples.
Spectrum Series 18
T E C H N O L O G I C A L R E S E A R C H
275
The incorporation of liberation data on top of the mineral recovery–size analysis
commenced approximately a decade later. This generally occurred at an industrial site with
a development section because only an industrial site could afford the cost of traditional
point counting or image analysis/automated electron microscopy on a large number of size
fractions. An early example was the copper–lead–zinc concentrator of Brunswick Mining
and Smelting Corporation Limited, which used the liberation data for further analysis of
separations (Petruk and Schnarr, 1981). Around this time Petruk of CANMET in Canada
had integrated a microprobe, an energy dispersive X-ray analyser and an image analyser
that provided liberation data, requiring a specialised operator (Petruk, 2000). Petruk stated
that he ‘did not have the funds’ for the ‘sophisticated equipment’ needed for development of
an equivalent to the QEM*SEM, which was built in Melbourne by CSIRO, but he noted that
his system had some additional capabilities. The increasing use of liberation data coincided
with the development of image analysis/automated electron microscope systems, although
liberation data had been available for a long time via the traditional point counting method.
Measurement of liberation led to a common sequence being developed for analysis of separations:
• mineral recovery–size analysis, which was the traditional method;
• mineral recovery–size–liberation analysis, which provided a much deeper level of under-standing; and
• surface analysis of freshly taken samples with protective conditions to retain the surface properties existing in the process to explain why liberated minerals report in the wrong product.
Plant analysis involving mineral assays has become more common over the last couple of
decades as the use of automated scanning electron microscopes (ie QEMSEM/ QEMSCAN
and MLA) has increased. It can be applied to analysis of separations for more complex
mineral systems, a common example being for a porphyry copper ore in which the copper
exists in more than one mineral (eg chalcocite, native copper, bornite and chalcopyrite).
It must be noted that the traditional, optical microscope based point counting method,
which has been available for over 100 years, provides liberation data and also mineral assays
on size fractions.
In existing plants mineral recovery–size–liberation analysis can be used to recognise
inadequate liberation levels. In plant design, liberation data can be used for determining
the primary and regrinding product sizings that provide appropriate levels of liberation. Of
course, the necessary separation conditions also have to be determined to obtain an effi cient
mineral separation in conjunction with the appropriate level of liberation. Some details
on the background to this level of analysis are provided in Table 9.1 (Johnson and Munro,
2002). The liberation level for the recalculated feed is a key concept for use of Table 9.1. This
is the percentage of that mineral entering the plant, which has been liberated before it exits
the plant in one of the concentrates or tailings. It therefore represents the cumulative effect
of all grinding and regrinding in the plant, being calculated by mathematical combination of
all the plant products, weighted by tonnage.

Spectrum Series 18
H I S T O R Y O F F L O TAT I O N
276
The liberation level in Table 9.1 determines the quality of the mineral separation that can be achieved. Figure 9.1 shows what would happen in a circuit when all liberated particles of the valuable mineral report to the correct product and composite particles containing the valuable mineral are recovered in descending order of quality. In constructing the limiting curve, imperfect liberation of the feed is accepted but perfect mineral separation is imposed on liberated and non-liberated feed particles. Comparison of the position of the limiting or theoretical grade recovery curve with the position of the actual grade recovery curve for the valuable mineral or element is one way of indicating the magnitude of the weaknesses in the process. This is the ‘performance gap’.
Liberation level (%)* Quality of separation
<70 Poor
70–80 Moderate
>80 Good
* Refers to liberation data measured in two dimensions.
TABLE 9.1
Guidelines for the valuable mineral liberation level in a plant feed (no regrinding in fl otation circuit) or forthe recalculated plant feed (regrinding in fl otation circuit) and the resulting expected quality of separation.
FIGURE 9.1
Example of theoretical grade recovery curves and actual curves for three circuits processing theThalanga ore (Nice and Brown, 1995). The ‘Limiting Curve’ is the theoretical grade recovery curve.
Prior to approximately 1970, researchers sought to establish equations for describing the kinetics of the valuable minerals in fl otation process. Typically, laboratory versions of the fl otation process were investigated initially. The emphasis then shifted to surveys of industrial fl otation banks and to analysis of the mineral recovery–time data at various levels of detail to establish mathematical models of the full-scale fl otation process (Lynch et al, 1981).
Spectrum Series 18
T E C H N O L O G I C A L R E S E A R C H
277
It was generally assumed that the models for the gangue minerals would be as for the valuable minerals but with lower values for the rate constants or parameters. However, it was found in laboratory scale data that the behaviour of the gangue minerals in reporting to the concentrate was closely related to the behaviour of the water reporting to the concentrate through the mechanism of entrainment (Jowett, 1966). The important entrainment mechanism was demonstrated in plant data initially for a porphyry copper ore for which the data were analysed on a mineral recovery–size basis to provide an improved understanding of the mechanism (Johnson, McKee and Lynch, 1974). The importance of the entrainment mechanism for recovery of gangue minerals had to be recognised in the form of the mathematical models for fl otation. Further, the equations describing entrainment provided a theoretical basis for the benefi ts of ‘froth washing’, initially exemplifi ed by column technology (Finch and Dobby, 1990) and utilised in other fl otation machine designs. In these technologies, the water reaching the froth region and the fi nal concentrate from the pulp region (with its load of suspended gangue) was replaced by externally supplied water with no load of suspended gangue.
The purpose of developing mathematical models for fl otation banks was to be able to simulate entire circuits, which contained many banks. Such circuit simulations have now reached the stage where they are a useful engineering tool for predicting the effect of changes in throughput of ore, changes in water additions, changes in the installed capacity for a given throughput and some types of changes in circuit confi guration. It can be noted that these uses for modelling are essentially in the area of predicting the effect of residence time. An area of major known weakness in application of circuit simulation techniques is in dealing with the effect of regrinding stages within a circuit from the aspects of the increase in liberation achieved for each mineral and the chemical conditions required in the regrinding mill to utilise successfully any increase in liberation of the valuable mineral.
To perform circuit simulations for various alternative circuits, which essentially require prediction of the effect of residence time, an initial survey is required to determine the parameters in the model, ie to calibrate the model. However, in simulations involving regrinding stages without simplifying assumptions, a considerable amount of supporting experimental work may be anticipated. Developments since 1950 in understanding the complicated nature of grinding and regrinding steps from the view of the fl otation process are discussed in the next two sections.
Grinding, Eh and fl otation
Grinding mills have been used to prepare ore for fl otation since it became an industrial operation. Iron or steel grinding balls and rods were used in the mills because of their low cost and high specifi c gravity, and their role was thought to be principally a means of grinding the ore. Recognition of other properties was restricted to considering whether the addition of reagents should be made to the mill or to a conditioning stage/fl otation bank. Since 1950, studies on the physical and chemical aspects of grinding and regrinding have improved the understanding of the costly and complex preparation steps associated with a fl otation circuit. It has been shown that grinding and regrinding steps are not only sites for physical

Spectrum Series 18
H I S T O R Y O F F L O TAT I O N
278
change in the particles through size reduction and consequent changes in liberation, they also possess a chemical environment that infl uences the surface properties of the particles resulting from regrinding.
Rey and Formanek (1960) and other authors (to approximately 1980) demonstrated that the environment produced in a mill by commonly used grinding media (iron or steel) had an important effect on the fl otation behaviour of valuable sulfi de minerals and/or unwanted sulfi de minerals. Later, it came to be recognised that measurement of the pulp potential (Eh), along with other measurements, was a convenient way for expressing the chemical conditions that exist in a grinding mill (Figure 9.2). The use of iron or steel grinding media produces reducing preparation conditions (Eh values below those reached by pulp aeration) in a closed or largely closed grinding mill, which restricts the access of oxygen to the pulp inside the mill. This is associated with the well established corrosion mechanism for loss of iron or steel grinding media, in addition to physical degradation as another source of loss of the grinding media.
In Figure 9.2, the Eh and pH values are plotted for the primary and secondary grinding
sections in the galena section of the lead–zinc concentrator of Mount Isa Mines Limited
(Johnson, 1988). The fi rst point that the Eh and pH of the slurry could be measured was
the rod mill discharge (point A). A slightly lower value was obtained for the discharge of the
following closed circuit ball mill (B). On transportation to and passage through the primary
cyclones (C), the slurry accidentally acquired oxygen from the air, raising the Eh value, and
it rose again by the fi rst fl otation cell (D). By cell 5 in the primary rougher bank (E) the Eh
was approaching its highest possible value for that system of ore and water with aeration.
The Eh value at the last cell in the primary rougher bank (F) can be taken as the steady state
FIGURE 9.2
Eh-pH diagram for the primary and secondary grinding circuits and the following rougher fl otation banks for the lead–zinc ore at Mount Isa Mines Limited (Johnson, 1988). At Eh values below those in the transition region, collector is not adsorbed
electrochemically.

Spectrum Series 18
T E C H N O L O G I C A L R E S E A R C H
279
value for that ore/water system when exposed to air at the pH of the system. The slurry from
cell (F) was returned to the closed circuit secondary grinding mills and the resulting large
lowering of the Eh value, at approximately fi xed pH values, can be observed. In the secondary
grinding circuit the Eh rose in the cyclone overfl ow (H) and the secondary rougher bank (J).
The Eh value for point J is similar to the value for the primary rougher bank (F) and these
can be taken as the equilibrium value for that ore/water system when exposed to air. The
equilibrium Eh for the system is given by a line drawn parallel to the experimental water-
oxygen lines, with its position driven by the location of points F and J in Figure 9.2.
From Figure 9.2, the Eh had to increase by approximately 400 mV at essentially a fi xed
pH to reach its steady state value for that system. For the electrochemical uptake of collector
on the valuable mineral, it will be explained in the next section that a critical Eh value for the
valuable mineral in the system must be exceeded (see transition region). Two consequences
of reducing conditions in a closed or largely closed grinding mill (ie restricted access of
oxygen) from iron or steel media are:
1. The minerals present are protected from extensive further oxidation (often a positive feature as accidental activation of minerals by metal ions produced by oxidation of the various sulfi de minerals is lessened, eg activation of sphalerite by lead ions from oxidation of galena).
2. All the minerals present acquire randomly iron hydroxide (more correctly oxyhydroxide) layers on their surfaces (if the reducing conditions are produced by iron or steel grinding media). This aspect is now known to be usually a detrimental feature as greater reagent additions, particularly of collector, are needed to compete with the adsorbed iron oxyhydroxides. However, some exceptions exist.
The signifi cance of the grinding media can be judged by the fact that the vast majority of
regrinding mills in Australia were designed with, or converted to, media that were inert (eg
silica or ceramic) or were iron with an elevated chromium level to lower its susceptibility
to corrosion and lessen contamination of surfaces with iron oxyhydroxides. The change
in industry practice was driven by a combination of more cost-effective media and the
detrimental effect of iron/steel media on the fl otation process. The economics of such
conversions are now being examined for primary grinding circuits.
Electrochemical mechanism for collector adsorption
For recovery of a valuable particle, the fl otation process is considered to require a successful
outcome in each of the following subprocesses: collision between particle and bubble,
adhesion of particle to bubble, transportation of the particle attached to the bubble to the
base of the froth region and transportation of the particle through the froth region. It is
usually considered that chemical aspects of the system are important in the last three of
these subprocesses. Hence, the importance of the chemical aspects of the fl otation process
can be recognised and major applications of research in this area will now be considered.
Up to the 1950s, there was a controversy between Taggart (chemical reaction) and Wark
(chemisorption) on the mechanism for collector adsorption on the surface of the valuable

Spectrum Series 18
H I S T O R Y O F F L O TAT I O N
280
mineral. The chemical property that was not prominent in the controversy previously
was the role of pulp potential (Eh) in the uptake of collector on the surface of the valuable
mineral. The possible importance of Eh arose from a contribution by Nixon (1957). Woods
(1990) commented that:
Australia’s Nixon proposed another way in which a neutral surface can be achieved; he suggested that ‘the troublesome electrons are removed from the xanthate ion by a reaction with oxygen’.
Although it was not explicitly stated, the assumption was by a corrosion type mechanism involving the simultaneous anodic oxidation of the collector and the cathodic reduction of oxygen. The proposed ‘corrosion type mechanism’, ie an electrochemical mechanism for collector uptake, could be demonstrated experimentally if collector uptake was only possible in defi nite Eh regions (preferably in accordance with the thermodynamics of the underlying equations, although this was not necessary for industrial use where the regions can be observed by experiment).
From that time to the end of the 1980s, experimental work at various scales (laboratory
cyclic voltammetry, instrumented laboratory batch cells, pilot plant scale and plant scale)
allowed conclusive demonstration of the importance of Eh in collector uptake (and also the
action of many depressants and activators) and how its role was of practical importance to
the operation of an industrial fl otation process, and in developing new fl otation separations.
Earlier, the importance of pulp potential had been demonstrated in other analogous parts
of the minerals industry, eg leaching reactions in hydrometallurgy (Natarajan and Iwasaki,
1974) and in the science of geochemistry (Mason, 1966). The role of pulp potential took
longer to be recognised in the fl otation process. In Figure 9.2, a transition region for Eh is
indicated, below which electrochemical uptake of collector (xanthate) does not occur. Above
this Eh value, the anodic reaction in the electrochemical mechanism can proceed, producing
the following compounds from the uptake of xanthate, which is the most commonly used
collector family:
• a metal xanthate as for the Taggart proposal;
• an adsorbed xanthate radical as for the Wark proposal; and
• dixanthogen, which is the adsorbed dimer from xanthate when the Eh is suffi ciently high for the reaction that produces the dimer.
Contributions from more than one of the above mechanisms were possible under the electrochemical approach. Further, the electrochemical model can also be used to explain the action of many examples of depression or activation. For each of the valuable minerals, experimental work at a fi xed pH has provided a relationship between recovery of the valuable mineral and Eh. This relationship has the following typical form (Trahar, 1984; Richardson and Walker, 1985):
• A transition region of rapidly rising recovery with small increases in Eh. These Eh values must be exceeded for the process to operate normally (indicated by the Eh values of the transition region in Figure 9.2 for galena). The Eh value for the transition region depends on the sulfi de mineral.

Spectrum Series 18
T E C H N O L O G I C A L R E S E A R C H
281
• A plateau region over which the recovery of the valuable mineral is uniformly high for a considerable range of Eh values. This is the Eh region in which the process can proceed normally.
• A region of rapidly decreasing recovery with small increases in Eh. These Eh values are too high for the process because the surface and/or the collector becomes oxidised.
The implication from Figure 9.2 is that galena would not be hydrophobic and ready for the fl otation process when the Eh did not exceed the transition region (Johnson, 1987). This situation can arise from diminished entry of oxygen into the pulp during its transportation or an increased requirement for oxygen by the ore. Severe examples of this scenario have been observed in the copper concentrator at Mount Isa (Grano, 1984) where chalcopyrite is the valuable mineral and examples of only moderate severity have been observed for galena in the lead–zinc concentrator at Mount Isa (Johnson, Jowett and Heyes, 1981). This situation causes an anomalous grade–recovery curve for the valuable element/mineral with a clear maximum in the concentrate grade part of the way along the bank. The early cells have diminished recovery and grade values because the preparation phase for the valuable mineral was not completed before entry to the bank.
Before 1950, the variables studied in fl otation systems (typically at laboratory scale) were the effect of pH, the adsorption properties of various families of collector, and the effect of various cations and anions on the fl otation process. In general, these studies were conducted in air saturated systems. In terms of studies after 1950, in which the importance of both pulp potential (Eh) and pH became recognised, the work before 1950 largely investigated the effect of pH at the equilibrium value of pulp potential associated with that pH value. Such work has continued up to the present but it has been supplemented by work at Eh values above and below the equilibrium pulp potential. As a result of the increased understanding, the following chemical parameters can be measured as a part of chemical surveys, which may be conducted alone or in conjunction with surveys of grinding and regrinding mills, along with fl otation banks:
• pulp potential (Eh) and pH, summarised in Eh-pH diagrams, and supplemented by other measurements, eg dissolved oxygen concentration, concentrations of various reagents, anions and cations depending on the system;
• oxygen demand (Spira and Rosenblum, 1974); and
• oxidation level of surfaces:
◦ use of a well-known metal complexing reagent (ethylenediaminetetra-acetic acid – EDTA) for extraction of adsorbed metal ions from surfaces (Rumball and Richmond, 1996); and
◦ surface analysis by instruments.
Industrial examples of the importance of Eh/pH values and the practical role of the transition region for Eh were given in preceding paragraphs for two plants at Mount Isa. Further, an example of problem solving using Eh/pH values is given in the section on sphalerite separation in the zinc circuit concerning process developments in the lead–zinc concentrator in Mount Isa. Further discussion is now provided for the fi rst two points listed above.

Spectrum Series 18
H I S T O R Y O F F L O TAT I O N
282
The steady state Eh value reached for a given ore/water system at pH 8 is typically in the range +100 to +300 mV (in Figure 9.2 at pH 8, it was +180 mV). To reach this value after grinding under reducing conditions, the accidental or planned introduction of oxygen from the atmosphere is the typical means. If there is a low oxygen demand (ores with low sulfi de mineral assays), the oxygen demand is likely to be satisfi ed accidentally from exposure to the atmosphere during transportation and, even if there is no consideration of oxygen addition during design of the plant, problems will not exist. However, if there is a signifi cant or high oxygen demand (ores with moderate or high sulfi de mineral assays, usually from pyrite/pyrrhotite being the co-dominant or dominant gangue mineral), the oxygen demand will not be satisfi ed accidentally from exposure to the atmosphere during transportation and an aeration or equivalent step will be required in the plant design. The oxygen demand test provides the required oxygen addition in such steps.
The introduction of oxygen or other oxidants to satisfy the oxygen demand of the ore and the ongoing addition of air in the fl otation cells results in progressive oxidation of the sulfi de minerals from the beginning to the end of the grinding/fl otation system. This progressive oxidation can be monitored by the two methods listed earlier (EDTA extraction of metal ions and surface analysis by instrument methods). At alkaline pH values, the metal ions from oxidation of the sulfi de minerals form their insoluble oxyhydroxides, which adsorb randomly on the surfaces of the particles in the system. The presence of these adsorbed oxidation products lower the fl otation rate constants for the valuable mineral(s), cause increased collector additions and the metal ions released can cause unintended activation of minerals in the ore, eg copper, lead and silver ions from oxidation of valuable minerals present activating sphalerite in a galena fl otation circuit. The oxidation of valuable sulfi des in the fl otation circuit (anodic reaction) is known to be accentuated by high pyrite feed grades (providing a large area of cathode for oxygen to accept electrons from the anodic oxidation reaction of valuable sulfi des), ie the importance of another electrochemical reaction can be recognised.
A valuable publication during the development of many of these topics was Principles of
Mineral Flotation, published in 1984 by The Australasian Institute of Mining and Metallurgy,
which contains the papers from the Wark Symposium held in Adelaide in 1983 as a tribute to
Sir Ian Wark and his earlier work (Wark, 1938; Sutherland and Wark, 1955). In the following
sections the techniques used to correct current and long-term problems in the effi ciencies of
a lead–zinc concentrator are discussed as examples of technological applications of fl otation
research. Some details are given in the supplementary notes.
CASE STUDY – CORRECTING A DECLINE IN PERFORMANCE OF A LEAD–ZINC CONCENTRATOR AFTER CONVERSION TO A SINGLE CIRCUIT WITH LARGER FLOTATION CELLS
Background
A major development program was carried out in the lead–zinc concentrator of Mount Isa Mines Ltd (now Xstrata) from 1980 to 1997 for three reasons:

Spectrum Series 18
T E C H N O L O G I C A L R E S E A R C H
283
• the zinc recovery in zinc concentrate was traditionally relatively low and had to be increased;
• the ore still to be mined had higher zinc grades and lower lead grades, thereby increasing the importance of zinc recovery; and
• increases in throughput and changes to more diffi cult ores also revealed capacity limitations and increased the need for a more effi cient plant with higher recoveries.
The early history of lead–zinc metallurgy at Mount Isa has been documented (Kruttschnitt, Jacobsen and Gross, 1939; Cunningham, 1953) and a description of the plant before the development phase was given by Watsford (1980). The lead–zinc orebody was very much at the ‘diffi cult to treat’ end of the spectrum of the lead–zinc orebodies known at that time, due to its fi ne grain size (Figure 9.13) and the naturally hydrophobic, carbonaceous pyrite component that diluted the lead concentrate. The current plant was commissioned in 1966 with two parallel grinding and fl otation circuits (Challen et al, 1968) and a decision was made in 1979 to replace the existing fl otation machines with fewer higher capacity units, allowing the use of a single fl otation circuit. This installation commenced in April 1980 and the single circuit containing completely new cells started operating in October 1980. The new cells were Agitair 120 fl otation machines in which there were four impellers (2.8 m3/ impeller) per machine and they replaced Agitair 48 fl otation machines in which there was one impeller (1.4 m3) per machine. Because of the reduced number of banks and smaller number of control loops, the circuit modifi cations included supervisory control of reagent additions, bank froth depths, bank aeration rates and pump box levels by use of a Honeywell TDC system. The existing Courier on-stream analyser was used to monitor the single circuit in more detail than the two previous parallel circuits. The introduction of new fl otation machines and the reorganisation of some previous equipment meant that operating personnel required some time to adapt and learn the necessary operating methods. The fl ow sheet for the single circuit (lead and zinc sections) is given in Figure 9.3. Unusual design aspects of the lead circuit were discussed by Davey and Slaughter (1970) and Bartrum, Dobrowolski and Schache (1977).
FIGURE 9.3
Circuit diagram for the lead–zinc concentrator in 1981–82 (in 1985–86, lead retreatment rougher concentratewas directed to an additional separate cleaning section, creating the low grade middlings (LGM) circuit).

Spectrum Series 18
H I S T O R Y O F F L O TAT I O N
284
Diagnosis of deterioration in plant performance
In May and June of 1981, full circuit surveys were conducted and analysed at various levels of detail to assist in solution of a major deterioration in plant performance. The surveys were planned and executed through the CSIRO Division of Mineral Engineering (Johnson, Wickham and Watsford, 1982) after allocation of a team of onsite laboratory personnel by Mount Isa Mines Limited. Five complete surveys of the concentrator were conducted between 14 May 1981 and 17 June 1981 along with some smaller surveys. In the progression from the fi rst to the last, there was increasing detail in the surveys, particularly in the zinc circuit for which the deterioration in performance was largest. In the last survey, ‘down the bank surveys’ were obtained for every bank in the lead and zinc circuits. It was established that reliable mass balances could be calculated from each of the surveys. After analysis of the data at the ‘unsized’ level, the samples from selected surveys were subjected to more detailed data collection at the mineral recovery–size and mineral recovery–size–liberation level. (See supplementary notes for more details about performances of size fractions.)
The low zinc recoveries in the zinc circuit around at the end of 1980–81 were found to be caused by high circulating loads of sphalerite, particularly in the fi nest infrasizer fraction (–8 μm), and the loss of some of this fi ne sphalerite to the fi nal tailing as a result of its somewhat diminished rate constant and the available residence time in the zinc secondary rougher-scavenger. The high circulating load of fi ne sphalerite was caused by higher than normal additions of lime/dextrin based depressant to the zinc cleaners in an attempt to obtain the target grade (52 per cent zinc) for the ore after installation of the single circuit. From analysis of the zinc cleaner and zinc rougher scavenger at the mineral recovery–size and mineral recovery–size–liberation levels, it was realised that depressing conditions in the zinc cleaners caused rejection of coarse composite sphalerite to the cleaner tailing and to regrinding, but that they also directed much of the fi ne free sphalerite to cleaner tailing. This formed a high circulating load between the sphalerite cleaning and rougher–scavenger sections and caused unacceptable sphalerite losses to fi nal tailing in the fi ne fraction (see Johnson, Wickham and Watsford, 1982 and Johnson, 1987 for more details).
Corrective actions
To regain normal performance of the fi ne sphalerite in the cleaning section, the target concentrate grade was lowered to 50.5 per cent zinc and no depressant was added to the zinc cleaner section. The loss of fi ne sphalerite (–8 μm) in fi nal tailing decreased but increases occurred in the proportion of sphalerite in the +38 μm fractions of the recalculated feed and in the recoveries of all minerals in that size fraction of the zinc concentrate.
A different method had to be used in the short to medium term to direct the sphalerite in composites to regrinding to obtain improved liberation. The coarse particles were removed by cycloning of third cleaner bank feed, causing a return to normal values for the distribution of sphalerite in the +38 μm fractions of the recalculated feed in the middle of 1981–82 (Figure 9.14 in supplementary notes). The low tonnage of +38 μm solid was fl oated in a small separate fl otation bank under the depressing conditions that used to be employed in the zinc cleaners (but were now unsustainable). The free sphalerite was recovered and joined the

Spectrum Series 18
T E C H N O L O G I C A L R E S E A R C H
285
fi nal concentrate and the composite particles containing sphalerite in the tailing were piped to the regrinding section for liberation. By April of 1983, the new zinc cleaning banks were extended (along with some rougher banks) and it was again possible by the use of depressing conditions (eg moderate lime additions) to reject sphalerite in composites to the cleaner tailing and hence the regrinding system by the traditional mechanism. Cycloning within the zinc cleaner block ceased. As a result of this experience, changes were made by the company in the attention paid to detailed data obtained from the period composite samples:
• The monthly data were examined in detail on a formal mineral recovery–size basis for each month (also known as period) rather than on a cursory basis.
• In January 1982, liberation data were obtained for the fi rst time on period data and this continued on every set of period data into the future. A detailed scheme for processing the data and extracting key parameters was developed and applied to each set of period liberation data.
The mineral recovery–size–liberation level of analysis was also applied to all sections of the plant in selected major plant surveys to understand the detailed performance of each section. The use of this level of analysis was rare at that time.
CASE STUDY – CORRECTING A DECLINE IN PERFORMANCE OF A LEAD–ZINC CONCENTRATOR CAUSED BY CHANGE IN ORE TYPE AND OTHER FACTORS
Background
During the 1980s, the increase in throughput and decline in head grades were exacerbated by a signifi cant increase in ore complexity. This resulted in a severe liberation problem, with the plant grind size being too coarse for the mineral grain sizes, and a worsening separation problem caused by increasing amounts of naturally fl oating carbonaceous pyrite. Metallurgical performance declined dramatically and it was clear that solutions could only come from a rigorous engineering approach. Two fundamental tools existed to understand the nature of the changes: mineral recovery–size analysis and mineral recovery–size–liberation analysis, the former having been used considerably in the past, unlike the latter. These two tools were applied to routine plant inventory samples, detailed plant surveys and samples from laboratory and pilot plant test work. This provided a unique mineralogical profi le of plant performance, which captured both the decade-long decline in performance, and the results of the step changes to improve it. From the 1960s and possibly earlier, inventory samples of plant products and feed were taken and assayed every shift for metallurgical accounting purposes. Care was taken with the design and operation of inventory samplers to ensure there was no size or assay bias. Shift samples were combined into daily composites, which were further combined into period composites (13 periods each year). The period composite samples were subjected to the following sizing and assaying:
• Screen sizing to 37 μm, followed by fi ne sizing (by Haultain Infrasizer until 1992–93, then by Warman Cyclosizer after 1992–93). The cyclosizer part of the sizing was modifi ed to allow extension of the size analysis to fi ner sizes, as well as convenient collection of the fi nest two fractions.

Spectrum Series 18
H I S T O R Y O F F L O TAT I O N
286
• Chemical assay of all size fractions, providing a fully sized mass balance for the plant
each period.
• Liberation analysis of size fractions starting January 1982. Until 1992–93 this was done
by manual point counting (Amdel Limited in Adelaide or in the company laboratory), and
afterwards at the QEM*SEM bureau. Integration of the mineral mass balances for each
size fraction (part of the mineral recovery–size analysis) with the liberation data gave the
more detailed mass balances for the mineral recovery–size–liberation analysis.
It is most unlikely that the plant performance improvement described later in this section
would have been achieved without the rigorous application of these tools for diagnosis
of process weaknesses and provision of justifi cation for process improvements. The two
most important process weaknesses were inadequate sphalerite liberation level from size
reduction and declining separation results in the lead circuit for liberated particles.
The fl ow sheet for the circuit (lead and zinc sections) in 1981–82 was given in Figure 9.3.
Unusual design aspects of the lead circuit were primary and secondary lead roughing
sections with a secondary grinding stage between the rougher sections and provision for
return of galena from the zinc circuit to the lead circuit via the regrinding/retreatment
section. Justifi cation for the unusual return of galena from the zinc circuit to the lead circuit
was the economic importance of maximising lead recovery up to that time due to the relative
prices of lead and zinc, the existence of a lead smelter onsite at Mount Isa for processing lead
concentrate, and lead feed grades being higher than zinc feed grades at that time. The lead–
zinc circuit in 1995 is depicted in Figure 9.4. This section is based on previous papers (Pease
et al (1997) on the lead circuit, Young et al (1997) on the zinc circuit and Johnson (1987) on
data analysis techniques).
FIGURE 9.4
Circuit diagram for the lead–zinc concentrator in 1995 after process changes (see text).

Spectrum Series 18
T E C H N O L O G I C A L R E S E A R C H
287
Liberation levels for sphalerite and galena
The liberation level for the recalculated feed, which was discussed previously, is a key concept used in this example. From 1984 to 1991, sphalerite liberation in the recalculated plant feed dropped from almost 70 per cent to just over 50 per cent (Figure 9.5).
FIGURE 9.5
Sphalerite liberation in the recalculated feed and zinc recovery (total and to zinc concentrate) versus time.
This was attributed mainly to fi ner grained ore, although the recalculated feed sizing (P
80 ) coarsened from 50 to 80 μm because of increases in throughput with no extra grinding
power. From the important Table 9.1, the sphalerite liberation decreased from the boundary between the ‘moderate’ and ‘poor’ categories to a long way into the ‘poor’ category. The decrease in sphalerite liberation caused a drop in zinc recovery, since the maintenance of zinc concentrate grade at the target (50.5 per cent zinc) allowed no additional low-grade sphalerite-bearing composites in the concentrate. Similarly galena liberation in the recalculated plant feed decreased from 70–75 per cent to 60–65 per cent by 1991, which is from the middle of the ‘moderate’ category into the ‘poor’ category. Lead recovery to lead concentrate tracked the decrease in galena liberation closely until 1991. This was accompanied by increased contamination of zinc in lead concentrate, and lead in zinc concentrate. There were two possible responses to the decrease in sphalerite and galena liberation – grind fi ner to increase liberation or accept increasing quantities of complex composite particles into the concentrate.
The dilemma – more grinding or a third concentrate
Because of the high capital cost of additional grinding and a shortage of capital for expenditure, the decision was made to produce a low grade middlings (LGM) concentrate from

Spectrum Series 18
H I S T O R Y O F F L O TAT I O N
288
1985–86 to maintain the total recovery for lead and particularly for zinc. This concentrate was produced by directing the rougher concentrate from the previous lead retreatment rougher (Figure 9.3) to a separate LGM cleaning section and directing the tailing from the LGM section to the fi nal tailing. The LGM concentrate assayed typically 13 per cent lead and 34 per cent zinc, compared with the target for zinc concentrate of 50.5 per cent zinc and less than three per cent lead. The LGM concentrate contained many galena/sphalerite composite particles that could no longer be allowed to report to the lead or zinc concentrates, otherwise their concentrate grades would be lower than the targets. Though metal payment terms were higher in a ‘single mineral’ concentrate than in LGM concentrate, this approach allowed lead and zinc concentrate quality to be maintained while still receiving some payment for metal in composites, which were becoming more prevalent.
The method of obtaining liberation data for Figure 9.5 changed from point counting to QEM*SEM at the end of 1992–93. Several sets of data were obtained by both methods at the time of the conversion and the QEM*SEM route increased the numerical value for sphalerite liberation in the recalculated feed by four per cent (absolute). For both methods, the liberation values as received are plotted in the graphs (no corrections).
The sphalerite liberation in all size fractions decreased almost uniformly over time, consequently zinc recovery decreased uniformly and production of LGM concentrate increased. By 1988, total zinc recovery had to be reduced further as the target value for the zinc assay in the LGM concentrate (34 per cent) could not be maintained. In hindsight, production of LGM concentrate distracted management from the true severity of the problem, since zinc recovery was still quoted as over 70 per cent (Figure 9.5) until 1989. This was really a misrepresentation, since only 55 per cent was recovered to zinc concentrate, with 15 per cent to LGM concentrate. At the beginning of LGM production, revenue per tonne of concentrate was higher because of favourable contract terms for LGM concentrate. As its production rose, market contract terms declined until a unit of zinc in LGM concentrate was worth less than half that of zinc in zinc concentrate. Over time the zinc recovery to zinc concentrate decreased greatly while production of LGM concentrate rose to unreasonable levels, and the capital cost of fi ne grinding, which previously had been deferred, was justifi ed. The underlying problem of inadequate liberation after the primary and secondary grinding circuits, particularly for sphalerite, was addressed principally via the ‘fi ne grinding project’ in 1992 (see section on solving underlying problems in the zinc circuit).
IsaMill technologyIn addition, in the middle of 1994–95, the new IsaMill technology was applied to regrinding lead cleaner block feed from 20–25 μm to a product of 12–15 μm (80 per cent passing sizes), providing a small additional increase in sphalerite liberation (see supplementary notes on IsaMill Technology). The IsaMill installation increased zinc recovery by up to fi ve per cent by liberating sphalerite from composites that previously reported to lead and LGM concentrates. Johnson et al (1998) reported the IsaMill installation increased:
… the liberation value of all minerals, when summed across all size fractions, allowing increased recovery of the galena in the fi ne size fractions and improved rejection of sphalerite, iron sulphides and non-sulphide gangue from the lead

Spectrum Series 18
T E C H N O L O G I C A L R E S E A R C H
289
concentrate. This improved the lead grade and concentrate quality and, over time, some of the increase in lead grade was traded-off to increase lead recovery.
There was better rejection of iron sulfi des and sphalerite from lead concentrate due to better liberation, and the IsaMill installation on the lead cleaner feed eliminated the complex galena middling particles from the LGM circuit, as shown in Figure 9.4. Process control became more effective because the circuit contained equipment that produced the required particle size without detrimental effects from introduced iron oxyhydroxides.
Galena separation in the lead circuit
Deteriorating results for liberated particles in the lead circuit became a serious problem. These were caused by increasing amounts of liberated, fi ne-grained, carbonaceous pyrite in the feed.
Figure 9.6 shows the lead head grade declining while iron sulfi de head grade increased during the 1980s – the ratio of iron sulfi de to lead in feed rose from around two in 1977 to almost four in 1992. Worse still, an increasing proportion of this pyrite was present as the naturally fl oating carbonaceous type rather than the ‘normally behaved’ euhedral pyrite. Carbonaceous pyrite remains hydrophobic under most fl otation conditions, and also adsorbs large quantities of reagents, which makes fl otation diffi cult to control. Since it is naturally hydrophobic it was mainly a problem in the lead circuit.
4.00
5.00
6.00
7.00
8.00
9.00
10.00
73/74 74/7575/76 76/77 77/78 78/79 79/80 80/81 81/82 82/83 83/84 84/85 85/86 86/87 87/88 88/89 89/90 90/91 91/92
Year
% Pb
0
5
10
15
20
25
% IS
Iron sulphides (IS)
Lead Grade
FIGURE 9.6
Decreasing lead head grade and increasing iron sulfi de head grade with time.
Figure 9.7 shows a decline in lead recovery and falling average concentrate grade until
1992. Changes in ore sources caused severe fl uctuations in concentrate grade. The combined
effect of falling lead concentrate grade and variability was a major problem for the lead
smelter because throughput was limited by the sulfur removal capacity of the sinter plant.
The fi rst option for manipulating the behaviour of the carbonaceous pyrite was depressant
technology, the most effective depressant at natural pH (7.5 to 8) being a dextrin (60 per
cent)/azo dye intermediate product (40 per cent) (Bartrum, Dobrowolski and Schache, 1977;

Spectrum Series 18
H I S T O R Y O F F L O TAT I O N
290
Watsford, 1980). The depressant was added in the lead cleaning section. The second option
was prefl otation before lead roughing, which had been used in the past (Davey and Slaughter,
1970). A third option (‘cold’ lead reverse process) was developed in laboratory and pilot plant
development work in 1983. In the process, galena in fi nal lead concentrate was depressed
and the carbonaceous pyrite continued to be recovered in the reverse fl otation process.
In 1992, to improve lead circuit separation as part of the ‘fi ne grinding project’ package, the ‘cold’ lead reverse cleaning process (Figure 9.8) commenced operation to remove the fi ne carbonaceous pyrite from the lead concentrate produced from the conventional lead cleaning section.
FIGURE 9.7
Graphs of period lead recovery and period lead concentrate grade versus timeshowing the decrease in lead recovery and the variation in the period lead grade.
FIGURE 9.8
Flotation circuit for lead reverse cleaning.
To depress the galena, conventional lead cleaner concentrate was raised to pH 12 with lime at ambient temperature. The carbonaceous pyrite continued to fl oat and was recovered by roughing and cleaning to lower the galena content before discarding. The pyrite concentrate assayed in the region of 30 per cent iron, 32 per cent sulfur and 19 per cent lead. Typically, one per cent lead and 1.2 per cent silver recovery was lost for each one per cent increase in

Spectrum Series 18
T E C H N O L O G I C A L R E S E A R C H
291
lead concentrate grade (and the accompanying 0.5 per cent lower iron assay and 0.3 per cent lower sulfur assay in lead concentrate). The maximum upgrading capacity of the circuit (because of physical constraints) was four per cent lead. The circuit’s major advantage was providing independent control of lead grade–recovery decisions. In the conventional cleaners there was very little ability to trade lead recovery for lead grade, since the lead cleaner tailing assay had to be kept low to keep galena out of the zinc circuit where it diluted the zinc concentrate. The reverse cleaning circuit improved lead concentrate quality by removing carbonaceous pyrite and reducing variability and a process control system varied the air addition to the cleaning section of the reverse circuit to control the lead concentrate grade to a set point. Operation of the circuit was based on need, depending on ore sources and lead concentrate grade from the conventional lead cleaning section, metal prices and the onsite lead smelter performance.
Sphalerite separation in the zinc circuit
The decline in sphalerite liberation posed the most serious problem for zinc metallurgy, but decreasing separation effi ciency of liberated particles caused by increasing amounts of fi ne-grained, carbonaceous liberated pyrite was also an important issue for maintaining zinc metallurgy. Although the natural fl oatability of the carbonaceous pyrite resulted in a greater impact in the lead circuit, Figure 9.9 shows that there was also some impact on the zinc circuit.
49.00
50.00
51.00
52.00
53.00
54.00
55.00
56.00
57.00
173
/74
174
/75
175
/76
176
/77
177
/78
178
/79
179
/80
180
/81
181
/82
182
/83
183
/84
184
/85
185
/86
186
/87
187
/88
188
/89
189
/90
190
/91
191
/92
Year
% Z
n
0
1
2
3
4
5
6
7
8
% IS
Zn Grade IS Grade
FIGURE 9.9
Zinc grade and iron sulfi de grades for the zinc concentrate from 1981–82 to 1990–91.
For the same zinc concentrate grade from 1981–82 to 1990–91, iron sulfi de content rose from four to 6.5 per cent, which contributed to falling zinc recovery since the higher iron sulfi des content in the zinc concentrate left less room for composite particles containing sphalerite. Attempts to improve the separation of liberated particles in the zinc circuit included:

Spectrum Series 18
H I S T O R Y O F F L O TAT I O N
292
• operating the LGM circuit, which provided a destination for the streams containing the most diffi cult composites, eg zinc scavenger concentrate and zinc cleaner tailing;
• installation of new column cleaning capacity in the zinc retreatment and LGM circuits (Espinosa-Gomez et al, 1989; Espinosa-Gomez and Johnson, 1991); and
• changes in depressant practice in the zinc cleaners and unsuccessful testing of alternative collectors.
The most powerful process for separation of pyrite from a zinc concentrate was known to be the ‘hot’ zinc reverse fl otation process from practice around the world. Two versions of a ‘hot’ zinc reverse fl otation cleaning circuit were demonstrated at the pilot plant scale in 1983 for removal of iron sulfi des from the conventional zinc cleaner concentrate. However, by the time this approach was demonstrated, it was clear that circuit simplifi cation was the priority rather than the addition of new equipment for such a costly process. Measurements of Eh and pH were used to solve a diffi cult problem with one version of this process at the pilot plant scale (Johnson and Munro, 1988), these ensured that the necessary reducing conditions (Eh of 0 mV) at pH 4 existed before fl otation and were maintained along the bank.
The changes made during the 1980s were individually effective in achieving performance improvements but the rate of improvement did not match the rate of decline of the orebody properties along with increases in throughput. Further, the succession of small changes had dramatically increased circuit complexity as the circuit changes had treated symptoms rather than the underlying causes. There were three circuits (lead, zinc and LGM) instead of two (lead and zinc) and some circuits had multiple concentrate and tailing exit points, making plant operation more complex and less stable.
Solving underlying problems in the zinc circuit (1990–1997) – the fi ne grinding project
Metallurgical performance improved dramatically for sphalerite in the 1990s after the ‘fi ne grinding project’ addressed the underlying issue of very inadequate sphalerite liberation in the zinc circuit. Whilst it was well-known prior to 1992 that fi ner grinding was required from the mineral recovery–size–liberation data, the high capital cost prevented the acquisition of the requisite additional grinding equipment. Conversion of the copper concentrator to AG/SAG milling in 1991 assisted by releasing two 5 m by 6.1 m, 2.6 MW ball mills, greatly reducing the capital cost of the ‘fi ne grinding project’, which was approved to install these two mills in the lead–zinc concentrator, along with a 520 kW tower mill for additional regrinding in the LGM circuit (Figure 9.4). This mill was converted to use grinding balls with elevated chromium content.
The fi ner feed sizing and more dilute pulps required extra fl otation capacity, which resulted in the installation of two banks of nine Dorr-Oliver DO600 cells for lead secondary roughing and scavenging, and three banks of 12 Dorr Oliver DO600 cells for zinc roughing and scavenging. Existing fl otation cells were used to provide additional roughing, retreatment or cleaning capacity. The fl ow sheet and equipment in the lead–zinc concentrator after the ‘fi ne grinding project’ were listed in the second edition of Australasian Mining and Metallurgy, The Sir Maurice Mawby Volume (Munro, 1993). In summary, the new equipment provided the following changes, excluding the lead reverse fl otation process discussed earlier:

Spectrum Series 18
T E C H N O L O G I C A L R E S E A R C H
293
• Increase in primary and secondary grinding power from 6.3 MW to 11.5 MW. The recalculated feed sizing (P
80 ) dropped from 80 to 37 μm.
• Increase in regrinding power from 0.75 MW to 1.27 MW. Regrinding size (P80
) in the LGM circuit dropped to 12 μm.
• Doubling of fl otation capacity.
The tower mill was commissioned in December 1991, and two secondary mills in October–
November 1992. Figure 9.5 shows the effect on sphalerite liberation and zinc recovery.
The key features were:
• Sphalerite liberation increased by 25 per cent by 1993.
• Total zinc recovery increased by eight per cent.
• More importantly, the amount of zinc reporting to the low value LGM concentrate was reduced, yielding an increase in zinc recovery to zinc concentrate of over 15 per cent. These recovery gains not only achieved feasibility study estimates almost immediately
after commissioning, but also quickly exceeded the same estimates.
An important feature towards the end of Figure 9.5 is that sphalerite liberation exceeded total sphalerite recovery. All the liberation gains for sphalerite from the fi ne grinding project were not converted to increased sphalerite recovery immediately, since more minerals were now in the diffi cult to separate size ranges (eg 20 per cent of the sphalerite was now less than 4 μm). Inadequate liberation was no longer a major issue. As for the lead circuit, it was realised that further development was required from improved understanding of fi ne particle surface chemistry. (By 2003, the gap between sphalerite liberation and sphalerite recovery had been almost halved from ongoing developments.) Recent developments are discussed in the supplementary notes.
AUTOMATED MINERALOGY
Introduction
Diagnosis and control of fl otation and other mineral concentration processes, including prediction and control of feedstock behaviour, is essential to the effi cient operation of the process plant and to the realisation of the full economic potential of the plant and the feed orebodies. By the 1970s use of online X-ray fl uorescence and laboratory based elemental analysis of samples throughout a plant provided the gross measure of feed grade, yield, losses and amount of cross-contamination between desired products. The broad behaviour of a plant could thus be monitored and various control strategies invoked. However, the mineral mass fl ow through a plant, degree of liberation of individual minerals and the extent of composite particle occurrence for example could only be determined by examination of individual samples in an optical microscope, and for more quantitative measures by optical point counting. This technique, including various measures of liberation and size distribution, became widely used (King, 1983; Petruk, 2000).
The point counting technique of course depends on operator skill, the maximum number
of minerals that can be readily identifi ed and the number of particles it was feasible to

Spectrum Series 18
H I S T O R Y O F F L O TAT I O N
294
examine at suffi cient resolution in a reasonable time. In the 1970s various groups in Canada
(Petruk, 1984), United Kingdom (Jones, 1984, 1987) South Africa (Oosthuyzen, 1983) and
Australia (Grant et al, 1977; Reid and Zuiderwyk, 1983; Reid et al, 1984) began to develop
optical and electron beam methods of automating the collection of point counting data.
The CSIRO project, headed by A F Reid, began in 1975 to trial the use of the scanning electron
microscope as a means of automated scanning of sectioned fl otation samples to rapidly and
accurately determine the volume fractions of a wide range of mineral compositions (modal
analysis), along with improved measures of their liberation and compositeness, as well as
the size distributions of the particles and their component minerals.
This work, strongly supported by Australian mining companies through the Australian Mineral Industries Research Association (AMIRA), led to the development of the QEM*SEM, later renamed QEMSCAN, a completely automated instrument that allowed the rapid identifi cation and measurement of a desired number of mineral grains, drill core or ore sample sections. This measurement system, based on image analysis and stereological principles, incorporates a wide range of innovations in measurement technique. These include automated beam current and backscatter electron (BSE) intensity calibration, the scanning of up to nine, and later 16, separate samples, and a ‘reference library’ of the EDS spectra and elemental composition of most known economic and gangue minerals.
Methodology
Sample preparationIn order to ensure the random orientation and sampling of mineral grains, fl otation concentrates or other samples, such as sized and sampled crushed drill core, were mixed in the ratio 1:10 with crushed graphite of the same size range, and the mixture mounted in epoxy resin (Miller, Reid and Zuiderwyk,1982; Reid et al, 1984). Particular care was given to sectioning and polishing, so as to minimise image defects (Jackson, Reid and Wittenberg, 1984).
Mineral mapping in the scanning electron microscope
The electron beam is typically scanned over a 1 to 5 mm square raster in steps of 0.25 to
25 microns, and the sample stage then automatically stepped to the next area. Within each
sampled area an original boundary-tracing algorithm (Grant and Reid, 1981) defi nes the
location and area of each particle and of the individual minerals within each grain or section.
BSE signals provide very high-speed discrimination between the epoxy medium and mineral
grains, so that recorded observations are made only on minerals. Search algorithms were
developed that interpreted the recorded energy dispersive X-ray (EDS) spectra, taken to a
fi xed count per point to determine the elements, and thus the mineral present (Figure 9.10).
Mineral identifi cations were typically made within the 10 ms or so in which the electron beam
dwelt at the next sampling point. In this way each mineral was identifi ed at each coordinate
point, and a condensed but highly detailed map, using run lengths of each mineral type, was
produced for each grain. Several hundred grains per sample and up to nine, and later 16,

Spectrum Series 18
T E C H N O L O G I C A L R E S E A R C H
295
samples were measured automatically in one overnight period, and the resulting data then
subjected to a variety of interpretive procedures.
For common minerals, a total of 1000 counts per point is suffi cient for identifi cation, as opposed to accurate but much slower chemical analysis by various electron beam methods. Reference sets of several hundred mineral spectra were accumulated, including a wide variety of silicates and non-silicate gangue species, as well as most of the economically important sulfi des. For more complex mineral groups, such as nickel sulfi des, or the range of iron-containing sphalerites, higher count values can be called up. In some cases the discrimination between minerals of different density provided by backscatter electrons (with signal intensity proportional to average atomic number) is suffi cient to discriminate between species such as sulfi des and silicates or goethite and haematite. BSE signals also allow for very effi cient location of sparse minerals of high density, such as those of the platinum metals group; their detailed mapping can then be combined with the more general mapping of the total mineral population.
Prototype QEMSCANs and subsequent production versions employed large automated sample stages, up to four EDS detectors to obtain maximum count rates and sample throughput, and a variety of techniques for beam stabilisation, beam density and BSE signal calibration. The related mineral liberation analysis (MLA) system more recently developed at JKMRC, University of Queensland, based on early collaboration with CSIRO (Grant et al, 1977), employs a subset of the QEMSCAN techniques and is also applied to a wide range of mineral process operations (Fandrich et al, 2007). Both systems are now available with high speed silicon drift EDS detectors, equipped with thermoelectric rather than liquid nitrogen cooling.
FIGURE 9.10
Composite ore particle QEMSCAN image, ~200 μm. The tracing algorithm fi nds the boundary of the particle and the bounding rectangle within which it fi ts. On re-scan, the boundary of each separate mineral exposure is also found. Areas, segment lengths, boundary lengths and mineral to mineral transitions are all recorded. A ‘cleaning’ step removes false identifi cations at transitions.
Beam stepping intervals are typically from 0.25 μm to 25 μm. Note that the platinum group mineral is completely enclosed in pentlandite.

Spectrum Series 18
H I S T O R Y O F F L O TAT I O N
296
Validation
For the intended applications of QEMSCAN it was important to validate the sample preparation and measurement procedures to ensure that the spatial, stereological and
compositional data provided by the system was appropriately based. For example, it was
shown that the use of small-scale spinning riffl es to produce 100–300 mg of fl otation
particle samples gave mineral compositional variances in the one to three per cent range,
which were essentially identical to those calculated from random statistics and the number
of particles measured (Reid and Zuiderwyk, 1983; Reid et al, 1984). Similarly, the elemental
compositions of a total sample calculated from mineral volume fractions, known mineral
compositions and known densities were very reproducible, and very close to bulk elemental
chemical analyses both for fl otation samples (Miller, Reid and Zuiderwyk, 1982) and for
those from drill core (Reid et al, 1984). Considerable subsequent work has continued to
confi rm these fi ndings.
Information output
From the maps of the individual mineral grain sections in a drill core, grind or fl otation sample, a large number of geometric, size and compositional parameters may be derived. In particular the area fraction of each mineral in each section sums to the volume fraction of that mineral in the whole sample. For fl otation samples this immediately provides the percentage yield (or loss) in that sample or size fraction. By dividing the area fraction of exposure of the mineral of interest into deciles, 0–10 per cent through to 90–100 per cent, the cumulative liberation yield (Miller, Reid and Zuiderwyk, 1982) can be determined, so that as well as the total yield the degree of intergrowth and of occurrence of composite particles can be determined for the sample or the size fraction. A simple variance for each decile and the total liberation value has been derived for this form of presentation (Reid et al, 1984) and the degree of bias in such estimates has been examined in detail (Lätti and Adair, 2001). The same data can be used to construct yield versus grade curves for each size fraction, and for their combined values for the whole sample (Figure 9.11).
It has also proved particularly useful to display the mineral grain and liberation information in visual form, with the maps of individual particle sections arranged in order of area fraction of a given mineral (Figure 9.12). This allows an immediate visual appreciation of the liberation dynamics, as well as the nature of the unwanted minerals in each fraction. These may be misplaced fl otation product (eg sphalerite in galena concentrate), carried or included impurities, such as arsenopyrite, or magnesium silicates in nickel concentrate composites. For a well-sampled plant, combination of the size fraction data for each sample provides the mineral mass balance and mineral mass fl ows for the whole plant, as well as grade-recovery curves (Figure 9.11) for each fraction or sample.
Mineral associations and grain sizes
As well as determining run lengths and areas for a given mineral, data which can be used to
derive grain and individual mineral size distributions and liberation statistics (Miller, Reid
and Zuiderwyk, 1982; King, 1983; Leigh, Lyman and Gottlieb, 1996; Sutherland, 2007), the

Spectrum Series 18
T E C H N O L O G I C A L R E S E A R C H
297
mapping technique employed by QEMSCAN also allows a count of the number of transitions
from one mineral to the next or of mineral edge to background (Miller, Reid and Zuiderwyk,
1982). This allows the determination of specifi c mineral associations, normalised with respect
to random distributions, and therefore aids their tracking through a fl otation or separation
process. For example, the silver mineral freibergite can be predominately associated with
galena and pyrite, uranium species with specifi c copper minerals and platinum group
minerals with nickel sulfi de species such as pentlandite (Figure 9.10). The fi rst commercially
installed QEMSCAN, at Rustenburg Platinum Holdings (now Anglo American Platinum
FIGURE 9.11
Grade versus recovery (per cent) for sphalerite concentrate in sieve, cyclosizer and combined size fractions.
FIGURE 9.12
QEMSCAN visualisation of sized fl otation concentrates and tailings.
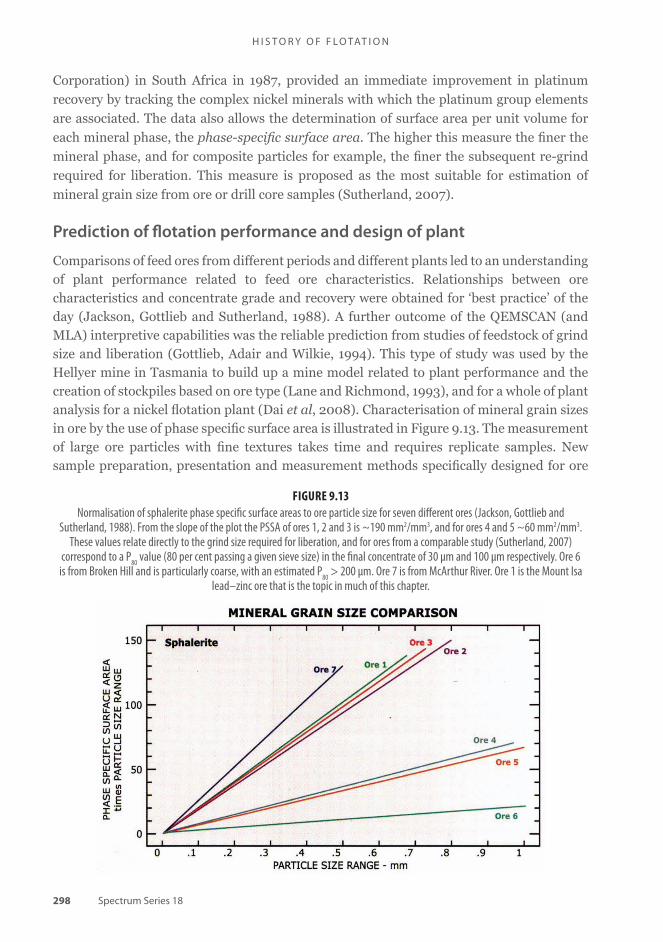
Spectrum Series 18
H I S T O R Y O F F L O TAT I O N
298
Corporation) in South Africa in 1987, provided an immediate improvement in platinum
recovery by tracking the complex nickel minerals with which the platinum group elements
are associated. The data also allows the determination of surface area per unit volume for
each mineral phase, the phase-specifi c surface area. The higher this measure the fi ner the
mineral phase, and for composite particles for example, the fi ner the subsequent re-grind
required for liberation. This measure is proposed as the most suitable for estimation of
mineral grain size from ore or drill core samples (Sutherland, 2007).
Prediction of fl otation performance and design of plant
Comparisons of feed ores from different periods and different plants led to an understanding of plant performance related to feed ore characteristics. Relationships between ore characteristics and concentrate grade and recovery were obtained for ‘best practice’ of the day (Jackson, Gottlieb and Sutherland, 1988). A further outcome of the QEMSCAN (and MLA) interpretive capabilities was the reliable prediction from studies of feedstock of grind size and liberation (Gottlieb, Adair and Wilkie, 1994). This type of study was used by the Hellyer mine in Tasmania to build up a mine model related to plant performance and the creation of stockpiles based on ore type (Lane and Richmond, 1993), and for a whole of plant analysis for a nickel fl otation plant (Dai et al, 2008). Characterisation of mineral grain sizes in ore by the use of phase specifi c surface area is illustrated in Figure 9.13. The measurement of large ore particles with fi ne textures takes time and requires replicate samples. New sample preparation, presentation and measurement methods specifi cally designed for ore
FIGURE 9.13
Normalisation of sphalerite phase specifi c surface areas to ore particle size for seven diff erent ores (Jackson, Gottlieb and Sutherland, 1988). From the slope of the plot the PSSA of ores 1, 2 and 3 is ~190 mm2/mm3, and for ores 4 and 5 ~60 mm2/mm3.
These values relate directly to the grind size required for liberation, and for ores from a comparable study (Sutherland, 2007) correspond to a P
80 value (80 per cent passing a given sieve size) in the fi nal concentrate of 30 μm and 100 μm respectively. Ore 6
is from Broken Hill and is particularly coarse, with an estimated P80
> 200 μm. Ore 7 is from McArthur River. Ore 1 is the Mount Isa lead–zinc ore that is the topic in much of this chapter.

Spectrum Series 18
T E C H N O L O G I C A L R E S E A R C H
299
characterisation have therefore been developed. Used at an early stage in the mining life cycle the resultant data allows prediction of processing behaviour and processing properties for stockpiling, blending and block models (Fennel et al, 2005).
With over 150 QEMSCAN and MLA units around the world it has now become
commonplace not only to interpret the performance of operating plants by use of QEMSCAN
measurements but also to assess orebody composition, including for block models, and to
predict plant performance from drill core and ore samples. In this process not only the
mineral abundances, but the nature of the gangue minerals, the mineral associations and
the natural grain sizes (from transect measurements and determination of phase specifi c
surface areas) are all important in predicting grind size, the design of necessary fl otation or
other concentration circuits and the likely recoveries and losses. Perhaps one of the most
intensive of premining and preprocessing QEMSCAN applications is the very large planned
extension of the Olympic Dam copper–uranium deposit in South Australia.
Case study – Olympic Dam deposit
Located 560 km north of Adelaide, South Australia, Olympic Dam is the world’s fourth
largest remaining copper and gold deposit and the largest known uranium deposit. The
deposit contains chalcocite, bornite, chalcopyrite, pyrite and three major uranium mineral
species (uraninite, coffi nite and brannerite), which are associated with the copper, as well
as gold and silver mineralisation. Both the existing underground mining operation, with its
associated concentrator, hydrometallugical circuit and smelter, and the evaluation of drill
core samples from the extensive prefeasibilty studies of the proposed much larger open pit
operation, have made extensive, and essential, use of both QEMSCAN and MLA facilities.
The fl otation and leaching circuits are sampled throughout from mill feed to tailings
leach residues on a regular basis to provide size by size analysis of plant performance and
mineral species behaviour. Prior to 2003 this analysis depended on optical point counting,
but since then full mineralogical mass fl ow data have been obtained by MLA or QEMSCAN
measurements. Since 1994 there have also been in place computational procedures to convert
elemental chemical assays back to mineralogical compositions for plant and feed samples,
using the known suite of minerals in the ore. This computation, similar to that described by
Huminicki, Sylvester and Shaffer (2007) is also applied to the monthly composite samples
of smelter feed. In the prefeasibility study of the planned open cut extension, up to 15 m
intercepts from a 150 × 150 m drilling grid over several square kilometres were examined
using multiple MLA units, with core samples crushed and sampled at –600 +425 μm.
In keeping with the size of the deposit, this is probably one the most extensive applications
of automated mineralogy yet undertaken.
Automated mineralogy worldwide
The power of the QEMSCAN and MLA data acquisition and interpretation systems has led to their widespread use by mining companies in-house and by service organisations such as ALS Mineralogy and SGS Mineral Services in Australia and the Colorado School of Mines

Spectrum Series 18
H I S T O R Y O F F L O TAT I O N
300
and University of Utah in the USA. International seminars on this methodology (MEI, 2007, 2008) feature numerous studies employing QEMSCAN or MLA systems in fl otation and orebody and feed assessment, and there is a substantial bibliography on QEMSCAN development and applications (X-Ray Mineral Services, 2008). It is to be expected that the capabilities provided by QEMSCAN and MLA will continue to be enlarged (Fennel et al, 2005), augmented by information technology systems that allow ready analysis of the entirety of a process plant’s performance, comparison of performance between different plants, characterisation of ore blocks and mineral deposits and applications to every kind of mineral process and type of mineral.
Where bulk chemical analyses of large amounts of drill core or other ore samples are
historically or presently available, qualitative characterisation of the minerals present in the
orebody using selected samples, followed by normalisation of the chemical compositions
back to mineral volume fractions (as for example at Olympic Dam and in Huminicki, Sylvester
and Shaffer, 2007), allows a much more powerful use of expected process performance than
the simple elemental analyses. This technique can also be applied to periodic composite
samples such as bulk concentrates or smelter feed. While other specialised techniques
continue to be developed (Donskoi et al, 2008) it appears that the suite of techniques and of
output information sets provided by QEMSCAN and the related MLA systems will continue
to increase, and be even more widely applied.
REFERENCES
Bartrum, J, Dobrowolski, H J and Schache, I S, 1977. Developments in milling of silver–lead–zinc ores in the Mount Isa area since 1970, in Lead–Zinc Update 1977, pp 157–182 (American Institute of Mining, Metallurgical and Petroleum Engineers: Littleton).
Cameron, A W, Kelsall, D F, Restarick, C J and Stewart, P S B, 1971. A detailed assessment of concentrator performance at Broken Hill South Limited, AusIMM Proceedings, 240:53–67.
Challen, R H, Draper, N, Hoffmann, C W and Menzies, R B, 1968. The design, construction and comm-issioning of No 2 Concentrator, Mount Isa Mines Limited, AusIMM Proceedings, 226:109–130.
Cullinan, V, 1995. AMIRA P260B update report, September (Ian Wark Research Institute: Adelaide).
Cullinan, V, Grano, S R, Greet, C J, Johnson, N W and Ralston, J, 1997. Investigating fi ne galena recovery problems in the lead circuit of Mount Isa Mines Limited lead/zinc concentrator, Part 1: Grinding media effects, Minerals Engineering, 12(2):147–163.
Cunningham, K T, 1953. Milling at Mount Isa, AusIMM Proceedings, 171:307–340.
Dai, Z, Bosa, J A, Lee, A and Wells, P, 2008. Mass balance and mineralogical analysis of fl otation plant survey samples to improve plant metallurgy, Minerals Engineering, 21(12–14).
Davey, J M and Slaughter, P J, 1970. Changes in lead–zinc fl otation practice at Mount Isa Mines Limited, 1955–1970, in Proceedings AIME World Symposium on Mining and Metallurgy of Lead and Zinc, St Louis, 1(22):401–427.
Donskoi, E, Poliakov, A, Manuel, J R and Raynlyn, T D, 2008. Development of optical image analysis techniques for better mineral and texture identifi cation of iron ores, in Proceedings Automated Mineralogy ’08, Brisbane, 27–28 August.
Enderle, U, Woodall, P, Duffy, M and Johnson, N W, 1997. Stirred mill technology for regrinding McArthur River and Mount Isa zinc/lead ores, in Proceedings XX International Mineral Processing Congress, Aachen, vol 2, pp 71–78.

Spectrum Series 18
T E C H N O L O G I C A L R E S E A R C H
301
Espinosa-Gomez, R and Johnson, N W, 1991. Technical experiences with conventional columns at Mount Isa Mines Ltd, in Proceedings Column ’91, 2:511–523.
Espinosa-Gomez, R, Johnson, N W, Pease, J D and Munro, P D, 1989. The commissioning of the first flotation columns at Mount Isa Mines Limited, in Proceedings International Symposium on Complex Ores Processing, pp 293–302 (Canadian Institute of Mining and Metallurgy: Montreal).
Fandrich, R, Gu, Y, Burrows, D and Moeller, K, 2007. Modern SEM-based mineral liberation analysis, International Journal of Mineral Processing, 84:310–320.
Fennel, M, Guevara, J, Canchaya, S, Velarde, G, Baum, W and Gottlieb, P, 2005. QEMSCAN mineral analysis for ore characterisation and plant support at Cerro Verde, in XXVII Convencion Minera, Arequipa, Peru.
Fiedler, K F, Munro, P D and Pease, J D, 1984. Commissioning and operation of the 800 tph heavy medium cyclone plant at Mount Isa Mines Limited, in Proceedings AusIMM Annual Conference, pp 259–271 (The Australasian Institute of Mining and Metallurgy: Melbourne).
Finch, J A and Dobby, G S, 1990. Column Flotation (Pergamon Press: Oxford).
Gaudin, A M, Groh, J O and Henderson, H B, 1931. Effect of particle size on fl otation, AIME Technical Publication 414, pp 3–23.
Gottlieb, P, Adair, B J and Wilkie, G J, 1994. QEM*SEM liberation indices for grinding classifi cation and fl otation, in Proceedings Fifth Mill Operators’ Conference, pp 5-14 (The Australasian Institute of Mining and Metallurgy: Melbourne).
Grano, S R, 1984. Performance of rougher-scavenger banks at Copper Concentrator, Technical Memorandum, Mount Isa Mines Limited, Mount Isa.
Grano, S R, Lauder, D W, Johnson, N W and Ralston, J, 1997. An investigation of galena recovery problems in the Hilton Concentrator of Mount Isa Mines Limited, Australia, Minerals Engineering, 10(10):1139–1163.
Grano, S R, Ralston, J and Johnson, N W, 1988. Characterisation and treatment of heavy medium plant slimes in the Mt Isa Mines lead/zinc concentrator, Minerals Engineering, 1(2):137–150.
Grano, S R, Wong, P L, Skinner, W, Johnson, N W and Ralston, J, 1995. Detection and control of calcium sulphate precipitation in the lead circuit of the Hilton Concentrator of Mount Isa Mines Limited, Australia, in Proceedings XIX International Mineral Processing Congress, Chapter 29, pp 171–179.
Grant, G, Hall, J S, Reid, A F and Zuiderwyck, M, 1977. Characterization of particulate and composite mineral grains by on-line computer of SEM images, in Proceedings 15th APCOM Symposium, pp 159–170 (The Australasian Institute of Mining and Metallurgy: Melbourne).
Grant, G and Reid, A F, 1981. An effi cient algorithm for boundary tracing and feature extraction, Computer Graphics and Image Processing, 17:225–237.
Greet, C (ed), 2009. Flotation Plant Optimisation: Methodologies for Identifying and Solving Problems Within Base Metal Sulphide Flotation Plants (The Australasian Institute of Mining and Metallurgy: Melbourne).
Huminicki, M A E, Sylvester, P J and Shaffer, M, 2007. Three-dimensional quantitative mineralogical modeling of the Voisey’s Bay Ni-Cu-Co Ovoid deposit: Confi rming the mineralogical model using MLA techniques, in Proceedings Automated Mineralogy ’07, Brisbane, 1–23 September.
Jackson, B R, Gottlieb, P and Sutherland, D N, 1988. A method for measuring and comparing the mineral grain sizes of ores from different origins, in Proceedings Third Mill Operators’ Conference, p 61 (The Australasian Institute of Mining and Metallurgy: Melbourne).
Jackson, B R, Reid, A F and Wittenberg, J C, 1984. Technical note – Rapid production of high quality polished sections for automated image analysis of minerals, AusIMM Proceedings, 289(March):93–97.

Spectrum Series 18
H I S T O R Y O F F L O TAT I O N
302
Johnson, N W, 1987. Application of kinetics and liberation data to analysis of an industrial fl otation process, CIM Bulletin, 80(899):113–117.
Johnson, N W, 1988. Application of electrochemical concepts to four sulphide fl otation separations, in Proceedings Conference on Electrochemistry in Mineral and Metal Processing II, May, pp 131–149 (Electrochemistry Society: Atlanta).
Johnson, N W, Gao, M, Young, M F and Cronin, B, 1998. Application of the ISAMILL (a horizontal stirred mill) to the lead/zinc concentrator (Mount Isa Mines Ltd) and the mining cycle, in Proceedings AusIMM Annual Conference, pp 291–297 (The Australasian Institute of Mining and Metallurgy: Melbourne).
Johnson, N W, Jowett, A and Heyes, G W, 1981. Oxidation-reduction effects in galena fl otation: Observations on Pb-Zn-Fe sulphides separation, IMM Transactions, 91:C32–37.
Johnson, N W, McKee, D J and Lynch, A J, 1974. Flotation rates of non-sulphide minerals in chalcopyrite fl otation processes, AIME Transactions, 256:204–209.
Johnson, N W and Munro, P D, 1988. Eh-pH measurements for problem solving in a zinc reverse fl otation process, AusIMM Proceedings, 293(3):53–58.
Johnson, N W and Munro, P D, 2002. Overview of fl otation technology and plant practice for complex sulphide ores, Minerals Processing Plant Design Practice and Control Proceedings (eds: A L Mular, D N Halbe and D J Barrett), vol 1, pp 1097–1123 (Society for Mining, Metallurgy and Exploration: Littleton).
Johnson, N W, Wickham, P and Watsford, R M S, 1982. Analysis of lead/zinc concentrator fl otation performance at Mount Isa Mines Limited, in Proceedings Second Mill Operators’ Conference, pp 313–326 (The Australasian Institute of Mining and Metallurgy: Melbourne).
Jones, M P, 1984. Recent developments in the rapid collection of quantitative mineral data, in Proceedings Second International Congress on Applied Mineralogy, Los Angeles, 22–25 February, pp 449–464.
Jones, M P, 1987. Applied Mineralogy: A Quantitative Approach (Graham and Trotman: London).
Jowett, A, 1966. Gangue mineral contamination of froth, Brit Chem Eng, 2:330–333.
Kelsall, D F, 1961. Application of probability in the assessment of fl otation systems, IMM Transactions, 70:191–204.
King, R P, 1983. Stereological methods for the prediction and measurement of mineral liberation, Special Publication of the Geological Society of South Africa, 7, pp 449–464.
Kruttschnitt, J, Jacobsen, L K and Gross, K B, 1939. Milling methods and costs at the Mount Isa Mines, Ltd, Mount Isa, Queensland, Australia, AusIMM Proceedings, 116:413–458.
Lane, G S and Richmond, G D, 1993. Improving fi ne particle fl otation selectivity at Hellyer, in Proceedings XVIII International Mineral Processing Congress, pp 897–904 (The Australasian Institute of Mining and Metallurgy: Melbourne).
Lätti, D and Adair, B J I, 2001. An assessment of stereological adjustment procedures, Minerals Engineering, 14(12):1579–1587.
Leigh, G M, Lyman, G J and Gottlieb, P, 1996. Stereological estimates of liberation from mineral section measurements: A rederivation of Barbery’s formulae with extensions, Powder Technology, 87(2):141–152.
Lynch, A J, Johnson, N W, Manlapig, E V and Thorne, C G, 1981. Mineral and Coal Flotation Circuits; Their Simulation and Control (Elsevier).
Mason, B, 1966. Principles of Geochemistry, third edition (John Wiley & Sons, Inc).
MEI, 2007. Automated Mineralogy ’07 Conference, Brisbane, 1–2 September.
MEI, 2008. Automated Mineralogy ’08 Conference, Brisbane, 27–28 August.

Spectrum Series 18
T E C H N O L O G I C A L R E S E A R C H
303
Miller, P R, Reid, A F and Zuiderwyk, M A, 1982. QEM*SEM image analysis in the determination of modal assays, mineral associations and mineral liberation, in Proceedings XIV International Mineral Processing Congress, Toronto, 17– 23 October.
Munro, P D, 1993. Lead–zinc–silver ore concentration practice at the lead/zinc concentrator of Mount Isa Mines Limited, Mount Isa, Queensland, in Australasian Mining and Metallurgy: The Sir Maurice Mawby Memorial Volume, second edition, pp 498–50 (The Australasian Institute of Mining and Metallurgy: Melbourne).
Natarajan, K A and Iwasaki, I, 1974. Eh measurements in hydrometallurgical systems, Minerals Science Engineering, 6(1):35–44.
Nice, R W and Brown, P J, 1995. The design of a base metals separation process, in Proceedings XIX International Mineral Processing Congress, San Francisco, pp 137–143.
Nixon, J C, 1957. Discussion, in Proceedings Second International Congress of Surface Activity, 3, 369.
Oosthuyzen, E J, 1983. The application of automatic image analysis to mineralogy and extractive metallurgy, Special Publication of the Geological Society of South Africa, 7, pp 449–464.
Pease, J D, Young, M F, Greet, C J, Johnson, N W and Munro, P D, 1997. Application of fi ne grinding to improve galena fl otation at the Mt Isa Mines lead/zinc concentrator, presented to AMIRA Annual Conference, P2.1–P2.12.
Petruk, W, 1984. Image analysis measurements and data presentation for mineral dressing applications, in Proceedings Second International Congress on Applied Mineralogy, Los Angeles, 22–25 February, pp 127–140.
Petruk, W, 2000. Applied Mineralogy in the Mining Industry, p 268 (Elsevier).
Petruk, W and Schnarr, J R, 1981. An evaluation of the recovery of free and unliberated mineral grains, metals and trace elements in the concentrator at Brunswick Mining and Smelting Corp Ltd, CIM Bulletin, 74(833):132–159.
Reid, A F, Gottlieb, P, MacDonald, K J and Miller, P R, 1984. QEM*SEM image analysis of ore minerals: Volume fraction, liberation and observational variances, in Proceedings Second International Congress on Applied Mineralogy in the Minerals Industry, Los Angeles, 22–25 February.
Reid, A F and Zuiderwyk, 1983. QEM*SEM: Automated image analysis and stereological applications to mineral processing and ore characterization, Acta Sterol 1983; 2/Suppl I: 205–208, Proceedings Sixth International Congress, Gainesville, 9–14 October.
Rey, M and Formanek, V, 1960. Some factors affecting selectivity in the differential fl otation of lead–zinc ores, particularly in the presence of oxidized lead minerals, in Proceedings International Mineral Processing Congress, London, pp 343–353.
Richardson, P E and Walker, G W, 1985. The fl otation of chalcocite, bornite, chalcopyrite and pyrite in an electrochemical cell, in Proceedings 15th International Mineral Processing Congress, 2:198–210.
Rohner, P, 1993. Lead–zinc–silver ore concentration practice at the Hilton Concentrator of Mount Isa Mines Limited, Mount Isa, Queensland, in Australasian Mining and Metallurgy: The Sir Maurice Mawby Memorial Volume, second edition, pp 504–507 (The Australasian Institute of Mining and Metallurgy: Melbourne).
Rumball, J A and Richmond, G D, 1996. Measurement of oxidation in a base metal fl otation circuit by selective leaching with EDTA, International Journal of Mineral Processing, 48:1–20.
Small, G L and Grano, S R, 1994. An x-ray photoelectron spectroscopic study of samples taken within the secondary grinding and lead fl otation circuits of the Mount Isa Mines Lead/Zinc Concentrator, Techsearch Report, University of South Australia.
Small, G L, Grano, S R, Ralston, J and Johnson, N W, 1997. Methods to increase fi ne mineral recovery in the Mount Isa Mines lead/zinc concentrator, Minerals Engineering, 10(1):1–15.

Spectrum Series 18
H I S T O R Y O F F L O TAT I O N
304
Spira, P and Rosenblum, F, 1974. The oxygen demand of fl otation pulps, in Proceedings Sixth Annual Meeting of the Canadian Mineral Processors, pp 74–106 (Canadian Institute of Mining and Metallurgy: Montreal).
Sutherland, D, 2007. Estimation of mineral grain size using automated mineralogy, Minerals Engineering Journal, 20:452–460.
Sutherland, K L and Wark, I W, 1955. Principles of Flotation (The Australasian Institute of Mining and Metallurgy: Melbourne).
Trahar, W J, 1984. The infl uence of pulp potential in sulphide fl otation, in Principles of Mineral Flotation – The Wark Symposium (eds: M H Jones and J T Woodcock), pp 117–135 (The Australasian Institute of Mining and Metallurgy: Melbourne).
Trahar, W J and Warren, L J, 1976. The fl oatability of very fi ne particles – A review, International Journal of Mineral Processing, 3:103–131.
Wark, I W, 1938. Principles of Flotation (The Australasian Institute of Mining and Metallurgy: Melbourne).
Watsford, R M S, 1980. Lead–zinc–silver ore concentration by Mount Isa Mines Ltd, Mount Isa, Q’ld, in Australasian Mining and Metallurgy: The Sir Maurice Mawby Memorial Volume, fi rst edition, pp 208–213 (The Australasian Institute of Mining and Metallurgy: Melbourne).
Woods, R, 1990. Electrochemistry of sulphide minerals, Chemistry in Australia, Nov:392–395.
X-Ray Mineral Services, 2008. Published journal papers, conference proceedings and magazine articles covering QEMSCAN® Automated Mineralogical and Petrological Analysis [online]. Available from: <http://www.xrayminerals.com/research.html> [Accessed: 25 March 2009].
Young, M F, Pease, J D and Fisher, K S, 2000. The George Fisher Project to increase recovery in the Mount Isa lead/zinc concentrator, in Proceedings Seventh Mill Operators’ Conference, pp 157–164 (The Australasian Institute of Mining and Metallurgy: Melbourne).
Young, M F, Pease, J D, Johnson, N W and Munro, P D, 1997. Developments in milling practice at the lead/zinc concentrator of Mount Isa Mines Limited from 1990, in Proceedings Sixth Mill Operators’ Conference, pp 3–12 (The Australasian Institute of Mining and Metallurgy: Melbourne).
Supplementary Notes
CASE STUDY – CORRECTING A DECLINE IN PERFORMANCE OF A LEAD–ZINC
CONCENTRATOR AFTER CONVERSION TO A SINGLE CIRCUIT WITH LARGER
FLOTATION CELLS
Behaviour of size fractions
Samples from three circuit surveys and from portions of other surveys were screened and the subsieve fractions were sized using the Haultain Infrasizer. The size fractions were assayed for lead, zinc and iron and for each bank in the survey with one or more concentrate streams, the size by size elemental data were converted to size by size mineral recovery data by the program BANKS (CSIRO Division of Mineral Engineering). This program provided sized mineral recovery and residence time values and therefore mineral rate constants at a sized level for each cell or group of cells in the survey. In conjunction with water recovery values and water rate constants, the output from the program greatly assisted in diagnosis of process weaknesses in each block or bank. The benefi ts from complementary analysis of the sphalerite in the zinc circuit at the mineral recovery–size level from monthly inventory samples can be seen in Figure 9.14 (Johnson, 1987).

Spectrum Series 18
T E C H N O L O G I C A L R E S E A R C H
305
The signifi cance of the three size fractions is explained in Table 9.2. All the zinc in the feed existed as sphalerite and the size distribution of the recalculated feed (the size distributions of all plant products weighted by tonnage) was used in assessing performance.
FIGURE 9.14
Graphs of the concentrator feed assay (per cent zinc), the distribution of zinc for three size fractions of the recalculated plantfeed and, for the same fractions, the recovery of zinc into the zinc concentrate for all periods from 1980–81 to 1983–84
(all size fractions given in microns (μm)) (Johnson, 1987).
Size fraction of sphalerite Signifi cance of size fraction in mineral recovery – size analysis
–8 microns Combined fi ne size fractions. Moderately inferior performance for sphalerite in comparison with
the intermediate size fractions.
–23 +16 microns Intermediate size fractions. Highest level of performance for sphalerite in the system.
+38 microns Combined coarse fractions. Inferior performance for sphalerite in comparison with the
intermediate size fractions.
TABLE 9.2
Signifi cance of size fractions in data in Figure 9.14.
In the data referred to in Figure 9.14 there was one large and permanent change in the zinc feed assay (due to start-up of a new heavy media plant (Fiedler, Munro and Pease, 1984) introduced to improve overall economics for lead–zinc ore), and the recovery of sphalerite in the combined fi ne (0–8 μm) and the combined coarse fractions (+38 μm) altered dramatically while the recovery of a size fraction (–23 +16 μm) representing the intermediate size fractions was unaffected. This questions the belief of many metallurgists that all size fractions respond in a similar fashion to changes in operating variables and that analysis of data on a mineral recovery–size basis is therefore unnecessary. In the bottom section

Spectrum Series 18
H I S T O R Y O F F L O TAT I O N
306
of Figure 9.14, the sharp reduction in recovery (with respect to the recalculated feed) of fi ne sphalerite (0–8 μm) in 1980–81 independently of the other size fractions was particularly important because 40 to 50 per cent of the sphalerite existed in that size fraction (Figure 9.14) in the recalculated feed.
CORRECTING A DECLINE IN THE PERFORMANCE OF THE LEAD–ZINC
CONCENTRATOR OF MOUNT ISA MINES LIMITED CAUSED BY CHANGE
IN ORE TYPE AND OTHER FACTORS
The IsaMill technology
The lead–zinc concentrator also played an important role for the ‘McArthur River Project’ by testing the new IsaMill of 3000 L and 1.1 MW before start-up of the McArthur River operation. The McArthur River deposit in the Northern Territory was discovered in the middle of the 1950s and was found to be more diffi cult to treat than the diffi cult Mount Isa lead–zinc ore. The grain size for the McArthur River ore was even fi ner than the Mount Isa ore (Figure 9.13). Laboratories around the world were unable to provide an economic fl ow sheet over the next 30 years. In the early 1990s, Mount Isa Mines Limited developed the revolutionary new ultrafi ne grinding technology (IsaMill) for treating the deposit as one strand of a new ‘McArthur River Project’, which commenced in 1989. The full-scale prototypes were developed and tested in the lead–zinc concentrator before operations commenced at the McArthur River site. For the McArthur River ore, these mills could readily regrind streams to much fi ner sizes than previously possible. The development of these mills for the McArthur River deposit resulted from application of the liberation guidelines in Table 9.1. Enforcement of these guidelines meant that regrinding for the McArthur River ore had to provide a fi ne product (80 per cent –7 μm) not achievable at acceptable energy consumptions by technology in the minerals industry at that time. Further, IsaMill technology avoided the use of iron/steel grinding media from which the deposition of iron oxyhydroxides typically caused an additional important impediment in fl otation after conventional regrinding technologies at fi ne product sizes. Traditional minerals industry practice was to infer the suitability of a grinding or regrinding product sizing (without measurement of liberation) by the success or otherwise of a following fl otation separation. This inferential method is increasingly likely to be misleading as the product size becomes fi ner. The circuit in the lead–zinc concentrator has used one and sometimes two 1.1 MW IsaMills regrinding lead cleaner block feed since 1995 (Enderle et al, 1997; Johnson et al, 1998). These mills increased liberation of all the minerals and the inert media provided the same benefi ts for the Mount Isa ore as for the McArthur River ore.
Other issues investigated in lead circuit
Obtaining adequate liberation by fi ne regrinding to a P80
< 15 μm for the cleaner feed was a prerequisite for good metallurgical performance for the Mt Isa and Hilton ores that were processed in the lead–zinc concentrator. However, fi ne regrinding increases generation of –7 μm particles, which present additional problems in fl otation due to lowered ability to collide with bubbles (Trahar and Warren, 1976). Therefore, the focus of development changed from improving galena liberation to improving separation of iron sulfi des and then improving fi ne particle fl otation for the galena.
The reasons for the lowered recovery of fi ne particles were a lowered ability to collide with bubbles, or this weakness plus additional effects from surface modifi cation (eg oxidation, or deposited hydrophilic surface layers). Much of the work in the lead circuit (for both the Mount Isa lead–zinc concentrator and, from 1989, the much smaller, new Hilton Concentrator (Rohner, 1993)) suggested that the poor response of the fi ne galena was due to hydrophilic surface coatings, for example, calcium sulfate and species derived from the grinding media (Small and Grano, 1994; Grano et al, 1995; Grano et al, 1997; Small et al, 1997). Thus strategies to improve fi ne galena recovery were aimed at ‘cleaning-up’ the system, ie making the hydrophilic species present in the pulp inert so that they no longer interfered with galena fl otation by adsorption on the surface of the galena.

Spectrum Series 18
T E C H N O L O G I C A L R E S E A R C H
307
One approach was directed at reducing precipitation of calcium sulfate on mineral surfaces. The use of sodium carbonate at the Hilton Concentrator countered the effects of calcium sulfate and improved the fl otation response of galena (Grano et al, 1995). Sodium carbonate had replaced lime for 12 months on Mount Isa lead–zinc ore in the lead–zinc concentrator in 1970–71 (Bartrum, Dobrowolski and Schache, 1977) to improve silver metallurgy. However, the practice was terminated because calcium carbonate from the reaction between the introduced carbonate and calcium in the pulp from hard water and the pH modifi er, lime, rapidly deposited inside process pipes, threatening to make the plant unusable. Bartrum, Dobrowolski and Schache (1977) reported ‘extreme deposition of carbonates in pipelines’, causing its cessation. Because of the potential benefi ts from additions of sodium carbonate for galena metallurgy and because commercial products (linear polyphosphates) existed to prevent extensive deposition of calcium sulfate in the process pipes, development work on the use of sodium carbonate commenced on two fronts in the 1990s:
• laboratory fl ow sheet development, including reagent practice, for the George Fisher deposit, which would shortly be mined and become the main feed source for the lead–zinc concentrator; and
• concurrent short trials of the addition of sodium carbonate to ball mills in the lead–zinc concentrator to establish relevant addition points and key chemical measurements to assist in determining suitable addition rates, as diffi culties existed in fi nding the correct addition rate for the ore sources on a given day.
The effects of various grinding media types on fl otation were also investigated. These tests showed that the use of high chromium white iron grinding media instead of high carbon, low alloy steel media improved the recovery of fi ne galena (Cullinan et al, 1997). X-ray photoelectron spectroscopy analysis (XPS) was completed on samples of secondary ball mill feed reground in the laboratory using both normal and ‘high chromium’ media types (Cullinan, 1995). The surface analysis indicated higher atomic concentrations of iron and signifi cantly lower atomic concentrations of sulfur for the ‘mild steel’ case. Spectral analysis showed the iron to be present as iron oxyhydroxides for the sample prepared using ‘mild steel’ media, and the sulfur to be predominantly as sulfate for the sample prepared using ‘high chromium’ media. The surface chemical evidence suggested that the ‘mild steel’ media provided a more reactive grinding environment, while the high chromium media produced a more oxidising grinding environment.
High intensity conditioning (HIC) was also investigated, and showed that signifi cant improvements in fi ne galena recovery were achieved (Small et al, 1997). HIC resulted in cleaner surfaces of fi ne galena particles through the application of intense shear, thereby increasing the adsorption of collector on the fi ne galena particles and their hydrophobicity. HIC was not cost effective in this application but it was effective in applications for the Hellyer ore (Lane and Richmond, 1993). The Hellyer staff conducted a large amount of process development involving many pulp chemistry issues in conjunction with the Ian Wark Research Institute after start-up. In general, the Hellyer staff had to deal with the consequences of considerable oxidation of valuable sulfi des in the fl otation circuit from the very high pyrite feed grade accentuated by high fl otation residence times.
Heavy medium plant slimes fl otation circuit
Other important changes instituted in the 1980s to improve lead circuit separation were:
• Installation of a Heavy Medium Plant (HMP) slimes roughing and cleaning circuit in 1988. HMP slimes generated in the mining process represented about 15 per cent of the lead in the fl otation feed, and had different reagent requirements to normal feed (Grano, Ralston and Johnson, 1988). A fl ow sheet including roughing at pH 9 (with lime), addition of zinc sulfate and cleaning in a Jameson cell was developed, producing a lead concentrate from HMP slimes that averaged over 60 per cent lead, compared with an estimated 45 per cent lead when included in conventional feed (and its reagent system). The separate HMP slimes roughing and cleaning gave a two per cent increase in overall lead concentrate grade.

Spectrum Series 18
H I S T O R Y O F F L O TAT I O N
308
• The LGM circuit from 1985–86 assisted by accepting low quality galena-bearing middlings via lead scavenger concentrate, diverting these from the previous lead circuit (see circuit changes in 1985–86 listed in Figure 9.3).
The Jameson cell installation for cleaning in the HMP slimes circuit was the fi rst commercial installation of this technology in sulfi de or coal circuits. Much of the testing of the Jameson cell at various scales was performed by company research staff in this plant, leading to incorporation of this technology in the separate HMP slimes circuit. When operated with correct water additions, one stage of Jameson cells or fl otation columns was found to be equivalent to ~2.5 stages of conventional cleaners. Before establishing the separate HMP slimes circuit, its fundamental properties were studied in conjunction with the Ian Wark Research Institute by comparison with those properties for the primary grinding circuit product. The HMP slimes stream contained sphalerite, which was highly activated by lead ions from extensive oxidation of the galena in the HMP slimes stream after its formation during mining/transportation; this also decreased the galena fl otation rate. The sphalerite activation was countered by addition of a more powerful sphalerite depressant, zinc sulfate. Previously, with combined treatment of HMP slimes and primary grinding circuit product, the lead and other metal ions from HMP slimes activated sphalerite from the primary grinding circuit product.
A historical perspective on the use of zinc sulfate at this plant is useful. Bartrum, Dobrowolski and Schache (1977) reported extensive plant trials with zinc sulfate between 1970 and 1972 and stated:
… froth conditions deteriorated and resulted in lower lead concentrate grades while sphalerite was diffi cult to activate after the lead circuit resulting in a lower zinc recovery.
The preferential adsorption of zinc hydroxides on the sphalerite, causing its depression in the lead circuit, created new problems in restoring fl oatability to the sphalerite in the zinc circuit. All of the sphalerite in the plant feed was exposed to zinc sulfate in those trials, but the addition of zinc sulfate to HMP slimes alone meant that zinc sulfate was being added only to a low tonnage stream and the high tonnage primary grinding product was not exposed to it, avoiding its adverse effect on the majority of the sphalerite. But an additional lead circuit was operated.
Further improvements in zinc circuit
In the two years after implementation of the fi ne grinding project, further performance gains were made as the circuit was adjusted and simplifi ed. Effectively, operating personnel had to forget many of the circuit rules, which were essential when poor liberation and insuffi cient fl otation capacity were the root cause of many problems. The most signifi cant of these are listed, giving an increase in zinc recovery to zinc concentrate of a further fi ve per cent:
• reintroduction of high pH zinc cleaning using lime, and
• relocation of some LGM circuit regrinding capacity (two ball mills – 375 kW each) into the zinc circuit (Figure 9.4).
It was also noted that the application of process control became more effective with adequate fl otation capacity and appropriate regrinding product sizings. In 1994–95, more sphalerite reached the zinc circuit feed from the introduction of IsaMill technology for regrinding of the lead cleaner block feed. The fi ne product size from the IsaMill technology also allowed the lead scavenger concentrate to be directed to it, leaving the zinc retreatment tailing as the only remaining feed to the LGM circuit (Figure 9.4). After all the changes, the importance of zinc retreatment tailing as a feed to the LGM circuit diminished along with the production rate of LGM concentrate.
In the area of pulp chemistry, a simple advance was achieved by replacing process (recycle) water with higher quality, fresh water for dilution of the pulp in both lead and zinc cleaning, ie as the major water addition in each cleaning section. This change sought to eliminate intermittent unexplained misbehaviour of the cleaning sections, possibly due to intermittent exceeding of the solubility product of salts involving calcium and/or magnesium ions, causing their deposition on surfaces and disrupting

Spectrum Series 18
T E C H N O L O G I C A L R E S E A R C H
309
sphalerite fl otation. This modifi cation removed a major source of intermittent circuit instability. Experiments were conducted at the laboratory and pilot plant scales on separate conditioning with collector of the fi ne sphalerite (nominally the –10 μm fraction). The fl otation rate of the fi ne sphalerite was raised with the higher collector addition possible for it. These successful trials were not implemented in the plant. However, the work was a further demonstration that application of the mineral recovery–size methodology was valuable in providing technical solutions to process weaknesses.
Review
Adoption of rigorous, mineral recovery–size and mineral recovery–size–liberation engineering methodologies to plant performance over a long period of time was crucial to diagnose the causes of the decline in plant performance and recognise, justify and implement means of correcting the decline. During 1991 to 1995 sphalerite liberation in size fractions in the recalculated plant feed increased and zinc recovery by size also increased. Improved liberation was caused by more grinding power or better grinding effi ciency (Figure 9.4) and it occurred in four main stages:
• installation of tower mill in LGM circuit,
• installation of increased primary and secondary grinding power during the ‘fi ne grinding project’,
• relocation of grinding power from LGM circuit to zinc circuit, and
• installation of lead cleaner feed regrinding using IsaMill technology.
Where the process weaknesses indicated that inadequate pulp chemistry caused the weakness, suitable chemistry investigations were conducted to obtain engineering solutions, including surface analysis where appropriate.
The result was a 20 per cent increase in zinc recovery to zinc concentrate, a fi ve per cent increase in lead recovery to lead concentrate, improved quality for both lead and zinc concentrates and a 70 per cent reduction in the production of the low value LGM concentrate. These metallurgical improvements were driven by technological changes targeted at the fundamental nature of the fi ne-grained, diffi cult Mount Isa ore. The changes were highly successful and were essential for continued operation as ore quality declined. This case study provides an excellent example of the benefi ts of applying the described engineering approach to routine operations over a long period of time. The benefi ts from using this approach as part of a management system are:
• Most questions by management can be answered quickly because of the detailed nature of the data. It is noted that the database must be updated each month or period.
• The scope and options for process improvement can be assessed.
• Decisions can be made on a factual basis as market conditions change.
• An intimate understanding of the important processing characteristics of the ore was a valuable by-product of the work, which was utilised in the next round of changes (discussed below).
Postscript – next round of changes
The metallurgical improvements described in this paper were driven by technology changes targeted at the fundamental nature of the fi ne-grained, diffi cult ore. The changes were highly successful and economically essential to business as ore quality declined. However, the improvements came at a price of capital expenditure and higher operating cost. In 1996, the next improvements came from a comprehensive examination of the mine/mill/smelter business based on the improved understanding of the ore types. Rather than solving complex ore related problems in the plant, the worst ore sources were eliminated from the mine schedule, and the remaining sources were scheduled to improve feed consistency. This resulted in elimination of the LGM concentrate and increased lead and zinc concentrate grades and recoveries, as well as providing a simpler and steadier circuit. These changes were achieved without capital expenditure and without extra operating cost. The lead–zinc concentrator produced

Spectrum Series 18
H I S T O R Y O F F L O TAT I O N
310
two concentrates before the decline in performance. The plant then operated with production of a third product (LGM concentrate). The plant was returned to production of two concentrates after the ‘fi ne grinding project’ and related follow-up developments as just described.
A summary of the product sizings for the grinding and regrinding steps is given in Table 9.3 for three key phases for the plant (predecline, during the base of the decline and after corrective actions). The major changes in product sizings can be seen in Table 9.3, which provides a compact summary of the associated grinding/regrinding work. Ironically, rather than removing the technical challenges, the developments enhanced the ability of technical advances to deliver further improvements, such as better plant stability, leading to much better application of process control in fl otation.
Phase of operation Product sizing, 80 per cent passing size (μm)
Primary grinding Secondary
grinding
Combined
Pb/Zn regrind
Pb regrind Zn regrind
Pre-decline 160 80 35 Did not exist Did not exist
Base of decline 200–240 100–120 50* Did not exist Did not exist
After ‘fi ne grinding
project’ and follow-up
developments
80 37 Did not exist 12–15** 12***
* Low grade middling (LGM) concentrate production existed during this phase and this sizing value refers to the feed to the LGM
rougher circuit after regrinding.
** Open circuit IsaMill technology.
*** Closed circuit tower mill followed by open circuit IsaMill technology. With the later modifi cations for the George Fisher ore, a small
additional stream in the zinc retreatment circuit was reground to 7 μm by IsaMill technology (Young, Pease and Fisher, 2000).
TABLE 9.3
Summary of product sizings for each grinding step for three phases of plant improvement.
Further, the stage was set to develop the next generation of advances from applications of pulp chemistry and fi ne particle surface chemistry, as there was damping of the large operational ‘noise’, which traditionally hindered plant investigation of such complex issues. This phase is not discussed. However, it can also be noted that sodium carbonate for which a testing phase was described in the text was implemented in the lead–zinc concentrator for treatment of the George Fisher ore (Young, Pease and Fisher, 2000) and that very small additions of a linear polyphosphate were an enabling technology in allowing use of the sodium carbonate without blocking pipes in the plant with calcite deposits.

Spectrum Series 18 311
THE EARLY YEARS 1902–1918
It was known from the start of fl otation at Broken Hill that acid addition had to be scaled to the feed rate, which meant controlling the feed rate to the required level. At the BHP plant truckloads of ore passed over a weighbridge and the ore was then crushed and delivered to the fi ne ore bin, which had a door with rack and pinion sitting above a feed roll at the base. The rate at which ore fl owed from the bin could be controlled by raising or lowering the door and a jet of water ensured that the ore fl owed freely down a chute to the grinding rolls.
This method of feed control was still used in some mills 50 years later. Ore was manually sampled at the feed chute every hour to determine the metal contents of the feed and this system was also in use many years later. In the Amalgamated Zinc (De Bavay’s) Ltd plant (AusIMM Broken Hill Branch, 1930) a push feeder was used in the fi ne ore bin to deliver ore to the tube mills.
C H A P T E R 1 0
Circuit Control
FIGURE 10.1
Feed rate control mechanism used at BHP in 1905 (Delprat, 1907).

Spectrum Series 18
H I S T O R Y O F F L O TAT I O N
312
These simple methods of measurement and control were suitable for Broken Hill in those days since the absolute priority was making fl otation work in a consistent and reliable manner. Operators would have been more concerned with clearing foreign matter such as rocks and plant roots from the feed and maintaining variables such as feed rate, additions of acid and oil, and pulp temperature, at the correct values than with controlling grade or recovery, which was out of the question anyhow since no instruments were available to measure grades and fl otation itself was a mystery (Henderson, 1928).
But it was a different matter in the fl otation plant that Dr Louis Ricketts built at the Inspiration mine in Arizona in 1915. The new chemical engineering industry, which was being established in North America at the time, relied on automatic control and Dr Ricketts was a chemical engineer from Princeton University (Marcossan, 1957). In his work at Inspiration he insisted on using the best equipment available, both in the pilot plant in which different circuits were tested and in the large plant that he eventually built. He left nothing to chance. Typical of his approach was the sampling plant that he designed to keep track of the characteristics of the ore to be processed.
FIGURE 10.2
Sampling system for plant feed at Inspiration Copper (Kenyon Burch, 1917).
Measuring and control devices used in the 15 000 tons per day plant designed by Dr Ricketts included:
• a 30 inch apron feeder and a 20 inch belt conveyor with weighing machine on the feed to each of the 18 ball mill – classifi er circuits;
• rotating splitters with variable outlets used to distribute pulp between fl otation banks;
• automatic samplers worked by a water balance used throughout the mill;
• small, variable speed bucket elevators used to scale oil addition to ore tonnage (Motherwell, 1916); and
• an electrolytic method was used for frequent chemical analysis of samples (Motherwell, 1916).

Spectrum Series 18
C I R C U I T C O N T R O L
313
As process knowledge improved alkalinity was controlled at Inspiration on an hourly basis and copper sulfi de in the tailings was controlled by adjusting xanthate. No technique was available to Dr Ricketts to give warning of change in the type or grade of ore entering the plant; these could only be detected by the operator, but the systems used at Inspiration helped to stabilise the process and reduce process ‘noise’, which is an important part of the development of control systems. The level of measurement and control used in the Inspiration plant in 1916 was so good as to be unusual in fl otation plants even 50 years later and it must have been a factor in creating confi dence in fl otation and in its rapid expansion.
GROWTH AND CONSOLIDATION OF CONTROL SYSTEMS
1918–1960
From 1918 to 1928 fl otation circuits were installed in many plants and R&D programs were carried out by engineers and chemists in companies, universities and the US Bureau of Mines (USBM) on various aspects of the process. These programs changed fl otation from a wayward process to a process that was more effi cient, predictable and controllable, mainly by improving the cells and producing reagents for specifi c purposes. The main changes were due to activators and depressants, which were developed for specifi c ores to improve selectivity between the sulfi de minerals, and to xanthates, which were selective collectors for sulfi des and which could be controlled readily because they were soluble in water. There was no on-stream analysis at the time to give rapid indication of grades and recoveries but experienced operators could recognise when fl otation performance was deteriorating and adjust reagents by manual control of valves.
At the Sullivan mill in 1923 reagents were controlled according to the ore being treated, for example different ores required variations in soda ash from 1–10 lb per ton, in copper sulfate from 0.2–1.5 lb per ton and in sodium cyanide from 0.05–0.3 lb per ton. Zinc tailing was the critical stream. Diamond (1928) wrote that:
… zinc fl otation operators are required to report at 1-hr intervals their estimate of the zinc content of the fi nal tailing. Their average for the shift is checked again with the shift assays the following day. Marvellous skill has been achieved by them, and it is a fact that they can judge fi nal zinc tailing to .1% Zn. Their monthly average estimate rarely exceeds 0.05% zinc difference from control assay.
The meetings convened by the American Institute of Mining, Metallurgical and Petroleum Engineers (AIME) in Salt Lake City in August 1927 and New York in February 1928 to discuss the progress of fl otation were just in time; the economic depression was starting and interest in new ideas in fl otation faded quickly and was replaced by in-plant studies that promised quick economic returns. There was no on-stream analysis but operators could control the feed rates of ore, water and reagents; aeration rate (sometimes); cell levels, which controlled the froth depth; and diverter trays in the double launder system by which cell concentrates could be sent to different destinations.
Operators paid particular attention to the condition of the froth. In the rougher cells at the 4000 tons per day lead–zinc concentrator of Zinc Corporation the froth was heavily laden

Spectrum Series 18
H I S T O R Y O F F L O TAT I O N
314
with mineral and fl owed quickly, so care had to be taken to prevent froth fl ooding, but in the scavenger cells the bubbles were larger and more watery provided that mineral recovery was satisfactory. In the cleaner cells the froth was also heavily laden and the criterion for good performance was bubbles with small, clear watery windows, which occurred when bubbles were neither too tough nor too brittle and drainage was occurring on bubble surfaces. Cleaner cell aeration rates were normally set by opening the valve until there was air breakthrough on the surface of the cell, then closing the valve until it was eliminated. Often a dual laundering system was used to vary the destination of the concentrate. Depending on the cleaner tailing assay and froth appearance the operator would use trays to divert concentrate to fi nal product or cleaner feed.
Operators in other concentrators had their own styles of circuit control depending on the ore but experience and skill were always essential. Control was a hands-on activity wholly dependent on the vision and skill of the operator and, as Diamond found at Cominco, the best operators produced remarkable results.
Progress in automatic control during World War II brought new interest in its application to mineral processing circuits and some new sensors used for various applications were:
• Differential pressure probes that could detect pulp levels and slurry densities, in particular tailings. Signals from these activated local controllers to maintain levels constant or to divert streams as required.
• Magnetic fl ow meters and gamma density gauges that could measure the fl ow rates of solids in pulps. Their main use at fi rst was for control of grinding circuits to ensure stability of the fl otation feed, such as in the Duval Sierrita mill in Arizona (Janes, Johnson and Finkelstein, 1978), but they were so successful that they were also used for many other streams.
FIGURE 10.3
Diverter trays on the 12 cell lead cleaner fl otation bank at Zinc Corporation, Broken Hill, in 1955. Denver No 21 Sub-A cells were in use. Froth in early cells were diverted to fi nal concentrate, froth in later cells recycled back to the roughers (Braes, 2009).

Spectrum Series 18
C I R C U I T C O N T R O L
315
• Instruments built for specifi c purposes in concentrators. For example engineers at Cominco observed the high correlation of metallurgical results to xanthate concentrations and pH and devised an instrument that could analyse solutions for xanthates to provide data for reagent control (Bushell and Malnarich, 1956).
Rapid analysis was always an important objective and at Broken Hill a spectroscope using X-ray fl uorescence was adapted to reduce the delay between sampling and reporting of assays from four hours to 30 minutes (Rawling and Greaves, 1965). This was an intermediate step on the way to on-stream analysis, which would have a delay of only a few minutes.
On-stream analysis (OSA) was so important in fl otation technology that its full development will be discussed later in this chapter. Suffi ce it to write here that OSA presented a tough problem in physics and years were to elapse before all the scientifi c and mechanical diffi culties involved in producing a reliable instrument for OSA were solved. It was a timely development because it was ready when high capacity circuits using large cells were introduced in the early 1970s. OSA measurements were essential if those circuits were to be operated at peak effi ciency.
1960–1980
The growing interest in automatic control in the 1950s led to plant trials of control systems in the 1960s and to their installation in some mills in the 1970s. Progress was slow because problems with accurate sample collection, abrasion and blockage of probes and sample lines had to be solved. The 1977 review of instrumentation and control in Canadian concentrators (Behrend, 1978) gave a snapshot of the status of mill control in Canada at that time. The review covered the transition period when larger fl otation cells up to 10 m3 volume were being used in circuits in some mills, control systems were being evaluated, and some companies were installing separate mill control rooms. Comments by G M Behrend on the status of process control in the Canadian mining industry in 1977 included:
• the transition in the mining industry from virtually no automatic process control to the accelerated development which we are witnessing today was a very sudden affair
• the developing process control technology was paralleled by a changing labour market … It is now quite impossible to train the artisan-operators who for so long were the backbone of mineral processing
• in the history of Canadian mining, the 1970s will probably be characterised as the era in which automatic on-line product analysis, together with digital computer control, had made the breakthrough and had become generally accepted and even necessary to the operation of the modern minerals processing plant.
This was a good description of the state of mineral process control at the time in all countries in which large, effi cient concentrators were operated. It was common for some companies to take the lead in devising and proving plant control systems; other companies then followed with their own modifi cations and process control became a topic for robust discussion at technical meetings.

Spectrum Series 18
H I S T O R Y O F F L O TAT I O N
316
Outokumpu Oy in Finland moved rapidly to take a prominent role in process
measurement and control in the early 1970s. Outokumpu started mining a low-grade, base
metal sulfi de ore at Keretti in 1910 and an ore nearby at Pyhäsalmi in 1958. As discussed
later in this chapter the company took the opportunity to build an on-stream analysis (OSA)
unit and control system and test them at its mines and its research division then developed
other instruments and control techniques during the next several years. The accuracy and
value of the Courier OSA system was verifi ed at fi ve Outokumpu concentrators in Finland
during 1970–71 and it was then ready for sale to other mills. Competition for X-ray tube
systems came from Applied Research Laboratories and was vigorous for some time. The
multi-stream X-ray on-stream analysis systems, which became available from Outokumpu
and Applied Research Laboratories in the early 1970s, accelerated the development of
automatic control systems for fl otation circuits, although progress was necessarily slow
and careful since the systems had to be reliable for 24 hours per day. It was fortuitous that
this fl otation control work was well advanced when the fi rst circuits using large cells were
installed because the fl ows were so high that operating them without on-stream analysis
would have been diffi cult.
Control rooms in concentrators in the mid 1970s were designed so that supervisors had
continuous information about plant circuits and could advise operators on the process fl oors
when to take corrective action. Computers were small by today’s standards – 8 KB core
memory was typical – but they were suffi cient for outstanding work to be done by engineers
in building feedback control systems for particular circuits using data collected from plant
instruments. A bonus was that engineers found while writing the control software that new
information was required about the behaviour of circuits and obtaining this led to a better
understanding of how fl otation circuits worked and to better circuit effi ciencies.
It was an exciting time for fl otation control engineers and advanced systems were developed in several concentrators to suit different types of ores, for example at the Kidd Creek mine in Canada (Amsden, Chapman and Reading, 1973) and the Mount Isa mine in Australia (Lynch et al, 1981). The systems may have been different but the requirements for success were the same, a good instrument maintenance section and a control engineer to ‘champion’ the system. The departure of the champion usually led to the system falling into disuse.
POST 1980 – CONTROLLING CIRCUITS IN WHICH LARGE CELLS ARE USED
Plants with large cells are vastly different from the plants with hundreds of small cells discussed earlier.
Figure 10.4 shows a 300 m3 FLSmidth cell installed in a plant; the size of this giant cell is put in perspective by the men on the walkways.
The old style of circuit control, which involved the operator walking past cells and making the adjustments considered to be necessary, was not possible with large cells. In theory there is no difference between controlling banks of small and large cells but in practice there are two main differences:

Spectrum Series 18
C I R C U I T C O N T R O L
317
1. Banks of small cells were usually preceded by rod and ball mills to which the feed rates were steady and controllable, but banks of large cells are usually preceded by semi-autogenous mills which produce varying feed rates to fl otation because the feed rates to them are controlled to maintain constant power draw. Consequently they vary and these mills deliver changing pulp fl ows to rougher cells, which create frequent disturbances in cell levels and froth depths, which can adversely affect grades and recoveries.
2. Small cells can be inspected easily and performance of banks can be controlled in the plant by adjusting weir gates for pulp level, air addition valves for froth mobility and reagent addition rates for concentrate grade and recovery. This is in contrast to modern large cell plants in which fl ows are very high and inspections can be diffi cult, including for safety reasons. Circuit adjustments are (often) made from a centralised control room.
With large cells instruments such as on-stream analysers and mass fl ow meters are
essential if the metallurgical performance of the circuit is to be assessed and controlled.
With the trend towards centralised control rooms and less emphasis by operators on walking
the fl oor and inspecting the banks novel instrumentation approaches based on digital image
technology have been employed. Froth imaging systems can provide information on froth
type, bubble size and froth mobility. They are discussed in the section on radioisotope
systems. Circuits using large cells are usually equipped with many sensing instruments and
controllers and various levels of control can be achieved with them. These levels will be
discussed to indicate the status of fl otation control after 100 years of copper sulfi de fl otation.
Low level regulatory control
The main regulatory control loops are those that control pulp level and airfl ow rate for each cell or bank, slurry level in each transfer hopper and fl ow rate of each reagent. For each
FIGURE 10.4
An FLSmidth 300 m3 fl otation cell in Rio Tinto’s Copperton concentrator.

Spectrum Series 18
H I S T O R Y O F F L O TAT I O N
318
control loop the operator enters a set point, which is maintained by the plant’s process control system. All the loops are programmed into a purpose-built process control computer1. The proportional, integral, derivative (PID) controller2 is used for each control loop. Early automatic fl otation control employed stand-alone controllers located close to the process; these contained one, or at most two, PID algorithms, while modern DCS or PLC systems1
can contain hundreds of PID loops. A well-tuned controller to maintain cell pulp levels at required heights is essential to handle changes in volumetric fl ow of the feed, particularly when SAG mills are used. The reason is that an increase in fl ow increases the pulp level, a controller responds by opening the tailing valve3, and this in turn increases the fl ow to the next cell. The disturbance then moves from cell to cell through the circuit and in a badly tuned system this instability may continue for a long period. With large volume rougher and scavenger cells small variations in pulp level can result in signifi cant changes in concentrate fl ows to downstream cleaner circuits, which can result in off-specifi cation concentrate grades. Accurate control of cell levels can be achieved by specialist control packages (Singh, Louw and Hulbert, 2003), or by using the power and fl exibility of modern control systems.
The Century Mine owned by the MMG group has one of the largest polymetallic fl otation circuits currently in use. The fl ow sheet of the circuit, which is shown in Figure 10.5, includes 79 large 200 m3 cells with 45 pulp level controllers. Due to the interactive nature of this circuit (common in most fl otation circuits) individual PID controllers were unsuitable for stabilising cell pulp level particularly during plant start-up, and it was necessary to use a specialist level control package. Muller et al (2004) described the implementation of a control package specifi cally designed to control pulp levels in fl otation circuits. The importance of a regulatory control system cannot be over emphasised. With the control loops correctly tuned a skilled operator can manipulate the fl otation plant to maintain fi nal product grades, maximise recovery and minimise operating costs, just as the operator did manually with small cells in previous years. But now it can be done more accurately and consistently. This control layer also provides a platform for more advanced control approaches, which will be discussed in the following sections.
Supervisory control
This layer of control is so named because it provides set points for the regulatory control loops discussed in the previous section. Supervisory control can free the fl otation operator from mundane repetitive tasks, as can regulatory control, and operators can make decisions at a more strategic level, for example adjusting collector addition rates to maximise metal recovery. Typically the operator will look at the rougher tailing assay (supplied every fi ve
1. Over the last 30 years or more purpose-built process control computers have been used. These fall into two basic types: distributed control systems (DCS) are more favoured for a plant with a predominance of continuous control (PID control) and programmable logic controllers (PLC), which tend to be used more for discrete control (eg stopping and starting motors and interlocking). Over the last ten years the distinction between DCS and PLC has become blurred and some manufacturers claim systems that combine the best attributes of each.
2. The PID controller is still the industry standard today. Several attempts by various manufacturers have been made to replace this controller for regulatory control in the process industries – none have been successful.
3. Usually a pinch or plug type valve, which is commonly called a dart valve.

Spectrum Series 18
C I R C U I T C O N T R O L
319
or more minutes via OSA) and adjust the collector to achieve an acceptable assay given the prevailing ore conditions. The procedure is to increase collector a little if there is an opportunity for additional recovery, provided this action did not have an adverse effect on the rest of the circuit, or decrease collector and reduce metal recovery if the rougher tail assay is not sustainable because high recirculating fl ows are building in the circuit. A similar situation can also occur if pulp levels or air rates are used as the primary manipulated variables.
The next step was to control rougher tail assay to a set point by automatically adjusting collector, but this caused the problem that maximum metal recovery in the roughers may cause off-target concentrate grades in the cleaners. Individual sections could be controlled but the coordination of loops in different sections proved diffi cult and called for higher levels of control. This problem was encountered in the Century mine circuit where supervisory control of recirculating fl ows and tailings density were achieved by manipulation of cell pulp level set points in the zinc ultra-fi ne fl otation circuit, but the system fell into disuse (Prinsloo, 2009) because operators were unable to select optimal set points for these supervisory control loops. Muller et al (2004) provides a description of this unsuccessful supervisory control strategy at Century Zinc. Similar fi ndings have been reported by Thornton (1991), who applied self-tuning control techniques to control the lead assay (from OSA) in the primary rougher bank in the No 2 Concentrator at Mount Isa Mines (now owned by Xstrata Zinc).
FIGURE 10.5
Lead and zinc fl otation fl ow sheet of MMG Group’s Century Mine.

Spectrum Series 18
H I S T O R Y O F F L O TAT I O N
320
Optimising control
Changing the set points of low level regulatory loops, such as those controlling pulp level, air and reagent fl ow, is now normal practice for fl otation operators, but progress with higher level supervisory loops has been slow because of potential problems with selecting appropriate concentrate grade or recovery set points. To solve these problems control engineers have used several approaches to coordinate supervisory loops in interacting sections of a fl otation plant. One approach has been to train operators to select the correct set points for supervisory loops and use modern computerised displays showing large amounts of plant data now stored in plant computers to augment this training. Another approach has been to install supervisory control in sections of the plant where there are defi nable goals and leave operators with the task of controlling the rest of the fl otation circuit.
Early fl otation control at Mount Isa Mines provided a simple approach to set point selection. This control strategy is shown in Figure 10.6 in which a 12 cell rougher bank was controlled. The system employed cascade control and consisted of two controllers – one adjusted collector addition to control the four-cell copper assay to a target value, the other controlled the 12-cell copper assay by adjusting the four-cell target. An advantage of controlling the four-cell copper assay was that it provided early warning of ore type changes. The rationale behind this control strategy (Lynch et al, 1981) was that different four cell tail assays set points were required for different ore types. This control strategy recognised the problem of set point selection and devised a simple approach to solve it.
FIGURE 10.6
A ‘ cascade’ control system that used a tailings assay to control collector addition.
Logic directed or rule-based control has been used to select set points for supervisory controllers. In these systems an attempt is made to reproduce the decision-making process of a skilled operator. Early attempts in the 1970s involved computerisation of fl ow charts containing the logic of control; these fl ow charts could also be used manually by operators

Spectrum Series 18
C I R C U I T C O N T R O L
321
to optimise and control the process. Figure 10.7 shows a computerised fl ow chart of the decision-making power of a human operator, which was used at the Kidd Creek concentrator to optimise collector (R208 and R317) dosage in chalcopyrite fl otation (Amsden, Chapman and Reading, 1973). Modern versions of the Kidd Creek control strategy are embodied in computer programs called expert systems.
Expert systems were originally developed by artifi cial intelligence researchers and are
intended to capture and reproduce the problem-solving skills of a human expert. They must
be programmed like any conventional computer program. Hales et al (2009) described the
application of modern expert system technology to control grinding and fl otation plants.
While these systems have been successes in comminution, particularly semi-autogenous
grinding, expert system technology has found no permanent application in fl otation plants.
Comment
The emphasis in control has changed from the skilled, experienced operator walking the fl oor, watching the froth and making changes to air or reagent valves as deemed necessary,
FIGURE 10.7
An ‘ expert’ fl otation control system used at Kidd Creek (Amsden, Chapman and Reading, 1973).

Spectrum Series 18
H I S T O R Y O F F L O TAT I O N
322
to operators who observe the display of plant data on computer screens and changes set points for the regulatory or supervisory systems as instructed. Control centres became necessary when circuits moved from a myriad of small cells to relatively few, very large cells and perhaps it was inevitable that the metallurgical knowledge that came from walking the fl oor would diminish. There has been some effort to supplement this lack of metallurgical knowledge (or just gut feel for the process) with more sophisticated levels of automatic control. This approach has met with less success than the papers in journals and conferences would indicate. Despite this it can be said that control of fl otation circuits has advanced during the last ten years and it is expected that considerable progress will be made in solving the remaining problems during the next ten years.
ON-STREAM ANALYSIS
A major advance in fl otation technology occurred when on-stream analysis (OSA) systems were developed (Lynch et al, 2005). On-stream X-ray Fluorescence (XRF) analysers provide elemental assays from the process fl ows and according to Hales and Marchant (1979) are the single most important online instrument because they measure metal concentrations and permit fl otation circuit grades and recoveries to be calculated every few minutes.
In the days before OSA, fl otation results depended on the operator’s skills in observing the froth and changing air and reagents manually as the froth changed, but after OSA became available, fl otation could be monitored accurately and controlled. Its development in the 1960s was timely; cell size was about to grow rapidly and there was no alternative sensor suitable for complete process control systems. OSA by itself was not enough; in the early 1960s digital computers became available and it was the OSA–computer link that changed fl otation into an advanced technology.
Background
For many years the problem with operating fl otation circuits was that there was a long delay
between taking samples from circuits and obtaining the assays. The results were therefore
of historical value only and were not useful for circuit control, which could only be achieved
if the delay was signifi cantly reduced to a matter of minutes. The rapid analysis of elements
such as lead and copper in circuit streams was not possible, however, until particles could be
analysed in the pulps rather than by sampling, drying and use of conventional assay methods.
In the 1950s, it was realised that X-ray techniques offered the most promising approach
and there seemed to be only one likely candidate: X-ray fl uorescence (XRF) analysis by
wavelength dispersive methods based on X-ray tube and crystal spectrometer (Lynch et al,
2005). In the 1960s, an alternative approach was developed of using radioisotope X-ray
techniques based on gamma-ray preferential absorption (XRA) and energy dispersive (XRF)
analysis. In 1960 the X-ray and radioisotope approaches required completely different
developments if practical OSA systems were to be realised.
The X-ray tube and crystal spectrometer system was relatively complex and expensive but was known to give accurate results because the wavelength dispersive system could

Spectrum Series 18
C I R C U I T C O N T R O L
323
resolve fl uorescent X-rays from adjacent atomic number elements. The equipment had to be installed in the plant in a central location, where it would sequentially analyse continuous samples, which were taken from each process stream and fed through sample pipelines to the analyser. This involved accurate sampling of each process stream, long runs of pipelines to the central analyser, pumping, sample splitting, constant head tanks and fl ow cells. The radioisotope techniques of analysis involved the use of relatively inexpensive source-detector systems. Hence, one or more head units could be placed near each plant process stream, with only a short sample pipe between process stream and analysis system. This resulted in easier installation and fewer construction problems. The two radioisotope techniques were at different stages of development:
1. XRA techniques: these were suitable for high atomic number elements such as lead, uranium, tungsten and bismuth. The problem was that there were only a few radioisotope sources emitting gamma rays of suitable energy, and even fewer were commercially available.
2. XRF techniques: these were essential for medium atomic number elements such as iron, nickel, copper, zinc and tin. The problem in this case was that the detectors that were available could not resolve fl uorescent X-rays from adjacent atomic number elements.
X-RAY TUBE SYSTEMS
Plant tests were carried out in the late 1950s using laboratory X-ray tube systems for off-
line measurement of dry plant samples and online measurement of plant pulps (Lynch,
2005). These systems worked well. The fi rst online system was tested during 1959–1960
in the 36 000 tons-per-day concentrator of the Anaconda Copper Corporation in Butte,
Montana. The X-ray system was satisfactory, but problems occurred with sample handling
and presentation that took months to resolve (Lucy, Fulmore and Holderreed, 1963).
For example:
Suffi cient wood is present to completely stop all fl ow through the X-ray head. Various types of screens were tried before fi nding a satisfactory solution. This was typical of the type of mechanical problem that plagued and delayed the fi nal process control by X-ray analysis.
The system presented assays of 13 streams every 20 minutes. Another system was built
in 1962 by the Research and Instrumentation Division of Rhoanglo Mine Services Ltd in
Northern Rhodesia (now Zambia). It was installed in the Bancroft concentrator and presented
copper assays of six streams every eight minutes (Barlin and Keys, 1963). In the late 1960s
Outokumpu Oy started to sell X-ray tube systems and their story is told in the next section.
Outokumpu Oy
The Finnish mining company Outokumpu Oy established a physics research laboratory called the Institute of Physics in 1962. Its main target was to develop measurement technology for automation in minerals and metals processing operations for the company’s many complex sulfi de ore concentrators, base metal smelters and refi neries. In particular labour-saving
Spectrum Series 18
H I S T O R Y O F F L O TAT I O N
324
automated measurements with minimal sample handling were desirable. According to the memoirs of Erkki Laurila, the founding fathers of the institute were Dr Petri Bryk, Managing Director of Outokumpu Oy, Professor Erkki Laurila, member of the Finnish Academy of Sciences and a bottle of Salignac, a French cognac (Jauho, 2002). Matti Kongas (Outotec Global Technology Manager – Intelligent Instruments) discussed the development of the instrument division and this is recorded in the following paragraphs.
Petri Bryk and Erkki Laurila were a well accomplished metallurgist and physicist team. They hired Professor Pekka Rautala, who had recently moved back to Finland from the USA, to manage the new Institute. He had a ScD in materials science from Massachusetts Institute of Technology (MIT) and he had been an assistant professor at MIT and later a professor at Purdue University. The new building for the laboratory was built 1968 in Espoo relatively close to the Helsinki University of Technology campus. The new building had space for manufacturing of the products in addition to development and testing of the prototypes. Today the same building houses Outokumpu Oyj head offi ce surrounded by the technology spin-off Outotec Oyj offi ces in new buildings on the same site. Main measurement technologies from the beginning were electromagnetism and X-ray fl uorescence. Professor Erkki Laurila was consulting for technology based on electromagnetism. The fi rst analyser designed to measure magnetite content of material in conveyor belt reached only prototype stage. The success came with a bench top magnetite analyser. These Satmagan analysers are still in use at many plants. A metal detector for conveyor belts was another success. Known as Metor, they are used worldwide for their original purpose of preventing metal pieces among ore to damage crushers and particularly by thousands at airports to detect potentially dangerous metallic objects carried by passengers.
Professor Pekka Rautala’s background with X-ray fl uorescence (XRF) was applied to develop an on-stream elemental analyser for fl otation control. Most Outokumpu’s concentrators treated complex sulfi de ores and produced many concentrates. Such operations were diffi cult to manage without frequent assay information, which was too expensive to measure by manual sampling and laboratory analysis. The measurement technology was based on X-ray tube excitation of fl uorescence spectrum off a sample in a fl ow cell and with analysis by wavelength dispersive spectrometers. The spectrometers, which were designed by Pekka Rautala based on his materials science background and lens crafting hobby, proved to have not only the best available performance but they were robust for industrial environment. Essentially the same spectrometers are still the best available technology and are used today in most Outotec Courier analysers.
The fi rst Courier 300 X-ray fl uorescence analyser was installed at Pyhäsalmi copper/zinc/pyrite concentrator in the middle of Finland in 1968. It was in operation for well over 30 years with some updates in the computer hardware and software. The secret of the success story is believed to be the unchecked fact that the prototype troubleshooting and commissioning team only received one way tickets to rather boring Pyhäsalmi in the middle of nowhere. Return tickets were considered by Professor Rautala only after acceptable calibration results were presented to him. Half a dozen Courier 300 analysers were installed and commissioned at Outokumpu’s concentrators before their sale to other mining companies was considered. The fi rst customer outside Finland was Mount Isa Mine in Australia in 1972. Two original

Spectrum Series 18
C I R C U I T C O N T R O L
325
Courier 300 model analysers are still in use in North America, though updated models were introduced already in the 1980s. The Courier analyser family became the most successful on-stream XRF analyser in the industry with over 600 analysers sold worldwide so far.
With the development of energy dispersive XRF technology, Outokumpu developed and tested an in-stream XRF probe with radioisotope excitation for slurry analysis in middle 1970s. When tested in parallel with a centralised analyser with wavelength dispersive spectrometers, the performance difference was signifi cant in favour of the older design. After a test installation at Keretti concentrator the product development was discontinued as there were no volunteers within Outokumpu concentrators to participate in long-term beta tests of the product. Another energy dispersive XRF development effort was done in the early 1980s with some Minexan analysers actually installed at small mineral processing plants. These worked better as they were based on proper sampling system and fl ow cell design but never became popular enough to survive more than fi ve years as a product.
In the early days accuracy and availability of samples was a concern. Plant metallurgists at
the fi rst installations had their own strong opinions on how sampling was working and how
it actually should be done. Every concentrator superintendent and metallurgist with some
professional self respect had at least one design of a primary sampler which was claimed to be
the only ‘correct’ one. Only after it was realised that even sampling and sample transportation
follow the proven laws of nature and can be approached by a systematic engineering design,
things were sorted out. A number of standard well proven primary sampler designs were
introduced as well as an improved secondary sampling system for new analyser models.
(Kongas, 2009).
In 1962 Outokumpu brought the Pyhäsalmi mine into operation to produce lead, copper, zinc and pyrite concentrates and it became a large-scale laboratory in which instruments developed by the Institute were tested. This was an important factor in the success of the program. The Courier 300 on-stream analysis system, which was a 14-stream, wavelength dispersive X-ray analyser, was installed in the Pyhäsalmi plant at the end of 1967 and its success led to the installation of a second analyser in 1970 (Leskinen et al, 1972) with both systems analysing copper, zinc and iron.
The two Courier analysers at the Pyhäsalmi Concentrator are shown in Figure 10.8. Analysis data were sent to a process computer that controlled the grinding and copper and zinc fl otation circuits. Assays of each stream were available to the operators every six to seven minutes; the cost per assay was about two cents, and the analysers had a high availability that was usually more than 99 per cent. Digital computer control was also started at the plant in 1970. In late 1970 a Courier 300 system was installed at the Keretti Concentrator of the Outokumpu Mine to analyse copper, zinc, iron and later cobalt. In 1971 similar analysers were installed at the Vihanti, Vuonos and Kotalahti concentrators. Using the analyser, Outokumpu developed its own process control and management system and installed the fi rst at the Kotalahti nickel concentrator in 1973. A reliable sampling system was the basis for the Courier 300 on-stream analyser; it consisted of a primary sampler, secondary sampler, cleaner screen, feeding tank, sample cell, timer controlled sampler and pumps, sumps and pipes (Leskinen, 1976).

Spectrum Series 18
H I S T O R Y O F F L O TAT I O N
326
FIGURE 10.8
Two Courier 300 on-stream analysers at the Pyhäsalmi Concentrator.
In the original Courier systems the process fl ow did not exceed 2400 m3/h and its solids content was less than 50 per cent by weight and particle size was less than 3 mm. In the following decade the installation of the Courier systems continued to grow with around 30 systems in operation in plants, mainly in North America and Australia (Saarhelo et al, 1988). Distributed analyser systems were also introduced and became popular due to their low initial investment cost and ease of expansion when required (Kiuru, 1981). Systems were installed directly when additional measurement points were required. The probes were connected to each other through a communication line that also linked the probe array and the computer in the control room. Mostly the probes of the distributed analysers were based on the energy dispersive measurement principle utilising a proportional counter or solid-state detector (Hietala and Kiuru, 1980).
However, in critical applications these systems suffered from limited accuracy and sensitivity. Outokumpu then introduced the Courier 30 analyser that overcame these problems by using a crystal spectrometer and X-ray tubes. The Courier 30 could be installed directly in the process environment and measure up to fi ve slurries using a single slurry multiplexer and the fi rst pilot installation was at the Vammala nickel and copper concentrator in 1980 (Kiuru, 1981). By 1983 new methods of sampling were in use including analyser probe immersion and automatic samplers. The typical delay time between the extraction of a sample from the process stream and the output of a measurement was two to three minutes and the time between successive measurements was four to 15 minutes (Hughes, 1983). By 1988 the total number of online analysers in minerals processing plants was over 230 (Saarhelo et al, 1988), the majority of which were in metallic ore fl otation plants with more than half delivered by Outokumpu. By this time it was also possible to make online measurements of industrial minerals such as talc, calcium and potassium by use of an XRF analyser such as the Courier 20, or a combined XRD/XRF analyser such as the Courier 40. By 1989 the Courier 40 was successfully tested at an apatite concentrator and a talc concentrator (Ahonen et al, 1989).

Spectrum Series 18
C I R C U I T C O N T R O L
327
By 1996 enhancements in measurement technology and sampling signifi cantly increased the analytical performance of the X-ray analysers (Saloheimo and Sanhueza, 1996), the results being seen in either faster analysis for a given number of samples, or the capability of measuring more streams using a single unit.
RADIOISOTOPE SYSTEMS
Radioisotope systems offered the possibility of simpler and less expensive OSA systems compared with the X-ray tube systems (Lynch et al, 2005). The plant system could be built up in stages as needs arose. Short sample by-lines would reduce the problems of pipe blockage caused by coarse particles and wood chips, and wear on detector windows would also be reduced. The critical link between the minerals industry and expertise in radioisotope X-ray techniques was established in 1962 when North Broken Hill Ltd (NBH) approached the Australian Atomic Energy Commission (AAEC) with their requirements for OSA. The approach by Conzinc Riotinto of Australia (CRA) to the AAEC in 1965 led to the highly productive collaboration between physicists at the AAEC led by John Watt and metallurgists at CRA led by Bruce Rawling.
Gamma-ray transmission for high atomic number elements
Gamma-ray transmission was the fi rst technique developed for OSA using radioisotopes. In 1957 the Australian Atomic Energy Commission (AAEC) was investigating a reactor system
FIGURE 10.9
A secondary sampling system.

Spectrum Series 18
H I S T O R Y O F F L O TAT I O N
328
based on uranium powder suspended in liquid sodium, and the suspension was simulated by tungsten powder in water that was pumped around a 25 mm cross-section loop. The concentrations of tungsten over a cross-section of pipe were determined by scanning the gamma-ray beam (thulium 170, 84 keV gamma rays) over the pipe cross-section. This was the fi rst radioisotope OSA system of slurries (Watt and Lawther, 1958).
In 1962 North Broken Hill Ltd (NBH) asked the AAEC whether it was possible to continuously determine the lead concentration of their fl otation feed slurry online in a 150 mm diameter steel pipe. Calculations showed that this should be possible by combining measurements of gamma-ray transmission at two different gamma-ray energies, about 200 and 662 keV. The AAEC overcame the lack of a suitable 200 keV radioisotope by developing a novel source based on Compton scattering of higher-energy gamma rays yielding an output of about 225 keV gamma rays. This dual-energy gamma-ray transmission technique was tested successfully in the NBH plant in 1964 and 1966 (Ellis et al, 1967). The radioisotope system was installed online at the NBH concentrator in 1968. This was the world’s fi rst permanent installation of a radioisotope OSA system in a mineral concentrator. In December 1965, Bruce Rawling of Conzinc Riotinto Australia (CRA) asked John Watt about measuring both lead and zinc in sample by-lines from various process streams in a CRA concentrator at Broken Hill. Watt’s response was that lead in fl otation feed would be accurately determined by dual-energy gamma-ray transmission based on radioisotopes Gd-153 (100 keV) and Cs-137 (662 keV). For tailings, a correction would have to be made for matrix variations by a further transmission measurement with gamma rays of suitable energy. These predictions were later confi rmed by calculation and experiments on samples of solids taken from plant streams (Watt, 1967; Ellis et al, 1969). Philips Industries Pty Ltd provided laboratory equipment to CRA for sample by-line trials, and in 1968 CRA staff proved that lead could be determined accurately in a sample by-line from the main fl otation feed stream (Hinckfuss and Rawling, 1968).
X-ray fl uorescence for medium atomic number elements
The discussions between Rawling and Watt in 1965 crystallised thoughts on the urgency of developing radioisotope XRF techniques for OSA for medium atomic number elements such as copper and zinc. Australian mineral companies had to be contacted to obtain comprehensive information about their requirements, and samples had to be collected over extended periods of time from various process streams in several concentrators so that the AAEC could determine whether the techniques provided suffi cient accuracy to meet these requirements. The AAEC contracted Australian Mineral Development Laboratories ( Amdel) in 1966 to undertake the survey of mineral company requirements for OSA, and this was completed in mid-1967. Over the period from 1966 to 1968, mineral companies supplied the AAEC with suites of about 25 samples that were taken over a period of at least six weeks from each of several process streams in their plants.
During 1966–1968 the AAEC undertook extensive development of radioisotope XRF assemblies and techniques (Watt and Gravitis, 1973; Watt, 1983). In 1966, XRF measurements were made on samples of lead–zinc ore, taken from widespread locations throughout the CRA mine, with excellent results of zinc in the range 0–34 wt per cent being determined

Spectrum Series 18
C I R C U I T C O N T R O L
329
to 0.6 wt per cent (1σ) (Watt, 1967). Measurements on the samples taken from several streams in each of six concentrators also gave promising results (Ellis et al, 1969) with one exception, copper in the iron-rich tailings from Tennant Creek, which was later solved with the development of the detector-radiator assembly (Watt, 1972). The success of laboratory measurements on samples was followed up by on-stream trials of radioisotope XRF systems at fi ve mineral concentrators, undertaken during 1968–1971 by AAEC, Amdel and plant staff (Fookes et al, 1971). Overall, these trials were very successful and led to improvements in radioisotope X-ray assemblies and techniques.
During 1967 Douglas Hinckfuss of CRA proposed replacing XRF measurements on a sample by-line with measurements by probes immersed directly into the plant process stream (Hinckfuss, 1972). The probe was a casing containing the radioisotope source and detector assembly.
The immersion probe, shown in Figure 10.10, was a key development to the radioisotope OSA system because it overcame the need for use of sample by-lines and dramatically reduced window wear (Fookes et al, 1973). There was now a complete contrast in approaches to OSA by the radioisotope and the X-ray tube systems. Joint CRA–AAEC trials at Broken Hill using immersion probes demonstrated excellent results for lead and zinc determined in plant process streams (Fookes et al, 1973). Stump and Roberts (1974) demonstrated better control of grinding and fl otation at the New Broken Hill Consolidated concentrator based on using radioisotope probes and computer control, as well as excellent accuracies of the OSA for lead and zinc in actual plant installations. From 1967 the AAEC also used silicon solid-state detectors for laboratory XRF measurements on mineral samples from plants. These detectors had good X-ray energy resolution and proved to be very suitable for the analysis of samples from process streams (Gravitis, Greig and Watt, 1974). These detectors were then not suffi ciently stable for use in industrial plants. In the early 1980s, Amdel incorporated these detectors into immersion probes for plant use in tailing streams.
FIGURE 10.10
Radioisotope on-stream analysis (OSA) system immersion probe (Cutmore et al, 1993).

Spectrum Series 18
H I S T O R Y O F F L O TAT I O N
330
Commercial system
The radioisotope XRF and XRA assemblies developed by the AAEC, incorporated into the casing of the immersion probe developed by CRA, became the basis of the commercial OSA system. Philips Industries Ltd was selected as the licensee to design and manufacture the commercial system hardware, and Amdel was selected to undertake the feasibility studies, installation and calibration. Amdel installed the fi rst three plant-analysis systems in concentrators in 1973. The development of the radioisotope on-stream analysis system was a productive ten-year project that contributed much to fl otation technology. Amdel took over the system manufacture in 1978. Thermo Electron Corporation took over the Amdel Instrumentation Division, including staff, in 1999 and continues to manufacture the radioisotope system.
FROTH CAMERAS
Froth fl ows and modern camera technology
An important aspect of the basic control of fl otation cells is stabilising the fl ow of froth over the cell lip into the froth launder. Traditionally the fi eld operator does that by adjusting the individual froth depths and the cell airfl ows to maintain a certain froth fl ow profi le along the bank of cells, for example the rougher section. The section production rate of concentrate, and hence the grade and recovery, is judged and controlled through the total froth fl ow.
As part of the trend in process control practice in mineral processing plants towards instrumentation and automation there have also been moves to automate this basic control function, mainly to obtain better control over the ‘transfer’ fl ows, eg rougher concentrate to cleaner feed. However, froth fl ow is one of the more diffi cult measurements to instrument. A common approach to the control of the bank concentrate fl ows has involved controlling the level in the collection hopper. When the concentrate is pumped from the hopper at a controlled fl ow, eg to the cleaner bank, using a variable-speed pump and a magnetic fl owmeter, the hopper level can be held constant by varying the froth fl ow from the bank feeding it, thus making the froth fl ow equal to the set cleaner feed fl ow.
However, this simple technique cannot deal with the froth fl ows from the individual cells. Attempts were therefore made to measure cell froth velocity. Presently, the most successful technique of doing that has proven to be to use a video camera together with image analysis software in a dedicated computer, eg a common PC. This approach offers other benefi ts, not the least of which is that the control room operator can visually monitor the froth of each cell remotely. Further developments in image analysis software and the use of colour video could conceivably lead to automatic control functions based on bubble size, the appearance of the bubble ‘windows’, the bubble bursting rate and possibly the colour of the froth surface.
The fi rst serious attempt at producing an industrial froth visualisation and analysis system to take advantage of modern computing power was made by Nguyen (1998) at JKTech, the commercial division of the Julius Kruttschnitt Mineral Research Centre in Brisbane, Australia. The system consisted of one or more cameras, connected to a central processing computer via optical fi bre. The system calculated froth velocity, and inferred the froth bubble

Spectrum Series 18
C I R C U I T C O N T R O L
331
size from textural analysis of a sequence of captured images. ‘ JKFrothCam’ systems were fi rst installed on fl otation columns in coal preparation plants in central Queensland and were used in control strategies to minimise the ash content of the concentrate. Subsequent JKFrothCam systems were also installed on fl otation circuits at a number of large copper concentrators for use in process control strategies with good success. Since 1998, Nguyen’s work has inspired the development of a number of other commercial systems that are now widely utilised throughout the industry. The two most widely used froth monitoring systems currently are Outotec’s FrothMaster™ 2 system and Metso Cisa’s VisioFroth® system. Both systems utilise colour cameras installed over the fl otation cell at a distance where splashing onto the lens from the froth will be minimal. Consistent lighting of the fi eld of view of the cameras is crucial to the image analysis algorithms and is controlled by sunshades and either halogen or LED lighting.
Figure 10.11 (left) shows a schematic of a FrothMaster™ 2 camera above the froth surface. The cameras capture images of the moving froth surface at up to 25 frames per second and these are transmitted back to the image processing module via optical fi bre or coaxial cable. In FrothMaster™ the images are processed in the fi eld on single-board computers, with four cameras being analysed by each computer. The VisioFroth® images are processed centrally on a multi-processor server. Figure 10.11 (right) shows one section of the VisioFroth® interface. The left-hand side of the fi gure consists of the live video of the froth with the region of interest shown in the white box. This can be resized, rotated and moved to allow the most representative region of the froth to be analysed without physically adjusting the camera.
FIGURE 10.11
Outotec’s FrothMaster™ 2 Camera (left), Metso Cisa’s VisioFroth® system (right).
In the upper right of the fi gure is a 2D depiction of the x and y components of the froth velocity. The delineations of the bubbles used to calculate bubble size distribution are shown directly to the right of the captured video. Both systems analyse the froth surface in real time and provide several measurements, such as froth velocity, bubble size, stability and colour.

Spectrum Series 18
H I S T O R Y O F F L O TAT I O N
332
Process control applications
The three parameters most widely used in fl otation control strategies are froth velocity,
bubble size/froth texture and colour. As mentioned previously, froth velocity allows an
inference to be made of the mass pull of an individual cell. The bubble size distribution and
texture can be related to concentrate quality or the need for a reagent change, and colour and
brightness descriptors can be used to assess the cell concentrate grade (Runge et al, 2007).
Froth imaging data provides the most benefi ts when used in conjunction with an expert
control system. Several control strategies utilising image analysis data have been reported in
technical journals (Hyötyniemi, Ylinen and Miettunen, 2000; Brown, Dioses and Van Olst,
2001; Carr and Tilli, 2009; Supomo et al, 2007). So far, froth imaging data has been used for
the velocity control of individual cells, for froth velocity profi le control down a bank of cells
(Gorain, 2005) and for feed forward compensation of changes in circuit fl ow rate.
Froth vision parameters can also be combined with online slurry elemental analysers to
control individual fl otation machines simultaneously, and to supervise the overall circuit
performance. As the velocity at which the froth is recovered over the cell lip has a direct and
consistent infl uence on grade and recovery, the control of froth velocity is possible by using
slurry level, aeration rate and frother dosage as manipulated variables.
At this stage successful applications of froth cameras in control systems have been
reported but their use is not yet widespread. It will be interesting to see to what extent
possibilities beyond the measurement of froth velocity are developed and utilised in the
plants. It seems likely that soon at least the very large tank-cells will be routinely equipped
with froth cameras and ‘pulling rate’ control via froth velocity and automatic manipulation
of froth depth and airfl ow.
REFERENCES
Ahonen, A, Alfthan, C, Hirvonen, M, Ollokainen, J, Rintamaki, M, Saloheimo, K and Virtanen, P, 1989. On site tests of a new XRD/XRF on-line process analyser, in Advances in X-Ray Analysis (eds: Barrett, Gilfrich, Jenkins, Huang and Predecki), vol 32 (Plenum Publishing Corp: New York).
Amsden, M P, Chapman, C and Reading, M B, 1973. Computer control of fl otation at Ecstall concentrator, CIM Bulletin, September, pp 84–91.
AusIMM Broken Hill Branch, 1930. The development of processes for the treatment of crude ore, accumulated dumps of tailing and slime at Broken Hill, New South Wales, AusIMM Proceedings, 80:379–444.
Barlin, B and Keys, N J, 1963. Concentration at Bancroft, Mining Engineering, 15(9):47–53.
Behrend, G M, 1978. Mill instrumentation and process control in the Canadian mining industry, in Milling Practice in Canada, pp 23–44 (Canadian Institute of Mining and Metallurgy: Montreal).
Braes, J R, 2009. Personal communication.
Brown, N, Dioses, J and Van Olst, M, 2001. Advances in fl otation process control at Cadia Hill Gold Mine using froth imaging technology, in Proceedings SME Annual Meeting (Society of Mining, Metallurgy and Exploration: Littleton).
Burch, H K, 1917. Mine and mill plant of the Inspiration Consolidated Copper Co, AIME Transactions, 55:707–740.

Spectrum Series 18
C I R C U I T C O N T R O L
333
Bushell, C H G and Malnarich, M, 1956. Reagent control in fl otation in mining engineering, AIME Transactions, July, pp 734–737.
Carr, D and Tilli, O, 2009. Optimising large fl otation cell performance through advanced instrumentation and control, in Proceedings Tenth Mill Operators’ Conference, pp 299–304 (The Australasian Institute of Mining and Metallurgy: Melbourne).
Cutmore, N G, Howarth, W J, Sowerby, B D and Watt, J S, 1993. On-line analysis for the mineral industry, in Proceedings AusIMM Centenary Conference Adelaide, pp 189–198 (The Australasian Institute of Mining and Metallurgy: Melbourne).
Delprat, G D, 1907. Presidential Address – Ore treatment at the Broken Hill Proprietary mine, Transactions of the Australasian Institute of Mining Engineers, vol XII, paper 158, pp 1-29.
Diamond, R W, 1928. Ore concentration practice of the Consolidated Mining and Smelting Company of Canada, in Flotation Practice, papers and discussions presented at meetings held in Salt Lake City, August 1927, and New York, February 1928, pp 95–106 (American Institute of Mining and Metallurgical Engineers: New York).
Ellis, W K, Fookes, R A, Gravitis, V L and Watt, J S, 1969. Radioisotope X-ray techniques for on-stream analysis of slurries: Feasibility studies using solid samples of mineral products, International Journal of Applied Radiation and Isotopes, 20:691–701.
Ellis, W K, Fookes, R A, Watt, J S, Hardy, E L and Stewart, C C, 1967. Determination of lead in ore pulps by a technique using two gamma-ray absorption gauges, International Journal of Applied Radiation and Isotopes, 18:473–478.
Fookes, R A, Gravitis, V L, Hinckfuss, D A, Stump, N W and Watt, J S, 1973. Plant trials of radioisotope immersion probes for on-stream analysis of mineral process streams, Transactions of the Institution of Mining and Metallurgy, Mineral Processing and Extractive Metallurgy, 82(796):C21–C25.
Fookes, R A, Gravitis, V L, Watt, J S, Wenk, G and Wilkinson, L R, 1971. On-stream analysis for copper, zinc, tin and lead in plant mineral slurries using radioisotope X-ray techniques, in Proceedings Symposium on Automatic Control Systems in Mineral Processing Plants, pp 21–23 (The Australasian Institute of Mining and Metallurgy: Melbourne).
Gorain, B K, 2005. Optimisation of fl otation circuits with large fl otation cells, in Proceedings Centenary of Flotation Symposium, pp 843–852 (The Australasian Institute of Mining and Metallurgy: Melbourne).
Gravitis, V L, Greig, R A and Watt, J S, 1974. X-ray fl uorescence analysis of mineral samples using solid state detector and radioisotope X-ray source, AusIMM Proceedings, 249:1–4.
Hales, L B, Hales, M L, Burbidge, C D and Collins, D T, 2009. How to increase plant performance with artifi cial intelligence and expert systems [online]. Available from: <http://www.kscape.com/content/how-increase-plant-performance-artifi cial-intelligence-and-expert-systems>.
Hales, L B and Marchant, G R, 1979. Instrumentation, in Computer Methods for the 80s in the Mineral Industry (ed: A Weiss), chapter 5.2 (Society of Mining, Metallurgy and Exploration: Littleton).
Henderson, E T, 1928. The history of ore treatment processes in Broken Hill, AusIMM Proceedings, 72:99–112.
Hietala, M and Kiuru, E S, 1980. New energy and wavelength dispersive on-stream XRF probes, in Preprints of the Third Symposium on Automation in Mining, Mineral and Metal Processing, Montreal, August.
Hinckfuss, D A, 1972. Immersible fl uorescence probe, Australian Patent 39964/72.
Hinckfuss, D A and Rawling, B S, 1968. The development and application of an on-stream analysis system for lead at the Zinc Corporation, Limited, in Broken Hill Mines—1968 (eds: M Radmanovitch and J T Woodcock), pp 475–479 (The Australasian Institute of Mining and Metallurgy: Melbourne).
Hughes, D V, 1983. Sampling systems for on-stream x-ray analysers in ore-dressing plants, Transactions of the Institute of Measurement and Control, 5(4):185–191.

Spectrum Series 18
H I S T O R Y O F F L O TAT I O N
334
Hyötyniemi, H, Ylinen, R and Miettunen, J, 2000. AI in practice: Case study on a fl otation plant, in STeP 2000 – Millennium of Artifi cial Intelligence, Vol. 2: ‘AI of Today’ (ed: H Hyötyniemi), pp 159–166 (Finnish Artifi cial Intelligence Society: Helsinki).
Janes, C G, Johnson, L M Jr and Finkelstein, N W, 1978. The Duval Sierrita concentrator, in Flotation – A M Gaudin Memorial Volume, chapter 39 (Society of Mining, Metallurgy and Exploration: Littleton).
Jauho, P, 2002. Obituary for Pekka Rautala, Helsingin Sanomat 19 January 2002 (in Finnish).
Kiuru, E S, 1981. A new instrument for accurate on-stream XRF measurement, in Proceedings Promecon ’81 Conference, London, 16–18 June.
Kongas, M, 2009. Personal communication.
Leskinen, T, 1976. The sampling system of Courier 300 analyser, in Proceedings Canadian Mineral Processors Conference, Ottawa, 20–22 January, pp 327–346.
Leskinen, T, Koskinen, J, Lappalainen, S, Niitti, T and Vanninen, P, 1972. On-stream analysers and Outokumpu concentrators, presented to 74th Annual Meeting of the CIM, 9–12 April (Canadian Institute of Mining and Metallurgy: Montreal).
Lucy, W, Fulmore, T G and Holderreed, F L, 1963. Copper analysis of pulp streams in the Anaconda Copper Concentrator by X-Ray fl uorescence, in Proceedings Sixth International Mineral Processing Congress (ed: A Roberts), pp 679–689 (Pergamon Press: London).
Lynch, A J, Johnson, N W, Manlapig, E V and Thorne, G C, 1981. Mineral and Coal Flotation Circuits – Their Simulation and Control, pp 183–224 (Elsevier).
Lynch, A J, Watt, J S, Finch, J A and Harbort, G J, 2005. History of fl otation technology, in Proceedings Centenary of Flotation Symposium, pp 15–18 (The Australasian Institute of Mining and Metallurgy: Melbourne).
Marcossan, I F, 1957. Anaconda (Dodd Mead: New York).
Motherwell, W, 1916. Flotation tests at Mount Morgan, in The Flotation Process (ed: T A Rickard), pp 53-59 (Mining and Scientifi c Press: San Francisco).
Muller, B, Smith, G C, Smit, S, Singh, A, Strobos, P J J and Reemeyer, L, 2004. Enhancing fl otation performance with process control at Century Mine, in Proceedings Metallurgical Plant Design and Operating Strategies (MetPlant) 2004 Conference, pp 337–350 (The Australasian Institute of Mining and Metallurgy: Melbourne).
Nguyen, K K, 1998. Flotation froth characterisation by using vision technology, PhD thesis, University of Queensland (unpublished).
Prinsloo, A, 2009. Personal communication.
Rawling, B S and Greaves, M C, 1965. The use of X-ray fl uorescence analysis for rapid mill control assaying, AusIMM Proceedings, 211:135–155.
Runge, K, McMaster, J, Wortley, M, La Rosa, D and Guyot, O, 2007. A correlation between VisioFroth® measurements and the performance of a fl otation cell, in Proceedings Ninth Mill Operators’ Conference, pp 79–86 (The Australasian Institute of Mining and Metallurgy: Melbourne).
Saarhelo, K, Paakkinen, U and Pennanen, D, 1988. On-line analysis in industrial mineral applications, in Proceedings 8th Industrial Minerals International Congress, Boston, pp 196-203.
Saloheimo, K and Sanhueza, I, 1996. Utilisation of analysers and control systems to metallurgical processes, presented to Clean Technology for the Mining Industry, Concepcion, 15–17 May.
Singh, A, Louw, J J and Hulbert, D G, 2003. Flotation stabilization and optimization, Journal of the South African Institute of Mining and Metallurgy, November, pp 581–588.
Stump, N W and Roberts, A N, 1974. On-stream analysis and computer control at the New Broken Hill Consolidated Limited concentrator, AIME Transactions, 256:143–148.

Spectrum Series 18
C I R C U I T C O N T R O L
335
Supomo, A, Yap, E, Zheng, X, Banini, G, Mosher, J and Partanen, A, 2007. PT Freeport Indonesia’s mass-pull control strategy for rougher fl otation, presented to Flotation ’07 (Minerals Engineering International).
Thornton, A J, 1991. Cautious adaptive control of an industrial fl otation circuit, Mineral Engineering, 4:1227–1241.
Watt, J S, 1967. Recent developments in low energy X-and gamma-ray sources and applications in Australia, in Proceedings Second Symposium on Low-Energy X-and Gamma-Ray Sources and Applications (eds: P S Baker and M Gerrard), vol 2, pp 663–695, Report ORNL-11C-10 (Oak Ridge National Laboratory: Oak Ridge).
Watt, J S, 1983. On-stream analysis of metalliferous ore slurries, International Journal of Applied Radiation and Isotopes, 34(1):309–331.
Watt, J S and Gravitis, V L, 1973. Radioisotope X-ray fl uorescence techniques applied to on-stream analysis of mineral process streams, in Automatic Control in Mining, Mineral and Metal Processing, IFAC International Symposium, Sydney, 13–17 August, pp 199–205 (Institution of Engineers).
Watt, J S and Lawther, K R, 1958. Measurement of concentration of tungsten suspensions and density of liquid sodium by gamma-ray absorption, in Proceedings Symposium on the Peaceful Uses of Atomic Energy in Australia, section 5 (Australian Atomic Energy Commission: Sydney).

Spectrum Series 18 337
We are grateful to engineers from many countries who responded readily to requests for information about the ores and the fl otation circuits of many years ago and about the people who made them work. Their contributions are an important part of the text of this history and they add life to what might otherwise have been a pedestrian story.
The locations that have been particularly important in fl otation history are Broken Hill in Australia, El Teniente in Chile and Bingham Canyon in the USA. We thank Cliff Braes (Consultant, Broken Hill) Araneda Osés Octavio Andrés and Carlos Torres Yáñez (Codelco El Teniente, Chile) and David Kashuba (Rio Tinto, Kennecott Utah Copper) for the information they provided about early fl otation at those sites and about the circuits that were used when large cells became available. Several of the images in the book were supplied by them and they show the progress that has occurred as plants have progressed from a few thousand tonnes per day to more than 100 000 tonnes per day.
We thank Professor Freidrich Balck from the Technical University of Clausthal for the wonderful pictures of mineral concentration plants in prefl otation days and Mr Kjell Olsen for the pictures of the Elmore vacuum cells, which operated successfully at the Sulitjelma mine in northern Norway in 1909.
Mr Norman Lamb, President of California-Engels Mining Company, graciously provided photos of the fi rst all-fl otation plant in the USA, which commenced operations in 1914. Takahide Wakamatsu, Emeritus Professor, University of Kyoto, Japan, wrote the text on the fl otation of Kuroko ores, which were complex sulfi de ores mined for many years and which presented very diffi cult problems for fl otation engineers.
Research to improve fl otation by understanding its theory started about 1910, and progress to about 1940 is discussed in Chapter 8. Research programs then grew rapidly. The history of fl otation theory since those early studies is beyond the scope of this book.
In Chapters 9 and 10 the historical and the modern approaches to coping with changes in mineralogy and mineral content, which have always been the defi ning problems in fl otation circuits, are discussed. In Chapter 9 Dr Bill Johnson (Mineralurgy Ltd, Brisbane) discussed new techniques for optimising circuit performance as mineralogy and circuit arrangement change and Dr Alan Reid (formerly CSIRO Melbourne) described the development of a system based on the scanning electron to defi ne the associations in composite mineral particles.
Paul Gottlieb and Dr Alan Butcher also provided valuable input to this chapter, as did Dr Kathy Ehrig of BHP Billiton.
Chapter 10 is concerned with the control of fl otation circuits, which was entirely manual
for the fi rst 60 years. Then on-stream analysis was developed over a period of years and
automatic control of circuits became possible. The section on circuit control in Chapter 10
A C K N O W L E D G E M E N T S

Spectrum Series 18
H I S T O R Y O F F L O TAT I O N
338
was written by Dr Andrew Thornton (Mipac Ltd, Brisbane). On-stream analysis is also
discussed in Chapter 10, both its start in the 1960s and the recent developments.
Froth recognition is emerging as an important element in control and instruments that are now available for defi ning characteristics of the froth quantitatively are discussed by Mr David La Rosa (Metso, Brisbane) and Drs Coleman and Kongas (Outotec). Dr Kongas also described recent Outotec work with on-stream analysers.
During the four years that this book has been in preparation we have learnt much from discussions with many people. It is not possible for us to thank all our colleagues individually but we do wish to record our thanks to Ray Beebe (Independent Consultant, USA), Dr Dariusz Lelinski and Asa Weber (FLSmidth Minerals, Salt Lake City), Peter Tilyard (Group Metallurgist, MMG, Melbourne), Dave Lauder (Consultant, Ravenshoe) and Lutz Elber (Consultant, Perth). Special thanks go to Dr John Frew (formerly CSIRO Melbourne) for his assistance in reviewing the entire manuscript as part of The AusIMM peer review process. Invaluable historic information was provided by Harmel (Bull) Dawson (founder of Dawson Metallurgical Laboratories, Salt Lake City), H Rush Spedden (formerly Kennecott Copper Co, Salt Lake City), Frank Millsaps (formerly Galigher Equipment Co, now Consultant, Salt Lake City), Paul Fagergren, grandson of William Fagergren (EIMCO Water Technologies, Salt Lake City), Frank Seeton (formerly Denver Equipment Co, Denver), Richard Hiler (Rio Tinto Kennecott Utah Copper) and Richard G McDonald (formerly Galigher Equipment Co and US Bureau of Mines, Salt Lake City). We would also like to thank AMEC Minproc for allowing Greg Harbort time to work on this volume. We also express our appreciation to the Society for Mining, Metallurgy and Exploration (SME) for their support of this volume.
We are indebted to Karen Holtham (JKMRC librarian, Brisbane) who obtained many references that were not readily available and Tom Nelson (Salt Lake City, Utah) who used his computer skills to transform many of the old fi gures into excellent images.
Most of all we thank our families for their tolerance and good humour during the countless
hours we have been immersed in learning and writing about the history and development of
fl otation technology.
PERMISSIONS
We thank colleagues who have granted us permission to reproduce fi gures, tables and information. These are listed below. All reasonable attempts were made to contact the appropriate copyright holders of material reproduced in this book. Any omissions were unintentional and queries regarding this should be directed to the publisher.
• Figures 1.4 and 1.5 (Balck, 2001) – reproduced with permission from Professor Friedrich Balck, Technical University of Clausthal.
• Figures 2.1 and 2.5 – reproduced with permission from Broken Hill Historical Society.
• Figures 2.2, 2.3 and 2.20 – reproduced with permission from Broken Hill City Library.
• Figures 2.4 and 2.10 – reproduced with permission from BHP Billiton.
• Figure 2.18 – reproduced with permission from J R Braes.
• Figure 2.23 – reproduced with permission from Division of Minerals and Energy Resources, SA Government.

Spectrum Series 18
A C K N O W L E D G E M E N T S A N D P E R M I S S I O N S
339
• Figure 2.24 – reproduced with permission from Sulitjelma Historielag.
• Figure 2.25 (Fuerstenau, 1962) – reproduced with permission from the Society for
Mining, Metallurgy, and Exporation (http://www.smenet.org).
• Figure 2.27 (ARTBYOXO, 2008) – reproduced with permission from Robert J Corbett
Estate.
• Figure 3.2 – reproduced with permission from the Utah Historical Society.
• Figures 3.3, 3.4, 3.5, 3.15 and 3.16 (Parsons, 1933) – reproduced with permission from
the Society for Mining, Metallurgy, and Exploration (http://www.smenet.org).
• Figure 3.7 (Berkman, 2007) – reproduced with permission from The Australasian
Institute of Mining and Metallurgy.
• Figure 3.8 (Richards and Locke, 1940; Berkman, 2007) – reproduced with permission
from McGraw Hill Book Co and The Australasian Institute of Mining and Metallurgy.
• Figure 3.9 (Forrester, 1927; Taggart, 1945) – reproduced with permission from John
Wiley and Sons, Inc and J R Braes.
• Figures 3.11 and 3.12 – reproduced with permission from Codelco El Teniente.
• Figure 3.13 – reproduced with permission from California-Engels Mining Company.
• Figure 3.14 – reproduced with permission from the Canadian Institute of Mining,
Metallurgy and Petroleum (http://www.cim.org).
• Chapter 4 includes information relating to Denver Equipment Company – reproduced with permission from the Metso Group and information relating to the Fagergren-
WEMCO and Galigher-Agitair companies – reproduced with permission from FLSmidth.
• Figures 4.34 and 4.38 – reproduced with permission from Metso Group.
• Figure 4.36 – reproduced with permission from Rio Tinto and FLSmidth.
• Figure 4.37 – reproduced with permission from Outotec Minerals Oy.
• Figure 4.39 (Taggart, 1945) – reproduced with permission from John Wiley and Sons,
Inc.
• Figure 4.40 (Yianatos, 2003) – reproduced with permission from Juan Yianatos.
• Figures 4.43 and 4.45 – reproduced with permission from Professor Imhof.
• Figure 4.46 (Wu, 2007) – reproduced with permission from Professor Wu Dawei.
• Figure 4.48 – reproduced with permission from Xstrata Technology.
• Figure 4.49 – reproduced with permission from Professor Roe Han Yoon.
• Figure 5.5 (Parsons, 1933) – reproduced with permission from the Society for Mining,
Metallurgy, and Exploration (http://www.smenet.org).
• Figure 5.6 – reproduced with permission from Rio Tinto.
• Figures 5.7 and 5.8 – reproduced with permission from the Metso Group.
• Figure 5.9 (Braes, 2008; Wearing and Coleman, 1967) – reproduced with permission
from J R Braes and the Canadian Institute of Mining, Metallurgy and Petroleum (http://
www.cim.org).
• Figure 5.10 – reproduced with permission from Outotec Minerals Oy.

Spectrum Series 18
H I S T O R Y O F F L O TAT I O N
340
• Figure 5.14 – reproduced with permission from Bougainville Copper Limited.
• Figure 5.15 – reproduced with permission from Rio Tinto and the Utah Historical Society.
• Figure 5.16 – reproduced with permission from Rio Tinto.
• Figures 5.17, 5.18, 5.19 and 5.20 – reproduced with permission from Codelco El Teniente.
• Table 5.1 – extract reproduced with permission from the Metso Group.
• Chapter 8 is based on Nelson, M G and Smit, J T, 2007. Early development of the theory of froth fl otation, in Froth fl otation: A Century of Innovation (eds: M C Fuerstenau, G J Jameson and R-H Yoon) (Society for Mining, Metallurgy, and Exploration: Colorado) – reproduced with permission from the Society for Mining, Metallurgy, and Exploration (http://www.smenet.org).
• Chapter 10 includes information from Lynch, A J, Watt, J S, Finch, J A and Harbort, G J, 2007. History of fl otation technology, in Froth fl otation: A Century of Innovation (eds: M C Fuerstenau, G J Jameson and R-H Yoon) (Society for Mining, Metallurgy, and Exploration: Colorado) – reproduced with permission from the Society for Mining, Metallurgy, and Exploration (http://www.smenet.org).
• Figure 10.3 – reproduced with permission from J R Braes.
• Figure 10.4 – reproduced with permission from FLSmidth and Rio Tinto Kennecott.
• Figure 10.5 – reproduced with permission from OZ Minerals.
• Figure 10.7 (Amsden et al, 1973) – reproduced with permission from the Canadian Institute of Mining, Metallurgy and Petroleum (http://www.cim.org).
• Figures 10.8 and 10.9 – reproduced with permission from Outotec Minerals Oy.
• Figure 10.10 (Cutmore et al, 1993) – reproduced with permission from The Australasian Institute of Mining and Metallurgy.
• Figure 10.11 – reproduced with permission from Outotec Minerals Oy and Metso Group.

Spectrum Series 18 341
A
Adelaide Star Mines, Golconda, Nevada 71
Aero� oat collectors 85
af� nity of sul� des for oily surfaces
Everson 5
Haynes 4
Agitair cells (see Galigher Agitair) 110
Amalgamated Zinc (De Bavay’s)
� otation circuit in 1910 162
Amalgamated Zinc (De Bavay’s) Ltd 32
Amdel 328
American Cyanamid 117
AMIRA 46
Anaconda Company 111
Inspiration mill 163
Washoe mill 165
X-ray tube systems 323
Applied Research Laboratories 316
Ashcroft, Edgar 19
process at Cockle Creek 20
assays
elemental and mineral 274
Australian Atomic Energy Commission 327
automated mineralogy 293
automated scanning electron microscopes 275
automatic control 1960–1980 315
B
Bahr and Ekof cells 149
Baillieu, W L 31
barite � otation
growth from 1960 to 2000 213
in the 1930s 211
Basin mill 50
Behrend, G M 315
Bessel, Adolph
early life 4
I N D E X
� oating graphite 5
BHP (Broken Hill Proprietary)
early mining 16
� otation circuit in 1902 161
� otation process in 1903 22
formation 15
processing plants at Broken Hill 16
steelworks 26
Bingham Canyon
evolution of plants during 100 years 182
� otation circuits in 2009 183
open pit mining 67
porphyry coppers 66
Black Rock mine 49
Block 14
Potter � otation process 21
Boston Consolidated 66
Arthur mill in 1914 68
Bougainville Copper 178
� ow sheet 179
use of large equipment 178
Boyd, Adam 47
Braden Copper Company (El Teniente)
caving mine 68
� rst gravity mill 68
problems with building mine 181
Braden, William
founder of El Teniente 181
Bradford, Hezekiah
� lm � otation 6
Bradford Insulation 41
Bradford Kendall 41
Bradford, Leslie
at BHP 25, 41
at Zinc Corporation 35
copper sulfate 42
General Manager, BHP 42

Spectrum Series 18
H I S T O R Y O F F L O TAT I O N
342
sulfur dioxide 42
Britannia Mining Company,British Columbia 80
Broken Hill
� otation during 1908–1913 37
mining data 1886–1902 18
mining leases 1885, 1922 16
orebody and leases 15
sulfuric acid plants 36
tailings dumps 18
Bryk, Petri 324
BT (Booth Thompson) cells 111, 112
bulk oil � otation at Glasdir 8
Butte and Superior Co
use of cleaner cells 50
C
Callow, John 72, 99
cells at Mullan, Idaho 73, 99
James Douglas Gold Medal 100
operating the cells 101
pneumatic cell design 73, 100
Callow-Macintosh cell 101
Callow-MacIntosh cell 73
problems at Mount Isa 73
Canadian potash operations 206
CANMET X-ray and image analyser 275
Cascade cell
at Junction North mine 40
cascade control system 320
Cattermole’s process
details 28
problem with froth 28
Caucasus Copper Company 48
caving and open pit mining
pros and cons 67
Central mine and the MineralsSeparation process 29
Century Mine 318
Chiapponi, Marcus 182
chronology of � otation in the USA 70
CIS (formerly Soviet Union)
iron ore � otation 201
Clausthal mine and gravity plant
1871 � ow sheet 10
Cleaner and regrind circuits 1911–1914 163
Cleveland-Cliffs Iron Company 199
coal
dry processing in the 19th century 233
resistance in industry to � otation 233
coal � otation
1915–1930 234
1930–1960 238
1960–1975 240
after 1975 241
and the environment 234, 239
high intensity columns 241
Cockle Creek leaching/electrolysis plant 20
Codelco El Teniente (see El Tentente)
Collins House Group
zinc re� nery 45
Column Flotation Companyof Canada Ltd 146
Cominco � otation circuit 52
coarse � otation 140
competition between � otation cell manufacturers 124
contact angle 45
control at Inspiration Copper in 1916 312
control rooms in the 1970s 316
Conzinc Riotinto of Australia
radioisotope system 327
copper � otation
early installations 48
copper production
in Chile 1901–2000 185
tonnes ore milled, ore grades1880–2007 177
copper production 1924–2004 94
copper production and size of� otation cells 176
copper production and size ofmechanical cells 94
copper recoveries from porphyries
effect of � otation 71
Courier 300 systems 324

Spectrum Series 18
I N D E X
343
D
Daman, Arthur 105
Davcra cell 148
Dawson Metallurgical Laboratories 115
Dead Sea Works
potash � otation 206
de Bavay, Auguste
early life 31
� lm � otation process 32
De Beers Consolidated 32
Deister Flotaire columns 146
Delprat, Guillaume
departure from Broken Hill 26
early life 23
� rst large-scale � otation process 23
legal dispute with Potter 25
demand for metals and minerals1950–2000 94
Denver Equipment Company
competing with other manufacturers 124
history 105
increasing the size of cells 124
Denver � otation machines
DR 108
Sub-A 105
Devon mine, Kadina 47
diamond adhesion process 1
Diamond, R W 313
dispersed air � otation machine 152
diverter trays 313
Dutch State Mines
coal � otation 238, 239
Duval Corporation
Sierrita Concentrator 133
E
economics of circuits using larger cells 175
education and research
legacy of copper � otation 87
Edwards, Austin 46
Eelectrolytic Zinc Company, Risdon 45
effect of grinding media on � otation 277
Eh-pH diagram for Mount Isa Mineslead–zinc grinding circuits 278
electricity generation in the USA1902–1942 87
electrochemical mechanisms 279
electrolytic process for zinc 20
Elmore brothers
early life 7
Glasdir mine 8
pilot plant in London 8
Elmore Brothers
vacuum � otation process at Broken Hill 33
vacuum � otation process at Cornwall 33
vacuum � otation process at Sulitjelma 48
El Teniente (Braden and Codelco)
Colon concentrator 185
effect of � otation on copper recovery 184
� rst use of � otation for copper ores 77
grinding and � otation circuits in 2008 186
mill in 1906 69
Sewell concentrator 185
Engels Copper Mining Company,California 79
entrainment in � otation 277
Ethiopian potash operations 207
eucalyptus oil 43
Everson, Carrie
early life 5
� oating sul� des 5
later life 6
expert control systems 321
F
Fagergren, William 116
Fagergren machines 119
license transfer to WEMCO 118
link with American Cyanamid 118
Fahrenwald, Arthur 105
Fahrenwald (Denver) machines 105
feed control at BHP in 1905 311
feldspar � otation
� rst process in 1938 209
� oating low-grade ores by 1960 210

Spectrum Series 18
H I S T O R Y O F F L O TAT I O N
344
� lm � otation
Bradford, Hezekiah process 6
De Bavay process 32
Laurion mine 1
MacQuisten process 71
surface tension effect 21
� ash � otation 139
� otation
types of processes 21
� otation cells
Bahr and Ekof cells 149
Davcra cell 148
dispersed air 152
high intensity 147
Jameson cell 153
Microcel 154
XPM and FJC cells 151
� otation cell sizes 1950–1973 134
� otation circuits
Anaconda, Inspiration 163
Anaconda, Washoe 165
BHP plant 161
cleaner and regrind circuits 163
De Bavay’s plant 162
Duval, Sierrita 167
high capacity for low-grade ores 163
INCO, Copper Cliff 168
Kennecott/Utah 166
lower capacity for higher grade ores 169
� otation columns 143
Canadian (conventional) column 146
Cole 75
early Chinese columns 143
early phosphate columns 144
Norris 75
Towne and Flinn 75
� otation machines in Australian coalindustry 1989 241
� otation machines in Coeur d’Alenedistrict, 1927 96
� otation processes 1902–1908
classi� cation of 21
� otation reagents
in 1916 84
in the 1950s (typical data) 174
� otation theories 250
Gaudin, Antoine 265
Hoover, Theodore 251
Louis, H 250
Richards, Robert 250
Rickard, Thomas 252
Simons, T 256
Taggart, A F 257
Truscott, S J 254
Wark, Ian 263
FLSmidth � otation cells 317
� uorspar � otation
in Europe 218
in USA 215
use of heavy media and � otation 217
Forrester cells 74
Froment, Alcide 9
froth cameras 330
Metso 331
Outotec 331
froth depth
effect on concentration 142
G
Galigher Agitair Company
competing with other manufacturers 126
history 110
increasing the size of cells 135
Gaspe Copper Mines pneumatic cells 171
Gaudin, Antoine 2, 265
Gepp, Herbert 45
Glasdir mine 8
gold adhesion process 1
Govett, F A 35
Goyder Laughton machine forPotter process 22
graphite � otation
Bessel process 5
processes 192
gravity mills
Bingham Canyon 67
Clausthal 10

Spectrum Series 18
I N D E X
345
comparison with � otation mills 71
El Teniente (Braden) 68
grease tables 1
Great Fitzroy copper mines 47
Greenway, Howard 43
H
haematite � otation
Birmingham Red Ores (Alabama) 197
Cleveland-Cliffs Iron Company 199
Mesabi Range 198
Haynes, William 4
Hebbard, James
background 30
interest in � otation 31
Herodotus 1
Hill Syndicate
purchaser of dumps at Broken Hill 34
Hoover, Herbert 34
Hoover, Theodore 29, 251
Horwood process 38
Hyde, James 49
I
improved recoveries by � otation 71
INCO, Copper Cliff 168
increasing the size of � otation machines 134
industrial minerals
factors affecting � otation 191
� otation milestones 189
Inspiration Copper Company
ore deposits 81
Ricketts, Louis 81
the 15 000 tons per day plant 80
Inspiration Copper Company� otation circuit 163
Institute of Physics, Outokumpu Oy 323
Institution of Mining and Metallurgymeeting, London, 1900 9
International Minerals and Chemical Corp (IMC)
feldspar � oation plants 210
phosphate plants in Florida 202
International Nickel Company of Canada 168
iron ore � otation 197
Cleveland-Cliffs Inc 200
CVRD (now Vale) 200
Michigan College 198
Pickands Mather & Co(Erie Mining Co) 199
IsaMill technology 288
J
Jackling, Daniel 66
Jameson cell 153
JKFrothCam 331
JKTech 330
Joralemon, Ira 65
Junction North mine
inventions 40
K
kaolin � otation 221
‘piggy back’ � otation 223
Keller, Cornelius 85
Kennecott Utah Copper
~1912 67
1988 � otation circuit 183
Arthur and Magna plants 167
plants 1903–2007 182
Kidd Creek 321
Kola peninsula phosphate plants 203
Kuroko deposits in Japan 53
average metal contents 58
black ore 54
Matsumine mill 57
yellow ore 55
L
laboratory � otation
Watson, Richard 2
lapis lazuli 2
larger � otation machines
need for 132
largest copper plants
in 1927 89
in 1945 94

Spectrum Series 18
H I S T O R Y O F F L O TAT I O N
346
Lasseter Sub-A cell 108
Laurila, Erkki 324
Laurion silver mines 1
Lavers, Henry 43
lazurite and azurite concentration 2
leaching and electrolysis process (Ashcroft) 19
legacies of copper � otation 87
legacies of � otation research at Broken Hill 44
legal dispute between Potter and Delprat 25
Letrange, Edouard 19
Lewis, Carl 85
liberation level
quality of separation 276
limestone � otation 195
Valley Forge cement plant 196
litigation 1911–1922 86
Louis, H 250
Low level regulatory control 317
Lyster, James 47
background 39
selective � otation process 40
M
magnetic separation 20
Mansur, Muhammad ibn 2
Masson, David 45
Mawby, Maurice 46
mechanical cells for phosphate � otation 203
Metalloinvest Management Company(iron ore) 201
Metals Recovery Company, MellonInstitute 85, 234
Miami Copper Company 81
Microcel 154, 155
mineragraphy 46
mineral liberation analyser (MLA) 275
Minerals Separation and De BavayProcesses Pty Ltd 44
Minerals Separation Company
� rst froth � otation plants 29
� otation chemicals 43
link with Central mine 29
mechanical cells 43
Sulman-Picard patent 28
mineral technologies
1875–1900 11
Missouri lead–zinc ores 51
Mitchell, Deane 36
MMG group 318
Moroccoan potash operations 207
Mount Isa Mines Limited 319, 324
� otation problems 282
Mount Morgan Ltd 47
Myers, John 50
N
National Coal Board (UK)
coal � otation 239
National Copper Company, Mullan, Idaho 73
need for larger cells 132
New Broken Hill Consolidatedmechanical cells 171
new measuring instruments in the 1960s 314
North Broken Hill
radioisotope system 327
unit cells (� ash � otation) 139
Novomeysky, Moshe 206
Nutter, Edward 49
O
Olympic Dam deposit 299
on-stream analysis 322
optimising control 320
Ore Concentration Syndicate Ltd 8
Outokumpu 137, 323
increasing the size of cells 138
Institute of Physics 323
Pyhäsalmi mine 325
round � otation machines 138
Owen process 40
Owen, T M 40
P
Peterson, Ernest 116, 118
Petit, Monsieur 2
Philips Industries 328, 330
phosphate � otation
in Brazil 203

Spectrum Series 18
I N D E X
347
in the Kola peninsula 203
in the USA 201
Phosphate Recovery Corporation 202
Pickands Mather & Co (Erie Mining Co) 199
Pittsburgh Coal Company 239
plant research techniques 274
pneumatic cells
Callow 73, 99
Forrester 102, 103
MacIntosh 101, 102
Steffensen 104
pneumatic columns
Cole 75
Norris 75
Towne and Flinn 75
porphyry coppers 66
potash � otation 204
potash production, 1931 and 2005 207
Potter, Charles 21
problem of coal � nes 234
Q
QEMSCAN analyser 275
R
radioisotope systems 327
rapid chemical analysis 315
Rasp, Charles 15
Rautala, Pekka 324
Rawling, Bruce 327, 328
reagents for coal � otation
in the 1920s 237
in the 1950s 240
reverse � otation of iron ore 197
Rhoanglo Mine Services
X-ray tube system 323
Richards, Robert 250
Rickard, Thomas 38, 252
Ricketts, Louis 81
Inspiration plant 82
Robinson, Lionel (stockbroker) 34
Robinson, W S (� nancier and manager) 37
Robson, George 7
S
SAMARCO 200
Satmagan analysers 324
Schnabel, Dr (consultant at Broken Hill) 17
selective � otation 38
Simons, T 256
Skinningrove Iron Co
coal � otation 235
steam shovels
Bingham Canyon 1906 67
Mesabi Range 1902 66
Stillwell, Frank 46
St Joe Lead Company 51
Sul� de Corporation at Cockle Creek 19
sulfuric acid plants 36
Sulitelma mine, Norway 48
Sulman-Picard process 28
supervisory control 318
sylvite and halite separation 205
T
Taggart, A F 257
talc
concentration by air separators 193
� otation 194
technological research 273
Thompson, W B 81
Timber Butte mill
sodium cyanide 50
Timber Butte Mill
rougher-cleaner circuits 163
Truscott, S J 254
typical � ow sheets in the 1950s 170
U
unit cells (� ash � otation) 139
University of Washington
coal research 234
USA copper production 1875–1925 66
US Bureau of Mines (USBM)
coal research 234
Utah Copper 67

Spectrum Series 18
H I S T O R Y O F F L O TAT I O N
348
V
Valley Forge Cement Company 196
W
Wark, Ian 45
Washoe mill (Anaconda) � otation circuit 165
Watson, Bishop Richard 2
Watt, John 327, 328
WEMCO
competing with other manufacturers 128
� otation machines 122, 123
increasing the size of cells 135
Wernher Beit and Company 32
World population and mineral demand 11
X
xanthates 85
XPM and FJC cells 151
X-ray tube techniques 323
Z
zinc analysis at Cominco in 1923 313
Zinc Corporation
alkaline � otation circuit 47
failure, then success of � otation 36
� nance and purchase of dumps 35
formation 34

F O R E W O R DAustralia has been at the forefront of technical innovation and development in the mining industry since the fi rst copper exports from South Australia in the 1840s and in no area is this more evident than in the process of fl otation. Often the key driver for innovation is a compelling business need or opportunity. This was the situation facing Guillaume Daniel Delprat when he arrived at Broken Hill as General Manager of the Broken Hill Proprietary Company Limited (BHP) in 1899. The rich oxidised surface ore was being replaced by deeper complex primary sulfi de ores. A new mill, utilising gravity methods of separation, was producing poor recoveries with nearly all the zinc and half the silver content reporting to tailings. These waste dumps were accumulating rapidly. Declining grades and recoveries, compounded by falling silver and lead prices had seen a steady decline in dividends since 1890. It was in this background that Delprat, working with his chief metallurgists A D Carmichael and Leslie Bradford fi rst observed the phenomena of zinc fl otation in the laboratory and then developed a commercial process to utilise it. No wonder there is a well known photograph of Delprat, Bradford and others sitting proudly in front of the fi rst bagged 50 tons of zinc concentrate produced in 1903! For BHP, the unlocking of the metal values contained in the waste dumps provided the fi nancial strength to develop the smelters at Port Pirie, the development of Iron Knob and the subsequent move into iron and steel.
Today fl otation is an integral step in the processing of nearly all the commodities that Australia produces, from base metals and nickel, to coal, iron ore and future investments in potash. The development of the fl otation process at Broken Hill over the years of the early 1900s, its success for BHP and the simultaneous rise of the Zinc Corporation, the forerunner of today’s RioTinto, and other Australian mining companies is a great Australian success story. It has required the energy, drive and expertise of many talented people including operators, researchers, engineers, managers and fi nanciers. The key individuals, the diff erent technologies and their applications both successes and failures are captured here. The development of the original Potter-Delprat process, the introduction of oils to generate froth fl otation and the achievement of selective fl otation processing all focused on solving challenges with the Broken Hill lead–silver–zinc ores.
The industry is indebted to Professor Alban Lynch (AO) for this thorough, knowledgeable and well illustrated and researched book. As the foundation director of The University of Queensland’s Julius Kruttschnitt Mineral Research Centre (JKMRC), Professor Lynch is an eminent fi gure in the world of comminution and fl otation. The AMIRA administered P9 Project, which he was instrumental in launching, has brought together the mining industry and mineral processing researchers both in Australia and overseas for nearly 50 years. It has pioneered many of the more recent developments in grinding and fl otation.
In the book Professor Lynch, Dr Harbort and Professor Nelson take us through 100 years of the development of fl otation, from its commercial origins at Broken Hill, through its rapid utilisation in the copper mines of the USA and Chile, its growing use in fi ne coal recovery and its now wide use in a range of industrial minerals.

Flotation practitioners and those interested in technology development will enjoy reading about the history of development of fl otation machines, the ingenuity applied and the competitive tension between and the claims of diff erent cell manufacturers leading up to the giant 300 m3 tank cells of today.
In fl otation, as noted in the book, understanding has always trailed practice. The fi nal chapters look at early fl otation theory, the growing understanding of the science of fl otation and the technology advancements that now enable us to relate plant performance to feed ore characteristics. Again Australia stands at the forefront of the world mining industry in fl otation research and development. Key Australian developments include the pioneering work of Sir Ian Wark to understand the chemical and physical phenomena involved in fl otation; the development of the automated mineralogy liberation and analysis tools QEMSCAN and MLA at CSIRO and JKMRC; the on stream analysis probes commercialised by AMDEL and the newly developing froth imaging systems. The impact of these developments on the global mining industry is exemplifi ed by the fact that there are now 150 QEMSCAN and MLA units in use around the world. These are aiding the diagnostic understanding of the performance of operating fl otation plants, and are increasingly being used in geometallurgy where drill core is analysed and measurements incorporated in block models for predicting future plant performance.
The next hundred years history of fl otation is yet to be revealed. However, what is certain is that the fl otation process will continue to be a key process step in the extraction and concentration of valuable mineral species, and will continue to evolve both in physical equipment and understanding as the mining industry grapples with the challenges of declining ore grades, deeper and more complex and changing orebodies, and increasing operating costs in the form of reagents, water, energy and maintenance.
BHP Billiton is proud of our history in the discovery, development and ongoing application of the fl otation process. The company thanks Professor Lynch and The Australasian Institute of Mining and Metallurgy for the opportunity to introduce this valuable contribution to the literature on the subject.
Dr John M SchubertDirectorBHP Billiton

P R E F A C EThe fi rst minerals boom occurred during 1875–1900 when the consumption of copper increased by 280 per cent, lead by 134 per cent and zinc by 190 per cent. By 1900 the mining industry was facing a problem, how could the supply of metals, which were then coming from high-grade deposits, be replaced when they were mined out? There was no shortage of minerals in lower grade deposits but they were usually too fi ne to be concentrated effi ciently by the gravity techniques then available and a new technique had to be found. It had been known for many years that fi ne particles of some minerals would adhere to oily surfaces or to gas bubbles and eff orts were made to develop an industrial process using this concept. There were some successes on a small scale in Germany, Wales and the USA but there had to be a strong economic incentive for companies to invest in making it work on a large scale and until this was apparent industrial mineral adhesion processes remained a hope rather than a reality.
The incentive came in the remote and desolate town of Broken Hill in Australia where gravity processing of the rich lead–silver–zinc ore recovered only 70 per cent of the lead and 50 per cent of the silver and left mountains of tailings containing 20 per cent zinc. Starting in 1902 companies at Broken Hill investigated several processes for the bulk fl otation of sulfi des and by 1912 fl otation was accepted there as an effi cient process for recovering fi ne particles. It was tested in other countries, such as Norway, Japan and Chile, and with other sulfi des, in particular copper, and everywhere fi ne particle recoveries improved. By 1915 fl otation plants were being built to concentrate fi ne-grained sulfi des in the porphyry coppers in western USA and with their success the process grew at a spectacular rate. Growth was driven by the new electricity industry. Flotation is now an essential process in the production of many minerals and because of this it is an essential component in the world economic system.
The story of the early days of fl otation is as much about the engineers, managers and fi nanciers who planned and supported the experiments and built the plants as it is of the technology which was being developed. The story of the last 80 years has been of larger plants, higher throughputs and eventually much larger fl otation cells culminating in today’s 250 000 tonnes per day plants. This book tells those stories, with some emphasis on the people who saw beyond conventional processing technology and achieved much with the new process.
We are grateful to engineers from many countries who responded readily to requests for information about the ores and the fl otation circuits of many years ago and the people who made them work. Their written contributions are included in the text and they add much to the story.
In particular we thank Takahide Wakamatsu (Emeritus Professor, University of Kyoto, Japan) for his notes on the fl otation of Kuroko ores; and Araneda Osés Octavio Andrés and Carlos Torres Yáñez (Codelco El Teniente, Chile) for their notes on early fl otation at El Teniente and on the current El Teniente circuits at Sewell and Colon.

Cliff Braes (Consultant, Broken Hill) provided much information about medium capacity circuits in the small cell era before large cells were widely used in the 1980s and David Kashuba (Rio Tinto, Bingham Canyon) provided information and images which described the evolution of circuits at Kennecott’s Bingham Canyon plants.
Chapters 9 and 10 are not concerned with historical details themselves but they are both concerned with the historical problem of change in mineralogy, and how research and new instruments are contributing to its solution. In Chapter 9 Dr Bill Johnson (Mineralurgy Ltd, Brisbane) wrote the section dealing with optimising circuit performance as mineralogy changes and Dr Alan Reid (formerly CSIRO Melbourne) described the development of a system based on the scanning electron to defi ne the associations in composite mineral particles.
Chapter 10 is concerned with the control of fl otation circuits, which was entirely manual for the fi rst 60 years. Then on-stream analysis was developed over a period of years and automatic control of circuits became possible. The section on circuit control in Chapter 10 was written by Dr Andrew Thornton (Mipac Ltd, Brisbane). On-stream analysis is also discussed, both its start in the 1960s and the recent developments. Froth recognition is emerging as an important element in control and instruments now available are discussed by Mr David La Rosa (Metso, Brisbane) and Drs Coleman and Kongas (Outotec) who also described recent Outotec work with on-stream analysers.
During the four years that this book has been in preparation we have learnt much from discussions with many people. It is not possible for us to thank all our colleagues but we do wish to record our thanks to Ray Beebe (Independent Consultant, USA), Dr Dariusz Lelinski (FLSmidth Minerals, Salt Lake City), Peter Tilyard (Group Metallurgist, MMG, Melbourne), Dave Lauder (Consultant, Ravenshoe), Lutz Elber (Consultant, Perth) and Dr John Frew (formerly CSIRO Melbourne). Karen Holtham (JKMRC librarian, Brisbane) obtained many references which were not readily available.
We wish to thank Kristy Pocock, Manager Publications, AusIMM, who was our patient and courteous editor and who contributed much to the book by detecting many mistakes and inconsistencies in the original text. However the responsibility for any errors remains solely with the authors.
Most of all we thank our families for their tolerance and good humour during the countless hours we have been immersed in the development of fl otation technology during 100 years.
Alban Lynch

A B O U T T H E A U T H O R S
ALBAN LYNCH
Alban’s career as a mineral processing engineer started at Zinc Corporation in Broken Hill in 1954. He moved to the University of Queensland in 1958 where he was a member of the research staff until 1988 and then Head of the Department of Mining and Metallurgical Engineering from 1988 to 1993. He was Foundation Director of the Julius Kruttschnitt Mineral Research Centre from 1971 to 1988 and specialised in the modelling and control of processes. From 1993 to 2007 he was Visiting Professor at Universities in Brazil, Mexico, Malaysia and Turkey. Publications include two books on mineral process simulation and control and a History of Grinding written with Chester Rowland. Alban has been the recipient of The AusIMM’s President’s Award and Institute Medal, the AIME’s Robert H Richards Award and the SME’s Antoine M Gaudin Award.
GREG HARBORT
Greg has 24 years experience in operations, research and development, design and engineering. Previous employment has included Peko Mines as a production metallurgist, Xstrata Technology as a development metallurgist with both the Jameson Cell and Isa Mill and JKTech as Technology Manager. In his current role as Principal Process Engineer with AMEC Minproc Limited he specialises in the use of geometallurgical modelling techniques for comminution and fl otation circuit design and optimisation. Greg originally graduated as a Metallurgical Engineer from the University of Queensland and in 2005 received a PhD from the University of Queensland for his research on fl otation machine design.
MIKE NELSON
Mike has 17 years’ experience as a mining engineering professor – fi ve at the University of Alaska Fairbanks and 12 at the University of Utah, where he is currently department chair. He also has 18 years’ industry experience in mining and mineral processing and has worked for Kennecott Copper, Westinghouse (Western Zirconium), Consolidation Coal (now CONSOL Energy) and EIMCO Process Equipment. He holds eight US patents and one Canadian patent. Mike received a BSc degree in metallurgical engineering and an MSc in applied physics from the University of Utah. His PhD, in mineral engineering, is from West Virginia University, where he did research on the modelling of automated longwall mining systems.

S P O N S O R
The Australasian Institute of Mining and Metallurgy would like to thankFLSmidth for their generous support of this volume.

www.flsmidth.com
flotation technologyLeading the way in
FLSmidth is the largest supplier of flotation cells with over 53,000 units sold making up approximately 70 percent of all installed flotation equipment worldwide. As the market leader in large cell development, FLSmidth engineers the world’s largest and most efficient flotation cells.
We take flotation cell development seriously. Before releasing equipment to the market, our flotation designs undergo a number of rigorous tests and proprietary CFD modeling to prove the hydrodynamics, mechanical stability, and metallurgical performance.
Along with proven technology, FLSmidth also provides for greater process flexibility. Designed around a universal tank, our SuperCell® technology can accommodate self-aspirated WEMCO® mechanisms, or forced-air Dorr-Oliver® mechanisms. These options mean you have greater control over coarse and fine particles for maximum recovery.
FLSmidth supplies the complete line of flotation cell sizes varying from 1m3 up to 500m3 sizes. We also offer metallurgical testing and with continued research and development, our process experts have the right flotation solution for your application.

Copies of all publications currently in print may be obtained from:
The AusIMM, Melbourne, Australia / Telephone +61 (3) 9662 3166 /
Email: [email protected]
Publications of The Australasian Institute of Mining and Metallurgy
SPECTRUM SERIES
1. Making the Mount Isa Mine, 1923 - 1933 Don Berkman 1996
2. History of Drilling Graham McGoggan 1996
3. The Cobar Mineral Field – A 1996 Perspective Warren Cook, Andrew Ford, Julian McDermott, Peter Standish, Craig Stegman and Therese Stegman
1996
4. Towards 2000 – Resource to Reserve Inputs Seminar, Melbourne, Vic 1997
5. Towards 2000 – National Conference on Ironmaking Resources and Reserves Estimation, Perth, WA
1997
6. Towards 2000 – The Resource Database Towards 2000, Wollongong, NSW
1997
7. Towards 2000 – Ore Reserves and Finance, Sydney, NSW 1997
8. Towards 2000 – Assessment of Reserves in Low Rank Coals, Morwell, Vic
1997
9. Towards 2000 – Ore Reserve Reconciliation Workshop, Darwin, NT 1997
10. Towards 2000 – Gold and Nickel Ore Reserve Estimation Practice Seminar
1998
11. Towards 2000 – Resource/Reserves Estimation Practice in the Central West New South Wales Mining Industry, Cobar, NSW
1999
12. Field Guide for Geoscientists and Technicians
First Edition 2004
Second Edition 2007
13. The Extractive Metallurgy of Zinc Roderick J Sinclair 2005
14. Orebody Modelling and Strategic Mine Planning – Uncertainty and Risk Management Models
First Edition Roussos Dimitrakopoulos 2005
Second Edition Roussos Dimitrakopoulos 2007
15. The Extractive Metallurgy of Lead Roderick J Sinclair 2009
16. Flotation Plant Optimisation: A Metallurgical Guide to Identifyingand Solving Problems in Flotation Plants
Ed: Christopher J Greet 2010
17. Advances in Orebody Modelling and Strategic Mine Planning I –Old and New Dimensions in a Changing World
Roussos Dimitrakopoulos 2010
18. History of Flotation A J Lynch, G J Harbort and M G Nelson
2010