History of Boston's Economy
31
THOMAS M. MENINO, MAYOR CITY OF BOSTON Boston Redevelopment Authority Paul L. McCann, Acting Director Clarence J. Jones, Chairman Consuelo G. Thornell, Treasurer Joseph W. Nigro Jr., Co-Vice Chairman Michael Taylor, Co-Vice Chairman John M. Moscardelli, Member Harry R. Collings, Secretary Report prepared by Geoff Lewis John Avault Jim Vrabel Policy Development and Research Robert W. Consalvo, Director Report #529 November 1999 History of Boston's Economy Growth and Transition 1970 - 1998
Transcript of History of Boston's Economy
THOMAS M. MENINO, MAYOR
CITY OF BOSTON
Boston Redevelopment AuthorityPaul L. McCann, Acting Director
Clarence J. Jones, Chairman
Consuelo G. Thornell, Treasurer
Joseph W. Nigro Jr., Co-Vice Chairman
Michael Taylor, Co-Vice Chairman
John M. Moscardelli, Member
Harry R. Collings, Secretary
Report prepared by
Geoff Lewis
John Avault
Jim Vrabel
Policy Development and Research
Robert W. Consalvo, Director
Report #529
November 1999
History of Boston's EconomyGrowth and Transition
1970 - 1998

T A B L E O F C O N T E N T S
EARLY ECONOMIC HISTORY OF BOSTON - A TRADITION OF INNOVATION 1
THE POST-WAR TRANSITION TO FINANCE AND PROFESSIONAL SERVICES 3
THE MODERN ERA 5BOSTON'S PLACE IN THE REGION 5
EMPLOYMENT 6
Finance, Insurance and Real Estate (F.I.R.E.) 6
Service Sector 6
Manufacturing 9
Trade 10
Public Sector 10
Tourism 11
REAL ESTATE 12COMMERCIAL MARKET 12
HOTEL MARKET 13
INDUSTRIAL MARKET 13
HOUSING MARKET 14
RECENT TRENDS AND ISSUES 16
POPULATION CHARACTERISTICS 18POPULATION AND RACIAL DISTRIBUTION 18
EDUCATIONAL ATTAINMENT 19
AGE 19
DAYLONG POPULATION AND COMMUTING PATTERNS 20
INCOME & POVERTY 20
CRIME 20
APPENDIX 211. EMPLOYMENT IN BOSTON; 1970-1998 22
2. BOSTON’S LARGEST PRIVATE EMPLOYERS 23
3. NATIONAL INSTITUTES OF HEALTH RESEARCH GRANTS 24
4. HOUSING DATA 25
5. POPULATION OF BOSTON 26
6. SOURCES OF DATA 27
7. OTHER SOURCES 28

L I S T O F F I G U R E S
FIGURE 1. BOSTON'S MODERN SERVICE ECONOMY BEGAN WITH THE OPENING OF THE PRUDENTIAL TOWER IN 1965. 4
FIGURE 2. THE NUMBER OF JOBS IN BOSTON IS AT AN ALL-TIME HIGH. 4
FIGURE 3. SIX YEARS OF GROWTH HAS PUSHED UNEMPLOYMENT TO A RECORD LOW. 5
FIGURE 4. F.I.R.E AND SERVICE JOBS ACCOUNT FOR A GROWING SHARE OF BOSTON'S EMPLOYMENT. 5
FIGURE 5. THE SECURITIES INDUSTRY IS DRIVING GROWTH IN THE F.I.R.E. SECTOR. 6
FIGURE 6. HEALTH CARE AND PROFESSIONAL AND BUSINESS SERVICES COMPRISE NEARLY 70 PERCENT OF THE SERVICE SECTOR. 7
FIGURE 7. EMPLOYMENT IN HEALTH CARE GROWS STEADILY WHILE PROFESSIONAL AND BUSINESS SERVICES ARE MORE VOLATILE. 7
FIGURE 8. BOSTON IS THE NATION'S LEADER IN NIH RESEARCH GRANTS WITH $760 MILLION IN 1997. 8
FIGURE 9. MANUFACTURING JOBS HAVE HELD STEADY SINCE 1992. 9
FIGURE 10. EMPLOYMENT IN BOSTON'S RETAIL ESTABLISHMENTS IS STRONG WHILE WHOLESALE TRADE LAGS BEHIND. 10
FIGURE 11. TOURISTS AND BUSINESS TRAVELERS ARE KEEPING BOSTON'S HOTELS FULL. 11
FIGURE 12. STRONG DEMAND FOR HOTEL ROOMS PUSHES THE AVERAGE DAILY ROOM RATE TO NEW HIGHS. 11
FIGURE 13. BOSTON'S OFFICE MARKET IS THE STRONGEST IN NATION. 12
FIGURE 14. CLASS A VACANCY RATES ARE AT HISTORIC LOWS. 12
FIGURE 15. ONLY 820,000 SQUARE FEET OF OFFICE SPACE HAVE BEEN ADDED SINCE 1992. 12
FIGURE 16. RENTS IN BOSTON ROSE ON AVERAGE 64 PERCENT FROM 1995 AND 1998. 14
FIGURE 17. HOME SALE PRICES INCREASED 15 PERCENT FROM 1997 TO 1998. 14
FIGURE 18. RENTERS OCCUPY MUCH OF BOSTON'S HOUSING STOCK. 15
FIGURE 19. HOUSING PRODUCTION HAS BEEN SLOW IN BOSTON SINCE THE RECESSION. 15
FIGURE 20. HOUSING UNITS ARE INCREASING WHILE POPULATION HAS DECLINED OVER THE PAST 40 YEARS. 16
FIGURE 21. MORE BOSTONIANS SPEAK A LANGUAGE OTHER THAN ENGLISH AT HOME. 18
FIGURE 22. THIRTY PERCENT OF BOSTON'S RESIDENTS HAVE A COLLEGE DEGREE AND FIFTY PERCENT HAVE SOME COLLEGE. 19
FIGURE 23. BOSTON'S COLLEGES AND UNIVERSITIES GIVE THE CITY A YOUNG POPULATION. 19
FIGURE 24. BOSTON'S PER CAPITA INCOME IS HIGHER THAN THE NATIONAL AVERAGE. 20
L I S T O F T A B L E S
TABLE 1. MOST OF THE HOUSING IN BOSTON WAS CONSTRUCTED BEFORE 1939. 15
TABLE 2. THE NUMBER OF RENTAL UNITS IN BOSTON IS DECREASING. 17
TABLE 3. BOSTON'S POPULATION IS BECOMING MORE DIVERSE. 18
TABLE 4. U.S. IMMIGRANTS COMPRISE ABOUT ONE-FIFTH OF BOSTON'S POPULATION 18
TABLE 5. BOSTON”S CRIME RATE IS DECLINING. 20

The City of Boston has always been central to the nation'shistory and its economy. Whether trading tea in the 17thcentury or mutual funds in the 20th century, Boston grewby being a leader in the industries that allowed the UnitedStates to prosper. Industries such as printing and publish-ing, finance, education and health care have been integralparts of the city's economy for centuries. Others, such ascomputers, bio-technology, and tele-communications aremore recent additions that were pioneered here.
Early Economic History of Boston - ATradition of Innovation
Immediately upon Boston's founding in 1630, enterprisingBostonians began to build a city around a port. Industrieswere created to respond to area needs, and innovationsabounded. That tradition of innovation has consistentlycontinued in Boston, making it the city it is today. Briefdescriptions of the city's early history and the major indus-tries of that time follow.
Geograhpy
Boston's geography was key to its development as a com-mercial center. The city's harbor and its position at themouth of three rivers extending inland made Boston anideal location for trade. Boston became the capital of theMassachusetts Bay Colony and the commercial hub ofNew England. By the 1720's, Boston already looked likea city.
After the Revolutionary War, Boston's new governmentbegan to plan for the development of the city. WroteLawrence Kennedy in his book Planning a City on a Hill,"acutely aware of what they were about, [Boston's leadersand developers] created much of the Boston we knowtoday. That these men achieved so much was inevitable;that they did it so well was not."
In the 1800's Boston's population grew significantly, as didits geographic area. Boston's physical expansion hap-pened in three different ways. First, residential areasspread as population increased. Second, large portions ofthe city were man-made, as harbors, mudflats, channelsand rivers were filled in with land from hills that werequarried or with fill from the suburbs brought in by rail.These man-made areas included the Back Bay, the SouthEnd, most of East Boston and a large portion of SouthBoston. Third, Boston also grew by annexing immediate-ly adjacent towns, including Brighton, Charlestown,Dorchester, Roxbury, and West Roxbury. Hyde Park wasthe last town to be annexed, in 1912.
Trade
By 1740, the entire region looked to Boston for trade. Thecity found its niche not in agriculture or manufacturing,but in the packaging, purchasing and selling of the goods
of other areas. After the Revolution, when trade with theBritish declined, enterprising Bostonians established tradewith ports all around the world. By the late 1700's, Bostonhad become the premier shipping and trading port in NorthAmerica, with a volume of trade four times that of NewYork. As the shipping industry evolved, it was outgrow-ing Boston's inner harbor. In the 1830s, merchants beganto use the waterfronts of South Boston and East Boston fortrade and other maritime activities such as shipbuildingand fishing.
Boston's trading role not only established the city as one ofthe major centers of commerce in the U.S., but alsobrought for many Bostonians substantial wealth whichwould be used to fund burgeoning industries in Boston andelsewhere.
Finance and Insurance
Substantial personal fortunes earned from the trade indus-try combined with the entrepreneurial spirit of earlyBostonians made Boston a major source of investmentcapital in the nation's early days. It was Boston investorswho provided much of the funding for the building of rail-roads across the country. In addition, the AmericanTelephone and Telegraph Company (AT&T) and GeneralElectric are among the corporations that started up withBoston money and Boston management.
Boston's finance sector arose not only as a way of invest-ing wealth earned from trade, but also as a way to supportthe city's trade industry. The Massachusetts Bank,Boston's first bank, opened its doors in 1784 and was cre-ated to support trade activities. The bank was the secondin the nation, and it evolved into BankBoston of today.Other banks soon sprung up on State Street, which wasnear the city's port. The State Street area continues to bethe heart of the city's financial community today.
Boston traders had initially been dependent on Britishunderwriters to mitigate the risk of losing a ship or itscargo. But soon they realized that a more local source ofunderwriting would allow Bostonians to hold on to moreof their profits, and would also allow more Bostoniansaccess to insurance. Three years after the first Americanunderwriting occurred in Philadelphia, a notary opened aninsurance office in Boston. Over the years, the practice ofunderwriting became more sophisticated and grew toencompass other ventures, such as fire insurance for ahome. By 1842, over 40 banks and insurance companieswere located in Boston.
Manufacturing
Until the mid 1800's, the city of Boston was primarilyengaged in trading activities. Boston's manufacturing sec-tor before 1810 consisted mostly of small family-ownedshops. Mechanized manufacturing was located in towns at
1

the outskirts of the city, many of which later became partof the city, such as Charlestown, Dorchester and Roxbury.
Like other Boston industrial sectors, Boston's manufactur-ing sector developed in large part out of a desire to be lessreliant upon England. America had little manufacturing inits early years, and was dependent on England for cloth.Strained relations between the two countries in the early1800s caused dire shortages of cloth in America.Bostonian and cotton importer Francis Cabot Lowell trav-eled to Britain to learn British textile manufacturingsecrets, then returned home to establish the BostonManufacturing Company. In 1814, the company's firstmill opened in Waltham. Its tremendous success resultedin the company's expansion, through the now famousLowell model of industrial towns located along theMerrimac River Valley and was led from Boston.
Publishing
Boston, along with New York and Philadelphia, was oneof the major U.S. publishing centers from the late 1700s tothe mid 1800s. Its role as a center of information was anatural outgrowth of its role as a center of activity.Printers were located near the old Massachusetts StateHouse, to be nearer to important news such as ship sched-ules and legislative decisions, as well as to provide docu-ments for government use. The area on Washington Streetwhere the printers were located earned the labels"Publisher's Row" and "Newspaper Row."
Publishing, at this time, played a central role in the city'seconomy. It accounted for nearly one in ten manufactur-ing firms in 1832. The publishing industry was the city'sfourth largest employer, after dry goods, nautical suppliesand metalworking. More money was invested in publish-ing machinery than in machinery for any other city-basedbusiness. And forty-two percent of all city investment wasin publishing capital.
With the onset of industrialization, publishers movedaway from Publisher's Row. Bookstores moved downWashington Street to Downtown Crossing. Presses movedto huge factories in South Boston and Hyde Park. And inthe late 1950's, Boston's two largest daily newspapersmoved to sites which had more space -- the Boston Globemoved to Dorchester and the Boston Herald moved to theSouth End.
Health Care
Boston's role as a center of commerce evolved into its roleas the place to which New Englanders looked for healthcare. While doctors could be found scattered around NewEngland, many got their training in Boston, and seriousprocedures were performed in the city's hospitals. Theclustering of hospitals and medical schools in the citywould continue, and today people in the region, the nation,
and the world continue to look to Boston for cutting-edgehealth care.
Many of America's medical firsts occurred in Boston.From 1731, when the first public smallpox inoculationswere given in Boston and 1799, when America's firstBoard of Health was established, the city has consistentlybeen a major contributor to and at the forefront of thehealth care and medical research industry. Other medicalfirsts which took place in Boston include:
· the introduction of insulin to the U.S.;
· the invention of the iron lung;
· development of the external cardiac pacemaker;
· development of artificial skin;
· the first successful kidney transplant;
· first use of electric current to restore the heart’s rhythm
· discovery of the gene for Alzheimer's disease; and
· the first cartilage transplant surgery in the U.S.
Education
Boston's strong education sector dates back to the earliestdays of America. Boston Latin School, founded in 1635,was the first public school in the colonies. The MatherSchool in Dorchester, founded in 1639, was the first pub-lic elementary school, and Boston English High School,founded in 1821, was the first public high school. Acrossthe river in Cambridge, Harvard College became the firstpost-secondary school when it was founded in 1636. Inthe 19th century, Horace Mann began the modern educa-tional reform movement in Boston.
Many of the country's education "firsts" happened inBoston because Bostonians place a high value on educa-tion. So many schools, colleges and universities sproutedup in the city that Boston became known as the "Athens ofAmerica." Entering the 21st century, Boston retains itspreeminence as an intellectual center, attracting peoplefrom around the country and around the world to its insti-tutions of higher education.
Tourism
Boston's rich history stems largely from its role as a criti-cal site in the Revolutionary War and the strong role it hasplayed in the nation's commerce and culture from colonialtimes to today. Boston's leaders and citizens take greatpride in the city's history, and have taken great pains topreserve that history and share it meaningfully with theworld. People come from all over to visit Boston's impor-tant historical sites, such as Bunker Hill, the U.S.S.Constitution, the Boston Tea Party Ship, and the Old NorthChurch. They also appreciate the many historical build-
2

ings and parks which have been preserved by the city.
While Boston's rich history is the foundation upon whichthe tourist industry is built, the city also draws people withvibrant attractions and events rooted equally in the pres-ent. For example, historic Faneuil Hall Marketplace is thesecond most popular shopping center in the larger metro-politan area. The Boston Marathon, over 100 years old,continues to draw large numbers of runners and onlookers.Boston is also the home of the John F. KennedyPresidential Library and Museum, which honors one of themost recent in a long line of Bostonians who made animpact on the nation.
The Post-War Transition to Finance andProfessional Services
In the years immediately following the Second World War,both population and investment began to flow out ofBoston into its suburbs, a trend seen in nearly everyAmerican urban center during this era. Boston's popula-tion peaked in 1950 at 801,444 people but by 1970 thepopulation was down to 641,071. Over the same periodthe rest of the SMSA grew from 1.62 million to 2.26 mil-lion. This suburbanization was largely the result of high-ways such as the Massachusetts Turnpike, Central Arteryand Rt. 128 during the fifties and I-495 ring in the sixties.Federal policies such as the FHA mortgage subsidies, andincome tax laws that tended to favor suburban over urbanpolitical jurisdictions also contributed to this explosivegrowth in the suburbs.
Boston's job base also declined as the suburban ring'sincreased. In 1947 the city had 561,854 jobs. By 1963there were only 536,986 jobs in Boston, while employ-ment in the suburban ring grew by 97,321 jobs from595,330 in 1958 to 692,651 in 1963. Clearly, the region'seconomic growth was occurring in the suburban ringwhere there was easy Interstate Highway access and lessexpensive land. Furthermore, the manufacture and distri-bution of goods became dependent upon easy highwayaccess rather than access to rail or port facilities, makingBoston a less desirable location for what had once been itsdominant economy.
To replace its shrinking industrial base the city needed toconvert itself into a center of the service and finance basedeconomy that was beginning to emerge nationwide. Theconcentration of world-class colleges and universitiesmade the city a logical choice for the industries that wereto eventually locate here. However, there were hurdles tothe development of the needed office space. Most signif-icant was the city's tax structure making the developmentand ownership of office buildings in Boston a risky andexpensive endeavor.
The expansion of Chapter 121A in 1960 by the StateLegislature enabled the city to give tax breaks on com-mercial office projects. This legislation encourageddevelopment by allowing the city to share the financialrisk of large commercial projects. The first application ofthis law was the construction of the Prudential Center.The Prudential Center and other office buildings that fol-lowed enabled the city to attract and capture the profes-sional service and finance jobs that were to become thestaples of Boston's economy. From 1947 to the comple-tion of the Prudential Tower in late 1964 only 27,745 jobsin the services and F.I.R.E. sectors were created in Boston.In the four years following the completion of the Prualmost 32,000 services and F.I.R.E. jobs were added (SeeFigure 1.) In 1947 such jobs comprised barely a quarter of
3

Boston's jobs; in 1968 services and F.I.R.E. jobs made up35 percent of the total jobs and today over 60 percent ofthe jobs in Boston are in these sectors.
Figure 1. Boston's modern service economy beganwith the opening of the Prudential Tower in 1965.
The Modern Era
The economy that has emerged is currently one of thestrongest in the nation. Boston has completed its shift toa service based economy and, as a result, has high con-centrations of professional service and finance jobs.Education and health care, traditionally associated withBoston, have continued to flourish in the city while bluecollar jobs in manufacturing, wholesale trade and trans-portation, communications and public utilities (T.C.P.U.)also remain available. Tourism continues to strengthenthe city's hotel, retail and restaurant industries.
Boston’s place in the region
Today, Boston is the center of New England's economy, itsimportance to the region shown by its role as a generatorof jobs and tax revenues. Although Boston accounts foronly 9.5 percent of the state's population, Boston accountsfor 17 percent of the state's jobs, 22 percent of total goodsand services in the state, and nearly 18 percent of thestate's tax revenues. Similarly, the city's economic impactis felt throughout the region as nearly one out of every 13jobs in New England is in Boston. As home to so many ofthe region's important public and private institutions andagencies, Boston also serves as the educational, medical,cultural, and governmental center of the region. Clearly,Boston is a sizable portion of the regional economy andcontributes substantially to that of the nation's.
Figure 2. The number of jobs in Boston is at an all-timehigh.
Boston's economy has fluctuated with the nation's and restof New England's, often preceding the region into reces-sion or leading the region into a period of recovery andgrowth. Boston's business cycles are also more pro-nounced than the region's and the nation's in terms of dura-tion and employment showing dramatic job growth andprosperity in good times and deeper unemployment in
4
450,000
500,000
550,000
600,000
650,000
700,000
518,513
643,615
576,304
671,023
-
20,000
40,000
60,000
80,000
100,000
120,000
140,000

periods of slow economic activity. For example, with theexception of the 1980-1982 recession, the number of jobsin Boston began to drop in absolute terms the year beforea nationwide recession and did not begin to rise until ayear after the national downturn was over (See Figure 2.)
Conversely, the Boston unemployment rate was up tothree percentage points lower than in the boom years ofthe 1980s. From 1989 to 1995 the city's unemploymentrate was lower than the state's, in contrast to previoustrends. From 1995 to 1998, the unemployment rate inBoston was higher than the state's (See Figure 3.)
Employment
The number of jobs in Boston peaked in 1969 at 564,906after which the city entered into a seven year recessionlasting from 1970 to 1976. In 1976, the lowest year of therecession, there were 518,513 jobs, a loss of over 46,000jobs from 1969.
In 1977 the number of jobs in the city began to rise andemployment numbers had reached their 1969 levels by1981. Employment held steady at this level until 1983,setting the stage for the so-called "MassachusettsMiracle," a six-year period of phenomenal growth andprosperity. Between 1983 and 1988, employment grew atan annual rate of 2.3 percent to 643,615; an addition of68,000 new jobs.
Figure 3. Six years of growth has pushed unemploy-ment to a record low.
The most recent recession began in 1989, spurring a seriesof annual job losses that totaled 67,000 jobs by 1992. Thisloss represented over 10 percent of the total labor force,the largest decline of the last three decades. Nevertheless,in 1992, the lowest point of the recession, the 576,304 jobsin Boston were still more than in the peak years of the1960s and 1970s.
The recession also caused unemployment to hit a nine-year high of 8.4 percent in 1991. The drop in unemploy-ment in 1992 was not due to a recovery in the number ofjobs but more likely due to the combination of peoplemoving out of the city and others stopping their search foremployment.
Real estate development slowed resulting in no new majorconstruction after 1992. Downtown office vacancy ratessoared to 17.1 percent in 1991, up from 5.2 percent justfour years earlier.
Since 1993, following a nationwide recovery, Boston hasadded over 89,000 jobs and grown at an annual growthrate of 2.4 percent to 665,401 jobs, a record high. Theservice and financial sectors have been particularly strongduring this growth period prompting developers to beginthe development process of new office towers in theFinancial District, Back Bay and the South BostonWaterfront.
As of 1997, Boston had regained all the jobs lost duringthe latest recession, but there has been a structural change.Boston's economy is relying less upon manufacturing andindustrial jobs in favor of white collar, knowledge basedjobs, such as financial services, health care and other pro-fessional and business service industries.
Figure 4. F.I.R.E and Service jobs account for a grow-ing share of Boston's employment.
This change is occurring rapidly. At the time of 1988peak, the service sector comprised 40.5 percent of the totaljobs in Boston. By 1998, the service sector had grown toinclude just over 46 percent of all Boston jobs. In contrast,manufacturing jobs dropped from 5.3 percent to 4.4 per-cent over the same period (See Figure 4). Within the serv-ice sector, professional and business services and healthcare grew rapidly since the 1992 employment trough,adding a combined 41,068 jobs or 79 percent of the serv-ice sector growth from 1992 to present. Retail and educa-
5
0.0%
2.0%
4.0%
6.0%
8.0%
10.0%
12.0%
1980
1982
1984
1986
1988
1990
1992
1994
1996
1998
U.S. City PMSA
0
100 ,000
200 ,000
300 ,000
400 ,000
500 ,000
600 ,000
700 ,000
1 9 7 0 1 9 8 0 1 9 8 8 1 9 9 2 1 9 9 8
Gove rnmen t
S e r v ic e s
F.I.R.E.
T rade
T.C.P.U.
Manu fac tu r i ng
Other

tion continue to be strong while the government sector hasyet to regain its losses since the recession.
Finance, Insurance, and Real Estate (F.I.R.E.)
The finance, insurance and real estate industries encom-pass some of the largest employers within the City ofBoston. Fidelity Investments (FMR Corporation)employs over 8,000 people in the city, most of them in theFinancial District. BankBoston employs many of its 5,400Boston workers downtown as well. Two insurance giantsfind homes in Boston as well; Liberty Mutual and JohnHancock Mutual Life Insurance Company. Each of thesecompanies employs approximately 4,500 people. TheF.I.R.E. sector lost 19,747 jobs in Boston between 1988and 1992, more than any other sector, but has regained allof these jobs and now employs 104,961 people in 1998.Phenomenal growth in securities and brokerage industriesshould continue to drive growth in the finance sector (SeeFigure 5.)
Figure 5. The securities industry is driving growth inthe F.I.R.E. sector.
Security and brokerage services are the fastest growingindustries in the F.I.R.E. sector, mostly due to the popular-ity of mutual funds. In 1970 7,551 people worked in secu-rities comprising less than 10 percent of the F.I.R.E. indus-try in terms of employment. Today, at 44,925 jobs, it is thelargest and has been since 1992 and makes up 43 percentof the F.I.R.E. industry. Boston continues to be a globalfinancial center as nearly one in twelve of the nation'ssecurities jobs are in Boston and the city recently sur-passed Tokyo to trail only New York City and London ininstitutional assets managed.
Within the City of Boston, the mutual funds industry gen-erates $3.2 billion in payroll and supports employmentgrowth in producer and business services industries such
as telecommunications, computer technology, printing,advertising, law, and accounting.
Earnings for those employed in the securities sector arehigh. The average income for financial services workersis $68,515, over double the median per capita income inBoston.
The Mutual Fund Tax Legislation changed the corporatetax structure for mutual fund service corporations operat-ing in Massachusetts. The new law calls for taxes to belevied only on sales to investors who are Massachusettsresidents. In addition, the tax law simplified the corporatetax by basing the levy exclusively on sales revenue.
Boston's banking industry has followed national trendsof reducing employees because of mergers, the prolifera-tion of ATMs and other automated functions.Technological changes have accelerated the Boston jobloss in this industry sector because many back office func-tions can be moved into the suburbs where rent is oftenless. Nevertheless, Boston remains one of the nation'sleading banking centers.
Employment in the insurance industry continues todecline as insurance needs and practices change. Themost recent figures indicate 22,552 people work in theinsurance industry in Boston. Insurance companies nowoperate more like security trading and brokerage firmsthan they did in the past. For example, the AmericanCouncil of Life Insurance reports life insurance companieshad 63 percent of their reserves backing life insurance.They had less than 30 percent of their reserves for this pur-pose in 1995. By 1995, two thirds of life insurance com-panies' reserves were invested in group and individualannuities.
The number of employees in real estate and other relatedindustries has been increasing slowly since the employ-ment low in 1992, employing 14,573 people, up over2,600 since 1992.
Service Sector
The service sector in Boston has been fastest growingindustry in the last 25 years. In 1970 there were 145,080service sector jobs, representing just over one-quarter ofthe total job market. Today there are 309,008 service jobs,or 46 percent of all the jobs in Boston. While it is true thatthe services industries were the largest employment sectorin 1970, there were other sectors employing nearly asmany people such as Trade and Finance, Insurance andReal Estate (F.I.R.E.). Today the next largest sector,F.I.R.E., is barely a third the size of the service sector.
The service sector is large and varied. It encompasseslawyers, health care providers, teachers, accountants,architects, consultants, barbers, janitors and hotel workers.
6
0
10 ,000
20 ,000
30 ,000
40 ,000
50 ,000
1 9 7 0 1 9 8 0 1 9 8 8 1 9 9 2 1 9 9 3 1 9 9 4 1 9 9 5 1 9 9 6 1 9 9 7 1 9 9 8
Bank ing S e c u r ities In s u r a n c e Rea l es ta te
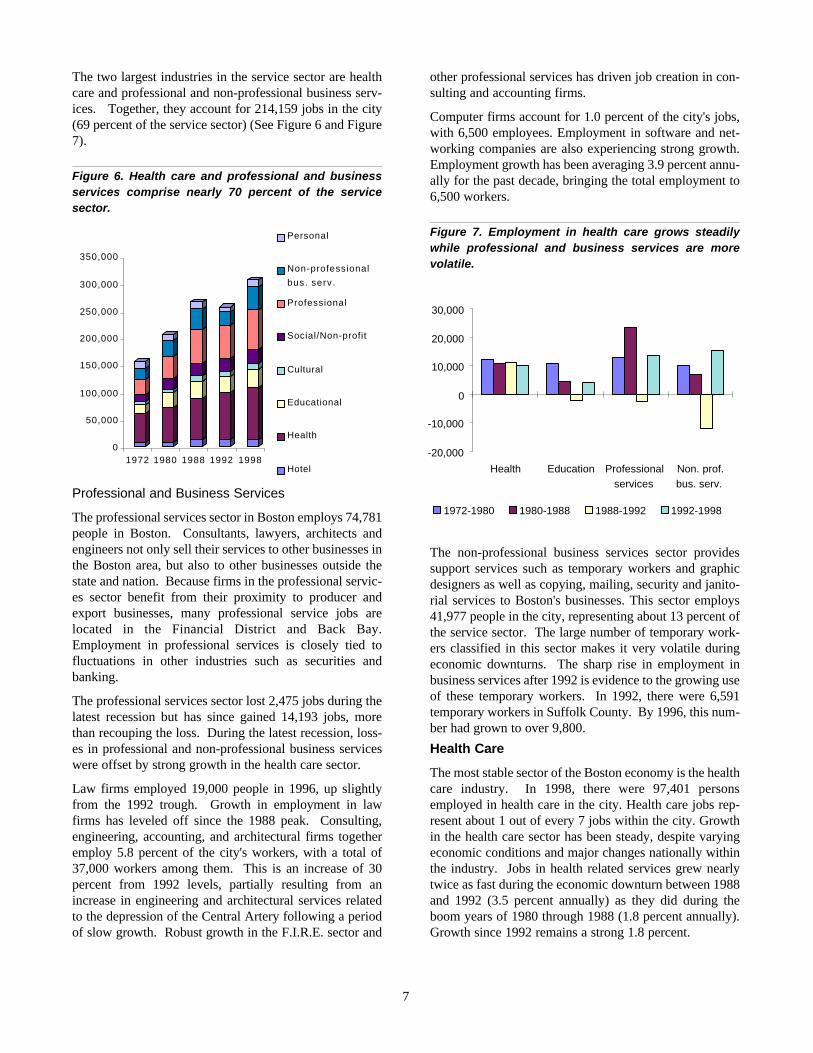
The two largest industries in the service sector are healthcare and professional and non-professional business serv-ices. Together, they account for 214,159 jobs in the city(69 percent of the service sector) (See Figure 6 and Figure7).
Figure 6. Health care and professional and businessservices comprise nearly 70 percent of the servicesector.
Professional and Business Services
The professional services sector in Boston employs 74,781people in Boston. Consultants, lawyers, architects andengineers not only sell their services to other businesses inthe Boston area, but also to other businesses outside thestate and nation. Because firms in the professional servic-es sector benefit from their proximity to producer andexport businesses, many professional service jobs arelocated in the Financial District and Back Bay.Employment in professional services is closely tied tofluctuations in other industries such as securities andbanking.
The professional services sector lost 2,475 jobs during thelatest recession but has since gained 14,193 jobs, morethan recouping the loss. During the latest recession, loss-es in professional and non-professional business serviceswere offset by strong growth in the health care sector.
Law firms employed 19,000 people in 1996, up slightlyfrom the 1992 trough. Growth in employment in lawfirms has leveled off since the 1988 peak. Consulting,engineering, accounting, and architectural firms togetheremploy 5.8 percent of the city's workers, with a total of37,000 workers among them. This is an increase of 30percent from 1992 levels, partially resulting from anincrease in engineering and architectural services relatedto the depression of the Central Artery following a periodof slow growth. Robust growth in the F.I.R.E. sector and
other professional services has driven job creation in con-sulting and accounting firms.
Computer firms account for 1.0 percent of the city's jobs,with 6,500 employees. Employment in software and net-working companies are also experiencing strong growth.Employment growth has been averaging 3.9 percent annu-ally for the past decade, bringing the total employment to6,500 workers.
Figure 7. Employment in health care grows steadilywhile professional and business services are morevolatile.
The non-professional business services sector providessupport services such as temporary workers and graphicdesigners as well as copying, mailing, security and janito-rial services to Boston's businesses. This sector employs41,977 people in the city, representing about 13 percent ofthe service sector. The large number of temporary work-ers classified in this sector makes it very volatile duringeconomic downturns. The sharp rise in employment inbusiness services after 1992 is evidence to the growing useof these temporary workers. In 1992, there were 6,591temporary workers in Suffolk County. By 1996, this num-ber had grown to over 9,800.
Health Care
The most stable sector of the Boston economy is the healthcare industry. In 1998, there were 97,401 personsemployed in health care in the city. Health care jobs rep-resent about 1 out of every 7 jobs within the city. Growthin the health care sector has been steady, despite varyingeconomic conditions and major changes nationally withinthe industry. Jobs in health related services grew nearlytwice as fast during the economic downturn between 1988and 1992 (3.5 percent annually) as they did during theboom years of 1980 through 1988 (1.8 percent annually).Growth since 1992 remains a strong 1.8 percent.
7
0
50,000
100,000
150,000
200,000
250,000
300,000
350,000
1972 1980 1988 1992 1998
Personal
Non-professional
bus. serv.
Professional
Social/Non-profit
Cultural
Educational
Health
Hotel
-20,000
-10,000
0
10,000
20,000
30,000
Health Education Professionalservices
Non. prof.bus. serv.
1972-1980 1980-1988 1988-1992 1992-1998

Hospitals still retain the a strong presence in Boston'shealth care industry, but the national trend toward HealthMaintenance Organizations (HMOs), downsizing andmergers with other facilities has been felt here. Twenty-six in-patient hospitals are currently located within the citylimits, including Beth Israel Deaconess Hospital, BostonMedical Center, Brigham and Women's Hospital,Children's Hospital, Massachusetts General Hospital, andthe New England Medical Center. Five years ago, therewere 30 hospitals, today there are 26 totaling over 4,600beds. MGH is the largest employer in the city, employing11,415 workers. The city also has approximately 34 long-term care facilities, 1 hospice and 14 rest homes andnumerous private practices. Boston is also home to theHarvard, Tufts and Boston Universities' medical and den-tal schools and twenty-five neighborhood health clinics,not including health maintenance organizations and mem-bership clinics.
Figure 8. Boston is the nation's leader in NIH ResearchGrants with $760 million in 1997.
Health Maintenance Organizations (HMOs) are becominga major employer in Boston. Harvard/Pilgrim Health Planis the city's 20th largest employer with 2,375 employees.Other HMOs are headquartered in Boston and providehealth care throughout the state. Latest figures show11,188 people working in SIC 801 titled, "Offices andClinics of Medical Doctors" (where HMOs are classified)in Suffolk County. This is up from 8,455 three years priorand 3,793 ten years prior. The number of establishmentsunder this classification with 100 or more employees wentfrom two in 1985 to 22 in 1995.
Boston's health care industry does more than provide firstrate medical care to the populace, it is a major source ofemployment and funding. In 1994, when it surpassed NewYork City, Boston became the leading city in the nation inreceiving National Institute of Health (NIH) funds. It has
been the nation's leader ever since then. By 1997, Bostonwas receiving $760 million, $63 million more than NewYork. If the Longwood Medical Area were ranked sepa-rately, it would rank just ahead of Philadelphia, claimingthe number four spot in the nation in terms of NIH fund-ing (See Figure 8.) These research grants have helped thecity's hospitals add over 1.3 million square feet of researchspace in the past 8 years.
Education
The city's 35 universities, colleges and community col-leges had a combined enrollment in fall 1997 of 135,530.In addition, graduate schools of Harvard University andTufts University, whose graduate schools are in Boston,enrolled 5,098 students in the city in 1997. The studentsenrolled in Boston universities contribute between $3.1billion and $3.4 billion to the Boston economy, accordingto the Association of Independent Colleges andUniversities. Based on total graduate and undergraduateenrollment, Boston University is the largest university inBoston, with 29,387 students in 1996.
Latest figures show that 33,268 people work in the city'sprivate elementary and high schools and colleges and uni-versities. The city's public school employees and workersat the two public community colleges and one public uni-versity are counted under the public sector for statisticalpurposes. Private school employment represents 10.8 per-cent of the jobs in the service sector. Employment in theeducation sector dropped by 2,116 jobs during the latestrecession but has regained almost twice that amount sincethe recession.
The economic impact of the educational institutionsextends well beyond the number of people directlyemployed by the sector. Boston area colleges and univer-sities are a source of new highly skilled professionals andinnovation. According to the Massachusetts Institute ofTechnology, although only 10% of its enrollees over thedecade of the 1980s were from the Boston area, 24%remained in the area after graduation, helping to attractfirms needing highly educated workers. The intellectualcapital also creates job opportunities for theCommonwealth and the city. According to a BankBostonstudy, firms founded by MIT graduates employ 125,000people in the state (5 percent of total) and comprise 10 per-cent of the state's economic base.
The high concentration of intellectual capital has attractedventure capitalists to Boston. Venture capital firms con-tributed over $1.2 billion to New England companiesenabling entrepreneurs to create new businesses, jobs andopportunities. National Science Foundation (NSF)research and development funding to Boston's universitiestotaled $17.3 million, augmenting the NIH grants to hos-pitals. Massachusetts is now the second largest recipientof venture capital, trailing only California.
8
$ -
$ 1 0 0 , 0 0 0 , 0 0 0
$ 2 0 0 , 0 0 0 , 0 0 0
$ 3 0 0 , 0 0 0 , 0 0 0
$ 4 0 0 , 0 0 0 , 0 0 0
$ 5 0 0 , 0 0 0 , 0 0 0
$ 6 0 0 , 0 0 0 , 0 0 0
$ 7 0 0 , 0 0 0 , 0 0 0
$ 8 0 0 , 0 0 0 , 0 0 0
1981
1983
1985
1987
1989
1991
1993
1995
1997

Boston has ranked in Fortune Magazine's top 10 cities listfour out of the last six years, including 1993's TopKnowledge Workers. In 1997, Boston distinguished itselfas the third most improved city, in 1995, the city ranked asthe fifth best city to live and work and in 1992 it wasawarded the ninth best city for international business.Fortune cited the concentration of colleges and universi-ties, the presence of knowledge-based firms and the highlevel of educational attainment as one of the prime reasonsfor these awards.
Other Services
Other service sector industries do well in Boston. Thehotel industry employs 12,430 people, down from the1990 peak of 13,380 but occupancy and room rates arenear historic highs. Increased demand due to the soon tobe built Boston Convention and Exhibition Center isspurring the development of new hotels, creating morejobs in this sector. The BCEC is also expected to improvedemand for cultural and entertainment services, currentlyemploying 10,789 people in the city.
Manufacturing
The manufacturing industry is important to Boston's econ-omy because it diversifies the economy, produces goodsfor export to domestic and foreign markets and employs awide range of skilled and unskilled workers within thecity. Many jobs in the popular, growing industries such asfinance, bio-tech and software development requireadvanced degrees. Manufacturing jobs, while usuallyrequiring special training and skills, often do not requireformal education beyond high school, giving those with-out college degrees more well paying employment oppor-tunities. Manufacturing jobs are more likely to be held byBoston residents than jobs in any other sector.
Boston has been able to maintain its manufacturing basesince the end of the last recession while the rest of NewEngland's employment in manufacturing has declinedslightly over the same period. The manufacturing sectorlost nearly 40,000 jobs since 1969, when it comprised 12percent of the total jobs in Boston. Much of this declineis attributable not only to less expensive rents outside thecity and development pressures on manufacturing siteswithin the city but also a national decline in manufactur-ing jobs due to increased productivity and overseas migra-tion of manufacturing jobs (See Figure 9).
The number of jobs in manufacturing has hovered around29,000 since 1992 despite the recent loss of jobs causedby the closing of the Digital Equipment plant in 1993 andStride Rite in 1997. Gillette is the largest manufacturingcompany in the city, employing 3,400 people of whichapproximately 1,200 are involved in manufacturing attheir South Boston plant.
Printing and publishing is the largest manufacturing sec-
tor, employing just over 10,000 people. This is up eightpercent since 1992. Boston food processors have alsogrown in employment over the last five years. Over 600new jobs have been created in this industry between 1991and 1996. Increases in food processing industry couldalso translate into gains for Boston's food wholesalers,especially in the Newmarket area where many of the foodrelated businesses are located. Employment in the manu-facture of durable goods has also remained relativelysteady. Employment in the manufacturing of plastic andrubber, electronic components, and transportation compo-nents has risen steadily in the last 5 years but has been off-set by losses in businesses engaged in paper and both pri-mary and fabricated metal production. Employment inchemical and apparel manufacturing has also declined.
Figure 9. Manufacturing jobs have held steady since1992.
The BRA, through its Economic and IndustrialDevelopment Corporation (EDIC) arm, has an active rolein the preservation and creation of manufacturing jobs.The EDIC acquired land in South Boston from theMassachusetts Land Bank in 1976 after the EconomicDevelopment Plan created a framework for the conversionof the Naval Annex, and later the South Boston ArmyBase, into the new Boston Marine Industrial Park (BMIP).The MIP is reserved primarily for industrial and marineuses. Over $40 million in public investments in the parkwhich has leveraged over $150 million in private invest-ment. Approximately 200 businesses, employing 3,500people, are currently located in the BMIP's 191 acres inbusinesses such as food processing, ship repair, seafooddistribution, light manufacturing, and importing. TheBRA also manages other smaller industrial parks. Withinthe city-owned industrial parks, the BRA is working tomaintain the number of blue collar jobs and the percent-age of these jobs held by Boston residents.
A report by Cognetics, Inc. listing U.S. high growth com-panies gives promising news for Boston. The top five"Gazelle" industries in terms of company growth weremanufacturing firms producing electrical components,rubber and plastics, primary metal products, paper prod-
9
0
10,000
20,000
30,000
40,000
50,000
60,000
70,000
1970
1980
1988
1992
1993
1994
1995
1996
1997
1998

ucts, and instruments. Boston currently has strong electri-cal component manufacturing and measuring, controllingand optical instrument manufacturing industries; eachemploying roughly 2,400 people in the city. The rubberand plastics industry is smaller in terms of employmentnumbers but has grown by 121 percent since 1991.Primary metal and paper products manufacturers, bothdemanding large amounts of electricity and water, havebeen leaving the city for several decades.
Trade
Job growth in the wholesale trade industry has laggedbehind the rest of the city's posted job gains. In 1970 therewere 42,630 jobs in wholesale trade. Today there are only16,610, up slightly from the 1994 low of 15,516. Despitethis slight gain it is clear that wholesale traders are leavingthe city for more accessible facilities in the suburbs wheremore large single-story facilities are available providingbetter access by truck for shipping and receiving (SeeFigure 10).
The Newmarket area has traditionally been Boston's foodwholesale area. The area lost some of its jobs as the fooddistribution industry shrank in Boston by 50 percent since1980. Today, the area is growing again with the uncer-tainty surrounding the failed Megaplex project resolvedand the Big Dig underway. One-half of the workers inNewmarket live in Boston, two thirds of those comingfrom South Boston, Dorchester, Roxbury, or the SouthEnd.
Figure 10. Employment in Boston's retail establish-ments is strong while wholesale trade lags behind.
Retail trade continues to do well in Boston. Latest figuresindicate that the number of retail jobs has surpassed thepre-recession level to now employ 65,397. Since 1974 thenumber of retail jobs has wavered but never exceeded65,480 (1984) and never dipped below 56,513 (1991).The retail market is partially fueled by the large resident
student population. Newbury Street remains Boston's pre-mier retail market and its trendy stores are tourist attrac-tions in their own right. The presence of a strong down-town retail market is both a cause and testament to thecontinued vitality of Boston. The Scarborough Reportlists Quincy Market/Faneuil Hall and Downtown Crossingas the second and third most popular shopping centers inthe Metropolitan area behind the Burlington Mall.
A good indicator of Boston's neighborhood investment isthe construction of nine new grocery stores in the past fiveyears plus two expansions of existing supermarkets.Recent additions to the downtown and the Back Bay retailmarket include Border's Books, HMV Records, Lechter's,Marshall's and Tello's, and Niketown. Home Depot hasopened a 114,000 square foot store in theDorchester/Roxbury area; the company's first establish-ment in an inner city.
Boston is the first city to have a citywide Main StreetsProgram to revitalize its historic neighborhood retail cen-ters. This program, a volunteer run program managed bythe National Trust for Historic Preservation, has been verysuccessful; creating 85 new businesses and almost 540new jobs. Five additional Main Street Districts wereadded in 1996, bringing the total to 15 and there are plansto add five more.
Boston's restaurants are a major source of funding for thestate, generating over $60 million (17 percent of theCommonwealth's total) in meal tax revenue. Students,tourists and residents frequent Boston's approximately1,700 restaurants. They also attract visitors from the sub-urbs, creating a vibrant street life in Boston's downtownand its neighborhoods and providing employment oppor-tunities for nearly 30,000 people.
Public Sector
Boston is both the capital of Massachusetts and the region-al capital for the federal government. As a result, manypublic sector jobs at all levels of government are locatedwithin the city limits. These government jobs includepublic school teachers and public safety personnel such asfire and police departments.
Between 1988 and 1992 the public sector lost 11,263 jobsin Boston. Only 3,607 of these jobs have been recoveredsince. Although this job loss occurred during a recession-ary period, the decline is more due to a nationwide trendof reducing the number of government employees after aperiod of hiring in the public sector. Beginning in 1985and continuing through 1988 the number of governmentjobs in Boston rose between 2.5 and five percent annually.In fact, the latest figure of 89,212 government jobs in 1998is still above the 83,563 average in the 10 years precedingthe recent spike in government employment beginning in1983. The job loss was fairly evenly distributed across allthree levels of government; federal, state and local.
10
0
20 ,000
40 ,000
60 ,000
80 ,000
100 ,000
1970
1980
1988
1992
1993
1994
1995
1996
1997
1998
W h o le s a le T rade Retai l Trade

Tourism
The tourist trade spans several industries including hotelservices, restaurants, retail, transportation, cultural eventsand entertainment services. Visitors bring outside moneyinto Boston and create demand for cultural and civicamenities that are enjoyed by city residents as well.
Figure 11. Tourists and business travelers are keepingBoston's hotels full.
According to the Greater Boston Convention and VisitorsBureau, an estimated 11.5 million people visited theBoston metropolitan area in 1998, up 11.7 percent fromthe 10.3 million visitors in 1995. These visitors, measuredas tourists, business travelers and convention and meetingdelegates who traveled at least 100 miles to get to the city,had an estimated total economic impact upon the Bostonmetropolitan area of approximately $7.1 billion in hotelaccommodations, meals, entertainment, shopping, trans-portation and other services during 1998.
The city provides a venue for concerts, ice shows, circus-es, plays, and other entertainment and sports events. Thecity is home to three major league sports franchises: theBoston Red Sox baseball team, the Boston Bruins hockeyteam and the Boston Celtics basketball team. The newFleetCenter, home to the Bruins and the Celtics, opened inSeptember, 1995. Other events such as the BostonMarathon and the Head of the Charles Regatta attract evenmore visitors to Boston.
The hotel industry employed 12,430 people in 1998, downfrom the 1989 peak of 13,422. This change is simply dueto organizational changes. For example, when a hotelrestaurant is handed over to an independent operator, thejobs in that restaurant are re-classified as restaurant jobs.Boston's hotels had an average occupancy rate of 78.6 per-cent in 1998. The shortage of hotel rooms reflected by thishigh occupancy rate causes many visitors to Boston to findlodging outside the city.
More hotel rooms will need to be constructed to meetfuture demand created in part by the construction of theBoston Convention and Exhibition Center in SouthBoston. The BRA's 2,000 by 2000 hotel plan calls for theconstruction of 2,000 hotel rooms by end of the year 2000.This plan will create many employment opportunities forthe city's residents as every two hotel rooms generate oneconstruction job for the duration of their construction, andonce completed every ten rooms provide nearly nine per-manent jobs.
Figure 12. Strong demand for hotel rooms pushes theaverage daily room rate to new highs.
In Boston, 838 hotel rooms were added between July 1997and the end of 1998. This brings the city's inventory ofrooms in major hotels (50 or more rooms) to 12,974.Another 1,274 rooms are scheduled to be completed in1999, resulting in a net increase of 761 keys after a sched-uled hotel closing.
The Boston Convention and Exhibition Center in SouthBoston will be completed in 2003 with 600,000 squarefeet contiguous exhibition space enabling the city toattract major conventions and trade shows bringing morevisitors to the city.
11
6 0 . 0 %
7 0 . 0 %
8 0 . 0 %
9 0 . 0 %
1991
1992
1993
1994
1995
1996
1997
1998
Occ
upan
cy R
ate
$100.00
$120.00
$140.00
$160.00
$180.00
$200.00
Real Estate
Commercial Market
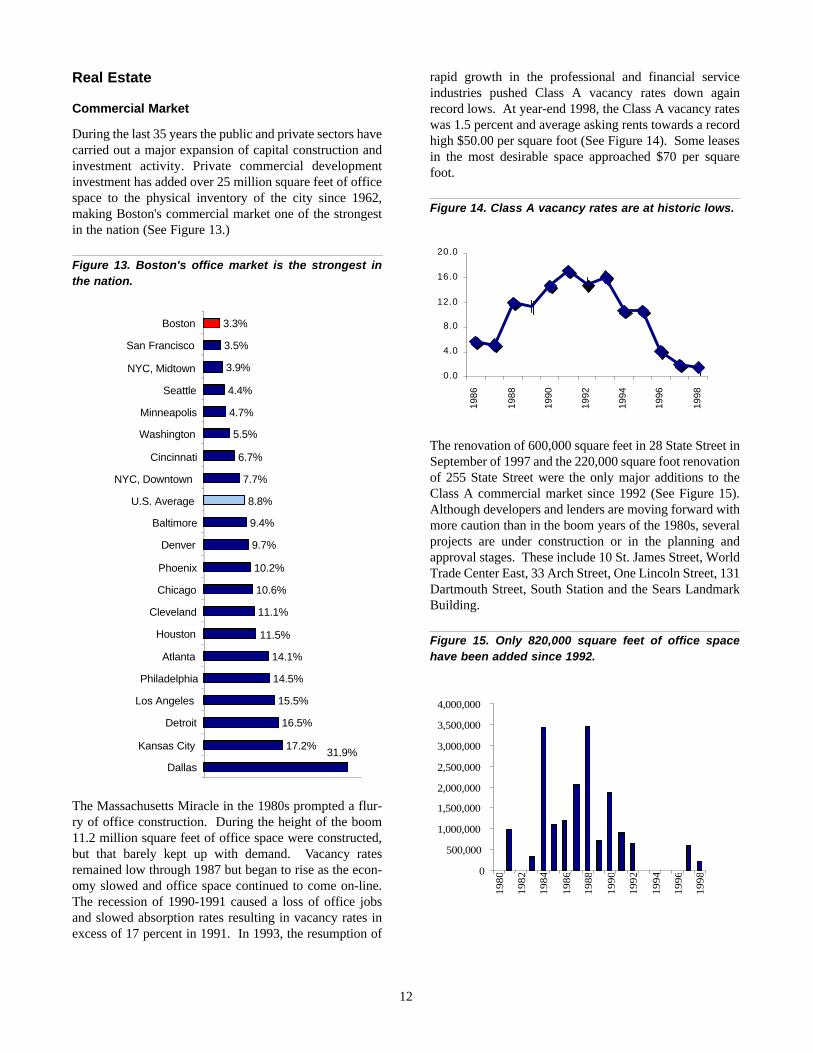
During the last 35 years the public and private sectors havecarried out a major expansion of capital construction andinvestment activity. Private commercial developmentinvestment has added over 25 million square feet of officespace to the physical inventory of the city since 1962,making Boston's commercial market one of the strongestin the nation (See Figure 13.)
Figure 13. Boston's office market is the strongest inthe nation.
The Massachusetts Miracle in the 1980s prompted a flur-ry of office construction. During the height of the boom11.2 million square feet of office space were constructed,but that barely kept up with demand. Vacancy ratesremained low through 1987 but began to rise as the econ-omy slowed and office space continued to come on-line.The recession of 1990-1991 caused a loss of office jobsand slowed absorption rates resulting in vacancy rates inexcess of 17 percent in 1991. In 1993, the resumption of
rapid growth in the professional and financial serviceindustries pushed Class A vacancy rates down againrecord lows. At year-end 1998, the Class A vacancy rateswas 1.5 percent and average asking rents towards a recordhigh $50.00 per square foot (See Figure 14). Some leasesin the most desirable space approached $70 per squarefoot.
Figure 14. Class A vacancy rates are at historic lows.
The renovation of 600,000 square feet in 28 State Street inSeptember of 1997 and the 220,000 square foot renovationof 255 State Street were the only major additions to theClass A commercial market since 1992 (See Figure 15).Although developers and lenders are moving forward withmore caution than in the boom years of the 1980s, severalprojects are under construction or in the planning andapproval stages. These include 10 St. James Street, WorldTrade Center East, 33 Arch Street, One Lincoln Street, 131Dartmouth Street, South Station and the Sears LandmarkBuilding.
Figure 15. Only 820,000 square feet of office spacehave been added since 1992.
12
0.0
4.0
8.0
12.0
16.0
20.0
1986
1988
1990
1992
1994
1996
1998
17.2%
16.5%
15.5%
14.5%
14.1%
11.5%
11.1%
10.6%
10.2%
9.7%
9.4%
8.8%
7.7%
6.7%
5.5%
4.7%
4.4%
3.9%
3.5%
3.3%
31.9%Dallas
Kansas City
Detroit
Los Angeles
Philadelphia
Atlanta
Houston
Cleveland
Chicago
Phoenix
Denver
Baltimore
U.S. Average
NYC, Downtown
Cincinnati
Washington
Minneapolis
Seattle
NYC, Midtown
San Francisco
Boston
0
500,000
1,000,000
1,500,000
2,000,000
2,500,000
3,000,000
3,500,000
4,000,000
1980
1982
1984
1986
1988
1990
1992
1994
1996
1998

Hotel Market
Boston's hotel market is one of the hottest in the country.From 1980 through 1989, eighteen hotel projects, includ-ing sixteen new hotels and two additions to existing hotels,added 5,439 new rooms to the city's hotel stock. The num-ber of hotel rooms in the city has risen from 6,907 in 1980to 12,070 by 1991, an increase of 75 percent. The latestfigures show that Boston's hotel market is strong. Theaverage occupancy rate was 78.6 percent and an annualaverage daily room rate of $175.59.
Three hotels totaling 310 rooms were constructed in 1997and the new Seaport Hotel and four expansions of existinghotels added another 528 rooms in 1998. In 1999 fournew hotels and one expansion will contribute another1,274 new rooms but the net increase will be just 761rooms since the Airport Hilton is intended to replace theoriginal Hilton, which was built in 1975.
The year 2000 will see the completion of another 422rooms in new hotels which are currently under construc-tion. Sixteen more hotels are actively seeking approval inan attempt to open in time for the 2003 inauguration of theBoston Convention and Exhibition Center.
The approval of the Boston Convention and ExhibitionCenter by the state legislature creates the need for addi-tional hotel rooms in South Boston. The convention cen-ter, along with the hotels and other developments in SouthBoston, will have a positive effect on the area and helpbring the waterfront back into prominence. Clearly, thephenomenal performance of the hotel market in terms ofoccupancy and room rates has stimulated a lot of develop-ment activity.
Industrial Market
Boston has just over 21 million square feet of industrialspace within the city limits. As of May 1997, over 10.2million square feet of industrial space was surveyed andthe vacancy rate was found to be 35.7%, with over 3.6 mil-lion square feet unoccupied. The average rent for qualityindustrial space was estimated to be in the range of $5.00to $6.50 per square foot. In 1994, there were 3.9 millionsquare feet of industrial research and development spacein the city, which was 16% vacant with 619,000 squarefeet available. The average rent was estimated to be $11per square foot.
From 1983 through 1991, 5.5 million square feet wereacquired and/or rehabilitated in the city for industrial usefrom 1983 through 1991. Among these projects were themulti-million dollar expansions by Teradyne, Inc., theMarine Industrial Park, and private investments in rehabil-itation for industrial use of the Stonybrook CommerceCenter, the Haffenreffer Brewery in Jamaica Plain and theHowden Sirocco (the former Westinghouse) plant in HydePark.
In 1992, Genzyme Corporation, a Cambridge-basedbiotechnology firm, began construction of an $85 millionbio-pharmaceutical manufacturing plant in AllstonLanding. The company also plans to build further manu-facturing, research and development and headquartersfacilities on the site.
Three major losses to the city's industrial base came whenthe Digital Equipment Company's (DEC) vacated itsCrosstown site in 1993 and the Stride Rite closed its plantin 1997. In 1995, the H.P. Hood consolidated its opera-tions and closed its Charlestown Plant. The DEC buildinghas since been partially leased by the MassachusettsBiotechnology Research Institute (MBRI) providingoffice and research facilities, access to venture capital, anda education and training program. To date the MBRI hasutilized $5 million in Federal funding to attract over $20million in venture capital. Thirty-five thousand squarefeet in the DEC building are still available for industrialuse. The Stride-Rite facility consists of two buildingstotaling 552,000 square feet on 9.8 acres. Private devel-opers have already shown interest in the redevelopment ofthe site. The former Hood plant in Charlestown has beenthe site of some freight forwarder uses moving off ofLogan airport, bringing several hundred jobs to the area.
There were seven major projects completed in the 1995-1997 period: the Advanced Electronics expansion to110,000 square feet; the expansion of the Boston FreightTerminal in Fort Point Channel; the American EngineeredComponents move from Cambridge to Boston; the ZoomTelephonics building doubling in size to 150,000 squarefeet; Boston Ship Repair's expanded business in Dry-Dock3 at BMIP; and The Harry Miller Company developmentof 36,000 square feet of space with assistance in Boston'sEnhanced Enterprise Community; and, the completion ofthe New Boston Seafood Center, housing seven seafoodcompanies in a 70,000 square foot in the Marine IndustrialPark.
There has been recent industrial development activity aswell. The Seafood Initiative in the Marine Industrial Parkcontinue to be successful as seven companies have com-mitted to build facilities that will help Boston retain itswaterfront seafood industry. For example, North Coast isplanning a 60,000 square foot processing plant.
In Newmarket, the BRA is creating and implementing aneconomic development plan in conjunction with propertyowners and other neighborhood groups. The plan also willinclude an analysis for the South Bay incinerator site forindustrial reuse.
Another industrial project in the pipeline is the recentlyannounced International Cargo Port. This development inthe Marine Industrial Park is expected to create 900 newmaritime jobs.
13
Housing Market
The housing market in Boston is one of the tightest in thenation. Low vacancy rates and a slowdown in multi-fam-ily housing production has pushed rents and sales prices torecord highs in many areas of the city.
Rents
Rents in Boston continue to rise due to increased demandfor rental housing, decreasing supply of rental units andincreasing salaries. For example, in 1995 the citywidemedian rent for a two-bedroom apartment was $825. Lastyear, the median rent had climbed to $1,350, a 64 percentincrease. The neighborhoods with the largest percentageincrease were East Boston, South Boston, Jamaica Plain,and Allston-Brighton.
The rents near downtown Boston are the highest, forexample, in the Back Bay and Beacon Hill and CentralBoston, the median rent for two-bedroom apartments isaround $2,000 per month while in Mattapan the medianrent is $700 and in Hyde Park it is $850 (See Figure 16).
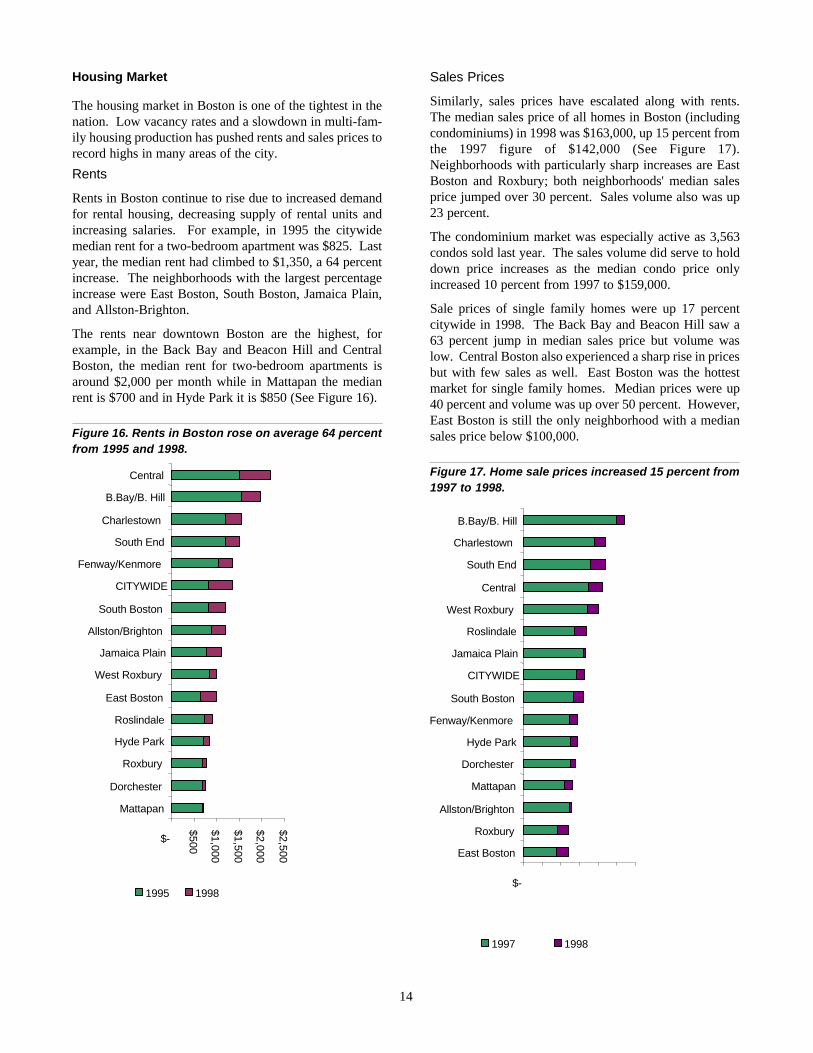
Figure 16. Rents in Boston rose on average 64 percentfrom 1995 and 1998.
Sales Prices
Similarly, sales prices have escalated along with rents.The median sales price of all homes in Boston (includingcondominiums) in 1998 was $163,000, up 15 percent fromthe 1997 figure of $142,000 (See Figure 17).Neighborhoods with particularly sharp increases are EastBoston and Roxbury; both neighborhoods' median salesprice jumped over 30 percent. Sales volume also was up23 percent.
The condominium market was especially active as 3,563condos sold last year. The sales volume did serve to holddown price increases as the median condo price onlyincreased 10 percent from 1997 to $159,000.
Sale prices of single family homes were up 17 percentcitywide in 1998. The Back Bay and Beacon Hill saw a63 percent jump in median sales price but volume waslow. Central Boston also experienced a sharp rise in pricesbut with few sales as well. East Boston was the hottestmarket for single family homes. Median prices were up40 percent and volume was up over 50 percent. However,East Boston is still the only neighborhood with a mediansales price below $100,000.
Figure 17. Home sale prices increased 15 percent from1997 to 1998.
14
$-
$500
$1,000
$1,500
$2,000
$2,500
Mattapan
Dorchester
Roxbury
Hyde Park
Roslindale
East Boston
West Roxbury
Jamaica Plain
Allston/Brighton
South Boston
CITYWIDE
Fenway/Kenmore
South End
Charlestown
B.Bay/B. Hill
Central
1995 1998$-
East Boston
Roxbury
Allston/Brighton
Mattapan
Dorchester
Hyde Park
Fenway/Kenmore
South Boston
CITYWIDE
Jamaica Plain
Roslindale
West Roxbury
Central
South End
Charlestown
B.Bay/B. Hill
1997 1998

Tenure and Housing Types
The homeownership rate in Boston was 28.1 percent as ofthe 1990 census, up 2.4 percent from 1980. More recentdata suggest that the ownership rate has risen since thecensus. The neighborhoods with the highest homeowner-ship rate are West Roxbury, Hyde Park, and Roslindale,while those with the lowest are Fenway/Kenmore, CentralBoston, the South End, and Allston/Brighton.
The statewide ownership rate is 62.3 percent (1997) andthe metro area (excluding Boston) has an ownership rateof 62.6 percent of the total occupied units (1990). Clearly,the city has a greater portion of its housing stock availablefor rent than the state or metro region. In fact, Boston hasone-third of the entire metro area's rental stock, but onlyone-fifth of the total housing stock.
Boston's primary housing type is the triple-decker. Unitsin 3 or 4 family homes comprise over 25 percent of thehousing stock (See Figure 18). While only 23 percent ofthese units are owner-occupied, nearly 60 percent of thebuildings have the owner occupying one of the units. Induplexes, over 70 percent of the buildings are owneroccupied. In fact, the city is at 85 percent of its theoreti-cal maximum homeownership rate of 36 percent. The the-oretical maximum is when every building with less than10 housing units has the building's owner living in one ofthem.
Figure 18. Renters occupy much of Boston's housingstock.
Approximately 16 percent of the housing in Boston is sin-gle family, of which 80 percent is owner occupied. In con-trast, the 30 percent of the housing stock in buildings with10 or more units is only about 3 percent owner occupied.This figure may go up due to recent condominium con-versions.
Boston has one of the oldest housing stocks in the nation.According to the Census Bureau, 57.6 percent of the hous-ing units in Boston were built prior to 1939 (See Table 1).The housing stock is dominated by rental units, especiallythose in three or four unit buildings (the famous BostonTriple Decker) and most of the housing units have three tofive rooms.
Table 1. Most of the housing in Boston was construct-ed before 1939.
Year Number of Percent ofConstructed Units Housing Stock1980-1990 18,966 7.6%1970-1979 21,303 8.5%1960-1969 23,266 9.3%1950-1959 18,576 7.4%1940-1949 24,144 9.6%Before 1939 144,608 57.6%Total 250,863 100%
New Housing Production
During the 1980s, Boston's housing growth (measured asnew construction building permits) was only 12% ofmetro (less than the city's 22% share of housing stock).During the 1990s, Boston housing development has beenjust 4% of total metro development. At this rate, Bostonwill decline from 21.8% of metro housing supply in 1990to 19.9% in 2010. But Boston housing constructionrevived strongly last year, as the number of new construc-tion dwelling units permitted grew from 249 units in 1997to 757 units in 1998. Boston's 1998 permits were 9.4% ofthe metro total.
Figure 19. Housing production has been slow inBoston since the recession.
15
0
10000
20000
30000
40000
50000
Units in structure
Hou
sing
uni
ts
Owner Occupied Renter Occupied
0
500
1,000
1,500
2,000
2,500
3,000
1980
1982
1984
1986
1988
1990
1992
1994
1996
1998
Uni
ts p
erm
itted
1-4 units 5+ units

Housing supply growth rates through new construction aver-aged less than one half of one percent annually in Bostonduring the 1980's "Massachusetts Miracle" and just aboutone tenth of one percent annually during the 1990s (SeeFigure 19.) In addition, adaptive reuse conversion on non-residential buildings added about half as many units as didnew construction during the 1980s, but demolitions reducednet housing gain to just about two thirds of gross additions.
Affordable
"Affordable" housing: publicly subsidized, means-testedhousing comprises about 18% of Boston's housing stock, orabout 45,000 units. Boston Housing Authority (BHA)housing represents about 14,000 of these units.
Over 15,000 units in 103 privately owned multifamily hous-ing projects are subsidized via federal and state programssuch as mortgage subsidies, or Section 8 rental assistance.As a result, these units are protected as affordable to house-holds making less than the region's median. Many of theseunits are in danger of losing their protected status becauseowners are opting to pre-pay the subsidized mortgages,therefore enabling them to rent their units at market rate.
Recent Trends and Issues
Single-family and Homeownership Opportunities
As noted before, housing prices are continuing to moveupwards. This is a trend that can be expected to continue asa lull in housing production combined with a robust econo-my and low interest rates work to put more people and moremoney in competition for a limited number of housing units.Eighty percent of single family homes are owner occupiedso the increase in prices is creating wealth for many Bostonresidents. However, the prices are increasing so rapidly thatmany young families cannot afford to buy a home in Bostonand must look elsewhere or continue to rent.
Multifamily and Rental Housing
Rents are also expected to continue to increase for the samereasons, but rents are increasing faster than housing prices.There are several phenomena that might explain this:
Slowdown in multifamily housing production - One majorreason for the sharp decline in Boston housing production isthe national decline in multi-family housing construction.While the national pace of housing production in smallerbuildings (1-4 units) during the 1990s has exceeded one mil-lion units annually, beating the 1980s pace by 7 percent,national housing production in larger developments (5+units) averaged less than a quarter million units annually, orjust 52 percent of the 1980s average. In Massachusetts dur-ing the 1990s, housing production in smaller structures hasaveraged 74% of the 1980s level, but recent housing pro-duction in larger structures is just 18% of the 1980s annualaverage. In Boston during the 1990s, small structure hous-ing has averaged 40% of 1980s levels, and large building
housing production is 19% of the previous decade's pace.Changes in U.S. tax law, reduced subsidies for production,and the reluctance of capital markets to finance large proj-ects all contribute to the decline in multi-family housing pro-duction.
Figure 20. Housing units are increasing while populationhas declined over the past 40 years.
Demographic changes - Household size has been shrinkingfor the past several decades. In fact, in 1950, when the cityof Boston's population hit an all-time high of 801,000, therewere fewer housing units than there were in 1990.Statewide, the number of single person dwellings increasedfrom 7.2 percent of all households in 1950 to 25.8 percent in1990. Single person households are much more likely tooccupy rental units in multi-family structures than singlefamily dwellings. More demand is created for this type ofhousing as rising incomes allow more people to live alone.
Non-traditional households (single parent families andnon-family households such as students) are also on the riseand frequently seek housing in rental units.
Condo conversion - The city actually saw a decline in thenumber of rental units from the 1980 census to the 1990 cen-sus, mostly as a result of apartments being sold as condo-miniums. Condo conversion was very prevalent in the BackBay and Beacon Hill, neighborhoods that also experienced adecline in the number of housing units (rental and owner-occupied) during the 1980s. Central Boston,Allston/Brighton, and Jamaica Plain also experienced a lossof rental units due to condo conversions. While condo con-versions create more homeownership opportunities, muchneeded rental housing is removed from the market (SeeTable 2.)
Students - Boston's colleges and universities are expandingtheir enrollment but have not added student housing. Untilrecently, the housing supply for students has not grown tomatch the growing number of students placing considerablepressure upon the housing markets in neighborhoods such asFenway/Kenmore, Allston/Brighton, and Roxbury. In addi-
16
200,000
300,000
400,000
500,000
600,000
700,000
800,000
900,000
1950 1960 1970 1980 1990
160,000
180,000
200,000
220,000
240,000
260,000
Housing U
nits
Population Housing Units

tion to driving up rents by increasing demand, rents arepushed up by students' ability to pay more for a housingunit by living two or more to a unit.
Since 1993 1,275 dormitory beds have been opened, 1,614are under construction and anther 350 have beenapproved. The BRA plans for another 1,500 beds to beconstructed, further easing the pressure that students placeupon neighborhood housing markets. The 4,700 dormito-ry beds will be a 26 percent increase in student housingover seven years.
Table 2 .The number of rental units in Boston isdecreasing.
Change in number Neighborhood of rental units (1980-1990)
Allston-Brighton -297
Back Bay-Beacon Hill -2,295
Central -504
Charlestown 1,015
East Boston 434
Fenway-Kenmore 137
Hyde Park 356
Jamaica Plain 304
Mattapan -354
North Dorchester 270
Roslindale 204
Roxbury -449
South Dorchester 67
South Boston -177
South End 196
West Roxbury 65
Total -1,038
Subsidized and Affordable Housing
The housing crunch in Boston has created affordabilityproblems for not only the city's poor. The 45,000 housingunits (18 percent of the city's total) that are designatedaffordable through public ownership, subsidized mort-gages, and Section 8 project-based contracts provide somerelief, but the waiting lists for public housing and Section8 vouchers are full, suggesting that the need for affordablehousing is not met.
Compounding the affordability problem are the project-based mortgage subsidies and Section 8 certificates thatare expiring over the next few years. The booming econ-omy and housing market is making conversion of afford-able units into market rate units very attractive. Manyowners have pre-paid their subsidized mortgages, therebyending the rent controls from affected units, in order toreceive higher rents. As the housing prices and rents con-tinue to rise, maintaining the number of affordable unitsbecomes more important.
To date, 890 affordable units have been converted to mar-ket rate and another 1,798 are at risk. Another 2,183 prop-erties have Section 8 property disposition contracts thatare expiring in the next several years. Of these, 1,173 arethe Granite Properties that have been preserved as afford-able. This still leaves 1,010 Section 8 units at risk. Alltold, there are 3,698 affordable units that are at risk orhave already been converted to market rate.
17

Population Characteristics
Population and Racial Distribution
Boston's population reached 574,283 according to the1990 Census, registering the first gain since the decade ofthe 1940s. Boston was one of few U.S. central cities togrow during the 1980s and the city retains its position asthe twentieth largest city in the United States. Populationgrowth in Boston has been limited by the city's smallphysical size. At 48 square miles, Boston is the secondsmallest of the 20 most populous cities, behind SanFrancisco.
Population growth is also limited by Boston's householdsize. Household size has been declining since the 1970census but is now holding steady as the children of babyboomers are beginning to have children. After the year2000, the average household size will more than likelybegin to fall again. In 1980, Boston's average householdsize was 2.40 down from 2.76 in 1970. The 1990 censusreported that the average household size had droppedslightly to 2.37.
Boston is the core city in the Boston Primary MetropolitanStatistical Area (PMSA) which has 3.2 million people liv-ing in its 129 communities. The Boston PMSA is by farthe largest PMSA in the Boston CMSA which includescommunities from York, Maine to Thompson,Connecticut, including Lawrence, Lowell, Nashua andWorchester. Almost 5.5 million people live in the CMSA's238 communities making it the seventh largest in thecountry
Table 3. Boston's population is becoming morediverse.
Percent of PopulationRace 1980 1990White (Non Hispanic) 70 59.1Black 22.4 25.6Native American 0.2 0.3Asian 2.7 5.3Other 4.7 6Hispanic Origin* 6.4 10.8
*Hispanic Origin can be of any race
Boston has a diverse population, with minorities compris-ing 40.9 percent of the population. Of these minorities,blacks are the largest, comprising 25.6 percent of the totalpopulation, followed by those of Hispanic origin whomake up 10.8 percent. Asians, American Indians, andAleuts comprise the remaining population. Asians andHispanics are the fastest growing racial and ethnic groupsin the city (See Table 3).
Boston historically has been a city of immigrants. This
trend continues to the present. Nearly 115,000 people liv-ing in Boston in 1990 were foreign-born-over 63,000 ofthem arriving in the United States since 1980. The racialand ethnic groups with the fastest growth rates in Bostonare Asians and Hispanics. There was an increase of17,369 people reporting themselves as Asian between the1980 and 1990 Census and an increase of 23,549Hispanics over the same period. Although this representsnatural increase as well as immigration, it gives a goodpicture of trends in Boston. A quarter of the growth in theAsian population occurred in the Allston-Brighton areawith another 13 percent in the Fenway-Kenmore neigh-borhoods. Over 20 percent of the growth in Hispanic pop-ulation was in East Boston. Allston-Brighton, JamaicaPlain Roxbury and Roslindale also experienced significantgrowth in their Hispanic population. The immigration actof 1990 has resulted in the largest declines in population inthe past 15 years (See Table 4).
Table 4. U.S. immigrants comprise about one-fifth ofBoston's population
Year of entry Number of residents
-1950 9,282
1950-1959 5,632
1960-1969 12,825
1970-1979 23,493
1980-1986 36,187
1987-1990 27,178
Total foreign-born Boston residents 114,597
The number of people speaking languages other thanEnglish at home is also rising in Boston. In 1980, 81 per-cent of the people in Boston five years and older spokeonly English at home. In 1990 only 74 percent did.Spanish is the second most common language spoken inBoston with over 51,000 speakers. Other languagesinclude mostly Asian and Pacific Island languages,Portuguese and Russian (See Figure 21).
Figure 21. More Bostonians speak a language otherthan English at home.
18
0 %
20%
40%
60%
80%
100%
1980 1990
English Only Spanish Other

Educational Attainment
Boston is known as the Athens of America because of thestrong presence of its colleges and universities. The city'scolleges and universities provide jobs and attract busi-nesses looking for a highly skilled workforce.
In response to the Education Reform Act, Boston hasalready introduced four new curricula in English, math,science and social studies and introduced standardized stu-dent tests. The number of full-day kindergarten programsis being expanded and the city is upgrading library servic-es. Computers are also becoming an essential part of thecurriculum as more schools get PCs and Internet connec-tions in the classrooms. Students in Boston's publicschools have increase their Massachusetts EducationalAssessment scores since the passage of this legislation.
Over 63,000 students are enrolled in Boston PublicSchools. Enrollment in kindergarten through eighthgrades has increased by nearly six percent in the past fiveyears, but high school enrollment has declined by one per-cent. The student population is more diverse than thecity's population as a whole. Blacks comprise 48.4 per-cent of the student body and 25.2 percent is Hispanic.White students comprise 16.9 percent and Asians andother races make up the remaining 9.5 percent. Over 58percent of graduating students plan to attend either a twoor four college after graduation.
Figure 22. Thirty percent of Boston's residents have acollege degree and fifty percent have some college.
The State has a strong secondary school system in terms ofmath and science. The Massachusetts TechnologyCollaborative reports that Massachusetts eighth gradershave the among the highest National Assessment ofEducational Progress (NAEP) scores in the nation sur-passing other high tech and technology rich states such asNew York, Texas, California, and Florida. Boston'sschools are below the state's average in terms of test per-
formance but nevertheless, the city benefits from the higheducational attainment of other towns in theCommonwealth.
Residents of Boston increased their overall educationalattainment between 1970 and 1980 and again between1980 and 1990 making the city more attractive to busi-nesses. In 1970, only 53.4 percent of the city's populationaged 25 and older held at least a high school diploma. By1980, this was up to 68.5 percent in 1980. The latest datashow that over three-quarters of Boston's residents aged25 or older have at least a high school diploma. Nearlyhalf have at least some college experience and 18 percenthave earned a bachelor's degree; 40 percent of these witha graduate or professional degree (See Figure 22).
Many Boston jobs require a high level of education andtraining. There are almost 290,000 employed people liv-ing in Boston and 648,120 jobs within the city limits. Asa result, people living outside the city hold most of thejobs in Boston. Despite the high level of education of cityresidents, Bostonians are under-represented in industriesmore likely to have high paying occupations and positions.A Boston resident is more likely to hold a job in manufac-turing, wholesale or retail trade, or construction than asuburban worker.
Age
Boston has a comparatively young population, with agreater percentage of persons aged 15-34 than the neigh-boring counties. People aged 25-34, who represent 19.2percent of the population, increased as a percentage of thepopulation by 4 percent between 1980 and 1990. Fifteento 24 year olds declined as a percentage of the populationbetween 1980 and 1990 but still make up over 20 percentof the city's population. Those under four years old areincreasing as a percentage of the population, and 35-44year olds are the fastest growing segment of the population(See Figure 23).
Figure 23. Boston's colleges and universities give thecity a young population.
19
0 %
20%
40%
60%
80%
1 0 0 %
1 9 7 0 1 9 8 0 1 9 9 0
0 - 8 y e a r s
1 - 3 y e a r s
o f h igh
s c h o o l
High
s c h o o l
g radua te
1 - 3 y e a r s
o f c o l lege
4 + y e a r s
o f c o l lege
0.0%
5.0%
10.0%
15.0%
20.0%
25.0%
0-4 5-
14
15-
24
25-
34
35-
44
45-
54
55-
64
65-
74
75-
84
85+
Rest of Boston PMSA Boston

Daylong Population and Commuting Patterns
During a typical workday, Boston's population doubles tonearly 1.2 million, as people come to Boston to work,shop, go to school, receive health care or attend specialevents. The large number of people coming into Bostonbrings in business and money, adds to the vitality, andgives a telling picture of the true importance of the cityand its impact upon the region.
Boston has a very accessible public transportation system,so there are many choices of commuting methods. Fortypercent of Boston's residents drove alone to work while 32percent took a bus, subway or train to work, according tothe 1990 Census. Roughly ten percent carpooled and theremainder (18 percent) either walked, biked, or worked athome. Boston's average commute time is just over 23minutes.
Income and Poverty
Per capita personal income for Suffolk County was$30,716 in 1995, 32% above national per capita personalincome of $23,348, according to the U.S. Bureau ofEconomic Analysis. A historical summary of per capitaincome shows that, from 1980 to 1990, Suffolk County'sper capita income grew at a rate greater than that for thenation. This is in contrast to the 1970-1980 period whenit rose at a slower rate. Suffolk County's per capita incomegrew at a faster rate than the per capita income growthrates for the United States and Metropolitan Bostonbetween 1990 and 1995 (See Figure 24).
Figure 24. Boston's per capita income is higher thanthe national average.
The city's median household income based on U.S. Censusdata, rose from $18,202.52 in 1970, to $12,530 in 1980and $29,179 in 1990.
In 1989 and 1993, the Census Bureau modeled the medi-
an household income at the county level. Suffolk County'smedian household income grew from $25,227 in 1989 to$30,143 in 1993, the latest available figures.
Boston was one of eleven of the fifty largest U.S. cities tosee a decline in its poverty rate. In 1980, the city's pover-ty rate was worse than the largest fifty cities' average at20.2 percent. By 1990, Boston had reduced its povertyrate to 18.7 percent and was better than the fifty-city aver-age.
U.S. Bureau of the Census released the most recent coun-ty-level data on income and poverty rates in 1994. Itshould be noted that small sampling size makes morerecent and reliable data on poverty unavailable at theneighborhood level and data at the county level are not asaccurate as those at the national level. The poverty rateincreased in Suffolk County between 1990 and 1994, butnot as fast as the national or state rates. The percentageof children aged 5-17 in poverty has grown by 8.2 per-centage points while the national rate stayed virtually thesame. While there was an increase of 4,416 children in thecity between 1980 and 1990, 9,171 children were added toSuffolk County's poverty rolls
Crime
Boston has been nationally recognized for its decliningcrime rate. As in most other large U.S. cities, the numberof both violent crimes (homicide, rape, robbery, andaggravated assault) and property crimes (burglary, larceny,and vehicle theft) are down substantially in the past sixyears (See Table 5).
Table 5. Boston's crime rate is declining.
1993 1994 1995 1996 1997 1998
Homicide 98 85 96 59 43 34
Rape 480 453 379 414 350 356
Robbery 4,081 4,245 3,597 3,470 2,728 2,334
Agg. Assault 6,184 5,881 5,496 5,211 4,765 4,703
Violent Crime 10,843 10,664 9,568 9,154 7,886 7,427
Burglary 7,982 6,799 6,671 5,052 4,301 3,610
Larceny 24,798 24,375 26,002 21,234 17,920 17,578
Vehicle Theft 11,932 11,240 10,036 9,271 7,731 6,366
Property Crime 44,712 42,414 42,709 35,557 29,952 27,554
20
$-
$5,000
$10,000
$15,000
$20,000
$25,000
$30,000
$35,000
1970
1990
1992
1994
1996
United States Suffolk County

21
A P P E N D I X

22
1. Employment in Boston, 1970-1998
Industry (SIC) 1970 1980 1988 1992 1993 1994 1995 1996 1997 1998
Agri./Mining (1-14) 977 996 1,387 1,218 1,314 1,453 1,232 1,248 1,312 1,322
Construction (15-17) 22,296 11,818 16,519 10,810 11,522 12,602 13,274 13,074 13,776 16,094
Manufacturing (20-39) 63,812 52,689 34,919 28,230 28,882 29,584 29,114 29,135 28,596 29,704
Trans/Comm./Pub. Util.(40-49) 44,826 38,799 37,820 35,644 35,706 36,515 36,382 36,328 37,232 37,301
Wholesale Trade (50-51) 42,630 28,786 23,282 16,191 15,671 15,516 16,393 16,385 16,242 16,610
Retail Trade (52-59) 82,457 60,053 62,714 56,954 57,211 60,371 61,309 62,736 63,350 65,397
Finance/Ins./R. E. (60-67) 76,343 76,643 104,324 84,577 85,940 92,820 94,188 97,118 101,256 104,194
Banking(60,61) 22,698 21,338 30,144 21,965 21,649 22,860 23,461 20,376 21,490 22,552
Securities (62) 7,551 8,469 21,240 24,464 26,670 30,594 31,980 38,724 42,171 44,925
Insurance (63,64) 38,780 36,513 33,871 26,200 25,621 26,412 25,449 24,046 23,422 22,141
R. E. /Other(65,66,67) 7,313 10,323 19,069 11,948 12,000 12,955 13,299 13,973 14,172 14,573
Services (70-89) 145,080 205,772 265,558 256,850 270,035 278,900 286,019 292,900 301,446 309,008
Hotel (70) * 6,539 12,552 12,193 12,023 12,180 11,892 11,742 11,750 12,430
Health (80) * 65,436 76,057 87,011 90,634 92,024 92,133 94,692 96,085 97,401
Educational (82) * 26,386 30,934 28,818 29,520 31,190 33,167 33,321 32,739 33,268
Cultural (78,79,84) * 6,216 9,592 9,339 9,523 9,657 9,333 9,982 10,536 10,847
Soc./Non-prof. (83,86) * 19,994 23,158 23,087 24,726 23,688 24,374 24,261 25,115 25,529
Professional (73(p),81,87,89) * 39,859 63,063 60,588 62,079 62,285 65,928 67,260 70,857 74,781
Non-Professional Bus. Serv.(73p) * 30,415 37,335 25,492 30,685 36,927 37,587 39,855 42,003 41,977
Personal(72,75,76,88) * 10,927 12,868 10,323 10,846 10,949 11,605 11,787 12,362 12,775
Government (90+) 81,571 88,756 97,093 85,830 87,939 87,135 91,625 89,058 89,589 91,392
Total 559,991 564,312 643,615 576,304 594,219 614,895 629,536 637,982 652,799 671,022
1950 1955 1960 1965
Agri/mining 1,874 1,700 1,376 1,205
Construction. 19,978 16,851 17,908 18,369
Manufacturing 101,892 95,785 88,102 76,593
Trans/Comm./Pub. Util. 37,183 40,673 41,120 37,395
Trade 147,585 140,163 126,978 119,477
Finance/Ins./R. E.. 51,917 55,755 57,980 61,504
Services 89,004 94,595 105,485 113,922
Propr 16,320 16,178 15,939 15,559
Govt. 84,966 98,890 95,673 97,586
Total 550,719 560,590 550,561 541,610
Job figures prior to 1969 use a different classification system and therefore may not correspond
exactly to the currently used classification system.

Massachusetts General Hospital 11,415
Brigham and Women’s Hospital 8,661
Fidelity Investments (FMR Corp) 8,000
Boston University 7,410
Beth Israel Deaconess 6,205
BankBoston 5,429
New England Medical Center 4,995
Children’s Hospital 4,729
Liberty Mutual 4,657
John Hancock Mutual Life Ins. Co 4,494
Boston Medical Center 3,628
Gillette Company 3,404
Northeastern University 3,186
Stop and Shop 3,000
Putnam Investments 2,946
St. Elizabeth’s Medical Center 2,927
Fleet Bank of Massachusetts 2,822
Harvard/Pilgram Health 2,375
State Street Bank & Trust Co. 2,251
Boston Globe 2,250
The New England 2,155
Marriott International 2,119
Au Bon Pain 1,912
Dana Farber 1,904
Filene’s 1,868
Teradyne, Inc. 1,650
Boston Edison 1,625
American Airlines 1,600
Thomson Financial Services 1,588
Star Market 1,562
Blue Cross/Blue Shield 1,449
Visiting Nurses Association 1,443
Carney Hospital 1,333
Stone and Webster 1,274
First Security Services Corp 1,233
Faulkner (Hospital) Corp. 1,212
Federal Reserve Bank of Boston 1,202
USAir 1,200
Mass. Eye and Ear Infirmary 1,165
Liberty Mutual Cos, Inc. 1,075
Delta Airlines 1,045
23
2. Boston’s Largest Private EmployersAs of September, 1997
Data as of September 1997. Several of the above employers have since merged or consolidated.

24
3. National Institutes of Health Research Grants, 1990-1997
City 1990 1991 1992 1993 1994 1995 1996 1997
Boston 471,844,087 530,001,990 576,278,369 597,795,761 630,109,153 650,732,173 704,142,555 760,357,060
New York 523,670,139 565,379,899 603,480,556 599,584,457 628,402,761 628,547,538 647,250,338 697,223,528
San Diego 218,709,590 235,712,517 256,472,091 269,684,562 279,490,389 411,551,266 425,394,337 473,150,023
Philadelphia 259,713,256 290,180,630 307,042,050 313,959,306 336,200,805 360,000,757 370,343,912 412,778,587
Baltimore 254,559,811 275,939,995 311,296,749 332,020,795 350,996,420 342,570,163 373,643,534 390,683,064
Seattle 209,109,541 236,630,074 278,764,732 253,214,477 278,475,276 321,987,894 319,839,820 366,672,197
Los Angeles 228,203,660 225,926,407 255,135,771 259,307,429 267,080,541 271,674,627 279,438,720 289,058,435
San Francisco 184,629,715 192,304,939 209,603,748 202,045,321 214,384,742 218,481,416 231,167,609 239,832,458
Chicago 160,816,628 170,197,472 181,173,012 184,948,152 198,940,079 213,107,851 227,744,382 238,861,910
Houston 139,408,238 160,669,369 165,577,352 184,537,296 206,422,019 195,910,625 220,359,912 232,159,312

Median Sales Prices, 1997-1998
Neighborhood 1997 1998East Boston $88,051 $120,000 Roxbury $90,000 $120,000 Allston/Brighton $124,000 $127,950 Mattapan $110,500 $130,000 Dorchester $125,000 $140,000 Hyde Park $125,000 $145,000 Fenway/Kenmore $122,000 $145,177 South Boston $133,000 $160,000 CITYWIDE $142,000 $163,000 Jamaica Plain $162,000 $165,000 Roslindale $137,500 $168,000 West Roxbury $172,382 $200,000 Central $174,000 $211,000 South End $179,000 $219,000 Charlestown $191,500 $220,000 Back Bay/Beacon Hill $249,000 $270,000
Median Rents, 1995-1998
Neighborhood 1995 1998Mattapan $688 $700 Dorchester $675 $750 Roxbury $688 $775 Hyde Park $700 $838 Roslindale $725 $900 East Boston $650 $1,000 West Roxbury $850 $1,000 Jamaica Plain $775 $1,100 Allston/Brighton $893 $1,200 South Boston $825 $1,200 CITYWIDE $825 $1,350 Fenway/Kenmore $1,050 $1,350 South End $1,200 $1,500 Charlestown $1,200 $1,550 BackBay/Beacon Hill $1,548 $1,970 Central $1,500 $2,200
25
4. Housing Costs

5. Population of Boston
Year Population
1790 18,320
1800 24,937
1810 33,787
1820 43,298
1830 61,392
1840 93,383
1850 136,881
1860 177,840
1870 250,526
1880 362,839
1890 448,477
1900 560,892
1910 670,585
1920 748,060
1930 781,188
1940 770,816
1950 801,444
1960 697,197
1970 641,071
1980 562,994
1990 574,283
26

6. Sources of Data
The major statistical data relating to population, employ-ment and income are derived primarily from four separatesources: the U.S. Census Bureau, the U.S. Bureau ofLabor Statistics, the U.S. Bureau of Economic Analysis,and the City of Boston/Boston Redevelopment Authority,each of which is described below.
The U.S. Census Bureau publishes information about pop-ulation, housing and the economy. Data from the 1990Decennial Census of Population and Housing is nowavailable for the city. In addition, some monthly and quar-terly data are available through September 1998 on certaintopics for the region, Massachusetts, and the Boston met-ropolitan area. The U.S. Census Bureau does not publishsuch interim data for the city.
The U.S. Bureau of Labor Statistics publishes data andreports about the workforce and related subjects includingunemployment rates, area wages, and cost-of-livingadjustments. Final data for 1996 are the most recent annu-al data available; the most recent monthly data are forSeptember` 1998.
The U.S. Bureau of Economic Analysis publishes quarter-ly and annual statistics on income and employment. Themost recent annual figures are from the September 1998revised series for the nation, New England, andMassachusetts and the August 1996 revised series for met-ropolitan counties and Suffolk County, which consists ofthe city plus the municipalities of Revere, Chelsea andWinthrop; the city comprises approximately 87% of the
County's population and approximately 96% of itsemployment.
The City of Boston and the Boston RedevelopmentAuthority prepare reports and compile data on the popula-tion and economy of the city and its neighborhoods. TheBRA also provides data and trends from various local,regional, state and national sources on such topics asemployment and occupation, large employers, cityschools, universities and colleges, medical institutions,tourism and lodging, transportation, office and industrialmarkets, housing, building activity and urban redevelop-ment and infrastructure projects.
Statistical data do not necessarily reflect current activitybecause of delays resulting from the time required to col-lect, tabulate and publish such data. This report includesthe most recent data available, but of such necessarydelays, the data contained herein may not reflect currentconditions or trends. Additionally, statistical data areapproximations and generalizations subject to varioussources of error inherent in the statistical process, and maybe revised on the basis of more complete data. Within suchlimits, the statistical data contained herein describe pastactivity and are not presented with a view to predictingfuture economic activity either in particular categories orin general.
27

7. Other Sources
ACCRA
American Council of Life Insurance
Association of Independent Colleges and Universities
BankBoston
Banker and Tradesman
Boston Business Journal
Boston Consulting Group
Boston Housing Authority
Boston Police Department
Boston Tomorrow Conference
Bureau of Labor Statistics
C.B. Richard Ellis
Center for Labor Market Studies
Cognetics, Inc.
Coopers and Lybrand
Cushman and Wakefield
Department of Neighborhood Development, Boston
Federal Bureau of Investigation
Federal Reserve Bank of Boston
Fortune Magazine
Greater Boston Chamber of Commerce
Greater Boston Convention and Visitors Bureau
Initiative for a Competitive Inner City
James Howell (The Howell Report)
Lawrence Kennedy, Planning the City upon a Hill
Mass Insight
Massachusetts Department of Education
Massachusetts Department of Employment and Training
Massachusetts Institute of Technology
Massachusetts Technology Collaborative
Massachusetts Port Authority
Merideth and Grew
Metropolitan Area Planning Council
Michael Porter, The Competitive Advantage ofMassachusetts
Mt. Auburn Associates
Municipal Research Bureau
National Assessment of Educational Programs (NAEP)
National Association of Realtors
National Realtors Board
National Trust for Historic Preservation
New England Board of Higher Education
New England Economic Project (NEEP)
Pinnacle Advisory Group
Rental Housing Association
Scarborough Report
Spaulding and Slye
U.S. Bureau of Economic Analysis
U.S. Bureau of the Census
Yolanda Kodrzycki, Federal Reserve Bank
28