Distance from Urban Agglomeration Economies and Rural Poverty

History, Geography and Economies of Agglomeration:
Evidence from Italian Cities*
Marco Percoco Department of Institutional Analysis and Public Management and CERTeT
Università Bocconi
First draft: July 2006 This draft: May 2009
Preliminary Draft (English language still to be reviewed!)
Abstract In recent years a growing body of literature has begun to consider the eventual presence of path dependence in the development process of countries. This peculiarity has always been recognized in regional and urban studies as the path of development follows almost naturally an history- dependent spatial diffusion, influenced by both physical geography and the quality of institutions. In this paper I consider the case of Italian cities over a very long time period, i.e. from 1300 to 1861. My measure of development is urban population and I relate it to both geographical and institutional variables at both city and regional level. I find that the quality of institutions in terms of political constraints and favourable geography have a positive effect on urban development. Furthermore I found that the experience of independent city states in the Early Middle Age as well as the presence of a port and a university in 1861 is positively correlated with firm density in 2001 and through this variable with income. These results are interpreted as evidence on the historical roots of agglomeration economies in Italy. Keywords: Urban development, Path dependence, Geography, Institutions JEL Numbers: O18, R12. (*) Financial support from Bocconi University is gratefully acknowledged. I would like to thank Paolo Malanima and Guido Tabellini for making available their data on urban population and past institutions in Italian regions respectively. I also owe a special gratitude to Alasdair Anderson for his support during the early stages of the research and to Fabio Arcangeli, Michela Barbot, Antonio Calafati, Davide Cantoni, Marco Cattini, Sandy Dall’Erba, Gilles Duranton, Philip McCann, Massimiliano Onorato, John Parr, Lanfranco Senn and participants in seminars and conferences at Universidad de Sao Paulo (August 2006), North American meetings of the Regional Science Association International (Toronto, November 2006), Italian Regional Science Association (Bolzano, September 2007), European Economic Association (Milan, August 2008), Società Italiana degli Economisti (Perugia, October 2008) for useful comments and discussion. The usual disclaimer applies.

1
1. Introduction
The evolution of urban systems has been one of the most debated topic in the history of
economics and is currently setting the scene in economic geography (Storper, 2008).
Recently, works by Eaton and Eckstein (1997) on France and Japan and by Dobkins and
Ioannides (2001) on the USA, with later works by Black and Henderson (2003) and
Ioannides and Overman (2003), have established or confirmed some basic facts about
urban systems and their development. In particular, city size has been found to be
distributed according to a Pareto distribution that has proved to be very stable over time.
However, the apparent persistence of the Pareto distribution has been actually
characterized by two trends:
- a very stable ranking of city size at the top of the hierarchy;
- substantial changes at the bottom of the distribution reflecting the entry of new
cities and the rapid growth and decline of the old ones.
This implies that, although the shape of urban hierarchy is in general very stable over
the time, intra-distribution dynamics is present, reflecting the life cycle of cities, hence
the shape as well as the evolution of city size distribution are likely to be driven by the
fundamental determinants of urban development (Krugman, 1996).
For a long time period, cities have been considered as very similar to countries, hence
the determinants of long run growth and development have been found to be human
capital accumulation and the location of new firms. However, as argued by Storper
(2008), institutions and geography need to be considered as key factor of urban growth.
Institutions is a very broad concept which considers both de jure political institutions
and de facto institutions which are the “ways that public sector agencies and private
sector groups and individuals interact in detailed ways to shape the rules and resources

2
of the economy” (Storper, 2008; p. 9). As for de jure institutions, the relevance of
history has been convincingly documented and demonstrated. In particular, Acemoglu
et al. (2001) provide evidence that the mortality rate of European settlers in former
colonies affected institutional quality. In colonies in which the mortality rate was high,
European colonizers established extractive rent-seeking institutions, while in countries
in which the mortality rate was low, colonizers established growth promoting
institutions that protected property rights. This result can be taken as a path-breaking
study showing how a historic event can have sound effects on past institutions, that,
thorough their persistence, have an influence on current income levels (Nunn, 2008).
Similar arguments are also at the heart of the well-known Putnam’s (1993) theory of
regional development in Italy, for which he hypothesizes that past political institutions
(i.e. experiences of free cities during the Early Middle Age) influence actual level of
social capital and hence development.
An alternative theory of economic development can be found in the so-called
“geography view” which has been often considered as in competition with the
“institutions view”. The proponents of this hypothesis consider physical and economic
geography (i.e., what Krugman (1991a) calls first and second natures) as important as
institutions in determining economic development (Bosker and Garretsen, 2009;
MacArthur and Sachs, 2000).
With very few exceptions (Acemoglu et al, 2005; Bosker et al., 2008), the
aforementioned literature has focused on cross-country development differentials, in
whose analysis the role of geography is often found to be irrelevant as it is often proxied
by distance from the equator that does not prove to be salient in analyzing local
development. The study of cross-city variation of development has to be related to

3
different measures of geography which are meant to quantify the natural advantage of
cities. In other words, urban development is likely to be influenced by both geography
and the quality of institutions. What is not clear a priori is whether the effect of
geography on current economic development works through its impact on historic
events or through a direct effect on current economic outcomes.
Although apparently in competition, both the “institutions view” and the “geography
view” point at the existence of path dependence of economic development. Through the
persistence of de facto and de jure institutions, as well as through economies of
agglomeration in economic activity, institutional history and geography may shape
paths of economic development. So far, at local level, we have only some pieces of
evidence on the path dependence hypothesis, mainly because of the lack of data and of
an appropriate framework. In this paper I aim to propose some econometric evidence of
the institutional and geographical sources of path dependence in urban development.
Although the econometric framework may be thought to be not adequate as it fails to
account for the multiplicity of development patterns as postulated in the evolutionary
literature (Martin and Sunley, 2006), my econometric evidence points out some robust
statistical results on the very long run effect of historic events and of adverse geography
in city development.
The Italian context is congenial to test this hypothesis because of the great variability of
past institutional quality within the country, geographical characteristics and economic
outcomes of its cities. Hence, in the present paper I aim to test a sort of “history and
geography view” in the context of Italian cities over a very long time period. My
empirical strategy consists in firstly providing evidence on the determinants of city
development for 593 cities on a period spanning the Late Middle Age up to the

4
Unification of Italy. Secondly, on a cross-section of cities, I relate the level of industrial
development and in a certain sense the economies of agglomeration in 2001 to history
and geography.
In particular, I aim to show that both institutions and geography are fundamental
ingredients in the ideal recipe of long run urban development in both pre-industrial
cities (Duranton, 1998) and contemporary cities. To this end, I have assembled a unique
dataset containing information on the population and characteristics of hundreds of
Italian cities over the period 1300-1861. Hence, I test whether and how urban
development (as measured by city population) was actually influenced by both
geography, as expressed by market potential, morphology and accessibility to transport
networks, and institutions, as defined by the quality of regional governments and by the
communal past of the city. I found that both geography and institutions have played a
significant role in shaping urban development of Italian cities and hence in the making
of modern cities. Interestingly, this large dataset allowed me to verify whether the size
distribution of Italian cities is a Pareto function and its temporal pattern. I have found a
very slight process of deconcentration over the centuries, although it is interesting to
note that the top of the distribution presents very small changes, implying a substantial
path dependence of urban development. A particular feature of past institutions of
Italian cities, as defined by the experience of free city-states during the Early Middle
Age, is that these de jure institutions formalized business practices into commercial
laws which lasted for several centuries and, some of them, are still applied in modern
cities. This form of “legal persistence” can be thought to be a source of long run
industrial development through the enforcement of property rights, leading to higher
industrial development. I test this hypothesis and find that institutional past is positively

5
correlated with the firm density and this in turn has a positive impact on the level of
current income. Those results are then interpreted as evidence on the historical and
geographical origins of economies of agglomeration and hence local development.
As mentioned above, the literature on history and development is growing fast and
perhaps it is now quite abundant. I think the present paper is somehow different from
previous works as I “track” the relevance of institutions and geography across the
centuries in a large panel of cities and only after having provided clear evidence on their
importance, I relate them to current development.
The paper proceeds as follows. In the next section I review the main literature and
highlight some aspects of our research hypothesis, in Section 3 we provide a descriptive
quantitative analysis of urban history in Italy by also estimating the exponent of the
Pareto distribution for city size. In the fourth section econometric evidence on the
development of cities over the period 1300-1861 is presented and discussed, while long
run regressions are in Section 5. Section 6 concludes.
2. Geography and institutions in urban development
In a neoclassical growth framework, an economic system grows according to its capital
accumulation rate. However, this model does not prove to be satisfactory in explaining
intra-country variation of income where factor endowments are not the only sources of
development (Acemoglu and Dell, 2009). Regional and urban systems are very likely to
grow depending on their economic structure which is influenced by, among other
things, by their relative position and place accessibility (i.e. geography) and the quality
of institutions.

6
The role of nature in shaping the development process of both cities and countries is
lively debated by economists, starting from the very influential papers by Acemoglu et
al. (2002), Gallup et al. (1999), MacArthur and Sachs (2000) and Sachs (2001). In
general, the literature has identified different channels of transmission of geography to
development.
In backward economies, specialized in agriculture, climate may have a significant
impact on productivity and, in the long run, on the adoption of different technologies
(Comin et al., 2006; Diamond, 1997; Sachs, 2001). In addition, in those same poor areas
the “disease burden” in terms of malaria diffusion increases the overall mortality rate
and hence reduces the growth rate of the economy. The diffusion of malaria as a proxy
of the adverse effect of geography is very important because this disease is strictly
related to insane environmental conditions (Diamond, 1997; Percoco, 2009; Gallup and
Sachs, 2001).
Over the historical period of observation of the present study, i.e. 1300-1861, the
diffusion of diseases as the plague, the smallpox, the cholera and the malaria plagued
Italian cities and reduced even significantly urban population. The Black Death in 1347-
1351 killed almost one third of the European population (Cipolla, 1974), while the
plague of 1630-1631 killed a similar proportion of Italian urban population with a
mortality rate ranging from 12% in Florence to 61% in Verona1 (Table 1).
[Insert Table 1 about here]
1 Interestingly, Cipolla (1989) argues that part of the variability in the mortality rates of the 1630-1631 plague was due to differences in urban health care institutions. In particular, in Tuscany a system of Uffici di Sanità (“Offices for public health care”) was particularly active. As a consequence, the mortality rate of Florence was very low (12%).

7
Between the Black Death and the last plague epidemics in 1630-1631, several episodes
of plague occurred in Italy. Cipolla (1974) reports 21 epidemics of plague in Venice and
23 in Florence2. Interestingly, for those types of diseases, physical geography may help
to reduce the disease burden. In particular, more isolated cities, possibly in mountain
areas, were comparatively less affected by epidemics3. However, in those cases,
geography plays also an opposite role by increasing transport costs and reducing
development of cities.
Besides climate and the relative disease burden, geography makes transport of goods
more costly and hence firms located in remote areas less competitive.
As convincingly argued by Duranton (1998), the process of economic development of
the pre-industrial city was deeply influenced by the “tiranny of distance”, that is
physical space and transport costs introduced relevant frictions in economic space. The
number of cities in a given system is thus a function of transport costs and agricultural
surpluses (Bairoch, 1988; Braudel, 1984; Pirenne, 1925). In particular, as demonstrated
by Duranton (1998), the “tyranny of distance” does not predict city size, rather sets it
upper and lower bounds on the size of cities. The reason is that the maximum city size
raises when all the agricultural surplus produced in the countryside is consumed during
the transport process. The lower bound is set by the same reasoning. In other words,
geography shapes urban development in a variety of ways, ranging from high transport
costs to the morphology that may significantly influence the location of economic
activities.
2 Note that the hypothesis of a positive impact of adverse geographical conditions has been convincingly tested by Nunn and Puga (2008) in the case of ruggedness of territories in Africa and its defensive role against slave trade. 3 Notice that the decision to locate cities in the past was made according to two competing objectives: the minimization of transport costs or the minimization of health and military risk. To this extent, mountain areas, being almost isolated, were particularly attractive for the second motive.

8
However, as noted earlier, the “tyranny of distance” does not fully explain actual city
size. In fact, the quality of institutions has been identified as a crucial source of
development at country, regional and urban level. From an institutional-economic
viewpoint North (1981, p.3) defined institutions as “the rules of the game in a society
or, more formally, are the humanly devised constraints that shape human interaction”.
In the pre-industrial period, guilds were the pro-market institutions, in the sense that
they aimed to increase inter-city trade in order to increase demand and production.
However, the system of guilds was only a part of the much more complex institutional
structure of pre-industrial cities.
Particularly interesting for the scope of the present paper is the seminal work by
DeLong and Shleifer (1993) in which they presented results on the relevance of regional
institutions in explaining urban development. In particular, in the case of Europe in the
period between 1000 and 1800, they found that cities under absolutist regimes grew less
than cities under non-absolutist governments, possibly because of higher taxation under
revenue-maximizing monarch4.
By analyzing the contemporary development geography of Italy, Putnam (1993) argued
that trust and the quality of local government does affect the level of development by
reducing transaction and coordination costs. Putnam (1993) also argues that social
capital is higher in areas in the North where, in the Early Middle Age, experiences of
independent city states were diffused5.
4 A similar result is presented in a recent paper by Henderson and Wang (2006) on contemporary worldwide cities. Interestingly, they find that technological innovations have large impacts on bigger cities, while the process of democratization does affect more smaller cities. Finally, those authors conclude that those opposing effects may be the reason why worldwide relative size distribution of cities has remained unchanged over 1960-2000. 5 In a recent and interesting paper, Guiso et al. (2007) have provided empirical support to the fact that the actual level of social capital in Central-Northern Italy municipalities are dependent on the communal past of the cities. Similarly, Tabellini (2007) finds that past political institutions explain current culture in European regions, which, in turn, is positively related to income level.

9
As from this view, the experience of independent communal republics (Repubbliche
Comunali) in several areas of the North has resulted in long-lasting civicness which in
turn has produced higher level of trust and social capital. Interestingly, the rise of
Repubbliche comunali in the North can be viewed as an historical accident. In
particular, in the Early Middle Age the main concern of Government was considered to
be the defense of cities from enemies attacks. In order to minimize defense cost, citizens
in the North self-organized into oligarchic democracies. In the South, Frederick II
maintained defense policy centralized along with a slight decentralization of fiscal
policy. There is no evidence on the differences in the effectiveness of the defense policy
between the two parts of the country, however, the economic consequnces of the choice
were persistent and large. In fact, in the aftermath of the death of Frederick II, rent-
seeking local lords brought Southern cities to underdevelopment because of higher tax
rates and poor property rights rules (Ascheri, 1994).
The hypothesis of Putnam (1993) hence postulates that a relatively minor difference in
de jure institutions resulted, in the long run, into considerable differences in de facto
institutions and social capital. But why do past political institutions influence the actual
level of development? One possible reason is the existence of multiple equilibria in the
process of intergenerational transmission of beliefs, for which agents with a low quality
culture will transmit good values only in case of shocks, while agents with good culture
always transmit good culture (Guiso et al., 2007).
Although appealing, this could be viewed as only one of the possible channels of
transmission of the institutional history of Italian cities.
A very important feature of the Repubbliche Comunali has been neglected by most of
the aforementioned literature, i.e. the fact that urban governments passed the so-called

10
Statuti Comunali, a sort of local constitutions. What is interesting in these laws is the
prevalence of the commercial law (as a sign of market orientation of Communal
institutions) which has been used until the 1950s and in some cases are still adopted in
some cities (Cattini and Romani, 2001)6. In fact, after the unification of Italy, the rules
formalized in the Statuti Comunali evolved into formal commercial habits maintained
by the local Chambers of Commerce.
Obviously, such norms have evolved over the centuries, but what I would like to point
out is the relevance of Statuti Comunali to enhance an early rule of law, persisting
across centuries as a formal economic institution.
The economic literature has reached a wide consensus on the relevance of the rule of
law in enhancing entrepreneurship and hence economic development (Audretsch, 2007).
Cities where norms were stable and written, governed by market-oriented institutions
were more likely to become important commercial or proto-industrial centers.
Interestingly, the persistence of the rule of law across the centuries guaranteed, along
with favorable economic geography conditions, the persistence of entrepreneurial
behavior. It should not be surprising to observe the birth of industrial districts in cities
and towns with a communal past (Cattini and Romani, 2001; Putnam, 1993).
The hypothesis of the relevance of Statuti Comunali as a source of long run
development is also in line with recent literature in economic geography. In fact, as
convincingly pointed out by Martin and Sunley (2006), among the source of path
dependence are also region-specific institutions which enable specific economic and
regulatory institutions. In particular, habits and conventions are among the most
6 The strength over the time of economic norms autonomously set by cities is confirmed by the fact that after the Pope State was established in Central Italy, annexing also cities which were previously city-states, Pope Innocenzo III gave wide autonomy to those city parliaments as for economic and fiscal norms

11
important driving factors of the location of new firms and hence for economic growth
(Boschma and Lambooy, 1999; Storper, 1997). It should be mentioned that also
Southern cities developed forms of autonomy from the central State. In the X century,
Southern Italy was sufficiently developed to attract merchants from all over the
Mediterranean Sea. Normans arrived in 999 and founded their Kingdom by conquering
or annexing cities in the South. The most important among those cities had the status of
universitas, i.e. a city endowed with an institutional structure very similar to the one of
German and French independent cities (Ascheri, 1994). Several reasons are at the heart
of long run failure of universitas, here I want to point out only the most important ones,
according to the seminal work by Ascheri (1994). First, although universitas had a
formalized corpus iuris, which regulated relationships both between the city and the
central government and between private agents, those norm were often violated by
Norman kings and by local lords in order to meet vested interests. Second, while
Repubbliche Comunali were democratic states with market oriented institutions,
universitas were ruled by local lords, mainly landowners, interested in maximizing
fiscal revenues and profits from agriculture. As a consequence, Southern cities have not
been congenial for firm birth for centuries.
To sum up, both geography and institutions can be thought to be at the heart of urban
development. However, institutional history may have persistent effects on economic
environment, not only through culture, as the previous literature has argued, but also
through formal norms evolving but persisting over the centuries. In the next sections,
after describing my dataset, I will provide some evidence supporting these hypotheses.
issuing power. Another sign of the importance of such norms is the fact that they persisted also after the process of legal convergence started in the aftermath of the Unification of Italy, occurred in 1861.

12
3. Urban evolution in pre-industrial Italy
3.1 The data
The data we make use of are mainly from Malanima (1998) who provides estimates of
population for cities with more than 5,000 inhabitants on a centennial basis over the
period 1300-1861 (i.e. 1300, 1400, 1500, 1600, 1700, 1800, 1861). Appendix 1 contains
the list of cities in the sample.
Some few details on the characteristics of the dataset on Italian cities may prove to be
useful. The choice of a 5,000 inhabitants threshold has been used to maximize the
number of cities in the sample and minimize eventual errors in population size. In other
words, the dataset includes centers when they exceed a population of 5,000 and
excludes them when those centers population fall below the threshold. Data have been
collected only once in a century because of the lack of reliable information for small
centers and for most of Southern cities. The characteristics briefly described so far pose
some problems in the econometric analysis of urban growth and development will be
addressed in Section 4.
As for urban history Malanima (2005) proposes three époques in the urbanization
process of Italy. The first phase occurred between the tenth century and 1350, during
which relatively new centers increased in population (Amalfi, Cuneo, Ferrara, Udine,
Venice and many other cities). At the same time urbanization rate became larger in the
Center-North than in the South. The second phase was during the period 1350-1861,
while the third phase starts with the Unification of Italy in 1861 and arrives up to
nowadays.
From the IV century on a decline in urbanization occurred and several cities
disappeared. However, in 1200 other cities experienced very large increase in

13
population: Alessandria, Amalfi, Catanzaro Cuneo, Fabriano, Ferrara, Foggia, l’Aquila,
Lecce, Macerata, Molfetta, Udine, Venice and Viterbo (Malanima, 2005). In the same
period, towns in the North and in the Center began to grow faster than Southern ones. In
1300 urbanization rate was higher in the Center-North (21.4%) than in the South
(18.6%). In this same period, the triangle formed by Florence, Milan and Venice
became the core of Italian development with 97 cities exceeding 5,000 inhabitants, 26
10,000 and 13 15,000 (Malanima, 2005). It should be mentioned that this is the period
of major diffusion of Repubbliche comunali, hence a period of important institutional
innovation.
The second period of Italian urban history covers a very long time span and almost
coincides with the period of observation of the present section, i.e. 1350-1870.
Malanima (2005) found that the Italian urbanization rate declined over this period from
21.4% to 16.2%. It is interesting to notice that the pattern of urbanization rate follows
the fall of the centrality of the Italian economy over the XVI-XIX centuries (Braudel,
1984). As figure 1 shows, in 1500 the urbanization rate in Central-Northern Italy was
16.4%, almost three times the Western Europe average and five times the English rate.
This figure changed dramatically at the end of the period under consideration as the
Italian urbanization rate was 3.4 points lower than the European average and only one
third of the English rate.
[Figures 1 and 2 about here]
The decline of the relevance of Italy in the European context is also reflected by the
decline of the Italian population as a fraction of the European population as a whole. In

14
fact over the period 1300-1800 the percentage of the Italian population over the total
population of Europe fell from 30.5% to 15.9% (figure 2).
Interestingly, during the period 1300-1861, both total and agricultural productions
declined substantially (figure 3), and the share of agriculture to total GDP slightly
increased (figure 4). As a result, urban and agricultural real wages fell by about 50% in
1860-1870 with respect to 1320-1330 (figure 5). What is interesting is the co-movement
of all time series implying no substantial divergence between urban and countryside
economic conditions neither in terms of production nor of wage differential. However,
concerning with wage differential, which in the Harris-Todaro model of urban migration
is crucial in explaining the residential choice of workers and then the change in urban
population with respect to the rest of the country, it should be mentioned that as we only
have wages measured in terms of 1860-1870 indices, we cannot compute a clear urban-
agricultural wage differential. However, what it emerges from figure 5 is the fact that,
as the historical patterns of both wage rates are common, the differential between the
two could not have widened substantially, i.e. such to explain the fall of the
urbanization rate (especially if compared to other European countries).
[Figures 3, 4, 5, 6 about here]
From previous figures, it emerges that the urbanization rate in Italy fell substantially
between 1300 and 1860, although differences between urban and countryside economic
conditions remained almost unchanged. As Italian population almost doubled during
that time period (figure 6), this implies that there are other than purely economic driving
forces in urban development, that in our case we suspect to be both geography and

15
institutions. In fact a declining level of urbanization joint with an increasing total
population implies a higher growth rate in the countryside than in the city. If we
consider wage differential as an index of living standard and if this is almost unchanged
over the time period of observation, this implies that there should be centripetal forces
pushing population out of the cities. In addition, it is likely that this period of urban
decline did not affect all cities or that this decline had different intensity according to
given city characteristics. In this paper I am interested in verifying whether geography
and institutions are determinants of urban competitive advantage leading in the long
run, to divergence in the levels of development.
As table 2 shows, in the 1300 the biggest city was Milano, while Palermo was the
biggest city in the South, as well as the only Southern city in the ranking. The hierarchy
in 1300 was deeply influenced by the legacy of Repubbliche Comunali as Bolgogna,
Brescia, Cremona, Firenze, Padova, Siena as well as by the presence of two of the four
Repubbliche Marinare as Genova and Venezia (the others were Amalfi and Pisa).
Interestingly, it seems that, with only few exceptions, the core of the urban hierarchy in
Italy as in 1861 raised in 1500 and stabilized over the centuries up to the Unification,
occurred in 1861 and later on in 2001 with the only exception of Naples.
[Insert tables 2 and 3 about here]
In table 3 we present average population by macro-region and city size. Also in this case
the well known Italian dualism is evident, by showing that average city size in the
Center-North was almost double than in the South, although a slight process of
16
convergence occurred over the centuries as the average size of Northern cities decreased
and the one of Southern ones increased.
3.2 City size distribution, 1300-1861
In the previous sub-section I have presented some descriptive statistics on the size of
Italian cities and have found a process of very slight convergence, if not persistence, in
city size. This result is in line with works by Eaton and Eckstein (1997), Dobkins and
Ioannides (2001), Black and Henderson (2003) and Ioannides and Overman (2003)
found that there is a wide relative size distribution of cities in large economies that is
stable over time. Big and small cities coexist in equal proportions over long periods of
time.
Within that relative size distribution, individual cities are generally growing in
population size over time; and what is considered a big versus small city in absolute size
changes over time. While there is entry of new cities and both rapid growth and decline
of cities nearer the bottom of the urban hierarchy, at the top city size rankings are
substantially stable over time. Size distributions of cities within countries, at least at the
upper tail are well approximated by a Pareto distribution.
Building on the paper by Eaton and Eckstein (1997), Black and Henderson (1999)
propose a model of endogenous growth in a system of different types of cities. The
authors consider a typical trade off a firm faces in the location decision making that is
the one between localized economies of scale and congestion costs. They find that,
given steady national population growth and human capital accumulation, the size and
17
number of cities grow, although maintaining a constant relative size distribution7. This
constant rank-size rule is also known as the Zipf’s law for cities.
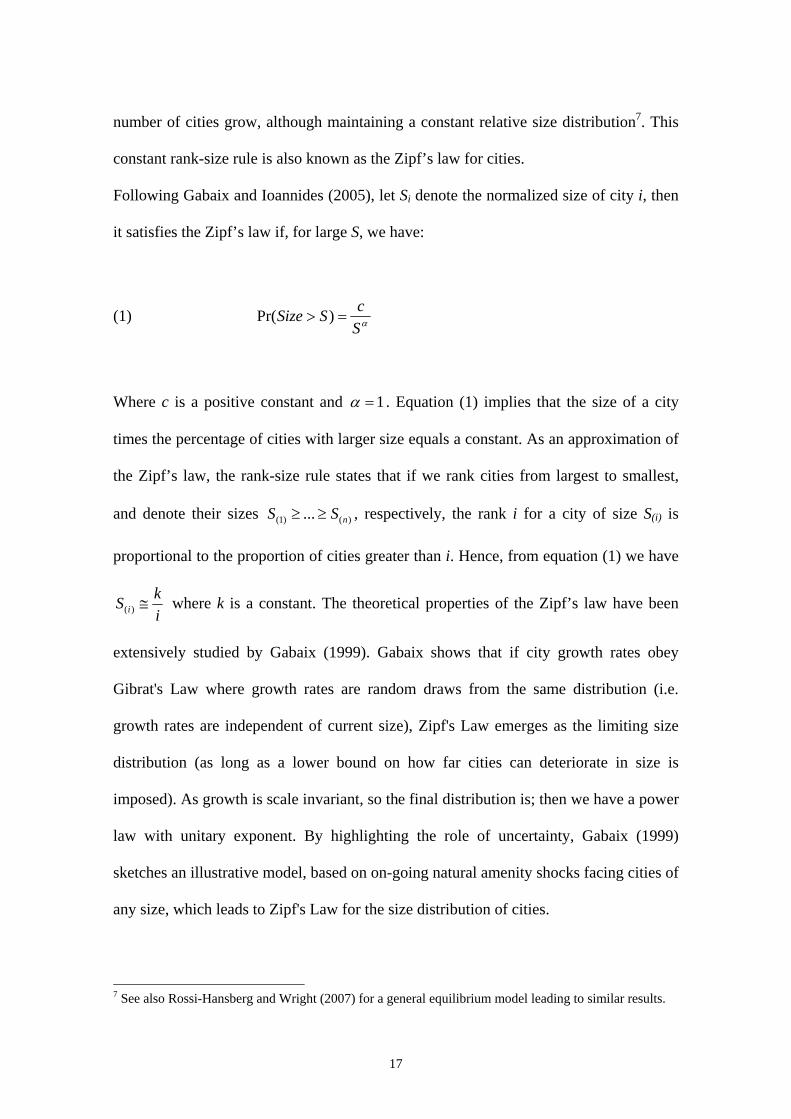
Following Gabaix and Ioannides (2005), let Si denote the normalized size of city i, then
it satisfies the Zipf’s law if, for large S, we have:
(1) αScSSize => )Pr(
Where c is a positive constant and 1=α . Equation (1) implies that the size of a city
times the percentage of cities with larger size equals a constant. As an approximation of
the Zipf’s law, the rank-size rule states that if we rank cities from largest to smallest,
and denote their sizes )()1( ... nSS ≥≥ , respectively, the rank i for a city of size S(i) is
proportional to the proportion of cities greater than i. Hence, from equation (1) we have
ikS i ≅)( where k is a constant. The theoretical properties of the Zipf’s law have been
extensively studied by Gabaix (1999). Gabaix shows that if city growth rates obey
Gibrat's Law where growth rates are random draws from the same distribution (i.e.
growth rates are independent of current size), Zipf's Law emerges as the limiting size
distribution (as long as a lower bound on how far cities can deteriorate in size is
imposed). As growth is scale invariant, so the final distribution is; then we have a power
law with unitary exponent. By highlighting the role of uncertainty, Gabaix (1999)
sketches an illustrative model, based on on-going natural amenity shocks facing cities of
any size, which leads to Zipf's Law for the size distribution of cities.
7 See also Rossi-Hansberg and Wright (2007) for a general equilibrium model leading to similar results.

18
In recent years, an increasing number of papers have appeared in order to estimate
empirically the evolution of the Zipf’s law, with particular reference to US cities8. Black
and Henderson (2003) study the evolution of city size distribution of US cities along the
XX century, finding a stable wide relative size distribution of cities which is supported
by different types of cities with different industrial compositions (specializations). The
size distribution exhibits some increasing relative concentration; they associate with the
recent relative growth of services in the US economy. Along the same line, Dobkins and
Ioannides (2001) find evidence of parallel growth in US cities, implying a α constant
over time.
The classical regression approach to the test of the Zipf’s Law consists in estimating:
(2) log(rank)= constant + α∗log(population) + ε
where ε in an iid error term. If 1=α , then the rank-size rule holds. One of the main
concerns is the consistent definition over time of the threshold population size the Zipf’s
Law is supposed to hold. Some authors use an absolute cut-off point (e.g., urban
population of 50,000 or more); some use a relative cutoff point (e.g., the minimum size
city included in the sample should be 0.30 mean city size); and others look at a set
number (e.g., 50 or 100) of the largest cities.
[Insert table 4 about here]
8 See e.g. the survey in Gabaix and Iannides (2005).

19
In table 4 Panel A I report estimates of the Zipf’s exponent for both the full sample and
the upper tail of the distribution, i.e. cities in the top one third of size distribution. In
both cases, it is found a slight decline in the concentration of city population, although
the Pareto distribution, as expected, is very likely to hold only for larger cities.
Interestingly enough, from 1600 on, the distribution of cities in the upper tail has been
substantially stable, confirming the preliminary evidence offered in table 2. This result
holds partly also for the full sample, even though the decline in the Pareto exponent
seems to be more marked.
Panels B and C in table 4 present empirical results for the Zipf’s Law estimation for the
Center-North and the South. Although in some cases the number of observations is low
and does not allow an estimation of the exponent of the power law, it nevertheless
emerges that urban hierarchy was more pronounced in the Center-North than in the
South, although in both cases, the Pareto distribution seems to hold for the top 1/3 of the
distribution. In addition, it is interesting to note how in the XIV century, the
concentration of population among cities was stronger in the South than in the North,
but a process of convergence towards a 0.946-0.992 value of the exponent took place
over the centuries, leading to a substantial equal distribution of city population between
Center-Northern and Southern cities.
In this section I have reported results on the long run stability of urban hierarchy in
Italy, although a slight process of deconcentration, along with a decline in urbanization
rate, occurred. This does not necessarily imply a lack of urban growth, rather a process
of parallel growth between the groups of large and small-medium cities. In order to
investigate the determinants of this growth, in the next section I present an econometric
analysis of urban development.

20
4. Geography and institutions in urban development
4.1 Description of the main variables
As stated in the previous sections, there are good reasons to think that urban
development has been historically influenced by both geography and institutions. In the
model sketched by Duranton (1998), the higher transport costs, the lower the bound
limiting city size was. In other terms, transport costs are at the heart of city size. In our
analysis, I proxy transport costs by means of several variables: the altitude, road and
waterways accessibility and the existence of a port9.
As for altitude, we expect a negative correlation of this variable with urban development
as expressed by city size, as transport costs are higher when goods are shipped to or
from mountain areas. As a consequence and ceteris paribus, mountain cities are less
attractive to people because of lower productivity, lower wages and higher prices of
goods.
Our second measure of geography concerns roads and waterways accessibility. Road
infrastructure network was mainly built by Romans and it expanded slowly over the
time. Our index of accessibility takes the value of 1 if the city was on the Roman road
network and 0 otherwise. As for inland waterways accessibility, our index is a dummy
variable taking the value of 1 if the city was on a navigable river and 0 otherwise10
Finally, I think at the presence of a port in the city as a major facility, capable to
influence deeply the process of development (Fujita and Mori, 1996). In fact, the
dramatic increase of international trade in late Middle Age was mainly driven by two
9 Appendix 2 provides a detailed description on the sources and construction of all variables. 10 Both accessibility variables are time-invarying. In a previous version of the paper I used road accessibility indicators as varying across the time because of network expansion; however, as econometric results were qualitatively similar, I decided to rely on the time-invarying variable in order to reduce measurement error.

21
factors (du Jourdin, 1993): innovation in the shipping technology and the rise of
capitalist institutions. As firstly argued by Braudel (1984) and empirically demonstrated
by Acemoglu et al. (2005), the focal point of international trade up to the end of XVII
century was the Mediterranean Basin. And in this geographical context, Italian cities
played a crucial role both as shippers and traders (du Jourdin, 1993). However, with the
raise of Atlantic trade, the baricenter of international trade shifted to the Northern
Europe range and exacerbated poor economic conditions of cities in the South whose
economies, highly specialized in agriculture, suffered substantially of the competition of
cheaper goods coming from overseas (De Rosa, 2003). However, as pointed out by
Cipolla (1965) and Munro (1999), geography, in terms of distance from the Northern
range, cannot be considered as the only reason for the decline of some of Italian cities in
the XVIII century as also different sailing technologies and the rise of risks associated
with local conflicts in the Mediterranean basin were also key factors11.
In the present paper we will consider also the economic geography that characterizes
city locations. In fact, the New Economic Geography literature has convincingly
demonstrated the importance of market potential as one of the determinants of trade
flows. With regard to cities, de Vries (1984) proposed an index, also used by Bosker et
al. (2008), that defines the urban potential as:
(3) ∑= ⋅
=n
j ijij
ji Distw
PoppotentialUrban
1
11 Pozzolo (2007) reports an increase of 250% circa between the end of the XV and the end of XVII centuries in insurance rate for goods shipped in the Mediterranean Sea.
22
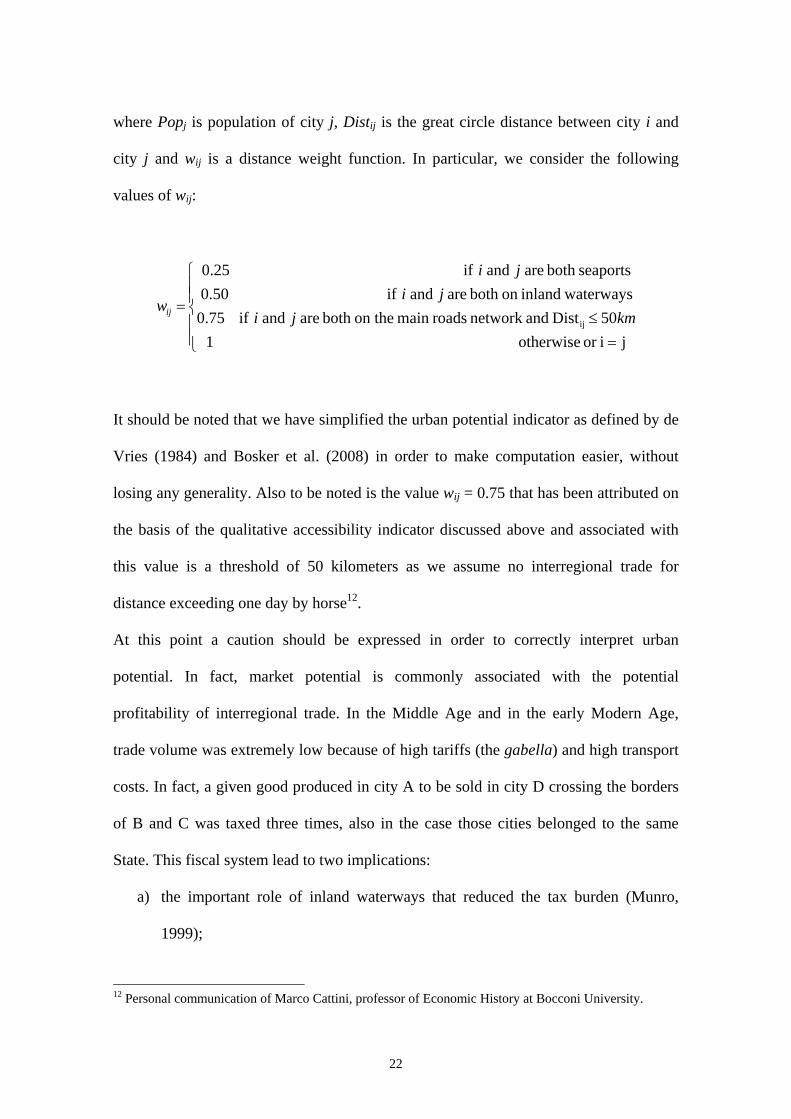
where Popj is population of city j, Distij is the great circle distance between city i and
city j and wij is a distance weight function. In particular, we consider the following
values of wij:
⎪⎪⎩
⎪⎪⎨
⎧
=≤
=
jior otherwise 150Dist andnetwork roadsmain on theboth are and if 75.0
waterwaysinlandon both are and if 50.0seaportsboth are and if 25.0
ij kmj i ji
j i
wij
It should be noted that we have simplified the urban potential indicator as defined by de
Vries (1984) and Bosker et al. (2008) in order to make computation easier, without
losing any generality. Also to be noted is the value wij = 0.75 that has been attributed on
the basis of the qualitative accessibility indicator discussed above and associated with
this value is a threshold of 50 kilometers as we assume no interregional trade for
distance exceeding one day by horse12.
At this point a caution should be expressed in order to correctly interpret urban
potential. In fact, market potential is commonly associated with the potential
profitability of interregional trade. In the Middle Age and in the early Modern Age,
trade volume was extremely low because of high tariffs (the gabella) and high transport
costs. In fact, a given good produced in city A to be sold in city D crossing the borders
of B and C was taxed three times, also in the case those cities belonged to the same
State. This fiscal system lead to two implications:
a) the important role of inland waterways that reduced the tax burden (Munro,
1999);
12 Personal communication of Marco Cattini, professor of Economic History at Bocconi University.

23
b) the relevance of interregional trade was very small.
Concerning with point b), it should be noted that the largest portion of trade was
between the countryside and the core city. In fact, larger cities were often the result of
large cultivable fields. All those reasons lead me to impose a cut-off point at 50
kilometers for urban potential.
Concerning with institutions, we make use of the data in Tabellini (2007) in which past
regional institutions are coded by following the variable “Constraints on the Executive”
as in the POLITY IV database. This variable (institutions) varies from 1 (unlimited
authority) to 7 (accountable executive, constrained by checks and balances). I have
extended Tabellini’s (2007) dataset to cover 1300 and 1400. To this end, the main
sources of information were Ascheri (1994) and DeLong and Shleifer (1993). It should
be stated that our measure of institutional quality is at regional level, while some cities
in the same political system could differ because of their culture and their institutional
history. In particular, I refer to the fact that a number of Center-Northern cities in the
Early Middle Age were independent republics where capitalistic institutions were key in
shaping economic development. The relevance of Comuni was also recognized by
Putnam who argued that North-South differences in the civicness could be explained in
terms of civic ethos with respect to property rights protection, inequality aversion and
rule of law. All those features, that largely affect economic development, are a direct
consequence of the institutional past of cities and regions, and in particular to the
existence of independent and democratic forms of urban government (Ascheri, 2006;
Guiso et al., 2007; Milani, 2005). In my analysis I advance the hypothesis that cities
under regional capitalistic institutions regime with a Comune past were more developed
24
and grew more than cities under absolutist regimes. In my dataset, the time-invarying
variable comune takes value 1 if the city was a Repubblica Comunale and 0 otherwise.
Bosker et al. (2008) make use of a dummy variable on capital cities, meant to be a
politico-institutional variable. However, I could not find reliable information on this as,
according to Alfani (2005), during the period 1300-1861 too many cities lost or took the
“capital city attribute”. In particular, by presenting some descriptive analysis on some of
the North Italian capitals, he defines the rationalization of capital cities occurred in the
XVI-XVII centuries as a “capital holocaust”. In addition, several so-called “capitals”
were actually Comuni. As for the aim of this paper I prefer to rely on the variable
comune indicating the communal past of the city as it has a clear interpretation in terms
of institutions impact.
According to the analysis of Ascheri (1994), medieval universities should be thought to
be as liberal institutions as teaching was relatively free, as well as the internal
organizations of both students and professors cultural activities. This implies that the
presence of a university in pre-modern cities should not be considered as a proxy for
human capital, rather as an institutions improving urban governance. In order to
estimate the impact of university location, I introduced the variable universityit which
takes value 1 if city i had a university in century t and 0 otherwise.
4.2 Empirical evidence
I start the empirical analysis by considering urban development differences. The first
specification I test is as follows:
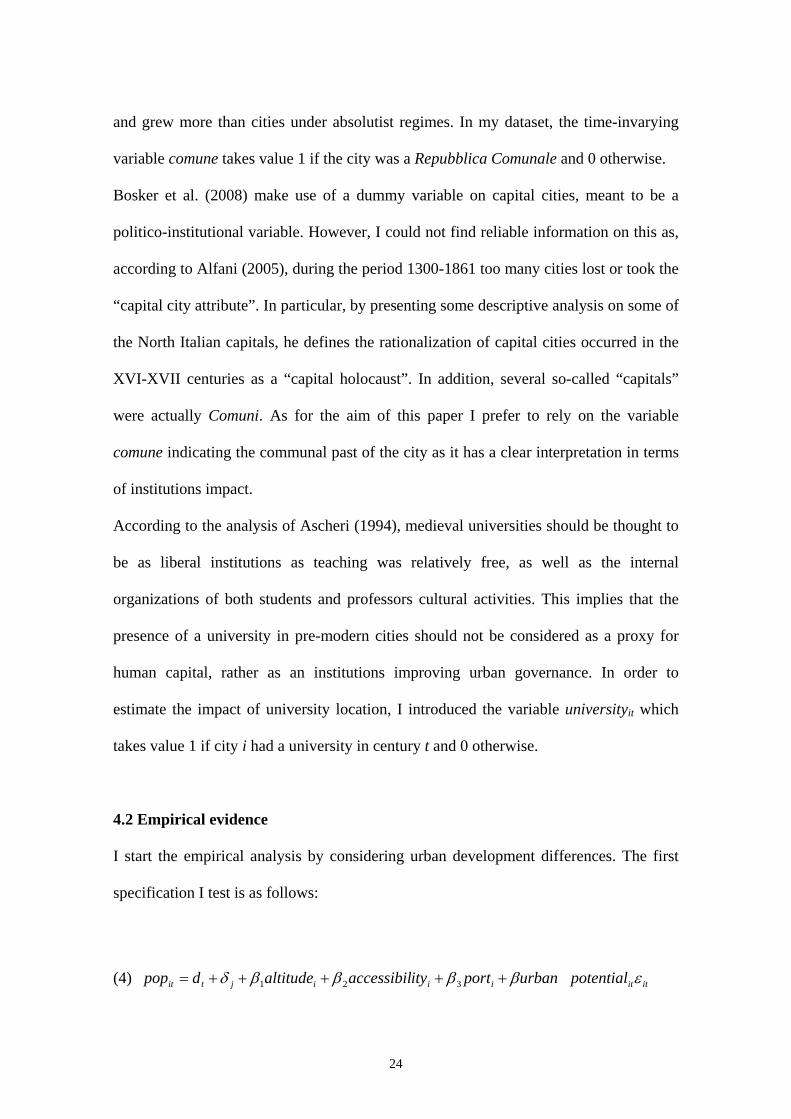
(4) ititiiijtit potentialurbanportityaccessibilaltitudedpop εββββδ +++++= 321

25
where popit indicates log-population of city i at time t, altitudei is a dummy variable
taking value of 1 if city altitude is higher than 500 meters, accessibilityit indicates the
road and inland waterways accessibility indices described in the previous sub-section.
Variable porti is a dummy variable for the presence of a major port. Urban potential is
expressed in log and defined as from equation (3). Equation (4) is estimated by means
of a GLS random effect estimates with a complete set of time and regional dummies (dt
and δj respectively).
Model 1 in table 5 reports results for equation (4). All the estimated coefficients have
the expected signs. In particular, mountain cities have smaller population than cities,
although it is not found to be significant. The presence of a port is of particular
relevance for urban development as it increases city population of about 5,200
inhabitants. As for accessibility, it is found that both roads and waterways have very
similar effects on urban development, increasing population of 1,300 inhabitants if a
city was located on a major road or on a navigable river. The elasticity of log-population
is found to be very large (0.59) and significant.
Let us now turn to consider the role of institutions in influencing urban development. In
table 5 (in models 2, 3) we report empirical estimates of a slightly modified version of
(4), that is:
(5) itijtititjtit comunensinstitutioXuniversitydpop εδγβαδ ++++++= −1)ln(
where universityit-1 stands for the presence of a university institution in the city in
century t-1. One may argue that this variable is probably affected by endogeneity.

26
However, as convincingly argued by Ascheri (1994), all along the Middle and Modern
Ages, universities were founded not as a specific result of government planning, but as
a sort of an unpredictable choice made by one or a group of experts in given matters.
Hence, in our analysis we will not consider the university variable as an endogenous
regressor, although, as a caution, we consider the lagged value of the variable13.
The variable institutionsjt is the quality of regional government at time t, while comune
is the variable described above denoting the experience of free city state. Matrix Xit is
the set of variables considered in regression (4).
Interestingly, the coefficients of all the additional variables in models 2 and 3 have the
expected signs and are found to be highly significant. Evidence is also found on the
positive effect of regional institutions implying that high quality institutions in the
region provided fertile soil for urban development. Also to be noted is that when I
consider institutions, urban potential becomes not significant. The experience of free
city state in the Early Middle Age (commune) increases city population by 1,480
inhabitants, while the presence of a university by 2,460.
In models 4 and 5, I divided the sample between cities with population larger than or
equal to 10,000 inhabitants and smaller cities. The burden of physical geography is
found to be significant only for larger cities, implying a sort of nonlinear effect of
geography between large and small cities. The presence of a university turns out to be
very large and highly significant for larger cities, while the Communal past is important
in explaining urban population only in the case of smaller cities. As from results in
models 4 and 5, it seems that from an institutional viewpoint university is more
important than the institutional past of the city only for large cities. Finally, in model 6,
13 To this end, I have extended the dataset to consider also 1200 only for the university variable. However, it should be mentioned that very few universities were established at that time.

27
I look at development differentials within the North in order to test the robustness of the
coefficient associated to comune, which, in this case, slightly increases, while its
significance is maintained.
Although I have considered regional dummy variables and several time-invariant
variables in the specification in (5), I cannot exclude the existence of further
heterogeneity. In order to address this issue, I estimated fixed effects regressions where
all time-invariant variables (port, comune, altitude, accessibility) have been interacted
with a full set of time dummy variables. Panel B reports coefficient estimates of time-
varying variables as well as p-values of tests for joint significance of interacted time-
invariant variables. Physical geography is found to be significant, while the elasticity of
urban development to urban potential is still not significant. As for institutions,
university is positive and marginally significant only in models 7 and 8, while there is
no evidence of particular relevance of regional institutions. Interestingly, comune
maintains its significance across all models as from the p-values of the significance
tests.
The next step in our econometric analysis is the estimation of a growth regression in the
form:
(6) itjtittjtitit nsinstitutioXpopdpoppop εδγβαδ ++++++=− −− i1100 comune)ln()ln()ln(
Results in table 6 show that a city located on the mountain had, on average, a growth
rate of the population lower by almost ten percentage points than a city in the lowland,
and as from models 3 and 6, the presence of a port increased the growth rate by 31.6-
32.6%, depending on city size. Concerning institutions, it is interesting to note that

28
university has a very large and significant impact on urban growth. It should be stated
that the specification in (6) considers as a dependent variable the centennial growth rate.
This does not pose particular problems in the estimation and interpretation of the
coefficient estimates, with the sole exception of the period 1800-1861 which is
unequally spaced with respect to the others. Although results are not reported for the
sake of brevity, I have estimated equation (6) by excluding that period and found that
results do not change significantly.
[Tables 6 and 7 about here]
Because of the structure of the database, previous analysis could suffer from a selection
bias imposed by logarithmic specification for cities with a population smaller than
5,000. In order to overcome this problem, table 7 reports estimates for balanced panels
for both level and growth regressions. Interestingly, comune and university preserve
their sign and significance, while institutions loses its significance. This result casts
some doubts on the relevance of regional institutions in explaining urban development,
once heterogeneity is fully considered. A similar consideration applies to the urban
potential.
Accessibility is found to be significant, while altitude is not significant (with the
exception of model 5) and in one case changes the sign of the coefficient.
The econometric evidence presented so far shows a plausible link between institutions,
geography and urban development. However, do this relationship hold also in the long
run? In the next section I will then address the issue of whether and how geography and

29
institutions are also determinants of long run development of Italian cities through their
effects on firm density.
5. The historical roots of agglomeration economies
In the previous section I have estimated models of urban development in which the role
of institutions and geography has been highlighted and tracked across several centuries.
However, as pointed out in Section 2, both categories of variables are suspected to be
among the determinants of path dependence in urban development.
A large body of literature has provided evidence on the positive effect of firm density
on productivity, as a measure of agglomeration economies. Since the seminal work by
Ciccone and Hall (1996), the major challenge of those studies has been the choice of the
right set of instruments needed to identify the parameter associated with the density of
economic activities. As recognized and discussed in Krugman (1991b), industrial
location follows a path dependent process, mainly imposed by increasing returns. In this
light, Combes et al. (2009) proposes the estimation of economies of agglomeration in
France by using as instruments for the density of firms population density in 1831 and
other land characteristics. They find, as previous literature, that the elasticity of wage
and productivity to firm density is very close to 0.1.
As discussed in Section 2, in the case of Italy, the legacy of Repubbliche Comunali
consisted in a sound and stable body of local commercial laws, the so-called Statuti
Comunali, which enhanced private firm birth and, in the long run, industrial
development. In the model I have in mind, the experience of free city states should be
correlated to actual firm density because of the persistence of rules and laws protecting
property rights.

30
Combes et al. (2009) estimate the impact of firm density on wages and total factor
productivity. Both variables are not available in the case of Italian cities, hence I will
use taxable income per capita as a measure of wage or development.
From a formal point of view, I will estimate a 2SLS model of the form:
(7) ijiiiij nsinstitutiocomuneuniversityXdensityfirm ξϖδγβα +++++=
(8) iiii densitycfirmbXaincome ε+++=
where firm density for city i in region j is the (log) of the ratio between the number of
firms and total city surface in 2001, university is a dummy variable taking value 1 if the
city had a university in 1861 and 0 otherwise, institutions is the average across time of
the variable measuring the quality of regional institutions, income is (log) taxable
income per capita in 2001. In vector X I consider a set of variables including regional
dummies, altitude and port.
Before proceeding with the description of results, some comments on the hypotheses
underlying the estimation of model (7)-(8) are needed.
Combes et al. (2009) make use of population density in 1831 as an history-related
instrument to explain exogenously the current level of firm density in France. In the
previous section I have shown that urban population of Italian cities is clearly related to
past institutions and some of the geographical variables. With these results in mind, I
have not chosen population in 1861 (or in any other century), rather have I considered

31
its determinants, so that in the first stage regression in (7) institutional and geographical
variables appear in place of past population.
The econometric analysis on the panel of cities has pointed out that only some of the
geographical variables have had an effect on city population. That analysis lead my
choice of the instruments in (7). In particular, it has been found that urban potential has
low explanatory power across all the specifications, hence, to limit my discussion on the
quality of the instruments, I have decided not to consider is as an instrument for firm
density.
The exclusionary restrictions impose that university, comune and institutions influence
income only through the density of firms. This hypothesis is justified by the discussion
in previous sections, so that we assume that good institutions enforced property rights
protection through a set of norms and commercial habits which enhanced private
initiative. In the spirit of Putnam (1993) and Tabellini (2007), Guiso et al. (2007)
assume that comune influence culture in Italian cities. However, one of the variables
they consider is the number of not-for-profit organizations per capita, which, in my
case, can be reasonably considered to be coagglomerated with for-profit firms. In any
case, in what follows, I will provide a number of test for the validity of the instruments.
A final point to be discussed concerns the choice of the dependent variable in (8), which
is income and not, as it is common in the literature, productivity or wage rate. However,
the aforementioned literature assumes that denser places produce higher productivity
and wages which is reasonably associated with higher income per capita. Hence, in the
case of equation (8) I will consider a sort of reduced form estimation linking the
predicted value of firm density to income, without providing the intermediate effect on
productivity or wage.

32
[Tables 8, 9]
In table 8 I report results of the estimation of equations (7)-(8). In models 1 and 2 in
Panel A, in particular, I report coefficient estimates for the whole sample. The
coefficient for port is significant and large, while there is no evidence of the impact of
altitude on the density of economic activities. The coefficient for university is
significant and larger than the coefficient for comune, while institutions is found to be
significant at 5%. In Panel B, I report estimates of second stage regressions. It is found
that the elasticity of income to firm density is very close to the value 0.1, as discussed in
Combes et al. (2009) and this is highly significant. The other variables altitude and port
are found to be not or marginally significant in explaining income in the cities of the
sample. In both models, the Hansen J test for over-identifying restrictions have a very
large p-values, although it seems that the quality of the instruments is lower when
considering also the variable institutions, which is reasonable, as this variable is
measured at regional level. Also the F statistic for weak instruments have values
comfortably large.
In model 3 I introduce a different variable in place of comune, i.e. statuto. This variable
is very likely to be measured with error as it takes the value of 1 if the city had a Statuto
Comunale in the Middle Age and 0 otherwise. The reason why this is measured with
error derives from the fact that the source is the Statuti Comunali collection maintained
by the Senate of the Italian Republic. This collection cannot be considered as complete
because some cities may have had a Statuto but it may have not been collected by the
Senate for some reasons. Hence, the variable statuto may be under-measuring the

33
phenomenon I am interested in. Also note that the correlation between comune and
statuto is approximately 0.30. This variable is nevertheless interesting as it both
provides a clearer rationale for the long run regressions in (7) and (8) and because it
provides a robustness check for comune. As from Panel A, I found that the coefficient
for statuto is larger than the one for comune, while the elasticity to firm density is very
close to the one in model 2. In addition, no substantial changes occur in the tests for the
quality of the instruments.
Models (4) and (5) present the results when considering differences within the Center-
North. It is found that the coefficient associated with university decreases, while the one
for comune is higher. The variable statuto is found to be only weakly significant,
although in the specification in model (5) the p-value of the test for over-identifying
restrictions is particularly high. Also in this case, however, the elasticity of income to
firm density is very close to 0.1.
The orthogonality tests on my instruments cannot reject the hypotheses that past
institutions have an impact on income only through firm density. As a further check, in
table 9, I add the institutional variables one at a time. If the instruments are valid, the
coefficient associated with these additional regressors must be not significantly different
from zero and the elasticity to the density of firms should remain significant and stable
across the specifications. Results in table 9 confirm my hypotheses, although in the case
of institutions the p-value for the Hansen J test is low.
Overall, the results presented in this section confirm the hypothesis that industrial
development, as measured by firm density, is associated with a history of good
institutions. As for geography, I have found that the presence of a major port is

34
significant in explaining firm density, while it is not found to be relevant in explaining
income per capita.
6. Conclusion
In this paper, I investigated the urban development process of Italian cities over the
period 1300-1861. Recent economic literature has proposed two conflicting views of
economic development, the “institutions view” and the “geography view”. In the spirit
of a model of pre-industrial city, we espouse a third was that may be called the
“institutions and geography view”, that is, the development process, at least at local
level, is deeply influenced by both the quality of institutions and the geography burden.
By making use of a new dataset on a large panel of Italian cities, I have provided some
econometric evidence in support to this research hypothesis. In particular, we have
found that accessibility and the presence of a seaport were as important as good formal
institutions for urban development. Interestingly, also the presence of a university has
been found to be key in the making of modern cities, although this variable should be
not considered as measuring the presence of human capital, rather as a liberal (though
not necessarily pro-market) institution. Although robust, our results do not explain
completely the exponential growth of cities, such as Genoa, and the fall of others, such
as Venice (figure 7), as in the former the quality of institutions were considered to be
very low, whilst in Genoa and Venice pro-market institutions ruled the cities for
centuries. Acemoglu and Robinson (2006) have highlighted the fact that de facto
institutions may exacerbate economic conditions by lowering the degree of political
competition. On this point, we have provided some descriptive evidence showing that
the higher the turnover rate in city councils, the higher the growth rate of the economy.
35
In the case of Genoa and Venice, it should be noted that the structure of trade contracts
in the cities was a key institution in the making of urban development. Puga and Trefler
(2007) points out how the commenda could be thought to be at the heart of Venice
decline because of its status quo bias, while Greif (2006) demonstrates how the
podestaria should be thought to be one of the main causes of the Genoa’s decline during
the XIII century14.
[Table 10; Figure 7]
Despite the specific cases, what is relevant is the fact that in an urban context the
mechanisms of elites’ power conservation were key in the development process
(Acemoglu and Robinson, 2006; Duranton, 1998). On this point, table 10 shows the
turnover rate and the percentage of city council seats to top ten historical families in
three North Italian cities, with very similar formal institutions. It is interesting to note
that, with the exception of Piacenza over the period 1600-1800, the higher the turnover
rate, the higher the growth rate of the cities was.
To sum up, my historical evidence points at a clear role of past institutions and of first
nature geography in explaining cross-city variation of development across the centuries.
My analysis also suggests that those same forces should be thought to be at the origin of
agglomeration economies in Italy, especially in the Center-Northern part of the country.
In particular, by making use of instrumental variable regressions, I have found that the
density of economic activities is influenced positively by good past institutions and by
the presence of a port. The elasticity of per capita income to firm density is then found
to be 0.08-0.1 depending on the specification. Although these results should be taken
14 However, as it emerges from figure 7, it seems that Genoa recovered later on.

36
cautiously as the dependent variable is not wage or productivity, they nevertheless point
out the long run determinant of institutions and, only in part, of geography. I have
interpreted these results in the light of the persistence of the rule of law in the cities that
passed Statuti Comunali over the centuries.
References
Acemoglu, D. and Dell, M. (2009), Beyond Neoclassical Growth: Technology, Human Capital, Institutions and Within-Country Differences, American Economic Journal: Macroeconomics, forthcoming. Acemoglu, D., S. Johnson, and J.A. Robinson (2001), The Colonial Origins of Comparative Development: An Empirical Investigation, American Economic Review, 91(5):1369-1401. Acemoglu, D., S. Johnson, and J.A. Robinson (2002), Reversal of Fortune: Geography and Institutions in the Making of the Modern World Income Distribution, Quarterly Journal of Economics, 117(4):1231-1294. Acemoglu, D., S. Johnson, and J.A. Robinson (2005), The Rise of Europe: Atlantic Trade, Institutional Change and Growth, American Economic Review, 95:546-579. Acemoglu, D. and J.A. Robinson (2006), Economic Backwardness in Political Perspective, American Political Science Review, 100(1):115-131. Alfani, G. (2005), Tono istituzionale e migrazioni urbane: il ruolo dell’acquisto o della perdita dello status di capitale nelle dinamiche demografiche delle città italiane, Università Bocconi, mimeo. Ascheri M. (1994), Istituzioni medievali, Bologna: il Mulino. Ascheri M. (2006), Le Città-Stato, Bologna: il Mulino. Audretsch, D. B. (2007). The Entrepreneurial Society. Oxford: Oxford University Press. Bairoch, P. (1988), Cities and Economic Development: From the Dawn of History to the Present, University of Chicago Press, Chicago. Black, D. and J.V. Henderson (2003), Urban Evolution in the USA, Journal of Economic Geography, 3,343-373. Black, D. and J.V. Henderson (1999), A Theory of Urban Growth, Journal of Political Economy, 107, 252-84.

37
Boschma, R.A. and Lambooy, J.G. (1999), Evolutionary Economics and Economic Geography, Journal of Evolutionary Economics, 9:411-429. Bosker, M. and Garretsen, H. (2009), Economic Development and the Geography of Institutions, Journal of Economic Geography, 9(3):295-328. Bosker, M., Brakman, S., H. Garretsen, H. de Jong, and M. Schramm (2008), Ports, Plagues and Politics: Explaining Italian City Growth 1300-1861, European Review of Economic History, 12:97-131. Braudel, F. (1984), Capitalism and Material Life, 1400-1800, Fontana Collins, London. Cattini, M. (1984), Alla ricerca delle congiunture sociali: i ritmi del ricambio politico nei ceti dirigienti urbani e rurali dell’Emilia moderna, in Proceeding of the Conference I ceti dirigenti in Italia in età moderna e contemporanea, Del Biano Editore. Cattini, M. and M.A. Romani (2004), Per lo studio delle élites municipali di due capitali di stato: Parma e Modena nei secoli dell’età moderna, Cheiron, 41:101-133. Ciccone, A. and R. Hall (1996), Productivity and the Density of Economic Activities, American Economic Review, 86(1): 54-70. Cipolla, C.M. (1965), Guns and Sails in the Early Phase of European Expansion, 1400-1700, Collins Sons & Co., London. Cipolla, C.M. (1974), Storia Economica dell’Europa Pre-Industriale, il Mulino, Bologna. Cipolla, C.M. (1989), Miasmi e umori, il Mulino, Bologna. Combes, P.P., Duranton, G., Gobillon, L., Roux, S. (2009), Estimating Agglomeration Economies With History, Geology, and Worker Effects, in E. Glaeser (ed.), The Economics of Agglomeration Economies, The University of Chicago Press, forthcoming. Comin, D., Easterly, W., and Gong, E. (2006), Was the Wealth of Nations Determined in 1000 B.C.?, NBER Working paper No. 12657. DeLong, J.B. and A. Shleifer (1993), “Princes and Merchants: European City Growth before the Indsutrial Revolution”, Jurnal of Law and Economics, 36(4):671-702. De Rosa (2003), Conflitti e squilibri nel Mezzogiorno tra Cinque e Ottocento, Editori Laterza, Bari. De Vries, J. (1984), European Urbanization 1500-1800, London: Methuen & Co. Diamond, J. (1997), Guns, Germs and Steeel: The Fate of Human Societies, W.W. Norton & Co., New York, NY.
38
Dobkins, L.H. and Y.M. Ioannides (2001), Spatial Interactions Among U.S. Cities: 1900-1990, Regional Science and Urban Economics, 31, 701-32. Du Jourdin (1993), L’Europe et la Mer, Paris: Editions du Seuil. Duranton, G. (1998), Labor Specialization, Transports Costs and City Size, Journal of Regional Science, 38 (4), 553-575. Eaton, J. and Z. Eckstein (1997), Cities and Growth: Evidence from France and Japan, Regional Science and Urban Economics, 27, 443-74. Gabaix, X. (1999), Zipf's Law for Cities: an Explanation, Quarterly Journal of Economics, 114, 739-67. Gabaix, X. and Y.M. Ioannides (2005), The Evolution of City Size Distributions, in Handbook of Urban and Regional Economics,J.V. Henderson and J-F Thisse (eds), North Holland, forthcoming. Gallup, J.L. and Sachs, J.D. (2001), The Economic Burden of Malaria, American Journal of Tropical Medicine and Hygiene, 64(1-2):85-96. Gallup, J.L., Sachs, J.D., and A. Mellinger (1999), Geography and Economic Development, International Regional Science Review, 22(2):179-232. Greif, A. (2006), Institutions and the Path to the Modern Economy, Cambridge: Cambridge University Press. Guiso, L., P. Sapienza and L. Zingales (2007), Lung Term Persistence, Northwestern University, mimeo. Henderson, J.V. (1988), Urban Development: Theory, Fact and Illusion, Oxford University Press. Henderson, J.V. and H.G. Wang (2006), Urbanization and City Growth: the Role of Institutions, Brown University, mimeo. Ioannides, Y.M. and H.G. Overman (2003), Zipf's Law for Cities: An Empirical Examination, Regional Science and Urban Economics, 33, 1, March, 127-137. Krugman, P. (1991a), Increasing Returns and Economic Geography, Journal of Political Economy, 99(3):483-499. Krugman, P. (1991b), History and Industry Location: the Case of the Manufacturing Belt, American Economic Review Papers & Proceedings, 81(2):80-83. Krugman, P. (1996), Confronting the Mystery of Urban Hierarchy, Journal of the Japanese and International Economies, 10(4): 399-418.

39
Malanima, P. (1998), Italian Cities 1300-1861 A quantitative approach. Rivista di Storia Economica, 14(2):91-126. Malanima, P. (2002), L’economia italiana, il Mulino, Bologna. Malanima, P. (2003), Measuring the Italian Economy, Rivista di Storia Economica, 19(3):265-295. Malanima, P. (2005), Urbanisation and the Italian Economy During the Last Millennium, European Economic History Review, 9:97-122. Martin, R. and P. Sunley (2006), Path Dependence and Regional Economic Evolution, Journal of Economic Geography, 6(4):395-437. McArthur, J.W. and Sachs, J.D. (2000), Institutions and Geography: Comment on Acemoglu, Johnson and Robinson (2000), NBER Working Paper 8114. Milani, G. (2005), I Comuni italiani, Bari: Editori Laterza. Munro, J. (1999), The Low Countries' Export Trade in Textiles with the Mediterranean Basin, 1200-1600: A Cost-Benefit Analysis of Comparative Advantages in Overland and Maritime Trade Routes, University of Toronto, mimeo. North, D. (1981), Structure and Change in Economic History, New York: Norton. Nunn, N. (2008), The Importance of History for Economic Development, Harvard University, mimeo. Nunn, N. and Puga, D. (2008), Ruggedness: The Blessing of Bad Geography in Africa, Harvard University, mimeo. Percoco, M. (2009), The Fight Against Geography: Malaria and Economic Growth in Italian Regions, Università Bocconi, mimeo. Pirenne, H. (1925), Medieval Cities, Their Origins and the Revival of Trade, Princeton University Press, Princeton, NJ. Pozzolo, L., (2007), Violence, Protection Costs, and Commercial Decline in Seventeenth Century Italy, Rivista di Storia Economica, 23(1):111-124. Puga, D. and D. Trefler (2007), International Trade and Domestic Institutions: The Medieval Response to Globalization, presentation file. Putnam, R. (1993), Making Democracy Work, Princeton: Princeton University Press. Rossi-Hansberg, E. and M.L. Wright (2007), Urban Structure and Growth, Review of Economic Studies, 74:597-624.

40
Sachs, J. (2001), Tropical Underdevelopment, NBER Working Paper N. 8119. Storper, M. (1997), The Regional World: Territorial Development in a Global Economy, Guilford Press, New York. Storper, M. (2008), Why Does a City Grow? Specialization, Human Capital, or Institutions?, London School of Economics, mimeo. Tabellini, G. (2007), Culture and Institutions in European Regions, Università Bocconi, mimeo.

41
Appendix 1
Cities in the sample Abbiategrasso, Acerra, Acireale, Acquaviva, Acqui, Adernò, Adria, Afragola, Agira, Agnone, Agrigento, Aidone, Airola, Alatri, Alba, Alcamo, Alessandria, Alghero, Alia, Altamura, Amalfi, Amelia, Anagni, Ancona, Andria, Angri, Aosta, Apricena, Aragona, Arezzo, Ariano, Arpino, Arzano, Ascoli Piceno, Ascoli Satriano, Assisi, Asti, Atri, Augusta, Avellino, Aversa, Avigliano, Avola, Bagnara Calabra, Bagnocavallo, Bari, Barletta, Barra, Barrafranca, Bassano, Belcastro, Bella, Belluno, Belpasso, Benevento, Bergamo, Bernalda, Biancavilla, Biella, Bisaccia, Bisacquino, Bisceglie, Bisignano, Bitonto, Bivona, Bologna, Bolzano, Borgetto, Borgo (Stradella), Borgo di Gaeta, Bovino, Bra, Brescia, Brindisi, Bronte, Buccino, Burgio, Busto Arsizio, Caccamo, Cagliari, Caivano, Calascibetta, Calatafimi, Calitri, Caltabellotta, Caltagirone, Caltanissetta, Caltavuturo, Calvello, Camerino, Cammarata, Campagna, Campanaro, Campobasso, Campobello , Campobello di Licata, Candela, Canicattì, Canicattini, Canosa, Canosa, Capua, Caravaggio, Carignano, Carini, Carpi, Carpino, Carrara, Casacalenda, Casale Monferrato, Casalpusterlengo, Casamassima, Cascia, Caserta, Casoria, Cassano allo Jonio, Cassino, Castelbuono, Castellammare del Golfo, Castellammare di Stabia, Castellana, Castellaneta, Castellazzo Bormida, Castelnuovo Scrivia, Castelvetrano, Casterltermini, Castronovo di Sicilia, Castroreale, Castrovillari, Catania, Catanzaro, Cattolica Eraclea, Cefalù, Ceglie Messapico, Cento, Cerignola, Cerreto Sannita, Cesena, Chiaromonte Gulfi, Chiavari, Chieri, Chieti, Chioggia, Chiusa Sclafani, Chivasso, Ciminna, Cingoli, Cinisi, Cinquefondi, Città di Castello, Cittanova, Civitanova, Civitavecchia, Codogno, Colle Sannita, Colle Valdelsa, Comacchio, Comiso, Como, Conegliano, Conversano, Corato, Corigliano, Corleone, Corneto, Corridonia, Cortona, Cosenza, Crema, Cremona, Crotone, Cuneo, Eboli, Empoli, Enna, Erice, Fabriano, Faenza, Fano, Fasano, Favara, Feltre, Ferentino, Fermo, Ferrandina, Ferrara, Firenze, Florida, Foggia, Foligno, Fondi, Forenza, Forlì, Fossano, Fossombrone, Francavilla, Frattamaggiore, Gaeta, Galatina, Galatone, Galliate, Gallipoli, Gangi, Garlasco, Genova, Gerace, Giarre, Gibellina, Gioia del Colle, Giovinazzo, Giuliano in Campania, Gorizia, Gragnano, Grammichele, Grassano, Gravina, Grosseto, Grottaglie, Grotte, Grupo Appula, Gubbio, Iglesias, Imola, Irsina, Isernia, Itri, Ivrea, Jesi, Lacedonia, Lanciano, L'Aquila, Largo di Mercato, Larino, Laterza, Latiano, Laurenzana, Lauria, Lavello, Lavello, Lecce, Lentini, Leonessa, Leonforte, Lercara, Licata, Licodia Eubea, Linguaglossa, Lipari, Livorno, Lodi, Longobucco, Lucca, Lucera, Lugo, Lungro, Macerata, Maddaloni, Magenta, Maglie, Mammola, Manduria, Manfredonia, Mantova, Maratea, Marcianise, Marineo, Marsala, Marsico Nuovo, Martina Franca, Massa, Massa Marittima, Massafra, Matera, Mazara, Mazzarino, Melfi, Menfi, Mesagne, Messina, Meta, Mezzoiuso, Milano, Milazzo, Militello Val Catania, Mineo, Minervino Murge, Misilmeri, Misterbianco, Mistretta, Modena, Modica, Modugno, Mola (Formia), Mola di Bari, Molfetta, Moliterno, Moncalieri, Mondovì, Monopoli, Monreale, Monselice, Montalcino, Monte Sant'Angelo, Montefiascone, Montella, Montemaggiore, Montepulciano, Monterosso Almo, Montesarchio, Montescaglioso, Monza, Morano Calabro, Mormanno, Muro Lucano, Mussomeli, Napoli, Nardò, Narni, Naro, Nicastro, Nicosia, Niscemi, Nizza, Nocera, Noci, Noicataro, Nola, Norcia, Noto, Novara, Novi, Nuoro, Oneglia, Oria, Oristano, Orsara Danno Irpina, Orte, Ortona, Orvieto, Osimo, Ostuni, Ozieri, Padova,

42
Padula, Pagani, Palagonia, Palazzo Adriano, Palazzo San Gervasio, Palazzolo Acreide, Palermo, Palma Campania, Palma di Montechiaro, Palmi, Paola, Palo del Colle, Parma, Partinico, Paternò, Patti, Pavia, Penne, Pertanna, Perugia, Pesaro, Pescia, Piacenza, Piana, Piazza, Piazza Armerina, Piedimonte, Pietragalla, Pietraperzia, Pinerolo, Pisa, Pisticci, Pistoia, Pizzo, Polistena, Polizzi, Pomigliano d'Arco, Pontecorvo, Pontedera, Popoli, Portici, Porto Maurizio, Potenza, Pozzuoli, Prato, Pratola, Peligna, Prizzi, Putignano, Quarto Sant'Elena, Racalmuto, Raffadali, Ragusa, Randazzo, Ravanusa, Ravello, Ravenna, Recalbuto, Recanati, Reggio Calabria, Reggio Emilia, Resina, Ribeira, Riccia, Riesi, Rieti, Rimini, Rionero in Vulture, Riposto, Roma, Roseto Valfortore, Rossano, Rovereto, Rovigno, Rovigo, Ruvo, Sala Consilina, Salemi, Salerno, Saluzzo, Sambuca di Sicilia, San Bartolomeo, San Cataldo, San Colombano al Lambro, Sant’Elpidio, San Fele, San Fratello, San Gimignano, San Giovanni a Tedduccio, San Giovanni in Fiore, San Giovanni Rotondo, San Gregorio , agno, San Marco in Lamis, San Miniato, San Nicandro, San Remo, San Severino Marche, San Severo, San Vito dei Normanni, Sanbiase, Santa Caterina, Santa Eufemia, Santa Margherita di Belice, Santa Maria a Vico, Santa Maria Capua Vetere, Santa Ninfa, Sant'Agata di Puglia, Sant'Angelo Lodigiano, Sant'Antimo, Santeramo in Colle, Santo Stefano, Quisquina, Sarno, Saronno, Sassano, Sassari, Savigliano, Savona, Scafati, Sciacca, Scicli, Scordia, Secondigliano, Senigallia, Seregno, Serradifalco, Sessa Aurunca, Sestri Ponente, Sezze, Siculiana, Siena, Siracusa, Sora, Sora, Soresina, Sortino, Spaccafurno, Spezia, Spinazzola, Spoleto, Stigliano, Strongoli, Subiaco, Sulmona, Taormina, Taranto, Teano, Teggiano, Tempio Pausania, Teramo, Terlizzi, Termini, Terni, Terranova di Sicilia, Terrasini, Tivoli, Todi, Tolentino, Torino, Toritto, Torre Annunziata, Torre del Greco, Torre Maggiore, Tortona, Trani, Trapani, Treia, Trento, Treviglio, Treviso, Tricarico, Trieste, Triggiano, Trinitapoli, Trino, Troia, Troina, Tropea, Tuscania, Udine, Urbino, Valenza, Valguarnera, Valle d'Olmo, Varese, Vasto, Velletri, Venezia, Venosa, Vercelli, Veroli, Verona, Viadana, Viareggio, Vibo Valentia, Vicenza, Vico del Gargano, Vieste, Vigevano, Viggianello, Viggiano, Villarosa, Viterbo, Vittoria, Vizzini, Voghera, Volterra.

43
Appendix 2
Description of variables
Population This variable is in ‘000 and comes from Malanima (1998), where one observation per century is available. The dataset reports information only for cities with a population larger than 5,000. Altitude The source for this variable is the Atlante Statistico dei Comuni. Institutions This is a seven point scale. With the following classification Index Form of government 1 Absolutism 2 Non-bureaucratic absolutism 3 Strong-prince proto-absolutism 4 Feudal anarchy 5 Princes checked extra-constitutionally by powerful magnates 6 Independent city-republics 7 Weak prince standestaats The sources for this variable is De Long and Shleifer (1993) and Tabellini (2007). Comune This variable is meant to capture the long run effect of a period of democracy. It is a dummy variable taking the value of 1 for the city having been an autonomous municipality during the X-XIII centuries. The sources for this variable are: Ascheri (2006), Guiso et al. (2007), Milani (2005) and from the atlas Atlante Storico De Agostini and Nuovissimo Atlante Storico Mondiale. Port and accessibility The dummy variable for the presence of a port is taken from du Jourdin (1993) and from atlas Atlante Storico De Agostini and Nuovissimo Atlante Storico Mondiale. My index of road accessibility takes the value of 1 if the city was on the Roman road network and 0 otherwise. As for inland waterways accessibility, the index is a dummy variable taking the value of 1 if the city was on a navigable river and 0 otherwise. Data are from Atlante Storico De Agostini and Nuovissimo Atlante Storico Mondiale and books in the series Le città nella storia d’Italia, Laterza. University The sources for the university variable are Atlante Storico De Agostini and Nuovissimo Atlante Storico Mondiale. Income The source for taxable income per capita is ANCITEL.

44
Statuto This variable takes the value 1 if the city had a Statuto Comunale and 0 otherwise. The source for this variable is the Collezione degli Statuti Comunali maintained by the Senate. The databank is accessible through the website: http://notes9.senato.it/w3/Biblioteca/catalogoDegliStatutiMedievali.nsf/home?OpenPage

Table 1: Mortality rates in some North-Italian cities during the plague of 1630-1631 City Population Deaths Mortality rate (%) Bergamo 25,000 10,000 40 Bologna 62,000 15,000 24 Brescia 24,000 11,000 45 Como 12,000 5,000 42 Cremona 37,000 17,000 38 Firenze 32,000 9,000 12 Milano 130,000 60,000 47 Padova 76,000 19,000 59 Parma 30,000 15,000 50 Verona 54,000 33,000 61 Venezia 140,000 46,000 33 Vicenza 32,000 12,000 38
Source: Cipolla (1974), p. 191.
Table 2: The ten largest cities in Italy, 1300-2001 1300 1500 1700 1861 1901 1951 2001
Milano 150 Napoli 150 Napoli 220 Napoli 419 Napoli 564 Roma 1702 Roma 2460 Venezia 110 Venezia 102 Roma 140 Milano 196 Milano 492 Milano 1277 Milano 1183 Firenze 110 Milano 100 Venezia 138 Roma 188 Roma 463 Napoli 1025 Napoli 993 Genova 60 Genova 70 Palermo 110 Torino 181 Torino 336 Torino 722 Torino 857 Bologna 50 Bologna 55 Milano 109 Palermo 168 Palermo 310 Genova 688 Palermo 653 Siena 50 Roma 55 Firenze 72 Genova 128 Genova 235 Palermo 503 Genova 604 Palermo 50 Firenze 50 Genova 64 Venezia 114 Firenze 206 Firenze 391 Bologna 370 Brescia 45 Palermo 50 Bologna 63 Firenze 114 Bologna 152 Bologna 351 Firenze 352 Cremona 45 Brescia 48 Messina 50 Bologna 90 Venezia 152 Venezia 323 Bari 313 Padova 40 Cremona 40 Torino 44 Livorno 84 Messina 150 Catania 302 Catania 307

Table 3: Average city size population Italy North Center South
Whole Sample
13.500 20,564 13,250 10.095
Population> 10,000
25,710 34,152 25,100 17,611
Population< 10,000
6,449 6,437 6,303 6,527
Average in 1300
13,197 21,416 13,096 8,984
Average in 1861
13,436 21,340 13,537 10,444
Average centennial growth rate
0.36% -0.07% 0.66% 3.01%

Table 4: Parametric estimation of city size distribution Panel A: Whole sample Full sample Cities in top 1/3 of size distribution
at R2 Obs. at R2 Obs. 1300 0.786
(0.016) 0.898 192 1.168
(0.020) 0.973 64
1400 0.792 (0.022)
0.912 94 1.248 (0.019)
0.914 33
1500 0.723 (0.018)
0.865 146 1.115 (0.017)
0.981 50
1600 0.677 (0.017)
0.871 208 0.981 (0.012)
0.945 70
1700 0.693 (0.028)
0.846 212 1.038 (0.025)
0.932 74
1800 0.656 (0.021)
0.844 337 0.984 (0.022)
0.954 107
1861 0.559 (0.022)
0.783 510 0.902 (0.021)
0.926 170
Panel B: Cities in the Centre-North Full sample Cities in top 1/3 of size distribution at R2 Obs. at R2 Obs. 1300 0.786
(0.019) 0.937 109 1.054
(0.022) 0.985 35
1400 0.742 (0.021)
0.948
65 0.926 (0.051)
0.940 22
1500 0.745 (0.029)
0.893 79 1.120 (0.058)
0.939 26
1600 0.734 (0.024)
0.907 93 1.033 (0.039)
0.956 34
1700 0.719 (0.026)
0.891 93 1.056 (0.044)
0.948 32
1800 0.745 (0.030)
0.874 88 1.254 (0.053)
0.958 26
1861 0.670 (0.020)
0.878 157 0.992 (0.029)
0.957 52
Panel C: Cities in the South Full sample Cities in top 1/3 of size distribution at R2 Obs. at R2 Obs. 1300 0.937
(0.029) 0.924 83 1.246
(0.038) 0.972 32
1400 1.105 (0.036)
0.972 29 a a a
1500 0.955 (0.033)
0.966 67 0.977 (0.031)
0.877 23
1600 0.822 (0.079)
0.971 115 0.921 (0.029)
0.955 39
1700 0.756 (0.015
0.951 119 0.832 (0.024)
0.957 55
1800 0.722 (0.012)
0.934 219 0.876 (0.022)
0.956 72
1861 0.628 (0.014)
0.842 353 0.946 (0.019)
0.953 126
Note: Biased standard errors in parentheses. (a): The paucity of the number of observations does not allow correct estimation.
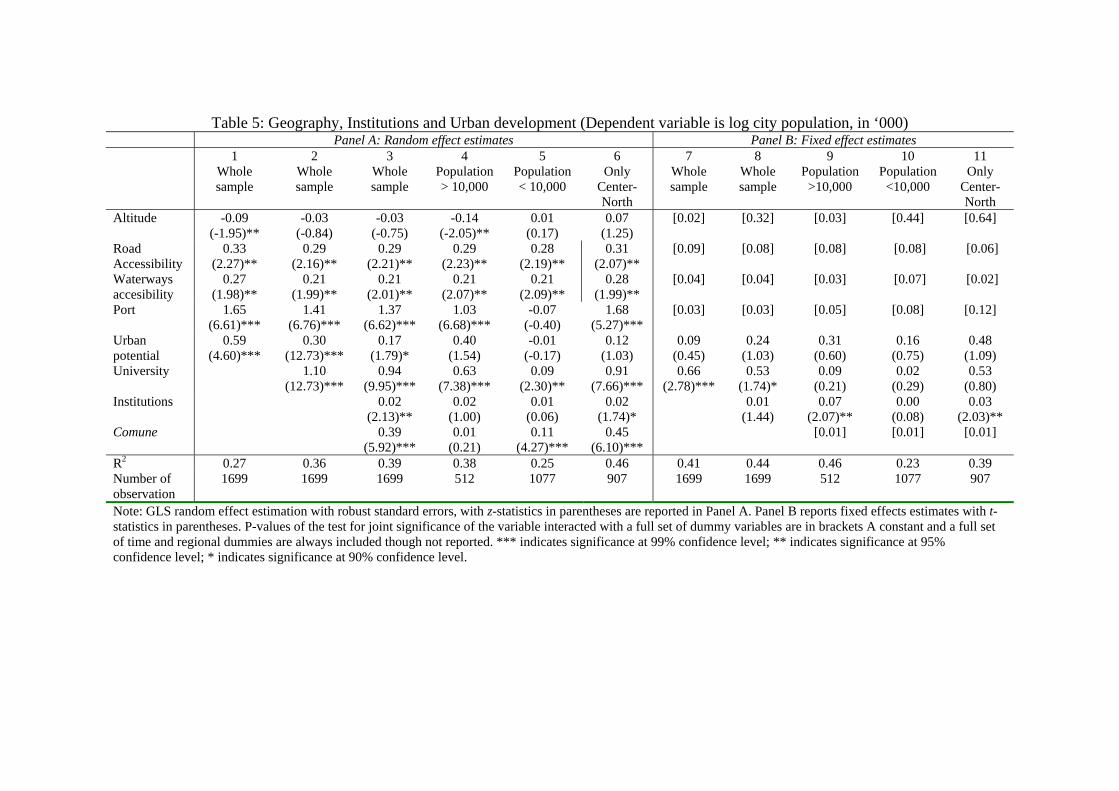
Table 5: Geography, Institutions and Urban development (Dependent variable is log city population, in ‘000) Panel A: Random effect estimates Panel B: Fixed effect estimates 1
Whole sample
2 Whole sample
3 Whole sample
4 Population > 10,000
5 Population < 10,000
6 Only
Center-North
7 Whole sample
8 Whole sample
9 Population
>10,000
10 Population
<10,000
11 Only
Center-North
Altitude -0.09 (-1.95)**
-0.03 (-0.84)
-0.03 (-0.75)
-0.14 (-2.05)**
0.01 (0.17)
0.07 (1.25)
[0.02] [0.32] [0.03] [0.44] [0.64]
Road Accessibility Waterways accesibility
0.33 (2.27)**
0.27 (1.98)**
0.29 (2.16)**
0.21 (1.99)**
0.29 (2.21)**
0.21 (2.01)**
0.29 (2.23)**
0.21 (2.07)**
0.28 (2.19)**
0.21 (2.09)**
0.31 (2.07)**
0.28 (1.99)**
[0.09]
[0.04]
[0.08]
[0.04]
[0.08]
[0.03]
[0.08]
[0.07]
[0.06]
[0.02]
Port 1.65 (6.61)***
1.41 (6.76)***
1.37 (6.62)***
1.03 (6.68)***
-0.07 (-0.40)
1.68 (5.27)***
[0.03] [0.03] [0.05] [0.08] [0.12]
Urban potential
0.59 (4.60)***
0.30 (12.73)***
0.17 (1.79)*
0.40 (1.54)
-0.01 (-0.17)
0.12 (1.03)
0.09 (0.45)
0.24 (1.03)
0.31 (0.60)
0.16 (0.75)
0.48 (1.09)
University 1.10 (12.73)***
0.94 (9.95)***
0.63 (7.38)***
0.09 (2.30)**
0.91 (7.66)***
0.66 (2.78)***
0.53 (1.74)*
0.09 (0.21)
0.02 (0.29)
0.53 (0.80)
Institutions 0.02 (2.13)**
0.02 (1.00)
0.01 (0.06)
0.02 (1.74)*
0.01 (1.44)
0.07 (2.07)**
0.00 (0.08)
0.03 (2.03)**
Comune 0.39 (5.92)***
0.01 (0.21)
0.11 (4.27)***
0.45 (6.10)***
[0.01] [0.01] [0.01]
R2 0.27 0.36 0.39 0.38 0.25 0.46 0.41 0.44 0.46 0.23 0.39 Number of observation
1699 1699 1699 512 1077 907 1699 1699 512 1077 907
Note: GLS random effect estimation with robust standard errors, with z-statistics in parentheses are reported in Panel A. Panel B reports fixed effects estimates with t-statistics in parentheses. P-values of the test for joint significance of the variable interacted with a full set of dummy variables are in brackets A constant and a full set of time and regional dummies are always included though not reported. *** indicates significance at 99% confidence level; ** indicates significance at 95% confidence level; * indicates significance at 90% confidence level.

Table 6: Geography, Institutions and Urban growth (Dependent variable is centennial population growth) Panel A: Random effect estimates Panel B: Fixed effect estimates 1
Whole sample
2 Whole sample
3 Whole sample
4 Population > 10,000
5 Population <
10,000
6 Only
Center-North
7 Whole sample
8 Whole sample
9 Population
>10,000
11 Population
<10,000
11 Only Center-
North
Population t-1
-0.12 (-6.06)***
-0.18 (-7.79)***
-0.18 (-7.62)***
-0.31 (-8.33)***
-0.77 (-25.87)***
-0.18 (-5.54)***
-0.64 (-16.86)***
-0.66 (-17.65)***
-0.62 (-12.24)***
-0.94 (-22.93)***
-0.62 (-12.84)***
Altitude -0.09 (-3.08)***
-0.06 (-2.57)***
-0.06 (-2.37)**
-0.10 (-1.67)*
-0.02 (-0.74)
-0.04 (-1.20)
[0.08] [0.15] [0.22] [0.17] [0.18]
Road accessibility Waterways accessibility
0.29 (2.19)**
0.22 (1.99)**
0.29 (2.31)**
0.22 (2.01)**
0.29 (2.13)**
0.21 (2.17)**
0.29 (2.22)**
0.22 (2.19)**
0.29 (2.21)**
0.21 (2.05)**
0.32 (1.98)**
0.24 (2.05)**
[0.08]
[0.09]
[0.07]
[0.06]
[0.08]
[0.09]
[0.06]
[0.09]
[0.06]
[0.08]
Port 0.29 (3.33)***
0.32 (3.71)***
0.32 (3.73)***
0.34 (3.07)***
0.08 (0.97)
0.45 (3.33)***
[0.01] [0.01] [0.01] [0.02] [0.01]
Urban potential t-1
-0.155 (-1.50)
-0.20 (-2.03)**
-0.20 (-2.04)**
-0.17 (-1.02)
0.04 (1.05)
-0.21 (-2.06)**
0.39 (1.45)
0.19 (1.34)
0.09 (0.20)
0.15 (0.53)
-0.18 (-0.22)
University 0.24 (5.99)***
0.23 (5.64)***
0.18 (3.54)***
0.04 (1.06)
0.22 (4.61)***
0.36 (2.15)**
0.34 (2.08)**
0.04 (0.24)
0.06 (2.05)**
0.09 (0.67)
Institutions t-1
0.01 (0.93)
0.01 (0.87)
0.03 (0.35)
0.02 (1.77)*
0.02 (1.87)*
0.09 (2.62)***
-0.01 (-0.79)
0.03 (2.32)**
Comune 0.03 (2.22)**
0.04 (0.84)
0.07 (2.67)***
0.07 (1.95)*
[0.04] [0.22] [0.03] [0.08]
R2 0.39 0.40 0.42 0.46 0.74 0.46 0.64 0.65 0.68 0.82 0.68 Number of observation
1040 1040 1040 433 607 581 1040 1040 433 607 581
Note: GLS random effect estimation with robust standard errors, with z-statistics in parentheses are reported in Panel A. Panel B reports fixed effects estimates with t-statistics in parentheses. P-values of the test for joint significance of the variable interacted with a full set of dummy variables are in brackets A constant and a full set of time and regional dummies are always included though not reported. *** indicates significance at 99% confidence level; ** indicates significance at 95% confidence level; * indicates significance at 90% confidence level.

Table 7: Geography, institutions, urban development and growth – Balanced panel Panel A: Random effect
estimates (Dep. Var.: log population)
Panel B: Fixed effect estimates (Dep. Var.: log
population)
Panel C: Random effect estimates (Dep. Var.: Centennial growth)
Panel D: Fixed effect estimates (Dep. Var.: Centennial growth)
1 Whole sample
2 Only
Center-North
3 Whole sample
4 Only
Center-North
5 Whole sample
6 Only
Center-North
7 Whole sample
8 Only
Center-North
Population t-1 -0.18 (-7.62)***
-0.18 (-5.54)***
-0.64 (-16.86)***
-0.60 (-11.93)***
Altitude -0.03 (-0.75)
0.07 (1.25)
[0.09] [0.08] -0.06 (-2.47)***
-0.04 (-1.20)
[0.09] [0.11]
Road Accessibility Waterways accessibility
0.271 (2.11)**
0.201 (2.33)**
0.279 (2.14)**
0.212 (2.17)**
[0.01]
[0.02]
[0.01]
[0.02]
0.288 (2.11)**
0.213 (1.97)**
0.276 (2.13)**
0.209 (2.02)**
[0.02]
[0.03]
[0.01]
[0.03]
Port 1.37 (6.62)***
1.68 (5.27)***
[0.01] [0.01] 0.32 (3.73)***
0.45 (3.33)***
[0.01] [0.01]
Urban potential t-1
0.17 (1.69)*
0.12 (1.03)
0.09 (0.45)
0.34 (0.85)
-0.20 (-2.04)**
-0.21 (-2.06)**
0.39 (1.45)
-0.38 (-0.49)
University 0.94 (9.95)***
0.91 (7.66)***
0.66 (2.78)***
0.63 (1.22)
0.23 (5.64)***
0.22 (4.61)***
0.36 (1.99)**
-0.05 (-1.11)
Institutions t-1
0.02 (2.13)**
0.02 (1.74)*
0.02 (1.73)*
0.02 (1.48)
0.01 (0.93)
0.02 (1.77)*
0.02 (1.72)*
0.02 (1.73)*
Comune 0.39 (5.92)***
0.45 (6.10)***
[0.01] [0.01] 0.03 (1.22)
0.07 (1.98)**
[0.01] [0.02]
R2 0.38 0.46 0.42 0.36 0.42 0.46 0.64 0.65 Number of observations
1699 907 1699 907 1040 581 1040 581
Note: GLS random effect estimation with robust standard errors. z-statistics are in parentheses. A constant and a full set of time and regional dummies (North, Centre, South, Sardinia and Sicily) is always included though not reported. *** indicates significance at 99% confidence level; ** indicates significance at 95% confidence level; * indicates significance at 90% confidence level. In models 3, 4, 7, 8 altitude, road accessibility, waterways accessibility, port and comune are interacted with a full set of time dummy variables. The corresponding values in brackets report p-values for a test of joint significance of the interacted variables.

Table 8: Long run regressions Panel A: First stage regressions. Dependent variable is Firm Density in 2001 (in logs) 1
Whole sample 2
Whole sample 3
Whole sample 4
Only cities in the Center-
North
5 Only cities in the Center-
North Altitude -0.10
(-0.62) -0.16
(-0.94) -0.20
(-1.18) -0.01
(-0.06) -0.10
(-0.39) Road accessibility 0.54
(2.03)** 0.52
(2.01)** 0.49
(2.07)** 0.52
(2.13)** 0.52
(2.12)** Waterways accessibility
0.23 (1.78)*
0.23 (1.79)*
0.19 (1.78)*
0.23 (2.01)**
0.23 (1.99)**
Port 1.11 (3.93)***
1.16 (4.01)***
1.02 (3.18)***
0.62 (1.38)
0.60 (1.20)
University 1.27 (5.12)***
1.28 (5.03)***
1.23 (4.78)***
0.90 (3.16)***
1.08 (3.79)***
Comune 0.41 (2.58)***
0.37 (2.28)**
0.53 (3.11)***
Institutions 0.53 (2.38)**
0.52 (2.32)**
0.26 (0.57)
0.19 (0.40)
Statuto 0.57 (2.84)***
0.32 (1.83)*
Panel B: Second stage regressions. Dependent variable is Income per capita in 2001 (in logs)
Firm density 0.11 (6.18)***
0.09 (4.96)***
0.09 (5.57)***
0.09 (4.74)***
0.10 (4.82)***
Road accessibility 0.12 (1.76)*
0.13 (1.42)
0.12 (1.55)
0.09 (0.98)
0.09 (0.99)
Waterways accessibility
0.03 (0.89)
0.02 (0.91)
0.03 (0.99)
0.02 (1.01)
0.02 (1.07)
Altitude -0.03 (-1.81)*
-0.03 (-1.82)*
-0.03 (-1.84)*
-0.04 (1.62)
-0.04 (1.52)
Port -0.30 (-0.61)
-0.002 (-0.04)
-0.003 (-0.06)
-0.02 (-0.39)
-0.03 (0.42)
R2 0.62 0.67 0.67 0.56 0.49 Number of observations
563 563 563 563 563
p- value of Hansen J statistic
0.85 0.33 0.33 0.20 0.81
Kleibergen-Paap rk Wald F statistic
20.88 14.79 16.39 8.916 8.26
Note: t statistics are in parentheses. A constant and a full set of regional dummies are always included though not reported. *** indicates significance at 99% confidence level; ** indicates significance at 95% confidence level; * indicates significance at 90% confidence level.
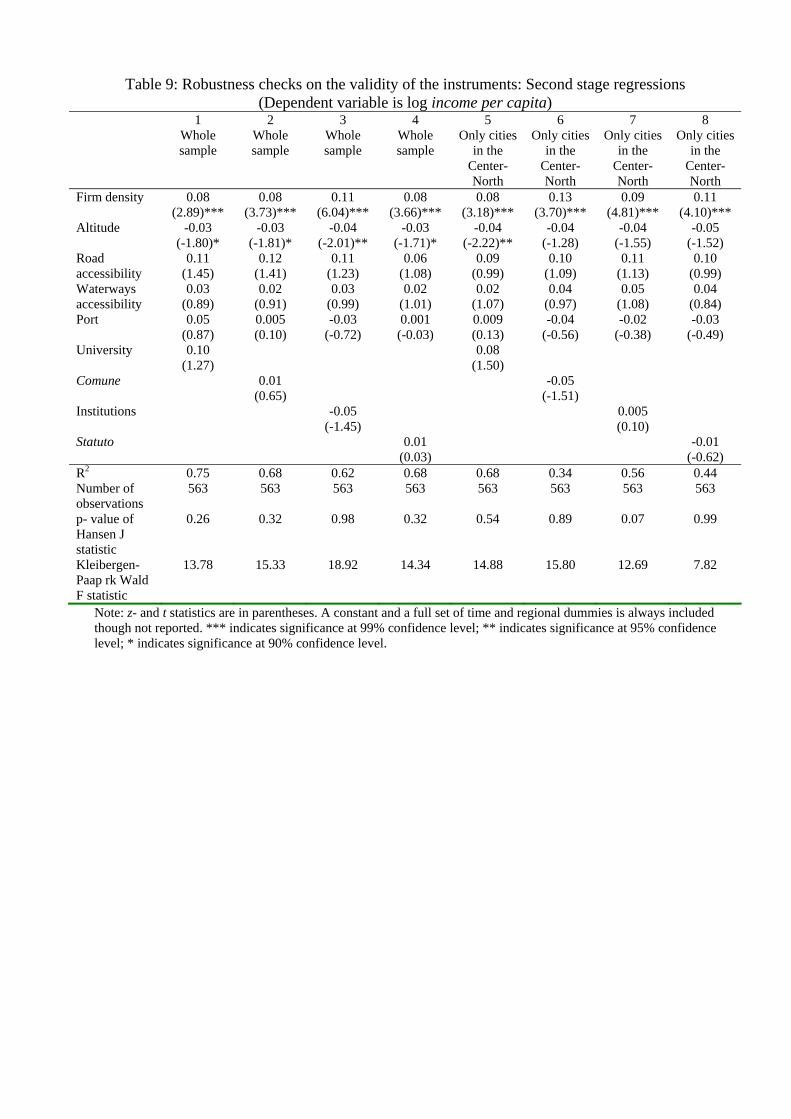
Table 9: Robustness checks on the validity of the instruments: Second stage regressions (Dependent variable is log income per capita)
1 Whole sample
2 Whole sample
3 Whole sample
4 Whole sample
5 Only cities
in the Center-North
6 Only cities
in the Center-North
7 Only cities
in the Center-North
8 Only cities
in the Center-North
Firm density 0.08 (2.89)***
0.08 (3.73)***
0.11 (6.04)***
0.08 (3.66)***
0.08 (3.18)***
0.13 (3.70)***
0.09 (4.81)***
0.11 (4.10)***
Altitude -0.03 (-1.80)*
-0.03 (-1.81)*
-0.04 (-2.01)**
-0.03 (-1.71)*
-0.04 (-2.22)**
-0.04 (-1.28)
-0.04 (-1.55)
-0.05 (-1.52)
Road accessibility
0.11 (1.45)
0.12 (1.41)
0.11 (1.23)
0.06 (1.08)
0.09 (0.99)
0.10 (1.09)
0.11 (1.13)
0.10 (0.99)
Waterways accessibility
0.03 (0.89)
0.02 (0.91)
0.03 (0.99)
0.02 (1.01)
0.02 (1.07)
0.04 (0.97)
0.05 (1.08)
0.04 (0.84)
Port 0.05 (0.87)
0.005 (0.10)
-0.03 (-0.72)
0.001 (-0.03)
0.009 (0.13)
-0.04 (-0.56)
-0.02 (-0.38)
-0.03 (-0.49)
University 0.10 (1.27)
0.08 (1.50)
Comune 0.01 (0.65)
-0.05 (-1.51)
Institutions -0.05 (-1.45)
0.005 (0.10)
Statuto 0.01 (0.03)
-0.01 (-0.62)
R2 0.75 0.68 0.62 0.68 0.68 0.34 0.56 0.44 Number of observations
563 563 563 563 563 563 563 563
p- value of Hansen J statistic
0.26 0.32 0.98 0.32 0.54 0.89 0.07 0.99
Kleibergen-Paap rk Wald F statistic
13.78 15.33 18.92 14.34 14.88 15.80 12.69 7.82
Note: z- and t statistics are in parentheses. A constant and a full set of time and regional dummies is always included though not reported. *** indicates significance at 99% confidence level; ** indicates significance at 95% confidence level; * indicates significance at 90% confidence level.

Table 10: Elites and urban growth in three Italian cities Parma Piacenza Modena
Panel A: Turnover rate in city council 1500 0.35 0.65 0.3 1600 0.25 0.71 0.26 1700 0.28 0.69 0.22
Panel B: Percentage of city council seats to top 10 “historical families” 1500 0.16 - 0.51 1600 0.14 - 0.58 1700 0.14 - 0.65
Panel C: Centennial growth rate of city population 1500-1600 0.28 0.32 0.20 1600-1700 0.09 -0.09 0.11 1700-1800 0.36 -0.07 0.10
Source: Cattini (1984) and Cattini and Romani (2004).

Figure 1: Urbanization rates in Western Europe, Italy, England and Wales and the Netherlands
0
5
10
15
20
25
30
35
40
45
1500 1600 1700 1800 1850
Urb
aniz
atio
n ra
te
Western Europe Centre-North Italy England (and Wales) The Netherlands
Source: Malanima (2005) Figure 2: The urban population in Italy with respect to the European urban population
0
5
10
15
20
25
30
35
1300 1400 1500 1600 1700 1800
Italia
n/Eu
rope
an p
opul
atio
n
Source: Malanima (2002)

Figure 3: Per capita GDP and per capita agricultural product (indices 1860-1870=100)
0
20
40
60
80
100
120
140
160
1310
-20
1340
-50
1370
-80
1400
-10
1430
-40
1460
-70
1490
-1500
1520
-30
1550
-60
1580
-90
1610
-20
1640
-50
1670
-80
1700
-10
1730
-40
1760
-70
1790
-1800
1820
-30
1850
-60
Per capita GDP Per capital agricultural product
Source: Malanima (2003) Figure 4: Share of agriculture on total GDP (in 1860-1870 Italian lire)
0
0.1
0.2
0.3
0.4
0.5
0.6
1310
-20
1340
-50
1370
-80
1400
-10
1430
-40
1460
-70
1490
-1500
1520
-30
1550
-60
1580
-90
1610
-20
1640
-50
1670
-80
1700
-10
1730
-40
1760
-70
1790
-1800
1820
-30
1850
-60
Per capita agricultural product/per capita GDP
Source: Malanima (2003)

Figure 5: Historical pattern of urban and agricultural wages (indices 1860-1870=100)
0
50
100
150
200
250
300
1320
-30
1340
-50
1360
-70
1380
-90
1400
-10
1420
-30
1440
-50
1460
-70
1480
-90
1500
-10
1520
-30
1540
-50
1560
-70
1580
-90
1600
-10
1620
-30
1640
-50
1660
-70
1680
-90
1700
-10
1720
-30
1740
-50
1760
-70
1780
-90
1800
-10
1820
-30
1840
-50
1860
-70
Agricultural wages Urban wages
Source: Malanima (2003) Figure 6: Total population in Italy
0
500 0
10 00 0
1500 0
20 00 0
2 500 0
30 00 0
130 0 14 00 150 0 16 00 1700 180 0 186 1
Source: Malanima (2005)

Figure 7: Population dynamics in Genoa and Venice
0.0 0%
0 .50%
1.0 0%
1.50%
2.0 0%
2 .50%
130 0 14 00 150 0 16 00 170 0 18 00 18 61
Venice Genoa
Note: The graph draws the dynamics of city population with respect to total Center-North Italian population. Source: Malanima (1998; 2002).