Historical Monthly Energy
360
DOE/EIA-0035(73-92) Distribution Category UC-950 Historical Monthly Energy Review 1973–1992 Energy Information Administration Office of Energy Markets and End Use U.S. Department of Energy Washington, DC 20585 This report was prepared by the Energy Information Administration, the independent statistical and analytical agency within the Department of Energy. The information contained herein should not be construed as advocating or reflecting any policy position of the Department of Energy or any other organization.
description
The Historical Monthly Energy Review (HMER) presents monthly and annual data from 1973 through 1992 on production, consumption, stocks, imports, exports, and prices of the principal energy commodities in the United States.
Transcript of Historical Monthly Energy

DOE/EIA-0035(73-92)Distribution Category UC-950
HistoricalMonthly Energy Review
1973–1992
Energy Information AdministrationOffice of Energy Markets and End Use
U.S. Department of EnergyWashington, DC 20585
This report was prepared by the Energy Information Administration, the independent statistical and analyticalagency within the Department of Energy. The information contained herein should not be construed as advocatingor reflecting any policy position of the Department of Energy or any other organization.

Historical Monthly Energy Review
The Historical Monthly Energy Review (HMER) presentsmonthly and annual data from 1973 through 1992 onproduction, consumption, stocks, imports, exports, andprices of the principal energy commodities in theUnited States. Also included are data on internationalproduction of crude oil, consumption of petroleumproducts, petroleum stocks, and production of electric-ity from nuclear-powered facilities.
This publication is a companion to the Monthly EnergyReview (MER) in the sense that the data series presentedhere are the same as those found in the MER, alsopublished by the Energy Information Administration(EIA). Since the HMER presents monthly data for allyears from 1973 through 1992 and includes previouslyunpublished revisions to MER data, it is the most con-venient and most accurate source of historical MERdata.
Publication of this report is in keeping with responsi-bilities given to EIA in Public Law 95-91 (Departmentof Energy Organization Act), which states, in part, inSection 205(a)(2) that:
The Administrator shall be responsible for carryingout a central, comprehensive, and unified energydata and information program which will collect,evaluate, assemble, analyze, and disseminate dataand information...
Contacts
The Historical Monthly Energy Review (HMER) was pre-pared by EIA. General information about this reportmay be obtained from W. Calvin Kilgore, Director,Office of Energy Markets and End Use, 202-586-1617;Lynda T. Carlson, Director, Energy End Use and Inte-grated Statistics Division, 202-586-1112; and KatherineE. Seiferlein, Chief, Integrated Statistics Branch, 202-586-5692.
Questions and comments concerning the contents ofthe HMER may be directed to the Principal Analyst,Chuck Allen, 202-586-5692, or through Internet [email protected].
Requests for additional information on other energy sta-tistics available from EIA and questions concerning sub-scriptions and report distribution may be directed to the
National Energy Information Center, at the address andtelephone numbers shown under Ordering Information.
Ordering Information
This and other EIA publications may be purchasedfrom the Superintendent of Documents, U.S. Govern-ment Printing Office; a preprinted order form in theback of this publication is provided for your conve-nience.
Telephone and fax orders should be directed to:
U.S. Government Printing OfficeMcPherson Square Bookstore1510 H Street, N.W.Washington, DC 20005202-653-20509 a.m. to 4:30 p.m., eastern time, M-FFax: 202-376-5055 (24 hours a day)
Superintendent of DocumentsU.S. Government Printing OfficeWashington, DC 204028 a.m. to 4 p.m., eastern time, M-FFax: 202-512-2233 (24 hours a day)
Mail orders should be directed to:
U.S. Government Printing OfficeP.O. Box 371954Pittsburgh, PA 15250-7954
Complimentary subscriptions and single issues areavailable to certain groups of subscribers, such as pub-lic and academic libraries; Federal, State, local and for-eign governments; EIA survey respondents; and themedia. For further information and for answers to ques-tions on energy statistics, please contact EIA’s NationalEnergy Information Center. Address, telephone num-bers, and hours are as follows:
National Energy Information Center, EI-231Energy Information AdministrationForrestal Building, Room 1F-048Washington, DC 20585202-586-8800, 9 a.m. to 5 p.m., eastern time, M-FInternet: [email protected]
TTY: For people who are deaf or hard of hearing: 202-586-1181
Electronic AccessThe Historical Monthly Energy Review data are available electronically. See the insideback cover of this publication for information about ordering computer diskettes. Forinformation needed to access data through EIA’s Electronic Publishing System (EPUB),see page 357. Contact the U.S. Government Printing Office at 202-512-1524 forinformation about accessing the Federal Bulletin Board.

A Message to Readers of the Historical Monthly Energy Review
Three years ago the Energy Information Administration (EIA) published the first Historical Monthly Energy Review(HMER), covering data from 1973-1988. That report was created to address the need for a compendium of monthlyenergy data under one cover with detailed source documentation. It served as a supplement to the Monthly EnergyReview (MER), which provides only 2 to 3 years of current monthly data at any one time.
This edition of the HMER extends the original HMER in several ways:
• Four additional years of monthly data, 1989-1992, have been added.
• This report fully replaces the earlier one; each data cell that has been revised since the original HMER is markedwith an "R" so that changes can be quickly noted.
• Section 1 has been expanded to include Tables 1.7-1.13, which were not available in the first HMER.
• Tables 3.9 on propane and Table 4.3 on natural gas trade, which have been added to the MER since the releaseof the first HMER, are included in this edition. In addition, Table 10.4 on nuclear electricity gross generationhas been reorganized to align more closely with the current presentation in the MER.
Analysts who would like to acquire the HMER data on computer diskettes will find more information on the insideback cover of this report. HMER data can also be accessed through the EIA Electronic Publication System (EPUB)(202-586-2557) and the U.S. Government Printing Office (GPO) Federal Bulletin Board (202-512-1524). Instructionsfor configuring your communications software for EPUB are located on page 357.
EIA appreciates hearing from the people who are using our products. Your comments help us to determine if ourwork is useful to you and if we are meeting your needs for energy data. We want to put our limited resources to thebest possible use. Please contact us if you have suggestions or comments about this report. I can be reached inWashington, DC, at 202-586-5692, by fax at 202-586-0018, or through Internet at [email protected].
Katherine E. Seiferlein Chief, Integrated Statistics Branch
Energy Information Administration/Historical Monthly Energy Review 1973-1992iii
Energy Information Administration/Historical Monthly Energy Review 1973-1992
Contents
Page
A Message to Readers . . . . . . . . . . . . . . . . . . . . . . . . . . . . . . . . . . . . . iii
Section 1. Energy Overview . . . . . . . . . . . . . . . . . . . . . . . . . . . . . . . . . . 1
Section 2. Energy Consumption . . . . . . . . . . . . . . . . . . . . . . . . . . . . . . . 47
Section 3. Petroleum . . . . . . . . . . . . . . . . . . . . . . . . . . . . . . . . . . . . . . 77
Section 4. Natural Gas . . . . . . . . . . . . . . . . . . . . . . . . . . . . . . . . . . . . 159
Section 5. Oil and Gas Resource Development . . . . . . . . . . . . . . . . . . . . . . 185
Section 6. Coal . . . . . . . . . . . . . . . . . . . . . . . . . . . . . . . . . . . . . . . . 197
Section 7. Electricity . . . . . . . . . . . . . . . . . . . . . . . . . . . . . . . . . . . . . 213
Section 8. Nuclear Energy . . . . . . . . . . . . . . . . . . . . . . . . . . . . . . . . . . 233
Section 9. Energy Prices . . . . . . . . . . . . . . . . . . . . . . . . . . . . . . . . . . . 245
Section 10. International Energy . . . . . . . . . . . . . . . . . . . . . . . . . . . . . . 305
Appendix A. Thermal Conversion Factors . . . . . . . . . . . . . . . . . . . . . . . . 339
Appendix B. Metric and Other Physical Conversion Factors . . . . . . . . . . . . . . 349
Appendix C. List of MER Features . . . . . . . . . . . . . . . . . . . . . . . . . . . . . 353
Appendix D. Electronic Publishing System (EPUB) . . . . . . . . . . . . . . . . . . . 357
Glossary . . . . . . . . . . . . . . . . . . . . . . . . . . . . . . . . . . . . . . . . . . . . 359
v

Section 1. Energy Overview
1.1 Energy Summary, Annual Data, 1973-1992 . . . . . . . . . . . . . . . . . . . . . . . . . . . . . . . . . 31.2 Energy Overview, 1973-1992 . . . . . . . . . . . . . . . . . . . . . . . . . . . . . . . . . . . . . . . . . 51.3 Energy Production by Source, 1973-1992 . . . . . . . . . . . . . . . . . . . . . . . . . . . . . . . . . . 91.4 Energy Consumption by Source, 1973-1992 . . . . . . . . . . . . . . . . . . . . . . . . . . . . . . . . 131.5 Energy Net Imports by Source, 1973-1992 . . . . . . . . . . . . . . . . . . . . . . . . . . . . . . . . . 171.6 Merchandise Trade Value, 1974-1992 . . . . . . . . . . . . . . . . . . . . . . . . . . . . . . . . . . . . 211.7 Cost of Fuels to End Users in Constant (1982-84) Dollars, 1973-1992 . . . . . . . . . . . . . . . . . . 251.8 U.S. Dependence on Petroleum Net Imports, 1973-1992 . . . . . . . . . . . . . . . . . . . . . . . . . 291.9 Energy Consumption per Dollar of Gross Domestic Product, 1973-1992 . . . . . . . . . . . . . . . . 331.10 Passenger Car Efficiency, 1973-1992 . . . . . . . . . . . . . . . . . . . . . . . . . . . . . . . . . . . . . 351.11 Heating Degree-Days by Census Division, 1973-1992 . . . . . . . . . . . . . . . . . . . . . . . . . . . 361.12 Cooling Degree-Days by Census Division, 1973-1992 . . . . . . . . . . . . . . . . . . . . . . . . . . . 401.13 Degree-Day Normals by Census Division . . . . . . . . . . . . . . . . . . . . . . . . . . . . . . . . . 44
Section 2. Energy Consumption
2.1 Energy Consumption Summary, Annual Data, 1973-1992 . . . . . . . . . . . . . . . . . . . . . . . . 492.2 Energy Consumption by End-Use Sector, 1973-1992 . . . . . . . . . . . . . . . . . . . . . . . . . . . 512.3 Residential and Commercial Energy Consumption, 1973-1992 . . . . . . . . . . . . . . . . . . . . . 552.4 Industrial Energy Consumption, 1973-1992 . . . . . . . . . . . . . . . . . . . . . . . . . . . . . . . . 592.5 Transportation Energy Consumption, 1973-1992 . . . . . . . . . . . . . . . . . . . . . . . . . . . . . 632.6 Energy Input at Electric Utilities, 1973-1992 . . . . . . . . . . . . . . . . . . . . . . . . . . . . . . . . 67
Section 3. Petroleum
3.1 Petroleum Overview, 1973-1992 3.1a Field Production, Stock Change, Petroleum Products Supplied, and Ending Stocks . . . . 79 3.1b Imports, Exports, and Net Imports . . . . . . . . . . . . . . . . . . . . . . . . . . . . . . . . 83
3.2 Crude Oil Supply and Disposition, 1973-1992 3.2a Supply . . . . . . . . . . . . . . . . . . . . . . . . . . . . . . . . . . . . . . . . . . . . . . . . . 87 3.2b Disposition and Ending Stocks . . . . . . . . . . . . . . . . . . . . . . . . . . . . . . . . . . . 91
3.3 Petroleum Imports, 1973-1992 3.3a Algeria, Iraq, Kuwait, and Libya . . . . . . . . . . . . . . . . . . . . . . . . . . . . . . . . . . 95 3.3b Qatar, Saudi Arabia, U.A.E., and Total Arab OPEC . . . . . . . . . . . . . . . . . . . . . . . 99 3.3c Ecuador, Gabon, Indonesia, and Iran . . . . . . . . . . . . . . . . . . . . . . . . . . . . . . 103 3.3d Nigeria, Venezuela, Total Non-Arab OPEC, and Total OPEC . . . . . . . . . . . . . . . . 107 3.3e Angola, Australia, Bahama Islands, Brazil, Canada, and China . . . . . . . . . . . . . . . 111 3.3f Colombia, Italy, Malaysia, Mexico, and Netherlands . . . . . . . . . . . . . . . . . . . . . 115 3.3g Netherlands Antilles, Norway, Puerto Rico, Russia, Spain, and Trinidad and Tobago . . 119 3.3h United Kingdom, Virgin Islands, Other Non-OPEC, Total Non-OPEC, and Total
Imports . . . . . . . . . . . . . . . . . . . . . . . . . . . . . . . . . . . . . . . . . . . . . . 1233.4 Finished Motor Gasoline Supply and Disposition, 1973-1992 . . . . . . . . . . . . . . . . . . . . . 1273.5 Distillate Fuel Oil Supply and Disposition, 1973-1992 . . . . . . . . . . . . . . . . . . . . . . . . . 1313.6 Residual Fuel Oil Supply and Disposition, 1973-1992 . . . . . . . . . . . . . . . . . . . . . . . . . . 1353.7 Jet Fuel Supply and Disposition, 1973-1992 . . . . . . . . . . . . . . . . . . . . . . . . . . . . . . . 1393.8 Liquefied Petroleum Gases Supply and Disposition, 1973-1992 . . . . . . . . . . . . . . . . . . . . 1433.9 Propane and Propylene Supply and Disposition, 1973-1992 . . . . . . . . . . . . . . . . . . . . . . 1473.10 Other Petroleum Products Supply and Disposition, 1973-1992 . . . . . . . . . . . . . . . . . . . . 151
Tables
Page
Energy Information Administration/Historical Monthly Energy Review 1973-1992vi

Section 4. Natural Gas
4.1 Natural Gas Production, 1973-1992 . . . . . . . . . . . . . . . . . . . . . . . . . . . . . . . . . . . . 1614.2 Natural Gas Supply and Disposition, 1973-1992 . . . . . . . . . . . . . . . . . . . . . . . . . . . . 1654.3 Natural Gas Trade by Country, 1973-1992 . . . . . . . . . . . . . . . . . . . . . . . . . . . . . . . . 1694.4 Natural Gas Consumption by End-Use Sector, 1973-1992 . . . . . . . . . . . . . . . . . . . . . . . 1734.5 Natural Gas in Underground Storage, 1973-1992 . . . . . . . . . . . . . . . . . . . . . . . . . . . . 177
Section 5. Oil and Gas Resource Development
5.1 Oil and Gas Drilling Activity Measurements, 1973-1992 . . . . . . . . . . . . . . . . . . . . . . . . 1875.2 Oil and Gas Wells Drilled, 1973-1992 . . . . . . . . . . . . . . . . . . . . . . . . . . . . . . . . . . . 191
Section 6. Coal
6.1 Coal Overview, 1973-1992 . . . . . . . . . . . . . . . . . . . . . . . . . . . . . . . . . . . . . . . . . 1996.2 Coal Consumption by End-Use Sector, 1973-1992 . . . . . . . . . . . . . . . . . . . . . . . . . . . . 2036.3 Coal Stocks, End of Period, 1973-1992 . . . . . . . . . . . . . . . . . . . . . . . . . . . . . . . . . . . 207
Section 7. Electricity
7.1 Electric Utility Net Generation of Electricity, 1973-1992 . . . . . . . . . . . . . . . . . . . . . . . . . 2157.2 Electricity Sales by End-Use Sector, 1973-1992 . . . . . . . . . . . . . . . . . . . . . . . . . . . . . . 2197.3 Electric Utility Consumption of Fossil Fuels to Generate Electricity, 1973-1992 . . . . . . . . . . . 2237.4 Electric Utility Stocks of Coal and Petroleum, End of Period, 1973-1992 . . . . . . . . . . . . . . . 227
Section 8. Nuclear Energy
8.1 Nuclear Power Plant Operations, 1973-1992 . . . . . . . . . . . . . . . . . . . . . . . . . . . . . . . 2358.2 Nuclear Generating Units, End of Period, 1973-1992 . . . . . . . . . . . . . . . . . . . . . . . . . . 239
Section 9. Energy Prices
9.1 Crude Oil Price Summary, 1973-1992 . . . . . . . . . . . . . . . . . . . . . . . . . . . . . . . . . . . 2479.2 F.O.B. Costs of Crude Oil Imports from Selected Countries, 1973-1992 . . . . . . . . . . . . . . . . 2519.3 Landed Costs of Crude Oil Imports from Selected Countries, 1973-1992 . . . . . . . . . . . . . . . 2559.4 Motor Gasoline Retail Prices, U.S. City Average, 1973-1992 . . . . . . . . . . . . . . . . . . . . . . 2599.5 Refiner Prices of Residual Fuel Oil
9.5a Wholesale and Retail, 1975-1982 . . . . . . . . . . . . . . . . . . . . . . . . . . . . . . . . . 263 9.5b Resale and End Users, 1978-1992 . . . . . . . . . . . . . . . . . . . . . . . . . . . . . . . . . 265
9.6 Refiner Prices of Petroleum Products, Wholesale/Resale 9.6a Wholesale, 1975-1982 . . . . . . . . . . . . . . . . . . . . . . . . . . . . . . . . . . . . . . . 268 9.6b For Resale, 1978-1992 . . . . . . . . . . . . . . . . . . . . . . . . . . . . . . . . . . . . . . . 270
9.7 Refiner Prices of Petroleum Products, Retail/End Users 9.7a Retail, 1975-1982 . . . . . . . . . . . . . . . . . . . . . . . . . . . . . . . . . . . . . . . . . . 273 9.7b To End Users, 1978-1992 . . . . . . . . . . . . . . . . . . . . . . . . . . . . . . . . . . . . . . 275
9.8 No. 2 Distillate Prices to Residences, 1978-1992 9.8a Northeastern States . . . . . . . . . . . . . . . . . . . . . . . . . . . . . . . . . . . . . . . . 278 9.8b Selected South Atlantic and Midwestern States . . . . . . . . . . . . . . . . . . . . . . . . 281 9.8c Selected Western States and U.S. Average . . . . . . . . . . . . . . . . . . . . . . . . . . . . 284
Tables (continued)
Page
Energy Information Administration/Historical Monthly Energy Review 1973-1992 vii

Section 9. Energy Prices (continued)
9.9 Electricity Retail Prices, 1973-1992 . . . . . . . . . . . . . . . . . . . . . . . . . . . . . . . . . . . . . 2879.10 Quantity and Cost of Fossil-Fuel Receipts at Steam-Electric Utility Plants, 1973-1992 . . . . . . . 2919.11 Natural Gas Prices, 1973-1992 . . . . . . . . . . . . . . . . . . . . . . . . . . . . . . . . . . . . . . . 295
Section 10. International Energy
10.1 World Crude Oil Production, 1973-1992 10.1a Algeria Through Venezuela . . . . . . . . . . . . . . . . . . . . . . . . . . . . . . . . . . . 307 10.1b Total OPEC, Ecuador Through Market Economies, and World . . . . . . . . . . . . . . . 311
10.2 Petroleum Consumption in OECD Countries, 1973-1992 . . . . . . . . . . . . . . . . . . . . . . . . 31510.3 Petroleum Stocks in OECD Countries, End of Period, 1973-1992 . . . . . . . . . . . . . . . . . . . 31810.4 Nuclear Electricity Gross Generation, 1973-1992
10.4a Regions and Total . . . . . . . . . . . . . . . . . . . . . . . . . . . . . . . . . . . . . . . . . 321 10.4b North, Central, and South America . . . . . . . . . . . . . . . . . . . . . . . . . . . . . . 325 10.4c Western Europe . . . . . . . . . . . . . . . . . . . . . . . . . . . . . . . . . . . . . . . . . . 329 10.4d Far East and Africa . . . . . . . . . . . . . . . . . . . . . . . . . . . . . . . . . . . . . . . . 333
Appendix A. Thermal Conversion Factors
A1. Approximate Heat Content of Petroleum Products . . . . . . . . . . . . . . . . . . . . . . . . . . . 339A2. Approximate Heat Content of Crude Oil, Crude Oil and Products, and Natural Gas
Plant Liquids, 1973-1992 . . . . . . . . . . . . . . . . . . . . . . . . . . . . . . . . . . . . . . . . . 340A3. Approximate Heat Content of Petroleum Products, Weighted Averages, 1973-1992 . . . . . . . . 340A4. Approximate Heat Content of Natural Gas, 1973-1992 . . . . . . . . . . . . . . . . . . . . . . . . . 341A5. Approximate Heat Content of Coal, 1973-1992 . . . . . . . . . . . . . . . . . . . . . . . . . . . . . 341A6. Approximate Heat Content of Bituminous Coal and Lignite, 1973-1992 . . . . . . . . . . . . . . . 342A7. Approximate Heat Content of Anthracite and Coal Coke, 1973-1992 . . . . . . . . . . . . . . . . . 342A8. Approximate Heat Rates for Electricity, 1973-1992 . . . . . . . . . . . . . . . . . . . . . . . . . . . 343
Appendix B. Metric and Other Physical Conversion Factors
B1. Metric Conversion Factors . . . . . . . . . . . . . . . . . . . . . . . . . . . . . . . . . . . . . . . . . 350B2. Metric Prefixes . . . . . . . . . . . . . . . . . . . . . . . . . . . . . . . . . . . . . . . . . . . . . . . . 351B3. Other Physical Conversion Factors . . . . . . . . . . . . . . . . . . . . . . . . . . . . . . . . . . . . 351
Tables (continued)
Page
Energy Information Administration/Historical Monthly Energy Review 1973-1992viii

Section 1Energy Overview
Bonneville Power Administration's Hungry Horse Dam generates electricity in thePacific Northwest.

Table 1.1 Energy Summary, Annual Data, 1973-1992
(Quadrillion Btu)
Activity and Energy Source 1973 1974 1975 1976 1977 1978 1979 1980 1981 1982
Productiona ..................................... 62.060 60.835 59.860 59.892 60.219 61.103 63.801 64.761 64.421 R 63.962 Coal .............................................. 13.993 14.074 14.990 15.654 15.755 14.910 17.539 18.597 18.376 18.639 Natural Gas (Dry) ......................... 22.187 21.210 19.640 19.480 19.565 19.485 20.076 19.908 19.699 R 18.319 Petroleum ..................................... 22.062 21.046 20.104 19.589 19.781 20.679 20.390 20.503 20.453 20.500 Crude Oilb ................................. 19.493 18.575 17.729 17.262 17.454 18.434 18.104 18.249 18.146 18.309 NGPLc ...................................... 2.569 2.471 2.374 2.327 2.327 2.245 2.286 2.254 2.307 2.191 Nuclear Electric Power ................. .910 1.272 1.900 2.111 2.702 3.024 2.776 2.739 3.008 3.131 Hydroelectric Powerd .................... 2.861 3.177 3.155 2.976 2.333 2.937 2.931 2.900 2.758 3.266 Geothermal ................................... .043 .053 .070 .078 .077 .064 .084 .110 .123 .105 Othere ........................................... .003 .003 .002 .003 .005 .003 .005 .005 .004 .003
Consumptiona ................................. 74.282 72.543 70.546 74.362 76.288 78.089 78.898 75.955 73.990 70.848 Coal .............................................. 12.971 12.663 12.663 13.584 13.922 13.765 15.039 15.423 15.907 15.322 Natural Gasf ................................. 22.512 21.732 19.948 20.345 19.931 20.000 20.666 20.394 19.928 18.505 Petroleum ..................................... 34.840 33.455 32.731 35.175 37.122 37.965 37.123 34.202 31.931 30.231 Nuclear Electric Power ................. .910 1.272 1.900 2.111 2.702 3.024 2.776 2.739 3.008 3.131 Hydroelectric Powerg .................... 3.010 3.309 3.219 3.066 2.515 3.141 3.141 3.118 3.105 3.572 Geothermal ................................... .043 .053 .070 .078 .077 .064 .084 .110 .123 .105 Otherh ........................................... -.004 .059 .016 .003 .020 .128 .068 -.031 -.012 -.018
Imports ............................................ 14.731 14.413 14.111 16.837 20.090 19.254 19.616 15.971 13.975 12.092 Coal .............................................. .003 .052 .024 .030 .041 .074 .051 .030 .026 .019 Natural Gas .................................. 1.060 .985 .978 .988 1.037 .995 1.300 1.006 .917 .950 Petroleum ..................................... 13.466 13.127 12.948 15.672 18.756 17.824 17.933 14.658 12.639 10.777 Crude Oili .................................. 6.887 7.395 8.721 11.239 14.027 13.460 13.825 11.195 9.336 7.418 Productsj ................................... 6.578 5.731 4.227 4.434 4.728 4.364 4.108 3.463 3.303 3.359 Electricityk ..................................... .175 .161 .117 .114 .210 .220 .233 .260 .379 .343 Coal Coke ..................................... .027 .088 .045 .033 .045 .142 .099 .016 .013 .003
Exports ............................................ 2.051 2.223 2.359 2.188 2.071 1.931 2.870 3.723 4.329 4.633 Coal .............................................. 1.425 1.620 1.761 1.597 1.442 1.078 1.753 2.421 2.944 2.787 Natural Gas .................................. .079 .078 .074 .066 .056 .053 .056 .049 .060 .052 Petroleum ..................................... .486 .465 .439 .469 .514 .767 1.002 1.160 1.264 1.732 Crude Oilb ................................. .004 .006 .012 .017 .106 .335 .497 .609 .482 .500 Productsj ................................... .482 .458 .427 .452 .408 .432 .505 .551 .781 1.231 Electricityk ..................................... .027 .028 .053 .025 .029 .015 .023 .043 .032 .037 Coal Coke ..................................... .035 .032 .032 .033 .031 .017 .036 .051 .029 .025
Net Imports ...................................... 12.680 12.190 11.752 14.648 18.019 17.323 16.746 12.247 9.646 7.460 Coal .............................................. -1.422 -1.568 -1.738 -1.567 -1.401 -1.004 -1.702 -2.391 -2.918 -2.768 Natural Gas .................................. .981 .907 .904 .922 .981 .941 1.243 .957 .857 .898 Petroleum ..................................... 12.980 12.662 12.508 15.203 18.242 17.057 16.931 13.499 11.376 9.045 Crude Oili .................................. 6.883 7.389 8.708 11.221 13.921 13.125 13.328 10.586 8.854 6.917 Productsj ................................... 6.097 5.273 3.800 3.982 4.321 3.932 3.603 2.912 2.522 2.128 Electricityk ..................................... .148 .133 .064 .089 .182 .204 .211 .217 .347 .306 Coal Coke ..................................... -.007 .056 .014 .000 .015 .125 .063 -.035 -.016 -.022
See footnotes at end of table.
Energy Information Administration/Historical Monthly Energy Review 1973-1992 3

Table 1.1 Energy Summary, Annual Data, 1973-1992 (Continued)
(Quadrillion Btu)
Activity and Energy Source 1983 1984 1985 1986 1987 1988 1989 1990 1991 1992
Productiona ..................................... R 61.279 R 65.962 R 64.871 R 64.350 R 64.952 R 66.105 66.129 67.853 67.484 66.853 Coal .............................................. 17.246 19.719 19.325 19.510 20.142 20.737 21.345 22.456 21.594 21.593 Natural Gas (Dry) ......................... R 16.593 R 18.008 R 16.980 R 16.541 R 17.136 R 17.599 17.847 18.362 18.229 18.375 Petroleum ..................................... 20.576 21.122 21.233 20.525 19.890 19.539 18.275 17.746 18.007 17.586 Crude Oilb ................................. 18.392 18.848 18.992 18.376 17.675 17.279 16.117 15.571 15.701 15.223 NGPLc ...................................... 2.184 2.274 2.241 2.149 2.215 2.260 2.158 2.175 2.306 2.363 Nuclear Electric Power ................. 3.203 3.553 4.149 4.471 4.906 5.661 5.677 6.161 6.579 6.607 Hydroelectric Powerd .................... 3.527 R 3.386 R 2.970 R 3.071 R 2.635 R 2.334 2.767 2.926 2.885 2.501 Geothermal ................................... .129 .165 .198 .219 .229 .217 .197 .181 .170 .170 Othere ........................................... .004 .009 .015 .012 .016 .017 .020 .021 .021 .022
Consumptiona ................................. 70.524 R 74.144 R 73.981 R 74.297 R 76.894 R 80.218 81.325 81.265 81.116 82.144 Coal .............................................. 15.894 R 17.071 17.478 R 17.261 18.008 18.846 18.925 19.101 18.770 18.868 Natural Gasf ................................. 17.357 18.507 17.834 16.708 17.744 18.552 19.384 19.296 19.606 20.131 Petroleum ..................................... 30.054 31.051 30.922 32.196 32.865 34.222 34.211 33.553 32.845 33.527 Nuclear Electric Power ................. 3.203 3.553 4.149 4.471 4.906 5.661 5.677 6.161 6.579 6.607 Hydroelectric Powerg .................... 3.899 R 3.800 R 3.398 R 3.446 R 3.117 R 2.662 2.881 2.946 3.115 2.793 Geothermal ................................... .129 .165 .198 .219 .229 .217 .197 .181 .170 .170 Otherh ........................................... -.012 -.002 .001 -.004 .024 .057 .051 .026 .030 .049
Imports ............................................ 12.027 R 12.767 R 12.103 R 14.438 R 15.764 R 17.564 18.947 18.987 18.577 19.650 Coal .............................................. .032 .032 .049 .055 .044 .053 .071 .067 .085 .095 Natural Gas .................................. .940 .847 .952 .748 .992 1.296 1.387 1.551 1.798 2.112 Petroleum ..................................... 10.647 11.433 10.609 13.201 14.162 15.747 17.162 17.117 16.348 16.968 Crude Oili .................................. 7.079 R 7.302 R 6.814 R 9.002 R 10.067 R 11.027 12.596 12.766 12.553 13.253 Productsj ................................... 3.568 4.131 3.796 4.199 4.095 4.720 4.565 4.351 3.794 3.714 Electricityk ..................................... .407 .441 .479 .425 .544 .401 .269 .233 .319 .349 Coal Coke ..................................... .001 .014 .014 .008 .023 .067 .057 .019 .027 .043
Exports ............................................ 3.717 3.804 4.231 4.055 R 3.853 4.415 4.765 4.910 5.220 5.017 Coal .............................................. 2.045 2.151 2.438 2.248 2.093 2.499 2.637 2.772 2.854 2.682 Natural Gas .................................. .055 .055 .056 .062 .055 .075 .109 .087 .132 .246 Petroleum ..................................... 1.565 1.545 1.657 1.670 1.630 1.741 1.836 1.824 2.128 2.008 Crude Oilb ................................. .348 R .384 R .432 R .326 R .319 R .329 .300 .230 .246 .188 Productsj ................................... 1.217 1.161 1.225 1.344 1.311 1.412 1.536 1.594 1.882 1.819 Electricityk ..................................... .035 .027 .052 .050 .061 .073 .156 .212 .088 .071 Coal Coke ..................................... .017 .026 .028 .025 .014 .027 .027 .014 .018 .016
Net Imports ...................................... 8.310 R 8.963 R 7.872 R 10.382 R 11.911 R 13.149 14.181 14.077 13.357 14.633 Coal .............................................. -2.013 -2.119 -2.389 -2.193 -2.049 -2.446 -2.566 -2.705 -2.769 -2.587 Natural Gas .................................. .885 .792 .896 .686 .937 1.221 1.278 1.464 1.666 1.941 Petroleum ..................................... 9.082 9.888 8.952 11.531 12.532 14.006 15.325 15.293 14.220 14.960 Crude Oili .................................. 6.731 6.918 6.381 8.676 9.748 10.698 12.296 12.536 12.308 13.065 Productsj ................................... 2.351 2.970 2.570 2.855 2.784 3.308 3.029 2.757 1.912 1.895 Electricityk ..................................... .372 R .414 R .428 R .375 R .483 R .328 .113 .020 .231 .292 Coal Coke ..................................... -.016 -.011 -.013 -.017 .009 .040 .030 .005 .009 .027
a Due to a lack of consistent historical data, some renewable energysources are not included. For example, in 1991, 3.3 quadrillion Btu ofrenewable energy consumed by U.S. electric utilities to generate electricity fordistribution is included, but an estimated 3.4 quadrillion Btu of renewableenergy used by other sectors is not included.
b Includes lease condensate.c Natural gas plant liquids.d Electric utility and industrial production of hydroelectric power.e Other production is electricity generated for distribution from wood,
waste, wind, photovoltaic, and solar thermal energy.f Includes supplemental gaseous fuels.
g Electric utility and industrial production and net imports of electricity.h Other consumption is net imports of coal coke and electricity generated
for distribution from wood, waste, wind, photovoltaic, and solar thermal
energy.i Crude oil, lease condensate, and imports of crude oil for the Strategic
Petroleum Reserve.j Petroleum products, unfinished oils, pentanes plus, and gasoline
blending components.k Assumed to be hydroelectricity and estimated at the input heat rate for
fossil-fuel steam-electric power plant generation, which averaged 10.4thousand Btu per kilowatthour from 1973-1992. Actual heat rates applied inconverting kilowatthours to Btu are listed by year in Table A8.
R=Revised data. Notes: • Totals may not equal sum of components due to independent
rounding. • Geographic coverage is the 50 States and the District ofColumbia.
Sources: See end of section.
Energy Information Administration/Historical Monthly Energy Review 1973-19924

Table 1.2 Energy Overview, 1973-1992
(Quadrillion Btu)
Productiona Consumptiona,b Imports Exports Net Imports
1973January ................................................. 5.280 7.118 1.183 R 0.127 R 1.056February ............................................... 5.042 6.491 1.177 R .122 R 1.055March .................................................... 5.294 6.403 1.319 R .141 R 1.178April ...................................................... 5.040 5.839 R 1.095 R .196 R .899May ....................................................... 5.286 5.958 1.173 R .198 R .975June ...................................................... 5.047 5.683 1.139 R .180 R .959July ....................................................... 5.067 5.828 R 1.226 R .166 R 1.061August .................................................. 5.356 6.065 1.308 R .193 R 1.115September ............................................ 5.003 5.653 R 1.236 .148 R 1.088October ................................................. 5.279 6.060 R 1.326 .209 R 1.117November ............................................. 5.117 6.410 1.331 R .185 1.147December ............................................. 5.250 6.775 R 1.217 R .185 R 1.032Total ..................................................... 62.060 74.282 14.731 2.051 12.680
1974January ................................................. 5.358 6.788 R 1.092 .123 .969February ............................................... 4.947 6.204 .964 .166 .798March .................................................... 5.278 6.258 1.074 .134 R .940April ...................................................... 5.156 5.750 1.165 .188 .977May ....................................................... 5.342 5.748 1.290 R .219 R 1.071June ...................................................... 4.924 5.528 1.220 .227 .993July ....................................................... 5.115 5.861 1.290 .202 R 1.087August .................................................. 5.135 5.893 1.270 .192 R 1.077September ............................................ 4.970 5.595 1.163 .171 .992October ................................................. 5.240 6.065 1.242 .248 R .994November ............................................. 4.535 6.124 R 1.314 .227 R 1.087December ............................................. 4.836 6.730 R 1.328 .124 R 1.204Total ..................................................... 60.835 72.543 14.413 2.223 12.190
1975January ................................................. 5.156 6.929 1.354 .166 R 1.188February ............................................... 4.780 6.056 1.115 .174 R .940March .................................................... 5.109 6.264 1.147 R .203 .944April ...................................................... 4.969 5.686 R .985 .212 R .773May ....................................................... 5.096 5.373 1.047 R .237 .810June ...................................................... 4.989 5.314 1.040 R .218 .821July ....................................................... 4.843 5.551 1.175 .175 1.000August .................................................. 4.942 5.630 1.233 .206 1.027September ............................................ 4.870 5.384 1.282 .172 R 1.110October ................................................. 5.110 5.797 1.242 .171 1.071November ............................................. 4.885 5.744 R 1.222 .242 .981December ............................................. 5.110 6.818 1.269 .183 1.086Total ..................................................... 59.860 70.546 14.111 2.359 11.752
1976January ................................................. 5.056 7.185 1.319 .135 1.184February ............................................... 4.843 6.263 1.235 R .132 1.104March .................................................... 5.197 6.257 1.312 .150 1.163April ...................................................... 4.928 5.731 1.260 R .204 1.055May ....................................................... 5.032 5.660 R 1.243 .195 1.049June ...................................................... 5.027 5.693 R 1.405 .224 1.182July ....................................................... 4.793 5.887 1.518 .185 R 1.334August .................................................. 4.950 5.832 1.436 .166 1.270September ............................................ 4.945 5.609 1.483 .199 1.284October ................................................. 5.024 6.121 1.474 .202 1.272November ............................................. 4.943 6.602 1.515 .216 1.299December ............................................. 5.155 7.521 1.635 .181 1.453Total ..................................................... 59.892 74.362 16.837 2.188 14.648
1977January ................................................. 4.785 7.710 1.722 .102 1.620February ............................................... 4.633 6.532 1.749 R .129 R 1.620March .................................................... 5.331 6.433 1.821 .138 1.683April ...................................................... 5.018 5.851 R 1.635 .197 R 1.438May ....................................................... 5.152 5.857 1.660 R .213 R 1.447June ...................................................... 5.069 5.946 1.665 .211 1.454July ....................................................... 4.840 6.052 R 1.744 .197 R 1.547August .................................................. 5.039 6.149 1.654 .167 R 1.487September ............................................ 5.199 5.939 R 1.606 R .194 R 1.411October ................................................. 5.268 6.140 1.632 .188 1.444November ............................................. 5.257 6.365 R 1.538 .173 R 1.365December ............................................. 4.629 7.314 1.665 R .162 1.502Total ..................................................... 60.219 76.288 20.090 2.071 18.019
See footnotes at end of table.
Energy Information Administration/Historical Monthly Energy Review 1973-1992 5

Table 1.2 Energy Overview, 1973-1992 (Continued)
(Quadrillion Btu)
Productiona Consumptiona,b Imports Exports Net Imports
1978January ................................................. 4.472 7.574 1.622 0.078 1.544February ............................................... 4.157 6.905 1.432 .058 R 1.375March .................................................... 4.865 6.801 1.659 R .065 1.593April ...................................................... 5.171 6.016 R 1.479 .133 R 1.346May ....................................................... 5.491 6.183 1.492 .183 1.309June ...................................................... 5.310 5.995 R 1.525 R .221 1.304July ....................................................... 5.171 6.179 R 1.613 .161 1.452August .................................................. 5.364 6.326 1.614 .177 1.437September ............................................ 5.039 5.942 1.694 .185 R 1.510October ................................................. 5.423 6.278 1.629 R .224 1.406November ............................................. 5.347 6.547 1.678 R .238 1.441December ............................................. 5.291 7.344 1.817 .210 1.607Total ..................................................... 61.103 78.089 19.254 1.931 17.323
1979January ................................................. 5.318 7.928 R 1.783 R .176 1.607February ............................................... 4.923 7.258 1.527 R .160 1.367March .................................................... 5.501 6.987 1.722 R .242 1.479April ...................................................... 5.248 6.137 1.516 R .235 1.281May ....................................................... 5.455 6.187 1.601 R .251 R 1.350June ...................................................... 5.296 5.976 R 1.594 .252 1.342July ....................................................... 5.001 6.111 1.683 .267 1.416August .................................................. 5.488 R 6.324 1.688 R .261 R 1.427September ............................................ 5.165 R 5.891 1.536 .220 1.316October ................................................. 5.630 6.385 1.707 .284 R 1.424November ............................................. 5.404 6.530 1.564 R .263 1.302December ............................................. 5.372 7.183 1.695 R .259 R 1.436Total ..................................................... 63.801 78.898 19.616 2.870 16.746
1980January ................................................. 5.605 7.403 1.695 R .228 1.467February ............................................... 5.249 6.962 1.473 .211 1.262March .................................................... 5.633 6.848 1.476 .265 1.211April ...................................................... 5.396 5.986 1.339 .288 1.051May ....................................................... 5.527 5.837 R 1.282 .346 .936June ...................................................... 5.335 5.693 1.287 .361 .926July ....................................................... 5.186 5.944 1.210 R .324 .886August .................................................. 5.276 5.874 1.203 R .314 .889September ............................................ 5.239 5.794 R 1.169 .331 .837October ................................................. 5.431 6.151 R 1.248 .372 .876November ............................................. 5.272 6.256 1.227 R .344 R .883December ............................................. 5.613 7.205 1.363 .339 1.023Total ..................................................... 64.761 75.955 15.971 3.723 12.247
1981January ................................................. 5.447 7.460 R 1.350 R .263 1.087February ............................................... 5.185 6.332 1.213 R .278 .934March .................................................... 5.677 6.440 R 1.195 .371 R .824April ...................................................... 4.597 5.709 1.087 .326 R .762May ....................................................... 4.732 5.765 1.134 .275 .859June ...................................................... 5.198 5.818 1.043 .247 .796July ....................................................... 5.542 6.022 1.143 .394 .749August .................................................. 5.717 5.923 1.135 .421 R .714September ............................................ 5.536 5.650 R 1.205 .413 .792October ................................................. 5.686 5.973 1.182 .467 .715November ............................................. 5.419 5.976 1.112 R .442 .670December ............................................. 5.685 6.922 1.175 .432 .743Total ..................................................... 64.421 73.990 13.975 4.329 9.646
1982January ................................................. R 5.499 7.266 1.085 .318 .768February ............................................... R 5.245 6.295 .890 .376 R .515March .................................................... R 5.845 6.356 R .908 .442 .466April ...................................................... R 5.417 5.850 R .854 .428 .427May ....................................................... R 5.404 5.412 .958 .421 .537June ...................................................... R 5.335 5.374 1.004 .419 .585July ....................................................... R 5.174 5.645 1.150 R .387 .762August .................................................. R 5.372 5.622 1.041 .358 .683September ............................................ R 5.118 5.373 R 1.041 R .375 .666October ................................................. R 5.245 5.545 R 1.066 .437 .629November ............................................. R 5.099 5.818 1.125 .351 .774December ............................................. R 5.210 6.293 .969 R .321 R .648Total ..................................................... R 63.962 70.848 12.092 4.633 7.460
See footnotes at end of table.
Energy Information Administration/Historical Monthly Energy Review 1973-19926

Table 1.2 Energy Overview, 1973-1992 (Continued)
(Quadrillion Btu)
Productiona Consumptiona,b Imports Exports Net Imports
1983January ................................................. R 5.301 R 6.712 0.942 R 0.300 0.641February ............................................... R 4.840 R 5.884 .732 .264 .468March .................................................... R 5.261 R 6.199 .783 .319 R .465April ...................................................... R 5.010 R 5.665 R .931 .314 .617May ....................................................... R 5.074 R 5.505 1.006 .348 R .658June ...................................................... R 4.974 R 5.499 R 1.018 .334 R .684July ....................................................... R 4.919 R 5.750 1.124 .273 .851August .................................................. R 5.290 R 5.893 R 1.199 .348 R .851September ............................................ R 5.068 R 5.484 1.173 R .324 .849October ................................................. R 5.220 R 5.506 1.051 .325 .726November ............................................. R 5.127 R 5.764 R 1.020 R .279 R .741December ............................................. R 5.196 R 6.663 1.047 R .289 .758Total ..................................................... R 61.279 70.524 12.027 3.717 8.310
1984January ................................................. R 5.620 R 7.450 1.102 .247 R .855February ............................................... R 5.389 R 6.436 1.053 R .220 .832March .................................................... R 5.695 R 6.645 R 1.048 .315 .732April ...................................................... R 5.410 R 6.063 1.035 R .326 R .709May ....................................................... R 5.700 R 5.960 1.170 .365 R .806June ...................................................... R 5.436 R 5.814 R 1.041 .367 R .674July ....................................................... R 5.538 R 5.946 R 1.066 .326 R .741August .................................................. R 5.847 R 6.117 R 1.005 R .358 R .647September ............................................ R 5.444 R 5.558 1.005 R .354 R .651October ................................................. R 5.309 R 5.766 R 1.143 .295 .848November ............................................. R 5.157 R 5.907 R 1.086 R .270 R .816December ............................................. R 5.417 R 6.484 R 1.013 .360 R .653Total ..................................................... R 65.962 R 74.144 R 12.767 3.804 R 8.963
1985January ................................................. R 5.572 R 7.189 .926 R .304 R .622February ............................................... R 5.199 R 6.701 R .757 R .305 R .451March .................................................... R 5.603 R 6.381 .971 .318 .653April ...................................................... R 5.368 R 5.902 1.034 .332 R .703May ....................................................... R 5.516 R 5.795 R 1.146 .381 R .765June ...................................................... R 5.275 R 5.681 R .961 .342 R .619July ....................................................... R 5.283 R 5.983 R .995 .328 R .667August .................................................. R 5.466 R 6.050 .959 R .419 .539September ............................................ R 5.266 R 5.564 R .965 .364 R .601October ................................................. R 5.498 R 5.836 1.029 R .364 R .665November ............................................. R 5.223 R 5.866 R 1.171 .406 R .765December ............................................. R 5.602 R 7.034 R 1.190 .368 R .822Total ..................................................... R 64.871 R 73.981 R 12.103 4.231 R 7.872
1986January ................................................. R 5.787 R 7.225 R 1.145 R .319 R .826February ............................................... R 5.256 R 6.456 R .876 .291 R .585March .................................................... R 5.622 R 6.579 R .944 R .314 .630April ...................................................... R 5.305 R 5.907 1.028 .380 .648May ....................................................... R 5.359 R 5.885 R 1.242 .365 R .877June ...................................................... R 5.176 R 5.803 R 1.276 .315 R .961July ....................................................... R 5.202 R 6.141 R 1.337 .338 R .999August .................................................. R 5.321 R 6.015 R 1.389 .374 R 1.015September ............................................ R 5.150 R 5.626 R 1.334 .347 R .987October ................................................. R 5.405 R 5.856 1.268 .352 .916November ............................................. R 5.232 R 5.948 R 1.262 .331 R .930December ............................................. R 5.535 R 6.855 R 1.337 R .328 R 1.009Total ..................................................... R 64.350 R 74.297 R 14.438 4.055 R 10.382
1987January ................................................. R 5.654 R 7.307 1.292 .281 R 1.011February ............................................... R 5.168 R 6.576 1.111 .294 .817March .................................................... R 5.547 R 6.593 R 1.183 .315 R .868April ...................................................... R 5.234 R 6.143 R 1.157 .324 R .833May ....................................................... R 5.269 R 6.006 R 1.201 .300 R .901June ...................................................... R 5.275 6.094 R 1.291 R .320 R .971July ....................................................... R 5.214 R 6.440 R 1.489 .307 R 1.183August .................................................. R 5.464 R 6.326 1.478 R .335 R 1.143September ............................................ R 5.363 R 5.939 1.371 .324 R 1.047October ................................................. R 5.603 R 6.182 R 1.414 R .305 1.109November ............................................. R 5.451 R 6.176 1.384 R .331 1.054December ............................................. R 5.712 R 7.112 1.392 .417 R .975Total ..................................................... R 64.952 R 76.894 R 15.764 R 3.853 R 11.911
See footnotes at end of table.
Energy Information Administration/Historical Monthly Energy Review 1973-1992 7

Table 1.2 Energy Overview, 1973-1992 (Continued)
(Quadrillion Btu)
Productiona Consumptiona,b Imports Exports Net Imports
1988January ................................................. R 5.683 R 7.619 R 1.477 0.289 R 1.188February ............................................... R 5.426 R 7.129 R 1.383 .276 1.107March .................................................... R 5.785 R 7.095 R 1.412 R .350 R 1.063April ...................................................... R 5.347 R 6.242 R 1.401 R .364 R 1.037May ....................................................... R 5.424 R 6.174 1.482 .373 1.109June ...................................................... R 5.354 R 6.297 R 1.406 R .394 1.012July ....................................................... R 5.287 R 6.535 R 1.472 .382 R 1.090August .................................................. R 5.716 R 6.770 R 1.482 R .408 R 1.075September ............................................ R 5.410 R 6.138 R 1.440 .396 R 1.044October ................................................. R 5.503 R 6.377 R 1.560 R .382 R 1.177November ............................................. R 5.525 R 6.503 1.497 R .361 1.136December ............................................. R 5.644 R 7.339 R 1.552 .440 R 1.112Total ..................................................... R 66.105 R 80.218 R 17.564 4.415 R 13.149
1989January ................................................. 5.736 7.388 1.642 .319 1.323February ............................................... 5.170 6.993 1.453 .337 1.116March .................................................... 5.737 7.262 1.495 .404 1.090April ...................................................... 5.336 6.385 1.558 .405 1.153May ....................................................... 5.619 6.362 1.556 .420 1.136June ...................................................... 5.401 6.408 1.535 .440 1.095July ....................................................... 5.252 6.554 1.666 .327 1.339August .................................................. 5.795 6.709 1.696 .408 1.288September ............................................ 5.415 6.190 1.550 .389 1.161October ................................................. 5.618 6.486 1.648 .420 1.229November ............................................. 5.596 6.643 1.605 .460 1.145December ............................................. 5.454 7.945 1.543 .436 1.107Total ..................................................... 66.129 81.325 18.947 4.765 14.181
1990January ................................................. 6.034 7.546 1.829 .361 1.468February ............................................... 5.463 6.753 1.512 .330 1.182March .................................................... 5.895 7.033 1.587 .428 1.159April ...................................................... 5.460 6.500 1.524 .388 1.136May ....................................................... 5.652 6.484 1.747 .412 1.335June ...................................................... 5.520 6.495 1.679 .412 1.267July ....................................................... 5.538 6.751 1.798 .385 1.412August .................................................. 5.833 6.966 1.716 .438 1.278September ............................................ 5.402 6.330 1.448 .441 1.007October ................................................. 5.829 6.558 1.397 .418 .979November ............................................. 5.638 6.547 1.396 .459 .936December ............................................. 5.589 7.301 1.355 .437 .918Total ..................................................... 67.853 81.265 18.987 4.910 14.077
1991January ................................................. 5.941 7.795 1.483 .397 1.085February ............................................... 5.438 6.643 1.294 .462 .832March .................................................... 5.803 6.893 1.391 .395 .996April ...................................................... 5.460 6.302 1.482 .326 1.156May ....................................................... 5.578 6.394 1.731 .489 1.241June ...................................................... 5.429 6.421 1.622 .423 1.199July ....................................................... 5.613 6.818 1.593 .457 1.136August .................................................. 5.763 6.798 1.754 .448 1.306September ............................................ 5.450 6.344 1.562 .432 1.130October ................................................. 5.771 6.561 1.562 .432 1.130November ............................................. 5.530 6.740 1.548 .464 1.084December ............................................. 5.708 7.408 1.556 .495 1.062Total ..................................................... 67.484 81.116 18.577 5.220 13.357
1992January ................................................. 5.919 7.678 1.615 .458 1.157February ............................................... 5.415 6.989 1.377 .372 1.005March .................................................... 5.630 7.070 1.500 .416 1.084April ...................................................... 5.407 6.565 1.639 .413 1.226May ....................................................... 5.491 6.435 1.641 .434 1.207June ...................................................... 5.461 6.403 1.609 .426 1.183July ....................................................... 5.587 6.822 1.770 .441 1.329August .................................................. 5.594 6.673 1.727 .367 1.360September ............................................ 5.439 6.356 1.654 .417 1.237October ................................................. 5.640 6.590 1.781 .383 1.399November ............................................. 5.479 6.798 1.650 .428 1.221December ............................................. 5.792 7.765 1.688 .462 1.226Total ..................................................... 66.853 82.144 19.650 5.017 14.633
a Due to a lack of consistent historical data, some renewable energysources are not included. For example, in 1991, 3.3 quadrillion Btu ofrenewable energy consumed by U.S. electric utilities to generate electricity fordistribution is included, but an estimated 3.4 quadrillion Btu of renewableenergy used by other sectors is not included.
b The sum of domestic energy production and net imports of energy doesnot equal domestic energy consumption. The difference is attributed to stockchanges; losses and gains in conversion, transportation, and distribution; the
addition of blending compounds; shipments of anthracite to U.S. ArmedForces in Europe; and adjustments to account for discrepancies betweenreporting systems.
R=Revised data. Notes: • For definitions, see Notes 1-4 at end of section. • Totals may
not equal sum of components due to independent rounding. • Geographiccoverage is the 50 States and the District of Columbia.
Sources: See end of section.
Energy Information Administration/Historical Monthly Energy Review 1973-19928

Table 1.3 Energy Production by Source, 1973-1992
(Quadrillion Btu)
Coal
NaturalGas(Dry)
Crude Oila
NaturalGas PlantLiquids
NuclearElectricPower
Hydro-electricPowerb
GeothermalEnergy Otherc Totald
1973January ............... 1.167 1.908 1.650 0.211 0.068 0.273 0.003 (s) 5.280February ............. 1.086 1.923 1.526 .198 .065 .242 .003 (s) 5.042March .................. 1.197 1.868 1.667 .218 .072 .269 .003 (s) 5.294April .................... 1.112 1.778 1.617 .213 .064 .253 .003 (s) 5.040May ..................... 1.217 1.859 1.665 .218 .062 .261 .003 (s) 5.286June .................... 1.104 1.802 1.603 .210 .074 .250 .004 (s) 5.047July ..................... 1.034 1.842 1.657 .218 .076 .236 .004 (s) 5.067August ................ 1.320 1.857 1.649 .219 .085 .222 .004 (s) 5.356September .......... 1.142 1.803 1.577 .211 .086 .180 .003 (s) 5.003October ............... 1.286 1.837 1.658 .220 .082 .192 .004 (s) 5.279November ........... 1.178 1.826 1.594 .215 .089 .210 .004 (s) 5.117December ........... 1.150 1.887 1.630 .217 .088 .274 .005 (s) 5.250Total ................... 13.993 22.187 19.493 2.569 .910 2.861 .043 .003 62.060
1974January ............... 1.251 1.895 1.606 .211 .085 .305 .004 (s) 5.358February ............. 1.166 1.729 1.485 .194 .091 .280 .004 (s) 4.947March .................. 1.195 1.861 1.612 .217 .098 .291 .004 (s) 5.278April .................... 1.268 1.748 1.558 .204 .080 .294 .004 (s) 5.156May ..................... 1.344 1.814 1.602 .210 .073 .295 .004 (s) 5.342June .................... 1.121 1.709 1.528 .203 .079 .281 .004 (s) 4.924July ..................... 1.150 1.785 1.579 .206 .114 .277 .005 (s) 5.115August ................ 1.210 1.757 1.564 .208 .138 .253 .004 (s) 5.135September .......... 1.228 1.723 1.469 .197 .123 .225 .004 (s) 4.970October ............... 1.411 1.735 1.548 .210 .121 .211 .004 (s) 5.240November ........... .791 1.698 1.491 .204 .123 .223 .005 (s) 4.535December ........... .941 1.757 1.533 .208 .148 .243 .005 (s) 4.836Total ................... 14.074 21.210 18.575 2.471 1.272 3.177 .053 .003 60.835
1975January ............... 1.276 1.738 1.520 .201 .154 .263 .004 (s) 5.156February ............. 1.198 1.607 1.395 .184 .140 .251 .004 (s) 4.780March .................. 1.217 1.698 1.527 .205 .164 .294 .005 (s) 5.109April .................... 1.238 1.633 1.471 .195 .147 .280 .005 (s) 4.969May ..................... 1.293 1.650 1.507 .198 .152 .292 .005 (s) 5.096June .................... 1.299 1.596 1.465 .197 .140 .285 .006 (s) 4.989July ..................... 1.063 1.638 1.499 .200 .169 .268 .006 (s) 4.843August ................ 1.197 1.638 1.483 .204 .175 .238 .007 (s) 4.942September .......... 1.295 1.565 1.441 .188 .159 .216 .006 (s) 4.870October ............... 1.396 1.608 1.497 .203 .161 .238 .007 (s) 5.110November ........... 1.249 1.581 1.440 .195 .156 .257 .007 (s) 4.885December ........... 1.269 1.690 1.484 .203 .184 .273 .007 (s) 5.110Total ................... 14.990 19.640 17.729 2.374 1.900 3.155 .070 .002 59.860
1976January ............... 1.213 1.710 1.480 .195 .178 .273 .007 (s) 5.056February ............. 1.239 1.608 1.384 .189 .159 .257 .007 (s) 4.843March .................. 1.404 1.674 1.480 .198 .155 .279 .007 (s) 5.197April .................... 1.364 1.585 1.405 .192 .121 .253 .006 (s) 4.928May ..................... 1.337 1.633 1.461 .195 .132 .268 .006 (s) 5.032June .................... 1.378 1.601 1.408 .191 .174 .268 .006 (s) 5.027July ..................... 1.024 1.636 1.461 .196 .196 .273 .007 (s) 4.793August ................ 1.239 1.597 1.458 .196 .203 .250 .007 (s) 4.950September .......... 1.398 1.528 1.418 .191 .191 .213 .007 (s) 4.945October ............... 1.357 1.600 1.450 .197 .192 .221 .006 (s) 5.024November ........... 1.355 1.597 1.406 .193 .178 .208 .005 (s) 4.943December ........... 1.346 1.712 1.449 .195 .233 .213 .006 (s) 5.155Total ................... 15.654 19.480 17.262 2.327 2.111 2.976 .078 .003 59.892
1977January ............... 1.018 1.700 1.412 .189 .239 .219 .007 .001 4.785February ............. 1.123 1.636 1.322 .175 .211 .160 .006 .001 4.633March .................. 1.520 1.711 1.455 .206 .223 .210 .007 .001 5.331April .................... 1.381 1.606 1.417 .197 .214 .197 .006 (s) 5.018May ..................... 1.423 1.653 1.452 .198 .222 .198 .006 (s) 5.152June .................... 1.437 1.611 1.410 .191 .232 .182 .006 (s) 5.069July ..................... 1.131 1.636 1.457 .197 .235 .178 .007 (s) 4.840August ................ 1.316 1.607 1.494 .195 .245 .177 .006 (s) 5.039September .......... 1.581 1.562 1.475 .187 .211 .174 .007 (s) 5.199October ............... 1.542 1.591 1.542 .199 .205 .182 .007 (s) 5.268November ........... 1.570 1.569 1.493 .192 .210 .216 .007 (s) 5.257December ........... .713 1.687 1.526 .200 .256 .241 .007 (s) 4.629Total ................... 15.755 19.565 17.454 2.327 2.702 2.333 .077 .005 60.219
See footnotes at end of table.
Energy Information Administration/Historical Monthly Energy Review 1973-1992 9

Table 1.3 Energy Production by Source, 1973-1992 (Continued)
(Quadrillion Btu)
Coal
NaturalGas(Dry)
Crude Oila
NaturalGas PlantLiquids
NuclearElectricPower
Hydro-electricPowerb
GeothermalEnergy Otherc Totald
1978January ............... 0.527 1.701 1.503 0.189 0.283 0.263 0.007 (s) 4.472February ............. .538 1.609 1.360 .172 .239 .233 .006 (s) 4.157March .................. .890 1.705 1.568 .194 .246 .258 .005 (s) 4.865April .................... 1.357 1.627 1.534 .191 .192 .265 .004 (s) 5.171May ..................... 1.567 1.623 1.587 .186 .223 .301 .004 (s) 5.491June .................... 1.493 1.584 1.537 .186 .243 .263 .005 (s) 5.310July ..................... 1.220 1.652 1.574 .190 .274 .256 .005 (s) 5.171August ................ 1.464 1.617 1.575 .189 .280 .232 .006 (s) 5.364September .......... 1.317 1.538 1.531 .182 .243 .222 .006 (s) 5.039October ............... 1.595 1.595 1.586 .187 .252 .204 .005 (s) 5.423November ........... 1.583 1.567 1.521 .189 .272 .209 .005 (s) 5.347December ........... 1.359 1.668 1.557 .191 .278 .231 .007 (s) 5.291Total ................... 14.910 19.485 18.434 2.245 3.024 2.937 .064 .003 61.103
1979January ............... 1.298 1.738 1.524 .188 .302 .262 .006 (s) 5.318February ............. 1.231 1.624 1.385 .173 .282 .223 .005 (s) 4.923March .................. 1.499 1.721 1.546 .190 .265 .272 .007 .001 5.501April .................... 1.436 1.660 1.488 .191 .200 .266 .007 (s) 5.248May ..................... 1.560 1.683 1.546 .192 .163 .303 .007 (s) 5.455June .................... 1.587 1.611 1.467 .186 .175 .262 .007 (s) 5.296July ..................... 1.203 1.630 1.504 .192 .227 .238 .007 (s) 5.001August ................ 1.608 1.656 1.537 .193 .263 .223 .008 (s) 5.488September .......... 1.450 1.603 1.483 .186 .237 .199 .007 (s) 5.165October ............... 1.764 1.672 1.550 .197 .228 .211 .008 (s) 5.630November ........... 1.538 1.691 1.524 .199 .209 .234 .007 .001 5.404December ........... 1.364 1.788 1.549 .199 .224 .238 .009 (s) 5.372Total ................... 17.539 20.076 18.104 2.286 2.776 2.931 .084 .005 63.801
1980January ............... 1.560 1.797 1.560 .200 .215 .266 .007 .001 5.605February ............. 1.469 1.686 1.464 .188 .210 .225 .007 .001 5.249March .................. 1.590 1.806 1.564 .190 .219 .256 .008 (s) 5.633April .................... 1.561 1.648 1.511 .191 .205 .271 .008 (s) 5.396May ..................... 1.592 1.672 1.553 .196 .201 .303 .010 (s) 5.527June .................... 1.599 1.565 1.488 .183 .200 .291 .009 (s) 5.335July ..................... 1.374 1.594 1.537 .185 .229 .257 .010 (s) 5.186August ................ 1.533 1.554 1.513 .184 .265 .215 .010 (s) 5.276September .......... 1.543 1.557 1.500 .178 .257 .194 .009 (s) 5.239October ............... 1.620 1.626 1.534 .184 .267 .188 .011 (s) 5.431November ........... 1.539 1.629 1.478 .184 .229 .202 .010 (s) 5.272December ........... 1.616 1.774 1.547 .189 .241 .234 .010 (s) 5.613Total ................... 18.597 19.908 18.249 2.254 2.739 2.900 .110 .005 64.761
1981January ............... 1.471 1.729 1.535 .201 .262 .237 .011 (s) 5.447February ............. 1.582 1.553 1.397 .182 .238 .223 .010 (s) 5.185March .................. 1.746 1.713 1.549 .198 .243 .218 .011 (s) 5.677April .................... .809 1.652 1.489 .188 .228 .220 .010 (s) 4.597May ..................... .850 1.676 1.529 .194 .218 .255 .010 (s) 4.732June .................... 1.373 1.613 1.501 .188 .233 .279 .010 (s) 5.198July ..................... 1.653 1.641 1.528 .189 .255 .266 .011 (s) 5.542August ................ 1.757 1.683 1.543 .197 .297 .228 .011 (s) 5.717September .......... 1.823 1.557 1.497 .190 .269 .189 .011 (s) 5.536October ............... 1.901 1.622 1.540 .195 .227 .191 .011 (s) 5.686November ........... 1.708 1.563 1.494 .192 .251 .201 .009 (s) 5.419December ........... 1.703 1.696 1.544 .194 .287 .252 .009 (s) 5.685Total ................... 18.376 19.699 18.146 2.307 3.008 2.758 .123 .004 64.421
1982January ............... 1.493 R 1.710 1.530 .189 .284 .284 .008 (s) R 5.499February ............. 1.583 R 1.567 1.413 .169 .224 .282 .008 (s) R 5.245March .................. 1.867 R 1.657 1.558 .189 .252 .315 .007 (s) R 5.845April .................... 1.636 R 1.564 1.495 .179 .241 .295 .007 (s) R 5.417May ..................... 1.582 R 1.535 1.561 .182 .240 .296 .008 (s) R 5.404June .................... 1.595 R 1.489 1.504 .175 .266 .296 .009 (s) R 5.335July ..................... 1.346 R 1.509 1.557 .182 .282 .288 .010 (s) R 5.174August ................ 1.621 R 1.476 1.552 .183 .277 .252 .010 (s) R 5.372September .......... 1.511 R 1.416 1.514 .176 .281 .210 .009 (s) R 5.118October ............... 1.576 R 1.444 1.565 .184 .257 .209 .010 (s) R 5.245November ........... 1.425 R 1.460 1.513 .187 .257 .246 .011 (s) R 5.099December ........... 1.404 R 1.494 1.546 .195 .270 .293 .008 (s) R 5.210Total ................... 18.639 R 18.319 18.309 2.191 3.131 3.266 .105 .003 R 63.962
See footnotes at end of table.
Energy Information Administration/Historical Monthly Energy Review 1973-199210

Table 1.3 Energy Production by Source, 1973-1992 (Continued)
(Quadrillion Btu)
Coal
NaturalGas(Dry)
Crude Oila
NaturalGas PlantLiquids
NuclearElectricPower
Hydro-electricPowerb
GeothermalEnergy Otherc Totald
1983January ............... 1.383 R 1.571 1.564 0.188 0.273 0.311 0.010 (s) R 5.301February ............. 1.337 R 1.363 1.422 .169 .242 .297 .008 (s) R 4.840March .................. 1.519 R 1.403 1.564 .183 .261 .322 .009 (s) R 5.261April .................... 1.364 R 1.375 1.527 .173 .244 .319 .009 (s) R 5.010May ..................... 1.394 R 1.371 1.552 .178 .240 .332 .007 (s) R 5.074June .................... 1.363 R 1.328 1.508 .175 .263 .326 .009 (s) R 4.974July ..................... 1.218 R 1.376 1.553 .183 .279 .299 .011 (s) R 4.919August ................ 1.616 R 1.352 1.561 .186 .286 .274 .015 (s) R 5.290September .......... 1.551 R 1.287 1.528 .184 .273 .231 .014 (s) R 5.068October ............... 1.582 R 1.353 1.577 .191 .281 .220 .014 (s) R 5.220November ........... 1.515 R 1.349 1.526 .189 .273 .262 .013 (s) R 5.127December ........... 1.405 R 1.463 1.510 .184 .287 .336 .010 .001 R 5.196Total ................... 17.246 R 16.593 18.392 2.184 3.203 3.527 .129 .004 R 61.279
1984January ............... 1.495 R 1.702 1.594 .186 .318 R .314 .010 .001 R 5.620February ............. 1.621 R 1.478 1.493 .181 .308 R .294 .013 (s) R 5.389March .................. 1.794 R 1.521 1.559 .189 .296 R .321 .014 .001 R 5.695April .................... 1.601 R 1.488 1.542 .185 .263 R .316 .014 .001 R 5.410May ..................... 1.784 R 1.485 1.610 .191 .280 R .336 .013 .001 R 5.700June .................... 1.682 R 1.438 1.540 .184 .274 R .304 .013 .001 R 5.436July ..................... 1.646 R 1.491 1.598 .193 .307 R .290 .012 .001 R 5.538August ................ 1.999 R 1.469 1.584 .193 .320 R .265 .015 .001 R 5.847September .......... 1.739 R 1.400 1.565 .190 .316 R .221 .014 .001 R 5.444October ............... 1.536 R 1.472 1.601 .195 .269 R .220 .015 .001 R 5.309November ........... 1.417 R 1.469 1.562 .192 .266 R .235 .015 .001 R 5.157December ........... 1.405 R 1.594 1.600 .195 .335 R .272 .017 .001 R 5.417Total ................... 19.719 R 18.008 18.848 2.274 3.553 R 3.386 .165 .009 R 65.962
1985January ............... 1.493 R 1.615 1.571 .192 .391 R .291 .016 .001 R 5.572February ............. 1.470 R 1.467 1.466 .173 .333 R .273 .015 .001 R 5.199March .................. 1.700 R 1.464 1.635 .189 .336 R .260 .017 .001 R 5.603April .................... 1.674 R 1.380 1.574 .181 .286 R .258 .015 .001 R 5.368May ..................... 1.714 R 1.365 1.642 .188 .310 R .279 .015 .001 R 5.516June .................... 1.602 R 1.319 1.570 .183 .333 R .252 .015 .001 R 5.275July ..................... 1.514 R 1.351 1.609 .185 .380 R .225 .016 .001 R 5.283August ................ 1.741 R 1.348 1.583 .189 .376 R .211 .017 .001 R 5.466September .......... 1.618 R 1.321 1.558 .180 .373 R .198 .016 .001 R 5.266October ............... 1.753 R 1.376 1.613 .190 .337 R .212 .016 .001 R 5.498November ........... 1.515 R 1.381 1.549 .190 .326 R .242 .019 .001 R 5.223December ........... 1.531 R 1.594 1.624 .199 .365 R .267 .021 .001 R 5.602Total ................... 19.325 R 16.980 18.992 2.241 4.149 R 2.970 .198 .015 R 64.871
1986January ............... 1.711 R 1.591 1.643 .201 .391 R .226 .021 .001 R 5.787February ............. 1.588 R 1.379 1.490 .180 .353 R .245 .018 .001 R 5.256March .................. 1.696 R 1.464 1.621 .189 .332 R .300 .019 .001 R 5.622April .................... 1.636 R 1.315 1.542 .173 .329 R .291 .017 .001 R 5.305May ..................... 1.598 R 1.340 1.589 .182 .345 R .288 .017 .001 R 5.359June .................... 1.587 R 1.282 1.500 .171 .338 R .277 .019 .001 R 5.176July ..................... 1.481 R 1.323 1.557 .177 .388 R .254 .020 .001 R 5.202August ................ 1.672 R 1.323 1.506 .170 .405 R .224 .020 .001 R 5.321September .......... 1.639 R 1.259 1.449 .167 .395 R .223 .017 .001 R 5.150October ............... 1.751 R 1.333 1.514 .174 .391 R .225 .016 .001 R 5.405November ........... 1.538 R 1.414 1.464 .179 .377 R .244 .014 .001 R 5.232December ........... 1.612 R 1.516 1.502 .185 .426 R .274 .019 .001 R 5.535Total ................... 19.510 R 16.541 18.376 2.149 4.471 R 3.071 .219 .012 R 64.350
1987January ............... 1.637 R 1.586 1.525 .187 .431 R .268 .019 .001 R 5.654February ............. 1.571 R 1.426 1.362 .172 .394 R .224 .018 .001 R 5.168March .................. 1.663 R 1.506 1.522 .188 .402 R .245 .019 .001 R 5.547April .................... 1.557 R 1.403 1.479 .181 .361 R .233 .018 .001 R 5.234May ..................... 1.550 R 1.387 1.499 .187 .370 R .256 .019 .001 R 5.269June .................... 1.690 R 1.329 1.440 .180 .394 R .221 .020 .002 R 5.275July ..................... 1.530 R 1.347 1.484 .187 .432 R .213 .020 .002 R 5.214August ................ 1.769 R 1.371 1.476 .185 .446 R .195 .020 .002 R 5.464September .......... 1.808 R 1.308 1.428 .181 .427 R .192 .019 .001 R 5.363October ............... 1.885 R 1.422 1.504 .189 .393 R .189 .019 .001 R 5.603November ........... 1.737 R 1.464 1.461 .187 .403 R .178 .018 .001 R 5.451December ........... 1.744 R 1.587 1.495 .191 .453 R .222 .019 .001 R 5.712Total ................... 20.142 R 17.136 17.675 2.215 4.906 R 2.635 .229 .016 R 64.952
See footnotes at end of table.
Energy Information Administration/Historical Monthly Energy Review 1973-1992 11

Table 1.3 Energy Production by Source, 1973-1992 (Continued)
(Quadrillion Btu)
Coal
NaturalGas(Dry)
Crude Oila
NaturalGas PlantLiquids
NuclearElectricPower
Hydro-electricPowerb
GeothermalEnergy Otherc Totald
1988January ............... 1.649 R 1.634 1.483 0.186 0.480 R 0.230 0.019 0.001 R 5.683February ............. 1.681 R 1.488 1.409 .177 .454 R .200 .016 .001 R 5.426March .................. 1.839 R 1.552 1.506 .193 .472 R .204 .019 .001 R 5.785April .................... 1.650 R 1.421 1.442 .184 .430 R .200 .017 .001 R 5.347May ..................... 1.621 R 1.455 1.480 .192 .437 R .223 .017 .001 R 5.424June .................... 1.675 R 1.383 1.422 .184 .474 R .198 .018 .002 R 5.354July ..................... 1.516 R 1.401 1.446 .191 .535 R .177 .020 .002 R 5.287August ................ 1.933 R 1.421 1.453 .190 .527 R .172 .019 .002 R 5.716September .......... 1.824 R 1.340 1.374 .185 .497 R .170 .018 .002 R 5.410October ............... 1.773 R 1.457 1.442 .196 .458 R .158 .018 .002 R 5.503November ........... 1.817 R 1.484 1.396 .190 .425 R .193 .018 .001 R 5.525December ........... 1.758 R 1.565 1.428 .193 .473 R .208 .018 .001 R 5.644Total ................... 20.737 R 17.599 17.279 2.260 5.661 R 2.334 .217 .017 R 66.105
1989January ............... 1.792 1.585 1.427 .197 .497 .219 .017 .001 5.736February ............. 1.641 1.464 1.265 .172 .415 .195 .016 .001 5.170March .................. 1.946 1.552 1.362 .196 .425 .236 .018 .001 5.737April .................... 1.686 1.478 1.352 .192 .359 .251 .016 .001 5.336May ..................... 1.802 1.498 1.405 .192 .411 .293 .017 .001 5.619June .................... 1.715 1.437 1.327 .173 .461 .270 .017 .002 5.401July ..................... 1.449 1.465 1.338 .183 .561 .237 .017 .002 5.252August ................ 1.988 1.454 1.356 .178 .589 .211 .016 .002 5.795September .......... 1.853 1.384 1.313 .170 .481 .197 .015 .002 5.415October ............... 1.956 1.452 1.340 .175 .467 .209 .016 .002 5.618November ........... 1.899 1.512 1.311 .170 .465 .221 .015 .002 5.596December ........... 1.618 1.567 1.319 .159 .545 .228 .016 .002 5.454Total ................... 21.345 17.847 16.117 2.158 5.677 2.767 .197 .020 66.129
1990January ............... 1.976 1.667 1.357 .183 .589 .245 .016 .002 6.034February ............. 1.790 1.485 1.218 .168 .534 .252 .015 .002 5.463March .................. 1.999 1.576 1.337 .181 .492 .293 .016 .002 5.895April .................... 1.815 1.494 1.289 .171 .411 .265 .013 .002 5.460May ..................... 1.888 1.510 1.318 .178 .459 .282 .015 .002 5.652June .................... 1.846 1.469 1.236 .167 .495 .290 .016 .001 5.520July ..................... 1.741 1.494 1.290 .176 .573 .247 .016 .002 5.538August ................ 2.004 1.499 1.310 .187 .595 .220 .015 .002 5.833September .......... 1.814 1.436 1.257 .183 .518 .178 .015 .002 5.402October ............... 2.039 1.562 1.356 .198 .463 .194 .015 .002 5.829November ........... 1.893 1.559 1.285 .194 .481 .209 .015 .002 5.638December ........... 1.651 1.611 1.319 .190 .551 .250 .016 .002 5.589Total ................... 22.456 18.362 15.571 2.175 6.161 2.926 .181 .021 67.853
1991January ............... 1.870 1.658 1.348 .194 .584 .269 .015 .002 5.941February ............. 1.800 1.459 1.240 .181 .514 .229 .013 .002 5.438March .................. 1.853 1.581 1.357 .199 .528 .270 .015 .002 5.803April .................... 1.727 1.506 1.306 .190 .447 .269 .013 .002 5.460May ..................... 1.739 1.497 1.332 .196 .502 .298 .014 .002 5.578June .................... 1.673 1.427 1.274 .186 .582 .271 .014 .002 5.429July ..................... 1.738 1.441 1.321 .191 .652 .254 .014 .002 5.613August ................ 1.937 1.447 1.315 .192 .628 .228 .014 .002 5.763September .......... 1.777 1.440 1.282 .185 .557 .193 .013 .002 5.450October ............... 1.969 1.554 1.337 .199 .512 .184 .014 .002 5.771November ........... 1.782 1.574 1.275 .194 .497 .192 .015 .002 5.530December ........... 1.730 1.645 1.312 .199 .576 .229 .015 .002 5.708Total ................... 21.594 18.229 15.701 2.306 6.579 2.885 .170 .021 67.484
1992January ............... 1.904 1.633 1.323 .199 .618 .225 .015 .002 5.919February ............. 1.778 1.440 1.243 .187 .564 .188 .013 .002 5.415March .................. 1.859 1.519 1.321 .200 .489 .225 .015 .002 5.630April .................... 1.785 1.491 1.269 .193 .451 .203 .014 .001 5.407May ..................... 1.737 1.529 1.289 .200 .487 .233 .014 .002 5.491June .................... 1.732 1.488 1.247 .194 .547 .237 .014 .002 5.461July ..................... 1.750 1.536 1.282 .198 .598 .206 .014 .002 5.587August ................ 1.830 1.495 1.245 .193 .626 .189 .014 .002 5.594September .......... 1.811 1.481 1.223 .189 .544 .176 .013 .002 5.439October ............... 1.869 1.579 1.281 .203 .521 .171 .014 .002 5.640November ........... 1.739 1.559 1.222 .200 .542 .201 .014 .002 5.479December ........... 1.799 1.626 1.277 .206 .620 .248 .014 .002 5.792Total ................... 21.593 18.375 15.223 2.363 6.607 2.501 .170 .022 66.853
a Includes lease condensate.b Electric utility and industrial generation.c "Other" production is electricity generated for distribution from wood,
waste, wind, photovoltaic, and solar thermal energy.d Due to a lack of consistent historical data, some renewable energy
sources are not included. For example, in 1991, 3.3 quadrillion Btu ofrenewable energy consumed by U.S. electric utilities to generate electricity for
distribution is included, but an estimated 3.4 quadrillion Btu of renewableenergy used by other sectors is not included.
R=Revised data. (s)=Less than 0.5 trillion Btu. Notes: • See Note 1 at end of section. • Totals may not equal sum of
components due to independent rounding. • Geographic coverage is the 50States and the District of Columbia.
Sources: See end of section.
Energy Information Administration/Historical Monthly Energy Review 1973-199212

Table 1.4 Energy Consumption by Source, 1973-1992
(Quadrillion Btu)
CoalNaturalGasa Petroleum
NuclearElectricPower
Hydro-electricPowerb
GeothermalEnergy Otherc Totald
1973January ............... 1.166 2.397 3.199 0.068 0.285 0.003 -0.001 7.118February ............. 1.050 2.171 2.949 .065 .254 .003 (s) 6.491March .................. 1.047 2.057 2.943 .072 .281 .003 -.002 6.403April .................... .999 1.874 2.634 .064 .265 .003 (s) 5.839May ..................... 1.014 1.765 2.842 .062 .273 .003 -.003 5.958June .................... 1.050 1.566 2.727 .074 .262 .004 (s) 5.683July ..................... 1.111 1.591 2.799 .076 .248 .004 -.001 5.828August ................ 1.136 1.615 2.992 .085 .235 .004 -.001 6.065September .......... 1.058 1.559 2.756 .086 .192 .003 -.001 5.653October ............... 1.083 1.744 2.941 .082 .204 .004 .002 6.060November ........... 1.089 1.945 3.060 .089 .222 .004 .001 6.410December ........... 1.169 2.228 2.998 .088 .287 .005 .001 6.775Total ................... 12.971 22.512 34.840 .910 3.010 .043 -.004 74.282
1974January ............... 1.146 2.284 2.949 .085 .316 .004 .004 6.788February ............. 1.036 2.103 2.676 .091 .290 .004 .003 6.204March .................. 1.051 2.051 2.748 .098 .302 .004 .004 6.258April .................... .995 1.732 2.630 .080 .305 .004 .005 5.750May ..................... 1.029 1.647 2.683 .073 .306 .004 .005 5.748June .................... 1.014 1.474 2.661 .079 .292 .004 .004 5.528July ..................... 1.111 1.550 2.789 .114 .288 .005 .004 5.861August ................ 1.112 1.546 2.824 .138 .264 .004 .004 5.893September .......... 1.006 1.574 2.646 .123 .236 .004 .007 5.595October ............... 1.052 1.747 2.909 .121 .222 .004 .009 6.065November ........... 1.022 1.871 2.865 .123 .234 .005 .005 6.124December ........... 1.089 2.154 3.073 .148 .255 .005 .005 6.730Total ................... 12.663 21.732 33.455 1.272 3.309 .053 .059 72.543
1975January ............... 1.132 2.295 3.066 .154 .269 .004 .009 6.929February ............. 1.039 1.980 2.628 .140 .256 .004 .008 6.056March .................. 1.072 1.943 2.779 .164 .299 .005 .003 6.264April .................... .996 1.608 2.645 .147 .285 .005 (s) 5.686May ..................... .977 1.359 2.581 .152 .297 .005 .003 5.373June .................... 1.022 1.283 2.573 .140 .291 .006 -.001 5.314July ..................... 1.082 1.341 2.681 .169 .274 .006 -.001 5.551August ................ 1.117 1.398 2.692 .175 .243 .007 -.002 5.630September .......... 1.003 1.399 2.599 .159 .221 .006 -.003 5.384October ............... 1.021 1.576 2.789 .161 .244 .007 -.001 5.797November ........... 1.044 1.674 2.600 .156 .262 .007 .001 5.744December ........... 1.159 2.092 3.097 .184 .278 .007 .001 6.818Total ................... 12.663 19.948 32.731 1.900 3.219 .070 .016 70.546
1976January ............... 1.201 2.337 3.182 .178 .281 .007 -.001 7.185February ............. 1.064 1.977 2.795 .159 .264 .007 -.002 6.263March .................. 1.104 1.755 2.952 .155 .286 .007 -.002 6.257April .................... 1.054 1.538 2.753 .121 .261 .006 -.002 5.731May ..................... 1.060 1.463 2.726 .132 .275 .006 -.003 5.660June .................... 1.099 1.362 2.778 .174 .275 .006 -.001 5.693July ..................... 1.171 1.399 2.834 .196 .281 .007 (s) 5.887August ................ 1.180 1.343 2.840 .203 .257 .007 .002 5.832September .......... 1.082 1.328 2.780 .191 .221 .007 .001 5.609October ............... 1.119 1.653 2.916 .192 .229 .006 .006 6.121November ........... 1.176 1.913 3.112 .178 .215 .005 .002 6.602December ........... 1.274 2.277 3.508 .233 .220 .006 .003 7.521Total ................... 13.584 20.345 35.175 2.111 3.066 .078 .003 74.362
1977January ............... 1.266 2.458 3.507 .239 .235 .007 -.001 7.710February ............. 1.122 1.854 3.165 .211 .174 .006 .001 6.532March .................. 1.129 1.751 3.100 .223 .225 .007 -.001 6.433April .................... 1.041 1.469 2.910 .214 .212 .006 -.002 5.851May ..................... 1.103 1.408 2.903 .222 .213 .006 .001 5.857June .................... 1.162 1.361 2.987 .232 .197 .006 .001 5.946July ..................... 1.257 1.353 3.005 .235 .193 .007 .002 6.052August ................ 1.231 1.393 3.081 .245 .192 .006 .001 6.149September .......... 1.136 1.457 2.932 .211 .189 .007 .007 5.939October ............... 1.127 1.550 3.049 .205 .197 .007 .004 6.140November ........... 1.139 1.725 3.052 .210 .231 .007 .001 6.365December ........... 1.207 2.152 3.430 .256 .256 .007 .006 7.314Total ................... 13.922 19.931 37.122 2.702 2.515 .077 .020 76.288
See footnotes at end of table.
Energy Information Administration/Historical Monthly Energy Review 1973-1992 13
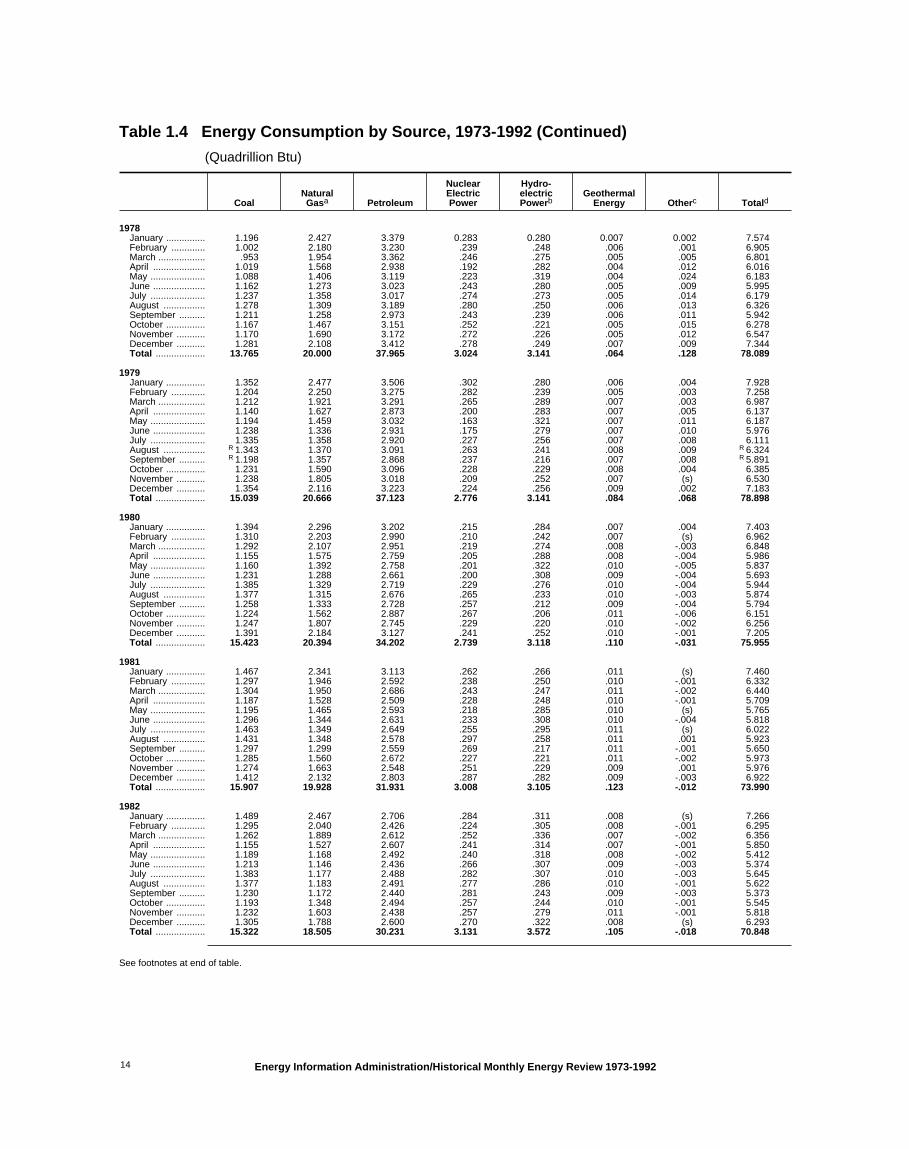
Table 1.4 Energy Consumption by Source, 1973-1992 (Continued)
(Quadrillion Btu)
CoalNaturalGasa Petroleum
NuclearElectricPower
Hydro-electricPowerb
GeothermalEnergy Otherc Totald
1978January ............... 1.196 2.427 3.379 0.283 0.280 0.007 0.002 7.574February ............. 1.002 2.180 3.230 .239 .248 .006 .001 6.905March .................. .953 1.954 3.362 .246 .275 .005 .005 6.801April .................... 1.019 1.568 2.938 .192 .282 .004 .012 6.016May ..................... 1.088 1.406 3.119 .223 .319 .004 .024 6.183June .................... 1.162 1.273 3.023 .243 .280 .005 .009 5.995July ..................... 1.237 1.358 3.017 .274 .273 .005 .014 6.179August ................ 1.278 1.309 3.189 .280 .250 .006 .013 6.326September .......... 1.211 1.258 2.973 .243 .239 .006 .011 5.942October ............... 1.167 1.467 3.151 .252 .221 .005 .015 6.278November ........... 1.170 1.690 3.172 .272 .226 .005 .012 6.547December ........... 1.281 2.108 3.412 .278 .249 .007 .009 7.344Total ................... 13.765 20.000 37.965 3.024 3.141 .064 .128 78.089
1979January ............... 1.352 2.477 3.506 .302 .280 .006 .004 7.928February ............. 1.204 2.250 3.275 .282 .239 .005 .003 7.258March .................. 1.212 1.921 3.291 .265 .289 .007 .003 6.987April .................... 1.140 1.627 2.873 .200 .283 .007 .005 6.137May ..................... 1.194 1.459 3.032 .163 .321 .007 .011 6.187June .................... 1.238 1.336 2.931 .175 .279 .007 .010 5.976July ..................... 1.335 1.358 2.920 .227 .256 .007 .008 6.111August ................ R 1.343 1.370 3.091 .263 .241 .008 .009 R 6.324September .......... R 1.198 1.357 2.868 .237 .216 .007 .008 R 5.891October ............... 1.231 1.590 3.096 .228 .229 .008 .004 6.385November ........... 1.238 1.805 3.018 .209 .252 .007 (s) 6.530December ........... 1.354 2.116 3.223 .224 .256 .009 .002 7.183Total ................... 15.039 20.666 37.123 2.776 3.141 .084 .068 78.898
1980January ............... 1.394 2.296 3.202 .215 .284 .007 .004 7.403February ............. 1.310 2.203 2.990 .210 .242 .007 (s) 6.962March .................. 1.292 2.107 2.951 .219 .274 .008 -.003 6.848April .................... 1.155 1.575 2.759 .205 .288 .008 -.004 5.986May ..................... 1.160 1.392 2.758 .201 .322 .010 -.005 5.837June .................... 1.231 1.288 2.661 .200 .308 .009 -.004 5.693July ..................... 1.385 1.329 2.719 .229 .276 .010 -.004 5.944August ................ 1.377 1.315 2.676 .265 .233 .010 -.003 5.874September .......... 1.258 1.333 2.728 .257 .212 .009 -.004 5.794October ............... 1.224 1.562 2.887 .267 .206 .011 -.006 6.151November ........... 1.247 1.807 2.745 .229 .220 .010 -.002 6.256December ........... 1.391 2.184 3.127 .241 .252 .010 -.001 7.205Total ................... 15.423 20.394 34.202 2.739 3.118 .110 -.031 75.955
1981January ............... 1.467 2.341 3.113 .262 .266 .011 (s) 7.460February ............. 1.297 1.946 2.592 .238 .250 .010 -.001 6.332March .................. 1.304 1.950 2.686 .243 .247 .011 -.002 6.440April .................... 1.187 1.528 2.509 .228 .248 .010 -.001 5.709May ..................... 1.195 1.465 2.593 .218 .285 .010 (s) 5.765June .................... 1.296 1.344 2.631 .233 .308 .010 -.004 5.818July ..................... 1.463 1.349 2.649 .255 .295 .011 (s) 6.022August ................ 1.431 1.348 2.578 .297 .258 .011 .001 5.923September .......... 1.297 1.299 2.559 .269 .217 .011 -.001 5.650October ............... 1.285 1.560 2.672 .227 .221 .011 -.002 5.973November ........... 1.274 1.663 2.548 .251 .229 .009 .001 5.976December ........... 1.412 2.132 2.803 .287 .282 .009 -.003 6.922Total ................... 15.907 19.928 31.931 3.008 3.105 .123 -.012 73.990
1982January ............... 1.489 2.467 2.706 .284 .311 .008 (s) 7.266February ............. 1.295 2.040 2.426 .224 .305 .008 -.001 6.295March .................. 1.262 1.889 2.612 .252 .336 .007 -.002 6.356April .................... 1.155 1.527 2.607 .241 .314 .007 -.001 5.850May ..................... 1.189 1.168 2.492 .240 .318 .008 -.002 5.412June .................... 1.213 1.146 2.436 .266 .307 .009 -.003 5.374July ..................... 1.383 1.177 2.488 .282 .307 .010 -.003 5.645August ................ 1.377 1.183 2.491 .277 .286 .010 -.001 5.622September .......... 1.230 1.172 2.440 .281 .243 .009 -.003 5.373October ............... 1.193 1.348 2.494 .257 .244 .010 -.001 5.545November ........... 1.232 1.603 2.438 .257 .279 .011 -.001 5.818December ........... 1.305 1.788 2.600 .270 .322 .008 (s) 6.293Total ................... 15.322 18.505 30.231 3.131 3.572 .105 -.018 70.848
See footnotes at end of table.
Energy Information Administration/Historical Monthly Energy Review 1973-199214

Table 1.4 Energy Consumption by Source, 1973-1992 (Continued)
(Quadrillion Btu)
CoalNaturalGasa Petroleum
NuclearElectricPower
Hydro-electricPowerb
GeothermalEnergy Otherc Totald
1983January ............... 1.360 R 2.263 2.467 0.273 0.339 0.010 -0.001 R 6.712February ............. 1.180 R 1.890 2.239 .242 .326 .008 -.001 R 5.884March .................. 1.196 R 1.779 2.604 .261 .350 .009 (s) R 6.199April .................... 1.140 R 1.546 2.383 .244 .347 .009 -.002 R 5.665May ..................... 1.172 R 1.301 2.431 .240 .355 .007 -.001 R 5.505June .................... 1.257 R 1.137 2.480 .263 .354 .009 -.001 R 5.499July ..................... 1.499 R 1.114 2.517 .279 .331 .011 -.001 R 5.750August ................ 1.574 R 1.116 2.594 .286 .309 .015 (s) R 5.893September .......... 1.366 R 1.049 2.515 .273 .268 .014 -.001 R 5.484October ............... 1.304 R 1.141 2.507 .281 .257 .014 (s) R 5.506November ........... 1.325 R 1.346 2.514 .273 .294 .013 -.001 R 5.764December ........... 1.522 R 1.674 2.803 .287 .369 .010 -.002 R 6.663Total ................... 15.894 17.357 30.054 3.203 3.899 .129 -.012 70.524
1984January ............... 1.552 2.413 2.810 .318 R .346 .010 .001 R 7.450February ............. 1.359 2.015 2.415 .308 R .322 .013 .003 R 6.436March .................. 1.403 1.897 2.684 .296 R .350 .014 (s) R 6.645April .................... 1.272 1.648 2.520 .263 R .346 .014 (s) R 6.063May ..................... 1.298 R 1.388 2.612 .280 R .368 .013 (s) R 5.960June .................... 1.439 1.212 2.542 .274 R .335 .013 -.002 R 5.814July ..................... 1.519 1.188 2.592 .307 R .328 .012 (s) R 5.946August ................ 1.587 1.190 2.695 .320 R .311 .015 -.001 R 6.117September .......... 1.384 1.119 2.468 .316 R .258 .014 (s) R 5.558October ............... 1.395 1.217 2.612 .269 R .261 .015 -.002 R 5.766November ........... 1.394 1.436 2.529 .266 R .268 .015 -.001 R 5.907December ........... 1.470 R 1.785 2.571 .335 R .305 .017 .001 R 6.484Total ................... R 17.071 18.507 31.051 3.553 R 3.800 .165 -.002 R 74.144
1985January ............... 1.599 R 2.169 2.690 .391 R .321 .016 .002 R 7.189February ............. 1.405 R 2.216 2.432 .333 R .298 .015 .003 R 6.701March .................. 1.386 R 1.775 2.567 .336 R .298 .017 .002 R 6.381April .................... 1.319 R 1.492 2.500 .286 R .288 .015 .001 R 5.902May ..................... 1.384 R 1.184 2.589 .310 R .314 .015 -.002 R 5.795June .................... 1.431 R 1.111 2.502 .333 R .290 .015 -.001 R 5.681July ..................... 1.585 R 1.155 2.577 .380 R .270 .016 (s) R 5.983August ................ 1.562 R 1.154 2.682 .376 R .258 .017 (s) R 6.050September .......... 1.425 R 1.074 2.440 .373 R .237 .016 -.001 R 5.564October ............... 1.389 R 1.184 2.663 .337 R .247 .016 (s) R 5.836November ........... 1.386 R 1.355 2.505 .326 R .276 .019 -.001 R 5.866December ........... 1.607 R 1.965 2.774 .365 R .302 .021 (s) R 7.034Total ................... 17.478 17.834 30.922 4.149 R 3.398 .198 .001 R 73.981
1986January ............... 1.628 R 2.217 2.702 .391 R .264 .021 .001 R 7.225February ............. R 1.413 R 1.942 2.455 .353 R .273 .018 .001 R 6.456March .................. 1.385 R 1.783 2.734 .332 R .325 .019 (s) R 6.579April .................... 1.265 R 1.388 2.592 .329 R .315 .017 (s) R 5.907May ..................... 1.321 R 1.200 2.686 .345 R .317 .017 -.002 R 5.885June .................... 1.464 R 1.067 2.609 .338 R .306 .019 .001 R 5.803July ..................... 1.648 R 1.062 2.739 .388 R .286 .020 -.001 R 6.141August ................ 1.515 R 1.025 2.791 .405 R .263 .020 -.004 R 6.015September .......... 1.401 R .968 2.586 .395 R .258 .017 .001 R 5.626October ............... 1.356 R 1.047 2.789 .391 R .257 .016 (s) R 5.856November ........... 1.367 R 1.282 2.637 .377 R .274 .014 -.002 R 5.948December ........... 1.498 R 1.727 2.877 .426 R .308 .019 .001 R 6.855Total ................... R 17.261 16.708 32.196 4.471 R 3.446 .219 -.004 R 74.297
1987January ............... 1.563 R 2.191 2.794 .431 R .308 .019 (s) R 7.307February ............. 1.358 R 1.978 2.558 .394 R .269 .018 .002 R 6.576March .................. 1.372 R 1.802 2.707 .402 R .291 .019 (s) R 6.593April .................... 1.323 R 1.481 2.678 .361 R .280 .018 .002 R 6.143May ..................... 1.419 R 1.220 2.684 .370 R .293 .019 .002 R 6.006June .................... 1.554 R 1.132 2.728 .394 R .263 .020 .003 6.094July ..................... 1.732 R 1.126 2.866 .432 R .262 .020 .002 R 6.440August ................ 1.720 R 1.159 2.738 .446 R .241 .020 .002 R 6.326September .......... 1.484 R 1.076 2.702 .427 R .226 .019 .005 R 5.939October ............... 1.448 R 1.258 2.838 .393 R .223 .019 .003 R 6.182November ........... 1.434 R 1.460 2.649 .403 R .208 .018 .004 R 6.176December ........... 1.602 R 1.862 2.922 .453 R .254 .019 (s) R 7.112Total ................... 18.008 17.744 32.865 4.906 R 3.117 .229 .024 R 76.894
See footnotes at end of table.
Energy Information Administration/Historical Monthly Energy Review 1973-1992 15
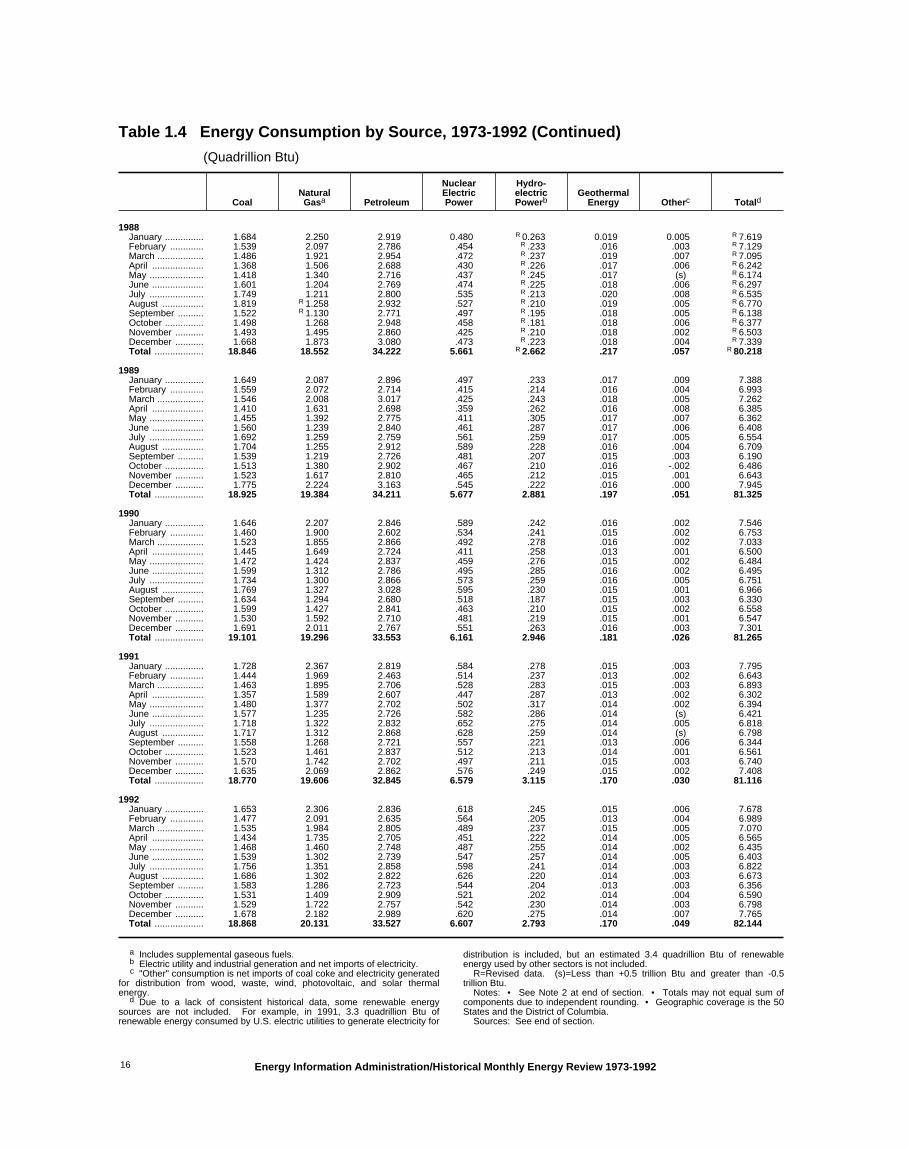
Table 1.4 Energy Consumption by Source, 1973-1992 (Continued)
(Quadrillion Btu)
CoalNaturalGasa Petroleum
NuclearElectricPower
Hydro-electricPowerb
GeothermalEnergy Otherc Totald
1988January ............... 1.684 2.250 2.919 0.480 R 0.263 0.019 0.005 R 7.619February ............. 1.539 2.097 2.786 .454 R .233 .016 .003 R 7.129March .................. 1.486 1.921 2.954 .472 R .237 .019 .007 R 7.095April .................... 1.368 1.506 2.688 .430 R .226 .017 .006 R 6.242May ..................... 1.418 1.340 2.716 .437 R .245 .017 (s) R 6.174June .................... 1.601 1.204 2.769 .474 R .225 .018 .006 R 6.297July ..................... 1.749 1.211 2.800 .535 R .213 .020 .008 R 6.535August ................ 1.819 R 1.258 2.932 .527 R .210 .019 .005 R 6.770September .......... 1.522 R 1.130 2.771 .497 R .195 .018 .005 R 6.138October ............... 1.498 1.268 2.948 .458 R .181 .018 .006 R 6.377November ........... 1.493 1.495 2.860 .425 R .210 .018 .002 R 6.503December ........... 1.668 1.873 3.080 .473 R .223 .018 .004 R 7.339Total ................... 18.846 18.552 34.222 5.661 R 2.662 .217 .057 R 80.218
1989January ............... 1.649 2.087 2.896 .497 .233 .017 .009 7.388February ............. 1.559 2.072 2.714 .415 .214 .016 .004 6.993March .................. 1.546 2.008 3.017 .425 .243 .018 .005 7.262April .................... 1.410 1.631 2.698 .359 .262 .016 .008 6.385May ..................... 1.455 1.392 2.775 .411 .305 .017 .007 6.362June .................... 1.560 1.239 2.840 .461 .287 .017 .006 6.408July ..................... 1.692 1.259 2.759 .561 .259 .017 .005 6.554August ................ 1.704 1.255 2.912 .589 .228 .016 .004 6.709September .......... 1.539 1.219 2.726 .481 .207 .015 .003 6.190October ............... 1.513 1.380 2.902 .467 .210 .016 -.002 6.486November ........... 1.523 1.617 2.810 .465 .212 .015 .001 6.643December ........... 1.775 2.224 3.163 .545 .222 .016 .000 7.945Total ................... 18.925 19.384 34.211 5.677 2.881 .197 .051 81.325
1990January ............... 1.646 2.207 2.846 .589 .242 .016 .002 7.546February ............. 1.460 1.900 2.602 .534 .241 .015 .002 6.753March .................. 1.523 1.855 2.866 .492 .278 .016 .002 7.033April .................... 1.445 1.649 2.724 .411 .258 .013 .001 6.500May ..................... 1.472 1.424 2.837 .459 .276 .015 .002 6.484June .................... 1.599 1.312 2.786 .495 .285 .016 .002 6.495July ..................... 1.734 1.300 2.866 .573 .259 .016 .005 6.751August ................ 1.769 1.327 3.028 .595 .230 .015 .001 6.966September .......... 1.634 1.294 2.680 .518 .187 .015 .003 6.330October ............... 1.599 1.427 2.841 .463 .210 .015 .002 6.558November ........... 1.530 1.592 2.710 .481 .219 .015 .001 6.547December ........... 1.691 2.011 2.767 .551 .263 .016 .003 7.301Total ................... 19.101 19.296 33.553 6.161 2.946 .181 .026 81.265
1991January ............... 1.728 2.367 2.819 .584 .278 .015 .003 7.795February ............. 1.444 1.969 2.463 .514 .237 .013 .002 6.643March .................. 1.463 1.895 2.706 .528 .283 .015 .003 6.893April .................... 1.357 1.589 2.607 .447 .287 .013 .002 6.302May ..................... 1.480 1.377 2.702 .502 .317 .014 .002 6.394June .................... 1.577 1.235 2.726 .582 .286 .014 (s) 6.421July ..................... 1.718 1.322 2.832 .652 .275 .014 .005 6.818August ................ 1.717 1.312 2.868 .628 .259 .014 (s) 6.798September .......... 1.558 1.268 2.721 .557 .221 .013 .006 6.344October ............... 1.523 1.461 2.837 .512 .213 .014 .001 6.561November ........... 1.570 1.742 2.702 .497 .211 .015 .003 6.740December ........... 1.635 2.069 2.862 .576 .249 .015 .002 7.408Total ................... 18.770 19.606 32.845 6.579 3.115 .170 .030 81.116
1992January ............... 1.653 2.306 2.836 .618 .245 .015 .006 7.678February ............. 1.477 2.091 2.635 .564 .205 .013 .004 6.989March .................. 1.535 1.984 2.805 .489 .237 .015 .005 7.070April .................... 1.434 1.735 2.705 .451 .222 .014 .005 6.565May ..................... 1.468 1.460 2.748 .487 .255 .014 .002 6.435June .................... 1.539 1.302 2.739 .547 .257 .014 .005 6.403July ..................... 1.756 1.351 2.858 .598 .241 .014 .003 6.822August ................ 1.686 1.302 2.822 .626 .220 .014 .003 6.673September .......... 1.583 1.286 2.723 .544 .204 .013 .003 6.356October ............... 1.531 1.409 2.909 .521 .202 .014 .004 6.590November ........... 1.529 1.722 2.757 .542 .230 .014 .003 6.798December ........... 1.678 2.182 2.989 .620 .275 .014 .007 7.765Total ................... 18.868 20.131 33.527 6.607 2.793 .170 .049 82.144
a Includes supplemental gaseous fuels.b Electric utility and industrial generation and net imports of electricity.c "Other" consumption is net imports of coal coke and electricity generated
for distribution from wood, waste, wind, photovoltaic, and solar thermalenergy.
d Due to a lack of consistent historical data, some renewable energysources are not included. For example, in 1991, 3.3 quadrillion Btu ofrenewable energy consumed by U.S. electric utilities to generate electricity for
distribution is included, but an estimated 3.4 quadrillion Btu of renewableenergy used by other sectors is not included.
R=Revised data. (s)=Less than +0.5 trillion Btu and greater than -0.5trillion Btu.
Notes: • See Note 2 at end of section. • Totals may not equal sum ofcomponents due to independent rounding. • Geographic coverage is the 50States and the District of Columbia.
Sources: See end of section.
Energy Information Administration/Historical Monthly Energy Review 1973-199216
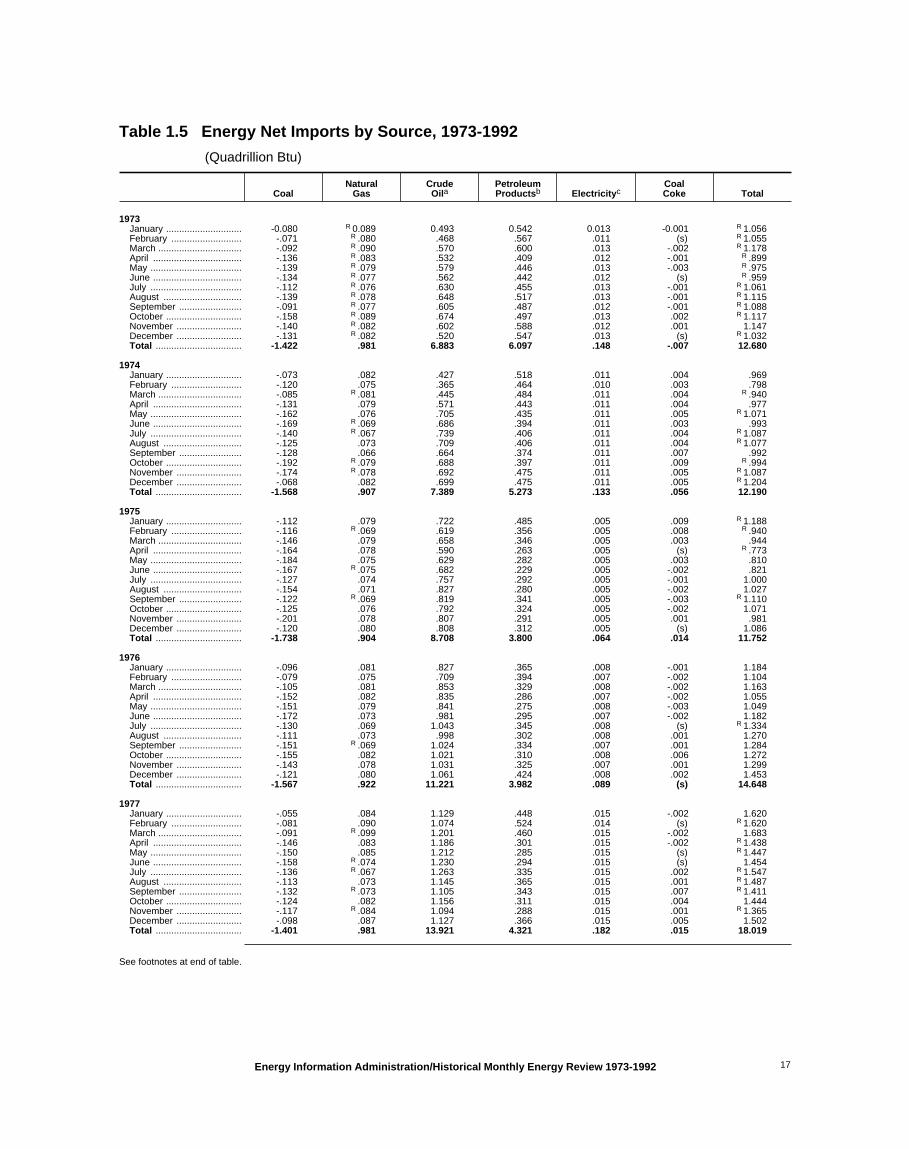
Table 1.5 Energy Net Imports by Source, 1973-1992
(Quadrillion Btu)
CoalNatural
GasCrudeOila
PetroleumProductsb Electricityc
CoalCoke Total
1973January ............................. -0.080 R 0.089 0.493 0.542 0.013 -0.001 R 1.056February ........................... -.071 R .080 .468 .567 .011 (s) R 1.055March ................................ -.092 R .090 .570 .600 .013 -.002 R 1.178April .................................. -.136 R .083 .532 .409 .012 -.001 R .899May ................................... -.139 R .079 .579 .446 .013 -.003 R .975June .................................. -.134 R .077 .562 .442 .012 (s) R .959July ................................... -.112 R .076 .630 .455 .013 -.001 R 1.061August .............................. -.139 R .078 .648 .517 .013 -.001 R 1.115September ........................ -.091 R .077 .605 .487 .012 -.001 R 1.088October ............................. -.158 R .089 .674 .497 .013 .002 R 1.117November ......................... -.140 R .082 .602 .588 .012 .001 1.147December ......................... -.131 R .082 .520 .547 .013 (s) R 1.032Total ................................. -1.422 .981 6.883 6.097 .148 -.007 12.680
1974January ............................. -.073 .082 .427 .518 .011 .004 .969February ........................... -.120 .075 .365 .464 .010 .003 .798March ................................ -.085 R .081 .445 .484 .011 .004 R .940April .................................. -.131 .079 .571 .443 .011 .004 .977May ................................... -.162 .076 .705 .435 .011 .005 R 1.071June .................................. -.169 R .069 .686 .394 .011 .003 .993July ................................... -.140 R .067 .739 .406 .011 .004 R 1.087August .............................. -.125 .073 .709 .406 .011 .004 R 1.077September ........................ -.128 .066 .664 .374 .011 .007 .992October ............................. -.192 R .079 .688 .397 .011 .009 R .994November ......................... -.174 R .078 .692 .475 .011 .005 R 1.087December ......................... -.068 .082 .699 .475 .011 .005 R 1.204Total ................................. -1.568 .907 7.389 5.273 .133 .056 12.190
1975January ............................. -.112 .079 .722 .485 .005 .009 R 1.188February ........................... -.116 R .069 .619 .356 .005 .008 R .940March ................................ -.146 .079 .658 .346 .005 .003 .944April .................................. -.164 .078 .590 .263 .005 (s) R .773May ................................... -.184 .075 .629 .282 .005 .003 .810June .................................. -.167 R .075 .682 .229 .005 -.002 .821July ................................... -.127 .074 .757 .292 .005 -.001 1.000August .............................. -.154 .071 .827 .280 .005 -.002 1.027September ........................ -.122 R .069 .819 .341 .005 -.003 R 1.110October ............................. -.125 .076 .792 .324 .005 -.002 1.071November ......................... -.201 .078 .807 .291 .005 .001 .981December ......................... -.120 .080 .808 .312 .005 (s) 1.086Total ................................. -1.738 .904 8.708 3.800 .064 .014 11.752
1976January ............................. -.096 .081 .827 .365 .008 -.001 1.184February ........................... -.079 .075 .709 .394 .007 -.002 1.104March ................................ -.105 .081 .853 .329 .008 -.002 1.163April .................................. -.152 .082 .835 .286 .007 -.002 1.055May ................................... -.151 .079 .841 .275 .008 -.003 1.049June .................................. -.172 .073 .981 .295 .007 -.002 1.182July ................................... -.130 .069 1.043 .345 .008 (s) R 1.334August .............................. -.111 .073 .998 .302 .008 .001 1.270September ........................ -.151 R .069 1.024 .334 .007 .001 1.284October ............................. -.155 .082 1.021 .310 .008 .006 1.272November ......................... -.143 .078 1.031 .325 .007 .001 1.299December ......................... -.121 .080 1.061 .424 .008 .002 1.453Total ................................. -1.567 .922 11.221 3.982 .089 (s) 14.648
1977January ............................. -.055 .084 1.129 .448 .015 -.002 1.620February ........................... -.081 .090 1.074 .524 .014 (s) R 1.620March ................................ -.091 R .099 1.201 .460 .015 -.002 1.683April .................................. -.146 .083 1.186 .301 .015 -.002 R 1.438May ................................... -.150 .085 1.212 .285 .015 (s) R 1.447June .................................. -.158 R .074 1.230 .294 .015 (s) 1.454July ................................... -.136 R .067 1.263 .335 .015 .002 R 1.547August .............................. -.113 .073 1.145 .365 .015 .001 R 1.487September ........................ -.132 R .073 1.105 .343 .015 .007 R 1.411October ............................. -.124 .082 1.156 .311 .015 .004 1.444November ......................... -.117 R .084 1.094 .288 .015 .001 R 1.365December ......................... -.098 .087 1.127 .366 .015 .005 1.502Total ................................. -1.401 .981 13.921 4.321 .182 .015 18.019
See footnotes at end of table.
Energy Information Administration/Historical Monthly Energy Review 1973-1992 17

Table 1.5 Energy Net Imports by Source, 1973-1992 (Continued)
(Quadrillion Btu)
CoalNatural
GasCrudeOila
PetroleumProductsb Electricityc
CoalCoke Total
1978January ............................. -0.020 R 0.083 1.105 0.358 0.017 0.001 1.544February ........................... -.012 R .075 .935 .360 .016 .001 R 1.375March ................................ -.004 R .083 1.098 .394 .017 .005 1.593April .................................. -.059 .077 .963 .335 .017 .012 R 1.346May ................................... -.110 .071 1.008 .299 .017 .024 1.309June .................................. -.137 .066 1.092 .257 .017 .009 1.304July ................................... -.087 .069 1.114 .325 .017 .014 1.452August .............................. -.091 .071 1.125 .302 .017 .013 1.437September ........................ -.087 .069 1.184 .315 .017 .011 R 1.510October ............................. -.125 .079 1.137 .282 .017 .014 1.406November ......................... -.157 R .090 1.151 .328 .017 .012 1.441December ......................... -.116 R .107 1.213 .378 .017 .009 1.607Total ................................. -1.004 .941 13.125 3.932 .204 .125 17.323
1979January ............................. -.091 R .099 1.215 .361 .018 .004 1.607February ........................... -.066 R .095 1.014 .304 .016 .003 1.367March ................................ -.120 .112 1.082 .386 .018 .002 1.479April .................................. -.136 .105 1.037 .252 .017 .005 1.281May ................................... -.162 .103 1.097 .283 .018 .011 R 1.350June .................................. -.154 .100 1.118 .252 .017 .009 1.342July ................................... -.165 R .101 1.145 .308 .018 .008 1.416August .............................. -.158 R .096 1.182 .281 .018 .009 R 1.427September ........................ -.132 .097 1.090 .236 .017 .008 1.316October ............................. -.194 .108 1.209 .279 .018 .003 R 1.424November ......................... -.161 .115 1.040 .290 .017 (s) 1.302December ......................... -.163 R .111 1.099 .370 .018 .002 R 1.436Total ................................. -1.702 1.243 13.328 3.603 .211 .063 16.746
1980January ............................. -.115 R .114 1.096 .349 .018 .003 1.467February ........................... -.102 R .106 .958 .284 .017 -.001 1.262March ................................ -.146 .106 .967 .269 .018 -.003 1.211April .................................. -.198 .076 .943 .218 .018 -.005 1.051May ................................... -.222 .069 .861 .214 .018 -.005 .936June .................................. -.232 .059 .892 .193 .018 -.004 .926July ................................... -.217 .059 .830 .199 .018 -.004 .886August .............................. -.240 R .059 .851 .204 .018 -.003 .889September ........................ -.221 .056 .765 .223 .018 -.004 .837October ............................. -.246 R .071 .803 .235 .018 -.006 .876November ......................... -.237 .087 .766 .252 .018 -.002 R .883December ......................... -.215 .095 .854 .272 .018 -.001 1.023Total ................................. -2.391 .957 10.586 2.912 .217 -.035 12.247
1981January ............................. -.151 .087 .829 .293 .030 (s) 1.087February ........................... -.175 .081 .762 .240 .027 -.001 .934March ................................ -.252 .076 .778 .196 .030 -.003 R .824April .................................. -.215 R .066 .723 .161 .029 -.001 R .762May ................................... -.157 R .060 .717 .210 .030 (s) .859June .................................. -.158 .061 .687 .181 .029 -.004 .796July ................................... -.281 .062 .728 .210 .030 (s) .749August .............................. -.292 .060 .717 .199 .030 (s) R .714September ........................ -.310 .062 .794 .219 .029 -.002 .792October ............................. -.321 .075 .749 .184 .030 -.003 .715November ......................... -.308 .078 .658 .214 .029 (s) .670December ......................... -.299 .089 .712 .215 .030 -.003 .743Total ................................. -2.918 .857 8.854 2.522 .347 -.016 9.646
1982January ............................. -.160 .097 .624 .181 .027 (s) .768February ........................... -.234 R .082 .438 .207 .023 -.001 R .515March ................................ -.273 .078 .461 .181 .020 -.002 .466April .................................. -.284 .071 .468 .153 .019 -.001 .427May ................................... -.262 .063 .551 .166 .022 -.002 .537June .................................. -.280 .056 .654 .147 .011 -.004 .585July ................................... -.239 .063 .726 .196 .019 -.003 .762August .............................. -.190 .056 .641 .144 .033 -.001 .683September ........................ -.226 .062 .603 .196 .033 -.003 .666October ............................. -.260 .073 .614 .168 .035 -.001 .629November ......................... -.203 .088 .629 .228 .033 -.001 .774December ......................... -.157 .107 .507 .161 .030 -.001 R .648Total ................................. -2.768 .898 6.917 2.128 .306 -.022 7.460
See footnotes at end of table.
Energy Information Administration/Historical Monthly Energy Review 1973-199218

Table 1.5 Energy Net Imports by Source, 1973-1992 (Continued)
(Quadrillion Btu)
CoalNatural
GasCrudeOila
PetroleumProductsb Electricityc
CoalCoke Total
1983January ............................. -0.116 0.110 0.514 0.105 0.029 -0.001 0.641February ........................... -.113 .092 .327 .134 .029 -.001 .468March ................................ -.162 .083 .382 .134 .029 -.001 R .465April .................................. -.157 .071 .530 .148 .028 -.002 .617May ................................... -.180 R .058 .556 .202 .023 -.002 R .658June .................................. -.188 .057 .600 .188 .028 -.001 R .684July ................................... -.159 R .055 .673 .252 .032 -.002 .851August .............................. -.217 .051 .732 .252 .035 -.001 R .851September ........................ -.195 R .064 .705 .239 .038 -.001 .849October ............................. -.209 .061 .597 .241 .037 -.001 .726November ......................... -.153 R .078 .551 .233 .032 -.001 R .741December ......................... -.162 .105 .563 .222 .033 -.003 .758Total ................................. -2.013 .885 6.731 2.351 .372 -.016 8.310
1984January ............................. -.132 R .093 .524 .336 .032 .001 R .855February ........................... -.109 R .065 .467 .379 R .029 .002 .832March ................................ -.152 .063 .584 .209 .029 -.001 .732April .................................. -.199 R .067 .567 .244 .030 (s) R .709May ................................... -.215 R .062 .672 .255 R .033 -.001 R .806June .................................. -.205 R .057 .581 .213 .031 -.002 R .674July ................................... -.215 R .051 .639 .228 R .038 -.001 R .741August .............................. -.214 R .050 .552 .214 .046 -.002 R .647September ........................ -.228 R .053 .556 .233 R .038 (s) R .651October ............................. -.173 .062 .652 .269 .041 -.003 .848November ......................... -.109 R .080 .591 .223 .033 -.003 R .816December ......................... -.169 R .090 .533 .167 R .033 -.001 R .653Total ................................. -2.119 .792 6.918 2.970 R .414 -.011 R 8.963
1985January ............................. -.150 .099 .465 .177 .030 (s) R .622February ........................... -.156 R .095 .308 .178 .025 .001 R .451March ................................ -.174 .084 .470 .235 .038 (s) .653April .................................. -.181 .071 .554 .228 .030 .001 R .703May ................................... -.239 R .072 .629 .271 .034 -.003 R .765June .................................. -.205 R .061 .519 .210 .037 -.002 R .619July ................................... -.188 .053 .551 .208 .044 -.002 R .667August .............................. -.268 .056 .520 .185 .047 -.001 .539September ........................ -.208 R .059 .519 .196 .038 -.003 R .601October ............................. -.227 .071 .563 .223 .035 -.001 R .665November ......................... -.211 R .073 .650 .223 R .034 -.003 R .765December ......................... -.183 R .102 .633 .237 .034 -.001 R .822Total ................................. -2.389 .896 6.381 2.570 R .428 -.013 R 7.872
1986January ............................. -.152 .094 .607 .240 R .038 (s) R .826February ........................... -.130 .071 .464 .152 .028 (s) R .585March ................................ -.159 R .049 .509 .206 .025 -.001 .630April .................................. -.213 .037 .636 .164 R .025 (s) .648May ................................... -.220 .049 .760 .262 R .030 -.003 R .877June .................................. -.188 .038 .779 .303 .028 (s) R .961July ................................... -.200 R .043 .853 .274 .031 -.002 R .999August .............................. -.199 R .044 .847 .288 R .040 -.006 R 1.015September ........................ -.211 R .050 .863 .250 .035 (s) R .987October ............................. -.187 R .063 .782 .227 R .032 -.001 .916November ......................... -.167 .064 .797 .210 R .030 -.003 R .930December ......................... -.167 R .085 .779 .279 .034 -.001 R 1.009Total ................................. -2.193 .686 8.676 2.855 R .375 -.017 R 10.382
1987January ............................. -.141 .096 .787 .229 R .041 -.001 R 1.011February ........................... -.120 R .080 .593 .218 R .045 .001 .817March ................................ -.167 .081 .664 .246 R .046 -.002 R .868April .................................. -.158 .065 .689 .189 R .047 (s) R .833May ................................... -.169 .058 .782 .192 .037 (s) R .901June .................................. -.190 .053 .831 .232 R .043 .002 R .971July ................................... -.171 R .062 .942 .302 .048 (s) R 1.183August .............................. -.199 .070 .982 .242 .046 .001 R 1.143September ........................ -.171 .068 .885 .228 R .034 .004 R 1.047October ............................. -.172 .088 .926 .232 .034 .002 1.109November ......................... -.183 R .100 .859 .244 .030 .003 1.054December ......................... -.209 .116 .809 .229 R .032 -.001 R .975Total ................................. -2.049 .937 9.748 2.784 R .483 .009 R 11.911
See footnotes at end of table.
Energy Information Administration/Historical Monthly Energy Review 1973-1992 19

Table 1.5 Energy Net Imports by Source, 1973-1992 (Continued)
(Quadrillion Btu)
CoalNatural
GasCrudeOila
PetroleumProductsb Electricityc
CoalCoke Total
1988January ............................. -0.113 R 0.133 0.816 0.316 R 0.033 0.003 R 1.188February ........................... -.114 .112 .771 .303 R .034 .002 1.107March ................................ -.182 R .106 .852 .249 .032 .006 R 1.063April .................................. -.233 R .088 .895 .256 .026 .004 R 1.037May ................................... -.202 .090 .952 .249 R .023 -.002 1.109June .................................. -.205 .085 .918 .183 .027 .005 1.012July ................................... -.213 .095 .899 .267 .035 .007 R 1.090August .............................. -.240 R .090 .903 .280 .038 .003 R 1.075September ........................ -.264 R .089 .902 .290 .025 .003 R 1.044October ............................. -.231 R .102 .985 .294 .023 .004 R 1.177November ......................... -.214 .114 .872 .346 .017 .001 1.136December ......................... -.234 R .119 .933 .276 .015 .003 R 1.112Total ................................. -2.446 1.221 10.698 3.308 R .328 .040 R 13.149
1989January ............................. -.163 .113 1.012 .340 .014 .007 1.323February ........................... -.173 .103 .843 .321 .019 .002 1.116March ................................ -.211 .102 .894 .295 .006 .003 1.090April .................................. -.234 .099 .994 .276 .010 .007 1.153May ................................... -.246 .100 1.025 .238 .012 .006 1.136June .................................. -.247 .095 1.016 .210 .016 .004 1.095July ................................... -.153 .093 1.125 .248 .022 .004 1.339August .............................. -.206 .099 1.173 .202 .018 .003 1.288September ........................ -.245 .108 1.062 .224 .009 .002 1.161October ............................. -.239 .113 1.122 .237 (s) -.004 1.229November ......................... -.249 .116 1.073 .217 -.009 -.001 1.145December ......................... -.199 .137 .956 .221 -.005 -.002 1.107Total ................................. -2.566 1.278 12.296 3.029 .113 .030 14.181
1990January ............................. -.191 .128 1.119 .415 -.003 (s) 1.468February ........................... -.157 .111 .963 .276 -.011 (s) 1.182March ................................ -.220 .106 1.101 .186 -.015 .001 1.159April .................................. -.220 .119 1.015 .231 -.007 -.001 1.136May ................................... -.254 .118 1.167 .310 -.006 (s) 1.335June .................................. -.235 .112 1.128 .266 -.005 .001 1.267July ................................... -.236 .116 1.245 .272 .011 .003 1.412August .............................. -.261 .115 1.175 .239 .010 -.001 1.278September ........................ -.263 .114 .996 .150 .009 .001 1.007October ............................. -.222 .137 .925 .123 .015 .001 .979November ......................... -.246 .135 .881 .157 .010 -.001 .936December ......................... -.198 .151 .819 .133 .013 .001 .918Total ................................. -2.705 1.464 12.536 2.757 .020 .005 14.077
1991January ............................. -.156 .156 .967 .108 .009 .001 1.085February ........................... -.202 .129 .889 .008 .007 .001 .832March ................................ -.203 .143 .928 .113 .013 .002 .996April .................................. -.176 .137 .958 .219 .018 .001 1.156May ................................... -.256 .135 1.144 .199 .019 .001 1.241June .................................. -.236 .128 1.117 .176 .016 -.001 1.199July ................................... -.256 .129 1.073 .166 .021 .003 1.136August .............................. -.270 .119 1.215 .212 .031 -.002 1.306September ........................ -.267 .125 1.018 .223 .028 .004 1.130October ............................. -.237 .144 1.031 .162 .029 -.001 1.130November ......................... -.270 .156 .965 .213 .019 .001 1.084December ......................... -.240 .165 1.002 .114 .021 (s) 1.062Total ................................. -2.769 1.666 12.308 1.912 .231 .009 13.357
1992January ............................. -.218 .150 1.078 .122 .021 .004 1.157February ........................... -.198 .163 .873 .146 .018 .003 1.005March ................................ -.214 .160 .963 .160 .012 .003 1.084April .................................. -.219 .160 1.090 .173 .018 .003 1.226May ................................... -.240 .157 1.099 .168 .022 .001 1.207June .................................. -.221 .146 1.084 .152 .020 .003 1.183July ................................... -.241 .153 1.245 .137 .035 .001 1.329August .............................. -.194 .158 1.168 .197 .031 .001 1.360September ........................ -.235 .149 1.099 .195 .028 .001 1.237October ............................. -.183 .159 1.217 .173 .031 .002 1.399November ......................... -.219 .194 1.074 .142 .029 .001 1.221December ......................... -.204 .193 1.076 .129 .027 .005 1.226Total ................................. -2.587 1.941 13.065 1.895 .292 .027 14.633
a Crude oil, lease condensate, and imports of crude oil for the StrategicPetroleum Reserve.
b Petroleum products, unfinished oils, pentanes plus, and gasolineblending components.
c Assumed to be hydroelectricity and estimated at the average input heatrate for fossil-fuel steam-electric power plant generation, which has rangedfrom 10.2 thousand Btu to 10.5 thousand Btu per kilowatthour between 1973and 1992. Actual heat rates applied in converting kilowatthours to Btu are
listed by year in Table A8.R=Revised data. (s)=Less than +0.5 trillion Btu and greater than -0.5
trillion Btu. Notes: • See Notes 3 and 4 at end of section. • Net imports equal
imports minus exports. Minus sign indicates exports are greater than imports.• Totals may not equal sum of components due to independent rounding.• Geographic coverage is the 50 States and the District of Columbia.
Sources: See end of section.
Energy Information Administration/Historical Monthly Energy Review 1973-199220
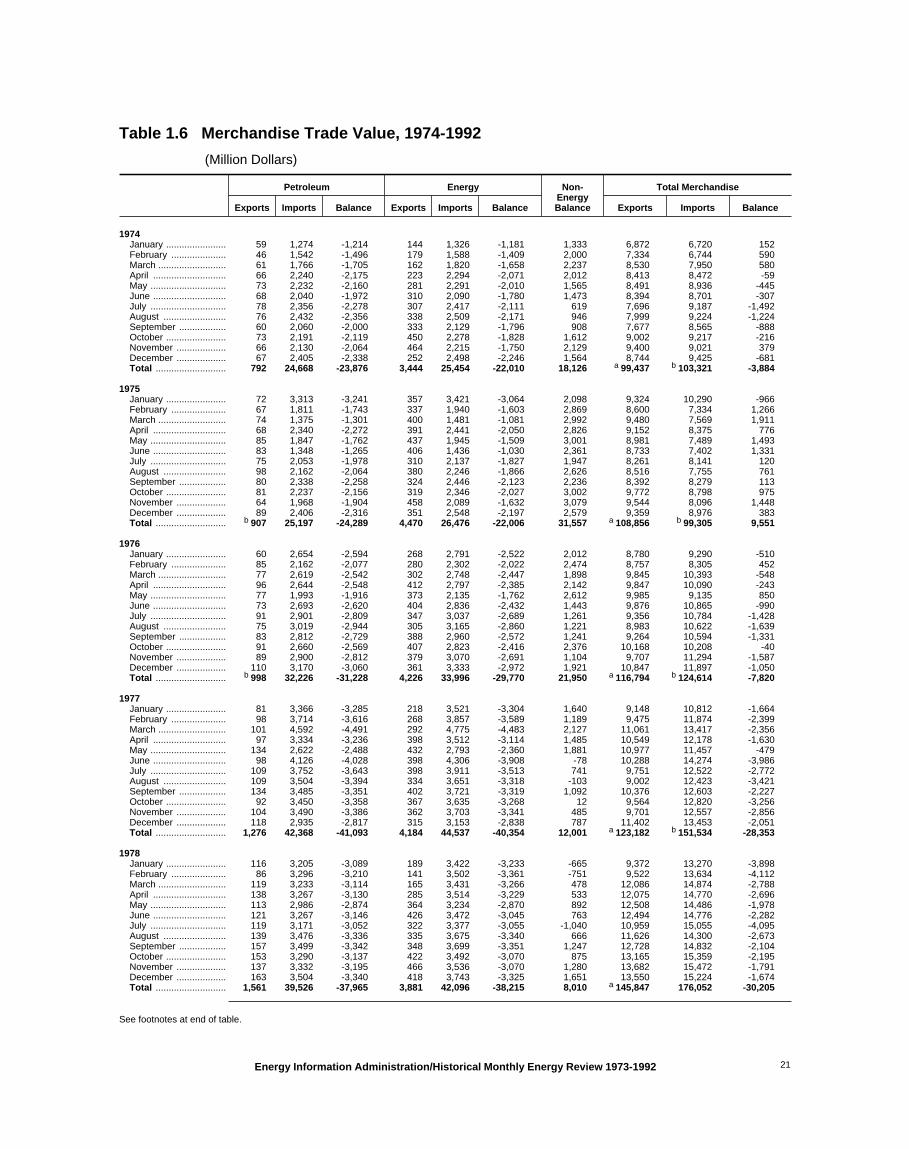
Table 1.6 Merchandise Trade Value, 1974-1992
(Million Dollars)
Petroleum Energy Non-EnergyBalance
Total Merchandise
Exports Imports Balance Exports Imports Balance Exports Imports Balance
1974January ....................... 59 1,274 -1,214 144 1,326 -1,181 1,333 6,872 6,720 152February ..................... 46 1,542 -1,496 179 1,588 -1,409 2,000 7,334 6,744 590March .......................... 61 1,766 -1,705 162 1,820 -1,658 2,237 8,530 7,950 580April ............................ 66 2,240 -2,175 223 2,294 -2,071 2,012 8,413 8,472 -59May ............................. 73 2,232 -2,160 281 2,291 -2,010 1,565 8,491 8,936 -445June ............................ 68 2,040 -1,972 310 2,090 -1,780 1,473 8,394 8,701 -307July ............................. 78 2,356 -2,278 307 2,417 -2,111 619 7,696 9,187 -1,492August ........................ 76 2,432 -2,356 338 2,509 -2,171 946 7,999 9,224 -1,224September .................. 60 2,060 -2,000 333 2,129 -1,796 908 7,677 8,565 -888October ....................... 73 2,191 -2,119 450 2,278 -1,828 1,612 9,002 9,217 -216November ................... 66 2,130 -2,064 464 2,215 -1,750 2,129 9,400 9,021 379December ................... 67 2,405 -2,338 252 2,498 -2,246 1,564 8,744 9,425 -681Total ........................... 792 24,668 -23,876 3,444 25,454 -22,010 18,126 a 99,437 b 103,321 -3,884
1975January ....................... 72 3,313 -3,241 357 3,421 -3,064 2,098 9,324 10,290 -966February ..................... 67 1,811 -1,743 337 1,940 -1,603 2,869 8,600 7,334 1,266March .......................... 74 1,375 -1,301 400 1,481 -1,081 2,992 9,480 7,569 1,911April ............................ 68 2,340 -2,272 391 2,441 -2,050 2,826 9,152 8,375 776May ............................. 85 1,847 -1,762 437 1,945 -1,509 3,001 8,981 7,489 1,493June ............................ 83 1,348 -1,265 406 1,436 -1,030 2,361 8,733 7,402 1,331July ............................. 75 2,053 -1,978 310 2,137 -1,827 1,947 8,261 8,141 120August ........................ 98 2,162 -2,064 380 2,246 -1,866 2,626 8,516 7,755 761September .................. 80 2,338 -2,258 324 2,446 -2,123 2,236 8,392 8,279 113October ....................... 81 2,237 -2,156 319 2,346 -2,027 3,002 9,772 8,798 975November ................... 64 1,968 -1,904 458 2,089 -1,632 3,079 9,544 8,096 1,448December ................... 89 2,406 -2,316 351 2,548 -2,197 2,579 9,359 8,976 383Total ........................... b 907 25,197 -24,289 4,470 26,476 -22,006 31,557 a 108,856 b 99,305 9,551
1976January ....................... 60 2,654 -2,594 268 2,791 -2,522 2,012 8,780 9,290 -510February ..................... 85 2,162 -2,077 280 2,302 -2,022 2,474 8,757 8,305 452March .......................... 77 2,619 -2,542 302 2,748 -2,447 1,898 9,845 10,393 -548April ............................ 96 2,644 -2,548 412 2,797 -2,385 2,142 9,847 10,090 -243May ............................. 77 1,993 -1,916 373 2,135 -1,762 2,612 9,985 9,135 850June ............................ 73 2,693 -2,620 404 2,836 -2,432 1,443 9,876 10,865 -990July ............................. 91 2,901 -2,809 347 3,037 -2,689 1,261 9,356 10,784 -1,428August ........................ 75 3,019 -2,944 305 3,165 -2,860 1,221 8,983 10,622 -1,639September .................. 83 2,812 -2,729 388 2,960 -2,572 1,241 9,264 10,594 -1,331October ....................... 91 2,660 -2,569 407 2,823 -2,416 2,376 10,168 10,208 -40November ................... 89 2,900 -2,812 379 3,070 -2,691 1,104 9,707 11,294 -1,587December ................... 110 3,170 -3,060 361 3,333 -2,972 1,921 10,847 11,897 -1,050Total ........................... b 998 32,226 -31,228 4,226 33,996 -29,770 21,950 a 116,794 b 124,614 -7,820
1977January ....................... 81 3,366 -3,285 218 3,521 -3,304 1,640 9,148 10,812 -1,664February ..................... 98 3,714 -3,616 268 3,857 -3,589 1,189 9,475 11,874 -2,399March .......................... 101 4,592 -4,491 292 4,775 -4,483 2,127 11,061 13,417 -2,356April ............................ 97 3,334 -3,236 398 3,512 -3,114 1,485 10,549 12,178 -1,630May ............................. 134 2,622 -2,488 432 2,793 -2,360 1,881 10,977 11,457 -479June ............................ 98 4,126 -4,028 398 4,306 -3,908 -78 10,288 14,274 -3,986July ............................. 109 3,752 -3,643 398 3,911 -3,513 741 9,751 12,522 -2,772August ........................ 109 3,504 -3,394 334 3,651 -3,318 -103 9,002 12,423 -3,421September .................. 134 3,485 -3,351 402 3,721 -3,319 1,092 10,376 12,603 -2,227October ....................... 92 3,450 -3,358 367 3,635 -3,268 12 9,564 12,820 -3,256November ................... 104 3,490 -3,386 362 3,703 -3,341 485 9,701 12,557 -2,856December ................... 118 2,935 -2,817 315 3,153 -2,838 787 11,402 13,453 -2,051Total ........................... 1,276 42,368 -41,093 4,184 44,537 -40,354 12,001 a 123,182 b 151,534 -28,353
1978January ....................... 116 3,205 -3,089 189 3,422 -3,233 -665 9,372 13,270 -3,898February ..................... 86 3,296 -3,210 141 3,502 -3,361 -751 9,522 13,634 -4,112March .......................... 119 3,233 -3,114 165 3,431 -3,266 478 12,086 14,874 -2,788April ............................ 138 3,267 -3,130 285 3,514 -3,229 533 12,075 14,770 -2,696May ............................. 113 2,986 -2,874 364 3,234 -2,870 892 12,508 14,486 -1,978June ............................ 121 3,267 -3,146 426 3,472 -3,045 763 12,494 14,776 -2,282July ............................. 119 3,171 -3,052 322 3,377 -3,055 -1,040 10,959 15,055 -4,095August ........................ 139 3,476 -3,336 335 3,675 -3,340 666 11,626 14,300 -2,673September .................. 157 3,499 -3,342 348 3,699 -3,351 1,247 12,728 14,832 -2,104October ....................... 153 3,290 -3,137 422 3,492 -3,070 875 13,165 15,359 -2,195November ................... 137 3,332 -3,195 466 3,536 -3,070 1,280 13,682 15,472 -1,791December ................... 163 3,504 -3,340 418 3,743 -3,325 1,651 13,550 15,224 -1,674Total ........................... 1,561 39,526 -37,965 3,881 42,096 -38,215 8,010 a 145,847 176,052 -30,205
See footnotes at end of table.
Energy Information Administration/Historical Monthly Energy Review 1973-1992 21

Table 1.6 Merchandise Trade Value, 1974-1992 (Continued)
(Million Dollars)
Petroleum Energy Non-EnergyBalance
Total Merchandise
Exports Imports Balance Exports Imports Balance Exports Imports Balance
1979January ....................... 138 3,989 -3,851 350 4,228 -3,878 328 12,577 16,127 -3,550February ..................... 120 3,289 -3,169 292 3,527 -3,235 2,097 12,944 14,083 -1,139March .......................... 152 3,712 -3,560 436 3,948 -3,512 3,048 15,607 16,071 -464April ............................ 169 4,046 -3,877 467 4,241 -3,774 1,653 14,277 16,397 -2,120May ............................. 139 3,833 -3,694 471 4,165 -3,694 1,657 14,843 16,879 -2,037June ............................ 157 4,273 -4,116 500 4,528 -4,028 1,602 15,379 17,805 -2,426July ............................. 188 4,817 -4,629 534 5,074 -4,540 1,864 14,749 17,425 -2,676August ........................ 149 5,199 -5,050 501 5,460 -4,960 1,704 15,054 18,309 -3,256September .................. 151 5,805 -5,654 438 6,084 -5,646 2,312 14,963 18,297 -3,334October ....................... 167 6,275 -6,108 567 6,549 -5,982 3,809 17,305 19,478 -2,173November ................... 186 5,079 -4,893 522 5,409 -4,888 3,095 17,331 19,124 -1,793December ................... 196 6,396 -6,200 543 6,783 -6,241 2,948 16,996 20,289 -3,293Total ........................... 1,914 56,715 -54,801 5,621 59,998 -54,377 30,455 a 186,363 210,285 -23,922
1980January ....................... 219 6,722 -6,502 481 7,118 -6,637 2,266 16,372 20,743 -4,371February ..................... 187 7,710 -7,523 436 8,152 -7,717 3,584 16,977 21,109 -4,133March .......................... 235 7,109 -6,875 567 7,564 -6,997 5,397 19,694 21,293 -1,599April ............................ 205 6,323 -6,119 631 6,797 -6,166 5,162 19,154 20,158 -1,004May ............................. 250 6,834 -6,584 737 7,150 -6,414 4,343 18,772 20,842 -2,071June ............................ 250 6,942 -6,692 730 7,276 -6,546 4,281 18,682 20,946 -2,265July ............................. 268 5,683 -5,415 707 5,986 -5,279 2,913 17,217 19,583 -2,366August ........................ 205 6,164 -5,959 703 6,461 -5,758 4,574 17,947 19,130 -1,184September .................. 228 5,971 -5,744 710 6,278 -5,569 3,871 17,835 19,533 -1,698October ....................... 238 6,304 -6,066 755 6,601 -5,845 5,184 19,965 20,626 -661November ................... 269 5,782 -5,513 785 6,128 -5,343 4,169 18,618 19,793 -1,174December ................... 280 7,093 -6,814 741 7,413 -6,672 4,718 19,551 21,505 -1,954Total ........................... 2,833 78,637 -75,803 7,982 82,924 -74,942 55,246 a 225,566 245,262 -19,696
1981January ....................... 278 7,521 -7,243 620 8,007 -7,387 2,792 17,964 22,559 -4,595February ..................... 324 7,459 -7,135 705 7,939 -7,234 4,969 18,845 21,110 -2,264March .......................... 297 6,063 -5,766 826 6,471 -5,645 7,226 22,929 21,348 1,581April ............................ 286 7,426 -7,141 746 7,831 -7,086 4,850 20,512 22,747 -2,236May ............................. 307 5,718 -5,411 638 6,075 -5,437 3,992 19,989 21,434 -1,446June ............................ 221 6,919 -6,699 614 7,252 -6,638 4,386 20,262 22,514 -2,252July ............................. 298 5,339 -5,041 919 5,687 -4,768 3,010 18,569 20,328 -1,759August ........................ 244 6,518 -6,274 919 6,876 -5,957 1,136 17,767 22,589 -4,821September .................. 238 6,243 -6,004 958 6,555 -5,596 3,700 18,819 20,715 -1,896October ....................... 423 6,296 -5,873 1,131 6,638 -5,507 1,894 19,897 23,510 -3,614November ................... 369 6,192 -5,823 1,098 6,608 -5,510 2,051 19,048 22,507 -3,459December ................... 414 4,966 -4,553 1,106 5,422 -4,316 3,834 19,140 19,622 -482Total ........................... 3,696 76,659 -72,963 10,279 81,360 -71,081 48,814 a 238,715 260,982 -22,267
1982January ....................... 636 6,964 -6,328 1,049 7,439 -6,391 1,300 17,515 22,606 -5,091February ..................... 472 4,618 -4,146 1,051 5,107 -4,056 3,429 17,637 18,265 -627March .......................... 578 4,568 -3,990 1,246 5,009 -3,763 3,100 20,161 20,823 -663April ............................ 527 3,922 -3,396 1,190 4,312 -3,122 3,850 18,611 17,882 729May ............................. 517 3,806 -3,289 1,144 4,167 -3,024 1,220 19,001 20,805 -1,804June ............................ 407 5,097 -4,690 1,090 5,427 -4,336 1,941 19,416 21,811 -2,395July ............................. 424 5,526 -5,103 997 5,943 -4,946 2,442 17,259 19,763 -2,504August ........................ 458 6,014 -5,556 955 6,353 -5,398 -1,205 16,265 22,868 -6,603September .................. 523 4,849 -4,326 1,073 5,201 -4,127 656 16,717 20,188 -3,471October ....................... 554 5,592 -5,038 1,206 5,947 -4,740 796 17,275 21,219 -3,945November ................... 362 4,554 -4,192 846 5,037 -4,191 884 15,695 19,002 -3,307December ................... 491 4,948 -4,457 882 5,468 -4,586 2,589 16,724 18,720 -1,996Total ........................... 5,947 60,458 -54,511 12,729 65,409 -52,680 25,170 a 216,442 243,952 -27,510
1983January ....................... 650 4,568 -3,918 1,006 5,142 -4,135 191 16,205 20,149 -3,944February ..................... 366 3,085 -2,720 681 3,704 -3,023 971 15,541 17,593 -2,052March .......................... 382 3,338 -2,957 844 3,865 -3,021 1,040 18,330 20,311 -1,981April ............................ 440 3,348 -2,908 873 3,763 -2,891 -205 16,712 19,808 -3,096May ............................. 328 4,703 -4,375 759 5,033 -4,274 -1,425 16,235 21,933 -5,698June ............................ 382 4,393 -4,011 816 4,767 -3,951 -254 17,558 21,763 -4,205July ............................. 280 4,844 -4,564 653 5,164 -4,511 -1,177 15,895 21,584 -5,689August ........................ 376 5,425 -5,049 838 5,703 -4,866 -2,553 15,640 23,059 -7,419September .................. 334 5,301 -4,968 821 5,571 -4,750 -141 16,845 21,736 -4,891October ....................... 314 5,584 -5,270 777 5,872 -5,095 -2,785 17,251 25,130 -7,879November ................... 343 4,658 -4,315 681 4,951 -4,270 -2,218 16,817 23,305 -6,488December ................... 364 3,968 -3,605 752 4,417 -3,665 -502 17,510 21,678 -4,168Total ........................... 4,557 53,217 -48,659 9,500 57,952 -48,452 -3,957 a 205,639 258,048 -52,409
See footnotes at end of table.
Energy Information Administration/Historical Monthly Energy Review 1973-199222

Table 1.6 Merchandise Trade Value, 1974-1992 (Continued)
(Million Dollars)
Petroleum Energy Non-EnergyBalance
Total Merchandise
Exports Imports Balance Exports Imports Balance Exports Imports Balance
1984January ....................... 279 4,625 -4,346 582 5,089 -4,507 -3,662 16,766 24,934 -8,168February ..................... 228 4,564 -4,336 502 5,006 -4,504 -3,436 17,039 24,979 -7,940March .......................... 423 4,916 -4,493 790 5,323 -4,533 -3,800 19,359 27,692 -8,333April ............................ 302 5,324 -5,022 759 5,629 -4,870 -3,790 17,900 26,560 -8,660May ............................. 436 4,357 -3,921 901 4,696 -3,795 -6,509 19,009 29,313 -10,304June ............................ 417 4,891 -4,473 872 5,206 -4,335 -5,557 18,734 28,626 -9,891July ............................. 281 5,167 -4,886 765 5,434 -4,669 -6,270 17,657 28,597 -10,940August ........................ 409 4,632 -4,222 878 4,886 -4,008 -6,107 18,219 28,335 -10,116September .................. 331 4,403 -4,072 820 4,663 -3,844 -5,092 17,412 26,348 -8,936October ....................... 350 4,906 -4,556 757 5,168 -4,411 -7,321 18,737 30,469 -11,732November ................... 442 4,913 -4,472 712 5,207 -4,495 -5,881 18,630 29,006 -10,376December ................... 571 4,228 -3,657 973 4,672 -3,699 -2,864 19,261 25,824 -6,563Total ........................... 4,470 56,924 -52,454 9,311 60,980 -51,669 -55,033 a 223,976 b 330,678 -106,703
1985January ....................... 438 4,094 -3,656 804 4,434 -3,630 -6,200 17,428 27,258 -9,830February ..................... 421 3,611 -3,191 786 3,989 -3,203 -3,151 17,846 24,200 -6,354March .......................... 375 3,013 -2,638 754 3,351 -2,597 -4,267 19,765 26,629 -6,864April ............................ 328 4,502 -4,174 738 4,876 -4,137 -6,108 17,984 28,230 -10,246May ............................. 333 4,463 -4,131 837 4,748 -3,911 -6,819 18,915 29,645 -10,730June ............................ 272 4,808 -4,536 708 5,088 -4,380 -4,959 18,068 27,407 -9,339July ............................. 326 3,888 -3,562 760 4,146 -3,387 -9,114 16,553 29,054 -12,501August ........................ 374 3,717 -3,343 934 3,937 -3,003 -7,435 16,401 26,840 -10,439September .................. 420 4,371 -3,950 868 4,597 -3,729 -6,644 16,790 27,163 -10,373October ....................... 427 4,461 -4,034 903 4,699 -3,796 -9,009 17,868 30,673 -12,805November ................... 519 4,584 -4,066 991 4,824 -3,833 -7,622 17,743 29,198 -11,455December ................... 474 4,962 -4,488 888 5,228 -4,340 -8,485 17,417 30,242 -12,825Total ........................... 4,707 50,475 -45,768 9,971 53,917 -43,946 -73,765 a 218,815 b 336,526 -117,712
1986January ....................... 483 5,034 -4,551 812 5,344 -4,532 -7,634 17,605 29,771 -12,166February ..................... 368 3,609 -3,241 676 3,874 -3,199 -5,829 18,053 27,080 -9,028March .......................... 295 3,113 -2,817 622 3,331 -2,709 -7,252 19,427 29,388 -9,961April ............................ 349 1,999 -1,650 791 2,176 -1,385 -10,233 19,039 30,657 -11,618May ............................. 296 2,567 -2,271 728 2,700 -1,972 -8,734 19,471 30,177 -10,706June ............................ 209 3,046 -2,838 584 3,185 -2,601 -7,612 20,497 30,709 -10,213July ............................. 243 2,794 -2,551 653 2,933 -2,281 -10,775 18,829 31,885 -13,056August ........................ 256 2,376 -2,120 661 2,511 -1,850 -10,307 17,323 29,480 -12,156September .................. 254 2,794 -2,540 657 2,933 -2,276 -10,868 17,785 30,929 -13,144October ....................... 303 2,507 -2,204 670 2,662 -1,992 -10,477 20,357 32,827 -12,470November ................... 292 2,801 -2,509 641 3,014 -2,373 -10,767 19,355 32,495 -13,141December ................... 292 2,503 -2,211 620 2,647 -2,027 -8,596 19,417 30,040 -10,623Total ........................... 3,640 35,142 -31,503 8,115 37,310 -29,195 -109,084 227,159 365,438 -138,279
1987January ....................... 322 2,390 -2,068 573 2,564 -1,991 -11,462 17,346 30,799 -13,453February ..................... 329 3,170 -2,841 564 3,440 -2,876 -8,081 18,854 29,810 -10,956March .......................... 290 3,014 -2,724 620 3,120 -2,500 -8,129 21,836 32,464 -10,629April ............................ 330 2,832 -2,502 633 2,979 -2,346 -9,267 20,678 32,291 -11,613May ............................. 310 3,287 -2,977 623 3,425 -2,802 -9,608 20,760 33,170 -12,411June ............................ 322 3,815 -3,493 654 3,895 -3,241 -10,481 21,637 35,358 -13,721July ............................. 296 4,410 -4,114 605 4,593 -3,988 -10,443 21,379 35,810 -14,431August ........................ 311 4,461 -4,150 675 4,582 -3,907 -9,840 20,079 33,826 -13,747September .................. 327 3,710 -3,383 659 3,830 -3,171 -9,313 21,184 33,668 -12,484October ....................... 323 4,082 -3,759 630 4,240 -3,610 -11,688 22,778 38,076 -15,298November ................... 327 3,774 -3,448 660 3,904 -3,244 -8,688 23,279 35,211 -11,932December ................... 436 3,341 -2,905 817 3,612 -2,795 -8,650 24,314 35,759 -11,444Total ........................... 3,922 42,285 -38,363 7,713 b 44,220 -36,506 -115,613 254,122 406,241 -152,119
1988January ....................... 348 3,309 -2,961 560 3,576 -3,016 -6,858 23,162 33,035 -9,874February ..................... 313 3,529 -3,216 548 3,795 -3,247 -7,931 24,316 35,494 -11,179March .......................... 285 3,023 -2,737 645 3,190 -2,545 -5,111 29,343 36,999 -7,656April ............................ 268 3,119 -2,851 678 3,281 -2,602 -5,631 26,728 34,961 -8,233May ............................. 370 3,625 -3,256 763 3,800 -3,037 -4,878 28,193 36,108 -7,915June ............................ 354 3,366 -3,013 728 3,525 -2,797 -8,941 26,803 38,541 -11,738July ............................. 282 3,138 -2,856 677 3,293 -2,616 -7,595 25,186 35,397 -10,211August ........................ 309 3,457 -3,148 731 3,636 -2,906 -8,101 26,539 37,545 -11,006September .................. 230 2,993 -2,763 691 3,124 -2,433 -6,804 27,067 36,304 -9,237October ....................... 241 2,933 -2,692 676 3,072 -2,396 -7,855 28,544 38,795 -10,251November ................... 257 2,958 -2,701 674 3,162 -2,488 -8,336 27,565 38,389 -10,824December ................... 437 3,339 -2,901 863 3,605 -2,742 -7,660 28,982 39,384 -10,402Total ........................... 3,693 38,787 -35,094 8,235 b 41,042 R -32,806 -85,720 322,426 440,952 -118,526
See footnotes at end of table.
Energy Information Administration/Historical Monthly Energy Review 1973-1992 23

Table 1.6 Merchandise Trade Value, 1974-1992 (Continued)
(Million Dollars)
Petroleum Energy Non-EnergyBalance
Total Merchandise
Exports Imports Balance Exports Imports Balance Exports Imports Balance
1989January ....................... 403 3,505 -3,102 678 3,816 -3,138 -5,501 27,541 36,179 -8,639February ..................... 337 3,276 -2,938 673 3,567 -2,894 -5,728 27,927 36,549 -8,622March .......................... 372 3,751 -3,379 783 4,024 -3,241 -3,712 33,243 40,197 -6,954April ............................ 384 4,170 -3,786 814 4,392 -3,578 -3,613 31,052 38,243 -7,191May ............................. 435 4,789 -4,354 905 5,057 -4,152 -5,311 31,496 40,959 -9,463June ............................ 413 4,275 -3,862 854 4,523 -3,670 -5,054 31,820 40,544 -8,724July ............................. 384 4,397 -4,013 676 4,629 -3,953 -6,629 28,708 39,290 -10,582August ........................ 487 4,665 -4,178 865 4,925 -4,060 -6,975 29,406 40,440 -11,034September .................. 407 3,846 -3,439 852 4,074 -3,222 -5,749 29,710 38,680 -8,971October ....................... 411 4,519 -4,108 853 4,757 -3,904 -7,876 31,756 43,536 -11,780November ................... 523 4,387 -3,864 990 4,616 -3,626 -7,128 30,279 41,033 -10,754December ................... 466 4,125 -3,660 885 4,430 -3,545 -3,142 30,874 37,561 -6,687Total ........................... 5,021 49,704 -44,683 b 9,869 b 52,779 -42,910 -66,490 363,812 473,211 -109,399
1990January ....................... 486 5,923 -5,437 881 6,171 -5,290 -4,349 30,664 40,304 -9,640February ..................... 436 4,704 -4,269 781 4,938 -4,157 -1,993 30,962 37,112 -6,150March .......................... 514 4,867 -4,352 976 5,205 -4,229 -2,140 35,971 42,339 -6,369April ............................ 392 3,970 -3,578 828 4,101 -3,274 -3,327 32,617 39,217 -6,600May ............................. 390 4,650 -4,259 872 4,913 -4,041 -3,339 33,539 40,918 -7,380June ............................ 388 4,062 -3,674 866 4,286 -3,420 -3,138 34,470 41,028 -6,558July ............................. 385 4,238 -3,853 837 4,482 -3,645 -7,234 30,736 41,615 -10,879August ........................ 568 5,380 -4,812 1,055 5,601 -4,546 -6,039 31,723 42,309 -10,586September .................. 682 5,797 -5,115 1,175 6,050 -4,875 -4,375 31,444 40,695 -9,251October ....................... 893 6,331 -5,438 1,332 6,659 -5,327 -6,858 35,310 47,495 -12,184November ................... 961 6,371 -5,410 1,426 6,673 -5,247 -5,377 33,267 43,891 -10,624December ................... 807 5,292 -4,485 1,204 5,581 -4,377 -1,900 32,889 39,166 -6,277Total ........................... 6,901 61,583 -54,682 12,233 64,661 -52,428 -50,068 393,592 496,088 -102,496
1991January ....................... 881 5,361 -4,480 1,188 5,698 -4,509 -2,569 33,165 40,244 -7,079February ..................... 928 3,741 -2,813 1,327 4,032 -2,705 -1,496 32,775 36,976 -4,201March .......................... 565 3,729 -3,164 951 4,003 -3,051 1,163 36,820 38,708 -1,889April ............................ 397 4,030 -3,633 748 4,286 -3,538 128 36,137 39,548 -3,411May ............................. 562 4,699 -4,137 1,031 4,957 -3,926 -231 36,024 40,181 -4,158June ............................ 506 4,177 -3,671 936 4,408 -3,473 -476 35,480 39,428 -3,948July ............................. 513 4,133 -3,620 987 4,388 -3,401 -4,493 33,444 41,338 -7,894August ........................ 495 4,641 -4,146 998 4,876 -3,879 -3,571 33,633 41,082 -7,450September .................. 415 4,475 -4,060 884 4,723 -3,839 -3,271 34,391 41,502 -7,111October ....................... 584 4,226 -3,642 1,031 4,533 -3,502 -5,232 37,897 46,631 -8,735November ................... 488 4,112 -3,623 943 4,399 -3,456 -1,486 36,970 41,911 -4,942December ................... 620 4,028 -3,408 1,058 4,326 -3,268 -2,640 34,996 40,904 -5,908Total ........................... 6,954 51,350 -44,396 12,081 54,629 -42,548 -24,175 421,730 488,453 -66,723
1992January ....................... 602 3,683 -3,082 1,007 4,016 -3,009 -2,461 34,514 39,984 -5,470February ..................... 454 3,165 -2,711 879 3,452 -2,573 396 36,898 39,075 -2,178March .......................... 419 3,477 -3,058 831 3,762 -2,931 -596 39,817 43,344 -3,527April ............................ 511 3,931 -3,420 932 4,215 -3,283 -2,489 37,154 42,925 -5,772May ............................. 535 4,274 -3,738 968 4,573 -3,605 -1,804 36,737 42,146 -5,409June ............................ 548 4,713 -4,165 958 5,007 -4,049 -2,669 39,094 45,812 -6,718July ............................. 654 4,912 -4,258 1,067 5,222 -4,155 -5,738 35,979 45,872 -9,893August ........................ 503 4,702 -4,199 867 5,034 -4,167 -6,051 34,838 45,055 -10,218September .................. 428 4,680 -4,252 839 5,026 -4,187 -5,506 36,811 46,503 -9,693October ....................... 506 5,047 -4,541 874 5,456 -4,582 -5,124 40,115 49,820 -9,706November ................... 550 4,462 -3,912 940 4,873 -3,933 -4,711 37,670 46,314 -8,644December ................... 700 4,172 -3,471 1,093 4,621 -3,529 -3,747 38,537 45,813 -7,276Total ........................... 6,412 51,217 -44,805 11,254 55,256 -44,002 -40,500 448,164 532,665 -84,501
a Annual value is not equal to the sum of the months becauseundocumented exports to Canada are not included in the individual months.
b Annual value is not equal to the sum of the months because somemonthly revisions are not available for publication.
R=Revised data. Notes: • Monthly data are not adjusted for seasonal variations. • See
Note 5 at end of section. • Totals may not equal sum of components due toindependent rounding. • The U.S. import statistics reflect both governmentand nongovernment imports of merchandise from foreign countries into theU.S. customs territory, which comprises the 50 States, the District ofColumbia, Puerto Rico, and the Virgin Islands.
Sources: See end of section.
Energy Information Administration/Historical Monthly Energy Review 1973-199224
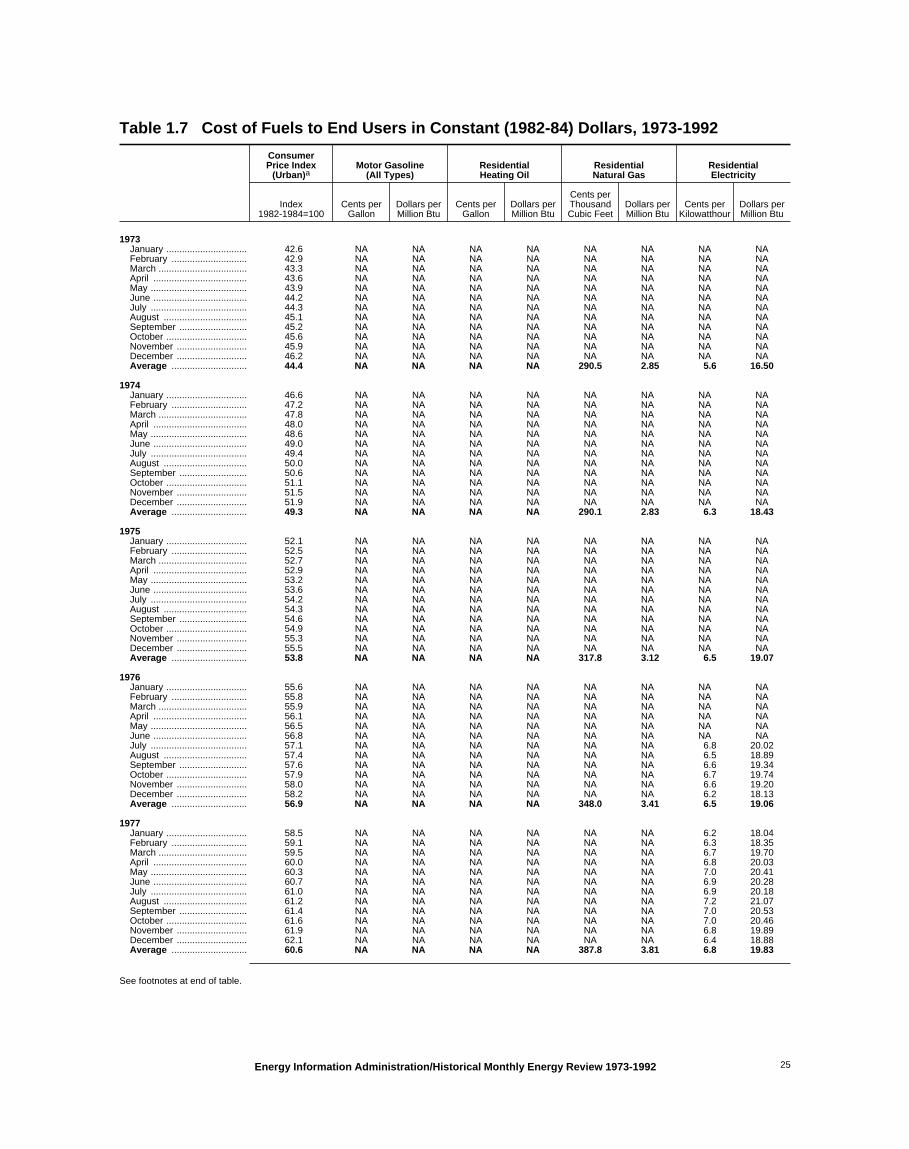
Table 1.7 Cost of Fuels to End Users in Constant (1982-84) Dollars, 1973-1992
ConsumerPrice Index
(Urban)aMotor Gasoline
(All Types)ResidentialHeating Oil
ResidentialNatural Gas
ResidentialElectricity
Index1982-1984=100
Cents perGallon
Dollars perMillion Btu
Cents perGallon
Dollars perMillion Btu
Cents perThousandCubic Feet
Dollars perMillion Btu
Cents perKilowatthour
Dollars perMillion Btu
1973January ............................... 42.6 NA NA NA NA NA NA NA NAFebruary ............................. 42.9 NA NA NA NA NA NA NA NAMarch .................................. 43.3 NA NA NA NA NA NA NA NAApril .................................... 43.6 NA NA NA NA NA NA NA NAMay ..................................... 43.9 NA NA NA NA NA NA NA NAJune .................................... 44.2 NA NA NA NA NA NA NA NAJuly ..................................... 44.3 NA NA NA NA NA NA NA NAAugust ................................ 45.1 NA NA NA NA NA NA NA NASeptember .......................... 45.2 NA NA NA NA NA NA NA NAOctober ............................... 45.6 NA NA NA NA NA NA NA NANovember ........................... 45.9 NA NA NA NA NA NA NA NADecember ........................... 46.2 NA NA NA NA NA NA NA NAAverage ............................. 44.4 NA NA NA NA 290.5 2.85 5.6 16.50
1974January ............................... 46.6 NA NA NA NA NA NA NA NAFebruary ............................. 47.2 NA NA NA NA NA NA NA NAMarch .................................. 47.8 NA NA NA NA NA NA NA NAApril .................................... 48.0 NA NA NA NA NA NA NA NAMay ..................................... 48.6 NA NA NA NA NA NA NA NAJune .................................... 49.0 NA NA NA NA NA NA NA NAJuly ..................................... 49.4 NA NA NA NA NA NA NA NAAugust ................................ 50.0 NA NA NA NA NA NA NA NASeptember .......................... 50.6 NA NA NA NA NA NA NA NAOctober ............................... 51.1 NA NA NA NA NA NA NA NANovember ........................... 51.5 NA NA NA NA NA NA NA NADecember ........................... 51.9 NA NA NA NA NA NA NA NAAverage ............................. 49.3 NA NA NA NA 290.1 2.83 6.3 18.43
1975January ............................... 52.1 NA NA NA NA NA NA NA NAFebruary ............................. 52.5 NA NA NA NA NA NA NA NAMarch .................................. 52.7 NA NA NA NA NA NA NA NAApril .................................... 52.9 NA NA NA NA NA NA NA NAMay ..................................... 53.2 NA NA NA NA NA NA NA NAJune .................................... 53.6 NA NA NA NA NA NA NA NAJuly ..................................... 54.2 NA NA NA NA NA NA NA NAAugust ................................ 54.3 NA NA NA NA NA NA NA NASeptember .......................... 54.6 NA NA NA NA NA NA NA NAOctober ............................... 54.9 NA NA NA NA NA NA NA NANovember ........................... 55.3 NA NA NA NA NA NA NA NADecember ........................... 55.5 NA NA NA NA NA NA NA NAAverage ............................. 53.8 NA NA NA NA 317.8 3.12 6.5 19.07
1976January ............................... 55.6 NA NA NA NA NA NA NA NAFebruary ............................. 55.8 NA NA NA NA NA NA NA NAMarch .................................. 55.9 NA NA NA NA NA NA NA NAApril .................................... 56.1 NA NA NA NA NA NA NA NAMay ..................................... 56.5 NA NA NA NA NA NA NA NAJune .................................... 56.8 NA NA NA NA NA NA NA NAJuly ..................................... 57.1 NA NA NA NA NA NA 6.8 20.02August ................................ 57.4 NA NA NA NA NA NA 6.5 18.89September .......................... 57.6 NA NA NA NA NA NA 6.6 19.34October ............................... 57.9 NA NA NA NA NA NA 6.7 19.74November ........................... 58.0 NA NA NA NA NA NA 6.6 19.20December ........................... 58.2 NA NA NA NA NA NA 6.2 18.13Average ............................. 56.9 NA NA NA NA 348.0 3.41 6.5 19.06
1977January ............................... 58.5 NA NA NA NA NA NA 6.2 18.04February ............................. 59.1 NA NA NA NA NA NA 6.3 18.35March .................................. 59.5 NA NA NA NA NA NA 6.7 19.70April .................................... 60.0 NA NA NA NA NA NA 6.8 20.03May ..................................... 60.3 NA NA NA NA NA NA 7.0 20.41June .................................... 60.7 NA NA NA NA NA NA 6.9 20.28July ..................................... 61.0 NA NA NA NA NA NA 6.9 20.18August ................................ 61.2 NA NA NA NA NA NA 7.2 21.07September .......................... 61.4 NA NA NA NA NA NA 7.0 20.53October ............................... 61.6 NA NA NA NA NA NA 7.0 20.46November ........................... 61.9 NA NA NA NA NA NA 6.8 19.89December ........................... 62.1 NA NA NA NA NA NA 6.4 18.88Average ............................. 60.6 NA NA NA NA 387.8 3.81 6.8 19.83
See footnotes at end of table.
Energy Information Administration/Historical Monthly Energy Review 1973-1992 25

Table 1.7 Cost of Fuels to End Users in Constant (1982-84) Dollars, 1973-1992 (Continued)
ConsumerPrice Index
(Urban)aMotor Gasoline
(All Types)ResidentialHeating Oil
ResidentialNatural Gas
ResidentialElectricity
Index1982-1984=100
Cents perGallon
Dollars perMillion Btu
Cents perGallon
Dollars perMillion Btu
Cents perThousandCubic Feet
Dollars perMillion Btu
Cents perKilowatthour
Dollars perMillion Btu
1978January ............................... 62.5 101.0 8.07 NA NA NA NA 6.2 18.29February ............................. 62.9 100.0 8.00 NA NA NA NA 6.2 18.17March .................................. 63.4 99.2 7.93 NA NA NA NA 6.5 18.95April .................................... 63.9 98.7 7.90 NA NA NA NA 6.7 19.72May ..................................... 64.5 98.8 7.90 NA NA NA NA 7.0 20.45June .................................... 65.2 98.9 7.91 NA NA NA NA 6.9 20.23July ..................................... 65.7 99.7 7.97 NA NA NA NA 6.9 20.07August ................................ 66.0 100.5 8.03 NA NA NA NA 6.8 19.98September .......................... 66.5 100.6 8.04 NA NA NA NA 6.8 19.83October ............................... 67.1 100.0 8.00 NA NA NA NA 6.7 19.66November ........................... 67.4 100.3 8.02 NA NA NA NA 6.5 19.13December ........................... 67.7 101.2 8.09 NA NA NA NA 6.2 18.18Average ............................. 65.2 100.0 8.00 75.2 5.42 392.6 3.86 6.6 19.33
1979January ............................... 68.3 101.8 8.14 NA NA NA NA 6.0 17.59February ............................. 69.1 102.3 8.18 NA NA NA NA 5.9 17.39March .................................. 69.8 105.0 8.40 NA NA NA NA 6.2 18.06April .................................... 70.6 110.5 8.83 NA NA NA NA 6.4 18.68May ..................................... 71.5 115.1 9.20 NA NA NA NA 6.6 19.27June .................................... 72.3 121.7 9.73 NA NA NA NA 6.8 19.86July ..................................... 73.1 127.2 10.17 NA NA NA NA 6.7 19.65August ................................ 73.8 131.0 10.48 NA NA NA NA 6.6 19.46September .......................... 74.6 133.8 10.70 NA NA NA NA 6.7 19.64October ............................... 75.2 133.8 10.70 NA NA NA NA 6.7 19.49November ........................... 75.9 134.3 10.73 NA NA NA NA 6.3 18.53December ........................... 76.7 135.9 10.86 NA NA NA NA 6.1 17.96Average ............................. 72.6 121.5 9.71 97.0 6.99 410.5 4.03 6.3 18.57
1980January ............................... 77.8 142.7 11.41 NA NA NA NA 6.0 17.71February ............................. 78.9 150.3 12.02 NA NA NA NA 6.0 17.46March .................................. 80.1 153.6 12.28 NA NA NA NA 6.1 17.93April .................................... 81.0 153.3 12.26 NA NA NA NA 6.3 18.45May ..................................... 81.8 152.1 12.16 NA NA NA NA 6.6 19.35June .................................... 82.7 150.7 12.05 NA NA NA NA 6.8 19.85July ..................................... 82.7 150.8 12.06 NA NA NA NA 6.9 20.20August ................................ 83.3 149.2 11.93 NA NA NA NA 6.8 20.05September .......................... 84.0 146.5 11.72 NA NA NA NA 6.8 19.89October ............................... 84.8 144.2 11.53 NA NA NA NA 6.7 19.70November ........................... 85.5 142.9 11.43 NA NA NA NA 6.6 19.20December ........................... 86.3 142.6 11.40 NA NA NA NA 6.4 18.68Average ............................. 82.4 148.2 11.85 118.2 8.52 446.6 4.36 6.6 19.21
1981January ............................... 87.0 145.9 11.66 NA NA 452.9 4.42 7.1 20.89February ............................. 87.9 153.9 12.31 NA NA 453.9 4.43 7.3 21.34March .................................. 88.5 156.8 12.54 NA NA 458.8 4.48 7.5 21.86April .................................... 89.1 155.0 12.39 NA NA 461.3 4.50 7.5 22.04May ..................................... 89.8 152.6 12.20 NA NA 477.7 4.66 7.7 22.52June .................................... 90.6 150.3 12.02 NA NA 474.6 4.63 7.8 22.97July ..................................... 91.6 147.7 11.81 NA NA 471.6 4.60 7.9 23.04August ................................ 92.3 146.0 11.68 NA NA 465.9 4.55 7.8 22.86September .......................... 93.2 145.7 11.65 NA NA 479.6 4.68 7.7 22.64October ............................... 93.4 144.9 11.58 NA NA 481.8 4.70 7.7 22.59November ........................... 93.7 144.2 11.53 NA NA 483.5 4.72 7.4 21.58December ........................... 94.0 143.4 11.47 NA NA 484.0 4.72 7.1 20.89Average ............................. 90.9 148.8 11.90 131.4 9.47 471.9 4.60 6.8 19.99
1982January ............................... 94.3 142.2 11.37 127.9 9.22 493.1 4.81 7.1 20.82February ............................. 94.6 139.3 11.14 126.0 9.09 495.8 4.83 7.1 20.76March .................................. 94.5 134.2 10.73 120.5 8.69 505.8 4.93 7.3 21.40April .................................... 94.9 127.5 10.19 117.7 8.49 512.1 4.99 7.3 21.31May ..................................... 95.8 127.8 10.22 118.0 8.50 539.7 5.26 7.5 22.03June .................................... 97.0 133.6 10.68 118.4 8.53 536.1 5.22 7.6 22.36July ..................................... 97.5 135.2 10.81 117.3 8.46 536.4 5.23 7.7 22.54August ................................ 97.7 134.1 10.72 117.1 8.44 535.3 5.22 7.7 22.50September .......................... 97.9 132.0 10.55 116.1 8.37 552.6 5.39 7.8 22.75October ............................... 98.2 130.3 10.42 120.4 8.68 576.4 5.62 7.6 22.38November ........................... 98.0 129.4 10.35 122.6 8.84 579.6 5.65 7.5 21.83December ........................... 97.6 127.5 10.19 121.1 8.73 588.1 5.73 7.2 21.02Average ............................. 96.5 132.7 10.61 120.2 8.67 535.8 5.22 7.2 20.96
See footnotes at end of table.
Energy Information Administration/Historical Monthly Energy Review 1973-199226
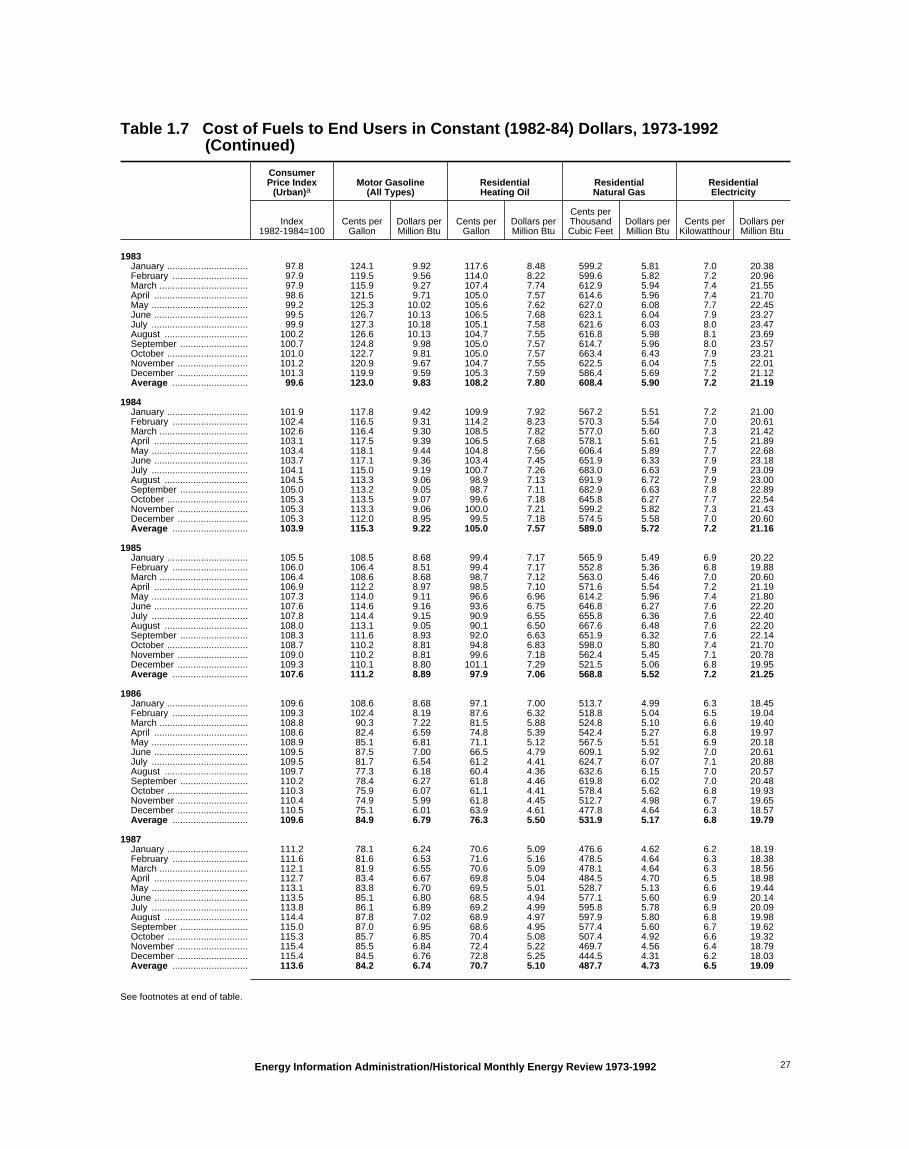
Table 1.7 Cost of Fuels to End Users in Constant (1982-84) Dollars, 1973-1992 (Continued)
ConsumerPrice Index
(Urban)aMotor Gasoline
(All Types)ResidentialHeating Oil
ResidentialNatural Gas
ResidentialElectricity
Index1982-1984=100
Cents perGallon
Dollars perMillion Btu
Cents perGallon
Dollars perMillion Btu
Cents perThousandCubic Feet
Dollars perMillion Btu
Cents perKilowatthour
Dollars perMillion Btu
1983January ............................... 97.8 124.1 9.92 117.6 8.48 599.2 5.81 7.0 20.38February ............................. 97.9 119.5 9.56 114.0 8.22 599.6 5.82 7.2 20.96March .................................. 97.9 115.9 9.27 107.4 7.74 612.9 5.94 7.4 21.55April .................................... 98.6 121.5 9.71 105.0 7.57 614.6 5.96 7.4 21.70May ..................................... 99.2 125.3 10.02 105.6 7.62 627.0 6.08 7.7 22.45June .................................... 99.5 126.7 10.13 106.5 7.68 623.1 6.04 7.9 23.27July ..................................... 99.9 127.3 10.18 105.1 7.58 621.6 6.03 8.0 23.47August ................................ 100.2 126.6 10.13 104.7 7.55 616.8 5.98 8.1 23.69September .......................... 100.7 124.8 9.98 105.0 7.57 614.7 5.96 8.0 23.57October ............................... 101.0 122.7 9.81 105.0 7.57 663.4 6.43 7.9 23.21November ........................... 101.2 120.9 9.67 104.7 7.55 622.5 6.04 7.5 22.01December ........................... 101.3 119.9 9.59 105.3 7.59 586.4 5.69 7.2 21.12Average ............................. 99.6 123.0 9.83 108.2 7.80 608.4 5.90 7.2 21.19
1984January ............................... 101.9 117.8 9.42 109.9 7.92 567.2 5.51 7.2 21.00February ............................. 102.4 116.5 9.31 114.2 8.23 570.3 5.54 7.0 20.61March .................................. 102.6 116.4 9.30 108.5 7.82 577.0 5.60 7.3 21.42April .................................... 103.1 117.5 9.39 106.5 7.68 578.1 5.61 7.5 21.89May ..................................... 103.4 118.1 9.44 104.8 7.56 606.4 5.89 7.7 22.68June .................................... 103.7 117.1 9.36 103.4 7.45 651.9 6.33 7.9 23.18July ..................................... 104.1 115.0 9.19 100.7 7.26 683.0 6.63 7.9 23.09August ................................ 104.5 113.3 9.06 98.9 7.13 691.9 6.72 7.9 23.00September .......................... 105.0 113.2 9.05 98.7 7.11 682.9 6.63 7.8 22.89October ............................... 105.3 113.5 9.07 99.6 7.18 645.8 6.27 7.7 22.54November ........................... 105.3 113.3 9.06 100.0 7.21 599.2 5.82 7.3 21.43December ........................... 105.3 112.0 8.95 99.5 7.18 574.5 5.58 7.0 20.60Average ............................. 103.9 115.3 9.22 105.0 7.57 589.0 5.72 7.2 21.16
1985January ............................... 105.5 108.5 8.68 99.4 7.17 565.9 5.49 6.9 20.22February ............................. 106.0 106.4 8.51 99.4 7.17 552.8 5.36 6.8 19.88March .................................. 106.4 108.6 8.68 98.7 7.12 563.0 5.46 7.0 20.60April .................................... 106.9 112.2 8.97 98.5 7.10 571.6 5.54 7.2 21.19May ..................................... 107.3 114.0 9.11 96.6 6.96 614.2 5.96 7.4 21.80June .................................... 107.6 114.6 9.16 93.6 6.75 646.8 6.27 7.6 22.20July ..................................... 107.8 114.4 9.15 90.9 6.55 655.8 6.36 7.6 22.40August ................................ 108.0 113.1 9.05 90.1 6.50 667.6 6.48 7.6 22.20September .......................... 108.3 111.6 8.93 92.0 6.63 651.9 6.32 7.6 22.14October ............................... 108.7 110.2 8.81 94.8 6.83 598.0 5.80 7.4 21.70November ........................... 109.0 110.2 8.81 99.6 7.18 562.4 5.45 7.1 20.78December ........................... 109.3 110.1 8.80 101.1 7.29 521.5 5.06 6.8 19.95Average ............................. 107.6 111.2 8.89 97.9 7.06 568.8 5.52 7.2 21.25
1986January ............................... 109.6 108.6 8.68 97.1 7.00 513.7 4.99 6.3 18.45February ............................. 109.3 102.4 8.19 87.6 6.32 518.8 5.04 6.5 19.04March .................................. 108.8 90.3 7.22 81.5 5.88 524.8 5.10 6.6 19.40April .................................... 108.6 82.4 6.59 74.8 5.39 542.4 5.27 6.8 19.97May ..................................... 108.9 85.1 6.81 71.1 5.12 567.5 5.51 6.9 20.18June .................................... 109.5 87.5 7.00 66.5 4.79 609.1 5.92 7.0 20.61July ..................................... 109.5 81.7 6.54 61.2 4.41 624.7 6.07 7.1 20.88August ................................ 109.7 77.3 6.18 60.4 4.36 632.6 6.15 7.0 20.57September .......................... 110.2 78.4 6.27 61.8 4.46 619.8 6.02 7.0 20.48October ............................... 110.3 75.9 6.07 61.1 4.41 578.4 5.62 6.8 19.93November ........................... 110.4 74.9 5.99 61.8 4.45 512.7 4.98 6.7 19.65December ........................... 110.5 75.1 6.01 63.9 4.61 477.8 4.64 6.3 18.57Average ............................. 109.6 84.9 6.79 76.3 5.50 531.9 5.17 6.8 19.79
1987January ............................... 111.2 78.1 6.24 70.6 5.09 476.6 4.62 6.2 18.19February ............................. 111.6 81.6 6.53 71.6 5.16 478.5 4.64 6.3 18.38March .................................. 112.1 81.9 6.55 70.6 5.09 478.1 4.64 6.3 18.56April .................................... 112.7 83.4 6.67 69.8 5.04 484.5 4.70 6.5 18.98May ..................................... 113.1 83.8 6.70 69.5 5.01 528.7 5.13 6.6 19.44June .................................... 113.5 85.1 6.80 68.5 4.94 577.1 5.60 6.9 20.14July ..................................... 113.8 86.1 6.89 69.2 4.99 595.8 5.78 6.9 20.09August ................................ 114.4 87.8 7.02 68.9 4.97 597.9 5.80 6.8 19.98September .......................... 115.0 87.0 6.95 68.6 4.95 577.4 5.60 6.7 19.62October ............................... 115.3 85.7 6.85 70.4 5.08 507.4 4.92 6.6 19.32November ........................... 115.4 85.5 6.84 72.4 5.22 469.7 4.56 6.4 18.79December ........................... 115.4 84.5 6.76 72.8 5.25 444.5 4.31 6.2 18.03Average ............................. 113.6 84.2 6.74 70.7 5.10 487.7 4.73 6.5 19.09
See footnotes at end of table.
Energy Information Administration/Historical Monthly Energy Review 1973-1992 27

Table 1.7 Cost of Fuels to End Users in Constant (1982-84) Dollars, 1973-1992 (Continued)
ConsumerPrice Index
(Urban)aMotor Gasoline
(All Types)ResidentialHeating Oil
ResidentialNatural Gas
ResidentialElectricity
Index1982-1984=100
Cents perGallon
Dollars perMillion Btu
Cents perGallon
Dollars perMillion Btu
Cents perThousandCubic Feet
Dollars perMillion Btu
Cents perKilowatthour
Dollars perMillion Btu
1988January ............................... 115.7 81.8 6.54 73.2 5.28 439.1 4.27 6.0 17.48February ............................. 116.0 80.0 6.40 72.3 5.22 438.8 4.26 6.0 17.69March .................................. 116.5 79.0 6.31 71.3 5.14 444.6 4.32 6.1 17.86April .................................... 117.1 80.8 6.46 71.0 5.12 456.9 4.44 6.2 18.27May ..................................... 117.5 82.6 6.60 69.7 5.03 499.6 4.85 6.5 18.96June .................................... 118.0 82.3 6.58 67.0 4.83 550.8 5.35 6.6 19.37July ..................................... 118.5 83.0 6.64 64.7 4.67 568.8 5.53 6.7 19.54August ................................ 119.0 84.4 6.75 61.9 4.47 581.5 5.65 6.6 19.46September .......................... 119.8 82.8 6.62 63.4 4.57 566.8 5.51 6.5 19.08October ............................... 120.2 81.2 6.49 62.8 4.53 495.0 4.81 6.4 18.77November ........................... 120.3 80.8 6.46 64.2 4.63 462.2 4.49 6.2 18.27December ........................... 120.5 79.1 6.32 67.6 4.87 447.3 4.35 6.1 17.76Average ............................. 118.3 81.4 6.51 68.7 4.96 462.4 4.49 6.3 18.58
1989January ............................... 121.1 78.0 6.23 70.1 5.05 446.7 4.33 6.0 17.43February ............................. 121.6 78.5 6.28 70.3 5.07 442.4 4.29 5.9 17.35March .................................. 122.3 79.6 6.37 71.2 5.14 445.6 4.32 5.9 17.25April .................................... 123.1 89.2 7.13 71.3 5.14 450.0 4.37 6.1 17.86May ..................................... 123.8 93.1 7.44 70.0 5.04 479.0 4.65 6.2 18.23June .................................... 124.1 92.7 7.41 67.8 4.89 530.2 5.14 6.5 18.89July ..................................... 124.4 91.0 7.28 66.0 4.76 556.3 5.40 6.5 19.08August ................................ 124.6 88.0 7.03 65.4 4.72 567.4 5.50 6.5 19.05September .......................... 125.0 85.8 6.86 65.2 4.70 544.0 5.28 6.4 18.76October ............................... 125.6 85.3 6.82 68.2 4.91 482.5 4.68 6.3 18.43November ........................... 125.9 83.1 6.64 70.1 5.06 441.6 4.28 6.0 17.46December ........................... 126.1 81.7 6.53 85.3 6.15 420.3 4.08 5.8 16.97Average ............................. 124.0 85.5 6.83 72.6 5.23 454.8 4.41 6.1 17.96
1990January ............................... 127.4 85.6 6.84 89.5 6.45 426.2 4.14 5.7 16.56February ............................. 128.0 84.8 6.78 75.4 5.44 441.4 4.29 5.9 17.17March .................................. 128.7 83.6 6.68 73.7 5.32 435.1 4.22 5.9 17.31April .................................... 128.9 85.0 6.80 72.3 5.21 437.5 4.25 6.0 17.51May ..................................... 129.2 86.2 6.89 70.2 5.06 464.4 4.51 6.2 18.15June .................................... 129.9 87.8 7.02 66.5 4.80 505.0 4.90 6.2 18.28July ..................................... 130.4 87.3 6.98 64.2 4.63 539.9 5.24 6.3 18.43August ................................ 131.6 94.7 7.57 75.1 5.41 538.0 5.22 6.3 18.48September .......................... 132.7 101.5 8.12 86.1 6.21 520.0 5.05 6.2 18.11October ............................... 133.5 107.2 8.57 94.2 6.79 459.9 4.47 6.1 17.78November ........................... 133.8 107.0 8.56 92.8 6.69 425.3 4.13 5.8 17.09December ........................... 133.8 105.4 8.43 89.5 6.45 420.0 4.08 5.7 16.65Average ............................. 130.7 93.1 7.44 81.3 5.86 443.8 4.31 6.0 17.49
1991January ............................... 134.6 96.9 7.75 87.0 6.27 411.6 3.99 5.5 16.11February ............................. 134.8 88.9 7.11 82.0 5.91 412.5 4.00 5.6 16.52March .................................. 135.0 84.3 6.74 76.0 5.48 414.8 4.02 5.8 16.93April .................................... 135.2 85.7 6.85 71.7 5.17 436.4 4.23 5.9 17.34May ..................................... 135.6 89.2 7.13 68.2 4.92 463.1 4.49 6.1 17.72June .................................... 136.0 89.3 7.14 65.7 4.73 512.5 4.97 6.1 17.89July ..................................... 136.2 87.0 6.96 63.6 4.58 530.8 5.15 6.2 18.08August ................................ 136.6 87.6 7.00 63.7 4.59 538.8 5.23 6.2 18.02September .......................... 137.2 87.4 6.99 65.4 4.71 504.4 4.89 6.1 17.94October ............................... 137.4 85.9 6.87 68.4 4.93 451.2 4.38 6.0 17.70November ........................... 137.8 86.6 6.92 71.1 5.13 399.9 3.88 5.8 17.01December ........................... 137.9 85.7 6.85 69.5 5.01 399.6 3.88 5.7 16.58Average ............................. 136.2 87.8 7.02 74.8 5.39 427.3 4.14 6.0 17.43
1992January ............................... 138.1 82.2 6.57 68.2 4.92 400.4 3.88 5.6 16.34February ............................. 138.6 80.6 6.44 68.0 4.90 399.7 3.88 5.6 16.49March .................................. 139.3 80.5 6.44 66.9 4.82 394.8 3.83 5.7 16.83April .................................... 139.5 81.9 6.55 66.3 4.78 402.9 3.91 5.7 16.81May ..................................... 139.7 85.7 6.85 66.1 4.76 440.2 4.27 6.0 17.62June .................................... 140.2 88.4 7.07 65.6 4.73 487.9 4.73 6.1 17.98July ..................................... 140.5 88.1 7.05 64.3 4.64 517.4 5.02 6.1 17.94August ................................ 140.9 86.7 6.93 62.9 4.53 528.7 5.13 6.1 17.89September .......................... 141.3 86.5 6.91 63.8 4.60 506.0 4.91 6.1 17.84October ............................... 141.8 86.0 6.87 66.1 4.76 459.8 4.46 6.0 17.57November ........................... 142.0 86.1 6.89 66.8 4.81 423.9 4.11 5.8 16.92December ........................... 141.9 84.6 6.77 66.6 4.80 404.5 3.92 5.6 16.32Average ............................. 140.3 84.8 6.78 66.6 4.80 419.8 4.07 5.8 17.13
a Consumer Price Index, All Urban Consumers, All Items, 1982-1984 =100.0.
NA=Not available. Notes: • Fuel costs are calculated by using the Urban Consumer Price
Index (CPI) developed by the Bureau of Labor Statistics. • Annual averagesmay not equal average of months due to independent rounding.• Geographic coverage is the 50 States and the District of Columbia.
Sources: See end of section.
Energy Information Administration/Historical Monthly Energy Review 1973-199228
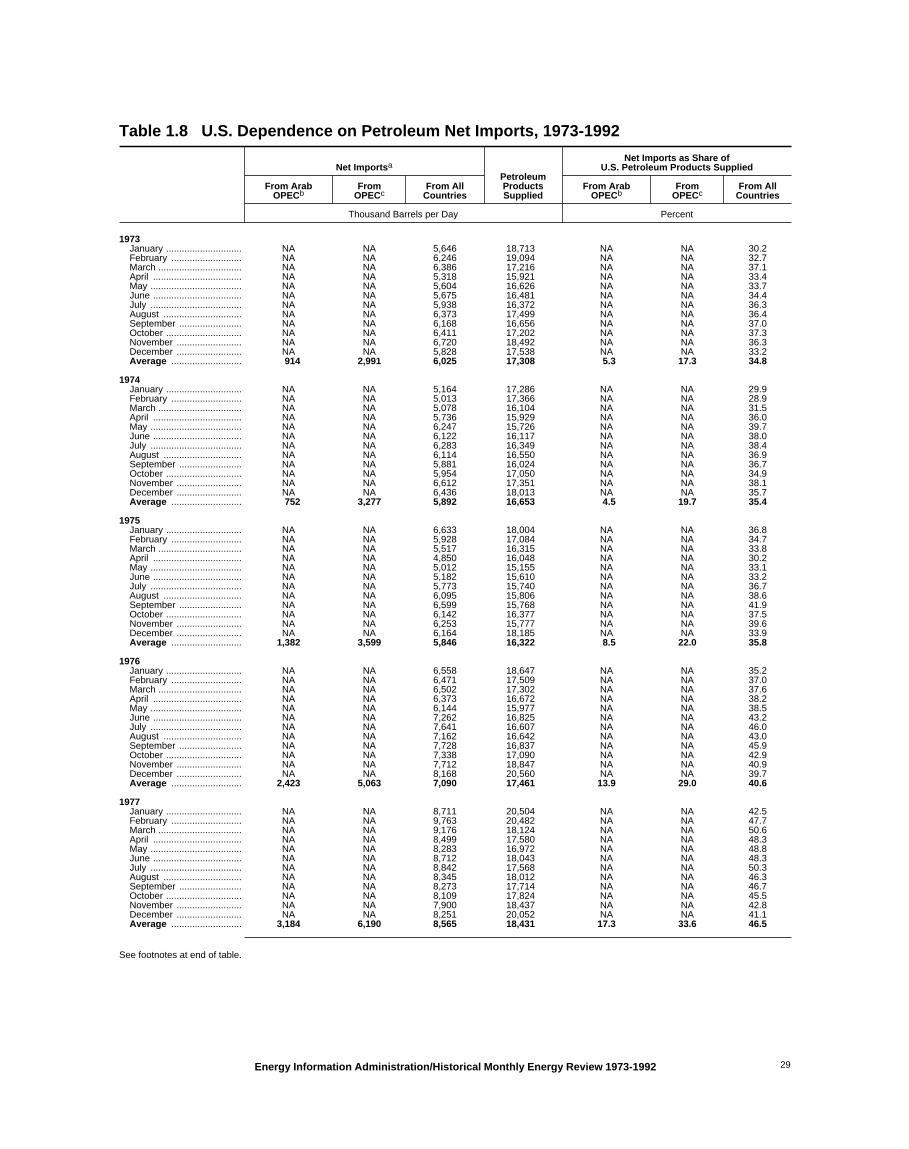
Table 1.8 U.S. Dependence on Petroleum Net Imports, 1973-1992
Net Importsa
PetroleumProductsSupplied
Net Imports as Share ofU.S. Petroleum Products Supplied
From ArabOPECb
FromOPECc
From AllCountries
From ArabOPECb
FromOPECc
From AllCountries
Thousand Barrels per Day Percent
1973January ............................. NA NA 5,646 18,713 NA NA 30.2February ........................... NA NA 6,246 19,094 NA NA 32.7March ................................ NA NA 6,386 17,216 NA NA 37.1April .................................. NA NA 5,318 15,921 NA NA 33.4May ................................... NA NA 5,604 16,626 NA NA 33.7June .................................. NA NA 5,675 16,481 NA NA 34.4July ................................... NA NA 5,938 16,372 NA NA 36.3August .............................. NA NA 6,373 17,499 NA NA 36.4September ........................ NA NA 6,168 16,656 NA NA 37.0October ............................. NA NA 6,411 17,202 NA NA 37.3November ......................... NA NA 6,720 18,492 NA NA 36.3December ......................... NA NA 5,828 17,538 NA NA 33.2Average ........................... 914 2,991 6,025 17,308 5.3 17.3 34.8
1974January ............................. NA NA 5,164 17,286 NA NA 29.9February ........................... NA NA 5,013 17,366 NA NA 28.9March ................................ NA NA 5,078 16,104 NA NA 31.5April .................................. NA NA 5,736 15,929 NA NA 36.0May ................................... NA NA 6,247 15,726 NA NA 39.7June .................................. NA NA 6,122 16,117 NA NA 38.0July ................................... NA NA 6,283 16,349 NA NA 38.4August .............................. NA NA 6,114 16,550 NA NA 36.9September ........................ NA NA 5,881 16,024 NA NA 36.7October ............................. NA NA 5,954 17,050 NA NA 34.9November ......................... NA NA 6,612 17,351 NA NA 38.1December ......................... NA NA 6,436 18,013 NA NA 35.7Average ........................... 752 3,277 5,892 16,653 4.5 19.7 35.4
1975January ............................. NA NA 6,633 18,004 NA NA 36.8February ........................... NA NA 5,928 17,084 NA NA 34.7March ................................ NA NA 5,517 16,315 NA NA 33.8April .................................. NA NA 4,850 16,048 NA NA 30.2May ................................... NA NA 5,012 15,155 NA NA 33.1June .................................. NA NA 5,182 15,610 NA NA 33.2July ................................... NA NA 5,773 15,740 NA NA 36.7August .............................. NA NA 6,095 15,806 NA NA 38.6September ........................ NA NA 6,599 15,768 NA NA 41.9October ............................. NA NA 6,142 16,377 NA NA 37.5November ......................... NA NA 6,253 15,777 NA NA 39.6December ......................... NA NA 6,164 18,185 NA NA 33.9Average ........................... 1,382 3,599 5,846 16,322 8.5 22.0 35.8
1976January ............................. NA NA 6,558 18,647 NA NA 35.2February ........................... NA NA 6,471 17,509 NA NA 37.0March ................................ NA NA 6,502 17,302 NA NA 37.6April .................................. NA NA 6,373 16,672 NA NA 38.2May ................................... NA NA 6,144 15,977 NA NA 38.5June .................................. NA NA 7,262 16,825 NA NA 43.2July ................................... NA NA 7,641 16,607 NA NA 46.0August .............................. NA NA 7,162 16,642 NA NA 43.0September ........................ NA NA 7,728 16,837 NA NA 45.9October ............................. NA NA 7,338 17,090 NA NA 42.9November ......................... NA NA 7,712 18,847 NA NA 40.9December ......................... NA NA 8,168 20,560 NA NA 39.7Average ........................... 2,423 5,063 7,090 17,461 13.9 29.0 40.6
1977January ............................. NA NA 8,711 20,504 NA NA 42.5February ........................... NA NA 9,763 20,482 NA NA 47.7March ................................ NA NA 9,176 18,124 NA NA 50.6April .................................. NA NA 8,499 17,580 NA NA 48.3May ................................... NA NA 8,283 16,972 NA NA 48.8June .................................. NA NA 8,712 18,043 NA NA 48.3July ................................... NA NA 8,842 17,568 NA NA 50.3August .............................. NA NA 8,345 18,012 NA NA 46.3September ........................ NA NA 8,273 17,714 NA NA 46.7October ............................. NA NA 8,109 17,824 NA NA 45.5November ......................... NA NA 7,900 18,437 NA NA 42.8December ......................... NA NA 8,251 20,052 NA NA 41.1Average ........................... 3,184 6,190 8,565 18,431 17.3 33.6 46.5
See footnotes at end of table.
Energy Information Administration/Historical Monthly Energy Review 1973-1992 29

Table 1.8 U.S. Dependence on Petroleum Net Imports, 1973-1992 (Continued)
Net Importsa
PetroleumProductsSupplied
Net Imports as Share ofU.S. Petroleum Products Supplied
From ArabOPECb
FromOPECc
From AllCountries
From ArabOPECb
FromOPECc
From AllCountries
Thousand Barrels per Day Percent
1978January ............................. 2,968 5,753 8,076 19,752 15.0 29.1 40.9February ........................... 2,821 5,496 7,911 20,900 13.5 26.3 37.9March ................................ 2,902 5,972 8,232 19,652 14.8 30.4 41.9April .................................. 2,829 5,146 7,406 17,747 15.9 29.0 41.7May ................................... 2,444 5,119 7,218 18,230 13.4 28.1 39.6June .................................. 3,027 5,648 7,709 18,260 16.6 30.9 42.2July ................................... 2,830 5,656 7,947 17,633 16.0 32.1 45.1August .............................. 2,924 5,617 7,881 18,639 15.7 30.1 42.3September ........................ 3,183 6,180 8,559 17,954 17.7 34.4 47.7October ............................. 3,033 5,734 7,845 18,417 16.5 31.1 42.6November ......................... 3,291 6,237 8,443 19,156 17.2 32.6 44.1December ......................... 3,291 6,394 8,786 19,944 16.5 32.1 44.1Average ........................... 2,962 5,747 8,002 18,847 15.7 30.5 42.5
1979January ............................. 3,423 6,063 8,756 20,586 16.6 29.5 42.5February ........................... 3,403 5,806 8,105 21,288 16.0 27.3 38.1March ................................ 2,947 5,750 8,150 19,322 15.3 29.8 42.2April .................................. 3,310 5,399 7,400 17,434 19.0 31.0 42.4May ................................... 3,023 5,444 7,662 17,801 17.0 30.6 43.0June .................................. 3,184 5,502 7,859 17,786 17.9 30.9 44.2July ................................... 3,080 5,675 8,072 17,144 18.0 33.1 47.1August .............................. 3,050 6,088 8,124 18,149 16.8 33.5 44.8September ........................ 2,843 5,439 7,609 17,400 16.3 31.3 43.7October ............................. 3,085 5,734 8,263 18,176 17.0 31.5 45.5November ......................... 2,614 5,308 7,631 18,313 14.3 29.0 41.7December ......................... 2,742 5,374 8,157 18,922 14.5 28.4 43.1Average ........................... 3,056 5,633 7,985 18,513 16.5 30.4 43.1
1980January ............................. 3,032 5,461 8,048 18,851 16.1 29.0 42.7February ........................... 3,056 5,027 7,386 18,817 16.2 26.7 39.3March ................................ 2,885 4,646 6,879 17,377 16.6 26.7 39.6April .................................. 2,859 4,365 6,672 16,784 17.0 26.0 39.8May ................................... 2,327 4,095 5,987 16,238 14.3 25.2 36.9June .................................. 2,594 4,393 6,240 16,187 16.0 27.1 38.6July ................................... 2,417 3,991 5,727 16,008 15.1 24.9 35.8August .............................. 2,219 3,730 5,873 15,753 14.1 23.7 37.3September ........................ 2,184 3,665 5,682 16,598 13.2 22.1 34.2October ............................. 2,223 3,812 5,781 16,995 13.1 22.4 34.0November ......................... 2,337 3,939 5,859 16,702 14.0 23.6 35.1December ......................... 2,483 4,417 6,272 18,410 13.5 24.0 34.1Average ........................... 2,549 4,293 6,365 17,056 14.9 25.2 37.3
1981January ............................. 2,215 4,121 6,270 18,430 12.0 22.4 34.0February ........................... 2,059 3,882 6,203 16,989 12.1 22.9 36.5March ................................ 1,905 3,416 5,442 15,907 12.0 21.5 34.2April .................................. 1,864 3,238 5,098 15,350 12.1 21.1 33.2May ................................... 1,792 3,193 5,180 15,353 11.7 20.8 33.7June .................................. 1,700 2,917 5,015 16,095 10.6 18.1 31.2July ................................... 1,754 3,224 5,245 15,682 11.2 20.6 33.4August .............................. 1,763 3,064 5,123 15,263 11.6 20.1 33.6September ........................ 2,062 3,258 5,845 15,655 13.2 20.8 37.3October ............................. 1,817 3,205 5,221 15,822 11.5 20.3 33.0November ......................... 1,723 3,179 5,041 15,593 11.0 20.4 32.3December ......................... 1,498 3,117 5,187 16,596 9.0 18.8 31.3Average ........................... 1,844 3,315 5,401 16,058 11.5 20.6 33.6
1982January ............................. 1,402 2,852 4,502 16,122 8.7 17.7 27.9February ........................... 1,053 2,284 4,003 16,001 6.6 14.3 25.0March ................................ 857 2,026 3,602 15,560 5.5 13.0 23.1April .................................. 736 1,865 3,593 16,046 4.6 11.6 22.4May ................................... 895 1,826 4,008 14,847 6.0 12.3 27.0June .................................. 817 2,087 4,624 14,998 5.4 13.9 30.8July ................................... 963 2,683 5,149 14,821 6.5 18.1 34.7August .............................. 817 2,090 4,386 14,839 5.5 14.1 29.6September ........................ 674 1,933 4,624 15,022 4.5 12.9 30.8October ............................. 809 2,076 4,374 14,859 5.4 14.0 29.4November ......................... 794 2,227 4,958 15,009 5.3 14.8 33.0December ......................... 415 1,676 3,746 15,487 2.7 10.8 24.2Average ........................... 852 2,136 4,298 15,296 5.6 14.0 28.1
See footnotes at end of table.
Energy Information Administration/Historical Monthly Energy Review 1973-199230
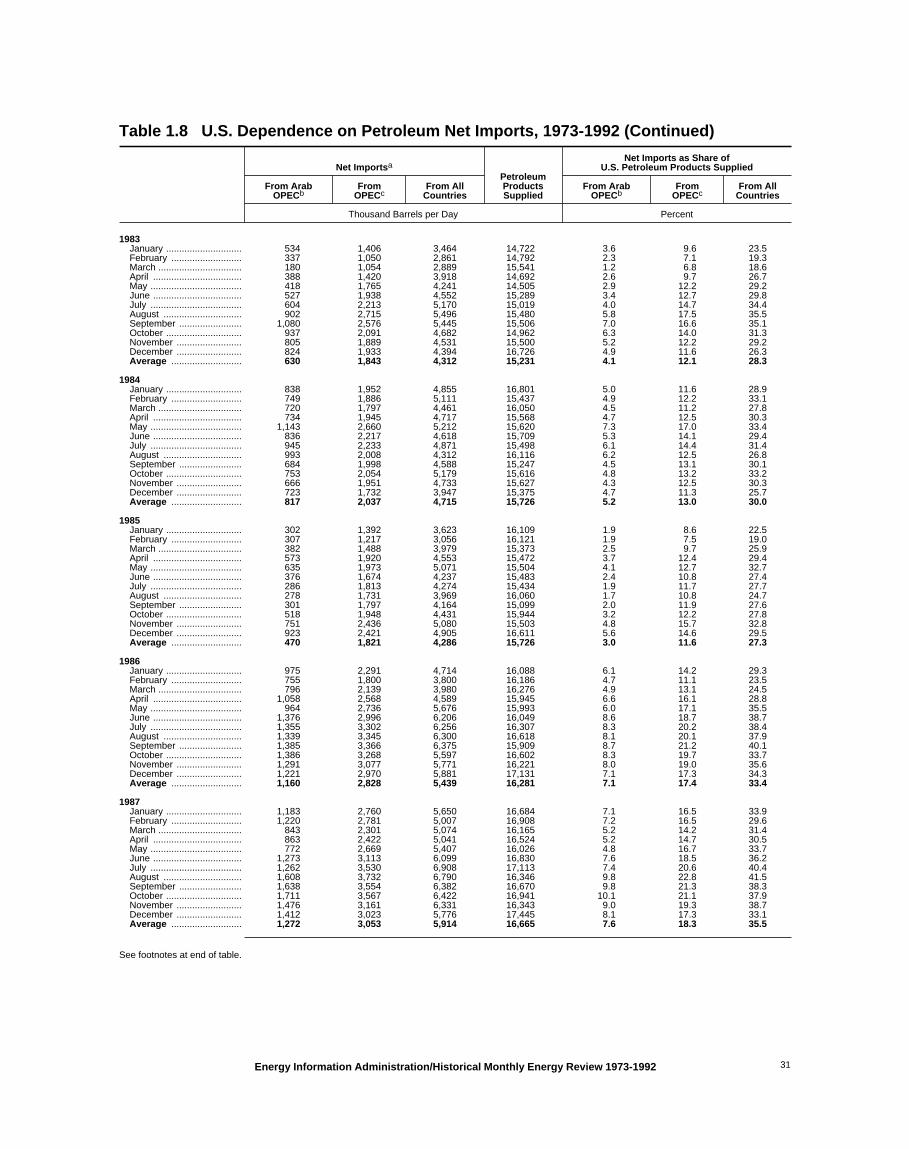
Table 1.8 U.S. Dependence on Petroleum Net Imports, 1973-1992 (Continued)
Net Importsa
PetroleumProductsSupplied
Net Imports as Share ofU.S. Petroleum Products Supplied
From ArabOPECb
FromOPECc
From AllCountries
From ArabOPECb
FromOPECc
From AllCountries
Thousand Barrels per Day Percent
1983January ............................. 534 1,406 3,464 14,722 3.6 9.6 23.5February ........................... 337 1,050 2,861 14,792 2.3 7.1 19.3March ................................ 180 1,054 2,889 15,541 1.2 6.8 18.6April .................................. 388 1,420 3,918 14,692 2.6 9.7 26.7May ................................... 418 1,765 4,241 14,505 2.9 12.2 29.2June .................................. 527 1,938 4,552 15,289 3.4 12.7 29.8July ................................... 604 2,213 5,170 15,019 4.0 14.7 34.4August .............................. 902 2,715 5,496 15,480 5.8 17.5 35.5September ........................ 1,080 2,576 5,445 15,506 7.0 16.6 35.1October ............................. 937 2,091 4,682 14,962 6.3 14.0 31.3November ......................... 805 1,889 4,531 15,500 5.2 12.2 29.2December ......................... 824 1,933 4,394 16,726 4.9 11.6 26.3Average ........................... 630 1,843 4,312 15,231 4.1 12.1 28.3
1984January ............................. 838 1,952 4,855 16,801 5.0 11.6 28.9February ........................... 749 1,886 5,111 15,437 4.9 12.2 33.1March ................................ 720 1,797 4,461 16,050 4.5 11.2 27.8April .................................. 734 1,945 4,717 15,568 4.7 12.5 30.3May ................................... 1,143 2,660 5,212 15,620 7.3 17.0 33.4June .................................. 836 2,217 4,618 15,709 5.3 14.1 29.4July ................................... 945 2,233 4,871 15,498 6.1 14.4 31.4August .............................. 993 2,008 4,312 16,116 6.2 12.5 26.8September ........................ 684 1,998 4,588 15,247 4.5 13.1 30.1October ............................. 753 2,054 5,179 15,616 4.8 13.2 33.2November ......................... 666 1,951 4,733 15,627 4.3 12.5 30.3December ......................... 723 1,732 3,947 15,375 4.7 11.3 25.7Average ........................... 817 2,037 4,715 15,726 5.2 13.0 30.0
1985January ............................. 302 1,392 3,623 16,109 1.9 8.6 22.5February ........................... 307 1,217 3,056 16,121 1.9 7.5 19.0March ................................ 382 1,488 3,979 15,373 2.5 9.7 25.9April .................................. 573 1,920 4,553 15,472 3.7 12.4 29.4May ................................... 635 1,973 5,071 15,504 4.1 12.7 32.7June .................................. 376 1,674 4,237 15,483 2.4 10.8 27.4July ................................... 286 1,813 4,274 15,434 1.9 11.7 27.7August .............................. 278 1,731 3,969 16,060 1.7 10.8 24.7September ........................ 301 1,797 4,164 15,099 2.0 11.9 27.6October ............................. 518 1,948 4,431 15,944 3.2 12.2 27.8November ......................... 751 2,436 5,080 15,503 4.8 15.7 32.8December ......................... 923 2,421 4,905 16,611 5.6 14.6 29.5Average ........................... 470 1,821 4,286 15,726 3.0 11.6 27.3
1986January ............................. 975 2,291 4,714 16,088 6.1 14.2 29.3February ........................... 755 1,800 3,800 16,186 4.7 11.1 23.5March ................................ 796 2,139 3,980 16,276 4.9 13.1 24.5April .................................. 1,058 2,568 4,589 15,945 6.6 16.1 28.8May ................................... 964 2,736 5,676 15,993 6.0 17.1 35.5June .................................. 1,376 2,996 6,206 16,049 8.6 18.7 38.7July ................................... 1,355 3,302 6,256 16,307 8.3 20.2 38.4August .............................. 1,339 3,345 6,300 16,618 8.1 20.1 37.9September ........................ 1,385 3,366 6,375 15,909 8.7 21.2 40.1October ............................. 1,386 3,268 5,597 16,602 8.3 19.7 33.7November ......................... 1,291 3,077 5,771 16,221 8.0 19.0 35.6December ......................... 1,221 2,970 5,881 17,131 7.1 17.3 34.3Average ........................... 1,160 2,828 5,439 16,281 7.1 17.4 33.4
1987January ............................. 1,183 2,760 5,650 16,684 7.1 16.5 33.9February ........................... 1,220 2,781 5,007 16,908 7.2 16.5 29.6March ................................ 843 2,301 5,074 16,165 5.2 14.2 31.4April .................................. 863 2,422 5,041 16,524 5.2 14.7 30.5May ................................... 772 2,669 5,407 16,026 4.8 16.7 33.7June .................................. 1,273 3,113 6,099 16,830 7.6 18.5 36.2July ................................... 1,262 3,530 6,908 17,113 7.4 20.6 40.4August .............................. 1,608 3,732 6,790 16,346 9.8 22.8 41.5September ........................ 1,638 3,554 6,382 16,670 9.8 21.3 38.3October ............................. 1,711 3,567 6,422 16,941 10.1 21.1 37.9November ......................... 1,476 3,161 6,331 16,343 9.0 19.3 38.7December ......................... 1,412 3,023 5,776 17,445 8.1 17.3 33.1Average ........................... 1,272 3,053 5,914 16,665 7.6 18.3 35.5
See footnotes at end of table.
Energy Information Administration/Historical Monthly Energy Review 1973-1992 31

Table 1.8 U.S. Dependence on Petroleum Net Imports, 1973-1992 (Continued)
Net Importsa
PetroleumProductsSupplied
Net Imports as Share ofU.S. Petroleum Products Supplied
From ArabOPECb
FromOPECc
From AllCountries
From ArabOPECb
FromOPECc
From AllCountries
Thousand Barrels per Day Percent
1988January ............................. 1,651 3,125 6,296 17,403 9.5 18.0 36.2February ........................... 1,881 3,459 6,392 17,760 10.6 19.5 36.0March ................................ 1,509 3,063 6,110 17,612 8.6 17.4 34.7April .................................. 1,607 3,405 6,594 16,561 9.7 20.6 39.8May ................................... 1,721 3,494 6,655 16,197 10.6 21.6 41.1June .................................. 1,635 3,624 6,301 17,059 9.6 21.2 36.9July ................................... 1,910 3,585 6,471 16,695 11.4 21.5 38.8August .............................. 2,036 3,701 6,572 17,482 11.6 21.2 37.6September ........................ 2,039 3,679 6,833 17,072 11.9 21.5 40.0October ............................. 2,067 3,851 7,098 17,580 11.8 21.9 40.4November ......................... 1,913 3,509 6,997 17,620 10.9 19.9 39.7December ......................... 2,079 3,660 6,719 18,365 11.3 19.9 36.6Average ........................... 1,837 3,513 6,587 17,283 10.6 20.3 38.1
1989January ............................. 2,217 4,205 7,494 17,269 12.8 24.3 43.4February ........................... 2,123 3,834 7,157 17,920 11.8 21.4 39.9March ................................ 1,804 3,688 6,596 17,989 10.0 20.5 36.7April .................................. 2,029 3,926 7,268 16,624 12.2 23.6 43.7May ................................... 1,973 4,015 6,986 16,546 11.9 24.3 42.2June .................................. 2,163 4,102 7,002 17,497 12.4 23.4 40.0July ................................... 2,305 4,426 7,589 16,453 14.0 26.9 46.1August .............................. 2,452 4,509 7,593 17,360 14.1 26.0 43.7September ........................ 2,191 4,209 7,347 16,795 13.0 25.1 43.7October ............................. 2,120 4,141 7,511 17,304 12.2 23.9 43.4November ......................... 2,254 4,316 7,366 17,311 13.0 24.9 42.6December ......................... 1,904 4,088 6,512 18,858 10.1 21.7 34.5Average ........................... 2,128 4,124 7,202 17,325 12.3 23.8 41.6
1990January ............................. 2,602 4,851 8,488 16,964 15.3 28.6 50.0February ........................... 2,506 4,587 7,577 17,175 14.6 26.7 44.1March ................................ 2,160 4,410 7,084 17,087 12.6 25.8 41.5April .................................. 2,070 4,179 7,097 16,778 12.3 24.9 42.3May ................................... 2,348 4,559 8,144 16,915 13.9 27.0 48.1June .................................. 2,316 4,449 7,944 17,165 13.5 25.9 46.3July ................................... 2,851 4,986 8,353 17,084 16.7 29.2 48.9August .............................. 2,757 4,918 7,794 18,050 15.3 27.2 43.2September ........................ 1,915 3,939 6,514 16,512 11.6 23.9 39.5October ............................. 1,789 3,498 5,768 16,934 10.6 20.7 34.1November ......................... 1,754 3,622 5,918 16,695 10.5 21.7 35.4December ......................... 1,841 3,422 5,252 16,494 11.2 20.7 31.8Average ........................... 2,243 4,285 7,161 16,988 13.2 25.2 42.2
1991January ............................. 2,203 3,826 5,904 16,893 13.0 22.6 35.0February ........................... 1,809 3,747 5,424 16,339 11.1 22.9 33.2March ................................ 1,903 3,610 5,702 16,212 11.7 22.3 35.2April .................................. 2,044 3,715 6,680 16,139 12.7 23.0 41.4May ................................... 2,563 4,697 7,369 16,189 15.8 29.0 45.5June .................................. 2,141 4,480 7,323 16,878 12.7 26.5 43.4July ................................... 1,925 4,217 6,793 16,971 11.3 24.9 40.0August .............................. 2,205 4,592 7,832 17,183 12.8 26.7 45.6September ........................ 1,945 3,936 7,042 16,848 11.5 23.4 41.8October ............................. 1,954 3,997 6,550 16,996 11.5 23.5 38.5November ......................... 2,071 4,155 6,690 16,730 12.4 24.8 40.0December ......................... 1,890 3,776 6,124 17,145 11.0 22.0 35.7Average ........................... 2,057 4,065 6,626 16,714 12.3 24.3 39.6
1992January ............................. 2,239 4,207 6,568 17,012 13.2 24.7 38.6February ........................... 1,993 3,536 5,975 16,893 11.8 20.9 35.4March ................................ 1,921 3,590 6,156 16,825 11.4 21.3 36.6April .................................. 1,913 4,060 7,155 16,764 11.4 24.2 42.7May ................................... 1,963 4,108 6,939 16,485 11.9 24.9 42.1June .................................. 1,887 3,999 6,989 16,978 11.1 23.6 41.2July ................................... 1,956 4,327 7,550 17,143 11.4 25.2 44.0August .............................. 1,927 4,112 7,470 16,929 11.4 24.3 44.1September ........................ 1,845 4,253 7,330 16,876 10.9 25.2 43.4October ............................. 1,917 4,499 7,603 17,448 11.0 25.8 43.6November ......................... 1,913 4,054 6,877 17,091 11.2 23.7 40.2December ......................... 2,181 4,073 6,602 17,928 12.2 22.7 36.8Average ........................... 1,972 4,071 6,938 17,033 11.6 23.9 40.7
a "Net Imports" are imports minus exports. Imports from members of theOrganization of Petroleum Exporting Countries (OPEC) exclude indirectimports, which are petroleum products primarily from Caribbean and WestEuropean areas and refined from crude oil produced by OPEC.
b The Arab members of OPEC are Algeria, Iraq, Kuwait, Libya, Qatar,Saudi Arabia, and the United Arab Emirates. Net imports from the NeutralZone between Kuwait and Saudi Arabia are included in net imports from ArabOPEC.
c OPEC consists of Ecuador, Gabon, Indonesia, Iran, Nigeria, andVenezuela, as well as the Arab members.
Notes: • Beginning in October 1977, Strategic Petroleum Reserves areincluded. • Annual averages may not equal average of months due toindependent rounding. • U.S. geographic coverage is the 50 States and theDistrict of Columbia.
Sources: See end of section.
Energy Information Administration/Historical Monthly Energy Review 1973-199232

Table 1.9 Energy Consumption per Dollar of Gross Domestic Product, 1973-1992
(Seasonally Adjusted at Annual Rates)
Energy ConsumptionGross
DomesticProduct(GDP)
Energy Consumption per Dollar of GDP
Petroleumand
Natural GasOther
Energy Totala
Petroleumand
Natural GasOther
Energy Total
Quadrillion Btu
Billion1987 Dollars
Thousand Btu per 1987 Dollar
1973 1st Quarter ............... 58.173 16.388 74.562 3,253.3 17.88 5.04 22.92 2nd Quarter .............. 58.274 17.005 75.279 3,267.6 17.83 5.20 23.04 3rd Quarter ............... 57.059 16.767 73.826 3,264.3 17.48 5.14 22.62 4th Quarter ............... 55.929 17.545 73.475 3,289.1 17.00 5.33 22.34 Year ......................... 57.352 16.930 74.282 3,268.6 17.55 5.18 22.73
1974 1st Quarter ............... 54.685 17.523 72.208 3,259.4 16.78 5.38 22.15 2nd Quarter .............. 55.678 17.372 73.049 3,267.6 17.04 5.32 22.36 3rd Quarter ............... 55.494 17.338 72.832 3,239.1 17.13 5.35 22.49 4th Quarter ............... 54.886 17.194 72.081 3,226.4 17.01 5.33 22.34 Year ......................... 55.187 17.356 72.543 3,248.1 16.99 5.34 22.33
1975 1st Quarter ............... 54.262 17.799 72.061 3,154.0 17.20 5.64 22.85 2nd Quarter .............. 52.445 17.960 70.405 3,190.4 16.44 5.63 22.07 3rd Quarter ............... 52.300 17.441 69.740 3,249.9 16.09 5.37 21.46 4th Quarter ............... 52.018 17.992 70.010 3,292.5 15.80 5.46 21.26 Year ......................... 52.678 17.867 70.546 3,221.7 16.35 5.55 21.90
1976 1st Quarter ............... 54.407 18.516 72.922 3,356.7 16.21 5.52 21.72 2nd Quarter .............. 55.207 18.566 73.773 3,369.2 16.39 5.51 21.90 3rd Quarter ............... 54.369 18.835 73.204 3,381.0 16.08 5.57 21.65 4th Quarter ............... 58.080 19.444 77.524 3,416.3 17.00 5.69 22.69 Year ......................... 55.520 18.842 74.362 3,380.8 16.42 5.57 22.00
1977 1st Quarter ............... 57.432 19.312 76.744 3,466.4 16.57 5.57 22.14 2nd Quarter .............. 56.933 19.197 76.129 3,525.0 16.15 5.45 21.60 3rd Quarter ............... 57.451 19.052 76.503 3,574.4 16.07 5.33 21.40 4th Quarter ............... 56.403 19.383 75.786 3,567.2 15.81 5.43 21.25 Year ......................... 57.053 19.236 76.288 3,533.3 16.15 5.44 21.59
1978 1st Quarter ............... 59.891 19.003 78.894 3,591.8 16.67 5.29 21.96 2nd Quarter .............. 58.231 20.253 78.484 3,707.0 15.71 5.46 21.17 3rd Quarter ............... 57.100 20.598 77.698 3,735.6 15.29 5.51 20.80 4th Quarter ............... 56.684 20.616 77.300 3,779.6 15.00 5.45 20.45 Year ......................... 57.966 20.123 78.089 3,703.5 15.65 5.43 21.09
1979 1st Quarter ............... 60.429 21.732 82.162 3,780.8 15.98 5.75 21.73 2nd Quarter .............. 57.955 21.135 79.090 3,784.3 15.31 5.58 20.90 3rd Quarter ............... 56.603 20.525 77.128 3,807.5 14.87 5.39 20.26 4th Quarter ............... 56.230 21.056 77.286 3,814.6 14.74 5.52 20.26 Year ......................... 57.789 21.108 78.898 3,796.8 15.22 5.56 20.78
1980 1st Quarter ............... 56.650 21.523 78.172 3,830.8 14.79 5.62 20.41 2nd Quarter .............. 54.411 21.466 75.876 3,732.6 14.58 5.75 20.33 3rd Quarter ............... 52.993 21.107 74.101 3,733.5 14.19 5.65 19.85 4th Quarter ............... 54.339 21.343 75.682 3,808.5 14.27 5.60 19.87 Year ......................... 54.596 21.359 75.955 3,776.3 14.46 5.66 20.11
1981 1st Quarter ............... 52.958 22.155 75.114 3,860.5 13.72 5.74 19.46 2nd Quarter .............. 52.420 22.090 74.510 3,844.4 13.64 5.75 19.38 3rd Quarter ............... 51.325 22.210 73.535 3,864.5 13.28 5.75 19.03 4th Quarter ............... 50.754 22.068 72.822 3,803.1 13.35 5.80 19.15 Year ......................... 51.859 22.131 73.990 3,843.1 13.49 5.76 19.25
1982 1st Quarter ............... 51.379 22.846 74.225 3,756.1 13.68 6.08 19.76 2nd Quarter .............. 49.079 22.300 71.379 3,771.1 13.01 5.91 18.93 3rd Quarter ............... 47.653 21.672 69.325 3,754.4 12.69 5.77 18.47 4th Quarter ............... 46.903 21.644 68.548 3,759.6 12.48 5.76 18.23 Year ......................... 48.736 22.111 70.848 3,760.3 12.96 5.88 18.84
See footnotes at end of table.
Energy Information Administration/Historical Monthly Energy Review 1973-1992 33

Table 1.9 Energy Consumption per Dollar of Gross Domestic Product, 1973-1992 (Continued)
(Seasonally Adjusted at Annual Rates)
Energy ConsumptionGross
DomesticProduct(GDP)
Energy Consumption per Dollar of GDP
Petroleumand
Natural GasOther
Energy Totala
Petroleumand
Natural GasOther
Energy Total
Quadrillion Btu
Billion1987 Dollars
Thousand Btu per 1987 Dollar
1983 1st Quarter ............... 46.111 21.981 68.092 3,783.5 12.19 5.81 18.00 2nd Quarter .............. 46.622 22.788 69.411 3,886.5 12.00 5.86 17.86 3rd Quarter ............... 47.461 23.766 71.227 3,944.4 12.03 6.03 18.06 4th Quarter ............... 49.391 23.892 73.283 4,012.1 12.31 5.95 18.27 Year ......................... 47.411 23.114 70.524 3,906.6 12.14 5.92 18.05
1984 1st Quarter ............... 51.163 24.874 76.037 4,089.5 12.51 6.08 18.59 2nd Quarter .............. 51.055 24.977 76.031 4,144.0 12.32 6.03 18.35 3rd Quarter ............... 48.842 24.299 73.140 4,166.4 11.72 5.83 17.55 4th Quarter ............... 47.212 24.221 71.433 4,194.2 11.26 5.77 17.03 Year ......................... 49.558 24.586 74.144 4,148.5 11.95 5.93 17.87
1985 1st Quarter ............... 50.023 25.585 75.608 4,221.8 11.85 6.06 17.91 2nd Quarter .............. 48.438 25.212 73.651 4,254.8 11.38 5.93 17.31 3rd Quarter ............... 47.988 24.799 72.786 4,309.0 11.14 5.76 16.89 4th Quarter ............... 48.599 25.310 73.909 4,333.5 11.21 5.84 17.06 Year ......................... 48.756 25.225 73.981 4,279.8 11.39 5.89 17.29
1986 1st Quarter ............... 49.988 25.699 75.687 4,390.5 11.39 5.85 17.24 2nd Quarter .............. 49.202 25.375 74.577 4,387.7 11.21 5.78 17.00 3rd Quarter ............... 48.317 25.083 73.399 4,412.6 10.95 5.68 16.63 4th Quarter ............... 48.136 25.421 73.557 4,427.1 10.87 5.74 16.62 Year ......................... 48.904 25.393 74.297 4,404.5 11.10 5.77 16.87
1987 1st Quarter ............... 50.664 25.802 76.466 4,460.0 11.36 5.79 17.14 2nd Quarter .............. 50.780 26.508 77.288 4,515.3 11.25 5.87 17.12 3rd Quarter ............... 50.381 26.611 76.991 4,559.3 11.05 5.84 16.89 4th Quarter ............... 50.616 26.211 76.827 4,625.5 10.94 5.67 16.61 Year ......................... 50.609 26.285 76.894 4,539.9 11.15 5.79 16.94
1988 1st Quarter ............... 53.704 27.474 81.178 4,655.3 11.54 5.90 17.44 2nd Quarter .............. 52.258 27.338 79.596 4,704.8 11.11 5.81 16.92 3rd Quarter ............... 52.321 27.759 80.080 4,734.5 11.05 5.86 16.91 4th Quarter ............... 52.819 27.202 80.021 4,779.7 11.05 5.69 16.74 Year ......................... 52.774 27.443 80.218 4,718.6 11.18 5.82 17.00
1989 1st Quarter ............... 54.042 27.428 81.470 4,817.6 11.22 5.69 16.91 2nd Quarter .............. 53.594 27.709 81.303 4,839.0 11.08 5.73 16.80 3rd Quarter ............... 52.173 27.525 79.697 4,839.0 10.78 5.69 16.47 4th Quarter ............... 54.580 28.254 82.834 4,856.7 11.24 5.82 17.06 Year ......................... 53.595 27.731 81.325 4,838.0 11.08 5.73 16.81
1990 1st Quarter ............... 52.241 28.180 80.421 4,898.3 10.67 5.75 16.42 2nd Quarter .............. 54.069 28.346 82.415 4,917.1 11.00 5.76 16.76 3rd Quarter ............... 53.459 28.411 81.870 4,906.5 10.90 5.79 16.69 4th Quarter ............... 51.627 28.538 80.166 4,867.2 10.61 5.86 16.47 Year ......................... 52.849 28.416 81.265 4,897.3 10.79 5.80 16.59
1991 1st Quarter ............... 52.249 28.362 80.611 4,837.8 10.80 5.86 16.66 2nd Quarter .............. 51.976 29.146 81.122 4,855.6 10.70 6.00 16.71 3rd Quarter ............... 52.712 28.741 81.453 4,872.6 10.82 5.90 16.72 4th Quarter ............... 52.860 28.409 81.268 4,879.6 10.83 5.82 16.65 Year ......................... 52.452 28.665 81.116 4,861.4 10.79 5.90 16.69
1992 1st Quarter ............... 53.676 28.132 81.808 4,922.0 10.91 5.72 16.62 2nd Quarter .............. 54.051 28.532 82.583 4,956.5 10.91 5.76 16.66 3rd Quarter ............... 52.840 28.291 81.131 4,998.2 10.57 5.66 16.23 4th Quarter ............... 54.066 28.989 83.055 5,068.3 10.67 5.72 16.39 Year ......................... 53.657 28.487 82.144 4,986.3 10.76 5.71 16.47
a Excludes wood, waste, geothermal, wind, photovoltaic, and solar thermalenergy, except for small amounts used by electric utilities to generateelectricity for distribution.
Notes: • The data in this table are frequently revised; those shown herecorrespond to the data in the July 1994 Monthly Energy Review.• Quarterly data are seasonally adjusted and shown at annual rates.
• Yearly data may not equal average of quarters due to seasonalityadjustments and independent rounding. • Totals may not equal sum ofcomponents due to independent rounding. • Geographic coverage is the 50States and the District of Columbia.
Sources: See end of section.
Energy Information Administration/Historical Monthly Energy Review 1973-199234

Table 1.10 Passenger Car Efficiency, 1973-1992
Mileage
Fuel Consumption
Fuel Rate
Milesper Car
Index1973=100.0
Gallonsper Car
Index1973=100.0
Milesper Gallon
Index1973=100.0
1973 ................................ 10,256 100.0 771 100.0 13.30 100.01974 ................................ 9,606 93.7 716 92.9 13.42 100.91975 ................................ 9,690 94.5 716 92.9 13.52 101.71976 ................................ 9,785 95.4 723 93.8 13.53 101.71977 ................................ 9,879 96.3 716 92.9 13.80 103.81978 ................................ 9,835 95.9 701 90.9 14.04 105.61979 ................................ 9,403 91.7 653 84.7 14.41 108.31980 ................................ 9,141 89.1 591 76.7 15.46 116.21981 ................................ 9,186 89.6 576 74.7 15.94 119.81982 ................................ 9,428 91.9 566 73.4 16.65 125.21983 ................................ 9,475 92.4 553 71.7 17.14 128.91984 ................................ 9,558 93.2 536 69.5 17.83 134.11985 ................................ 9,560 93.2 525 68.1 18.20 136.81986 ................................ 9,608 93.7 526 68.2 18.27 137.41987 ................................ 9,878 96.3 514 66.7 19.20 144.41988 ................................ 10,121 98.7 509 66.0 19.87 149.41989 ................................ 10,332 100.7 509 66.0 20.31 152.71990 ................................ 10,548 102.8 502 65.1 21.02 158.01991 ................................ 10,757 104.9 496 64.3 21.69 163.11992a .............................. 11,063 107.9 512 66.4 21.60 162.4
a Preliminary data.Note: Geographic coverage is the 50 States and the District of Columbia.
Sources: See end of section.
Energy Information Administration/Historical Monthly Energy Review 1973-1992 35

Table 1.11 Heating Degree-Days by Census Division, 1973-1992
Census Divisions
U.S.Averagea
NewEngland
MiddleAtlantic
EastNorth
Central
WestNorth
CentralSouth
Atlantic
EastSouth
Central
WestSouth
Central Mountain Pacifica
1973January ................... 1,151 1,034 1,133 1,295 615 812 682 1,081 641 893February ................. 1,094 1,016 1,041 1,042 578 680 489 804 440 772March ...................... 763 642 630 668 279 296 211 752 519 504April ........................ 524 444 493 502 194 241 145 536 307 356May ......................... 329 273 293 241 77 103 16 234 142 182June ........................ 29 10 21 34 1 1 0 80 56 22July ......................... 2 2 2 11 0 0 0 19 23 6August .................... 4 3 7 8 0 0 0 18 34 9September .............. 137 69 73 127 8 7 4 156 70 61October ................... 413 295 267 274 116 119 44 331 192 212November ............... 719 610 689 757 284 341 165 665 451 497December ............... 955 929 1,131 1,267 566 709 500 886 508 799Total ....................... 6,120 5,327 5,780 6,226 2,718 3,309 2,256 5,562 3,383 4,313
1974January ................... 1,171 1,022 1,188 1,416 409 565 553 1,036 614 838February ................. 1,114 1,020 1,079 1,037 506 599 372 794 470 754March ...................... 923 799 822 808 299 322 158 581 433 556April ........................ 521 412 424 407 148 188 68 439 321 310May ......................... 363 235 271 220 48 48 2 198 204 171June ........................ 73 46 72 60 12 16 1 52 58 42July ......................... 6 5 3 2 0 0 0 9 24 6August .................... 16 8 18 41 0 0 0 42 18 13September .............. 141 110 173 208 28 57 29 149 35 94October ................... 574 464 429 362 201 248 74 327 171 303November ............... 708 626 713 782 349 442 296 658 374 524December ............... 1,011 923 1,067 1,135 551 686 527 996 572 795Total ....................... 6,621 5,670 6,259 6,478 2,551 3,171 2,080 5,281 3,294 4,406
1975January ................... 1,101 986 1,134 1,277 527 660 481 1,005 573 821February ................. 1,060 922 1,039 1,181 444 552 447 839 506 742March ...................... 983 881 982 1,063 416 523 316 732 506 686April ........................ 697 623 645 563 222 240 95 576 465 449May ......................... 183 119 141 149 29 33 7 296 196 117June ........................ 57 24 31 44 3 2 0 112 100 37July ......................... 1 2 4 3 0 0 0 10 24 5August .................... 19 8 9 17 0 0 0 35 37 13September .............. 184 143 184 178 29 50 13 143 46 100October ................... 376 278 346 330 109 167 65 357 223 235November ............... 581 495 580 720 283 397 258 714 418 462December ............... 1,120 996 1,074 1,153 578 712 505 874 529 805Total ....................... 6,362 5,477 6,169 6,678 2,640 3,336 2,187 5,693 3,623 4,472
1976January ................... 1,375 1,268 1,376 1,361 720 890 592 958 511 974February ................. 936 810 863 831 381 451 257 689 456 609March ...................... 883 720 718 815 283 338 220 739 471 544April ........................ 468 397 427 360 145 188 69 438 370 309May ......................... 289 242 288 237 76 124 32 209 156 178June ........................ 17 12 26 33 4 6 1 93 79 28July ......................... 13 12 5 6 1 0 0 10 24 8August .................... 28 18 31 15 2 1 0 36 37 19September .............. 164 117 139 110 29 44 6 121 52 81October ................... 530 488 555 558 240 328 198 423 152 367November ............... 846 822 971 996 493 676 478 666 293 668December ............... 1,290 1,191 1,369 1,348 666 835 593 921 514 941Total ....................... 6,839 6,097 6,768 6,670 3,040 3,881 2,446 5,303 3,115 4,726
1977January ................... 1,473 1,455 1,704 1,716 931 1,187 831 1,047 600 1,188February ................. 1,095 994 1,108 996 568 684 411 706 366 751March ...................... 769 672 694 702 286 359 240 745 510 529April ........................ 539 423 353 298 117 126 71 369 255 270May ......................... 213 135 98 80 30 30 3 252 286 119June ........................ 84 51 64 32 6 3 0 39 58 38July ......................... 6 2 1 5 0 0 0 11 26 6August .................... 19 11 28 46 0 0 0 27 8 13September .............. 139 70 82 104 7 10 1 108 76 59October ................... 448 415 459 414 196 263 63 317 164 295November ............... 651 598 716 814 296 381 228 627 342 493December ............... 1,143 1,063 1,231 1,299 610 769 482 812 444 844Total ....................... 6,579 5,889 6,538 6,506 3,047 3,812 2,330 5,060 3,135 4,605
See footnotes at end of table.
Energy Information Administration/Historical Monthly Energy Review 1973-199236

Table 1.11 Heating Degree-Days by Census Division, 1973-1992 (Continued)
Census Divisions
U.S.Averagea
NewEngland
MiddleAtlantic
EastNorth
Central
WestNorth
CentralSouth
Atlantic
EastSouth
Central
WestSouth
Central Mountain Pacifica
1978January ................... 1,293 1,254 1,495 1,649 808 1,089 844 948 502 1,061February ................. 1,253 1,223 1,388 1,394 733 925 693 785 425 958March ...................... 1,030 937 1,050 970 451 562 335 574 326 677April ........................ 633 525 511 443 160 155 51 411 340 350May ......................... 265 232 228 187 64 73 9 270 157 157June ........................ 56 35 42 42 2 1 0 76 52 31July ......................... 9 6 10 12 0 0 0 12 16 7August .................... 16 7 14 19 0 0 0 37 20 11September .............. 207 109 47 55 9 8 1 127 68 59October ................... 479 407 451 410 174 237 72 318 126 283November ............... 743 633 711 827 267 320 221 712 469 517December ............... 1,077 962 1,148 1,316 519 692 538 1,100 667 847Total ....................... 7,061 6,330 7,095 7,324 3,187 4,062 2,764 5,370 3,168 4,958
1979January ................... 1,179 1,157 1,544 1,765 717 1,018 847 1,216 682 1,079February ................. 1,307 1,271 1,376 1,407 676 792 563 823 514 950March ...................... 805 720 838 916 346 417 258 682 411 575April ........................ 588 510 567 546 164 189 83 436 302 364May ......................... 206 178 245 245 49 73 18 250 145 148June ........................ 65 49 44 49 10 6 0 81 58 37July ......................... 2 4 12 12 0 0 0 11 15 6August .................... 27 13 26 30 0 0 0 29 22 15September .............. 141 88 95 93 18 29 5 81 29 58October ................... 451 397 423 393 171 206 45 296 151 271November ............... 590 550 741 861 283 465 371 800 412 528December ............... 987 914 1,010 1,052 543 705 504 859 461 750Total ....................... 6,348 5,851 6,921 7,369 2,977 3,900 2,694 5,564 3,202 4,781
1980January ................... 1,188 1,116 1,250 1,318 624 739 530 951 537 887February ................. 1,159 1,092 1,209 1,216 639 789 498 712 370 831March ...................... 959 895 997 987 431 551 320 728 444 680April ........................ 546 453 530 427 161 237 114 432 267 338May ......................... 248 156 191 158 41 60 9 262 232 142June ........................ 92 57 70 37 6 4 0 69 106 49July ......................... 4 3 3 5 0 0 0 8 19 5August .................... 10 3 6 18 0 0 0 31 32 10September .............. 115 55 86 104 5 7 1 110 63 54October ................... 509 431 514 468 187 255 100 370 145 316November ............... 811 748 778 739 396 487 332 638 333 564December ............... 1,259 1,134 1,158 1,175 609 726 474 741 438 831Total ....................... 6,900 6,143 6,792 6,652 3,099 3,855 2,378 5,052 2,986 4,707
1981January ................... 1,491 1,352 1,351 1,232 812 930 600 821 465 984February ................. 890 849 1,009 994 501 628 422 699 383 689March ...................... 903 865 856 747 452 529 285 641 411 620April ........................ 499 407 389 300 105 93 28 317 260 260May ......................... 238 188 285 241 70 101 19 239 157 165June ........................ 39 22 33 43 1 0 0 63 48 25July ......................... 4 4 6 9 0 0 0 11 22 6August .................... 28 14 18 24 1 0 0 19 10 11September .............. 157 107 133 120 25 40 4 90 49 76October ................... 536 467 485 451 196 223 75 388 229 327November ............... 727 669 707 689 359 410 224 557 329 504December ............... 1,100 1,045 1,174 1,265 655 803 505 826 478 845Total ....................... 6,612 5,989 6,446 6,115 3,177 3,757 2,162 4,671 2,841 4,512
1982January ................... 1,473 1,369 1,524 1,650 755 889 589 1,003 634 1,067February ................. 1,067 976 1,172 1,193 467 642 508 802 424 776March ...................... 952 865 920 900 354 377 215 654 473 620April ........................ 645 561 618 553 216 272 107 462 339 408May ......................... 250 148 117 151 26 25 7 257 176 114June ........................ 123 64 99 96 6 8 1 104 97 62July ......................... 5 3 3 7 0 0 0 17 27 7August .................... 50 30 34 25 1 1 0 14 19 19September .............. 131 95 123 131 25 37 3 136 60 75October ................... 456 361 358 390 151 182 77 417 179 264November ............... 623 575 707 849 292 401 275 728 446 515December ............... 922 819 867 1,055 428 523 445 950 575 692Total ....................... 6,697 5,866 6,542 7,000 2,721 3,357 2,227 5,544 3,449 4,619
See footnotes at end of table.
Energy Information Administration/Historical Monthly Energy Review 1973-1992 37

Table 1.11 Heating Degree-Days by Census Division, 1973-1992 (Continued)
Census Divisions
U.S.Averagea
NewEngland
MiddleAtlantic
EastNorth
Central
WestNorth
CentralSouth
Atlantic
EastSouth
Central
WestSouth
Central Mountain Pacifica
1983January ................... 1,183 1,085 1,159 1,225 674 824 620 873 501 874February ................. 1,010 936 931 951 541 628 448 710 405 706March ...................... 842 759 806 842 383 491 326 659 400 588April ........................ 564 519 598 617 242 326 164 558 363 421May ......................... 328 263 315 276 65 89 20 288 151 189June ........................ 35 24 36 49 4 5 1 104 83 35July ......................... 4 2 0 2 0 0 0 16 29 6August .................... 13 5 2 2 0 0 0 8 14 5September .............. 72 60 84 94 17 20 2 104 55 53October ................... 435 354 379 383 144 163 60 331 142 251November ............... 681 629 679 755 346 442 233 659 377 509December ............... 1,138 1,097 1,434 1,705 641 904 798 1,049 553 990Total ....................... 6,305 5,733 6,423 6,901 3,057 3,892 2,672 5,359 3,073 4,627
1984January ................... 1,325 1,266 1,422 1,384 728 943 715 1,024 497 1,000February ................. 876 810 865 870 452 567 391 805 426 645March ...................... 1,084 1,019 1,096 1,043 447 527 286 679 329 704April ........................ 590 513 524 501 211 227 97 506 308 371May ......................... 308 260 299 245 61 92 10 190 128 172June ........................ 36 18 22 34 1 0 0 97 79 28July ......................... 5 8 12 13 1 0 0 10 14 7August .................... 8 6 8 7 0 0 0 17 17 7September .............. 186 132 134 164 33 35 6 145 46 88October ................... 375 250 305 373 67 88 65 482 232 223November ............... 714 679 766 791 402 507 293 665 436 565December ............... 935 816 965 1,157 388 465 331 972 637 704Total ....................... 6,442 5,777 6,418 6,582 2,791 3,451 2,194 5,592 3,149 4,514
1985January ................... 1,382 1,269 1,445 1,512 782 1,037 760 1,072 613 1,057February ................. 1,024 966 1,183 1,217 523 731 540 898 475 807March ...................... 857 753 769 726 323 370 197 688 496 557April ........................ 534 396 346 334 114 140 54 351 227 260May ......................... 244 153 165 138 38 50 5 185 184 123June ........................ 107 63 78 78 5 4 0 66 50 47July ......................... 5 6 7 11 0 0 0 8 6 5August .................... 28 12 29 46 1 0 0 29 23 17September .............. 112 61 81 137 16 28 3 192 100 69October ................... 408 322 359 411 98 116 61 386 192 243November ............... 681 554 711 1,006 184 246 217 801 507 506December ............... 1,189 1,105 1,373 1,503 652 880 629 1,000 568 951Total ....................... 6,571 5,660 6,546 7,119 2,736 3,602 2,466 5,676 3,441 4,642
1986January ................... 1,177 1,112 1,247 1,185 669 822 505 803 414 859February ................. 1,120 1,030 1,090 1,133 477 534 334 686 393 734March ...................... 872 771 794 722 374 440 218 496 316 542April ........................ 506 439 393 370 149 162 51 394 293 295May ......................... 233 134 185 168 38 43 7 230 160 123June ........................ 88 35 47 28 1 1 0 49 46 30July ......................... 13 4 2 6 0 0 0 23 37 9August .................... 38 21 39 46 1 0 0 19 10 18September .............. 181 96 72 109 13 9 2 182 119 76October ................... 453 352 377 399 122 168 82 390 169 258November ............... 805 725 835 942 299 384 305 664 322 558December ............... 1,031 946 1,069 1,123 543 731 554 934 528 793Total ....................... 6,517 5,665 6,150 6,231 2,686 3,294 2,058 4,870 2,807 4,295
1987January ................... 1,257 1,151 1,215 1,217 681 837 615 998 597 920February ................. 1,118 1,027 932 839 547 593 385 732 424 714March ...................... 881 749 761 741 381 423 322 699 412 573April ........................ 541 444 440 343 221 250 100 341 193 309May ......................... 261 173 135 108 30 18 3 194 122 107June ........................ 46 14 16 19 1 0 0 59 54 20July ......................... 5 1 0 3 0 0 0 18 40 8August .................... 38 15 15 26 0 0 0 38 17 13September .............. 134 89 90 107 13 21 5 123 45 61October ................... 501 487 567 525 254 331 104 307 113 345November ............... 745 629 640 690 301 375 272 657 367 491December ............... 1,019 920 999 1,094 508 618 486 987 629 773Total ....................... 6,546 5,699 5,810 5,712 2,937 3,466 2,292 5,153 3,013 4,334
See footnotes at end of table.
Energy Information Administration/Historical Monthly Energy Review 1973-199238
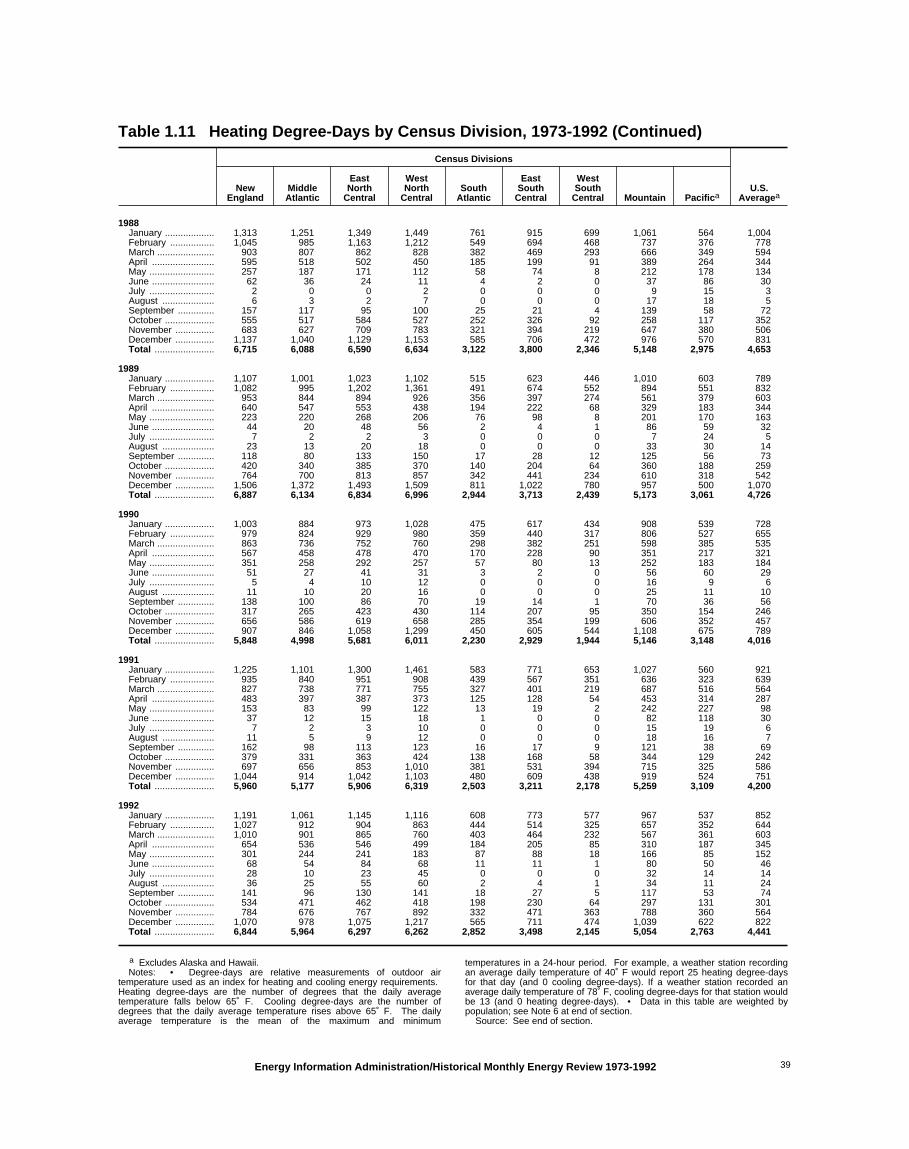
Table 1.11 Heating Degree-Days by Census Division, 1973-1992 (Continued)
Census Divisions
U.S.Averagea
NewEngland
MiddleAtlantic
EastNorth
Central
WestNorth
CentralSouth
Atlantic
EastSouth
Central
WestSouth
Central Mountain Pacifica
1988January ................... 1,313 1,251 1,349 1,449 761 915 699 1,061 564 1,004February ................. 1,045 985 1,163 1,212 549 694 468 737 376 778March ...................... 903 807 862 828 382 469 293 666 349 594April ........................ 595 518 502 450 185 199 91 389 264 344May ......................... 257 187 171 112 58 74 8 212 178 134June ........................ 62 36 24 11 4 2 0 37 86 30July ......................... 2 0 0 2 0 0 0 9 15 3August .................... 6 3 2 7 0 0 0 17 18 5September .............. 157 117 95 100 25 21 4 139 58 72October ................... 555 517 584 527 252 326 92 258 117 352November ............... 683 627 709 783 321 394 219 647 380 506December ............... 1,137 1,040 1,129 1,153 585 706 472 976 570 831Total ....................... 6,715 6,088 6,590 6,634 3,122 3,800 2,346 5,148 2,975 4,653
1989January ................... 1,107 1,001 1,023 1,102 515 623 446 1,010 603 789February ................. 1,082 995 1,202 1,361 491 674 552 894 551 832March ...................... 953 844 894 926 356 397 274 561 379 603April ........................ 640 547 553 438 194 222 68 329 183 344May ......................... 223 220 268 206 76 98 8 201 170 163June ........................ 44 20 48 56 2 4 1 86 59 32July ......................... 7 2 2 3 0 0 0 7 24 5August .................... 23 13 20 18 0 0 0 33 30 14September .............. 118 80 133 150 17 28 12 125 56 73October ................... 420 340 385 370 140 204 64 360 188 259November ............... 764 700 813 857 342 441 234 610 318 542December ............... 1,506 1,372 1,493 1,509 811 1,022 780 957 500 1,070Total ....................... 6,887 6,134 6,834 6,996 2,944 3,713 2,439 5,173 3,061 4,726
1990January ................... 1,003 884 973 1,028 475 617 434 908 539 728February ................. 979 824 929 980 359 440 317 806 527 655March ...................... 863 736 752 760 298 382 251 598 385 535April ........................ 567 458 478 470 170 228 90 351 217 321May ......................... 351 258 292 257 57 80 13 252 183 184June ........................ 51 27 41 31 3 2 0 56 60 29July ......................... 5 4 10 12 0 0 0 16 9 6August .................... 11 10 20 16 0 0 0 25 11 10September .............. 138 100 86 70 19 14 1 70 36 56October ................... 317 265 423 430 114 207 95 350 154 246November ............... 656 586 619 658 285 354 199 606 352 457December ............... 907 846 1,058 1,299 450 605 544 1,108 675 789Total ....................... 5,848 4,998 5,681 6,011 2,230 2,929 1,944 5,146 3,148 4,016
1991January ................... 1,225 1,101 1,300 1,461 583 771 653 1,027 560 921February ................. 935 840 951 908 439 567 351 636 323 639March ...................... 827 738 771 755 327 401 219 687 516 564April ........................ 483 397 387 373 125 128 54 453 314 287May ......................... 153 83 99 122 13 19 2 242 227 98June ........................ 37 12 15 18 1 0 0 82 118 30July ......................... 7 2 3 10 0 0 0 15 19 6August .................... 11 5 9 12 0 0 0 18 16 7September .............. 162 98 113 123 16 17 9 121 38 69October ................... 379 331 363 424 138 168 58 344 129 242November ............... 697 656 853 1,010 381 531 394 715 325 586December ............... 1,044 914 1,042 1,103 480 609 438 919 524 751Total ....................... 5,960 5,177 5,906 6,319 2,503 3,211 2,178 5,259 3,109 4,200
1992January ................... 1,191 1,061 1,145 1,116 608 773 577 967 537 852February ................. 1,027 912 904 863 444 514 325 657 352 644March ...................... 1,010 901 865 760 403 464 232 567 361 603April ........................ 654 536 546 499 184 205 85 310 187 345May ......................... 301 244 241 183 87 88 18 166 85 152June ........................ 68 54 84 68 11 11 1 80 50 46July ......................... 28 10 23 45 0 0 0 32 14 14August .................... 36 25 55 60 2 4 1 34 11 24September .............. 141 96 130 141 18 27 5 117 53 74October ................... 534 471 462 418 198 230 64 297 131 301November ............... 784 676 767 892 332 471 363 788 360 564December ............... 1,070 978 1,075 1,217 565 711 474 1,039 622 822Total ....................... 6,844 5,964 6,297 6,262 2,852 3,498 2,145 5,054 2,763 4,441
a Excludes Alaska and Hawaii.Notes: • Degree-days are relative measurements of outdoor air
temperature used as an index for heating and cooling energy requirements. Heating degree-days are the number of degrees that the daily averagetemperature falls below 65˚ F. Cooling degree-days are the number ofdegrees that the daily average temperature rises above 65˚ F. The dailyaverage temperature is the mean of the maximum and minimum
temperatures in a 24-hour period. For example, a weather station recordingan average daily temperature of 40˚ F would report 25 heating degree-daysfor that day (and 0 cooling degree-days). If a weather station recorded anaverage daily temperature of 78˚ F, cooling degree-days for that station wouldbe 13 (and 0 heating degree-days). • Data in this table are weighted bypopulation; see Note 6 at end of section.
Source: See end of section.
Energy Information Administration/Historical Monthly Energy Review 1973-1992 39
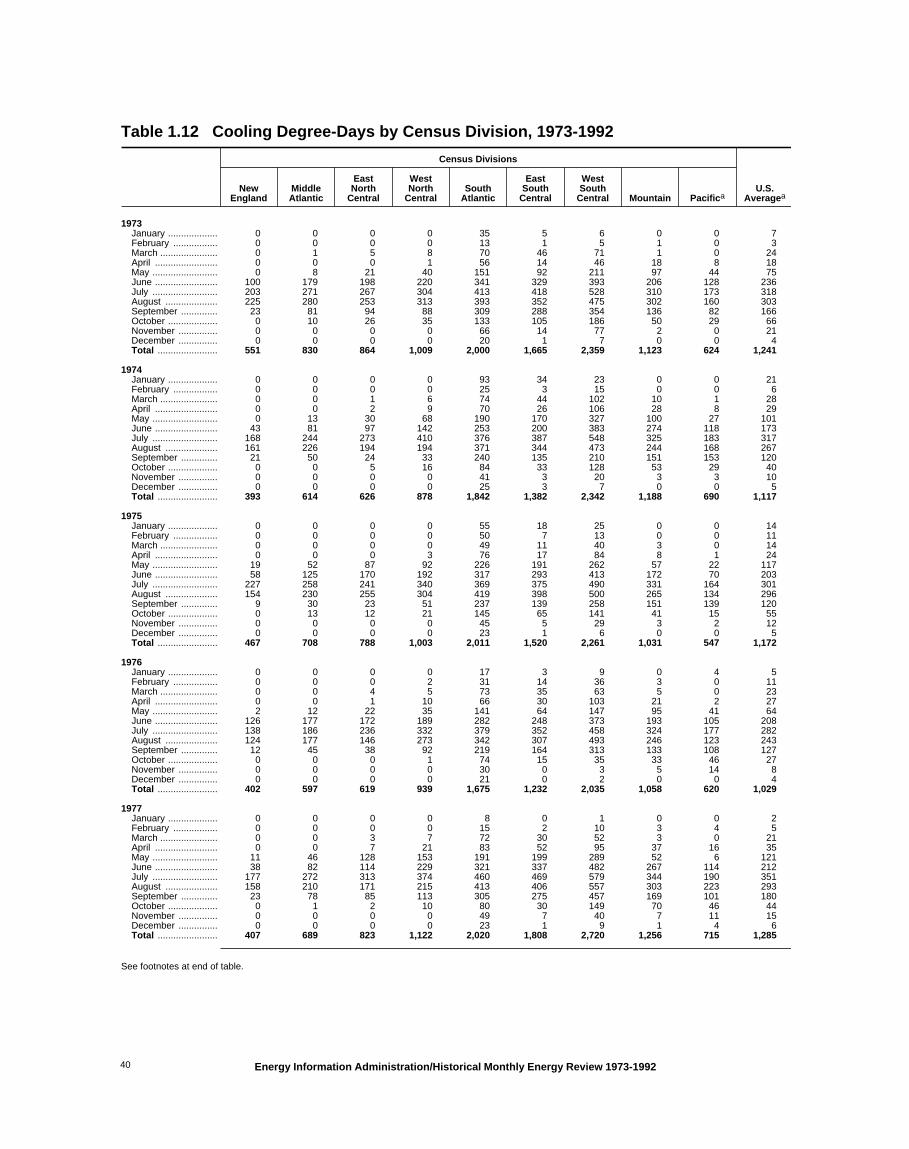
Table 1.12 Cooling Degree-Days by Census Division, 1973-1992
Census Divisions
U.S.Averagea
NewEngland
MiddleAtlantic
EastNorth
Central
WestNorth
CentralSouth
Atlantic
EastSouth
Central
WestSouth
Central Mountain Pacifica
1973January ................... 0 0 0 0 35 5 6 0 0 7February ................. 0 0 0 0 13 1 5 1 0 3March ...................... 0 1 5 8 70 46 71 1 0 24April ........................ 0 0 0 1 56 14 46 18 8 18May ......................... 0 8 21 40 151 92 211 97 44 75June ........................ 100 179 198 220 341 329 393 206 128 236July ......................... 203 271 267 304 413 418 528 310 173 318August .................... 225 280 253 313 393 352 475 302 160 303September .............. 23 81 94 88 309 288 354 136 82 166October ................... 0 10 26 35 133 105 186 50 29 66November ............... 0 0 0 0 66 14 77 2 0 21December ............... 0 0 0 0 20 1 7 0 0 4Total ....................... 551 830 864 1,009 2,000 1,665 2,359 1,123 624 1,241
1974January ................... 0 0 0 0 93 34 23 0 0 21February ................. 0 0 0 0 25 3 15 0 0 6March ...................... 0 0 1 6 74 44 102 10 1 28April ........................ 0 0 2 9 70 26 106 28 8 29May ......................... 0 13 30 68 190 170 327 100 27 101June ........................ 43 81 97 142 253 200 383 274 118 173July ......................... 168 244 273 410 376 387 548 325 183 317August .................... 161 226 194 194 371 344 473 244 168 267September .............. 21 50 24 33 240 135 210 151 153 120October ................... 0 0 5 16 84 33 128 53 29 40November ............... 0 0 0 0 41 3 20 3 3 10December ............... 0 0 0 0 25 3 7 0 0 5Total ....................... 393 614 626 878 1,842 1,382 2,342 1,188 690 1,117
1975January ................... 0 0 0 0 55 18 25 0 0 14February ................. 0 0 0 0 50 7 13 0 0 11March ...................... 0 0 0 0 49 11 40 3 0 14April ........................ 0 0 0 3 76 17 84 8 1 24May ......................... 19 52 87 92 226 191 262 57 22 117June ........................ 58 125 170 192 317 293 413 172 70 203July ......................... 227 258 241 340 369 375 490 331 164 301August .................... 154 230 255 304 419 398 500 265 134 296September .............. 9 30 23 51 237 139 258 151 139 120October ................... 0 13 12 21 145 65 141 41 15 55November ............... 0 0 0 0 45 5 29 3 2 12December ............... 0 0 0 0 23 1 6 0 0 5Total ....................... 467 708 788 1,003 2,011 1,520 2,261 1,031 547 1,172
1976January ................... 0 0 0 0 17 3 9 0 4 5February ................. 0 0 0 2 31 14 36 3 0 11March ...................... 0 0 4 5 73 35 63 5 0 23April ........................ 0 0 1 10 66 30 103 21 2 27May ......................... 2 12 22 35 141 64 147 95 41 64June ........................ 126 177 172 189 282 248 373 193 105 208July ......................... 138 186 236 332 379 352 458 324 177 282August .................... 124 177 146 273 342 307 493 246 123 243September .............. 12 45 38 92 219 164 313 133 108 127October ................... 0 0 0 1 74 15 35 33 46 27November ............... 0 0 0 0 30 0 3 5 14 8December ............... 0 0 0 0 21 0 2 0 0 4Total ....................... 402 597 619 939 1,675 1,232 2,035 1,058 620 1,029
1977January ................... 0 0 0 0 8 0 1 0 0 2February ................. 0 0 0 0 15 2 10 3 4 5March ...................... 0 0 3 7 72 30 52 3 0 21April ........................ 0 0 7 21 83 52 95 37 16 35May ......................... 11 46 128 153 191 199 289 52 6 121June ........................ 38 82 114 229 321 337 482 267 114 212July ......................... 177 272 313 374 460 469 579 344 190 351August .................... 158 210 171 215 413 406 557 303 223 293September .............. 23 78 85 113 305 275 457 169 101 180October ................... 0 1 2 10 80 30 149 70 46 44November ............... 0 0 0 0 49 7 40 7 11 15December ............... 0 0 0 0 23 1 9 1 4 6Total ....................... 407 689 823 1,122 2,020 1,808 2,720 1,256 715 1,285
See footnotes at end of table.
Energy Information Administration/Historical Monthly Energy Review 1973-199240

Table 1.12 Cooling Degree-Days by Census Division, 1973-1992 (Continued)
Census Divisions
U.S.Averagea
NewEngland
MiddleAtlantic
EastNorth
Central
WestNorth
CentralSouth
Atlantic
EastSouth
Central
WestSouth
Central Mountain Pacifica
1978January ................... 0 0 0 0 13 0 2 0 2 3February ................. 0 0 0 0 7 0 0 1 0 1March ...................... 0 0 0 0 29 6 24 13 9 10April ........................ 0 0 1 8 73 41 122 23 6 31May ......................... 5 13 36 57 172 129 289 72 44 93June ........................ 60 110 150 201 330 323 460 232 118 218July ......................... 145 194 216 319 402 436 621 350 191 310August .................... 162 250 209 265 422 397 541 259 177 300September .............. 6 48 126 168 294 294 393 146 122 180October ................... 0 0 3 9 111 41 131 75 69 52November ............... 0 0 0 0 72 16 48 3 0 19December ............... 0 0 0 0 47 2 7 0 0 9Total ....................... 378 615 741 1,027 1,972 1,685 2,638 1,174 738 1,226
1979January ................... 0 0 0 0 20 1 3 0 0 4February ................. 0 0 0 0 18 1 4 0 0 4March ...................... 0 0 0 2 37 20 48 4 1 13April ........................ 0 0 0 2 89 34 101 27 10 32May ......................... 14 28 34 49 170 120 185 75 40 82June ........................ 50 75 144 180 263 265 398 205 124 187July ......................... 215 224 196 280 388 371 527 335 192 295August .................... 135 199 172 237 393 362 489 247 162 266September .............. 20 61 66 104 258 185 297 205 204 160October ................... 0 1 6 17 113 50 175 65 35 53November ............... 0 0 0 0 55 2 10 1 0 11December ............... 0 0 0 0 29 1 5 0 2 6Total ....................... 434 588 618 871 1,833 1,412 2,242 1,164 770 1,113
1980January ................... 0 0 0 0 30 10 19 0 4 9February ................. 0 0 0 0 12 1 5 3 5 4March ...................... 0 0 0 0 50 8 33 4 1 13April ........................ 0 0 0 3 67 15 61 26 14 23May ......................... 9 36 54 76 186 140 259 54 12 95June ........................ 33 76 106 223 302 306 521 229 70 199July ......................... 211 279 293 441 468 514 666 383 212 374August .................... 198 298 280 342 459 488 608 279 175 347September .............. 36 104 82 125 333 318 447 166 106 192October ................... 0 0 1 7 108 31 97 51 48 42November ............... 0 0 0 0 43 2 11 5 6 10December ............... 0 0 0 0 17 1 7 2 5 5Total ....................... 487 793 816 1,217 2,075 1,834 2,734 1,202 658 1,313
1981January ................... 0 0 0 0 6 2 8 2 5 3February ................. 0 0 0 0 25 2 8 3 4 6March ...................... 0 0 0 4 26 9 34 6 3 10April ........................ 0 0 5 33 104 83 179 51 19 52May ......................... 8 23 22 36 148 88 206 86 41 75June ........................ 82 139 168 213 401 372 457 273 193 257July ......................... 202 266 232 315 443 449 571 358 213 333August .................... 129 182 186 226 348 361 513 322 238 275September .............. 15 47 43 90 223 161 328 184 139 138October ................... 0 0 2 7 112 43 143 37 15 43November ............... 0 0 0 0 32 6 43 9 6 12December ............... 0 0 0 0 21 0 8 0 0 5Total ....................... 436 657 658 924 1,889 1,576 2,498 1,331 876 1,209
1982January ................... 0 0 0 0 27 5 13 0 0 6February ................. 0 0 0 0 53 3 5 3 0 10March ...................... 0 0 0 2 66 30 65 5 1 21April ........................ 0 0 0 0 77 16 77 31 8 26May ......................... 8 38 110 91 198 201 254 80 30 115June ........................ 19 63 75 104 307 263 412 180 61 165July ......................... 184 248 256 329 420 426 562 308 167 318August .................... 88 137 143 241 356 348 580 325 200 262September .............. 22 53 48 80 230 171 363 153 118 140October ................... 0 2 11 12 110 58 129 34 34 47November ............... 0 0 0 0 64 5 28 2 0 15December ............... 0 0 0 0 50 11 14 0 0 11Total ....................... 321 541 643 859 1,958 1,537 2,502 1,121 619 1,136
See footnotes at end of table.
Energy Information Administration/Historical Monthly Energy Review 1973-1992 41

Table 1.12 Cooling Degree-Days by Census Division, 1973-1992 (Continued)
Census Divisions
U.S.Averagea
NewEngland
MiddleAtlantic
EastNorth
Central
WestNorth
CentralSouth
Atlantic
EastSouth
Central
WestSouth
Central Mountain Pacifica
1983January ................... 0 0 0 0 23 4 9 0 4 6February ................. 0 0 0 0 21 2 7 2 0 5March ...................... 0 0 0 1 28 10 26 5 4 9April ........................ 0 0 0 0 41 5 42 13 2 13May ......................... 0 9 19 30 158 102 199 76 36 72June ........................ 86 134 159 173 294 252 360 174 82 193July ......................... 218 298 347 401 455 451 535 322 161 353August .................... 174 261 322 441 457 483 577 324 236 362September .............. 60 93 78 117 249 201 346 201 186 172October ................... 0 4 9 15 128 66 148 54 62 58November ............... 0 0 0 0 40 3 39 3 3 12December ............... 0 0 0 0 31 0 0 0 0 5Total ....................... 538 799 934 1,178 1,925 1,579 2,288 1,174 776 1,260
1984January ................... 0 0 0 0 23 2 4 0 5 5February ................. 0 0 0 0 28 3 11 2 0 6March ...................... 0 0 0 0 38 10 44 12 10 14April ........................ 0 0 0 0 55 19 96 25 11 24May ......................... 1 10 21 37 164 104 264 144 82 92June ........................ 91 155 207 224 331 339 449 195 99 233July ......................... 165 191 190 282 362 350 529 325 264 291August .................... 201 242 243 327 390 350 531 290 236 312September .............. 9 33 42 70 211 174 304 167 230 143October ................... 1 18 21 15 175 136 172 27 19 70November ............... 0 0 0 0 37 2 23 3 0 9December ............... 0 0 0 0 51 19 42 0 0 15Total ....................... 468 649 724 955 1,865 1,508 2,469 1,190 956 1,214
1985January ................... 0 0 0 0 13 1 3 0 0 3February ................. 0 0 0 0 28 1 4 1 0 5March ...................... 0 0 1 6 60 33 75 6 1 22April ........................ 0 0 6 15 79 44 126 49 27 39May ......................... 8 36 68 94 194 153 278 106 28 108June ........................ 25 70 95 132 326 299 424 243 137 193July ......................... 177 228 224 299 392 387 520 364 268 313August .................... 131 198 156 187 370 355 577 291 174 269September .............. 31 87 80 84 247 189 365 102 69 145October ................... 0 8 13 13 182 106 163 46 33 68November ............... 0 0 0 0 94 28 61 2 0 25December ............... 0 0 0 0 19 0 3 0 0 4Total ....................... 372 627 643 830 2,004 1,596 2,599 1,210 737 1,194
1986January ................... 0 0 0 0 24 4 17 4 10 8February ................. 0 0 0 0 39 7 24 3 1 10March ...................... 0 0 1 8 37 17 57 20 10 17April ........................ 0 0 3 13 56 33 140 41 13 33May ......................... 10 46 58 77 190 168 253 100 39 106June ........................ 39 117 146 248 370 357 442 262 125 231July ......................... 137 247 289 364 490 495 594 279 152 340August .................... 104 156 134 177 368 346 510 329 228 259September .............. 11 55 97 123 283 287 424 109 48 161October ................... 0 5 10 11 143 64 123 36 28 52November ............... 0 0 0 0 100 13 30 5 10 23December ............... 0 0 0 0 49 1 4 0 0 9Total ....................... 301 626 738 1,021 2,149 1,792 2,618 1,188 664 1,249
1987January ................... 0 0 0 0 24 4 8 0 0 5February ................. 0 0 0 0 30 3 13 2 0 7March ...................... 0 0 1 5 43 18 25 5 3 13April ........................ 0 0 0 11 31 13 65 56 38 23May ......................... 6 28 96 132 207 237 297 96 53 127June ........................ 76 163 218 262 363 330 406 243 118 244July ......................... 194 302 318 361 473 426 510 291 114 334August .................... 108 176 213 253 453 451 579 264 171 298September .............. 22 60 72 89 279 212 329 154 134 156October ................... 0 0 0 2 72 14 100 82 72 40November ............... 0 0 0 0 57 5 24 3 3 14December ............... 0 0 0 0 35 5 12 0 0 8Total ....................... 406 729 918 1,115 2,067 1,718 2,368 1,196 706 1,269
See footnotes at end of table.
Energy Information Administration/Historical Monthly Energy Review 1973-199242

Table 1.12 Cooling Degree-Days by Census Division, 1973-1992 (Continued)
Census Divisions
U.S.Averagea
NewEngland
MiddleAtlantic
EastNorth
Central
WestNorth
CentralSouth
Atlantic
EastSouth
Central
WestSouth
Central Mountain Pacifica
1988January ................... 0 0 0 0 24 2 5 0 0 5February ................. 0 0 0 0 21 1 6 3 3 5March ...................... 0 0 0 1 38 13 35 10 10 13April ........................ 0 0 0 4 70 27 85 33 15 28May ......................... 6 22 64 116 145 113 221 91 31 89June ........................ 56 110 191 296 306 307 411 274 80 218July ......................... 233 323 333 354 434 418 534 369 231 359August .................... 233 287 319 351 450 446 570 302 181 348September .............. 17 40 68 106 254 224 367 139 114 149October ................... 0 0 0 2 86 20 128 95 61 45November ............... 0 0 0 0 65 9 50 4 3 18December ............... 0 0 0 0 30 2 10 0 0 6Total ....................... 545 782 975 1,230 1,923 1,582 2,422 1,320 729 1,283
1989January ................... 0 0 0 0 61 21 31 0 0 15February ................. 0 0 0 0 36 2 6 3 0 7March ...................... 0 0 0 1 61 23 39 23 9 19April ........................ 0 0 0 8 71 18 101 77 45 36May ......................... 9 15 25 52 156 102 295 111 33 88June ........................ 77 149 134 150 350 274 378 221 103 208July ......................... 165 229 259 332 411 382 499 387 196 312August .................... 146 192 185 250 382 360 489 275 146 266September .............. 29 68 41 55 265 186 280 171 114 138October ................... 0 5 8 16 118 45 140 54 29 49November ............... 0 0 0 0 54 4 37 8 10 16December ............... 0 0 0 0 12 0 0 0 0 2Total ....................... 426 658 652 864 1,977 1,417 2,295 1,330 685 1,156
1990January ................... 0 0 1 1 59 20 30 0 0 15February ................. 0 0 0 0 58 15 28 0 0 14March ...................... 0 0 2 5 64 26 50 14 5 21April ........................ 0 0 0 3 66 17 89 50 25 29May ......................... 1 10 22 33 190 115 264 87 28 86June ........................ 67 122 147 229 337 317 527 280 124 234July ......................... 191 248 212 287 442 394 501 330 241 316August .................... 191 210 182 269 409 395 534 267 194 291September .............. 22 50 76 147 270 262 396 199 144 172October ................... 5 16 5 9 149 48 106 61 60 57November ............... 0 0 0 0 54 8 45 6 6 16December ............... 0 0 0 0 45 5 9 0 0 9Total ....................... 477 656 647 983 2,143 1,622 2,579 1,294 827 1,260
1991January ................... 0 0 0 0 52 7 8 0 0 10February ................. 0 0 0 0 34 5 16 8 6 9March ...................... 0 0 1 6 58 23 64 2 0 19April ........................ 0 0 3 11 111 54 141 25 10 42May ......................... 30 86 130 119 272 228 310 73 17 147June ........................ 89 171 228 272 336 325 445 182 59 235July ......................... 187 278 286 324 462 444 535 330 178 336August .................... 190 260 240 288 409 377 505 318 173 305September .............. 15 53 59 91 265 225 290 165 150 149October ................... 0 6 12 14 122 65 163 76 71 62November ............... 0 0 0 0 35 0 8 3 8 8December ............... 0 0 0 0 41 5 14 0 0 9Total ....................... 511 854 959 1,125 2,197 1,758 2,499 1,182 672 1,331
1992January ................... 0 0 0 0 27 5 9 0 3 6February ................. 0 0 0 0 35 8 22 4 3 10March ...................... 0 0 0 5 39 15 56 8 4 15April ........................ 0 0 0 4 54 20 82 54 41 29May ......................... 2 10 33 58 118 101 185 116 82 77June ........................ 50 73 87 133 269 229 396 204 107 170July ......................... 100 189 174 211 450 408 524 282 202 286August .................... 106 135 107 142 334 269 413 285 251 228September .............. 18 53 45 73 260 195 345 180 151 150October ................... 0 0 3 11 94 40 147 72 56 49November ............... 0 0 0 0 63 1 10 1 5 13December ............... 0 0 0 0 34 2 12 0 0 7Total ....................... 276 460 449 637 1,777 1,293 2,201 1,206 905 1,040
a Excludes Alaska and Hawaii.Notes: • Degree-days are relative measurements of outdoor air
temperature used as an index for heating and cooling energy requirements. Cooling degree-days are the number of degrees that the daily averagetemperature rises above 65˚ F. Heating degree-days are the number ofdegrees that the daily average temperature falls below 65˚ F. The dailyaverage temperature is the mean of the maximum and minimum
temperatures in a 24-hour period. For example, if a weather station recordedan average daily temperature of 78˚ F, cooling degree-days for that stationwould be 13 (and 0 heating degree-days). A weather station recording anaverage daily temperature of 40˚ F, would report 25 heating degree-days forthat day (and 0 cooling degree-days). • Data in this table are weighted bypopulation; see Note 6 at end of section.
Source: See end of section.
Energy Information Administration/Historical Monthly Energy Review 1973-1992 43

Energy Summary Notesand Sources
Notes:1. Energy Production: Production of energy includesproduction of coal, crude oil and lease condensate, nat-ural gas plant liquids, natural gas (dry), electric utilityand industrial production of hydroelectric power, andelectricity generated from nuclear power. Productionalso includes electricity generated for distribution fromgeothermal, wood, waste, wind, photovoltaic, andsolar thermal energy but excludes other energy ob-tained from those sources because consistent historicaldata are not available. Approximate heat contents (Btuvalues) are derived by using the conversion factorsprovided in Appendix A.
2. Energy Consumption: Consumption of energy in-cludes consumption of coal, natural gas (includingsupplemental gaseous fuels), petroleum productssupplied, electric utility and industrial production ofhydroelectric power, net imports of electricity (as-sumed to be hydroelectricity), net imports of coalcoke, and electricity generated from nuclear power.Consumption also includes electricity generated fordistribution from geothermal, wood, waste, wind,
photovoltaic, and solar thermal energy but excludesother energy obtained from those sources because con-sistent historical data are not available. Approximateheat contents (Btu values) are derived by using theconversion factors provided in Appendix A.
3. Energy Imports: Energy imports include imports ofcoal, crude oil (including crude oil imported for theStrategic Petroleum Reserve), petroleum products, nat-ural gas, electricity (assumed to be hydroelectricity),and coal coke. Approximate heat contents (Btu values)are derived by using the conversion factors provided inAppendix A. For further information on electricity, see“Note for imports and exports of electricity” underNote 8 of Section 2, “Energy Consumption Notes andSources.”
4. Energy Exports: Energy exports include coal, crudeoil, petroleum products, natural gas, electricity pro-duced from hydroelectric power, and coal coke. Ap-proximate heat contents (Btu values) are derived byusing the conversion factors provided in Appendix A.For further information on electricity, see “Note forimports and exports of electricity” under Note 8 ofSection 2, “Energy Consumption Notes and Sources.”
Table 1.13 Degree-Day Normals by Census Division
Census Divisions
U.S.Averagea
NewEngland
MiddleAtlantic
EastNorth
Central
WestNorth
CentralSouth
Atlantic
EastSouth
Central
WestSouth
Central Mountain Pacifica
Heating Degree-Day Normalsb
January ....................... 1,262 1,170 1,315 1,398 670 844 620 991 573 948February ..................... 1,086 1,001 1,093 1,107 538 657 447 765 438 768March .......................... 919 821 868 865 379 455 277 677 432 611April ............................ 580 484 483 438 169 187 75 433 312 339May ............................. 275 200 217 189 51 63 10 231 183 150June ............................ 59 31 43 43 4 4 0 80 78 36July ............................. 7 4 6 9 0 0 0 13 22 7August ........................ 24 12 20 23 1 0 0 26 20 13September .................. 140 89 102 123 19 25 5 134 62 69October ....................... 439 368 402 396 158 204 77 357 174 271November ................... 720 647 731 798 335 432 272 665 385 528December ................... 1,110 1,012 1,143 1,247 571 718 523 950 564 836Total ........................... 6,621 5,839 6,421 6,635 2,895 3,589 2,306 5,321 3,245 4,576
Cooling Degree-Day Normalsb
January ....................... 0 0 0 0 30 7 12 0 1 7February ..................... 0 0 0 0 27 4 11 2 1 7March .......................... 0 0 1 3 48 19 47 8 3 16April ............................ 0 0 1 8 72 34 109 31 13 31May ............................. 6 24 52 72 176 142 253 85 31 95June ............................ 62 121 152 199 314 298 428 214 97 208July ............................. 179 247 249 325 412 403 544 337 190 317August ........................ 148 210 201 263 391 374 528 287 193 287September .................. 25 68 69 94 259 218 349 153 122 154October ....................... 1 6 11 16 118 57 137 51 38 52November ................... 0 0 0 0 49 6 33 4 4 13December ................... 0 0 0 0 30 3 10 0 0 7Total ........................... 421 675 736 981 1,926 1,565 2,460 1,174 694 1,193
a Excludes Alaska and Hawaii.b Normals are based on calculations of data from 1961 through 1990.Notes: • Data in this table are weighted by population; see Note 6 at end
of section. • Totals may not equal sum of components due to independentrounding.
Sources: See end of section.
Energy Information Administration/Historical Monthly Energy Review 1973-199244

5. Merchandise Trade Value: Import data presentedare based on the customs value. That value does notinclude insurance and freight and is consequentlylower than the cost, insurance, and freight (CIF) value,which is also reported by the Bureau of the Census. Allexport data, and import data prior to 1981, are on a freealongside ship (f.a.s.) basis.
“Balance” is exports minus imports; a positive balanceindicates a surplus trade value and a negative balanceindicates a deficit trade value. “Energy” includes min-eral fuels, lubricants, and related material. “Non-En-ergy Balance” and “Total Merchandise” include foreignexports (i.e., re-exports) and nonmonetary gold andDepartment of Defense Grant-Aid shipments. The“Non-Energy Balance” is calculated by subtracting the“Energy” from the “Total Merchandise Balance.”
“Imports” consist of government and nongovernmentshipments of merchandise into the 50 States, the Dis-trict of Columbia, Puerto Rico, the U.S. Virgin Islands,and the U.S. Foreign Trade Zones. They reflect the totalarrival from foreign countries of merchandise that im-mediately entered consumption channels, warehouses,the Foreign Trade Zones, or the Strategic PetroleumReserve. They exclude shipments between the UnitedStates, Puerto Rico, and U.S. possessions, shipments toU.S. Armed Forces and diplomatic missions abroad fortheir own use, U.S. goods returned to the United Statesby its Armed Forces, and in-transit shipments.
6. Degree-Days: Degree-days are relative measure-ments of outdoor air temperature used as an index forheating and cooling energy requirements. Several de-gree-day databases are maintained by the NationalOceanic and Atmospheric Administration. Data pre-sented in the Historical Monthly Energy Review are de-veloped at the National Climatic Center in Asheville,NC, where temperature information recorded at nearly8,000 weather stations is used to calculate statewidedegree-day averages, weighted by population. Stateaverages are aggregated to Census Divisions and thenational average. Resident State population in 1990from the Bureau of the Census is used for weighting.
In contrast, the data presented in the Monthly EnergyReview (MER) are developed at the National WeatherService Climate Analysis Center, in Camp Springs, MD.Those data are available weekly with monthly summa-ries, based on information recorded at about 200weather stations. The monthly data published in theMER are available sooner than the data developed inAsheville.
Sources:
Table 1.1• Production: Table 1.3.
• Consumption: Table 1.4.• Imports and Exports: Data in tables 3.1b, 4.2, and 6.1were converted into Btu using the conversion factors inAppendix A, tables A2-A7. See also Section 2, “EnergyConsumption Notes and Sources,” Notes 8 and 9.• Net Imports: Table 1.5.
Table 1.2• Production: Table 1.3.• Consumption: Table 1.4.• Imports and Exports: Tables 3.1b, 4.2, 6.1, A2-A8, andSection 2, “Energy Consumption Notes and Sources,”Notes 8 and 9.• Net Imports: Table 1.5.
Table 1.3• Coal: Tables 6.1 and A5-A7.• Natural Gas (Dry): Tables 4.1 and A4.• Crude Oil and Natural Gas Plant Liquids: Tables3.1a and A2.• Nuclear Electric Power: Tables 7.1 and A8.•Hydroelectric Power: Table 7.1; Section 2, “EnergyConsumption Notes and Sources,” Note 8; and Table A8.•Geothermal Energy and Other: Section 2, “EnergyConsumption Notes and Sources,” Note 7, and Table A8.
Table 1.4• Coal: Tables 6.1 and A5-A7.• Natural Gas: Tables 4.2 and A4.• Petroleum: Tables 3.1a and A3. • Nuclear Electric Power: Tables 7.1 and A8.•Hydroelectric Power: Table 7.1; Section 2, “EnergyConsumption Notes and Sources,” Note 8; and Table A8.•Geothermal Energy and Other: Section 2, “EnergyConsumption Notes and Sources,” Note 7, and Table A8.
Table 1.5• Coal: Tables 6.1 and A5-A7.• Natural Gas: Tables 4.2 and A4.• Crude Oil and Petroleum Products: Tables 3.1b andA2.•Electricity: Section 2, “Energy Consumption Notesand Sources,” Note 8, and Table A8.•Coal Coke: Section 2, “Energy Consumption Notesand Sources,” Note 9, and Table A7.
Table 1.6
U.S. Department of Commerce, Bureau of the Census,Foreign Trade Division:
• Petroleum Exports—1974-1987: “U.S. Exports,”FT410, December issues. 1988: “Report on U.S. Mer-chandise Trade, 1988 Final Revisions.” 1989: “Reporton U.S. Merchandise Trade, 1989 Revisions.” 1990:“U.S. Merchandise Trade: 1990 Final Report.” 1991:
Energy Information Administration/Historical Monthly Energy Review 1973-1992 45
“U.S. Merchandise Trade: 1991 Final Report,” May 13,1992. 1992: “U.S. Merchandise Trade: 1992 Final Re-port,” May 12, 1993.
• Petroleum Imports—1974-1987: “U.S. MerchandiseTrade,” FT900, December issues, 1975-1988. 1988: “Re-port on U.S. Merchandise Trade, 1988 Final Revisions.”1989: “Report on U.S. Merchandise Trade, 1989 Revi-sions.” 1990: “U.S. Merchandise Trade: 1990 Final Re-port.” 1991: “U.S. Merchandise Trade: 1991 FinalReport,” May 13, 1992, and “U.S. Merchandise Trade:October 1992,” December 17, 1992, page 3. 1992: “U.S.Merchandise Trade: 1992 Final Report,” May 12, 1993.
• Energy Exports and Imports—1974-1987: U.S. mer-chandise trade press releases and database printoutsfor adjustments. 1988: January-July, monthly FT900supplement, 1989 issues. August-December, monthlyFT900, 1989 issues. 1989: Monthly FT900, 1990 issues.1990: “U.S. Merchandise Trade: 1990 Final Report.”1991: “U.S. Merchandise Trade: 1991 Final Report,”May 13, 1992, and “U.S. Merchandise Trade: October1992,” December 17, 1992, page 3. 1992: “U.S. MerchandiseTrade: 1992 Final Report,” May 12, 1993.
• Total Merchandise—1974-1987: U.S. merchandisetrade press releases and database printouts for adjust-ments. 1988: “Report on U.S. Merchandise Trade, 1988Final Revisions,” August 18, 1989. 1989: “Report onU.S. Merchandise Trade, 1989 Revisions,” July 10, 1990.1990: “U.S. Merchandise Trade: 1990 Final Report,”May 10, 1991, and “U.S. Merchandise Trade: December1992,” February 18, 1993, page 3. 1991-1992: “U.S. Mer-chandise Trade: 1992 Final Report,” May 12, 1993.
• Petroleum Balance, Energy Balance, and Non-En-ergy Balance—Calculated by the Energy InformationAdministration.
Table 1.7
•CPI: 1973-1992—Economic Report of the President,February 1994, Table B-59.
• Annual Data: Annual prices in Tables 9.4 (All Types),9.8c, 9.11, and 9.9 (Monthly Series) adjusted by the CPI.
•Monthly Data: Monthly prices in Tables 9.4 (AllTypes), 9.8c, 9.11, and 9.9 (Monthly Series) adjusted bythe CPI.
• Conversion Factors: Tables A1, A4, and A8.
Table 1.8• Imports: Tables 3.3a-3.3h.
• Exports 1973-1976—U.S. Department of the Interior,Bureau of Mines, Mineral Industry Surveys. 1977—EIA,Energy Data Reports, “Petroleum Statement, Annual.”1978-1980—EIA, Energy Data Reports, “PetroleumStatement, Annual,” and U.S. Department of Com-merce, Census Bureau, Form EM-522. 1981-1992—EIA, Petroleum Supply Annual.
• Petroleum Products Supplied: Table 3.1a.
Table 1.9
• Energy Consumption: Table 1.4.
• Gross Domestic Product: 1973-1991—U.S. Depart-ment of Commerce, Bureau of Economic Analysis,Survey of Current Business, September 1993, Table 2.1992—U.S. Department of Commerce, Bureau of Eco-nomic Analysis, United States Department of CommerceNews, March 31, 1994, Table 2.
Table 1.10
Indices are prepared from statistics published by theU.S. Department of Transportation, Federal HighwayAdministration, Federal Highway Statistics Division.
• 1973-1985—Highway Statistics Summary to 1985, TableVM-201A.
• 1986-1992—Highway Statistics, annual, Table VM-1.
Table 1.11
U.S. Department of Commerce, National Oceanic andAtmospheric Administration, National Climatic DataCenter, Asheville, NC, Historical Climatology Series 5-1.
Table 1.12
U.S. Department of Commerce, National Oceanic andAtmospheric Administration, National Climatic DataCenter, Asheville, NC, Historical Climatology Series 5-2.
Table 1.13
U.S. Department of Commerce, National Oceanic andAtmospheric Administration, National Climatic DataCenter, Asheville, NC, Historical Climatology Series 5-1and 5-2.
Energy Information Administration/Historical Monthly Energy Review 1973-199246

Section 2Energy Consumption
The transportation sector accounts for over a fourth of all energy consumed in the United States.

Table 2.1 Energy Consumption Summary, Annual Data, 1973-1992
(Quadrillion Btu)
Sector and Energy Source 1973 1974 1975 1976 1977 1978 1979 1980 1981 1982
Residential and Commercial Coal ................................................ 0.254 0.257 0.209 0.203 0.205 0.214 0.187 0.145 0.167 0.187 Natural Gas a .................................. 7.626 7.518 7.581 7.866 7.461 7.624 7.891 7.540 7.243 7.427 Petroleum ....................................... 4.391 3.996 3.805 4.181 4.206 4.070 3.448 3.035 2.634 2.449 Primary Consumption ................... 12.270 11.771 11.595 12.250 11.873 11.908 11.525 10.721 10.043 10.063 Electricity ........................................ 3.495 3.475 3.604 3.747 3.955 4.116 4.184 4.355 4.497 4.566 Net Consumption .......................... 15.766 15.246 15.200 15.997 15.828 16.023 15.709 15.075 14.541 14.629 Electrical System Energy Losses ... 8.377 R 8.480 8.700 R 9.021 R 9.556 R 10.061 R 10.100 R 10.580 R 10.700 R 11.000 Total Consumptionb ................... 24.143 R 23.725 R 23.899 R 25.018 R 25.384 R 26.084 R 25.808 R 25.655 R 25.241 R 25.629
Industrial Coal ................................................ 4.057 3.870 3.667 3.661 3.454 3.314 3.593 3.155 3.157 2.552 Natural Gas a .................................. 10.388 10.004 8.532 8.762 8.635 8.539 8.549 8.395 8.257 7.121 Petroleum ....................................... 9.104 8.694 8.146 9.010 9.774 9.867 10.568 9.525 8.285 7.794 Hydroelectric Power ....................... .035 .033 .032 .033 .033 .032 .034 .033 .033 .033 Net Imports of Coal Coke ............... -.007 .056 .014 (s) .015 .125 .063 -.035 -.016 -.022 Primary Consumption ................... 23.576 22.657 20.391 21.465 21.911 21.876 22.807 21.073 19.715 17.479 Electricity ........................................ 2.341 2.337 2.346 2.573 2.682 2.761 2.873 2.781 2.817 2.542 Net Consumption .......................... 25.917 24.994 22.737 24.038 24.593 24.637 25.679 23.854 22.533 20.020 Electrical System Energy Losses ... 5.611 R 5.700 R 5.665 R 6.198 R 6.484 R 6.755 R 6.936 R 6.752 R 6.707 R 6.125 Total Consumptionb ................... 31.528 R 30.694 R 28.402 R 30.236 R 31.077 R 31.392 R 32.616 R 30.606 R 29.240 R 26.145
Transportation Coal ................................................ .003 .002 .001 (s) (s) c(� ) c(� ) c(� ) c(� ) c(� ) Natural Gas d .................................. .743 .685 .595 .559 .543 .539 .612 .650 .658 .612 Petroleum ....................................... 17.831 17.399 17.614 18.506 19.241 20.041 19.825 19.008 18.811 18.420 Primary Consumption ................... 18.576 18.086 18.209 19.065 19.784 20.580 20.436 19.658 19.469 19.032 Electricity ........................................ .008 .009 .010 .010 .010 .009 .010 .011 .011 .011 Net Consumption .......................... 18.584 18.095 18.219 19.076 19.794 20.589 20.447 19.669 19.480 19.043 Electrical System Energy Losses ... .020 .022 .025 .025 .025 .022 .025 .026 .026 .026 Total Consumptionb ................... 18.605 18.117 18.244 19.101 19.819 20.611 20.472 19.695 19.507 19.069
End-Use Consumption Coal e ............................................. 4.313 4.129 3.877 3.864 3.660 3.527 3.779 3.300 3.323 2.739 Natural Gas e .................................. 18.764 18.213 16.708 17.194 16.647 16.704 17.053 16.584 16.160 15.163 Petroleum ....................................... 31.325 30.090 29.565 31.698 33.222 33.978 33.840 31.569 29.729 28.664 Hydroelectric Power ....................... .035 .033 .032 .033 .033 .032 .034 .033 .033 .033 Net Imports of Coal Coke ............... -.007 .056 .014 (s) .015 .125 .063 -.035 -.016 -.022 Primary Consumption ................... 54.430 52.521 50.196 52.788 53.575 54.365 54.770 51.451 49.230 46.578 Electricity ........................................ 5.844 5.821 5.961 6.330 6.648 6.885 7.067 7.146 7.326 7.119 Net Consumption .......................... 60.274 58.341 56.157 59.119 60.223 61.251 61.836 58.597 56.556 53.697 Electrical System Energy Losses ... 14.008 14.202 14.389 15.243 16.065 16.838 17.061 17.359 17.434 17.151 Total Consumptionb ................... 74.282 72.543 70.546 74.362 76.288 78.089 78.898 75.955 73.990 70.848
Electric Utilities Coal ................................................ 8.658 8.534 8.786 9.720 10.262 10.238 11.260 12.123 12.583 12.582 Natural Gas a .................................. 3.748 3.519 3.240 3.152 3.284 3.297 3.613 3.810 3.768 3.342 Petroleum f ..................................... 3.515 3.365 3.166 3.477 3.901 3.987 3.283 2.634 2.202 1.568 Nuclear Electric Power ................... .910 1.272 1.900 2.111 2.702 3.024 2.776 2.739 3.008 3.131 Hydroelectric Power g ..................... 2.975 3.276 3.187 3.032 2.482 3.110 3.107 3.085 3.072 3.539 Geothermal ..................................... .043 .053 .070 .078 .077 .064 .084 .110 .123 .105 Other h ............................................ .003 .003 .002 .003 .005 .003 .005 .005 .004 .003 Total ............................................. 19.852 20.022 20.350 21.574 22.713 23.724 24.128 24.505 24.760 24.270
All Sectors Coal ................................................ 12.971 12.663 12.663 13.584 13.922 13.765 15.039 15.423 15.907 15.322 Natural Gas a .................................. 22.512 21.732 19.948 20.345 19.931 20.000 20.666 20.394 19.928 18.505 Petroleum ....................................... 34.840 33.455 32.731 35.175 37.122 37.965 37.123 34.202 31.931 30.231 Nuclear Electric Power ................... .910 1.272 1.900 2.111 2.702 3.024 2.776 2.739 3.008 3.131 Hydroelectric Power i ...................... 3.010 3.309 3.219 3.066 2.515 3.141 3.141 3.118 3.105 3.572 Geothermal ..................................... .043 .053 .070 .078 .077 .064 .084 .110 .123 .105 Net Imports of Coal Coke ............... -.007 .056 .014 (s) .015 .125 .063 -.035 -.016 -.022 Other h ............................................ .003 .003 .002 .003 .005 .003 .005 .005 .004 .003 Primary Consumptionb .............. 74.282 72.543 70.546 74.362 76.288 78.089 78.898 75.955 73.990 70.848
See footnotes at end of table.
Energy Information Administration/Historical Monthly Energy Review 1973-1992 49

Table 2.1 Energy Consumption Summary, Annual Data, 1973-1992 (Continued)
(Quadrillion Btu)
Sector and Energy Source 1983 1984 1985 1986 1987 1988 1989 1990 1991 1992
Residential and Commercial Coal ................................................ 0.192 0.209 0.176 0.176 0.162 0.168 0.146 0.156 0.141 0.142 Natural Gas a .................................. 7.024 7.292 7.079 6.825 6.954 7.513 7.731 7.225 7.510 7.726 Petroleum ....................................... 2.498 R 2.535 R 2.522 R 2.555 R 2.587 R 2.600 2.525 2.173 2.154 2.126 Primary Consumption ................... 9.715 R 10.036 R 9.777 R 9.556 R 9.703 R 10.280 10.402 9.553 9.805 9.993 Electricity ........................................ 4.680 4.928 5.061 5.235 5.443 5.724 5.859 6.015 6.180 6.096 Net Consumption .......................... 14.395 R 14.964 R 14.839 R 14.791 R 15.146 R 16.004 16.261 15.568 15.986 16.090 Electrical System Energy Losses ... R 11.232 R 11.510 R 11.865 R 12.061 R 12.477 R 12.920 13.143 13.218 13.439 13.010 Total Consumptionb ................... R 25.627 R 26.474 R 26.704 R 26.852 R 27.623 R 28.925 29.404 28.786 29.424 29.100
Industrial Coal ................................................ 2.490 2.842 2.760 R 2.640 2.673 2.828 2.787 2.756 2.601 2.515 Natural Gas a .................................. 6.826 7.448 7.080 6.690 7.323 7.696 8.131 8.502 8.619 8.967 Petroleum ....................................... 7.420 R 8.014 R 7.805 R 7.920 R 8.150 R 8.430 8.133 8.319 8.057 8.638 Hydroelectric Power ....................... .033 .033 .033 R .033 R .033 R .033 .033 .033 .033 .033 Net Imports of Coal Coke ............... -.016 -.011 -.013 -.017 .009 .040 .030 .005 .009 .027 Primary Consumption ................... 16.753 R 18.325 R 17.665 R 17.267 R 18.188 R 19.026 19.113 19.615 19.319 20.180 Electricity ........................................ 2.648 2.859 2.855 2.834 2.928 3.059 3.158 3.226 3.230 3.319 Net Consumption .......................... 19.401 R 21.184 R 20.520 R 20.101 R 21.116 R 22.085 22.272 22.841 22.549 23.498 Electrical System Energy Losses ... R 6.359 R 6.683 R 6.694 R 6.529 R 6.710 R 6.901 7.082 7.095 7.021 7.079 Total Consumptionb ................... R 25.759 R 27.867 R 27.214 R 26.630 R 27.826 R 28.986 29.353 29.936 29.570 30.577
Transportation Coal ................................................ c(� ) c(� ) c(� ) c(� ) c(� ) c(� ) c(� ) c(� ) c(� ) c(� ) Natural Gas d .................................. .505 .545 .519 .499 .535 .632 .649 .680 .620 .606 Petroleum ....................................... 18.593 R 19.216 R 19.504 R 20.269 R 20.871 R 21.629 21.868 21.810 21.456 21.812 Primary Consumption ................... 19.098 R 19.761 R 20.024 R 20.768 R 21.406 R 22.260 22.517 22.490 22.076 22.418 Electricity ........................................ .011 .012 .013 .013 .013 .014 .014 .014 .014 .014 Net Consumption .......................... 19.109 R 19.773 R 20.036 R 20.781 R 21.419 R 22.274 22.530 22.504 22.090 22.432 Electrical System Energy Losses ... .026 .028 .030 R .031 .029 .031 .031 .031 .030 .029 Total Consumptionb ................... 19.135 R 19.801 R 20.067 R 20.812 R 21.448 R 22.305 22.561 22.535 22.120 22.461
End-Use Consumption Coal e ............................................. 2.682 3.051 2.936 R 2.817 2.835 2.996 2.938 2.912 2.742 2.657 Natural Gas e .................................. 14.359 15.287 14.674 14.017 14.809 15.843 16.513 16.414 16.750 17.304 Petroleum ....................................... 28.510 29.765 29.832 30.744 31.608 32.659 32.526 32.302 31.668 32.576 Hydroelectric Power ....................... .033 .033 .033 R .033 R .033 R .033 .033 .033 .033 .033 Net Imports of Coal Coke ............... -.016 -.011 -.013 -.017 .009 .040 .030 .005 .009 .027 Primary Consumption ................... 45.568 48.124 R 47.462 R 47.594 R 49.294 R 51.569 52.039 51.666 51.202 52.597 Electricity ........................................ 7.339 7.799 7.929 8.082 8.384 8.796 9.031 9.255 9.424 9.429 Net Consumption .......................... 52.907 55.923 55.391 R 55.676 57.678 60.366 61.070 60.921 60.626 62.025 Electrical System Energy Losses ... 17.617 R 18.221 R 18.589 R 18.620 R 19.216 R 19.852 20.255 20.343 20.491 20.119 Total Consumptionb ................... 70.524 R 74.144 R 73.981 R 74.297 R 76.894 R 80.218 81.325 81.265 81.116 82.144
Electric Utilities Coal ................................................ 13.213 14.020 14.542 14.444 15.173 15.850 15.988 16.189 16.028 16.211 Natural Gas a .................................. 2.998 3.220 3.160 2.691 2.935 2.709 2.871 2.882 2.856 2.826 Petroleum f ..................................... 1.544 1.286 1.090 1.452 1.257 1.563 1.685 1.250 1.178 .951 Nuclear Electric Power ................... 3.203 3.553 4.149 4.471 4.906 5.661 5.677 6.161 6.579 6.607 Hydroelectric Power g ..................... 3.866 R 3.767 R 3.365 R 3.413 R 3.084 R 2.630 2.848 2.914 3.083 2.760 Geothermal ..................................... .129 .165 .198 .219 .229 .217 .197 .181 .170 .170 Other h ............................................ .004 .009 .015 .012 .016 .017 .020 .021 .021 .022 Total ............................................. 24.956 R 26.020 R 26.519 R 26.703 R 27.600 R 28.648 29.286 29.599 29.915 29.547
All Sectors Coal ................................................ 15.894 R 17.071 17.478 R 17.261 18.008 18.846 18.925 19.101 18.770 18.868 Natural Gas a .................................. 17.357 18.507 17.834 16.708 17.744 18.552 19.384 19.296 19.606 20.131 Petroleum ....................................... 30.054 31.051 30.922 32.196 32.865 34.222 34.211 33.553 32.845 33.527 Nuclear Electric Power ................... 3.203 3.553 4.149 4.471 4.906 5.661 5.677 6.161 6.579 6.607 Hydroelectric Power i ...................... 3.899 R 3.800 R 3.398 R 3.446 R 3.117 R 2.662 2.881 2.946 3.115 2.793 Geothermal ..................................... .129 .165 .198 .219 .229 .217 .197 .181 .170 .170 Net Imports of Coal Coke ............... -.016 -.011 -.013 -.017 .009 .040 .030 .005 .009 .027 Other h ............................................ .004 .009 .015 .012 .016 .017 .020 .021 .021 .022 Primary Consumptionb .............. 70.524 R 74.144 R 73.981 R 74.297 R 76.894 R 80.218 81.325 81.265 81.116 82.144
a Includes supplemental gaseous fuels.b Due to a lack of consistent historical data, some renewable energy
sources are not included. For example, in 1991, 3.3 quadrillion Btu ofrenewable energy consumed by U.S. electric utilities to generate electricity fordistribution is included, but an estimated 3.4 quadrillion Btu of renewableenergy used by other sectors is not included.
c Since 1978, the small amounts of coal consumed for transportation havebeen reported as industrial sector consumption.
d Pipeline fuel only, including supplemental gaseous fuels.e Totals may not equal sum of sectors due to the use of sector-specific
conversion factors.f Includes residual and distillate fuel oils, petroleum coke, and small
amounts of kerosene and jet fuel.g Includes net imports of electricity.h "Other" is electricity generated for distribution from wood, waste, wind,
photovoltaic, and solar thermal energy.i Electric utility and industrial production and net imports of electricity.
R=Revised data. (s)=Less than +0.5 trillion Btu and greater than -0.5trillion Btu.
Notes: • Totals may not equal sum of components due to independentrounding. • Geographic coverage is the 50 States and the District ofColumbia.
Additional Notes and Sources: See end of section.
Energy Information Administration/Historical Monthly Energy Review 1973-199250

Table 2.2 Energy Consumption by End-Use Sector, 1973-1992
(Quadrillion Btu)
Residential and Commercial Industrial Transportation
Net TotalaNet Total Net Total Net Total
1973January ....................... R 2.242 R 2.986 R 2.164 R 2.626 1.501 1.503 5.910 7.118February ..................... R 2.032 R 2.666 R 2.003 R 2.412 1.409 1.411 5.446 6.491March .......................... R 1.705 R 2.356 R 2.056 R 2.505 1.541 1.543 5.301 6.403April ............................ R 1.297 R 1.888 R 2.013 R 2.452 1.499 1.500 4.807 5.839May ............................. R 1.055 R 1.685 R 2.170 R 2.652 1.622 1.623 4.845 5.958June ............................ R .865 R 1.597 R 2.020 R 2.527 1.557 1.559 4.442 5.683July ............................. R .817 R 1.651 R 2.058 R 2.559 1.615 1.617 4.491 5.828August ........................ R .849 R 1.700 R 2.190 R 2.700 1.661 1.663 4.702 6.065September .................. R .875 R 1.583 R 2.130 R 2.558 1.509 1.510 4.515 5.653October ....................... R .987 R 1.660 R 2.328 R 2.805 1.594 1.596 4.909 6.060November ................... R 1.336 R 1.973 R 2.413 R 2.881 1.553 1.554 5.303 6.410December ................... R 1.705 R 2.397 R 2.371 R 2.850 1.524 1.526 5.603 6.775Total ........................... 15.766 24.143 25.917 31.528 18.584 18.605 60.274 74.282
1974January ....................... R 2.110 R 2.835 R 2.085 R 2.541 1.410 1.412 5.606 6.788February ..................... R 1.819 R 2.446 R 2.022 R 2.443 1.314 1.316 5.154 6.204March .......................... R 1.605 R 2.272 R 2.041 R 2.507 1.477 1.479 5.122 6.258April ............................ R 1.327 R 1.943 R 1.891 R 2.342 1.467 1.469 4.681 5.750May ............................. R .997 R 1.672 R 1.993 R 2.503 1.573 1.575 4.562 5.748June ............................ R .859 R 1.565 R 1.942 R 2.427 1.535 1.537 4.336 5.528July ............................. R .823 R 1.690 R 2.036 R 2.568 1.598 1.600 4.460 5.861August ........................ R .819 R 1.650 R 2.121 R 2.625 1.615 1.617 4.557 5.893September .................. R .862 R 1.538 R 2.141 R 2.575 1.482 1.483 4.484 5.595October ....................... R 1.017 R 1.678 R 2.323 R 2.813 1.573 1.574 4.912 6.065November ................... R 1.226 R 1.888 R 2.252 R 2.735 1.495 1.497 4.978 6.124December ................... R 1.782 R 2.550 R 2.145 R 2.615 1.555 1.557 5.491 6.730Total ........................... 15.246 R 23.725 24.994 R 30.694 18.095 18.117 58.341 72.543
1975January ....................... R 1.947 R 2.714 R 2.255 R 2.724 1.487 1.489 5.691 6.929February ..................... R 1.849 R 2.504 R 1.803 R 2.217 1.334 1.336 4.985 6.056March .......................... R 1.693 R 2.396 R 1.927 R 2.386 1.484 1.486 5.100 6.264April ............................ R 1.513 R 2.156 R 1.593 R 2.031 1.502 1.503 4.603 5.686May ............................. R 1.020 R 1.699 R 1.628 R 2.117 1.560 1.562 4.203 5.373June ............................ R .844 R 1.591 R 1.677 R 2.171 1.552 1.554 4.072 5.314July ............................. R .825 R 1.686 R 1.778 R 2.276 1.585 1.587 4.190 5.551August ........................ R .827 R 1.696 R 1.825 R 2.327 1.600 1.602 4.257 5.630September .................. R .864 R 1.551 R 1.894 R 2.312 1.519 1.520 4.277 5.384October ....................... R .946 R 1.612 R 2.122 R 2.611 1.571 1.573 4.639 5.797November ................... R 1.118 R 1.769 R 2.030 R 2.514 1.457 1.460 4.607 5.744December ................... R 1.753 R 2.526 R 2.206 R 2.716 1.569 1.571 5.533 6.818Total ........................... 15.200 R 23.899 22.737 R 28.402 18.219 18.244 56.157 70.546
1976January ....................... R 2.216 R 3.067 R 2.105 R 2.596 1.515 1.518 5.841 7.185February ..................... R 1.914 R 2.610 R 1.807 R 2.245 1.406 1.408 5.128 6.263March .......................... R 1.574 R 2.286 R 1.857 R 2.370 1.600 1.602 5.030 6.257April ............................ R 1.245 R 1.880 R 1.780 R 2.260 1.592 1.594 4.614 5.731May ............................. R 1.032 R 1.686 R 1.879 R 2.395 1.580 1.582 4.487 5.660June ............................ R .896 R 1.652 R 1.833 R 2.401 1.639 1.641 4.367 5.693July ............................. R .845 R 1.715 R 1.937 R 2.494 1.675 1.678 4.459 5.887August ........................ R .838 R 1.701 R 1.949 R 2.492 1.633 1.635 4.424 5.832September .................. R .858 R 1.572 R 1.974 R 2.449 1.587 1.589 4.419 5.609October ....................... R 1.005 R 1.700 R 2.296 R 2.826 1.594 1.596 4.895 6.121November ................... R 1.504 R 2.233 R 2.237 R 2.780 1.585 1.587 5.328 6.602December ................... R 2.072 R 2.918 R 2.382 R 2.928 1.668 1.671 6.127 7.521Total ........................... 15.997 R 25.018 24.038 R 30.236 19.076 19.101 59.119 74.362
1977January ....................... R 2.467 R 3.422 R 2.165 R 2.710 1.570 1.572 6.207 7.710February ..................... R 2.124 R 2.851 R 1.761 R 2.192 1.487 1.489 5.372 6.532March .......................... R 1.539 R 2.279 R 1.992 R 2.513 1.642 1.645 5.170 6.433April ............................ R 1.189 R 1.844 R 1.861 R 2.369 1.641 1.643 4.686 5.851May ............................. R .957 R 1.673 R 1.961 R 2.546 1.640 1.642 4.554 5.857June ............................ R .873 R 1.674 R 1.999 R 2.585 1.687 1.689 4.557 5.946July ............................. R .865 R 1.830 R 1.929 R 2.510 1.706 1.709 4.504 6.052August ........................ R .868 R 1.797 R 2.050 R 2.615 1.731 1.733 4.653 6.149September .................. R .867 R 1.657 R 2.113 R 2.623 1.654 1.656 4.638 5.939October ....................... R 1.006 R 1.714 R 2.235 R 2.757 1.668 1.670 4.908 6.140November ................... 1.228 1.943 2.224 2.778 1.640 1.642 5.094 6.365December ................... R 1.844 R 2.701 R 2.304 R 2.878 1.728 1.731 5.882 7.314Total ........................... 15.828 R 25.384 24.593 R 31.077 19.794 19.819 60.223 76.288
See footnotes at end of table.
Energy Information Administration/Historical Monthly Energy Review 1973-1992 51
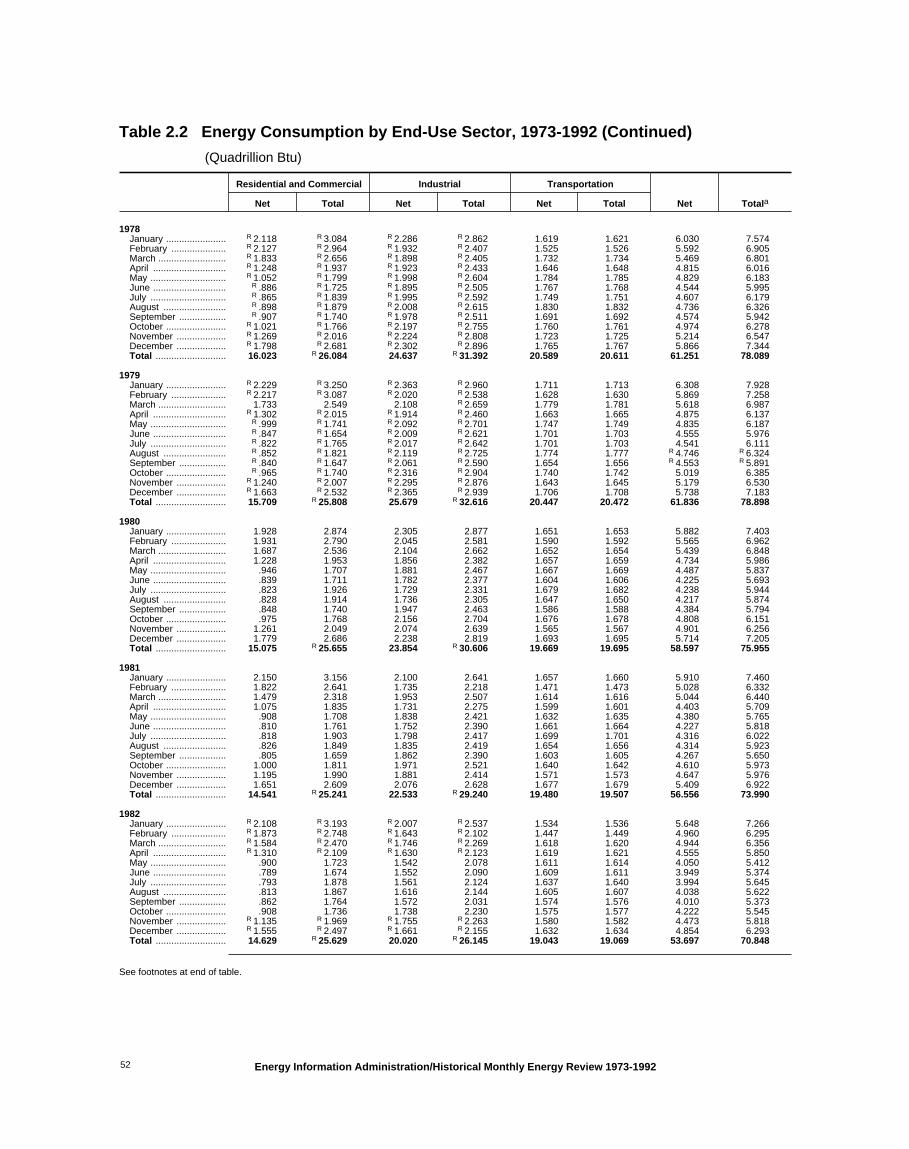
Table 2.2 Energy Consumption by End-Use Sector, 1973-1992 (Continued)
(Quadrillion Btu)
Residential and Commercial Industrial Transportation
Net TotalaNet Total Net Total Net Total
1978January ....................... R 2.118 R 3.084 R 2.286 R 2.862 1.619 1.621 6.030 7.574February ..................... R 2.127 R 2.964 R 1.932 R 2.407 1.525 1.526 5.592 6.905March .......................... R 1.833 R 2.656 R 1.898 R 2.405 1.732 1.734 5.469 6.801April ............................ R 1.248 R 1.937 R 1.923 R 2.433 1.646 1.648 4.815 6.016May ............................. R 1.052 R 1.799 R 1.998 R 2.604 1.784 1.785 4.829 6.183June ............................ R .886 R 1.725 R 1.895 R 2.505 1.767 1.768 4.544 5.995July ............................. R .865 R 1.839 R 1.995 R 2.592 1.749 1.751 4.607 6.179August ........................ R .898 R 1.879 R 2.008 R 2.615 1.830 1.832 4.736 6.326September .................. R .907 R 1.740 R 1.978 R 2.511 1.691 1.692 4.574 5.942October ....................... R 1.021 R 1.766 R 2.197 R 2.755 1.760 1.761 4.974 6.278November ................... R 1.269 R 2.016 R 2.224 R 2.808 1.723 1.725 5.214 6.547December ................... R 1.798 R 2.681 R 2.302 R 2.896 1.765 1.767 5.866 7.344Total ........................... 16.023 R 26.084 24.637 R 31.392 20.589 20.611 61.251 78.089
1979January ....................... R 2.229 R 3.250 R 2.363 R 2.960 1.711 1.713 6.308 7.928February ..................... R 2.217 R 3.087 R 2.020 R 2.538 1.628 1.630 5.869 7.258March .......................... 1.733 2.549 2.108 R 2.659 1.779 1.781 5.618 6.987April ............................ R 1.302 R 2.015 R 1.914 R 2.460 1.663 1.665 4.875 6.137May ............................. R .999 R 1.741 R 2.092 R 2.701 1.747 1.749 4.835 6.187June ............................ R .847 R 1.654 R 2.009 R 2.621 1.701 1.703 4.555 5.976July ............................. R .822 R 1.765 R 2.017 R 2.642 1.701 1.703 4.541 6.111August ........................ R .852 R 1.821 R 2.119 R 2.725 1.774 1.777 R 4.746 R 6.324September .................. R .840 R 1.647 R 2.061 R 2.590 1.654 1.656 R 4.553 R 5.891October ....................... R .965 R 1.740 R 2.316 R 2.904 1.740 1.742 5.019 6.385November ................... R 1.240 R 2.007 R 2.295 R 2.876 1.643 1.645 5.179 6.530December ................... R 1.663 R 2.532 R 2.365 R 2.939 1.706 1.708 5.738 7.183Total ........................... 15.709 R 25.808 25.679 R 32.616 20.447 20.472 61.836 78.898
1980January ....................... 1.928 2.874 2.305 2.877 1.651 1.653 5.882 7.403February ..................... 1.931 2.790 2.045 2.581 1.590 1.592 5.565 6.962March .......................... 1.687 2.536 2.104 2.662 1.652 1.654 5.439 6.848April ............................ 1.228 1.953 1.856 2.382 1.657 1.659 4.734 5.986May ............................. .946 1.707 1.881 2.467 1.667 1.669 4.487 5.837June ............................ .839 1.711 1.782 2.377 1.604 1.606 4.225 5.693July ............................. .823 1.926 1.729 2.331 1.679 1.682 4.238 5.944August ........................ .828 1.914 1.736 2.305 1.647 1.650 4.217 5.874September .................. .848 1.740 1.947 2.463 1.586 1.588 4.384 5.794October ....................... .975 1.768 2.156 2.704 1.676 1.678 4.808 6.151November ................... 1.261 2.049 2.074 2.639 1.565 1.567 4.901 6.256December ................... 1.779 2.686 2.238 2.819 1.693 1.695 5.714 7.205Total ........................... 15.075 R 25.655 23.854 R 30.606 19.669 19.695 58.597 75.955
1981January ....................... 2.150 3.156 2.100 2.641 1.657 1.660 5.910 7.460February ..................... 1.822 2.641 1.735 2.218 1.471 1.473 5.028 6.332March .......................... 1.479 2.318 1.953 2.507 1.614 1.616 5.044 6.440April ............................ 1.075 1.835 1.731 2.275 1.599 1.601 4.403 5.709May ............................. .908 1.708 1.838 2.421 1.632 1.635 4.380 5.765June ............................ .810 1.761 1.752 2.390 1.661 1.664 4.227 5.818July ............................. .818 1.903 1.798 2.417 1.699 1.701 4.316 6.022August ........................ .826 1.849 1.835 2.419 1.654 1.656 4.314 5.923September .................. .805 1.659 1.862 2.390 1.603 1.605 4.267 5.650October ....................... 1.000 1.811 1.971 2.521 1.640 1.642 4.610 5.973November ................... 1.195 1.990 1.881 2.414 1.571 1.573 4.647 5.976December ................... 1.651 2.609 2.076 2.628 1.677 1.679 5.409 6.922Total ........................... 14.541 R 25.241 22.533 R 29.240 19.480 19.507 56.556 73.990
1982January ....................... R 2.108 R 3.193 R 2.007 R 2.537 1.534 1.536 5.648 7.266February ..................... R 1.873 R 2.748 R 1.643 R 2.102 1.447 1.449 4.960 6.295March .......................... R 1.584 R 2.470 R 1.746 R 2.269 1.618 1.620 4.944 6.356April ............................ R 1.310 R 2.109 R 1.630 R 2.123 1.619 1.621 4.555 5.850May ............................. .900 1.723 1.542 2.078 1.611 1.614 4.050 5.412June ............................ .789 1.674 1.552 2.090 1.609 1.611 3.949 5.374July ............................. .793 1.878 1.561 2.124 1.637 1.640 3.994 5.645August ........................ .813 1.867 1.616 2.144 1.605 1.607 4.038 5.622September .................. .862 1.764 1.572 2.031 1.574 1.576 4.010 5.373October ....................... .908 1.736 1.738 2.230 1.575 1.577 4.222 5.545November ................... R 1.135 R 1.969 R 1.755 R 2.263 1.580 1.582 4.473 5.818December ................... R 1.555 R 2.497 R 1.661 R 2.155 1.632 1.634 4.854 6.293Total ........................... 14.629 R 25.629 20.020 R 26.145 19.043 19.069 53.697 70.848
See footnotes at end of table.
Energy Information Administration/Historical Monthly Energy Review 1973-199252

Table 2.2 Energy Consumption by End-Use Sector, 1973-1992 (Continued)
(Quadrillion Btu)
Residential and Commercial Industrial Transportation
Net TotalaNet Total Net Total Net Total
1983January ....................... R 2.029 R 3.033 R 1.697 R 2.179 R 1.496 R 1.498 R 5.223 R 6.712February ..................... R 1.686 R 2.519 R 1.565 R 1.996 R 1.368 R 1.370 R 4.619 R 5.884March .......................... R 1.530 R 2.417 R 1.627 R 2.126 R 1.653 R 1.656 R 4.811 R 6.199April ............................ R 1.283 R 2.086 R 1.573 R 2.045 R 1.536 R 1.538 R 4.388 R 5.665May ............................. R .938 R 1.749 R 1.620 R 2.151 R 1.605 R 1.607 R 4.162 R 5.505June ............................ R .807 R 1.712 R 1.565 R 2.134 R 1.647 R 1.649 R 4.022 R 5.499July ............................. R .830 R 1.954 R 1.548 R 2.134 R 1.656 R 1.659 R 4.038 R 5.750August ........................ R .874 R 2.047 R 1.568 R 2.158 R 1.681 R 1.683 R 4.127 R 5.893September .................. R .859 R 1.801 R 1.582 R 2.079 R 1.601 R 1.603 R 4.044 R 5.484October ....................... R .873 R 1.715 R 1.632 R 2.174 R 1.616 R 1.618 R 4.120 R 5.506November ................... R 1.098 R 1.940 R 1.714 R 2.268 R 1.557 R 1.559 R 4.367 R 5.764December ................... R 1.588 R 2.655 R 1.708 R 2.316 R 1.691 R 1.693 R 4.986 R 6.663Total ........................... 14.395 R 25.627 19.401 R 25.759 19.109 19.135 52.907 70.524
1984January ....................... R 2.201 R 3.304 R 2.030 R 2.552 R 1.589 R 1.591 R 5.823 R 7.450February ..................... R 1.754 R 2.655 R 1.821 R 2.312 R 1.467 R 1.469 R 5.041 R 6.436March .......................... R 1.622 2.562 R 1.894 R 2.455 R 1.626 R 1.628 5.142 R 6.645April ............................ R 1.309 R 2.118 R 1.811 R 2.334 R 1.614 R 1.616 4.728 R 6.063May ............................. R 1.008 R 1.884 R 1.783 R 2.373 R 1.705 R 1.707 R 4.491 R 5.960June ............................ R .849 R 1.834 R 1.672 R 2.287 R 1.688 R 1.691 R 4.210 R 5.814July ............................. R .856 R 1.954 R 1.675 R 2.268 R 1.719 R 1.721 R 4.253 R 5.946August ........................ R .873 R 2.011 R 1.695 R 2.323 R 1.777 R 1.779 R 4.348 R 6.117September .................. R .870 R 1.788 R 1.644 R 2.156 R 1.612 R 1.615 4.126 R 5.558October ....................... R .900 R 1.780 R 1.732 R 2.291 R 1.691 R 1.694 4.325 R 5.766November ................... R 1.144 R 2.027 R 1.694 R 2.245 R 1.631 R 1.633 4.471 R 5.907December ................... R 1.577 R 2.556 R 1.733 R 2.271 R 1.654 R 1.656 4.965 R 6.484Total ........................... R 14.964 R 26.474 R 21.184 R 27.867 R 19.773 R 19.801 55.923 R 74.144
1985January ....................... R 1.922 R 3.071 R 1.925 R 2.510 R 1.603 R 1.606 R 5.453 R 7.189February ..................... R 2.027 R 2.976 R 1.765 R 2.242 R 1.481 R 1.483 R 5.273 R 6.701March .......................... R 1.524 R 2.442 R 1.745 R 2.280 R 1.658 R 1.660 R 4.926 R 6.381April ............................ R 1.184 R 2.008 R 1.697 R 2.224 R 1.674 R 1.676 R 4.549 R 5.902May ............................. R .887 R 1.782 R 1.689 R 2.283 R 1.730 R 1.733 R 4.303 R 5.795June ............................ R .831 R 1.811 R 1.606 R 2.192 R 1.674 R 1.677 R 4.112 R 5.681July ............................. R .857 R 2.001 R 1.624 R 2.228 R 1.749 R 1.752 R 4.232 R 5.983August ........................ R .872 R 2.004 R 1.657 R 2.252 R 1.790 R 1.793 R 4.320 R 6.050September .................. R .879 R 1.841 R 1.591 R 2.105 R 1.616 R 1.618 R 4.085 R 5.564October ....................... R .941 R 1.845 R 1.713 R 2.268 R 1.720 R 1.723 R 4.374 R 5.836November ................... R 1.122 R 2.026 R 1.654 R 2.205 R 1.633 R 1.635 R 4.408 R 5.866December ................... R 1.792 2.896 R 1.854 R 2.423 R 1.709 R 1.712 R 5.357 R 7.034Total ........................... R 14.839 R 26.704 R 20.520 R 27.214 R 20.036 R 20.067 55.391 R 73.981
1986January ....................... R 2.033 R 3.131 R 1.931 R 2.448 R 1.645 R 1.647 R 5.609 R 7.225February ..................... 1.793 R 2.710 R 1.774 R 2.256 R 1.488 R 1.490 R 5.054 R 6.456March .......................... 1.572 R 2.491 R 1.834 R 2.362 R 1.727 R 1.729 R 5.130 R 6.579April ............................ R 1.149 R 1.988 R 1.689 R 2.215 R 1.708 R 1.710 R 4.540 R 5.907May ............................. R .942 R 1.854 R 1.677 R 2.260 R 1.773 R 1.775 R 4.387 R 5.885June ............................ R .855 1.899 R 1.573 R 2.146 R 1.755 R 1.757 R 4.183 R 5.803July ............................. R .901 R 2.160 R 1.522 R 2.122 R 1.850 R 1.853 R 4.279 R 6.141August ........................ R .903 R 2.044 R 1.557 R 2.104 R 1.859 R 1.862 R 4.324 R 6.015September .................. R .863 R 1.859 R 1.534 R 2.069 R 1.693 R 1.695 R 4.092 R 5.626October ....................... R .955 1.883 R 1.633 R 2.173 R 1.796 R 1.799 R 4.386 R 5.856November ................... R 1.166 2.104 R 1.602 R 2.152 R 1.688 R 1.690 R 4.457 R 5.948December ................... R 1.658 R 2.728 R 1.776 R 2.322 R 1.799 R 1.802 R 5.236 R 6.855Total ........................... R 14.791 R 26.852 R 20.101 R 26.630 R 20.781 R 20.812 R 55.676 R 74.297
1987January ....................... R 1.944 R 3.088 R 1.999 R 2.531 R 1.683 R 1.685 R 5.628 R 7.307February ..................... R 1.787 R 2.726 R 1.799 R 2.271 R 1.577 R 1.579 R 5.163 R 6.576March .......................... R 1.589 R 2.559 R 1.724 R 2.260 R 1.771 R 1.773 R 5.085 R 6.593April ............................ R 1.235 R 2.117 R 1.729 R 2.256 R 1.772 R 1.774 R 4.732 R 6.143May ............................. R .953 R 1.927 R 1.641 R 2.228 R 1.850 R 1.852 R 4.442 R 6.006June ............................ R .886 1.991 R 1.669 R 2.274 R 1.822 R 1.825 R 4.381 6.094July ............................. R .943 R 2.214 R 1.711 R 2.325 R 1.895 R 1.897 R 4.552 R 6.440August ........................ R .935 2.191 R 1.670 R 2.265 R 1.865 R 1.868 R 4.473 R 6.326September .................. R .919 R 1.921 R 1.719 R 2.258 R 1.759 R 1.761 R 4.396 R 5.939October ....................... R 1.046 R 1.971 R 1.801 R 2.361 R 1.851 R 1.853 R 4.695 R 6.182November ................... R 1.225 2.149 R 1.725 R 2.288 R 1.740 R 1.743 R 4.687 R 6.176December ................... R 1.683 R 2.770 R 1.929 R 2.507 R 1.835 R 1.838 R 5.445 R 7.112Total ........................... R 15.146 R 27.623 R 21.116 R 27.826 R 21.419 R 21.448 57.678 R 76.894
See footnotes at end of table.
Energy Information Administration/Historical Monthly Energy Review 1973-1992 53

Table 2.2 Energy Consumption by End-Use Sector, 1973-1992 (Continued)
(Quadrillion Btu)
Residential and Commercial Industrial Transportation
Net TotalaNet Total Net Total Net Total
1988January ....................... R 2.159 R 3.356 R 1.928 R 2.479 R 1.780 R 1.783 5.869 R 7.619February ..................... R 1.951 R 2.981 R 1.917 R 2.434 R 1.712 R 1.714 5.580 R 7.129March .......................... R 1.662 R 2.672 R 2.001 R 2.554 R 1.869 R 1.872 5.530 R 7.095April ............................ R 1.252 R 2.147 R 1.735 R 2.268 R 1.827 R 1.830 R 4.811 R 6.242May ............................. R 1.014 R 1.963 R 1.739 R 2.336 R 1.875 R 1.877 4.626 R 6.174June ............................ R .913 R 2.031 R 1.725 R 2.351 R 1.908 R 1.911 4.550 R 6.297July ............................. R .982 R 2.296 R 1.689 R 2.313 R 1.919 R 1.922 4.594 R 6.535August ........................ R 1.018 R 2.378 R 1.810 R 2.445 R 1.938 R 1.941 4.771 R 6.770September .................. R .948 R 1.975 R 1.785 R 2.322 R 1.838 R 1.840 4.571 R 6.138October ....................... R 1.059 R 2.013 R 1.908 R 2.477 R 1.886 R 1.889 4.852 R 6.377November ................... R 1.296 R 2.248 R 1.861 R 2.428 R 1.827 R 1.830 R 4.982 R 6.503December ................... R 1.749 R 2.866 R 1.987 R 2.577 R 1.894 R 1.896 5.630 R 7.339Total ........................... R 16.004 R 28.925 R 22.085 R 28.986 R 22.274 R 22.305 60.366 R 80.218
1989January ....................... 1.963 3.085 1.945 2.500 1.799 1.802 5.708 7.388February ..................... 1.887 2.928 1.832 2.370 1.693 1.695 5.412 6.993March .......................... 1.760 2.828 1.948 2.508 1.926 1.928 5.631 7.262April ............................ 1.297 2.226 1.810 2.359 1.801 1.803 4.905 6.385May ............................. 1.030 2.034 1.802 2.423 1.903 1.906 4.735 6.362June ............................ .949 2.060 1.783 2.403 1.941 1.943 4.674 6.408July ............................. .966 2.260 1.744 2.378 1.910 1.913 4.623 6.554August ........................ .989 2.260 1.812 2.448 1.993 1.996 4.800 6.709September .................. .972 2.024 1.769 2.322 1.840 1.843 4.583 6.190October ....................... 1.053 2.040 1.943 2.537 1.908 1.911 4.903 6.486November ................... 1.329 2.315 1.882 2.471 1.855 1.857 5.065 6.643December ................... 2.066 3.344 2.001 2.634 1.962 1.964 6.032 7.945Total ........................... 16.261 29.404 22.272 29.353 22.530 22.561 61.070 81.325
1990January ....................... 2.014 3.172 2.024 2.551 1.819 1.822 5.858 7.546February ..................... 1.689 2.670 1.835 2.364 1.718 1.720 5.240 6.753March .......................... 1.545 2.585 1.942 2.526 1.920 1.923 5.406 7.033April ............................ 1.275 2.219 1.882 2.442 1.838 1.840 4.993 6.500May ............................. 1.026 2.037 1.901 2.518 1.928 1.931 4.854 6.484June ............................ .957 2.136 1.808 2.460 1.894 1.897 4.661 6.495July ............................. 1.010 2.335 1.829 2.461 1.949 1.952 4.791 6.751August ........................ 1.006 2.324 1.955 2.615 2.019 2.022 4.984 6.966September .................. 1.001 2.121 1.849 2.409 1.796 1.798 4.649 6.330October ....................... 1.050 2.070 1.976 2.573 1.912 1.915 4.938 6.558November ................... 1.272 2.235 1.894 2.461 1.849 1.851 5.014 6.547December ................... 1.724 2.880 1.945 2.554 1.862 1.864 5.533 7.301Total ........................... 15.568 28.786 22.841 29.936 22.504 22.535 60.921 81.265
1991January ....................... 2.141 3.376 2.048 2.620 1.795 1.798 5.984 7.795February ..................... 1.754 2.729 1.765 2.261 1.653 1.655 5.170 6.643March .......................... 1.585 2.632 1.856 2.420 1.842 1.844 5.280 6.893April ............................ 1.234 2.179 1.788 2.339 1.784 1.786 4.805 6.302May ............................. 1.024 2.111 1.757 2.397 1.882 1.885 4.663 6.394June ............................ .972 2.171 1.764 2.381 1.863 1.866 4.603 6.421July ............................. 1.029 2.396 1.822 2.463 1.952 1.955 4.808 6.818August ........................ 1.002 2.327 1.869 2.511 1.953 1.956 4.828 6.798September .................. .982 2.078 1.906 2.461 1.802 1.804 4.690 6.344October ....................... 1.063 2.076 2.001 2.590 1.893 1.896 4.956 6.561November ................... 1.406 2.421 1.960 2.536 1.783 1.785 5.146 6.740December ................... 1.793 2.928 2.014 2.591 1.889 1.891 5.694 7.408Total ........................... 15.986 29.424 22.549 29.570 22.090 22.120 60.626 81.116
1992January ....................... 2.029 3.218 2.062 2.633 1.826 1.828 5.916 7.678February ..................... 1.814 2.816 1.940 2.458 1.716 1.718 5.468 6.989March .......................... 1.596 2.615 2.014 2.590 1.864 1.866 5.472 7.070April ............................ 1.336 2.272 1.909 2.458 1.834 1.837 5.078 6.565May ............................. 1.040 2.021 1.917 2.515 1.897 1.899 4.853 6.435June ............................ .941 2.029 1.860 2.494 1.875 1.878 4.678 6.403July ............................. .995 2.293 1.902 2.558 1.963 1.966 4.865 6.822August ........................ .974 2.195 1.893 2.520 1.952 1.954 4.822 6.673September .................. .983 2.065 1.862 2.444 1.842 1.844 4.689 6.356October ....................... 1.083 2.066 2.030 2.610 1.911 1.914 5.024 6.590November ................... 1.381 2.390 1.992 2.588 1.818 1.820 5.190 6.798December ................... 1.918 3.118 2.118 2.711 1.933 1.936 5.970 7.765Total ........................... 16.090 29.100 23.498 30.577 22.432 22.461 62.025 82.144
a Due to a lack of consistent historical data, some renewable energysources are not included. For example, in 1991, 3.3 quadrillion Btu ofrenewable energy consumed by U.S. electric utilities to generate electricity fordistribution is included, but an estimated 3.4 quadrillion Btu of renewableenergy used by other sectors is not included.
R=Revised data. Notes: • Totals may not equal sum of components due to independent
rounding and the use of sector-specific conversion factors for natural gas andcoal. • Geographic coverage is the 50 States and the District of Columbia. Additional Notes and Sources: See end of section.
Energy Information Administration/Historical Monthly Energy Review 1973-199254
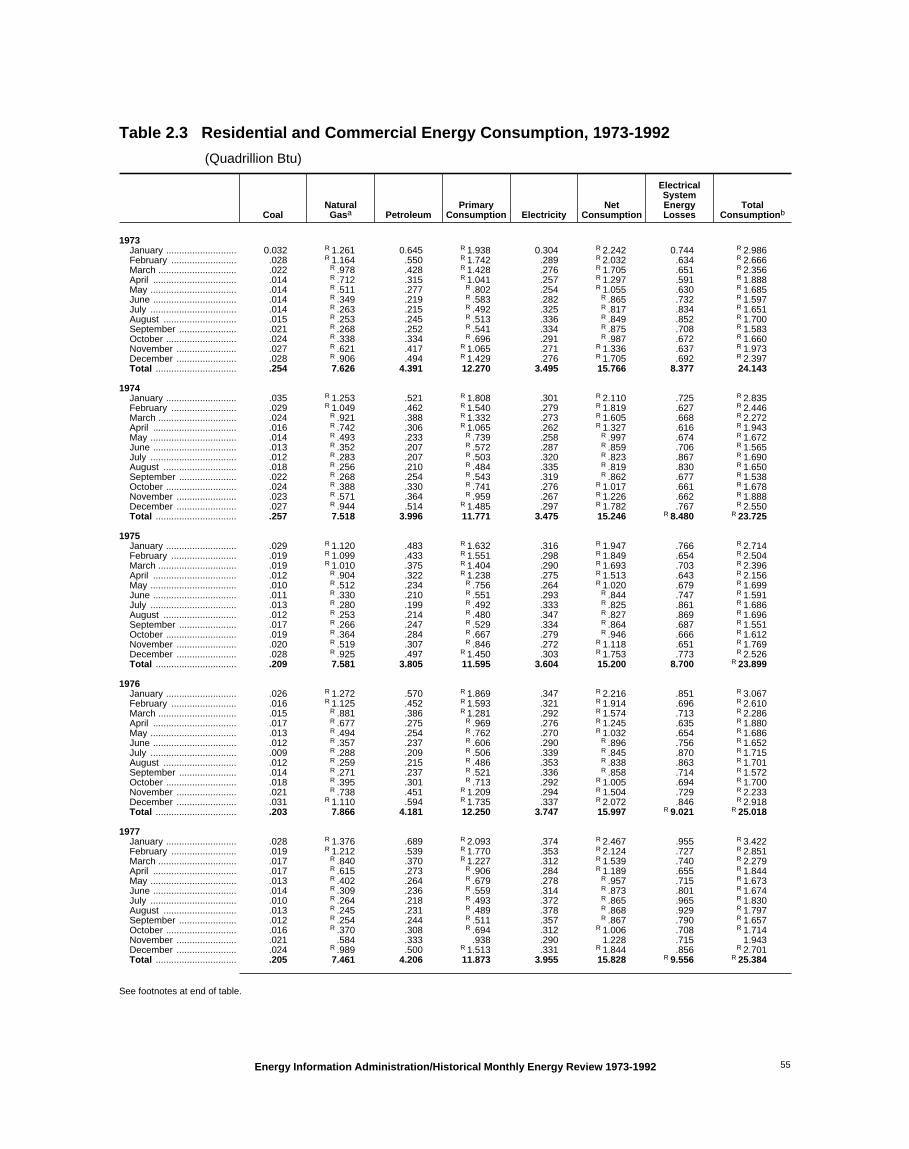
Table 2.3 Residential and Commercial Energy Consumption, 1973-1992
(Quadrillion Btu)
CoalNaturalGasa Petroleum
PrimaryConsumption Electricity
NetConsumption
ElectricalSystemEnergyLosses
TotalConsumptionb
1973January ........................... 0.032 R 1.261 0.645 R 1.938 0.304 R 2.242 0.744 R 2.986February ......................... .028 R 1.164 .550 R 1.742 .289 R 2.032 .634 R 2.666March .............................. .022 R .978 .428 R 1.428 .276 R 1.705 .651 R 2.356April ................................ .014 R .712 .315 R 1.041 .257 R 1.297 .591 R 1.888May ................................. .014 R .511 .277 R .802 .254 R 1.055 .630 R 1.685June ................................ .014 R .349 .219 R .583 .282 R .865 .732 R 1.597July ................................. .014 R .263 .215 R .492 .325 R .817 .834 R 1.651August ............................ .015 R .253 .245 R .513 .336 R .849 .852 R 1.700September ...................... .021 R .268 .252 R .541 .334 R .875 .708 R 1.583October ........................... .024 R .338 .334 R .696 .291 R .987 .672 R 1.660November ....................... .027 R .621 .417 R 1.065 .271 R 1.336 .637 R 1.973December ....................... .028 R .906 .494 R 1.429 .276 R 1.705 .692 R 2.397Total ............................... .254 7.626 4.391 12.270 3.495 15.766 8.377 24.143
1974January ........................... .035 R 1.253 .521 R 1.808 .301 R 2.110 .725 R 2.835February ......................... .029 R 1.049 .462 R 1.540 .279 R 1.819 .627 R 2.446March .............................. .024 R .921 .388 R 1.332 .273 R 1.605 .668 R 2.272April ................................ .016 R .742 .306 R 1.065 .262 R 1.327 .616 R 1.943May ................................. .014 R .493 .233 R .739 .258 R .997 .674 R 1.672June ................................ .013 R .352 .207 R .572 .287 R .859 .706 R 1.565July ................................. .012 R .283 .207 R .503 .320 R .823 .867 R 1.690August ............................ .018 R .256 .210 R .484 .335 R .819 .830 R 1.650September ...................... .022 R .268 .254 R .543 .319 R .862 .677 R 1.538October ........................... .024 R .388 .330 R .741 .276 R 1.017 .661 R 1.678November ....................... .023 R .571 .364 R .959 .267 R 1.226 .662 R 1.888December ....................... .027 R .944 .514 R 1.485 .297 R 1.782 .767 R 2.550Total ............................... .257 7.518 3.996 11.771 3.475 15.246 R 8.480 R 23.725
1975January ........................... .029 R 1.120 .483 R 1.632 .316 R 1.947 .766 R 2.714February ......................... .019 R 1.099 .433 R 1.551 .298 R 1.849 .654 R 2.504March .............................. .019 R 1.010 .375 R 1.404 .290 R 1.693 .703 R 2.396April ................................ .012 R .904 .322 R 1.238 .275 R 1.513 .643 R 2.156May ................................. .010 R .512 .234 R .756 .264 R 1.020 .679 R 1.699June ................................ .011 R .330 .210 R .551 .293 R .844 .747 R 1.591July ................................. .013 R .280 .199 R .492 .333 R .825 .861 R 1.686August ............................ .012 R .253 .214 R .480 .347 R .827 .869 R 1.696September ...................... .017 R .266 .247 R .529 .334 R .864 .687 R 1.551October ........................... .019 R .364 .284 R .667 .279 R .946 .666 R 1.612November ....................... .020 R .519 .307 R .846 .272 R 1.118 .651 R 1.769December ....................... .028 R .925 .497 R 1.450 .303 R 1.753 .773 R 2.526Total ............................... .209 7.581 3.805 11.595 3.604 15.200 8.700 R 23.899
1976January ........................... .026 R 1.272 .570 R 1.869 .347 R 2.216 .851 R 3.067February ......................... .016 R 1.125 .452 R 1.593 .321 R 1.914 .696 R 2.610March .............................. .015 R .881 .386 R 1.281 .292 R 1.574 .713 R 2.286April ................................ .017 R .677 .275 R .969 .276 R 1.245 .635 R 1.880May ................................. .013 R .494 .254 R .762 .270 R 1.032 .654 R 1.686June ................................ .012 R .357 .237 R .606 .290 R .896 .756 R 1.652July ................................. .009 R .288 .209 R .506 .339 R .845 .870 R 1.715August ............................ .012 R .259 .215 R .486 .353 R .838 .863 R 1.701September ...................... .014 R .271 .237 R .521 .336 R .858 .714 R 1.572October ........................... .018 R .395 .301 R .713 .292 R 1.005 .694 R 1.700November ....................... .021 R .738 .451 R 1.209 .294 R 1.504 .729 R 2.233December ....................... .031 R 1.110 .594 R 1.735 .337 R 2.072 .846 R 2.918Total ............................... .203 7.866 4.181 12.250 3.747 15.997 R 9.021 R 25.018
1977January ........................... .028 R 1.376 .689 R 2.093 .374 R 2.467 .955 R 3.422February ......................... .019 R 1.212 .539 R 1.770 .353 R 2.124 .727 R 2.851March .............................. .017 R .840 .370 R 1.227 .312 R 1.539 .740 R 2.279April ................................ .017 R .615 .273 R .906 .284 R 1.189 .655 R 1.844May ................................. .013 R .402 .264 R .679 .278 R .957 .715 R 1.673June ................................ .014 R .309 .236 R .559 .314 R .873 .801 R 1.674July ................................. .010 R .264 .218 R .493 .372 R .865 .965 R 1.830August ............................ .013 R .245 .231 R .489 .378 R .868 .929 R 1.797September ...................... .012 R .254 .244 R .511 .357 R .867 .790 R 1.657October ........................... .016 R .370 .308 R .694 .312 R 1.006 .708 R 1.714November ....................... .021 .584 .333 .938 .290 1.228 .715 1.943December ....................... .024 R .989 .500 R 1.513 .331 R 1.844 .856 R 2.701Total ............................... .205 7.461 4.206 11.873 3.955 15.828 R 9.556 R 25.384
See footnotes at end of table.
Energy Information Administration/Historical Monthly Energy Review 1973-1992 55

Table 2.3 Residential and Commercial Energy Consumption, 1973-1992 (Continued)
(Quadrillion Btu)
CoalNaturalGasa Petroleum
PrimaryConsumption Electricity
NetConsumption
ElectricalSystemEnergyLosses
TotalConsumptionb
1978January ........................... 0.023 R 1.226 0.491 R 1.741 0.377 R 2.118 0.966 R 3.084February ......................... .024 R 1.259 .476 R 1.758 .369 R 2.127 .836 R 2.964March .............................. .018 R 1.042 .427 R 1.488 .345 R 1.833 .824 R 2.656April ................................ .016 R .681 .256 R .953 .294 R 1.248 .689 R 1.937May ................................. .014 R .481 .272 R .767 .285 R 1.052 .746 R 1.799June ................................ .014 R .309 .237 R .560 .326 R .886 .838 R 1.725July ................................. .012 R .258 .217 R .487 .378 R .865 .973 R 1.839August ............................ .013 R .235 .263 R .511 .388 R .898 .980 R 1.879September ...................... .014 R .242 .271 R .527 .380 R .907 .833 R 1.740October ........................... .021 R .349 .327 R .696 .325 R 1.021 .745 R 1.766November ....................... .022 R .582 .361 R .965 .304 R 1.269 .747 R 2.016December ....................... .024 .959 .471 R 1.454 .344 R 1.798 .883 R 2.681Total ............................... .214 7.624 4.070 11.908 4.116 16.023 R 10.061 R 26.084
1979January ........................... .029 R 1.323 .480 R 1.831 .398 R 2.229 1.021 R 3.250February ......................... .017 R 1.361 .451 R 1.829 .388 R 2.217 .870 R 3.087March .............................. .014 1.027 .340 1.381 .352 1.733 .816 2.549April ................................ .012 R .732 .245 R .990 .312 R 1.302 .714 R 2.015May ................................. .011 .466 .223 .700 .299 R .999 .742 R 1.741June ................................ .011 R .321 .191 R .524 .323 R .847 .806 R 1.654July ................................. .010 R .259 .188 R .457 .365 R .822 .943 R 1.765August ............................ .009 R .241 .209 R .459 .393 R .852 .969 R 1.821September ...................... .012 R .248 .210 R .471 .370 R .840 .807 R 1.647October ........................... .017 R .364 .262 R .643 .321 R .965 .775 R 1.740November ....................... .021 R .612 .292 R .925 .315 R 1.240 .768 R 2.007December ....................... .022 R .936 .357 R 1.315 .348 R 1.663 .869 R 2.532Total ............................... .187 7.891 3.448 11.525 4.184 15.709 R 10.100 R 25.808
1980January ........................... .019 1.104 .423 1.547 .381 1.928 .946 2.874February ......................... .017 1.182 .357 1.556 .375 1.931 .859 2.790March .............................. .012 1.041 .275 1.328 .358 1.687 .849 2.536April ................................ .013 .707 .189 .909 .319 1.228 .724 1.953May ................................. .008 .444 .195 .648 .298 .946 .761 1.707June ................................ .006 .322 .178 .505 .334 .839 .872 1.711July ................................. .008 .254 .152 .414 .410 .823 1.102 1.926August ............................ .007 .236 .146 .389 .439 .828 1.086 1.914September ...................... .010 .247 .181 .437 .410 .848 .892 1.740October ........................... .013 .362 .257 .633 .343 .975 .793 1.768November ....................... .014 .631 .294 .939 .322 1.261 .788 2.049December ....................... .018 1.010 .387 1.415 .364 1.779 .907 2.686Total ............................... .145 7.540 3.035 10.721 4.355 15.075 R 10.580 R 25.655
1981January ........................... .020 1.268 .437 1.725 .425 2.150 1.006 3.156February ......................... .016 1.122 .293 1.431 .391 1.822 .819 2.641March .............................. .011 .911 .202 1.124 .355 1.479 .840 2.318April ................................ .013 .590 .147 .750 .325 1.075 .760 1.835May ................................. .011 .421 .155 .587 .321 .908 .799 1.708June ................................ .007 .291 .148 .446 .365 .810 .951 1.761July ................................. .010 .241 .138 .389 .429 .818 1.085 1.903August ............................ .010 .236 .149 .395 .431 .826 1.023 1.849September ...................... .013 .246 .153 .413 .392 .805 .854 1.659October ........................... .014 .390 .249 .652 .348 1.000 .811 1.811November ....................... .019 .583 .257 .859 .336 1.195 .794 1.990December ....................... .024 .942 .306 1.271 .380 1.651 .958 2.609Total ............................... .167 7.243 2.634 10.043 4.497 14.541 R 10.700 R 25.241
1982January ........................... .022 R 1.343 .303 R 1.668 .440 R 2.108 1.085 R 3.193February ......................... .016 R 1.221 .228 R 1.465 .409 R 1.873 .875 R 2.748March .............................. .013 R .947 .252 R 1.211 .373 R 1.584 .886 R 2.470April ................................ .016 R .705 .243 R .964 .346 R 1.310 .799 R 2.109May ................................. .011 .382 .181 .573 .327 .900 .823 1.723June ................................ .008 .279 .144 .431 .358 .789 .885 1.674July ................................. .014 .245 .121 .381 .412 .793 1.085 1.878August ............................ .015 .234 .134 .383 .431 .813 1.054 1.867September ...................... .014 .247 .197 .459 .403 .862 .903 1.764October ........................... .015 .343 .201 .559 .349 .908 .828 1.736November ....................... .019 R .604 .172 R .795 .340 R 1.135 .834 R 1.969December ....................... .023 R .877 .274 R 1.174 .381 R 1.555 .942 R 2.497Total ............................... .187 7.427 2.449 10.063 4.566 14.629 R 11.000 R 25.629
See footnotes at end of table.
Energy Information Administration/Historical Monthly Energy Review 1973-199256
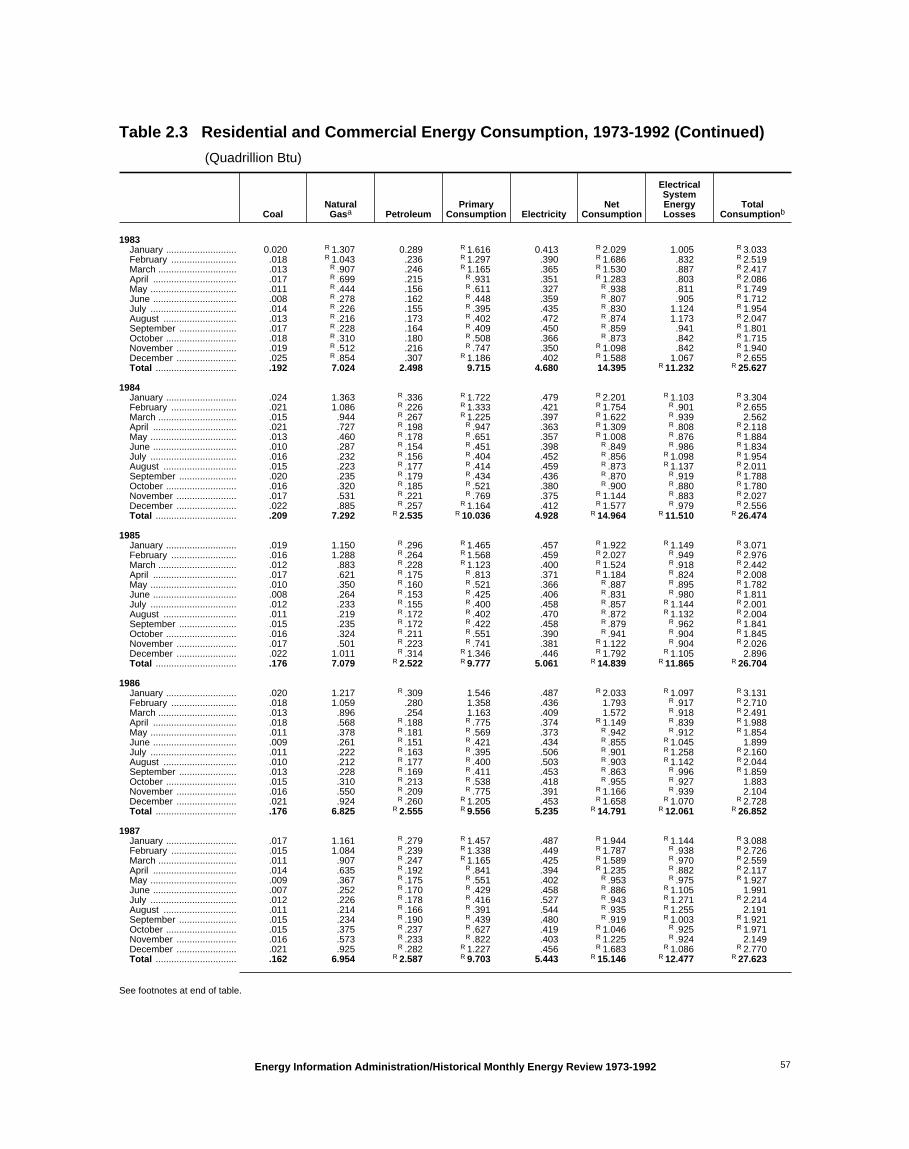
Table 2.3 Residential and Commercial Energy Consumption, 1973-1992 (Continued)
(Quadrillion Btu)
CoalNaturalGasa Petroleum
PrimaryConsumption Electricity
NetConsumption
ElectricalSystemEnergyLosses
TotalConsumptionb
1983January ........................... 0.020 R 1.307 0.289 R 1.616 0.413 R 2.029 1.005 R 3.033February ......................... .018 R 1.043 .236 R 1.297 .390 R 1.686 .832 R 2.519March .............................. .013 R .907 .246 R 1.165 .365 R 1.530 .887 R 2.417April ................................ .017 R .699 .215 R .931 .351 R 1.283 .803 R 2.086May ................................. .011 R .444 .156 R .611 .327 R .938 .811 R 1.749June ................................ .008 R .278 .162 R .448 .359 R .807 .905 R 1.712July ................................. .014 R .226 .155 R .395 .435 R .830 1.124 R 1.954August ............................ .013 R .216 .173 R .402 .472 R .874 1.173 R 2.047September ...................... .017 R .228 .164 R .409 .450 R .859 .941 R 1.801October ........................... .018 R .310 .180 R .508 .366 R .873 .842 R 1.715November ....................... .019 R .512 .216 R .747 .350 R 1.098 .842 R 1.940December ....................... .025 R .854 .307 R 1.186 .402 R 1.588 1.067 R 2.655Total ............................... .192 7.024 2.498 9.715 4.680 14.395 R 11.232 R 25.627
1984January ........................... .024 1.363 R .336 R 1.722 .479 R 2.201 R 1.103 R 3.304February ......................... .021 1.086 R .226 R 1.333 .421 R 1.754 R .901 R 2.655March .............................. .015 .944 R .267 R 1.225 .397 R 1.622 R .939 2.562April ................................ .021 .727 R .198 R .947 .363 R 1.309 R .808 R 2.118May ................................. .013 .460 R .178 R .651 .357 R 1.008 R .876 R 1.884June ................................ .010 .287 R .154 R .451 .398 R .849 R .986 R 1.834July ................................. .016 .232 R .156 R .404 .452 R .856 R 1.098 R 1.954August ............................ .015 .223 R .177 R .414 .459 R .873 R 1.137 R 2.011September ...................... .020 .235 R .179 R .434 .436 R .870 R .919 R 1.788October ........................... .016 .320 R .185 R .521 .380 R .900 R .880 R 1.780November ....................... .017 .531 R .221 R .769 .375 R 1.144 R .883 R 2.027December ....................... .022 .885 R .257 R 1.164 .412 R 1.577 R .979 R 2.556Total ............................... .209 7.292 R 2.535 R 10.036 4.928 R 14.964 R 11.510 R 26.474
1985January ........................... .019 1.150 R .296 R 1.465 .457 R 1.922 R 1.149 R 3.071February ......................... .016 1.288 R .264 R 1.568 .459 R 2.027 R .949 R 2.976March .............................. .012 .883 R .228 R 1.123 .400 R 1.524 R .918 R 2.442April ................................ .017 .621 R .175 R .813 .371 R 1.184 R .824 R 2.008May ................................. .010 .350 R .160 R .521 .366 R .887 R .895 R 1.782June ................................ .008 .264 R .153 R .425 .406 R .831 R .980 R 1.811July ................................. .012 .233 R .155 R .400 .458 R .857 R 1.144 R 2.001August ............................ .011 .219 R .172 R .402 .470 R .872 R 1.132 R 2.004September ...................... .015 .235 R .172 R .422 .458 R .879 R .962 R 1.841October ........................... .016 .324 R .211 R .551 .390 R .941 R .904 R 1.845November ....................... .017 .501 R .223 R .741 .381 R 1.122 R .904 R 2.026December ....................... .022 1.011 R .314 R 1.346 .446 R 1.792 R 1.105 2.896Total ............................... .176 7.079 R 2.522 R 9.777 5.061 R 14.839 R 11.865 R 26.704
1986January ........................... .020 1.217 R .309 1.546 .487 R 2.033 R 1.097 R 3.131February ......................... .018 1.059 .280 1.358 .436 1.793 R .917 R 2.710March .............................. .013 .896 .254 1.163 .409 1.572 R .918 R 2.491April ................................ .018 .568 R .188 R .775 .374 R 1.149 R .839 R 1.988May ................................. .011 .378 R .181 R .569 .373 R .942 R .912 R 1.854June ................................ .009 .261 R .151 R .421 .434 R .855 R 1.045 1.899July ................................. .011 .222 R .163 R .395 .506 R .901 R 1.258 R 2.160August ............................ .010 .212 R .177 R .400 .503 R .903 R 1.142 R 2.044September ...................... .013 .228 R .169 R .411 .453 R .863 R .996 R 1.859October ........................... .015 .310 R .213 R .538 .418 R .955 R .927 1.883November ....................... .016 .550 R .209 R .775 .391 R 1.166 R .939 2.104December ....................... .021 .924 R .260 R 1.205 .453 R 1.658 R 1.070 R 2.728Total ............................... .176 6.825 R 2.555 R 9.556 5.235 R 14.791 R 12.061 R 26.852
1987January ........................... .017 1.161 R .279 R 1.457 .487 R 1.944 R 1.144 R 3.088February ......................... .015 1.084 R .239 R 1.338 .449 R 1.787 R .938 R 2.726March .............................. .011 .907 R .247 R 1.165 .425 R 1.589 R .970 R 2.559April ................................ .014 .635 R .192 R .841 .394 R 1.235 R .882 R 2.117May ................................. .009 .367 R .175 R .551 .402 R .953 R .975 R 1.927June ................................ .007 .252 R .170 R .429 .458 R .886 R 1.105 1.991July ................................. .012 .226 R .178 R .416 .527 R .943 R 1.271 R 2.214August ............................ .011 .214 R .166 R .391 .544 R .935 R 1.255 2.191September ...................... .015 .234 R .190 R .439 .480 R .919 R 1.003 R 1.921October ........................... .015 .375 R .237 R .627 .419 R 1.046 R .925 R 1.971November ....................... .016 .573 R .233 R .822 .403 R 1.225 R .924 2.149December ....................... .021 .925 R .282 R 1.227 .456 R 1.683 R 1.086 R 2.770Total ............................... .162 6.954 R 2.587 R 9.703 5.443 R 15.146 R 12.477 R 27.623
See footnotes at end of table.
Energy Information Administration/Historical Monthly Energy Review 1973-1992 57

Table 2.3 Residential and Commercial Energy Consumption, 1973-1992 (Continued)
(Quadrillion Btu)
CoalNaturalGasa Petroleum
PrimaryConsumption Electricity
NetConsumption
ElectricalSystemEnergyLosses
TotalConsumptionb
1988January ........................... 0.019 1.313 R 0.299 R 1.632 0.527 R 2.159 R 1.197 R 3.356February ......................... .016 1.180 R .268 R 1.463 .488 R 1.951 R 1.030 R 2.981March .............................. .012 .944 R .255 R 1.211 .451 R 1.662 R 1.009 R 2.672April ................................ .014 .641 R .186 R .841 .411 R 1.252 R .895 R 2.147May ................................. .008 .428 R .178 R .614 .400 R 1.014 R .948 R 1.963June ................................ .010 .278 R .160 R .448 .465 R .913 R 1.118 R 2.031July ................................. .016 .239 R .178 R .433 .549 R .982 R 1.314 R 2.296August ............................ .015 .234 R .186 R .436 .582 R 1.018 R 1.360 R 2.378September ...................... .009 .244 R .188 R .442 .506 R .948 R 1.027 R 1.975October ........................... .011 .399 R .211 R .621 .439 R 1.059 R .954 R 2.013November ....................... .014 .634 R .223 R .871 .425 R 1.296 R .952 R 2.248December ....................... .023 .979 R .267 R 1.268 .481 R 1.749 R 1.116 R 2.866Total ............................... .168 7.513 R 2.600 R 10.280 5.724 R 16.004 R 12.920 R 28.925
1989January ........................... .015 1.162 .271 1.448 .514 1.963 1.123 3.085February ......................... .016 1.158 .230 1.404 .483 1.887 1.041 2.928March .............................. .012 1.018 .246 1.276 .484 1.760 1.068 2.828April ................................ .012 .668 .185 .865 .432 1.297 .929 2.226May ................................. .008 .428 .169 .605 .425 1.030 1.004 2.034June ................................ .007 .285 .172 .464 .485 .949 1.112 2.060July ................................. .012 .246 .159 .417 .549 .966 1.293 2.260August ............................ .011 .238 .187 .436 .553 .989 1.270 2.260September ...................... .007 .260 .186 .454 .518 .972 1.052 2.024October ........................... .005 .392 .205 .603 .450 1.053 .987 2.040November ....................... .013 .656 .221 .889 .439 1.329 .987 2.315December ....................... .028 1.218 .294 1.540 .526 2.066 1.277 3.344Total ............................... .146 7.731 2.525 10.402 5.859 16.261 13.143 29.404
1990January ........................... .016 1.224 .209 1.450 .564 2.014 1.158 3.172February ......................... .015 1.008 .193 1.216 .472 1.689 .982 2.670March .............................. .013 .880 .185 1.078 .467 1.545 1.041 2.585April ................................ .012 .655 .169 .836 .439 1.275 .945 2.219May ................................. .008 .418 .159 .586 .441 1.026 1.011 2.037June ................................ .009 .293 .157 .459 .498 .957 1.179 2.136July ................................. .012 .257 .160 .430 .580 1.010 1.325 2.335August ............................ .012 .244 .179 .434 .572 1.006 1.318 2.324September ...................... .009 .261 .174 .445 .557 1.001 1.119 2.121October ........................... .010 .376 .187 .572 .478 1.050 1.020 2.070November ....................... .014 .617 .190 .821 .450 1.272 .964 2.235December ....................... .024 .991 .211 1.227 .497 1.724 1.156 2.880Total ............................... .156 7.225 2.173 9.553 6.015 15.568 13.218 28.786
1991January ........................... .020 1.317 .242 1.579 .562 2.141 1.236 3.376February ......................... .014 1.055 .190 1.259 .495 1.754 .975 2.729March .............................. .012 .911 .187 1.111 .474 1.585 1.047 2.632April ................................ .009 .617 .164 .790 .444 1.234 .945 2.179May ................................. .008 .394 .156 .558 .466 1.024 1.088 2.111June ................................ .007 .275 .155 .437 .535 .972 1.199 2.171July ................................. .010 .259 .164 .433 .596 1.029 1.367 2.396August ............................ .009 .238 .163 .410 .593 1.002 1.325 2.327September ...................... .007 .267 .155 .429 .553 .982 1.096 2.078October ........................... .008 .400 .178 .586 .477 1.063 1.013 2.076November ....................... .016 .737 .182 .934 .471 1.406 1.015 2.421December ....................... .020 1.040 .219 1.279 .514 1.793 1.134 2.928Total ............................... .141 7.510 2.154 9.805 6.180 15.986 13.439 29.424
1992January ........................... .017 1.233 .229 1.480 .550 2.029 1.189 3.218February ......................... .013 1.095 .197 1.305 .508 1.814 1.002 2.816March .............................. .012 .916 .189 1.117 .479 1.596 1.019 2.615April ................................ .012 .703 .165 .880 .455 1.336 .936 2.272May ................................. .007 .434 .146 .587 .452 1.040 .982 2.021June ................................ .007 .296 .148 .451 .489 .941 1.089 2.029July ................................. .011 .262 .149 .422 .573 .995 1.298 2.293August ............................ .009 .254 .141 .404 .570 .974 1.221 2.195September ...................... .009 .266 .177 .451 .532 .983 1.082 2.065October ........................... .008 .419 .173 .601 .482 1.083 .983 2.066November ....................... .015 .714 .184 .913 .468 1.381 1.009 2.390December ....................... .021 1.132 .227 1.380 .538 1.918 1.200 3.118Total ............................... .142 7.726 2.126 9.993 6.096 16.090 13.010 29.100
a Includes supplemental gaseous fuels.b Due to a lack of consistent historical data, some renewable energy
sources are not included. For example, in 1991, an estimated 0.7 quadrillionBtu of renewable energy consumed by the U.S. residential and commercialsectors (primarily the residential sector) is not included.
R=Revised data. Notes: • Totals may not equal sum of components due to independent
rounding. • Geographic coverage is the 50 States and the District ofColumbia. Additional Notes and Sources: See end of section.
Energy Information Administration/Historical Monthly Energy Review 1973-199258

Table 2.4 Industrial Energy Consumption, 1973-1992
(Quadrillion Btu)
CoalNaturalGasa Petroleum
Hydro-electricPower
NetImportsof CoalCoke
PrimaryConsumption Electricity
NetConsumption
ElectricalSystemEnergyLosses
TotalConsumptionb
1973January ......................... 0.363 R 0.826 0.784 0.003 -0.001 R 1.975 0.189 R 2.164 0.462 R 2.626February ....................... .334 R .713 .767 .003 (s) R 1.817 .186 R 2.003 .409 R 2.412March ............................ .344 R .746 .774 .003 -.002 R 1.865 .191 R 2.056 .449 R 2.505April .............................. .338 R .824 .658 .003 -.001 R 1.822 .191 R 2.013 .439 R 2.452May ............................... .344 R .869 .763 .003 -.003 R 1.976 .194 R 2.170 .482 R 2.652June .............................. .326 R .783 .712 .003 (s) R 1.824 .196 R 2.020 .508 R 2.527July ............................... .320 R .840 .701 .003 -.001 R 1.863 .195 R 2.058 .501 R 2.559August .......................... .316 R .878 .794 .003 -.001 R 1.989 .201 R 2.190 .509 R 2.700September .................... .307 R .875 .745 .002 -.001 R 1.928 .202 R 2.130 .428 R 2.558October ......................... .337 R 1.010 .769 .003 .002 R 2.121 .206 R 2.328 .477 R 2.805November ..................... .347 R .999 .864 .003 .001 R 2.213 .199 R 2.413 .468 R 2.881December ..................... .380 R 1.023 .773 .003 (s) R 2.180 .191 R 2.371 .479 R 2.850Total ............................. 4.057 10.388 9.104 .035 -.007 23.576 2.341 25.917 5.611 31.528
1974January ......................... .359 R .733 .797 .003 .004 R 1.896 .189 R 2.085 .455 R 2.541February ....................... .336 R .780 .713 .003 .003 R 1.835 .187 R 2.022 .421 R 2.443March ............................ .341 R .804 .700 .003 .004 R 1.851 .190 R 2.041 .466 R 2.507April .............................. .337 R .668 .687 .003 .004 R 1.699 .191 R 1.891 .451 R 2.342May ............................... .328 R .787 .675 .003 .005 R 1.798 .195 R 1.993 .510 R 2.503June .............................. .312 R .719 .708 .003 .003 R 1.745 .197 R 1.942 .485 R 2.427July ............................... .310 R .804 .720 .003 .004 R 1.840 .196 R 2.036 .532 R 2.568August .......................... .319 R .850 .742 .003 .004 R 1.917 .203 R 2.121 .504 R 2.625September .................... .311 R .935 .682 .002 .007 R 1.937 .204 R 2.141 .433 R 2.575October ......................... .332 R .998 .777 .002 .009 R 2.118 .205 R 2.323 .490 R 2.813November ..................... .295 R .995 .760 .002 .005 R 2.057 .195 R 2.252 .483 R 2.735December ..................... .290 R .930 .735 .003 .005 R 1.963 .182 R 2.145 .470 R 2.615Total ............................. 3.870 10.004 8.694 .033 .056 22.657 2.337 24.994 R 5.700 R 30.694
1975January ......................... .327 R .896 .828 .003 .009 R 2.062 .193 R 2.255 .469 R 2.724February ....................... .327 R .627 .649 .003 .008 R 1.614 .189 R 1.803 .415 R 2.217March ............................ .349 R .658 .725 .003 .003 R 1.737 .190 R 1.927 .460 R 2.386April .............................. .328 R .436 .638 .003 (s) R 1.405 .188 R 1.593 .438 R 2.031May ............................... .309 R .525 .598 .003 .003 R 1.437 .191 R 1.628 .489 R 2.117June .............................. .288 R .600 .595 .003 -.002 R 1.484 .194 R 1.677 .493 R 2.171July ............................... .274 R .650 .660 .003 -.001 R 1.585 .193 R 1.778 .498 R 2.276August .......................... .277 R .734 .612 .002 -.002 R 1.624 .201 R 1.825 .502 R 2.327September .................... .279 R .768 .644 .002 -.003 R 1.690 .203 R 1.894 .418 R 2.312October ......................... .290 R .883 .743 .002 -.002 R 1.918 .204 R 2.122 .489 R 2.611November ..................... .301 R .871 .652 .002 .001 R 1.827 .202 R 2.030 .484 R 2.514December ..................... .318 R .885 .801 .003 (s) R 2.007 .200 R 2.206 .509 R 2.716Total ............................. 3.667 8.532 8.146 .032 .014 20.391 2.346 22.737 R 5.665 R 28.402
1976January ......................... .305 R .787 .811 .003 -.001 R 1.905 .200 R 2.105 .491 R 2.596February ....................... .290 R .592 .722 .003 -.002 R 1.605 .202 R 1.807 .437 R 2.245March ............................ .308 R .598 .740 .003 -.002 R 1.647 .210 R 1.857 .512 R 2.370April .............................. .307 R .586 .678 .003 -.002 R 1.571 .209 R 1.780 .480 R 2.260May ............................... .315 R .655 .696 .003 -.003 R 1.666 .213 R 1.879 .516 R 2.395June .............................. .300 R .647 .667 .003 -.002 R 1.615 .218 R 1.833 .568 R 2.401July ............................... .297 R .728 .693 .003 (s) R 1.721 .217 R 1.937 .556 R 2.494August .......................... .291 R .710 .722 .002 .001 R 1.727 .222 R 1.949 .543 R 2.492September .................... .291 R .719 .738 .002 .001 R 1.751 .224 R 1.974 .475 R 2.449October ......................... .305 R .957 .803 .003 .006 R 2.074 .223 R 2.296 .530 R 2.826November ..................... .312 R .899 .803 .003 .001 R 2.018 .219 R 2.237 .542 R 2.780December ..................... .339 R .883 .937 .003 .002 R 2.164 .218 R 2.382 .547 R 2.928Total ............................. 3.661 8.762 9.010 .033 (s) 21.465 2.573 24.038 R 6.198 R 30.236
1977January ......................... .305 R .801 .843 .003 -.002 R 1.951 .214 R 2.165 .546 R 2.710February ....................... .294 R .383 .872 .002 (s) R 1.551 .210 R 1.761 .431 R 2.192March ............................ .316 R .623 .831 .003 -.002 R 1.772 .220 R 1.992 .522 R 2.513April .............................. .298 R .584 .758 .003 -.002 R 1.641 .220 R 1.861 .508 R 2.369May ............................... .295 R .700 .735 .003 (s) R 1.734 .228 R 1.961 .585 R 2.546June .............................. .286 R .695 .786 .003 (s) R 1.770 .229 R 1.999 .586 R 2.585July ............................... .276 R .696 .729 .002 .002 R 1.705 .224 R 1.929 .581 R 2.510August .......................... .263 R .750 .804 .002 .001 R 1.820 .230 R 2.050 .565 R 2.615September .................... .257 R .829 .788 .002 .007 R 1.883 .230 R 2.113 .510 R 2.623October ......................... .287 R .844 .866 .003 .004 R 2.004 .231 R 2.235 .522 R 2.757November ..................... .285 .853 .857 .003 .001 R 1.999 .225 2.224 .555 2.778December ..................... .292 R .876 .906 .003 .005 R 2.082 .222 R 2.304 .574 R 2.878Total ............................. 3.454 8.635 9.774 .033 .015 21.911 2.682 24.593 R 6.484 R 31.077
See footnotes at end of table.
Energy Information Administration/Historical Monthly Energy Review 1973-1992 59

Table 2.4 Industrial Energy Consumption, 1973-1992 (Continued)
(Quadrillion Btu)
CoalNaturalGasa Petroleum
Hydro-electricPower
NetImportsof CoalCoke
PrimaryConsumption Electricity
NetConsumption
ElectricalSystemEnergyLosses
TotalConsumptionb
1978January ......................... 0.260 R 0.895 0.902 0.003 0.001 R 2.061 0.225 R 2.286 0.576 R 2.862February ....................... .210 R .641 .867 .003 .001 R 1.722 .210 R 1.932 .475 R 2.407March ............................ .206 R .618 .854 .003 .005 R 1.685 .212 R 1.898 .507 R 2.405April .............................. .269 R .613 .808 .003 .012 R 1.705 .218 R 1.923 .510 R 2.433May ............................... .287 R .618 .835 .003 .024 R 1.767 .231 R 1.998 .606 R 2.604June .............................. .282 R .599 .765 .003 .009 R 1.658 .238 R 1.895 .610 R 2.505July ............................... .286 R .692 .768 .003 .014 R 1.763 .232 R 1.995 .597 R 2.592August .......................... .284 R .690 .779 .002 .013 R 1.768 .240 R 2.008 .607 R 2.615September .................... .290 R .677 .755 .002 .011 R 1.736 .243 R 1.978 .533 R 2.511October ......................... .302 R .808 .828 .002 .014 R 1.954 .243 R 2.197 .557 R 2.755November ..................... .306 R .826 .840 .002 .012 R 1.986 .238 R 2.224 .584 R 2.808December ..................... .330 R .862 .867 .002 .009 R 2.071 .231 R 2.302 .594 R 2.896Total ............................. 3.314 8.539 9.867 .032 .125 21.876 2.761 24.637 R 6.755 R 31.392
1979January ......................... .321 R .841 .961 .003 .004 R 2.130 .233 R 2.363 .597 R 2.960February ....................... .291 R .585 .908 .003 .003 R 1.790 .231 R 2.020 .518 R 2.538March ............................ .310 .566 .989 .003 .002 1.870 .238 2.108 .552 R 2.659April .............................. .299 R .576 .791 .003 .005 R 1.675 .239 R 1.914 .546 R 2.460May ............................... .298 R .663 .872 .004 .011 1.848 .245 R 2.092 .609 R 2.701June .............................. .286 R .646 .819 .003 .009 R 1.763 .245 R 2.009 .612 R 2.621July ............................... .292 R .679 .794 .003 .008 R 1.775 .242 R 2.017 .625 R 2.642August .......................... R .292 R .703 .867 .003 .009 R 1.873 .246 R 2.119 .606 R 2.725September .................... R .286 R .720 .803 .002 .008 R 1.819 .242 R 2.061 .529 R 2.590October ......................... .297 R .845 .924 .002 .003 R 2.072 .244 R 2.316 .588 R 2.904November ..................... .298 R .869 .888 .003 (s) R 2.057 .238 R 2.295 .581 R 2.876December ..................... .324 R .857 .950 .003 .002 R 2.135 .230 R 2.365 .574 R 2.939Total ............................. 3.593 8.549 10.568 .034 .063 22.807 2.873 25.679 R 6.936 R 32.616
1980January ......................... .305 .832 .932 .003 .003 2.075 .230 2.305 .572 2.877February ....................... .284 .677 .849 .003 -.001 1.812 .234 2.045 .535 2.581March ............................ .290 .704 .875 .003 -.003 1.868 .236 2.104 .558 2.662April .............................. .283 .552 .790 .003 -.005 1.625 .232 1.856 .526 2.382May ............................... .275 .612 .766 .003 -.005 1.652 .229 1.881 .586 2.467June .............................. .249 .578 .729 .003 -.004 1.555 .228 1.782 .594 2.377July ............................... .227 .600 .680 .003 -.004 1.506 .224 1.729 .601 2.331August .......................... .229 .620 .657 .002 -.003 1.506 .230 1.736 .569 2.305September .................... .223 .676 .813 .002 -.004 1.710 .237 1.947 .516 2.463October ......................... .250 .837 .835 .002 -.006 1.919 .237 2.156 .548 2.704November ..................... .259 .853 .731 .002 -.002 1.843 .231 2.074 .565 2.639December ..................... .281 .853 .869 .002 -.001 2.004 .234 2.238 .582 2.819Total ............................. 3.155 8.395 9.525 .033 -.035 21.073 2.781 23.854 R 6.752 R 30.606
1981January ......................... .294 .754 .821 .003 (s) 1.871 .229 2.100 .542 2.641February ....................... .273 .526 .705 .003 -.001 1.505 .230 1.735 .482 2.218March ............................ .276 .690 .752 .003 -.003 1.719 .234 1.953 .554 2.507April .............................. .256 .588 .653 .003 -.001 1.498 .232 1.731 .544 2.275May ............................... .234 .668 .698 .003 (s) 1.604 .234 1.838 .583 2.421June .............................. .229 .616 .664 .003 -.004 1.508 .244 1.752 .637 2.390July ............................... .267 .641 .642 .003 (s) 1.554 .245 1.798 .619 2.417August .......................... .270 .667 .649 .002 (s) 1.589 .246 1.835 .584 2.419September .................... .263 .675 .682 .002 -.002 1.620 .242 1.862 .527 2.390October ......................... .264 .807 .664 .002 -.003 1.735 .236 1.971 .550 2.521November ..................... .266 .756 .632 .002 (s) 1.656 .226 1.881 .533 2.414December ..................... .265 .870 .723 .002 -.003 1.858 .219 2.076 .552 2.628Total ............................. 3.157 8.257 8.285 .033 -.016 19.715 2.817 22.533 R 6.707 R 29.240
1982January ......................... .265 R .794 .730 .003 (s) R 1.792 .215 R 2.007 .530 R 2.537February ....................... .249 R .521 .658 .003 -.001 R 1.429 .214 R 1.643 .459 R 2.102March ............................ .239 R .623 .662 .003 -.002 R 1.526 .220 R 1.746 .523 R 2.269April .............................. .221 R .516 .676 .003 -.001 R 1.416 .214 R 1.630 .494 R 2.123May ............................... .214 .480 .633 .003 -.002 1.328 .213 1.542 .537 2.078June .............................. .200 .524 .612 .003 -.004 1.335 .217 1.552 .538 2.090July ............................... .193 .529 .625 .003 -.003 1.347 .214 1.561 .563 2.124August .......................... .195 .537 .667 .002 -.001 1.400 .216 1.616 .529 2.144September .................... .186 .583 .599 .002 -.003 1.367 .205 1.572 .459 2.031October ......................... .194 .678 .657 .002 -.001 1.530 .208 1.738 .492 2.230November ..................... .197 R .710 .640 .002 -.001 R 1.548 .207 R 1.755 .508 R 2.263December ..................... .199 R .627 .634 .002 -.001 R 1.462 .199 R 1.661 .494 R 2.155Total ............................. 2.552 7.121 7.794 .033 -.022 17.479 2.542 20.020 R 6.125 R 26.145
See footnotes at end of table.
Energy Information Administration/Historical Monthly Energy Review 1973-199260

Table 2.4 Industrial Energy Consumption, 1973-1992 (Continued)
(Quadrillion Btu)
CoalNaturalGasa Petroleum
Hydro-electricPower
NetImportsof CoalCoke
PrimaryConsumption Electricity
NetConsumption
ElectricalSystemEnergyLosses
TotalConsumptionb
1983January ......................... 0.211 R 0.688 0.599 0.003 -0.001 R 1.500 0.198 R 1.697 0.481 R 2.179February ....................... .196 R .623 .544 .003 -.001 R 1.364 .201 R 1.565 .430 R 1.996March ............................ .187 R .615 .618 .003 -.001 R 1.421 .206 R 1.627 .499 R 2.126April .............................. .205 R .598 .563 .003 -.002 R 1.367 .207 R 1.573 .472 R 2.045May ............................... .198 R .592 .614 .004 -.002 R 1.406 .214 R 1.620 .530 R 2.151June .............................. .182 R .563 .592 .003 -.001 R 1.340 .226 R 1.565 .569 R 2.134July ............................... .206 R .522 .592 .003 -.002 R 1.322 .227 R 1.548 .586 R 2.134August .......................... .209 R .495 .624 .002 -.001 R 1.330 .238 R 1.568 .591 R 2.158September .................... .203 R .475 .666 .002 -.001 R 1.345 .238 R 1.582 .496 R 2.079October ......................... .217 R .533 .646 .002 -.001 R 1.397 .235 R 1.632 .542 R 2.174November ..................... .227 R .573 .683 .002 -.001 R 1.484 .230 R 1.714 .554 R 2.268December ..................... .249 R .550 .680 .002 -.003 R 1.478 .229 R 1.708 .608 R 2.316Total ............................. 2.490 6.826 7.420 .033 -.016 16.753 2.648 19.401 R 6.359 R 25.759
1984January ......................... .256 .769 R .774 .003 .001 R 1.804 .227 R 2.030 R .522 R 2.552February ....................... .237 R .689 R .661 .003 .002 R 1.591 .229 R 1.821 R .491 R 2.312March ............................ .238 .692 R .725 .003 -.001 R 1.657 .237 R 1.894 R .561 R 2.455April .............................. .253 .650 R .670 .003 (s) R 1.576 .235 R 1.811 R .524 R 2.334May ............................... .245 R .611 R .683 .003 -.001 R 1.542 .241 R 1.783 R .590 R 2.373June .............................. .225 R .574 R .623 .003 -.002 R 1.423 .248 R 1.672 R .615 R 2.287July ............................... .227 .550 R .652 .003 -.001 R 1.431 .244 R 1.675 R .593 R 2.268August .......................... .230 .561 R .650 .002 -.002 R 1.441 .253 R 1.695 R .628 R 2.323September .................... .223 .542 R .635 .002 (s) R 1.402 .242 R 1.644 R .511 R 2.156October ......................... .222 .575 R .695 .002 -.003 R 1.491 .241 R 1.732 R .559 R 2.291November ..................... .232 .608 R .621 .002 -.003 R 1.460 .234 R 1.694 R .551 R 2.245December ..................... .255 .625 R .625 .002 -.001 R 1.507 .227 R 1.733 R .538 R 2.271Total ............................. 2.842 7.448 R 8.014 .033 -.011 R 18.325 2.859 R 21.184 R 6.683 R 27.867
1985January ......................... .245 R .728 R .716 .003 (s) R 1.693 .233 R 1.925 R .585 R 2.510February ....................... .226 R .670 R .635 .003 .001 R 1.535 .231 R 1.765 R .477 R 2.242March ............................ .227 R .633 R .648 .003 (s) R 1.512 .234 R 1.745 R .535 R 2.280April .............................. .241 R .588 R .628 .003 .001 R 1.460 .237 R 1.697 R .526 R 2.224May ............................... .233 R .548 R .665 .003 -.003 R 1.446 .243 R 1.689 R .594 R 2.283June .............................. .213 R .516 R .633 .003 -.002 R 1.363 .243 R 1.606 R .587 R 2.192July ............................... .223 R .533 R .625 .003 -.002 R 1.382 .242 R 1.624 R .604 R 2.228August .......................... .226 R .528 R .654 .002 -.001 R 1.410 .247 R 1.657 R .595 R 2.252September .................... .219 R .517 R .610 .002 -.003 R 1.346 .245 R 1.591 R .515 R 2.105October ......................... .221 R .561 R .690 .002 -.001 R 1.473 .239 R 1.713 .555 R 2.268November ..................... .231 R .575 R .616 .002 -.003 R 1.422 .233 R 1.654 R .551 R 2.205December ..................... .254 R .683 R .685 .002 -.001 R 1.624 .230 R 1.854 R .570 R 2.423Total ............................. 2.760 7.080 R 7.805 .033 -.013 R 17.665 2.855 R 20.520 R 6.694 R 27.214
1986January ......................... .259 R .757 R .683 .003 (s) R 1.702 .229 R 1.931 R .517 R 2.448February ....................... R .237 R .674 R .631 .003 (s) R 1.545 .229 R 1.774 R .483 R 2.256March ............................ .240 R .667 R .690 .003 -.001 R 1.599 .235 R 1.834 R .528 R 2.362April .............................. .239 R .577 R .636 .003 (s) R 1.455 .234 R 1.689 R .526 R 2.215May ............................... .231 R .544 R .663 .003 -.003 R 1.438 .239 R 1.677 R .583 R 2.260June .............................. .212 R .499 R .620 .003 (s) R 1.335 .238 R 1.573 R .573 R 2.146July ............................... .196 R .490 R .593 .003 -.002 R 1.281 .241 R 1.522 R .600 R 2.122August .......................... .199 R .488 R .632 .002 -.006 R 1.316 .241 R 1.557 R .547 R 2.104September .................... .193 R .448 R .647 .002 (s) R 1.290 .243 R 1.534 R .535 R 2.069October ......................... .198 R .474 R .716 .002 -.001 R 1.389 .244 R 1.633 R .541 R 2.173November ..................... .208 R .499 R .668 .002 -.003 R 1.373 .229 R 1.602 R .550 R 2.152December ..................... .229 R .572 R .741 .002 -.001 R 1.544 .231 R 1.776 R .547 R 2.322Total ............................. R 2.640 6.690 R 7.920 R .033 -.017 R 17.267 2.834 R 20.101 R 6.529 R 26.630
1987January ......................... .225 R .785 R .761 .003 -.001 R 1.772 .227 R 1.999 R .533 R 2.531February ....................... .207 R .684 R .679 .003 .001 R 1.573 .226 R 1.799 R .472 R 2.271March ............................ .206 R .652 R .630 .003 -.002 R 1.489 .235 R 1.724 R .536 R 2.260April .............................. .226 R .589 R .675 .003 (s) R 1.494 .235 R 1.729 R .527 R 2.256May ............................... .218 R .559 R .618 .003 (s) R 1.399 .242 R 1.641 R .587 R 2.228June .............................. .201 R .547 R .666 .003 .002 R 1.418 .251 R 1.669 R .605 R 2.274July ............................... .221 R .532 R .700 .003 (s) R 1.456 .255 R 1.711 R .614 R 2.325August .......................... .224 R .555 R .629 .002 .001 R 1.411 .258 R 1.670 R .595 R 2.265September .................... .218 R .526 R .711 .002 .004 R 1.461 .258 R 1.719 R .539 R 2.258October ......................... .228 R .595 R .721 .002 .002 R 1.548 .253 R 1.801 R .560 R 2.361November ..................... .238 R .618 R .619 .002 .003 R 1.480 .246 R 1.725 R .563 R 2.288December ..................... .262 R .682 R .741 .002 -.001 R 1.687 .243 R 1.929 R .578 R 2.507Total ............................. 2.673 7.323 R 8.150 R .033 .009 R 18.188 2.928 R 21.116 R 6.710 R 27.826
See footnotes at end of table.
Energy Information Administration/Historical Monthly Energy Review 1973-1992 61
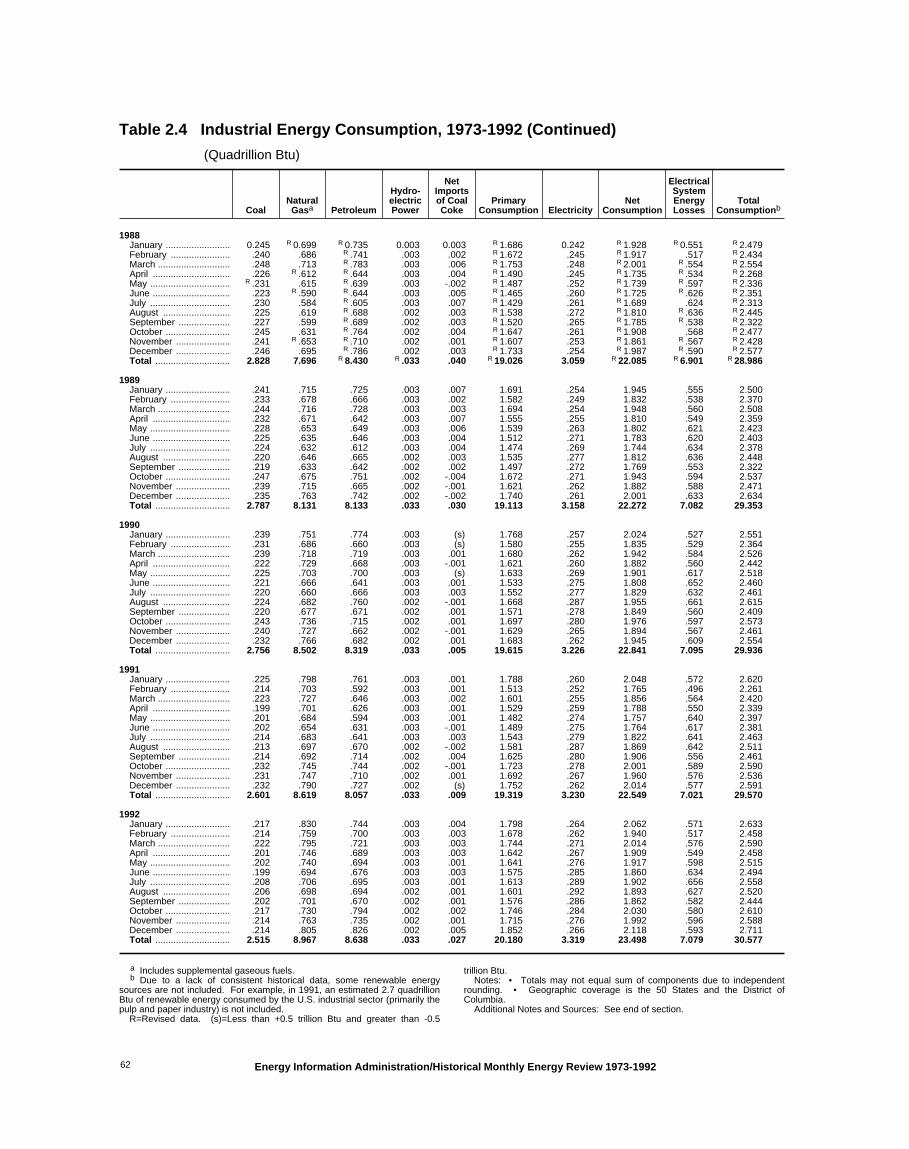
Table 2.4 Industrial Energy Consumption, 1973-1992 (Continued)
(Quadrillion Btu)
CoalNaturalGasa Petroleum
Hydro-electricPower
NetImportsof CoalCoke
PrimaryConsumption Electricity
NetConsumption
ElectricalSystemEnergyLosses
TotalConsumptionb
1988January ......................... 0.245 R 0.699 R 0.735 0.003 0.003 R 1.686 0.242 R 1.928 R 0.551 R 2.479February ....................... .240 .686 R .741 .003 .002 R 1.672 .245 R 1.917 .517 R 2.434March ............................ .248 .713 R .783 .003 .006 R 1.753 .248 R 2.001 R .554 R 2.554April .............................. .226 R .612 R .644 .003 .004 R 1.490 .245 R 1.735 R .534 R 2.268May ............................... R .231 .615 R .639 .003 -.002 R 1.487 .252 R 1.739 R .597 R 2.336June .............................. .223 R .590 R .644 .003 .005 R 1.465 .260 R 1.725 R .626 R 2.351July ............................... .230 .584 R .605 .003 .007 R 1.429 .261 R 1.689 .624 R 2.313August .......................... .225 .619 R .688 .002 .003 R 1.538 .272 R 1.810 R .636 R 2.445September .................... .227 .599 R .689 .002 .003 R 1.520 .265 R 1.785 R .538 R 2.322October ......................... .245 .631 R .764 .002 .004 R 1.647 .261 R 1.908 .568 R 2.477November ..................... .241 R .653 R .710 .002 .001 R 1.607 .253 R 1.861 R .567 R 2.428December ..................... .246 .695 R .786 .002 .003 R 1.733 .254 R 1.987 R .590 R 2.577Total ............................. 2.828 7.696 R 8.430 R .033 .040 R 19.026 3.059 R 22.085 R 6.901 R 28.986
1989January ......................... .241 .715 .725 .003 .007 1.691 .254 1.945 .555 2.500February ....................... .233 .678 .666 .003 .002 1.582 .249 1.832 .538 2.370March ............................ .244 .716 .728 .003 .003 1.694 .254 1.948 .560 2.508April .............................. .232 .671 .642 .003 .007 1.555 .255 1.810 .549 2.359May ............................... .228 .653 .649 .003 .006 1.539 .263 1.802 .621 2.423June .............................. .225 .635 .646 .003 .004 1.512 .271 1.783 .620 2.403July ............................... .224 .632 .612 .003 .004 1.474 .269 1.744 .634 2.378August .......................... .220 .646 .665 .002 .003 1.535 .277 1.812 .636 2.448September .................... .219 .633 .642 .002 .002 1.497 .272 1.769 .553 2.322October ......................... .247 .675 .751 .002 -.004 1.672 .271 1.943 .594 2.537November ..................... .239 .715 .665 .002 -.001 1.621 .262 1.882 .588 2.471December ..................... .235 .763 .742 .002 -.002 1.740 .261 2.001 .633 2.634Total ............................. 2.787 8.131 8.133 .033 .030 19.113 3.158 22.272 7.082 29.353
1990January ......................... .239 .751 .774 .003 (s) 1.768 .257 2.024 .527 2.551February ....................... .231 .686 .660 .003 (s) 1.580 .255 1.835 .529 2.364March ............................ .239 .718 .719 .003 .001 1.680 .262 1.942 .584 2.526April .............................. .222 .729 .668 .003 -.001 1.621 .260 1.882 .560 2.442May ............................... .225 .703 .700 .003 (s) 1.633 .269 1.901 .617 2.518June .............................. .221 .666 .641 .003 .001 1.533 .275 1.808 .652 2.460July ............................... .220 .660 .666 .003 .003 1.552 .277 1.829 .632 2.461August .......................... .224 .682 .760 .002 -.001 1.668 .287 1.955 .661 2.615September .................... .220 .677 .671 .002 .001 1.571 .278 1.849 .560 2.409October ......................... .243 .736 .715 .002 .001 1.697 .280 1.976 .597 2.573November ..................... .240 .727 .662 .002 -.001 1.629 .265 1.894 .567 2.461December ..................... .232 .766 .682 .002 .001 1.683 .262 1.945 .609 2.554Total ............................. 2.756 8.502 8.319 .033 .005 19.615 3.226 22.841 7.095 29.936
1991January ......................... .225 .798 .761 .003 .001 1.788 .260 2.048 .572 2.620February ....................... .214 .703 .592 .003 .001 1.513 .252 1.765 .496 2.261March ............................ .223 .727 .646 .003 .002 1.601 .255 1.856 .564 2.420April .............................. .199 .701 .626 .003 .001 1.529 .259 1.788 .550 2.339May ............................... .201 .684 .594 .003 .001 1.482 .274 1.757 .640 2.397June .............................. .202 .654 .631 .003 -.001 1.489 .275 1.764 .617 2.381July ............................... .214 .683 .641 .003 .003 1.543 .279 1.822 .641 2.463August .......................... .213 .697 .670 .002 -.002 1.581 .287 1.869 .642 2.511September .................... .214 .692 .714 .002 .004 1.625 .280 1.906 .556 2.461October ......................... .232 .745 .744 .002 -.001 1.723 .278 2.001 .589 2.590November ..................... .231 .747 .710 .002 .001 1.692 .267 1.960 .576 2.536December ..................... .232 .790 .727 .002 (s) 1.752 .262 2.014 .577 2.591Total ............................. 2.601 8.619 8.057 .033 .009 19.319 3.230 22.549 7.021 29.570
1992January ......................... .217 .830 .744 .003 .004 1.798 .264 2.062 .571 2.633February ....................... .214 .759 .700 .003 .003 1.678 .262 1.940 .517 2.458March ............................ .222 .795 .721 .003 .003 1.744 .271 2.014 .576 2.590April .............................. .201 .746 .689 .003 .003 1.642 .267 1.909 .549 2.458May ............................... .202 .740 .694 .003 .001 1.641 .276 1.917 .598 2.515June .............................. .199 .694 .676 .003 .003 1.575 .285 1.860 .634 2.494July ............................... .208 .706 .695 .003 .001 1.613 .289 1.902 .656 2.558August .......................... .206 .698 .694 .002 .001 1.601 .292 1.893 .627 2.520September .................... .202 .701 .670 .002 .001 1.576 .286 1.862 .582 2.444October ......................... .217 .730 .794 .002 .002 1.746 .284 2.030 .580 2.610November ..................... .214 .763 .735 .002 .001 1.715 .276 1.992 .596 2.588December ..................... .214 .805 .826 .002 .005 1.852 .266 2.118 .593 2.711Total ............................. 2.515 8.967 8.638 .033 .027 20.180 3.319 23.498 7.079 30.577
a Includes supplemental gaseous fuels.b Due to a lack of consistent historical data, some renewable energy
sources are not included. For example, in 1991, an estimated 2.7 quadrillionBtu of renewable energy consumed by the U.S. industrial sector (primarily thepulp and paper industry) is not included.
R=Revised data. (s)=Less than +0.5 trillion Btu and greater than -0.5
trillion Btu. Notes: • Totals may not equal sum of components due to independent
rounding. • Geographic coverage is the 50 States and the District ofColumbia. Additional Notes and Sources: See end of section.
Energy Information Administration/Historical Monthly Energy Review 1973-199262

Table 2.5 Transportation Energy Consumption, 1973-1992
(Quadrillion Btu)
CoalNaturalGasa Petroleum
PrimaryConsumption Electricity
NetConsumption
ElectricalSystemEnergyLosses
TotalConsumptionb
1973January ....................... 0.000 0.079 1.421 1.500 0.001 1.501 0.002 1.503February ..................... .000 .072 1.337 1.408 .001 1.409 .002 1.411March .......................... (s) .068 1.473 1.541 .001 1.541 .002 1.543April ............................ (s) .062 1.436 1.498 .001 1.499 .001 1.500May ............................. (s) .058 1.563 1.621 .001 1.622 .002 1.623June ............................ (s) .052 1.504 1.556 .001 1.557 .002 1.559July ............................. (s) .052 1.562 1.615 .001 1.615 .002 1.617August ........................ (s) .053 1.606 1.660 .001 1.661 .002 1.663September .................. (s) .051 1.456 1.508 .001 1.509 .002 1.510October ....................... (s) .058 1.535 1.593 .001 1.594 .002 1.596November ................... (s) .064 1.487 1.552 .001 1.553 .002 1.554December ................... (s) .074 1.450 1.523 .001 1.524 .002 1.526Total ........................... .003 .743 17.831 18.576 .008 18.584 .020 18.605
1974January ....................... .000 .072 1.337 1.409 .001 1.410 .002 1.412February ..................... .000 .066 1.247 1.313 .001 1.314 .002 1.316March .......................... (s) .065 1.412 1.477 .001 1.477 .002 1.479April ............................ (s) .055 1.411 1.466 .001 1.467 .002 1.469May ............................. (s) .052 1.520 1.573 .001 1.573 .002 1.575June ............................ (s) .046 1.488 1.535 .001 1.535 .002 1.537July ............................. (s) .049 1.549 1.598 .001 1.598 .002 1.600August ........................ (s) .049 1.565 1.614 .001 1.615 .002 1.617September .................. (s) .050 1.431 1.481 .001 1.482 .002 1.483October ....................... (s) .055 1.517 1.572 .001 1.573 .002 1.574November ................... (s) .059 1.435 1.495 .001 1.495 .002 1.497December ................... (s) .068 1.486 1.554 .001 1.555 .002 1.557Total ........................... .002 .685 17.399 18.086 .009 18.095 .022 18.117
1975January ....................... (s) .068 1.418 1.486 .001 1.487 .002 1.489February ..................... (s) .059 1.274 1.333 .001 1.334 .002 1.336March .......................... .000 .058 1.426 1.484 .001 1.484 .002 1.486April ............................ (s) .048 1.453 1.501 .001 1.502 .002 1.503May ............................. (s) .041 1.518 1.559 .001 1.560 .002 1.562June ............................ (s) .038 1.513 1.551 .001 1.552 .002 1.554July ............................. (s) .040 1.544 1.584 .001 1.585 .002 1.587August ........................ (s) .042 1.558 1.599 .001 1.600 .002 1.602September .................. (s) .042 1.476 1.518 .001 1.519 .002 1.520October ....................... (s) .047 1.523 1.570 .001 1.571 .002 1.573November ................... (s) .050 1.407 1.457 .001 1.457 .002 1.460December ................... (s) .062 1.506 1.568 .001 1.569 .002 1.571Total ........................... .001 .595 17.614 18.209 .010 18.219 .025 18.244
1976January ....................... .000 .064 1.450 1.514 .001 1.515 .002 1.518February ..................... .000 .054 1.351 1.405 .001 1.406 .002 1.408March .......................... .000 .048 1.551 1.599 .001 1.600 .002 1.602April ............................ (s) .042 1.549 1.591 .001 1.592 .002 1.594May ............................. (s) .040 1.539 1.579 .001 1.580 .002 1.582June ............................ (s) .037 1.601 1.638 .001 1.639 .002 1.641July ............................. (s) .038 1.636 1.674 .001 1.675 .002 1.678August ........................ (s) .037 1.596 1.632 .001 1.633 .002 1.635September .................. (s) .036 1.550 1.586 .001 1.587 .002 1.589October ....................... (s) .045 1.548 1.593 .001 1.594 .002 1.596November ................... (s) .053 1.531 1.584 .001 1.585 .002 1.587December ................... (s) .063 1.605 1.668 .001 1.668 .002 1.671Total ........................... (s) .559 18.506 19.065 .010 19.076 .025 19.101
1977January ....................... .000 .067 1.502 1.569 .001 1.570 .002 1.572February ..................... .000 .050 1.436 1.486 .001 1.487 .002 1.489March .......................... .000 .048 1.594 1.642 .001 1.642 .002 1.645April ............................ (s) .040 1.600 1.640 .001 1.641 .002 1.643May ............................. (s) .038 1.601 1.639 .001 1.640 .002 1.642June ............................ (s) .037 1.649 1.686 .001 1.687 .002 1.689July ............................. (s) .037 1.669 1.706 .001 1.706 .002 1.709August ........................ (s) .038 1.692 1.730 .001 1.731 .002 1.733September .................. (s) .040 1.614 1.653 .001 1.654 .002 1.656October ....................... (s) .042 1.624 1.667 .001 1.668 .002 1.670November ................... (s) .047 1.592 1.639 .001 1.640 .002 1.642December ................... .000 .059 1.669 1.728 .001 1.728 .002 1.731Total ........................... (s) .543 19.241 19.784 .010 19.794 .025 19.819
See footnotes at end of table.
Energy Information Administration/Historical Monthly Energy Review 1973-1992 63
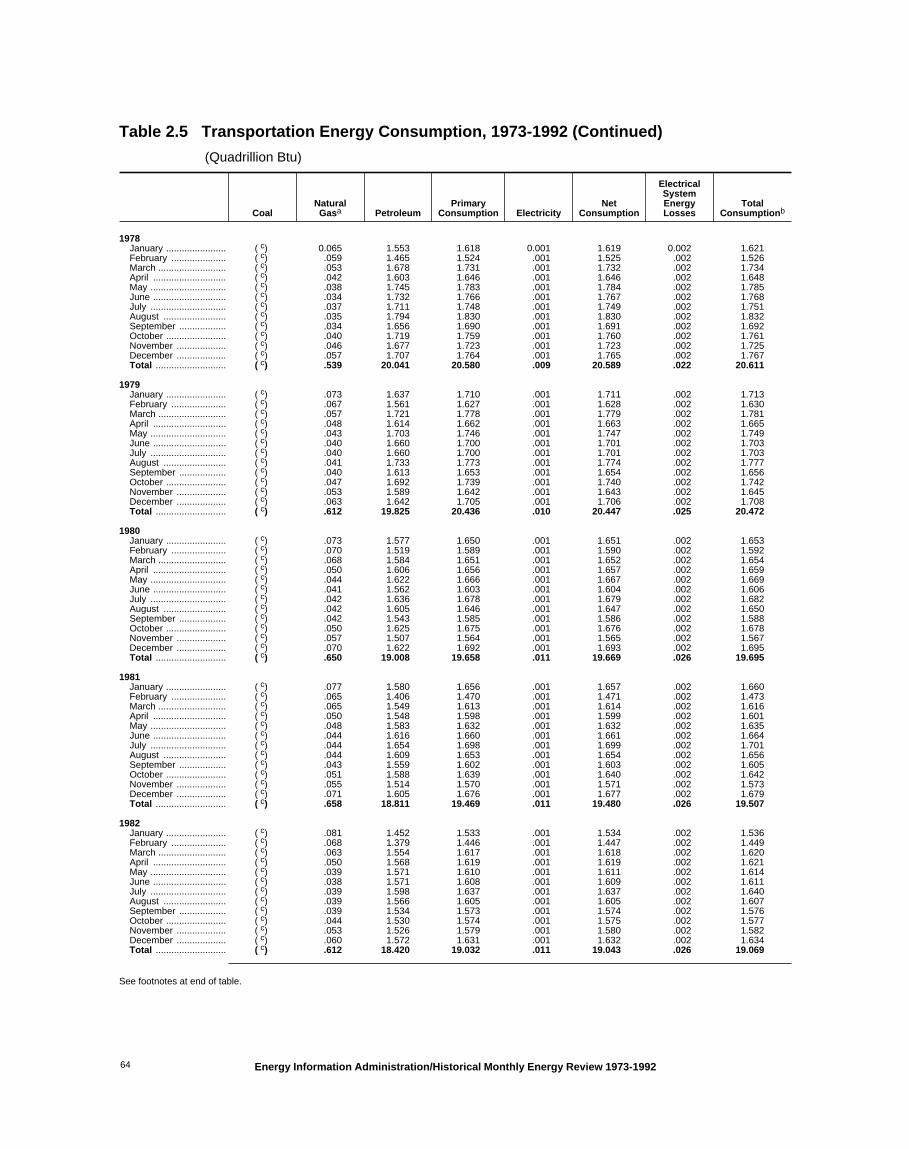
Table 2.5 Transportation Energy Consumption, 1973-1992 (Continued)
(Quadrillion Btu)
CoalNaturalGasa Petroleum
PrimaryConsumption Electricity
NetConsumption
ElectricalSystemEnergyLosses
TotalConsumptionb
1978January ....................... c(� ) 0.065 1.553 1.618 0.001 1.619 0.002 1.621February ..................... c(� ) .059 1.465 1.524 .001 1.525 .002 1.526March .......................... c(� ) .053 1.678 1.731 .001 1.732 .002 1.734April ............................ c(� ) .042 1.603 1.646 .001 1.646 .002 1.648May ............................. c(� ) .038 1.745 1.783 .001 1.784 .002 1.785June ............................ c(� ) .034 1.732 1.766 .001 1.767 .002 1.768July ............................. c(� ) .037 1.711 1.748 .001 1.749 .002 1.751August ........................ c(� ) .035 1.794 1.830 .001 1.830 .002 1.832September .................. c(� ) .034 1.656 1.690 .001 1.691 .002 1.692October ....................... c(� ) .040 1.719 1.759 .001 1.760 .002 1.761November ................... c(� ) .046 1.677 1.723 .001 1.723 .002 1.725December ................... c(� ) .057 1.707 1.764 .001 1.765 .002 1.767Total ........................... c(� ) .539 20.041 20.580 .009 20.589 .022 20.611
1979January ....................... c(� ) .073 1.637 1.710 .001 1.711 .002 1.713February ..................... c(� ) .067 1.561 1.627 .001 1.628 .002 1.630March .......................... c(� ) .057 1.721 1.778 .001 1.779 .002 1.781April ............................ c(� ) .048 1.614 1.662 .001 1.663 .002 1.665May ............................. c(� ) .043 1.703 1.746 .001 1.747 .002 1.749June ............................ c(� ) .040 1.660 1.700 .001 1.701 .002 1.703July ............................. c(� ) .040 1.660 1.700 .001 1.701 .002 1.703August ........................ c(� ) .041 1.733 1.773 .001 1.774 .002 1.777September .................. c(� ) .040 1.613 1.653 .001 1.654 .002 1.656October ....................... c(� ) .047 1.692 1.739 .001 1.740 .002 1.742November ................... c(� ) .053 1.589 1.642 .001 1.643 .002 1.645December ................... c(� ) .063 1.642 1.705 .001 1.706 .002 1.708Total ........................... c(� ) .612 19.825 20.436 .010 20.447 .025 20.472
1980January ....................... c(� ) .073 1.577 1.650 .001 1.651 .002 1.653February ..................... c(� ) .070 1.519 1.589 .001 1.590 .002 1.592March .......................... c(� ) .068 1.584 1.651 .001 1.652 .002 1.654April ............................ c(� ) .050 1.606 1.656 .001 1.657 .002 1.659May ............................. c(� ) .044 1.622 1.666 .001 1.667 .002 1.669June ............................ c(� ) .041 1.562 1.603 .001 1.604 .002 1.606July ............................. c(� ) .042 1.636 1.678 .001 1.679 .002 1.682August ........................ c(� ) .042 1.605 1.646 .001 1.647 .002 1.650September .................. c(� ) .042 1.543 1.585 .001 1.586 .002 1.588October ....................... c(� ) .050 1.625 1.675 .001 1.676 .002 1.678November ................... c(� ) .057 1.507 1.564 .001 1.565 .002 1.567December ................... c(� ) .070 1.622 1.692 .001 1.693 .002 1.695Total ........................... c(� ) .650 19.008 19.658 .011 19.669 .026 19.695
1981January ....................... c(� ) .077 1.580 1.656 .001 1.657 .002 1.660February ..................... c(� ) .065 1.406 1.470 .001 1.471 .002 1.473March .......................... c(� ) .065 1.549 1.613 .001 1.614 .002 1.616April ............................ c(� ) .050 1.548 1.598 .001 1.599 .002 1.601May ............................. c(� ) .048 1.583 1.632 .001 1.632 .002 1.635June ............................ c(� ) .044 1.616 1.660 .001 1.661 .002 1.664July ............................. c(� ) .044 1.654 1.698 .001 1.699 .002 1.701August ........................ c(� ) .044 1.609 1.653 .001 1.654 .002 1.656September .................. c(� ) .043 1.559 1.602 .001 1.603 .002 1.605October ....................... c(� ) .051 1.588 1.639 .001 1.640 .002 1.642November ................... c(� ) .055 1.514 1.570 .001 1.571 .002 1.573December ................... c(� ) .071 1.605 1.676 .001 1.677 .002 1.679Total ........................... c(� ) .658 18.811 19.469 .011 19.480 .026 19.507
1982January ....................... c(� ) .081 1.452 1.533 .001 1.534 .002 1.536February ..................... c(� ) .068 1.379 1.446 .001 1.447 .002 1.449March .......................... c(� ) .063 1.554 1.617 .001 1.618 .002 1.620April ............................ c(� ) .050 1.568 1.619 .001 1.619 .002 1.621May ............................. c(� ) .039 1.571 1.610 .001 1.611 .002 1.614June ............................ c(� ) .038 1.571 1.608 .001 1.609 .002 1.611July ............................. c(� ) .039 1.598 1.637 .001 1.637 .002 1.640August ........................ c(� ) .039 1.566 1.605 .001 1.605 .002 1.607September .................. c(� ) .039 1.534 1.573 .001 1.574 .002 1.576October ....................... c(� ) .044 1.530 1.574 .001 1.575 .002 1.577November ................... c(� ) .053 1.526 1.579 .001 1.580 .002 1.582December ................... c(� ) .060 1.572 1.631 .001 1.632 .002 1.634Total ........................... c(� ) .612 18.420 19.032 .011 19.043 .026 19.069
See footnotes at end of table.
Energy Information Administration/Historical Monthly Energy Review 1973-199264

Table 2.5 Transportation Energy Consumption, 1973-1992 (Continued)
(Quadrillion Btu)
CoalNaturalGasa Petroleum
PrimaryConsumption Electricity
NetConsumption
ElectricalSystemEnergyLosses
TotalConsumptionb
1983January ....................... c(� ) R 0.053 1.442 R 1.495 0.001 R 1.496 0.002 R 1.498February ..................... c(� ) R .042 1.325 R 1.367 .001 R 1.368 .002 R 1.370March .......................... c(� ) R .044 1.608 R 1.652 .001 R 1.653 .002 R 1.656April ............................ c(� ) R .039 1.496 R 1.535 .001 R 1.536 .002 R 1.538May ............................. c(� ) R .040 1.564 R 1.605 .001 R 1.605 .002 R 1.607June ............................ c(� ) R .040 1.606 R 1.646 .001 R 1.647 .002 R 1.649July ............................. c(� ) R .042 1.613 R 1.655 .001 R 1.656 .002 R 1.659August ........................ c(� ) R .041 1.639 R 1.680 .001 R 1.681 .002 R 1.683September .................. c(� ) R .038 1.562 R 1.600 .001 R 1.601 .002 R 1.603October ....................... c(� ) R .040 1.575 R 1.616 .001 R 1.616 .002 R 1.618November ................... c(� ) R .040 1.516 R 1.556 .001 R 1.557 .002 R 1.559December ................... c(� ) R .046 1.644 R 1.690 .001 R 1.691 .002 R 1.693Total ........................... c(� ) .505 18.593 19.098 .011 19.109 .026 19.135
1984January ....................... c(� ) .057 R 1.531 R 1.588 .001 R 1.589 .002 R 1.591February ..................... c(� ) .045 R 1.421 R 1.466 .001 R 1.467 .002 R 1.469March .......................... c(� ) .047 R 1.577 R 1.625 .001 R 1.626 .002 R 1.628April ............................ c(� ) .042 R 1.571 R 1.613 .001 R 1.614 .002 R 1.616May ............................. c(� ) .043 R 1.661 R 1.704 .001 R 1.705 .002 R 1.707June ............................ c(� ) .043 R 1.644 R 1.687 .001 R 1.688 .002 R 1.691July ............................. c(� ) .045 R 1.673 R 1.718 .001 R 1.719 .002 R 1.721August ........................ c(� ) .044 R 1.732 R 1.776 .001 R 1.777 .003 R 1.779September .................. c(� ) .041 R 1.570 R 1.611 .001 R 1.612 .002 R 1.615October ....................... c(� ) .043 R 1.647 R 1.690 .001 R 1.691 .002 R 1.694November ................... c(� ) .043 R 1.587 R 1.630 .001 R 1.631 .002 R 1.633December ................... c(� ) .049 R 1.603 R 1.653 .001 R 1.654 .002 R 1.656Total ........................... c(� ) .545 R 19.216 R 19.761 .012 R 19.773 .028 R 19.801
1985January ....................... c(� ) .056 R 1.546 R 1.602 .001 R 1.603 .003 R 1.606February ..................... c(� ) .047 R 1.432 R 1.480 .001 R 1.481 .002 R 1.483March .......................... c(� ) .043 R 1.613 R 1.657 .001 R 1.658 .002 R 1.660April ............................ c(� ) .040 R 1.632 R 1.673 .001 R 1.674 .002 R 1.676May ............................. c(� ) .041 R 1.688 R 1.729 .001 R 1.730 .003 R 1.733June ............................ c(� ) .039 R 1.634 R 1.673 .001 R 1.674 .003 R 1.677July ............................. c(� ) .041 R 1.707 R 1.748 .001 R 1.749 .003 R 1.752August ........................ c(� ) .040 R 1.749 R 1.789 .001 R 1.790 .003 R 1.793September .................. c(� ) .038 R 1.577 R 1.615 .001 R 1.616 .002 R 1.618October ....................... c(� ) .040 R 1.679 R 1.719 .001 R 1.720 .002 R 1.723November ................... c(� ) .040 R 1.591 R 1.631 .001 R 1.633 .003 R 1.635December ................... c(� ) .053 R 1.656 R 1.708 .001 R 1.709 .003 R 1.712Total ........................... c(� ) .519 R 19.504 R 20.024 .013 R 20.036 .030 R 20.067
1986January ....................... c(� ) R .052 R 1.592 R 1.644 .001 R 1.645 .003 R 1.647February ..................... c(� ) R .045 R 1.442 R 1.487 .001 R 1.488 .002 R 1.490March .......................... c(� ) R .044 R 1.682 R 1.726 .001 R 1.727 .002 R 1.729April ............................ c(� ) .037 R 1.670 R 1.707 .001 R 1.708 .002 R 1.710May ............................. c(� ) .039 R 1.732 R 1.772 .001 R 1.773 .003 R 1.775June ............................ c(� ) .038 R 1.715 R 1.753 .001 R 1.755 .003 R 1.757July ............................. c(� ) .039 R 1.809 R 1.849 .001 R 1.850 .003 R 1.853August ........................ c(� ) .039 R 1.819 R 1.858 .001 R 1.859 .003 R 1.862September .................. c(� ) .037 R 1.654 R 1.692 .001 R 1.693 R .003 R 1.695October ....................... c(� ) .039 R 1.756 R 1.795 .001 R 1.796 .002 R 1.799November ................... c(� ) .039 R 1.648 R 1.687 .001 R 1.688 .002 R 1.690December ................... c(� ) R .049 R 1.750 R 1.798 .001 R 1.799 .003 R 1.802Total ........................... c(� ) .499 R 20.269 R 20.768 .013 R 20.781 R .031 R 20.812
1987January ....................... c(� ) .055 R 1.627 R 1.682 .001 R 1.683 .003 R 1.685February ..................... c(� ) R .047 R 1.529 R 1.575 .001 R 1.577 .002 R 1.579March .......................... c(� ) R .046 R 1.724 R 1.770 .001 R 1.771 .002 R 1.773April ............................ c(� ) .043 R 1.727 R 1.771 .001 R 1.772 .002 R 1.774May ............................. c(� ) .043 R 1.805 R 1.849 .001 R 1.850 .003 R 1.852June ............................ c(� ) .041 R 1.780 R 1.821 .001 R 1.822 .003 R 1.825July ............................. c(� ) .039 R 1.854 R 1.893 .001 R 1.895 .003 R 1.897August ........................ c(� ) .041 R 1.823 R 1.864 .001 R 1.865 .003 R 1.868September .................. c(� ) .039 R 1.719 R 1.758 .001 R 1.759 .002 R 1.761October ....................... c(� ) .042 R 1.807 R 1.850 .001 R 1.851 .002 R 1.853November ................... c(� ) R .045 R 1.695 R 1.739 .001 R 1.740 .002 R 1.743December ................... c(� ) .053 R 1.781 R 1.834 .001 R 1.835 .003 R 1.838Total ........................... c(� ) .535 R 20.871 R 21.406 .013 R 21.419 .029 R 21.448
See footnotes at end of table.
Energy Information Administration/Historical Monthly Energy Review 1973-1992 65

Table 2.5 Transportation Energy Consumption, 1973-1992 (Continued)
(Quadrillion Btu)
CoalNaturalGasa Petroleum
PrimaryConsumption Electricity
NetConsumption
ElectricalSystemEnergyLosses
TotalConsumptionb
1988January ....................... c(� ) 0.065 R 1.714 R 1.779 0.001 R 1.780 0.003 R 1.783February ..................... c(� ) .057 R 1.654 R 1.711 .001 R 1.712 .002 R 1.714March .......................... c(� ) .055 R 1.814 R 1.868 .001 R 1.869 .002 R 1.872April ............................ c(� ) .047 R 1.779 R 1.826 .001 R 1.827 .002 R 1.830May ............................. c(� ) .050 R 1.823 R 1.874 .001 R 1.875 .003 R 1.877June ............................ c(� ) .048 R 1.859 R 1.907 .001 R 1.908 .003 R 1.911July ............................. c(� ) .050 R 1.867 R 1.918 .001 R 1.919 .003 R 1.922August ........................ c(� ) .050 R 1.886 R 1.937 .001 R 1.938 .003 R 1.941September .................. c(� ) .048 R 1.788 R 1.837 .001 R 1.838 .002 R 1.840October ....................... c(� ) .050 R 1.835 R 1.885 .001 R 1.886 .003 R 1.889November ................... c(� ) .052 R 1.774 R 1.826 .001 R 1.827 .002 R 1.830December ................... c(� ) .058 R 1.835 R 1.892 .001 R 1.894 .003 R 1.896Total ........................... c(� ) .632 R 21.629 R 22.260 .014 R 22.274 .031 R 22.305
1989January ....................... c(� ) .059 1.740 1.798 .001 1.799 .002 1.802February ..................... c(� ) .059 1.633 1.691 .001 1.693 .002 1.695March .......................... c(� ) .056 1.869 1.924 .001 1.926 .002 1.928April ............................ c(� ) .050 1.750 1.800 .001 1.801 .002 1.803May ............................. c(� ) .053 1.849 1.902 .001 1.903 .003 1.906June ............................ c(� ) .051 1.888 1.940 .001 1.941 .003 1.943July ............................. c(� ) .051 1.857 1.909 .001 1.910 .003 1.913August ........................ c(� ) .051 1.941 1.992 .001 1.993 .003 1.996September .................. c(� ) .049 1.790 1.839 .001 1.840 .002 1.843October ....................... c(� ) .050 1.857 1.907 .001 1.908 .002 1.911November ................... c(� ) .051 1.802 1.854 .001 1.855 .002 1.857December ................... c(� ) .067 1.893 1.960 .001 1.962 .003 1.964Total ........................... c(� ) .649 21.868 22.517 .014 22.530 .031 22.561
1990January ....................... c(� ) .079 1.739 1.818 .001 1.819 .002 1.822February ..................... c(� ) .068 1.649 1.717 .001 1.718 .002 1.720March .......................... c(� ) .066 1.854 1.919 .001 1.920 .002 1.923April ............................ c(� ) .058 1.779 1.837 .001 1.838 .002 1.840May ............................. c(� ) .050 1.877 1.927 .001 1.928 .003 1.931June ............................ c(� ) .046 1.847 1.893 .001 1.894 .003 1.897July ............................. c(� ) .045 1.902 1.947 .001 1.949 .003 1.952August ........................ c(� ) .046 1.972 2.018 .001 2.019 .003 2.022September .................. c(� ) .045 1.749 1.794 .001 1.796 .002 1.798October ....................... c(� ) .050 1.861 1.911 .001 1.912 .003 1.915November ................... c(� ) .056 1.792 1.848 .001 1.849 .002 1.851December ................... c(� ) .072 1.789 1.860 .001 1.862 .003 1.864Total ........................... c(� ) .680 21.810 22.490 .014 22.504 .031 22.535
1991January ....................... c(� ) .076 1.718 1.794 .001 1.795 .003 1.798February ..................... c(� ) .063 1.588 1.652 .001 1.653 .002 1.655March .......................... c(� ) .060 1.780 1.841 .001 1.842 .002 1.844April ............................ c(� ) .050 1.732 1.783 .001 1.784 .002 1.786May ............................. c(� ) .043 1.838 1.881 .001 1.882 .003 1.885June ............................ c(� ) .038 1.823 1.862 .001 1.863 .003 1.866July ............................. c(� ) .041 1.910 1.951 .001 1.952 .003 1.955August ........................ c(� ) .041 1.911 1.952 .001 1.953 .003 1.956September .................. c(� ) .040 1.761 1.800 .001 1.802 .002 1.804October ....................... c(� ) .046 1.846 1.892 .001 1.893 .002 1.896November ................... c(� ) .055 1.726 1.782 .001 1.783 .002 1.785December ................... c(� ) .066 1.821 1.887 .001 1.889 .002 1.891Total ........................... c(� ) .620 21.456 22.076 .014 22.090 .030 22.120
1992January ....................... c(� ) .070 1.754 1.825 .001 1.826 .002 1.828February ..................... c(� ) .064 1.651 1.715 .001 1.716 .002 1.718March .......................... c(� ) .060 1.803 1.863 .001 1.864 .002 1.866April ............................ c(� ) .052 1.781 1.833 .001 1.834 .002 1.837May ............................. c(� ) .044 1.852 1.896 .001 1.897 .002 1.899June ............................ c(� ) .039 1.835 1.874 .001 1.875 .003 1.878July ............................. c(� ) .040 1.922 1.962 .001 1.963 .003 1.966August ........................ c(� ) .039 1.912 1.950 .001 1.952 .003 1.954September .................. c(� ) .038 1.803 1.841 .001 1.842 .002 1.844October ....................... c(� ) .042 1.868 1.910 .001 1.911 .002 1.914November ................... c(� ) .052 1.765 1.817 .001 1.818 .002 1.820December ................... c(� ) .066 1.866 1.932 .001 1.933 .003 1.936Total ........................... c(� ) .606 21.812 22.418 .014 22.432 .029 22.461
a Pipeline fuel only, including supplemental gaseous fuels.b Due to a lack of consistent historical data, some renewable energy
sources are not included. For example, in 1991, an estimated 0.1 quadrillionBtu of renewable energy consumed by the U.S. transportation sector is notincluded.
c Since 1978, the small amounts of coal consumed for transportation have
been reported as industrial sector consumption.R=Revised data. (s)=Less than 0.5 trillion Btu. Notes: • Totals may not equal sum of components due to independent
rounding. • Geographic coverage is the 50 States and the District ofColumbia. Additional Notes and Sources: See end of section.
Energy Information Administration/Historical Monthly Energy Review 1973-199266
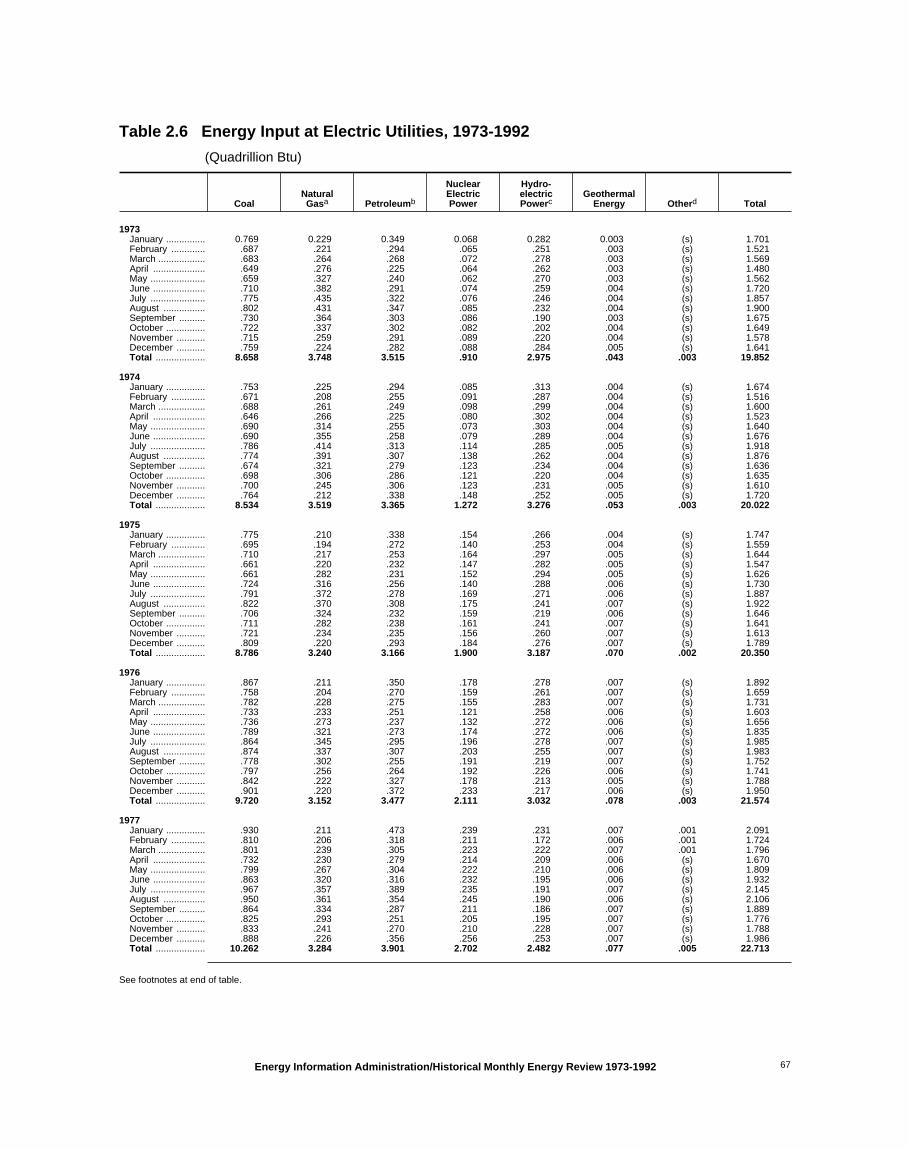
Table 2.6 Energy Input at Electric Utilities, 1973-1992
(Quadrillion Btu)
CoalNaturalGasa Petroleumb
NuclearElectricPower
Hydro-electricPowerc
GeothermalEnergy Otherd Total
1973January ............... 0.769 0.229 0.349 0.068 0.282 0.003 (s) 1.701February ............. .687 .221 .294 .065 .251 .003 (s) 1.521March .................. .683 .264 .268 .072 .278 .003 (s) 1.569April .................... .649 .276 .225 .064 .262 .003 (s) 1.480May ..................... .659 .327 .240 .062 .270 .003 (s) 1.562June .................... .710 .382 .291 .074 .259 .004 (s) 1.720July ..................... .775 .435 .322 .076 .246 .004 (s) 1.857August ................ .802 .431 .347 .085 .232 .004 (s) 1.900September .......... .730 .364 .303 .086 .190 .003 (s) 1.675October ............... .722 .337 .302 .082 .202 .004 (s) 1.649November ........... .715 .259 .291 .089 .220 .004 (s) 1.578December ........... .759 .224 .282 .088 .284 .005 (s) 1.641Total ................... 8.658 3.748 3.515 .910 2.975 .043 .003 19.852
1974January ............... .753 .225 .294 .085 .313 .004 (s) 1.674February ............. .671 .208 .255 .091 .287 .004 (s) 1.516March .................. .688 .261 .249 .098 .299 .004 (s) 1.600April .................... .646 .266 .225 .080 .302 .004 (s) 1.523May ..................... .690 .314 .255 .073 .303 .004 (s) 1.640June .................... .690 .355 .258 .079 .289 .004 (s) 1.676July ..................... .786 .414 .313 .114 .285 .005 (s) 1.918August ................ .774 .391 .307 .138 .262 .004 (s) 1.876September .......... .674 .321 .279 .123 .234 .004 (s) 1.636October ............... .698 .306 .286 .121 .220 .004 (s) 1.635November ........... .700 .245 .306 .123 .231 .005 (s) 1.610December ........... .764 .212 .338 .148 .252 .005 (s) 1.720Total ................... 8.534 3.519 3.365 1.272 3.276 .053 .003 20.022
1975January ............... .775 .210 .338 .154 .266 .004 (s) 1.747February ............. .695 .194 .272 .140 .253 .004 (s) 1.559March .................. .710 .217 .253 .164 .297 .005 (s) 1.644April .................... .661 .220 .232 .147 .282 .005 (s) 1.547May ..................... .661 .282 .231 .152 .294 .005 (s) 1.626June .................... .724 .316 .256 .140 .288 .006 (s) 1.730July ..................... .791 .372 .278 .169 .271 .006 (s) 1.887August ................ .822 .370 .308 .175 .241 .007 (s) 1.922September .......... .706 .324 .232 .159 .219 .006 (s) 1.646October ............... .711 .282 .238 .161 .241 .007 (s) 1.641November ........... .721 .234 .235 .156 .260 .007 (s) 1.613December ........... .809 .220 .293 .184 .276 .007 (s) 1.789Total ................... 8.786 3.240 3.166 1.900 3.187 .070 .002 20.350
1976January ............... .867 .211 .350 .178 .278 .007 (s) 1.892February ............. .758 .204 .270 .159 .261 .007 (s) 1.659March .................. .782 .228 .275 .155 .283 .007 (s) 1.731April .................... .733 .233 .251 .121 .258 .006 (s) 1.603May ..................... .736 .273 .237 .132 .272 .006 (s) 1.656June .................... .789 .321 .273 .174 .272 .006 (s) 1.835July ..................... .864 .345 .295 .196 .278 .007 (s) 1.985August ................ .874 .337 .307 .203 .255 .007 (s) 1.983September .......... .778 .302 .255 .191 .219 .007 (s) 1.752October ............... .797 .256 .264 .192 .226 .006 (s) 1.741November ........... .842 .222 .327 .178 .213 .005 (s) 1.788December ........... .901 .220 .372 .233 .217 .006 (s) 1.950Total ................... 9.720 3.152 3.477 2.111 3.032 .078 .003 21.574
1977January ............... .930 .211 .473 .239 .231 .007 .001 2.091February ............. .810 .206 .318 .211 .172 .006 .001 1.724March .................. .801 .239 .305 .223 .222 .007 .001 1.796April .................... .732 .230 .279 .214 .209 .006 (s) 1.670May ..................... .799 .267 .304 .222 .210 .006 (s) 1.809June .................... .863 .320 .316 .232 .195 .006 (s) 1.932July ..................... .967 .357 .389 .235 .191 .007 (s) 2.145August ................ .950 .361 .354 .245 .190 .006 (s) 2.106September .......... .864 .334 .287 .211 .186 .007 (s) 1.889October ............... .825 .293 .251 .205 .195 .007 (s) 1.776November ........... .833 .241 .270 .210 .228 .007 (s) 1.788December ........... .888 .226 .356 .256 .253 .007 (s) 1.986Total ................... 10.262 3.284 3.901 2.702 2.482 .077 .005 22.713
See footnotes at end of table.
Energy Information Administration/Historical Monthly Energy Review 1973-1992 67
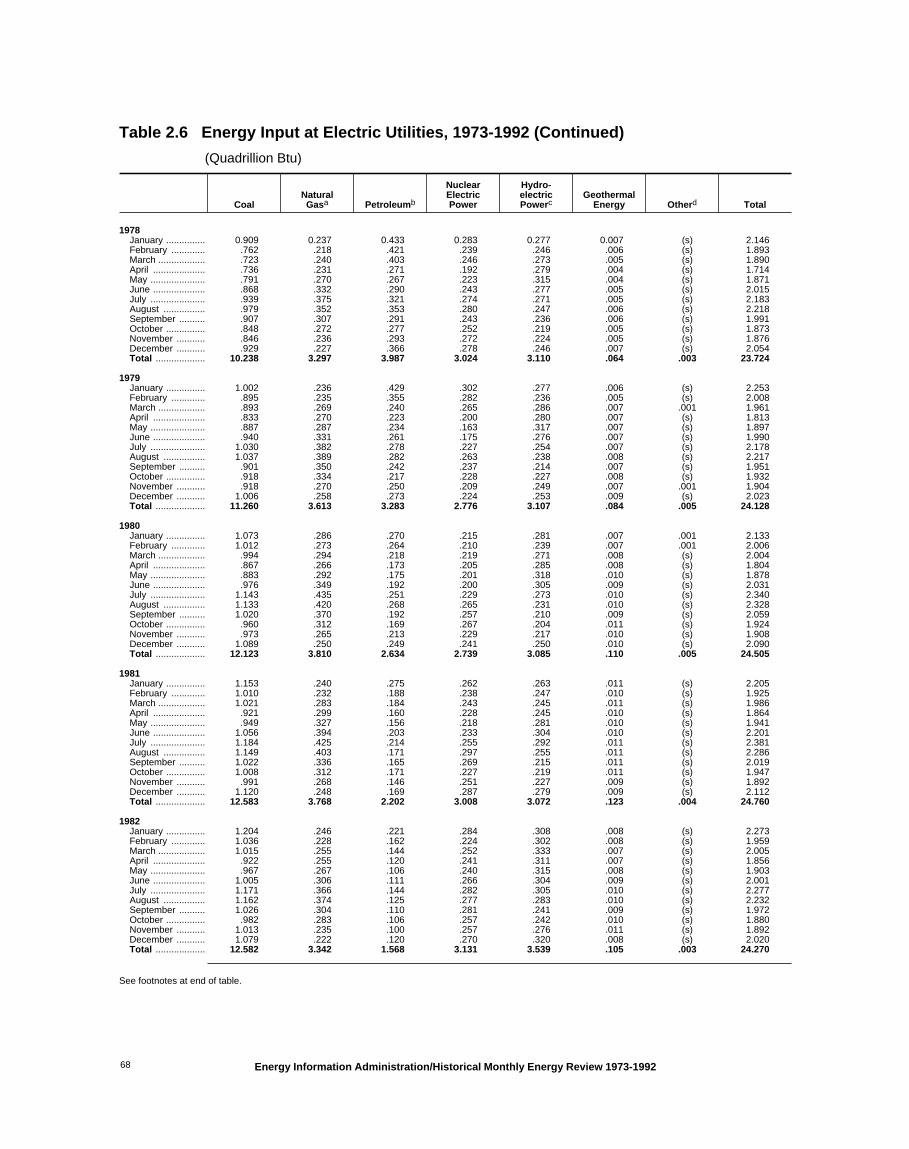
Table 2.6 Energy Input at Electric Utilities, 1973-1992 (Continued)
(Quadrillion Btu)
CoalNaturalGasa Petroleumb
NuclearElectricPower
Hydro-electricPowerc
GeothermalEnergy Otherd Total
1978January ............... 0.909 0.237 0.433 0.283 0.277 0.007 (s) 2.146February ............. .762 .218 .421 .239 .246 .006 (s) 1.893March .................. .723 .240 .403 .246 .273 .005 (s) 1.890April .................... .736 .231 .271 .192 .279 .004 (s) 1.714May ..................... .791 .270 .267 .223 .315 .004 (s) 1.871June .................... .868 .332 .290 .243 .277 .005 (s) 2.015July ..................... .939 .375 .321 .274 .271 .005 (s) 2.183August ................ .979 .352 .353 .280 .247 .006 (s) 2.218September .......... .907 .307 .291 .243 .236 .006 (s) 1.991October ............... .848 .272 .277 .252 .219 .005 (s) 1.873November ........... .846 .236 .293 .272 .224 .005 (s) 1.876December ........... .929 .227 .366 .278 .246 .007 (s) 2.054Total ................... 10.238 3.297 3.987 3.024 3.110 .064 .003 23.724
1979January ............... 1.002 .236 .429 .302 .277 .006 (s) 2.253February ............. .895 .235 .355 .282 .236 .005 (s) 2.008March .................. .893 .269 .240 .265 .286 .007 .001 1.961April .................... .833 .270 .223 .200 .280 .007 (s) 1.813May ..................... .887 .287 .234 .163 .317 .007 (s) 1.897June .................... .940 .331 .261 .175 .276 .007 (s) 1.990July ..................... 1.030 .382 .278 .227 .254 .007 (s) 2.178August ................ 1.037 .389 .282 .263 .238 .008 (s) 2.217September .......... .901 .350 .242 .237 .214 .007 (s) 1.951October ............... .918 .334 .217 .228 .227 .008 (s) 1.932November ........... .918 .270 .250 .209 .249 .007 .001 1.904December ........... 1.006 .258 .273 .224 .253 .009 (s) 2.023Total ................... 11.260 3.613 3.283 2.776 3.107 .084 .005 24.128
1980January ............... 1.073 .286 .270 .215 .281 .007 .001 2.133February ............. 1.012 .273 .264 .210 .239 .007 .001 2.006March .................. .994 .294 .218 .219 .271 .008 (s) 2.004April .................... .867 .266 .173 .205 .285 .008 (s) 1.804May ..................... .883 .292 .175 .201 .318 .010 (s) 1.878June .................... .976 .349 .192 .200 .305 .009 (s) 2.031July ..................... 1.143 .435 .251 .229 .273 .010 (s) 2.340August ................ 1.133 .420 .268 .265 .231 .010 (s) 2.328September .......... 1.020 .370 .192 .257 .210 .009 (s) 2.059October ............... .960 .312 .169 .267 .204 .011 (s) 1.924November ........... .973 .265 .213 .229 .217 .010 (s) 1.908December ........... 1.089 .250 .249 .241 .250 .010 (s) 2.090Total ................... 12.123 3.810 2.634 2.739 3.085 .110 .005 24.505
1981January ............... 1.153 .240 .275 .262 .263 .011 (s) 2.205February ............. 1.010 .232 .188 .238 .247 .010 (s) 1.925March .................. 1.021 .283 .184 .243 .245 .011 (s) 1.986April .................... .921 .299 .160 .228 .245 .010 (s) 1.864May ..................... .949 .327 .156 .218 .281 .010 (s) 1.941June .................... 1.056 .394 .203 .233 .304 .010 (s) 2.201July ..................... 1.184 .425 .214 .255 .292 .011 (s) 2.381August ................ 1.149 .403 .171 .297 .255 .011 (s) 2.286September .......... 1.022 .336 .165 .269 .215 .011 (s) 2.019October ............... 1.008 .312 .171 .227 .219 .011 (s) 1.947November ........... .991 .268 .146 .251 .227 .009 (s) 1.892December ........... 1.120 .248 .169 .287 .279 .009 (s) 2.112Total ................... 12.583 3.768 2.202 3.008 3.072 .123 .004 24.760
1982January ............... 1.204 .246 .221 .284 .308 .008 (s) 2.273February ............. 1.036 .228 .162 .224 .302 .008 (s) 1.959March .................. 1.015 .255 .144 .252 .333 .007 (s) 2.005April .................... .922 .255 .120 .241 .311 .007 (s) 1.856May ..................... .967 .267 .106 .240 .315 .008 (s) 1.903June .................... 1.005 .306 .111 .266 .304 .009 (s) 2.001July ..................... 1.171 .366 .144 .282 .305 .010 (s) 2.277August ................ 1.162 .374 .125 .277 .283 .010 (s) 2.232September .......... 1.026 .304 .110 .281 .241 .009 (s) 1.972October ............... .982 .283 .106 .257 .242 .010 (s) 1.880November ........... 1.013 .235 .100 .257 .276 .011 (s) 1.892December ........... 1.079 .222 .120 .270 .320 .008 (s) 2.020Total ................... 12.582 3.342 1.568 3.131 3.539 .105 .003 24.270
See footnotes at end of table.
Energy Information Administration/Historical Monthly Energy Review 1973-199268

Table 2.6 Energy Input at Electric Utilities, 1973-1992 (Continued)
(Quadrillion Btu)
CoalNaturalGasa Petroleumb
NuclearElectricPower
Hydro-electricPowerc
GeothermalEnergy Otherd Total
1983January ............... 1.128 0.215 0.137 0.273 0.336 0.010 (s) 2.100February ............. .967 .182 .134 .242 .323 .008 (s) 1.857March .................. .996 .214 .133 .261 .347 .009 (s) 1.960April .................... .921 .209 .110 .244 .344 .009 (s) 1.836May ..................... .965 .225 .097 .240 .351 .007 (s) 1.886June .................... 1.064 .255 .119 .263 .351 .009 (s) 2.062July ..................... 1.276 .324 .156 .279 .328 .011 (s) 2.375August ................ 1.348 .363 .158 .286 .306 .015 (s) 2.476September .......... 1.146 .307 .123 .273 .266 .014 (s) 2.129October ............... 1.071 .259 .106 .281 .255 .014 (s) 1.987November ........... 1.082 .221 .099 .273 .292 .013 (s) 1.980December ........... 1.249 .225 .171 .287 .366 .010 .001 2.310Total ................... 13.213 2.998 1.544 3.203 3.866 .129 .004 24.956
1984January ............... 1.271 .223 .169 .318 R .343 .010 .001 R 2.334February ............. 1.103 .194 .108 .308 R .320 .013 (s) R 2.046March .................. 1.151 .213 .115 .296 R .347 .014 .001 R 2.138April .................... 1.004 .228 .081 .263 R .343 .014 .001 R 1.932May ..................... 1.045 .274 .090 .280 R .365 .013 .001 R 2.068June .................... 1.202 .308 .121 .274 R .332 .013 .001 R 2.251July ..................... 1.274 .361 .111 .307 R .325 .012 .001 R 2.391August ................ 1.338 .362 .137 .320 R .309 .015 .001 R 2.482September .......... 1.140 .301 .083 .316 R .256 .014 .001 R 2.111October ............... 1.155 .279 .084 .269 R .259 .015 .001 R 2.063November ........... 1.144 .253 .100 .266 R .266 .015 .001 R 2.046December ........... 1.193 .225 .086 .335 R .303 .017 .001 R 2.159Total ................... 14.020 3.220 1.286 3.553 R 3.767 .165 .009 R 26.020
1985January ............... 1.334 .235 .132 .391 R .318 .016 .001 R 2.427February ............. 1.163 .210 .101 .333 R .295 .015 .001 R 2.119March .................. 1.148 .215 .077 .336 R .295 .017 .001 R 2.090April .................... 1.067 .243 .066 .286 R .285 .015 .001 R 1.962May ..................... 1.144 .245 .075 .310 R .310 .015 .001 R 2.102June .................... 1.208 .293 .083 .333 R .286 .015 .001 R 2.219July ..................... 1.347 .349 .090 .380 R .267 .016 .001 R 2.451August ................ 1.322 .368 .107 .376 R .256 .017 .001 R 2.448September .......... 1.190 .285 .082 .373 R .235 .016 .001 R 2.182October ............... 1.152 .259 .082 .337 R .245 .016 .001 R 2.092November ........... 1.138 .239 .075 .326 R .273 .019 .001 R 2.072December ........... 1.329 .218 .120 .365 R .299 .021 .001 R 2.354Total ................... 14.542 3.160 1.090 4.149 R 3.365 .198 .015 R 26.519
1986January ............... 1.350 .190 .119 .391 R .261 .021 .001 R 2.334February ............. 1.161 .162 .101 .353 R .271 .018 .001 R 2.068March .................. 1.136 .175 .107 .332 R .322 .019 .001 R 2.094April .................... 1.014 .205 .097 .329 R .312 .017 .001 R 1.976May ..................... 1.084 .239 .111 .345 R .314 .017 .001 R 2.111June .................... 1.242 .269 .123 .338 R .302 .019 .001 R 2.294July ..................... 1.434 .311 .173 .388 R .283 .020 .001 R 2.610August ................ 1.301 .286 .163 .405 R .261 .020 .001 R 2.436September .......... 1.192 .255 .115 .395 R .256 .017 .001 R 2.231October ............... 1.141 .224 .105 .391 R .254 .016 .001 R 2.133November ........... 1.142 .193 .112 .377 R .272 .014 .001 R 2.111December ........... 1.246 .181 .126 .426 R .305 .019 .001 R 2.305Total ................... 14.444 2.691 1.452 4.471 R 3.413 .219 .012 R 26.703
1987January ............... 1.319 .191 .128 .431 R .305 .019 .001 R 2.395February ............. 1.135 .163 .111 .394 R .266 .018 .001 R 2.089March .................. 1.155 .197 .107 .402 R .288 .019 .001 R 2.169April .................... 1.087 .213 .084 .361 R .277 .018 .001 R 2.041May ..................... 1.194 .250 .086 .370 R .289 .019 .001 R 2.210June .................... 1.342 .293 .112 .394 R .260 .020 .002 R 2.422July ..................... 1.495 .329 .134 .432 R .259 .020 .002 R 2.670August ................ 1.481 .349 .120 .446 R .239 .020 .002 R 2.657September .......... 1.253 .277 .082 .427 R .223 .019 .001 R 2.282October ............... 1.207 .246 .073 .393 R .221 .019 .001 R 2.160November ........... 1.183 .224 .103 .403 R .206 .018 .001 R 2.138December ........... 1.322 .203 .117 .453 R .251 .019 .001 R 2.366Total ................... 15.173 2.935 1.257 4.906 R 3.084 .229 .016 R 27.600
See footnotes at end of table.
Energy Information Administration/Historical Monthly Energy Review 1973-1992 69

Table 2.6 Energy Input at Electric Utilities, 1973-1992 (Continued)
(Quadrillion Btu)
CoalNaturalGasa Petroleumb
NuclearElectricPower
Hydro-electricPowerc
GeothermalEnergy Otherd Total
1988January ............... 1.418 0.172 0.170 0.480 R 0.260 0.019 0.001 R 2.521February ............. 1.283 .174 .123 .454 R .231 .016 .001 R 2.283March .................. 1.228 .210 .102 .472 R .234 .019 .001 R 2.265April .................... 1.131 .205 .079 .430 R .223 .017 .001 R 2.088May ..................... 1.181 .247 .076 .437 R .242 .017 .001 R 2.201June .................... 1.366 .288 .105 .474 R .221 .018 .002 R 2.473July ..................... 1.500 .337 .149 .535 R .210 .020 .002 R 2.752August ................ 1.573 .354 .171 .527 R .208 .019 .002 R 2.853September .......... 1.286 .239 .105 .497 R .193 .018 .002 R 2.340October ............... 1.245 .187 .138 .458 R .179 .018 .002 R 2.226November ........... 1.239 .155 .154 .425 R .208 .018 .001 R 2.201December ........... 1.399 .141 .192 .473 R .221 .018 .001 R 2.446Total ................... 15.850 2.709 1.563 5.661 R 2.630 .217 .017 R 28.648
1989January ............... 1.392 .152 .161 .497 .230 .017 .001 2.450February ............. 1.309 .178 .185 .415 .211 .016 .001 2.315March .................. 1.293 .217 .175 .425 .240 .018 .001 2.370April .................... 1.170 .242 .121 .359 .258 .016 .001 2.168May ..................... 1.220 .258 .107 .411 .302 .017 .001 2.316June .................... 1.327 .268 .134 .461 .283 .017 .002 2.491July ..................... 1.454 .329 .132 .561 .256 .017 .002 2.751August ................ 1.470 .319 .118 .589 .226 .016 .002 2.740September .......... 1.312 .276 .109 .481 .205 .015 .002 2.398October ............... 1.263 .262 .089 .467 .207 .016 .002 2.305November ........... 1.272 .195 .121 .465 .209 .015 .002 2.280December ........... 1.508 .176 .233 .545 .220 .016 .002 2.701Total ................... 15.988 2.871 1.685 5.677 2.848 .197 .020 29.286
1990January ............... 1.391 .151 .123 .589 .239 .016 .002 2.510February ............. 1.216 .136 .100 .534 .238 .015 .002 2.241March .................. 1.274 .190 .108 .492 .275 .016 .002 2.358April .................... 1.213 .206 .108 .411 .255 .013 .002 2.207May ..................... 1.240 .252 .101 .459 .273 .015 .002 2.341June .................... 1.367 .307 .141 .495 .281 .016 .001 2.608July ..................... 1.497 .337 .138 .573 .256 .016 .002 2.819August ................ 1.530 .355 .117 .595 .227 .015 .002 2.842September .......... 1.402 .311 .086 .518 .184 .015 .002 2.518October ............... 1.347 .266 .077 .463 .207 .015 .002 2.378November ........... 1.278 .191 .067 .481 .217 .015 .002 2.249December ........... 1.434 .181 .085 .551 .260 .016 .002 2.528Total ................... 16.189 2.882 1.250 6.161 2.914 .181 .021 29.599
1991January ............... 1.482 .177 .099 .584 .275 .015 .002 2.634February ............. 1.217 .150 .092 .514 .234 .013 .002 2.221March .................. 1.230 .198 .092 .528 .280 .015 .002 2.344April .................... 1.151 .221 .084 .447 .284 .013 .002 2.201May ..................... 1.271 .255 .115 .502 .314 .014 .002 2.472June .................... 1.366 .266 .117 .582 .283 .014 .002 2.631July ..................... 1.491 .338 .118 .652 .272 .014 .002 2.887August ................ 1.492 .335 .123 .628 .256 .014 .002 2.851September .......... 1.337 .269 .091 .557 .218 .013 .002 2.488October ............... 1.284 .270 .068 .512 .211 .014 .002 2.361November ........... 1.324 .203 .084 .497 .209 .015 .002 2.333December ........... 1.384 .174 .094 .576 .247 .015 .002 2.492Total ................... 16.028 2.856 1.178 6.579 3.083 .170 .021 29.915
1992January ............... 1.419 .173 .108 .618 .242 .015 .002 2.577February ............. 1.251 .174 .087 .564 .203 .013 .002 2.294March .................. 1.303 .212 .092 .489 .234 .015 .002 2.348April .................... 1.222 .234 .069 .451 .219 .014 .001 2.211May ..................... 1.260 .242 .056 .487 .251 .014 .002 2.311June .................... 1.333 .272 .080 .547 .254 .014 .002 2.501July ..................... 1.534 .341 .092 .598 .238 .014 .002 2.820August ................ 1.468 .309 .076 .626 .217 .014 .002 2.714September .......... 1.371 .280 .074 .544 .201 .013 .002 2.485October ............... 1.306 .217 .073 .521 .200 .014 .002 2.333November ........... 1.302 .193 .074 .542 .227 .014 .002 2.353December ........... 1.442 .179 .070 .620 .272 .014 .002 2.600Total ................... 16.211 2.826 .951 6.607 2.760 .170 .022 29.547
a Includes supplemental gaseous fuels.b Includes residual and distillate fuel oils, petroleum coke, and small
amounts of kerosene and jet fuel.c Includes net imports of electricity.d "Other" is electricity generated for distribution from wood, waste, wind,
photovoltaic, and solar thermal energy.
R=Revised data. (s)=Less than 0.5 trillion Btu. Notes: • Totals may not equal sum of components due to independent
rounding. • Geographic coverage is the 50 States and the District ofColumbia. Additional Notes and Sources: See end of section.
Energy Information Administration/Historical Monthly Energy Review 1973-199270

Energy Consumption Notes and SourcesThe data in this section of the Historical Monthly EnergyReview (HMER) are obtained initially from a group ofenergy-related surveys, typically called "supply sur-veys," conducted by the Energy Information Adminis-tration (EIA). Supply surveys are those surveysdirected to suppliers and marketers of specific energysources. They measure the quantities of specific energysources produced, or the quantities supplied to themarket, or both. The data obtained from the EIA’ssupply surveys are integrated to yield the summaryconsumption statistics published in this section (and inSection 1) of the HMER. Users of the EIA’s energyconsumption statistics should be aware of a secondgroup of energy-related surveys, typically called "con-sumption surveys." Consumption surveys gather infor-mation on the types of energy consumed by end usersof energy, along with the characteristics of those endusers that can be associated with energy use. For exam-ple, the Manufacturing Energy Consumption Surveybelongs to the consumption survey group because itcollects information directly from end users (the man-ufacturing establishments). There are important differ-ences between the supply and consumption surveysthat need to be taken into account in any analysis thatuses both data sources. For information on those differ-ences, see Energy Consumption by End-Use Sector, A Com-parison of Measures by Consumption and Supply Surveys,DOE/EIA-0533, EIA, Washington, DC, April 6, 1990.The numbered notes that follow elaborate on essentialinformation in Section 2.
1. Total Energy Consumed: Total energy consumedincludes coal, natural gas (including supplemental gas-eous fuels), petroleum products supplied, electric util-ity and industrial generation of hydroelectric power,net imports of electricity generated from hydroelectricpower, and electricity generated from nuclear power.Total energy consumed also includes electricity gener-ated from geothermal, wood, waste, wind, photovol-taic, and solar thermal energy but excludes other energyobtained from those sources because consistent histor-ical data are not available.
2. Economic Sectors: Energy use is assigned to themajor economic sectors according to the followingguidelines as closely as possible:
• Residential—All private residences, whether oc-cupied or vacant, owned or rented, including sin-gle-family homes, multifamily housing units, andmobile homes. Secondary homes, such as sum-mer homes, are also included. Institutional hous-ing, such as school dormitories, hospitals, andmilitary barracks, generally are not included in
the residential sector; they are included in thecommercial sector.
• Commercial—Business establishments that arenot engaged in transportation or in manufactur-ing or other types of industrial activity (agricul-ture, mining, or construction). Commercialestablishments include hotels, motels, restau-rants, wholesale businesses, retail stores, laun-dries, and other service enterprises; religious andnonprofit organizations; health, social, and edu-cational institutions; and Federal, State, and localgovernments. Street lights, pumps, bridges, andpublic services are also included if the establish-ment operating them is considered commercial.
• Industrial—Manufacturing industries, whichmake up the largest part of the sector, along withmining, construction, agriculture, fisheries, andforestry. Establishments in this sector range fromsteel mills to small farms to companies assem-bling electronic components.
• Transportation—Private and public vehicles thatmove people and commodities. Included are au-tomobiles, trucks, buses, motorcycles, railroadsand railways (including streetcars), aircraft,ships, barges, and natural gas pipelines.
• Electric Utility—Privately and publicly ownedestablishments that generate, transmit, distribute,and sell electricity primarily for use by the publicand meet the definition of an electric utility. Non-utility power producers are not included in theelectric utility sector.
Although the end-use allocations are made accordingto these aggregations as closely as possible, some dataare collected by using different classifications. For ex-ample, data on agricultural use of natural gas are col-lected and reported in the commercial sector, ratherthan in the industrial sector. Since agricultural use ofnatural gas cannot be identified separately, it is in-cluded in the commercial sector in this report. Anotherexample is master-metered condominiums and apart-ments, and buildings with a combination of residentialand commercial units. In many cases, the metering andbilling practices cause residential energy usage of elec-tricity, natural gas, or fuel oil to be included in thecommercial sector. No adjustments for these discrep-ancies were made.
3. Conversion Factors: See the conversion factors listedin Appendix A.
4. Coal: Coal is anthracite, bituminous coal (includingsubbituminous coal), and lignite. Sources:
• 1973-September 1977: U.S. Department of the In-terior (DOI), Bureau of Mines (BOM), MineralsYearbook and Minerals Industry Surveys.
Energy Information Administration/Historical Monthly Energy Review 1973-1992 71
• Electric Utilities—October 1977-1992: EIA, FormEIA-759 (formerly Federal Power Commission(FPC), Form FPC-4), "Monthly Power Plant Report."
• Other Industrial—October 1977-December 1979:EIA, Form EIA-3, "Monthly Coal ConsumptionReport—Manufacturing Plants"; January 1980-1992: EIA, Form EIA-3, "Quarterly Coal Con-sumption Report—Manufacturing Plants" andForm EIA-6, "Coal Distribution Report," quar-terly.
• Coke Plants—October 1977-December 1980: EIA,Form EIA-5/5A, "Coke and Coal Chemicals—Monthly/Annual"; January 1981-December 1984:EIA, Form EIA-5/5A, "Coke Plant Report—Quar-terly/Annual Supplement"; January 1985-1992: EIA,Form EIA-5/5A, "Coke Plant Report—Quarterly."
• Residential and Commercial—October 1977-December 1979: EIA, Form EIA-2, "MonthlyCoal Report, Retail Dealers—Upper LakeDocks"; January 1980-1992: EIA, Form EIA-6,"Coal Distribution Report," quarterly.
5. Natural Gas: Natural gas consumption by end use isbased on data presented in Table 4.4 of this report. ForSection 2 calculations, lease and plant fuel consumptionare added to industrial deliveries, and pipeline fuelrepresents transportation use of natural gas. Values inBtu are derived by using the conversion factors pro-vided in Appendix A. Sources:
• 1973-1975: DOI, BOM, Minerals Yearbook, "NaturalGas" chapter.
• 1976-1978: EIA, Energy Data Reports, "Natural Gas,Annual."
• 1979: EIA, Natural Gas Production and Consumption1979.
• 1980-1992: EIA, Natural Gas Annual.
• Electric Utilities—1973-1976: Form FPC-4,"Monthly Power Plant Report"; 1977-1981: Fed-eral Energy Regulatory Commission (FERC),Form FPC-4, "Monthly Power Plant Report";1982-1992: EIA, Form EIA-759, "Monthly PowerPlant Report."
• American Gas Association, "Monthly Gas UtilityStatistical Report," residential and commercialmonthly sales data for 1973-1979, which are usedto estimate monthly consumption values fromEIA annual consumption values.
6. Petroleum: Petroleum consumption by end use is thesum of all individual petroleum products estimated tobe consumed in each end-use sector. First, total con-sumption by product is determined. Petroleum con-sumption in this section of the Historical Monthly EnergyReview (HMER) is the series called "petroleum products
supplied" in Section 3. Sources for petroleum productssupplied by individual products are:
• 1973-1975: DOI, BOM, Mineral Industry Surveys,"Petroleum Statement, Annual."
• 1976-1980: EIA, Energy Data Reports, "PetroleumStatement, Annual."
• 1981-1992: EIA, Petroleum Supply Annual.
Specific petroleum products’ end-use allocation proce-dures follow:
• Aviation Gasoline—All product supplied is as-signed to the transportation sector.
• Asphalt—All product supplied is assigned to theindustrial sector.
• Distillate Fuel—Product supplied is assigned toelectric utilities and non-electric utilities as follows:
Electric Utilities, All Periods.
For 1973-1979, consumption of distillate fuel isassumed to be the amount of petroleum (minussmall amounts of kerosene and kerosene-type jetfuel deliveries) consumed in gas turbine and in-ternal combustion plants. For 1980-1992, con-sumption of distillate fuel is assumed to be theamount of light oil (minus small amounts of ker-osene deliveries through 1982) consumed at elec-tric utilities. (See Table 7.3)
Sources: 1973-September 1977: FPC, Form FPC-4,"Monthly Power Plant Report"; October 1977-1981: FERC, Form FPC-4, "Monthly Power PlantReport"; 1982-1992: EIA, Form EIA-759, "MonthlyPower Plant Report."
Sectors Other Than Electric Utilities, Annual Estimates.
The aggregate non-electric utility use of distillatefuel is total distillate fuel supplied minus the elec-tric utility consumption. The non-electric utilityannual consumption totals are allocated to theindividual non-electric utility sectors (residential,commercial, industrial, and transportation) inproportion to the share of "adjusted sales" of eachend-use sector, as reported in EIA’s Fuel Oil andKerosene Sales report series (DOE/EIA-0535),which is based primarily on data collected byForm EIA-821, previously Form EIA-172. "Ad-justed sales" are sales that have been adjusted atthe PAD district level to equal EIA volume esti-mates of petroleum products supplied in the U.S.market. Following are notes on the individualsector groupings:
Energy Information Administration/Historical Monthly Energy Review 1973-199272

- From 1979-1992, the residential sector adjustedsales total is directly from the Sales reports. Priorto 1979, each year’s sales subtotal of the heatingplus industrial category was split into residential,commercial, and industrial (including farm) inproportion to the 1979 shares.
- From 1979-1992, the commercial sector adjustedsales total is directly from the Sales reports. Priorto 1979, each year’s sales subtotal of the heatingplus industrial category was split into residential,commercial, and industrial (including farm) inproportion to the 1979 shares.
- From 1979-1992, the industrial sector adjustedsales total is the sum of the adjusted sales forindustrial, farm, oil company, off-highway, die-sel, and all other uses. Prior to 1979, each year’ssales subtotal of the heating plus industrial cate-gory was split into residential, commercial, andindustrial (including farm) in proportion to the1979 shares, and this estimated industrial portionis added to oil company, off-highway diesel, andall other uses.
- The transportation sector adjusted sales total isthe sum of the adjusted sales for railroad, vesselbunkering, on-highway diesel, and military usesfor all years.
Sectors Other Than Electric Utilities, MonthlyEstimates.
- Residential and commercial monthly consump-tion is estimated by allocating the annual esti-mates, which are described above, into themonths in proportion to each month’s share of theyear’s sales of No. 2 heating oil. The year’s salestotals are from the following sources: for 1973-1980, the Ethyl Corporation, Monthly Report ofHeating Oil Sales; for 1981 and 1982, the AmericanPetroleum Institute, Monthly Report of Heating OilSales; and for 1983-1992, EIA, Form EIA-782A,"Refiners’/Gas Plant Operators’ Monthly Petro-leum Product Sales Report," No. 2 Fuel Oil Salesto End Users and for Resale.
- The transportation highway use portion is allo-cated into the months in proportion to eachmonth’s share of the year’s total sales for highwayuse as reported by the Federal HighwayAdministration’s Table MF-25, "Private and Com-mercial Highway Use of Special Fuels byMonths." The remaining transportation use ofdistillate fuel (i.e., for railroads, vessel bunkering,and military use) is evenly distributed over themonths, adjusted for the number of days permonth.
- Industrial monthly estimates are made by sub-tracting the residential and commercial, transpor-tation, and electric utility sector estimates fromeach month’s total distillate fuel supplied.
• Jet Fuel—Through 1982, small amounts of kero-sene-type jet fuel were consumed by electric util-ities. Kerosene-type jet fuel deliveries to electricutilities as reported on the Form FERC-423 (for-merly Form FPC-423) were used as estimates ofthis consumption. All remaining jet fuel (kero-sene-type and naphtha-type) is consumed by thetransportation sector.
• Kerosene—Total product supplied monthly is al-located to the major end-use sectors in proportionto annual sales grouped into end-use sectors fromEIA’s Fuel Oil and Kerosene Sales reports (basedprimarily on data collected by Form EIA-821, pre-viously Form EIA-172), as follows:
-Residential deliveries, and commercial and in-dustrial sales are taken directly from the Salesreports for 1979-1992. Prior to 1979, each year’ssales category called "heating" was split into resi-dential, commercial, and industrial in proportionto the 1979 shares. The estimated industrial (in-cluding farm) portion was added to all other uses.
• Liquefied Petroleum Gases (LPG)—The annualshares of LPG’s total consumption that are esti-mated to be consumed by each end-use sector areapplied to each month’s total LPG consumption(i.e., product supplied) to create monthly end-useconsumption estimates. The annual end-useshares are calculated in the following manner:
- Sales of LPG to the residential and commercialsector are converted from thousand gallons peryear to thousand barrels per year and are as-sumed to be the annual consumption of LPG bythe sector.
- The quantity of LPG sold each year for consump-tion in internal combustion engines is allocatedbetween the transportation and industrial sectorson the basis of data for special fuels used onhighways published by the U.S. Department ofTransportation, Federal Highway Administra-tion, in Highway Statistics. The allocations of LPGsold for internal combustion engine use to thetransportation sector range from a high of 67 per-cent in 1981 to a low of 37 percent in 1987.
- LPG consumed annually by the industrial sectoris estimated as the difference between LPG’s totalsupplied and the estimated consumption by thesum of the residential and commercial sector andthe transportation sector. The industrial sectorincludes LPG used by chemical plants as rawmaterials or solvents and for use in the production
Energy Information Administration/Historical Monthly Energy Review 1973-1992 73
of synthetic rubber; refinery fuel use; use as syn-thetic natural gas feedstock; and use in secondaryrecovery projects; all farm use; LPG sold to gasutility companies for distribution through themains; and a portion of the use of LPG as aninternal combustion engine fuel.
The sources of the annual sales data for creating annualend-use shares are:
- 1973-1982: EIA’s "Sales of Liquefied PetroleumGases and Ethane" reports, based primarily ondata collected by Form EIA-174.
- 1983: End-use consumption estimates for 1983are based on 1982 end-use consumption becausethe collection of data under Form EIA-174 wasdiscontinued after data year 1982.
- 1984-1992: American Petroleum Institute (API),"Sales of Natural Gas Liquids and Liquefied Re-finery Gases," which is based on an LPG salessurvey jointly sponsored by API, the Gas Proces-sors Association, and the National Liquefied Pe-troleum Gas Association.
• Lubricants—Total product supplied is allocatedto the industrial and transportation sectors for allmonths according to proportions developed fromannual sales of lubricants to the two sectors fromU.S. Department of Commerce, Bureau of theCensus, Current Industrial Reports, "Sales of Lubri-cating and Industrial Oils and Greases." The 1973shares were applied to 1973 and 1974; the 1975shares were applied to 1975 and 1976; and the1977 shares were applied to 1977-1992.
• Motor Gasoline—Total product suppliedmonthly is allocated to the major end-use sectorsin proportion to aggregations of annual sales cat-egories created on the basis of the U.S. Depart-ment of Transportation, Federal HighwayAdministration, Highway Statistics, Tables MF-21,MF-24, and MF-25, as follows:
- Commercial sales are the sum of sales for publicnon-highway use and miscellaneous and unclas-sified uses.
- Industrial sales are the sum of sales for agricul-ture, construction, and industrial and commercialuse as classified in the Highway Statistics.
- Transportation sales are the sum of sales forhighway use (minus the sales of special fuels,which are primarily diesel fuel and are accountedfor in the transportation sector of distillate fuel)and sales for marine use.
• Petroleum Coke—The portion consumed by elec-tric utilities is from Form EIA-759, "MonthlyPower Plant Report" (formerly Form FPC-4). The
remaining petroleum coke is assigned to the in-dustrial sector.
• Residual Fuel—Product supplied is assignedto electric utilities and non-electric utilities asfollows:
Electric Utilities, All Periods.
For 1973-1979, consumption of residual fuel isassumed to be the amount of petroleum con-sumed in steam-electric power plants. For 1980-1992, consumption of residual fuel is assumed tobe the amount of heavy oil consumed at electricutilities. (See Table 7.3)
Sources: 1973-September 1977: Form FPC-4,"Monthly Power Plant Report"; October 1977-1981: FERC, Form FPC-4, "Monthly Power PlantReport"; 1982-1992: EIA, Form EIA-759, "MonthlyPower Plant Report."
Sectors Other Than Electric Utilities, AnnualEstimates.
The aggregate non-electric utility use of residualfuel is total residual fuel supplied minus the elec-tric utility consumption. The non-electric utilityannual totals are allocated into the individualnon-electric utility sectors in proportion to theamount of residual fuel sold to end users,grouped into sectors from EIA’s Fuel Oil and Ker-osene Sales reports (based primarily on data col-lected by Form EIA-821, previously FormEIA-172), as follows:
- From 1979-1992, commercial sales data are di-rectly from the Sales reports. Prior to 1979, eachyear’s sales subtotal of the heating plus industrialcategory was split into commercial and industrialin proportion to the 1979 shares.
- From 1979-1992, industrial sales data are the sumof sales for industrial, oil company, and all otheruses. Prior to 1979, each year’s sales subtotal ofthe heating plus industrial category was split intocommercial and industrial in proportion to the1979 shares, and this estimated industrial portionwas added to oil company and all other uses.
- Transportation sales are the sum of sales forrailroad, vessel bunkering, and military uses forall years.
Sectors Other Than Electric Utilities, MonthlyEstimates.
- Commercial sector monthly consumption is esti-mated by allocating the annual estimates, which aredescribed above, into the months in proportion to
Energy Information Administration/Historical Monthly Energy Review 1973-199274

each month’s share of the year’s sales of No. 2heating oil. The year’s sales totals are from thefollowing sources: for 1973-1980, the Ethyl Cor-poration, Monthly Report of Heating Oil Sales; for1981 and 1982, the American Petroleum Institute,Monthly Report of Heating Oil Sales; and for 1983-1992, EIA, Form EIA-782A, "Refiners’/Gas PlantOperators’ Monthly Petroleum Product Sales Re-port," No. 2 Fuel Oil Sales to End Users and forResale.
- Transportation monthly estimates are made byevenly distributing the annual sector estimateover the months, adjusting for the number ofdays per month.
- Industrial monthly estimates are made by sub-tracting the commercial, transportation, and elec-tric utility sector estimates from each month’stotal residual fuel supplied.
• Road Oil—All product supplied is assigned tothe industrial sector.
• All Other Petroleum Products—The productsupplied of all remaining petroleum products isassigned to the industrial sector.
7. Nuclear Electric Power, Geothermal, and Wood,Waste, Wind, Photovoltaic, and Solar Thermal EnergySources Connected to Electric Utility DistributionSystems. Sources:
• 1973-1976: FPC, Form FPC-4, "Monthly PowerPlant Report."
• 1977-1981: FERC, Form FPC-4, "Monthly PowerPlant Report."
• 1982-1992: EIA, Form EIA-759, "Monthly PowerPlant Report."
8. Hydroelectric Power: Includes electricity generatedby hydroelectric power at electric utilities, smallamounts in the industrial sector, and net imports ofelectricity, which are assumed to be generated by hy-droelectric power and are included in the electric utili-ties sector.
Sources for electric utilities sector:
• 1973-1976: FPC, Form FPC-4, "Monthly PowerPlant Report."
• 1977-1981: FERC, Form FPC-4, "Monthly PowerPlant Report."
• 1982-1992: EIA, Form EIA-759, "Monthly PowerPlant Report."
Sources for industrial sector:
• 1973-1978: FPC, Form FPC-4, "Monthly PowerPlant Report," for plants with generating capacityexceeding 10 megawatts, and FPC, Form FPC-12C, "Industrial Electric Generating Capacity,"for all other plants.
• 1979: FPC, Form FPC-4, "Monthly Power PlantReport," for plants with generating capacity ex-ceeding 10 megawatts and EIA estimates for allother plants.
• 1980-1992: Annual generation estimated by EIAas the average generation over the 6-year periodof 1974-1979; monthly generation estimated to bein proportion to each month’s hydroelectricitygeneration in the electric utility industry in 1980.
Note for imports and exports of electricity:
• Annual electricity import and export values arebased on reported data. Monthly values fromJanuary 1982-1992 are based on reported datafrom the same sources. Monthly values prior to1982 were estimated by converting the annualvalues to daily rates and multiplying by the num-ber of days in the month. Accordingly, month-to-month analyses are not comparable across thetransition date of January 1982. Monthly analy-ses on either side of that date and all annualanalyses are comparable.
Sources for imports and exports of electricity:
• 1973-1980: Department of Energy (DOE), Eco-nomic Regulatory Administration (ERA), "Re-port on Electric Energy Exchanges with Canadaand Mexico."
• 1981: DOE, Office of Energy Emergency Opera-tions, "Report on Electric Energy Exchanges withCanada and Mexico for Calendar Year 1981,"April 1982 (revised June 1982).
• 1982 and 1983: DOE, ERA, Electricity ExchangesAcross International Borders.
• 1984-1986: DOE, ERA, Electricity TransactionsAcross International Borders.
• 1987 and 1988: DOE, ERA, Form ERA-781R,"Annual Report of International ElectricalExport/Import Data."
• 1989-1992: DOE, Assistant Secretary for FossilEnergy, Form FE-781-R, "Annual Report of Inter-national Electrical Export/Import Data."
9. Net Imports of Coal Coke: Net imports means im-ports minus exports, and a minus sign indicates thatexports are greater than imports. Sources:
Energy Information Administration/Historical Monthly Energy Review 1973-1992 75

• 1973-1975: DOI, BOM, Minerals Yearbook, "Cokeand Coal Chemicals" chapter.
• 1976-1980: EIA, Energy Data Report, "Coke andCoal Chemicals" annual.
• 1981: EIA, Energy Data Report, "Coke Plant Re-port," quarterly.
• 1982-1992: EIA, Quarterly Coal Report.
10. Electricity: End-use consumption of electricity isbased on Table 7.2 sales data. "Other," which is primar-ily for use in government buildings, is added to thecommercial sector, except for approximately 4 percentused by railroads and railways and attributed to thetransportation sector. For 1973-1983, "Monthly Series"data are used directly. For 1984-1992, monthly esti-mates are created by dividing each month’s "MonthlySeries" value by the "Monthly Series" total for the yearand multiplying by the "Annual Series" value for theyear. Kilowatthours are converted to Btu at the rate of3,412 Btu per kilowatthour. See Table 7.2 for sources ofthe electricity sales data.
11. Electrical System Energy Losses: Electrical systemenergy losses are calculated as the difference between
total energy input at electric utilities and the total en-ergy content of electricity sold to end-use consumers.Most of those losses occur at steam-electric powerplants (conventional and nuclear) in the conversion ofheat energy into mechanical energy to turn electricgenerators. The loss is a thermodynamically necessaryfeature of the steam-electric cycle. Part of the energyinput-to-output losses is a result of imputing fossil en-ergy equivalent inputs for hydroelectric and other en-ergy sources, since there is no generally acceptedpractice for measuring those thermal conversion rates.In addition to conversion losses, other losses includepower plant use of electricity, transmission and distri-bution of electricity from power plants to end-use con-sumers (also called "line losses"), and unaccounted forelectricity. Total losses are allocated to the end-usesectors in proportion to each sector’s share of total elec-tricity sales. Overall, approximately 67 percent of totalenergy input is lost in conversion; of electricity generated,approximately 5 percent is lost in plant use and 9 percentis lost in transmission and distribution. Calculated elec-trical system energy losses may be less than actual losses,because primary consumption does not include the en-ergy equivalent of utility purchases of electricity fromnon-electric utilities and from Canada and Mexico, al-though they are included in electricity sales.
Energy Information Administration/Historical Monthly Energy Review 1973-199276

Section 3Petroleum
Up to 2 million barrels per day of North Slope crude oil flow through the Trans-Alaska Pipelineto the Port of Valdez.

Table 3.1a Petroleum Overview, 1973-1992: Field Production, Stock Change, Petroleum Products Supplied, and Ending Stocks
Field Production Stock Changea
PetroleumProductsSupplied
Ending Stocksb
TotalDomesticc
CrudeOil
NaturalGas Plant
ProductionCrudeOild
PetroleumProducts
Crude Oild andPetroleumProducts
Thousand Barrels per Day Million Barrels
1973January ....................................... 10,884 9,176 1,680 -288 -1,430 18,713 906February ..................................... 11,174 9,395 1,745 -75 -1,332 19,094 866March .......................................... 11,039 9,272 1,734 283 390 17,216 887April ............................................ 11,065 9,292 1,750 155 716 15,921 913May ............................................. 11,034 9,262 1,739 293 365 16,626 934June ............................................ 10,969 9,214 1,727 -300 1,111 16,481 958July ............................................. 10,986 9,217 1,737 -167 1,080 16,372 986August ........................................ 10,947 9,169 1,748 150 194 17,499 997September .................................. 10,837 9,065 1,741 -235 857 16,656 1,016October ....................................... 11,009 9,224 1,756 162 541 17,202 1,037November ................................... 10,960 9,161 1,774 123 -597 18,492 1,023December ................................... 10,821 9,063 1,729 -243 -239 17,538 1,008Average ..................................... 10,975 9,208 1,738 -11 146 17,308 1,008
1974January ....................................... 10,664 8,934 1,699 -305 -768 17,286 975February ..................................... 10,911 9,142 1,728 275 -1,271 17,366 947March .......................................... 10,731 8,965 1,741 127 64 16,104 953April ............................................ 10,690 8,954 1,696 391 592 15,929 983May ............................................. 10,638 8,911 1,690 422 1,109 15,726 1,030June ............................................ 10,504 8,780 1,684 -23 1,028 16,117 1,060July ............................................. 10,477 8,780 1,657 -3 882 16,349 1,087August ........................................ 10,423 8,699 1,676 -124 560 16,550 1,101September .................................. 10,115 8,443 1,638 63 366 16,024 1,114October ....................................... 10,326 8,611 1,686 87 -350 17,050 1,106November ................................... 10,296 8,569 1,694 57 -135 17,351 1,103December ................................... 10,228 8,527 1,670 -198 -761 18,013 e1,074Average ..................................... 10,498 8,774 1,688 62 117 16,653 e1,074
1975January ....................................... 10,115 8,455 1,630 e176 e-884 18,004 1,099February ..................................... 10,267 8,591 1,646 225 -687 17,084 1,086March .......................................... 10,176 8,493 1,658 104 -422 16,315 1,076April ............................................ 10,129 8,457 1,635 64 -704 16,048 1,057May ............................................. 10,022 8,379 1,607 -31 425 15,155 1,069June ............................................ 10,108 8,421 1,646 -161 219 15,610 1,071July ............................................. 10,005 8,336 1,621 -386 877 15,740 1,086August ........................................ 9,941 8,249 1,650 -243 907 15,806 1,107September .................................. 9,894 8,280 1,577 94 1,253 15,768 1,147October ....................................... 10,009 8,324 1,643 327 -44 16,377 1,156November ................................... 9,958 8,278 1,635 46 738 15,777 1,180December ................................... 9,937 8,254 1,646 13 -1,519 18,185 1,133Average ..................................... 10,045 8,375 1,633 e17 e15 16,322 1,133
1976January ....................................... 9,853 8,232 1,585 579 -2,009 18,647 1,089February ..................................... 9,913 8,231 1,640 -410 -224 17,509 1,070March .......................................... 9,881 8,232 1,615 184 -498 17,302 1,060April ............................................ 9,731 8,077 1,616 117 -232 16,672 1,057May ............................................. 9,749 8,125 1,588 -85 608 15,977 1,073June ............................................ 9,741 8,094 1,606 -76 753 16,825 1,094July ............................................. 9,763 8,127 1,592 29 1,289 16,607 1,134August ........................................ 9,740 8,111 1,596 -172 924 16,642 1,158September .................................. 9,786 8,150 1,602 236 892 16,837 1,192October ....................................... 9,699 8,063 1,601 430 -33 17,090 1,204November ................................... 9,737 8,080 1,621 38 -806 18,847 1,181December ................................... 9,698 8,061 1,589 -431 -1,795 20,560 1,112Average ..................................... 9,774 8,132 f 1,604 39 -96 17,461 1,112
1977January ....................................... 9,442 7,854 1,549 279 -1,792 20,504 1,065February ..................................... 9,774 8,139 1,589 -95 -420 20,482 1,050March .......................................... 9,823 8,090 1,687 260 911 18,124 1,087April ............................................ 9,861 8,145 1,664 645 501 17,580 1,121May ............................................. 9,751 8,075 1,620 319 1,301 16,972 1,171June ............................................ 9,772 8,102 1,616 166 630 18,043 1,195July ............................................. 9,761 8,105 1,609 51 1,364 17,568 1,239August ........................................ 9,957 8,307 1,593 115 862 18,012 1,269September .................................. 10,116 8,480 1,585 -158 1,300 17,714 1,304October ....................................... 10,249 8,573 1,633 292 765 17,824 1,336November ................................... 10,261 8,579 1,627 236 93 18,437 1,346December ................................... 10,182 8,487 1,637 -84 -1,026 20,052 1,312Average ..................................... 9,913 8,245 1,618 170 378 18,431 1,312
See footnotes at end of table.
Energy Information Administration/Historical Monthly Energy Review 1973-1992 79

Table 3.1a Petroleum Overview, 1973-1992: Field Production, Stock Change, Petroleum Products Supplied, and Ending Stocks (Continued)
Field Production Stock Changea
PetroleumProductsSupplied
Ending Stocksb
TotalDomesticc
CrudeOil
NaturalGas Plant
ProductionCrudeOild
PetroleumProducts
Crude Oild andPetroleumProducts
Thousand Barrels per Day Million Barrels
1978January ....................................... 9,975 8,360 1,557 155 -1,554 19,752 1,269February ..................................... 9,994 8,377 1,562 -83 -2,676 20,900 1,191March .......................................... 10,361 8,720 1,590 444 -1,202 19,652 1,168April ............................................ 10,482 8,818 1,619 42 166 17,747 1,174May ............................................. 10,403 8,825 1,530 -337 423 18,230 1,177June ............................................ 10,465 8,832 1,583 292 -12 18,260 1,185July ............................................. 10,372 8,756 1,558 151 1,052 17,633 1,222August ........................................ 10,369 8,758 1,556 -333 300 18,639 1,221September .................................. 10,400 8,800 1,546 348 1,037 17,954 1,263October ....................................... 10,414 8,820 1,540 320 272 18,417 1,281November ................................... 10,394 8,741 1,602 105 238 19,156 1,292December ................................... 10,284 8,662 1,566 -164 -287 19,944 1,278Average ..................................... 10,328 8,707 1,567 78 -172 18,847 1,278
1979January ....................................... 10,042 8,475 1,530 -35 -1,470 20,586 1,231February ..................................... 10,119 8,525 1,561 191 -3,031 21,288 1,151March .......................................... 10,179 8,601 1,548 602 -893 19,322 1,142April ............................................ 10,199 8,553 1,611 125 675 17,434 1,166May ............................................. 10,211 8,601 1,570 8 363 17,801 1,178June ............................................ 10,045 8,432 1,571 374 685 17,786 1,210July ............................................. 9,970 8,364 1,564 -367 1,828 17,144 1,255August ........................................ 10,173 8,548 1,575 294 602 18,149 1,283September .................................. 10,142 8,523 1,565 99 768 17,400 1,309October ....................................... 10,290 8,621 1,607 675 -3 18,176 1,330November ................................... 10,497 8,761 1,676 85 239 18,313 1,339December ................................... 10,286 8,615 1,626 -269 318 18,922 1,341Average ..................................... 10,179 8,552 1,584 148 25 18,513 1,341
1980January ....................................... 10,377 8,675 1,648 594 -270 18,851 1,351February ..................................... 10,402 8,705 1,656 292 -563 18,817 1,343March .......................................... 10,303 8,698 1,568 47 99 17,377 1,348April ............................................ 10,356 8,685 1,630 412 229 16,784 1,367May ............................................. 10,298 8,635 1,615 117 520 16,238 1,387June ............................................ 10,164 8,554 1,561 -65 869 16,187 1,411July ............................................. 10,113 8,547 1,524 -88 556 16,008 1,425August ........................................ 9,974 8,414 1,519 274 473 15,753 1,449September .................................. 10,184 8,619 1,515 -307 259 16,598 1,447October ....................................... 10,092 8,532 1,516 191 -756 16,995 1,430November ................................... 10,109 8,495 1,571 8 84 16,702 1,432December ................................... 10,204 8,606 1,560 -304 -993 18,410 e1,392Average ..................................... 10,214 8,597 1,573 98 42 17,056 e1,392
1981January ....................................... 10,231 8,540 1,652 e-50 e-1,159 18,430 1,388February ..................................... 10,294 8,604 1,653 278 -250 16,989 1,389March .......................................... 10,272 8,613 1,624 632 -224 15,907 1,401April ............................................ 10,195 8,557 1,599 595 -148 15,350 1,415May ............................................. 10,160 8,501 1,593 391 374 15,353 1,438June ............................................ 10,287 8,629 1,594 135 -406 16,095 1,430July ............................................. 10,098 8,500 1,548 360 -91 15,682 1,439August ........................................ 10,243 8,583 1,614 -397 999 15,263 1,457September .................................. 10,281 8,604 1,612 285 341 15,655 1,476October ....................................... 10,225 8,563 1,598 760 -477 15,822 1,485November ................................... 10,269 8,586 1,630 325 233 15,593 1,501December ................................... 10,220 8,585 1,590 170 -745 16,596 1,484Average ..................................... 10,230 8,572 1,609 e290 e-130 16,058 1,484
1982January ....................................... 10,128 8,509 1,578 401 -1,298 f 16,122 1,456February ..................................... 10,312 8,702 1,563 242 -1,230 16,001 1,428March .......................................... 10,284 8,667 1,572 -121 -1,047 15,560 1,392April ............................................ 10,188 8,591 1,542 37 -1,583 16,046 1,346May ............................................. 10,244 8,683 1,518 -29 66 14,847 1,347June ............................................ 10,212 8,646 1,511 -40 489 14,998 1,360July ............................................. 10,229 8,658 1,513 147 926 14,821 1,393August ........................................ 10,215 8,634 1,524 440 44 14,839 1,408September .................................. 10,279 8,701 1,518 -263 447 15,022 1,414October ....................................... 10,299 8,701 1,530 548 47 14,859 1,432November ................................... 10,359 8,697 1,609 398 361 15,009 1,455December ................................... 10,276 8,598 1,628 -128 -688 15,487 e1,430Average ..................................... 10,252 8,649 1,550 136 -283 15,296 e1,430
See footnotes at end of table.
Energy Information Administration/Historical Monthly Energy Review 1973-199280

Table 3.1a Petroleum Overview, 1973-1992: Field Production, Stock Change, Petroleum Products Supplied, and Ending Stocks (Continued)
Field Production Stock Changea
PetroleumProductsSupplied
Ending Stocksb
TotalDomesticc
CrudeOil
NaturalGas Plant
ProductionCrudeOild
PetroleumProducts
Crude Oild andPetroleumProducts
Thousand Barrels per Day Million Barrels
1983January ....................................... 10,331 8,697 1,580 e499 e-772 14,722 1,452February ..................................... 10,388 8,758 1,575 320 -1,113 14,792 1,430March .......................................... 10,279 8,700 1,541 -83 -1,810 15,541 1,372April ............................................ 10,322 8,776 1,506 402 -308 14,692 1,374May ............................................. 10,190 8,631 1,493 15 602 14,505 1,394June ............................................ 10,261 8,667 1,523 122 276 15,289 1,405July ............................................. 10,228 8,636 1,539 -233 909 15,019 1,426August ........................................ 10,284 8,679 1,562 796 271 15,480 1,460September .................................. 10,447 8,784 1,602 239 621 15,506 1,485October ....................................... 10,434 8,771 1,604 274 442 14,962 1,508November ................................... 10,461 8,770 1,641 -114 182 15,500 1,510December ................................... 9,983 8,397 1,544 329 -2,133 16,726 1,454Average ..................................... 10,299 8,688 1,559 e214 e-234 15,231 1,454
1984January ....................................... 10,477 8,868 1,572 328 -1,115 16,801 1,429February ..................................... 10,565 8,874 1,635 -197 1,374 15,437 1,463March .......................................... 10,319 8,672 1,599 25 -641 16,050 1,444April ............................................ 10,531 8,862 1,619 476 106 15,568 1,462May ............................................. 10,623 8,955 1,614 677 434 15,620 1,496June ............................................ 10,507 8,852 1,613 104 109 15,709 1,503July ............................................. 10,587 8,885 1,634 169 169 15,498 1,513August ........................................ 10,478 8,809 1,637 -250 -252 16,116 1,498September .................................. 10,692 8,993 1,660 -260 769 15,247 1,513October ....................................... 10,608 8,906 1,649 759 246 15,616 1,544November ................................... 10,689 8,979 1,678 236 177 15,627 1,556December ................................... 10,578 8,897 1,649 290 -293 15,375 1,556Average ..................................... 10,554 8,879 1,630 199 81 15,726 1,556
1985January ....................................... 10,412 8,740 1,628 -76 -1,351 16,109 1,512February ..................................... 10,692 9,025 1,623 -425 -1,347 16,121 1,462March .......................................... 10,748 9,095 1,600 309 -403 15,373 1,460April ............................................ 10,673 9,043 1,582 520 -56 15,472 1,473May ............................................. 10,770 9,132 1,594 700 399 15,504 1,508June ............................................ 10,664 9,022 1,597 -264 382 15,483 1,511July ............................................. 10,550 8,949 1,568 -326 496 15,434 1,516August ........................................ 10,485 8,803 1,594 -159 -568 16,060 1,494September .................................. 10,584 8,954 1,575 34 255 15,099 1,502October ....................................... 10,637 8,970 1,610 -98 -124 15,944 1,496November ................................... 10,640 8,902 1,660 295 634 15,503 1,523December ................................... 10,777 9,030 1,680 58 -207 16,611 1,519Average ..................................... 10,636 8,971 1,609 50 -153 15,726 1,519
1986January ....................................... 10,911 9,137 1,711 383 151 16,088 1,535February ..................................... 10,916 9,173 1,696 37 -804 16,186 1,514March .......................................... 10,664 9,013 1,604 345 -1,160 16,276 1,489April ............................................ 10,435 8,864 1,523 -41 -262 15,945 1,479May ............................................. 10,440 8,838 1,543 -260 1,109 15,993 1,506June ............................................ 10,187 8,623 1,504 -3 1,238 16,049 1,543July ............................................. 10,225 8,660 1,507 541 422 16,307 1,573August ........................................ 9,875 8,374 1,445 -242 551 16,618 1,582September .................................. 9,852 8,328 1,468 217 973 15,909 1,618October ....................................... 9,954 8,419 1,477 233 -476 16,602 1,610November ................................... 10,061 8,412 1,569 -95 147 16,221 1,612December ................................... 9,985 8,352 1,571 -186 -443 17,131 1,593Average ..................................... 10,289 8,680 1,551 78 124 16,281 1,593
1987January ....................................... 10,139 8,480 1,582 166 -376 16,684 1,586February ..................................... 10,073 8,389 1,618 22 -831 16,908 1,563March .......................................... 10,131 8,464 1,598 125 -340 16,165 1,557April ............................................ 10,139 8,498 1,590 -50 -532 16,524 1,539May ............................................. 9,977 8,336 1,585 -36 116 16,026 1,542June ............................................ 9,906 8,279 1,578 165 42 16,830 1,548July ............................................. 9,895 8,251 1,582 -33 372 17,113 1,558August ........................................ 9,843 8,210 1,571 345 737 16,346 1,592September .................................. 9,851 8,205 1,582 220 236 16,670 1,606October ....................................... 10,037 8,364 1,602 661 -523 16,941 1,610November ................................... 10,112 8,397 1,637 355 478 16,343 1,635December ................................... 10,001 8,318 1,621 -405 -482 17,445 1,607Average ..................................... 10,008 8,349 1,595 128 -87 16,665 1,607
See footnotes at end of table.
Energy Information Administration/Historical Monthly Energy Review 1973-1992 81
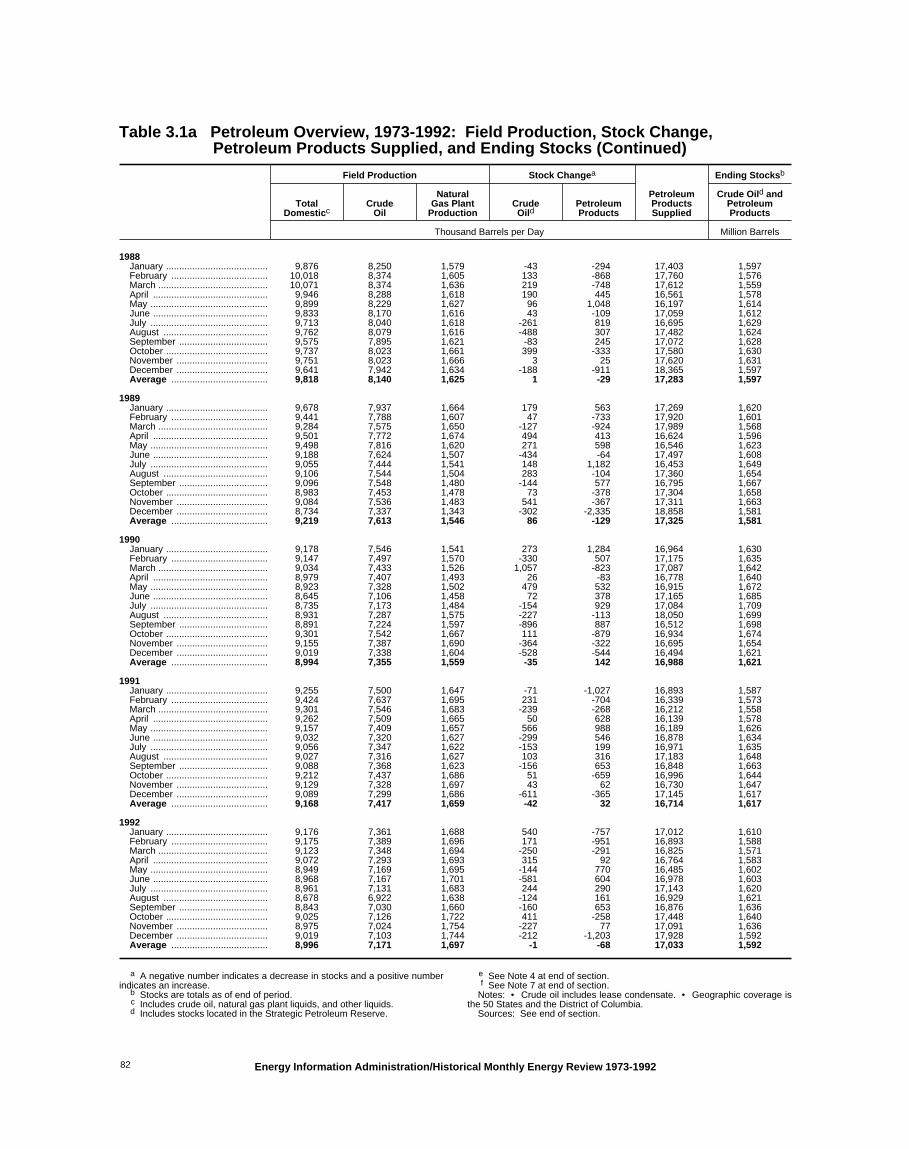
Table 3.1a Petroleum Overview, 1973-1992: Field Production, Stock Change, Petroleum Products Supplied, and Ending Stocks (Continued)
Field Production Stock Changea
PetroleumProductsSupplied
Ending Stocksb
TotalDomesticc
CrudeOil
NaturalGas Plant
ProductionCrudeOild
PetroleumProducts
Crude Oild andPetroleumProducts
Thousand Barrels per Day Million Barrels
1988January ....................................... 9,876 8,250 1,579 -43 -294 17,403 1,597February ..................................... 10,018 8,374 1,605 133 -868 17,760 1,576March .......................................... 10,071 8,374 1,636 219 -748 17,612 1,559April ............................................ 9,946 8,288 1,618 190 445 16,561 1,578May ............................................. 9,899 8,229 1,627 96 1,048 16,197 1,614June ............................................ 9,833 8,170 1,616 43 -109 17,059 1,612July ............................................. 9,713 8,040 1,618 -261 819 16,695 1,629August ........................................ 9,762 8,079 1,616 -488 307 17,482 1,624September .................................. 9,575 7,895 1,621 -83 245 17,072 1,628October ....................................... 9,737 8,023 1,661 399 -333 17,580 1,630November ................................... 9,751 8,023 1,666 3 25 17,620 1,631December ................................... 9,641 7,942 1,634 -188 -911 18,365 1,597Average ..................................... 9,818 8,140 1,625 1 -29 17,283 1,597
1989January ....................................... 9,678 7,937 1,664 179 563 17,269 1,620February ..................................... 9,441 7,788 1,607 47 -733 17,920 1,601March .......................................... 9,284 7,575 1,650 -127 -924 17,989 1,568April ............................................ 9,501 7,772 1,674 494 413 16,624 1,596May ............................................. 9,498 7,816 1,620 271 598 16,546 1,623June ............................................ 9,188 7,624 1,507 -434 -64 17,497 1,608July ............................................. 9,055 7,444 1,541 148 1,182 16,453 1,649August ........................................ 9,106 7,544 1,504 283 -104 17,360 1,654September .................................. 9,096 7,548 1,480 -144 577 16,795 1,667October ....................................... 8,983 7,453 1,478 73 -378 17,304 1,658November ................................... 9,084 7,536 1,483 541 -367 17,311 1,663December ................................... 8,734 7,337 1,343 -302 -2,335 18,858 1,581Average ..................................... 9,219 7,613 1,546 86 -129 17,325 1,581
1990January ....................................... 9,178 7,546 1,541 273 1,284 16,964 1,630February ..................................... 9,147 7,497 1,570 -330 507 17,175 1,635March .......................................... 9,034 7,433 1,526 1,057 -823 17,087 1,642April ............................................ 8,979 7,407 1,493 26 -83 16,778 1,640May ............................................. 8,923 7,328 1,502 479 532 16,915 1,672June ............................................ 8,645 7,106 1,458 72 378 17,165 1,685July ............................................. 8,735 7,173 1,484 -154 929 17,084 1,709August ........................................ 8,931 7,287 1,575 -227 -113 18,050 1,699September .................................. 8,891 7,224 1,597 -896 887 16,512 1,698October ....................................... 9,301 7,542 1,667 111 -879 16,934 1,674November ................................... 9,155 7,387 1,690 -364 -322 16,695 1,654December ................................... 9,019 7,338 1,604 -528 -544 16,494 1,621Average ..................................... 8,994 7,355 1,559 -35 142 16,988 1,621
1991January ....................................... 9,255 7,500 1,647 -71 -1,027 16,893 1,587February ..................................... 9,424 7,637 1,695 231 -704 16,339 1,573March .......................................... 9,301 7,546 1,683 -239 -268 16,212 1,558April ............................................ 9,262 7,509 1,665 50 628 16,139 1,578May ............................................. 9,157 7,409 1,657 566 988 16,189 1,626June ............................................ 9,032 7,320 1,627 -299 546 16,878 1,634July ............................................. 9,056 7,347 1,622 -153 199 16,971 1,635August ........................................ 9,027 7,316 1,627 103 316 17,183 1,648September .................................. 9,088 7,368 1,623 -156 653 16,848 1,663October ....................................... 9,212 7,437 1,686 51 -659 16,996 1,644November ................................... 9,129 7,328 1,697 43 62 16,730 1,647December ................................... 9,089 7,299 1,686 -611 -365 17,145 1,617Average ..................................... 9,168 7,417 1,659 -42 32 16,714 1,617
1992January ....................................... 9,176 7,361 1,688 540 -757 17,012 1,610February ..................................... 9,175 7,389 1,696 171 -951 16,893 1,588March .......................................... 9,123 7,348 1,694 -250 -291 16,825 1,571April ............................................ 9,072 7,293 1,693 315 92 16,764 1,583May ............................................. 8,949 7,169 1,695 -144 770 16,485 1,602June ............................................ 8,968 7,167 1,701 -581 604 16,978 1,603July ............................................. 8,961 7,131 1,683 244 290 17,143 1,620August ........................................ 8,678 6,922 1,638 -124 161 16,929 1,621September .................................. 8,843 7,030 1,660 -160 653 16,876 1,636October ....................................... 9,025 7,126 1,722 411 -258 17,448 1,640November ................................... 8,975 7,024 1,754 -227 77 17,091 1,636December ................................... 9,019 7,103 1,744 -212 -1,203 17,928 1,592Average ..................................... 8,996 7,171 1,697 -1 -68 17,033 1,592
a A negative number indicates a decrease in stocks and a positive numberindicates an increase.
b Stocks are totals as of end of period.c Includes crude oil, natural gas plant liquids, and other liquids.d Includes stocks located in the Strategic Petroleum Reserve.
e See Note 4 at end of section.f See Note 7 at end of section.
Notes: • Crude oil includes lease condensate. • Geographic coverage isthe 50 States and the District of Columbia.
Sources: See end of section.
Energy Information Administration/Historical Monthly Energy Review 1973-199282

Table 3.1b Petroleum Overview, 1973-1992: Imports, Exports, and Net Imports
Imports Exports
NetImportsbTotal
CrudeOila
PetroleumProducts Total
CrudeOil
PetroleumProducts
Thousand Barrels per Day
1973January ....................................... 5,857 2,732 3,125 211 0 211 5,646February ..................................... 6,507 2,873 3,635 261 0 261 6,246March .......................................... 6,610 3,162 3,448 224 0 224 6,386April ............................................ 5,593 3,049 2,545 276 0 276 5,318May ............................................. 5,841 3,215 2,626 237 4 233 5,604June ............................................ 5,890 3,220 2,670 215 0 215 5,675July ............................................. 6,179 3,501 2,678 241 7 233 5,938August ........................................ 6,591 3,593 2,999 218 0 218 6,373September .................................. 6,411 3,471 2,941 243 5 238 6,168October ....................................... 6,633 3,739 2,894 222 0 222 6,411November ................................... 6,922 3,452 3,470 203 0 203 6,720December ................................... 6,056 2,891 3,164 228 6 222 5,828Average ..................................... 6,256 3,244 3,012 231 2 229 6,025
1974January ....................................... 5,371 2,382 2,989 207 17 189 5,164February ..................................... 5,216 2,248 2,968 203 10 193 5,013March .......................................... 5,274 2,462 2,812 196 0 196 5,078April ............................................ 5,980 3,267 2,713 243 1 243 5,736May ............................................. 6,493 3,908 2,586 247 6 240 6,247June ............................................ 6,360 3,925 2,435 238 1 237 6,122July ............................................. 6,537 4,091 2,445 253 0 253 6,283August ........................................ 6,361 3,924 2,438 247 0 247 6,114September .................................. 6,052 3,797 2,255 171 0 171 5,881October ....................................... 6,175 3,810 2,366 221 0 221 5,954November ................................... 6,798 3,958 2,840 186 0 186 6,612December ................................... 6,667 3,869 2,798 231 0 231 6,436Average ..................................... 6,112 3,477 2,635 221 3 218 5,892
1975January ....................................... 6,861 4,029 2,832 228 27 201 6,633February ..................................... 6,176 3,828 2,348 248 34 214 5,928March .......................................... 5,730 3,656 2,074 213 11 202 5,517April ............................................ 5,040 3,378 1,662 190 1 190 4,850May ............................................. 5,214 3,486 1,728 202 0 202 5,012June ............................................ 5,406 3,905 1,502 224 0 224 5,182July ............................................. 5,959 4,192 1,767 186 0 186 5,773August ........................................ 6,298 4,581 1,717 203 0 203 6,095September .................................. 6,804 4,689 2,115 205 0 205 6,599October ....................................... 6,329 4,389 1,940 187 0 187 6,142November ................................... 6,419 4,623 1,796 166 0 166 6,253December ................................... 6,425 4,476 1,949 262 0 262 6,164Average ..................................... 6,056 4,105 1,951 209 6 204 5,846
1976January ....................................... 6,714 4,594 2,119 156 0 156 6,558February ..................................... 6,712 4,208 2,504 241 0 241 6,471March .......................................... 6,687 4,738 1,949 185 1 183 6,502April ............................................ 6,595 4,790 1,806 222 0 222 6,373May ............................................. 6,323 4,669 1,654 179 (s) 179 6,144June ............................................ 7,474 5,628 1,847 213 0 213 7,262July ............................................. 7,884 5,792 2,092 242 0 242 7,641August ........................................ 7,382 5,556 1,827 220 12 208 7,162September .................................. 7,924 5,875 2,050 196 0 196 7,728October ....................................... 7,536 5,689 1,847 198 18 180 7,338November ................................... 8,060 5,946 2,115 348 30 318 7,712December ................................... 8,447 5,925 2,522 279 34 246 8,168Average ..................................... 7,313 5,287 2,026 223 8 215 7,090
1977January ....................................... 8,903 6,281 2,622 192 13 179 8,711February ..................................... 9,997 6,659 3,338 234 59 175 9,763March .......................................... 9,383 6,699 2,684 207 32 175 9,176April ............................................ 8,723 6,821 1,902 223 17 207 8,499May ............................................. 8,571 6,818 1,753 288 89 199 8,283June ............................................ 8,937 7,065 1,872 225 10 215 8,712July ............................................. 9,095 7,068 2,027 254 53 201 8,842August ........................................ 8,574 6,395 2,179 230 37 193 8,345September .................................. 8,567 6,429 2,137 294 91 203 8,273October ....................................... 8,364 6,502 1,862 255 85 170 8,109November ................................... 8,135 6,321 1,814 235 45 190 7,900December ................................... 8,525 6,327 2,198 274 69 206 8,251Average ..................................... 8,807 6,615 2,193 243 50 193 8,565
See footnotes at end of table.
Energy Information Administration/Historical Monthly Energy Review 1973-1992 83

Table 3.1b Petroleum Overview, 1973-1992: Imports, Exports, and Net Imports (Continued)
Imports Exports
NetImportsbTotal
CrudeOila
PetroleumProducts Total
CrudeOil
PetroleumProducts
Thousand Barrels per Day
1978January ....................................... 8,332 6,240 2,092 257 98 158 8,076February ..................................... 8,119 5,764 2,355 208 8 200 7,911March .......................................... 8,501 6,163 2,338 269 60 209 8,232April ............................................ 7,743 5,627 2,116 337 92 245 7,406May ............................................. 7,531 5,727 1,804 313 124 189 7,218June ............................................ 8,108 6,468 1,640 399 195 204 7,709July ............................................. 8,277 6,329 1,948 330 138 192 7,947August ........................................ 8,292 6,435 1,858 411 182 229 7,881September .................................. 9,036 7,053 1,983 477 251 226 8,559October ....................................... 8,313 6,595 1,718 469 272 197 7,845November ................................... 8,852 6,831 2,021 409 218 191 8,443December ................................... 9,241 6,996 2,245 455 251 205 8,786Average ..................................... 8,363 6,356 2,008 362 158 204 8,002
1979January ....................................... 9,148 6,925 2,223 392 177 215 8,756February ..................................... 8,591 6,522 2,069 486 288 198 8,105March .......................................... 8,760 6,374 2,386 611 370 241 8,150April ............................................ 7,893 6,211 1,682 493 260 234 7,400May ............................................. 8,091 6,261 1,830 429 171 257 7,662June ............................................ 8,327 6,647 1,680 468 235 233 7,859July ............................................. 8,559 6,602 1,956 486 244 242 8,072August ........................................ 8,590 6,809 1,781 466 245 221 8,124September .................................. 8,023 6,426 1,597 414 175 239 7,609October ....................................... 8,688 6,890 1,798 425 179 246 8,263November ................................... 8,141 6,228 1,913 510 264 246 7,631December ................................... 8,628 6,318 2,310 471 215 256 8,157Average ..................................... 8,456 6,519 1,937 c 471 235 c 236 c 7,985
1980January ....................................... 8,598 6,406 2,192 550 322 228 8,048February ..................................... 7,945 6,013 1,931 558 332 227 7,386March .......................................... 7,452 5,695 1,757 573 330 243 6,879April ............................................ 7,106 5,598 1,508 434 192 241 6,672May ............................................. 6,579 5,106 1,472 591 326 266 5,987June ............................................ 6,894 5,480 1,414 654 365 289 6,240July ............................................. 6,257 4,843 1,414 531 238 293 5,727August ........................................ 6,192 4,803 1,389 319 78 241 5,873September .................................. 6,239 4,707 1,532 557 322 235 5,682October ....................................... 6,379 4,768 1,611 598 309 288 5,781November ................................... 6,408 4,680 1,728 549 289 260 c 5,859December ................................... 6,894 5,082 1,812 622 343 279 6,272Average ..................................... 6,909 5,263 1,646 544 287 258 6,365
1981January ....................................... 6,827 4,932 1,895 558 339 219 6,270February ..................................... 6,772 4,873 1,899 569 198 371 6,203March .......................................... 6,028 4,521 1,507 586 210 376 5,442April ............................................ 5,668 4,338 1,330 570 198 372 5,098May ............................................. 5,775 4,287 1,489 595 312 283 5,180June ............................................ 5,435 4,061 1,375 420 123 297 5,015July ............................................. 5,816 4,296 1,521 571 257 314 5,245August ........................................ 5,767 4,179 1,588 644 204 440 5,123September .................................. 6,365 4,740 1,624 519 194 325 5,845October ....................................... 5,959 4,380 1,579 738 226 512 5,221November ................................... 5,741 4,046 1,695 701 278 423 5,041December ................................... 5,843 4,137 1,706 656 189 467 5,187Average ..................................... 5,996 4,396 1,599 595 228 367 5,401
1982January ....................................... c 5,330 3,693 c 1,638 829 238 591 c 4,502February ..................................... 4,807 2,990 1,817 804 304 499 4,003March .......................................... 4,484 2,874 1,610 882 321 561 3,602April ............................................ 4,378 2,849 1,529 786 174 611 3,593May ............................................. 4,811 3,309 1,503 803 262 542 4,008June ............................................ 5,327 3,836 1,491 703 94 609 4,624July ............................................. 5,890 4,248 1,642 741 229 512 5,149August ........................................ 5,244 3,851 1,392 858 304 554 4,386September .................................. 5,414 3,636 1,778 791 184 606 4,624October ....................................... 5,306 3,670 1,636 932 270 662 4,374November ................................... 5,744 3,862 1,882 786 262 524 4,958December ................................... 4,606 3,000 1,605 860 193 667 3,746Average ..................................... 5,113 3,488 1,625 815 236 579 4,298
See footnotes at end of table.
Energy Information Administration/Historical Monthly Energy Review 1973-199284

Table 3.1b Petroleum Overview, 1973-1992: Imports, Exports, and Net Imports (Continued)
Imports Exports
NetImportsbTotal
CrudeOila
PetroleumProducts Total
CrudeOil
PetroleumProducts
Thousand Barrels per Day
1983January ....................................... 4,438 2,964 1,474 973 117 856 3,464February ..................................... 3,726 2,267 1,459 865 262 603 2,861March .......................................... 3,690 2,290 1,400 801 174 627 2,889April ............................................ 4,727 3,118 1,609 809 88 721 3,918May ............................................. 5,089 3,360 1,729 848 280 568 4,241June ............................................ 5,326 3,577 1,749 774 144 630 4,552July ............................................. 5,741 3,871 1,870 571 145 426 5,170August ........................................ 6,159 4,227 1,933 663 172 491 5,496September .................................. 6,129 4,210 1,919 684 177 507 5,445October ....................................... 5,258 3,446 1,812 576 140 436 4,682November ................................... 5,210 3,337 1,873 679 186 494 4,531December ................................... 5,033 3,213 1,820 639 95 544 4,394Average ..................................... 5,051 3,329 1,722 739 164 575 4,312
1984January ....................................... 5,430 3,055 2,375 575 153 422 4,855February ..................................... 5,693 2,950 2,743 582 185 397 5,111March .......................................... 5,301 3,470 1,832 840 236 605 4,461April ............................................ 5,372 3,417 1,955 655 172 483 4,717May ............................................. 5,979 3,942 2,036 766 219 548 5,212June ............................................ 5,482 3,546 1,936 864 222 642 4,618July ............................................. 5,407 3,646 1,761 536 108 429 4,871August ........................................ 5,044 3,248 1,796 732 190 542 4,312September .................................. 5,252 3,342 1,909 664 162 502 4,588October ....................................... 5,779 3,751 2,028 599 141 458 5,179November ................................... 5,587 3,583 2,004 854 202 652 4,733December ................................... 4,933 3,136 1,796 986 185 801 3,947Average ..................................... 5,437 3,426 2,011 722 181 541 4,715
1985January ....................................... 4,415 2,717 1,698 792 144 647 3,623February ..................................... 3,913 2,108 1,805 857 221 636 3,056March .......................................... 4,673 2,786 1,887 694 189 505 3,979April ............................................ 5,316 3,401 1,915 764 236 528 4,553May ............................................. 5,776 3,730 2,046 705 250 455 5,071June ............................................ 4,929 3,188 1,741 692 226 467 4,237July ............................................. 4,950 3,203 1,747 675 154 521 4,274August ........................................ 4,718 3,114 1,603 749 241 508 3,969September .................................. 4,970 3,155 1,816 806 188 618 4,164October ....................................... 5,121 3,238 1,883 690 123 567 4,431November ................................... 6,116 3,999 2,118 1,036 286 750 5,080December ................................... 5,831 3,696 2,135 925 197 728 4,905Average ..................................... 5,067 3,201 1,866 781 204 577 4,286
1986January ....................................... 5,573 3,472 2,101 859 159 700 4,714February ..................................... 4,676 2,968 1,709 876 162 715 3,800March .......................................... 4,712 2,988 1,724 732 212 520 3,980April ............................................ 5,439 3,684 1,755 850 94 756 4,589May ............................................. 6,400 4,250 2,150 724 98 625 5,676June ............................................ 6,848 4,635 2,213 642 240 401 6,206July ............................................. 6,942 4,726 2,216 685 65 620 6,256August ........................................ 7,168 4,859 2,309 868 233 635 6,300September .................................. 7,090 5,031 2,059 714 161 553 6,375October ....................................... 6,427 4,419 2,008 831 151 680 5,597November ................................... 6,592 4,615 1,977 821 115 706 5,771December ................................... 6,700 4,412 2,288 820 159 661 5,881Average ..................................... 6,224 4,178 2,045 785 154 631 5,439
1987January ....................................... 6,353 4,385 1,968 703 84 619 5,650February ..................................... 5,984 3,866 2,118 977 284 694 5,007March .......................................... 5,794 3,779 2,015 720 150 570 5,074April ............................................ 5,911 4,132 1,779 870 247 624 5,041May ............................................. 6,073 4,340 1,732 666 69 597 5,407June ............................................ 6,769 4,807 1,962 669 116 554 6,099July ............................................. 7,588 5,295 2,293 680 149 531 6,908August ........................................ 7,454 5,510 1,944 664 141 523 6,790September .................................. 7,178 5,110 2,068 795 116 680 6,382October ....................................... 7,068 5,142 1,926 646 84 562 6,422November ................................... 7,068 5,013 2,055 737 164 573 6,331December ................................... 6,833 4,640 2,194 1,057 220 838 5,776Average ..................................... 6,678 4,674 2,004 764 151 613 5,914
See footnotes at end of table.
Energy Information Administration/Historical Monthly Energy Review 1973-1992 85

Table 3.1b Petroleum Overview, 1973-1992: Imports, Exports, and Net Imports (Continued)
Imports Exports
NetImportsbTotal
CrudeOila
PetroleumProducts Total
CrudeOil
PetroleumProducts
Thousand Barrels per Day
1988January ....................................... 7,181 4,662 2,519 885 206 679 6,296February ..................................... 7,256 4,650 2,605 864 146 718 6,392March .......................................... 6,944 4,868 2,076 834 213 622 6,110April ............................................ 7,270 5,167 2,103 676 114 562 6,594May ............................................. 7,469 5,339 2,130 814 138 676 6,655June ............................................ 7,239 5,322 1,917 938 138 800 6,301July ............................................. 7,297 5,100 2,197 826 186 640 6,471August ........................................ 7,386 5,089 2,296 814 152 661 6,572September .................................. 7,506 5,212 2,294 673 119 554 6,833October ....................................... 7,830 5,551 2,279 732 166 566 7,098November ................................... 7,714 5,070 2,644 717 148 569 6,997December ................................... 7,727 5,230 2,497 1,008 129 879 6,719Average ..................................... 7,402 5,107 2,295 815 155 661 6,587
1989January ....................................... 8,255 5,661 2,594 761 137 624 7,494February ..................................... 8,032 5,305 2,727 875 208 666 7,157March .......................................... 7,456 5,035 2,421 860 156 704 6,596April ............................................ 8,078 5,750 2,328 810 139 670 7,268May ............................................. 7,778 5,729 2,049 791 131 661 6,986June ............................................ 7,977 5,976 2,002 975 243 732 7,002July ............................................. 8,369 6,214 2,155 780 69 711 7,589August ........................................ 8,560 6,565 1,995 967 162 805 7,593September .................................. 8,002 6,028 1,975 655 32 623 7,347October ....................................... 8,301 6,187 2,115 791 61 730 7,511November ................................... 8,341 6,171 2,170 975 120 855 7,366December ................................... 7,579 5,463 2,116 1,067 247 821 6,512Average ..................................... 8,061 5,843 2,217 859 142 717 7,202
1990January ....................................... 9,197 6,212 2,985 709 132 578 8,488February ..................................... 8,399 5,895 2,505 822 102 720 7,577March .......................................... 7,965 6,117 1,848 880 132 748 7,084April ............................................ 7,858 5,813 2,045 761 111 649 7,097May ............................................. 8,834 6,454 2,380 690 112 578 8,144June ............................................ 8,747 6,423 2,323 803 88 715 7,944July ............................................. 9,048 6,855 2,193 696 89 606 8,353August ........................................ 8,644 6,452 2,192 850 64 785 7,794September .................................. 7,361 5,664 1,698 847 68 779 6,514October ....................................... 6,717 5,132 1,585 949 104 844 5,768November ................................... 7,003 5,085 1,918 1,085 137 948 5,918December ................................... 6,439 4,611 1,828 1,187 162 1,026 5,252Average ..................................... 8,018 5,894 2,123 857 109 748 7,161
1991January ....................................... 7,103 5,296 1,808 1,199 50 1,149 5,904February ..................................... 6,865 5,485 1,380 1,441 152 1,288 5,424March .......................................... 6,646 5,166 1,480 944 137 807 5,702April ............................................ 7,418 5,529 1,888 737 162 575 6,680May ............................................. 8,518 6,363 2,155 1,149 165 984 7,369June ............................................ 8,245 6,334 1,911 921 78 843 7,323July ............................................. 7,755 5,955 1,801 963 139 824 6,793August ........................................ 8,670 6,645 2,025 837 55 783 7,832September .................................. 7,826 5,812 2,015 785 109 676 7,042October ....................................... 7,467 5,683 1,784 918 92 826 6,550November ................................... 7,615 5,528 2,087 926 126 800 6,690December ................................... 7,337 5,565 1,772 1,213 133 1,081 6,124Average ..................................... 7,627 5,782 1,844 1,001 116 885 6,626
1992January ....................................... 7,712 5,956 1,756 1,144 118 1,026 6,568February ..................................... 6,827 5,079 1,748 852 22 829 5,975March .......................................... 7,068 5,321 1,747 912 105 807 6,156April ............................................ 8,092 6,127 1,966 937 23 914 7,155May ............................................. 7,823 6,060 1,763 885 106 779 6,939June ............................................ 7,946 6,171 1,775 957 107 850 6,989July ............................................. 8,479 6,796 1,683 929 53 876 7,550August ........................................ 8,260 6,457 1,803 789 133 657 7,470September .................................. 8,178 6,218 1,960 848 68 780 7,330October ....................................... 8,505 6,696 1,810 902 106 796 7,603November ................................... 7,872 6,121 1,751 995 111 885 6,877December ................................... 7,839 5,937 1,901 1,237 107 1,130 6,602Average ..................................... 7,888 6,083 1,805 950 89 861 6,938
a Includes crude oil for storage in the Strategic Petroleum Reserve.b Net imports equals imports minus exports.c See Note 7 at end of section.(s)=Less than 500 barrels per day.
Notes: • Crude oil includes lease condensate. • Totals may not equalsum of components due to independent rounding. • Geographic coverage isthe 50 States and the District of Columbia.
Sources: See end of section.
Energy Information Administration/Historical Monthly Energy Review 1973-199286

Table 3.2a Crude Oil Supply and Disposition, 1973-1992: Supply
Supply
Field Production ImportsUnaccounted-
for CrudeOilb
Crude OilUsed
DirectlycTotal
Domestic Alaskan Total SPRa Other
Thousand Barrels per Day
1973January ............................. 9,176 195 2,732 – 2,732 20 -12February ........................... 9,395 216 2,873 – 2,873 -130 -13March ................................ 9,272 174 3,162 – 3,162 76 -13April .................................. 9,292 197 3,049 – 3,049 49 -13May ................................... 9,262 200 3,215 – 3,215 127 -12June .................................. 9,214 198 3,220 – 3,220 168 -27July ................................... 9,217 202 3,501 – 3,501 -96 -18August .............................. 9,169 207 3,593 – 3,593 66 -28September ........................ 9,065 201 3,471 – 3,471 -171 -21October ............................. 9,224 200 3,739 – 3,739 -4 -26November ......................... 9,161 195 3,452 – 3,452 -78 -25December ......................... 9,063 196 2,891 – 2,891 -11 -18Average ........................... 9,208 198 3,244 – 3,244 3 -19
1974January ............................. 8,934 191 2,382 – 2,382 -82 -19February ........................... 9,142 190 2,248 – 2,248 26 -17March ................................ 8,965 183 2,462 – 2,462 80 -13April .................................. 8,954 180 3,267 – 3,267 20 -14May ................................... 8,911 191 3,908 – 3,908 -30 -14June .................................. 8,780 202 3,925 – 3,925 -1 -15July ................................... 8,780 202 4,091 – 4,091 -36 -14August .............................. 8,699 200 3,924 – 3,924 -75 -14September ........................ 8,443 196 3,797 – 3,797 -26 -14October ............................. 8,611 197 3,810 – 3,810 -19 -15November ......................... 8,569 196 3,958 – 3,958 -105 -20December ......................... 8,527 191 3,869 – 3,869 -47 -14Average ........................... 8,774 193 3,477 – 3,477 -25 -15
1975January ............................. 8,455 193 4,029 – 4,029 42 -14February ........................... 8,591 192 3,828 – 3,828 2 -15March ................................ 8,493 190 3,656 – 3,656 -104 -13April .................................. 8,457 188 3,378 – 3,378 61 -15May ................................... 8,379 192 3,486 – 3,486 117 -17June .................................. 8,421 190 3,905 – 3,905 -40 -16July ................................... 8,336 190 4,192 – 4,192 34 -20August .............................. 8,249 190 4,581 – 4,581 1 -14September ........................ 8,280 195 4,689 – 4,689 109 -24October ............................. 8,324 192 4,389 – 4,389 9 -17November ......................... 8,278 192 4,623 – 4,623 -131 -22December ......................... 8,254 192 4,476 – 4,476 94 -17Average ........................... 8,375 191 4,105 – 4,105 17 -17
1976January ............................. 8,232 193 4,594 – 4,594 346 -19February ........................... 8,231 191 4,208 – 4,208 18 -19March ................................ 8,232 190 4,738 – 4,738 124 -18April .................................. 8,077 159 4,790 – 4,790 10 -19May ................................... 8,125 149 4,669 – 4,669 73 -18June .................................. 8,094 150 5,628 – 5,628 35 -19July ................................... 8,127 171 5,792 – 5,792 43 -18August .............................. 8,111 173 5,556 – 5,556 94 -17September ........................ 8,150 172 5,875 – 5,875 -38 -19October ............................. 8,063 179 5,689 – 5,689 49 -19November ......................... 8,080 175 5,946 – 5,946 180 -20December ......................... 8,061 175 5,925 – 5,925 -16 -19Average ........................... 8,132 173 5,287 – 5,287 77 d -19
1977January ............................. 7,854 172 6,281 – 6,281 316 -14February ........................... 8,139 167 6,659 – 6,659 -69 -15March ................................ 8,090 164 6,699 – 6,699 -203 -15April .................................. 8,145 163 6,821 – 6,821 -97 -15May ................................... 8,075 166 6,818 – 6,818 137 -14June .................................. 8,102 285 7,065 – 7,065 -96 -15July ................................... 8,105 371 7,068 – 7,068 -158 -14August .............................. 8,307 638 6,395 – 6,395 122 -14September ........................ 8,480 861 6,429 – 6,429 -22 -14October ............................. 8,573 839 6,502 93 6,409 -13 -14November ......................... 8,579 859 6,321 73 6,248 47 -14December ......................... 8,487 858 6,327 79 6,248 -51 -14Average ........................... 8,245 464 6,615 21 6,594 -6 -14
See footnotes at end of table.
Energy Information Administration/Historical Monthly Energy Review 1973-1992 87
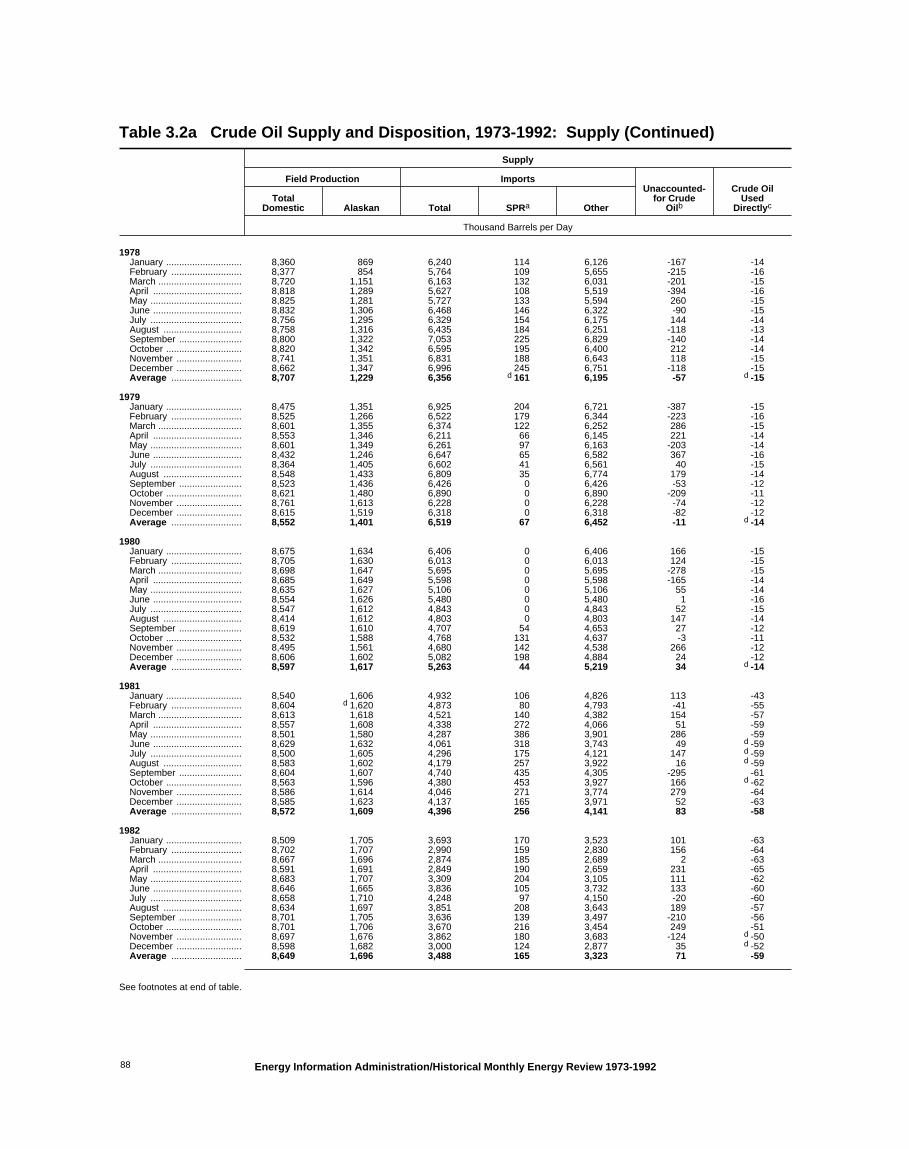
Table 3.2a Crude Oil Supply and Disposition, 1973-1992: Supply (Continued)
Supply
Field Production ImportsUnaccounted-
for CrudeOilb
Crude OilUsed
DirectlycTotal
Domestic Alaskan Total SPRa Other
Thousand Barrels per Day
1978January ............................. 8,360 869 6,240 114 6,126 -167 -14February ........................... 8,377 854 5,764 109 5,655 -215 -16March ................................ 8,720 1,151 6,163 132 6,031 -201 -15April .................................. 8,818 1,289 5,627 108 5,519 -394 -16May ................................... 8,825 1,281 5,727 133 5,594 260 -15June .................................. 8,832 1,306 6,468 146 6,322 -90 -15July ................................... 8,756 1,295 6,329 154 6,175 144 -14August .............................. 8,758 1,316 6,435 184 6,251 -118 -13September ........................ 8,800 1,322 7,053 225 6,829 -140 -14October ............................. 8,820 1,342 6,595 195 6,400 212 -14November ......................... 8,741 1,351 6,831 188 6,643 118 -15December ......................... 8,662 1,347 6,996 245 6,751 -118 -15Average ........................... 8,707 1,229 6,356 d 161 6,195 -57 d -15
1979January ............................. 8,475 1,351 6,925 204 6,721 -387 -15February ........................... 8,525 1,266 6,522 179 6,344 -223 -16March ................................ 8,601 1,355 6,374 122 6,252 286 -15April .................................. 8,553 1,346 6,211 66 6,145 221 -14May ................................... 8,601 1,349 6,261 97 6,163 -203 -14June .................................. 8,432 1,246 6,647 65 6,582 367 -16July ................................... 8,364 1,405 6,602 41 6,561 40 -15August .............................. 8,548 1,433 6,809 35 6,774 179 -14September ........................ 8,523 1,436 6,426 0 6,426 -53 -12October ............................. 8,621 1,480 6,890 0 6,890 -209 -11November ......................... 8,761 1,613 6,228 0 6,228 -74 -12December ......................... 8,615 1,519 6,318 0 6,318 -82 -12Average ........................... 8,552 1,401 6,519 67 6,452 -11 d -14
1980January ............................. 8,675 1,634 6,406 0 6,406 166 -15February ........................... 8,705 1,630 6,013 0 6,013 124 -15March ................................ 8,698 1,647 5,695 0 5,695 -278 -15April .................................. 8,685 1,649 5,598 0 5,598 -165 -14May ................................... 8,635 1,627 5,106 0 5,106 55 -14June .................................. 8,554 1,626 5,480 0 5,480 1 -16July ................................... 8,547 1,612 4,843 0 4,843 52 -15August .............................. 8,414 1,612 4,803 0 4,803 147 -14September ........................ 8,619 1,610 4,707 54 4,653 27 -12October ............................. 8,532 1,588 4,768 131 4,637 -3 -11November ......................... 8,495 1,561 4,680 142 4,538 266 -12December ......................... 8,606 1,602 5,082 198 4,884 24 -12Average ........................... 8,597 1,617 5,263 44 5,219 34 d -14
1981January ............................. 8,540 1,606 4,932 106 4,826 113 -43February ........................... 8,604 d 1,620 4,873 80 4,793 -41 -55March ................................ 8,613 1,618 4,521 140 4,382 154 -57April .................................. 8,557 1,608 4,338 272 4,066 51 -59May ................................... 8,501 1,580 4,287 386 3,901 286 -59June .................................. 8,629 1,632 4,061 318 3,743 49 d -59July ................................... 8,500 1,605 4,296 175 4,121 147 d -59August .............................. 8,583 1,602 4,179 257 3,922 16 d -59September ........................ 8,604 1,607 4,740 435 4,305 -295 -61October ............................. 8,563 1,596 4,380 453 3,927 166 d -62November ......................... 8,586 1,614 4,046 271 3,774 279 -64December ......................... 8,585 1,623 4,137 165 3,971 52 -63Average ........................... 8,572 1,609 4,396 256 4,141 83 -58
1982January ............................. 8,509 1,705 3,693 170 3,523 101 -63February ........................... 8,702 1,707 2,990 159 2,830 156 -64March ................................ 8,667 1,696 2,874 185 2,689 2 -63April .................................. 8,591 1,691 2,849 190 2,659 231 -65May ................................... 8,683 1,707 3,309 204 3,105 111 -62June .................................. 8,646 1,665 3,836 105 3,732 133 -60July ................................... 8,658 1,710 4,248 97 4,150 -20 -60August .............................. 8,634 1,697 3,851 208 3,643 189 -57September ........................ 8,701 1,705 3,636 139 3,497 -210 -56October ............................. 8,701 1,706 3,670 216 3,454 249 -51November ......................... 8,697 1,676 3,862 180 3,683 -124 d -50December ......................... 8,598 1,682 3,000 124 2,877 35 d -52Average ........................... 8,649 1,696 3,488 165 3,323 71 -59
See footnotes at end of table.
Energy Information Administration/Historical Monthly Energy Review 1973-199288

Table 3.2a Crude Oil Supply and Disposition, 1973-1992: Supply (Continued)
Supply
Field Production ImportsUnaccounted-
for CrudeOilb
Crude OilUsed
DirectlycTotal
Domestic Alaskan Total SPRa Other
Thousand Barrels per Day
1983January ............................. 8,697 1,732 2,964 219 2,746 170 –February ........................... 8,758 1,717 2,267 197 2,070 262 –March ................................ 8,700 1,732 2,290 201 2,089 31 –April .................................. 8,776 1,721 3,118 205 2,913 98 –May ................................... 8,631 1,662 3,360 289 3,071 169 –June .................................. 8,667 1,687 3,577 190 3,387 370 –July ................................... 8,636 1,715 3,871 274 3,597 -167 –August .............................. 8,679 1,697 4,227 350 3,876 281 –September ........................ 8,784 1,738 4,210 309 3,901 -30 –October ............................. 8,771 1,733 3,446 202 3,244 44 –November ......................... 8,770 1,720 3,337 171 3,166 34 –December ......................... 8,397 1,711 3,213 193 3,020 117 –Average ........................... 8,688 1,714 3,329 234 3,096 114 –
1984January ............................. 8,868 1,752 3,055 200 2,855 211 –February ........................... 8,874 1,749 2,950 85 2,866 386 –March ................................ 8,672 1,570 3,470 148 3,322 110 –April .................................. 8,862 1,770 3,417 170 3,248 325 –May ................................... 8,955 1,764 3,942 246 3,696 309 –June .................................. 8,852 1,659 3,546 309 3,237 246 –July ................................... 8,885 1,695 3,646 329 3,317 -164 –August .............................. 8,809 1,722 3,248 180 3,068 293 –September ........................ 8,993 1,761 3,342 53 3,289 -94 –October ............................. 8,906 1,732 3,751 187 3,565 291 –November ......................... 8,979 1,781 3,583 219 3,364 47 –December ......................... 8,897 1,720 3,136 229 2,907 262 –Average ........................... 8,879 1,722 3,426 197 3,229 185 –
1985January ............................. 8,740 1,647 2,717 223 2,494 122 –February ........................... 9,025 1,877 2,108 98 2,010 94 –March ................................ 9,095 1,866 2,786 48 2,738 59 –April .................................. 9,043 1,784 3,401 108 3,293 183 –May ................................... 9,132 1,888 3,730 222 3,508 247 –June .................................. 9,022 1,871 3,188 155 3,034 100 –July ................................... 8,949 1,809 3,203 226 2,977 177 –August .............................. 8,803 1,795 3,114 116 2,999 267 –September ........................ 8,954 1,867 3,155 71 3,084 93 –October ............................. 8,970 1,850 3,238 20 3,218 81 –November ......................... 8,902 1,804 3,999 53 3,946 150 –December ......................... 9,030 1,852 3,696 74 3,621 164 –Average ........................... 8,971 1,825 3,201 118 3,083 145 –
1986January ............................. 9,137 1,870 3,472 51 3,420 364 –February ........................... 9,173 1,907 2,968 24 2,944 32 –March ................................ 9,013 1,860 2,988 59 2,929 259 –April .................................. 8,864 1,836 3,684 63 3,621 70 –May ................................... 8,838 1,927 4,250 36 4,215 79 –June .................................. 8,623 1,887 4,635 64 4,571 292 –July ................................... 8,660 1,903 4,726 52 4,674 189 –August .............................. 8,374 1,811 4,859 51 4,809 93 –September ........................ 8,328 1,782 5,031 47 4,984 161 –October ............................. 8,419 1,927 4,419 37 4,382 223 –November ......................... 8,412 1,883 4,615 45 4,570 -136 –December ......................... 8,352 1,807 4,412 48 4,365 28 –Average ........................... 8,680 1,867 4,178 48 4,130 139 –
1987January ............................. 8,480 2,019 4,385 92 4,293 -5 –February ........................... 8,389 1,853 3,866 44 3,822 382 –March ................................ 8,464 1,968 3,779 95 3,684 151 –April .................................. 8,498 1,990 4,132 57 4,076 120 –May ................................... 8,336 1,979 4,340 92 4,248 51 –June .................................. 8,279 1,930 4,807 64 4,743 434 –July ................................... 8,251 1,910 5,295 76 5,218 32 –August .............................. 8,210 1,908 5,510 63 5,447 177 –September ........................ 8,205 1,874 5,110 64 5,047 217 –October ............................. 8,364 1,986 5,142 57 5,085 -3 –November ......................... 8,397 2,068 5,013 97 4,916 115 –December ......................... 8,318 2,043 4,640 68 4,572 101 –Average ........................... 8,349 1,962 4,674 73 4,601 145 –
See footnotes at end of table.
Energy Information Administration/Historical Monthly Energy Review 1973-1992 89

Table 3.2a Crude Oil Supply and Disposition, 1973-1992: Supply (Continued)
Supply
Field Production ImportsUnaccounted-
for CrudeOilb
Crude OilUsed
DirectlycTotal
Domestic Alaskan Total SPRa Other
Thousand Barrels per Day
1988January ............................. 8,250 1,999 4,662 67 4,595 216 –February ........................... 8,374 2,070 4,650 49 4,601 -50 –March ................................ 8,374 2,086 4,868 23 4,845 258 –April .................................. 8,288 2,029 5,167 78 5,090 27 –May ................................... 8,229 2,016 5,339 22 5,317 125 –June .................................. 8,170 1,984 5,322 70 5,252 208 –July ................................... 8,040 1,960 5,100 42 5,058 432 –August .............................. 8,079 2,009 5,089 26 5,064 278 –September ........................ 7,895 2,019 5,212 84 5,128 228 –October ............................. 8,023 2,010 5,551 43 5,508 160 –November ......................... 8,023 2,027 5,070 89 4,981 258 –December ......................... 7,942 1,996 5,230 27 5,203 196 –Average ........................... 8,140 2,017 5,107 51 5,055 196 –
1989January ............................. 7,937 1,958 5,661 65 5,596 94 –February ........................... 7,788 1,962 5,305 84 5,221 -26 –March ................................ 7,575 1,686 5,035 75 4,960 426 –April .................................. 7,772 1,890 5,750 59 5,690 91 –May ................................... 7,816 1,973 5,729 77 5,652 280 –June .................................. 7,624 1,861 5,976 55 5,920 135 –July ................................... 7,444 1,725 6,214 75 6,139 426 –August .............................. 7,544 1,870 6,565 32 6,533 213 –September ........................ 7,548 1,875 6,028 59 5,969 121 –October ............................. 7,453 1,877 6,187 37 6,149 -125 –November ......................... 7,536 1,915 6,171 41 6,131 397 –December ......................... 7,337 1,904 5,463 12 5,452 343 –Average ........................... 7,613 1,874 5,843 56 5,787 200 –
1990January ............................. 7,546 1,864 6,212 24 6,188 178 –February ........................... 7,497 1,834 5,895 12 5,883 -98 –March ................................ 7,433 1,819 6,117 44 6,073 540 –April .................................. 7,407 1,802 5,813 38 5,775 -9 –May ................................... 7,328 1,765 6,454 89 6,365 225 –June .................................. 7,106 1,612 6,423 17 6,407 349 –July ................................... 7,173 1,687 6,855 0 6,855 150 –August .............................. 7,287 1,727 6,452 95 6,357 259 –September ........................ 7,224 1,702 5,664 0 5,664 402 –October ............................. 7,542 1,884 5,132 0 5,132 382 –November ......................... 7,387 1,746 5,085 0 5,085 269 –December ......................... 7,338 1,838 4,611 0 4,611 409 –Average ........................... 7,355 1,773 5,894 27 5,867 258 –
1991January ............................. 7,500 1,848 5,296 0 5,296 -59 –February ........................... 7,637 1,908 5,485 0 5,485 324 –March ................................ 7,546 1,887 5,166 0 5,166 43 –April .................................. 7,509 1,798 5,529 0 5,529 236 –May ................................... 7,409 1,771 6,363 0 6,363 513 –June .................................. 7,320 1,757 6,334 0 6,334 59 –July ................................... 7,347 1,775 5,955 0 5,955 403 –August .............................. 7,316 1,731 6,645 0 6,645 11 –September ........................ 7,368 1,787 5,812 0 5,812 484 –October ............................. 7,437 1,843 5,683 0 5,683 -59 –November ......................... 7,328 1,765 5,528 0 5,528 263 –December ......................... 7,299 1,718 5,565 0 5,565 146 –Average ........................... 7,417 1,798 5,782 0 5,782 195 –
1992January ............................. 7,361 1,789 5,956 0 5,956 290 –February ........................... 7,389 1,808 5,079 0 5,079 229 –March ................................ 7,348 1,785 5,321 0 5,321 287 –April .................................. 7,293 1,741 6,127 0 6,127 189 –May ................................... 7,169 1,682 6,060 0 6,060 421 –June .................................. 7,167 1,703 6,171 34 6,138 259 –July ................................... 7,131 1,655 6,796 0 6,796 332 –August .............................. 6,922 1,635 6,457 18 6,439 65 –September ........................ 7,030 1,700 6,218 16 6,202 385 –October ............................. 7,126 1,696 6,696 49 6,647 290 –November ......................... 7,024 1,674 6,121 0 6,121 296 –December ......................... 7,103 1,705 5,937 0 5,937 61 –Average ........................... 7,171 1,714 6,083 10 6,073 258 –
a Strategic Petroleum Reserve.b A balancing item.c Beginning in January 1983, crude oil used directly as fuel is shown as
product supplied.d See Note 7 at end of section.
– =Not applicable. Notes: • Crude oil includes lease condensate. • Totals may not equal
sum of components due to independent rounding. • Geographic coverage isthe 50 States and the District of Columbia.
Sources: See end of section.
Energy Information Administration/Historical Monthly Energy Review 1973-199290

Table 3.2b Crude Oil Supply and Disposition, 1973-1992: Disposition and Ending Stocks
Disposition Ending Stocksa
CrudeLosses
Stock Changeb
RefineryInputs Exports
ProductSuppliedd Total SPRc
OtherPrimarySPRc Other
Thousand Barrels per Day Million Barrels
1973January ..................................... 13 – -288 12,190 0 – 237 – 237February ................................... 13 – -75 12,187 0 – 235 – 235March ........................................ 13 – 283 12,201 0 – 244 – 244April .......................................... 13 – 155 12,208 0 – 249 – 249May ........................................... 13 – 293 12,281 4 – 258 – 258June .......................................... 14 – -300 12,862 0 – 249 – 249July ........................................... 14 – -167 12,750 7 – 244 – 244August ...................................... 14 – 150 12,635 0 – 248 – 248September ................................ 14 – -235 12,560 5 – 241 – 241October ..................................... 14 – 162 12,758 0 – 246 – 246November ................................. 13 – 123 12,374 0 – 250 – 250December ................................. 13 – -243 12,150 6 – 242 – 242Average ................................... 13 – -11 12,431 2 – 242 – 242
1974January ..................................... 12 – -305 11,491 17 – 233 – 233February ................................... 12 – 275 11,102 10 – 241 – 241March ........................................ 12 – 127 11,355 0 – 245 – 245April .......................................... 13 – 391 11,823 1 – 256 – 256May ........................................... 13 – 422 12,333 6 – 269 – 269June .......................................... 14 – -23 12,697 1 – 269 – 269July ........................................... 14 – -3 12,811 0 – 269 – 269August ...................................... 14 – -124 12,644 0 – 265 – 265September ................................ 13 – 63 12,124 0 – 267 – 267October ..................................... 13 – 87 12,286 0 – 269 – 269November ................................. 13 – 57 12,332 0 – 271 – 271December ................................. 13 – -198 12,519 0 – 265 – 265Average ................................... 13 – 62 12,133 3 – 265 – 265
1975January ..................................... 13 – 176 12,297 27 – 270 – 270February ................................... 13 – 225 12,135 34 – 277 – 277March ........................................ 13 – 104 11,905 11 – 280 – 280April .......................................... 13 – 64 11,803 1 – 282 – 282May ........................................... 13 – -31 11,983 0 – 281 – 281June .......................................... 13 – -161 12,417 0 – 276 – 276July ........................................... 14 – -386 12,915 0 – 264 – 264August ...................................... 14 – -243 13,046 0 – 257 – 257September ................................ 14 – 94 12,945 0 – 259 – 259October ..................................... 13 – 327 12,365 0 – 270 – 270November ................................. 14 – 46 12,689 0 – 271 – 271December ................................. 14 – 13 12,779 0 – 271 – 271Average ................................... 13 – 17 12,442 6 – 271 – 271
1976January ..................................... 14 – 579 12,560 0 – 289 – 289February ................................... 14 – -410 12,834 0 – 277 – 277March ........................................ 14 – 184 12,877 1 – 283 – 283April .......................................... 14 – 117 12,727 0 – 287 – 287May ........................................... 14 – -85 12,920 (s) – 284 – 284June .......................................... 15 – -76 13,799 0 – 282 – 282July ........................................... 15 – 29 13,901 0 – 283 – 283August ...................................... 15 – -172 13,888 12 – 277 – 277September ................................ 15 – 236 13,716 0 – 284 – 284October ..................................... 14 – 430 13,319 18 – 298 – 298November ................................. 15 – 38 14,101 30 – 299 – 299December ................................. 15 – -431 14,333 34 – 285 – 285Average ................................... e 14 – 39 13,416 8 – 285 – 285
1977January ..................................... 15 – 279 14,130 13 – 294 – 294February ................................... 16 – -95 14,734 59 – 291 – 291March ........................................ 15 – 260 14,263 32 – 300 – 300April .......................................... 15 – 645 14,177 17 – 319 – 319May ........................................... 16 – 319 14,593 89 – 329 – 329June .......................................... 16 – 166 14,865 10 – 334 – 334July ........................................... 16 – 51 14,882 53 – 335 – 335August ...................................... 16 – 115 14,642 37 – 339 – 339September ................................ 16 – -158 14,924 91 – 334 – 334October ..................................... 16 85 207 14,654 85 – 343 3 341November ................................. 16 81 155 14,636 45 – 350 5 345December ................................. 16 76 -160 14,748 69 – 348 7 340Average ................................... 16 20 150 14,602 50 – 348 7 340
See footnotes at end of table.
Energy Information Administration/Historical Monthly Energy Review 1973-1992 91
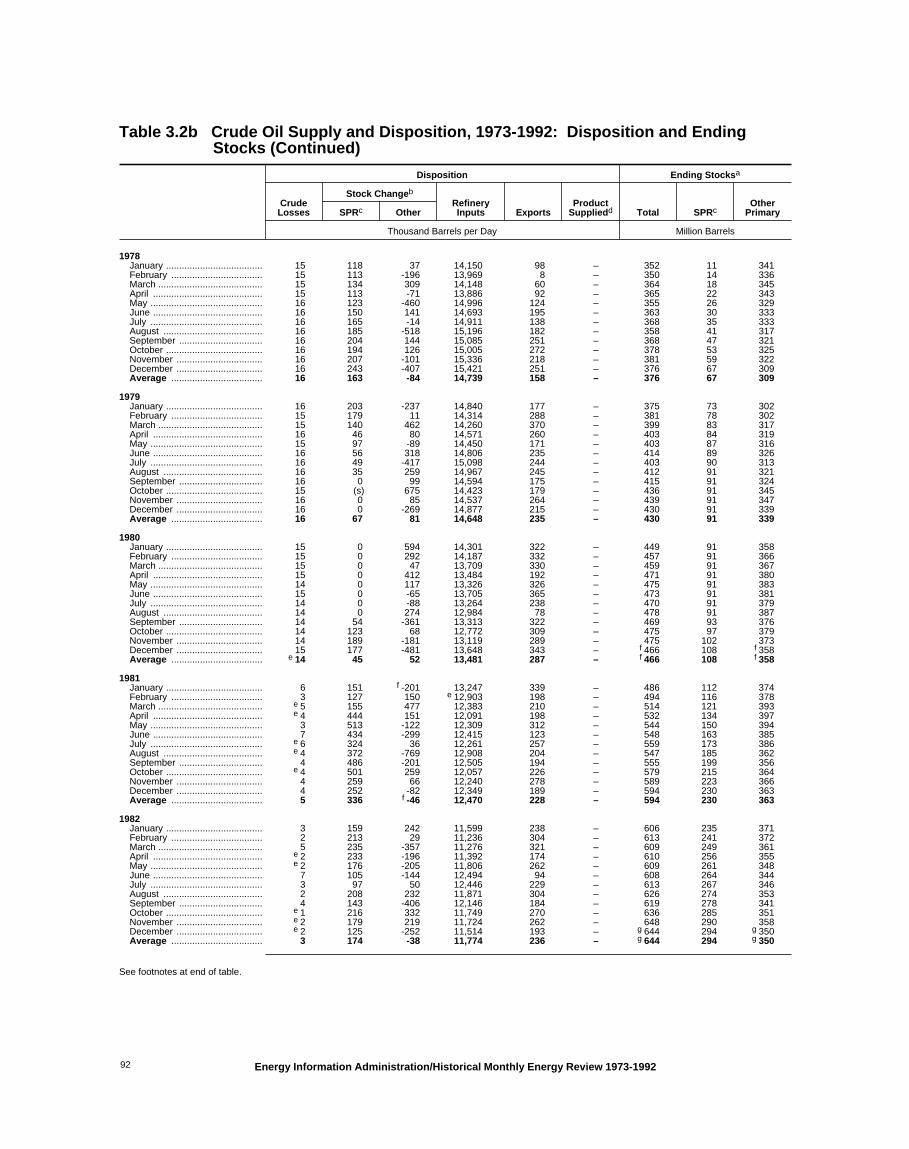
Table 3.2b Crude Oil Supply and Disposition, 1973-1992: Disposition and Ending Stocks (Continued)
Disposition Ending Stocksa
CrudeLosses
Stock Changeb
RefineryInputs Exports
ProductSuppliedd Total SPRc
OtherPrimarySPRc Other
Thousand Barrels per Day Million Barrels
1978January ..................................... 15 118 37 14,150 98 – 352 11 341February ................................... 15 113 -196 13,969 8 – 350 14 336March ........................................ 15 134 309 14,148 60 – 364 18 345April .......................................... 15 113 -71 13,886 92 – 365 22 343May ........................................... 16 123 -460 14,996 124 – 355 26 329June .......................................... 16 150 141 14,693 195 – 363 30 333July ........................................... 16 165 -14 14,911 138 – 368 35 333August ...................................... 16 185 -518 15,196 182 – 358 41 317September ................................ 16 204 144 15,085 251 – 368 47 321October ..................................... 16 194 126 15,005 272 – 378 53 325November ................................. 16 207 -101 15,336 218 – 381 59 322December ................................. 16 243 -407 15,421 251 – 376 67 309Average ................................... 16 163 -84 14,739 158 – 376 67 309
1979January ..................................... 16 203 -237 14,840 177 – 375 73 302February ................................... 15 179 11 14,314 288 – 381 78 302March ........................................ 15 140 462 14,260 370 – 399 83 317April .......................................... 16 46 80 14,571 260 – 403 84 319May ........................................... 15 97 -89 14,450 171 – 403 87 316June .......................................... 16 56 318 14,806 235 – 414 89 326July ........................................... 16 49 -417 15,098 244 – 403 90 313August ...................................... 16 35 259 14,967 245 – 412 91 321September ................................ 16 0 99 14,594 175 – 415 91 324October ..................................... 15 (s) 675 14,423 179 – 436 91 345November ................................. 16 0 85 14,537 264 – 439 91 347December ................................. 16 0 -269 14,877 215 – 430 91 339Average ................................... 16 67 81 14,648 235 – 430 91 339
1980January ..................................... 15 0 594 14,301 322 – 449 91 358February ................................... 15 0 292 14,187 332 – 457 91 366March ........................................ 15 0 47 13,709 330 – 459 91 367April .......................................... 15 0 412 13,484 192 – 471 91 380May ........................................... 14 0 117 13,326 326 – 475 91 383June .......................................... 15 0 -65 13,705 365 – 473 91 381July ........................................... 14 0 -88 13,264 238 – 470 91 379August ...................................... 14 0 274 12,984 78 – 478 91 387September ................................ 14 54 -361 13,313 322 – 469 93 376October ..................................... 14 123 68 12,772 309 – 475 97 379November ................................. 14 189 -181 13,119 289 – 475 102 373December ................................. 15 177 -481 13,648 343 – f 466 108 f 358Average ................................... e 14 45 52 13,481 287 – f 466 108 f 358
1981January ..................................... 6 151 f -201 13,247 339 – 486 112 374February ................................... 3 127 150 e 12,903 198 – 494 116 378March ........................................ e 5 155 477 12,383 210 – 514 121 393April .......................................... e 4 444 151 12,091 198 – 532 134 397May ........................................... 3 513 -122 12,309 312 – 544 150 394June .......................................... 7 434 -299 12,415 123 – 548 163 385July ........................................... e 6 324 36 12,261 257 – 559 173 386August ...................................... e 4 372 -769 12,908 204 – 547 185 362September ................................ 4 486 -201 12,505 194 – 555 199 356October ..................................... e 4 501 259 12,057 226 – 579 215 364November ................................. 4 259 66 12,240 278 – 589 223 366December ................................. 4 252 -82 12,349 189 – 594 230 363Average ................................... 5 336 f -46 12,470 228 – 594 230 363
1982January ..................................... 3 159 242 11,599 238 – 606 235 371February ................................... 2 213 29 11,236 304 – 613 241 372March ........................................ 5 235 -357 11,276 321 – 609 249 361April .......................................... e 2 233 -196 11,392 174 – 610 256 355May ........................................... e 2 176 -205 11,806 262 – 609 261 348June .......................................... 7 105 -144 12,494 94 – 608 264 344July ........................................... 3 97 50 12,446 229 – 613 267 346August ...................................... 2 208 232 11,871 304 – 626 274 353September ................................ 4 143 -406 12,146 184 – 619 278 341October ..................................... e 1 216 332 11,749 270 – 636 285 351November ................................. e 2 179 219 11,724 262 – 648 290 358December ................................. e 2 125 -252 11,514 193 – g 644 294 g 350Average ................................... 3 174 -38 11,774 236 – g 644 294 g 350
See footnotes at end of table.
Energy Information Administration/Historical Monthly Energy Review 1973-199292

Table 3.2b Crude Oil Supply and Disposition, 1973-1992: Disposition and Ending Stocks (Continued)
Disposition Ending Stocksa
CrudeLosses
Stock Changeb
RefineryInputs Exports
ProductSuppliedd Total SPRc
OtherPrimarySPRc Other
Thousand Barrels per Day Million Barrels
1983January ..................................... 2 219 g 280 11,143 117 71 660 301 360February ................................... 3 197 123 10,633 262 71 669 306 363March ........................................ 2 184 -267 10,859 174 70 667 312 355April .......................................... 2 197 205 11,433 88 68 679 318 361May ........................................... 1 293 -278 11,800 280 63 679 327 353June .......................................... (s) 188 -66 12,284 144 64 683 332 351July ........................................... 2 264 -497 12,360 145 65 676 341 335August ...................................... 1 358 438 12,152 172 64 700 352 349September ................................ 1 307 -68 12,482 177 66 708 361 347October ..................................... 1 201 73 11,782 140 63 716 367 349November ................................. 2 135 -250 12,004 186 64 713 371 341December ................................. 1 252 78 11,234 95 67 723 379 344Average ................................... 2 234 g -20 11,685 164 66 723 379 344
1984January ..................................... 1 173 155 11,587 153 64 733 384 349February ................................... 1 96 -293 12,157 185 65 727 387 340March ........................................ 2 147 -122 11,926 236 62 728 392 336April .......................................... 1 170 307 11,891 172 64 742 397 346May ........................................... 2 245 432 12,247 219 62 763 404 359June .......................................... 2 309 -205 12,255 222 61 767 414 353July ........................................... 2 328 -159 12,028 108 60 772 424 348August ...................................... 1 179 -429 12,346 190 63 764 429 335September ................................ 3 53 -314 12,271 162 66 756 431 325October ..................................... 1 186 573 11,978 141 69 780 437 343November ................................. (s) 207 29 12,108 202 62 787 443 344December ................................. (s) 241 50 11,755 185 64 796 451 345Average ................................... 2 195 4 12,044 181 64 796 451 345
1985January ..................................... 1 223 -298 11,445 144 63 794 457 336February ................................... 1 97 -522 11,367 221 63 782 460 322March ........................................ 1 48 262 11,372 189 69 791 462 330April .......................................... 1 111 409 11,805 236 67 807 465 342May ........................................... 1 225 475 12,094 250 65 829 472 357June .......................................... 1 155 -419 12,292 226 56 821 477 344July ........................................... 1 225 -551 12,445 154 55 811 484 327August ...................................... (s) 116 -274 12,045 241 55 806 487 318September ................................ (s) 71 -37 11,925 188 55 807 489 317October ..................................... (s) 20 -119 12,209 123 55 804 490 314November ................................. (s) 53 242 12,410 286 59 812 491 321December ................................. 1 60 -2 12,570 197 63 814 493 321Average ................................... 1 117 -67 12,002 204 60 814 493 321
1986January ..................................... 1 35 348 12,374 159 57 826 494 332February ................................... (s) 35 2 11,918 162 56 827 495 332March ........................................ (s) 49 296 11,652 212 52 838 497 341April .......................................... (s) 63 -104 12,512 94 51 837 499 338May ........................................... (s) 35 -295 13,279 98 49 829 500 329June .......................................... (s) 64 -66 13,261 240 52 828 502 327July ........................................... (s) 52 489 12,917 65 51 845 503 342August ...................................... (s) 51 -293 13,287 233 48 838 505 333September ................................ (s) 47 170 13,097 161 45 844 506 338October ..................................... (s) 36 197 12,636 151 41 851 508 344November ................................. (s) 65 -160 12,831 115 41 849 509 339December ................................. (s) 68 -254 12,777 159 42 843 512 331Average ................................... (s) 50 28 12,716 154 49 843 512 331
1987January ..................................... 1 108 58 12,570 84 41 848 515 333February ................................... (s) 64 -42 12,290 284 41 849 517 332March ........................................ 1 106 19 12,081 150 39 852 520 332April .......................................... (s) 67 -116 12,512 247 41 851 522 329May ........................................... (s) 101 -137 12,653 69 42 850 525 325June .......................................... (s) 69 97 13,202 116 36 855 527 328July ........................................... (s) 91 -124 13,430 149 32 854 530 324August ...................................... (s) 63 281 13,380 141 31 864 532 332September ................................ (s) 64 157 13,168 116 28 871 534 337October ..................................... (s) 57 604 12,733 84 25 892 536 356November ................................. (s) 97 258 12,981 164 25 902 539 364December ................................. (s) 68 -472 13,212 220 31 890 541 349Average ................................... (s) 80 49 12,854 151 34 890 541 349
See footnotes at end of table.
Energy Information Administration/Historical Monthly Energy Review 1973-1992 93

Table 3.2b Crude Oil Supply and Disposition, 1973-1992: Disposition and Ending Stocks (Continued)
Disposition Ending Stocksa
CrudeLosses
Stock Changeb
RefineryInputs Exports
ProductSuppliedd Total SPRc
OtherPrimarySPRc Other
Thousand Barrels per Day Million Barrels
1988January ..................................... (s) 67 -110 12,920 206 45 888 543 346February ................................... (s) 49 84 12,644 146 52 892 544 348March ........................................ (s) 26 193 13,016 213 52 899 545 354April .......................................... (s) 77 112 13,135 114 42 905 547 357May ........................................... (s) 22 74 13,425 138 34 908 548 360June .......................................... (s) 70 -27 13,487 138 32 909 550 359July ........................................... 1 42 -302 13,617 186 29 901 551 349August ...................................... (s) 26 -514 13,752 152 30 886 552 334September ................................ (s) 84 -167 13,261 119 37 883 555 329October ..................................... (s) 43 356 13,126 166 42 896 556 340November ................................. (s) 89 -86 13,156 148 44 896 559 337December ................................. (s) 27 -215 13,381 129 44 890 560 330Average ................................... (s) 52 -51 13,246 155 40 890 560 330
1989January ..................................... (s) 65 115 13,330 137 47 895 562 334February ................................... (s) 85 -38 12,765 208 48 897 564 333March ........................................ (s) 75 -202 12,963 156 45 893 566 327April .......................................... (s) 60 434 12,956 139 23 908 568 340May ........................................... (s) 77 194 13,405 131 19 916 570 346June .......................................... (s) 44 -478 13,905 243 20 903 572 331July ........................................... (s) 86 62 13,848 69 19 908 574 333August ...................................... (s) 32 251 13,861 162 17 916 575 341September ................................ 1 59 -203 13,791 32 18 912 577 335October ..................................... 0 37 36 13,360 61 21 914 578 336November ................................. (s) 41 500 13,420 120 25 930 579 351December ................................. (s) 12 -313 13,165 247 33 921 580 341Average ................................... (s) 56 30 13,401 142 28 921 580 341
1990January ..................................... (s) 24 249 13,491 132 40 930 581 349February ................................... 0 12 -342 13,487 102 36 920 581 339March ........................................ 0 44 1,013 12,876 132 24 953 582 371April .......................................... (s) 38 -12 13,051 111 24 954 583 370May ........................................... 0 89 389 13,386 112 30 969 586 383June .......................................... (s) 16 56 13,689 88 29 971 587 384July ........................................... 0 0 -154 14,212 89 31 966 587 379August ...................................... (s) 94 -321 14,142 64 18 959 590 370September ................................ (s) (s) -897 14,104 68 14 932 590 343October ..................................... (s) -8 120 12,825 104 15 936 589 346November ................................. (s) -111 -253 12,953 137 13 925 586 339December ................................. (s) -10 -517 12,708 162 15 908 586 323Average ................................... (s) 16 -51 13,409 109 24 908 586 323
1991January ..................................... 0 0 -71 12,735 50 23 906 586 320February ................................... 0 -147 379 13,046 152 17 913 582 331March ........................................ (s) -422 183 12,839 137 18 905 568 337April .......................................... (s) 0 50 13,042 162 21 907 568 338May ........................................... (s) 0 566 13,539 165 15 924 568 356June .......................................... (s) (s) -299 13,918 78 16 915 568 347July ........................................... 0 (s) -153 13,703 139 15 911 569 342August ...................................... 0 (s) 103 13,800 55 13 914 569 345September ................................ 0 0 -156 13,694 109 16 909 569 341October ..................................... (s) (s) 51 12,896 92 22 911 569 342November ................................. (s) (s) 43 12,929 126 22 912 569 344December ................................. 0 (s) -611 13,465 133 23 893 569 325Average ................................... (s) -47 5 13,301 116 18 893 569 325
1992January ..................................... 0 (s) 540 12,923 118 26 910 569 341February ................................... (s) 0 171 12,486 22 17 915 569 346March ........................................ (s) (s) -250 13,083 105 18 907 569 339April .......................................... 0 0 315 13,260 23 11 917 569 348May ........................................... 0 (s) -145 13,679 106 10 912 569 344June .......................................... (s) 34 -615 14,059 107 12 895 570 325July ........................................... 0 (s) 244 13,953 53 9 902 570 333August ...................................... (s) 20 -144 13,426 133 8 898 570 328September ................................ 0 43 -204 13,714 68 11 893 571 322October ..................................... (s) 69 342 13,584 106 10 906 574 333November ................................. (s) 15 -243 13,547 111 10 899 574 325December ................................. (s) 22 -234 13,194 107 12 893 575 318Average ................................... (s) 17 -18 13,411 89 13 893 575 318
a Stocks are totals as of end of period.b A negative number indicates a decrease in stocks and a positive number
indicates an increase.c Strategic Petroleum Reserve.d Beginning in January 1983, crude oil used directly as fuel is shown as
product supplied.e See Note 7 at end of section.f Stocks of Alaskan crude oil in transit are included beginning in January
1981. See Note 5 at end of section.g See Note 4 at end of section.– =Not applicable. (s)=Less than +500 barrels per day and greater than
-500 barrels per day. Notes: • Crude oil includes lease condensate. • Totals may not equal
sum of components due to independent rounding. • Geographic coverage isthe 50 States and the District of Columbia.
Sources: See end of section.
Energy Information Administration/Historical Monthly Energy Review 1973-199294

Table 3.3a Petroleum Imports, 1973-1992: Algeria, Iraq, Kuwait, and Libya
(Thousand Barrels per Day)
Arab OPECa
Algeria Iraq Kuwaitb Libya
Total Crude Oil Total Crude Oil Total Crude Oil Total Crude Oil
1973January ............................... E 180 177 0 0 E 61 51 E 146 125February ............................. E 174 170 0 0 E 43 36 E 256 218March .................................. E 141 139 0 0 E 42 36 E 194 166April .................................... E 109 99 0 0 E 60 50 E 195 159May ..................................... E 181 164 10 10 E 60 50 E 182 148June .................................... E 169 153 0 0 E 54 44 E 84 69July ..................................... E 173 148 0 0 E 16 16 E 157 116August ................................ E 132 113 11 11 E 57 55 E 193 143September .......................... E 144 124 17 17 E 46 44 E 207 153October ............................... E 167 119 12 12 E 56 56 E 196 164November ........................... E 42 30 0 0 E 63 63 E 149 125December ........................... E 1 1 0 0 E 0 0 E 22 19Average ............................. c 136 120 4 4 47 42 164 133
1974January ............................... 0 0 0 0 0 0 1 1February ............................. 3 3 0 0 0 0 17 17March .................................. 8 8 0 0 0 0 5 5April .................................... E 117 115 0 0 2 2 8 8May ..................................... E 236 231 0 0 1 1 4 4June .................................... E 357 351 0 0 4 4 0 0July ..................................... E 349 326 0 0 3 3 E 0 0August ................................ E 187 175 0 0 33 33 E 0 0September .......................... E 264 247 0 0 0 0 E 20 16October ............................... E 301 279 0 0 E 0 0 0 0November ........................... E 187 173 0 0 E 21 16 0 0December ........................... E 262 243 0 0 E 0 0 0 0Average ............................. 190 180 0 0 5 5 4 4
1975January ............................... E 293 274 0 0 E 0 0 19 19February ............................. E 226 211 0 0 E 20 4 82 82March .................................. E 295 276 0 0 E 71 13 175 175April .................................... 226 214 0 0 4 0 125 125May ..................................... 345 338 7 7 12 4 211 198June .................................... 347 325 0 0 24 22 183 174July ..................................... 347 331 0 0 2 2 248 240August ................................ 269 267 16 16 1 1 407 407September .......................... 284 230 4 0 11 0 457 427October ............................... 236 210 3 0 19 0 236 206November ........................... 296 280 0 0 10 2 276 258December ........................... 211 210 0 0 12 0 355 355Average ............................. 282 264 2 2 c 16 4 232 223
1976January ............................... 346 332 0 0 5 0 451 433February ............................. 357 350 0 0 28 0 328 326March .................................. 347 323 0 0 3 0 379 372April .................................... 446 446 0 0 0 0 356 339May ..................................... 411 404 0 0 0 0 362 345June .................................... 501 478 0 0 2 0 488 473July ..................................... 548 526 0 0 4 4 487 478August ................................ 510 481 32 32 0 0 463 456September .......................... 435 421 124 124 11 11 491 491October ............................... 357 331 65 65 0 0 456 456November ........................... 502 453 52 52 0 0 534 527December ........................... 380 347 40 40 2 0 637 623Average ............................. c 432 408 26 26 5 1 453 444
1977January ............................... 488 473 61 61 148 136 625 610February ............................. 666 658 0 0 41 10 653 645March .................................. 471 457 19 19 46 40 738 716April .................................... 665 654 52 52 73 67 783 776May ..................................... 393 381 144 144 51 51 769 734June .................................... 453 441 83 83 72 66 841 814July ..................................... 568 553 100 100 50 50 762 751August ................................ 632 601 64 64 6 6 640 601September .......................... 551 535 93 93 0 0 679 660October ............................... 663 639 86 86 46 46 680 667November ........................... 591 577 94 94 5 5 847 827December ........................... 574 567 83 83 39 28 656 650Average ............................. 559 544 74 74 48 42 723 704
See footnotes at end of table.
Energy Information Administration/Historical Monthly Energy Review 1973-1992 95

Table 3.3a Petroleum Imports, 1973-1992: Algeria, Iraq, Kuwait, and Libya (Continued)
(Thousand Barrels per Day)
Arab OPECa
Algeria Iraq Kuwaitb Libya
Total Crude Oil Total Crude Oil Total Crude Oil Total Crude Oil
1978January ............................... 708 692 69 69 22 18 571 557February ............................. 658 658 44 44 0 0 594 577March .................................. 716 710 32 32 38 38 584 560April .................................... 598 577 28 28 0 0 612 580May ..................................... 701 677 32 32 0 0 499 489June .................................... 776 765 54 54 0 0 649 642July ..................................... 659 641 136 136 0 0 629 607August ................................ 464 459 44 44 0 0 799 785September .......................... 616 588 76 76 7 0 762 752October ............................... 710 682 0 0 0 0 713 685November ........................... 619 599 99 99 0 0 758 752December ........................... 561 557 129 129 0 0 676 670Average ............................. 649 634 62 62 6 5 654 638
1979January ............................... 669 647 56 56 6 6 754 740February ............................. 746 644 69 69 11 11 614 604March .................................. 579 550 146 146 0 0 598 552April .................................... 687 674 55 55 0 0 771 771May ..................................... 755 725 41 41 0 0 651 644June .................................... 588 561 239 239 0 0 765 752July ..................................... 591 558 49 49 16 12 666 645August ................................ 669 647 69 69 53 22 657 643September .......................... 510 506 120 120 0 0 621 605October ............................... 615 594 123 123 12 12 762 740November ........................... 621 597 27 27 0 0 476 458December ........................... 603 598 60 60 0 0 559 542Average ............................. 636 608 88 88 8 5 658 642
1980January ............................... 503 483 82 82 0 0 618 618February ............................. 656 640 17 17 49 49 603 588March .................................. 472 447 47 47 28 28 654 646April .................................... 546 524 43 43 64 64 683 668May ..................................... 441 415 30 30 46 46 468 464June .................................... 497 486 0 0 17 17 561 561July ..................................... 557 521 7 7 0 0 492 492August ................................ 432 391 50 50 13 13 431 416September .......................... 375 354 48 48 38 38 505 493October ............................... 465 391 14 14 43 43 478 470November ........................... 493 462 0 0 30 23 500 500December ........................... 423 373 (s) (s) 0 0 658 658Average ............................. 488 456 28 28 27 27 554 548
1981January ............................... 341 326 0 0 0 0 500 493February ............................. 381 338 (s) 0 0 0 468 468March .................................. 352 314 0 0 0 0 485 485April .................................... 263 254 0 0 0 0 485 477May ..................................... 393 355 0 0 0 0 443 437June .................................... 356 294 0 0 0 0 380 380July ..................................... 333 277 0 0 0 0 251 251August ................................ 348 280 0 0 0 0 274 274September .......................... 336 255 0 0 0 0 154 154October ............................... 242 188 0 0 0 0 147 136November ........................... 210 136 0 0 0 0 132 132December ........................... 176 116 0 0 0 0 122 122Average ............................. 311 261 (s) 0 0 0 319 317
1982January ............................... 254 201 0 0 0 0 161 152February ............................. 139 76 35 35 0 0 92 92March .................................. 91 15 0 0 0 0 37 37April .................................... 85 (s) 0 0 0 0 0 0May ..................................... 179 74 0 0 0 0 0 0June .................................... 115 69 0 0 18 18 0 0July ..................................... 159 73 0 0 17 0 0 0August ................................ 181 101 0 0 0 0 0 0September .......................... 179 80 0 0 9 0 0 0October ............................... 249 128 0 0 0 0 7 0November ........................... 247 156 0 0 0 0 14 0December ........................... 155 99 0 0 17 11 0 0Average ............................. 170 90 3 3 5 2 26 23
See footnotes at end of table.
Energy Information Administration/Historical Monthly Energy Review 1973-199296

Table 3.3a Petroleum Imports, 1973-1992: Algeria, Iraq, Kuwait, and Libya (Continued)
(Thousand Barrels per Day)
Arab OPECa
Algeria Iraq Kuwaitb Libya
Total Crude Oil Total Crude Oil Total Crude Oil Total Crude Oil
1983January ............................... 207 117 (s) (s) 0 0 0 0February ............................. 115 79 0 0 0 0 0 0March .................................. 63 30 0 0 17 0 0 0April .................................... 227 176 0 0 0 0 0 0May ..................................... 286 201 0 0 0 0 0 0June .................................... 300 235 0 0 0 0 0 0July ..................................... 283 249 62 62 16 0 0 0August ................................ 378 296 (s) (s) 25 25 0 0September .......................... 423 315 26 26 27 0 0 0October ............................... 261 194 14 14 8 8 0 0November ........................... 184 113 0 0 22 5 0 0December ........................... 144 101 21 21 47 47 0 0Average ............................. 240 176 10 10 14 7 0 0
1984January ............................... 242 95 0 0 8 8 0 0February ............................. 369 209 (s) (s) 18 (s) 7 0March .................................. 285 183 0 0 16 0 0 0April .................................... 280 222 0 0 39 9 0 0May ..................................... 471 331 0 0 106 74 0 0June .................................... 302 176 18 18 62 36 0 0July ..................................... 332 187 67 67 6 6 0 0August ................................ 404 211 0 0 21 21 0 0September .......................... 359 202 20 20 38 27 0 0October ............................... 333 238 12 12 8 8 0 0November ........................... 298 172 0 0 58 47 0 0December ........................... 204 107 32 32 51 51 0 0Average ............................. 323 194 12 12 36 24 1 0
1985January ............................... 112 55 (s) (s) 25 9 0 0February ............................. 174 84 0 0 25 25 0 0March .................................. 247 169 0 0 0 0 0 0April .................................... 286 174 0 0 11 11 8 0May ..................................... 255 110 182 182 29 0 0 0June .................................... 178 47 74 74 15 0 5 0July ..................................... 125 50 95 95 0 0 10 0August ................................ 135 50 82 82 0 0 0 0September .......................... 147 48 48 48 24 0 0 0October ............................... 177 61 0 0 56 0 20 0November ........................... 164 71 70 70 43 0 11 0December ........................... 244 85 0 0 24 0 0 0Average ............................. 187 84 46 46 21 4 4 0
1986January ............................... 215 120 30 30 56 (s) 0 0February ............................. 157 58 0 0 26 0 0 0March .................................. 260 136 31 31 25 0 0 0April .................................... 275 113 38 38 26 0 0 0May ..................................... 193 50 92 92 67 17 0 0June .................................... 319 77 139 139 173 67 0 0July ..................................... 310 20 95 95 98 41 0 0August ................................ 363 69 134 134 93 62 0 0September .......................... 245 51 126 126 82 0 0 0October ............................... 305 73 132 125 104 101 0 0November ........................... 311 100 54 54 28 12 0 0December ........................... 291 66 95 95 38 30 0 0Average ............................. 271 78 81 81 68 28 0 0
1987January ............................... 156 88 94 94 43 43 0 0February ............................. 307 134 40 40 46 16 0 0March .................................. 334 141 36 36 43 35 0 0April .................................... 323 152 0 0 18 0 0 0May ..................................... 196 51 30 30 24 0 0 0June .................................... 247 48 201 195 0 0 0 0July ..................................... 347 86 62 62 58 57 0 0August ................................ 250 76 139 139 158 128 0 0September .......................... 378 156 66 66 148 126 0 0October ............................... 274 140 135 135 142 142 0 0November ........................... 395 199 115 115 233 214 0 0December ........................... 339 112 74 67 95 78 0 0Average ............................. 295 115 83 82 84 70 0 0
See footnotes at end of table.
Energy Information Administration/Historical Monthly Energy Review 1973-1992 97
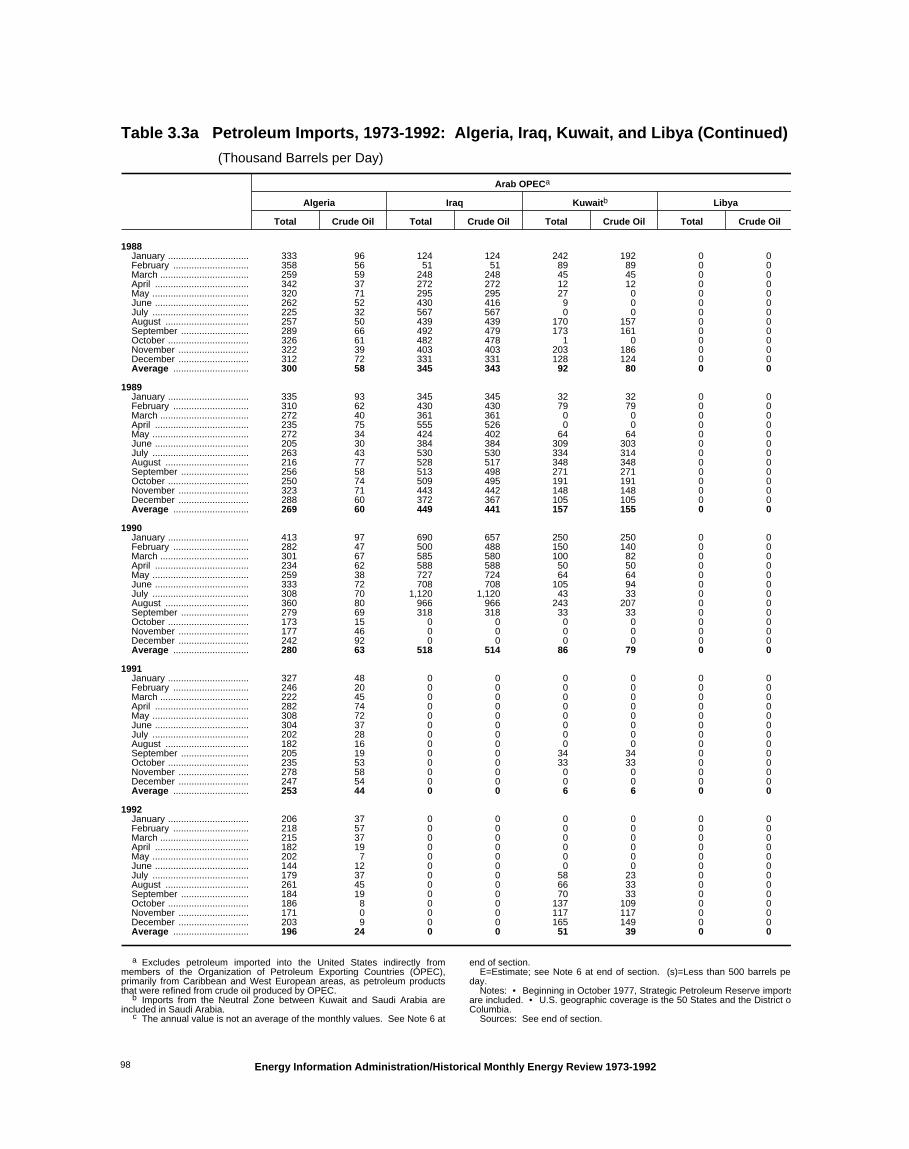
Table 3.3a Petroleum Imports, 1973-1992: Algeria, Iraq, Kuwait, and Libya (Continued)
(Thousand Barrels per Day)
Arab OPECa
Algeria Iraq Kuwaitb Libya
Total Crude Oil Total Crude Oil Total Crude Oil Total Crude Oil
1988January ............................... 333 96 124 124 242 192 0 0February ............................. 358 56 51 51 89 89 0 0March .................................. 259 59 248 248 45 45 0 0April .................................... 342 37 272 272 12 12 0 0May ..................................... 320 71 295 295 27 0 0 0June .................................... 262 52 430 416 9 0 0 0July ..................................... 225 32 567 567 0 0 0 0August ................................ 257 50 439 439 170 157 0 0September .......................... 289 66 492 479 173 161 0 0October ............................... 326 61 482 478 1 0 0 0November ........................... 322 39 403 403 203 186 0 0December ........................... 312 72 331 331 128 124 0 0Average ............................. 300 58 345 343 92 80 0 0
1989January ............................... 335 93 345 345 32 32 0 0February ............................. 310 62 430 430 79 79 0 0March .................................. 272 40 361 361 0 0 0 0April .................................... 235 75 555 526 0 0 0 0May ..................................... 272 34 424 402 64 64 0 0June .................................... 205 30 384 384 309 303 0 0July ..................................... 263 43 530 530 334 314 0 0August ................................ 216 77 528 517 348 348 0 0September .......................... 256 58 513 498 271 271 0 0October ............................... 250 74 509 495 191 191 0 0November ........................... 323 71 443 442 148 148 0 0December ........................... 288 60 372 367 105 105 0 0Average ............................. 269 60 449 441 157 155 0 0
1990January ............................... 413 97 690 657 250 250 0 0February ............................. 282 47 500 488 150 140 0 0March .................................. 301 67 585 580 100 82 0 0April .................................... 234 62 588 588 50 50 0 0May ..................................... 259 38 727 724 64 64 0 0June .................................... 333 72 708 708 105 94 0 0July ..................................... 308 70 1,120 1,120 43 33 0 0August ................................ 360 80 966 966 243 207 0 0September .......................... 279 69 318 318 33 33 0 0October ............................... 173 15 0 0 0 0 0 0November ........................... 177 46 0 0 0 0 0 0December ........................... 242 92 0 0 0 0 0 0Average ............................. 280 63 518 514 86 79 0 0
1991January ............................... 327 48 0 0 0 0 0 0February ............................. 246 20 0 0 0 0 0 0March .................................. 222 45 0 0 0 0 0 0April .................................... 282 74 0 0 0 0 0 0May ..................................... 308 72 0 0 0 0 0 0June .................................... 304 37 0 0 0 0 0 0July ..................................... 202 28 0 0 0 0 0 0August ................................ 182 16 0 0 0 0 0 0September .......................... 205 19 0 0 34 34 0 0October ............................... 235 53 0 0 33 33 0 0November ........................... 278 58 0 0 0 0 0 0December ........................... 247 54 0 0 0 0 0 0Average ............................. 253 44 0 0 6 6 0 0
1992January ............................... 206 37 0 0 0 0 0 0February ............................. 218 57 0 0 0 0 0 0March .................................. 215 37 0 0 0 0 0 0April .................................... 182 19 0 0 0 0 0 0May ..................................... 202 7 0 0 0 0 0 0June .................................... 144 12 0 0 0 0 0 0July ..................................... 179 37 0 0 58 23 0 0August ................................ 261 45 0 0 66 33 0 0September .......................... 184 19 0 0 70 33 0 0October ............................... 186 8 0 0 137 109 0 0November ........................... 171 0 0 0 117 117 0 0December ........................... 203 9 0 0 165 149 0 0Average ............................. 196 24 0 0 51 39 0 0
a Excludes petroleum imported into the United States indirectly frommembers of the Organization of Petroleum Exporting Countries (OPEC),primarily from Caribbean and West European areas, as petroleum productsthat were refined from crude oil produced by OPEC.
b Imports from the Neutral Zone between Kuwait and Saudi Arabia areincluded in Saudi Arabia.
c The annual value is not an average of the monthly values. See Note 6 at
end of section.E=Estimate; see Note 6 at end of section. (s)=Less than 500 barrels per
day. Notes: • Beginning in October 1977, Strategic Petroleum Reserve imports
are included. • U.S. geographic coverage is the 50 States and the District ofColumbia.
Sources: See end of section.
Energy Information Administration/Historical Monthly Energy Review 1973-199298

Table 3.3b Petroleum Imports, 1973-1992: Qatar, Saudi Arabia, U.A.E., and Total Arab OPEC
(Thousand Barrels per Day)
Arab OPECa
TotalArab OPECaQatar Saudi Arabiab United Arab Emirates
Total Crude Oil Total Crude Oil Total Crude Oil Total Crude Oil
1973January ............................... 0 0 E 372 351 10 10 E 769 713February ............................. 0 0 E 271 255 39 39 E 782 719March .................................. 0 0 E 414 390 162 162 E 954 893April .................................... 0 0 E 316 290 75 75 E 755 672May ..................................... 0 0 E 399 366 58 58 E 889 796June .................................... 6 6 E 473 434 80 80 E 866 787July ..................................... 0 0 E 669 644 102 102 E 1,117 1,026August ................................ 12 12 E 675 650 64 64 E 1,144 1,047September .......................... 41 41 E 623 599 88 88 E 1,167 1,067October ............................... 18 18 E 781 744 62 62 E 1,290 1,175November ........................... 9 9 E 647 616 107 107 E 1,016 950December ........................... 2 2 E 192 183 0 0 E 217 205Average ............................. 7 7 c 486 462 71 71 915 838
1974January ............................... 0 0 E 21 19 10 10 E 32 30February ............................. 0 0 E 42 38 0 0 E 61 58March .................................. 0 0 E 84 76 0 0 E 96 89April .................................... E 0 0 E 44 41 14 14 E 184 180May ..................................... E 0 0 E 590 557 85 85 E 916 878June .................................... E 17 12 E 689 650 159 159 E 1,226 1,176July ..................................... 35 35 E 589 550 E 127 122 E 1,104 1,036August ................................ 10 10 E 626 584 E 208 199 E 1,063 1,000September .......................... 23 23 E 555 518 E 117 112 E 980 917October ............................... 65 65 E 748 726 58 58 E 1,172 1,127November ........................... 44 44 E 736 714 25 25 E 1,013 972December ........................... 14 14 E 772 749 38 38 E 1,085 1,043Average ............................. 17 17 461 438 c 74 69 c 752 713
1975January ............................... 56 56 E 852 845 47 47 E 1,267 1,241February ............................. 0 0 E 796 789 106 106 E 1,229 1,192March .................................. 25 25 E 632 627 113 113 E 1,310 1,228April .................................... 1 1 428 419 70 70 853 829May ..................................... 5 5 335 329 125 125 1,041 1,006June .................................... 0 0 501 469 77 77 1,131 1,067July ..................................... 10 10 588 569 107 107 1,302 1,260August ................................ 17 17 748 735 260 260 1,718 1,702September .......................... 64 64 731 712 216 216 1,766 1,649October ............................... 28 28 961 943 93 93 1,575 1,480November ........................... 0 0 934 922 69 69 1,585 1,531December ........................... 11 11 1,075 1,058 114 114 1,778 1,748Average ............................. 18 18 715 701 117 117 c 1,383 1,330
1976January ............................... 13 13 1,112 1,110 119 119 2,046 2,007February ............................. 11 11 1,081 1,077 108 108 1,914 1,872March .................................. 12 12 1,158 1,145 159 159 2,059 2,011April .................................... 11 11 1,028 1,023 196 196 2,036 2,014May ..................................... 10 10 1,142 1,129 215 215 2,139 2,102June .................................... 0 0 1,205 1,193 290 290 2,486 2,434July ..................................... 39 39 1,328 1,328 305 305 2,710 2,680August ................................ 46 46 1,318 1,306 228 228 2,597 2,550September .......................... 41 41 1,288 1,286 335 335 2,726 2,709October ............................... 30 30 1,366 1,340 304 304 2,579 2,526November ........................... 23 23 1,316 1,313 341 341 2,769 2,710December ........................... 46 46 1,404 1,398 448 448 2,957 2,902Average ............................. 24 24 1,230 1,222 254 254 c 2,424 2,378
1977January ............................... 23 23 1,327 1,321 320 320 2,991 2,943February ............................. 38 38 1,442 1,436 317 317 3,156 3,103March .................................. 44 44 1,348 1,339 370 370 3,036 2,984April .................................... 34 34 1,437 1,429 324 324 3,368 3,336May ..................................... 94 94 1,724 1,716 252 252 3,428 3,373June .................................... 79 79 1,433 1,420 439 425 3,400 3,327July ..................................... 90 90 1,405 1,394 274 269 3,248 3,206August ................................ 70 70 1,401 1,382 309 307 3,121 3,030September .......................... 57 57 1,487 1,487 348 347 3,215 3,179October ............................... 72 72 1,343 1,343 253 252 3,142 3,105November ........................... 94 94 1,119 1,119 420 420 3,169 3,136December ........................... 101 101 1,103 1,093 402 402 2,958 2,925Average ............................. 67 67 1,380 1,373 335 333 3,185 3,136
See footnotes at end of table.
Energy Information Administration/Historical Monthly Energy Review 1973-1992 99
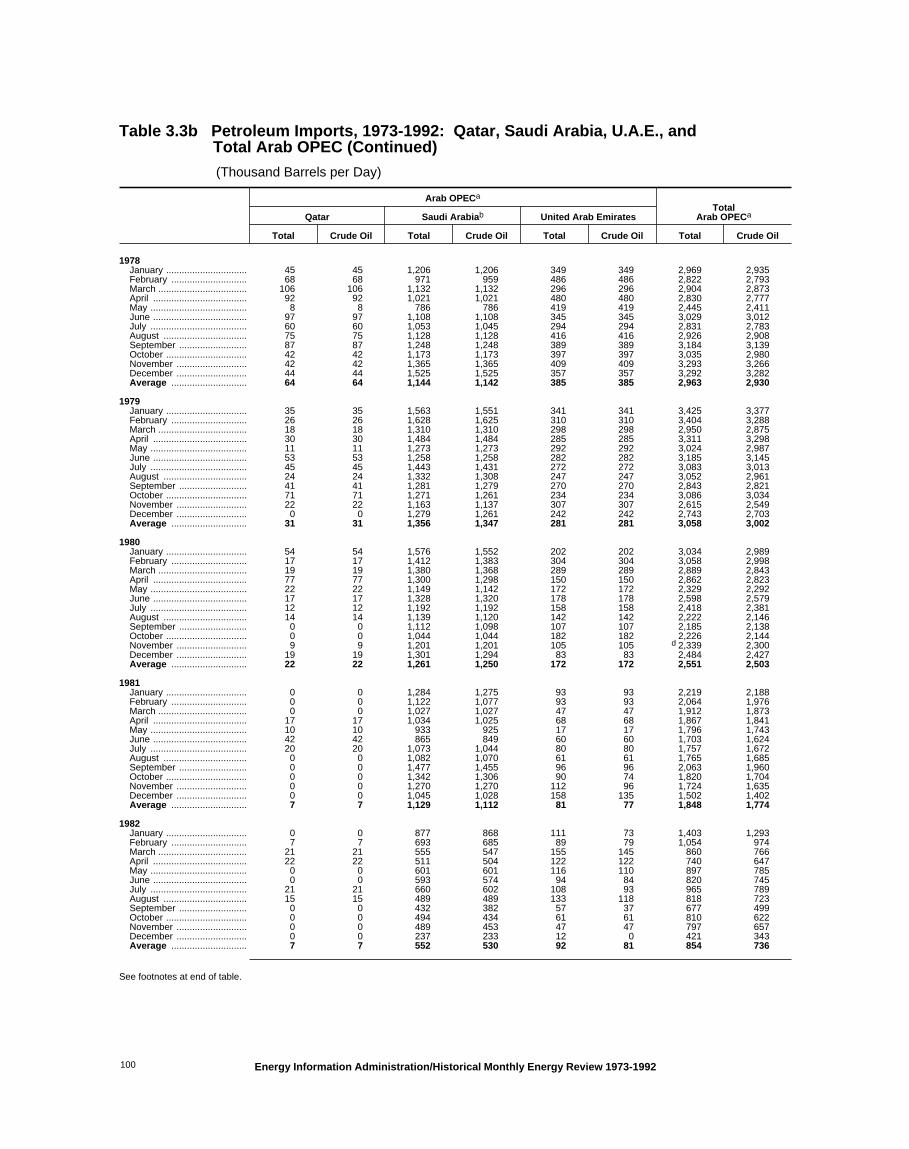
Table 3.3b Petroleum Imports, 1973-1992: Qatar, Saudi Arabia, U.A.E., and Total Arab OPEC (Continued)
(Thousand Barrels per Day)
Arab OPECa
TotalArab OPECaQatar Saudi Arabiab United Arab Emirates
Total Crude Oil Total Crude Oil Total Crude Oil Total Crude Oil
1978January ............................... 45 45 1,206 1,206 349 349 2,969 2,935February ............................. 68 68 971 959 486 486 2,822 2,793March .................................. 106 106 1,132 1,132 296 296 2,904 2,873April .................................... 92 92 1,021 1,021 480 480 2,830 2,777May ..................................... 8 8 786 786 419 419 2,445 2,411June .................................... 97 97 1,108 1,108 345 345 3,029 3,012July ..................................... 60 60 1,053 1,045 294 294 2,831 2,783August ................................ 75 75 1,128 1,128 416 416 2,926 2,908September .......................... 87 87 1,248 1,248 389 389 3,184 3,139October ............................... 42 42 1,173 1,173 397 397 3,035 2,980November ........................... 42 42 1,365 1,365 409 409 3,293 3,266December ........................... 44 44 1,525 1,525 357 357 3,292 3,282Average ............................. 64 64 1,144 1,142 385 385 2,963 2,930
1979January ............................... 35 35 1,563 1,551 341 341 3,425 3,377February ............................. 26 26 1,628 1,625 310 310 3,404 3,288March .................................. 18 18 1,310 1,310 298 298 2,950 2,875April .................................... 30 30 1,484 1,484 285 285 3,311 3,298May ..................................... 11 11 1,273 1,273 292 292 3,024 2,987June .................................... 53 53 1,258 1,258 282 282 3,185 3,145July ..................................... 45 45 1,443 1,431 272 272 3,083 3,013August ................................ 24 24 1,332 1,308 247 247 3,052 2,961September .......................... 41 41 1,281 1,279 270 270 2,843 2,821October ............................... 71 71 1,271 1,261 234 234 3,086 3,034November ........................... 22 22 1,163 1,137 307 307 2,615 2,549December ........................... 0 0 1,279 1,261 242 242 2,743 2,703Average ............................. 31 31 1,356 1,347 281 281 3,058 3,002
1980January ............................... 54 54 1,576 1,552 202 202 3,034 2,989February ............................. 17 17 1,412 1,383 304 304 3,058 2,998March .................................. 19 19 1,380 1,368 289 289 2,889 2,843April .................................... 77 77 1,300 1,298 150 150 2,862 2,823May ..................................... 22 22 1,149 1,142 172 172 2,329 2,292June .................................... 17 17 1,328 1,320 178 178 2,598 2,579July ..................................... 12 12 1,192 1,192 158 158 2,418 2,381August ................................ 14 14 1,139 1,120 142 142 2,222 2,146September .......................... 0 0 1,112 1,098 107 107 2,185 2,138October ............................... 0 0 1,044 1,044 182 182 2,226 2,144November ........................... 9 9 1,201 1,201 105 105 d 2,339 2,300December ........................... 19 19 1,301 1,294 83 83 2,484 2,427Average ............................. 22 22 1,261 1,250 172 172 2,551 2,503
1981January ............................... 0 0 1,284 1,275 93 93 2,219 2,188February ............................. 0 0 1,122 1,077 93 93 2,064 1,976March .................................. 0 0 1,027 1,027 47 47 1,912 1,873April .................................... 17 17 1,034 1,025 68 68 1,867 1,841May ..................................... 10 10 933 925 17 17 1,796 1,743June .................................... 42 42 865 849 60 60 1,703 1,624July ..................................... 20 20 1,073 1,044 80 80 1,757 1,672August ................................ 0 0 1,082 1,070 61 61 1,765 1,685September .......................... 0 0 1,477 1,455 96 96 2,063 1,960October ............................... 0 0 1,342 1,306 90 74 1,820 1,704November ........................... 0 0 1,270 1,270 112 96 1,724 1,635December ........................... 0 0 1,045 1,028 158 135 1,502 1,402Average ............................. 7 7 1,129 1,112 81 77 1,848 1,774
1982January ............................... 0 0 877 868 111 73 1,403 1,293February ............................. 7 7 693 685 89 79 1,054 974March .................................. 21 21 555 547 155 145 860 766April .................................... 22 22 511 504 122 122 740 647May ..................................... 0 0 601 601 116 110 897 785June .................................... 0 0 593 574 94 84 820 745July ..................................... 21 21 660 602 108 93 965 789August ................................ 15 15 489 489 133 118 818 723September .......................... 0 0 432 382 57 37 677 499October ............................... 0 0 494 434 61 61 810 622November ........................... 0 0 489 453 47 47 797 657December ........................... 0 0 237 233 12 0 421 343Average ............................. 7 7 552 530 92 81 854 736
See footnotes at end of table.
Energy Information Administration/Historical Monthly Energy Review 1973-1992100

Table 3.3b Petroleum Imports, 1973-1992: Qatar, Saudi Arabia, U.A.E., and Total Arab OPEC (Continued)
(Thousand Barrels per Day)
Arab OPECa
TotalArab OPECaQatar Saudi Arabiab United Arab Emirates
Total Crude Oil Total Crude Oil Total Crude Oil Total Crude Oil
1983January ............................... 0 0 282 276 47 40 537 432February ............................. 0 0 214 214 9 9 338 301March .................................. 0 0 103 103 0 0 183 134April .................................... 0 0 162 162 (s) (s) 389 338May ..................................... 0 0 122 111 12 0 420 312June .................................... 0 0 188 170 40 25 528 429July ..................................... 0 0 182 173 64 40 606 524August ................................ (s) 0 448 414 52 12 903 748September .......................... (s) 0 587 555 21 12 1,084 908October ............................... 0 0 638 601 16 16 938 834November ........................... 0 0 545 535 56 39 807 692December ........................... 0 0 569 538 45 26 826 732Average ............................. (s) 0 337 321 30 18 632 533
1984January ............................... 0 0 477 457 114 104 842 663February ............................. 0 0 324 319 33 18 751 545March .................................. 0 0 310 293 112 94 723 570April .................................... 0 0 320 301 95 47 735 579May ..................................... 0 0 329 317 240 199 1,146 921June .................................... 0 0 411 399 46 18 838 646July ..................................... 0 0 429 426 112 89 946 775August ................................ 48 48 438 431 82 73 993 784September .......................... 0 0 159 154 113 47 688 450October ............................... 0 0 287 287 114 84 754 629November ........................... 5 0 183 149 124 88 668 456December ........................... 1 0 224 167 211 211 723 568Average ............................. 5 4 325 309 117 90 819 634
1985January ............................... 3 0 106 74 60 47 305 185February ............................. 0 0 108 77 0 0 307 187March .................................. 0 0 85 59 52 52 385 281April .................................... 0 0 201 133 70 35 575 354May ..................................... 0 0 41 (s) 128 78 635 370June .................................... 0 0 26 (s) 81 81 378 201July ..................................... 0 0 44 (s) 13 13 286 158August ................................ 0 0 46 35 17 17 280 184September .......................... 0 0 27 0 57 57 302 154October ............................... 0 0 251 210 17 17 520 288November ........................... 0 0 430 381 34 21 752 543December ........................... 0 0 642 602 15 0 925 687Average ............................. (s) 0 168 132 45 35 472 300
1986January ............................... 0 0 664 601 11 0 976 752February ............................. 0 0 574 535 0 0 757 594March .................................. 0 0 482 445 0 0 798 612April .................................... 0 0 698 681 21 0 1,058 831May ..................................... 0 0 574 520 40 24 966 703June .................................... 0 0 662 591 83 73 1,377 947July ..................................... 57 53 738 632 59 47 1,357 887August ................................ 33 25 680 564 37 34 1,339 888September .......................... 63 63 810 748 62 62 1,388 1,050October ............................... 2 2 697 672 147 147 1,387 1,120November ........................... 0 0 868 753 34 34 1,295 952December ........................... 0 0 769 677 30 30 1,223 899Average ............................. 13 12 685 618 44 38 1,162 854
1987January ............................... 0 0 875 827 15 12 1,184 1,065February ............................. 0 0 776 648 54 32 1,222 871March .................................. 0 0 430 340 0 0 843 553April .................................... 0 0 463 320 62 62 866 534May ..................................... 0 0 499 436 26 26 775 543June .................................... 0 0 782 601 45 30 1,275 875July ..................................... 0 0 756 641 42 42 1,264 887August ................................ 0 0 961 865 103 88 1,611 1,295September .......................... 0 0 902 782 146 146 1,640 1,276October ............................... 0 0 1,051 950 111 111 1,713 1,478November ........................... 0 0 637 538 97 97 1,477 1,163December ........................... 0 0 876 740 31 31 1,415 1,029Average ............................. 0 0 751 642 61 56 1,274 965
See footnotes at end of table.
Energy Information Administration/Historical Monthly Energy Review 1973-1992 101

Table 3.3b Petroleum Imports, 1973-1992: Qatar, Saudi Arabia, U.A.E., and Total Arab OPEC (Continued)
(Thousand Barrels per Day)
Arab OPECa
TotalArab OPECaQatar Saudi Arabiab United Arab Emirates
Total Crude Oil Total Crude Oil Total Crude Oil Total Crude Oil
1988January ............................... 0 0 894 778 61 37 1,652 1,228February ............................. 0 0 1,307 1,177 79 71 1,883 1,444March .................................. 0 0 950 810 6 0 1,509 1,162April .................................... 0 0 937 797 48 48 1,610 1,167May ..................................... 0 0 1,041 870 41 41 1,724 1,277June .................................... 0 0 923 749 11 0 1,635 1,217July ..................................... 0 0 1,076 800 43 35 1,911 1,433August ................................ 0 0 1,169 899 0 0 2,036 1,545September .......................... 0 0 1,066 922 22 22 2,042 1,649October ............................... 0 0 1,244 1,066 16 0 2,069 1,604November ........................... 0 0 986 850 0 0 1,914 1,477December ........................... 0 0 1,289 1,223 19 19 2,080 1,769Average ............................. 0 0 1,073 911 29 23 1,839 1,415
1989January ............................... 0 0 1,449 1,335 59 59 2,219 1,863February ............................. 0 0 1,290 1,177 17 17 2,126 1,765March .................................. 0 0 1,108 1,025 64 64 1,805 1,490April .................................... 0 0 1,226 1,074 14 14 2,030 1,689May ..................................... 0 0 1,155 1,056 61 61 1,977 1,617June .................................... 0 0 1,249 1,147 17 17 2,164 1,881July ..................................... 0 0 1,182 1,096 0 0 2,308 1,982August ................................ 0 0 1,316 1,159 44 0 2,453 2,101September .......................... 26 26 1,109 1,021 20 0 2,195 1,874October ............................... 0 0 1,158 1,047 14 14 2,122 1,819November ........................... 0 0 1,342 1,230 0 0 2,257 1,891December ........................... 0 0 1,115 1,029 26 0 1,905 1,561Average ............................. 2 2 1,224 1,116 28 21 2,130 1,794
1990January ............................... 0 0 1,214 1,055 37 0 2,605 2,060February ............................. 0 0 1,557 1,372 18 18 2,506 2,065March .................................. 0 0 1,157 1,060 17 17 2,161 1,805April .................................... 43 43 1,149 950 9 0 2,073 1,693May ..................................... 0 0 1,225 1,076 73 60 2,349 1,963June .................................... 0 0 1,153 1,041 20 0 2,318 1,916July ..................................... 0 0 1,369 1,242 13 13 2,853 2,478August ................................ 0 0 1,189 1,052 0 0 2,757 2,305September .......................... 0 0 1,286 1,168 0 0 1,915 1,588October ............................... 0 0 1,619 1,473 0 0 1,792 1,488November ........................... 0 0 1,581 1,431 0 0 1,758 1,477December ........................... 0 0 1,587 1,431 14 0 1,843 1,523Average ............................. 4 4 1,339 1,195 17 9 2,244 1,864
1991January ............................... 0 0 1,934 1,782 0 0 2,261 1,830February ............................. 0 0 1,566 1,538 0 0 1,812 1,559March .................................. 0 0 1,683 1,646 0 0 1,905 1,691April .................................... 0 0 1,764 1,702 0 0 2,046 1,776May ..................................... 0 0 2,258 2,053 0 0 2,566 2,124June .................................... 0 0 1,841 1,795 0 0 2,145 1,832July ..................................... 0 0 1,725 1,641 0 0 1,928 1,670August ................................ 0 0 2,019 1,964 7 0 2,208 1,980September .......................... 0 0 1,708 1,562 0 0 1,947 1,615October ............................... 0 0 1,671 1,545 18 18 1,956 1,649November ........................... 0 0 1,778 1,626 16 0 2,072 1,684December ........................... 0 0 1,645 1,566 0 0 1,892 1,620Average ............................. 0 0 1,802 1,703 3 2 2,064 1,754
1992January ............................... 0 0 2,017 1,900 18 0 2,241 1,937February ............................. 0 0 1,776 1,687 0 0 1,995 1,745March .................................. 0 0 1,707 1,568 0 0 1,922 1,605April .................................... 0 0 1,734 1,524 0 0 1,916 1,543May ..................................... 0 0 1,764 1,584 0 0 1,966 1,591June .................................... 0 0 1,744 1,610 0 0 1,888 1,621July ..................................... 8 0 1,713 1,599 0 0 1,958 1,659August ................................ 0 0 1,594 1,473 7 0 1,929 1,551September .......................... 0 0 1,593 1,477 0 0 1,847 1,529October ............................... 0 0 1,593 1,482 4 0 1,920 1,599November ........................... 0 0 1,608 1,540 17 0 1,913 1,657December ........................... 0 0 1,793 1,725 28 0 2,188 1,882Average ............................. 1 0 1,720 1,597 6 0 1,974 1,660
a Excludes petroleum imported into the United States indirectly frommembers of the Organization of Petroleum Exporting Countries (OPEC),primarily from Caribbean and West European areas, as petroleum productsthat were refined from crude oil produced by OPEC.
b Imports from the Neutral Zone between Kuwait and Saudi Arabia areincluded in Saudi Arabia.
c The annual value is not an average of the monthly values. See Note 6 atend of section.
d See Note 7 at end of section.E=Estimate; see Note 6 at end of section. (s)=Less than 500 barrels per
day. Notes: • Beginning in October 1977, Strategic Petroleum Reserve imports
are included. • Totals may not equal sum of components due to independentrounding. • U.S. geographic coverage is the 50 States and the District ofColumbia.
Sources: See end of section.
Energy Information Administration/Historical Monthly Energy Review 1973-1992102

Table 3.3c Petroleum Imports, 1973-1992: Ecuador, Gabon, Indonesia, and Iran
(Thousand Barrels per Day)
Non-Arab OPECa
Ecuador Gabon Indonesia Iran
Total Crude Oil Total Crude Oil Total Crude Oil Total Crude Oil
1973January ............................... E 43 41 0 0 110 110 E 69 64February ............................. E 77 75 0 0 152 152 E 138 127March .................................. E 27 26 0 0 229 229 E 167 154April .................................... E 85 83 0 0 E 140 137 E 109 107May ..................................... E 18 18 0 0 E 234 230 E 258 255June .................................... E 45 44 0 0 E 252 248 E 261 258July ..................................... E 40 38 0 0 E 294 256 E 236 229August ................................ E 66 62 0 0 E 192 167 E 264 256September .......................... E 35 33 0 0 E 286 249 E 212 206October ............................... 49 49 0 0 E 164 155 E 248 243November ........................... 38 38 0 0 E 218 206 E 249 244December ........................... 62 62 0 0 E 276 260 E 453 444Average ............................. 48 47 0 0 213 200 223 216
1974January ............................... 62 62 0 0 E 167 147 E 467 463February ............................. 38 38 0 0 E 413 363 E 336 333March .................................. 64 64 0 0 E 275 241 E 383 380April .................................... E 54 53 11 11 E 368 351 E 612 603May ..................................... E 67 65 24 24 E 293 280 E 586 577June .................................... E 78 76 22 22 E 261 249 E 551 543July ..................................... 16 16 10 10 E 351 336 E 571 566August ................................ 16 16 43 43 E 215 206 E 486 481September .......................... 23 23 51 51 E 326 313 E 432 428October ............................... 46 46 81 81 E 236 232 E 388 381November ........................... 20 20 23 23 E 336 330 E 355 349December ........................... 22 22 13 13 E 374 367 E 449 441Average ............................. 42 42 23 23 300 284 469 463
1975January ............................... 53 53 4 4 E 279 272 E 398 393February ............................. 59 59 39 39 E 327 319 E 292 289March .................................. 31 31 77 77 E 294 286 E 182 180April .................................... 39 39 18 18 351 321 346 346May ..................................... 83 83 20 20 359 335 256 255June .................................... 48 48 59 59 481 461 232 232July ..................................... 77 77 27 27 463 460 217 217August ................................ 38 38 18 13 472 463 203 200September .......................... 70 70 28 28 443 436 277 273October ............................... 41 41 17 17 402 402 311 305November ........................... 50 50 11 11 397 397 473 470December ........................... 94 90 13 11 391 391 186 186Average ............................. 57 57 27 27 b 390 379 280 278
1976January ............................... 50 50 18 18 478 478 388 386February ............................. 12 12 50 46 476 476 241 241March .................................. 42 42 27 27 552 552 287 286April .................................... 66 66 5 5 468 464 323 323May ..................................... 59 59 67 63 485 484 184 183June .................................... 47 47 21 16 604 598 323 323July ..................................... 60 60 9 9 581 581 374 374August ................................ 47 43 8 4 555 555 294 294September .......................... 17 17 5 5 570 570 275 273October ............................... 76 76 62 57 487 486 284 284November ........................... 74 74 20 20 647 647 317 317December ........................... 63 63 46 46 556 556 289 289Average ............................. 51 51 28 26 b 539 537 298 298
1977January ............................... 51 51 42 22 637 619 397 397February ............................. 78 78 85 63 581 547 412 412March .................................. 45 45 38 28 575 528 735 735April .................................... 53 53 39 26 524 474 517 517May ..................................... 81 77 42 42 509 476 563 559June .................................... 95 95 10 6 672 637 563 547July ..................................... 48 48 64 59 539 499 A 857 850August ................................ 94 94 43 43 553 519 500 474September .......................... 19 19 33 29 391 355 449 449October ............................... 29 18 40 30 467 451 413 413November ........................... 40 38 52 52 515 462 423 418December ........................... 50 50 17 17 533 514 573 570Average ............................. 57 55 42 35 541 507 535 530
See footnotes at end of table.
Energy Information Administration/Historical Monthly Energy Review 1973-1992 103

Table 3.3c Petroleum Imports, 1973-1992: Ecuador, Gabon, Indonesia, and Iran (Continued)
(Thousand Barrels per Day)
Non-Arab OPECa
Ecuador Gabon Indonesia Iran
Total Crude Oil Total Crude Oil Total Crude Oil Total Crude Oil
1978January ............................... 67 67 25 21 528 466 690 679February ............................. 79 66 60 60 406 378 539 539March .................................. 49 41 29 29 604 576 535 535April .................................... 36 24 73 67 532 495 442 442May ..................................... 25 15 19 15 550 538 746 746June .................................... 31 21 37 37 666 608 536 536July ..................................... 72 45 34 34 648 603 532 532August ................................ 51 22 36 21 575 556 574 574September .......................... 60 45 32 25 634 611 591 591October ............................... 55 33 16 16 571 553 608 608November ........................... 52 38 29 29 549 488 495 495December ........................... 68 43 105 105 604 513 369 369Average ............................. 54 38 41 38 573 533 555 554
1979January ............................... 89 66 42 42 503 436 187 187February ............................. 31 22 34 34 521 427 86 67March .................................. 56 35 52 52 419 392 22 0April .................................... 24 16 21 21 376 374 52 52May ..................................... 50 26 45 45 343 283 197 195June .................................... 35 35 37 37 391 338 318 315July ..................................... 19 19 53 53 427 408 425 400August ................................ 34 26 82 82 499 465 516 508September .......................... 38 26 0 0 359 332 373 365October ............................... 46 40 54 54 452 420 496 496November ........................... 63 49 34 34 351 320 549 542December ........................... 19 0 52 47 403 357 414 414Average ............................. 42 30 42 42 420 380 304 297
1980January ............................... 11 0 32 32 454 418 95 91February ............................. 29 14 40 40 317 272 9 9March .................................. 65 54 16 16 405 367 0 0April .................................... 46 38 11 11 374 328 0 0May ..................................... 4 0 45 45 360 324 0 0June .................................... 31 23 41 30 331 303 0 0July ..................................... 27 22 17 17 365 333 0 0August ................................ 12 0 22 22 289 260 0 0September .......................... 25 13 0 0 299 277 0 0October ............................... 8 0 30 30 348 328 0 0November ........................... 14 0 25 25 348 322 0 0December ........................... 53 37 29 29 288 235 0 0Average ............................. 27 17 26 25 348 314 9 8
1981January ............................... 15 11 12 12 424 362 0 0February ............................. 33 16 59 59 406 374 0 0March .................................. 8 0 47 47 328 293 0 0April .................................... 4 0 18 18 307 243 0 0May ..................................... 75 55 39 39 297 246 0 0June .................................... 49 45 28 28 367 311 0 0July ..................................... 12 (s) 7 7 340 298 0 0August ................................ 56 38 28 28 377 316 0 0September .......................... 62 50 87 87 371 330 0 0October ............................... 120 112 52 52 427 378 0 0November ........................... 30 23 25 25 353 301 0 0December ........................... 116 107 16 16 400 368 0 0Average ............................. 48 38 35 35 366 318 0 0
1982January ............................... 61 51 66 66 289 248 0 0February ............................. 15 0 45 45 244 166 0 0March .................................. 50 43 20 20 200 172 0 0April .................................... 38 22 25 25 215 204 0 0May ..................................... 54 48 0 0 236 210 0 0June .................................... 37 25 55 55 215 202 72 72July ..................................... 35 35 22 22 327 312 69 69August ................................ 69 59 49 49 271 258 27 27September .......................... 17 17 43 39 191 187 21 21October ............................... 81 59 25 25 242 232 108 108November ........................... 30 23 85 85 283 263 34 34December ........................... 10 0 46 46 265 243 88 88Average ............................. 42 32 40 40 248 226 35 35
See footnotes at end of table.
Energy Information Administration/Historical Monthly Energy Review 1973-1992104

Table 3.3c Petroleum Imports, 1973-1992: Ecuador, Gabon, Indonesia, and Iran (Continued)
(Thousand Barrels per Day)
Non-Arab OPECa
Ecuador Gabon Indonesia Iran
Total Crude Oil Total Crude Oil Total Crude Oil Total Crude Oil
1983January ............................... 21 11 33 33 255 250 43 43February ............................. 28 24 (s) (s) 217 210 0 0March .................................. 99 95 86 86 138 134 0 0April .................................... 58 58 67 67 210 187 0 0May ..................................... 21 21 48 48 405 373 37 37June .................................... 72 58 66 66 466 415 38 38July ..................................... 76 72 33 33 464 422 112 112August ................................ 112 112 93 93 433 416 213 213September .......................... 68 62 99 99 501 480 86 86October ............................... 70 70 76 76 368 346 12 12November ........................... 36 29 77 77 302 284 21 21December ........................... 73 62 22 22 294 264 9 9Average ............................. 61 56 59 59 338 315 48 48
1984January ............................... 43 33 0 0 289 243 0 0February ............................. 116 112 41 30 267 251 0 0March .................................. 58 54 52 52 283 219 67 67April .................................... 48 43 71 71 226 161 0 0May ..................................... 33 24 102 102 479 423 0 0June .................................... 46 36 46 46 415 366 0 0July ..................................... 63 48 105 105 384 343 0 0August ................................ 75 58 71 71 281 251 0 0September .......................... 43 37 47 47 333 284 17 17October ............................... 41 36 53 53 421 392 0 0November ........................... 68 62 42 42 424 402 24 24December ........................... 31 22 60 60 314 314 12 12Average ............................. 55 47 58 57 343 304 10 10
1985January ............................... 50 39 10 10 296 296 0 0February ............................. 39 27 0 0 232 232 0 0March .................................. 67 56 17 15 283 226 0 0April .................................... 27 12 49 41 313 288 0 0May ..................................... 55 34 88 88 265 248 0 0June .................................... 31 22 32 32 438 414 0 0July ..................................... 98 83 55 55 390 372 42 42August ................................ 95 83 112 112 377 338 100 100September .......................... 70 61 88 88 206 189 43 43October ............................... 88 70 52 52 277 277 41 41November ........................... 107 107 74 74 356 315 99 99December ........................... 78 72 46 46 324 308 0 0Average ............................. 67 56 52 51 314 292 27 27
1986January ............................... 106 92 18 18 290 256 0 0February ............................. 16 3 22 22 290 290 (s) (s)March .................................. 35 18 26 19 161 154 0 0April .................................... 67 61 9 0 292 262 0 0May ..................................... 86 81 45 45 314 276 40 40June .................................... 89 63 38 38 353 337 0 0July ..................................... 80 69 0 0 532 497 66 66August ................................ 74 59 45 45 274 274 93 93September .......................... 63 59 21 21 341 315 31 31October ............................... 85 69 24 24 388 373 0 0November ........................... 132 122 0 0 335 308 0 0December ........................... 90 69 61 61 251 221 0 0Average ............................. 77 64 26 25 318 297 19 19
1987January ............................... 81 71 0 0 254 223 0 0February ............................. 69 53 0 0 418 391 30 30March .................................. 41 35 15 15 317 283 73 73April .................................... 0 0 59 59 236 236 47 47May ..................................... 1 0 64 64 297 244 75 75June .................................... 0 0 68 68 261 246 165 165July ..................................... 0 0 38 38 349 324 237 237August ................................ 0 0 54 54 312 312 208 208September .......................... 13 13 35 35 242 204 193 193October ............................... 79 61 45 45 305 282 86 86November ........................... 33 25 21 21 219 212 41 41December ........................... 37 12 14 14 216 199 23 23Average ............................. 29 23 35 35 285 262 98 98
See footnotes at end of table.
Energy Information Administration/Historical Monthly Energy Review 1973-1992 105

Table 3.3c Petroleum Imports, 1973-1992: Ecuador, Gabon, Indonesia, and Iran (Continued)
(Thousand Barrels per Day)
Non-Arab OPECa
Ecuador Gabon Indonesia Iran
Total Crude Oil Total Crude Oil Total Crude Oil Total Crude Oil
1988January ............................... 94 63 36 36 179 137 c 1 c 1February ............................. 21 14 12 12 194 154 0 0March .................................. 34 12 11 11 127 112 0 0April .................................... 61 49 33 33 166 165 0 0May ..................................... 29 11 9 9 298 298 0 0June .................................... 42 24 46 46 184 184 0 0July ..................................... 23 12 0 0 216 216 0 0August ................................ 42 36 18 18 153 153 0 0September .......................... 32 26 0 0 242 201 0 0October ............................... 59 47 10 0 265 204 0 0November ........................... 66 48 22 22 240 227 0 0December ........................... 64 58 0 0 194 181 0 0Average ............................. 47 33 16 15 205 186 c (s) c (s)
1989January ............................... 52 46 0 0 218 201 0 0February ............................. 74 67 11 11 292 244 0 0March .................................. 100 85 10 10 167 107 0 0April .................................... 116 111 72 72 128 97 0 0May ..................................... 123 112 19 12 264 264 0 0June .................................... 75 75 88 88 138 129 0 0July ..................................... 86 86 42 37 113 108 0 0August ................................ 97 79 87 87 115 100 0 0September .......................... 115 109 32 32 113 91 0 0October ............................... 122 105 50 50 167 130 0 0November ........................... 71 62 99 99 231 208 0 0December ........................... 41 23 85 85 263 222 0 0Average ............................. 89 80 50 49 183 158 0 0
1990January ............................... 48 35 75 75 153 118 0 0February ............................. 60 40 43 43 254 189 0 0March .................................. 49 38 134 134 138 97 0 0April .................................... 31 29 32 28 88 80 0 0May ..................................... 17 12 27 27 85 77 0 0June .................................... 98 86 59 59 138 129 0 0July ..................................... 60 43 69 69 143 137 0 0August ................................ 81 69 119 119 69 55 0 0September .......................... 43 37 59 59 111 111 0 0October ............................... 49 43 50 50 88 88 0 0November ........................... 13 13 71 71 72 72 0 0December ........................... 35 12 30 30 45 36 0 0Average ............................. 49 38 64 64 114 98 0 0
1991January ............................... 18 6 41 41 70 70 0 0February ............................. 66 55 95 95 162 153 0 0March .................................. 67 58 29 29 93 93 0 0April .................................... 35 24 72 72 69 69 0 0May ..................................... 109 103 96 96 97 97 0 0June .................................... 129 126 70 70 187 187 0 0July ..................................... 62 47 137 137 88 88 81 81August ................................ 112 93 56 56 93 87 48 48September .......................... 31 25 91 91 83 64 152 152October ............................... 30 24 137 137 118 91 43 43November ........................... 55 48 91 91 120 96 64 64December ........................... 41 23 91 91 163 134 0 0Average ............................. 63 53 84 84 111 102 32 32
1992January ............................... 56 56 91 91 125 117 0 0February ............................. 61 48 105 105 39 39 0 0March .................................. 26 26 25 25 85 83 0 0April .................................... 53 46 186 186 54 49 0 0May ..................................... 51 51 135 135 155 133 0 0June .................................... 105 101 129 129 109 102 0 0July ..................................... 111 111 143 143 65 65 0 0August ................................ 99 93 108 108 91 85 0 0September .......................... 97 97 165 158 57 38 0 0October ............................... 42 36 167 167 54 43 0 0November ........................... 53 53 114 114 36 23 0 0December ........................... 24 24 120 120 60 60 0 0Average ............................. 65 62 124 123 78 70 0 0
a Excludes petroleum imported into the United States indirectly frommembers of the Organization of Petroleum Exporting Countries (OPEC),primarily from Caribbean and West European areas, as petroleum productsthat were refined from crude oil produced by OPEC.
b The annual value is not an average of the monthly values. See Note 6 atend of section.
c A small amount of Iranian crude oil entered the United States in January1988 from the Virgin Islands. The oil originated in Iran and was exported to
the Virgin Islands prior to the signing of Executive Order 12613 on October29, 1987.
E=Estimate; see Note 6 at end of section. (s)=Less than 500 barrels perday. A=Adjusted data; see Note 6 at end of section.
Notes: • Beginning in October 1977, Strategic Petroleum Reserve importsare included. • U.S. geographic coverage is the 50 States and the District ofColumbia.
Sources: See end of section.
Energy Information Administration/Historical Monthly Energy Review 1973-1992106

Table 3.3d Petroleum Imports, 1973-1992: Nigeria, Venezuela, Total Non-Arab OPEC, and Total OPEC
(Thousand Barrels per Day)
Non-Arab OPECa
TotalNon-Arab OPECa
TotalOPECaNigeria Venezuela
Total Crude Oil Total Crude Oil Total Crude Oil Total Crude Oil
1973January ............................... E 410 392 E 1,250 246 E 1,882 852 E 2,651 1,566February ............................. E 448 427 E 1,040 205 E 1,855 986 E 2,636 1,705March .................................. E 433 413 E 1,011 199 E 1,866 1,021 E 2,820 1,913April .................................... E 489 476 E 797 281 E 1,619 1,084 E 2,373 1,757May ..................................... E 426 415 E 998 352 E 1,934 1,269 E 2,823 2,065June .................................... E 421 410 E 982 346 E 1,961 1,306 E 2,827 2,093July ..................................... E 487 481 E 1,161 392 E 2,218 1,397 E 3,335 2,423August ................................ E 476 471 E 1,257 425 E 2,255 1,382 E 3,399 2,429September .......................... E 414 409 E 1,199 405 E 2,145 1,302 E 3,312 2,369October ............................... E 521 515 E 1,259 423 E 2,242 1,386 E 3,532 2,560November ........................... E 444 440 E 1,351 454 E 2,300 1,381 E 3,316 2,331December ........................... E 534 528 E 1,178 396 E 2,504 1,691 E 2,721 1,895Average ............................. 459 448 b 1,135 344 b 2,078 1,257 b 2,993 2,095
1974January ............................... E 464 462 E 1,116 255 E 2,276 1,388 E 2,308 1,418February ............................. E 359 357 E 973 222 E 2,119 1,313 E 2,180 1,371March .................................. E 548 545 E 1,216 278 E 2,487 1,509 E 2,583 1,597April .................................... E 702 689 E 950 285 E 2,697 1,992 E 2,882 2,172May ..................................... E 731 717 E 783 235 E 2,484 1,898 E 3,399 2,777June .................................... E 732 718 E 823 247 E 2,467 1,855 E 3,693 3,031July ..................................... E 890 862 E 861 371 E 2,699 2,159 E 3,803 3,196August ................................ E 909 880 E 872 375 E 2,542 2,002 E 3,605 3,002September .......................... E 768 743 E 969 417 E 2,570 1,975 E 3,550 2,892October ............................... E 723 704 E 1,088 387 E 2,561 1,830 E 3,732 2,957November ........................... E 1,039 1,012 E 1,087 387 E 2,861 2,121 E 3,874 3,093December ........................... E 669 652 E 1,015 361 E 2,543 1,857 E 3,628 2,900Average ............................. 713 697 b 979 319 2,527 1,827 b 3,280 2,540
1975January ............................... E 871 843 E 882 334 E 2,486 1,899 E 3,753 3,140February ............................. E 860 833 E 707 268 E 2,283 1,805 E 3,512 2,997March .................................. E 834 808 E 898 340 E 2,317 1,722 E 3,627 2,951April .................................... 619 614 824 444 2,197 1,782 3,050 2,611May ..................................... 643 639 801 411 2,163 1,744 3,204 2,750June .................................... 619 606 711 531 2,150 1,937 3,281 3,004July ..................................... 715 695 679 505 2,178 1,981 3,480 3,240August ................................ 804 799 522 387 2,058 1,901 3,776 3,604September .......................... 817 799 624 426 2,259 2,032 4,025 3,681October ............................... 773 754 515 366 2,058 1,885 3,634 3,365November ........................... 802 788 585 397 2,318 2,114 3,903 3,645December ........................... 785 777 622 328 2,091 1,782 3,868 3,530Average ............................. 762 746 b 702 395 b 2,219 1,882 b 3,601 3,211
1976January ............................... 782 773 547 133 2,262 1,838 4,308 3,845February ............................. 831 821 839 111 2,450 1,707 4,363 3,579March .................................. 905 897 468 152 2,281 1,955 4,339 3,967April .................................... 997 986 497 166 2,356 2,010 4,392 4,024May ..................................... 855 842 488 166 2,138 1,797 4,276 3,899June .................................... 1,134 1,122 668 263 2,797 2,368 5,283 4,803July ..................................... 1,137 1,128 808 265 2,970 2,418 5,680 5,098August ................................ 1,029 1,026 704 371 2,638 2,293 5,235 4,844September .......................... 1,173 1,159 932 412 2,972 2,437 5,698 5,146October ............................... 1,087 1,082 773 347 2,769 2,331 5,348 4,857November ........................... 1,174 1,161 812 292 3,044 2,512 5,812 5,222December ........................... 1,194 1,165 868 209 3,017 2,329 5,973 5,231Average ............................. 1,025 1,014 b 700 241 b 2,642 2,167 b 5,066 4,545
1977January ............................... 1,272 1,268 842 191 3,241 2,548 6,232 5,491February ............................. 1,256 1,240 937 168 3,350 2,509 6,506 5,612March .................................. 1,300 1,296 679 160 3,372 2,793 6,408 5,777April .................................... 1,254 1,250 666 288 3,053 2,608 6,421 5,944May ..................................... 1,072 1,060 534 251 2,802 2,465 6,230 5,838June .................................... 1,223 1,195 669 341 3,230 2,820 6,630 6,147July ..................................... 1,195 1,184 656 336 3,358 2,978 6,606 6,184August ................................ 975 964 753 316 2,918 2,411 6,040 5,441September .......................... 1,085 1,066 745 301 2,721 2,219 5,936 5,398October ............................... 1,159 1,150 592 241 2,699 2,304 5,842 5,409November ........................... 943 926 521 201 2,494 2,098 5,663 5,234December ........................... 990 969 709 204 2,872 2,324 5,830 5,248Average ............................. 1,143 1,130 690 250 3,008 2,507 6,193 5,643
See footnotes at end of table.
Energy Information Administration/Historical Monthly Energy Review 1973-1992 107
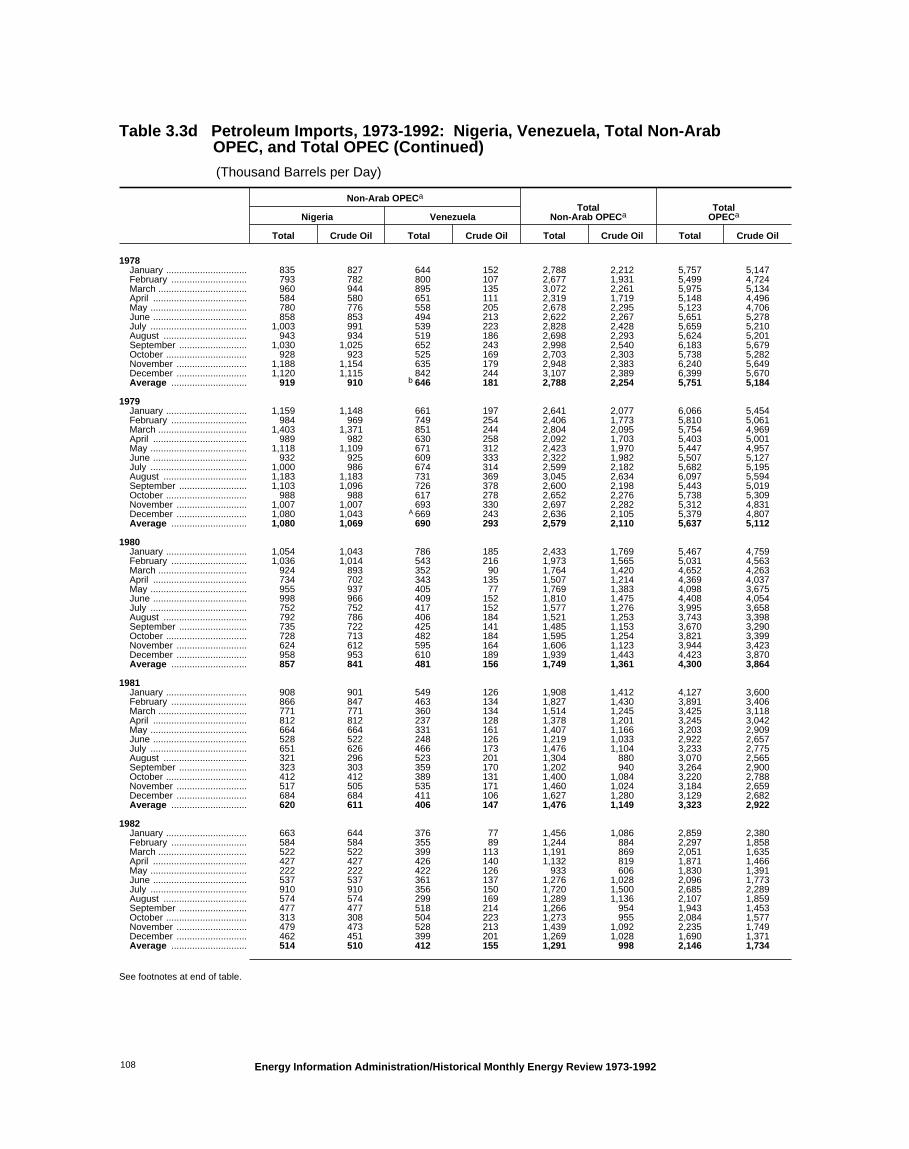
Table 3.3d Petroleum Imports, 1973-1992: Nigeria, Venezuela, Total Non-Arab OPEC, and Total OPEC (Continued)
(Thousand Barrels per Day)
Non-Arab OPECa
TotalNon-Arab OPECa
TotalOPECaNigeria Venezuela
Total Crude Oil Total Crude Oil Total Crude Oil Total Crude Oil
1978January ............................... 835 827 644 152 2,788 2,212 5,757 5,147February ............................. 793 782 800 107 2,677 1,931 5,499 4,724March .................................. 960 944 895 135 3,072 2,261 5,975 5,134April .................................... 584 580 651 111 2,319 1,719 5,148 4,496May ..................................... 780 776 558 205 2,678 2,295 5,123 4,706June .................................... 858 853 494 213 2,622 2,267 5,651 5,278July ..................................... 1,003 991 539 223 2,828 2,428 5,659 5,210August ................................ 943 934 519 186 2,698 2,293 5,624 5,201September .......................... 1,030 1,025 652 243 2,998 2,540 6,183 5,679October ............................... 928 923 525 169 2,703 2,303 5,738 5,282November ........................... 1,188 1,154 635 179 2,948 2,383 6,240 5,649December ........................... 1,120 1,115 842 244 3,107 2,389 6,399 5,670Average ............................. 919 910 b 646 181 2,788 2,254 5,751 5,184
1979January ............................... 1,159 1,148 661 197 2,641 2,077 6,066 5,454February ............................. 984 969 749 254 2,406 1,773 5,810 5,061March .................................. 1,403 1,371 851 244 2,804 2,095 5,754 4,969April .................................... 989 982 630 258 2,092 1,703 5,403 5,001May ..................................... 1,118 1,109 671 312 2,423 1,970 5,447 4,957June .................................... 932 925 609 333 2,322 1,982 5,507 5,127July ..................................... 1,000 986 674 314 2,599 2,182 5,682 5,195August ................................ 1,183 1,183 731 369 3,045 2,634 6,097 5,594September .......................... 1,103 1,096 726 378 2,600 2,198 5,443 5,019October ............................... 988 988 617 278 2,652 2,276 5,738 5,309November ........................... 1,007 1,007 693 330 2,697 2,282 5,312 4,831December ........................... 1,080 1,043 A 669 243 2,636 2,105 5,379 4,807Average ............................. 1,080 1,069 690 293 2,579 2,110 5,637 5,112
1980January ............................... 1,054 1,043 786 185 2,433 1,769 5,467 4,759February ............................. 1,036 1,014 543 216 1,973 1,565 5,031 4,563March .................................. 924 893 352 90 1,764 1,420 4,652 4,263April .................................... 734 702 343 135 1,507 1,214 4,369 4,037May ..................................... 955 937 405 77 1,769 1,383 4,098 3,675June .................................... 998 966 409 152 1,810 1,475 4,408 4,054July ..................................... 752 752 417 152 1,577 1,276 3,995 3,658August ................................ 792 786 406 184 1,521 1,253 3,743 3,398September .......................... 735 722 425 141 1,485 1,153 3,670 3,290October ............................... 728 713 482 184 1,595 1,254 3,821 3,399November ........................... 624 612 595 164 1,606 1,123 3,944 3,423December ........................... 958 953 610 189 1,939 1,443 4,423 3,870Average ............................. 857 841 481 156 1,749 1,361 4,300 3,864
1981January ............................... 908 901 549 126 1,908 1,412 4,127 3,600February ............................. 866 847 463 134 1,827 1,430 3,891 3,406March .................................. 771 771 360 134 1,514 1,245 3,425 3,118April .................................... 812 812 237 128 1,378 1,201 3,245 3,042May ..................................... 664 664 331 161 1,407 1,166 3,203 2,909June .................................... 528 522 248 126 1,219 1,033 2,922 2,657July ..................................... 651 626 466 173 1,476 1,104 3,233 2,775August ................................ 321 296 523 201 1,304 880 3,070 2,565September .......................... 323 303 359 170 1,202 940 3,264 2,900October ............................... 412 412 389 131 1,400 1,084 3,220 2,788November ........................... 517 505 535 171 1,460 1,024 3,184 2,659December ........................... 684 684 411 106 1,627 1,280 3,129 2,682Average ............................. 620 611 406 147 1,476 1,149 3,323 2,922
1982January ............................... 663 644 376 77 1,456 1,086 2,859 2,380February ............................. 584 584 355 89 1,244 884 2,297 1,858March .................................. 522 522 399 113 1,191 869 2,051 1,635April .................................... 427 427 426 140 1,132 819 1,871 1,466May ..................................... 222 222 422 126 933 606 1,830 1,391June .................................... 537 537 361 137 1,276 1,028 2,096 1,773July ..................................... 910 910 356 150 1,720 1,500 2,685 2,289August ................................ 574 574 299 169 1,289 1,136 2,107 1,859September .......................... 477 477 518 214 1,266 954 1,943 1,453October ............................... 313 308 504 223 1,273 955 2,084 1,577November ........................... 479 473 528 213 1,439 1,092 2,235 1,749December ........................... 462 451 399 201 1,269 1,028 1,690 1,371Average ............................. 514 510 412 155 1,291 998 2,146 1,734
See footnotes at end of table.
Energy Information Administration/Historical Monthly Energy Review 1973-1992108

Table 3.3d Petroleum Imports, 1973-1992: Nigeria, Venezuela, Total Non-Arab OPEC, and Total OPEC (Continued)
(Thousand Barrels per Day)
Non-Arab OPECa
TotalNon-Arab OPECa
TotalOPECaNigeria Venezuela
Total Crude Oil Total Crude Oil Total Crude Oil Total Crude Oil
1983January ............................... 186 186 337 151 875 674 1,412 1,107February ............................. 92 85 393 123 731 442 1,068 743March .................................. 121 121 440 130 883 566 1,066 699April .................................... 186 186 523 164 1,044 662 1,432 999May ..................................... 385 385 455 159 1,351 1,022 1,771 1,334June .................................... 467 467 335 126 1,445 1,170 1,973 1,599July ..................................... 525 525 434 169 1,644 1,333 2,251 1,857August ................................ 464 464 511 190 1,825 1,487 2,728 2,236September .......................... 324 324 432 226 1,511 1,277 2,595 2,185October ............................... 307 305 337 152 1,170 960 2,108 1,794November ........................... 215 213 452 217 1,102 842 1,910 1,534December ........................... 329 327 415 160 1,144 844 1,969 1,577Average ............................. 302 301 422 164 1,231 944 1,862 1,477
1984January ............................... 243 243 549 188 1,123 707 1,965 1,371February ............................. 244 239 478 211 1,145 843 1,896 1,388March .................................. 269 251 358 240 1,088 883 1,811 1,454April .................................... 288 278 593 277 1,227 831 1,962 1,410May ..................................... 289 275 627 351 1,531 1,176 2,677 2,097June .................................... 243 233 640 294 1,389 975 2,227 1,620July ..................................... 204 196 539 272 1,295 965 2,241 1,740August ................................ 114 108 475 199 1,016 688 2,009 1,472September .......................... 160 140 715 300 1,315 825 2,002 1,275October ............................... 208 197 585 259 1,308 937 2,062 1,566November ........................... 163 163 564 265 1,286 958 1,954 1,414December ........................... 166 159 459 183 1,042 750 1,765 1,318Average ............................. 216 207 548 253 1,230 878 2,049 1,512
1985January ............................... 262 252 481 161 1,100 757 1,405 943February ............................. 119 93 524 194 914 546 1,220 733March .................................. 164 154 588 327 1,120 778 1,505 1,059April .................................... 280 280 684 420 1,353 1,041 1,928 1,395May ..................................... 381 375 552 346 1,341 1,092 1,976 1,461June .................................... 357 352 452 281 1,311 1,101 1,690 1,303July ..................................... 381 376 573 272 1,539 1,200 1,825 1,358August ................................ 207 194 568 255 1,459 1,081 1,740 1,265September .......................... 285 263 808 357 1,500 1,000 1,802 1,153October ............................... 305 284 676 376 1,438 1,099 1,958 1,387November ........................... 325 308 727 384 1,688 1,287 2,440 1,830December ........................... 432 411 625 293 1,505 1,131 2,430 1,818Average ............................. 293 280 605 306 1,358 1,012 1,830 1,312
1986January ............................... 278 273 629 236 1,322 875 2,298 1,627February ............................. 204 199 518 200 1,050 714 1,807 1,308March .................................. 328 323 797 351 1,347 865 2,145 1,477April .................................... 319 311 831 426 1,518 1,061 2,576 1,892May ..................................... 398 398 899 487 1,783 1,326 2,749 2,029June .................................... 382 382 772 438 1,633 1,258 3,010 2,205July ..................................... 542 542 730 401 1,950 1,575 3,307 2,462August ................................ 606 606 916 537 2,007 1,613 3,346 2,501September .......................... 684 678 856 542 1,995 1,647 3,383 2,697October ............................... 530 530 863 440 1,890 1,436 3,276 2,556November ........................... 483 477 843 509 1,793 1,417 3,088 2,369December ........................... 511 511 841 414 1,753 1,277 2,976 2,176Average ............................. 440 437 793 416 1,674 1,259 2,837 2,113
1987January ............................... 346 346 899 530 1,580 1,170 2,764 2,236February ............................. 256 256 791 410 1,563 1,140 2,785 2,012March .................................. 312 312 702 418 1,461 1,136 2,305 1,689April .................................... 512 507 710 420 1,564 1,269 2,430 1,803May ..................................... 550 545 913 560 1,900 1,488 2,675 2,031June .................................... 546 546 808 524 1,847 1,548 3,122 2,423July ..................................... 792 769 854 558 2,269 1,926 3,533 2,813August ................................ 732 725 831 526 2,137 1,825 3,748 3,121September .......................... 615 608 821 500 1,920 1,554 3,560 2,830October ............................... 518 502 829 446 1,863 1,423 3,576 2,901November ........................... 607 602 771 493 1,692 1,395 3,169 2,558December ........................... 613 606 717 464 1,619 1,317 3,033 2,346Average ............................. 535 529 804 488 1,787 1,435 3,060 2,400
See footnotes at end of table.
Energy Information Administration/Historical Monthly Energy Review 1973-1992 109

Table 3.3d Petroleum Imports, 1973-1992: Nigeria, Venezuela, Total Non-Arab OPEC, and Total OPEC (Continued)
(Thousand Barrels per Day)
Non-Arab OPECa
TotalNon-Arab OPECa
TotalOPECaNigeria Venezuela
Total Crude Oil Total Crude Oil Total Crude Oil Total Crude Oil
1988January ............................... 406 397 766 372 1,481 1,006 3,134 2,234February ............................. 506 473 846 411 1,578 1,063 3,461 2,507March .................................. 589 569 803 514 1,564 1,219 3,073 2,381April .................................... 711 706 833 455 1,803 1,408 3,413 2,575May ..................................... 601 601 841 604 1,777 1,523 3,501 2,800June .................................... 875 866 850 567 1,997 1,687 3,632 2,904July ..................................... 715 711 724 440 1,679 1,379 3,589 2,812August ................................ 623 610 830 421 1,666 1,238 3,703 2,784September .......................... 546 532 824 425 1,643 1,183 3,685 2,832October ............................... 686 664 772 387 1,792 1,301 3,861 2,905November ........................... 489 484 779 370 1,596 1,152 3,510 2,628December ........................... 667 667 669 305 1,594 1,211 3,674 2,980Average ............................. 618 607 794 439 1,681 1,281 3,520 2,696
1989January ............................... 782 782 941 470 1,993 1,498 4,212 3,361February ............................. 567 559 775 368 1,719 1,249 3,845 3,015March .................................. 702 696 909 468 1,888 1,366 3,693 2,856April .................................... 750 722 831 424 1,897 1,426 3,927 3,115May ..................................... 789 789 853 509 2,048 1,686 4,025 3,303June .................................... 864 841 778 486 1,943 1,619 4,106 3,500July ..................................... 1,094 1,085 794 447 2,130 1,764 4,437 3,746August ................................ 946 932 834 486 2,078 1,683 4,531 3,784September .......................... 867 836 914 568 2,041 1,636 4,236 3,510October ............................... 713 694 1,004 592 2,056 1,571 4,177 3,390November ........................... 770 757 924 549 2,096 1,674 4,353 3,565December ........................... 915 886 903 561 2,206 1,777 4,111 3,338Average ............................. 815 800 873 495 2,010 1,582 4,140 3,376
1990January ............................... 830 830 1,155 696 2,260 1,754 4,865 3,813February ............................. 833 816 898 564 2,088 1,652 4,594 3,717March .................................. 1,054 1,031 893 543 2,268 1,843 4,429 3,648April .................................... 969 941 1,005 692 2,125 1,772 4,198 3,465May ..................................... 1,008 997 1,087 705 2,225 1,818 4,574 3,781June .................................... 778 760 1,070 704 2,142 1,737 4,460 3,653July ..................................... 860 855 1,007 665 2,139 1,769 4,992 4,246August ................................ 881 881 1,014 617 2,164 1,741 4,921 4,046September .......................... 755 743 1,062 740 2,029 1,690 3,944 3,277October ............................... 557 536 982 717 1,725 1,434 3,517 2,921November ........................... 574 555 1,142 725 1,871 1,435 3,629 2,912December ........................... 499 461 975 616 1,585 1,155 3,428 2,678Average ............................. 800 784 1,025 666 2,052 1,650 4,296 3,514
1991January ............................... 504 481 1,005 673 1,637 1,271 3,898 3,101February ............................. 721 717 959 686 2,003 1,705 3,815 3,264March .................................. 531 531 998 631 1,718 1,342 3,623 3,033April .................................... 677 649 845 470 1,698 1,283 3,744 3,059May ..................................... 860 838 997 581 2,158 1,715 4,724 3,839June .................................... 832 827 1,135 705 2,354 1,915 4,498 3,747July ..................................... 833 817 1,102 683 2,304 1,855 4,232 3,525August ................................ 1,016 983 1,070 701 2,394 1,966 4,602 3,946September .......................... 489 467 1,163 790 2,009 1,589 3,956 3,204October ............................... 651 623 1,087 777 2,067 1,694 4,023 3,343November ........................... 704 674 1,065 671 2,099 1,644 4,171 3,328December ........................... 617 593 987 655 1,899 1,496 3,791 3,116Average ............................. 703 683 1,035 668 2,028 1,622 4,092 3,377
1992January ............................... 593 566 1,119 787 1,984 1,617 4,224 3,554February ............................. 322 303 1,028 655 1,555 1,150 3,549 2,895March .................................. 441 409 1,106 793 1,684 1,336 3,606 2,941April .................................... 798 788 1,079 722 2,169 1,791 4,085 3,334May ..................................... 773 773 1,038 745 2,152 1,837 4,118 3,428June .................................... 740 740 1,059 738 2,141 1,809 4,029 3,430July ..................................... 900 883 1,163 912 2,382 2,114 4,339 3,772August ................................ 815 795 1,102 841 2,215 1,922 4,144 3,473September .......................... 774 754 1,333 953 2,426 2,001 4,274 3,531October ............................... 827 813 1,497 1,073 2,587 2,133 4,507 3,732November ........................... 626 608 1,343 921 2,173 1,719 4,086 3,376December ........................... 549 532 1,164 763 1,917 1,499 4,105 3,381Average ............................. 681 665 1,170 826 2,117 1,746 4,092 3,406
a Excludes petroleum imported into the United States indirectly frommembers of the Organization of Petroleum Exporting Countries (OPEC),primarily from Caribbean and West European areas, as petroleum productsthat were refined from crude oil produced by OPEC.
b The annual value is not an average of the monthly values. See Note 6 atend of section.
E=Estimate; see Note 6 at end of section. A=Adjusted data; see Note 6 at
end of section. Notes: • Beginning in October 1977, Strategic Petroleum Reserve imports
are included. • Totals may not equal sum of components due to independentrounding. • U.S. geographic coverage is the 50 States and the District ofColumbia.
Sources: See end of section.
Energy Information Administration/Historical Monthly Energy Review 1973-1992110
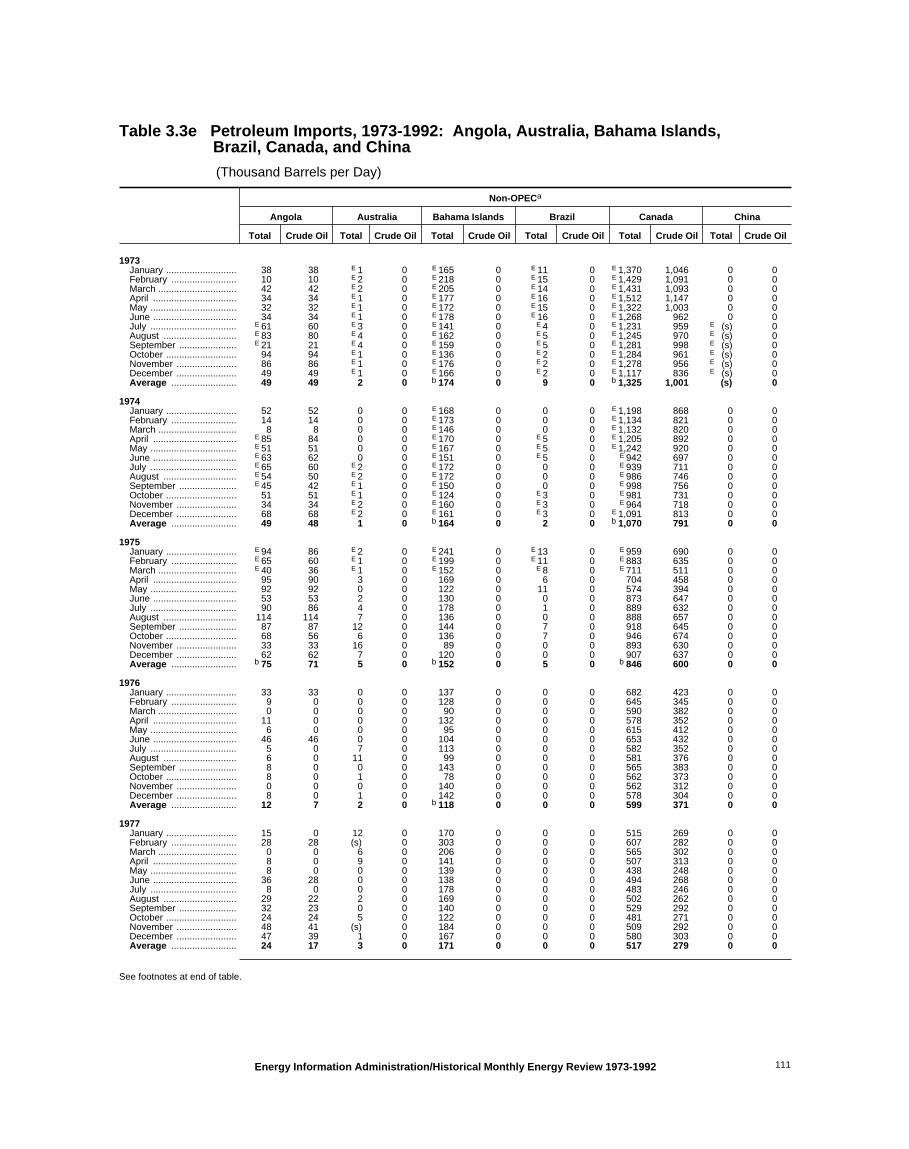
Table 3.3e Petroleum Imports, 1973-1992: Angola, Australia, Bahama Islands, Brazil, Canada, and China
(Thousand Barrels per Day)
Non-OPECa
Angola Australia Bahama Islands Brazil Canada China
Total Crude Oil Total Crude Oil Total Crude Oil Total Crude Oil Total Crude Oil Total Crude Oil
1973January ........................... 38 38 E 1 0 E 165 0 E 11 0 E 1,370 1,046 0 0February ......................... 10 10 E 2 0 E 218 0 E 15 0 E 1,429 1,091 0 0March .............................. 42 42 E 2 0 E 205 0 E 14 0 E 1,431 1,093 0 0April ................................ 34 34 E 1 0 E 177 0 E 16 0 E 1,512 1,147 0 0May ................................. 32 32 E 1 0 E 172 0 E 15 0 E 1,322 1,003 0 0June ................................ 34 34 E 1 0 E 178 0 E 16 0 E 1,268 962 0 0July ................................. E 61 60 E 3 0 E 141 0 E 4 0 E 1,231 959 E (s) 0August ............................ E 83 80 E 4 0 E 162 0 E 5 0 E 1,245 970 E (s) 0September ...................... E 21 21 E 4 0 E 159 0 E 5 0 E 1,281 998 E (s) 0October ........................... 94 94 E 1 0 E 136 0 E 2 0 E 1,284 961 E (s) 0November ....................... 86 86 E 1 0 E 176 0 E 2 0 E 1,278 956 E (s) 0December ....................... 49 49 E 1 0 E 166 0 E 2 0 E 1,117 836 E (s) 0Average ......................... 49 49 2 0 b 174 0 9 0 b 1,325 1,001 (s) 0
1974January ........................... 52 52 0 0 E 168 0 0 0 E 1,198 868 0 0February ......................... 14 14 0 0 E 173 0 0 0 E 1,134 821 0 0March .............................. 8 8 0 0 E 146 0 0 0 E 1,132 820 0 0April ................................ E 85 84 0 0 E 170 0 E 5 0 E 1,205 892 0 0May ................................. E 51 51 0 0 E 167 0 E 5 0 E 1,242 920 0 0June ................................ E 63 62 0 0 E 151 0 E 5 0 E 942 697 0 0July ................................. E 65 60 E 2 0 E 172 0 0 0 E 939 711 0 0August ............................ E 54 50 E 2 0 E 172 0 0 0 E 986 746 0 0September ...................... E 45 42 E 1 0 E 150 0 0 0 E 998 756 0 0October ........................... 51 51 E 1 0 E 124 0 E 3 0 E 981 731 0 0November ....................... 34 34 E 2 0 E 160 0 E 3 0 E 964 718 0 0December ....................... 68 68 E 2 0 E 161 0 E 3 0 E 1,091 813 0 0Average ......................... 49 48 1 0 b 164 0 2 0 b 1,070 791 0 0
1975January ........................... E 94 86 E 2 0 E 241 0 E 13 0 E 959 690 0 0February ......................... E 65 60 E 1 0 E 199 0 E 11 0 E 883 635 0 0March .............................. E 40 36 E 1 0 E 152 0 E 8 0 E 711 511 0 0April ................................ 95 90 3 0 169 0 6 0 704 458 0 0May ................................. 92 92 0 0 122 0 11 0 574 394 0 0June ................................ 53 53 2 0 130 0 0 0 873 647 0 0July ................................. 90 86 4 0 178 0 1 0 889 632 0 0August ............................ 114 114 7 0 136 0 0 0 888 657 0 0September ...................... 87 87 12 0 144 0 7 0 918 645 0 0October ........................... 68 56 6 0 136 0 7 0 946 674 0 0November ....................... 33 33 16 0 89 0 0 0 893 630 0 0December ....................... 62 62 7 0 120 0 0 0 907 637 0 0Average ......................... b 75 71 5 0 b 152 0 5 0 b 846 600 0 0
1976January ........................... 33 33 0 0 137 0 0 0 682 423 0 0February ......................... 9 0 0 0 128 0 0 0 645 345 0 0March .............................. 0 0 0 0 90 0 0 0 590 382 0 0April ................................ 11 0 0 0 132 0 0 0 578 352 0 0May ................................. 6 0 0 0 95 0 0 0 615 412 0 0June ................................ 46 46 0 0 104 0 0 0 653 432 0 0July ................................. 5 0 7 0 113 0 0 0 582 352 0 0August ............................ 6 0 11 0 99 0 0 0 581 376 0 0September ...................... 8 0 0 0 143 0 0 0 565 383 0 0October ........................... 8 0 1 0 78 0 0 0 562 373 0 0November ....................... 0 0 0 0 140 0 0 0 562 312 0 0December ....................... 8 0 1 0 142 0 0 0 578 304 0 0Average ......................... 12 7 2 0 b 118 0 0 0 599 371 0 0
1977January ........................... 15 0 12 0 170 0 0 0 515 269 0 0February ......................... 28 28 (s) 0 303 0 0 0 607 282 0 0March .............................. 0 0 6 0 206 0 0 0 565 302 0 0April ................................ 8 0 9 0 141 0 0 0 507 313 0 0May ................................. 8 0 0 0 139 0 0 0 438 248 0 0June ................................ 36 28 0 0 138 0 0 0 494 268 0 0July ................................. 8 0 0 0 178 0 0 0 483 246 0 0August ............................ 29 22 2 0 169 0 0 0 502 262 0 0September ...................... 32 23 0 0 140 0 0 0 529 292 0 0October ........................... 24 24 5 0 122 0 0 0 481 271 0 0November ....................... 48 41 (s) 0 184 0 0 0 509 292 0 0December ....................... 47 39 1 0 167 0 0 0 580 303 0 0Average ......................... 24 17 3 0 171 0 0 0 517 279 0 0
See footnotes at end of table.
Energy Information Administration/Historical Monthly Energy Review 1973-1992 111

Table 3.3e Petroleum Imports, 1973-1992: Angola, Australia, Bahama Islands, Brazil, Canada, and China (Continued)
(Thousand Barrels per Day)
Non-OPECa
Angola Australia Bahama Islands Brazil Canada China
Total Crude Oil Total Crude Oil Total Crude Oil Total Crude Oil Total Crude Oil Total Crude Oil
1978January ........................... 45 38 0 0 168 0 0 0 474 239 0 0February ......................... 34 26 6 0 218 0 0 0 499 260 0 0March .............................. 21 13 1 0 212 0 0 0 435 257 0 0April ................................ 85 0 0 0 141 0 0 0 395 233 0 0May ................................. 8 0 3 0 194 0 0 0 390 207 0 0June ................................ 5 0 0 0 145 0 0 0 469 242 0 0July ................................. 11 0 5 0 166 0 0 0 532 238 0 0August ............................ 0 0 9 0 188 0 0 0 418 235 0 0September ...................... 11 0 0 0 120 0 0 0 427 227 0 0October ........................... 0 0 4 0 106 0 0 0 426 252 0 0November ....................... 0 0 38 0 154 0 0 0 481 277 0 0December ....................... 15 0 0 0 112 0 0 0 651 309 0 0Average ......................... b 20 6 5 0 160 0 0 0 b 467 248 0 0
1979January ........................... 17 6 33 0 159 0 0 0 564 268 15 15February ......................... 51 51 8 0 106 0 0 0 561 319 10 10March .............................. 25 16 11 0 94 0 0 0 616 311 25 25April ................................ 85 73 1 0 129 0 0 0 578 334 18 18May ................................. 24 18 0 0 135 0 0 0 557 249 0 0June ................................ 54 42 1 0 139 0 0 0 469 238 25 25July ................................. 71 71 2 0 200 0 0 0 490 220 0 0August ............................ 75 75 12 0 157 0 0 0 464 260 0 0September ...................... 24 24 1 0 149 0 0 0 464 228 20 20October ........................... 8 8 1 0 151 0 0 0 487 232 9 9November ....................... 42 42 1 0 169 0 0 0 583 292 15 15December ....................... 39 39 0 0 A 178 0 8 0 619 312 25 25Average ......................... 43 39 6 0 147 0 1 0 538 271 13 13
1980January ........................... 39 28 1 0 175 0 0 0 c 569 283 0 0February ......................... 67 59 0 0 111 0 0 0 540 260 0 0March .............................. 34 27 1 0 124 0 8 0 460 199 0 0April ................................ 75 63 1 0 56 0 0 0 459 222 0 0May ................................. 62 62 1 0 77 0 0 0 419 206 0 0June ................................ 32 32 1 0 77 0 0 0 409 186 0 0July ................................. 20 20 1 0 43 0 9 0 c 379 158 0 0August ............................ 33 22 2 0 62 0 0 0 319 160 0 0September ...................... 37 37 1 0 58 0 10 0 458 184 1 0October ........................... 45 45 1 0 70 0 12 12 475 157 0 0November ....................... 35 24 0 0 22 0 0 0 470 181 0 0December ....................... 22 22 0 0 54 0 0 0 502 201 0 0Average ......................... 42 37 1 0 78 0 3 1 455 199 (s) 0
1981January ........................... 57 46 3 0 39 0 14 14 543 199 5 0February ......................... 62 62 0 0 84 0 26 13 546 199 0 0March .............................. 23 23 8 0 74 0 13 12 472 176 17 0April ................................ 23 23 0 0 68 0 12 12 412 141 12 0May ................................. 51 45 11 0 122 0 13 12 365 130 12 0June ................................ 36 36 0 0 51 0 1 0 353 121 28 0July ................................. 34 34 (s) 0 77 0 46 42 382 132 22 0August ............................ 45 45 1 0 69 0 20 12 378 153 28 0September ...................... 81 72 (s) 0 111 0 23 13 423 164 27 0October ........................... 74 64 33 0 63 0 23 12 449 173 20 0November ....................... 26 17 0 0 63 0 14 13 547 184 21 0December ....................... 77 77 0 0 70 0 74 14 501 199 25 0Average ......................... 49 45 5 0 74 0 23 14 447 164 18 0
1982January ........................... 69 69 1 0 58 0 11 0 513 195 16 0February ......................... 40 40 (s) (s) 67 0 61 14 537 193 20 0March .............................. 20 20 (s) 0 43 0 25 11 437 168 21 0April ................................ 16 16 10 0 82 0 42 26 360 178 40 0May ................................. 31 31 0 0 77 0 31 15 419 188 38 0June ................................ 48 48 9 0 32 0 45 14 481 200 47 17July ................................. 73 73 12 0 64 0 38 14 536 249 83 36August ............................ 45 45 7 0 80 0 57 12 443 243 48 11September ...................... 65 56 (s) 0 92 0 48 13 493 244 34 0October ........................... 68 60 11 0 45 0 84 54 459 214 48 10November ....................... 44 44 (s) 0 51 0 93 40 553 244 63 20December ....................... 13 0 9 0 88 0 32 12 561 248 24 0Average ......................... 44 42 5 (s) 65 0 47 19 482 214 40 8
See footnotes at end of table.
Energy Information Administration/Historical Monthly Energy Review 1973-1992112

Table 3.3e Petroleum Imports, 1973-1992: Angola, Australia, Bahama Islands, Brazil, Canada, and China (Continued)
(Thousand Barrels per Day)
Non-OPECa
Angola Australia Bahama Islands Brazil Canada China
Total Crude Oil Total Crude Oil Total Crude Oil Total Crude Oil Total Crude Oil Total Crude Oil
1983January ........................... 54 54 3 0 68 0 43 12 534 271 24 0February ......................... 23 12 9 0 92 0 28 0 586 229 25 0March .............................. 67 67 (s) 0 86 0 47 0 488 247 33 0April ................................ 102 102 (s) 0 174 0 31 0 454 246 30 0May ................................. 81 70 8 0 135 0 67 0 518 226 42 0June ................................ 86 75 (s) 0 137 0 29 8 586 286 35 0July ................................. 112 103 0 0 69 0 43 0 634 330 32 0August ............................ 90 71 9 0 144 0 54 0 542 301 26 0September ...................... 106 97 1 0 148 0 69 0 533 271 26 0October ........................... 46 36 0 0 171 0 8 0 532 279 81 50November ....................... 91 91 0 0 148 0 24 0 556 304 16 0December ....................... 77 67 18 0 127 0 45 0 604 299 33 18Average ......................... 78 71 4 0 125 0 41 2 547 274 34 6
1984January ........................... 84 84 18 0 159 0 41 0 635 293 47 20February ......................... 60 51 25 23 156 0 28 0 620 297 18 (s)March .............................. 125 116 10 0 90 0 61 0 694 357 36 1April ................................ 93 93 23 20 95 0 60 (s) 705 429 40 12May ................................. 63 63 36 30 31 0 46 0 722 377 39 0June ................................ 116 116 29 20 52 0 93 0 506 274 51 21July ................................. 68 68 51 25 14 0 62 0 577 291 60 22August ............................ 119 111 17 0 57 0 53 0 547 298 59 20September ...................... 91 91 5 0 98 0 56 0 550 319 57 11October ........................... 116 105 83 71 151 0 62 (s) 682 377 65 31November ....................... 86 63 77 58 88 0 76 0 640 376 40 21December ....................... 60 60 75 53 75 0 86 0 675 398 39 24Average ......................... 90 85 38 25 88 0 60 (s) 630 341 46 15
1985January ........................... 39 39 41 23 92 0 65 0 616 342 29 19February ......................... 108 83 41 24 37 0 56 0 730 438 24 0March .............................. 73 73 24 0 36 0 36 0 909 545 36 0April ................................ 140 140 23 8 4 0 68 0 890 556 79 48May ................................. 115 105 53 39 74 0 51 0 823 506 60 36June ................................ 120 120 67 54 24 0 68 0 720 455 22 12July ................................. 122 122 20 0 38 0 44 0 610 385 62 46August ............................ 121 121 13 0 11 0 105 0 664 408 71 45September ...................... 116 105 43 34 47 0 60 0 783 518 75 47October ........................... 95 83 26 22 35 0 62 0 825 480 35 24November ....................... 134 134 53 34 22 0 78 0 766 443 100 66December ....................... 135 123 36 13 54 0 37 0 902 540 111 82Average ......................... 110 104 37 21 40 0 61 0 770 468 59 36
1986January ........................... 66 55 25 15 62 0 23 0 823 501 67 43February ......................... 102 87 31 29 33 0 35 0 690 479 85 67March .............................. 48 48 33 21 18 0 49 0 750 515 109 94April ................................ 89 89 17 16 34 0 50 0 798 581 82 49May ................................. 162 151 13 10 32 0 33 0 881 674 124 76June ................................ 90 78 25 0 29 0 56 0 753 576 75 52July ................................. 81 81 33 21 44 0 40 0 763 562 112 99August ............................ 120 102 6 0 39 0 52 0 801 571 82 62September ...................... 198 187 30 22 15 0 75 0 801 573 107 79October ........................... 99 70 52 37 38 0 74 0 842 592 65 47November ....................... 134 134 83 70 39 0 70 0 960 633 87 73December ....................... 156 138 146 120 57 0 43 0 809 581 89 72Average ......................... 112 102 41 30 37 0 50 0 807 570 90 68
1987January ........................... 89 76 124 108 59 0 54 0 799 562 102 86February ......................... 108 84 11 0 56 0 76 0 783 547 60 51March .............................. 202 190 70 69 43 0 67 0 738 526 38 23April ................................ 170 158 31 27 43 0 92 0 818 614 65 46May ................................. 138 126 77 51 31 0 77 0 884 673 86 70June ................................ 193 180 24 20 22 0 62 0 912 680 116 103July ................................. 247 236 28 28 46 0 93 0 901 672 102 70August ............................ 263 250 84 74 27 0 104 0 841 613 93 70September ...................... 195 184 138 115 48 0 113 0 846 609 85 47October ........................... 133 123 18 13 26 0 72 0 938 638 87 63November ....................... 288 281 34 33 31 0 106 0 827 574 93 75December ....................... 276 265 54 47 10 0 92 0 883 585 59 49Average ......................... 192 180 58 49 37 0 84 0 848 608 82 63
See footnotes at end of table.
Energy Information Administration/Historical Monthly Energy Review 1973-1992 113

Table 3.3e Petroleum Imports, 1973-1992: Angola, Australia, Bahama Islands, Brazil, Canada, and China (Continued)
(Thousand Barrels per Day)
Non-OPECa
Angola Australia Bahama Islands Brazil Canada China
Total Crude Oil Total Crude Oil Total Crude Oil Total Crude Oil Total Crude Oil Total Crude Oil
1988January ........................... 204 193 111 111 51 0 108 0 959 633 104 104February ......................... 162 149 77 75 79 0 106 0 1,033 679 121 111March .............................. 209 187 77 71 47 0 77 0 1,002 666 50 49April ................................ 194 194 36 28 26 0 114 0 985 703 94 87May ................................. 285 274 69 60 24 0 88 0 1,001 705 92 85June ................................ 158 148 64 64 15 0 107 0 1,032 744 94 85July ................................. 258 258 61 53 15 0 109 0 972 688 85 70August ............................ 214 214 66 66 12 0 105 0 1,009 708 64 64September ...................... 249 237 85 78 37 0 94 0 936 626 81 64October ........................... 256 254 28 28 13 0 127 0 996 654 120 120November ....................... 212 191 83 79 27 0 70 0 1,080 707 54 54December ....................... 134 134 7 0 40 0 74 0 990 655 96 96Average ......................... 212 203 64 59 32 0 98 0 999 681 88 82
1989January ........................... 160 160 19 19 53 0 93 0 1,065 696 38 38February ......................... 249 237 32 27 24 0 131 0 1,007 639 32 26March .............................. 295 285 16 0 41 0 119 0 961 633 25 24April ................................ 256 256 43 41 55 0 76 0 877 599 97 83May ................................. 294 294 12 12 29 0 65 0 901 647 125 119June ................................ 256 245 31 31 28 0 92 0 921 673 66 60July ................................. 305 305 20 20 32 0 80 0 849 596 150 135August ............................ 317 306 39 30 19 0 67 0 911 616 68 67September ...................... 321 321 59 45 8 0 73 0 949 668 87 87October ........................... 335 335 58 53 44 0 66 0 857 590 85 84November ....................... 378 368 76 76 41 0 86 0 911 594 94 94December ....................... 238 238 23 16 29 0 39 0 973 613 90 90Average ......................... 284 279 36 31 34 0 82 0 931 630 80 76
1990January ........................... 262 262 41 41 80 0 48 0 982 605 121 121February ......................... 346 346 58 55 78 0 45 0 946 585 53 51March .............................. 296 296 41 41 35 0 8 0 850 583 83 83April ................................ 281 281 25 20 51 0 40 0 925 617 80 74May ................................. 235 235 69 69 29 0 114 0 981 654 66 65June ................................ 260 260 44 44 36 0 82 0 942 699 49 43July ................................. 303 303 126 101 25 0 93 0 899 659 132 122August ............................ 134 134 56 33 40 0 45 0 952 676 79 77September ...................... 135 123 57 45 45 0 8 0 924 632 47 42October ........................... 139 139 31 31 9 0 12 0 917 636 85 85November ....................... 238 238 28 28 0 0 74 0 902 645 113 113December ....................... 224 224 64 60 13 0 16 0 987 713 47 47Average ......................... 237 236 53 47 37 0 49 0 934 643 80 77
1991January ........................... 232 232 21 21 25 0 31 0 978 718 68 63February ......................... 202 202 0 0 14 0 13 0 1,135 881 102 96March .............................. 186 186 0 0 0 0 0 0 1,058 764 96 96April ................................ 337 337 55 55 35 0 17 0 1,103 768 113 113May ................................. 220 220 64 57 42 0 31 0 1,027 752 119 113June ................................ 205 205 43 31 30 0 41 0 986 705 144 139July ................................. 264 264 20 20 19 0 21 0 848 615 88 88August ............................ 298 298 37 22 78 0 27 0 1,011 694 85 75September ...................... 230 230 24 24 29 0 19 0 1,137 849 91 86October ........................... 300 300 13 0 51 0 16 0 936 639 29 24November ....................... 213 213 25 13 46 0 45 0 1,107 796 96 96December ....................... 359 359 13 13 53 0 8 0 1,083 759 65 65Average ......................... 254 254 26 21 35 0 22 0 1,033 743 91 87
1992January ........................... 360 360 11 11 63 0 18 0 1,045 786 144 144February ......................... 246 246 10 10 47 0 12 0 1,147 834 80 69March .............................. 339 339 0 0 76 0 (s) 0 1,100 832 75 75April ................................ 381 381 39 22 67 0 17 0 1,121 835 86 69May ................................. 264 264 0 0 46 0 18 0 1,013 779 129 114June ................................ 286 286 21 21 57 0 28 0 970 736 110 95July ................................. 443 443 20 20 22 0 25 0 1,044 798 68 64August ............................ 335 323 21 21 8 0 10 0 1,038 762 66 66September ...................... 248 248 0 0 8 0 21 0 1,131 839 80 75October ........................... 395 395 11 11 1 0 10 0 1,063 761 61 61November ....................... 458 458 53 49 20 0 32 0 1,037 784 86 86December ....................... 279 279 38 38 19 0 50 0 1,122 816 97 90Average ......................... 336 336 19 17 36 0 20 0 1,069 797 90 84
a Includes petroleum imported into the United States indirectly frommembers of the Organization of Petroleum Exporting Countries (OPEC),primarily from Caribbean and West European areas, as petroleum productsthat were refined from crude oil produced by OPEC.
b The annual value is not an average of the monthly values. See Note 6 atend of section.
c See Note 7 at end of section.
E=Estimate; see Note 6 at end of section. A=Adjusted data; see Note 6 atend of section. (s)=Less than 500 barrels per day.
Notes: • Beginning in October 1977, Strategic Petroleum Reserve importsare included. • U.S. geographic coverage is the 50 States and the District ofColumbia.
Sources: See end of section.
Energy Information Administration/Historical Monthly Energy Review 1973-1992114

Table 3.3f Petroleum Imports, 1973-1992: Colombia, Italy, Malaysia, Mexico, and Netherlands
(Thousand Barrels per Day)
Non-OPECa
Colombia Italy Malaysia Mexico Netherlands
Total Crude Oil Total Crude Oil Total Crude Oil Total Crude Oil Total Crude Oil
1973January ....................................... E 30 9 E 97 0 E 0 0 E 17 0 E 75 0February ..................................... E 0 0 E 129 0 E 57 8 E 22 0 E 99 0March .......................................... E 25 7 E 121 0 E 0 0 E 21 0 E 93 0April ............................................ E 4 0 E 114 0 E 7 0 E 54 8 E 11 0May ............................................. E 4 0 E 111 0 E 7 0 E 0 0 E 11 0June ............................................ E 4 0 E 115 0 E 7 0 E 0 0 E 11 0July ............................................. E 4 0 E 122 0 E 10 0 E 0 0 E 27 0August ........................................ E 4 0 E 140 0 E 11 0 E 0 0 E 32 0September .................................. E 4 0 E 138 0 E 11 0 E 21 8 E 31 0October ....................................... E 0 0 E 110 0 E 15 0 E 49 (s) E 67 0November ................................... E 0 0 E 142 0 E 19 0 E 0 0 E 87 0December ................................... E 26 9 E 134 0 E 18 0 E 0 0 E 82 0Average ..................................... 9 2 b 125 0 b 12 1 b 16 1 b 53 0
1974January ....................................... E 3 0 E 106 0 E 17 0 E 17 0 E 76 0February ..................................... E 3 0 E 109 0 E 18 0 E 17 0 E 78 0March .......................................... E 3 0 E 92 0 E 15 0 E 15 0 E 66 0April ............................................ E 11 0 E 89 0 E 11 0 E 2 0 E 50 0May ............................................. E 10 0 E 87 0 E 11 0 E 2 0 E 49 0June ............................................ E 9 0 E 78 0 E 10 0 E 2 0 E 44 0July ............................................. E 6 0 E 64 0 E 7 0 E 6 0 E 21 0August ........................................ E 6 0 E 64 0 E 7 0 E 6 0 E 21 0September .................................. E 5 0 E 56 0 E 6 0 E 5 0 E 19 0October ....................................... E (s) 0 E 37 0 E 17 7 E 0 0 E 27 0November ................................... E 1 0 E 48 0 E 15 6 E 23 15 E 34 0December ................................... E 1 0 E 48 0 E 8 3 E 7 5 E 35 0Average ..................................... 5 0 b 74 0 12 1 8 2 43 0
1975January ....................................... E 14 0 E 33 0 E 8 4 E 17 16 E 12 0February ..................................... E 11 0 E 27 0 E 19 8 E 48 46 E 10 0March .......................................... E 9 0 E 21 0 E 22 9 E 39 38 E 8 0April ............................................ 5 0 10 0 7 7 37 37 22 17May ............................................. 7 0 2 0 4 4 86 82 (s) 0June ............................................ 12 0 11 0 4 4 72 72 0 0July ............................................. 8 0 14 0 4 4 85 85 18 0August ........................................ (s) 0 33 0 4 4 71 71 9 0September .................................. 9 0 73 0 12 4 98 98 19 0October ....................................... 16 0 49 0 4 4 105 105 59 17November ................................... 14 0 16 0 7 7 107 107 49 16December ................................... 3 0 21 0 7 7 85 85 16 0Average ..................................... 9 0 b 27 0 8 5 71 70 b 19 4
1976January ....................................... 13 0 36 0 0 0 59 59 1 0February ..................................... 15 0 16 0 0 0 70 70 10 0March .......................................... 8 0 24 0 20 20 108 108 19 0April ............................................ 15 4 47 0 7 7 112 106 20 0May ............................................. 25 0 45 0 8 8 89 89 1 0June ............................................ 14 0 81 0 8 8 80 79 7 0July ............................................. 52 36 53 0 7 7 79 79 11 0August ........................................ 25 9 28 0 16 16 88 88 8 0September .................................. 28 15 61 0 29 29 85 84 8 0October ....................................... 11 0 11 0 32 24 79 79 2 0November ................................... 19 0 17 0 41 41 132 132 0 0December ................................... 24 2 33 0 49 34 66 65 3 0Average ..................................... 21 6 b 39 0 18 16 87 87 8 0
1977January ....................................... 18 0 27 0 63 54 98 98 30 0February ..................................... 14 0 63 0 82 71 168 165 109 0March .......................................... 0 0 128 0 52 44 172 171 80 0April ............................................ 15 0 95 0 76 61 155 145 34 0May ............................................. 15 0 52 0 103 75 174 174 15 11June ............................................ 14 0 47 0 63 60 181 169 8 0July ............................................. 19 0 51 0 40 39 159 159 23 9August ........................................ 17 0 37 0 83 69 215 215 41 9September .................................. 27 0 43 0 57 48 168 168 23 21October ....................................... 6 0 20 0 52 39 247 247 5 0November ................................... 25 0 34 0 64 64 231 231 1 0December ................................... 32 0 20 0 56 43 187 187 6 0Average ..................................... 17 0 51 0 66 55 179 177 31 4
See footnotes at end of table.
Energy Information Administration/Historical Monthly Energy Review 1973-1992 115

Table 3.3f Petroleum Imports, 1973-1992: Colombia, Italy, Malaysia, Mexico, and Netherlands (Continued)
(Thousand Barrels per Day)
Non-OPECa
Colombia Italy Malaysia Mexico Netherlands
Total Crude Oil Total Crude Oil Total Crude Oil Total Crude Oil Total Crude Oil
1978January ....................................... 26 0 24 0 36 36 236 236 1 0February ..................................... 14 0 9 0 46 31 211 204 0 0March .......................................... 33 0 18 0 40 40 231 231 (s) 0April ............................................ 34 0 41 0 38 23 231 226 (s) 0May ............................................. 26 0 56 0 31 25 258 258 0 0June ............................................ 20 0 34 0 50 42 287 287 (s) 0July ............................................. 20 0 38 0 56 53 309 309 0 0August ........................................ 4 0 34 0 36 33 393 393 13 0September .................................. 13 0 85 0 45 43 461 461 0 12October ....................................... 29 0 40 0 35 30 392 392 22 15November ................................... 23 0 54 0 52 51 402 402 5 0December ................................... 12 0 16 0 43 41 396 390 0 0Average ..................................... b 20 0 b 38 0 42 37 318 316 b 5 2
1979January ....................................... 14 0 50 0 92 53 595 595 13 10February ..................................... 0 0 15 0 70 43 415 415 78 68March .......................................... 29 0 52 0 86 77 397 397 28 0April ............................................ 34 0 24 0 35 29 302 300 1 0May ............................................. 15 0 29 0 69 57 403 403 1 0June ............................................ 17 0 53 0 57 48 458 455 17 4July ............................................. 23 0 29 0 79 75 407 404 32 0August ........................................ 28 0 2 0 46 33 439 437 10 0September .................................. 9 0 9 0 65 53 431 431 3 0October ....................................... 29 0 6 0 65 49 531 526 14 0November ................................... 7 0 17 0 67 57 429 426 27 0December ................................... 15 0 51 0 56 47 454 451 30 11Average ..................................... 18 0 b 30 0 66 52 439 437 b 23 7
1980January ....................................... 0 0 7 0 62 50 545 535 1 0February ..................................... 0 0 22 0 87 76 477 447 (s) 0March .......................................... 0 0 13 0 66 52 460 458 (s) 0April ............................................ 0 0 11 0 102 83 546 542 0 0May ............................................. 0 0 1 0 63 51 576 547 0 0June ............................................ 0 0 0 0 67 58 627 579 0 0July ............................................. 0 0 0 0 46 40 460 454 0 0August ........................................ 0 0 0 0 96 90 646 578 0 0September .................................. 24 0 0 0 76 68 550 512 11 0October ....................................... 16 0 0 0 53 50 605 604 7 0November ................................... 7 0 0 0 78 69 459 443 1 1December ................................... 0 0 0 0 52 45 445 382 0 0Average ..................................... 4 0 4 0 70 61 533 507 2 (s)
1981January ....................................... 13 0 17 0 52 46 401 378 12 0February ..................................... 0 0 14 0 35 32 437 419 14 0March .......................................... 3 0 0 0 20 17 488 470 44 0April ............................................ 0 0 13 0 53 48 418 398 53 (s)May ............................................. 0 0 (s) 0 32 29 522 490 37 0June ............................................ (s) 0 15 0 82 82 538 496 76 0July ............................................. 0 0 10 0 45 45 384 342 46 0August ........................................ 0 0 9 0 25 25 489 397 12 0September .................................. 0 0 11 0 19 15 708 562 22 0October ....................................... 0 0 24 0 41 37 669 591 (s) 0November ................................... 0 0 15 0 10 10 628 583 15 0December ................................... 0 0 7 0 18 14 587 509 27 0Average ..................................... 1 0 11 0 36 33 522 469 30 (s)
1982January ....................................... 0 0 9 0 27 27 425 355 16 0February ..................................... 0 0 17 0 17 17 476 383 12 0March .......................................... 0 0 15 0 46 46 503 475 38 (s)April ............................................ 12 0 51 0 18 18 476 425 31 (s)May ............................................. 11 0 8 0 13 10 766 755 26 0June ............................................ 0 0 15 0 22 21 797 739 18 0July ............................................. 0 0 3 0 63 63 783 744 32 0August ........................................ 9 0 16 (s) 13 13 853 831 55 0September .................................. 0 0 16 0 0 0 897 817 31 (s)October ....................................... 11 0 15 0 0 0 682 669 58 0November ................................... 22 0 40 0 0 0 860 836 49 0December ................................... 0 0 10 0 20 0 689 688 49 0Average ..................................... 5 0 18 (s) 20 18 685 645 35 (s)
See footnotes at end of table.
Energy Information Administration/Historical Monthly Energy Review 1973-1992116

Table 3.3f Petroleum Imports, 1973-1992: Colombia, Italy, Malaysia, Mexico, and Netherlands (Continued)
(Thousand Barrels per Day)
Non-OPECa
Colombia Italy Malaysia Mexico Netherlands
Total Crude Oil Total Crude Oil Total Crude Oil Total Crude Oil Total Crude Oil
1983January ....................................... (s) 0 2 0 21 15 849 782 67 33February ..................................... 0 0 7 0 0 0 722 663 18 0March .......................................... 0 0 3 0 0 0 775 758 39 0April ............................................ 9 0 16 0 0 0 981 950 77 0May ............................................. 1 0 17 0 0 0 944 911 52 0June ............................................ 11 0 19 (s) (s) 0 830 786 76 0July ............................................. 30 0 26 0 4 0 849 810 71 0August ........................................ 1 0 16 0 15 15 906 841 94 0September .................................. 21 0 20 0 5 0 849 776 97 0October ....................................... 11 0 24 0 3 0 771 696 108 0November ................................... 21 0 35 0 0 0 726 645 44 (s)December ................................... 18 0 30 (s) 0 0 710 572 38 0Average ..................................... 10 0 18 (s) 4 3 826 766 65 3
1984January ....................................... 1 0 48 0 4 0 710 633 22 0February ..................................... 26 0 85 0 0 0 748 655 241 19March .......................................... 11 0 52 (s) 3 0 716 657 79 16April ............................................ 0 0 35 (s) 1 0 869 778 54 0May ............................................. 11 0 50 0 (s) 0 676 618 39 0June ............................................ 5 0 41 0 5 0 754 667 44 (s)July ............................................. 32 0 28 0 0 0 740 658 67 0August ........................................ 0 0 41 0 0 0 640 576 20 0September .................................. 0 0 41 (s) 0 0 780 690 18 (s)October ....................................... (s) 0 47 0 0 0 827 694 71 0November ................................... 0 0 19 0 0 0 841 685 75 (s)December ................................... 6 0 51 (s) 0 0 686 596 52 0Average ..................................... 8 0 45 (s) 1 0 748 659 65 3
1985January ....................................... 8 0 20 (s) 0 0 767 679 26 0February ..................................... 8 0 50 0 0 0 652 520 47 0March .......................................... 9 0 76 0 0 0 923 767 111 0April ............................................ 16 0 69 0 0 0 950 833 93 0May ............................................. 45 0 77 0 15 0 929 831 52 0June ............................................ 37 0 65 0 0 0 726 553 70 0July ............................................. 8 0 53 0 1 0 814 706 54 0August ........................................ 21 0 46 0 3 0 859 752 31 0September .................................. 43 0 38 0 8 0 852 823 40 0October ....................................... 12 0 84 0 10 10 745 669 51 0November ................................... 27 0 69 0 0 0 887 806 40 0December ................................... 36 0 76 0 0 0 676 630 82 0Average ..................................... 23 0 60 (s) 3 1 816 715 58 0
1986January ....................................... 10 0 74 0 21 20 681 595 44 0February ..................................... 23 0 78 0 20 20 557 477 68 0March .......................................... 16 0 106 0 0 0 616 524 28 0April ............................................ 43 14 61 0 27 22 694 597 18 0May ............................................. 122 81 106 0 8 8 743 679 106 0June ............................................ 126 104 63 0 8 8 884 816 82 0July ............................................. 114 97 87 0 0 0 850 760 60 0August ........................................ 119 67 70 0 13 13 738 653 36 0September .................................. 102 62 83 0 0 0 615 561 49 0October ....................................... 99 65 49 0 45 37 680 589 55 0November ................................... 125 105 57 0 0 0 565 513 34 0December ................................... 141 83 75 0 0 0 746 670 67 0Average ..................................... 87 57 76 0 12 11 699 621 54 0
1987January ....................................... 176 115 60 0 21 21 689 620 95 0February ..................................... 119 107 34 0 0 0 692 602 34 0March .......................................... 131 82 61 0 30 30 721 658 69 0April ............................................ 156 112 11 0 0 0 679 627 72 0May ............................................. 102 74 52 0 4 0 541 517 9 0June ............................................ 144 95 40 7 0 0 664 620 49 0July ............................................. 137 101 62 0 11 11 680 611 81 0August ........................................ 179 143 68 0 0 0 577 539 20 0September .................................. 157 99 33 0 22 22 705 660 43 0October ....................................... 140 140 67 0 9 9 697 623 42 0November ................................... 194 164 60 0 16 16 627 591 137 0December ................................... 142 142 96 0 36 36 591 552 75 0Average ..................................... 148 115 54 1 13 12 655 602 60 0
See footnotes at end of table.
Energy Information Administration/Historical Monthly Energy Review 1973-1992 117

Table 3.3f Petroleum Imports, 1973-1992: Colombia, Italy, Malaysia, Mexico, and Netherlands (Continued)
(Thousand Barrels per Day)
Non-OPECa
Colombia Italy Malaysia Mexico Netherlands
Total Crude Oil Total Crude Oil Total Crude Oil Total Crude Oil Total Crude Oil
1988January ....................................... 168 137 111 9 31 27 808 729 96 0February ..................................... 67 0 61 0 10 10 710 620 82 0March .......................................... 203 160 111 20 0 0 745 709 66 0April ............................................ 155 145 72 12 9 9 678 575 5 0May ............................................. 135 119 53 0 0 0 722 662 49 0June ............................................ 37 33 41 11 21 21 766 726 53 0July ............................................. 105 74 49 0 20 20 723 655 105 0August ........................................ 79 50 38 0 18 18 704 615 58 0September .................................. 151 125 51 0 11 9 843 746 11 0October ....................................... 160 132 61 10 19 19 743 670 40 0November ................................... 145 113 61 0 76 76 811 723 77 0December ................................... 201 169 69 0 17 17 711 653 87 0Average ..................................... 134 106 65 5 19 19 747 674 61 0
1989January ....................................... 261 204 19 0 62 62 809 748 57 0February ..................................... 146 105 77 12 10 10 756 706 153 0March .......................................... 185 146 59 0 15 15 667 621 30 0April ............................................ 168 140 9 0 47 47 1,002 941 48 0May ............................................. 122 68 26 10 22 22 808 764 31 0June ............................................ 139 113 33 0 110 110 688 639 46 0July ............................................. 108 71 1 0 16 16 758 708 34 0August ........................................ 191 159 30 14 13 13 806 765 32 0September .................................. 163 146 22 0 10 10 721 659 54 0October ....................................... 147 116 74 0 28 28 837 760 43 0November ................................... 227 188 42 0 97 97 743 715 33 0December ................................... 199 173 19 0 33 33 610 566 37 0Average ..................................... 172 136 34 3 39 39 767 716 49 0
1990January ....................................... 188 146 124 0 14 14 776 691 129 0February ..................................... 203 168 76 0 42 38 725 669 80 0March .......................................... 177 146 47 0 28 28 815 757 21 0April ............................................ 198 143 53 0 38 38 466 414 47 0May ............................................. 220 175 101 10 0 0 788 688 63 0June ............................................ 180 117 95 0 9 9 912 815 92 0July ............................................. 169 111 56 11 20 20 706 651 54 0August ........................................ 203 132 43 0 142 142 773 676 39 0September .................................. 97 84 38 0 105 105 871 807 20 0October ....................................... 183 159 21 0 78 78 828 793 37 0November ................................... 209 177 32 0 8 8 761 706 49 0December ................................... 161 121 13 0 6 6 637 595 28 0Average ..................................... 182 140 58 2 41 40 755 689 55 0
1991January ....................................... 194 174 25 0 0 0 798 778 6 0February ..................................... 151 98 42 13 9 9 742 693 17 0March .......................................... 157 127 29 0 21 21 795 772 33 0April ............................................ 163 131 41 12 0 0 891 819 35 0May ............................................. 163 112 60 0 66 66 757 736 45 0June ............................................ 169 124 46 0 63 63 919 872 49 0July ............................................. 163 111 54 0 9 9 835 748 47 0August ........................................ 219 162 57 11 14 14 878 797 30 0September .................................. 168 103 89 0 10 10 805 768 44 0October ....................................... 128 80 41 0 64 64 811 754 16 0November ................................... 145 135 15 0 10 10 716 656 24 0December ................................... 138 117 61 0 14 14 732 708 4 0Average ..................................... 163 123 47 3 24 24 807 759 29 0
1992January ....................................... 158 111 51 0 0 0 764 721 31 0February ..................................... 114 92 48 0 0 0 838 807 9 0March .......................................... 101 74 44 0 0 0 846 809 34 0April ............................................ 150 129 75 0 0 0 857 795 8 0May ............................................. 57 46 57 0 5 5 788 764 27 0June ............................................ 135 114 69 0 8 8 905 883 25 0July ............................................. 103 93 36 0 40 40 830 788 21 0August ........................................ 156 142 94 0 22 22 857 790 45 0September .................................. 190 179 81 0 17 17 755 720 39 0October ....................................... 153 132 37 0 17 17 829 783 18 0November ................................... 127 84 33 0 8 8 762 700 26 0December ................................... 66 34 37 0 4 4 930 888 33 0Average ..................................... 126 102 55 0 10 10 830 787 26 0
a Includes petroleum imported into the United States indirectly frommembers of the Organization of Petroleum Exporting Countries (OPEC),primarily from Caribbean and West European areas, as petroleum productsthat were refined from crude oil produced by OPEC.
b The annual value is not an average of the monthly values. See Note 6 atend of section.
E=Estimate; see Note 6 at end of section. (s)=Less than 500 barrels perday.
Notes: • Beginning in October 1977, Strategic Petroleum Reserve importsare included. • U.S. geographic coverage is the 50 States and the District ofColumbia.
Sources: See end of section.
Energy Information Administration/Historical Monthly Energy Review 1973-1992118

Table 3.3g Petroleum Imports, 1973-1992: Netherlands Antilles, Norway, Puerto Rico, Russia, Spain, and Trinidad and Tobago
(Thousand Barrels per Day)
Non-OPECa
Netherlands Antilles Norway Puerto Rico Russiab Spain Trinidad and Tobago
Total Crude Oil Total Crude Oil Total Crude Oil Total Crude Oil Total Crude Oil Total Crude Oil
1973January ....................... E 519 0 0 0 E 103 0 E 19 0 E 37 0 E 253 57February ..................... E 688 0 0 0 E 136 0 E 25 0 E 50 0 E 192 43March .......................... E 647 0 0 0 E 128 0 E 23 0 E 47 0 E 355 80April ............................ E 566 0 E 1 0 E 79 0 E 25 0 E 24 0 E 236 60May ............................. E 549 0 E 1 0 E 76 0 E 24 0 E 23 0 E 247 63June ............................ E 568 0 E 1 0 E 79 0 E 25 0 E 24 0 E 249 64July ............................. E 483 0 0 0 E 81 0 E 18 0 E 18 0 E 151 31August ........................ E 554 0 0 0 E 93 0 E 21 0 E 21 0 E 319 66September .................. E 546 0 0 0 E 91 0 E 21 0 E 20 0 E 292 60October ....................... E 506 0 E 2 0 E 94 0 E 29 0 E 8 0 E 240 64November ................... E 654 0 E 3 0 E 122 0 E 38 0 E 10 0 E 222 59December ................... E 616 0 E 3 0 E 115 0 E 35 0 E 9 0 E 245 65Average ..................... c 585 0 1 0 c 99 0 c 26 0 c 26 0 c 255 60
1974January ....................... E 621 0 0 0 E 85 0 E 26 0 E 5 0 E 226 34February ..................... E 639 0 0 0 E 88 0 E 27 0 E 5 0 E 204 30March .......................... E 541 0 0 0 E 74 0 E 22 0 E 5 0 E 177 26April ............................ E 546 0 0 0 E 103 0 E 8 0 E 27 0 E 248 66May ............................. E 535 0 0 0 E 101 0 E 8 0 E 26 0 E 278 74June ............................ E 483 0 11 11 E 91 0 E 7 0 E 24 0 E 269 72July ............................. E 457 0 0 0 E 111 0 E 5 0 E 6 0 E 256 79August ........................ E 456 0 0 0 E 111 0 E 5 0 E 6 0 E 325 100September .................. E 397 0 0 0 E 97 0 E 4 0 E 5 0 E 205 63October ....................... E 401 0 0 0 E 62 0 E 31 0 E 8 0 E 185 55November ................... E 519 0 0 0 E 81 0 E 40 0 E 11 0 E 251 74December ................... E 521 0 0 0 E 81 0 E 40 0 E 11 0 E 274 81Average ..................... c 511 0 1 1 90 0 c 20 0 12 0 c 251 63
1975January ....................... E 469 0 0 0 E 157 0 E 18 0 E 3 0 E 206 80February ..................... E 387 0 0 0 E 130 0 E 15 0 E 3 0 E 215 83March .......................... E 295 0 15 15 E 99 0 E 11 0 E 2 0 E 249 97April ............................ 238 0 10 10 78 0 0 0 0 0 172 140May ............................. 243 0 23 19 78 0 7 0 (s) 0 237 128June ............................ 262 0 0 0 75 0 17 0 0 0 204 126July ............................. 368 0 0 0 105 0 23 0 0 0 281 135August ........................ 333 0 14 14 73 0 1 0 0 0 289 109September .................. 429 0 40 35 67 0 20 0 0 0 283 121October ....................... 358 0 47 38 106 0 37 0 0 0 222 122November ................... 280 0 31 20 61 0 25 0 0 0 266 126December ................... 238 0 18 0 51 0 17 0 0 0 262 116Average ..................... c 332 0 17 12 90 0 c 14 0 1 0 c 242 115
1976January ....................... 314 0 13 13 71 0 0 0 0 0 349 154February ..................... 262 0 7 7 122 0 0 0 0 0 326 135March .......................... 329 0 54 49 114 0 15 0 0 0 316 110April ............................ 275 0 23 23 68 0 8 0 0 0 292 136May ............................. 214 0 30 30 71 0 8 (s) 0 0 258 137June ............................ 190 0 28 28 54 0 14 0 0 0 319 148July ............................. 259 0 39 39 78 0 14 0 0 0 273 105August ........................ 269 0 83 79 81 0 17 10 6 0 164 20September .................. 273 0 66 66 104 0 11 0 0 0 183 17October ....................... 239 0 47 47 92 0 18 11 0 0 215 92November ................... 268 0 27 27 104 0 14 0 0 0 254 61December ................... 400 0 12 12 99 0 7 0 8 0 324 135Average ..................... 275 0 36 35 88 0 11 2 1 0 c 274 104
1977January ....................... 302 0 5 0 83 0 0 0 14 0 327 126February ..................... 374 0 106 106 86 0 26 12 14 0 413 137March .......................... A 256 0 73 62 97 0 16 11 41 0 301 127April ............................ 111 0 35 35 85 0 21 0 8 0 218 107May ............................. 154 0 59 59 106 0 14 0 13 0 308 159June ............................ 196 0 27 27 89 0 6 0 10 0 271 107July ............................. A 239 0 43 42 127 0 7 0 0 0 276 149August ........................ A 225 0 23 23 119 0 17 0 8 0 281 143September .................. A 201 0 53 53 157 0 12 0 6 0 251 105October ....................... A 197 0 46 46 114 0 8 0 11 0 288 168November ................... A 93 0 82 82 99 0 6 0 0 0 237 121December ................... 192 0 51 51 98 0 6 0 0 0 305 154Average ..................... 211 0 50 48 105 0 12 2 10 0 289 134
See footnotes at end of table.
Energy Information Administration/Historical Monthly Energy Review 1973-1992 119
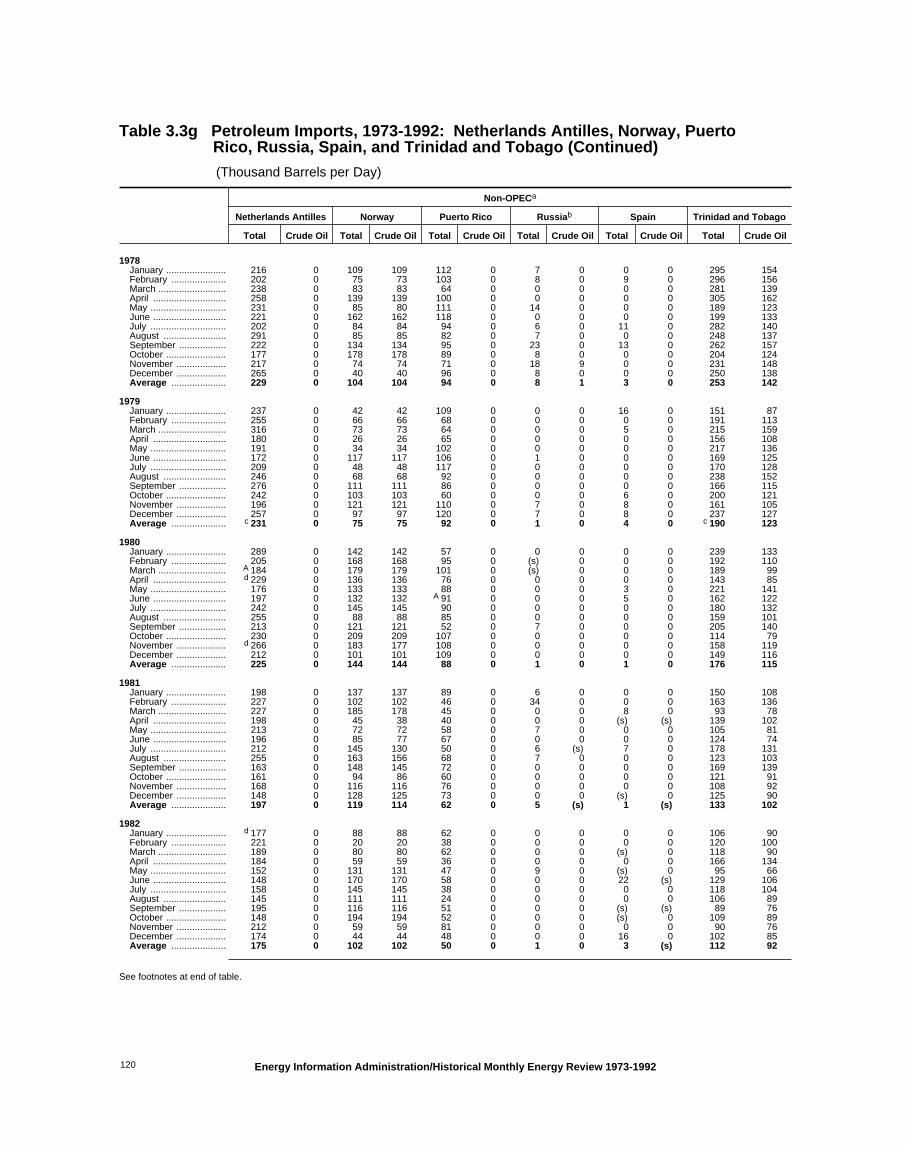
Table 3.3g Petroleum Imports, 1973-1992: Netherlands Antilles, Norway, Puerto Rico, Russia, Spain, and Trinidad and Tobago (Continued)
(Thousand Barrels per Day)
Non-OPECa
Netherlands Antilles Norway Puerto Rico Russiab Spain Trinidad and Tobago
Total Crude Oil Total Crude Oil Total Crude Oil Total Crude Oil Total Crude Oil Total Crude Oil
1978January ....................... 216 0 109 109 112 0 7 0 0 0 295 154February ..................... 202 0 75 73 103 0 8 0 9 0 296 156March .......................... 238 0 83 83 64 0 0 0 0 0 281 139April ............................ 258 0 139 139 100 0 0 0 0 0 305 162May ............................. 231 0 85 80 111 0 14 0 0 0 189 123June ............................ 221 0 162 162 118 0 0 0 0 0 199 133July ............................. 202 0 84 84 94 0 6 0 11 0 282 140August ........................ 291 0 85 85 82 0 7 0 0 0 248 137September .................. 222 0 134 134 95 0 23 0 13 0 262 157October ....................... 177 0 178 178 89 0 8 0 0 0 204 124November ................... 217 0 74 74 71 0 18 9 0 0 231 148December ................... 265 0 40 40 96 0 8 0 0 0 250 138Average ..................... 229 0 104 104 94 0 8 1 3 0 253 142
1979January ....................... 237 0 42 42 109 0 0 0 16 0 151 87February ..................... 255 0 66 66 68 0 0 0 0 0 191 113March .......................... 316 0 73 73 64 0 0 0 5 0 215 159April ............................ 180 0 26 26 65 0 0 0 0 0 156 108May ............................. 191 0 34 34 102 0 0 0 0 0 217 136June ............................ 172 0 117 117 106 0 1 0 0 0 169 125July ............................. 209 0 48 48 117 0 0 0 0 0 170 128August ........................ 246 0 68 68 92 0 0 0 0 0 238 152September .................. 276 0 111 111 86 0 0 0 0 0 166 115October ....................... 242 0 103 103 60 0 0 0 6 0 200 121November ................... 196 0 121 121 110 0 7 0 8 0 161 105December ................... 257 0 97 97 120 0 7 0 8 0 237 127Average ..................... c 231 0 75 75 92 0 1 0 4 0 c 190 123
1980January ....................... 289 0 142 142 57 0 0 0 0 0 239 133February ..................... 205 0 168 168 95 0 (s) 0 0 0 192 110March .......................... A 184 0 179 179 101 0 (s) 0 0 0 189 99April ............................ d 229 0 136 136 76 0 0 0 0 0 143 85May ............................. 176 0 133 133 88 0 0 0 3 0 221 141June ............................ 197 0 132 132 A 91 0 0 0 5 0 162 122July ............................. 242 0 145 145 90 0 0 0 0 0 180 132August ........................ 255 0 88 88 85 0 0 0 0 0 159 101September .................. 213 0 121 121 52 0 7 0 0 0 205 140October ....................... 230 0 209 209 107 0 0 0 0 0 114 79November ................... d 266 0 183 177 108 0 0 0 0 0 158 119December ................... 212 0 101 101 109 0 0 0 0 0 149 116Average ..................... 225 0 144 144 88 0 1 0 1 0 176 115
1981January ....................... 198 0 137 137 89 0 6 0 0 0 150 108February ..................... 227 0 102 102 46 0 34 0 0 0 163 136March .......................... 227 0 185 178 45 0 0 0 8 0 93 78April ............................ 198 0 45 38 40 0 0 0 (s) (s) 139 102May ............................. 213 0 72 72 58 0 7 0 0 0 105 81June ............................ 196 0 85 77 67 0 0 0 0 0 124 74July ............................. 212 0 145 130 50 0 6 (s) 7 0 178 131August ........................ 255 0 163 156 68 0 7 0 0 0 123 103September .................. 163 0 148 145 72 0 0 0 0 0 169 139October ....................... 161 0 94 86 60 0 0 0 0 0 121 91November ................... 168 0 116 116 76 0 0 0 0 0 108 92December ................... 148 0 128 125 73 0 0 0 (s) 0 125 90Average ..................... 197 0 119 114 62 0 5 (s) 1 (s) 133 102
1982January ....................... d 177 0 88 88 62 0 0 0 0 0 106 90February ..................... 221 0 20 20 38 0 0 0 0 0 120 100March .......................... 189 0 80 80 62 0 0 0 (s) 0 118 90April ............................ 184 0 59 59 36 0 0 0 0 0 166 134May ............................. 152 0 131 131 47 0 9 0 (s) 0 95 66June ............................ 148 0 170 170 58 0 0 0 22 (s) 129 106July ............................. 158 0 145 145 38 0 0 0 0 0 118 104August ........................ 145 0 111 111 24 0 0 0 0 0 106 89September .................. 195 0 116 116 51 0 0 0 (s) (s) 89 76October ....................... 148 0 194 194 52 0 0 0 (s) 0 109 89November ................... 212 0 59 59 81 0 0 0 0 0 90 76December ................... 174 0 44 44 48 0 0 0 16 0 102 85Average ..................... 175 0 102 102 50 0 1 0 3 (s) 112 92
See footnotes at end of table.
Energy Information Administration/Historical Monthly Energy Review 1973-1992120

Table 3.3g Petroleum Imports, 1973-1992: Netherlands Antilles, Norway, Puerto Rico, Russia, Spain, and Trinidad and Tobago (Continued)
(Thousand Barrels per Day)
Non-OPECa
Netherlands Antilles Norway Puerto Rico Russiab Spain Trinidad and Tobago
Total Crude Oil Total Crude Oil Total Crude Oil Total Crude Oil Total Crude Oil Total Crude Oil
1983January ....................... 228 0 58 58 40 0 0 0 0 0 73 73February ..................... 183 0 29 29 50 0 0 0 (s) 0 81 81March .......................... 187 0 28 28 43 0 (s) (s) 8 0 78 78April ............................ 216 0 189 189 20 0 (s) (s) 0 0 85 77May ............................. 153 0 72 72 42 0 0 0 5 0 108 89June ............................ 173 0 70 70 48 0 0 0 5 5 120 93July ............................. 198 0 103 103 37 0 0 0 0 0 107 86August ........................ 197 0 56 52 40 0 15 0 0 0 90 75September .................. 261 0 77 77 33 0 0 0 2 0 82 74October ....................... 172 0 32 32 48 0 0 0 (s) 0 106 89November ................... 144 0 55 55 55 0 (s) (s) 6 0 110 91December ................... 153 0 19 19 22 0 (s) (s) (s) 0 113 88Average ..................... 189 0 66 65 40 0 1 (s) 2 (s) 96 83
1984January ....................... 279 0 88 88 53 0 6 (s) 12 0 54 46February ..................... 289 0 63 59 58 0 16 (s) 54 0 77 57March .......................... 169 0 127 127 34 0 (s) (s) 8 0 93 93April ............................ 207 0 119 104 37 0 0 0 7 0 91 91May ............................. 192 0 112 104 38 0 8 0 16 0 57 57June ............................ 234 0 151 151 53 0 0 0 8 0 104 104July ............................. 99 0 179 179 27 0 18 0 0 0 120 91August ........................ 206 0 86 86 34 0 16 0 7 0 98 91September .................. 133 0 157 157 38 0 33 0 5 0 103 93October ....................... 112 0 101 101 37 0 39 (s) 1 0 122 122November ................... 181 0 118 118 44 0 17 0 3 0 115 112December ................... 161 0 69 69 46 0 7 0 11 0 98 92Average ..................... 188 0 114 112 42 0 13 (s) 11 0 94 87
1985January ....................... 132 0 34 34 32 0 14 (s) 1 0 113 103February ..................... 52 0 54 54 50 0 (s) (s) 8 0 119 99March .......................... 49 0 32 32 29 0 1 0 8 0 115 104April ............................ 18 0 75 68 42 0 21 0 40 0 107 91May ............................. 28 0 18 18 37 0 30 (s) 11 0 126 116June ............................ 30 0 18 18 23 0 9 0 31 0 92 63July ............................. 36 0 34 34 14 0 (s) (s) 52 0 133 122August ........................ 18 0 18 18 28 0 1 0 40 0 121 121September .................. 40 0 0 0 26 0 9 0 28 0 129 95October ....................... 5 0 35 27 21 0 7 0 23 0 99 73November ................... 30 0 54 54 26 0 (s) (s) 40 8 100 94December ................... 44 0 18 18 12 0 0 0 68 0 96 90Average ..................... 40 0 32 31 28 0 8 (s) 29 1 113 98
1986January ....................... 58 0 87 75 21 0 0 0 32 0 108 108February ..................... 11 0 110 110 18 0 (s) (s) 40 0 85 74March .......................... 27 0 35 35 25 0 0 0 30 0 79 72April ............................ 13 0 38 37 23 0 0 0 24 0 111 104May ............................. 37 0 1 0 27 0 16 0 31 0 130 89June ............................ 17 0 64 50 30 0 48 0 47 0 167 115July ............................. 25 0 40 40 29 0 20 0 157 0 131 94August ........................ 12 0 69 52 7 0 88 0 95 0 133 92September .................. 17 0 80 76 23 0 8 0 32 0 162 100October ....................... 26 0 23 17 21 0 19 0 40 0 112 89November ................... 53 0 89 89 21 0 10 0 41 0 129 99December ................... 7 0 85 64 12 0 9 0 66 0 148 82Average ..................... 25 0 60 53 21 0 18 (s) 53 0 125 93
1987January ....................... 29 0 75 72 33 0 14 0 44 0 100 79February ..................... 23 0 91 82 24 0 R 10 0 58 0 127 100March .......................... 14 0 127 111 17 0 4 0 67 0 124 65April ............................ 12 0 83 69 24 0 5 0 15 0 123 85May ............................. 33 0 117 102 21 0 0 0 44 0 117 83June ............................ 13 0 112 107 21 0 30 0 65 0 114 77July ............................. 71 0 81 70 17 0 9 0 61 0 98 75August ........................ 51 0 63 43 20 0 0 0 42 0 100 74September .................. 42 0 25 16 25 0 0 0 100 0 105 72October ....................... 16 0 36 36 17 0 22 0 57 0 88 63November ................... 14 0 64 56 15 0 15 0 40 0 111 70December ................... 24 0 90 71 23 0 19 0 65 0 73 61Average ..................... 29 0 80 70 21 0 R 11 0 55 0 106 75
See footnotes at end of table.
Energy Information Administration/Historical Monthly Energy Review 1973-1992 121

Table 3.3g Petroleum Imports, 1973-1992: Netherlands Antilles, Norway, Puerto Rico, Russia, Spain, and Trinidad and Tobago (Continued)
(Thousand Barrels per Day)
Non-OPECa
Netherlands Antilles Norway Puerto Rico Russiab Spain Trinidad and Tobago
Total Crude Oil Total Crude Oil Total Crude Oil Total Crude Oil Total Crude Oil Total Crude Oil
1988January ....................... 40 0 41 37 29 0 30 0 28 0 97 75February ..................... 21 0 63 54 16 0 45 0 47 0 93 63March .......................... 46 0 2 0 22 0 40 0 45 0 89 76April ............................ 43 0 65 65 29 0 0 0 93 0 82 72May ............................. 27 0 97 82 20 0 26 0 68 0 102 61June ............................ 31 0 1 0 13 0 15 0 57 0 112 80July ............................. 35 0 69 62 22 0 23 0 77 0 96 60August ........................ 32 0 82 79 23 0 23 0 97 0 97 79September .................. 25 0 101 85 29 0 22 0 92 0 96 81October ....................... 17 0 143 143 21 0 19 0 42 0 98 61November ................... 72 0 48 48 15 0 77 0 95 0 80 65December ................... 40 0 90 81 28 0 25 0 75 0 125 83Average ..................... 36 0 67 62 22 0 29 0 68 0 97 71
1989January ....................... 59 0 33 33 30 0 19 0 101 0 105 79February ..................... 44 0 233 222 24 0 12 0 70 0 92 85March .......................... 52 0 167 167 38 0 58 0 49 0 82 65April ............................ 14 0 186 175 24 0 49 0 56 0 117 99May ............................. 32 0 184 184 46 0 27 0 46 0 68 49June ............................ 34 0 179 179 32 0 79 0 99 0 143 100July ............................. 49 0 48 35 39 0 100 0 51 0 89 47August ........................ 43 0 117 98 21 0 43 0 69 0 101 79September .................. 35 0 146 119 33 0 68 0 70 0 95 69October ....................... 38 0 166 143 32 0 66 0 38 0 71 71November ................... 72 0 155 132 42 0 48 0 71 0 91 80December ................... 29 0 57 50 24 0 0 0 83 0 81 63Average ..................... 42 0 138 127 32 0 48 0 67 0 94 73
1990January ....................... 9 0 75 67 35 0 62 0 60 0 109 84February ..................... 27 0 43 37 32 0 40 0 53 0 89 67March .......................... 10 0 50 50 32 0 0 0 13 0 103 96April ............................ 40 0 134 118 33 0 20 0 17 0 114 81May ............................. 20 0 166 166 38 0 0 0 87 0 88 58June ............................ 21 0 209 199 27 0 19 0 66 0 118 83July ............................. 30 0 129 129 35 0 92 0 104 0 107 73August ........................ 41 0 159 159 29 0 73 0 54 0 108 91September .................. 33 0 125 119 20 0 49 0 23 0 89 70October ....................... 43 0 67 67 29 0 87 10 21 0 83 76November ................... 46 0 17 17 50 0 63 0 25 0 81 73December ................... 53 0 43 17 29 0 34 0 38 0 62 62Average ..................... 31 0 102 96 32 0 45 1 47 0 96 76
1991January ....................... 103 0 45 34 22 0 28 0 26 0 75 64February ..................... 23 0 37 37 20 0 17 0 18 0 76 76March .......................... 56 0 25 16 14 0 13 0 13 0 86 73April ............................ 61 0 51 35 23 0 39 0 66 0 84 64May ............................. 113 0 165 156 42 0 42 0 53 0 61 61June ............................ 84 0 99 84 19 0 0 0 41 0 118 104July ............................. 86 0 69 63 25 0 58 0 22 0 91 72August ........................ 100 0 142 136 42 0 80 11 48 0 91 66September .................. 67 0 79 72 34 0 23 0 42 0 119 75October ....................... 90 0 98 98 12 0 13 0 24 0 88 76November ................... 100 0 73 65 35 0 16 0 19 0 77 69December ................... 88 0 94 88 36 0 16 0 26 0 87 71Average ..................... 81 0 82 74 27 0 29 1 33 0 88 72
1992January ....................... 40 0 25 17 32 0 17 0 35 0 108 79February ..................... 82 0 11 0 23 0 3 0 16 0 109 76March .......................... 49 0 11 0 18 0 0 0 37 0 105 85April ............................ 73 0 155 147 14 0 0 0 35 0 79 75May ............................. 59 0 210 200 22 0 0 0 30 0 69 54June ............................ 83 0 234 225 36 0 0 0 46 0 94 74July ............................. 49 0 186 179 11 0 72 32 18 0 103 78August ........................ 65 0 142 134 38 0 62 31 29 0 106 54September .................. 60 0 103 102 37 0 53 0 56 0 84 56October ....................... 90 0 190 177 29 0 9 0 32 0 108 71November ................... 56 0 111 104 26 0 0 0 36 0 85 62December ................... 80 0 140 133 28 0 0 0 17 0 91 71Average ..................... 65 0 127 119 26 0 18 5 32 0 95 70
a Includes petroleum imported into the United States indirectly frommembers of the Organization of Petroleum Exporting Countries (OPEC),primarily from Caribbean and West European areas, as petroleum productsthat were refined from crude oil produced by OPEC.
b Imports from other States in the former U.S.S.R. may be included inimports from Russia for the years 1973-1992.
c The annual value is not an average of the monthly values. See Note 6 atend of section.
d See Note 7 at end of section.R=Revised data. E=Estimate; see Note 6 at end of section. A=Adjusted
data; see Note 6 at end of section. (s)=Less than 500 barrels per day. Notes: • Beginning in October 1977, Strategic Petroleum Reserve imports
are included. • U.S. geographic coverage is the 50 States and the District ofColumbia.
Sources: See end of section.
Energy Information Administration/Historical Monthly Energy Review 1973-1992122

Table 3.3h Petroleum Imports, 1973-1992: United Kingdom, Virgin Islands, Other Non-OPEC, Total Non-OPEC, and Total Imports
(Thousand Barrels per Day)
Non-OPECa
TotalNon-OPECa
TotalImportsUnited Kingdom Virgin Islands Other Non-OPEC
Total Crude Oil Total Crude Oil Total Crude Oil Total Crude Oil Total Crude Oil
1973January ............................. E 11 0 E 336 0 E 123 16 E 3,206 1,166 5,857 2,732February ........................... E 14 0 E 445 0 E 341 15 E 3,871 1,168 6,507 2,873March ................................ E 13 0 E 419 0 E 205 28 E 3,790 1,249 6,610 3,162April .................................. E 9 0 E 270 0 E 81 43 E 3,220 1,292 5,593 3,049May ................................... E 9 0 E 261 0 E 154 52 E 3,018 1,149 5,841 3,215June .................................. E 9 0 E 271 0 E 203 68 E 3,063 1,128 5,890 3,220July ................................... E 17 0 E 258 0 E 215 28 E 2,844 1,078 6,179 3,501August .............................. E 20 0 E 296 0 E 183 47 E 3,192 1,164 6,591 3,593September ........................ E 20 0 E 292 0 E 143 15 E 3,100 1,102 6,411 3,471October ............................. E 17 0 E 317 0 E 130 60 E 3,101 1,179 6,633 3,739November ......................... E 22 0 E 410 0 E 335 20 E 3,607 1,122 6,922 3,452December ......................... E 21 0 E 386 0 E 312 37 E 3,335 996 6,056 2,891Average ........................... 15 0 329 0 b 153 36 b 3,263 1,149 6,256 3,244
1974January ............................. E 2 0 E 368 0 E 92 10 E 3,063 964 5,371 2,382February ........................... E 2 0 E 379 0 E 148 12 E 3,036 877 5,216 2,248March ................................ E 1 0 E 320 0 E 74 11 E 2,691 865 5,274 2,462April .................................. E 14 0 E 333 0 E 192 53 E 3,098 1,095 5,980 3,267May ................................... E 14 0 E 326 0 E 181 86 E 3,094 1,131 6,493 3,908June .................................. E 13 0 E 295 0 E 172 52 E 2,667 894 6,360 3,925July ................................... E 2 0 E 426 0 E 187 45 E 2,734 896 6,537 4,091August .............................. E 2 0 E 425 0 E 108 25 E 2,757 922 6,361 3,924September ........................ E 1 0 E 370 0 E 137 45 E 2,502 905 6,052 3,797October ............................. E 11 0 E 404 0 E 100 9 E 2,443 852 6,175 3,810November ......................... E 15 0 E 524 0 E 201 18 E 2,924 865 6,798 3,958December ......................... E 15 0 E 526 0 E 146 0 E 3,039 969 6,667 3,869Average ........................... 8 0 b 391 0 b 122 30 b 2,832 937 6,112 3,477
1975January ............................. E 10 0 E 637 0 E 216 14 E 3,108 889 6,861 4,029February ........................... E 8 0 E 526 0 E 107 0 E 2,664 831 6,176 3,828March ................................ E 6 0 E 401 0 E 15 0 E 2,103 706 5,730 3,656April .................................. 8 0 348 0 79 9 1,990 767 5,040 3,378May ................................... 7 0 413 0 104 17 2,010 736 5,214 3,486June .................................. (s) 0 353 0 58 0 2,125 901 5,406 3,905July ................................... 6 0 321 0 83 10 2,479 952 5,959 4,192August .............................. 12 0 399 0 140 9 2,522 977 6,298 4,581September ........................ 10 0 390 0 162 19 2,779 1,008 6,804 4,689October ............................. 13 0 336 0 180 9 2,695 1,024 6,329 4,389November ......................... 37 4 353 0 241 36 2,516 979 6,419 4,623December ......................... 11 0 406 0 327 40 2,557 946 6,425 4,476Average ........................... b 14 (s) 406 0 b 120 14 b 2,454 893 6,056 4,105
1976January ............................. 35 11 468 0 195 56 2,405 749 6,714 4,594February ........................... 18 0 462 0 257 71 2,349 629 6,712 4,208March ................................ 30 0 425 0 207 103 2,348 771 6,687 4,738April .................................. 50 36 341 0 223 102 2,203 766 6,595 4,790May ................................... 43 31 389 0 151 62 2,047 770 6,323 4,669June .................................. 25 0 428 0 140 84 2,191 825 7,474 5,628July ................................... 8 0 386 0 238 76 2,204 694 7,884 5,792August .............................. 28 0 437 0 200 114 2,147 712 7,382 5,556September ........................ 13 5 408 0 239 128 2,226 729 7,924 5,875October ............................. 23 14 461 0 308 192 2,188 832 7,536 5,689November ......................... 39 28 454 0 177 123 2,248 724 8,060 5,946December ......................... 55 37 408 0 257 105 2,474 695 8,447 5,925Average ........................... 31 13 422 0 b 203 101 b 2,247 742 7,313 5,287
1977January ............................. 89 72 620 0 285 171 c 2,671 791 c 8,903 6,281February ........................... 146 77 549 0 404 169 3,492 1,047 9,997 6,659March ................................ 169 108 505 0 308 96 2,975 922 9,383 6,699April .................................. 104 62 409 0 271 154 2,302 877 8,723 6,821May ................................... 59 50 376 0 310 205 2,342 980 8,571 6,818June .................................. 98 81 322 0 307 179 2,307 918 8,937 7,065July ................................... 102 65 478 0 257 175 2,489 884 9,095 7,068August .............................. 110 96 431 0 225 114 2,535 954 8,574 6,395September ........................ 158 127 434 0 341 195 c 2,630 1,032 8,567 6,429October ............................. 156 136 452 0 288 164 2,523 1,093 8,364 6,502November ......................... 142 125 463 0 253 133 c 2,471 1,087 8,135 6,321December ......................... 178 169 556 0 212 132 2,695 1,078 8,525 6,327Average ........................... 126 97 466 0 287 157 2,614 971 8,807 6,615
See footnotes at end of table.
Energy Information Administration/Historical Monthly Energy Review 1973-1992 123

Table 3.3h Petroleum Imports, 1973-1992: United Kingdom, Virgin Islands, Other Non-OPEC, Total Non-OPEC, and Total Imports (Continued)
(Thousand Barrels per Day)
Non-OPECa
TotalNon-OPECa
TotalImportsUnited Kingdom Virgin Islands Other Non-OPEC
Total Crude Oil Total Crude Oil Total Crude Oil Total Crude Oil Total Crude Oil
1978January ............................. 210 210 466 0 152 70 2,575 1,093 8,332 6,240February ........................... 201 177 491 0 198 112 2,620 1,040 8,119 5,764March ................................ 149 133 506 0 214 133 2,526 1,030 8,501 6,163April .................................. 183 169 372 0 274 178 2,594 1,131 7,743 5,627May ................................... 154 139 304 0 356 190 2,408 1,021 7,531 5,727June .................................. 176 167 324 0 246 157 2,457 1,190 8,108 6,468July ................................... 132 132 402 0 268 162 2,618 1,119 8,277 6,329August .............................. 235 235 431 0 195 117 2,668 1,234 8,292 6,435September ........................ 231 196 432 0 278 144 2,853 1,375 9,036 7,053October ............................. 226 224 476 0 165 96 2,576 1,313 8,313 6,595November ......................... 101 92 489 0 203 129 2,612 1,182 8,852 6,831December ......................... 158 147 448 0 330 260 2,842 1,326 9,241 6,996Average ........................... 180 169 428 0 b 239 146 2,612 1,172 8,363 6,356
1979January ............................. 300 293 477 0 196 101 3,082 1,471 9,148 6,925February ........................... 156 156 421 0 310 221 2,782 1,462 8,591 6,522March ................................ 163 151 562 0 247 196 3,007 1,405 8,760 6,374April .................................. 175 175 475 0 207 148 2,490 1,211 7,893 6,211May ................................... 203 198 382 0 283 210 2,644 1,304 8,091 6,261June .................................. 264 259 414 0 289 207 2,820 1,520 8,327 6,647July ................................... 301 295 451 0 246 166 2,877 1,408 8,559 6,602August .............................. 76 74 357 0 183 116 2,493 1,214 8,590 6,809September ........................ 197 192 286 0 285 233 2,580 1,407 8,023 6,426October ............................. 153 145 403 0 483 388 2,950 1,580 8,688 6,890November ......................... 181 174 438 0 250 165 2,829 1,397 8,141 6,228December ......................... 256 249 508 0 284 153 3,249 1,511 8,628 6,318Average ........................... 202 197 431 0 b 269 192 2,819 1,407 8,456 6,519
1980January ............................. 296 288 467 0 241 190 3,131 1,647 8,598 6,406February ........................... 105 103 536 0 308 229 2,914 1,450 7,945 6,013March ................................ 232 230 449 0 301 188 2,800 1,432 7,452 5,695April .................................. 182 182 425 0 297 249 2,737 1,560 7,106 5,598May ................................... 124 121 303 0 234 172 2,481 1,432 6,579 5,106June .................................. 146 146 314 0 227 171 2,486 1,426 6,894 5,480July ................................... 115 115 378 0 155 121 2,262 1,186 6,257 4,843August .............................. 196 196 264 0 244 169 2,449 1,404 6,192 4,803September ........................ 218 218 343 0 185 136 2,569 1,417 6,239 4,707October ............................. 134 130 372 0 107 83 2,557 1,369 6,379 4,768November ......................... 157 151 391 0 129 93 2,464 1,257 6,408 4,680December ......................... 199 199 423 0 202 146 2,471 1,212 6,894 5,082Average ........................... 176 173 388 0 219 162 2,609 1,399 6,909 5,263
1981January ............................. 233 228 494 0 236 176 2,701 1,333 6,827 4,932February ........................... 271 227 481 0 339 276 2,881 1,467 6,772 4,873March ................................ 263 263 370 0 251 186 2,603 1,403 6,028 4,521April .................................. 402 402 365 0 169 131 2,423 1,296 5,668 4,338May ................................... 368 366 344 0 240 153 2,573 1,377 5,775 4,287June .................................. 397 397 262 0 202 121 2,513 1,404 5,435 4,061July ................................... 553 548 206 0 178 117 2,583 1,520 5,816 4,296August .............................. 592 592 184 0 230 131 2,698 1,614 5,767 4,179September ........................ 528 515 265 0 331 217 3,100 1,840 6,365 4,740October ............................. 351 349 303 0 253 188 2,739 1,592 5,959 4,380November ......................... 253 253 294 0 204 120 2,557 1,387 5,741 4,046December ......................... 280 280 367 0 206 146 2,714 1,455 5,843 4,137Average ........................... 375 369 327 0 236 163 2,672 1,474 5,996 4,396
1982January ............................. 346 331 334 0 213 158 c 2,472 1,313 c 5,330 3,693February ........................... 181 157 362 0 321 207 2,510 1,132 4,807 2,990March ................................ 294 262 307 0 235 86 2,433 1,239 4,484 2,874April .................................. 247 232 266 0 411 295 2,507 1,383 4,378 2,849May ................................... 516 516 302 0 309 207 2,981 1,918 4,811 3,309June .................................. 557 543 322 0 312 205 3,231 2,063 5,327 3,836July ................................... 433 433 376 0 250 99 3,204 1,959 5,890 4,248August .............................. 520 520 317 0 289 117 3,137 1,992 5,244 3,851September ........................ 631 605 278 0 436 256 c 3,471 2,183 5,414 3,636October ............................. 666 655 262 0 312 149 3,222 2,093 5,306 3,670November ......................... 623 607 334 0 337 188 c 3,509 2,113 5,744 3,862December ......................... 438 415 336 0 261 136 2,916 1,629 4,606 3,000Average ........................... 456 441 316 0 306 174 2,968 1,754 5,113 3,488
See footnotes at end of table.
Energy Information Administration/Historical Monthly Energy Review 1973-1992124

Table 3.3h Petroleum Imports, 1973-1992: United Kingdom, Virgin Islands, Other Non-OPEC, Total Non-OPEC, and Total Imports (Continued)
(Thousand Barrels per Day)
Non-OPECa
TotalNon-OPECa
TotalImportsUnited Kingdom Virgin Islands Other Non-OPEC
Total Crude Oil Total Crude Oil Total Crude Oil Total Crude Oil Total Crude Oil
1983January ............................. 314 307 299 0 349 251 3,026 1,858 4,438 2,964February ........................... 193 175 192 0 419 335 2,658 1,524 3,726 2,267March ................................ 240 232 162 0 341 182 2,624 1,591 3,690 2,290April .................................. 421 420 183 0 306 135 3,295 2,119 4,727 3,118May ................................... 484 474 235 0 355 184 3,318 2,026 5,089 3,360June .................................. 440 428 262 0 427 227 3,353 1,978 5,326 3,577July ................................... 369 346 364 0 443 237 3,490 2,014 5,741 3,871August .............................. 461 437 313 0 362 200 3,431 1,991 6,159 4,227September ........................ 475 452 307 0 421 277 3,534 2,025 6,129 4,210October ............................. 414 395 357 0 266 75 3,151 1,652 5,258 3,446November ......................... 334 327 427 0 509 290 3,300 1,803 5,210 3,337December ......................... 429 369 278 0 350 204 3,063 1,636 5,033 3,213Average ........................... 382 365 282 0 378 215 3,189 1,853 5,051 3,329
1984January ............................. 382 355 390 0 433 166 3,465 1,684 5,430 3,055February ........................... 344 278 418 0 471 124 3,797 1,562 5,693 2,950March ................................ 434 394 248 0 501 255 3,490 2,016 5,301 3,470April .................................. 282 276 257 0 437 204 3,410 2,008 5,372 3,417May ................................... 429 379 336 0 399 217 3,302 1,845 5,979 3,942June .................................. 345 339 268 0 396 235 3,255 1,926 5,482 3,546July ................................... 362 352 292 0 369 219 3,166 1,906 5,407 3,646August .............................. 388 377 236 0 410 217 3,035 1,776 5,044 3,248September ........................ 490 483 250 0 344 223 3,249 2,067 5,252 3,342October ............................. 486 467 321 0 394 218 3,717 2,185 5,779 3,751November ......................... 544 516 283 0 385 220 3,633 2,169 5,587 3,583December ......................... 337 313 235 0 398 214 3,168 1,819 4,933 3,136Average ........................... 402 378 294 0 411 210 3,388 1,914 5,437 3,426
1985January ............................. 345 323 235 0 401 211 3,010 1,774 4,415 2,717February ........................... 151 117 213 0 291 41 2,693 1,375 3,913 2,108March ................................ 133 103 235 0 332 102 3,168 1,727 4,673 2,786April .................................. 213 188 205 0 334 75 3,388 2,007 5,316 3,401May ................................... 419 371 252 0 583 248 3,800 2,269 5,776 3,730June .................................. 481 459 271 0 366 154 3,240 1,886 4,929 3,188July ................................... 324 266 236 0 469 164 3,124 1,845 4,950 3,203August .............................. 336 302 241 0 229 83 2,978 1,849 4,718 3,114September ........................ 303 263 173 0 353 117 3,169 2,002 4,970 3,155October ............................. 352 330 260 0 381 134 3,163 1,851 5,121 3,238November ......................... 376 350 325 0 549 179 3,676 2,168 6,116 3,999December ......................... 273 256 314 0 429 126 3,400 1,878 5,831 3,696Average ........................... 310 278 247 0 394 137 3,237 1,888 5,067 3,201
1986January ............................. 333 313 326 0 414 120 3,275 1,845 5,573 3,472February ........................... 218 193 309 0 357 124 2,870 1,660 4,676 2,968March ................................ 178 174 186 0 234 28 2,567 1,511 4,712 2,988April .................................. 188 167 209 0 345 117 2,863 1,792 5,439 3,684May ................................... 365 318 237 0 476 135 3,651 2,221 6,400 4,250June .................................. 569 481 233 0 472 151 3,838 2,430 6,848 4,635July ................................... 353 307 237 0 458 202 3,634 2,264 6,942 4,726August .............................. 584 545 214 0 542 201 3,822 2,358 7,168 4,859September ........................ 437 392 291 0 579 283 3,706 2,334 7,090 5,031October ............................. 173 164 215 0 422 156 3,151 1,862 6,427 4,419November ......................... 448 419 179 0 381 113 3,504 2,246 6,592 4,615December ......................... 351 325 291 0 428 100 3,724 2,237 6,700 4,412Average ........................... 350 317 244 0 426 144 3,387 2,065 6,224 4,178
1987January ............................. 384 338 327 0 317 72 3,589 2,150 6,353 4,385February ........................... 260 236 296 0 339 45 3,199 1,855 5,984 3,866March ................................ 322 281 247 0 396 57 3,489 2,090 5,794 3,779April .................................. 485 463 259 0 338 128 3,481 2,330 5,911 4,132May ................................... 392 370 214 0 459 245 3,398 2,309 6,073 4,340June .................................. 377 330 281 0 409 164 3,646 2,384 6,769 4,807July ................................... 354 254 288 0 686 352 4,055 2,481 7,588 5,295August .............................. 289 275 274 0 609 307 3,706 2,389 7,454 5,510September ........................ 259 223 271 0 408 233 3,618 2,280 7,178 5,110October ............................. 321 257 250 0 453 275 3,492 2,241 7,068 5,142November ......................... 456 391 235 0 539 205 3,899 2,455 7,068 5,013December ......................... 324 232 327 0 538 252 3,800 2,294 6,833 4,640Average ........................... 352 304 272 0 459 196 3,617 2,274 6,678 4,674
See footnotes at end of table.
Energy Information Administration/Historical Monthly Energy Review 1973-1992 125

Table 3.3h Petroleum Imports, 1973-1992: United Kingdom, Virgin Islands, Other Non-OPEC, Total Non-OPEC, and Total Imports (Continued)
(Thousand Barrels per Day)
Non-OPECa
TotalNon-OPECa
TotalImportsUnited Kingdom Virgin Islands Other Non-OPEC
Total Crude Oil Total Crude Oil Total Crude Oil Total Crude Oil Total Crude Oil
1988January ............................. 313 232 341 0 376 141 4,047 2,428 7,181 4,662February ........................... 334 261 200 0 466 122 3,794 2,143 7,256 4,650March ................................ 461 415 180 0 400 134 3,871 2,487 6,944 4,868April .................................. 594 556 193 0 389 145 3,857 2,593 7,270 5,167May ................................... 389 327 257 0 463 163 3,968 2,539 7,469 5,339June .................................. 232 200 212 0 547 306 3,607 2,418 7,239 5,322July ................................... 214 157 215 0 455 191 3,708 2,288 7,297 5,100August .............................. 111 53 172 0 679 359 3,683 2,306 7,386 5,089September ........................ 149 121 236 0 521 208 3,820 2,380 7,506 5,212October ............................. 447 392 234 0 384 164 3,969 2,646 7,830 5,551November ......................... 246 151 286 0 592 236 4,204 2,441 7,714 5,070December ......................... 294 182 372 0 578 179 4,053 2,250 7,727 5,230Average ........................... 315 254 242 0 487 196 3,882 2,411 7,402 5,107
1989January ............................. 215 138 415 0 429 122 4,043 2,300 8,255 5,661February ........................... 221 130 369 0 505 92 4,186 2,290 8,032 5,305March ................................ 174 130 324 0 409 93 3,763 2,179 7,456 5,035April .................................. 148 88 407 0 473 165 4,151 2,635 8,078 5,750May ................................... 202 169 379 0 334 88 3,753 2,426 7,778 5,729June .................................. 181 132 363 0 351 195 3,871 2,476 7,977 5,976July ................................... 328 210 331 0 544 324 3,932 2,468 8,369 6,214August .............................. 370 316 239 0 533 319 4,029 2,781 8,560 6,565September ........................ 191 149 190 0 470 244 3,766 2,517 8,002 6,028October ............................. 309 234 180 0 651 383 4,124 2,796 8,301 6,187November ......................... 165 141 279 0 337 121 3,988 2,606 8,341 6,171December ......................... 78 71 377 0 449 213 3,468 2,126 7,579 5,463Average ........................... 215 160 321 0 457 197 3,921 2,467 8,061 5,843
1990January ............................. 219 147 409 0 588 220 4,332 2,399 9,197 6,212February ........................... 74 23 323 0 471 139 3,805 2,177 8,399 5,895March ................................ 257 221 264 0 405 168 3,536 2,469 7,965 6,117April .................................. 304 288 283 0 513 275 3,660 2,348 7,858 5,813May ................................... 369 305 285 0 541 248 4,260 2,673 8,834 6,454June .................................. 249 233 299 0 579 270 4,287 2,771 8,747 6,423July ................................... 224 179 252 0 500 251 4,057 2,609 9,048 6,855August .............................. 183 179 230 0 340 107 3,722 2,406 8,644 6,452September ........................ 155 155 240 0 336 206 3,417 2,386 7,361 5,664October ............................. 81 44 204 0 245 92 3,199 2,210 6,717 5,132November ......................... 112 56 312 0 254 112 3,374 2,173 7,003 5,085December ......................... 33 19 291 0 233 70 3,011 1,933 6,439 4,611Average ........................... 189 155 282 0 417 180 3,721 2,381 8,018 5,894
1991January ............................. 32 19 261 0 235 91 3,205 2,195 7,103 5,296February ........................... 34 21 222 0 180 96 3,051 2,221 6,865 5,485March ................................ 48 19 214 0 179 60 3,023 2,133 6,646 5,166April .................................. 61 37 245 0 256 99 3,674 2,470 7,418 5,529May ................................... 222 188 264 0 239 63 3,794 2,524 8,518 6,363June .................................. 105 70 234 0 349 189 3,747 2,587 8,245 6,334July ................................... 228 164 191 0 384 275 3,524 2,430 7,755 5,955August .............................. 254 217 208 0 369 197 4,067 2,699 8,670 6,645September ........................ 218 194 269 0 374 197 3,871 2,608 7,826 5,812October ............................. 201 166 262 0 252 139 3,444 2,340 7,467 5,683November ......................... 84 18 264 0 335 130 3,444 2,200 7,615 5,528December ......................... 154 151 286 0 229 104 3,546 2,448 7,337 5,565Average ........................... 138 106 243 0 282 137 3,535 2,405 7,627 5,782
1992January ............................. 129 115 250 0 208 59 3,488 2,402 7,712 5,956February ........................... 63 0 222 0 196 50 3,278 2,184 6,827 5,079March ................................ 79 52 202 0 345 114 3,462 2,380 7,068 5,321April .................................. 157 128 234 0 458 212 4,007 2,793 8,092 6,127May ................................... 198 180 246 0 467 225 3,705 2,633 7,823 6,060June .................................. 248 206 266 0 297 95 3,917 2,741 7,946 6,171July ................................... 354 337 280 0 415 152 4,140 3,024 8,479 6,796August .............................. 295 282 263 0 464 357 4,116 2,984 8,260 6,457September ........................ 341 291 217 0 382 160 3,904 2,687 8,178 6,218October ............................. 411 411 254 0 279 144 3,998 2,964 8,505 6,696November ......................... 336 285 274 0 219 124 3,786 2,745 7,872 6,121December ......................... 148 110 273 0 283 92 3,734 2,556 7,839 5,937Average ........................... 230 200 249 0 335 149 3,796 2,676 7,888 6,083
a Includes petroleum imported into the United States indirectly frommembers of the Organization of Petroleum Exporting Countries (OPEC),primarily from Caribbean and West European areas, as petroleum productsthat were refined from crude oil produced by OPEC.
b The annual value is not an average of the monthly values. See Note 6 atend of section.
c See Note 7 at end of section.
E=Estimate; see Note 6 at end of section. (s)=Less than 500 barrels perday.
Notes: • Beginning in October 1977, Strategic Petroleum Reserve importsare included. • Totals may not equal sum of components due to independentrounding. • U.S. geographic coverage is the 50 States and the District ofColumbia.
Sources: See end of section.
Energy Information Administration/Historical Monthly Energy Review 1973-1992126

Table 3.4 Finished Motor Gasoline Supply and Disposition, 1973-1992
Supply Disposition Ending Stocksa
TotalProduction Importsb
StockChangeb,c Exports
Product Supplied TotalMotor
Gasolinee
FinishedMotor
GasolineTotal Unleadedd Unleaded
Thousand Barrels per DayPercentof Total Million Barrels
1973January ....................... 6,352 59 292 1 6,118 – – 222 –February ..................... 6,151 95 -195 5 6,437 – – 216 –March .......................... 6,161 71 -282 1 6,513 – – 208 –April ............................ 6,387 63 -95 4 6,541 – – 205 –May ............................. 6,724 101 -86 5 6,907 – – 202 –June ............................ 7,000 174 209 1 6,964 – – 208 –July ............................. 6,993 133 100 2 7,023 – – 212 –August ........................ 6,887 164 -206 (s) 7,257 – – 205 –September .................. 6,627 127 172 1 6,581 – – 210 –October ....................... 6,628 194 137 8 6,677 – – 215 –November ................... 6,382 216 -240 15 6,823 – – 207 –December ................... 6,106 202 66 5 6,237 – – 209 –Average ..................... 6,535 134 -9 4 6,674 – – 209 –
1974January ....................... 5,906 163 260 4 5,804 – – 218 –February ..................... 5,972 184 56 1 6,100 – – 219 –March .......................... 5,985 225 40 7 6,162 – – 220 –April ............................ 6,314 260 115 1 6,457 – – 224 –May ............................. 6,331 250 -164 (s) 6,745 – – 219 –June ............................ 6,666 211 -43 (s) 6,919 – – 217 –July ............................. 6,795 212 47 1 6,959 – – 219 –August ........................ 6,817 253 4 6 7,061 – – 219 –September .................. 6,455 202 269 1 6,388 – – 227 –October ....................... 6,339 171 -202 1 6,712 – – 221 –November ................... 6,294 174 -78 (s) 6,547 – – 218 –December ................... 6,422 141 -1 6 6,558 – – f 218 –Average ..................... 6,360 204 24 2 6,537 – – f 218 –
1975January ....................... 6,511 262 f 566 1 6,206 – – 242 –February ..................... 6,279 171 344 10 6,096 – – 252 –March .......................... 6,073 150 -104 1 6,326 – – 249 –April ............................ 6,049 133 -538 1 6,718 – – 233 –May ............................. 6,129 142 -601 (s) 6,871 – – 214 –June ............................ 6,672 177 -228 1 7,076 – – 207 –July ............................. 7,006 209 173 1 7,041 – – 213 –August ........................ 6,874 232 97 (s) 7,008 – – 216 –September .................. 6,825 269 366 (s) 6,729 – – 226 –October ....................... 6,412 207 -160 1 6,778 – – 222 –November ................... 6,605 139 354 1 6,390 – – 232 –December ................... 6,789 119 92 8 6,808 – – 235 –Average ..................... 6,520 184 f 28 2 6,675 – – 235 –
1976January ....................... 6,485 92 178 (s) 6,398 – – 241 –February ..................... 6,475 84 289 6 6,263 – – 249 –March .......................... 6,458 123 -316 6 6,890 – – 239 –April ............................ 6,565 99 -503 8 7,159 – – 224 –May ............................. 6,777 112 35 1 6,853 – – 225 –June ............................ 7,306 188 11 (s) 7,482 – – 225 –July ............................. 7,177 190 50 1 7,315 – – 227 –August ........................ 7,151 141 118 7 7,168 – – 231 –September .................. 6,881 171 -27 (s) 7,079 – – 230 –October ....................... 6,681 138 -111 (s) 6,929 – – 226 –November ................... 6,941 146 48 1 7,038 – – 228 –December ................... 7,178 84 118 7 7,138 – – 231 –Average ..................... 6,841 131 -10 3 6,978 – – 231 –
1977January ....................... 6,934 231 685 8 6,472 1,549 23.9 253 –February ..................... 6,817 188 104 2 6,900 1,773 25.7 256 –March .......................... 6,864 257 213 (s) 6,908 1,657 24.0 262 –April ............................ 6,968 269 -110 1 7,345 1,863 25.4 259 –May ............................. 6,948 202 118 2 7,029 1,803 25.7 263 –June ............................ 7,146 246 -202 1 7,593 2,142 28.2 256 –July ............................. 7,248 248 56 1 7,439 2,146 28.8 258 –August ........................ 7,190 190 -42 1 7,420 2,096 28.2 257 –September .................. 7,061 222 -35 1 7,316 2,081 28.4 256 –October ....................... 6,932 179 -21 1 7,130 2,135 29.9 255 –November ................... 7,125 179 111 2 7,191 2,060 28.6 259 –December ................... 7,147 197 -31 1 7,375 2,400 32.5 258 –Average ..................... 7,033 217 72 2 7,177 1,976 27.5 258 –
See footnotes at end of table.
Energy Information Administration/Historical Monthly Energy Review 1973-1992 127

Table 3.4 Finished Motor Gasoline Supply and Disposition, 1973-1992 (Continued)
Supply Disposition Ending Stocksa
TotalProduction Importsb
StockChangeb,c Exports
Product Supplied TotalMotor
Gasolinee
FinishedMotor
GasolineTotal Unleadedd Unleaded
Thousand Barrels per DayPercentof Total Million Barrels
1978January ....................... 6,935 214 467 1 6,681 2,097 31.4 272 –February ..................... 6,633 200 -44 1 6,876 2,162 31.4 271 –March .......................... 6,752 141 -364 1 7,255 2,425 33.4 260 –April ............................ 6,670 177 -356 1 7,202 2,391 33.2 249 –May ............................. 7,061 169 -496 2 7,724 2,342 30.3 234 –June ............................ 7,212 234 -468 1 7,913 2,697 34.1 219 –July ............................. 7,267 212 -100 2 7,576 2,629 34.7 216 –August ........................ 7,456 179 -239 1 7,872 2,834 36.0 209 –September .................. 7,401 251 251 2 7,399 2,607 35.2 217 –October ....................... 7,178 180 -91 2 7,448 2,576 34.6 214 –November ................... 7,585 147 228 1 7,503 2,713 36.2 221 –December ................... 7,833 182 562 1 7,451 2,751 36.9 238 –Average ..................... 7,169 190 -54 1 7,412 2,521 34.0 238 –
1979January ....................... 7,263 179 614 1 6,830 2,609 38.2 257 –February ..................... 6,937 160 -158 1 7,254 2,715 37.4 253 –March .......................... 6,659 168 -403 (s) 7,229 2,733 37.8 240 –April ............................ 6,787 156 -113 1 7,055 2,786 39.5 237 –May ............................. 6,806 145 -263 (s) 7,213 2,751 38.1 229 –June ............................ 7,016 261 85 (s) 7,191 2,787 38.8 231 –July ............................. 7,018 222 338 (s) 6,902 2,789 40.4 242 –August ........................ 6,900 148 -283 1 7,330 2,970 40.5 233 –September .................. 6,641 135 -106 (s) 6,881 2,815 40.9 230 –October ....................... 6,500 150 -370 (s) 7,020 2,802 39.9 218 –November ................... 6,689 182 80 1 6,791 2,928 43.1 221 –December ................... 7,003 263 536 (s) 6,730 2,890 42.9 237 –Average ..................... 6,852 181 -2 (s) 7,034 2,798 39.8 237 –
1980January ....................... 6,991 141 809 1 6,323 2,718 43.0 262 –February ..................... 6,866 154 423 (s) 6,596 2,969 45.0 275 –March .......................... 6,519 155 267 (s) 6,406 3,032 47.3 283 –April ............................ 6,284 155 -362 1 6,800 3,021 44.4 272 –May ............................. 6,316 132 -283 1 6,729 2,980 44.3 263 –June ............................ 6,569 148 59 1 6,657 3,099 46.6 265 –July ............................. 6,465 149 -132 3 6,743 3,131 46.4 261 –August ........................ 6,452 141 -56 1 6,648 3,135 47.2 259 –September .................. 6,383 106 -28 7 6,510 3,054 46.9 258 –October ....................... 6,131 152 -380 1 6,662 3,110 46.7 247 –November ................... 6,467 126 359 (s) 6,234 3,123 50.1 257 –December ................... 6,644 121 133 1 6,632 3,421 51.6 f 261 –Average ..................... 6,506 140 66 1 6,579 3,067 46.6 f 261 –
1981January g .................... 6,715 138 f 421 (s) 6,431 3,141 48.8 276 227February ..................... 6,308 111 118 1 6,301 3,095 49.1 284 230March .......................... 6,213 171 81 (s) 6,303 3,097 49.1 285 232April ............................ 6,114 186 -303 (s) 6,602 3,284 49.7 272 223May ............................. 6,122 150 -344 1 6,615 3,115 47.1 h 258 213June ............................ 6,220 186 -622 1 7,028 3,419 48.6 242 194July ............................. 6,405 151 -268 (s) 6,823 3,424 50.2 228 186August ........................ 6,611 124 95 3 6,637 3,344 50.4 233 189September .................. 6,564 169 70 2 6,662 3,338 50.1 237 191October ....................... 6,426 147 -7 3 6,578 3,257 49.5 236 190November ................... 6,564 148 338 1 6,373 3,198 50.2 248 201December ................... 6,586 197 91 11 6,681 3,444 51.5 253 203Average ..................... 6,405 157 f -28 2 6,588 3,264 49.5 253 203
1982January ....................... 6,167 128 316 18 5,961 3,067 51.5 261 213February ..................... 5,899 133 -172 8 6,196 3,210 51.8 257 208March .......................... 5,994 183 -334 44 6,466 3,358 51.9 247 198April ............................ 6,095 185 -650 33 6,897 3,495 50.7 221 179May ............................. 6,319 182 -177 23 6,655 3,415 51.3 214 173June ............................ 6,754 230 134 14 6,835 3,565 52.2 219 177July ............................. 6,768 225 178 24 6,790 h 3,568 h 52.5 226 183August ........................ 6,419 291 81 16 6,614 3,526 53.3 227 185September .................. 6,527 223 198 22 6,531 3,404 52.1 234 191October ....................... 6,262 185 42 15 6,391 3,351 52.4 234 192November ................... 6,273 211 -101 11 6,574 3,451 52.5 230 189December ................... 6,542 178 165 7 6,549 3,485 53.2 f 235 f 194Average ..................... 6,338 197 -25 20 6,539 3,409 52.1 f 235 f 194
See footnotes at end of table.
Energy Information Administration/Historical Monthly Energy Review 1973-1992128
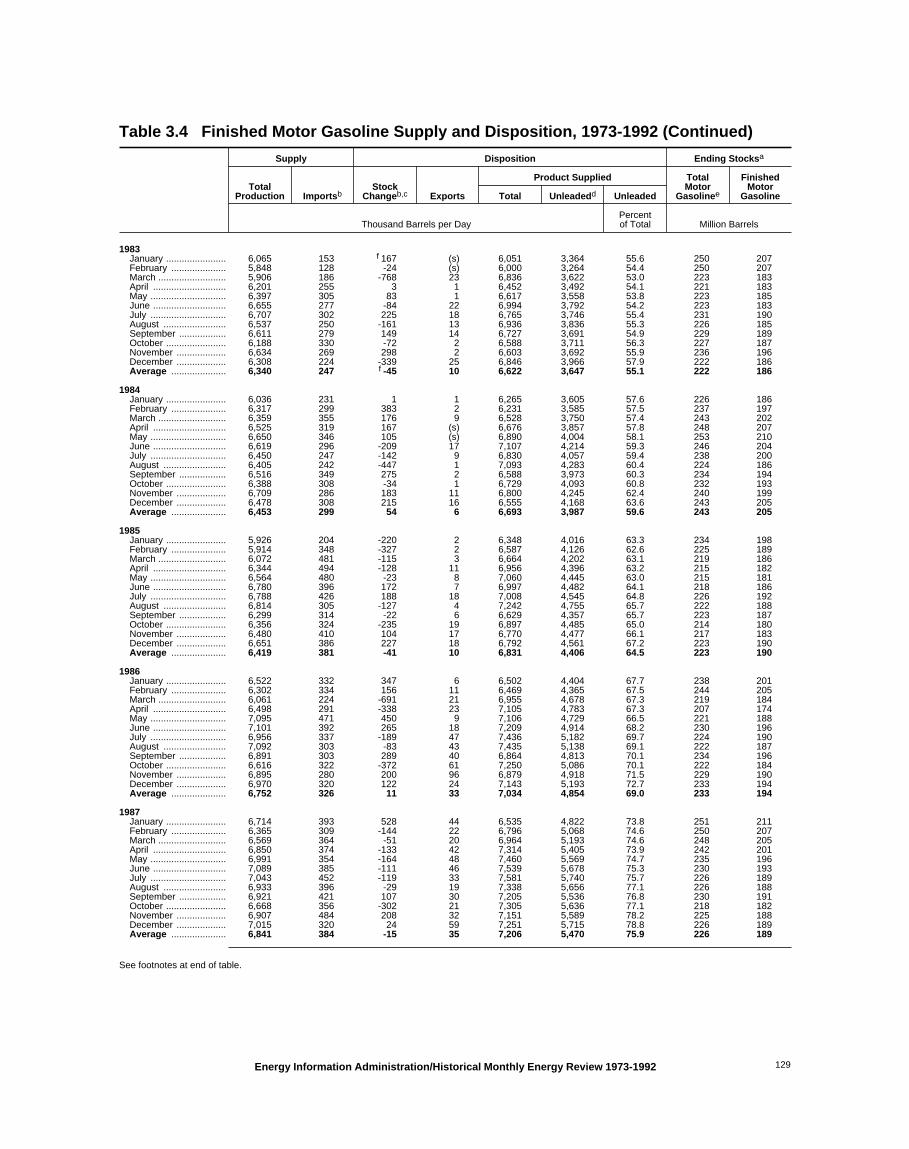
Table 3.4 Finished Motor Gasoline Supply and Disposition, 1973-1992 (Continued)
Supply Disposition Ending Stocksa
TotalProduction Importsb
StockChangeb,c Exports
Product Supplied TotalMotor
Gasolinee
FinishedMotor
GasolineTotal Unleadedd Unleaded
Thousand Barrels per DayPercentof Total Million Barrels
1983January ....................... 6,065 153 f 167 (s) 6,051 3,364 55.6 250 207February ..................... 5,848 128 -24 (s) 6,000 3,264 54.4 250 207March .......................... 5,906 186 -768 23 6,836 3,622 53.0 223 183April ............................ 6,201 255 3 1 6,452 3,492 54.1 221 183May ............................. 6,397 305 83 1 6,617 3,558 53.8 223 185June ............................ 6,655 277 -84 22 6,994 3,792 54.2 223 183July ............................. 6,707 302 225 18 6,765 3,746 55.4 231 190August ........................ 6,537 250 -161 13 6,936 3,836 55.3 226 185September .................. 6,611 279 149 14 6,727 3,691 54.9 229 189October ....................... 6,188 330 -72 2 6,588 3,711 56.3 227 187November ................... 6,634 269 298 2 6,603 3,692 55.9 236 196December ................... 6,308 224 -339 25 6,846 3,966 57.9 222 186Average ..................... 6,340 247 f -45 10 6,622 3,647 55.1 222 186
1984January ....................... 6,036 231 1 1 6,265 3,605 57.6 226 186February ..................... 6,317 299 383 2 6,231 3,585 57.5 237 197March .......................... 6,359 355 176 9 6,528 3,750 57.4 243 202April ............................ 6,525 319 167 (s) 6,676 3,857 57.8 248 207May ............................. 6,650 346 105 (s) 6,890 4,004 58.1 253 210June ............................ 6,619 296 -209 17 7,107 4,214 59.3 246 204July ............................. 6,450 247 -142 9 6,830 4,057 59.4 238 200August ........................ 6,405 242 -447 1 7,093 4,283 60.4 224 186September .................. 6,516 349 275 2 6,588 3,973 60.3 234 194October ....................... 6,388 308 -34 1 6,729 4,093 60.8 232 193November ................... 6,709 286 183 11 6,800 4,245 62.4 240 199December ................... 6,478 308 215 16 6,555 4,168 63.6 243 205Average ..................... 6,453 299 54 6 6,693 3,987 59.6 243 205
1985January ....................... 5,926 204 -220 2 6,348 4,016 63.3 234 198February ..................... 5,914 348 -327 2 6,587 4,126 62.6 225 189March .......................... 6,072 481 -115 3 6,664 4,202 63.1 219 186April ............................ 6,344 494 -128 11 6,956 4,396 63.2 215 182May ............................. 6,564 480 -23 8 7,060 4,445 63.0 215 181June ............................ 6,780 396 172 7 6,997 4,482 64.1 218 186July ............................. 6,788 426 188 18 7,008 4,545 64.8 226 192August ........................ 6,814 305 -127 4 7,242 4,755 65.7 222 188September .................. 6,299 314 -22 6 6,629 4,357 65.7 223 187October ....................... 6,356 324 -235 19 6,897 4,485 65.0 214 180November ................... 6,480 410 104 17 6,770 4,477 66.1 217 183December ................... 6,651 386 227 18 6,792 4,561 67.2 223 190Average ..................... 6,419 381 -41 10 6,831 4,406 64.5 223 190
1986January ....................... 6,522 332 347 6 6,502 4,404 67.7 238 201February ..................... 6,302 334 156 11 6,469 4,365 67.5 244 205March .......................... 6,061 224 -691 21 6,955 4,678 67.3 219 184April ............................ 6,498 291 -338 23 7,105 4,783 67.3 207 174May ............................. 7,095 471 450 9 7,106 4,729 66.5 221 188June ............................ 7,101 392 265 18 7,209 4,914 68.2 230 196July ............................. 6,956 337 -189 47 7,436 5,182 69.7 224 190August ........................ 7,092 303 -83 43 7,435 5,138 69.1 222 187September .................. 6,891 303 289 40 6,864 4,813 70.1 234 196October ....................... 6,616 322 -372 61 7,250 5,086 70.1 222 184November ................... 6,895 280 200 96 6,879 4,918 71.5 229 190December ................... 6,970 320 122 24 7,143 5,193 72.7 233 194Average ..................... 6,752 326 11 33 7,034 4,854 69.0 233 194
1987January ....................... 6,714 393 528 44 6,535 4,822 73.8 251 211February ..................... 6,365 309 -144 22 6,796 5,068 74.6 250 207March .......................... 6,569 364 -51 20 6,964 5,193 74.6 248 205April ............................ 6,850 374 -133 42 7,314 5,405 73.9 242 201May ............................. 6,991 354 -164 48 7,460 5,569 74.7 235 196June ............................ 7,089 385 -111 46 7,539 5,678 75.3 230 193July ............................. 7,043 452 -119 33 7,581 5,740 75.7 226 189August ........................ 6,933 396 -29 19 7,338 5,656 77.1 226 188September .................. 6,921 421 107 30 7,205 5,536 76.8 230 191October ....................... 6,668 356 -302 21 7,305 5,636 77.1 218 182November ................... 6,907 484 208 32 7,151 5,589 78.2 225 188December ................... 7,015 320 24 59 7,251 5,715 78.8 226 189Average ..................... 6,841 384 -15 35 7,206 5,470 75.9 226 189
See footnotes at end of table.
Energy Information Administration/Historical Monthly Energy Review 1973-1992 129
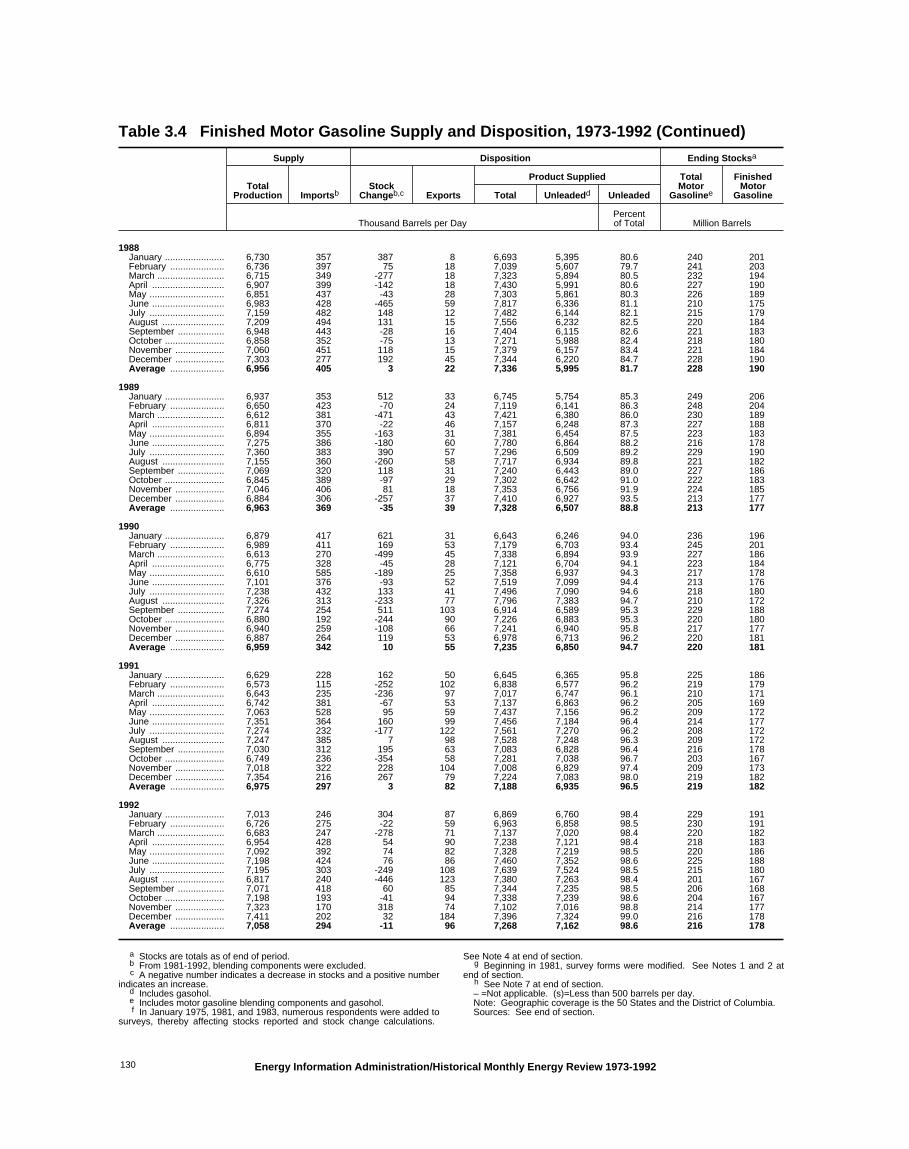
Table 3.4 Finished Motor Gasoline Supply and Disposition, 1973-1992 (Continued)
Supply Disposition Ending Stocksa
TotalProduction Importsb
StockChangeb,c Exports
Product Supplied TotalMotor
Gasolinee
FinishedMotor
GasolineTotal Unleadedd Unleaded
Thousand Barrels per DayPercentof Total Million Barrels
1988January ....................... 6,730 357 387 8 6,693 5,395 80.6 240 201February ..................... 6,736 397 75 18 7,039 5,607 79.7 241 203March .......................... 6,715 349 -277 18 7,323 5,894 80.5 232 194April ............................ 6,907 399 -142 18 7,430 5,991 80.6 227 190May ............................. 6,851 437 -43 28 7,303 5,861 80.3 226 189June ............................ 6,983 428 -465 59 7,817 6,336 81.1 210 175July ............................. 7,159 482 148 12 7,482 6,144 82.1 215 179August ........................ 7,209 494 131 15 7,556 6,232 82.5 220 184September .................. 6,948 443 -28 16 7,404 6,115 82.6 221 183October ....................... 6,858 352 -75 13 7,271 5,988 82.4 218 180November ................... 7,060 451 118 15 7,379 6,157 83.4 221 184December ................... 7,303 277 192 45 7,344 6,220 84.7 228 190Average ..................... 6,956 405 3 22 7,336 5,995 81.7 228 190
1989January ....................... 6,937 353 512 33 6,745 5,754 85.3 249 206February ..................... 6,650 423 -70 24 7,119 6,141 86.3 248 204March .......................... 6,612 381 -471 43 7,421 6,380 86.0 230 189April ............................ 6,811 370 -22 46 7,157 6,248 87.3 227 188May ............................. 6,894 355 -163 31 7,381 6,454 87.5 223 183June ............................ 7,275 386 -180 60 7,780 6,864 88.2 216 178July ............................. 7,360 383 390 57 7,296 6,509 89.2 229 190August ........................ 7,155 360 -260 58 7,717 6,934 89.8 221 182September .................. 7,069 320 118 31 7,240 6,443 89.0 227 186October ....................... 6,845 389 -97 29 7,302 6,642 91.0 222 183November ................... 7,046 406 81 18 7,353 6,756 91.9 224 185December ................... 6,884 306 -257 37 7,410 6,927 93.5 213 177Average ..................... 6,963 369 -35 39 7,328 6,507 88.8 213 177
1990January ....................... 6,879 417 621 31 6,643 6,246 94.0 236 196February ..................... 6,989 411 169 53 7,179 6,703 93.4 245 201March .......................... 6,613 270 -499 45 7,338 6,894 93.9 227 186April ............................ 6,775 328 -45 28 7,121 6,704 94.1 223 184May ............................. 6,610 585 -189 25 7,358 6,937 94.3 217 178June ............................ 7,101 376 -93 52 7,519 7,099 94.4 213 176July ............................. 7,238 432 133 41 7,496 7,090 94.6 218 180August ........................ 7,326 313 -233 77 7,796 7,383 94.7 210 172September .................. 7,274 254 511 103 6,914 6,589 95.3 229 188October ....................... 6,880 192 -244 90 7,226 6,883 95.3 220 180November ................... 6,940 259 -108 66 7,241 6,940 95.8 217 177December ................... 6,887 264 119 53 6,978 6,713 96.2 220 181Average ..................... 6,959 342 10 55 7,235 6,850 94.7 220 181
1991January ....................... 6,629 228 162 50 6,645 6,365 95.8 225 186February ..................... 6,573 115 -252 102 6,838 6,577 96.2 219 179March .......................... 6,643 235 -236 97 7,017 6,747 96.1 210 171April ............................ 6,742 381 -67 53 7,137 6,863 96.2 205 169May ............................. 7,063 528 95 59 7,437 7,156 96.2 209 172June ............................ 7,351 364 160 99 7,456 7,184 96.4 214 177July ............................. 7,274 232 -177 122 7,561 7,270 96.2 208 172August ........................ 7,247 385 7 98 7,528 7,248 96.3 209 172September .................. 7,030 312 195 63 7,083 6,828 96.4 216 178October ....................... 6,749 236 -354 58 7,281 7,038 96.7 203 167November ................... 7,018 322 228 104 7,008 6,829 97.4 209 173December ................... 7,354 216 267 79 7,224 7,083 98.0 219 182Average ..................... 6,975 297 3 82 7,188 6,935 96.5 219 182
1992January ....................... 7,013 246 304 87 6,869 6,760 98.4 229 191February ..................... 6,726 275 -22 59 6,963 6,858 98.5 230 191March .......................... 6,683 247 -278 71 7,137 7,020 98.4 220 182April ............................ 6,954 428 54 90 7,238 7,121 98.4 218 183May ............................. 7,092 392 74 82 7,328 7,219 98.5 220 186June ............................ 7,198 424 76 86 7,460 7,352 98.6 225 188July ............................. 7,195 303 -249 108 7,639 7,524 98.5 215 180August ........................ 6,817 240 -446 123 7,380 7,263 98.4 201 167September .................. 7,071 418 60 85 7,344 7,235 98.5 206 168October ....................... 7,198 193 -41 94 7,338 7,239 98.6 204 167November ................... 7,323 170 318 74 7,102 7,016 98.8 214 177December ................... 7,411 202 32 184 7,396 7,324 99.0 216 178Average ..................... 7,058 294 -11 96 7,268 7,162 98.6 216 178
a Stocks are totals as of end of period.b From 1981-1992, blending components were excluded.c A negative number indicates a decrease in stocks and a positive number
indicates an increase.d Includes gasohol.e Includes motor gasoline blending components and gasohol.f In January 1975, 1981, and 1983, numerous respondents were added to
surveys, thereby affecting stocks reported and stock change calculations.
See Note 4 at end of section.g Beginning in 1981, survey forms were modified. See Notes 1 and 2 at
end of section.h See Note 7 at end of section.– =Not applicable. (s)=Less than 500 barrels per day. Note: Geographic coverage is the 50 States and the District of Columbia.Sources: See end of section.
Energy Information Administration/Historical Monthly Energy Review 1973-1992130

Table 3.5 Distillate Fuel Oil Supply and Disposition, 1973-1992
Supply Disposition
EndingStocksc
TotalProduction Imports
Crude OilUsed
DirectlyaStock
Changeb ExportsProduct
Supplieda
Thousand Barrels per Day Million Barrels
1973January ............................. 3,031 364 1 -752 11 4,138 131February ........................... 2,940 731 2 -632 2 4,302 113March ................................ 2,670 602 2 -65 2 3,337 111April .................................. 2,513 240 2 114 7 2,635 115May ................................... 2,547 268 2 142 2 2,673 119June .................................. 2,827 222 2 625 8 2,419 138July ................................... 2,754 318 3 743 3 2,328 161August .............................. 2,803 288 2 529 9 2,555 177September ........................ 2,815 313 2 430 25 2,675 190October ............................. 2,913 451 2 413 23 2,930 203November ......................... 2,924 492 2 -93 3 3,508 200December ......................... 3,138 439 2 -121 10 3,690 196Average ........................... 2,822 392 2 115 9 3,092 196
1974January ............................. 2,882 464 2 -492 4 3,835 181February ........................... 2,399 306 2 -1,145 4 3,849 149March ................................ 2,227 287 2 -655 7 3,164 129April .................................. 2,523 220 2 -109 1 2,852 126May ................................... 2,705 268 2 524 1 2,450 142June .................................. 2,783 220 3 628 1 2,377 161July ................................... 2,792 221 2 704 3 2,309 182August .............................. 2,705 125 2 523 1 2,309 199September ........................ 2,552 152 2 320 1 2,385 208October ............................. 2,700 237 2 53 (s) 2,887 210November ......................... 2,801 454 2 99 2 3,157 213December ......................... 2,925 515 2 -414 3 3,853 e 200Average ........................... 2,669 289 2 d 10 2 2,948 e 200
1975January ............................. 2,853 334 2 e -774 (s) 3,963 200February ........................... 2,679 302 2 -822 2 3,803 177March ................................ 2,532 255 2 -503 (s) 3,292 161April .................................. 2,487 110 2 -496 2 3,094 146May ................................... 2,432 136 2 188 (s) 2,382 152June .................................. 2,574 69 1 376 2 2,267 163July ................................... 2,590 104 2 586 (s) 2,109 182August .............................. 2,592 92 2 511 2 2,173 197September ........................ 2,812 130 2 780 (s) 2,163 221October ............................. 2,745 104 1 174 (s) 2,677 226November ......................... 2,767 96 1 321 (s) 2,544 236December ......................... 2,784 138 1 -870 1 3,792 209Average ........................... 2,654 155 2 d,e -41 1 2,851 209
1976January ............................. 2,734 163 1 -1,399 (s) 4,297 165February ........................... 2,962 218 1 -517 1 3,697 150March ................................ 2,794 153 1 -391 1 3,339 138April .................................. 2,656 96 2 -35 1 2,788 137May ................................... 2,738 97 1 317 1 2,519 147June .................................. 2,886 151 1 600 1 2,436 165July ................................... 2,960 126 2 832 (s) 2,255 191August .............................. 2,982 131 2 873 4 2,237 218September ........................ 2,947 149 2 477 1 2,620 232October ............................. 2,996 144 1 109 1 3,031 236November ......................... 3,181 135 1 -398 1 3,714 224December ......................... 3,255 196 1 -1,216 1 4,667 186Average ........................... 2,924 146 1 -62 1 3,133 186
1977January ............................. 3,369 347 1 -1,386 1 5,103 143February ........................... 3,696 664 2 -348 1 4,708 133March ................................ 3,173 547 1 278 1 3,442 142April .................................. 2,995 153 2 211 3 2,936 148May ................................... 3,131 99 1 448 (s) 2,782 162June .................................. 3,191 135 1 557 (s) 2,770 179July ................................... 3,198 191 2 840 0 2,550 205August .............................. 3,273 161 2 803 (s) 2,632 230September ........................ 3,312 169 2 767 1 2,714 253October ............................. 3,362 150 1 471 5 3,037 267November ......................... 3,340 188 1 106 3 3,421 271December ......................... 3,323 227 1 -655 2 4,205 250Average ........................... 3,278 250 1 176 1 3,352 250
See footnotes at end of table.
Energy Information Administration/Historical Monthly Energy Review 1973-1992 131

Table 3.5 Distillate Fuel Oil Supply and Disposition, 1973-1992 (Continued)
Supply Disposition
EndingStocksc
TotalProduction Imports
Crude OilUsed
DirectlyaStock
Changeb ExportsProduct
Supplieda
Thousand Barrels per Day Million Barrels
1978January ............................. 3,067 196 1 -1,194 1 4,458 213February ........................... 2,952 212 2 -1,698 16 4,848 166March ................................ 3,015 193 1 -899 (s) 4,108 138April .................................. 2,960 100 2 -56 6 3,111 136May ................................... 3,250 125 1 273 1 3,103 145June .................................. 3,110 146 1 421 (s) 2,837 157July ................................... 3,124 149 2 748 4 2,522 180August .............................. 3,297 143 2 637 4 2,800 200September ........................ 3,185 163 2 684 2 2,664 221October ............................. 3,299 178 1 400 2 3,077 233November ......................... 3,367 223 1 5 3 3,583 233December ......................... 3,361 254 1 -541 2 4,156 216Average ........................... 3,167 173 1 -93 3 3,432 216
1979January ............................. 3,043 226 1 -1,311 1 4,581 176February ........................... 2,888 196 2 -1,734 7 4,812 127March ................................ 3,020 176 1 -469 1 3,664 113April .................................. 2,946 150 2 79 2 3,016 115May ................................... 3,066 185 1 255 (s) 2,998 123June .................................. 3,153 180 1 611 15 2,708 141July ................................... 3,306 225 2 963 7 2,563 171August .............................. 3,321 218 2 779 (s) 2,761 195September ........................ 3,355 126 2 834 2 2,647 220October ............................. 3,251 211 1 345 1 3,119 231November ......................... 3,240 193 1 186 (s) 3,247 237December ......................... 3,221 229 1 -256 (s) 3,708 229Average ........................... 3,153 193 1 34 3 3,311 229
1980January ............................. 3,014 179 1 -526 7 3,714 212February ........................... 2,766 237 1 -716 8 3,712 192March ................................ 2,558 193 1 -445 19 3,179 178April .................................. 2,461 154 2 -21 2 2,635 177May ................................... 2,474 126 1 199 1 2,402 183June .................................. 2,647 108 1 439 (s) 2,317 197July ................................... 2,690 117 2 557 3 2,249 214August .............................. 2,462 77 2 403 (s) 2,137 226September ........................ 2,686 101 2 201 (s) 2,587 232October ............................. 2,590 115 1 -215 (s) 2,920 226November ......................... 2,703 133 1 -111 (s) 2,949 222December ......................... 2,891 166 1 -556 (s) 3,615 e 205Average ........................... 2,662 142 1 -64 3 2,866 e 205
1981January f ........................... 2,989 273 11 e -836 (s) 4,109 179February ........................... 2,809 325 11 -246 17 3,373 173March ................................ 2,484 147 9 -264 (s) 2,904 164April .................................. 2,418 116 10 9 3 2,532 165May ................................... 2,454 179 10 232 (s) 2,411 172June .................................. 2,501 225 d 10 270 (s) 2,464 180July ................................... 2,395 179 10 204 2 2,378 186August .............................. 2,656 174 8 450 (s) 2,388 200September ........................ 2,610 129 10 235 1 2,513 207October ............................. 2,485 119 9 -197 5 2,803 201November ......................... 2,716 124 11 -36 6 2,880 200December ......................... 2,856 95 11 -277 26 3,212 192Average ........................... 2,613 173 10 e -38 5 2,829 192
1982January ............................. 2,591 97 10 -876 90 3,484 164February ........................... 2,427 132 11 -605 90 3,085 147March ................................ 2,288 48 10 -682 84 2,945 126April .................................. 2,358 59 13 -612 64 2,978 108May ................................... 2,618 74 10 183 75 2,444 114June .................................. 2,729 102 10 335 55 2,452 124July ................................... 2,734 125 11 789 24 2,058 148August .............................. 2,507 80 10 339 40 2,218 159September ........................ 2,657 61 12 85 139 2,507 161October ............................. 2,838 91 8 289 66 2,581 170November ......................... 2,860 145 8 514 24 2,475 186December ......................... 2,655 109 10 -225 143 2,855 e 179Average ........................... 2,606 93 10 -35 74 2,671 e 179
See footnotes at end of table.
Energy Information Administration/Historical Monthly Energy Review 1973-1992132

Table 3.5 Distillate Fuel Oil Supply and Disposition, 1973-1992 (Continued)
Supply Disposition
EndingStocksc
TotalProduction Imports
Crude OilUsed
DirectlyaStock
Changeb ExportsProduct
Supplieda
Thousand Barrels per Day Million Barrels
1983January ............................. 2,321 68 – e -580 173 2,797 168February ........................... 2,135 59 – -691 105 2,780 148March ................................ 1,993 42 – -971 59 2,947 118April .................................. 2,171 73 – -500 47 2,697 103May ................................... 2,444 147 – 186 50 2,354 109June .................................. 2,546 179 – 161 40 2,524 114July ................................... 2,604 267 – 546 55 2,270 131August .............................. 2,615 301 – 379 43 2,495 142September ........................ 2,739 259 – 386 37 2,575 154October ............................. 2,681 260 – 276 55 2,611 163November ......................... 2,680 203 – -45 54 2,874 161December ......................... 2,522 221 – -676 54 3,365 140Average ........................... 2,456 174 – e -124 64 2,690 140
1984January ............................. 2,591 299 – -676 40 3,525 119February ........................... 2,867 454 – 446 41 2,834 132March ................................ 2,479 115 – -731 66 3,259 110April .................................. 2,342 220 – -396 32 2,926 98May ................................... 2,624 253 – 15 48 2,814 98June .................................. 2,880 256 – 490 53 2,593 113July ................................... 2,719 199 – 373 40 2,504 124August .............................. 2,661 259 – 287 74 2,559 133September ........................ 2,707 291 – 321 22 2,654 143October ............................. 2,691 421 – 300 47 2,765 152November ......................... 2,826 316 – 291 24 2,827 161December ......................... 2,798 190 – 3 120 2,865 161Average ........................... 2,681 272 – 57 51 2,845 161
1985January ............................. 2,631 272 – -603 41 3,465 142February ........................... 2,504 143 – -748 64 3,330 121March ................................ 2,267 156 – -714 44 3,093 99April .................................. 2,490 253 – -82 27 2,798 97May ................................... 2,686 197 – 245 31 2,607 104June .................................. 2,647 152 – 175 30 2,594 110July ................................... 2,646 95 – 193 112 2,436 116August .............................. 2,592 81 – -62 100 2,636 114September ........................ 2,594 222 – 120 121 2,575 117October ............................. 2,902 262 – 195 67 2,901 123November ......................... 3,102 280 – 543 92 2,747 140December ......................... 3,176 287 – 128 81 3,254 144Average ........................... 2,687 200 – -48 67 2,868 144
1986January ............................. 2,899 325 – -232 126 3,330 136February ........................... 2,563 169 – -860 176 3,416 112March ................................ 2,643 217 – -438 131 3,168 99April .................................. 2,788 147 – -97 128 2,904 96May ................................... 2,858 149 – 95 149 2,762 99June .................................. 2,729 169 – 301 53 2,544 108July ................................... 2,710 313 – 355 75 2,592 119August .............................. 2,922 370 – 607 64 2,621 138September ........................ 2,865 262 – 489 98 2,540 152October ............................. 2,717 243 – -25 74 2,912 152November ......................... 2,917 254 – 222 72 2,877 158December ......................... 2,943 339 – -102 55 3,329 155Average ........................... 2,798 247 – 31 100 2,914 155
1987January ............................. 2,759 222 – -444 115 3,310 141February ........................... 2,556 253 – -629 93 3,345 124March ................................ 2,421 297 – -464 67 3,116 109April .................................. 2,553 192 – -300 53 2,991 100May ................................... 2,563 203 – 31 51 2,684 101June .................................. 2,689 265 – 104 61 2,790 104July ................................... 2,700 381 – 329 38 2,713 115August .............................. 2,706 222 – 327 47 2,553 125September ........................ 2,748 222 – 68 64 2,838 127October ............................. 2,780 237 – -187 53 3,151 121November ......................... 3,035 187 – 234 56 2,932 128December ......................... 3,242 378 – 209 92 3,318 134Average ........................... 2,731 255 – -56 66 2,976 134
See footnotes at end of table.
Energy Information Administration/Historical Monthly Energy Review 1973-1992 133

Table 3.5 Distillate Fuel Oil Supply and Disposition, 1973-1992 (Continued)
Supply Disposition
EndingStocksc
TotalProduction Imports
Crude OilUsed
DirectlyaStock
Changeb ExportsProduct
Supplieda
Thousand Barrels per Day Million Barrels
1988January ............................. 3,010 424 – -206 82 3,558 128February ........................... 2,667 383 – -614 107 3,557 110March ................................ 2,706 247 – -660 74 3,539 90April .................................. 2,867 210 – 171 42 2,864 95May ................................... 2,936 253 – 320 74 2,795 105June .................................. 2,893 222 – 185 76 2,854 110July ................................... 2,784 222 – 308 58 2,640 120August .............................. 2,848 279 – 185 70 2,873 126September ........................ 2,778 307 – 192 72 2,821 131October ............................. 2,827 336 – -103 48 3,218 128November ......................... 2,909 327 – 19 34 3,183 129December ......................... 3,068 409 – -171 87 3,560 124Average ........................... 2,859 302 – -30 69 3,122 124
1989January ............................. 2,974 346 – -93 110 3,303 121February ........................... 2,797 331 – -463 164 3,427 108March ................................ 2,713 439 – -352 76 3,428 97April .................................. 2,789 301 – 60 56 2,975 99May ................................... 2,750 290 – 35 51 2,954 100June .................................. 2,809 233 – (s) 39 3,002 100July ................................... 2,848 334 – 498 89 2,596 115August .............................. 2,907 254 – 41 154 2,966 116September ........................ 2,952 249 – 231 81 2,889 123October ............................. 2,906 261 – -50 90 3,127 122November ......................... 3,063 307 – -64 123 3,311 120December ......................... 3,266 324 – -454 130 3,914 106Average ........................... 2,899 306 – -49 97 3,157 106
1990January ............................. 3,130 505 – 388 62 3,185 118February ........................... 2,753 357 – -215 65 3,260 112March ................................ 2,657 281 – -415 75 3,277 99April .................................. 2,803 308 – 9 59 3,043 99May ................................... 2,874 209 – 108 75 2,900 103June .................................. 2,996 257 – 246 84 2,923 110July ................................... 3,008 236 – 487 30 2,726 125August .............................. 3,131 293 – 156 51 3,218 130September ........................ 2,968 226 – 207 123 2,864 136October ............................. 2,928 190 – 8 150 2,960 136November ......................... 2,915 238 – -129 188 3,094 132December ......................... 2,917 239 – -7 347 2,816 132Average ........................... 2,925 278 – 73 109 3,021 132
1991January ............................. 2,845 192 – -662 332 3,367 112February ........................... 2,870 139 – -359 393 2,976 102March ................................ 2,865 206 – -112 198 2,984 98April .................................. 2,819 258 – 156 81 2,839 103May ................................... 2,929 186 – 132 218 2,765 107June .................................. 2,941 209 – 225 150 2,775 114July ................................... 2,998 155 – 356 149 2,648 125August .............................. 2,961 168 – 214 144 2,770 131September ........................ 3,055 237 – 291 136 2,865 140October ............................. 3,040 207 – -59 259 3,047 138November ......................... 3,103 249 – 206 224 2,921 144December ......................... 3,107 252 – -30 302 3,087 144Average ........................... 2,962 205 – 31 215 2,921 144
1992January ............................. 2,818 232 – -541 360 3,231 127February ........................... 2,661 217 – -619 278 3,219 109March ................................ 2,749 238 – -358 138 3,207 98April .................................. 2,930 202 – -185 278 3,039 92May ................................... 2,933 179 – 139 222 2,753 96June .................................. 2,995 157 – 268 205 2,679 104July ................................... 3,067 172 – 328 201 2,710 115August .............................. 2,865 229 – 262 127 2,705 123September ........................ 2,983 237 – 168 145 2,908 128October ............................. 3,251 263 – 290 169 3,056 137November ......................... 3,240 236 – 316 230 2,929 146December ......................... 3,179 229 – -183 276 3,316 141Average ........................... 2,974 216 – -8 219 2,979 141
a Beginning in January 1983, crude oil used directly as distillate fuel oil isreported as crude oil product supplied on Table 3.2b rather than as distillatefuel oil product supplied.
b A negative number indicates a decrease in stocks and a positive numberindicates an increase.
c Stocks are totals as of end of period.d See Note 7 at end of section.e In January 1975, 1981, and 1983, numerous respondents were added to
surveys, thereby affecting stocks reported and stock change calculations.
See Note 4 at end of section.f Beginning in January 1981, survey forms were modified. See Note 3 at
end of section.– =Not applicable. (s)=Less than 500 barrels per day. Notes: • Totals may not equal sum of components due to independent
rounding. • Geographic coverage is the 50 States and the District ofColumbia.
Sources: See end of section.
Energy Information Administration/Historical Monthly Energy Review 1973-1992134

Table 3.6 Residual Fuel Oil Supply and Disposition, 1973-1992
Supply Disposition
EndingStocksc
TotalProduction Imports
Crude OilUsed
DirectlyaStock
Changeb ExportsProduct
Supplieda
Thousand Barrels per Day Million Barrels
1973January ............................. 1,112 2,019 11 -196 31 3,306 49February ........................... 1,038 2,147 11 -218 32 3,382 43March ................................ 955 2,196 11 53 24 3,084 45April .................................. 877 1,705 11 78 39 2,477 47May ................................... 948 1,668 10 70 35 2,521 49June .................................. 915 1,761 24 87 6 2,607 52July ................................... 882 1,597 16 50 34 2,412 53August .............................. 851 1,913 26 7 27 2,755 54September ........................ 878 1,849 19 50 20 2,676 55October ............................. 984 1,597 23 -4 19 2,590 55November ......................... 1,061 1,979 23 -99 5 3,158 52December ......................... 1,158 1,826 16 48 8 2,944 53Average ........................... 971 1,853 17 -5 23 2,822 53
1974January ............................. 1,072 1,733 17 -224 9 3,036 47February ........................... 1,029 1,904 15 -55 11 2,991 45March ................................ 912 1,713 11 72 9 2,556 47April .................................. 985 1,593 12 137 16 2,437 51May ................................... 995 1,362 12 97 12 2,260 54June .................................. 1,026 1,500 12 118 15 2,405 58July ................................... 1,056 1,474 12 61 7 2,473 60August .............................. 1,067 1,520 11 39 30 2,529 61September ........................ 1,032 1,421 12 -25 15 2,475 60October ............................. 1,099 1,465 13 -51 16 2,611 59November ......................... 1,229 1,753 18 56 8 2,935 60December ......................... 1,335 1,630 12 -22 15 2,983 d 60Average ........................... 1,070 1,587 13 17 14 2,639 d 60
1975January ............................. 1,415 1,657 12 d -184 15 3,253 69February ........................... 1,354 1,402 13 -98 19 2,849 66March ................................ 1,299 1,293 11 -76 10 2,669 64April .................................. 1,245 1,054 13 73 6 2,232 66May ................................... 1,151 1,160 15 231 8 2,087 73June .................................. 1,152 902 15 -128 21 2,177 70July ................................... 1,155 1,125 18 60 17 2,220 72August .............................. 1,146 1,021 13 11 12 2,157 72September ........................ 1,183 1,311 23 169 19 2,328 77October ............................. 1,165 1,251 16 159 5 2,268 82November ......................... 1,214 1,225 21 42 13 2,405 83December ......................... 1,354 1,283 16 -290 32 2,912 74Average ........................... 1,235 1,223 15 d -2 15 2,462 74
1976January ............................. 1,415 1,455 18 -243 13 3,118 67February ........................... 1,394 1,774 17 78 30 3,077 69March ................................ 1,311 1,342 16 -120 10 2,779 65April .................................. 1,283 1,258 17 44 18 2,496 66May ................................... 1,257 1,134 17 -42 10 2,439 65June .................................. 1,241 1,229 17 -29 7 2,509 64July ................................... 1,266 1,455 16 179 11 2,548 70August .............................. 1,321 1,307 16 -43 8 2,678 68September ........................ 1,330 1,452 18 265 8 2,526 76October ............................. 1,351 1,270 18 86 5 2,547 79November ......................... 1,581 1,474 19 -194 16 3,253 73December ......................... 1,772 1,828 18 -30 4 3,645 72Average ........................... 1,377 1,413 17 -5 12 2,801 72
1977January ............................. 1,892 1,615 13 -245 2 3,761 65February ........................... 1,955 1,996 14 238 8 3,719 71March ................................ 1,720 1,448 13 -8 3 3,185 71April .................................. 1,691 1,140 13 -34 3 2,874 70May ................................... 1,682 1,145 13 104 5 2,729 73June .................................. 1,720 1,181 13 -46 2 2,958 72July ................................... 1,735 1,271 12 187 18 2,812 78August .............................. 1,635 1,441 13 31 9 3,049 79September ........................ 1,750 1,458 12 291 3 2,926 88October ............................. 1,749 1,218 13 270 2 2,707 96November ......................... 1,695 1,094 12 -25 7 2,819 95December ......................... 1,839 1,348 12 -167 12 3,354 90Average ........................... 1,754 1,359 13 48 6 3,071 90
See footnotes at end of table.
Energy Information Administration/Historical Monthly Energy Review 1973-1992 135

Table 3.6 Residual Fuel Oil Supply and Disposition, 1973-1992 (Continued)
Supply Disposition
EndingStocksc
TotalProduction Imports
Crude OilUsed
DirectlyaStock
Changeb ExportsProduct
Supplieda
Thousand Barrels per Day Million Barrels
1978January ............................. 1,868 1,380 13 -269 13 3,518 82February ........................... 1,795 1,582 14 -592 10 3,974 65March ................................ 1,751 1,710 14 -87 22 3,540 62April .................................. 1,548 1,575 14 127 7 3,003 66May ................................... 1,653 1,231 13 194 16 2,686 72June .................................. 1,572 1,031 14 -12 4 2,625 72July ................................... 1,586 1,295 12 112 10 2,772 75August .............................. 1,630 1,275 12 -37 25 2,929 74September ........................ 1,636 1,318 12 238 12 2,716 81October ............................. 1,564 1,121 13 68 8 2,621 83November ......................... 1,662 1,353 13 176 6 2,845 89December ......................... 1,750 1,409 13 47 19 3,107 90Average ........................... 1,667 1,355 13 1 13 3,023 90
1979January ............................. 1,912 1,371 14 -269 6 3,560 82February ........................... 1,792 1,300 14 -498 10 3,595 68March ................................ 1,719 1,642 14 121 14 3,239 72April .................................. 1,639 1,134 13 277 2 2,507 80May ................................... 1,586 1,051 12 139 8 2,503 84June .................................. 1,548 880 14 -148 8 2,583 80July ................................... 1,575 1,065 13 196 5 2,451 86August .............................. 1,584 1,023 13 55 14 2,550 88September ........................ 1,627 979 10 6 2 2,609 88October ............................. 1,629 1,042 9 123 18 2,540 92November ......................... 1,736 1,046 10 -27 5 2,815 91December ......................... 1,894 1,278 10 155 14 3,013 96Average ........................... 1,687 1,151 12 15 9 2,826 96
1980January ............................. 1,771 e 1,339 14 51 5 3,067 97February ........................... 1,773 1,122 14 -214 17 3,105 91March ................................ 1,584 976 14 -87 2 2,658 88April .................................. 1,595 775 13 -102 40 2,444 85May ................................... 1,509 812 12 78 20 2,235 88June .................................. 1,575 749 14 4 14 2,321 88July ................................... 1,480 787 13 -71 60 2,291 86August .............................. 1,444 875 13 43 2 2,286 87September ........................ 1,495 906 10 31 21 2,359 88October ............................. 1,512 875 9 100 70 2,227 91November ......................... 1,579 1,024 10 74 88 2,451 93December ......................... 1,660 1,025 10 -46 62 2,679 d 92Average ........................... 1,580 939 12 -10 33 2,508 d 92
1981January f ........................... 1,612 1,015 32 d -302 65 2,896 82February ........................... 1,565 954 44 -150 125 2,588 78March ................................ 1,424 699 48 -100 145 2,126 75April .................................. 1,320 584 49 -66 151 1,868 73May ................................... 1,223 741 49 170 25 1,817 78June .................................. 1,232 540 49 -291 76 2,037 69July ................................... 1,174 830 48 -2 82 1,971 69August .............................. 1,231 819 50 179 69 1,852 75September ........................ 1,292 841 51 176 126 1,882 80October ............................. 1,238 e 783 54 -8 202 1,884 80November ......................... 1,227 880 53 49 203 1,909 81December ......................... 1,329 916 52 -110 157 2,250 78Average ........................... 1,321 800 48 d -37 118 2,088 78
1982January ............................. 1,235 831 53 -301 235 2,185 69February ........................... 1,186 956 53 -363 213 2,344 58March ................................ 1,123 912 53 -12 197 1,903 58April .................................. 1,166 788 52 -150 234 1,923 54May ................................... 1,128 742 52 172 191 1,560 59June .................................. 1,074 652 50 57 217 1,501 61July ................................... 1,028 657 49 -56 239 1,550 59August .............................. 965 e 550 47 -203 235 e 1,530 53September ........................ 1,008 872 44 306 148 1,470 62October ............................. 955 783 43 57 234 1,490 64November ......................... 989 e 836 43 94 182 1,591 66December ......................... 989 747 43 -6 186 1,598 d 66Average ........................... 1,070 776 48 -32 209 1,716 d 66
See footnotes at end of table.
Energy Information Administration/Historical Monthly Energy Review 1973-1992136

Table 3.6 Residual Fuel Oil Supply and Disposition, 1973-1992 (Continued)
Supply Disposition
EndingStocksc
TotalProduction Imports
Crude OilUsed
DirectlyaStock
Changeb ExportsProduct
Supplieda
Thousand Barrels per Day Million Barrels
1983January ............................. 972 691 – d -258 294 1,626 61February ........................... 857 647 – -257 191 1,570 53March ................................ 835 686 – -227 169 1,579 46April .................................. 941 753 – 10 310 1,374 47May ................................... 936 738 – 141 190 1,342 51June .................................. 828 677 – -36 218 1,323 50July ................................... 769 684 – 64 90 1,299 52August .............................. 710 739 – -115 165 1,400 48September ........................ 826 706 – 47 134 1,351 50October ............................. 807 638 – 50 153 1,243 51November ......................... 845 780 – 97 167 1,362 54December ......................... 897 649 – -182 141 1,587 49Average ........................... 852 699 – d -55 185 1,421 49
1984January ............................. 961 1,059 – -110 151 1,979 45February ........................... 1,003 1,151 – 416 87 1,651 57March ................................ 889 636 – -298 204 1,619 48April .................................. 847 651 – -15 130 1,384 47May ................................... 840 565 – -32 200 1,237 46June .................................. 849 685 – 15 176 1,344 47July ................................... 770 597 – 76 99 1,192 49August .............................. 800 572 – -149 260 1,261 45September ........................ 850 606 – 74 214 1,168 47October ............................. 907 461 – 127 174 1,066 51November ......................... 928 585 – -125 286 1,352 47December ......................... 1,053 627 – 193 299 1,189 53Average ........................... 891 681 – 12 190 1,369 53
1985January ............................. 1,004 568 – -219 312 1,480 46February ........................... 1,040 580 – -41 295 1,366 45March ................................ 963 477 – 35 216 1,190 46April .................................. 912 383 – 2 167 1,126 46May ................................... 793 394 – -155 185 1,156 41June .................................. 702 400 – -59 118 1,043 40July ................................... 732 437 – 29 83 1,058 41August .............................. 742 424 – -108 106 1,168 37September ........................ 808 617 – 207 188 1,031 43October ............................. 912 541 – 228 184 1,042 50November ......................... 932 627 – -5 275 1,290 50December ......................... 1,055 681 – 4 250 1,483 50Average ........................... 882 510 – -7 197 1,202 50
1986January ............................. 940 622 – -56 211 1,407 49February ........................... 856 604 – -200 183 1,478 43March ................................ 813 626 – -108 113 1,435 40April .................................. 933 545 – -127 202 1,402 36May ................................... 913 675 – 114 129 1,345 39June .................................. 818 712 – 111 43 1,377 43July ................................... 850 673 – -75 90 1,508 40August .............................. 896 793 – 29 174 1,485 41September ........................ 854 641 – 89 110 1,296 44October ............................. 827 635 – 59 144 1,259 46November ......................... 975 574 – 15 143 1,391 46December ......................... 987 913 – 37 224 1,638 47Average ........................... 889 669 – -8 147 1,418 47
1987January ............................. 920 701 – -81 198 1,504 45February ........................... 825 668 – -243 221 1,515 38March ................................ 863 559 – 38 150 1,234 39April .................................. 831 476 – -114 239 1,182 36May ................................... 813 505 – 145 144 1,029 40June .................................. 864 481 – 33 105 1,207 41July ................................... 901 721 – 108 175 1,339 45August .............................. 882 512 – 32 185 1,176 46September ........................ 904 526 – -42 177 1,296 44October ............................. 887 414 – 39 194 1,069 46November ......................... 928 568 – 145 146 1,205 50December ......................... 1,001 650 – -83 300 1,434 47Average ........................... 885 565 – (s) 186 1,264 47
See footnotes at end of table.
Energy Information Administration/Historical Monthly Energy Review 1973-1992 137
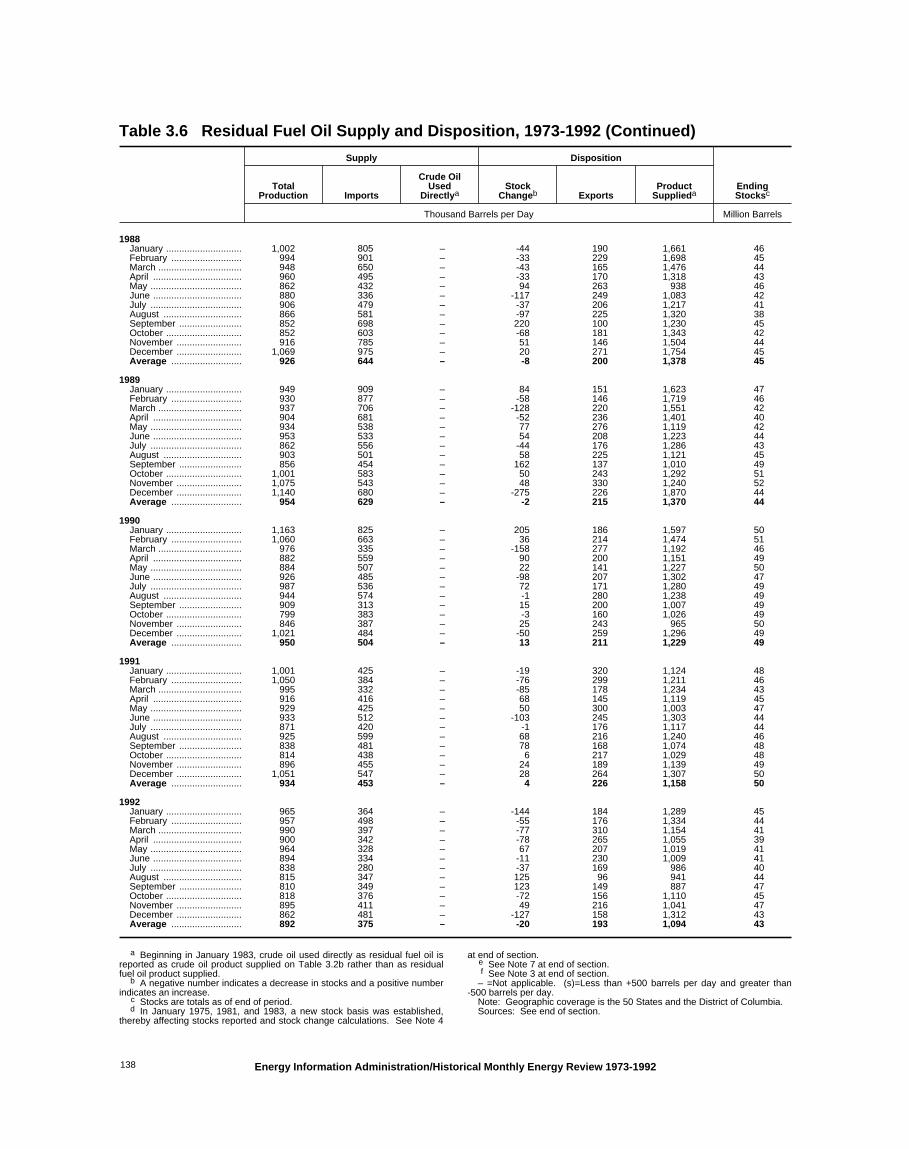
Table 3.6 Residual Fuel Oil Supply and Disposition, 1973-1992 (Continued)
Supply Disposition
EndingStocksc
TotalProduction Imports
Crude OilUsed
DirectlyaStock
Changeb ExportsProduct
Supplieda
Thousand Barrels per Day Million Barrels
1988January ............................. 1,002 805 – -44 190 1,661 46February ........................... 994 901 – -33 229 1,698 45March ................................ 948 650 – -43 165 1,476 44April .................................. 960 495 – -33 170 1,318 43May ................................... 862 432 – 94 263 938 46June .................................. 880 336 – -117 249 1,083 42July ................................... 906 479 – -37 206 1,217 41August .............................. 866 581 – -97 225 1,320 38September ........................ 852 698 – 220 100 1,230 45October ............................. 852 603 – -68 181 1,343 42November ......................... 916 785 – 51 146 1,504 44December ......................... 1,069 975 – 20 271 1,754 45Average ........................... 926 644 – -8 200 1,378 45
1989January ............................. 949 909 – 84 151 1,623 47February ........................... 930 877 – -58 146 1,719 46March ................................ 937 706 – -128 220 1,551 42April .................................. 904 681 – -52 236 1,401 40May ................................... 934 538 – 77 276 1,119 42June .................................. 953 533 – 54 208 1,223 44July ................................... 862 556 – -44 176 1,286 43August .............................. 903 501 – 58 225 1,121 45September ........................ 856 454 – 162 137 1,010 49October ............................. 1,001 583 – 50 243 1,292 51November ......................... 1,075 543 – 48 330 1,240 52December ......................... 1,140 680 – -275 226 1,870 44Average ........................... 954 629 – -2 215 1,370 44
1990January ............................. 1,163 825 – 205 186 1,597 50February ........................... 1,060 663 – 36 214 1,474 51March ................................ 976 335 – -158 277 1,192 46April .................................. 882 559 – 90 200 1,151 49May ................................... 884 507 – 22 141 1,227 50June .................................. 926 485 – -98 207 1,302 47July ................................... 987 536 – 72 171 1,280 49August .............................. 944 574 – -1 280 1,238 49September ........................ 909 313 – 15 200 1,007 49October ............................. 799 383 – -3 160 1,026 49November ......................... 846 387 – 25 243 965 50December ......................... 1,021 484 – -50 259 1,296 49Average ........................... 950 504 – 13 211 1,229 49
1991January ............................. 1,001 425 – -19 320 1,124 48February ........................... 1,050 384 – -76 299 1,211 46March ................................ 995 332 – -85 178 1,234 43April .................................. 916 416 – 68 145 1,119 45May ................................... 929 425 – 50 300 1,003 47June .................................. 933 512 – -103 245 1,303 44July ................................... 871 420 – -1 176 1,117 44August .............................. 925 599 – 68 216 1,240 46September ........................ 838 481 – 78 168 1,074 48October ............................. 814 438 – 6 217 1,029 48November ......................... 896 455 – 24 189 1,139 49December ......................... 1,051 547 – 28 264 1,307 50Average ........................... 934 453 – 4 226 1,158 50
1992January ............................. 965 364 – -144 184 1,289 45February ........................... 957 498 – -55 176 1,334 44March ................................ 990 397 – -77 310 1,154 41April .................................. 900 342 – -78 265 1,055 39May ................................... 964 328 – 67 207 1,019 41June .................................. 894 334 – -11 230 1,009 41July ................................... 838 280 – -37 169 986 40August .............................. 815 347 – 125 96 941 44September ........................ 810 349 – 123 149 887 47October ............................. 818 376 – -72 156 1,110 45November ......................... 895 411 – 49 216 1,041 47December ......................... 862 481 – -127 158 1,312 43Average ........................... 892 375 – -20 193 1,094 43
a Beginning in January 1983, crude oil used directly as residual fuel oil isreported as crude oil product supplied on Table 3.2b rather than as residualfuel oil product supplied.
b A negative number indicates a decrease in stocks and a positive numberindicates an increase.
c Stocks are totals as of end of period.d In January 1975, 1981, and 1983, a new stock basis was established,
thereby affecting stocks reported and stock change calculations. See Note 4
at end of section.e See Note 7 at end of section.f See Note 3 at end of section.
– =Not applicable. (s)=Less than +500 barrels per day and greater than-500 barrels per day.
Note: Geographic coverage is the 50 States and the District of Columbia.Sources: See end of section.
Energy Information Administration/Historical Monthly Energy Review 1973-1992138

Table 3.7 Jet Fuel Supply and Disposition, 1973-1992
Supply Disposition
Ending StocksaProduction
ImportsStock
Changeb Exports
Product Supplied
Total Kerosene Type Total Kerosene Type Total Kerosene Type
Thousand Barrels per Day Million Barrels
1973January ............................. 864 694 231 -22 7 1,110 914 25 19February ........................... 898 735 221 22 7 1,090 901 25 20March ................................ 917 722 152 69 6 994 804 28 22April .................................. 887 689 145 10 8 1,015 767 28 23May ................................... 840 646 211 -66 4 1,112 892 26 21June .................................. 836 658 164 -13 5 1,007 784 25 21July ................................... 825 669 232 7 3 1,046 848 26 21August .............................. 844 671 180 -26 1 1,049 816 25 21September ........................ 847 661 235 10 2 1,070 857 25 20October ............................. 875 705 246 14 3 1,104 849 26 21November ......................... 852 689 275 99 3 1,025 829 29 24December ......................... 830 611 259 (s) 2 1,087 848 29 23Average ........................... 859 679 212 8 4 1,059 842 29 23
1974January ............................. 800 624 136 38 2 895 722 30 24February ........................... 783 610 75 -4 2 860 694 30 24March ................................ 832 617 139 12 3 956 752 30 23April .................................. 868 664 132 58 2 941 723 32 25May ................................... 868 647 205 19 1 1,053 782 32 26June .................................. 810 596 141 -4 3 952 710 32 26July ................................... 802 635 214 -17 5 1,028 814 32 25August .............................. 805 638 206 -22 2 1,031 792 31 25September ........................ 867 651 217 -27 1 1,109 846 30 24October ............................. 868 670 161 12 5 1,011 782 31 25November ......................... 863 646 140 -32 2 1,032 792 30 24December ......................... 861 688 178 -6 2 1,043 834 c 29 c 24Average ........................... 836 641 163 2 3 993 771 c 29 c 24
1975January ............................. 831 693 229 c 18 2 1,041 871 30 25February ........................... 835 669 200 -42 2 1,075 869 29 24March ................................ 896 698 130 43 1 982 777 30 24April .................................. 864 698 137 -6 1 1,006 814 30 24May ................................... 861 678 133 15 2 977 762 31 25June .................................. 839 675 106 -46 1 989 797 29 24July ................................... 883 696 88 15 2 954 761 30 24August .............................. 958 770 132 42 2 1,046 834 31 25September ........................ 907 716 140 6 2 1,040 806 31 25October ............................. 864 667 106 -28 1 997 776 30 25November ......................... 864 662 89 -48 1 999 763 29 23December ......................... 849 672 109 45 2 911 673 30 25Average ........................... 871 691 133 c 2 2 1,001 791 30 25
1976January ............................. 889 728 69 8 3 948 806 31 24February ........................... 918 751 71 19 4 965 777 31 25March ................................ 927 756 86 46 2 965 774 33 27April .................................. 927 731 108 24 2 1,010 804 33 28May ................................... 899 684 106 43 1 960 745 35 28June .................................. 879 708 68 -26 1 972 776 34 28July ................................... 933 746 130 -37 2 1,099 885 33 27August .............................. 942 753 38 13 2 965 776 33 27September ........................ 990 772 63 3 2 1,048 805 33 27October ............................. 890 692 50 27 2 911 734 34 27November ......................... 920 731 56 -6 3 978 767 34 27December ......................... 900 715 72 -57 2 1,027 813 32 26Average ........................... 918 731 76 5 2 987 789 32 26
1977January ............................. 916 739 77 -62 2 1,054 879 30 23February ........................... 973 795 74 9 2 1,036 837 30 24March ................................ 953 757 99 10 2 1,040 808 31 25April .................................. 989 817 86 54 4 1,017 790 32 27May ................................... 977 788 57 42 2 991 784 34 28June .................................. 994 795 30 36 1 988 781 35 29July ................................... 967 787 85 10 1 1,041 843 35 29August .............................. 1,007 816 71 -34 1 1,111 897 34 28September ........................ 1,002 828 53 6 2 1,048 845 34 29October ............................. 972 768 67 22 2 1,016 817 35 28November ......................... 948 755 107 19 1 1,035 806 35 29December ......................... 976 799 90 -27 2 1,091 884 35 28Average ........................... 973 787 75 7 2 1,039 831 35 28
See footnotes at end of table.
Energy Information Administration/Historical Monthly Energy Review 1973-1992 139
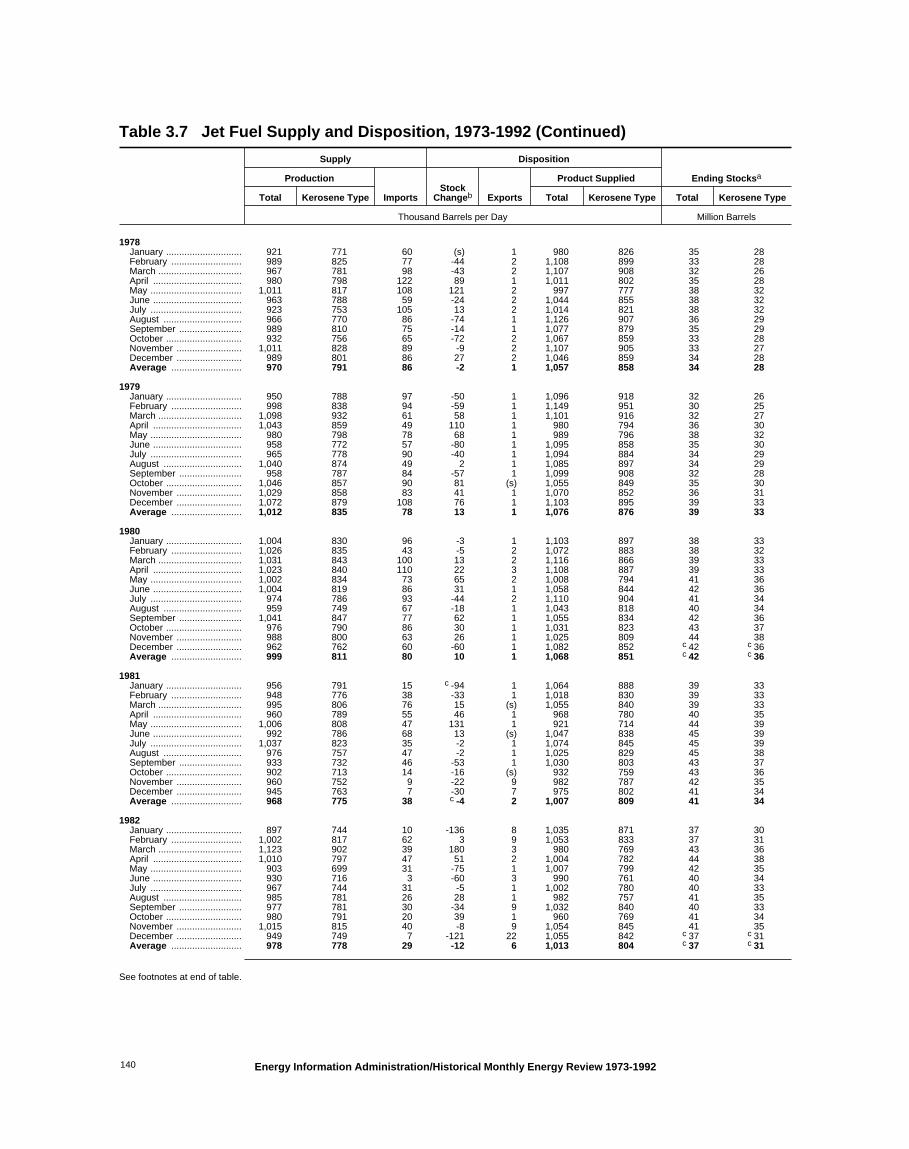
Table 3.7 Jet Fuel Supply and Disposition, 1973-1992 (Continued)
Supply Disposition
Ending StocksaProduction
ImportsStock
Changeb Exports
Product Supplied
Total Kerosene Type Total Kerosene Type Total Kerosene Type
Thousand Barrels per Day Million Barrels
1978January ............................. 921 771 60 (s) 1 980 826 35 28February ........................... 989 825 77 -44 2 1,108 899 33 28March ................................ 967 781 98 -43 2 1,107 908 32 26April .................................. 980 798 122 89 1 1,011 802 35 28May ................................... 1,011 817 108 121 2 997 777 38 32June .................................. 963 788 59 -24 2 1,044 855 38 32July ................................... 923 753 105 13 2 1,014 821 38 32August .............................. 966 770 86 -74 1 1,126 907 36 29September ........................ 989 810 75 -14 1 1,077 879 35 29October ............................. 932 756 65 -72 2 1,067 859 33 28November ......................... 1,011 828 89 -9 2 1,107 905 33 27December ......................... 989 801 86 27 2 1,046 859 34 28Average ........................... 970 791 86 -2 1 1,057 858 34 28
1979January ............................. 950 788 97 -50 1 1,096 918 32 26February ........................... 998 838 94 -59 1 1,149 951 30 25March ................................ 1,098 932 61 58 1 1,101 916 32 27April .................................. 1,043 859 49 110 1 980 794 36 30May ................................... 980 798 78 68 1 989 796 38 32June .................................. 958 772 57 -80 1 1,095 858 35 30July ................................... 965 778 90 -40 1 1,094 884 34 29August .............................. 1,040 874 49 2 1 1,085 897 34 29September ........................ 958 787 84 -57 1 1,099 908 32 28October ............................. 1,046 857 90 81 (s) 1,055 849 35 30November ......................... 1,029 858 83 41 1 1,070 852 36 31December ......................... 1,072 879 108 76 1 1,103 895 39 33Average ........................... 1,012 835 78 13 1 1,076 876 39 33
1980January ............................. 1,004 830 96 -3 1 1,103 897 38 33February ........................... 1,026 835 43 -5 2 1,072 883 38 32March ................................ 1,031 843 100 13 2 1,116 866 39 33April .................................. 1,023 840 110 22 3 1,108 887 39 33May ................................... 1,002 834 73 65 2 1,008 794 41 36June .................................. 1,004 819 86 31 1 1,058 844 42 36July ................................... 974 786 93 -44 2 1,110 904 41 34August .............................. 959 749 67 -18 1 1,043 818 40 34September ........................ 1,041 847 77 62 1 1,055 834 42 36October ............................. 976 790 86 30 1 1,031 823 43 37November ......................... 988 800 63 26 1 1,025 809 44 38December ......................... 962 762 60 -60 1 1,082 852 c 42 c 36Average ........................... 999 811 80 10 1 1,068 851 c 42 c 36
1981January ............................. 956 791 15 c -94 1 1,064 888 39 33February ........................... 948 776 38 -33 1 1,018 830 39 33March ................................ 995 806 76 15 (s) 1,055 840 39 33April .................................. 960 789 55 46 1 968 780 40 35May ................................... 1,006 808 47 131 1 921 714 44 39June .................................. 992 786 68 13 (s) 1,047 838 45 39July ................................... 1,037 823 35 -2 1 1,074 845 45 39August .............................. 976 757 47 -2 1 1,025 829 45 38September ........................ 933 732 46 -53 1 1,030 803 43 37October ............................. 902 713 14 -16 (s) 932 759 43 36November ......................... 960 752 9 -22 9 982 787 42 35December ......................... 945 763 7 -30 7 975 802 41 34Average ........................... 968 775 38 c -4 2 1,007 809 41 34
1982January ............................. 897 744 10 -136 8 1,035 871 37 30February ........................... 1,002 817 62 3 9 1,053 833 37 31March ................................ 1,123 902 39 180 3 980 769 43 36April .................................. 1,010 797 47 51 2 1,004 782 44 38May ................................... 903 699 31 -75 1 1,007 799 42 35June .................................. 930 716 3 -60 3 990 761 40 34July ................................... 967 744 31 -5 1 1,002 780 40 33August .............................. 985 781 26 28 1 982 757 41 35September ........................ 977 781 30 -34 9 1,032 840 40 33October ............................. 980 791 20 39 1 960 769 41 34November ......................... 1,015 815 40 -8 9 1,054 845 41 35December ......................... 949 749 7 -121 22 1,055 842 c 37 c 31Average ........................... 978 778 29 -12 6 1,013 804 c 37 c 31
See footnotes at end of table.
Energy Information Administration/Historical Monthly Energy Review 1973-1992140

Table 3.7 Jet Fuel Supply and Disposition, 1973-1992 (Continued)
Supply Disposition
Ending StocksaProduction
ImportsStock
Changeb Exports
Product Supplied
Total Kerosene Type Total Kerosene Type Total Kerosene Type
Thousand Barrels per Day Million Barrels
1983January ............................. 1,009 808 27 c 67 9 960 767 41 34February ........................... 1,010 786 8 -48 8 1,059 826 39 33March ................................ 1,042 814 35 71 1 1,006 783 42 35April .................................. 981 793 15 -42 7 1,031 834 40 34May ................................... 1,007 778 29 27 1 1,008 787 41 34June .................................. 1,048 832 26 -1 1 1,074 866 41 34July ................................... 1,037 816 30 -11 1 1,076 861 41 34August .............................. 1,014 812 40 -25 6 1,073 849 40 34September ........................ 1,090 890 44 48 9 1,077 881 41 35October ............................. 1,008 847 49 57 1 1,000 820 43 37November ......................... 1,079 876 23 80 12 1,009 819 46 39December ......................... 946 751 24 -226 15 1,181 975 39 32Average ........................... 1,022 817 29 c (s) 6 1,046 839 39 32
1984January ............................. 1,049 870 65 -98 10 1,202 1,011 36 29February ........................... 1,131 938 114 121 5 1,120 919 39 33March ................................ 1,104 893 49 51 1 1,102 898 41 34April .................................. 1,068 871 103 4 6 1,161 903 41 34May ................................... 1,100 890 56 9 1 1,146 905 41 34June .................................. 1,125 916 52 64 9 1,104 892 43 36July ................................... 1,179 948 40 21 10 1,189 956 44 37August .............................. 1,216 973 98 63 2 1,248 992 46 39September ........................ 1,155 926 33 -19 1 1,207 977 45 38October ............................. 1,170 958 56 -10 13 1,224 1,002 45 38November ......................... 1,141 920 36 8 11 1,158 924 45 38December ......................... 1,146 931 39 -95 40 1,241 1,051 42 35Average ........................... 1,132 919 62 9 9 1,175 953 42 35
1985January ............................. 1,143 958 68 -28 3 1,236 1,018 41 35February ........................... 1,176 981 38 14 22 1,178 966 41 35March ................................ 1,192 1,003 47 69 6 1,163 976 44 37April .................................. 1,159 937 17 -80 5 1,251 1,007 41 35May ................................... 1,145 915 30 36 5 1,134 906 42 36June .................................. 1,125 914 35 14 3 1,142 910 43 37July ................................... 1,177 954 51 8 3 1,217 1,009 43 36August .............................. 1,175 966 13 -44 23 1,209 998 42 35September ........................ 1,195 989 34 13 7 1,209 1,002 42 35October ............................. 1,239 1,036 55 8 28 1,258 1,041 42 36November ......................... 1,299 1,090 42 30 34 1,276 1,066 43 36December ......................... 1,240 1,051 37 -88 21 1,344 1,152 40 34Average ........................... 1,189 983 39 -4 13 1,218 1,005 40 34
1986January ............................. 1,337 1,143 27 36 38 1,290 1,090 42 35February ........................... 1,347 1,175 35 90 16 1,276 1,093 44 38March ................................ 1,292 1,119 29 111 12 1,199 1,007 48 42April .................................. 1,165 963 43 -66 17 1,257 1,086 46 39May ................................... 1,201 1,004 54 -7 14 1,248 1,030 45 39June .................................. 1,275 1,066 85 32 6 1,322 1,106 46 40July ................................... 1,288 1,084 121 74 10 1,325 1,091 49 42August .............................. 1,269 1,072 85 -3 5 1,352 1,164 48 42September ........................ 1,290 1,093 60 15 14 1,321 1,122 49 42October ............................. 1,314 1,112 38 54 25 1,272 1,066 51 44November ......................... 1,327 1,125 59 -16 22 1,380 1,171 50 43December ......................... 1,414 1,210 48 -13 30 1,445 1,236 50 43Average ........................... 1,293 1,097 57 25 18 1,307 1,105 50 43
1987January ............................. 1,366 1,192 43 (s) 47 1,361 1,202 50 42February ........................... 1,329 1,135 67 -52 20 1,427 1,213 48 41March ................................ 1,282 1,095 83 -7 8 1,365 1,169 48 41April .................................. 1,254 1,052 65 -31 4 1,345 1,146 47 40May ................................... 1,251 1,035 67 6 4 1,307 1,118 47 39June .................................. 1,252 1,048 66 -47 5 1,360 1,127 46 39July ................................... 1,347 1,126 73 26 5 1,390 1,165 47 39August .............................. 1,399 1,191 54 33 4 1,416 1,199 48 41September ........................ 1,394 1,190 83 82 35 1,361 1,139 50 44October ............................. 1,408 1,189 83 -11 35 1,467 1,264 50 43November ......................... 1,388 1,171 55 38 46 1,359 1,138 51 44December ......................... 1,439 1,233 68 -34 78 1,463 1,288 50 42Average ........................... 1,343 1,138 67 (s) 24 1,385 1,181 50 42
See footnotes at end of table.
Energy Information Administration/Historical Monthly Energy Review 1973-1992 141

Table 3.7 Jet Fuel Supply and Disposition, 1973-1992 (Continued)
Supply Disposition
Ending StocksaProduction
ImportsStock
Changeb Exports
Product Supplied
Total Kerosene Type Total Kerosene Type Total Kerosene Type
Thousand Barrels per Day Million Barrels
1988January ............................. 1,415 1,231 85 -141 82 1,560 1,360 46 38February ........................... 1,383 1,205 70 -94 34 1,513 1,281 43 37March ................................ 1,453 1,242 97 108 52 1,390 1,195 46 40April .................................. 1,291 1,088 84 -29 13 1,391 1,173 45 39May ................................... 1,288 1,059 112 25 7 1,368 1,157 46 39June .................................. 1,342 1,133 78 -17 15 1,421 1,206 46 39July ................................... 1,363 1,154 88 43 3 1,404 1,193 47 40August .............................. 1,345 1,138 103 -8 15 1,441 1,237 47 40September ........................ 1,375 1,177 61 -3 16 1,423 1,216 47 40October ............................. 1,366 1,158 146 16 4 1,491 1,277 47 41November ......................... 1,337 1,118 79 -32 9 1,439 1,221 46 40December ......................... 1,476 1,259 74 -75 82 1,543 1,314 44 38Average ........................... 1,370 1,164 90 -17 28 1,449 1,236 44 38
1989January ............................. 1,503 1,312 101 21 75 1,508 1,334 44 38February ........................... 1,404 1,214 120 -40 21 1,542 1,342 43 37March ................................ 1,396 1,188 101 -2 11 1,488 1,277 43 37April .................................. 1,270 1,074 127 31 16 1,351 1,150 44 38May ................................... 1,249 1,031 120 40 1 1,328 1,103 45 39June .................................. 1,350 1,139 124 -27 1 1,500 1,286 45 38July ................................... 1,410 1,194 113 90 11 1,422 1,219 47 41August .............................. 1,437 1,237 90 28 15 1,484 1,260 48 42September ........................ 1,442 1,218 95 -13 34 1,516 1,316 48 41October ............................. 1,504 1,300 74 74 30 1,474 1,252 50 44November ......................... 1,514 1,305 91 34 52 1,519 1,337 51 44December ......................... 1,354 1,149 115 -335 59 1,745 1,541 41 34Average ........................... 1,403 1,197 106 -8 27 1,489 1,284 41 34
1990January ............................. 1,527 1,340 163 76 30 1,584 1,404 43 37February ........................... 1,530 1,330 158 120 50 1,519 1,316 47 40March ................................ 1,457 1,256 120 92 30 1,455 1,289 49 42April .................................. 1,357 1,179 103 -91 19 1,531 1,335 47 40May ................................... 1,392 1,194 119 8 8 1,495 1,313 47 40June .................................. 1,388 1,214 125 13 10 1,490 1,320 47 40July ................................... 1,434 1,307 99 117 10 1,406 1,259 51 45August .............................. 1,424 1,250 83 -82 37 1,552 1,363 48 43September ........................ 1,548 1,339 81 48 47 1,534 1,329 50 44October ............................. 1,630 1,463 71 39 77 1,585 1,406 51 45November ......................... 1,606 1,445 93 -19 141 1,578 1,369 50 45December ......................... 1,570 1,411 82 51 60 1,541 1,378 52 46Average ........................... 1,488 1,311 108 31 43 1,522 1,340 52 46
1991January ............................. 1,509 1,354 67 -55 73 1,559 1,378 50 44February ........................... 1,548 1,384 44 -108 159 1,541 1,360 47 41March ................................ 1,299 1,157 65 -99 40 1,423 1,270 44 38April .................................. 1,286 1,135 73 -8 38 1,329 1,173 44 38May ................................... 1,367 1,191 87 85 35 1,334 1,143 47 41June .................................. 1,473 1,300 64 58 13 1,465 1,280 48 43July ................................... 1,426 1,255 67 -47 31 1,509 1,343 47 41August .............................. 1,486 1,316 88 21 11 1,543 1,343 48 42September ........................ 1,495 1,322 92 71 10 1,506 1,321 50 45October ............................. 1,415 1,253 59 -66 50 1,489 1,319 48 43November ......................... 1,433 1,276 56 15 5 1,469 1,282 48 44December ......................... 1,530 1,357 42 22 59 1,492 1,338 49 44Average ........................... 1,438 1,274 67 -9 43 1,471 1,296 49 44
1992January ............................. 1,352 1,200 39 -127 44 1,473 1,314 45 40February ........................... 1,311 1,164 56 -73 42 1,398 1,250 43 38March ................................ 1,347 1,215 56 31 7 1,365 1,218 44 39April .................................. 1,286 1,131 74 -68 18 1,409 1,262 42 37May ................................... 1,393 1,214 93 114 26 1,346 1,198 45 40June .................................. 1,374 1,234 86 -21 45 1,436 1,308 45 39July ................................... 1,473 1,328 81 59 62 1,433 1,280 46 42August .............................. 1,471 1,339 111 -32 28 1,585 1,438 45 41September ........................ 1,448 1,296 93 78 20 1,442 1,313 48 43October ............................. 1,408 1,265 105 -12 44 1,480 1,315 47 43November ......................... 1,456 1,319 90 -41 59 1,528 1,411 46 41December ......................... 1,462 1,336 102 -101 112 1,553 1,410 43 39Average ........................... 1,399 1,254 82 -16 43 1,454 1,310 43 39
a Stocks are totals as of end of period.b A negative number indicates a decrease in stocks and a positive number
indicates an increase.c In January 1975, 1981, and 1983, a new stock basis was established,
thereby affecting stocks reported and stock change calculations. See Note 4
at end of section.NA=Not available. (s)=Less than +500 barrels per day and greater than
-500 barrels per day. Note: Geographic coverage is the 50 States and the District of Columbia.Sources: See end of section.
Energy Information Administration/Historical Monthly Energy Review 1973-1992142

Table 3.8 Liquefied Petroleum Gases Supply and Disposition, 1973-1992
Supply Disposition
EndingStocksb
TotalProduction Imports
StockChangea
RefineryInputs Exports
ProductSupplied
Thousand Barrels per Day Million Barrels
1973January ............................. 1,567 204 -532 280 29 1,994 69February ........................... 1,623 190 -334 249 41 1,857 60March ................................ 1,625 147 125 206 36 1,406 64April .................................. 1,631 90 223 175 27 1,297 70May ................................... 1,660 113 310 170 25 1,268 80June .................................. 1,614 76 334 183 24 1,149 90July ................................... 1,588 87 354 191 25 1,103 101August .............................. 1,571 129 188 213 26 1,273 107September ........................ 1,571 99 147 208 26 1,288 111October ............................. 1,602 149 (s) 241 24 1,485 111November ......................... 1,573 171 -235 262 23 1,694 104December ......................... 1,574 127 -180 259 23 1,598 99Average ........................... 1,600 132 35 220 27 1,449 99
1974January ............................. 1,540 206 -276 228 27 1,766 90February ........................... 1,588 171 -56 215 22 1,579 89March ................................ 1,630 120 142 190 23 1,394 93April .................................. 1,604 113 218 177 23 1,299 99May ................................... 1,569 117 320 186 23 1,158 109June .................................. 1,574 120 243 193 23 1,235 117July ................................... 1,545 85 251 186 27 1,166 124August .............................. 1,553 83 203 207 24 1,201 131September ........................ 1,531 77 18 222 27 1,341 131October ............................. 1,569 109 -75 252 26 1,475 129November ......................... 1,550 117 -218 274 25 1,587 122December ......................... 1,530 164 -318 307 26 1,678 c 113Average ........................... 1,565 123 38 220 25 1,406 c 113
1975January ............................. 1,534 179 c -315 304 30 1,694 103February ........................... 1,535 116 -153 276 30 1,498 98March ................................ 1,528 96 -44 247 32 1,388 97April .................................. 1,497 102 142 200 29 1,228 101May ................................... 1,492 38 331 182 25 991 112June .................................. 1,518 93 415 183 22 991 124July ................................... 1,536 98 230 203 23 1,178 131August .............................. 1,577 82 233 202 24 1,200 138September ........................ 1,493 121 105 241 24 1,245 142October ............................. 1,528 139 -34 261 25 1,415 141November ......................... 1,538 130 -83 313 22 1,417 138December ......................... 1,550 148 -417 338 27 1,751 125Average ........................... 1,527 112 c 35 246 26 1,333 125
1976January ............................. 1,506 156 -520 302 24 1,855 109February ........................... 1,557 143 -121 279 23 1,518 106March ................................ 1,545 125 97 245 26 1,303 109April .................................. 1,540 85 182 216 26 1,201 114May ................................... 1,551 89 269 211 22 1,138 122June .................................. 1,520 114 268 228 28 1,110 130July ................................... 1,519 89 260 221 24 1,103 138August .............................. 1,517 108 168 223 21 1,213 144September ........................ 1,535 107 119 259 21 1,243 147October ............................. 1,509 172 -106 266 24 1,497 144November ......................... 1,568 177 -322 295 26 1,747 134December ......................... 1,559 190 -579 378 29 1,921 116Average ........................... 1,535 130 -24 260 25 1,404 116
1977January ............................. 1,494 197 -562 294 29 1,930 99February ........................... 1,531 221 -442 261 19 1,914 87March ................................ 1,569 192 151 237 19 1,354 91April .................................. 1,578 137 247 221 20 1,228 99May ................................... 1,605 136 365 194 14 1,167 110June .................................. 1,560 169 312 170 12 1,235 119July ................................... 1,570 125 376 166 20 1,133 131August .............................. 1,539 167 310 200 16 1,181 141September ........................ 1,533 111 221 205 14 1,203 147October ............................. 1,584 123 30 253 16 1,408 148November ......................... 1,617 151 -128 297 17 1,582 144December ......................... 1,607 212 -256 301 18 1,756 136Average ........................... 1,566 161 55 233 18 1,422 136
See footnotes at end of table.
Energy Information Administration/Historical Monthly Energy Review 1973-1992 143

Table 3.8 Liquefied Petroleum Gases Supply and Disposition, 1973-1992 (Continued)
Supply Disposition
EndingStocksb
TotalProduction Imports
StockChangea
RefineryInputs Exports
ProductSupplied
Thousand Barrels per Day Million Barrels
1978January ............................. 1,523 171 -471 274 21 1,870 122February ........................... 1,539 171 -363 253 22 1,799 112March ................................ 1,595 113 34 229 20 1,425 113April .................................. 1,574 80 298 178 18 1,160 122May ................................... 1,540 94 254 188 25 1,167 129June .................................. 1,532 99 302 188 20 1,121 138July ................................... 1,496 112 284 185 19 1,120 147August .............................. 1,494 81 252 210 27 1,087 155September ........................ 1,537 94 57 226 13 1,335 157October ............................. 1,508 104 -143 259 18 1,478 152November ......................... 1,559 112 -271 337 21 1,584 144December ......................... 1,550 243 -394 344 15 1,829 c 132Average ........................... 1,537 123 -12 239 20 1,413 c 132
1979January ............................. 1,536 240 c -632 310 12 2,086 117February ........................... 1,508 238 -575 298 16 2,007 100March ................................ 1,518 238 -169 240 31 1,654 95April .................................. 1,562 149 99 206 13 1,394 98May ................................... 1,555 242 215 218 11 1,352 105June .................................. 1,556 162 250 178 11 1,278 112July ................................... 1,577 231 263 180 10 1,354 120August .............................. 1,597 226 203 181 12 1,427 127September ........................ 1,525 184 116 194 9 1,389 130October ............................. 1,585 181 -129 239 14 1,642 126November ......................... 1,543 254 -221 288 18 1,712 120December ......................... 1,609 258 -288 305 22 1,827 111Average ........................... 1,556 217 c -70 236 15 1,592 111
1980January ............................. 1,560 264 -461 291 30 1,963 96February ........................... 1,581 252 -209 252 26 1,764 90March ................................ 1,519 214 -7 211 23 1,506 90April .................................. 1,546 186 339 171 19 1,203 100May ................................... 1,538 181 224 182 17 1,295 107June .................................. 1,528 184 319 170 18 1,205 117July ................................... 1,485 172 283 209 18 1,147 126August .............................. 1,507 158 296 203 17 1,149 135September ........................ 1,495 213 80 228 19 1,382 137October ............................. 1,546 249 -86 259 24 1,597 134November ......................... 1,549 231 -82 304 23 1,535 132December ......................... 1,567 289 -373 319 23 1,888 c 120Average ........................... 1,535 216 27 233 21 1,469 c 120
1981January ............................. 1,617 306 c -363 352 21 1,913 117February ........................... 1,593 327 -173 303 21 1,769 112March ................................ 1,551 260 4 257 20 d 1,531 112April .................................. 1,586 214 236 231 26 1,308 119May ................................... 1,587 189 258 220 19 1,279 127June .................................. 1,567 206 208 237 24 1,304 133July ................................... 1,507 213 258 215 17 1,229 141August .............................. 1,592 195 242 235 149 1,160 149September ........................ 1,622 199 75 287 21 1,438 151October ............................. 1,593 287 -72 320 76 1,556 149November ......................... 1,571 280 -86 383 58 1,495 146December ......................... 1,468 255 -379 428 50 1,624 135Average ........................... 1,571 244 c 18 289 42 1,466 135
1982January ............................. 1,565 314 -443 391 67 1,863 121February ........................... 1,466 291 -243 327 51 1,621 114March ................................ 1,544 223 -211 289 74 1,615 108April .................................. 1,506 188 -98 257 77 1,458 105May ................................... 1,565 186 71 234 43 1,403 107June .................................. 1,515 192 86 262 106 1,254 109July ................................... 1,476 227 13 253 37 1,399 110August .............................. 1,511 125 45 254 61 1,276 111September ........................ 1,538 247 -37 274 85 1,463 110October ............................. 1,517 194 -97 306 81 1,421 107November ......................... 1,542 267 -175 363 37 1,583 102December ......................... 1,580 258 -256 395 56 1,642 c 94Average ........................... d 1,527 226 -111 300 65 1,499 c 94
See footnotes at end of table.
Energy Information Administration/Historical Monthly Energy Review 1973-1992144

Table 3.8 Liquefied Petroleum Gases Supply and Disposition, 1973-1992 (Continued)
Supply Disposition
EndingStocksb
TotalProduction Imports
StockChangea
RefineryInputs Exports
ProductSupplied
Thousand Barrels per Day Million Barrels
1983January ............................. 1,611 240 c -520 313 118 1,939 86February ........................... 1,600 305 -128 244 76 1,713 82March ................................ 1,543 166 9 197 127 1,377 82April .................................. 1,607 124 156 198 116 1,260 87May ................................... 1,613 167 225 207 84 1,263 94June .................................. 1,664 172 334 203 59 1,241 104July ................................... 1,656 191 221 217 55 1,354 111August .............................. 1,586 160 199 229 29 1,289 117September ........................ 1,705 178 30 236 86 1,531 118October ............................. 1,688 160 81 268 32 1,467 120November ......................... 1,785 180 -70 362 33 1,640 118December ......................... 1,645 247 -575 363 66 2,038 c 101Average ........................... 1,642 190 c -4 253 73 1,509 c 101
1984January ............................. 1,615 269 c -494 340 23 2,015 93February ........................... 1,696 237 -122 324 41 1,690 89March ................................ 1,696 241 -12 288 68 1,593 89April .................................. 1,716 155 139 253 54 1,426 93May ................................... 1,714 211 240 244 42 1,399 100June .................................. 1,714 158 201 237 53 1,380 106July ................................... 1,725 132 139 232 43 1,444 111August .............................. 1,711 154 100 241 34 1,490 114September ........................ 1,693 128 50 283 26 1,462 115October ............................. 1,684 207 -138 322 56 1,650 111November ......................... 1,716 212 -89 376 52 1,588 108December ......................... 1,679 237 -239 349 82 1,724 101Average ........................... 1,697 195 c -19 291 48 1,572 101
1985January ............................. 1,676 255 -399 322 70 1,937 88February ........................... 1,689 237 -330 320 72 1,865 79March ................................ 1,684 223 -29 297 52 1,588 78April .................................. 1,696 156 143 262 78 1,368 83May ................................... 1,713 138 219 239 40 1,353 89June .................................. 1,728 181 175 250 51 1,432 95July ................................... 1,713 131 107 249 68 1,420 98August .............................. 1,710 153 98 277 80 1,409 101September ........................ 1,667 132 -61 321 29 1,510 99October ............................. 1,669 209 -304 340 47 1,794 90November ......................... 1,716 188 -192 387 88 1,620 84December ......................... 1,786 239 -337 386 75 1,901 74Average ........................... 1,704 187 -75 304 62 1,599 74
1986January ............................. 1,850 280 -80 364 47 1,800 71February ........................... 1,815 208 -108 325 74 1,733 68March ................................ 1,693 202 98 250 47 1,500 71April .................................. 1,642 134 200 256 33 1,286 77May ................................... 1,685 196 336 267 40 1,238 87June .................................. 1,649 253 490 228 25 1,158 102July ................................... 1,684 303 450 199 50 1,287 116August .............................. 1,619 271 332 243 53 1,262 126September ........................ 1,631 282 142 288 27 1,456 131October ............................. 1,625 234 -249 332 26 1,750 123November ......................... 1,724 310 -254 417 53 1,817 115December ......................... 1,725 227 -411 456 33 1,875 103Average ........................... 1,695 242 80 302 42 1,512 103
1987January ............................. 1,751 183 -500 419 43 1,971 87February ........................... 1,762 201 -205 341 38 1,789 81March ................................ 1,761 132 10 282 52 1,550 82April .................................. 1,775 149 121 274 36 1,493 85May ................................... 1,732 142 283 269 34 1,288 94June .................................. 1,732 119 175 255 22 1,400 99July ................................... 1,764 190 145 244 30 1,534 104August .............................. 1,717 198 259 252 33 1,372 112September ........................ 1,736 288 81 266 56 1,622 114October ............................. 1,736 233 -59 294 23 1,711 113November ......................... 1,763 233 -129 356 35 1,735 109December ......................... 1,753 214 -372 395 56 1,887 97Average ........................... 1,748 190 -15 304 38 1,612 97
See footnotes at end of table.
Energy Information Administration/Historical Monthly Energy Review 1973-1992 145

Table 3.8 Liquefied Petroleum Gases Supply and Disposition, 1973-1992 (Continued)
Supply Disposition
EndingStocksb
TotalProduction Imports
StockChangea
RefineryInputs Exports
ProductSupplied
Thousand Barrels per Day Million Barrels
1988January ............................. 1,734 226 -566 383 44 2,099 80February ........................... 1,770 245 -328 366 47 1,929 70March ................................ 1,819 165 -50 292 36 1,707 68April .................................. 1,806 205 361 277 43 1,329 79May ................................... 1,817 165 343 277 37 1,324 90June .................................. 1,814 144 331 256 38 1,333 100July ................................... 1,842 233 380 248 35 1,412 112August .............................. 1,847 241 287 262 50 1,490 121September ........................ 1,841 194 20 274 43 1,698 121October ............................. 1,872 216 -47 318 56 1,761 120November ......................... 1,835 258 -206 445 71 1,782 114December ......................... 1,811 222 -522 461 85 2,010 97Average ........................... 1,817 209 1 321 49 1,656 97
1989January ............................. 1,885 239 -335 422 19 2,018 87February ........................... 1,798 260 -333 328 31 2,032 78March ................................ 1,909 150 -85 274 43 1,827 75April .................................. 1,950 121 294 242 27 1,507 84May ................................... 1,943 110 428 226 43 1,357 97June .................................. 1,824 155 269 254 35 1,422 105July ................................... 1,850 192 407 247 45 1,343 118August .............................. 1,787 202 272 245 40 1,433 126September ........................ 1,737 182 -46 303 31 1,631 125October ............................. 1,679 176 -313 371 31 1,766 115November ......................... 1,643 179 -389 446 33 1,732 103December ......................... 1,483 205 -749 424 37 1,975 80Average ........................... 1,791 181 -47 315 35 1,668 80
1990January ............................. 1,684 261 -92 414 44 1,580 77February ........................... 1,743 235 11 339 42 1,587 78March ................................ 1,763 155 80 199 44 1,595 80April .................................. 1,751 150 91 195 25 1,589 83May ................................... 1,761 204 287 209 36 1,433 92June .................................. 1,719 202 469 212 28 1,211 106July ................................... 1,756 157 268 217 36 1,392 114August .............................. 1,825 256 339 236 43 1,463 125September ........................ 1,789 149 37 293 41 1,567 126October ............................. 1,773 159 -243 348 38 1,790 118November ......................... 1,731 140 -296 427 39 1,702 109December ......................... 1,692 184 -370 427 58 1,762 98Average ........................... 1,749 188 48 293 40 1,556 98
1991January ............................. 1,753 148 -658 364 56 2,139 78February ........................... 1,865 126 -271 322 60 1,880 70March ................................ 1,942 91 113 249 56 1,615 73April .................................. 1,937 154 346 237 31 1,477 84May ................................... 1,989 129 428 239 45 1,407 97June .................................. 1,949 148 328 245 32 1,492 107July ................................... 1,913 151 211 253 24 1,575 113August .............................. 1,899 143 175 255 18 1,594 119September ........................ 1,806 147 -84 288 31 1,718 116October ............................. 1,805 233 33 345 31 1,629 117November ......................... 1,789 156 -330 413 40 1,821 107December ......................... 1,810 139 -488 437 73 1,927 92Average ........................... 1,871 147 -15 304 41 1,689 92
1992January ............................. 1,820 142 -452 384 80 1,950 78February ........................... 1,917 126 -365 326 33 2,051 68March ................................ 2,033 97 153 247 43 1,687 72April .................................. 2,102 127 401 233 45 1,549 84May ................................... 2,106 106 489 245 44 1,433 100June .................................. 2,102 104 334 257 59 1,556 110July ................................... 2,090 106 345 255 52 1,544 120August .............................. 2,016 148 369 233 55 1,507 132September ........................ 1,886 114 37 299 45 1,620 133October ............................. 1,892 171 -242 369 39 1,898 125November ......................... 1,854 148 -541 403 43 2,097 109December ......................... 1,849 176 -660 453 49 2,184 89Average ........................... 1,972 131 -10 309 49 1,755 89
a A negative number indicates a decrease in stocks and a positive numberindicates an increase.
b Stocks are totals as of end of period.c In January 1975, 1979, 1981, 1983, and 1984, a new stock basis was
established, thereby affecting stocks reported and stock change calculations. See Note 4 at end of section.
d See Note 7 at end of section.(s)=Less than +500 barrels per day and greater than -500 barrels per day. Notes: • Liquefied petroleum gases include ethane, ethylene, propane,
propylene, normal butane, butylene, isobutane and isobutylene.• Geographic coverage is the 50 States and the District of Columbia.
Sources: See end of section.
Energy Information Administration/Historical Monthly Energy Review 1973-1992146

Table 3.9 Propane and Propylene Supply and Disposition, 1973-1992
(A Subset of Table 3.8)
Supply Disposition
EndingStocksb
TotalProduction Imports
StockChangea
RefineryInputs Exports
ProductSupplied
Thousand Barrels per Day Million Barrels
1973January ............................. 857 130 -421 16 16 1,376 41February ........................... 889 121 -315 9 26 1,290 32March ................................ 847 89 75 2 20 839 34April .................................. 881 49 157 6 15 752 39May ................................... 891 51 219 5 15 703 46June .................................. 870 39 269 4 13 623 54July ................................... 834 35 277 7 13 572 62August .............................. 819 55 160 11 14 689 67September ........................ 830 42 114 7 13 738 71October ............................. 867 81 79 9 13 847 73November ......................... 832 94 -169 7 11 1,077 68December ......................... 837 65 -106 8 12 986 65Average ........................... 854 71 30 8 15 872 65
1974January ............................. 803 124 -225 3 15 1,133 58February ........................... 823 96 -53 (s) 12 961 56March ................................ 834 65 74 (s) 13 812 58April .................................. 823 56 137 8 12 722 63May ................................... 796 72 205 12 12 639 69June .................................. 795 35 170 13 12 634 74July ................................... 773 20 128 13 15 637 78August .............................. 795 30 110 13 14 688 81September ........................ 803 27 -9 12 16 811 81October ............................. 818 57 -41 13 14 889 80November ......................... 810 51 -136 13 14 970 76December ......................... 794 75 -234 14 15 1,074 69Average ........................... 805 59 11 9 14 830 69
1975January ............................. 792 112 -233 12 16 1,110 61February ........................... 801 70 -115 13 17 957 58March ................................ 781 46 -45 12 14 845 57April .................................. 754 39 37 11 15 730 58May ................................... 752 21 218 17 13 525 65June .................................. 769 43 280 9 12 512 73July ................................... 768 59 185 5 13 625 79August .............................. 804 42 147 9 12 679 83September ........................ 774 68 90 9 11 732 86October ............................. 793 81 77 10 12 775 88November ......................... 799 63 30 14 11 807 89December ......................... 810 81 -241 9 14 1,109 82Average ........................... 783 60 36 11 13 783 82
1976January ............................. 778 92 -399 8 13 1,247 69February ........................... 780 64 -85 12 12 905 67March ................................ 774 60 63 3 14 754 69April .................................. 761 46 127 13 14 652 73May ................................... 765 31 198 16 12 570 79June .................................. 748 54 188 8 15 591 85July ................................... 746 51 143 28 12 614 89August .............................. 745 43 108 14 11 655 92September ........................ 766 55 112 17 11 681 96October ............................. 748 101 -74 7 13 903 93November ......................... 790 97 -245 10 13 1,109 86December ......................... 793 118 -396 12 16 1,278 74Average ........................... 766 68 -22 12 13 830 74
1977January ............................. 747 118 -516 12 15 1,354 58February ........................... 774 152 -364 8 10 1,271 48March ................................ 779 124 124 10 11 758 51April .................................. 778 64 220 14 11 596 58May ................................... 781 54 245 8 8 574 66June .................................. 756 70 180 16 6 624 71July ................................... 763 56 235 6 10 568 78August .............................. 759 77 192 9 8 627 84September ........................ 758 58 122 8 7 678 88October ............................. 787 68 28 9 9 809 89November ......................... 813 69 -39 6 9 906 88December ......................... 810 129 -201 10 10 1,119 81Average ........................... 775 86 21 10 10 821 81
See footnotes at end of table.
Energy Information Administration/Historical Monthly Energy Review 1973-1992 147
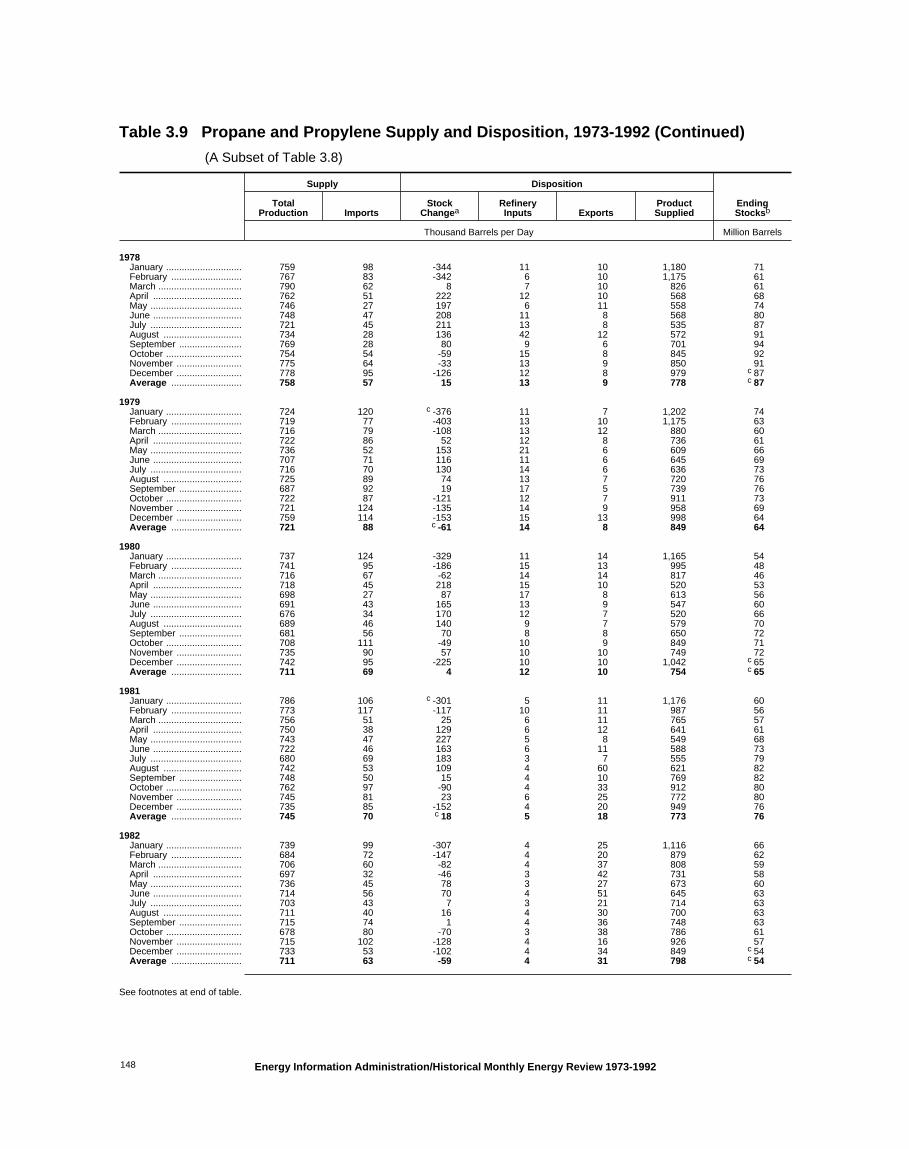
Table 3.9 Propane and Propylene Supply and Disposition, 1973-1992 (Continued)
(A Subset of Table 3.8)
Supply Disposition
EndingStocksb
TotalProduction Imports
StockChangea
RefineryInputs Exports
ProductSupplied
Thousand Barrels per Day Million Barrels
1978January ............................. 759 98 -344 11 10 1,180 71February ........................... 767 83 -342 6 10 1,175 61March ................................ 790 62 8 7 10 826 61April .................................. 762 51 222 12 10 568 68May ................................... 746 27 197 6 11 558 74June .................................. 748 47 208 11 8 568 80July ................................... 721 45 211 13 8 535 87August .............................. 734 28 136 42 12 572 91September ........................ 769 28 80 9 6 701 94October ............................. 754 54 -59 15 8 845 92November ......................... 775 64 -33 13 9 850 91December ......................... 778 95 -126 12 8 979 c 87Average ........................... 758 57 15 13 9 778 c 87
1979January ............................. 724 120 c -376 11 7 1,202 74February ........................... 719 77 -403 13 10 1,175 63March ................................ 716 79 -108 13 12 880 60April .................................. 722 86 52 12 8 736 61May ................................... 736 52 153 21 6 609 66June .................................. 707 71 116 11 6 645 69July ................................... 716 70 130 14 6 636 73August .............................. 725 89 74 13 7 720 76September ........................ 687 92 19 17 5 739 76October ............................. 722 87 -121 12 7 911 73November ......................... 721 124 -135 14 9 958 69December ......................... 759 114 -153 15 13 998 64Average ........................... 721 88 c -61 14 8 849 64
1980January ............................. 737 124 -329 11 14 1,165 54February ........................... 741 95 -186 15 13 995 48March ................................ 716 67 -62 14 14 817 46April .................................. 718 45 218 15 10 520 53May ................................... 698 27 87 17 8 613 56June .................................. 691 43 165 13 9 547 60July ................................... 676 34 170 12 7 520 66August .............................. 689 46 140 9 7 579 70September ........................ 681 56 70 8 8 650 72October ............................. 708 111 -49 10 9 849 71November ......................... 735 90 57 10 10 749 72December ......................... 742 95 -225 10 10 1,042 c 65Average ........................... 711 69 4 12 10 754 c 65
1981January ............................. 786 106 c -301 5 11 1,176 60February ........................... 773 117 -117 10 11 987 56March ................................ 756 51 25 6 11 765 57April .................................. 750 38 129 6 12 641 61May ................................... 743 47 227 5 8 549 68June .................................. 722 46 163 6 11 588 73July ................................... 680 69 183 3 7 555 79August .............................. 742 53 109 4 60 621 82September ........................ 748 50 15 4 10 769 82October ............................. 762 97 -90 4 33 912 80November ......................... 745 81 23 6 25 772 80December ......................... 735 85 -152 4 20 949 76Average ........................... 745 70 c 18 5 18 773 76
1982January ............................. 739 99 -307 4 25 1,116 66February ........................... 684 72 -147 4 20 879 62March ................................ 706 60 -82 4 37 808 59April .................................. 697 32 -46 3 42 731 58May ................................... 736 45 78 3 27 673 60June .................................. 714 56 70 4 51 645 63July ................................... 703 43 7 3 21 714 63August .............................. 711 40 16 4 30 700 63September ........................ 715 74 1 4 36 748 63October ............................. 678 80 -70 3 38 786 61November ......................... 715 102 -128 4 16 926 57December ......................... 733 53 -102 4 34 849 c 54Average ........................... 711 63 -59 4 31 798 c 54
See footnotes at end of table.
Energy Information Administration/Historical Monthly Energy Review 1973-1992148

Table 3.9 Propane and Propylene Supply and Disposition, 1973-1992 (Continued)
(A Subset of Table 3.8)
Supply Disposition
EndingStocksb
TotalProduction Imports
StockChangea
RefineryInputs Exports
ProductSupplied
Thousand Barrels per Day Million Barrels
1983January ............................. 732 67 c -328 4 67 1,056 47February ........................... 730 56 -176 4 54 904 42March ................................ 682 49 -54 4 79 702 40April .................................. 718 49 25 5 88 649 41May ................................... 727 43 197 4 55 513 47June .................................. 747 35 214 4 25 539 53July ................................... 726 22 169 3 24 552 59August .............................. 706 21 130 4 17 576 63September ........................ 724 45 -22 4 42 745 62October ............................. 732 39 -22 5 17 772 61November ......................... 794 42 -26 4 18 839 61December ......................... 742 60 -398 5 27 1,168 c 48Average ........................... 730 44 c -24 4 43 751 c 48
1984January ............................. 778 99 c -375 5 17 1,230 44February ........................... 813 80 -58 4 24 922 42March ................................ 797 65 -45 4 40 863 41April .................................. 808 49 132 4 29 691 45May ................................... 801 56 189 3 17 648 50June .................................. 802 47 162 4 34 649 55July ................................... 802 33 120 3 28 683 59August .............................. 800 59 84 3 19 753 62September ........................ 809 57 79 3 20 763 64October ............................. 799 83 -72 3 40 911 62November ......................... 845 92 -40 4 37 935 61December ......................... 827 85 -91 3 53 946 58Average ........................... 806 67 c 7 4 30 833 58
1985January ............................. 811 102 -338 3 51 1,197 47February ........................... 808 112 -213 4 56 1,073 41March ................................ 801 71 -1 2 45 826 41April .................................. 815 43 136 2 62 659 45May ................................... 813 40 149 2 32 669 50June .................................. 807 56 92 2 34 735 53July ................................... 825 48 74 3 48 749 55August .............................. 804 49 73 3 60 717 57September ........................ 797 51 -3 3 23 826 57October ............................. 811 80 -225 4 39 1,073 50November ......................... 832 77 -119 4 66 958 47December ......................... 868 78 -234 3 60 1,116 39Average ........................... 816 67 -50 3 48 883 39
1986January ............................. 884 137 -94 3 42 1,069 37February ........................... 852 62 -87 4 50 947 34March ................................ 789 50 67 6 27 739 36April .................................. 769 45 141 4 19 649 40May ................................... 803 90 265 4 24 600 49June .................................. 783 113 344 3 18 530 59July ................................... 797 134 311 3 36 580 69August .............................. 802 128 219 3 40 668 75September ........................ 816 178 121 2 15 855 79October ............................. 796 129 -165 2 20 1,068 74November ......................... 850 137 -138 5 28 1,092 70December ......................... 861 116 -223 5 19 1,175 63Average ........................... 817 110 64 4 28 831 63
1987January ............................. 859 79 -347 5 27 1,253 52February ........................... 823 83 -204 12 20 1,078 46March ................................ 805 59 -56 8 35 876 45April .................................. 831 61 18 8 19 847 45May ................................... 806 67 159 9 21 684 50June .................................. 801 45 124 9 16 697 54July ................................... 839 85 54 9 17 845 56August .............................. 804 82 102 4 19 760 59September ........................ 820 144 -61 9 42 974 57October ............................. 834 136 -76 8 17 1,021 54November ......................... 860 122 -19 10 20 971 54December ......................... 851 91 -197 9 41 1,089 48Average ........................... 828 88 -41 8 24 924 48
See footnotes at end of table.
Energy Information Administration/Historical Monthly Energy Review 1973-1992 149

Table 3.9 Propane and Propylene Supply and Disposition, 1973-1992 (Continued)
(A Subset of Table 3.8)
Supply Disposition
EndingStocksb
TotalProduction Imports
StockChangea
RefineryInputs Exports
ProductSupplied
Thousand Barrels per Day Million Barrels
1988January ............................. 858 126 -358 8 29 1,306 37February ........................... 862 138 -194 8 30 1,155 31March ................................ 857 89 -35 7 19 954 30April .................................. 863 88 278 8 27 639 38May ................................... 860 79 248 8 20 662 46June .................................. 832 77 207 9 20 674 52July ................................... 859 126 211 8 20 745 59August .............................. 870 120 157 8 27 797 64September ........................ 861 107 -17 9 25 951 63October ............................. 885 104 -42 8 42 981 62November ......................... 878 112 -85 9 46 1,019 59December ......................... 877 106 -284 11 64 1,192 50Average ........................... 863 106 7 8 31 923 50
1989January ............................. 909 154 -172 12 14 1,209 45February ........................... 862 140 -310 10 26 1,277 36March ................................ 887 101 -134 11 33 1,076 32April .................................. 895 93 148 14 21 804 37May ................................... 887 80 231 12 27 698 44June .................................. 858 105 191 12 26 734 50July ................................... 871 106 223 11 29 714 57August .............................. 847 106 125 10 20 799 60September ........................ 845 107 -45 10 21 966 59October ............................. 826 109 -165 9 23 1,069 54November ......................... 847 108 -190 9 20 1,116 48December ......................... 814 122 -539 8 27 1,439 32Average ........................... 862 111 -52 11 24 990 32
1990January ............................. 879 186 62 (s) 32 971 33February ........................... 916 152 -9 1 32 1,044 33March ................................ 880 118 -5 (s) 31 973 33April .................................. 869 116 -32 (s) 16 1,001 32May ................................... 853 147 132 (s) 25 842 36June .................................. 836 100 294 (s) 20 622 45July ................................... 860 91 165 (s) 23 763 50August .............................. 880 113 131 (s) 24 838 54September ........................ 888 77 102 0 27 837 57October ............................. 881 91 -81 (s) 30 1,023 55November ......................... 897 72 -31 (s) 29 971 54December ......................... 900 113 -157 0 46 1,124 49Average ........................... 878 115 48 (s) 28 917 49
1991January ............................. 920 105 -449 0 51 1,422 35February ........................... 923 90 -174 0 40 1,147 30March ................................ 912 56 -10 0 45 933 30April .................................. 900 101 179 0 25 798 35May ................................... 922 90 214 0 31 767 42June .................................. 906 81 223 0 22 741 49July ................................... 901 91 81 0 15 895 51August .............................. 891 73 40 0 13 910 52September ........................ 905 92 -22 0 14 1,006 52October ............................. 902 146 35 0 18 995 53November ......................... 930 82 -37 0 20 1,030 52December ......................... 964 86 -128 (s) 38 1,139 48Average ........................... 915 91 -3 (s) 28 982 48
1992January ............................. 949 90 -282 (s) 72 1,249 39February ........................... 955 86 -200 (s) 27 1,214 33March ................................ 940 68 -15 (s) 26 997 33April .................................. 961 80 120 0 24 896 36May ................................... 977 72 253 (s) 23 773 44June .................................. 978 66 206 (s) 27 811 50July ................................... 964 68 176 (s) 35 821 56August .............................. 946 85 117 (s) 25 889 59September ........................ 931 71 51 (s) 25 927 61October ............................. 933 104 -88 (s) 30 1,095 58November ......................... 964 99 -243 0 33 1,273 51December ......................... 977 131 -385 0 45 1,448 39Average ........................... 956 85 -24 (s) 33 1,032 39
a A negative number indicates a decrease in stocks and a positive numberindicates an increase.
b Stocks are totals as of end of period.c In January 1979, 1981, 1983, and 1984, a new stock basis was
established, thereby affecting stocks reported and stock change calculations.
See Note 4 at end of section.(s)=Less than 500 barrels per day. Note: Geographic coverage is the 50 States and the District of Columbia.Sources: See end of section.
Energy Information Administration/Historical Monthly Energy Review 1973-1992150

Table 3.10 Other Petroleum Products Supply and Disposition, 1973-1992
Supply Disposition
EndingStocksb
TotalProduction Imports
StockChangea
RefineryInputs Exports
ProductsSupplied
Thousand Barrels per Day Million Barrels
1973January ............................. 2,629 248 -221 918 132 2,047 172February ........................... 2,690 250 24 715 174 2,027 173March ................................ 2,675 280 490 427 155 1,883 188April .................................. 2,731 301 387 497 192 1,957 200May ................................... 2,746 265 -4 709 162 2,144 199June .................................. 2,919 274 -131 816 172 2,335 196July ................................... 3,014 312 -175 876 165 2,460 190August .............................. 3,072 324 -298 930 154 2,610 181September ........................ 2,969 318 48 709 164 2,366 182October ............................. 3,004 257 -18 719 144 2,416 182November ......................... 2,840 337 -29 768 153 2,285 181December ......................... 2,698 312 -53 905 175 1,983 179Average ........................... 2,833 290 1 750 162 2,211 179
1974January ............................. 2,486 287 -75 756 143 1,949 177February ........................... 2,567 327 -66 820 153 1,987 175March ................................ 2,481 328 453 337 147 1,872 189April .................................. 2,601 395 173 680 199 1,943 194May ................................... 2,702 383 313 508 204 2,060 204June .................................. 2,887 244 87 620 194 2,229 207July ................................... 2,985 240 -164 764 210 2,414 202August .............................. 2,984 251 -187 818 185 2,418 196September ........................ 2,797 186 -189 721 125 2,326 190October ............................. 2,841 222 -87 624 173 2,353 187November ......................... 2,728 202 38 649 149 2,094 188December ......................... 2,598 170 (s) 693 177 1,898 c 188Average ........................... 2,722 269 25 665 172 2,129 c 188
1975January ............................. 2,423 171 c -195 788 154 1,847 184February ........................... 2,319 157 85 475 152 1,764 187March ................................ 2,345 151 261 418 158 1,659 195April .................................. 2,324 126 121 408 151 1,770 198May ................................... 2,445 118 261 289 166 1,846 206June .................................. 2,600 155 -169 637 178 2,109 201July ................................... 2,737 143 -187 688 141 2,238 196August .............................. 2,734 159 12 495 163 2,222 196September ........................ 2,745 145 -174 639 161 2,263 191October ............................. 2,692 132 -154 582 154 2,242 186November ......................... 2,626 115 152 438 129 2,023 191December ......................... 2,557 152 -78 584 193 2,011 188Average ........................... 2,547 144 c -6 537 158 2,001 188
1976January ............................. 2,447 184 -33 519 115 2,030 187February ........................... 2,606 215 27 627 178 1,989 188March ................................ 2,583 119 187 352 138 2,025 194April .................................. 2,623 160 56 540 169 2,018 195May ................................... 2,654 117 -13 572 144 2,067 195June .................................. 2,844 97 -71 522 175 2,316 193July ................................... 2,899 102 6 505 204 2,286 193August .............................. 2,927 101 -205 687 166 2,380 187September ........................ 2,878 109 55 446 163 2,322 188October ............................. 2,705 74 -37 494 147 2,174 187November ......................... 2,762 127 67 434 272 2,117 189December ......................... 2,771 153 -30 589 203 2,162 188Average ........................... 2,725 129 (s) 524 172 2,158 188
1977January ............................. 2,651 155 -222 706 137 2,185 181February ........................... 2,809 194 18 636 144 2,205 182March ................................ 2,875 141 266 406 150 2,194 190April .................................. 2,835 118 133 464 176 2,180 194May ................................... 2,876 115 223 319 176 2,274 201June .................................. 3,018 112 -27 458 199 2,500 200July ................................... 3,137 107 -106 597 161 2,592 197August .............................. 3,109 150 -207 680 165 2,620 190September ........................ 3,029 125 50 414 183 2,506 192October ............................. 3,018 126 -8 482 143 2,526 192November ......................... 3,012 95 9 547 161 2,390 192December ......................... 2,888 124 110 461 171 2,271 195Average ........................... 2,939 130 20 514 164 2,371 195
See footnotes at end of table.
Energy Information Administration/Historical Monthly Energy Review 1973-1992 151

Table 3.10 Other Petroleum Products Supply and Disposition, 1973-1992 (Continued)
Supply Disposition
EndingStocksb
TotalProduction Imports
StockChangea
RefineryInputs Exports
ProductsSupplied
Thousand Barrels per Day Million Barrels
1978January ............................. 2,781 72 -86 571 122 2,245 193February ........................... 2,753 113 66 355 151 2,294 195March ................................ 2,847 83 157 391 163 2,218 199April .................................. 2,963 62 64 488 213 2,259 201May ................................... 3,106 77 77 409 144 2,552 204June .................................. 3,196 70 -229 599 177 2,719 197July ................................... 3,192 75 -5 487 156 2,630 197August .............................. 3,274 93 -238 609 171 2,824 189September ........................ 3,311 82 -179 613 195 2,764 184October ............................. 3,178 70 109 247 165 2,727 187November ......................... 3,232 98 109 528 158 2,534 191December ......................... 3,062 71 12 599 167 2,355 191Average ........................... 3,076 80 -12 492 165 2,511 191
1979January ............................. 2,972 110 45 414 196 2,432 192February ........................... 2,962 81 -7 417 164 2,470 192March ................................ 2,922 102 -31 427 194 2,434 191April .................................. 3,065 44 223 188 216 2,481 198May ................................... 3,223 129 -52 419 238 2,746 196June .................................. 3,276 141 -33 321 198 2,931 195July ................................... 3,227 123 107 243 220 2,780 199August .............................. 3,269 119 -154 353 193 2,996 194September ........................ 3,182 89 -25 295 225 2,775 193October ............................. 3,210 125 -51 372 214 2,800 192November ......................... 3,247 155 179 324 222 2,678 197December ......................... 3,129 174 94 449 219 2,541 200Average ........................... 3,141 116 24 352 208 2,673 200
1980January ............................. 3,145 173 -140 591 185 2,682 196February ........................... 3,155 124 158 380 172 2,569 200March ................................ 3,097 119 357 149 198 2,511 211April .................................. 3,082 128 352 86 177 2,595 222May ................................... 3,015 150 237 135 225 2,568 229June .................................. 3,012 139 18 250 255 2,629 230July ................................... 2,899 95 -38 356 208 2,469 229August .............................. 2,794 73 -194 351 220 2,490 223September ........................ 2,911 129 -87 234 187 2,706 220October ............................. 2,761 135 -205 351 192 2,557 214November ......................... 2,798 149 -183 475 148 2,508 208December ......................... 2,830 149 -90 362 193 2,514 c 205Average ........................... 2,957 130 15 310 197 2,566 c 205
1981January ............................. 2,865 148 c 13 851 132 2,017 257February ........................... 2,774 144 233 538 207 1,940 263March ................................ 2,727 154 40 642 210 1,988 265April .................................. 2,752 175 -71 733 191 2,073 263May ................................... 2,886 183 -72 594 237 2,310 260June .................................. 2,933 149 16 656 196 2,214 261July ................................... 2,814 114 -282 791 211 2,208 252August .............................. 2,900 229 35 676 218 2,201 253September ........................ 2,785 240 -162 883 175 2,129 248October ............................. 2,601 227 -177 710 226 2,069 243November ......................... 2,619 253 -11 784 146 1,953 242December ......................... 2,598 235 -41 805 215 1,854 241Average ........................... 2,771 188 c -42 723 197 2,081 241
1982January ............................. 2,274 259 142 624 172 1,596 246February ........................... 2,401 243 149 663 129 1,703 250March ................................ 2,343 204 11 725 159 1,652 250April .................................. 2,398 261 -125 796 202 1,786 246May ................................... 2,414 288 -109 824 209 1,777 243June .................................. 2,617 312 -63 812 214 1,967 241July ................................... 2,693 377 6 856 186 2,022 241August .............................. 2,598 320 -246 743 201 2,219 234September ........................ 2,556 345 -71 749 204 2,019 232October ............................. 2,549 363 -283 915 265 2,015 223November ......................... 2,482 383 36 837 260 1,732 224December ......................... 2,375 306 -244 885 253 1,787 c 216Average ........................... 2,475 305 -68 787 205 d 1,857 c 216
See footnotes at end of table.
Energy Information Administration/Historical Monthly Energy Review 1973-1992152

Table 3.10 Other Petroleum Products Supply and Disposition, 1973-1992 (Continued)
Supply Disposition
EndingStocksb
TotalProduction Imports
StockChangea
RefineryInputs Exports
ProductsSupplied
Thousand Barrels per Day Million Barrels
1983January ............................. 2,185 295 c 352 588 262 1,279 230February ........................... 2,219 313 36 673 224 1,599 231March ................................ 2,339 284 77 572 248 1,726 233April .................................. 2,317 388 65 592 239 1,809 235May ................................... 2,398 344 -62 705 241 1,858 233June .................................. 2,561 419 -95 717 291 2,069 231July ................................... 2,600 395 -138 735 207 2,189 226August .............................. 2,681 442 -4 668 235 2,223 226September ........................ 2,702 453 -42 788 227 2,179 225October ............................. 2,570 374 50 711 194 1,991 226November ......................... 2,489 419 -175 912 226 1,948 221December ......................... 2,177 455 -135 883 243 1,642 c 217Average ........................... 2,437 382 c -6 712 236 1,877 c 217
1984January ............................. 2,327 452 c 261 570 196 1,751 218February ........................... 2,464 487 130 754 221 1,846 221March ................................ 2,408 436 177 527 257 1,887 227April .................................. 2,516 507 207 623 262 1,931 233May ................................... 2,584 606 96 764 257 2,072 236June .................................. 2,744 489 -455 1,232 334 2,119 222July ................................... 2,685 546 -298 1,022 228 2,279 213August .............................. 2,633 471 -104 637 170 2,402 210September ........................ 2,605 503 69 699 237 2,102 212October ............................. 2,415 576 (s) 709 168 2,113 212November ......................... 2,391 569 -90 945 268 1,839 209December ......................... 2,232 394 -369 1,016 244 1,736 198Average ........................... 2,500 503 c -32 791 236 2,007 198
1985January ............................. 2,142 333 116 556 220 1,580 202February ........................... 2,246 461 87 707 182 1,732 204March ................................ 2,272 503 352 633 184 1,606 215April .................................. 2,459 611 86 836 240 1,907 218May ................................... 2,576 807 78 991 186 2,129 220June .................................. 2,799 577 -94 995 258 2,218 217July ................................... 2,817 607 -27 975 238 2,239 216August .............................. 2,912 627 -328 1,328 195 2,341 206September ........................ 2,683 495 -2 823 267 2,090 206October ............................. 2,571 493 -17 861 223 1,997 206November ......................... 2,473 570 152 906 243 1,740 210December ......................... 2,418 505 -138 1,006 284 1,774 206Average ........................... 2,532 550 22 886 227 1,947 206
1986January ............................. 2,565 514 136 967 273 1,703 210February ........................... 2,521 358 119 747 254 1,758 214March ................................ 2,462 425 -132 854 196 1,968 210April .................................. 2,623 594 166 760 352 1,939 215May ................................... 2,854 605 121 810 284 2,244 218June .................................. 2,934 602 38 853 256 2,388 220July ................................... 2,857 468 -193 1,064 348 2,107 214August .............................. 2,954 487 -333 1,061 296 2,416 203September ........................ 2,935 511 -50 846 263 2,387 202October ............................. 2,655 537 58 666 350 2,119 204November ......................... 2,577 501 -20 940 319 1,837 203December ......................... 2,506 442 -77 1,069 295 1,660 201Average ........................... 2,704 504 -15 888 291 2,045 201
1987January ............................. 2,487 426 121 659 171 1,962 204February ........................... 2,468 620 441 352 300 1,995 217March ................................ 2,484 580 135 757 274 1,898 221April .................................. 2,679 524 -76 872 250 2,157 219May ................................... 2,799 462 -185 913 316 2,216 213June .................................. 2,951 646 -111 896 315 2,497 210July ................................... 3,016 477 -116 835 251 2,523 206August .............................. 2,941 562 116 693 234 2,460 209September ........................ 2,956 527 -58 903 318 2,321 208October ............................. 2,815 603 -3 971 237 2,213 208November ......................... 2,622 528 -18 975 258 1,936 207December ......................... 2,611 565 -227 1,091 253 2,060 200Average ........................... 2,737 543 -1 829 264 2,187 200
See footnotes at end of table.
Energy Information Administration/Historical Monthly Energy Review 1973-1992 153

Table 3.10 Other Petroleum Products Supply and Disposition, 1973-1992 (Continued)
Supply Disposition
EndingStocksb
TotalProduction Imports
StockChangea
RefineryInputs Exports
ProductsSupplied
Thousand Barrels per Day Million Barrels
1988January ............................. 2,527 622 277 812 272 1,787 209February ........................... 2,523 610 125 753 284 1,971 212March ................................ 2,694 569 174 687 275 2,125 218April .................................. 2,719 710 116 851 275 2,187 221May ................................... 2,783 731 310 501 268 2,435 231June .................................. 2,923 709 -26 777 364 2,518 230July ................................... 2,952 693 -22 831 325 2,511 229August .............................. 3,068 598 -190 796 287 2,774 223September ........................ 2,870 590 -156 850 307 2,459 219October ............................. 2,797 625 -57 762 264 2,453 217November ......................... 2,731 744 75 818 294 2,289 219December ......................... 2,679 539 -354 1,153 310 2,109 208Average ........................... 2,773 645 22 799 294 2,303 208
1989January ............................. 2,696 646 375 706 236 2,024 220February ........................... 2,553 717 231 726 281 2,032 226March ................................ 2,671 644 114 660 311 2,230 230April .................................. 2,683 727 102 808 290 2,210 233May ................................... 2,882 635 181 688 258 2,391 239June .................................. 3,025 571 -179 838 388 2,549 233July ................................... 3,044 576 -159 955 333 2,491 228August .............................. 2,998 587 -244 893 313 2,623 221September ........................ 2,986 675 125 737 309 2,490 224October ............................. 2,687 632 -42 730 308 2,323 223November ......................... 2,608 645 -77 900 299 2,131 221December ......................... 2,409 486 -266 918 332 1,910 213Average ........................... 2,771 627 12 797 305 2,285 213
1990January ............................. 2,567 814 86 735 225 2,335 215February ........................... 2,781 680 387 654 298 2,122 226March ................................ 2,670 687 78 795 276 2,207 229April .................................. 2,774 596 -138 869 318 2,320 224May ................................... 2,847 756 295 544 292 2,471 234June .................................. 2,907 879 -160 919 334 2,692 229July ................................... 3,146 732 -148 958 317 2,752 224August .............................. 3,097 673 -291 998 297 2,766 215September ........................ 3,029 674 68 760 265 2,611 217October ............................. 2,848 590 -436 1,211 329 2,334 204November ......................... 2,788 800 206 1,010 270 2,102 210December ......................... 2,644 575 -288 1,172 249 2,087 201Average ........................... 2,842 705 -32 887 289 2,402 201
1991January ............................. 2,653 748 204 844 317 2,036 207February ........................... 2,668 573 363 726 275 1,876 217March ................................ 2,576 551 151 819 239 1,919 222April .................................. 2,724 607 133 753 228 2,217 226May ................................... 2,853 800 198 900 327 2,228 232June .................................. 3,030 615 -123 1,092 304 2,372 228July ................................... 3,029 776 -143 1,081 321 2,545 224August .............................. 2,993 642 -169 1,013 296 2,496 219September ........................ 3,010 746 101 802 267 2,586 222October ............................. 2,824 611 -218 944 211 2,498 215November ......................... 2,750 850 -81 1,093 238 2,349 213December ......................... 2,797 577 -163 1,147 304 2,085 208Average ........................... 2,826 675 18 936 277 2,269 208
1992January ............................. 2,702 734 203 787 272 2,175 214February ........................... 2,642 575 183 883 240 1,911 219March ................................ 2,752 713 238 730 239 2,258 227April .................................. 2,900 793 -31 1,043 217 2,464 226May ................................... 2,929 665 -113 910 199 2,598 222June .................................. 3,126 669 -42 787 225 2,826 221July ................................... 3,207 740 -156 996 284 2,822 216August .............................. 3,068 729 -116 884 227 2,802 212September ........................ 3,114 748 188 675 336 2,663 218October ............................. 2,923 701 -182 954 295 2,557 212November ......................... 2,915 697 -24 989 264 2,383 212December ......................... 2,853 711 -165 1,223 352 2,154 207Average ........................... 2,928 707 -3 906 263 2,470 207
a A negative number indicates a decrease in stocks and a positive numberindicates an increase.
b Stocks are totals as of end of period.c In January 1975, 1981, 1983, and 1984, a new stock basis was
established, thereby affecting stocks reported and stock change calculations. See Note 4 at end of section.
d See Note 7 at end of section.R=Revised data. (s)=Less than +500 barrels per day and greater than -500
barrels per day. Notes: • Other petroleum products include pentanes plus, other
hydrocarbons and alcohol, unfinished oils, gasoline blending components,and all finished petroleum products except finished motor gasoline, distillatefuel oil, residual fuel oil, jet fuel, and liquefied petroleum gases. • Geographiccoverage is the 50 States and the District of Columbia.
Sources: See end of section.
Energy Information Administration/Historical Monthly Energy Review 1973-1992154

Petroleum Notes and Sources
Notes:
1. The Energy Information Administration (EIA) usesa number of sources and methods to maintain the sur-vey respondent lists. On a regular basis, survey man-agers review such industry publications as the Oil andGas Journal and Oil Daily for information on facilities orcompanies starting up or closing down operations.Those sources are augmented by articles in newspa-pers, letters from respondents indicating changes instatus, and information received from survey systems.
To supplement routine frames maintenance and to pro-vide more thorough coverage, a comprehensive framesinvestigation is conducted every 3 years. This investi-gation results in the reassessment and recompilation ofthe complete frame for each survey. The effort alsoincludes the evaluation of the impact of potential framechanges on the historical time series of data from theserespondents. The results of this frame study are usuallyimplemented in January to provide a full year under thesame frame.
2. Motor Gasoline: Beginning in January 1981, the EIAexpanded its universe to include non-refinery blendersand separated blending components from finishedmotor gasoline as a reporting category. Also, surveyforms were modified to describe refinery operationsmore accurately.
3. Distillate and Residual Fuel Oils: The requirementto report crude oil in pipelines or burned on leases aseither distillate or residual fuel oil has been eliminated.Prior to January 1981, the refinery input of unfinishedoils typically exceeded the available supply of unfin-ished oils. That discrepancy was assumed to be due tothe redesignation of distillate and residual fuel oilsreceived as such but used as unfinished oil inputs bythe receiving refinery. The imbalance between supplyand disposition of unfinished oils would then be sub-tracted from the production of distillate and residualfuel oils. Two-thirds of that difference was subtractedfrom distillate and one-third from residual. Beginningin January 1981, the EIA modified its survey forms toaccount for redesignated product and discontinued theabove-mentioned adjustment. For further details, seethe EIA, Petroleum Supply Monthly.
4. New Stock Basis: In January 1975, 1979, 1981, and1983, numerous respondents were added to bulk termi-nal and pipeline surveys, affecting subsequent stocksreported and stock change calculations. Using the ex-panded coverage (new basis), the end-of-year stocks, inmillion barrels, would have been:
• Crude Oil: 1982—645 (Total) and 351 (Other Pri-mary).
• Crude Oil and Petroleum Products: 1974—1,121;1980—1,425; and 1982—1,461.
• Motor Gasoline: 1974—225; 1980—263 (Total)and 214 (Finished); 1982—244 (Total) and 202(Finished).
• Distillate Fuel Oil: 1974—224; 1980—205; and1982—186.
• Residual Fuel Oil: 1974—75; 1980—91; and1982—69.
• Jet Fuel: 1974—30 (Total) and 24 (Kerosene Type);1980—42 (Total) and 36 (Kerosene Type); and1982—39 (Total) and 32 (Kerosene Type).
• Liquefied Petroleum Gases: 1974—113; 1978—136; 1980—128; and 1982—102.
• Propane and Propylene: 1978—86; 1980—69; and1982—57.
• Other Petroleum Products: 1974—190; 1980—207;and 1982—219.
Stock change calculations beginning in 1975, 1979, 1981,and 1983 were made by using new basis stock levels.
In January 1984, changes were made in the reporting ofnatural gas liquids. As a result, unfractionated stream,which was formerly included in the "Other PetroleumProducts Supply and Disposition" table, is now re-ported on a component basis (ethane, propane, normalbutane, isobutane, and pentanes plus). Most of thesestocks now appear in the "Liquefied Petroleum GasesSupply and Disposition" table. This change affectsstocks reported and stock change calculations in eachtable. Under the new basis, end-of-year 1983 stocks, inmillion barrels, would have been:
• Liquefied Petroleum Gases: 1983—108.
• Propane and Propylene: 1983—55.
• Other Petroleum Products: 1983—210.
5. Stocks of Alaskan Crude Oil: Stocks of Alaskancrude oil in transit were included for the first time inJanuary 1981. The major impact of this change is on thereporting of stock change calculations. Using the ex-panded coverage (new basis), 1980 end-of-year stocks,in million barrels, would have been 488 (Total) and 380(Other Primary).
6. Petroleum Imports: For 1973-1980, the source infor-mation for petroleum product imports is preliminaryand incomplete. Because of this, the averages of themonthly "Total" data do not always equal the finalannual "Total" data. Where there was sufficient evi-dence to do so, the "Total" value for a particular month
Energy Information Administration/Historical Monthly Energy Review 1973-1992 155
was adjusted to bring the average of the monthly valuescloser to the annual value and is noted with an "A."
From January 1973-March 1975, crude oil imports datawere collected monthly, but petroleum product importsdata were collected only quarterly. The following meth-odology was used to estimate the monthly "Total" data:
1) For each country from which there were crudeoil imports in a particular quarter, monthly petro-leum product imports were estimated to be inproportion to the crude oil imports from thatcountry during that quarter.
2) Total petroleum product imports from OPECcountries were calculated by summing the esti-mated petroleum product imports from each ofthe individual OPEC countries.
3) Total petroleum product imports from non-OPEC countries were calculated by subtractingthe estimated total petroleum product imports
from OPEC countries from the total petroleumproduct imports from all sources.
4) For any country from which there were nocrude oil imports in a particular quarter (this ap-plies to only a few non-OPEC countries), monthlypetroleum product imports were estimated to bein proportion to the estimated total petroleumproduct imports from all non- OPEC countries forthat quarter.
5) "Total" data were then derived by summingthe crude oil data and the estimated petroleumproduct data.
7. Data Discrepancies: Due to differences internal toEIA data processing systems, some small discrepanciesexist between data in the Historical Monthly Energy Re-view (HMER) and the Petroleum Supply Annual (PSA)and Petroleum Supply Monthly (PSM). Data having dis-crepancies are marked with a footnote in Section 3 tablesand summarized in the table on the following page.
Energy Information Administration/Historical Monthly Energy Review 1973-1992156
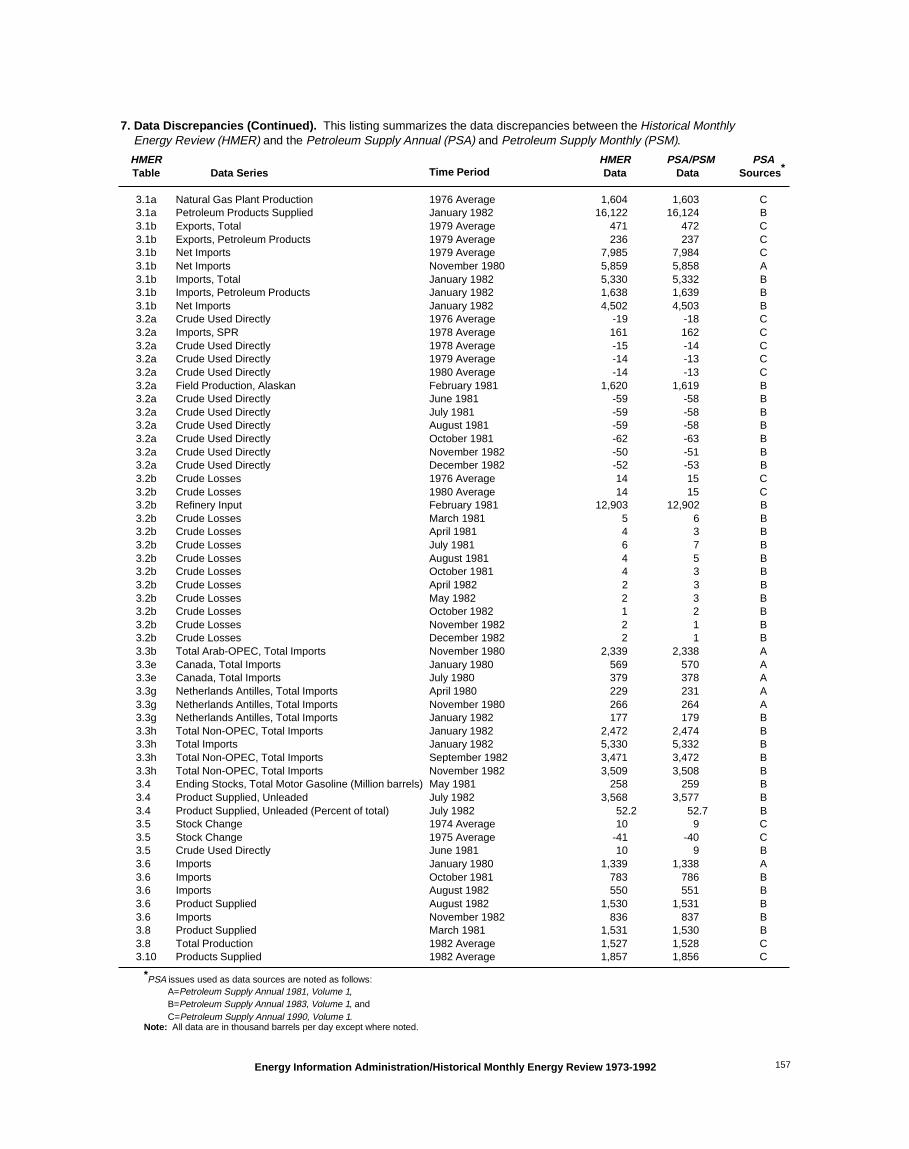
HMERTable Data Series Time Period
HMERData
PSA/PSM Data
PSASources *
3.1a Natural Gas Plant Production 1976 Average 1,604 1,603 C3.1a Petroleum Products Supplied January 1982 16,122 16,124 B3.1b Exports, Total 1979 Average 471 472 C3.1b Exports, Petroleum Products 1979 Average 236 237 C3.1b Net Imports 1979 Average 7,985 7,984 C3.1b Net Imports November 1980 5,859 5,858 A3.1b Imports, Total January 1982 5,330 5,332 B3.1b Imports, Petroleum Products January 1982 1,638 1,639 B3.1b Net Imports January 1982 4,502 4,503 B3.2a Crude Used Directly 1976 Average -19 -18 C3.2a Imports, SPR 1978 Average 161 162 C3.2a Crude Used Directly 1978 Average -15 -14 C3.2a Crude Used Directly 1979 Average -14 -13 C3.2a Crude Used Directly 1980 Average -14 -13 C3.2a Field Production, Alaskan February 1981 1,620 1,619 B3.2a Crude Used Directly June 1981 -59 -58 B3.2a Crude Used Directly July 1981 -59 -58 B3.2a Crude Used Directly August 1981 -59 -58 B3.2a Crude Used Directly October 1981 -62 -63 B3.2a Crude Used Directly November 1982 -50 -51 B3.2a Crude Used Directly December 1982 -52 -53 B3.2b Crude Losses 1976 Average 14 15 C3.2b Crude Losses 1980 Average 14 15 C3.2b Refinery Input February 1981 12,903 12,902 B3.2b Crude Losses March 1981 5 6 B3.2b Crude Losses April 1981 4 3 B3.2b Crude Losses July 1981 6 7 B3.2b Crude Losses August 1981 4 5 B3.2b Crude Losses October 1981 4 3 B3.2b Crude Losses April 1982 2 3 B3.2b Crude Losses May 1982 2 3 B3.2b Crude Losses October 1982 1 2 B3.2b Crude Losses November 1982 2 1 B3.2b Crude Losses December 1982 2 1 B3.3b Total Arab-OPEC, Total Imports November 1980 2,339 2,338 A3.3e Canada, Total Imports January 1980 569 570 A3.3e Canada, Total Imports July 1980 379 378 A3.3g Netherlands Antilles, Total Imports April 1980 229 231 A3.3g Netherlands Antilles, Total Imports November 1980 266 264 A3.3g Netherlands Antilles, Total Imports January 1982 177 179 B3.3h Total Non-OPEC, Total Imports January 1982 2,472 2,474 B3.3h Total Imports January 1982 5,330 5,332 B3.3h Total Non-OPEC, Total Imports September 1982 3,471 3,472 B3.3h Total Non-OPEC, Total Imports November 1982 3,509 3,508 B3.4 Ending Stocks, Total Motor Gasoline (Million barrels) May 1981 258 259 B3.4 Product Supplied, Unleaded July 1982 3,568 3,577 B3.4 Product Supplied, Unleaded (Percent of total) July 1982 52.2 52.7 B3.5 Stock Change 1974 Average 10 9 C3.5 Stock Change 1975 Average -41 -40 C3.5 Crude Used Directly June 1981 10 9 B3.6 Imports January 1980 1,339 1,338 A3.6 Imports October 1981 783 786 B3.6 Imports August 1982 550 551 B3.6 Product Supplied August 1982 1,530 1,531 B3.6 Imports November 1982 836 837 B3.8 Product Supplied March 1981 1,531 1,530 B3.8 Total Production 1982 Average 1,527 1,528 C3.10 Products Supplied 1982 Average 1,857 1,856 C
7. Data Discrepancies (Continued). This listing summarizes the data discrepancies between the Historical Monthly Energy Review (HMER) and the Petroleum Supply Annual (PSA) and Petroleum Supply Monthly (PSM).
*PSA issues used as data sources are noted as follows:A=Petroleum Supply Annual 1981, Volume 1,B=Petroleum Supply Annual 1983, Volume 1, andC=Petroleum Supply Annual 1990, Volume 1.
Note: All data are in thousand barrels per day except where noted.
Energy Information Administration/Historical Monthly Energy Review 1973-1992 157

Sources:
Table 3.1 (a,b)•1973-1975: U.S. Department of the Interior (DOI), Bu-reau of Mines (BOM), Mineral Industry Surveys, "Petro-leum Statement, Annual."
• 1976-1980: Energy Information Administration (EIA),Energy Data Reports, "Petroleum Statement, Annual."
• 1981-1992: EIA, Petroleum Supply Annual.
Table 3.2 (a,b)• Annual Data: 1973-1975—DOI, BOM, Mineral Indus-try Surveys, "Petroleum Statement, Annual." 1976-1980—EIA, Energy Data Reports, "Petroleum Statement,Annual." 1981-1992—EIA, Petroleum Supply Annual1992, Table S2.
• Monthly Data: Sources are the same as those forannual data, except for the following series and dates:SPR and Other Imports, October-December 1977—EIA, Monthly Energy Review, December 1979. SPR andOther Imports, January-December 1978—EIA, MonthlyEnergy Review, August 1980. SPR and Other PrimaryEnding Stocks, October 1977 and November 1977—EIA, Monthly Energy Review, December 1979. SPR andOther Primary Ending Stocks, January-November1978—EIA, Monthly Energy Review, August 1980. SPRand Other Stock Change, October 1977-December1978—Calculated by EIA using stocks data from theabove sources.
Table 3.3 (a-h) • Annual Data: EIA, Petroleum Supply Annual 1992,Volume 1, Table S3.
• Monthly Data: 1973-1975—DOI, BOM, Mineral Indus-try Surveys, "Petroleum Statement, Annual" and "P.A.D.Districts Supply/Demand Annual." 1976—EIA, EnergyData Reports, "Petroleum Statement, Annual" and"P.A.D. Districts Supply/Demand Annual." 1977—
EIA, Energy Data Reports, "Petroleum Statement, An-nual" and "P.A.D. Districts Supply/Demand Annual";EIA, "Report of Oil Imports into the United States andPuerto Rico, 1977-1985" (Form EIA-814/EIA-815),available only on data tape from the National TechnicalInformation Service (NTIS), Order NumberPB87147781; and U.S. Department of Commerce, Cen-sus Bureau, Form IM-145. 1978-1980—EIA, Energy DataReports, "Petroleum Statement, Annual" and "P.A.D.Districts Supply/Disposition, Annual"; EIA, "Report ofOil Imports into the United States and Puerto Rico,1977-1985" (Form EIA-814/EIA-815), available only ondata tape from NTIS, Order Number PB87147781; andU.S. Department of Commerce, Census Bureau, FormIM-145. 1981-1992—EIA, Petroleum Supply Annual.
Table 3.4
• 1973-1975: DOI, BOM, Mineral Industry Surveys, "Pe-troleum Statement, Annual."
• 1976: Unleaded Product Supplied—EIA, Energy DataReports, "Petroleum Statement, Annual."
• 1977: Unleaded Product Supplied—EIA, Monthly En-ergy Review, December 1979.
• 1978 and 1979: Unleaded Product Supplied—EIA,Monthly Petroleum Statistics Report.
• 1976-1979: All Other Series—EIA, Energy Data Re-ports, "Petroleum Statement, Annual."
• 1980: All Series—EIA, Energy Data Reports, "Petro-leum Statement, Annual."
• 1981-1992: All Series—EIA, Petroleum Supply Annual.
Tables 3.5-3.10
• 1973-1975: DOI, BOM, Mineral Industry Surveys, "Pe-troleum Statement, Annual."
• 1976-1980: EIA, Energy Data Reports, "Petroleum State-ment, Annual."
• 1981-1992: EIA, Petroleum Supply Annual.
Energy Information Administration/Historical Monthly Energy Review 1973-1992158

Section 4Natural Gas
One cubic foot of natural gas stored in this tank as a liquid at -260 degrees Fahrenheit wouldexpand to occupy over 600 cubic feet of space as a gas at 60 degrees Fahrenheit.

Table 4.1 Natural Gas Production, 1973-1992
(Billion Cubic Feet)
GrossWithdrawalsa Repressuringb
Nonhydro-carbon Gases
Removedc
Ventedand
Flaredd
MarketedProduction
(Wet)eExtraction
Lossf
TotalDry Gas
Productiong
1973January ............................. NA NA NA NA h 1,948 79 h 1,869February ........................... NA NA NA NA h 1,962 79 h 1,883March ................................ NA NA NA NA h 1,907 77 h 1,830April .................................. NA NA NA NA h 1,814 73 h 1,741May ................................... NA NA NA NA h 1,898 77 h 1,821June .................................. NA NA NA NA h 1,839 74 h 1,765July ................................... NA NA NA NA h 1,880 76 h 1,804August .............................. NA NA NA NA h 1,896 77 h 1,819September ........................ NA NA NA NA h 1,840 74 h 1,766October ............................. NA NA NA NA h 1,875 76 h 1,799November ......................... NA NA NA NA h 1,863 75 h 1,788December ......................... NA NA NA NA h 1,926 78 h 1,848Total ................................. 24,067 1,171 NA 248 h 22,648 917 h 21,731
1974January ............................. NA NA NA NA h 1,930 79 h 1,851February ........................... NA NA NA NA h 1,760 72 h 1,688March ................................ NA NA NA NA h 1,895 78 h 1,817April .................................. NA NA NA NA h 1,780 73 h 1,707May ................................... NA NA NA NA h 1,847 76 h 1,771June .................................. NA NA NA NA h 1,740 71 h 1,669July ................................... NA NA NA NA h 1,818 75 h 1,743August .............................. NA NA NA NA h 1,790 74 h 1,716September ........................ NA NA NA NA h 1,755 72 h 1,683October ............................. NA NA NA NA h 1,767 73 h 1,694November ......................... NA NA NA NA h 1,729 71 h 1,658December ......................... NA NA NA NA h 1,790 74 h 1,716Total ................................. 22,850 1,080 NA 169 h 21,601 887 h 20,713
1975January ............................. NA NA NA NA h 1,779 77 h 1,702February ........................... NA NA NA NA h 1,645 71 h 1,574March ................................ NA NA NA NA h 1,738 75 h 1,663April .................................. NA NA NA NA h 1,672 73 h 1,599May ................................... NA NA NA NA h 1,689 73 h 1,616June .................................. NA NA NA NA h 1,634 71 h 1,563July ................................... NA NA NA NA h 1,677 73 h 1,604August .............................. NA NA NA NA h 1,677 73 h 1,604September ........................ NA NA NA NA h 1,603 70 h 1,533October ............................. NA NA NA NA h 1,646 71 h 1,575November ......................... NA NA NA NA h 1,618 70 h 1,548December ......................... NA NA NA NA h 1,730 75 h 1,655Total ................................. 21,104 861 NA 134 h 20,109 872 h 19,236
1976January ............................. NA NA NA NA h 1,751 75 h 1,676February ........................... NA NA NA NA h 1,647 71 h 1,576March ................................ NA NA NA NA h 1,714 73 h 1,641April .................................. NA NA NA NA h 1,623 69 h 1,554May ................................... NA NA NA NA h 1,673 72 h 1,601June .................................. NA NA NA NA h 1,640 70 h 1,570July ................................... NA NA NA NA h 1,676 72 h 1,604August .............................. NA NA NA NA h 1,636 70 h 1,566September ........................ NA NA NA NA h 1,565 67 h 1,498October ............................. NA NA NA NA h 1,639 70 h 1,569November ......................... NA NA NA NA h 1,636 70 h 1,566December ......................... NA NA NA NA h 1,753 75 h 1,678Total ................................. 20,944 859 NA 132 h 19,952 854 h 19,098
1977January ............................. NA NA NA NA h 1,740 75 h 1,665February ........................... NA NA NA NA h 1,674 72 h 1,602March ................................ NA NA NA NA h 1,751 75 h 1,676April .................................. NA NA NA NA h 1,644 71 h 1,573May ................................... NA NA NA NA h 1,692 73 h 1,619June .................................. NA NA NA NA h 1,649 71 h 1,578July ................................... NA NA NA NA h 1,674 72 h 1,602August .............................. NA NA NA NA h 1,645 71 h 1,574September ........................ NA NA NA NA h 1,599 69 h 1,530October ............................. NA NA NA NA h 1,628 70 h 1,558November ......................... NA NA NA NA h 1,606 69 h 1,537December ......................... NA NA NA NA h 1,726 74 h 1,652Total ................................. 21,097 935 NA 137 h 20,025 863 h 19,163
See footnotes at end of table.
Energy Information Administration/Historical Monthly Energy Review 1973-1992 161

Table 4.1 Natural Gas Production, 1973-1992 (Continued)
(Billion Cubic Feet)
GrossWithdrawalsa Repressuringb
Nonhydro-carbon Gases
Removedc
Ventedand
Flaredd
MarketedProduction
(Wet)eExtraction
Lossf
TotalDry Gas
Productiong
1978January ............................. NA NA NA NA h 1,743 74 h 1,669February ........................... NA NA NA NA h 1,649 70 h 1,579March ................................ NA NA NA NA h 1,748 75 h 1,673April .................................. NA NA NA NA h 1,668 71 h 1,597May ................................... NA NA NA NA h 1,664 71 h 1,593June .................................. NA NA NA NA h 1,623 69 h 1,554July ................................... NA NA NA NA h 1,693 72 h 1,621August .............................. NA NA NA NA h 1,658 71 h 1,587September ........................ NA NA NA NA h 1,576 67 h 1,509October ............................. NA NA NA NA h 1,635 70 h 1,565November ......................... NA NA NA NA h 1,607 69 h 1,538December ......................... NA NA NA NA h 1,710 73 h 1,637Total ................................. 21,309 1,181 NA 153 h 19,974 852 h 19,122
1979January ............................. NA NA NA NA h 1,772 70 h 1,702February ........................... NA NA NA NA h 1,656 65 h 1,591March ................................ NA NA NA NA h 1,755 69 h 1,686April .................................. NA NA NA NA h 1,693 67 h 1,626May ................................... NA NA NA NA h 1,716 68 h 1,648June .................................. NA NA NA NA h 1,643 65 h 1,578July ................................... NA NA NA NA h 1,662 66 h 1,596August .............................. NA NA NA NA h 1,689 67 h 1,622September ........................ NA NA NA NA h 1,635 65 h 1,570October ............................. NA NA NA NA h 1,705 67 h 1,638November ......................... NA NA NA NA h 1,724 68 h 1,656December ......................... NA NA NA NA h 1,823 72 h 1,751Total ................................. 21,883 1,245 NA 167 h 20,471 808 h 19,663
1980January ............................. 1,960 110 18 12 1,821 70 1,751February ........................... 1,840 105 16 10 1,709 66 1,643March ................................ 1,971 114 17 10 1,830 70 1,760April .................................. 1,806 110 16 10 1,670 64 1,606May ................................... 1,840 118 17 11 1,695 65 1,630June .................................. 1,725 114 16 9 1,586 61 1,525July ................................... 1,756 114 17 9 1,616 62 1,554August .............................. 1,716 114 17 10 1,576 61 1,515September ........................ 1,723 115 17 12 1,579 61 1,518October ............................. 1,790 118 15 10 1,648 63 1,585November ......................... 1,790 112 17 10 1,652 64 1,588December ......................... 1,949 122 18 11 1,798 69 1,729Total ................................. 21,870 1,365 199 125 20,180 777 19,403
1981January ............................. 1,890 108 20 10 1,752 68 1,684February ........................... 1,702 101 18 10 1,573 61 1,512March ................................ 1,871 109 18 9 1,735 67 1,668April .................................. 1,808 108 18 8 1,674 65 1,609May ................................... 1,838 115 18 7 1,698 66 1,632June .................................. 1,770 109 19 8 1,634 63 1,571July ................................... 1,797 106 20 9 1,663 65 1,598August .............................. 1,841 108 18 10 1,705 66 1,639September ........................ 1,716 114 18 7 1,577 61 1,516October ............................. 1,781 113 18 7 1,643 64 1,579November ......................... 1,714 108 17 6 1,583 61 1,522December ......................... 1,860 114 20 8 1,718 67 1,651Total ................................. 21,587 1,312 222 98 19,956 775 19,181
1982January ............................. R 1,870 108 19 9 R 1,734 71 R 1,663February ........................... R 1,716 101 18 8 R 1,589 65 R 1,524March ................................ R 1,822 115 19 7 R 1,681 69 R 1,612April .................................. R 1,719 108 18 7 R 1,586 65 R 1,521May ................................... R 1,698 117 17 7 R 1,557 64 R 1,493June .................................. R 1,647 114 16 7 R 1,510 62 R 1,448July ................................... R 1,672 119 15 7 R 1,531 63 R 1,468August .............................. R 1,643 120 18 8 R 1,497 61 R 1,436September ........................ R 1,574 116 16 6 R 1,436 59 R 1,377October ............................. R 1,615 126 16 8 R 1,465 60 R 1,405November ......................... R 1,627 119 18 9 R 1,481 61 R 1,420December ......................... R 1,669 125 19 10 R 1,515 62 R 1,453Total ................................. R 20,272 1,388 208 93 R 18,582 762 R 17,820
See footnotes at end of table.
Energy Information Administration/Historical Monthly Energy Review 1973-1992162
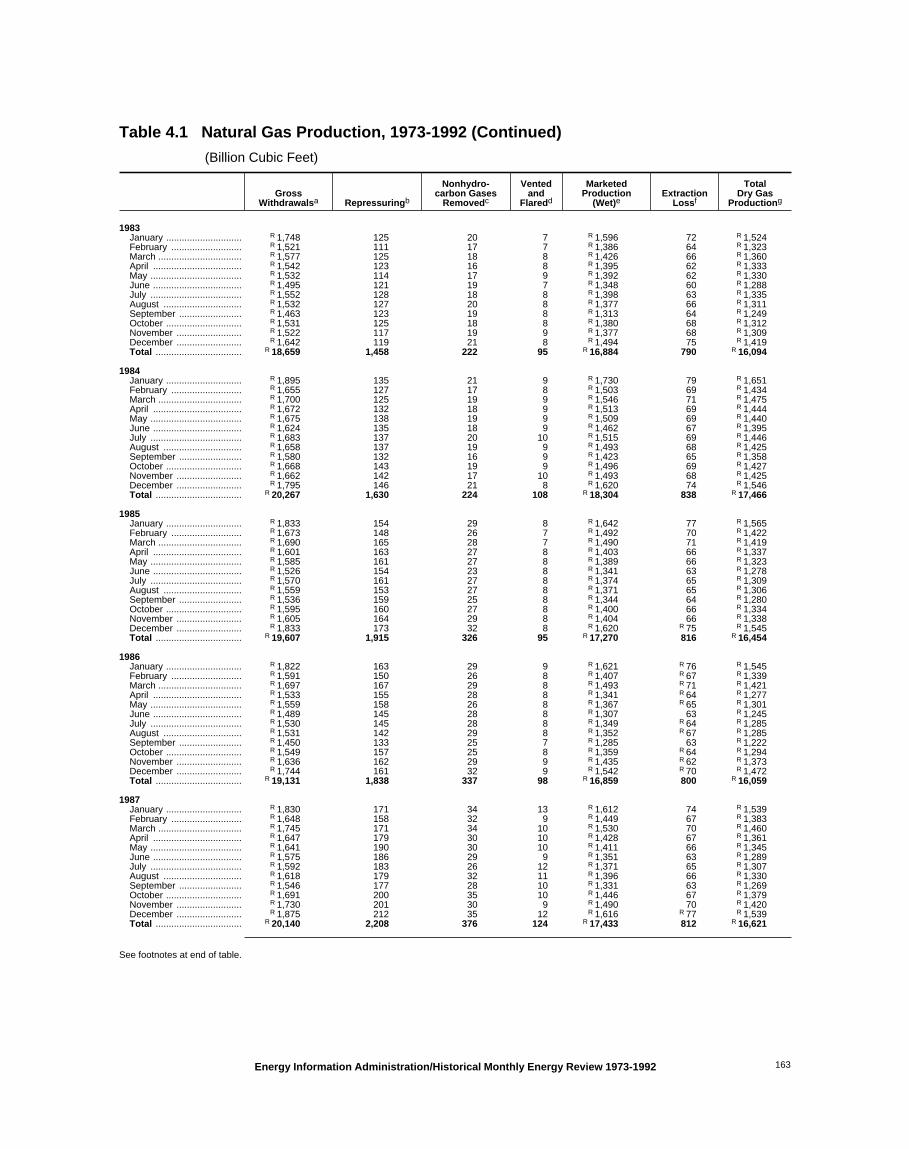
Table 4.1 Natural Gas Production, 1973-1992 (Continued)
(Billion Cubic Feet)
GrossWithdrawalsa Repressuringb
Nonhydro-carbon Gases
Removedc
Ventedand
Flaredd
MarketedProduction
(Wet)eExtraction
Lossf
TotalDry Gas
Productiong
1983January ............................. R 1,748 125 20 7 R 1,596 72 R 1,524February ........................... R 1,521 111 17 7 R 1,386 64 R 1,323March ................................ R 1,577 125 18 8 R 1,426 66 R 1,360April .................................. R 1,542 123 16 8 R 1,395 62 R 1,333May ................................... R 1,532 114 17 9 R 1,392 62 R 1,330June .................................. R 1,495 121 19 7 R 1,348 60 R 1,288July ................................... R 1,552 128 18 8 R 1,398 63 R 1,335August .............................. R 1,532 127 20 8 R 1,377 66 R 1,311September ........................ R 1,463 123 19 8 R 1,313 64 R 1,249October ............................. R 1,531 125 18 8 R 1,380 68 R 1,312November ......................... R 1,522 117 19 9 R 1,377 68 R 1,309December ......................... R 1,642 119 21 8 R 1,494 75 R 1,419Total ................................. R 18,659 1,458 222 95 R 16,884 790 R 16,094
1984January ............................. R 1,895 135 21 9 R 1,730 79 R 1,651February ........................... R 1,655 127 17 8 R 1,503 69 R 1,434March ................................ R 1,700 125 19 9 R 1,546 71 R 1,475April .................................. R 1,672 132 18 9 R 1,513 69 R 1,444May ................................... R 1,675 138 19 9 R 1,509 69 R 1,440June .................................. R 1,624 135 18 9 R 1,462 67 R 1,395July ................................... R 1,683 137 20 10 R 1,515 69 R 1,446August .............................. R 1,658 137 19 9 R 1,493 68 R 1,425September ........................ R 1,580 132 16 9 R 1,423 65 R 1,358October ............................. R 1,668 143 19 9 R 1,496 69 R 1,427November ......................... R 1,662 142 17 10 R 1,493 68 R 1,425December ......................... R 1,795 146 21 8 R 1,620 74 R 1,546Total ................................. R 20,267 1,630 224 108 R 18,304 838 R 17,466
1985January ............................. R 1,833 154 29 8 R 1,642 77 R 1,565February ........................... R 1,673 148 26 7 R 1,492 70 R 1,422March ................................ R 1,690 165 28 7 R 1,490 71 R 1,419April .................................. R 1,601 163 27 8 R 1,403 66 R 1,337May ................................... R 1,585 161 27 8 R 1,389 66 R 1,323June .................................. R 1,526 154 23 8 R 1,341 63 R 1,278July ................................... R 1,570 161 27 8 R 1,374 65 R 1,309August .............................. R 1,559 153 27 8 R 1,371 65 R 1,306September ........................ R 1,536 159 25 8 R 1,344 64 R 1,280October ............................. R 1,595 160 27 8 R 1,400 66 R 1,334November ......................... R 1,605 164 29 8 R 1,404 66 R 1,338December ......................... R 1,833 173 32 8 R 1,620 R 75 R 1,545Total ................................. R 19,607 1,915 326 95 R 17,270 816 R 16,454
1986January ............................. R 1,822 163 29 9 R 1,621 R 76 R 1,545February ........................... R 1,591 150 26 8 R 1,407 R 67 R 1,339March ................................ R 1,697 167 29 8 R 1,493 R 71 R 1,421April .................................. R 1,533 155 28 8 R 1,341 R 64 R 1,277May ................................... R 1,559 158 26 8 R 1,367 R 65 R 1,301June .................................. R 1,489 145 28 8 R 1,307 63 R 1,245July ................................... R 1,530 145 28 8 R 1,349 R 64 R 1,285August .............................. R 1,531 142 29 8 R 1,352 R 67 R 1,285September ........................ R 1,450 133 25 7 R 1,285 63 R 1,222October ............................. R 1,549 157 25 8 R 1,359 R 64 R 1,294November ......................... R 1,636 162 29 9 R 1,435 R 62 R 1,373December ......................... R 1,744 161 32 9 R 1,542 R 70 R 1,472Total ................................. R 19,131 1,838 337 98 R 16,859 800 R 16,059
1987January ............................. R 1,830 171 34 13 R 1,612 74 R 1,539February ........................... R 1,648 158 32 9 R 1,449 67 R 1,383March ................................ R 1,745 171 34 10 R 1,530 70 R 1,460April .................................. R 1,647 179 30 10 R 1,428 67 R 1,361May ................................... R 1,641 190 30 10 R 1,411 66 R 1,345June .................................. R 1,575 186 29 9 R 1,351 63 R 1,289July ................................... R 1,592 183 26 12 R 1,371 65 R 1,307August .............................. R 1,618 179 32 11 R 1,396 66 R 1,330September ........................ R 1,546 177 28 10 R 1,331 63 R 1,269October ............................. R 1,691 200 35 10 R 1,446 67 R 1,379November ......................... R 1,730 201 30 9 R 1,490 70 R 1,420December ......................... R 1,875 212 35 12 R 1,616 R 77 R 1,539Total ................................. R 20,140 2,208 376 124 R 17,433 812 R 16,621
See footnotes at end of table.
Energy Information Administration/Historical Monthly Energy Review 1973-1992 163
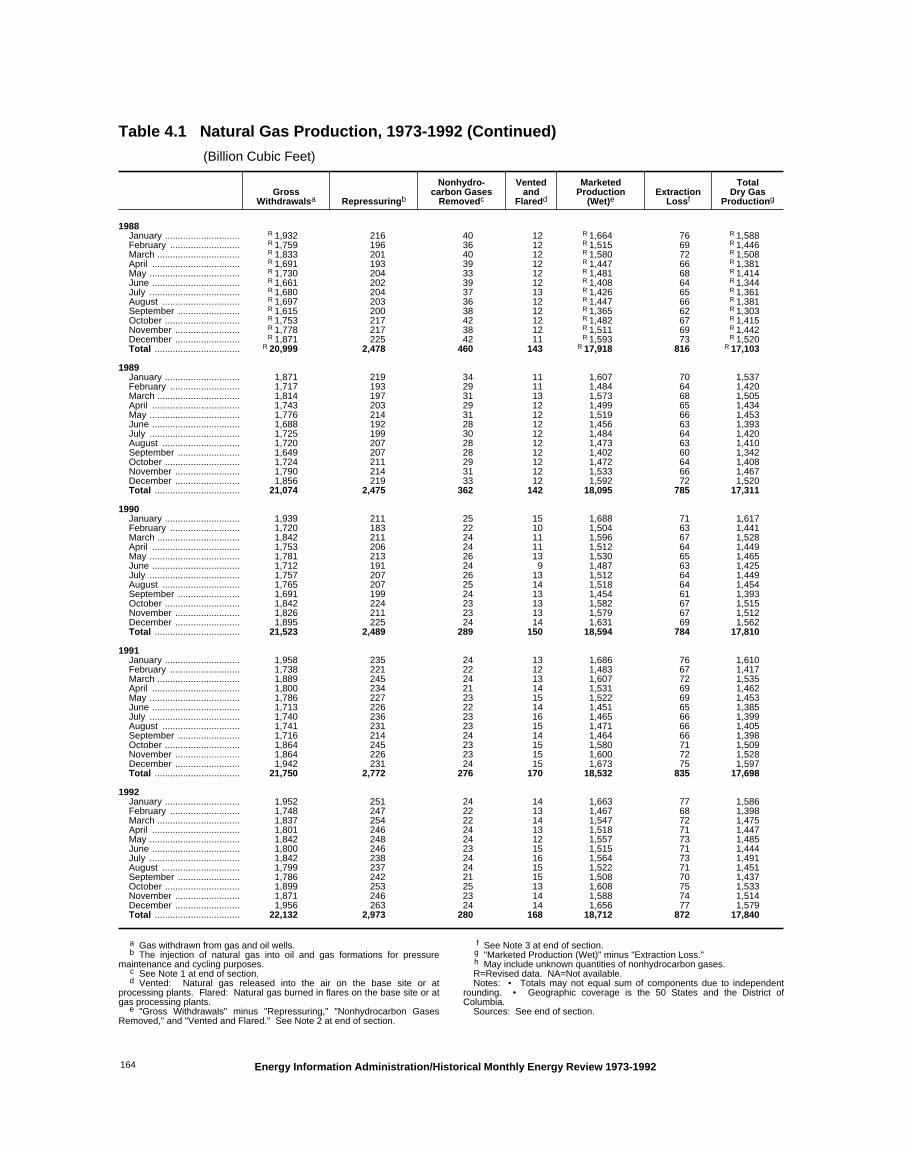
Table 4.1 Natural Gas Production, 1973-1992 (Continued)
(Billion Cubic Feet)
GrossWithdrawalsa Repressuringb
Nonhydro-carbon Gases
Removedc
Ventedand
Flaredd
MarketedProduction
(Wet)eExtraction
Lossf
TotalDry Gas
Productiong
1988January ............................. R 1,932 216 40 12 R 1,664 76 R 1,588February ........................... R 1,759 196 36 12 R 1,515 69 R 1,446March ................................ R 1,833 201 40 12 R 1,580 72 R 1,508April .................................. R 1,691 193 39 12 R 1,447 66 R 1,381May ................................... R 1,730 204 33 12 R 1,481 68 R 1,414June .................................. R 1,661 202 39 12 R 1,408 64 R 1,344July ................................... R 1,680 204 37 13 R 1,426 65 R 1,361August .............................. R 1,697 203 36 12 R 1,447 66 R 1,381September ........................ R 1,615 200 38 12 R 1,365 62 R 1,303October ............................. R 1,753 217 42 12 R 1,482 67 R 1,415November ......................... R 1,778 217 38 12 R 1,511 69 R 1,442December ......................... R 1,871 225 42 11 R 1,593 73 R 1,520Total ................................. R 20,999 2,478 460 143 R 17,918 816 R 17,103
1989January ............................. 1,871 219 34 11 1,607 70 1,537February ........................... 1,717 193 29 11 1,484 64 1,420March ................................ 1,814 197 31 13 1,573 68 1,505April .................................. 1,743 203 29 12 1,499 65 1,434May ................................... 1,776 214 31 12 1,519 66 1,453June .................................. 1,688 192 28 12 1,456 63 1,393July ................................... 1,725 199 30 12 1,484 64 1,420August .............................. 1,720 207 28 12 1,473 63 1,410September ........................ 1,649 207 28 12 1,402 60 1,342October ............................. 1,724 211 29 12 1,472 64 1,408November ......................... 1,790 214 31 12 1,533 66 1,467December ......................... 1,856 219 33 12 1,592 72 1,520Total ................................. 21,074 2,475 362 142 18,095 785 17,311
1990January ............................. 1,939 211 25 15 1,688 71 1,617February ........................... 1,720 183 22 10 1,504 63 1,441March ................................ 1,842 211 24 11 1,596 67 1,528April .................................. 1,753 206 24 11 1,512 64 1,449May ................................... 1,781 213 26 13 1,530 65 1,465June .................................. 1,712 191 24 9 1,487 63 1,425July ................................... 1,757 207 26 13 1,512 64 1,449August .............................. 1,765 207 25 14 1,518 64 1,454September ........................ 1,691 199 24 13 1,454 61 1,393October ............................. 1,842 224 23 13 1,582 67 1,515November ......................... 1,826 211 23 13 1,579 67 1,512December ......................... 1,895 225 24 14 1,631 69 1,562Total ................................. 21,523 2,489 289 150 18,594 784 17,810
1991January ............................. 1,958 235 24 13 1,686 76 1,610February ........................... 1,738 221 22 12 1,483 67 1,417March ................................ 1,889 245 24 13 1,607 72 1,535April .................................. 1,800 234 21 14 1,531 69 1,462May ................................... 1,786 227 23 15 1,522 69 1,453June .................................. 1,713 226 22 14 1,451 65 1,385July ................................... 1,740 236 23 16 1,465 66 1,399August .............................. 1,741 231 23 15 1,471 66 1,405September ........................ 1,716 214 24 14 1,464 66 1,398October ............................. 1,864 245 23 15 1,580 71 1,509November ......................... 1,864 226 23 15 1,600 72 1,528December ......................... 1,942 231 24 15 1,673 75 1,597Total ................................. 21,750 2,772 276 170 18,532 835 17,698
1992January ............................. 1,952 251 24 14 1,663 77 1,586February ........................... 1,748 247 22 13 1,467 68 1,398March ................................ 1,837 254 22 14 1,547 72 1,475April .................................. 1,801 246 24 13 1,518 71 1,447May ................................... 1,842 248 24 12 1,557 73 1,485June .................................. 1,800 246 23 15 1,515 71 1,444July ................................... 1,842 238 24 16 1,564 73 1,491August .............................. 1,799 237 24 15 1,522 71 1,451September ........................ 1,786 242 21 15 1,508 70 1,437October ............................. 1,899 253 25 13 1,608 75 1,533November ......................... 1,871 246 23 14 1,588 74 1,514December ......................... 1,956 263 24 14 1,656 77 1,579Total ................................. 22,132 2,973 280 168 18,712 872 17,840
a Gas withdrawn from gas and oil wells.b The injection of natural gas into oil and gas formations for pressure
maintenance and cycling purposes.c See Note 1 at end of section.d Vented: Natural gas released into the air on the base site or at
processing plants. Flared: Natural gas burned in flares on the base site or atgas processing plants.
e "Gross Withdrawals" minus "Repressuring," "Nonhydrocarbon GasesRemoved," and "Vented and Flared." See Note 2 at end of section.
f See Note 3 at end of section.g "Marketed Production (Wet)" minus "Extraction Loss."h May include unknown quantities of nonhydrocarbon gases.R=Revised data. NA=Not available. Notes: • Totals may not equal sum of components due to independent
rounding. • Geographic coverage is the 50 States and the District ofColumbia.
Sources: See end of section.
Energy Information Administration/Historical Monthly Energy Review 1973-1992164

Table 4.2 Natural Gas Supply and Disposition, 1973-1992
(Billion Cubic Feet)
Supply
TotalSupply/
Dispositiond
Disposition
TotalDry Gas
Production
Withdrawalsfrom
Storagea
SupplementalGaseous
Fuelsb ImportscBalancing
Itemb
Additionsto
Storagea Exportsc Consumptionb
1973January ................... e 1,869 NA NA 93 NA NA NA R 6 2,348February ................. e 1,883 NA NA 84 NA NA NA R 6 2,126March ...................... e 1,830 NA NA R 92 NA NA NA R 4 2,015April ........................ e 1,741 NA NA 88 NA NA NA R 8 1,835May ......................... e 1,821 NA NA 86 NA NA NA R 9 1,729June ........................ e 1,765 NA NA 79 NA NA NA R 4 1,534July ......................... e 1,804 NA NA R 79 NA NA NA R 6 1,558August .................... e 1,819 NA NA R 84 NA NA NA R 9 1,582September .............. e 1,766 NA NA R 81 NA NA NA 6 1,527October ................... e 1,799 NA NA R 92 NA NA NA 5 1,708November ............... e 1,788 NA NA R 86 NA NA NA R 6 1,905December ............... e 1,848 NA NA R 88 NA NA NA R 8 2,182Total ....................... e 21,731 1,533 NA 1,033 -196 24,101 1,974 77 22,049
1974January ................... e 1,851 NA NA 86 NA NA NA 6 2,230February ................. e 1,688 NA NA 79 NA NA NA 6 2,054March ...................... e 1,817 NA NA 85 NA NA NA 7 2,003April ........................ e 1,707 NA NA 83 NA NA NA 6 1,691May ......................... e 1,771 NA NA 80 NA NA NA R 5 1,608June ........................ e 1,669 NA NA 74 NA NA NA 8 1,439July ......................... e 1,743 NA NA R 73 NA NA NA 8 1,514August .................... e 1,716 NA NA 76 NA NA NA 5 1,510September .............. e 1,683 NA NA R 71 NA NA NA 6 1,537October ................... e 1,694 NA NA 83 NA NA NA 5 1,706November ............... e 1,658 NA NA R 83 NA NA NA 7 1,827December ............... e 1,716 NA NA R 86 NA NA NA 7 2,104Total ....................... e 20,713 1,701 NA 959 -289 23,084 1,784 77 21,223
1975January ................... e 1,702 NA NA 81 NA NA NA 4 2,248February ................. e 1,574 NA NA R 74 NA NA NA 7 1,939March ...................... e 1,663 NA NA 83 NA NA NA 6 1,903April ........................ e 1,599 NA NA 82 NA NA NA 6 1,575May ......................... e 1,616 NA NA 80 NA NA NA 7 1,331June ........................ e 1,563 NA NA 76 NA NA NA 4 1,257July ......................... e 1,604 NA NA 80 NA NA NA 8 1,313August .................... e 1,604 NA NA 75 NA NA NA 6 1,369September .............. e 1,533 31 NA 74 R -42 R 1,596 220 6 1,370October ................... e 1,575 51 NA 80 R 34 R 1,740 190 6 1,544November ............... e 1,548 146 NA 81 R -32 R 1,743 98 5 1,640December ............... e 1,655 371 NA 86 R -17 R 2,095 38 8 2,049Total ....................... e 19,236 1,760 NA 953 -235 21,714 2,104 73 19,538
1976January ................... e 1,676 R 487 NA 84 R 64 R 2,311 R 15 5 2,291February ................. e 1,576 R 245 NA 78 R 103 R 2,002 R 59 5 1,938March ...................... e 1,641 R 185 NA 85 R -113 R 1,798 R 71 6 1,721April ........................ e 1,554 R 69 NA 86 R -29 R 1,680 R 166 6 1,508May ......................... e 1,601 R 22 NA 82 R -46 R 1,659 R 220 5 1,434June ........................ e 1,570 R 25 NA 76 R -58 R 1,613 R 273 5 1,335July ......................... e 1,604 6 NA 73 R -34 R 1,649 R 271 6 1,372August .................... e 1,566 R 16 NA 77 R -68 R 1,591 R 268 6 1,317September .............. e 1,498 R 20 NA 74 R -50 R 1,542 R 233 R 7 1,302October ................... e 1,569 R 107 NA 85 R -14 R 1,747 R 121 5 1,621November ............... e 1,566 R 270 NA 81 R -1 R 1,916 R 36 5 1,875December ............... e 1,678 R 468 NA 83 R 29 R 2,258 R 21 5 2,232Total ....................... e 19,098 1,921 NA 964 -216 21,767 1,756 65 19,946
1977January ................... e 1,665 R 664 NA 87 R 13 R 2,429 R 17 5 2,407February ................. e 1,602 R 233 NA 92 R -9 R 1,918 R 97 R 5 1,816March ...................... e 1,676 R 131 NA 101 R -8 R 1,900 R 181 4 1,715April ........................ e 1,573 43 NA 84 R -11 R 1,689 R 247 3 1,439May ......................... e 1,619 17 NA 86 R -22 R 1,700 R 318 3 1,379June ........................ e 1,578 12 NA 76 R -22 R 1,644 R 306 5 1,333July ......................... e 1,602 15 NA R 72 R -21 R 1,668 R 336 7 1,325August .................... e 1,574 21 NA 76 R -22 R 1,649 R 280 5 1,364September .............. e 1,530 2 NA 75 R 78 R 1,685 R 253 5 1,427October ................... e 1,558 44 NA 85 R -12 R 1,675 R 152 5 1,518November ............... e 1,537 R 158 NA 86 R -5 R 1,776 R 81 5 1,690December ............... e 1,652 R 412 NA 90 R -1 R 2,153 R 40 5 2,108Total ....................... e 19,163 1,750 NA 1,011 -41 21,883 2,307 56 19,521
See footnotes at end of table.
Energy Information Administration/Historical Monthly Energy Review 1973-1992 165

Table 4.2 Natural Gas Supply and Disposition, 1973-1992 (Continued)
(Billion Cubic Feet)
Supply
TotalSupply/
Dispositiond
Disposition
TotalDry Gas
Production
Withdrawalsfrom
Storagea
SupplementalGaseous
Fuelsb ImportscBalancing
Itemb
Additionsto
Storagea Exportsc Consumptionb
1978January ................... e 1,669 R 662 NA 86 R -9 R 2,408 21 5 2,382February ................. e 1,579 R 526 NA 77 R -17 R 2,165 21 5 2,139March ...................... e 1,673 R 276 NA 86 R -22 R 2,013 R 90 5 1,918April ........................ e 1,597 R 67 NA 78 R -25 R 1,717 R 175 3 1,539May ......................... e 1,593 30 NA 74 R -27 R 1,670 R 285 5 1,380June ........................ e 1,554 18 NA 68 R -29 R 1,611 R 357 R 5 1,249July ......................... e 1,621 16 NA 72 R -30 R 1,679 R 341 5 1,333August .................... e 1,587 12 NA 74 R -32 R 1,641 R 351 5 1,285September .............. e 1,509 9 NA 73 R -28 R 1,563 R 322 6 1,235October ................... e 1,565 28 NA 80 R -26 R 1,647 R 204 3 1,440November ............... e 1,538 R 134 NA 91 R -22 R 1,741 R 80 3 1,658December ............... e 1,637 R 381 NA 107 R -20 R 2,105 R 32 4 2,069Total ....................... e 19,122 2,158 NA 966 -287 21,958 2,278 53 19,627
1979January ................... e 1,702 R 675 NA 102 R -26 R 2,453 R 20 R 7 2,426February ................. e 1,591 R 568 NA 97 R -25 R 2,231 R 22 5 2,204March ...................... e 1,686 R 206 NA 113 R -29 R 1,976 R 90 5 1,881April ........................ e 1,626 73 NA 106 R -31 R 1,774 R 175 5 1,594May ......................... e 1,648 13 NA 104 R -34 R 1,731 R 297 5 1,429June ........................ e 1,578 8 NA 101 R -36 R 1,651 R 337 5 1,309July ......................... e 1,596 19 NA 104 R -35 R 1,684 R 348 6 1,330August .................... e 1,622 12 NA 97 R -36 R 1,695 R 348 R 5 1,342September .............. e 1,570 14 NA 98 R -34 R 1,648 R 314 5 1,329October ................... e 1,638 34 NA 107 R -30 R 1,749 R 189 3 1,557November ............... e 1,656 132 NA R 115 R -28 R 1,875 R 104 3 1,768December ............... e 1,751 R 293 NA 110 R -27 R 2,127 R 51 4 2,072Total ....................... e 19,663 2,047 NA 1,253 -372 22,591 2,295 56 20,241
1980January ................... 1,751 438 17 118 -58 2,266 22 6 2,238February ................. 1,643 465 16 108 -55 2,177 25 5 2,147March ...................... 1,760 292 16 109 R -57 2,120 61 5 2,054April ........................ 1,606 67 12 77 -53 1,709 171 3 1,535May ......................... 1,630 9 11 70 -54 1,666 306 3 1,357June ........................ 1,525 14 10 61 -51 1,559 301 3 1,255July ......................... 1,554 20 10 61 -54 1,591 293 3 1,295August .................... 1,515 30 10 60 -50 1,565 280 3 1,282September .............. 1,518 11 10 60 -49 1,550 246 5 1,299October ................... 1,585 49 12 R 74 R -51 1,669 142 5 1,522November ............... 1,588 194 14 88 -53 1,831 67 R 4 1,761December ............... 1,729 383 16 98 -57 2,169 35 5 2,129Total ....................... 19,403 1,972 155 985 -640 21,875 1,949 49 19,877
1981January ................... 1,684 571 20 91 -44 2,322 38 5 2,279February ................. 1,512 385 17 85 -39 1,960 60 5 1,895March ...................... 1,668 239 17 80 -44 1,960 56 5 1,899April ........................ 1,609 56 14 69 -42 1,706 213 5 1,488May ......................... 1,632 27 13 62 -43 1,691 261 4 1,426June ........................ 1,571 28 12 65 -41 1,635 321 5 1,309July ......................... 1,598 27 12 66 -42 1,661 342 5 1,314August .................... 1,639 15 12 64 -43 1,687 369 5 1,313September .............. 1,516 9 12 67 -40 1,564 293 6 1,265October ................... 1,579 51 14 79 -41 1,682 158 5 1,519November ............... 1,522 127 15 82 -40 1,706 82 5 1,619December ............... 1,651 396 19 93 -43 2,116 35 5 2,076Total ....................... 19,181 1,930 176 904 -500 21,691 2,228 59 19,404
1982January ................... R 1,663 697 19 98 R -50 2,427 24 3 2,400February ................. R 1,524 461 16 85 R -46 2,040 51 5 1,984March ...................... R 1,612 274 15 82 R -49 1,934 91 5 1,838April ........................ R 1,521 112 12 72 R -45 1,672 185 2 1,485May ......................... R 1,493 11 9 65 R -45 1,533 394 3 1,136June ........................ R 1,448 11 9 61 R -44 1,485 364 6 1,115July ......................... R 1,468 12 9 67 R -44 1,512 362 5 1,145August .................... R 1,436 36 9 61 R -43 1,499 342 6 1,151September .............. R 1,377 20 9 66 R -42 1,430 285 5 1,140October ................... R 1,405 62 11 77 R -42 1,513 197 5 1,311November ............... R 1,420 168 13 91 R -43 1,649 85 5 1,559December ............... R 1,453 299 14 110 R -44 1,832 88 5 1,739Total ....................... R 17,820 2,164 145 933 R -537 20,525 2,472 52 18,001
See footnotes at end of table.
Energy Information Administration/Historical Monthly Energy Review 1973-1992166

Table 4.2 Natural Gas Supply and Disposition, 1973-1992 (Continued)
(Billion Cubic Feet)
Supply
TotalSupply/
Dispositiond
Disposition
TotalDry Gas
Production
Withdrawalsfrom
Storagea
SupplementalGaseous
Fuelsb ImportscBalancing
Itemb
Additionsto
Storagea Exportsc Consumptionb
1983January ................... R 1,524 R 627 R 16 112 R -36 R 2,243 R 44 5 R 2,195February ................. R 1,323 R 335 R 12 95 R 122 R 1,886 R 48 5 R 1,833March ...................... R 1,360 R 401 12 86 R -90 R 1,769 R 39 5 R 1,726April ........................ R 1,333 R 110 R 10 74 R 94 R 1,620 R 117 5 R 1,499May ......................... R 1,330 R 33 R 8 61 R 39 R 1,472 205 5 R 1,262June ........................ R 1,288 R 30 8 59 R -20 R 1,366 R 261 3 R 1,102July ......................... R 1,335 R 31 8 58 R -68 R 1,365 R 280 5 R 1,081August .................... R 1,311 R 33 R 10 56 R -65 R 1,345 R 257 6 R 1,082September .............. R 1,249 R 33 R 10 67 R -103 R 1,256 R 234 4 R 1,018October ................... R 1,312 R 52 10 64 R -131 R 1,307 R 196 4 R 1,107November ............... R 1,309 R 250 R 13 80 R -274 R 1,378 R 67 5 R 1,306December ............... R 1,419 R 334 R 16 107 R -172 R 1,703 R 75 5 R 1,624Total ....................... R 16,094 2,270 132 918 Rf -703 18,712 1,822 55 16,835
1984January ................... R 1,651 R 579 13 97 R 59 2,400 55 5 2,340February ................. R 1,434 310 10 69 R 198 2,020 61 5 R 1,955March ...................... R 1,475 371 10 69 R -30 1,895 49 6 1,840April ........................ R 1,444 102 8 71 R 125 1,750 147 5 R 1,599May ......................... R 1,440 31 7 66 R 65 R 1,609 259 5 R 1,346June ........................ R 1,395 28 7 59 R 18 R 1,507 329 3 R 1,175July ......................... R 1,446 29 7 55 R -28 R 1,509 353 5 1,152August .................... R 1,425 31 8 54 R -36 R 1,482 324 5 1,154September .............. R 1,358 31 8 57 R -70 R 1,384 295 5 1,085October ................... R 1,427 48 8 R 66 R -118 R 1,431 247 5 1,180November ............... R 1,425 231 11 R 85 R -269 R 1,482 85 5 R 1,392December ............... R 1,546 309 13 94 R -132 R 1,830 94 5 1,732Total ....................... R 17,466 2,098 110 843 Rf -217 20,300 2,295 55 17,951
1985January ................... R 1,565 R 651 13 104 R -195 R 2,138 32 5 R 2,102February ................. R 1,422 447 9 99 R 222 R 2,199 47 5 R 2,147March ...................... R 1,419 225 8 90 R 83 R 1,824 98 6 R 1,720April ........................ R 1,337 91 11 76 R 144 R 1,658 208 5 R 1,446May ......................... R 1,323 23 11 73 R 19 R 1,449 300 2 R 1,147June ........................ R 1,278 31 10 65 R -46 R 1,338 257 5 R 1,076July ......................... R 1,309 45 12 59 R 15 R 1,440 315 6 R 1,119August .................... R 1,306 50 12 61 R -22 R 1,406 283 5 R 1,118September .............. R 1,280 20 9 63 R -49 R 1,323 277 5 R 1,041October ................... R 1,334 71 12 76 R -137 R 1,355 203 5 R 1,147November ............... R 1,338 207 9 77 R -214 R 1,416 99 5 R 1,313December ............... R 1,545 R 537 R 13 106 R -248 R 1,953 44 5 R 1,904Total ....................... R 16,454 2,397 126 950 R -428 19,499 2,163 55 17,281
1986January ................... R 1,545 421 12 99 R 129 R 2,205 48 5 R 2,153February ................. R 1,339 375 11 74 R 143 R 1,942 54 3 R 1,885March ...................... R 1,421 215 11 55 R 144 R 1,846 109 5 R 1,731April ........................ R 1,277 73 8 43 R 95 R 1,496 142 6 R 1,348May ......................... R 1,301 42 8 52 R 25 R 1,428 260 3 R 1,165June ........................ R 1,245 24 8 44 R -19 R 1,302 260 6 R 1,036July ......................... R 1,285 29 8 48 R -53 R 1,317 281 6 R 1,031August .................... R 1,285 26 8 51 R -83 R 1,286 285 6 R 995September .............. R 1,222 25 8 54 R -121 R 1,188 244 5 R 940October ................... R 1,294 48 9 69 R -206 R 1,214 192 5 R 1,016November ............... R 1,373 200 10 70 R -329 R 1,324 74 6 R 1,244December ............... R 1,472 358 R 15 90 R -217 R 1,718 36 6 R 1,676Total ....................... R 16,059 1,837 113 750 R -493 18,266 1,984 61 16,221
1987January ................... R 1,539 521 R 10 101 R -3 R 2,168 38 5 R 2,125February ................. R 1,383 325 9 84 R 156 R 1,957 35 3 R 1,918March ...................... R 1,460 213 9 86 R 89 R 1,857 105 5 R 1,748April ........................ R 1,361 101 8 68 R 67 R 1,605 166 3 R 1,436May ......................... R 1,345 28 7 61 R 43 R 1,484 298 3 R 1,183June ........................ R 1,289 21 7 58 R -19 R 1,355 252 5 R 1,098July ......................... R 1,307 27 8 66 R -81 R 1,327 230 5 R 1,092August .................... R 1,330 43 8 75 R -81 R 1,374 245 5 R 1,125September .............. R 1,269 19 7 73 R -88 R 1,279 231 5 R 1,043October ................... R 1,379 86 8 93 R -193 R 1,373 148 5 R 1,220November ............... R 1,420 155 9 107 R -164 R 1,527 105 6 R 1,416December ............... R 1,539 365 R 15 121 R -170 R 1,870 59 5 R 1,806Total ....................... R 16,621 1,905 101 993 R -444 19,176 1,911 54 17,211
See footnotes at end of table.
Energy Information Administration/Historical Monthly Energy Review 1973-1992 167
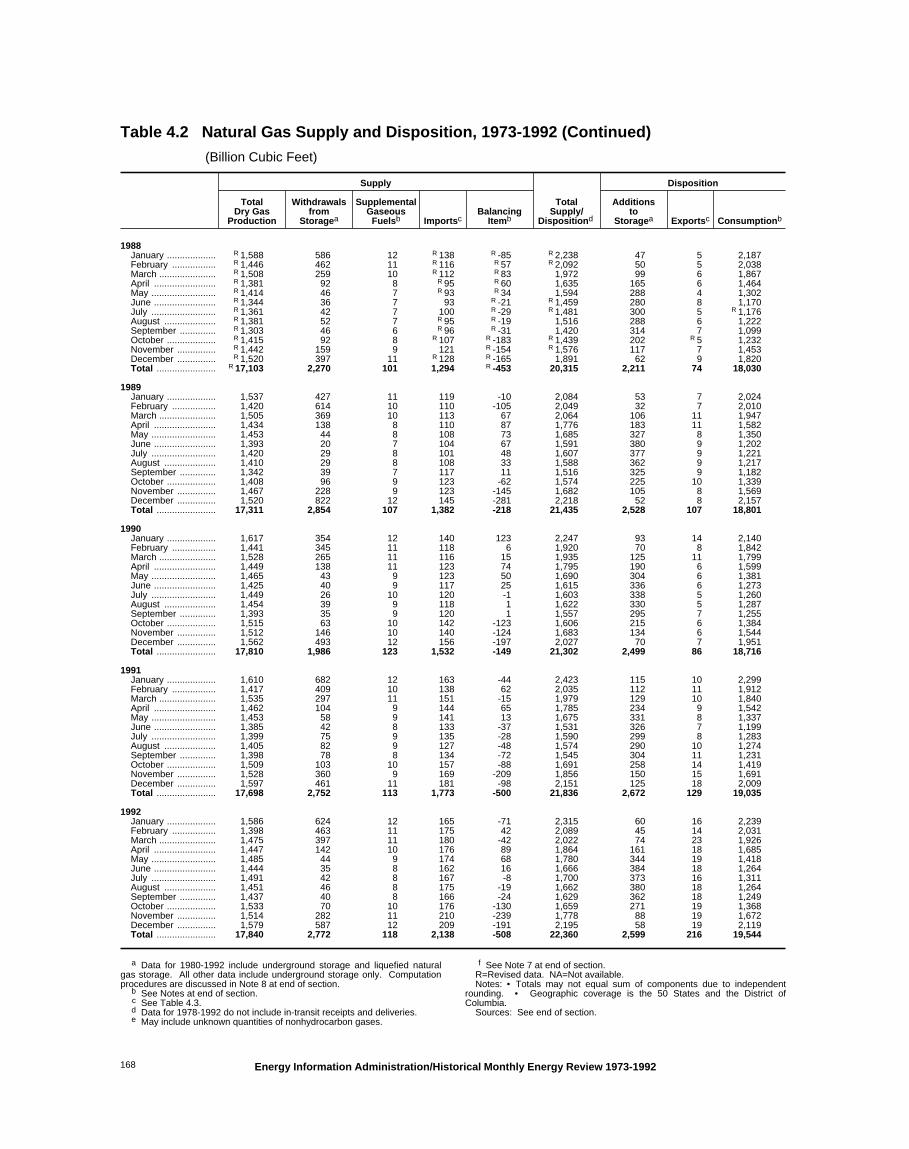
Table 4.2 Natural Gas Supply and Disposition, 1973-1992 (Continued)
(Billion Cubic Feet)
Supply
TotalSupply/
Dispositiond
Disposition
TotalDry Gas
Production
Withdrawalsfrom
Storagea
SupplementalGaseous
Fuelsb ImportscBalancing
Itemb
Additionsto
Storagea Exportsc Consumptionb
1988January ................... R 1,588 586 12 R 138 R -85 R 2,238 47 5 2,187February ................. R 1,446 462 11 R 116 R 57 R 2,092 50 5 2,038March ...................... R 1,508 259 10 R 112 R 83 1,972 99 6 1,867April ........................ R 1,381 92 8 R 95 R 60 1,635 165 6 1,464May ......................... R 1,414 46 7 R 93 R 34 1,594 288 4 1,302June ........................ R 1,344 36 7 93 R -21 R 1,459 280 8 1,170July ......................... R 1,361 42 7 100 R -29 R 1,481 300 5 R 1,176August .................... R 1,381 52 7 R 95 R -19 1,516 288 6 1,222September .............. R 1,303 46 6 R 96 R -31 1,420 314 7 1,099October ................... R 1,415 92 8 R 107 R -183 R 1,439 202 R 5 1,232November ............... R 1,442 159 9 121 R -154 R 1,576 117 7 1,453December ............... R 1,520 397 11 R 128 R -165 1,891 62 9 1,820Total ....................... R 17,103 2,270 101 1,294 R -453 20,315 2,211 74 18,030
1989January ................... 1,537 427 11 119 -10 2,084 53 7 2,024February ................. 1,420 614 10 110 -105 2,049 32 7 2,010March ...................... 1,505 369 10 113 67 2,064 106 11 1,947April ........................ 1,434 138 8 110 87 1,776 183 11 1,582May ......................... 1,453 44 8 108 73 1,685 327 8 1,350June ........................ 1,393 20 7 104 67 1,591 380 9 1,202July ......................... 1,420 29 8 101 48 1,607 377 9 1,221August .................... 1,410 29 8 108 33 1,588 362 9 1,217September .............. 1,342 39 7 117 11 1,516 325 9 1,182October ................... 1,408 96 9 123 -62 1,574 225 10 1,339November ............... 1,467 228 9 123 -145 1,682 105 8 1,569December ............... 1,520 822 12 145 -281 2,218 52 8 2,157Total ....................... 17,311 2,854 107 1,382 -218 21,435 2,528 107 18,801
1990January ................... 1,617 354 12 140 123 2,247 93 14 2,140February ................. 1,441 345 11 118 6 1,920 70 8 1,842March ...................... 1,528 265 11 116 15 1,935 125 11 1,799April ........................ 1,449 138 11 123 74 1,795 190 6 1,599May ......................... 1,465 43 9 123 50 1,690 304 6 1,381June ........................ 1,425 40 9 117 25 1,615 336 6 1,273July ......................... 1,449 26 10 120 -1 1,603 338 5 1,260August .................... 1,454 39 9 118 1 1,622 330 5 1,287September .............. 1,393 35 9 120 1 1,557 295 7 1,255October ................... 1,515 63 10 142 -123 1,606 215 6 1,384November ............... 1,512 146 10 140 -124 1,683 134 6 1,544December ............... 1,562 493 12 156 -197 2,027 70 7 1,951Total ....................... 17,810 1,986 123 1,532 -149 21,302 2,499 86 18,716
1991January ................... 1,610 682 12 163 -44 2,423 115 10 2,299February ................. 1,417 409 10 138 62 2,035 112 11 1,912March ...................... 1,535 297 11 151 -15 1,979 129 10 1,840April ........................ 1,462 104 9 144 65 1,785 234 9 1,542May ......................... 1,453 58 9 141 13 1,675 331 8 1,337June ........................ 1,385 42 8 133 -37 1,531 326 7 1,199July ......................... 1,399 75 9 135 -28 1,590 299 8 1,283August .................... 1,405 82 9 127 -48 1,574 290 10 1,274September .............. 1,398 78 8 134 -72 1,545 304 11 1,231October ................... 1,509 103 10 157 -88 1,691 258 14 1,419November ............... 1,528 360 9 169 -209 1,856 150 15 1,691December ............... 1,597 461 11 181 -98 2,151 125 18 2,009Total ....................... 17,698 2,752 113 1,773 -500 21,836 2,672 129 19,035
1992January ................... 1,586 624 12 165 -71 2,315 60 16 2,239February ................. 1,398 463 11 175 42 2,089 45 14 2,031March ...................... 1,475 397 11 180 -42 2,022 74 23 1,926April ........................ 1,447 142 10 176 89 1,864 161 18 1,685May ......................... 1,485 44 9 174 68 1,780 344 19 1,418June ........................ 1,444 35 8 162 16 1,666 384 18 1,264July ......................... 1,491 42 8 167 -8 1,700 373 16 1,311August .................... 1,451 46 8 175 -19 1,662 380 18 1,264September .............. 1,437 40 8 166 -24 1,629 362 18 1,249October ................... 1,533 70 10 176 -130 1,659 271 19 1,368November ............... 1,514 282 11 210 -239 1,778 88 19 1,672December ............... 1,579 587 12 209 -191 2,195 58 19 2,119Total ....................... 17,840 2,772 118 2,138 -508 22,360 2,599 216 19,544
a Data for 1980-1992 include underground storage and liquefied naturalgas storage. All other data include underground storage only. Computationprocedures are discussed in Note 8 at end of section.
b See Notes at end of section.c See Table 4.3.d Data for 1978-1992 do not include in-transit receipts and deliveries.e May include unknown quantities of nonhydrocarbon gases.
f See Note 7 at end of section.R=Revised data. NA=Not available. Notes: • Totals may not equal sum of components due to independent
rounding. • Geographic coverage is the 50 States and the District ofColumbia.
Sources: See end of section.
Energy Information Administration/Historical Monthly Energy Review 1973-1992168

Table 4.3 Natural Gas Trade by Country, 1973-1992
(Billion Cubic Feet)
Imports Exports
Canadaa Algeriab Otherc Total Canadaa Mexicoa Japanb Total
1973January ..................... 93 (s) (s) 93 (s) 1 4 R 6February ................... 84 (s) (s) 84 (s) 1 4 R 6March ........................ 91 (s) (s) R 92 1 1 1 R 4April .......................... 88 (s) (s) 88 1 1 6 R 8May ........................... 86 0 (s) 86 2 1 6 R 9June .......................... 79 0 (s) 79 2 1 1 R 4July ........................... 79 0 0 R 79 2 1 3 R 6August ...................... 84 0 (s) R 84 2 1 6 R 9September ................ 81 0 (s) R 81 1 1 4 6October ..................... 90 2 (s) R 92 1 1 3 5November ................. 85 1 (s) R 86 1 1 3 R 6December ................. 88 0 (s) R 88 1 1 6 R 8Total ......................... 1,028 3 2 1,033 15 14 48 77
1974January ..................... 86 0 (s) 86 (s) 1 4 6February ................... 79 0 (s) 79 (s) 1 4 6March ........................ 85 0 (s) 85 1 1 4 7April .......................... 83 0 (s) 83 1 1 4 6May ........................... 80 0 (s) 80 1 1 3 R 5June .......................... 74 0 0 74 2 1 5 8July ........................... 73 0 0 R 73 2 1 6 8August ...................... 76 0 0 76 1 1 3 5September ................ 71 0 0 R 71 1 1 4 6October ..................... 83 0 0 83 1 1 3 5November ................. 83 0 0 R 83 1 1 4 7December ................. 86 0 0 R 86 1 1 4 7Total ......................... 959 0 (s) 959 13 13 50 77
1975January ..................... 81 0 0 81 (s) 1 3 4February ................... 74 0 0 R 74 (s) 1 6 7March ........................ 83 0 0 83 1 1 4 6April .......................... 82 0 0 82 1 1 4 6May ........................... 80 0 0 80 1 1 4 7June .......................... 76 0 0 76 1 1 1 4July ........................... 78 2 0 80 1 1 6 8August ...................... 74 1 0 75 1 1 4 6September ................ 73 1 0 74 1 1 4 6October ..................... 80 0 0 80 1 1 4 6November ................. 81 0 0 81 (s) 1 4 5December ................. 85 1 0 86 1 1 6 8Total ......................... 948 5 0 953 10 9 53 73
1976January ..................... 83 1 0 84 (s) 1 4 5February ................... 78 0 0 78 (s) 1 4 5March ........................ 84 1 0 85 1 1 4 6April .......................... 84 2 0 86 1 1 4 6May ........................... 82 0 0 82 1 1 3 5June .......................... 76 0 0 76 1 1 3 5July ........................... 73 1 0 73 1 1 4 6August ...................... 75 1 0 77 1 1 4 6September ................ 73 1 0 74 1 (s) 5 R 7October ..................... 83 2 0 85 1 (s) 3 5November ................. 80 1 0 81 (s) 1 4 5December ................. 83 0 0 83 (s) 1 4 5Total ......................... 954 10 0 964 8 7 50 65
1977January ..................... 87 0 0 87 (s) 1 4 5February ................... 89 2 1 92 (s) (s) 4 R 5March ........................ 98 2 1 101 (s) (s) 4 4April .......................... 83 2 (s) 84 (s) (s) 3 3May ........................... 85 1 0 86 (s) (s) 3 3June .......................... 75 1 0 76 (s) (s) 4 5July ........................... 71 1 0 R 72 (s) (s) 7 7August ...................... 75 1 0 76 (s) (s) 5 5September ................ 75 0 0 75 (s) (s) 4 5October ..................... 84 1 0 85 (s) (s) 4 5November ................. 85 1 0 86 (s) (s) 4 5December ................. 90 0 0 90 (s) 1 4 5Total ......................... 997 11 2 1,011 (s) 4 52 56
See footnotes at end of table.
Energy Information Administration/Historical Monthly Energy Review 1973-1992 169

Table 4.3 Natural Gas Trade by Country, 1973-1992 (Continued)
(Billion Cubic Feet)
Imports Exports
Canadaa Algeriab Otherc Total Canadaa Mexicoa Japanb Total
1978January ..................... 86 0 0 86 (s) 1 4 5February ................... 76 1 0 77 (s) 1 4 5March ........................ 82 4 0 86 (s) (s) 4 5April .......................... 76 2 0 78 (s) (s) 3 3May ........................... 71 2 0 74 (s) (s) 4 5June .......................... 63 5 0 68 (s) (s) 4 R 5July ........................... 64 7 0 72 (s) (s) 4 5August ...................... 66 8 0 74 (s) (s) 4 5September ................ 64 9 0 73 (s) (s) 6 6October ..................... 67 14 0 80 (s) (s) 3 3November ................. 78 13 0 91 (s) (s) 3 3December ................. 88 19 0 107 (s) 1 3 4Total ......................... 881 84 0 966 (s) 4 48 53
1979January ..................... 90 13 0 102 (s) 1 6 R 7February ................... 81 16 0 97 (s) (s) 4 5March ........................ 86 27 0 113 (s) (s) 4 5April .......................... 83 23 0 106 (s) (s) 4 5May ........................... 78 26 0 104 (s) (s) 4 5June .......................... 77 24 0 101 (s) (s) 4 5July ........................... 77 27 0 104 (s) (s) 6 6August ...................... 73 24 0 97 (s) (s) 4 R 5September ................ 70 28 0 98 (s) (s) 4 5October ..................... 90 17 0 107 (s) (s) 3 3November ................. 97 17 0 R 115 (s) (s) 3 3December ................. 98 12 0 110 (s) 1 3 4Total ......................... 1,001 253 0 1,253 (s) 4 51 56
1980January ..................... 94 19 5 118 (s) 1 6 6February ................... 82 19 8 108 (s) (s) 4 5March ........................ 75 25 9 109 (s) (s) 4 5April .......................... 56 12 9 77 (s) (s) 3 3May ........................... 60 1 9 70 (s) (s) 3 3June .......................... 53 0 9 61 (s) (s) 3 3July ........................... 52 0 9 61 (s) (s) 2 3August ...................... 51 0 9 60 (s) (s) 2 3September ................ 51 0 9 60 (s) (s) 5 5October ..................... 63 3 9 R 74 (s) (s) 4 5November ................. 78 3 8 88 (s) (s) 3 R 4December ................. 84 5 9 98 (s) 1 4 5Total ......................... 797 86 102 985 (s) 4 45 49
1981January ..................... 81 0 10 91 (s) 1 5 5February ................... 71 5 9 85 (s) (s) 4 5March ........................ 69 2 9 80 (s) (s) 5 5April .......................... 55 5 9 69 (s) (s) 4 5May ........................... 52 3 8 62 (s) (s) 3 4June .......................... 55 2 8 65 (s) (s) 5 5July ........................... 53 5 8 66 (s) (s) 5 5August ...................... 54 3 8 64 (s) (s) 5 5September ................ 55 3 9 67 (s) (s) 6 6October ..................... 68 3 9 79 (s) (s) 5 5November ................. 68 5 8 82 (s) (s) 5 5December ................. 80 3 10 93 (s) (s) 4 5Total ......................... 762 37 105 904 (s) 3 56 59
1982January ..................... 87 3 9 98 (s) (s) 3 3February ................... 75 2 8 85 (s) (s) 4 5March ........................ 70 5 7 82 (s) (s) 4 5April .......................... 62 3 7 72 (s) (s) 1 2May ........................... 55 3 7 65 (s) (s) 3 3June .......................... 51 2 8 61 (s) (s) 6 6July ........................... 53 5 9 67 (s) (s) 4 5August ...................... 53 0 8 61 (s) (s) 6 6September ................ 53 5 8 66 (s) (s) 4 5October ..................... 66 2 8 77 (s) (s) 4 5November ................. 73 10 8 91 (s) (s) 4 5December ................. 85 15 9 110 (s) (s) 4 5Total ......................... 783 55 95 933 (s) 2 50 52
See footnotes at end of table.
Energy Information Administration/Historical Monthly Energy Review 1973-1992170

Table 4.3 Natural Gas Trade by Country, 1973-1992 (Continued)
(Billion Cubic Feet)
Imports Exports
Canadaa Algeriab Otherc Total Canadaa Mexicoa Japanb Total
1983January ..................... 86 17 9 112 (s) (s) 4 5February ................... 71 15 8 95 (s) (s) 4 5March ........................ 63 15 8 86 (s) (s) 4 5April .......................... 56 12 5 74 (s) (s) 4 5May ........................... 48 8 6 61 (s) (s) 4 5June .......................... 41 13 5 59 (s) (s) 3 3July ........................... 42 10 6 58 (s) (s) 4 5August ...................... 45 5 6 56 (s) (s) 6 6September ................ 52 10 5 67 (s) (s) 4 4October ..................... 53 6 6 64 (s) (s) 4 4November ................. 65 10 5 80 (s) (s) 4 5December ................. 91 10 6 107 (s) (s) 4 5Total ......................... 712 131 75 918 (s) 2 53 55
1984January ..................... 89 3 5 97 (s) (s) 4 5February ................... 62 3 4 69 (s) (s) 4 5March ........................ 61 3 5 69 (s) (s) 6 6April .......................... 60 6 5 71 (s) (s) 4 5May ........................... 57 3 6 66 (s) (s) 4 5June .......................... 50 3 5 59 (s) (s) 3 3July ........................... 47 3 6 55 (s) (s) 4 5August ...................... 49 0 6 54 (s) (s) 4 5September ................ 51 0 5 57 (s) (s) 4 5October ..................... 58 3 6 R 66 (s) (s) 4 5November ................. 79 5 0 R 85 (s) (s) 4 5December ................. 92 3 0 94 (s) (s) 4 5Total ......................... 755 36 52 843 (s) 2 53 55
1985January ..................... 101 3 0 104 (s) (s) 4 5February ................... 94 5 0 99 (s) (s) 4 5March ........................ 87 3 0 90 (s) (s) 6 6April .......................... 73 3 0 76 (s) (s) 4 5May ........................... 71 2 0 73 (s) (s) 1 2June .......................... 63 3 0 65 (s) (s) 4 5July ........................... 57 3 0 59 (s) (s) 6 6August ...................... 61 0 0 61 (s) (s) 4 5September ................ 61 3 0 63 (s) (s) 4 5October ..................... 76 0 0 76 (s) (s) 4 5November ................. 77 0 0 77 (s) (s) 4 5December ................. 106 0 0 106 (s) (s) 4 5Total ......................... 926 24 0 950 (s) 2 53 55
1986January ..................... 99 0 0 99 (s) (s) 4 5February ................... 74 0 0 74 (s) (s) 3 3March ........................ 55 0 0 55 1 (s) 4 5April .......................... 43 0 0 43 1 (s) 4 6May ........................... 52 0 0 52 1 (s) 1 3June .......................... 44 0 0 44 1 (s) 4 6July ........................... 48 0 0 48 1 (s) 4 6August ...................... 51 0 0 51 (s) (s) 6 6September ................ 54 0 0 54 (s) (s) 4 5October ..................... 69 0 0 69 1 (s) 4 5November ................. 70 0 0 70 1 (s) 4 6December ................. 89 0 2 90 1 (s) 4 6Total ......................... 749 0 2 750 9 2 50 61
1987January ..................... 101 0 0 101 (s) (s) 4 5February ................... 84 0 0 84 (s) (s) 3 3March ........................ 86 0 0 86 (s) (s) 4 5April .......................... 68 0 0 68 (s) (s) 3 3May ........................... 61 0 0 61 (s) (s) 3 3June .......................... 58 0 0 58 (s) (s) 4 5July ........................... 66 0 0 66 (s) (s) 4 5August ...................... 75 0 0 75 (s) (s) 4 5September ................ 73 0 0 73 (s) (s) 4 5October ..................... 93 0 0 93 1 (s) 4 5November ................. 107 0 0 107 2 (s) 4 6December ................. 121 0 0 121 (s) (s) 4 5Total ......................... 993 0 0 993 3 2 49 54
See footnotes at end of table.
Energy Information Administration/Historical Monthly Energy Review 1973-1992 171

Table 4.3 Natural Gas Trade by Country, 1973-1992 (Continued)
(Billion Cubic Feet)
Imports Exports
Canadaa Algeriab Otherc Total Canadaa Mexicoa Japanb Total
1988January ..................... 133 5 0 R 138 (s) (s) 4 5February ................... 116 0 0 R 116 (s) (s) 4 5March ........................ 109 3 0 R 112 2 (s) 4 6April .......................... 95 0 0 R 95 2 (s) 4 6May ........................... 93 0 0 R 93 2 (s) 1 4June .......................... 93 0 0 93 4 (s) 4 8July ........................... 100 0 0 100 (s) (s) 4 5August ...................... 95 0 0 R 95 1 (s) 4 6September ................ 96 0 0 R 96 3 (s) 4 7October ..................... 102 5 0 R 107 1 (s) 4 R 5November ................. 118 3 0 121 2 (s) 4 7December ................. 125 3 0 R 128 3 (s) 6 9Total ......................... 1,276 17 0 1,294 20 2 52 74
1989January ..................... 114 5 0 119 2 2 3 7February ................... 108 3 0 110 1 3 3 7March ........................ 111 3 0 113 2 3 6 11April .......................... 108 3 0 110 5 2 4 11May ........................... 103 5 0 108 2 3 3 8June .......................... 101 3 0 104 4 1 4 9July ........................... 99 2 0 101 4 1 4 9August ...................... 105 2 0 108 5 (s) 4 9September ................ 112 5 0 117 5 (s) 4 9October ..................... 120 3 0 123 4 1 6 10November ................. 118 5 0 123 3 1 4 8December ................. 140 5 0 145 2 2 4 8Total ......................... 1,339 42 0 1,382 38 17 51 107
1990January ..................... 130 10 0 140 8 1 4 14February ................... 107 10 0 118 1 2 4 8March ........................ 108 8 0 116 3 4 4 11April .......................... 113 10 0 123 1 1 4 6May ........................... 118 5 0 123 (s) 2 3 6June .......................... 114 3 0 117 (s) 2 4 6July ........................... 115 5 0 120 (s) (s) 4 5August ...................... 113 5 0 118 (s) (s) 4 5September ................ 114 5 0 120 (s) 2 4 7October ..................... 137 5 0 142 (s) (s) 6 6November ................. 129 10 0 140 1 (s) 4 6December ................. 148 8 0 156 1 1 4 7Total ......................... 1,448 84 0 1,532 17 16 53 86
1991January ..................... 156 8 0 163 2 3 4 10February ................... 133 5 0 138 3 3 4 11March ........................ 146 5 0 151 1 4 4 10April .......................... 139 5 0 144 (s) 3 6 9May ........................... 136 5 0 141 (s) 5 3 8June .......................... 131 3 0 133 (s) 4 3 7July ........................... 130 5 0 135 (s) 3 4 8August ...................... 127 0 0 127 1 3 6 10September ................ 131 3 0 134 (s) 6 4 11October ..................... 146 10 0 157 2 8 4 14November ................. 164 5 0 169 2 8 4 15December ................. 170 10 0 181 3 10 6 18Total ......................... 1,710 64 0 1,773 15 60 54 129
1992January ..................... 157 8 0 165 2 10 4 16February ................... 170 5 0 175 4 6 4 14March ........................ 178 3 0 180 11 7 4 23April .......................... 174 3 0 176 6 7 4 18May ........................... 174 0 0 174 6 7 6 19June .......................... 160 3 0 162 6 7 4 18July ........................... 167 0 0 167 5 6 4 16August ...................... 172 2 0 175 5 9 4 18September ................ 164 3 0 166 6 8 4 18October ..................... 174 3 0 176 6 10 3 19November ................. 203 8 0 210 3 11 4 19December ................. 202 8 0 209 7 8 4 19Total ......................... 2,094 43 0 2,138 68 96 53 216
a By pipeline, except for very small amounts of liquefied natural gasimported from Canada in 1973, 1977 and 1981. See Note 5 at end of section.
b As liquefied natural gas.c For 1973-1984, imports are from Mexico; for 1986, imports are from
Indonesia.
R=Revised data. (s)=Less than 500 million cubic feet. Notes: • See Note 5 at end of section. • Totals may not equal sum of
components due to independent rounding. • U.S. geographic coverage is the50 States and the District of Columbia.
Source: See end of section.
Energy Information Administration/Historical Monthly Energy Review 1973-1992172

Table 4.4 Natural Gas Consumption by End-Use Sector, 1973-1992
(Billion Cubic Feet)
Lease andPlant Fuel
PipelineFuela
Delivered to Consumers
TotalConsumptionResidential Commercialb Industrial
ElectricUtilities Total
1973January ..................... NA 78 844 R 392 NA 224 NA 2,348February ................... NA 70 747 R 394 NA 216 NA 2,126March ........................ NA 67 649 R 311 NA 258 NA 2,015April .......................... NA 61 466 R 232 NA 269 NA 1,835May ........................... NA 57 326 R 174 NA 319 NA 1,729June .......................... NA 51 207 R 135 NA 373 NA 1,534July ........................... NA 51 150 R 108 NA 425 NA 1,558August ...................... NA 52 142 R 106 NA 421 NA 1,582September ................ NA 50 159 R 104 NA 355 NA 1,527October ..................... NA 56 205 R 127 NA 329 NA 1,708November ................. NA 63 392 R 217 NA 253 NA 1,905December ................. NA 72 591 R 298 NA 218 NA 2,182Total ......................... 1,496 728 4,879 2,597 8,689 3,660 19,825 22,049
1974January ..................... NA 70 817 R 406 NA 221 NA 2,230February ................... NA 65 688 R 336 NA 203 NA 2,054March ........................ NA 63 598 R 302 NA 256 NA 2,003April .......................... NA 53 482 R 243 NA 260 NA 1,691May ........................... NA 51 316 R 165 NA 308 NA 1,608June .......................... NA 45 215 R 128 NA 348 NA 1,439July ........................... NA 48 166 R 110 NA 405 NA 1,514August ...................... NA 48 142 R 108 NA 383 NA 1,510September ................ NA 48 155 R 107 NA 314 NA 1,537October ..................... NA 54 235 R 143 NA 299 NA 1,706November ................. NA 58 359 R 200 NA 240 NA 1,827December ................. NA 66 613 R 309 NA 207 NA 2,104Total ......................... 1,477 669 4,786 2,556 8,292 3,443 19,077 21,223
1975January ..................... NA 67 751 R 347 NA 205 NA 2,248February ................... NA 58 732 R 346 NA 189 NA 1,939March ........................ NA 57 678 R 312 NA 211 NA 1,903April .......................... NA 47 597 R 289 NA 214 NA 1,575May ........................... NA 40 337 R 165 NA 275 NA 1,331June .......................... NA 38 204 R 120 NA 308 NA 1,257July ........................... NA 39 167 R 107 NA 362 NA 1,313August ...................... NA 41 144 R 104 NA 360 NA 1,369September ................ NA 41 154 R 107 NA 316 NA 1,370October ..................... NA 46 223 R 133 NA 275 NA 1,544November ................. NA 49 329 R 180 NA 228 NA 1,640December ................. NA 61 608 R 299 NA 214 NA 2,049Total ......................... 1,396 583 4,924 2,508 6,968 3,158 17,558 19,538
1976January ..................... NA 63 843 R 405 NA 207 NA 2,291February ................... NA 53 740 R 364 NA 199 NA 1,938March ........................ NA 47 578 R 286 NA 223 NA 1,721April .......................... NA 41 443 R 221 NA 228 NA 1,508May ........................... NA 39 316 R 169 NA 267 NA 1,434June .......................... NA 37 221 R 129 NA 313 NA 1,335July ........................... NA 38 170 R 112 NA 338 NA 1,372August ...................... NA 36 141 R 113 NA 330 NA 1,317September ................ NA 36 152 R 113 NA 295 NA 1,302October ..................... NA 45 242 R 146 NA 250 NA 1,621November ................. NA 52 471 R 253 NA 217 NA 1,875December ................. NA 61 734 R 355 NA 215 NA 2,232Total ......................... 1,634 548 5,051 2,668 6,964 3,081 17,764 19,946
1977January ..................... NA 66 937 R 413 NA 205 NA 2,407February ................... NA 50 823 R 366 NA 200 NA 1,816March ........................ NA 47 561 R 264 NA 232 NA 1,715April .......................... NA 39 401 R 202 NA 223 NA 1,439May ........................... NA 38 252 R 142 NA 260 NA 1,379June .......................... NA 36 182 R 121 NA 311 NA 1,333July ........................... NA 36 146 R 113 NA 347 NA 1,325August ...................... NA 37 131 R 109 NA 351 NA 1,364September ................ NA 39 141 R 109 NA 325 NA 1,427October ..................... NA 41 224 R 139 NA 285 NA 1,518November ................. NA 46 372 201 NA 234 NA 1,690December ................. NA 58 652 R 319 NA 220 NA 2,108Total ......................... 1,659 533 4,821 2,501 6,815 3,191 17,329 19,521
See footnotes at end of table.
Energy Information Administration/Historical Monthly Energy Review 1973-1992 173

Table 4.4 Natural Gas Consumption by End-Use Sector, 1973-1992 (Continued)
(Billion Cubic Feet)
Lease andPlant Fuel
PipelineFuela
Delivered to Consumers
TotalConsumptionResidential Commercialb Industrial
ElectricUtilities Total
1978January ..................... NA 64 816 R 391 NA 229 NA 2,382February ................... NA 58 838 R 401 NA 211 NA 2,139March ........................ NA 52 681 R 345 NA 232 NA 1,918April .......................... NA 42 446 R 225 NA 223 NA 1,539May ........................... NA 37 308 R 166 NA 261 NA 1,380June .......................... NA 34 184 R 120 NA 321 NA 1,249July ........................... NA 36 147 R 106 NA 362 NA 1,333August ...................... NA 35 130 R 101 NA 340 NA 1,285September ................ NA 33 135 R 103 NA 297 NA 1,235October ..................... NA 39 210 R 134 NA 263 NA 1,440November ................. NA 45 376 R 196 NA 228 NA 1,658December ................. NA 56 632 R 313 NA 220 NA 2,069Total ......................... 1,648 530 4,903 2,601 6,757 3,188 17,449 19,627
1979January ..................... NA 72 867 R 432 NA 228 NA 2,426February ................... NA 65 892 R 445 NA 227 NA 2,204March ........................ NA 56 660 349 NA 260 NA 1,881April .......................... NA 47 463 R 256 NA 261 NA 1,594May ........................... NA 42 288 R 171 NA 277 NA 1,429June .......................... NA 39 189 R 127 NA 320 NA 1,309July ........................... NA 39 148 R 107 NA 369 NA 1,330August ...................... NA 40 133 R 103 NA 375 NA 1,342September ................ NA 39 138 R 106 NA 338 NA 1,329October ..................... NA 46 215 R 142 NA 323 NA 1,557November ................. NA 52 379 R 223 NA 261 NA 1,768December ................. NA 62 594 R 326 NA 249 NA 2,072Total ......................... 1,499 601 4,965 2,786 6,899 3,491 18,141 20,241
1980January ..................... 93 71 722 356 719 277 2,074 2,238February ................... 87 68 774 380 574 264 1,992 2,147March ........................ 93 66 673 344 594 284 1,895 2,054April .......................... 85 49 451 239 454 257 1,401 1,535May ........................... 86 43 279 155 512 282 1,228 1,357June .......................... 81 40 191 123 483 337 1,134 1,255July ........................... 82 41 145 103 504 420 1,172 1,295August ...................... 80 41 129 101 526 405 1,161 1,282September ................ 80 41 135 106 580 357 1,178 1,299October ..................... 84 49 214 140 734 301 1,389 1,522November ................. 84 56 392 224 749 256 1,621 1,761December ................. 91 68 646 340 742 242 1,970 2,129Total ......................... 1,026 635 4,752 2,611 7,172 3,682 18,216 19,877
1981January ..................... 81 75 831 406 654 232 2,123 2,279February ................... 73 63 740 355 440 224 1,759 1,895March ........................ 81 63 585 304 593 273 1,755 1,899April .......................... 78 49 372 204 496 289 1,361 1,488May ........................... 79 47 260 151 573 316 1,300 1,426June .......................... 76 43 168 116 525 381 1,190 1,309July ........................... 77 43 136 99 548 411 1,194 1,314August ...................... 79 43 123 107 571 390 1,191 1,313September ................ 73 42 133 107 585 325 1,150 1,265October ..................... 76 50 232 148 711 302 1,393 1,519November ................. 74 54 364 205 663 259 1,491 1,619December ................. 80 69 601 318 769 239 1,927 2,076Total ......................... 928 642 4,546 2,520 7,128 3,640 17,834 19,404
1982January ..................... 104 79 866 R 443 R 670 238 2,217 2,400February ................... 95 66 786 R 404 R 413 220 1,823 1,984March ........................ 100 61 602 R 321 R 507 247 1,677 1,838April .......................... 95 49 451 R 236 R 408 246 1,341 1,485May ........................... 93 38 233 139 375 258 1,005 1,136June .......................... 90 37 165 107 420 296 988 1,115July ........................... 91 38 138 101 424 353 1,016 1,145August ...................... 89 38 123 105 435 361 1,024 1,151September ................ 86 38 136 105 482 293 1,016 1,140October ..................... 87 43 204 130 573 273 1,181 1,311November ................. 88 52 372 R 217 R 604 226 1,419 1,559December ................. 90 58 557 R 298 R 521 215 1,591 1,739Total ......................... 1,109 596 4,633 2,606 5,831 3,226 16,295 18,001
See footnotes at end of table.
Energy Information Administration/Historical Monthly Energy Review 1973-1992174

Table 4.4 Natural Gas Consumption by End-Use Sector, 1973-1992 (Continued)
(Billion Cubic Feet)
Lease andPlant Fuel
PipelineFuela
Delivered to Consumers
TotalConsumptionResidential Commercialb Industrial
ElectricUtilities Total
1983January ..................... R 93 R 51 R 850 R 418 R 593 208 R 2,057 R 2,195February ................... R 80 R 41 R 672 R 340 R 534 177 R 1,717 R 1,833March ........................ R 83 R 43 R 581 R 298 R 535 208 R 1,604 R 1,726April .......................... R 81 R 38 R 444 R 234 R 497 203 R 1,382 R 1,499May ........................... R 81 R 39 R 276 R 154 R 462 218 R 1,141 R 1,262June .......................... R 78 R 39 R 164 R 105 R 432 248 R 983 R 1,102July ........................... R 81 R 41 R 124 R 95 R 407 314 R 956 R 1,081August ...................... R 80 R 40 R 114 R 95 R 418 352 R 960 R 1,082September ................ R 76 R 37 R 123 R 99 R 405 299 R 902 R 1,018October ..................... R 80 R 39 R 176 R 124 R 431 251 R 985 R 1,107November ................. R 80 R 39 R 311 R 186 R 460 214 R 1,186 R 1,306December ................. R 86 R 44 R 545 R 283 R 469 218 R 1,495 R 1,624Total ......................... 978 490 4,381 2,433 5,643 2,911 15,367 16,835
1984January ..................... 102 55 886 437 645 215 2,183 2,340February ................... 88 44 700 354 581 187 1,823 R 1,955March ........................ 91 46 605 311 581 206 1,703 1,840April .......................... 89 41 463 243 542 220 1,469 R 1,599May ........................... 89 42 287 160 504 265 1,215 R 1,346June .......................... 86 42 170 108 472 298 1,047 R 1,175July ........................... 89 44 128 97 445 349 1,019 1,152August ...................... 88 43 118 98 457 350 1,023 1,154September ................ 84 40 127 101 442 291 961 1,085October ..................... 88 42 182 128 470 270 1,050 1,180November ................. 88 42 323 193 502 245 1,262 R 1,392December ................. 95 48 566 294 512 217 1,589 1,732Total ......................... 1,077 529 4,555 2,524 6,154 3,111 16,345 17,951
1985January ..................... 91 54 743 372 R 615 226 R 1,957 R 2,102February ................... 84 46 837 412 R 566 203 R 2,017 R 2,147March ........................ 83 42 566 290 R 531 207 R 1,595 R 1,720April .......................... 79 39 397 206 R 492 234 R 1,328 R 1,446May ........................... 78 40 212 128 R 454 236 R 1,029 R 1,147June .......................... 75 38 157 100 R 425 282 R 964 R 1,076July ........................... 77 40 130 96 R 440 337 R 1,002 R 1,119August ...................... 77 39 119 93 R 435 355 R 1,002 R 1,118September ................ 75 37 129 98 R 427 275 R 929 R 1,041October ..................... 78 39 190 125 R 466 250 R 1,030 R 1,147November ................. 79 39 306 180 R 479 230 R 1,195 R 1,313December ................. 91 51 647 333 R 571 210 R 1,762 R 1,904Total ......................... 966 504 4,433 2,432 5,901 3,044 15,811 17,281
1986January ..................... 89 50 791 392 R 647 184 R 2,013 R 2,153February ................... 77 43 685 345 R 578 157 R 1,765 R 1,885March ........................ 82 42 580 291 R 566 170 R 1,607 R 1,731April .......................... 73 36 363 189 R 488 198 R 1,239 R 1,348May ........................... 75 38 236 131 R 454 231 R 1,052 R 1,165June .......................... 71 37 155 99 R 414 260 R 928 R 1,036July ........................... 74 38 126 89 R 402 301 R 919 R 1,031August ...................... 74 38 117 89 R 400 276 R 883 R 995September ................ 70 36 131 91 R 366 247 R 834 R 940October ..................... 74 38 185 116 R 386 217 R 904 R 1,016November ................. 79 38 346 189 R 406 187 R 1,127 R 1,244December ................. 85 47 599 299 R 471 175 R 1,544 R 1,676Total ......................... 923 485 4,314 2,318 5,579 2,602 14,814 16,221
1987January ..................... R 108 53 741 384 R 653 185 R 1,964 R 2,125February ................... R 96 45 689 363 R 567 158 R 1,777 R 1,918March ........................ R 102 44 575 305 R 531 191 R 1,602 R 1,748April .......................... R 95 42 402 214 R 476 206 R 1,299 R 1,436May ........................... R 94 42 223 133 R 448 243 R 1,046 R 1,183June .......................... R 90 40 147 97 R 440 284 R 968 R 1,098July ........................... R 92 38 126 94 R 423 319 R 962 R 1,092August ...................... R 94 40 117 90 R 444 339 R 990 R 1,125September ................ R 90 38 126 101 R 420 268 R 915 R 1,043October ..................... R 95 41 223 141 R 481 238 R 1,084 R 1,220November ................. R 101 43 354 202 R 499 217 R 1,272 R 1,416December ................. R 90 51 592 305 R 571 197 R 1,665 R 1,806Total ......................... 1,149 519 4,315 2,430 5,953 2,844 15,542 17,211
See footnotes at end of table.
Energy Information Administration/Historical Monthly Energy Review 1973-1992 175

Table 4.4 Natural Gas Consumption by End-Use Sector, 1973-1992 (Continued)
(Billion Cubic Feet)
Lease andPlant Fuel
PipelineFuela
Delivered to Consumers
TotalConsumptionResidential Commercialb Industrial
ElectricUtilities Total
1988January ..................... 102 63 852 424 578 168 2,022 2,187February ................... 93 55 755 392 574 170 1,890 2,038March ........................ 97 53 597 320 596 204 1,717 1,867April .......................... 88 46 400 223 507 199 1,330 1,464May ........................... 91 49 258 158 507 240 1,162 1,302June .......................... 86 47 152 118 487 280 1,037 1,170July ........................... 87 49 123 109 480 328 1,041 R 1,176August ...................... 88 49 114 113 514 344 1,085 1,222September ................ 83 47 125 113 499 233 969 1,099October ..................... 91 49 232 156 522 182 1,092 1,232November ................. 92 51 391 225 543 150 1,310 1,453December ................. 98 56 631 320 577 137 1,666 1,820Total ......................... 1,096 614 4,630 2,670 6,383 2,636 16,320 18,030
1989January ..................... 95 57 751 376 598 147 1,872 2,024February ................... 88 57 743 380 570 172 1,865 2,010March ........................ 93 54 646 342 602 211 1,800 1,947April .......................... 88 49 414 233 563 235 1,445 1,582May ........................... 89 51 257 159 544 251 1,210 1,350June .......................... 86 50 155 121 530 260 1,066 1,202July ........................... 88 50 129 110 525 320 1,084 1,221August ...................... 87 50 121 110 539 310 1,080 1,217September ................ 82 48 139 113 532 268 1,052 1,182October ..................... 87 49 229 152 568 254 1,203 1,339November ................. 90 50 405 231 603 189 1,429 1,569December ................. 97 65 791 391 643 171 1,996 2,157Total ......................... 1,070 629 4,781 2,718 6,816 2,787 17,102 18,801
1990January ..................... 112 77 789 400 618 146 1,952 2,140February ................... 99 66 643 336 567 132 1,677 1,842March ........................ 106 64 552 302 591 184 1,629 1,799April .......................... 101 57 400 236 607 199 1,442 1,599May ........................... 102 48 248 158 581 244 1,230 1,381June .......................... 99 44 161 124 548 297 1,130 1,273July ........................... 101 44 127 123 540 326 1,116 1,260August ...................... 101 45 121 115 561 343 1,141 1,287September ................ 97 44 132 121 560 301 1,114 1,255October ..................... 106 48 214 151 609 257 1,231 1,384November ................. 105 54 376 224 600 185 1,384 1,544December ................. 109 70 630 332 635 175 1,773 1,951Total ......................... 1,236 660 4,391 2,623 7,018 2,787 16,820 18,716
1991January ..................... 102 74 844 434 672 173 2,123 2,299February ................... 90 61 664 359 591 146 1,761 1,912March ........................ 98 58 573 310 607 193 1,683 1,840April .......................... 93 49 373 225 586 216 1,400 1,542May ........................... 93 42 229 154 571 249 1,202 1,337June .......................... 89 37 148 119 546 260 1,073 1,199July ........................... 90 40 126 125 572 330 1,153 1,283August ...................... 90 40 118 113 586 328 1,144 1,274September ................ 89 38 138 121 582 263 1,103 1,231October ..................... 97 44 225 163 626 263 1,278 1,419November ................. 97 54 459 256 627 198 1,540 1,691December ................. 101 64 658 350 665 170 1,843 2,009Total ......................... 1,129 601 4,556 2,729 7,231 2,789 17,305 19,035
1992January ..................... 104 68 786 410 701 169 2,067 2,239February ................... 92 62 696 366 644 170 1,876 2,031March ........................ 97 58 574 315 674 208 1,770 1,926April .......................... 95 51 431 250 628 229 1,539 1,685May ........................... 97 42 251 170 620 236 1,278 1,418June .......................... 95 37 162 125 578 266 1,132 1,264July ........................... 98 39 132 122 587 334 1,175 1,311August ...................... 95 37 126 121 582 303 1,131 1,264September ................ 94 37 137 121 586 274 1,117 1,249October ..................... 101 41 241 166 608 213 1,227 1,368November ................. 99 50 437 256 641 189 1,523 1,672December ................. 104 64 717 381 677 176 1,951 2,119Total ......................... 1,171 588 4,690 2,803 7,527 2,766 17,786 19,544
a Natural gas consumed in the operation of pipelines, primarily incompressors.
b See Note 6 at end of section.R=Revised data. NA=Not available.
Notes: • Natural gas includes supplemental gaseous fuels. • Totals maynot equal sum of components due to independent rounding. • Geographiccoverage is the 50 States and the District of Columbia.
Sources: See end of section.
Energy Information Administration/Historical Monthly Energy Review 1973-1992176

Table 4.5 Natural Gas in Underground Storage, 1973-1992
(Volumes in Billion Cubic Feet)
Natural Gas inUnderground Storage,
End of Period
Change in Working Gasfrom Same Period
Previous Year Storage Activity
Base Gas Working Gas Totala Volume Percent Injectionsb Withdrawalsb Netc
1973January ..................... NA NA NA NA NA NA NA NAFebruary ................... NA NA NA NA NA NA NA NAMarch ........................ NA NA NA NA NA NA NA NAApril .......................... NA NA NA NA NA NA NA NAMay ........................... NA NA NA NA NA NA NA NAJune .......................... NA NA NA NA NA NA NA NAJuly ........................... NA NA NA NA NA NA NA NAAugust ...................... NA NA NA NA NA NA NA NASeptember ................ NA NA NA NA NA NA NA NAOctober ..................... NA NA NA NA NA NA NA NANovember ................. NA NA NA NA NA NA NA NADecember ................. 2,864 2,034 4,898 305 17.6 NA NA NATotal ......................... 2,864 2,034 4,898 305 17.6 1,974 1,533 442
1974January ..................... NA NA NA NA NA NA NA NAFebruary ................... NA NA NA NA NA NA NA NAMarch ........................ NA NA NA NA NA NA NA NAApril .......................... NA NA NA NA NA NA NA NAMay ........................... NA NA NA NA NA NA NA NAJune .......................... NA NA NA NA NA NA NA NAJuly ........................... NA NA NA NA NA NA NA NAAugust ...................... NA NA NA NA NA NA NA NASeptember ................ NA NA NA NA NA NA NA NAOctober ..................... 3,042 2,403 5,445 NA NA NA NA NANovember ................. NA NA NA NA NA NA NA NADecember ................. 2,912 2,050 4,962 16 .8 NA NA NATotal ......................... 2,912 2,050 4,962 16 .8 1,784 1,701 84
1975January ..................... NA NA NA NA NA NA NA NAFebruary ................... NA NA NA NA NA NA NA NAMarch ........................ NA NA NA NA NA NA NA NAApril .......................... NA NA NA NA NA NA NA NAMay ........................... NA NA NA NA NA NA NA NAJune .......................... NA NA NA NA NA NA NA NAJuly ........................... NA NA NA NA NA NA NA NAAugust ...................... NA NA NA NA NA NA NA NASeptember ................ 3,085 2,468 5,553 NA NA 220 31 189October ..................... 3,107 2,599 5,706 196 8.2 190 51 139November ................. 3,150 2,541 5,691 NA NA 98 146 -48December ................. 3,162 2,212 5,374 162 7.9 38 371 -333Total ......................... 3,162 2,212 5,374 162 7.9 2,104 1,760 344
1976January ..................... 3,169 1,648 4,817 NA NA R 15 R 487 R -472February ................... 3,173 1,444 4,617 NA NA R 59 R 245 R -186March ........................ 3,170 1,326 4,496 NA NA R 71 R 185 R -114April .......................... 3,184 1,423 4,607 NA NA R 166 R 69 R 97May ........................... 3,190 1,637 4,827 NA NA R 220 R 22 R 198June .......................... 3,208 1,908 5,116 NA NA R 273 R 25 R 248July ........................... 3,220 2,192 5,412 NA NA R 271 6 R 265August ...................... 3,251 2,447 5,698 NA NA R 268 R 16 R 252September ................ 3,296 2,650 5,946 182 7.4 R 233 R 20 R 213October ..................... 3,302 2,664 5,966 65 2.5 R 121 R 107 R 14November ................. 3,305 2,408 5,713 -133 -5.2 R 36 R 270 R -234December ................. 3,323 1,926 5,250 -286 -12.9 R 21 R 468 R -447Total ......................... 3,323 1,926 5,250 -286 -12.9 1,756 1,921 -165
1977January ..................... 3,293 1,287 4,580 -361 -21.9 R 17 R 664 R -647February ................... 3,283 1,163 4,446 -281 -19.5 R 97 R 233 R -136March ........................ 3,286 1,215 4,501 -111 -8.4 R 181 R 131 R 50April .......................... 3,286 1,427 4,713 4 .3 R 247 43 R 204May ........................... 3,293 1,731 5,024 94 5.7 R 318 17 R 301June .......................... 3,300 2,030 5,330 122 6.4 R 306 12 R 294July ........................... 3,317 2,348 5,665 156 7.1 R 336 15 R 321August ...................... 3,346 2,599 5,945 152 6.2 R 280 21 R 259September ................ 3,364 2,824 6,188 174 6.6 R 253 2 R 251October ..................... 3,373 2,929 6,302 265 9.9 R 152 44 R 108November ................. 3,403 2,821 6,224 413 17.2 R 81 R 158 R -77December ................. 3,391 2,475 5,866 549 28.5 R 40 R 412 R -372Total ......................... 3,391 2,475 5,866 549 28.5 2,307 1,750 557
See footnotes at end of table.
Energy Information Administration/Historical Monthly Energy Review 1973-1992 177

Table 4.5 Natural Gas in Underground Storage, 1973-1992 (Continued)
(Volumes in Billion Cubic Feet)
Natural Gas inUnderground Storage,
End of Period
Change in Working Gasfrom Same Period
Previous Year Storage Activity
Base Gas Working Gas Totala Volume Percent Injectionsb Withdrawalsb Netc
1978January ..................... 3,374 1,819 5,193 532 41.3 21 R 662 R -641February ................... 3,373 1,310 4,683 147 12.6 21 R 526 R -505March ........................ 3,374 1,123 4,497 -92 -7.6 R 90 R 276 -186April .......................... 3,377 1,231 4,608 -196 -13.7 R 175 R 67 R 108May ........................... 3,379 1,491 4,870 -240 -13.9 R 285 30 R 255June .......................... 3,381 1,836 5,217 -194 -9.6 R 357 18 R 339July ........................... 3,386 2,164 5,550 -184 -7.8 R 341 16 R 325August ...................... 3,403 2,501 5,904 -98 -3.8 R 351 12 R 339September ................ 3,411 2,813 6,224 -11 -.4 R 322 9 R 313October ..................... 3,444 2,958 6,402 29 1.0 R 204 28 R 176November ................. 3,425 2,927 6,352 106 3.8 R 80 R 134 R -54December ................. 3,473 2,547 6,020 72 2.9 R 32 R 381 R -349Total ......................... 3,473 2,547 6,020 72 2.9 2,278 2,158 120
1979January ..................... 3,458 1,890 5,348 71 3.9 R 20 R 675 R -655February ................... 3,457 1,349 4,806 39 3.0 R 22 R 568 R -546March ........................ 3,459 1,236 4,695 113 10.1 R 90 R 206 R -116April .......................... 3,427 1,335 4,762 104 8.4 R 175 73 R 102May ........................... 3,438 1,619 5,057 128 8.6 R 297 13 R 284June .......................... 3,449 1,950 5,399 114 6.2 R 337 8 R 329July ........................... 3,459 2,284 5,743 120 5.5 R 348 19 R 329August ...................... 3,467 2,628 6,095 127 5.1 R 348 12 R 336September ................ 3,481 2,920 6,401 107 3.8 R 314 14 R 300October ..................... 3,484 3,079 6,563 121 4.1 R 189 34 R 155November ................. 3,496 3,045 6,541 118 4.0 R 104 132 R -28December ................. 3,553 2,753 6,306 207 8.1 R 51 R 293 R -242Total ......................... 3,553 2,753 6,306 207 8.1 2,295 2,047 248
1980January ..................... 3,549 2,324 5,873 434 23.0 21 424 -403February ................... 3,550 1,852 5,402 503 37.3 24 451 -427March ........................ 3,556 1,594 5,150 358 29.0 59 283 -224April .......................... 3,584 1,691 5,275 356 26.7 167 65 102May ........................... 3,590 1,998 5,588 379 23.4 298 9 289June .......................... 3,596 2,299 5,895 349 17.9 293 14 278July ........................... 3,600 2,587 6,187 303 13.3 286 19 267August ...................... 3,608 2,854 6,462 226 8.6 273 29 244September ................ 3,613 3,099 R 6,712 179 6.1 240 11 229October ..................... 3,619 3,187 R 6,806 108 3.5 138 47 91November ................. 3,637 3,026 6,663 -19 -.6 65 188 -123December ................. 3,642 2,655 6,297 -99 -3.6 34 371 -337Total ......................... 3,642 2,655 6,297 -99 -3.6 1,896 1,910 -14
1981January ..................... 3,642 2,152 R 5,794 -172 -7.4 37 558 -521February ................... 3,648 1,824 5,472 -28 -1.5 59 376 -317March ........................ 3,654 1,631 5,285 37 2.3 55 234 -179April .......................... 3,670 1,764 5,434 73 4.3 208 55 153May ........................... 3,684 1,977 R 5,661 R -21 -1.1 255 26 228June .......................... 3,681 2,252 5,933 R -47 -2.0 314 27 287July ........................... 3,699 2,558 6,257 -29 -1.1 335 26 309August ...................... 3,713 2,882 6,595 28 1.0 361 15 346September ................ 3,720 3,152 6,872 53 1.7 287 9 277October ..................... 3,726 3,248 6,974 61 1.9 155 50 104November ................. 3,731 3,201 6,932 175 5.8 80 124 -44December ................. 3,752 2,817 6,569 162 6.1 34 387 -353Total ......................... 3,752 2,817 6,569 162 6.1 2,180 1,887 293
1982January ..................... 3,751 2,182 R 5,933 R 30 1.4 24 673 -649February ................... 3,750 1,787 R 5,537 -37 -2.0 50 446 -396March ........................ 3,766 1,604 5,370 R -27 R -1.7 88 265 -176April .......................... 3,778 1,676 5,454 -88 -5.0 180 108 73May ........................... 3,780 2,034 5,814 57 2.9 382 11 371June .......................... 3,778 2,369 6,147 117 5.2 353 11 342July ........................... 3,780 2,704 6,484 146 5.7 351 12 339August ...................... 3,781 2,998 R 6,779 116 4.0 332 35 298September ................ 3,782 3,251 7,033 99 3.1 277 20 257October ..................... 3,785 3,364 7,149 116 3.6 191 60 131November ................. 3,772 3,309 7,081 108 3.4 83 163 -80December ................. 3,808 3,071 6,879 255 9.0 86 289 -204Total ......................... 3,808 3,071 6,879 255 9.0 2,399 2,094 306
See footnotes at end of table.
Energy Information Administration/Historical Monthly Energy Review 1973-1992178

Table 4.5 Natural Gas in Underground Storage, 1973-1992 (Continued)
(Volumes in Billion Cubic Feet)
Natural Gas inUnderground Storage,
End of Period
Change in Working Gasfrom Same Period
Previous Year Storage Activity
Base Gas Working Gas Totala Volume Percent Injectionsb Withdrawalsb Netc
1983January ..................... 3,813 2,644 6,457 462 21.2 24 449 -424February ................... 3,811 2,356 6,167 569 R 31.8 36 325 -289March ........................ 3,812 2,148 R 5,960 544 33.9 59 266 -207April .......................... 3,818 2,074 R 5,892 398 R 23.7 82 160 -78May ........................... 3,818 2,222 R 6,040 188 R 9.2 191 40 151June .......................... 3,819 2,454 R 6,273 85 3.6 255 22 234July ........................... 3,826 2,696 6,522 -8 -.3 268 25 243August ...................... 3,823 2,908 R 6,731 R -90 -3.0 247 35 212September ................ 3,823 3,141 6,964 -110 -3.4 258 26 232October ..................... 3,825 3,270 7,095 -94 -2.8 171 40 131November ................. 3,841 3,175 R 7,016 -134 R -4.0 80 158 -78December ................. 3,847 2,595 6,442 -476 -15.5 29 597 -567Total ......................... 3,847 2,595 6,442 -476 -15.5 1,700 2,142 -442
1984January ..................... 3,847 2,091 R 5,938 -553 -20.9 54 571 -517February ................... 3,828 1,876 5,704 -480 -20.4 60 305 -244March ........................ 3,824 1,572 5,396 R -576 -26.8 48 365 -317April .......................... 3,822 1,620 5,442 -454 -21.9 144 100 44May ........................... 3,827 1,843 5,670 -379 -17.1 254 30 224June .......................... 3,828 2,141 5,969 -313 R -12.8 323 27 296July ........................... 3,829 2,456 6,285 R -240 -8.9 346 28 317August ...................... 3,829 2,740 6,569 -168 -5.8 318 30 288September ................ 3,829 2,996 6,825 R -145 -4.6 289 30 259October ..................... 3,837 3,175 R 7,012 -95 -2.9 242 47 195November ................. 3,900 3,015 6,915 -160 -5.0 83 227 -145December ................. 3,830 2,876 6,706 281 10.8 92 304 -213Total ......................... 3,830 2,876 6,706 281 10.8 2,252 2,064 188
1985January ..................... 3,841 2,242 6,083 151 7.2 32 642 -610February ................... 3,841 1,853 5,694 -23 -1.2 47 438 -391March ........................ 3,835 1,743 5,578 171 R 10.9 98 217 -119April .......................... 3,831 1,859 R 5,690 239 14.8 204 91 113May ........................... 3,837 2,129 R 5,966 286 15.5 294 23 272June .......................... 3,839 2,351 R 6,190 R 210 9.8 252 31 221July ........................... 3,849 2,605 6,454 149 6.1 309 45 263August ...................... 3,849 2,832 6,681 92 3.4 278 50 228September ................ 3,849 3,081 6,930 85 2.8 272 20 253October ..................... 3,851 3,204 7,055 29 .9 199 71 128November ................. 3,847 3,086 6,933 71 2.4 99 202 -103December ................. 3,842 2,607 6,448 -270 -9.4 44 529 -485Total ......................... 3,842 2,607 6,448 -270 -9.4 2,128 2,359 -231
1986January ..................... 3,842 2,213 R 6,055 -29 -1.3 48 414 -366February ................... 3,842 1,872 5,714 19 1.0 54 369 -315March ........................ 3,838 1,764 5,602 21 1.2 109 213 -104April .......................... 3,834 1,841 5,675 -18 -1.0 140 73 67May ........................... 3,830 2,076 5,906 -53 -2.5 255 42 213June .......................... 3,829 2,323 R 6,152 -28 -1.2 255 24 231July ........................... 3,841 2,570 R 6,411 -35 -1.3 274 29 245August ...................... 3,840 2,842 R 6,682 10 .4 279 26 253September ................ 3,840 3,066 6,906 R -15 -.5 239 25 215October ..................... 3,840 3,208 7,048 4 .1 189 48 141November ................. 3,820 3,077 6,897 -9 -.3 74 197 -123December ................. 3,819 2,749 6,567 142 5.5 36 352 -316Total ......................... 3,819 2,749 6,567 142 5.5 1,952 1,812 140
1987January ..................... 3,818 2,280 6,098 67 3.0 38 513 -475February ................... 3,815 1,988 5,803 116 6.2 35 320 -285March ........................ 3,813 1,879 R 5,692 115 6.5 105 210 -105April .......................... 3,812 1,938 5,750 97 5.3 163 101 62May ........................... 3,811 2,206 6,017 130 6.3 293 28 265June .......................... 3,810 2,437 6,247 R 114 4.9 248 21 227July ........................... 3,813 2,636 6,449 R 66 R 2.6 226 27 199August ...................... 3,813 2,836 R 6,649 R -6 -.2 241 43 198September ................ 3,813 3,049 6,862 -17 -.6 227 19 209October ..................... 3,813 3,106 6,919 -102 -3.2 146 86 60November ................. 3,792 3,059 6,851 -18 -.6 105 153 -48December ................. 3,792 2,756 6,548 7 .3 59 359 -300Total ......................... 3,792 2,756 6,548 7 .3 1,887 1,881 6
See footnotes at end of table.
Energy Information Administration/Historical Monthly Energy Review 1973-1992 179

Table 4.5 Natural Gas in Underground Storage, 1973-1992 (Continued)
(Volumes in Billion Cubic Feet)
Natural Gas inUnderground Storage,
End of Period
Change in Working Gasfrom Same Period
Previous Year Storage Activity
Base Gas Working Gas Totala Volume Percent Injectionsb Withdrawalsb Netc
1988January ..................... 3,792 2,228 6,020 -52 -2.3 47 578 -531February ................... 3,791 1,827 5,618 -161 -8.1 50 456 -406March ........................ 3,790 1,682 R 5,472 -197 -10.5 99 255 -156April .......................... 3,790 1,769 5,559 -169 -8.7 162 92 71May ........................... 3,790 2,027 R 5,817 -179 -8.1 282 46 236June .......................... 3,792 2,293 6,085 -144 -5.9 274 36 238July ........................... 3,793 2,567 R 6,360 -69 -2.6 294 42 252August ...................... 3,791 2,835 6,626 -1 .0 282 52 230September ................ 3,791 3,120 6,911 71 2.3 308 46 262October ..................... 3,792 3,243 7,035 137 4.4 198 92 105November ................. 3,803 3,171 6,974 112 3.7 117 157 -40December ................. 3,800 2,850 6,650 94 3.4 62 391 -329Total ......................... 3,800 2,850 6,650 94 3.4 2,174 2,244 -69
1989January ..................... 3,798 2,509 6,307 281 12.6 53 418 -365February ................... 3,801 1,994 5,795 167 9.1 32 602 -570March ........................ 3,801 1,776 5,577 94 5.6 106 362 -256April .......................... 3,801 1,823 5,624 54 3.1 180 138 42May ........................... 3,802 2,062 5,864 35 1.7 321 44 277June .......................... 3,802 2,374 6,176 81 3.5 374 20 354July ........................... 3,802 2,644 6,446 77 3.0 371 29 341August ...................... 3,802 2,938 6,740 103 3.6 356 29 328September ................ 3,802 3,187 6,989 67 2.1 320 39 281October ..................... 3,792 3,268 7,060 25 .8 221 96 124November ................. 3,809 3,199 7,008 28 .9 105 223 -118December ................. 3,812 2,513 6,325 -337 -11.8 52 805 -752Total ......................... 3,812 2,513 6,325 -337 -11.8 2,491 2,804 -313
1990January ..................... 3,818 2,270 6,088 -239 -9.5 93 342 -249February ................... 3,814 2,004 5,818 10 .5 70 332 -262March ........................ 3,818 1,875 5,693 99 5.6 125 258 -133April .......................... 3,839 1,946 5,785 123 6.7 188 138 50May ........................... 3,823 2,180 6,003 118 5.7 293 43 250June .......................... 3,844 2,485 6,329 111 4.7 324 40 284July ........................... 3,850 2,791 6,641 147 5.6 326 26 300August ...................... 3,851 3,071 6,922 133 4.5 318 39 279September ................ 3,852 3,321 7,173 134 4.2 284 35 249October ..................... 3,852 3,467 7,319 199 6.1 209 63 146November ................. 3,868 3,472 7,340 273 8.5 134 145 -11December ................. 3,868 3,068 6,936 555 22.1 69 473 -404Total ......................... 3,868 3,068 6,936 555 22.1 2,433 1,934 499
1991January ..................... 3,911 2,362 6,273 92 4.1 115 660 -545February ................... 3,908 2,063 5,972 59 3.0 112 397 -285March ........................ 3,895 1,912 5,806 37 2.0 129 291 -162April .......................... 3,898 2,037 5,935 91 4.7 228 104 124May ........................... 3,931 2,273 6,204 93 4.3 319 58 261June .......................... 3,939 2,553 6,492 68 2.7 314 42 272July ........................... 3,942 2,771 6,713 -20 -.7 290 75 214August ...................... 3,949 2,978 6,927 -93 -3.0 282 82 200September ................ 3,950 3,201 7,151 -120 -3.6 294 78 216October ..................... 3,961 3,369 7,330 -98 -2.8 251 103 148November ................. 3,952 3,148 7,100 -324 -9.3 150 352 -202December ................. 3,954 2,824 6,778 -244 -8.0 125 448 -323Total ......................... 3,954 2,824 6,778 -244 -8.0 2,608 2,689 -80
1992January ..................... 4,061 2,216 6,277 -146 -6.2 68 591 -524February ................... 4,057 1,837 5,894 -226 -10.9 52 441 -389March ........................ 4,046 1,545 5,591 -367 -19.2 81 381 -301April .......................... 4,038 1,573 5,611 -463 -22.8 167 150 18May ........................... 4,044 1,848 5,892 -425 -18.7 330 53 277June .......................... 4,050 2,153 6,203 -400 -15.7 366 43 323July ........................... 4,064 2,460 6,524 -311 -11.2 357 50 307August ...................... 4,062 2,761 6,823 -217 -7.3 364 54 309September ................ 4,061 3,044 7,105 -157 -4.9 346 48 298October ..................... 4,065 3,223 7,288 -146 -4.3 264 78 186November ................. 4,061 3,054 7,115 -94 -3.0 95 276 -181December ................. 4,044 2,597 6,641 -227 -8.0 65 557 -491Total ......................... 4,044 2,597 6,641 -227 -8.0 2,555 2,724 -168
a For total underground storage capacity at the end of each calendar year,see Note 8 at end of section.
b For 1980-1992, data differ from those shown on Table 4.2, whichincludes liquefied natural gas storage for that period.
c Positive numbers indicate injections are greater than withdrawals. Negative numbers indicate withdrawals are greater than injections. Netinjections or withdrawals may not equal the difference between applicable
ending stocks. See Note 8 at end of section.R=Revised data. NA=Not available. Notes: • Totals may not equal sum of components due to independent
rounding. • Geographic coverage is the 50 States and the District ofColumbia.
Sources: See end of section.
Energy Information Administration/Historical Monthly Energy Review 1973-1992180

Natural Gas Notes and Sources
Notes:1. Nonhydrocarbon Gases Removed: Annual data onnonhydrocarbon gases removed from marketed pro-duction—carbon dioxide, helium, hydrogen sulfide,and nitrogen—are from the Energy Information Ad-ministration (EIA) Natural Gas Annual (NGA) 1992.Data are not available prior to 1980. Differences be-tween annual data published in the EIA NGA and thesum of the preliminary monthly data (January-Decem-ber) are allocated proportionally to the months to createfinal monthly data. For further information, see the EIANatural Gas Monthly (NGM).
2. Production: Final annual data are from the EIANGA. Differences between annual data in the EIA NGAand the sum of preliminary monthly data (January-De-cember) are allocated proportionally to the months tocreate final monthly data.
3. Extraction Loss: Extraction loss is the reduction involume of natural gas resulting from the removal of nat-ural gas liquid constituents at natural gas processingplants. Annual data are from the EIA NGA, where theyare estimated on the basis of the type and quantity ofliquid products extracted from the gas stream and thecalculated volume of such products at standard condi-tions. For a detailed explanation of the calculations usedto derive estimated extraction losses, see the EIA NGA.Final monthly data are estimated by allocating annualextraction loss data to the months on the basis of totalnatural gas marketed production data from the EIA NGA.
4. Supplemental Gaseous Fuels: Any gaseous sub-stance that, introduced into or commingled with natu-ral gas, increases the volume available for disposition. Such substances include, but are not limited to, propane-air,refinery gas, coke oven gas, still gas, manufactured gas,biomass gas, or air or inert gases added for Btu stabilization.Annual data beginning with 1980 are from the EIA NGA.Unknown quantities of supplemental gaseous fuels areincluded in consumption data for 1979 and earlier years.
Monthly estimates are based on the annual ratio of sup-plemental gaseous fuels to the sum of dry gas production,net imports, and net withdrawals from storage. The ratiois applied to the monthly sum of the three elements tocompute a monthly supplemental gaseous fuels figure.
5. Imports and Exports: The United States importsnatural gas via pipeline from Canada. Prior to 1985, italso imported natural gas via pipeline from Mexico.Liquefied natural gas (LNG) arrives via tanker fromAlgeria. One shipment of LNG was received from In-donesia in December 1986. Very small amounts of LNG
arrived from Canada in 1973 (667 million cubic feet),1977 (572 million cubic feet), and 1981 (6 million cubicfeet). The United States exports natural gas via pipelineto Canada and Mexico and LNG via tanker to Japan.
Annual and monthly data are from the annual EIAForm FPC-14, "Annual Report for Importers and Ex-porters of Natural Gas," which requires data to be re-ported by month for the calendar year.
6. Consumption: Consumption includes pipeline fueluse, lease and plant fuel use, and deliveries to consum-ing sectors.
Monthly commercial data for 1973-1979 were calculatedby EIA by applying monthly-to-annual "Commercial"sales data ratios from the American Gas Association(AGA), Monthly Gas Utility Statistical Report publica-tions to the EIA annual commercial data. These calcu-lated data replace the original set of commercial data inthe Historical Monthly Energy Review (HMER), 1973-1988, which were based on combined AGA "Commer-cial" and "Other" sales data.
Monthly residential data for 1973-1979 were calculatedby EIA by applying monthly-to-annual "Residential"sales data ratios from the AGA to the EIA annual resi-dential data.
Annual consumption data are from the EIA NGA. Formore information on the methods of estimatingmonthly data, see the EIA NGM.
7. Balancing Item: The balancing item for natural gasrepresents the difference between the sum of the com-ponents of natural gas supply and the sum of compo-nents of natural gas disposition. The differences maybe due to quantities lost or to the effects of data report-ing problems. Reporting problems include differencesdue to the net result of conversions of flow data meteredat varying temperature and pressure bases and con-verted to a standard temperature and pressure base; theeffect of variations in company accounting and billingpractices; differences between billing cycle and calen-dar period time frames; and imbalances resulting fromthe merger of data reporting systems which vary inscope, format, definitions, and type of respondents.
The increase of 0.2 trillion cubic feet (Tcf) in the "Balanc-ing Item" category in 1983, followed by a decline of 0.5Tcf in 1984, reflected unusually large differences result-ing from the use of the annual billing cycle (essentiallyDecember 15 through the following December 14) con-sumption data in conjunction with calendar year sup-ply data. Record cold temperatures during the last halfof December 1983 resulted in a reported 0.3 Tcf increasein net withdrawals from underground storage for peakshaving as compared with the same period in 1982, but
Energy Information Administration/Historical Monthly Energy Review 1973-1992 181

the effect of this cold weather was reflected primarily in1984 consumption data. For underground storage data,see Table F2 in the May 1985 NGM, which was pub-lished in July 1985.
8. Natural Gas Storage: Gas in storage at the end of areporting period may not equal the quantity derived byadding or subtracting net injections or withdrawalsfrom the quantity in storage at the end of the previousperiod. The difference is due to changes in the quantityof native gas included in the base gas and/or losses inbase gas due to migration from storage reservoirs.
Monthly underground storage data are collected fromFederal Energy Regulatory Commission (FERC) FormsFERC-8 (interstate data) and EIA-191 (intrastate data).Beginning in January 1991, all data are collected on therevised Form EIA-191. Injection and withdrawal datafrom the FERC-8/EIA-191 survey are adjusted to corre-spond to data from Form EIA-176 following publicationof the EIA NGA.
The final monthly and annual storage and withdrawal datafor 1980-1989 include both underground and liquefied nat-ural gas (LNG) storage. Annual data on LNG additions andwithdrawals are from Form EIA-176. Monthly data areestimated by computing the ratio of each month’s under-ground storage additions and withdrawals to annual un-derground storage additions and withdrawals andapplying the ratio to the annual LNG data.
Total underground storage capacity at the end of eachcalendar year since 1975 (first year data were available),in billion cubic feet, was:
1975 6,280 1984 8,0431976 6,544 1985 8,0871977 6,678 1986 8,1451978 6,890 1987 8,1241979 6,929 1988 8,1241980 7,434 1989 8,1241981 7,805 1990 8,1251982 7,915 1991 7,9931983 7,985 1992 7,932
Sources:
Table 4.1
Annual data: • 1973-1987—Energy Information Ad-ministration (EIA), Natural Gas Annual 1992, Volume 1,Table 95. 1988-1992—EIA, Natural Gas Monthly, April1994, Table 1.
Monthly data: • Marketed Production, 1973-June1976—U.S. Department of the Interior (DOI), Bureau ofMines (BOM), Mineral Industry Surveys, "Natural Gas,Monthly," "Marketed Production, Imports and Exportsof Natural Gas," and EIA revisions to January throughMay data based on mid-year receipt of annual data on
Form BOM-6-1341-A, "Supply and Distribution of Nat-ural Gas—Producers." July 1976-1977—EIA, EnergyData Reports, "Natural Gas, Monthly," "Marketed Pro-duction, Imports and Exports of Natural Gas," and EIArevisions to January through May data based on mid-year receipt of annual data on Form BOM-6-1341-A,"Supply and Distribution of Natural Gas—Producers."1978 and 1979—EIA, Energy Data Reports, "Natural Gas,Monthly," "Natural and Synthetic Gas," and EIA revi-sions to January through July data based on mid-yearreceipt of annual data on Form BOM-6-1341-A, "Supplyand Distribution of Natural Gas—Producers," andForm EIA-176, "Annual Report of Natural and Supple-mental Gas Supply and Disposition."
• Extraction Loss, 1973-1981—Calculated by EIA as theannual extraction loss proportion of annual marketedproduction times marketed production for each month.
• Total Dry Gas Production, 1973-1981—Calculated byEIA as "Marketed Production" minus "Extraction Loss."
• All Series, 1980-1992 (except Extraction Loss and TotalDry Gas Production, 1980 and 1981, which are citedabove)—EIA, Natural Gas Monthly, Table 1, issues as listed,and revisions from the Natural Gas Office data systems:
Data Issue
1980 February 19831981 November 19831982 August 19841983 December 19851984 December 19861985 December 19871986 December 19881987 December 19891988 February 19911989 February 19921990 December 19921991 June 19931992 April 1994
Table 4.2
Annual data: • Total Dry Gas Production, 1973-1987—EIA, Natural Gas Annual 1992, Volume 1, Table 95.
• Withdrawals from Storage, 1973-1975 and 1980-1987—EIA, Natural Gas Annual 1992, Volume 1, Table96. 1976-1979—EIA, Natural Gas Production and Con-sumption 1979, Table 1.
• Supplemental Gaseous Fuels, 1980-1987—EIA, Nat-ural Gas Annual 1990, Volume 2, Table 12.
• Imports, Additions to Storage, Exports, and Con-sumption, 1973-1987—EIA, Natural Gas Annual 1992,Volume 1, Table 96.
• Total Supply/Disposition, 1973-1987—Sum of dis-position items.
Energy Information Administration/Historical Monthly Energy Review 1973-1992182
• Balancing Item, 1973-1987—Total supply/disposi-tion minus all other supply items.
• All Series, 1988-1992—EIA, Natural Gas Monthly,April 1994, Table 2.
Monthly data: • Total Dry Gas Production, 1973-1981—Table 4.1.
• Withdrawals from Storage and Additions to Stor-age—EIA, Monthly Energy Review, issues as listed, andrevisions from the Integrated Modeling Data System:
Data Issue
Sept.-Dec. 1975 February 19791976 February 19791977 December 19791978 August 19801979 June 1981
• Imports and Exports, 1973-June 1976—DOI, BOM,Mineral Industry Surveys, "Natural Gas, Monthly," andEIA revisions to data from the Federal Power Commis-sion (FPC), Form FPC-14. July 1976-1979—EIA, EnergyData Reports, "Natural Gas, Monthly," and EIA revisionsto data from the FPC, Form FPC-14.
• Consumption, 1973-1979—Calculated by DOI, BOM,and EIA as the sum of total dry gas production, nettrade, and estimated withdrawals from storage, addi-tions to storage, and unaccounted for.
• Total Supply/Disposition, September 1975-1992—Sum of the disposition items.
• Balancing Item, September 1975-1992—Total sup-ply/disposition minus all other supply items.
• All Other Series, 1980-1992 (except Total Dry GasProduction, 1980 and 1981, which is cited above)—EIA,Natural Gas Monthly, Table 2, issues as listed, and revi-sions from the Natural Gas Office data systems:
Data Issue
1980 February 19831981 November 19831982 August 19841983 December 19851984 December 19861985 December 19871986 December 19881987 December 19891988 February 19911989 December 19911990 December 19921991 June 19931992 April 1994
Table 4.3
• Annual data: 1973-1987—EIA, Form FPC-14, "AnnualReport for Importers and Exporters of Natural Gas."
1988-1992—EIA, Natural Gas Monthly, April 1994, Ta-bles 5 and 6.
• Monthly data: 1973-1991—EIA, Form FPC-14, "AnnualReport for Importers and Exporters of Natural Gas."1992—EIA, Natural Gas Monthly, April 1994, Tables 5and 6.
Table 4.4Annual data: • 1973-1987—EIA, Natural Gas Annual1992, Volume 1, Table 97. 1988-1992—EIA, Natural GasMonthly, April 1994, Table 3.
Monthly data: • Total Consumption, 1973-1979—Table 4.2.
• Electric Utilities, 1973-1976—FPC, Form FPC-4.1977-1979—EIA, Form EIA-759.
• Residential and Commercial, 1973-1979—EIA calcu-lations, see Note 6.
• Pipeline Fuel, 1973-1979—Calculated by EIA by ap-plying monthly-to-annual total consumption ratios tothe EIA pipeline fuel annual data.
• All Series, 1980-1992—EIA, Natural Gas Monthly(NGM), Table 3, issues as listed, and revisions from theNatural Gas Office data systems:
Data Issue
1980 February 1983 (Commercial deliveries are the sum of NGM "Commercial" and "Otherdeliveries").
1981 November 1983 (Commercial deliveries are the sum of NGM "Commercial" and "Other deliveries").
1982 August 19841983 December 19851984 December 19861985 January 19881986 January 19891987 January 19901988 March 19911989 December 19911990 December 19921991 June 19931992 April 1994
Table 4.5Annual data: • Storage Activity, 1973-1975—EIA,Natural Gas Annual 1992, Volume 2, Table 9. 1976-1979—EIA, Natural Gas Production and Consumption1979, Table 1. 1980-1987—EIA, Natural Gas Annual 1992,Volume 2, Table 11. 1988-1992—Natural Gas Monthly, April1994, Table 13.
• All Other Data, 1973 and 1974—American Gas Asso-ciation, Gas Facts, 1972 Data, Table 57, Gas Facts, 1973Data, Table 57, and Gas Facts, 1974 Data, Table 40. 1975and 1976—Federal Energy Administration (FEA), Form
Energy Information Administration/Historical Monthly Energy Review 1973-1992 183

FEA-G318-M-0, "Underground Gas Storage Report,"and FPC, Form FPC-8, "Underground Gas Storage Re-port." 1977 and 1978—EIA, Form FEA-G318-M-0, "Un-derground Gas Storage Report," and Federal EnergyRegulatory Commission (FERC), Form FERC-8, "Un-derground Gas Storage Report." 1979—EIA, Form EIA-191, "Underground Gas Storage Report," and FERC,Form FERC-8, "Underground Gas Storage Report."1980-1992—EIA, Natural Gas Monthly, issues and tablesas listed below for monthly data.
Monthly data: • Change in Working Gas, DecemberData, 1973-1979—Sources are the same as those for an-nual data. October 1975, September-November 1976,January-November 1977, January-November 1978,and January-November 1979—Calculated by EIA byusing Natural Gas in Underground Storage data fromthe above sources.
• Natural Gas in Underground Storage, DecemberData, 1973-1979—Sources are the same as those forannual data. October 1974-November 1979—EIA,Monthly Energy Review, issues as listed:
Data Issue
October 1974 December 1977Sept.-Nov. 1975 February 1979Jan.-Nov. 1976 February 1979Jan.-Nov. 1977 December 1979Jan.-Nov. 1978 August 1980Jan.-Nov. 1979 June 1981
• Storage Activity, September 1975-December 1981—EIA, Monthly Energy Review, issues as listed, and revi-sions from the Integrated Modeling Data System:
Data Issue
Sept.-Dec.1975 February 19791976 February 19791977 December 19791978 August 19801979 June 19811980 February 19831981 December 1983(4)
• All Series, 1980-1992 (except Storage Activity, 1980and 1981, which are cited above)—EIA, Natural GasMonthly, issues and tables as listed, and revisions fromthe Natural Gas Office data systems:
Data Issue Table
1980 February 1983 51981 November 1983 51982 September 1984 51983 December 1985 171984 December 1986 171985 December 1987 171986 December 1988 171987 December 1989 171988 February 1991 171989 December 1991 171990 December 1992 171991 June 1993 131992 April 1994 13
Energy Information Administration/Historical Monthly Energy Review 1973-1992184

Section 5Oil and Gas ResourceDevelopment
A Stevens Zone rig drills for oil at the Elk Hills Naval Petroleum Reserve in California.

Table 5.1 Oil and Gas Drilling Activity Measurements, 1973-1992
Crews Engaged inSeismic Exploration Rotary Rigs in Operationa
TotalFootageDrilledc
ActiveWell Servicing
UnitsdOffshore Onshore Total
By Site By Type
TotalbOffshore Onshore Oil Gas
Monthly Average Weekly Average Thousand Feet Number
1973January ......................... NA NA NA 99 1,120 NA NA 1,219 11,583 NAFebruary ....................... NA NA NA 89 1,037 NA NA 1,126 10,184 NAMarch ............................ NA NA NA 90 959 NA NA 1,049 11,123 NAApril .............................. NA NA NA 79 914 NA NA 993 10,103 NAMay ............................... NA NA NA 72 974 NA NA 1,046 11,928 NAJune .............................. NA NA NA 76 1,042 NA NA 1,118 11,360 NAJuly ............................... NA NA NA 81 R 1,075 NA NA R 1,156 11,550 NAAugust .......................... NA NA NA 82 1,140 NA NA 1,222 13,184 NASeptember .................... NA NA NA 83 1,183 NA NA 1,266 11,523 NAOctober ......................... NA NA NA 84 1,250 NA NA 1,334 12,664 NANovember ..................... NA NA NA 86 1,304 NA NA 1,390 12,192 NADecember ..................... NA NA NA 87 1,318 NA NA 1,405 12,033 NAAverage ....................... 23 227 250 84 1,110 NA NA 1,194 R 139,427 NA
1974January ......................... NA NA NA 89 1,283 NA NA 1,372 11,960 NAFebruary ....................... NA NA NA 91 1,264 NA NA 1,355 10,981 NAMarch ............................ NA NA NA 95 1,272 NA NA 1,367 12,836 NAApril .............................. NA NA NA 101 1,280 NA NA 1,381 13,223 NAMay ............................... 35 278 313 94 R 1,319 NA NA R 1,413 13,123 NAJune .............................. 38 279 317 90 1,342 NA NA 1,432 12,413 NAJuly ............................... 35 299 334 93 1,387 NA NA 1,480 13,896 NAAugust .......................... 34 287 321 92 1,426 NA NA 1,518 12,720 NASeptember .................... 34 287 321 90 1,437 NA NA 1,527 12,669 NAOctober ......................... 32 288 320 91 1,493 NA NA 1,584 13,816 NANovember ..................... 30 276 306 99 1,497 NA NA 1,596 12,623 NADecember ..................... 25 275 300 103 1,540 NA NA 1,643 13,531 NAAverage ....................... 31 274 305 94 1,378 NA NA 1,472 153,791 NA
1975January ......................... 27 274 301 94 1,521 NA NA 1,615 R 14,895 NAFebruary ....................... 24 278 302 93 1,518 NA NA 1,611 12,348 NAMarch ............................ 23 276 299 102 1,549 NA NA 1,651 14,282 NAApril .............................. 23 260 283 102 R 1,503 NA NA R 1,605 14,253 NAMay ............................... 32 254 286 102 1,490 NA NA 1,592 14,777 NAJune .............................. 38 251 289 106 1,507 NA NA 1,613 14,513 NAJuly ............................... 37 249 286 109 R 1,508 NA NA R 1,617 15,377 NAAugust .......................... 40 249 289 112 1,533 NA NA 1,645 15,988 NASeptember .................... 40 234 274 113 1,586 NA NA 1,699 15,888 NAOctober ......................... 29 241 270 112 1,604 NA NA 1,716 17,390 NANovember ..................... 27 238 265 113 1,644 NA NA 1,757 15,072 2,505December ..................... 26 233 259 116 1,677 NA NA 1,793 16,263 2,675Average ....................... 30 254 284 106 1,554 NA NA 1,660 181,046 NA
1976January ......................... 20 232 252 123 1,588 NA NA R 1,711 17,618 2,612February ....................... 17 232 249 126 1,468 NA NA 1,594 14,101 2,490March ............................ 18 222 240 132 1,408 NA NA 1,540 15,715 2,521April .............................. 17 221 238 124 1,356 NA NA 1,480 R 14,965 2,597May ............................... 21 226 247 121 1,375 NA NA 1,496 14,231 2,575June .............................. 29 229 258 120 1,426 NA NA 1,546 15,302 2,607July ............................... 30 240 270 132 1,465 NA NA 1,597 14,888 2,606August .......................... 33 242 275 128 1,563 NA NA 1,691 16,101 2,656September .................... 28 240 268 126 1,618 NA NA 1,744 15,852 2,652October ......................... 21 246 267 128 1,666 NA NA 1,794 16,672 2,639November ..................... 25 250 275 137 1,703 NA NA 1,840 15,866 2,601December ..................... 27 259 286 145 R 1,716 NA NA R 1,861 15,980 2,660Average ....................... 25 237 262 129 1,529 NA NA 1,658 187,291 2,601
1977January ......................... 26 254 280 146 1,704 NA NA 1,850 16,003 2,474February ....................... 27 259 286 166 1,690 NA NA 1,856 15,203 2,628March ............................ 22 260 282 163 1,724 NA NA 1,887 18,484 2,695April .............................. 26 266 292 162 1,745 NA NA 1,907 16,870 2,804May ............................... 29 272 301 169 1,813 NA NA 1,982 17,787 2,760June .............................. 31 274 305 169 1,839 NA NA 2,008 18,440 2,895July ............................... 30 285 315 172 1,851 NA NA 2,023 17,517 2,929August .......................... 31 295 326 178 1,888 NA NA 2,066 R 19,845 2,942September .................... 29 291 320 178 1,906 NA NA 2,084 18,562 2,964October ......................... 28 302 330 169 1,932 NA NA 2,101 R 19,966 2,973November ..................... 26 309 335 168 1,945 NA NA 2,113 18,364 2,968December ..................... 26 303 329 168 1,973 NA NA 2,141 R 18,655 2,898Average ....................... 27 281 308 167 1,834 NA NA 2,001 215,696 2,828
See footnotes at end of table.
Energy Information Administration/Historical Monthly Energy Review 1973-1992 187

Table 5.1 Oil and Gas Drilling Activity Measurements, 1973-1992 (Continued)
Crews Engaged inSeismic Exploration Rotary Rigs in Operationa
TotalFootageDrilledc
ActiveWell Servicing
UnitsdOffshore Onshore Total
By Site By Type
TotalbOffshore Onshore Oil Gas
Monthly Average Weekly Average Thousand Feet Number
1978January ......................... 26 302 328 172 1,956 NA NA 2,128 18,305 2,810February ....................... 23 305 328 181 1,954 NA NA 2,135 15,348 2,906March ............................ 20 314 334 180 R 1,979 NA NA R 2,159 19,423 2,899April .............................. 21 321 342 182 2,016 NA NA 2,198 20,330 2,997May ............................... 21 330 351 183 2,066 NA NA 2,249 20,174 2,996June .............................. 26 336 362 184 R 2,103 NA NA R 2,287 20,528 2,987July ............................... 26 341 367 185 2,122 NA NA 2,307 19,680 3,006August .......................... 27 338 365 198 R 2,127 NA NA R 2,325 21,347 3,089September .................... 21 333 354 194 2,138 NA NA 2,332 20,807 3,073October ......................... 29 342 371 190 2,156 NA NA 2,346 22,669 3,078November ..................... 27 342 369 187 2,169 NA NA 2,356 20,278 2,958December ..................... 30 328 358 188 2,098 NA NA 2,286 19,499 3,063Average ....................... 25 327 352 185 2,074 NA NA 2,259 238,388 2,988
1979January ......................... 28 327 355 207 1,992 NA NA 2,199 19,326 3,094February ....................... 29 321 350 206 1,858 NA NA 2,064 15,926 2,698March ............................ 32 332 364 203 R 1,768 NA NA R 1,971 18,797 2,765April .............................. 30 330 360 207 1,736 NA NA 1,943 17,583 3,034May ............................... 28 355 383 198 1,762 NA NA 1,960 19,610 3,369June .............................. 32 372 404 205 1,794 NA NA 1,999 19,860 3,506July ............................... 31 376 407 205 1,889 NA NA 2,094 19,663 3,572August .......................... 31 393 424 208 2,014 NA NA 2,222 22,492 3,621September .................... 30 403 433 215 2,069 NA NA 2,284 21,006 3,673October ......................... 29 407 436 211 2,169 NA NA 2,380 24,611 3,954November ..................... 31 408 439 205 2,255 NA NA 2,460 22,166 3,795December ..................... 31 419 450 216 2,336 NA NA 2,552 22,646 3,709Average ....................... 30 370 400 207 1,970 NA NA 2,177 243,686 3,399
1980January ......................... 29 439 468 219 2,352 NA NA 2,571 R 25,096 3,855February ....................... 29 440 469 216 2,397 NA NA 2,613 21,488 3,923March ............................ 29 448 477 219 2,439 NA NA 2,658 23,227 4,010April .............................. 31 465 496 222 R 2,461 NA NA R 2,683 23,529 3,871May ............................... 34 468 502 229 2,568 NA NA 2,797 24,767 4,032June .............................. 39 496 535 235 2,615 NA NA 2,850 27,204 4,112July ............................... 42 514 556 235 2,718 NA NA 2,953 27,112 4,092August .......................... 44 521 565 235 2,810 NA NA 3,045 27,581 4,155September .................... 44 523 567 231 2,868 NA NA 3,099 28,488 4,277October ......................... 41 530 571 232 R 2,917 NA NA R 3,149 29,347 4,290November ..................... 41 531 572 247 2,973 NA NA 3,220 R 26,825 4,281December ..................... 40 540 580 250 3,036 NA NA 3,286 27,639 4,172Average ....................... 37 493 530 231 2,678 NA NA 2,909 312,303 4,089
1981January ......................... 38 553 591 245 3,141 NA NA 3,386 R 34,935 4,209February ....................... 41 561 602 234 3,268 NA NA 3,502 28,001 4,359March ............................ 40 570 610 252 3,343 NA NA 3,595 32,331 4,238April .............................. 40 605 645 256 3,472 NA NA 3,728 31,956 4,430May ............................... 42 619 661 249 R 3,568 NA NA R 3,817 33,759 4,749June .............................. 44 652 696 246 3,680 NA NA 3,926 34,155 5,093July ............................... 43 668 711 262 3,736 NA NA 3,998 34,829 5,172August .......................... 46 689 735 264 3,867 NA NA 4,131 36,708 5,196September .................... 47 697 744 266 3,976 NA NA 4,242 35,618 5,164October ......................... 52 689 741 264 4,088 NA NA 4,352 36,184 5,142November ..................... 47 681 R 728 270 4,166 NA NA 4,436 33,262 5,165December ..................... 47 656 703 283 R 4,238 NA NA R 4,521 37,104 5,279Average ....................... 44 637 681 256 3,714 NA NA 3,970 408,842 4,850
1982January ......................... 53 642 695 280 4,156 NA NA 4,436 39,440 5,368February ....................... 53 625 678 269 3,891 NA NA 4,160 32,368 5,220March ............................ 52 597 649 262 3,554 NA NA 3,816 37,984 4,808April .............................. 55 571 626 251 3,209 NA NA 3,460 33,396 4,334May ............................... 61 551 612 251 2,927 NA NA 3,178 R 31,295 4,328June .............................. 69 546 615 248 2,660 NA NA 2,908 29,630 4,005July ............................... 66 527 593 242 2,504 NA NA 2,746 29,612 3,846August .......................... 62 500 562 235 2,385 NA NA 2,620 R 30,855 3,779September .................... 59 476 535 228 R 2,255 NA NA R 4,283 28,582 3,726October ......................... 51 465 516 229 2,173 NA NA 2,402 R 29,027 3,762November ..................... 50 452 502 214 2,286 NA NA 2,500 27,111 3,933December ..................... 49 428 477 214 2,482 NA NA 2,696 R 29,137 3,865Average ....................... 57 531 588 243 2,862 NA NA 3,105 R 378,437 4,248
See footnotes at end of table.
Energy Information Administration/Historical Monthly Energy Review 1973-1992188
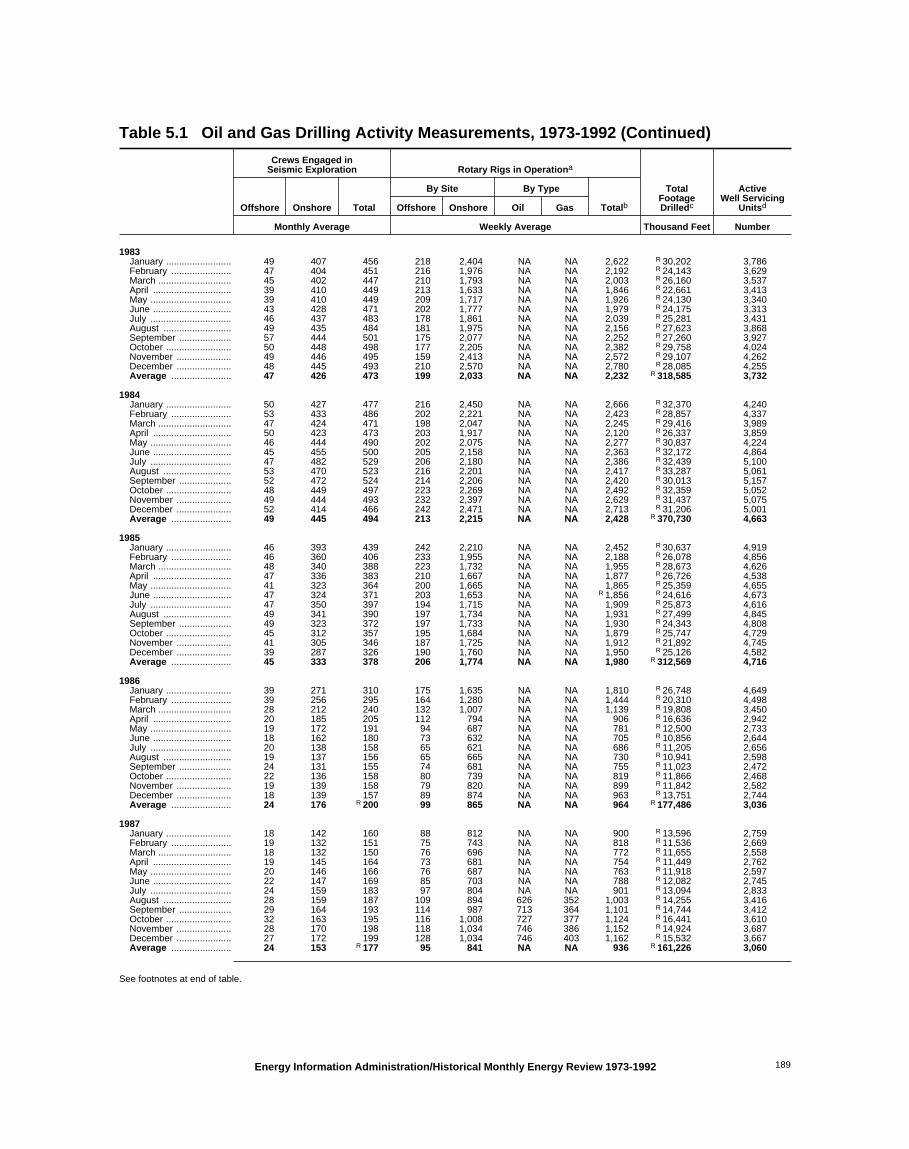
Table 5.1 Oil and Gas Drilling Activity Measurements, 1973-1992 (Continued)
Crews Engaged inSeismic Exploration Rotary Rigs in Operationa
TotalFootageDrilledc
ActiveWell Servicing
UnitsdOffshore Onshore Total
By Site By Type
TotalbOffshore Onshore Oil Gas
Monthly Average Weekly Average Thousand Feet Number
1983January ......................... 49 407 456 218 2,404 NA NA 2,622 R 30,202 3,786February ....................... 47 404 451 216 1,976 NA NA 2,192 R 24,143 3,629March ............................ 45 402 447 210 1,793 NA NA 2,003 R 26,160 3,537April .............................. 39 410 449 213 1,633 NA NA 1,846 R 22,661 3,413May ............................... 39 410 449 209 1,717 NA NA 1,926 R 24,130 3,340June .............................. 43 428 471 202 1,777 NA NA 1,979 R 24,175 3,313July ............................... 46 437 483 178 1,861 NA NA 2,039 R 25,281 3,431August .......................... 49 435 484 181 1,975 NA NA 2,156 R 27,623 3,868September .................... 57 444 501 175 2,077 NA NA 2,252 R 27,260 3,927October ......................... 50 448 498 177 2,205 NA NA 2,382 R 29,758 4,024November ..................... 49 446 495 159 2,413 NA NA 2,572 R 29,107 4,262December ..................... 48 445 493 210 2,570 NA NA 2,780 R 28,085 4,255Average ....................... 47 426 473 199 2,033 NA NA 2,232 R 318,585 3,732
1984January ......................... 50 427 477 216 2,450 NA NA 2,666 R 32,370 4,240February ....................... 53 433 486 202 2,221 NA NA 2,423 R 28,857 4,337March ............................ 47 424 471 198 2,047 NA NA 2,245 R 29,416 3,989April .............................. 50 423 473 203 1,917 NA NA 2,120 R 26,337 3,859May ............................... 46 444 490 202 2,075 NA NA 2,277 R 30,837 4,224June .............................. 45 455 500 205 2,158 NA NA 2,363 R 32,172 4,864July ............................... 47 482 529 206 2,180 NA NA 2,386 R 32,439 5,100August .......................... 53 470 523 216 2,201 NA NA 2,417 R 33,287 5,061September .................... 52 472 524 214 2,206 NA NA 2,420 R 30,013 5,157October ......................... 48 449 497 223 2,269 NA NA 2,492 R 32,359 5,052November ..................... 49 444 493 232 2,397 NA NA 2,629 R 31,437 5,075December ..................... 52 414 466 242 2,471 NA NA 2,713 R 31,206 5,001Average ....................... 49 445 494 213 2,215 NA NA 2,428 R 370,730 4,663
1985January ......................... 46 393 439 242 2,210 NA NA 2,452 R 30,637 4,919February ....................... 46 360 406 233 1,955 NA NA 2,188 R 26,078 4,856March ............................ 48 340 388 223 1,732 NA NA 1,955 R 28,673 4,626April .............................. 47 336 383 210 1,667 NA NA 1,877 R 26,726 4,538May ............................... 41 323 364 200 1,665 NA NA 1,865 R 25,359 4,655June .............................. 47 324 371 203 1,653 NA NA R 1,856 R 24,616 4,673July ............................... 47 350 397 194 1,715 NA NA 1,909 R 25,873 4,616August .......................... 49 341 390 197 1,734 NA NA 1,931 R 27,499 4,845September .................... 49 323 372 197 1,733 NA NA 1,930 R 24,343 4,808October ......................... 45 312 357 195 1,684 NA NA 1,879 R 25,747 4,729November ..................... 41 305 346 187 1,725 NA NA 1,912 R 21,892 4,745December ..................... 39 287 326 190 1,760 NA NA 1,950 R 25,126 4,582Average ....................... 45 333 378 206 1,774 NA NA 1,980 R 312,569 4,716
1986January ......................... 39 271 310 175 1,635 NA NA 1,810 R 26,748 4,649February ....................... 39 256 295 164 1,280 NA NA 1,444 R 20,310 4,498March ............................ 28 212 240 132 1,007 NA NA 1,139 R 19,808 3,450April .............................. 20 185 205 112 794 NA NA 906 R 16,636 2,942May ............................... 19 172 191 94 687 NA NA 781 R 12,500 2,733June .............................. 18 162 180 73 632 NA NA 705 R 10,856 2,644July ............................... 20 138 158 65 621 NA NA 686 R 11,205 2,656August .......................... 19 137 156 65 665 NA NA 730 R 10,941 2,598September .................... 24 131 155 74 681 NA NA 755 R 11,023 2,472October ......................... 22 136 158 80 739 NA NA 819 R 11,866 2,468November ..................... 19 139 158 79 820 NA NA 899 R 11,842 2,582December ..................... 18 139 157 89 874 NA NA 963 R 13,751 2,744Average ....................... 24 176 R 200 99 865 NA NA 964 R 177,486 3,036
1987January ......................... 18 142 160 88 812 NA NA 900 R 13,596 2,759February ....................... 19 132 151 75 743 NA NA 818 R 11,536 2,669March ............................ 18 132 150 76 696 NA NA 772 R 11,655 2,558April .............................. 19 145 164 73 681 NA NA 754 R 11,449 2,762May ............................... 20 146 166 76 687 NA NA 763 R 11,918 2,597June .............................. 22 147 169 85 703 NA NA 788 R 12,082 2,745July ............................... 24 159 183 97 804 NA NA 901 R 13,094 2,833August .......................... 28 159 187 109 894 626 352 1,003 R 14,255 3,416September .................... 29 164 193 114 987 713 364 1,101 R 14,744 3,412October ......................... 32 163 195 116 1,008 727 377 1,124 R 16,441 3,610November ..................... 28 170 198 118 1,034 746 386 1,152 R 14,924 3,687December ..................... 27 172 199 128 1,034 746 403 1,162 R 15,532 3,667Average ....................... 24 153 R 177 95 841 NA NA 936 R 161,226 3,060
See footnotes at end of table.
Energy Information Administration/Historical Monthly Energy Review 1973-1992 189

Table 5.1 Oil and Gas Drilling Activity Measurements, 1973-1992 (Continued)
Crews Engaged inSeismic Exploration Rotary Rigs in Operationa
TotalFootageDrilledc
ActiveWell Servicing
UnitsdOffshore Onshore Total
By Site By Type
TotalbOffshore Onshore Oil Gas
Monthly Average Weekly Average Thousand Feet Number
1988January ......................... 30 167 197 127 949 663 391 1,076 R 14,502 3,375February ....................... 30 168 198 123 853 575 375 976 R 13,435 3,485March ............................ 29 165 194 119 832 582 338 951 R 13,589 3,416April .............................. 29 167 196 117 800 567 316 917 R 12,674 3,230May ............................... 30 164 194 123 768 562 300 891 R 12,438 3,450June .............................. 30 158 188 124 773 554 309 897 R 12,641 3,541July ............................... 28 158 186 126 786 568 309 912 R 12,238 3,425August .......................... 32 156 188 123 807 565 335 930 R 11,987 3,559September .................... 30 151 181 122 805 512 390 927 R 12,701 3,344October ......................... 30 142 172 122 801 518 377 923 R 13,266 3,137November ..................... 28 127 155 129 789 490 406 918 R 11,529 3,090December ..................... 27 114 141 127 797 507 397 924 R 12,340 3,036Average ....................... 29 153 182 123 813 554 354 936 R 153,340 3,341
1989January ......................... 25 112 137 110 731 455 364 841 11,225 3,081February ....................... 23 115 138 95 667 392 347 762 9,062 2,997March ............................ 21 108 129 93 660 407 325 753 9,708 3,277April .............................. 22 109 131 92 679 427 322 771 10,141 3,417May ............................... 22 104 126 92 662 431 311 754 10,185 3,458June .............................. 22 102 124 103 692 423 357 795 10,721 3,319July ............................... 22 107 129 114 718 432 386 832 10,945 3,367August .......................... 26 110 136 114 772 437 438 886 11,903 3,379September .................... 24 114 138 107 848 460 484 955 11,730 3,495October ......................... 21 109 130 106 878 493 482 984 12,421 3,645November ..................... 20 109 129 119 922 532 498 1,041 12,375 3,690December ..................... 20 112 132 117 948 541 517 1,065 12,967 3,565Average ....................... 23 109 132 105 764 453 401 869 133,383 3,391
1990January ......................... 20 103 123 113 885 514 477 998 13,657 3,537February ....................... 20 100 120 105 806 492 412 911 10,942 3,486March ............................ 21 107 128 108 797 478 421 905 11,207 3,611April .............................. 24 101 125 111 824 484 447 935 10,753 3,411May ............................... 25 104 129 120 841 493 465 961 11,529 3,403June .............................. 23 100 123 113 886 498 495 999 11,996 3,522July ............................... 24 105 129 108 902 497 496 1,010 12,529 3,450August .......................... 23 102 125 108 879 506 466 987 12,982 3,605September .................... 25 101 126 107 935 566 460 1,042 12,663 3,905October ......................... 23 98 121 99 974 588 469 1,073 14,515 3,988November ..................... 23 100 123 106 1,031 615 495 1,137 12,657 3,984December ..................... 23 98 121 101 1,035 643 460 1,136 13,948 3,994Average ....................... 23 102 125 108 902 532 464 1,010 149,378 3,658
1991January ......................... 22 92 114 91 977 633 413 1,068 13,243 3,579February ....................... 21 97 118 88 896 564 405 984 12,738 3,512March ............................ 24 88 112 81 848 520 389 929 12,905 3,444April .............................. 23 87 110 95 770 469 374 865 12,490 3,416May ............................... 22 85 107 98 721 430 354 819 11,514 3,394June .............................. 21 87 108 93 774 483 342 867 11,214 3,363July ............................... 16 89 105 80 764 472 332 844 11,940 3,369August .......................... 15 87 102 68 735 451 326 803 11,861 3,257September .................... 14 84 98 71 704 433 314 775 10,669 3,208October ......................... 15 81 96 68 727 433 330 795 11,830 3,138November ..................... 18 73 91 72 736 457 328 808 10,395 3,113December ..................... 19 66 85 65 731 469 308 796 11,049 3,183Average ....................... 19 85 104 81 779 482 351 860 141,848 3,331
1992January ......................... 18 61 79 56 654 400 294 710 10,196 2,912February ....................... 13 62 75 51 618 378 277 669 8,610 2,704March ............................ 13 67 80 54 594 381 250 648 9,381 2,592April .............................. 13 72 85 55 587 370 251 642 8,860 2,727May ............................... 13 66 79 47 591 358 260 638 9,261 2,264June .............................. 12 64 76 44 577 343 260 621 9,034 2,369July ............................... 9 60 69 48 628 349 310 676 9,529 2,492August .......................... 9 67 76 51 635 334 331 686 9,635 2,630September .................... 10 66 76 45 672 345 356 717 10,748 2,825October ......................... 10 66 76 53 750 392 399 803 11,925 3,076November ..................... 15 61 76 60 822 418 451 882 11,764 2,977December ..................... 13 58 71 59 867 397 509 926 12,167 3,218Average ....................... 12 64 76 52 669 373 331 721 121,110 2,732
a Monthly data are averages of 4- or 5-week reporting periods, notcalendar months. Annual data are averages of 52- or 53-week reportingperiods, not calendar years.
b Sum of oil, gas, and miscellaneous other rigs, which is not shown. c Values shown are totals.d See Glossary.
R=Revised data. NA=Not available. Notes: • The data in this table are frequently revised; those shown here
correspond to the data in the July 1994 Monthly Energy Review.• Geographic coverage is the 50 States and the District of Columbia.
Sources: See end of section.
Energy Information Administration/Historical Monthly Energy Review 1973-1992190

Table 5.2 Oil and Gas Wells Drilled, 1973-1992
(Number of Wells)
Exploratory Development Total
Oil Gas Dry Total Oil Gas Dry Total Oil Gas Dry Total
1973January ....................... 58 61 548 667 726 461 339 1,526 784 522 887 2,193February ..................... 54 61 414 529 649 393 343 1,385 703 454 757 1,914March .......................... 54 69 438 561 803 427 385 1,615 857 496 823 2,176April ............................ 28 82 374 484 660 466 294 1,420 688 548 668 1,904May ............................. 51 97 461 609 846 506 358 1,710 897 603 819 2,319June ............................ 64 86 484 634 858 465 349 1,672 922 551 833 2,306July ............................. 47 114 535 696 820 503 369 1,692 867 617 904 2,388August ........................ 73 93 605 771 911 602 426 1,939 984 R 695 1,031 2,710September .................. 55 105 510 670 847 472 363 1,682 902 577 873 2,352October ....................... 51 111 564 726 849 586 402 1,837 900 697 966 2,563November ................... 64 97 506 667 854 524 410 1,788 918 621 916 R 2,455December ................... 55 103 599 757 774 491 390 1,655 829 594 989 2,412Total ........................... 654 1,079 6,038 7,771 9,597 5,896 4,428 19,921 10,251 6,975 10,466 27,692
1974January ....................... 58 86 492 636 856 600 377 1,833 914 686 869 2,469February ..................... 54 88 490 632 832 459 312 1,603 886 547 802 2,235March .......................... 71 99 497 667 997 560 408 1,965 1,068 659 905 2,632April ............................ 61 111 539 711 1,072 517 424 2,013 1,133 628 963 2,724May ............................. 78 121 574 773 1,118 483 458 2,059 1,196 604 1,032 2,832June ............................ 86 97 567 750 1,133 492 395 2,020 1,219 589 962 2,770July ............................. 82 105 612 799 1,173 500 515 2,188 1,255 605 1,127 2,987August ........................ 82 82 623 787 1,133 472 451 2,056 1,215 554 1,074 2,843September .................. 64 108 591 763 1,026 464 482 1,972 1,090 572 1,073 2,735October ....................... 86 118 626 830 1,193 516 527 2,236 1,279 634 1,153 3,066November ................... 66 94 650 810 1,041 433 454 1,928 1,107 527 1,104 2,738December ................... 82 96 633 811 1,220 469 508 2,197 1,302 565 1,141 3,008Total ........................... 870 1,205 6,894 8,969 12,794 5,965 5,311 24,070 13,664 7,170 12,205 33,039
1975January ....................... 84 97 630 811 1,231 522 513 2,266 1,315 619 1,143 3,077February ..................... 82 81 459 622 988 458 413 1,859 1,070 539 872 2,481March .......................... 94 92 581 767 1,226 442 455 2,123 1,320 534 1,036 2,890April ............................ 84 98 557 739 1,252 497 484 2,233 1,336 595 1,041 2,972May ............................. 86 114 548 748 1,269 523 500 2,292 1,355 637 1,048 3,040June ............................ 81 104 544 729 1,352 577 546 2,475 1,433 681 1,090 3,204July ............................. 83 129 636 848 1,370 603 532 2,505 1,453 732 1,168 3,353August ........................ 94 134 598 826 1,450 704 600 2,754 1,544 838 1,198 3,580September .................. 70 94 618 782 1,429 698 651 2,778 1,499 792 1,269 3,560October ....................... 90 114 694 898 1,636 729 688 3,053 1,726 843 1,382 3,951November ................... 70 110 642 822 1,367 569 592 2,528 1,437 679 1,234 3,350December ................... 73 96 700 869 1,418 585 555 2,558 1,491 681 1,255 3,427Total ........................... 991 1,263 7,207 9,461 15,988 6,907 6,529 29,424 16,979 8,170 13,736 38,885
1976January ....................... 92 129 687 908 1,619 740 636 2,995 1,711 869 1,323 3,903February ..................... 101 110 528 739 1,185 584 521 2,290 1,286 694 1,049 3,029March .......................... 90 125 602 817 1,409 592 574 2,575 1,499 717 1,176 3,392April ............................ 80 117 540 737 1,390 544 592 2,526 1,470 661 1,132 3,263May ............................. 87 106 506 699 1,298 603 567 2,468 1,385 709 1,073 3,167June ............................ 92 136 545 773 1,451 644 579 2,674 1,543 780 1,124 3,447July ............................. 86 109 533 728 1,250 690 548 2,488 1,336 799 1,081 3,216August ........................ 109 115 557 781 1,477 855 541 2,873 1,586 970 1,098 3,654September .................. 93 108 580 781 1,385 756 576 2,717 1,478 864 1,156 3,498October ....................... 78 109 604 791 1,454 710 641 2,805 1,532 819 1,245 3,596November ................... 104 111 575 790 1,295 734 589 2,618 1,399 845 1,164 3,408December ................... 88 87 597 772 1,384 624 587 2,595 1,472 711 1,184 3,367Total ........................... 1,100 1,362 6,854 9,316 16,597 8,076 6,951 31,624 17,697 9,438 13,805 40,940
1977January ....................... 110 82 558 750 1,278 769 539 2,586 1,388 851 1,097 3,336February ..................... 97 100 487 684 1,251 684 516 2,451 1,348 784 1,003 3,135March .......................... 94 138 573 805 1,563 872 643 3,078 1,657 1,010 1,216 3,883April ............................ 100 127 539 766 1,415 774 604 2,793 1,515 901 1,143 3,559May ............................. 105 117 600 822 1,489 828 654 2,971 1,594 945 1,254 3,793June ............................ 110 155 576 841 1,565 940 626 3,131 1,675 1,095 1,202 3,972July ............................. 78 132 609 819 1,429 902 652 2,983 1,507 1,034 1,261 3,802August ........................ 100 152 604 856 1,591 1,033 740 3,364 1,691 1,185 1,344 4,220September .................. 94 137 692 923 1,527 937 631 3,095 1,621 1,074 1,323 4,018October ....................... 103 139 730 972 1,521 1,022 698 3,241 1,624 1,161 1,428 4,213November ................... 109 151 698 958 1,448 863 687 2,998 1,557 1,014 1,385 3,956December ................... 83 132 736 951 1,440 933 644 3,017 1,523 1,065 1,380 3,968Total ........................... 1,183 1,562 7,402 10,147 17,517 10,557 7,634 35,708 18,700 12,119 15,036 45,855
See footnotes at end of table.
Energy Information Administration/Historical Monthly Energy Review 1973-1992 191

Table 5.2 Oil and Gas Wells Drilled, 1973-1992 (Continued)
(Number of Wells)
Exploratory Development Total
Oil Gas Dry Total Oil Gas Dry Total Oil Gas Dry Total
1978January ....................... 81 144 656 881 1,311 937 695 2,943 1,392 1,081 1,351 3,824February ..................... 94 119 547 760 1,076 743 494 2,313 1,170 862 1,041 3,073March .......................... 89 147 641 877 1,363 932 643 2,938 1,452 1,079 1,284 3,815April ............................ 109 161 627 897 1,673 979 685 3,337 1,782 1,140 1,312 4,234May ............................. 119 156 639 914 1,576 1,025 713 3,314 1,695 1,181 1,352 4,228June ............................ 113 152 660 925 1,646 1,092 752 3,490 1,759 1,244 1,412 4,415July ............................. 99 144 700 943 1,454 1,066 714 3,234 1,553 1,210 1,414 4,177August ........................ 96 153 683 932 1,592 1,202 841 3,635 1,688 1,355 1,524 4,567September .................. 98 143 698 939 1,488 1,160 797 3,445 1,586 1,303 1,495 4,384October ....................... 103 191 779 1,073 1,751 1,235 792 3,778 1,854 1,426 1,571 4,851November ................... 99 132 703 934 1,533 1,150 732 3,415 1,632 1,282 1,435 4,349December ................... 91 150 721 962 1,411 1,092 679 3,182 1,502 1,242 1,400 4,144Total ........................... 1,191 1,792 8,054 11,037 17,874 12,613 8,537 39,024 19,065 14,405 16,591 50,061
1979January ....................... 83 130 573 786 1,257 1,204 659 3,120 1,340 1,334 1,232 3,906February ..................... 86 119 478 683 1,065 791 524 2,380 1,151 910 1,002 3,063March .......................... 114 164 532 810 1,255 940 655 2,850 1,369 1,104 1,187 3,660April ............................ 96 151 533 780 1,282 959 572 2,813 1,378 1,110 1,105 3,593May ............................. 79 157 565 801 1,580 1,099 678 3,357 1,659 1,256 1,243 4,158June ............................ 113 181 604 898 1,613 1,154 671 3,438 1,726 1,335 1,275 4,336July ............................. 122 151 615 888 1,728 1,123 656 3,507 1,850 1,274 1,271 4,395August ........................ 103 157 716 976 1,830 1,260 791 3,881 1,933 1,417 1,507 4,857September .................. 129 158 685 972 1,777 1,137 765 3,679 1,906 1,295 1,450 4,651October ....................... 142 217 734 1,093 2,145 1,353 924 4,422 2,287 1,570 1,658 5,515November ................... 131 163 718 1,012 1,866 1,149 820 3,835 1,997 1,312 1,538 4,847December ................... 137 172 725 1,034 1,970 1,081 845 3,896 2,107 1,253 1,570 4,930Total ........................... 1,335 1,920 7,478 10,733 19,368 13,250 8,560 41,178 20,703 15,170 16,038 51,911
1980January ....................... 142 159 718 1,019 2,313 1,390 853 4,556 2,455 1,549 1,571 5,575February ..................... 138 170 610 918 2,011 1,075 686 3,772 2,149 1,245 1,296 4,690March .......................... 143 155 619 917 2,189 1,120 749 4,058 2,332 1,275 1,368 4,975April ............................ 140 173 632 945 2,261 1,104 809 4,174 2,401 1,277 1,441 5,119May ............................. 127 127 677 931 2,404 1,179 926 4,509 2,531 1,306 1,603 5,440June ............................ 140 189 749 1,078 2,637 1,376 970 4,983 2,777 1,565 1,719 6,061July ............................. 135 186 772 1,093 2,745 1,291 1,014 5,050 2,880 1,477 1,786 6,143August ........................ 162 154 846 1,162 2,784 1,383 1,084 5,251 2,946 1,537 1,930 6,413September .................. 168 207 845 1,220 2,738 1,413 1,055 5,206 2,906 1,620 1,900 6,426October ....................... 150 214 840 1,204 2,996 1,406 1,097 5,499 3,146 1,620 1,937 6,703November ................... 150 187 830 1,167 2,682 1,217 1,044 4,943 2,832 1,404 1,874 6,110December ................... 186 173 897 1,256 2,737 1,175 1,015 4,927 2,923 1,348 1,912 6,183Total ........................... 1,781 2,094 9,035 12,910 30,497 15,129 11,302 56,928 32,278 17,223 20,337 69,838
1981January ....................... 220 205 1,007 1,432 3,521 1,768 1,262 6,551 3,741 1,973 2,269 7,983February ..................... 178 184 802 1,164 2,795 1,188 972 4,955 2,973 1,372 1,774 6,119March .......................... 209 193 907 1,309 3,236 1,304 1,166 5,706 3,445 1,497 2,073 R 7,015April ............................ 183 215 909 1,307 3,213 1,334 1,133 5,680 3,396 1,549 2,042 6,987May ............................. 231 225 934 1,390 3,337 1,430 1,262 6,029 3,568 1,655 2,196 7,419June ............................ 220 208 1,009 1,437 3,465 1,457 1,271 6,193 3,685 1,665 2,280 7,630July ............................. 245 205 1,055 1,505 3,529 1,416 1,308 6,253 3,774 1,621 2,363 7,758August ........................ 236 240 1,130 1,606 3,614 1,552 1,400 6,566 3,850 1,792 2,530 8,172September .................. 226 241 1,101 1,568 3,465 1,562 1,302 6,329 3,691 1,803 2,403 7,897October ....................... 239 212 1,168 1,619 3,292 1,609 1,342 6,243 3,531 1,821 2,510 7,862November ................... 225 191 1,104 1,520 3,213 1,371 1,261 5,845 3,438 1,562 2,365 7,365December ................... 255 214 1,171 1,640 3,496 1,383 1,308 6,187 3,751 1,597 2,479 7,827Total ........................... 2,667 2,533 12,297 17,497 40,176 17,374 14,987 72,537 42,843 19,907 27,284 90,034
1982January ....................... 249 219 1,174 1,642 3,665 1,733 1,476 6,874 3,914 1,952 2,650 8,516February ..................... 188 174 945 1,307 2,877 1,424 1,152 5,453 3,065 1,598 2,097 6,760March .......................... 269 223 993 1,485 3,595 1,517 1,337 6,449 3,864 1,740 2,330 7,934April ............................ 231 170 946 1,347 3,350 1,376 1,285 6,011 3,581 1,546 2,231 7,358May ............................. 183 181 889 1,253 3,083 1,420 1,140 5,643 R 3,266 1,601 2,029 R 6,896June ............................ 216 190 890 1,296 2,806 1,381 1,156 5,343 3,022 1,571 2,046 6,639July ............................. 178 191 923 1,292 2,935 1,311 1,293 5,539 3,113 1,502 2,216 6,831August ........................ 203 175 934 1,312 3,057 1,379 1,304 5,740 3,260 1,554 2,238 7,052September .................. 184 163 896 1,243 2,767 1,320 1,213 5,300 2,951 1,483 2,109 6,543October ....................... 205 159 950 1,314 2,821 1,265 1,221 5,307 R 3,026 1,424 2,171 6,621November ................... 178 163 850 1,191 2,779 1,253 1,235 5,267 2,957 1,416 2,085 6,458December ................... 186 160 956 1,302 2,937 1,397 1,224 5,558 3,123 1,557 2,180 6,860Total ........................... 2,470 2,168 11,346 15,984 36,672 16,776 15,036 68,484 R 39,142 18,944 26,382 R 84,468
See footnotes at end of table.
Energy Information Administration/Historical Monthly Energy Review 1973-1992192
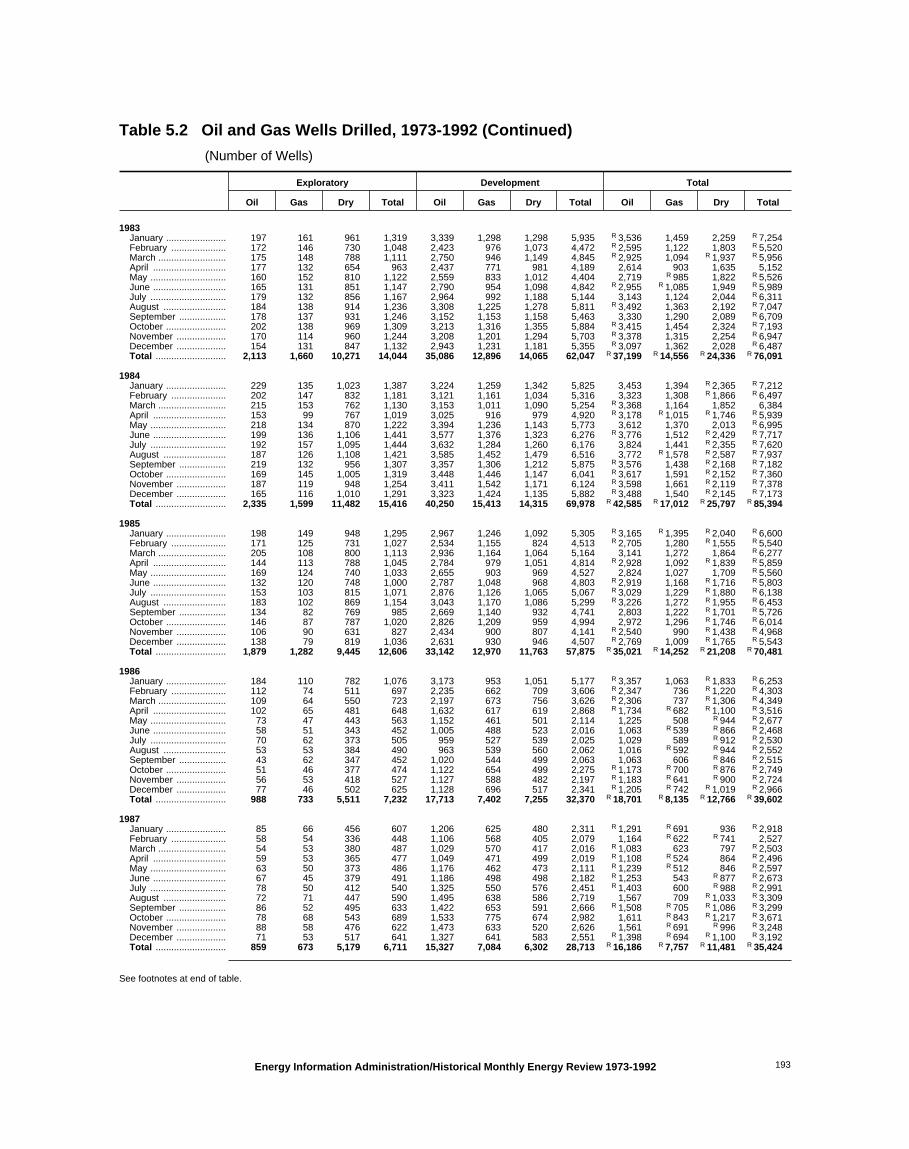
Table 5.2 Oil and Gas Wells Drilled, 1973-1992 (Continued)
(Number of Wells)
Exploratory Development Total
Oil Gas Dry Total Oil Gas Dry Total Oil Gas Dry Total
1983January ....................... 197 161 961 1,319 3,339 1,298 1,298 5,935 R 3,536 1,459 2,259 R 7,254February ..................... 172 146 730 1,048 2,423 976 1,073 4,472 R 2,595 1,122 1,803 R 5,520March .......................... 175 148 788 1,111 2,750 946 1,149 4,845 R 2,925 1,094 R 1,937 R 5,956April ............................ 177 132 654 963 2,437 771 981 4,189 2,614 903 1,635 5,152May ............................. 160 152 810 1,122 2,559 833 1,012 4,404 2,719 R 985 1,822 R 5,526June ............................ 165 131 851 1,147 2,790 954 1,098 4,842 R 2,955 R 1,085 1,949 R 5,989July ............................. 179 132 856 1,167 2,964 992 1,188 5,144 3,143 1,124 2,044 R 6,311August ........................ 184 138 914 1,236 3,308 1,225 1,278 5,811 R 3,492 1,363 2,192 R 7,047September .................. 178 137 931 1,246 3,152 1,153 1,158 5,463 3,330 1,290 2,089 R 6,709October ....................... 202 138 969 1,309 3,213 1,316 1,355 5,884 R 3,415 1,454 2,324 R 7,193November ................... 170 114 960 1,244 3,208 1,201 1,294 5,703 R 3,378 1,315 2,254 R 6,947December ................... 154 131 847 1,132 2,943 1,231 1,181 5,355 R 3,097 1,362 2,028 R 6,487Total ........................... 2,113 1,660 10,271 14,044 35,086 12,896 14,065 62,047 R 37,199 R 14,556 R 24,336 R 76,091
1984January ....................... 229 135 1,023 1,387 3,224 1,259 1,342 5,825 3,453 1,394 R 2,365 R 7,212February ..................... 202 147 832 1,181 3,121 1,161 1,034 5,316 3,323 1,308 R 1,866 R 6,497March .......................... 215 153 762 1,130 3,153 1,011 1,090 5,254 R 3,368 1,164 1,852 6,384April ............................ 153 99 767 1,019 3,025 916 979 4,920 R 3,178 R 1,015 R 1,746 R 5,939May ............................. 218 134 870 1,222 3,394 1,236 1,143 5,773 3,612 1,370 2,013 R 6,995June ............................ 199 136 1,106 1,441 3,577 1,376 1,323 6,276 R 3,776 1,512 R 2,429 R 7,717July ............................. 192 157 1,095 1,444 3,632 1,284 1,260 6,176 3,824 1,441 R 2,355 R 7,620August ........................ 187 126 1,108 1,421 3,585 1,452 1,479 6,516 3,772 R 1,578 R 2,587 R 7,937September .................. 219 132 956 1,307 3,357 1,306 1,212 5,875 R 3,576 1,438 R 2,168 R 7,182October ....................... 169 145 1,005 1,319 3,448 1,446 1,147 6,041 R 3,617 1,591 R 2,152 R 7,360November ................... 187 119 948 1,254 3,411 1,542 1,171 6,124 R 3,598 1,661 R 2,119 R 7,378December ................... 165 116 1,010 1,291 3,323 1,424 1,135 5,882 R 3,488 1,540 R 2,145 R 7,173Total ........................... 2,335 1,599 11,482 15,416 40,250 15,413 14,315 69,978 R 42,585 R 17,012 R 25,797 R 85,394
1985January ....................... 198 149 948 1,295 2,967 1,246 1,092 5,305 R 3,165 R 1,395 R 2,040 R 6,600February ..................... 171 125 731 1,027 2,534 1,155 824 4,513 R 2,705 1,280 R 1,555 R 5,540March .......................... 205 108 800 1,113 2,936 1,164 1,064 5,164 3,141 1,272 1,864 R 6,277April ............................ 144 113 788 1,045 2,784 979 1,051 4,814 R 2,928 1,092 R 1,839 R 5,859May ............................. 169 124 740 1,033 2,655 903 969 4,527 2,824 1,027 1,709 R 5,560June ............................ 132 120 748 1,000 2,787 1,048 968 4,803 R 2,919 1,168 R 1,716 R 5,803July ............................. 153 103 815 1,071 2,876 1,126 1,065 5,067 R 3,029 1,229 R 1,880 R 6,138August ........................ 183 102 869 1,154 3,043 1,170 1,086 5,299 R 3,226 1,272 R 1,955 R 6,453September .................. 134 82 769 985 2,669 1,140 932 4,741 2,803 1,222 R 1,701 R 5,726October ....................... 146 87 787 1,020 2,826 1,209 959 4,994 2,972 1,296 R 1,746 R 6,014November ................... 106 90 631 827 2,434 900 807 4,141 R 2,540 990 R 1,438 R 4,968December ................... 138 79 819 1,036 2,631 930 946 4,507 R 2,769 1,009 R 1,765 R 5,543Total ........................... 1,879 1,282 9,445 12,606 33,142 12,970 11,763 57,875 R 35,021 R 14,252 R 21,208 R 70,481
1986January ....................... 184 110 782 1,076 3,173 953 1,051 5,177 R 3,357 1,063 R 1,833 R 6,253February ..................... 112 74 511 697 2,235 662 709 3,606 R 2,347 736 R 1,220 R 4,303March .......................... 109 64 550 723 2,197 673 756 3,626 R 2,306 737 R 1,306 R 4,349April ............................ 102 65 481 648 1,632 617 619 2,868 R 1,734 R 682 R 1,100 R 3,516May ............................. 73 47 443 563 1,152 461 501 2,114 1,225 508 R 944 R 2,677June ............................ 58 51 343 452 1,005 488 523 2,016 1,063 R 539 R 866 R 2,468July ............................. 70 62 373 505 959 527 539 2,025 1,029 589 R 912 R 2,530August ........................ 53 53 384 490 963 539 560 2,062 1,016 R 592 R 944 R 2,552September .................. 43 62 347 452 1,020 544 499 2,063 1,063 606 R 846 R 2,515October ....................... 51 46 377 474 1,122 654 499 2,275 R 1,173 R 700 R 876 R 2,749November ................... 56 53 418 527 1,127 588 482 2,197 R 1,183 R 641 R 900 R 2,724December ................... 77 46 502 625 1,128 696 517 2,341 R 1,205 R 742 R 1,019 R 2,966Total ........................... 988 733 5,511 7,232 17,713 7,402 7,255 32,370 R 18,701 R 8,135 R 12,766 R 39,602
1987January ....................... 85 66 456 607 1,206 625 480 2,311 R 1,291 R 691 936 R 2,918February ..................... 58 54 336 448 1,106 568 405 2,079 1,164 R 622 R 741 2,527March .......................... 54 53 380 487 1,029 570 417 2,016 R 1,083 623 797 R 2,503April ............................ 59 53 365 477 1,049 471 499 2,019 R 1,108 R 524 864 R 2,496May ............................. 63 50 373 486 1,176 462 473 2,111 R 1,239 R 512 846 R 2,597June ............................ 67 45 379 491 1,186 498 498 2,182 R 1,253 543 R 877 R 2,673July ............................. 78 50 412 540 1,325 550 576 2,451 R 1,403 600 R 988 R 2,991August ........................ 72 71 447 590 1,495 638 586 2,719 1,567 709 R 1,033 R 3,309September .................. 86 52 495 633 1,422 653 591 2,666 R 1,508 R 705 R 1,086 R 3,299October ....................... 78 68 543 689 1,533 775 674 2,982 1,611 R 843 R 1,217 R 3,671November ................... 88 58 476 622 1,473 633 520 2,626 1,561 R 691 R 996 R 3,248December ................... 71 53 517 641 1,327 641 583 2,551 R 1,398 R 694 R 1,100 R 3,192Total ........................... 859 673 5,179 6,711 15,327 7,084 6,302 28,713 R 16,186 R 7,757 R 11,481 R 35,424
See footnotes at end of table.
Energy Information Administration/Historical Monthly Energy Review 1973-1992 193

Table 5.2 Oil and Gas Wells Drilled, 1973-1992 (Continued)
(Number of Wells)
Exploratory Development Total
Oil Gas Dry Total Oil Gas Dry Total Oil Gas Dry Total
1988January ....................... 76 50 401 527 1,257 612 527 2,396 R 1,333 662 R 928 R 2,923February ..................... 70 47 364 481 1,197 603 428 2,228 1,267 R 650 R 792 2,709March .......................... 66 46 377 489 1,246 590 445 2,281 R 1,312 R 636 822 R 2,770April ............................ 89 57 382 528 1,132 480 447 2,059 R 1,221 R 537 R 829 R 2,587May ............................. 55 57 388 500 1,201 507 497 2,205 R 1,256 R 564 R 885 R 2,705June ............................ 72 54 382 508 1,162 573 503 2,238 R 1,234 627 R 885 R 2,746July ............................. 62 62 399 523 998 553 467 2,018 R 1,060 615 R 866 2,541August ........................ 52 51 417 520 1,004 650 468 2,122 1,056 R 701 R 885 R 2,642September .................. 76 44 369 489 892 758 463 2,113 968 R 802 R 832 R 2,602October ....................... 70 72 478 620 915 753 494 2,162 R 985 825 R 972 2,782November ................... 49 61 394 504 763 723 360 1,846 R 812 R 784 R 754 2,350December ................... 55 62 415 532 763 773 377 1,913 818 835 R 792 2,445Total ........................... 792 663 4,766 6,221 12,530 7,575 5,476 25,581 R 13,322 R 8,238 R 10,242 R 31,802
1989January ....................... 45 66 327 438 781 715 336 1,832 826 781 663 2,270February ..................... 44 52 240 336 561 597 248 1,406 605 649 488 1,742March .......................... 49 44 315 408 657 621 334 1,612 706 665 649 2,020April ............................ 54 54 288 396 836 559 385 1,780 890 613 673 2,176May ............................. 40 46 328 414 853 602 359 1,814 893 648 687 2,228June ............................ 42 52 339 433 796 680 380 1,856 838 732 719 2,289July ............................. 45 53 321 419 832 738 403 1,973 877 791 724 2,392August ........................ 52 59 333 444 941 817 414 2,172 993 876 747 2,616September .................. 70 56 356 482 787 798 402 1,987 857 854 758 2,469October ....................... 41 44 404 489 912 833 446 2,191 953 877 850 2,680November ................... 47 65 378 490 906 801 385 2,092 953 866 763 2,582December ................... 51 63 372 486 897 810 398 2,105 948 873 770 2,591Total ........................... 580 654 4,001 5,235 9,759 8,571 4,490 22,820 10,339 9,225 8,491 28,055
1990January ....................... 51 54 376 481 959 838 365 2,162 1,010 892 741 2,643February ..................... 35 41 242 318 818 673 313 1,804 853 714 555 2,122March .......................... 43 51 258 352 813 673 328 1,814 856 724 586 2,166April ............................ 51 49 293 393 808 626 315 1,749 859 675 608 2,142May ............................. 45 39 258 342 834 761 380 1,975 879 800 638 2,317June ............................ 57 51 313 421 863 845 397 2,105 920 896 710 2,526July ............................. 56 59 352 467 903 895 393 2,191 959 954 745 2,658August ........................ 69 59 298 426 1,058 959 491 2,508 1,127 1,018 789 2,934September .................. 50 36 317 403 1,012 948 435 2,395 1,062 984 752 2,798October ....................... 62 60 370 492 1,198 1,018 482 2,698 1,260 1,078 852 3,190November ................... 45 35 357 437 1,127 761 513 2,401 1,172 796 870 2,838December ................... 53 51 348 452 1,140 858 420 2,418 1,193 909 768 2,870Total ........................... 617 585 3,782 4,984 11,533 9,855 4,832 26,220 12,150 10,440 8,614 31,204
1991January ....................... 56 46 247 349 1,166 834 352 2,352 1,222 880 599 2,701February ..................... 47 47 271 365 1,173 681 382 2,236 1,220 728 653 2,601March .......................... 53 32 267 352 1,098 753 379 2,230 1,151 785 646 2,582April ............................ 55 36 279 370 1,063 715 392 2,170 1,118 751 671 2,540May ............................. 39 34 263 336 996 692 387 2,075 1,035 726 650 2,411June ............................ 51 42 251 344 878 727 365 1,970 929 769 616 2,314July ............................. 56 36 301 393 903 775 401 2,079 959 811 702 2,472August ........................ 48 37 309 394 921 755 357 2,033 969 792 666 2,427September .................. 40 30 255 325 815 716 374 1,905 855 746 629 2,230October ....................... 32 46 286 364 911 766 413 2,090 943 812 699 2,454November ................... 25 35 302 362 725 571 357 1,653 750 606 659 2,015December ................... 43 43 272 358 714 717 368 1,799 757 760 640 2,157Total ........................... 545 464 3,303 4,312 11,363 8,702 4,527 24,592 11,908 9,166 7,830 28,904
1992January ....................... 46 33 218 297 741 587 321 1,649 787 620 539 1,946February ..................... 34 30 167 231 590 564 277 1,431 624 594 444 1,662March .......................... 38 31 205 274 721 481 319 1,521 759 512 524 1,795April ............................ 32 22 233 287 665 420 297 1,382 697 442 530 1,669May ............................. 35 23 225 283 636 469 374 1,479 671 492 599 1,762June ............................ 41 32 209 282 626 484 331 1,441 667 516 540 1,723July ............................. 43 30 256 329 664 543 312 1,519 707 573 568 1,848August ........................ 42 33 241 316 617 599 357 1,573 659 632 598 1,889September .................. 38 22 222 282 783 660 339 1,782 821 682 561 2,064October ....................... 30 34 205 269 748 949 358 2,055 778 983 563 2,324November ................... 38 33 165 236 690 890 331 1,911 728 923 496 2,147December ................... 29 33 225 287 757 973 391 2,121 786 1,006 616 2,408Total ........................... 446 356 2,571 3,373 8,238 7,619 4,007 19,864 8,684 7,975 6,578 23,237
R=Revised data. Notes: • The data in this table are frequently revised; those shown here
correspond to the data in the July 1994 Monthly Energy Review. See Notesat end of section. • Service wells, stratigraphic tests, and core tests are
excluded. • Geographic coverage is the 50 States and the District ofColumbia.
Source: See end of section.
Energy Information Administration/Historical Monthly Energy Review 1973-1992194

Oil and Gas Resource DevelopmentNotes and Sources
Notes:Three well types are considered in the HistoricalMonthly Energy Review (HMER) drilling statistics:"completed for oil," "completed for gas," and "dry hole."Wells that productively encounter both crude oil andnatural gas are categorized as "completed for oil." Bothdevelopment wells and exploratory wells (new fieldwildcats, new pool tests, and extension tests) are in-cluded in the statistics. All other classes of wells drilledin connection with the search for producible hydrocar-bons are excluded.
Prior to the March 1985 Monthly Energy Review (MER),drilling statistics consisted of completion data for theabove types and classes of wells as reported to theAmerican Petroleum Institute (API) during a givenmonth. Due to time lags between the date of wellcompletion and the date of completion reporting to theAPI, as-reported well completions proved to be aninaccurate indicator of drilling activity. During 1982,for example, as-reported well completions rose, whilethe number of actual completions fell. Consequently,the drilling statistics published since the March 1985MER are Energy Information Administration-generated(EIA) estimates produced by statistically imputing wellcounts and footage based on the partial data availablefrom the API.
Estimates for a given month are first published in theMER for that month. Revisions of the "oil," "gas," and"dry" components are made in the 6th, 12th, and 24thsubsequent months, as newly reported data allow
refinement of the estimates. Unscheduled revisionsmay also occur when the latest estimate differs by morethan 15 percent during the first 5 months, more than 10percent during the next 6 months, or more than 2 per-cent thereafter through 5 years. After 5 years, the re-ported API data are published in lieu of EIA-generatedestimates. Additional information about the EIA esti-mation methodology may be found in "Estimating WellCompletions," the feature article published in the March1985 MER.
Sources:
Table 5.1
• Crews Engaged in Seismic Exploration: Society ofExploration Geophysicists, Tulsa, Oklahoma, MonthlySeismic Crew Count, and annual reports in Geophysics:The Leading Edge of Exploration.
• Rotary Rigs in Operation: Baker Hughes Inc., Hous-ton, Texas, Rotary Rigs Running—by State.
• Total Footage Drilled: EIA computations, which arebased on well reports submitted to the American Petro-leum Institute by the Petroleum Information Corpora-tion, Denver, Colorado.
• Active Well Servicing Units: American Associationof Oilwell Servicing Contractors, Dallas, Texas, WellServicing.
Table 5.2• EIA computations, which are based on well reportssubmitted to the American Petroleum Institute by thePetroleum Information Corporation, Denver, Colorado.
Energy Information Administration/Historical Monthly Energy Review 1973-1992 195

Section 6Coal
A shield longwall roof support protects miners underground in the southern Illinois coal basin.
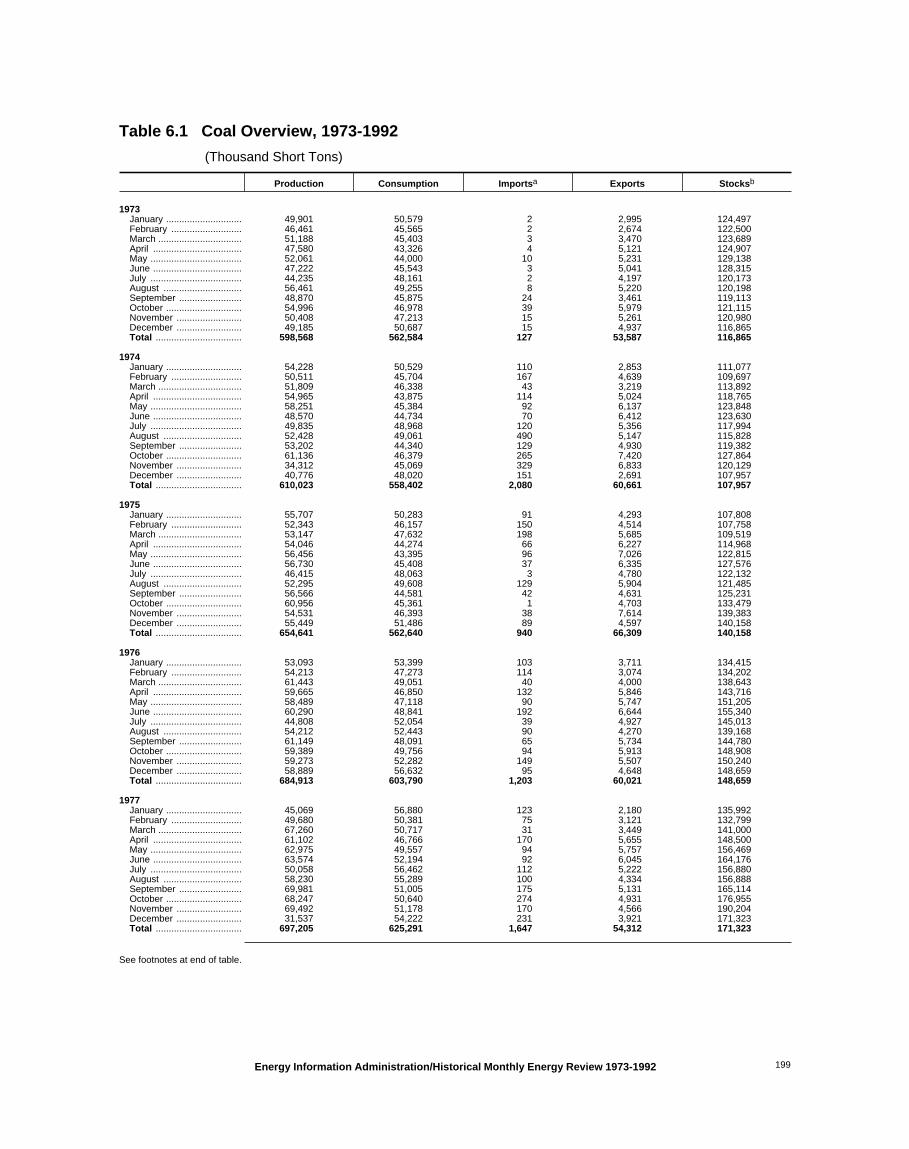
Table 6.1 Coal Overview, 1973-1992
(Thousand Short Tons)
Production Consumption Importsa Exports Stocksb
1973January ............................. 49,901 50,579 2 2,995 124,497February ........................... 46,461 45,565 2 2,674 122,500March ................................ 51,188 45,403 3 3,470 123,689April .................................. 47,580 43,326 4 5,121 124,907May ................................... 52,061 44,000 10 5,231 129,138June .................................. 47,222 45,543 3 5,041 128,315July ................................... 44,235 48,161 2 4,197 120,173August .............................. 56,461 49,255 8 5,220 120,198September ........................ 48,870 45,875 24 3,461 119,113October ............................. 54,996 46,978 39 5,979 121,115November ......................... 50,408 47,213 15 5,261 120,980December ......................... 49,185 50,687 15 4,937 116,865Total ................................. 598,568 562,584 127 53,587 116,865
1974January ............................. 54,228 50,529 110 2,853 111,077February ........................... 50,511 45,704 167 4,639 109,697March ................................ 51,809 46,338 43 3,219 113,892April .................................. 54,965 43,875 114 5,024 118,765May ................................... 58,251 45,384 92 6,137 123,848June .................................. 48,570 44,734 70 6,412 123,630July ................................... 49,835 48,968 120 5,356 117,994August .............................. 52,428 49,061 490 5,147 115,828September ........................ 53,202 44,340 129 4,930 119,382October ............................. 61,136 46,379 265 7,420 127,864November ......................... 34,312 45,069 329 6,833 120,129December ......................... 40,776 48,020 151 2,691 107,957Total ................................. 610,023 558,402 2,080 60,661 107,957
1975January ............................. 55,707 50,283 91 4,293 107,808February ........................... 52,343 46,157 150 4,514 107,758March ................................ 53,147 47,632 198 5,685 109,519April .................................. 54,046 44,274 66 6,227 114,968May ................................... 56,456 43,395 96 7,026 122,815June .................................. 56,730 45,408 37 6,335 127,576July ................................... 46,415 48,063 3 4,780 122,132August .............................. 52,295 49,608 129 5,904 121,485September ........................ 56,566 44,581 42 4,631 125,231October ............................. 60,956 45,361 1 4,703 133,479November ......................... 54,531 46,393 38 7,614 139,383December ......................... 55,449 51,486 89 4,597 140,158Total ................................. 654,641 562,640 940 66,309 140,158
1976January ............................. 53,093 53,399 103 3,711 134,415February ........................... 54,213 47,273 114 3,074 134,202March ................................ 61,443 49,051 40 4,000 138,643April .................................. 59,665 46,850 132 5,846 143,716May ................................... 58,489 47,118 90 5,747 151,205June .................................. 60,290 48,841 192 6,644 155,340July ................................... 44,808 52,054 39 4,927 145,013August .............................. 54,212 52,443 90 4,270 139,168September ........................ 61,149 48,091 65 5,734 144,780October ............................. 59,389 49,756 94 5,913 148,908November ......................... 59,273 52,282 149 5,507 150,240December ......................... 58,889 56,632 95 4,648 148,659Total ................................. 684,913 603,790 1,203 60,021 148,659
1977January ............................. 45,069 56,880 123 2,180 135,992February ........................... 49,680 50,381 75 3,121 132,799March ................................ 67,260 50,717 31 3,449 141,000April .................................. 61,102 46,766 170 5,655 148,500May ................................... 62,975 49,557 94 5,757 156,469June .................................. 63,574 52,194 92 6,045 164,176July ................................... 50,058 56,462 112 5,222 156,880August .............................. 58,230 55,289 100 4,334 156,888September ........................ 69,981 51,005 175 5,131 165,114October ............................. 68,247 50,640 274 4,931 176,955November ......................... 69,492 51,178 170 4,566 190,204December ......................... 31,537 54,222 231 3,921 171,323Total ................................. 697,205 625,291 1,647 54,312 171,323
See footnotes at end of table.
Energy Information Administration/Historical Monthly Energy Review 1973-1992 199

Table 6.1 Coal Overview, 1973-1992 (Continued)
(Thousand Short Tons)
Production Consumption Importsa Exports Stocksb
1978January ............................. 23,664 54,313 139 896 137,200February ........................... 24,198 45,488 159 589 112,361March ................................ 40,001 43,288 231 378 103,246April .................................. 61,011 46,284 417 2,615 116,760May ................................... 70,417 49,416 323 4,476 131,451June .................................. 67,111 52,795 291 5,433 144,154July ................................... 54,856 56,200 313 3,576 141,326August .............................. 65,813 58,056 227 3,636 144,881September ........................ 59,190 55,024 196 3,456 148,484October ............................. 71,681 53,003 371 5,055 156,895November ......................... 71,156 53,155 98 6,030 166,971December ......................... 61,066 58,203 188 4,574 166,246Total ................................. 670,164 625,225 2,953 40,714 166,246
1979January ............................. 57,794 61,199 186 3,607 157,130February ........................... 54,810 54,463 252 2,728 149,758March ................................ 66,775 54,864 123 4,644 154,771April .................................. 63,937 51,601 161 5,271 163,066May ................................... 69,488 54,026 112 6,217 172,018June .................................. 70,698 56,025 209 5,978 176,166July ................................... 53,595 60,397 88 6,300 169,036August .............................. 71,616 R 60,750 320 6,249 173,569September ........................ 64,590 R 54,219 180 5,147 178,809October ............................. 78,563 55,719 152 7,448 190,437November ......................... 68,506 55,997 130 6,173 198,537December ......................... 60,762 61,263 146 6,280 202,472Total ................................. 781,134 680,524 2,059 66,042 202,472
1980January ............................. 69,594 63,519 121 4,460 201,838February ........................... 65,546 59,678 193 4,041 200,757March ................................ 70,953 58,852 93 5,633 202,160April .................................. 69,658 52,635 63 7,563 211,092May ................................... 71,043 52,834 207 8,597 219,859June .................................. 71,338 56,098 104 8,899 225,451July ................................... 61,285 63,122 32 8,247 213,480August .............................. 68,399 62,752 166 9,270 215,672September ........................ 68,822 57,306 2 8,364 218,846October ............................. 72,290 55,775 139 9,454 226,367November ......................... 68,655 56,799 3 8,986 228,821December ......................... 72,117 63,359 70 8,228 228,407Total ................................. 829,700 R 702,730 1,194 91,742 228,407
1981January ............................. 65,927 67,580 35 5,795 223,483February ........................... 70,918 59,735 104 6,771 222,273March ................................ 78,266 60,069 77 9,710 232,199April .................................. 36,253 54,649 63 8,271 210,392May ................................... 38,100 55,025 97 6,086 190,883June .................................. 61,555 59,685 138 6,158 180,539July ................................... 74,076 67,394 13 10,763 177,163August .............................. 78,782 65,896 150 11,315 180,358September ........................ 81,720 59,721 69 11,900 188,387October ............................. 85,241 59,161 94 12,360 199,230November ......................... 76,577 58,695 76 11,849 207,042December ......................... 76,360 65,017 127 11,564 209,423Total ................................. 823,775 R 732,627 1,043 112,541 209,423
1982January ............................. 67,138 68,692 71 6,177 201,029February ........................... 71,169 59,746 30 8,965 203,240March ................................ 83,943 58,236 12 10,423 212,479April .................................. 73,587 53,274 10 10,831 220,747May ................................... 71,127 54,844 109 10,110 229,080June .................................. 71,720 55,949 9 10,680 235,252July ................................... 60,535 63,828 69 9,182 228,255August .............................. 72,898 63,528 131 7,385 229,282September ........................ 67,951 56,734 71 8,683 229,645October ............................. 70,852 55,034 66 9,972 233,826November ......................... 64,055 56,831 87 7,807 234,452December ......................... 63,136 60,214 76 6,064 R 232,038Total ................................. R 838,112 R 706,911 742 106,277 R 232,038
See footnotes at end of table.
Energy Information Administration/Historical Monthly Energy Review 1973-1992200

Table 6.1 Coal Overview, 1973-1992 (Continued)
(Thousand Short Tons)
Production Consumption Importsa Exports Stocksb
1983January ............................. 62,731 63,018 78 4,471 229,713February ........................... 60,654 54,692 71 4,382 230,413March ................................ 68,896 55,434 120 6,291 232,182April .................................. 61,837 52,816 144 6,115 232,567May ................................... 63,209 54,328 102 6,952 235,445June .................................. 61,797 58,237 133 7,279 234,794July ................................... 55,213 69,478 87 6,140 218,145August .............................. 73,291 72,947 115 8,380 211,153September ........................ 70,312 63,316 97 7,525 208,993October ............................. 71,754 60,454 190 8,131 213,975November ......................... 68,684 61,411 32 5,838 213,650December ......................... 63,713 70,540 102 6,269 R 202,584Total ................................. 782,091 R 736,672 1,271 77,772 R 202,584
1984January ............................. 67,921 R 71,920 81 5,062 196,985February ........................... 73,670 R 62,995 140 4,251 203,771March ................................ 81,524 65,028 55 5,813 208,548April .................................. 72,751 58,945 148 7,688 R 215,025May ................................... 81,073 R 60,165 72 8,221 R 223,263June .................................. 76,402 66,707 49 7,828 R 224,905July ................................... 74,785 R 70,422 193 8,318 R 223,119August .............................. 90,823 R 73,557 147 8,235 230,224September ........................ 78,984 64,133 95 8,710 237,720October ............................. 69,785 R 64,665 104 6,641 R 238,349November ......................... 64,388 64,613 68 4,190 234,702December ......................... 63,815 R 68,146 134 6,526 231,300Total ................................. 895,921 R 791,296 1,286 81,483 231,300
1985January ............................. 68,261 74,849 126 5,817 218,131February ........................... 67,233 65,777 101 6,030 212,035March ................................ 77,744 64,857 103 6,696 214,825April .................................. 76,541 61,753 203 7,065 220,230May ................................... 78,382 64,797 159 9,231 222,798June .................................. 73,237 66,978 138 7,913 223,210July ................................... 69,228 74,162 177 7,314 213,601August .............................. 79,622 73,102 264 10,422 209,555September ........................ 73,977 66,673 182 8,095 208,827October ............................. 80,158 65,033 128 8,744 212,920November ......................... 69,268 64,866 111 8,134 210,656December ......................... 69,989 75,201 260 7,220 203,367Total ................................. 883,638 818,049 1,952 92,680 203,367
1986January ............................. 78,106 R 75,873 154 5,935 200,074February ........................... 72,489 R 65,823 209 5,158 200,159March ................................ 77,379 R 64,538 122 6,152 204,422April .................................. 74,680 58,921 214 8,302 211,500May ................................... 72,907 61,559 172 8,545 215,508June .................................. 72,413 68,193 190 7,323 214,166July ................................... 67,597 76,787 178 7,780 199,556August .............................. 76,293 70,590 171 7,718 197,412September ........................ 74,791 65,293 188 8,189 198,689October ............................. 79,891 63,179 110 7,205 203,538November ......................... 70,189 63,682 319 6,676 206,834December ......................... 73,580 69,792 185 6,536 207,319Total ................................. 890,315 R 804,231 2,212 85,518 207,319
1987January ............................. 74,681 72,648 134 5,471 203,432February ........................... 71,662 63,091 85 4,643 205,551March ................................ 75,857 63,784 111 6,462 209,733April .................................. 71,044 61,472 229 6,229 212,699May ................................... 70,707 65,950 135 6,557 212,788June .................................. 77,072 72,204 118 7,328 209,976July ................................... 69,774 80,479 120 6,611 195,431August .............................. 80,707 79,935 191 7,758 189,919September ........................ 82,477 68,984 164 6,665 194,373October ............................. 85,992 67,299 86 6,633 203,544November ......................... 79,242 66,634 263 7,210 211,067December ......................... 79,549 74,462 109 8,042 213,780Total ................................. 918,762 836,941 1,747 79,607 213,780
See footnotes at end of table.
Energy Information Administration/Historical Monthly Energy Review 1973-1992 201

Table 6.1 Coal Overview, 1973-1992 (Continued)
(Thousand Short Tons)
Production Consumption Importsa Exports Stocksb
1988January ............................. 75,585 78,967 159 4,434 208,697February ........................... 77,054 72,166 162 4,482 207,712March ................................ 84,251 69,654 221 7,145 212,044April .................................. 75,623 R 64,152 107 8,943 214,768May ................................... 74,284 R 66,507 224 7,905 214,923June .................................. 76,738 R 75,076 257 8,053 209,386July ................................... 69,451 81,994 203 8,303 194,636August .............................. 88,576 R 85,301 205 9,322 186,020September ........................ 83,596 R 71,377 29 10,066 185,691October ............................. 81,241 R 70,248 229 9,010 189,812November ......................... 83,284 R 70,008 207 8,338 192,518December ......................... 80,584 R 78,191 131 9,023 188,831Total ................................. 950,265 R 883,642 2,134 95,023 188,831
1989January ............................. 82,331 77,511 66 6,306 185,952February ........................... 75,414 73,273 131 6,748 181,866March ................................ 89,421 72,701 334 8,375 184,630April .................................. 77,456 66,306 158 9,104 188,578May ................................... 82,776 68,391 312 9,685 193,282June .................................. 78,795 73,327 218 9,657 189,507July ................................... 66,601 79,558 375 6,209 175,341August .............................. 91,349 80,112 247 8,122 174,372September ........................ 85,115 72,356 303 9,661 176,013October ............................. 89,873 71,140 160 9,293 182,271November ......................... 87,236 71,598 245 9,768 186,815December ......................... 74,363 83,425 303 7,888 175,087Total ................................. 980,729 889,699 2,851 100,815 175,087
1990January ............................. 90,561 77,143 175 7,447 179,459February ........................... 82,021 68,461 268 6,243 186,448March ................................ 91,602 71,410 292 8,693 195,842April .................................. 83,167 67,721 182 8,590 203,424May ................................... 86,519 68,992 144 9,827 210,094June .................................. 84,592 74,953 348 9,316 209,956July ................................... 79,798 81,280 200 9,194 200,970August .............................. 91,842 82,954 120 10,065 197,284September ........................ 83,120 76,587 194 10,238 195,298October ............................. 93,424 74,966 284 8,756 201,683November ......................... 86,763 71,727 224 9,621 206,348December ......................... 75,666 79,285 268 7,813 201,629Total ................................. 1,029,076 895,480 2,699 105,804 201,629
1991January ............................. 86,261 81,738 263 6,214 199,927February ........................... 83,036 68,282 429 8,127 206,312March ................................ 85,450 69,188 246 7,977 213,647April .................................. 79,633 64,184 198 6,917 218,443May ................................... 80,190 69,981 248 10,018 219,221June .................................. 77,182 74,592 284 9,278 214,716July ................................... 80,151 81,221 348 10,099 204,378August .............................. 89,321 81,196 248 10,541 199,237September ........................ 81,966 73,676 387 10,557 197,488October ............................. 90,821 72,018 214 9,244 202,136November ......................... 82,194 74,239 298 10,602 201,670December ......................... 79,779 77,305 225 9,393 200,682Total ................................. 995,984 887,621 3,390 108,969 200,682
1992January ............................. 87,948 78,162 272 8,590 200,325February ........................... 82,139 69,837 213 7,759 204,716March ................................ 85,869 72,595 193 8,383 208,485April .................................. 82,449 67,802 239 8,616 211,429May ................................... 80,250 69,430 339 9,483 214,714June .................................. 80,036 72,804 466 8,911 213,783July ................................... 80,862 83,074 362 9,572 202,271August .............................. 84,537 79,736 197 7,605 198,710September ........................ 83,657 74,888 323 9,304 197,076October ............................. 86,364 72,405 471 7,443 200,971November ......................... 80,335 72,329 377 8,718 201,683December ......................... 83,100 79,359 351 8,134 197,685Total ................................. 997,545 892,421 3,803 102,516 197,685
a Includes Puerto Rico.b Stocks held by electric utilities, coke plants, general industry, and coal
producers and distributors at end of period. Excludes stocks held at retaildealers for consumption by the residential and commercial sector.
R=Revised data.
Notes: • For methodology used to calculate production, consumption, andstocks, see Notes 1, 2, and 3 at end of section. • Totals may not equal sumof components due to independent rounding. • Geographic coverage is the50 States and the District of Columbia.
Sources: See end of section.
Energy Information Administration/Historical Monthly Energy Review 1973-1992202

Table 6.2 Coal Consumption by End-Use Sector, 1973-1992
(Thousand Short Tons)
Residentialand
Commercial
Industrial
ElectricUtilities Total
CokePlants
Other IndustrialIncluding
Transportation
1973January ............................. 1,408 7,865 6,749 34,557 50,579February ........................... 1,206 7,220 6,242 30,897 45,565March ................................ 947 7,992 5,739 30,725 45,403April .................................. 620 7,763 5,773 29,170 43,326May ................................... 629 8,086 5,656 29,629 44,000June .................................. 631 7,815 5,195 31,902 45,543July ................................... 623 8,000 4,717 34,821 48,161August .............................. 673 7,932 4,605 36,045 49,255September ........................ 907 7,639 4,536 32,793 45,875October ............................. 1,057 7,921 5,557 32,443 46,978November ......................... 1,170 7,779 6,131 32,133 47,213December ......................... 1,246 8,089 7,254 34,098 50,687Total ................................. 11,117 94,101 68,154 389,212 562,584
1974January ............................. 1,534 8,018 6,430 34,547 50,529February ........................... 1,309 7,343 6,237 30,815 45,704March ................................ 1,049 7,699 5,996 31,594 46,338April .................................. 725 7,807 5,696 29,647 43,875May ................................... 625 7,941 5,142 31,676 45,384June .................................. 597 7,716 4,721 31,700 44,734July ................................... 555 7,804 4,520 36,089 48,968August .............................. 784 7,757 4,989 35,531 49,061September ........................ 959 7,568 4,855 30,958 44,340October ............................. 1,054 7,747 5,544 32,034 46,379November ......................... 1,041 6,616 5,292 32,120 45,069December ......................... 1,185 6,175 5,561 35,099 48,020Total ................................. 11,417 90,191 64,983 391,811 558,402
1975January ............................. 1,312 7,333 5,805 35,833 50,283February ........................... 857 R 7,060 R 6,149 32,091 46,157March ................................ 833 R 7,911 R 6,099 32,789 47,632April .................................. 553 7,454 5,724 30,543 44,274May ................................... 443 R 7,307 R 5,074 30,571 43,395June .................................. 485 7,022 4,450 33,451 45,408July ................................... 594 R 6,664 R 4,245 36,560 48,063August .............................. 554 6,590 4,502 37,962 49,608September ........................ 758 6,313 4,907 32,603 44,581October ............................. 865 6,688 4,960 32,848 45,361November ......................... 908 6,512 5,646 33,327 46,393December ......................... 1,248 6,744 6,109 37,385 51,486Total ................................. 9,410 83,598 63,670 405,962 562,640
1976January ............................. 1,144 6,760 5,514 39,981 53,399February ........................... 709 6,633 4,972 34,959 47,273March ................................ 649 7,296 5,013 36,093 49,051April .................................. 748 R 7,111 R 5,190 33,801 46,850May ................................... 584 7,427 5,167 33,940 47,118June .................................. 523 7,186 4,756 36,376 48,841July ................................... 402 7,300 4,517 39,835 52,054August .............................. 535 7,070 4,514 40,324 52,443September ........................ 598 6,940 4,663 35,890 48,091October ............................. 771 7,072 5,139 36,774 49,756November ......................... 903 6,934 5,615 38,830 52,282December ......................... 1,350 6,975 6,739 41,568 56,632Total ................................. 8,916 84,704 61,799 448,371 603,790
1977January ............................. 1,230 6,422 5,978 43,250 56,880February ........................... 826 6,273 5,622 37,660 50,381March ................................ 727 7,076 5,676 37,238 50,717April .................................. 751 6,827 5,149 34,039 46,766May ................................... 585 7,024 4,797 37,151 49,557June .................................. 606 6,841 R 4,608 40,139 52,194July ................................... 456 6,706 4,338 44,962 56,462August .............................. 566 6,180 R 4,385 44,158 55,289September ........................ 534 5,886 4,430 40,155 51,005October ............................. 686 6,346 5,241 38,367 50,640November ......................... 917 6,061 5,491 38,709 51,178December ......................... 1,070 6,097 5,757 41,298 54,222Total ................................. 8,954 77,739 61,472 477,126 625,291
See footnotes at end of table.
Energy Information Administration/Historical Monthly Energy Review 1973-1992 203
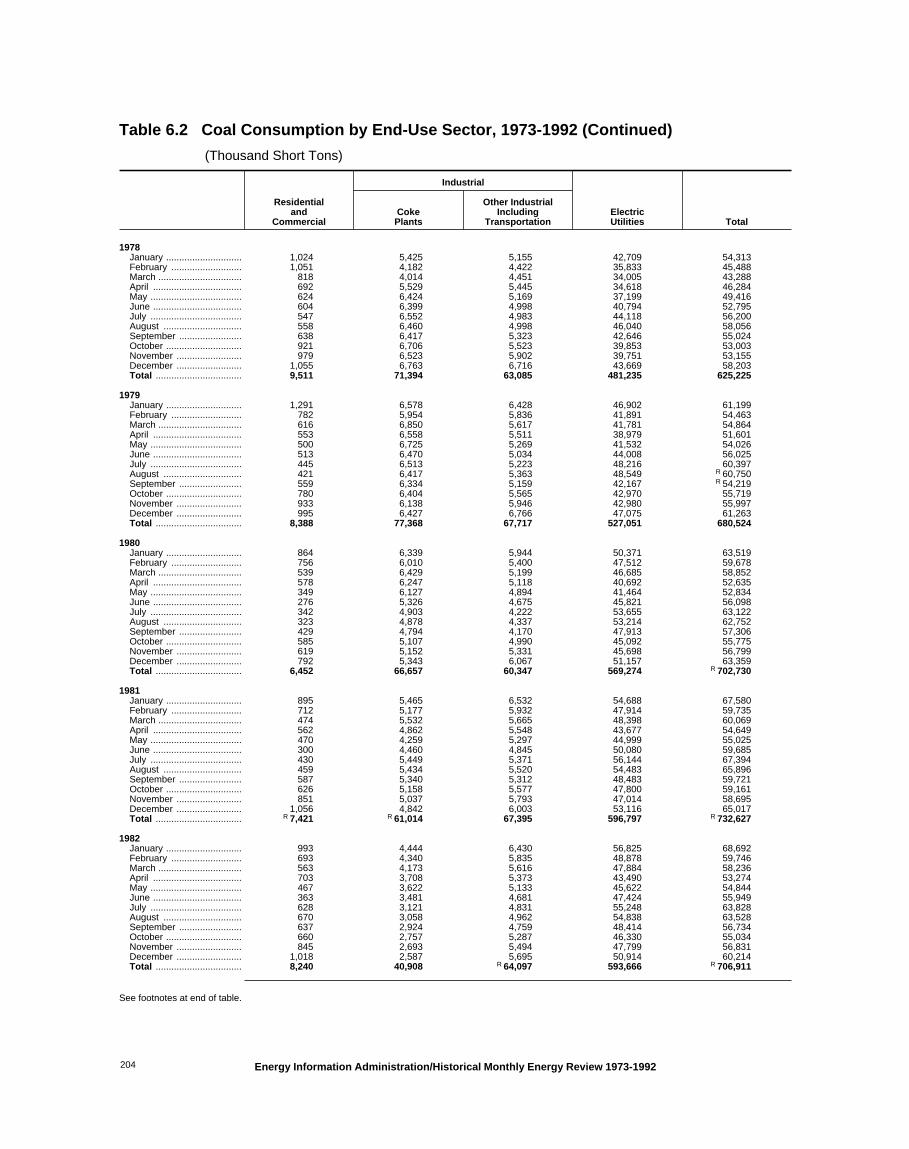
Table 6.2 Coal Consumption by End-Use Sector, 1973-1992 (Continued)
(Thousand Short Tons)
Residentialand
Commercial
Industrial
ElectricUtilities Total
CokePlants
Other IndustrialIncluding
Transportation
1978January ............................. 1,024 5,425 5,155 42,709 54,313February ........................... 1,051 4,182 4,422 35,833 45,488March ................................ 818 4,014 4,451 34,005 43,288April .................................. 692 5,529 5,445 34,618 46,284May ................................... 624 6,424 5,169 37,199 49,416June .................................. 604 6,399 4,998 40,794 52,795July ................................... 547 6,552 4,983 44,118 56,200August .............................. 558 6,460 4,998 46,040 58,056September ........................ 638 6,417 5,323 42,646 55,024October ............................. 921 6,706 5,523 39,853 53,003November ......................... 979 6,523 5,902 39,751 53,155December ......................... 1,055 6,763 6,716 43,669 58,203Total ................................. 9,511 71,394 63,085 481,235 625,225
1979January ............................. 1,291 6,578 6,428 46,902 61,199February ........................... 782 5,954 5,836 41,891 54,463March ................................ 616 6,850 5,617 41,781 54,864April .................................. 553 6,558 5,511 38,979 51,601May ................................... 500 6,725 5,269 41,532 54,026June .................................. 513 6,470 5,034 44,008 56,025July ................................... 445 6,513 5,223 48,216 60,397August .............................. 421 6,417 5,363 48,549 R 60,750September ........................ 559 6,334 5,159 42,167 R 54,219October ............................. 780 6,404 5,565 42,970 55,719November ......................... 933 6,138 5,946 42,980 55,997December ......................... 995 6,427 6,766 47,075 61,263Total ................................. 8,388 77,368 67,717 527,051 680,524
1980January ............................. 864 6,339 5,944 50,371 63,519February ........................... 756 6,010 5,400 47,512 59,678March ................................ 539 6,429 5,199 46,685 58,852April .................................. 578 6,247 5,118 40,692 52,635May ................................... 349 6,127 4,894 41,464 52,834June .................................. 276 5,326 4,675 45,821 56,098July ................................... 342 4,903 4,222 53,655 63,122August .............................. 323 4,878 4,337 53,214 62,752September ........................ 429 4,794 4,170 47,913 57,306October ............................. 585 5,107 4,990 45,092 55,775November ......................... 619 5,152 5,331 45,698 56,799December ......................... 792 5,343 6,067 51,157 63,359Total ................................. 6,452 66,657 60,347 569,274 R 702,730
1981January ............................. 895 5,465 6,532 54,688 67,580February ........................... 712 5,177 5,932 47,914 59,735March ................................ 474 5,532 5,665 48,398 60,069April .................................. 562 4,862 5,548 43,677 54,649May ................................... 470 4,259 5,297 44,999 55,025June .................................. 300 4,460 4,845 50,080 59,685July ................................... 430 5,449 5,371 56,144 67,394August .............................. 459 5,434 5,520 54,483 65,896September ........................ 587 5,340 5,312 48,483 59,721October ............................. 626 5,158 5,577 47,800 59,161November ......................... 851 5,037 5,793 47,014 58,695December ......................... 1,056 4,842 6,003 53,116 65,017Total ................................. R 7,421 R 61,014 67,395 596,797 R 732,627
1982January ............................. 993 4,444 6,430 56,825 68,692February ........................... 693 4,340 5,835 48,878 59,746March ................................ 563 4,173 5,616 47,884 58,236April .................................. 703 3,708 5,373 43,490 53,274May ................................... 467 3,622 5,133 45,622 54,844June .................................. 363 3,481 4,681 47,424 55,949July ................................... 628 3,121 4,831 55,248 63,828August .............................. 670 3,058 4,962 54,838 63,528September ........................ 637 2,924 4,759 48,414 56,734October ............................. 660 2,757 5,287 46,330 55,034November ......................... 845 2,693 5,494 47,799 56,831December ......................... 1,018 2,587 5,695 50,914 60,214Total ................................. 8,240 40,908 R 64,097 593,666 R 706,911
See footnotes at end of table.
Energy Information Administration/Historical Monthly Energy Review 1973-1992204

Table 6.2 Coal Consumption by End-Use Sector, 1973-1992 (Continued)
(Thousand Short Tons)
Residentialand
Commercial
Industrial
ElectricUtilities Total
CokePlants
Other IndustrialIncluding
Transportation
1983January ............................. 884 2,813 5,970 53,351 63,018February ........................... 773 2,742 5,405 45,772 54,692March ................................ 551 2,567 5,206 47,110 55,434April .................................. 767 3,206 5,254 43,589 52,816May ................................... 463 3,151 5,023 45,691 54,328June .................................. 367 2,734 4,798 50,338 58,237July ................................... 599 3,269 5,220 60,390 69,478August .............................. 566 3,252 5,362 63,767 72,947September ........................ 752 3,196 5,156 54,212 63,316October ............................. 799 3,307 5,659 50,689 60,454November ......................... 845 3,335 6,046 51,185 61,411December ......................... 1,082 3,461 6,880 59,117 70,540Total ................................. 8,448 37,033 R 65,980 625,211 R 736,672
1984January ............................. R 1,046 3,791 6,858 60,225 R 71,920February ........................... 915 3,592 6,230 52,257 R 62,995March ................................ 652 3,843 5,999 54,534 65,028April .................................. 928 4,180 6,273 47,565 58,945May ................................... 560 4,100 5,997 49,507 R 60,165June .................................. 443 3,564 5,729 56,971 66,707July ................................... R 695 3,639 5,730 60,359 R 70,422August .............................. 656 3,620 5,886 63,396 R 73,557September ........................ 872 3,557 5,659 54,045 64,133October ............................. R 693 R 3,318 5,902 54,753 R 64,665November ......................... 733 3,346 6,305 54,229 64,613December ......................... 938 3,473 R 7,175 56,560 R 68,146Total ................................. R 9,130 44,022 R 73,745 664,399 R 791,296
1985January ............................. 830 3,463 6,911 63,645 74,849February ........................... 726 3,282 6,278 55,491 65,777March ................................ 518 3,511 6,046 54,784 64,857April .................................. 764 3,851 6,236 50,903 61,753May ................................... 461 3,778 5,962 54,595 64,797June .................................. 365 3,284 5,696 57,634 66,978July ................................... 523 3,437 5,950 64,252 74,162August .............................. 494 3,420 6,112 63,076 73,102September ........................ 656 3,361 5,877 56,780 66,673October ............................. 716 3,165 6,183 54,969 65,033November ......................... 758 3,192 6,605 54,311 64,866December ......................... 969 3,313 7,517 63,402 75,201Total ................................. 7,779 41,056 75,372 693,841 818,049
1986January ............................. 893 R 3,503 7,443 64,034 R 75,873February ........................... 781 R 3,230 6,761 55,050 R 65,823March ................................ 557 R 3,572 6,511 53,898 R 64,538April .................................. 805 3,602 6,401 48,114 58,921May ................................... 486 3,533 6,120 51,420 61,559June .................................. 384 3,071 5,846 58,892 68,193July ................................... 470 2,591 5,705 68,021 76,787August .............................. 444 2,578 5,860 61,709 70,590September ........................ 589 2,534 5,634 56,536 65,293October ............................. 662 2,523 5,878 54,116 63,179November ......................... 701 2,545 6,279 54,158 63,682December ......................... 896 2,641 7,146 59,108 69,792Total ................................. 7,667 R 35,924 75,583 685,056 R 804,231
1987January ............................. 724 2,645 6,865 62,414 72,648February ........................... 634 2,506 6,236 53,715 63,091March ................................ 452 2,681 6,005 54,647 63,784April .................................. 603 3,298 6,137 51,435 61,472May ................................... 364 3,235 5,868 56,484 65,950June .................................. 288 2,812 5,605 63,500 72,204July ................................... 504 3,265 5,973 70,736 80,479August .............................. 476 3,249 6,135 70,075 79,935September ........................ 633 3,193 5,899 59,259 68,984October ............................. 656 3,297 6,228 57,117 67,299November ......................... 694 3,326 6,653 55,961 66,634December ......................... 888 3,452 7,572 62,551 74,462Total ................................. 6,914 36,957 75,175 717,894 836,941
See footnotes at end of table.
Energy Information Administration/Historical Monthly Energy Review 1973-1992 205

Table 6.2 Coal Consumption by End-Use Sector, 1973-1992 (Continued)
(Thousand Short Tons)
Residentialand
Commercial
Industrial
ElectricUtilities Total
CokePlants
Other IndustrialIncluding
Transportation
1988January ............................. 826 3,465 6,826 67,850 78,967February ........................... 678 3,297 6,789 61,401 72,166March ................................ 500 3,595 6,801 58,758 69,654April .................................. 608 R 3,504 5,904 54,135 R 64,152May ................................... 358 R 3,682 5,937 56,529 R 66,507June .................................. 440 R 3,349 5,944 65,343 R 75,076July ................................... 679 3,605 5,962 71,749 81,994August .............................. 658 3,418 5,972 75,253 R 85,301September ........................ 388 R 3,460 5,989 61,540 R 71,377October ............................. 446 R 3,547 6,694 59,561 R 70,248November ......................... 594 R 3,400 6,710 59,305 R 70,008December ......................... 955 R 3,565 6,724 66,948 R 78,191Total ................................. 7,130 R 41,888 76,252 758,372 R 883,642
1989January ............................. 632 3,441 6,671 66,767 77,511February ........................... 693 3,178 6,619 62,784 73,273March ................................ 512 3,589 6,595 62,005 72,701April .................................. 511 3,564 6,088 56,144 66,306May ................................... 336 3,478 6,050 58,527 68,391June .................................. 296 3,323 6,073 63,635 73,327July ................................... 496 3,467 5,875 69,720 79,558August .............................. 449 3,279 5,891 70,493 80,112September ........................ 318 3,263 5,865 62,910 72,356October ............................. 210 3,539 6,829 60,561 71,140November ......................... 530 3,246 6,815 61,006 71,598December ......................... 1,184 3,141 6,764 72,336 83,425Total ................................. 6,167 40,508 76,134 766,888 889,699
1990January ............................. 713 3,456 6,533 66,441 77,143February ........................... 656 3,117 6,576 58,112 68,461March ................................ 551 3,471 6,504 60,885 71,410April .................................. 532 3,227 6,025 57,937 67,721May ................................... 360 3,365 6,007 59,260 68,992June .................................. 373 3,203 6,037 65,340 74,953July ................................... 535 3,119 6,075 71,551 81,280August .............................. 498 3,236 6,113 73,106 82,954September ........................ 409 3,120 6,056 67,001 76,587October ............................. 413 3,319 6,853 64,381 74,966November ......................... 624 3,223 6,838 61,041 71,727December ......................... 1,059 3,020 6,713 68,493 79,285Total ................................. 6,724 38,877 76,330 773,549 895,480
1991January ............................. 862 2,928 6,541 71,406 81,738February ........................... 605 2,479 6,584 58,614 68,282March ................................ 541 2,883 6,492 59,272 69,188April .................................. 403 2,675 5,663 55,443 64,184May ................................... 330 2,710 5,713 61,228 69,981June .................................. 322 2,690 5,763 65,817 74,592July ................................... 427 2,929 6,014 71,852 81,221August .............................. 386 2,916 6,011 71,884 81,196September ........................ 319 2,932 6,026 64,397 73,676October ............................. 353 2,902 6,880 61,883 72,018November ......................... 677 2,896 6,852 63,814 74,239December ......................... 868 2,913 6,865 66,659 77,305Total ................................. 6,094 33,854 75,405 772,268 887,621
1992January ............................. 735 2,783 6,379 68,264 78,162February ........................... 582 2,656 6,416 60,183 69,837March ................................ 526 2,901 6,464 62,705 72,595April .................................. 532 2,723 5,754 58,794 67,802May ................................... 321 2,757 5,762 60,591 69,430June .................................. 296 2,617 5,769 64,122 72,804July ................................... 474 2,802 5,983 73,815 83,074August .............................. 393 2,773 5,933 70,637 79,736September ........................ 368 2,625 5,927 65,967 74,888October ............................. 367 2,586 6,645 62,806 72,405November ......................... 642 2,562 6,513 62,612 72,329December ......................... 916 2,581 6,497 69,365 79,359Total ................................. 6,153 32,366 74,042 779,860 892,421
R=Revised data. Notes: • For sector-specific reporting and estimating information, see Note
2 at end of section. • Totals may not equal sum of components due to
independent rounding. • Geographic coverage is the 50 States and theDistrict of Columbia.
Sources: See end of section.
Energy Information Administration/Historical Monthly Energy Review 1973-1992206

Table 6.3 Coal Stocks, End of Period, 1973-1992
(Thousand Short Tons)
ConsumerProducers
andDistributors Totala
CokePlants
OtherIndustrial
ElectricUtilities Totala
1973January ....................... 8,568 7,808 94,744 111,120 13,377 124,497February ..................... 8,435 8,041 92,724 109,200 13,300 122,500March .......................... 8,480 8,274 93,712 110,466 13,223 123,689April ............................ 8,540 8,507 94,714 111,761 13,146 124,907May ............................. 8,869 8,740 98,460 116,069 13,069 129,138June ............................ 8,594 8,973 97,756 115,323 12,992 128,315July ............................. 6,112 9,206 91,940 107,258 12,915 120,173August ........................ 6,549 9,439 91,372 107,360 12,838 120,198September .................. 6,636 9,672 90,044 106,352 12,761 119,113October ....................... 7,169 9,905 91,357 108,431 12,684 121,115November ................... 7,268 10,138 90,967 108,373 12,607 120,980December ................... 6,998 10,370 86,967 104,335 12,530 116,865
1974January ....................... 6,354 10,057 82,214 98,625 12,452 111,077February ..................... 6,180 9,745 81,394 97,319 12,378 109,697March .......................... 6,325 9,431 85,832 101,588 12,304 113,892April ............................ 6,727 9,117 90,691 106,535 12,230 118,765May ............................. 7,597 8,803 95,292 111,692 12,156 123,848June ............................ 7,473 8,489 95,586 111,548 12,082 123,630July ............................. 6,584 8,175 91,227 105,986 12,008 117,994August ........................ 6,839 7,861 89,194 103,894 11,934 115,828September .................. 7,266 7,547 92,709 107,522 11,860 119,382October ....................... 8,509 7,233 100,336 116,078 11,786 127,864November ................... 7,419 6,919 94,079 108,417 11,712 120,129December ................... 6,209 6,605 83,509 96,323 11,634 107,957
1975January ....................... 7,311 6,765 82,059 96,135 11,673 107,808February ..................... 8,175 6,925 80,945 96,045 11,713 107,758March .......................... 8,824 7,086 81,857 97,767 11,752 109,519April ............................ 9,125 7,246 86,805 103,176 11,792 114,968May ............................. 9,738 7,406 93,840 110,984 11,831 122,815June ............................ 10,140 7,567 97,998 115,705 11,871 127,576July ............................. 8,251 7,727 94,244 110,222 11,910 122,132August ........................ 7,467 7,888 94,180 109,535 11,950 121,485September .................. 7,131 8,048 98,063 113,242 11,989 125,231October ....................... 7,858 8,208 105,384 121,450 12,029 133,479November ................... 8,601 8,368 110,346 127,315 12,068 139,383December ................... 8,797 8,529 110,724 128,050 12,108 140,158
1976January ....................... 8,229 8,409 105,494 122,132 12,283 134,415February ..................... 8,603 8,290 104,850 121,743 12,459 134,202March .......................... 9,411 8,171 108,426 126,008 12,635 138,643April ............................ 10,015 8,052 112,838 130,905 12,811 143,716May ............................. 10,697 7,933 119,588 138,218 12,987 151,205June ............................ 11,338 7,814 123,025 142,177 13,163 155,340July ............................. 8,798 7,695 115,181 131,674 13,339 145,013August ........................ 7,349 7,576 110,728 125,653 13,515 139,168September .................. 8,257 7,457 115,375 131,089 13,691 144,780October ....................... 9,138 7,338 118,565 135,041 13,867 148,908November ................... 9,712 7,219 119,266 136,197 14,043 150,240December ................... 9,902 7,100 117,436 134,438 14,221 148,659
1977January ....................... 8,190 7,430 106,151 121,771 14,221 135,992February ..................... 7,543 7,760 103,275 118,578 14,221 132,799March .......................... 9,100 8,090 109,589 126,779 14,221 141,000April ............................ 9,970 8,421 115,888 134,279 14,221 148,500May ............................. 10,694 8,751 122,803 142,248 14,221 156,469June ............................ 12,109 9,081 128,763 149,953 14,223 164,176July ............................. 9,894 9,411 123,352 142,657 14,223 156,880August ........................ 9,125 9,742 123,798 142,665 14,223 156,888September .................. 10,506 10,072 130,313 150,891 14,223 165,114October ....................... 12,696 10,402 139,634 162,732 14,223 176,955November ................... 15,593 10,732 149,656 175,981 14,223 190,204December ................... 12,816 11,063 133,219 157,098 14,225 171,323
See footnotes at end of table.
Energy Information Administration/Historical Monthly Energy Review 1973-1992 207
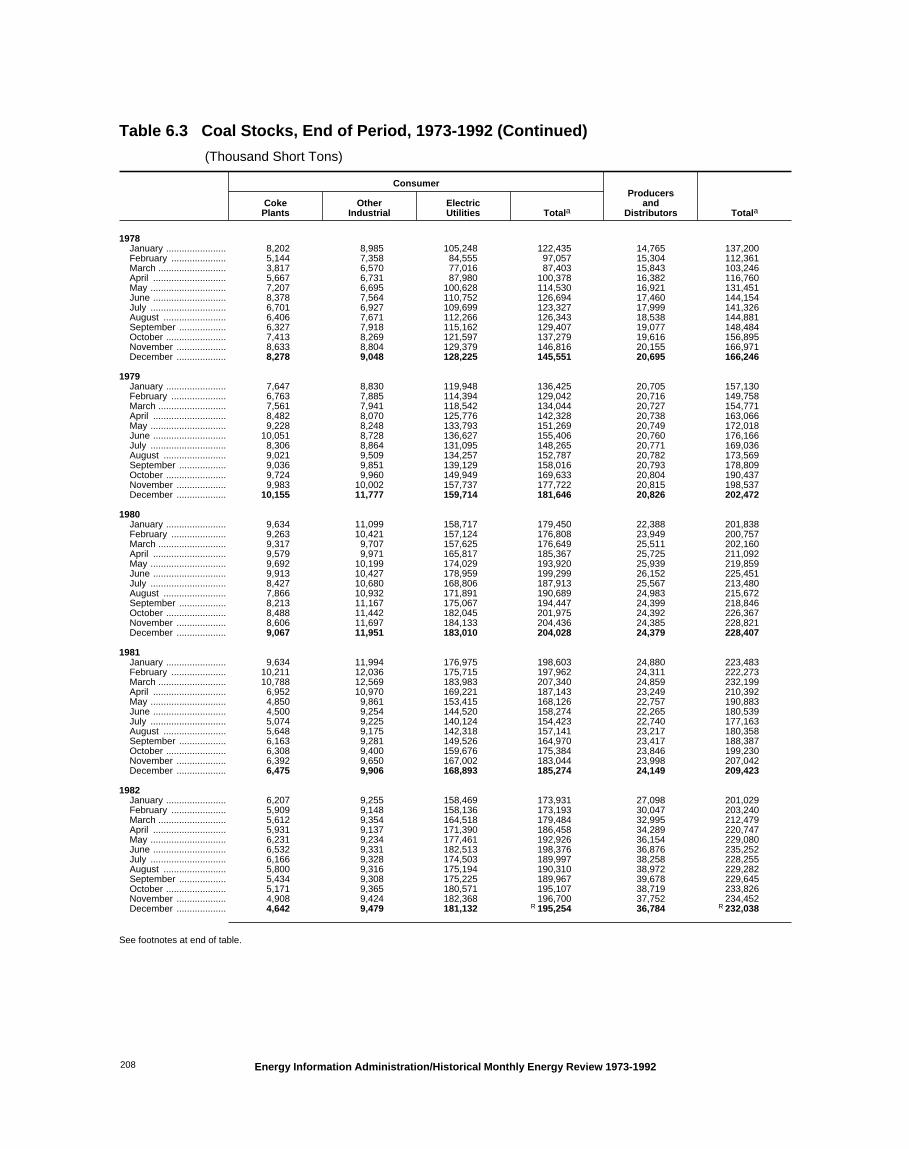
Table 6.3 Coal Stocks, End of Period, 1973-1992 (Continued)
(Thousand Short Tons)
ConsumerProducers
andDistributors Totala
CokePlants
OtherIndustrial
ElectricUtilities Totala
1978January ....................... 8,202 8,985 105,248 122,435 14,765 137,200February ..................... 5,144 7,358 84,555 97,057 15,304 112,361March .......................... 3,817 6,570 77,016 87,403 15,843 103,246April ............................ 5,667 6,731 87,980 100,378 16,382 116,760May ............................. 7,207 6,695 100,628 114,530 16,921 131,451June ............................ 8,378 7,564 110,752 126,694 17,460 144,154July ............................. 6,701 6,927 109,699 123,327 17,999 141,326August ........................ 6,406 7,671 112,266 126,343 18,538 144,881September .................. 6,327 7,918 115,162 129,407 19,077 148,484October ....................... 7,413 8,269 121,597 137,279 19,616 156,895November ................... 8,633 8,804 129,379 146,816 20,155 166,971December ................... 8,278 9,048 128,225 145,551 20,695 166,246
1979January ....................... 7,647 8,830 119,948 136,425 20,705 157,130February ..................... 6,763 7,885 114,394 129,042 20,716 149,758March .......................... 7,561 7,941 118,542 134,044 20,727 154,771April ............................ 8,482 8,070 125,776 142,328 20,738 163,066May ............................. 9,228 8,248 133,793 151,269 20,749 172,018June ............................ 10,051 8,728 136,627 155,406 20,760 176,166July ............................. 8,306 8,864 131,095 148,265 20,771 169,036August ........................ 9,021 9,509 134,257 152,787 20,782 173,569September .................. 9,036 9,851 139,129 158,016 20,793 178,809October ....................... 9,724 9,960 149,949 169,633 20,804 190,437November ................... 9,983 10,002 157,737 177,722 20,815 198,537December ................... 10,155 11,777 159,714 181,646 20,826 202,472
1980January ....................... 9,634 11,099 158,717 179,450 22,388 201,838February ..................... 9,263 10,421 157,124 176,808 23,949 200,757March .......................... 9,317 9,707 157,625 176,649 25,511 202,160April ............................ 9,579 9,971 165,817 185,367 25,725 211,092May ............................. 9,692 10,199 174,029 193,920 25,939 219,859June ............................ 9,913 10,427 178,959 199,299 26,152 225,451July ............................. 8,427 10,680 168,806 187,913 25,567 213,480August ........................ 7,866 10,932 171,891 190,689 24,983 215,672September .................. 8,213 11,167 175,067 194,447 24,399 218,846October ....................... 8,488 11,442 182,045 201,975 24,392 226,367November ................... 8,606 11,697 184,133 204,436 24,385 228,821December ................... 9,067 11,951 183,010 204,028 24,379 228,407
1981January ....................... 9,634 11,994 176,975 198,603 24,880 223,483February ..................... 10,211 12,036 175,715 197,962 24,311 222,273March .......................... 10,788 12,569 183,983 207,340 24,859 232,199April ............................ 6,952 10,970 169,221 187,143 23,249 210,392May ............................. 4,850 9,861 153,415 168,126 22,757 190,883June ............................ 4,500 9,254 144,520 158,274 22,265 180,539July ............................. 5,074 9,225 140,124 154,423 22,740 177,163August ........................ 5,648 9,175 142,318 157,141 23,217 180,358September .................. 6,163 9,281 149,526 164,970 23,417 188,387October ....................... 6,308 9,400 159,676 175,384 23,846 199,230November ................... 6,392 9,650 167,002 183,044 23,998 207,042December ................... 6,475 9,906 168,893 185,274 24,149 209,423
1982January ....................... 6,207 9,255 158,469 173,931 27,098 201,029February ..................... 5,909 9,148 158,136 173,193 30,047 203,240March .......................... 5,612 9,354 164,518 179,484 32,995 212,479April ............................ 5,931 9,137 171,390 186,458 34,289 220,747May ............................. 6,231 9,234 177,461 192,926 36,154 229,080June ............................ 6,532 9,331 182,513 198,376 36,876 235,252July ............................. 6,166 9,328 174,503 189,997 38,258 228,255August ........................ 5,800 9,316 175,194 190,310 38,972 229,282September .................. 5,434 9,308 175,225 189,967 39,678 229,645October ....................... 5,171 9,365 180,571 195,107 38,719 233,826November ................... 4,908 9,424 182,368 196,700 37,752 234,452December ................... 4,642 9,479 181,132 R 195,254 36,784 R 232,038
See footnotes at end of table.
Energy Information Administration/Historical Monthly Energy Review 1973-1992208

Table 6.3 Coal Stocks, End of Period, 1973-1992 (Continued)
(Thousand Short Tons)
ConsumerProducers
andDistributors Totala
CokePlants
OtherIndustrial
ElectricUtilities Totala
1983January ....................... 4,338 8,960 178,604 191,902 37,811 229,713February ..................... 4,034 8,439 179,101 191,574 38,839 230,413March .......................... 3,728 7,916 180,671 192,315 39,867 232,182April ............................ 4,089 7,942 181,371 193,402 39,165 232,567May ............................. 4,450 7,965 184,567 196,982 38,463 235,445June ............................ 4,812 7,985 184,236 197,033 37,761 234,794July ............................. 4,489 8,167 168,566 181,222 36,923 218,145August ........................ 4,165 8,345 162,557 175,067 36,086 211,153September .................. 3,842 8,518 161,384 173,744 35,249 208,993October ....................... 4,010 8,582 166,574 179,166 34,809 213,975November ................... 4,178 8,645 166,457 179,280 34,370 213,650December ................... 4,346 8,710 155,598 168,654 33,931 R 202,584
1984January ....................... 4,947 8,593 149,403 162,943 34,042 196,985February ..................... 5,548 8,476 155,593 169,617 34,154 203,771March .......................... 6,149 8,359 159,775 174,283 34,265 208,548April ............................ R 7,172 9,137 165,592 R 181,901 R 33,124 R 215,025May ............................. R 8,195 9,915 173,171 R 191,281 31,982 R 223,263June ............................ 9,217 10,693 174,155 194,065 30,841 R 224,905July ............................. R 9,659 11,904 171,095 R 192,658 30,461 R 223,119August ........................ R 10,100 R 13,115 176,928 200,143 30,081 230,224September .................. 10,541 14,327 183,151 208,019 29,701 237,720October ....................... 9,083 13,324 184,779 R 207,185 31,164 R 238,349November ................... 7,625 12,320 182,130 202,075 32,627 234,702December ................... 6,166 11,317 179,727 R 197,211 34,090 231,300
1985January ....................... 5,583 10,439 167,592 183,614 34,517 218,131February ..................... 4,999 9,561 162,531 177,091 34,944 212,035March .......................... 4,415 8,684 166,355 179,454 35,371 214,825April ............................ 4,472 8,749 171,695 184,917 35,313 220,230May ............................. 4,529 8,815 174,198 187,542 35,255 222,798June ............................ 4,587 8,881 174,545 188,013 35,197 223,210July ............................. 4,171 9,184 165,903 179,258 34,342 213,601August ........................ 3,754 9,488 162,825 176,068 33,487 209,555September .................. 3,338 9,791 163,065 176,195 32,632 208,827October ....................... 3,365 10,007 166,749 180,121 32,799 212,920November ................... 3,393 10,222 164,075 177,690 32,966 210,656December ................... 3,420 10,438 156,376 170,234 33,133 203,367
1986January ....................... 3,302 9,930 152,078 165,311 34,763 200,074February ..................... 3,185 9,423 151,157 163,765 36,394 200,159March .......................... 3,067 8,916 154,415 166,398 38,024 204,422April ............................ 3,224 9,135 161,076 173,434 38,065 211,500May ............................. 3,380 9,353 164,667 177,401 38,107 215,508June ............................ 3,537 9,572 162,909 176,018 38,148 214,166July ............................. 3,313 9,740 149,803 162,856 36,700 199,556August ........................ 3,090 9,908 149,163 162,161 35,252 197,412September .................. 2,866 10,074 151,945 164,885 33,804 198,689October ....................... 2,908 10,195 157,202 170,305 33,233 203,538November ................... 2,950 10,314 160,908 174,171 32,663 206,834December ................... 2,992 10,429 161,806 175,226 32,093 207,319
1987January ....................... 2,886 9,903 157,061 169,850 33,582 203,432February ..................... 2,780 9,377 158,322 170,479 35,071 205,551March .......................... 2,675 8,850 161,648 173,173 36,560 209,733April ............................ 3,028 8,881 165,103 177,012 35,686 212,699May ............................. 3,382 8,911 165,683 177,976 34,813 212,788June ............................ 3,735 8,941 163,361 176,037 33,939 209,976July ............................. 3,603 9,393 150,217 163,213 32,217 195,431August ........................ 3,472 9,845 146,106 159,422 30,496 189,919September .................. 3,340 10,297 151,961 165,598 28,775 194,373October ....................... 3,521 10,457 160,942 174,920 28,624 203,544November ................... 3,703 10,617 168,274 182,594 28,472 211,067December ................... 3,884 10,777 170,797 185,459 28,321 213,780
See footnotes at end of table.
Energy Information Administration/Historical Monthly Energy Review 1973-1992 209

Table 6.3 Coal Stocks, End of Period, 1973-1992 (Continued)
(Thousand Short Tons)
ConsumerProducers
andDistributors Totala
CokePlants
OtherIndustrial
ElectricUtilities Totala
1988January ....................... 3,942 10,058 163,561 177,561 31,135 208,697February ..................... 4,000 9,339 160,424 173,762 33,950 207,712March .......................... 4,057 8,619 162,603 175,279 36,764 212,044April ............................ 3,959 8,523 165,750 178,232 36,536 214,768May ............................. 3,861 8,427 166,328 178,616 36,307 214,923June ............................ 3,763 8,331 161,215 173,308 36,079 209,386July ............................. 3,467 8,428 148,234 160,130 34,506 194,636August ........................ 3,172 8,526 141,389 153,087 32,933 186,020September .................. 2,877 8,624 142,830 154,331 31,360 185,691October ....................... 2,964 8,672 147,130 158,766 31,046 189,812November ................... 3,051 8,720 150,016 161,786 30,732 192,518December ................... 3,137 8,768 146,507 158,413 30,418 188,831
1989January ....................... 3,264 8,073 142,538 153,876 32,076 185,952February ..................... 3,391 7,378 137,363 148,132 33,734 181,866March .......................... 3,518 6,683 139,036 149,238 35,392 184,630April ............................ 3,466 6,679 144,674 154,819 33,759 188,578May ............................. 3,413 6,675 151,067 161,155 32,127 193,282June ............................ 3,361 6,671 148,981 159,013 30,494 189,507July ............................. 3,476 7,054 134,865 145,395 29,946 175,341August ........................ 3,591 7,436 133,948 144,975 29,397 174,372September .................. 3,707 7,818 135,640 147,165 28,848 176,013October ....................... 3,426 7,666 142,280 153,372 28,899 182,271November ................... 3,145 7,515 147,207 157,866 28,949 186,815December ................... 2,864 7,363 135,860 146,087 29,000 175,087
1990January ....................... 3,123 7,237 138,067 148,426 31,033 179,459February ..................... 3,382 7,110 142,890 153,382 33,066 186,448March .......................... 3,641 6,984 150,118 160,743 35,099 195,842April ............................ 3,674 7,127 156,925 167,726 35,698 203,424May ............................. 3,706 7,270 162,821 173,798 36,296 210,094June ............................ 3,739 7,413 161,908 173,061 36,895 209,956July ............................. 3,387 7,810 153,957 165,153 35,816 200,970August ........................ 3,255 8,206 151,085 162,546 34,738 197,284September .................. 3,124 8,603 149,913 161,639 33,659 195,298October ....................... 3,192 8,640 156,271 168,104 33,579 201,683November ................... 3,260 8,678 160,911 172,850 33,499 206,348December ................... 3,329 8,716 156,166 168,210 33,418 201,629
1991January ....................... 3,262 8,234 152,097 163,594 36,333 199,927February ..................... 3,196 7,753 156,116 167,065 39,248 206,312March .......................... 3,130 7,271 161,084 171,485 42,162 213,647April ............................ 3,181 7,154 166,315 176,650 41,793 218,443May ............................. 3,232 7,038 167,528 177,797 41,423 219,221June ............................ 3,283 6,921 163,459 173,663 41,054 214,716July ............................. 3,087 7,033 155,680 165,800 38,578 204,378August ........................ 2,891 7,145 153,097 163,133 36,103 199,237September .................. 2,695 7,258 153,907 163,860 33,628 197,488October ....................... 2,721 7,192 158,813 168,726 33,409 202,136November ................... 2,747 7,127 158,605 168,479 33,190 201,670December ................... 2,773 7,061 157,876 167,711 32,971 200,682
1992January ....................... 2,807 6,616 155,637 165,060 35,265 200,325February ..................... 2,841 6,171 158,145 167,157 37,559 204,716March .......................... 2,875 5,725 160,032 168,632 39,853 208,485April ............................ 2,842 5,923 162,591 171,356 40,073 211,429May ............................. 2,809 6,100 165,512 174,421 40,293 214,714June ............................ 2,776 6,317 164,176 173,270 40,513 213,783July ............................. 2,589 6,538 154,403 163,530 38,741 202,271August ........................ 2,402 6,758 152,580 161,740 36,970 198,710September .................. 2,215 6,979 152,685 161,878 35,198 197,076October ....................... 2,342 6,974 156,859 166,175 34,796 200,971November ................... 2,470 6,969 157,849 167,288 34,395 201,683December ................... 2,597 6,965 154,130 163,692 33,993 197,685
a Excludes stocks held at retail dealers for consumption by the residentialand commercial sector. Residential and commercial coal stocks informationis available from the following sources: 1973-1976—U.S. Department of theInterior (DOI), Bureau of Mines (BOM), Minerals Yearbook. January-September 1977—DOI, BOM, Form 6-1400, "Monthly Coal Report,Retail Dealers—Upper Lake Docks." October 1977-1979—EnergyInformation Administration (EIA), Form EIA-2, "Monthly Coal Report, Retail
Dealers—Upper Lake Docks."R=Revised data. Notes: • For sector-specific reporting and estimating information, see Note
3 at end of section. • Totals may not equal sum of components due toindependent rounding. • Geographic coverage is the 50 States and theDistrict of Columbia.
Sources: See end of section.
Energy Information Administration/Historical Monthly Energy Review 1973-1992210

Coal Notes and Sources
Notes:1. Production: Monthly production figures are ad-justed to conform to final annual production data re-ported on Energy Information Administration (EIA)Form EIA-7A, "Coal Production Report." Preliminarymonthly figures reported before the adjustment aregenerally different from the final values. For furtherdetails, see EIA, Monthly Energy Review.
2. Consumption: Coal consumption data are reportedby major end-use sector:
• Residential and Commercial—Prior to 1980,monthly consumption estimates for the residen-tial and commercial sector were derived by usingreported data to modify baseline figures devel-oped by the Bureau of Mines. From 1980-1987,monthly estimates were derived by proportion-ing reported quarterly data by using the ratios ofmonthly-to-quarterly consumption data in 1979,the last year in which monthly data were reportedon Form EIA-2. During 1981 and 1982, the esti-mates were also modified to reflect air tempera-ture degree-days. Quarterly consumption datawere taken directly from reported data and weredefined as distribution to the residential and com-mercial sector as reported by coal producers anddistributors on Form EIA-6. From 1988-1992,monthly residential and commercial consump-tion estimates were derived from reported quar-terly data by using monthly national averagepopulation weighted heating/cooling degree-days obtained from the National Oceanic andAtmospheric Administration. The monthly ra-tios are the monthly national sum of heating andcooling degree-days as a proportion of the quar-terly national sum. Quarterly consumption dataare taken directly from reported data.
• Coke Plants—Prior to 1980, monthly coke plantconsumption data were taken directly from reporteddata. From 1980-1987, coke plant consumption esti-mates were derived by proportioning reported quar-terly data by using the ratios of monthly-to-quarterlyconsumption data in 1979, the last year in whichmonthly data were reported. From 1988-1992,monthly coke plant consumption estimates werederived from the reported quarterly data by usingmonthly ratios of raw steel production data fromthe American Iron and Steel Institute. The ratiosare the monthly raw steel production from openhearth and basic oxygen process furnaces as aproportion of the quarterly production fromthose kinds of furnaces.
• Other Industrial—Prior to 1978, monthlyconsumption data for the other industrial sector(all industrial users minus coke plants) were de-rived by using reported data to modify baselineconsumption figures from the most recent Bureau
of the Census Annual Survey of Manufactures orCensus of Manufactures. For 1978 and 1979,monthly estimates were derived from data re-ported on Forms EIA-3 and EIA-6. From 1980-1987, monthly figures were estimated byproportioning quarterly data by using the ratiosof monthly-to-quarterly consumption data in1979, the last year in which monthly data werereported on Form EIA-3. Quarterly consumptiondata were derived by adding beginning stocks atmanufacturing plants to current receipts and sub-tracting ending stocks at manufacturing plants.In this calculation, current receipts were thegreater of either reported receipts from manufac-turing plants (Form EIA-3) or reported shipmentsto the other industrial sector (Form EIA-6),thereby ensuring that agriculture, forestry, fish-ing, mining, and construction consumption datawere included where appropriate. From 1988-1992, monthly consumption for the other indus-trial sector was estimated from reported quarterlydata by using ratios derived from industrial pro-duction indices published by the Board of Gover-nors of the Federal Reserve System. Indices forsix major industry groups are used as the basis forcalculating the ratios: foods, Standard IndustrialClassification (SIC) 20; paper and products, SIC26; chemicals and products, SIC 28; petroleumproducts, SIC 29; clay, glass, and stone products,SIC 32; and primary metals, SIC 33. The monthlyratios are computed as the monthly sum of theweighted indices as a proportion of the quarterlysum of the weighted indices by using the 1977proportion as the weights.
• Electric Utilities—Monthly consumption data forelectric utility plants are taken directly from re-ported data.
3. Stocks: Coal stocks data are reported by major end-use sector:
• Coke Plants—Prior to 1980, monthly stocks atcoke plants were taken directly from reporteddata. From 1980-1992, coke plant stocks wereestimated by using one-third of the current quar-terly change to indicate the monthly change instocks. Quarterly stocks were taken directly fromdata reported on Form EIA-5.
• Other Industrial—Prior to 1978, stocks for theother industrial sector were derived by using re-ported data to modify baseline figures from aone-time Bureau of Mines survey of consumers.For 1978-1982, monthly estimates were derivedby judgmentally proportioning reported quar-terly data based on representative seasonal pat-terns of supply and demand. From 1983-1992,other industrial coal stocks were estimated as in-dicated above for coke plants. Quarterly stockswere taken directly from data reported on FormEIA-3 and therefore include only manufacturing
Energy Information Administration/Historical Monthly Energy Review 1973-1992 211

industries; data for agriculture, forestry, fishing,mining, and construction stocks are not available.
• Electric Utilities—Monthly stocks data at electricutility plants are taken directly from reporteddata.
• Producers and Distributors—Prior to 1980,monthly stocks data were derived from annualstock change data reported on the coal distribu-tion survey Form BOM-6-1419-Q, "Distribution ofBituminous Coal and Lignite Shipments." Theyear-end stock value is the previous year’s valueplus or minus the reported stock change.Monthly estimates of coal stocks are obtained bydividing the annual change into twelve incre-ments and adding (or subtracting) that value to(or from) the previous month’s estimate. For1980-1992, data were collected quarterly on FormEIA-6, "Coal Distribution Report," and monthlydata were estimated by using one-third of thequarterly change to indicate the monthly changein stocks.
4. Imports and Exports: All coal import and exportfigures are taken directly from data reported monthlyby the Bureau of the Census.
5. Additional Information: EIA’s Quarterly Coal Reportprovides additional information about coal data andestimation procedures.
Sources:
Table 6.1
• Production: 1973-September 1977—U.S. Departmentof the Interior (DOI), Bureau of Mines (BOM), MineralsYearbook and Mineral Industry Surveys. October 1977-1992—Energy Information Administration (EIA),Weekly Coal Production.
• Consumption—Table 6.2.
•Imports and Exports—U.S. Department of Com-merce, Bureau of the Census, Monthly Reports IM-145(Imports) and EM-522 (Exports).
• Stocks—Table 6.3.
Table 6.2• Residential and Commercial, 1973-1976—DOI,BOM, Minerals Yearbook. January-September 1977—DOI, BOM, Form 6-1400, "Monthly Coal Report, Retail
Dealers—Upper Lake Docks." October 1977-1979—EIA, Form EIA-2, "Monthly Coal Report, Retail Deal-ers—Upper Lake Docks." 1980-1992—EIA, Form EIA-6, "Coal Distribution Report," quarterly.
• Coke Plants, 1973-September 1977—DOI, BOM,Minerals Yearbook and Minerals Industry Surveys. Octo-ber 1977-1980—EIA, Form EIA-5/5A, "Coke and CoalChemicals—Monthly/Annual." 1981-1984—EIA,Form EIA-5/5A,"Coke Plant Report—Quarterly/An-nual Supplement." 1985-1992—EIA, Form EIA-5,"Coke Plant Report—Quarterly."
• Other Industrial, 1973-September 1977—DOI, BOM,Minerals Yearbook and Minerals Industry Surveys. Octo-ber 1977-1979—EIA, Form EIA-3, "Monthly Coal Consump-tion Report—Manufacturing Plants." 1980-1992—EIA,Form EIA-3, "Quarterly Coal Consumption Report—Manufacturing Plants," and Form EIA-6, "Coal Distri-bution Report," quarterly.
• Electric Utilities, 1973-September 1977—DOI, BOM,Minerals Yearbook and Minerals Industry Surveys. Octo-ber 1977-1992—EIA, Form EIA-759 (formerly FormFPC-4), "Monthly Power Plant Report."
Table 6.3
• Coke Plants, 1973-September 1977—DOI, BOM,Minerals Yearbook and Minerals Industry Surveys. Octo-ber 1977-1980—EIA, Form EIA-5/5A, "Coke and CoalChemicals—Monthly/Annual." 1981-1984—EIA, FormEIA-5/5A, "Coke Plant Report—Quarterly/AnnualSupplement." 1985-1992—EIA, Form EIA-5, "CokePlant Report—Quarterly."
• Other Industrial, 1973-September 1977—DOI, BOM,Minerals Yearbook and Minerals Industry Surveys. Octo-ber 1977-1979—EIA, Form EIA-3, "Monthly Coal Consump-tion Report—Manufacturing Plants." 1980-1992—EIA,Form EIA-3, "Quarterly Coal Consumption Report—Manu-facturing Plants," and Form EIA-6, "Coal Distribution Report,"quarterly.
• Electric Utilities, 1973-September 1977—DOI, BOM,Minerals Yearbook and Minerals Industry Surveys. Octo-ber 1977-1992—EIA, Form EIA-759 (formerly FormFPC-4), "Monthly Power Plant Report."
• Producers and Distributors—See Note 3, "Producersand Distributors."
Energy Information Administration/Historical Monthly Energy Review 1973-1992212

Section 7Electricity
A 1200-kilovolt ultra-high tower near Lyons, Oregon, forms part of the Bonneville PowerAdministration's network of over 12,000 miles of transmission lines in the Pacific Northwest.

Table 7.1 Electric Utility Net Generation of Electricity, 1973-1992
(Million Kilowatthours)
CoalNaturalGasa Petroleumb
NuclearElectricPower
Hydro-ElectricPower
GeothermalEnergy Otherc Total
1973January ............... 75,190 21,185 31,184 6,246 25,944 143 20 159,913February ............. 67,798 20,253 26,087 5,928 23,031 131 29 143,257March .................. 67,388 24,043 24,033 6,649 25,563 136 35 147,847April .................... 63,935 25,030 20,195 5,876 24,073 159 23 139,292May ..................... 64,927 29,756 21,742 5,697 24,793 148 25 147,088June .................... 69,592 34,627 26,000 6,784 23,752 170 21 160,945July ..................... 75,988 39,171 28,728 6,960 22,419 180 20 173,467August ................ 78,365 38,891 30,746 7,785 21,120 170 33 177,109September .......... 71,304 33,118 27,109 7,862 17,076 144 37 156,651October ............... 70,104 30,689 27,224 7,518 18,211 169 38 153,954November ........... 69,707 23,717 26,125 8,142 19,984 182 24 147,881December ........... 73,352 20,378 25,170 8,031 26,118 234 24 153,307Total ................... 847,651 340,858 314,343 83,479 272,083 1,966 328 1,860,710
1974January ............... 73,632 20,728 26,199 7,603 28,861 206 25 157,254February ............. 66,117 18,942 22,565 8,116 26,536 182 17 142,474March .................. 67,747 23,628 22,136 8,777 27,534 207 18 150,048April .................... 62,866 24,029 19,941 7,129 27,836 195 24 142,021May ..................... 67,789 28,325 22,682 6,562 27,935 195 23 153,513June .................... 67,471 31,728 23,065 7,080 26,602 189 27 156,161July ..................... 76,361 37,215 27,726 10,210 26,250 210 20 177,992August ................ 74,760 35,351 27,201 12,333 24,006 207 21 173,879September .......... 65,267 29,348 25,048 11,010 21,345 191 29 152,239October ............... 66,954 28,264 25,701 10,864 19,985 194 17 151,978November ........... 66,996 22,736 27,758 11,004 21,102 231 17 149,844December ........... 72,474 19,771 30,908 13,288 23,040 243 12 159,737Total ................... 828,433 320,065 300,931 113,976 301,032 2,453 251 1,867,140
1975January ............... 74,836 19,689 30,632 13,938 25,011 203 14 164,325February ............. 67,285 18,050 24,924 12,733 23,886 194 12 147,084March .................. 69,176 20,099 23,123 14,882 27,970 219 13 155,481April .................... 64,453 20,323 21,258 13,327 26,624 219 11 146,217May ..................... 64,741 25,707 21,050 13,764 27,713 238 18 153,231June .................... 70,346 28,830 23,062 12,744 27,143 295 21 162,442July ..................... 76,295 34,182 25,132 15,372 25,522 297 16 176,816August ................ 78,882 34,041 27,958 15,880 22,612 322 19 179,714September .......... 68,559 30,020 21,426 14,396 20,519 284 18 155,223October ............... 69,043 26,300 21,995 14,626 22,639 327 18 154,949November ........... 70,424 21,830 21,615 14,164 24,429 318 15 152,795December ........... 78,746 20,706 26,920 16,679 25,978 330 15 169,372Total ................... 852,786 299,778 289,095 172,505 300,047 3,246 191 1,917,649
1976January ............... 83,691 19,895 32,231 16,099 26,070 328 16 178,329February ............. 73,516 19,163 24,783 14,377 24,521 308 15 156,684March .................. 76,554 21,282 25,437 13,993 26,563 330 16 164,174April .................... 72,559 21,867 23,310 10,982 24,137 297 14 153,167May ..................... 72,499 25,319 21,807 11,929 25,516 284 15 157,370June .................... 76,926 29,715 25,117 15,757 25,563 295 18 173,392July ..................... 83,280 32,032 27,011 17,709 26,064 319 19 186,434August ................ 84,207 31,393 28,263 18,363 23,843 314 21 186,403September .......... 75,370 28,058 23,622 17,290 20,368 306 21 165,035October ............... 76,932 23,909 24,190 17,355 21,041 297 22 163,746November ........... 81,669 21,111 30,075 16,134 19,804 250 42 169,085December ........... 87,189 20,879 34,143 21,115 20,219 286 46 183,877Total ................... 944,391 294,624 319,988 191,104 283,707 3,616 266 2,037,696
1977January ............... 89,829 19,953 43,379 22,152 20,700 310 49 196,372February ............. 78,735 19,481 29,446 19,601 15,150 271 52 162,734March .................. 77,492 22,467 28,369 20,672 19,801 307 49 169,157April .................... 70,866 21,297 25,862 19,867 18,642 273 46 156,853May ..................... 77,049 24,701 27,964 20,599 18,677 295 46 169,332June .................... 83,117 29,621 28,971 21,517 17,226 290 45 180,787July ..................... 92,373 32,713 34,893 21,825 16,799 307 20 198,930August ................ 90,730 33,291 32,326 22,750 16,712 281 36 196,126September .......... 82,565 30,938 26,366 19,630 16,425 301 41 176,265October ............... 79,382 27,356 23,074 19,041 17,189 315 45 166,402November ........... 79,468 22,566 24,863 19,458 20,398 317 30 167,099December ........... 83,612 21,123 32,667 23,771 22,756 315 22 184,267Total ................... 985,219 305,505 358,179 250,883 220,475 3,582 481 2,124,323
See footnotes at end of table.
Energy Information Administration/Historical Monthly Energy Review 1973-1992 215
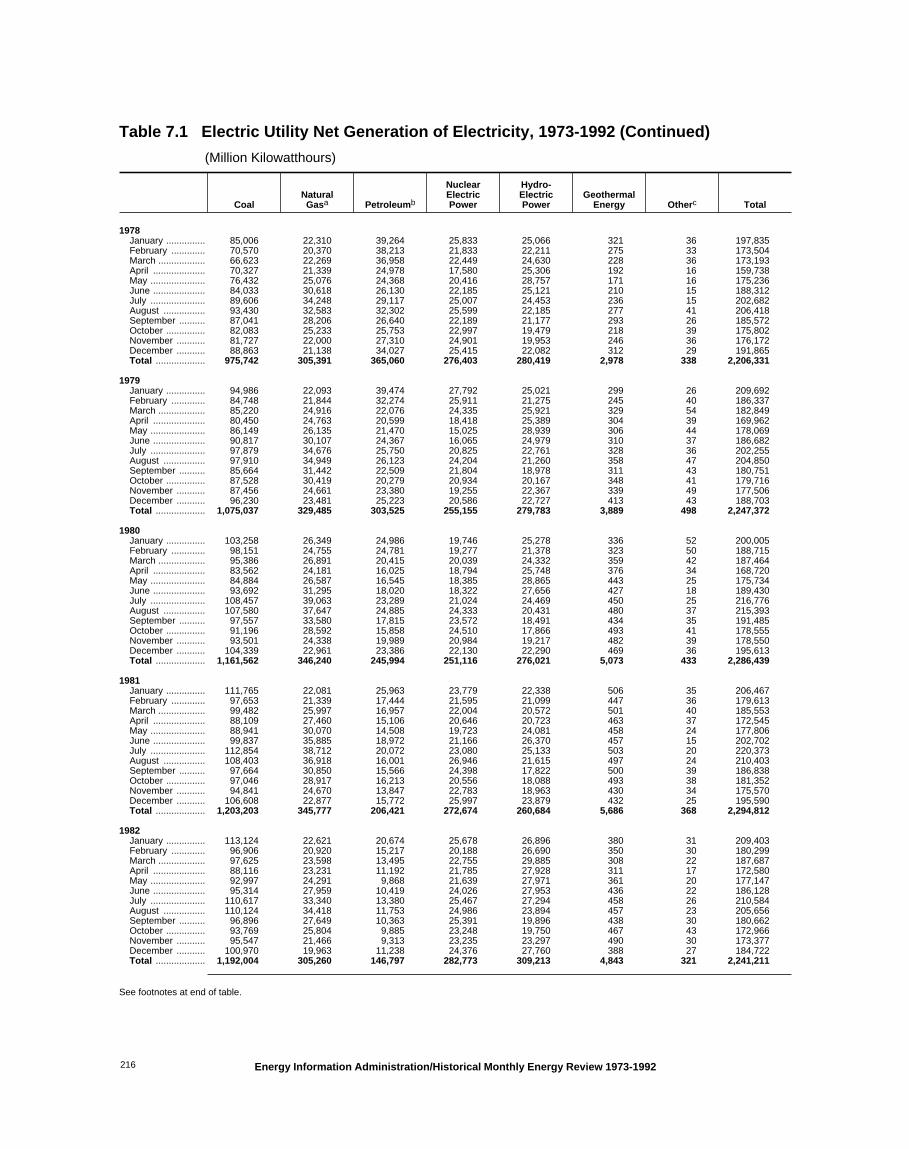
Table 7.1 Electric Utility Net Generation of Electricity, 1973-1992 (Continued)
(Million Kilowatthours)
CoalNaturalGasa Petroleumb
NuclearElectricPower
Hydro-ElectricPower
GeothermalEnergy Otherc Total
1978January ............... 85,006 22,310 39,264 25,833 25,066 321 36 197,835February ............. 70,570 20,370 38,213 21,833 22,211 275 33 173,504March .................. 66,623 22,269 36,958 22,449 24,630 228 36 173,193April .................... 70,327 21,339 24,978 17,580 25,306 192 16 159,738May ..................... 76,432 25,076 24,368 20,416 28,757 171 16 175,236June .................... 84,033 30,618 26,130 22,185 25,121 210 15 188,312July ..................... 89,606 34,248 29,117 25,007 24,453 236 15 202,682August ................ 93,430 32,583 32,302 25,599 22,185 277 41 206,418September .......... 87,041 28,206 26,640 22,189 21,177 293 26 185,572October ............... 82,083 25,233 25,753 22,997 19,479 218 39 175,802November ........... 81,727 22,000 27,310 24,901 19,953 246 36 176,172December ........... 88,863 21,138 34,027 25,415 22,082 312 29 191,865Total ................... 975,742 305,391 365,060 276,403 280,419 2,978 338 2,206,331
1979January ............... 94,986 22,093 39,474 27,792 25,021 299 26 209,692February ............. 84,748 21,844 32,274 25,911 21,275 245 40 186,337March .................. 85,220 24,916 22,076 24,335 25,921 329 54 182,849April .................... 80,450 24,763 20,599 18,418 25,389 304 39 169,962May ..................... 86,149 26,135 21,470 15,025 28,939 306 44 178,069June .................... 90,817 30,107 24,367 16,065 24,979 310 37 186,682July ..................... 97,879 34,676 25,750 20,825 22,761 328 36 202,255August ................ 97,910 34,949 26,123 24,204 21,260 358 47 204,850September .......... 85,664 31,442 22,509 21,804 18,978 311 43 180,751October ............... 87,528 30,419 20,279 20,934 20,167 348 41 179,716November ........... 87,456 24,661 23,380 19,255 22,367 339 49 177,506December ........... 96,230 23,481 25,223 20,586 22,727 413 43 188,703Total ................... 1,075,037 329,485 303,525 255,155 279,783 3,889 498 2,247,372
1980January ............... 103,258 26,349 24,986 19,746 25,278 336 52 200,005February ............. 98,151 24,755 24,781 19,277 21,378 323 50 188,715March .................. 95,386 26,891 20,415 20,039 24,332 359 42 187,464April .................... 83,562 24,181 16,025 18,794 25,748 376 34 168,720May ..................... 84,884 26,587 16,545 18,385 28,865 443 25 175,734June .................... 93,692 31,295 18,020 18,322 27,656 427 18 189,430July ..................... 108,457 39,063 23,289 21,024 24,469 450 25 216,776August ................ 107,580 37,647 24,885 24,333 20,431 480 37 215,393September .......... 97,557 33,580 17,815 23,572 18,491 434 35 191,485October ............... 91,196 28,592 15,858 24,510 17,866 493 41 178,555November ........... 93,501 24,338 19,989 20,984 19,217 482 39 178,550December ........... 104,339 22,961 23,386 22,130 22,290 469 36 195,613Total ................... 1,161,562 346,240 245,994 251,116 276,021 5,073 433 2,286,439
1981January ............... 111,765 22,081 25,963 23,779 22,338 506 35 206,467February ............. 97,653 21,339 17,444 21,595 21,099 447 36 179,613March .................. 99,482 25,997 16,957 22,004 20,572 501 40 185,553April .................... 88,109 27,460 15,106 20,646 20,723 463 37 172,545May ..................... 88,941 30,070 14,508 19,723 24,081 458 24 177,806June .................... 99,837 35,885 18,972 21,166 26,370 457 15 202,702July ..................... 112,854 38,712 20,072 23,080 25,133 503 20 220,373August ................ 108,403 36,918 16,001 26,946 21,615 497 24 210,403September .......... 97,664 30,850 15,566 24,398 17,822 500 39 186,838October ............... 97,046 28,917 16,213 20,556 18,088 493 38 181,352November ........... 94,841 24,670 13,847 22,783 18,963 430 34 175,570December ........... 106,608 22,877 15,772 25,997 23,879 432 25 195,590Total ................... 1,203,203 345,777 206,421 272,674 260,684 5,686 368 2,294,812
1982January ............... 113,124 22,621 20,674 25,678 26,896 380 31 209,403February ............. 96,906 20,920 15,217 20,188 26,690 350 30 180,299March .................. 97,625 23,598 13,495 22,755 29,885 308 22 187,687April .................... 88,116 23,231 11,192 21,785 27,928 311 17 172,580May ..................... 92,997 24,291 9,868 21,639 27,971 361 20 177,147June .................... 95,314 27,959 10,419 24,026 27,953 436 22 186,128July ..................... 110,617 33,340 13,380 25,467 27,294 458 26 210,584August ................ 110,124 34,418 11,753 24,986 23,894 457 23 205,656September .......... 96,896 27,649 10,363 25,391 19,896 438 30 180,662October ............... 93,769 25,804 9,885 23,248 19,750 467 43 172,966November ........... 95,547 21,466 9,313 23,235 23,297 490 30 173,377December ........... 100,970 19,963 11,238 24,376 27,760 388 27 184,722Total ................... 1,192,004 305,260 146,797 282,773 309,213 4,843 321 2,241,211
See footnotes at end of table.
Energy Information Administration/Historical Monthly Energy Review 1973-1992216
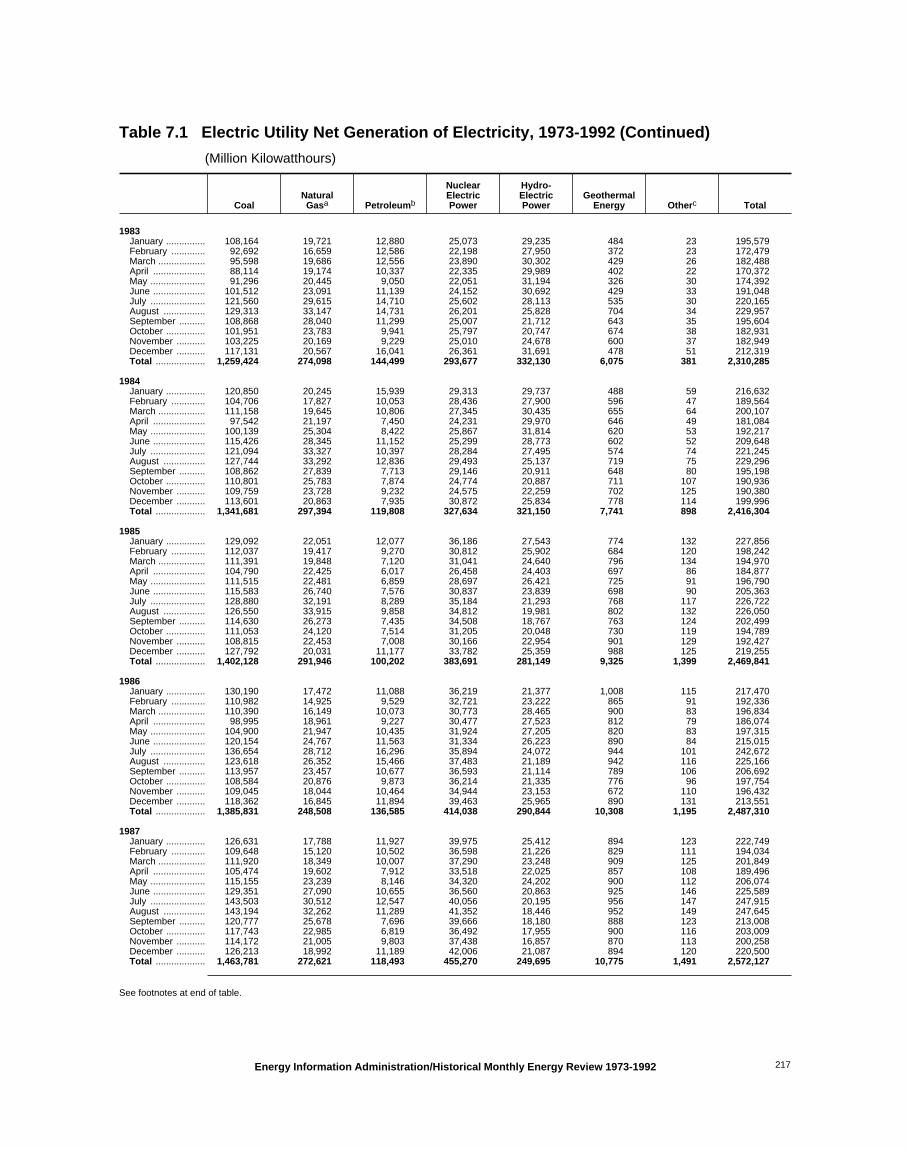
Table 7.1 Electric Utility Net Generation of Electricity, 1973-1992 (Continued)
(Million Kilowatthours)
CoalNaturalGasa Petroleumb
NuclearElectricPower
Hydro-ElectricPower
GeothermalEnergy Otherc Total
1983January ............... 108,164 19,721 12,880 25,073 29,235 484 23 195,579February ............. 92,692 16,659 12,586 22,198 27,950 372 23 172,479March .................. 95,598 19,686 12,556 23,890 30,302 429 26 182,488April .................... 88,114 19,174 10,337 22,335 29,989 402 22 170,372May ..................... 91,296 20,445 9,050 22,051 31,194 326 30 174,392June .................... 101,512 23,091 11,139 24,152 30,692 429 33 191,048July ..................... 121,560 29,615 14,710 25,602 28,113 535 30 220,165August ................ 129,313 33,147 14,731 26,201 25,828 704 34 229,957September .......... 108,868 28,040 11,299 25,007 21,712 643 35 195,604October ............... 101,951 23,783 9,941 25,797 20,747 674 38 182,931November ........... 103,225 20,169 9,229 25,010 24,678 600 37 182,949December ........... 117,131 20,567 16,041 26,361 31,691 478 51 212,319Total ................... 1,259,424 274,098 144,499 293,677 332,130 6,075 381 2,310,285
1984January ............... 120,850 20,245 15,939 29,313 29,737 488 59 216,632February ............. 104,706 17,827 10,053 28,436 27,900 596 47 189,564March .................. 111,158 19,645 10,806 27,345 30,435 655 64 200,107April .................... 97,542 21,197 7,450 24,231 29,970 646 49 181,084May ..................... 100,139 25,304 8,422 25,867 31,814 620 53 192,217June .................... 115,426 28,345 11,152 25,299 28,773 602 52 209,648July ..................... 121,094 33,327 10,397 28,284 27,495 574 74 221,245August ................ 127,744 33,292 12,836 29,493 25,137 719 75 229,296September .......... 108,862 27,839 7,713 29,146 20,911 648 80 195,198October ............... 110,801 25,783 7,874 24,774 20,887 711 107 190,936November ........... 109,759 23,728 9,232 24,575 22,259 702 125 190,380December ........... 113,601 20,863 7,935 30,872 25,834 778 114 199,996Total ................... 1,341,681 297,394 119,808 327,634 321,150 7,741 898 2,416,304
1985January ............... 129,092 22,051 12,077 36,186 27,543 774 132 227,856February ............. 112,037 19,417 9,270 30,812 25,902 684 120 198,242March .................. 111,391 19,848 7,120 31,041 24,640 796 134 194,970April .................... 104,790 22,425 6,017 26,458 24,403 697 86 184,877May ..................... 111,515 22,481 6,859 28,697 26,421 725 91 196,790June .................... 115,583 26,740 7,576 30,837 23,839 698 90 205,363July ..................... 128,880 32,191 8,289 35,184 21,293 768 117 226,722August ................ 126,550 33,915 9,858 34,812 19,981 802 132 226,050September .......... 114,630 26,273 7,435 34,508 18,767 763 124 202,499October ............... 111,053 24,120 7,514 31,205 20,048 730 119 194,789November ........... 108,815 22,453 7,008 30,166 22,954 901 129 192,427December ........... 127,792 20,031 11,177 33,782 25,359 988 125 219,255Total ................... 1,402,128 291,946 100,202 383,691 281,149 9,325 1,399 2,469,841
1986January ............... 130,190 17,472 11,088 36,219 21,377 1,008 115 217,470February ............. 110,982 14,925 9,529 32,721 23,222 865 91 192,336March .................. 110,390 16,149 10,073 30,773 28,465 900 83 196,834April .................... 98,995 18,961 9,227 30,477 27,523 812 79 186,074May ..................... 104,900 21,947 10,435 31,924 27,205 820 83 197,315June .................... 120,154 24,767 11,563 31,334 26,223 890 84 215,015July ..................... 136,654 28,712 16,296 35,894 24,072 944 101 242,672August ................ 123,618 26,352 15,466 37,483 21,189 942 116 225,166September .......... 113,957 23,457 10,677 36,593 21,114 789 106 206,692October ............... 108,584 20,876 9,873 36,214 21,335 776 96 197,754November ........... 109,045 18,044 10,464 34,944 23,153 672 110 196,432December ........... 118,362 16,845 11,894 39,463 25,965 890 131 213,551Total ................... 1,385,831 248,508 136,585 414,038 290,844 10,308 1,195 2,487,310
1987January ............... 126,631 17,788 11,927 39,975 25,412 894 123 222,749February ............. 109,648 15,120 10,502 36,598 21,226 829 111 194,034March .................. 111,920 18,349 10,007 37,290 23,248 909 125 201,849April .................... 105,474 19,602 7,912 33,518 22,025 857 108 189,496May ..................... 115,155 23,239 8,146 34,320 24,202 900 112 206,074June .................... 129,351 27,090 10,655 36,560 20,863 925 146 225,589July ..................... 143,503 30,512 12,547 40,056 20,195 956 147 247,915August ................ 143,194 32,262 11,289 41,352 18,446 952 149 247,645September .......... 120,777 25,678 7,696 39,666 18,180 888 123 213,008October ............... 117,743 22,985 6,819 36,492 17,955 900 116 203,009November ........... 114,172 21,005 9,803 37,438 16,857 870 113 200,258December ........... 126,213 18,992 11,189 42,006 21,087 894 120 220,500Total ................... 1,463,781 272,621 118,493 455,270 249,695 10,775 1,491 2,572,127
See footnotes at end of table.
Energy Information Administration/Historical Monthly Energy Review 1973-1992 217
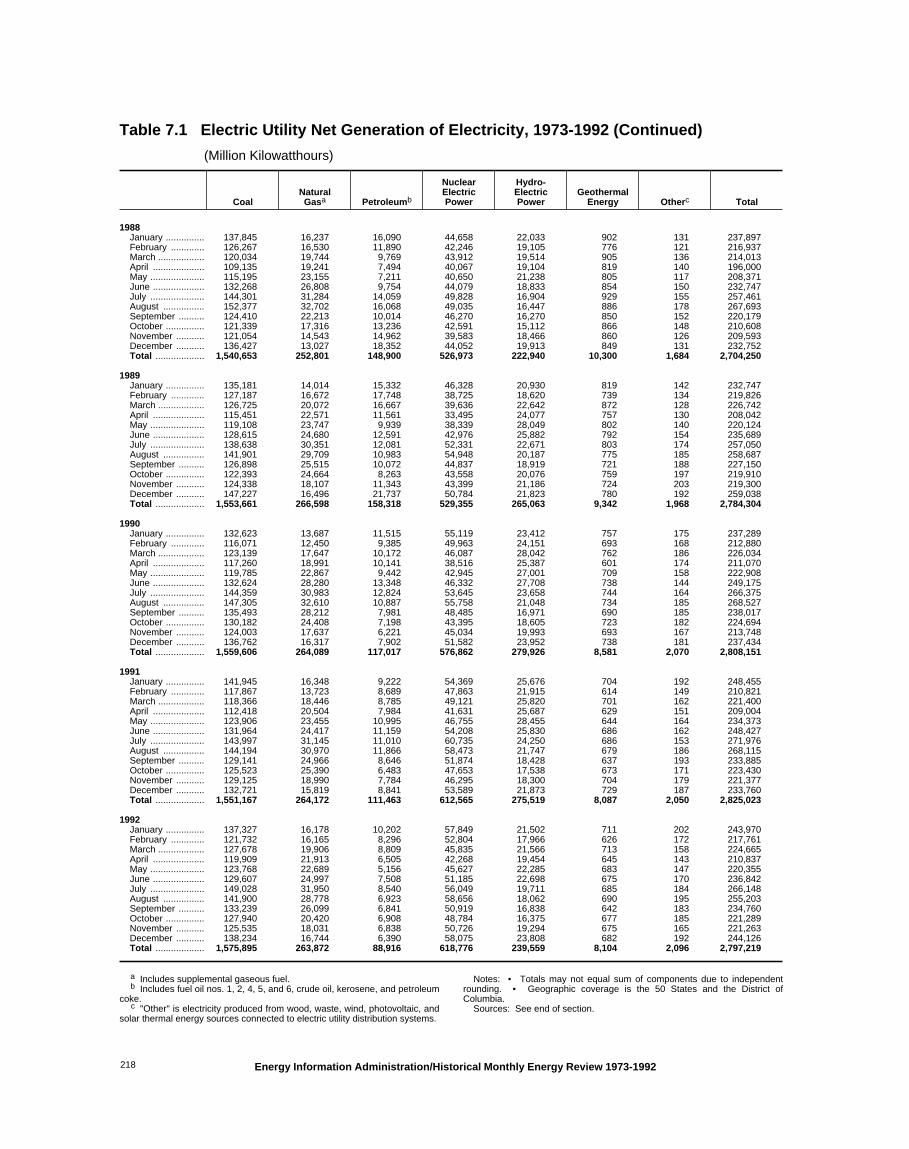
Table 7.1 Electric Utility Net Generation of Electricity, 1973-1992 (Continued)
(Million Kilowatthours)
CoalNaturalGasa Petroleumb
NuclearElectricPower
Hydro-ElectricPower
GeothermalEnergy Otherc Total
1988January ............... 137,845 16,237 16,090 44,658 22,033 902 131 237,897February ............. 126,267 16,530 11,890 42,246 19,105 776 121 216,937March .................. 120,034 19,744 9,769 43,912 19,514 905 136 214,013April .................... 109,135 19,241 7,494 40,067 19,104 819 140 196,000May ..................... 115,195 23,155 7,211 40,650 21,238 805 117 208,371June .................... 132,268 26,808 9,754 44,079 18,833 854 150 232,747July ..................... 144,301 31,284 14,059 49,828 16,904 929 155 257,461August ................ 152,377 32,702 16,068 49,035 16,447 886 178 267,693September .......... 124,410 22,213 10,014 46,270 16,270 850 152 220,179October ............... 121,339 17,316 13,236 42,591 15,112 866 148 210,608November ........... 121,054 14,543 14,962 39,583 18,466 860 126 209,593December ........... 136,427 13,027 18,352 44,052 19,913 849 131 232,752Total ................... 1,540,653 252,801 148,900 526,973 222,940 10,300 1,684 2,704,250
1989January ............... 135,181 14,014 15,332 46,328 20,930 819 142 232,747February ............. 127,187 16,672 17,748 38,725 18,620 739 134 219,826March .................. 126,725 20,072 16,667 39,636 22,642 872 128 226,742April .................... 115,451 22,571 11,561 33,495 24,077 757 130 208,042May ..................... 119,108 23,747 9,939 38,339 28,049 802 140 220,124June .................... 128,615 24,680 12,591 42,976 25,882 792 154 235,689July ..................... 138,638 30,351 12,081 52,331 22,671 803 174 257,050August ................ 141,901 29,709 10,983 54,948 20,187 775 185 258,687September .......... 126,898 25,515 10,072 44,837 18,919 721 188 227,150October ............... 122,393 24,664 8,263 43,558 20,076 759 197 219,910November ........... 124,338 18,107 11,343 43,399 21,186 724 203 219,300December ........... 147,227 16,496 21,737 50,784 21,823 780 192 259,038Total ................... 1,553,661 266,598 158,318 529,355 265,063 9,342 1,968 2,784,304
1990January ............... 132,623 13,687 11,515 55,119 23,412 757 175 237,289February ............. 116,071 12,450 9,385 49,963 24,151 693 168 212,880March .................. 123,139 17,647 10,172 46,087 28,042 762 186 226,034April .................... 117,260 18,991 10,141 38,516 25,387 601 174 211,070May ..................... 119,785 22,867 9,442 42,945 27,001 709 158 222,908June .................... 132,624 28,280 13,348 46,332 27,708 738 144 249,175July ..................... 144,359 30,983 12,824 53,645 23,658 744 164 266,375August ................ 147,305 32,610 10,887 55,758 21,048 734 185 268,527September .......... 135,493 28,212 7,981 48,485 16,971 690 185 238,017October ............... 130,182 24,408 7,198 43,395 18,605 723 182 224,694November ........... 124,003 17,637 6,221 45,034 19,993 693 167 213,748December ........... 136,762 16,317 7,902 51,582 23,952 738 181 237,434Total ................... 1,559,606 264,089 117,017 576,862 279,926 8,581 2,070 2,808,151
1991January ............... 141,945 16,348 9,222 54,369 25,676 704 192 248,455February ............. 117,867 13,723 8,689 47,863 21,915 614 149 210,821March .................. 118,366 18,446 8,785 49,121 25,820 701 162 221,400April .................... 112,418 20,504 7,984 41,631 25,687 629 151 209,004May ..................... 123,906 23,455 10,995 46,755 28,455 644 164 234,373June .................... 131,964 24,417 11,159 54,208 25,830 686 162 248,427July ..................... 143,997 31,145 11,010 60,735 24,250 686 153 271,976August ................ 144,194 30,970 11,866 58,473 21,747 679 186 268,115September .......... 129,141 24,966 8,646 51,874 18,428 637 193 233,885October ............... 125,523 25,390 6,483 47,653 17,538 673 171 223,430November ........... 129,125 18,990 7,784 46,295 18,300 704 179 221,377December ........... 132,721 15,819 8,841 53,589 21,873 729 187 233,760Total ................... 1,551,167 264,172 111,463 612,565 275,519 8,087 2,050 2,825,023
1992January ............... 137,327 16,178 10,202 57,849 21,502 711 202 243,970February ............. 121,732 16,165 8,296 52,804 17,966 626 172 217,761March .................. 127,678 19,906 8,809 45,835 21,566 713 158 224,665April .................... 119,909 21,913 6,505 42,268 19,454 645 143 210,837May ..................... 123,768 22,689 5,156 45,627 22,285 683 147 220,355June .................... 129,607 24,997 7,508 51,185 22,698 675 170 236,842July ..................... 149,028 31,950 8,540 56,049 19,711 685 184 266,148August ................ 141,900 28,778 6,923 58,656 18,062 690 195 255,203September .......... 133,239 26,099 6,841 50,919 16,838 642 183 234,760October ............... 127,940 20,420 6,908 48,784 16,375 677 185 221,289November ........... 125,535 18,031 6,838 50,726 19,294 675 165 221,263December ........... 138,234 16,744 6,390 58,075 23,808 682 192 244,126Total ................... 1,575,895 263,872 88,916 618,776 239,559 8,104 2,096 2,797,219
a Includes supplemental gaseous fuel.b Includes fuel oil nos. 1, 2, 4, 5, and 6, crude oil, kerosene, and petroleum
coke.c "Other" is electricity produced from wood, waste, wind, photovoltaic, and
solar thermal energy sources connected to electric utility distribution systems.
Notes: • Totals may not equal sum of components due to independentrounding. • Geographic coverage is the 50 States and the District ofColumbia.
Sources: See end of section.
Energy Information Administration/Historical Monthly Energy Review 1973-1992218

Table 7.2 Electricity Sales by End-Use Sector, 1973-1992
(Million Kilowatthours)
Residential Commercial Industrial Othera Total
MonthlySeriesb
AnnualSeries
MonthlySeriesb
AnnualSeries
MonthlySeriesb
AnnualSeries
MonthlySeriesb
AnnualSeries
MonthlySeriesb
AnnualSeries
1973January ................... 52,840 – 31,182 – 55,274 – 5,209 – 144,505 –February ................. 49,601 – 30,445 – 54,591 – 4,909 – 139,546 –March ...................... 46,315 – 30,100 – 55,866 – 4,822 – 137,102 –April ........................ 41,821 – 29,038 – 55,937 – 4,571 – 131,366 –May ......................... 39,825 – 30,060 – 56,838 – 4,638 – 131,361 –June ........................ 44,967 – 33,194 – 57,368 – 4,764 – 140,293 –July ......................... 54,123 – 36,147 – 57,152 – 5,140 – 152,562 –August .................... 56,742 – 36,820 – 58,865 – 5,054 – 157,481 –September .............. 56,210 – 36,711 – 59,178 – 5,211 – 157,310 –October ................... 47,207 – 33,289 – 60,514 – 5,032 – 146,042 –November ............... 43,181 – 31,453 – 58,433 – 5,075 – 138,142 –December ............... 46,399 – 29,829 – 56,070 – 4,902 – 137,199 –Total ....................... 579,231 NA 388,266 NA 686,085 NA 59,326 NA 1,712,909 NA
1974January ................... 52,878 – 30,647 – 55,457 – 5,004 – 143,986 –February ................. 47,779 – 29,563 – 54,799 – 4,596 – 136,737 –March ...................... 46,096 – 29,345 – 55,814 – 4,696 – 135,952 –April ........................ 43,193 – 29,090 – 56,115 – 4,610 – 133,007 –May ......................... 41,105 – 30,061 – 57,226 – 4,685 – 133,077 –June ........................ 46,597 – 32,988 – 57,702 – 4,643 – 141,931 –July ......................... 53,540 – 35,498 – 57,503 – 4,969 – 151,511 –August .................... 56,699 – 36,702 – 59,641 – 5,070 – 158,112 –September .............. 52,948 – 35,801 – 59,893 – 4,977 – 153,619 –October ................... 44,164 – 32,275 – 60,116 – 4,800 – 141,355 –November ............... 42,671 – 30,986 – 57,175 – 4,952 – 135,784 –December ............... 50,512 – 31,868 – 53,433 – 5,039 – 140,852 –Total ....................... 578,184 NA 384,826 NA 684,875 NA 58,039 NA 1,705,924 NA
1975January ................... 54,311 – 32,513 – 56,611 – 5,959 – 149,394 –February ................. 50,495 – 31,566 – 55,363 – 5,550 – 142,973 –March ...................... 48,239 – 31,299 – 55,567 – 5,644 – 140,749 –April ........................ 45,007 – 30,571 – 54,981 – 5,274 – 135,833 –May ......................... 41,294 – 31,029 – 55,835 – 5,410 – 133,568 –June ........................ 46,034 – 34,786 – 56,785 – 5,390 – 142,996 –July ......................... 54,325 – 37,768 – 56,460 – 5,651 – 154,204 –August .................... 57,659 – 38,714 – 58,813 – 5,716 – 160,902 –September .............. 54,720 – 37,462 – 59,575 – 5,984 – 157,741 –October ................... 43,255 – 32,921 – 59,891 – 5,751 – 141,818 –November ............... 42,289 – 31,711 – 59,278 – 5,982 – 139,260 –December ............... 50,513 – 32,708 – 58,519 – 5,913 – 147,653 –Total ....................... 588,140 NA 403,049 NA 687,680 NA 68,222 NA 1,747,091 NA
1976January ................... 60,492 – 35,080 – 58,601 – 6,365 – 160,539 –February ................. 54,588 – 33,924 – 59,175 – 5,861 – 153,549 –March ...................... 47,295 – 32,624 – 61,573 – 5,972 – 147,465 –April ........................ 43,811 – 31,920 – 61,188 – 5,392 – 142,310 –May ......................... 41,281 – 32,648 – 62,395 – 5,479 – 141,804 –June ........................ 44,382 – 35,443 – 63,837 – 5,376 – 149,039 –July ......................... 54,029 – 39,627 – 63,487 – 5,863 – 163,006 –August .................... 57,706 – 40,076 – 65,013 – 5,836 – 168,631 –September .............. 53,771 – 38,953 – 65,555 – 6,132 – 164,412 –October ................... 44,996 – 35,094 – 65,240 – 5,655 – 150,985 –November ............... 46,986 – 33,737 – 64,209 – 5,808 – 150,741 –December ............... 57,112 – 35,967 – 63,795 – 5,892 – 162,766 –Total ....................... 606,452 NA 425,094 NA 754,069 NA 69,631 NA 1,855,246 NA
1977January ................... 65,758 – 37,736 – 62,576 – 6,281 – 172,351 –February ................. 61,839 – 36,237 – 61,445 – 5,777 – 165,298 –March ...................... 51,173 – 34,366 – 64,500 – 6,165 – 156,204 –April ........................ 44,668 – 33,291 – 64,537 – 5,431 – 147,926 –May ......................... 41,825 – 34,410 – 66,747 – 5,620 – 148,602 –June ........................ 48,729 – 37,793 – 67,165 – 5,608 – 159,294 –July ......................... 61,377 – 42,017 – 65,666 – 5,938 – 174,998 –August .................... 62,692 – 42,634 – 67,426 – 5,838 – 178,590 –September .............. 57,630 – 41,213 – 67,463 – 5,956 – 172,262 –October ................... 49,021 – 36,779 – 67,560 – 5,989 – 159,348 –November ............... 45,241 – 34,192 – 65,985 – 5,893 – 151,312 –December ............... 55,287 – 35,845 – 64,969 – 6,075 – 162,175 –Total ....................... 645,239 NA 446,514 NA 786,037 NA 70,571 NA 1,948,361 NA
See footnotes at end of table.
Energy Information Administration/Historical Monthly Energy Review 1973-1992 219

Table 7.2 Electricity Sales by End-Use Sector, 1973-1992 (Continued)
(Million Kilowatthours)
Residential Commercial Industrial Othera Total
MonthlySeriesb
AnnualSeries
MonthlySeriesb
AnnualSeries
MonthlySeriesb
AnnualSeries
MonthlySeriesb
AnnualSeries
MonthlySeriesb
AnnualSeries
1978January ................... 65,906 – 38,271 – 65,883 – 6,589 – 176,649 –February ................. 64,579 – 37,606 – 61,461 – 6,281 – 169,927 –March ...................... 58,781 – 36,413 – 62,173 – 6,039 – 163,406 –April ........................ 47,396 – 33,737 – 63,891 – 5,361 – 150,385 –May ......................... 44,012 – 34,109 – 67,791 – 5,592 – 151,504 –June ........................ 50,832 – 39,219 – 69,635 – 5,833 – 165,519 –July ......................... 61,747 – 42,997 – 68,004 – 6,366 – 179,114 –August .................... 63,843 – 43,849 – 70,388 – 6,143 – 184,223 –September .............. 61,984 – 43,094 – 71,124 – 6,436 – 182,638 –October ................... 51,108 – 38,354 – 71,259 – 6,001 – 166,722 –November ............... 47,220 – 35,864 – 69,702 – 6,340 – 159,126 –December ............... 57,058 – 37,650 – 67,767 – 6,234 – 168,709 –Total ....................... 674,466 NA 461,163 NA 809,078 NA 73,215 NA 2,017,922 NA
1979January ................... 69,939 – 40,362 – 68,324 – 6,762 – 185,387 –February ................. 67,842 – 39,865 – 67,632 – 6,176 – 181,515 –March ...................... 59,314 – 38,123 – 69,783 – 6,029 – 173,249 –April ........................ 50,079 – 35,930 – 69,944 – 5,604 – 161,557 –May ......................... 45,730 – 36,398 – 71,798 – 5,625 – 159,551 –June ........................ 49,556 – 39,689 – 71,919 – 5,696 – 166,860 –July ......................... 58,606 – 42,773 – 70,984 – 5,976 – 178,339 –August .................... 64,808 – 44,199 – 71,956 – 6,346 – 187,309 –September .............. 59,703 – 42,498 – 71,014 – 6,425 – 179,640 –October ................... 49,505 – 38,820 – 71,472 – 6,151 – 165,948 –November ............... 49,617 – 36,711 – 69,780 – 6,163 – 162,271 –December ............... 58,120 – 37,939 – 67,297 – 6,117 – 169,473 –Total ....................... 682,819 NA 473,307 NA 841,903 NA 73,070 NA 2,071,099 NA
1980January ................... 65,841 – 39,578 – 67,532 – 6,634 – 179,585 –February ................. 64,514 – 39,528 – 68,508 – 6,171 – 178,721 –March ...................... 60,497 – 38,762 – 69,086 – 6,028 – 174,373 –April ........................ 51,749 – 36,453 – 67,908 – 5,591 – 161,701 –May ......................... 45,699 – 36,110 – 67,235 – 5,807 – 154,851 –June ........................ 52,267 – 40,129 – 66,739 – 5,737 – 164,872 –July ......................... 68,611 – 45,525 – 65,531 – 6,215 – 185,882 –August .................... 75,020 – 47,763 – 67,415 – 6,266 – 196,464 –September .............. 67,969 – 46,028 – 69,570 – 6,572 – 190,139 –October ................... 54,014 – 40,479 – 69,413 – 6,174 – 170,080 –November ............... 50,539 – 37,954 – 67,613 – 6,068 – 162,174 –December ............... 60,775 – 39,846 – 68,517 – 6,469 – 175,607 –Total ....................... 717,495 NA 488,155 NA 815,067 NA 73,732 NA 2,094,449 NA
1981January ................... 74,087 – 43,229 – 67,076 – 7,557 – 191,949 –February ................. 66,359 – 41,345 – 67,411 – 7,092 – 182,207 –March ...................... 57,660 – 39,541 – 68,590 – 7,035 – 172,826 –April ........................ 50,914 – 37,910 – 68,138 – 6,562 – 163,525 –May ......................... 48,348 – 39,331 – 68,714 – 6,780 – 163,173 –June ........................ 56,165 – 44,244 – 71,641 – 6,777 – 178,827 –July ......................... 69,990 – 48,989 – 71,712 – 7,124 – 197,814 –August .................... 70,299 – 49,003 – 72,010 – 7,147 – 198,459 –September .............. 61,098 – 46,977 – 71,011 – 7,164 – 186,250 –October ................... 52,989 – 42,183 – 69,154 – 7,024 – 171,350 –November ............... 51,965 – 39,747 – 66,161 – 7,143 – 165,016 –December ............... 62,391 – 41,839 – 64,124 – 7,351 – 175,705 –Total ....................... 722,265 NA 514,338 NA 825,743 NA 84,756 NA 2,147,103 NA
1982January ................... 76,264 – 44,947 – 62,939 – 7,929 – 192,079 –February ................. 69,128 – 43,459 – 62,778 – 7,441 – 182,805 –March ...................... 60,498 – 41,710 – 64,496 – 7,255 – 173,959 –April ........................ 54,918 – 40,036 – 62,723 – 6,836 – 164,512 –May ......................... 49,092 – 40,021 – 62,480 – 6,977 – 158,569 –June ........................ 54,083 – 44,206 – 63,684 – 6,766 – 168,739 –July ......................... 65,704 – 48,211 – 62,617 – 7,035 – 183,567 –August .................... 69,906 – 49,720 – 63,306 – 6,808 – 189,740 –September .............. 63,053 – 48,068 – 59,980 – 7,194 – 178,296 –October ................... 52,638 – 42,864 – 60,830 – 7,084 – 163,416 –November ............... 52,136 – 40,572 – 60,651 – 7,122 – 160,480 –December ............... 62,102 – 42,584 – 58,464 – 7,128 – 170,279 –Total ....................... 729,520 NA 526,397 NA 744,949 NA 85,575 NA 2,086,441 NA
See footnotes at end of table.
Energy Information Administration/Historical Monthly Energy Review 1973-1992220

Table 7.2 Electricity Sales by End-Use Sector, 1973-1992 (Continued)
(Million Kilowatthours)
Residential Commercial Industrial Othera Total
MonthlySeriesb
AnnualSeries
MonthlySeriesb
AnnualSeries
MonthlySeriesb
AnnualSeries
MonthlySeriesb
AnnualSeries
MonthlySeriesb
AnnualSeries
1983January ................... 69,967 – 44,019 – 57,938 – 7,252 – 179,176 –February ................. 65,039 – 42,475 – 59,032 – 6,919 – 173,465 –March ...................... 58,912 – 41,518 – 60,261 – 6,893 – 167,584 –April ........................ 56,284 – 40,679 – 60,548 – 6,296 – 163,807 –May ......................... 49,669 – 40,305 – 62,729 – 6,216 – 158,919 –June ........................ 54,138 – 45,086 – 66,152 – 6,228 – 171,604 –July ......................... 69,965 – 51,013 – 66,424 – 6,752 – 194,153 –August .................... 78,374 – 53,245 – 69,611 – 6,885 – 208,115 –September .............. 73,197 – 52,147 – 69,618 – 6,960 – 201,922 –October ................... 55,374 – 45,517 – 68,924 – 6,492 – 176,307 –November ............... 53,704 – 42,666 – 67,544 – 6,560 – 170,474 –December ............... 66,326 – 45,119 – 67,217 – 6,765 – 185,428 –Total ....................... 750,948 NA 543,788 NA 775,999 NA 80,219 NA 2,150,955 NA
1984January ................... 83,295 – 49,243 – 66,709 – 7,289 – 206,537 –February ................. 69,818 – 46,293 – 67,445 – 6,690 – 190,246 –March ...................... 63,656 – 45,232 – 69,684 – 6,902 – 185,475 –April ........................ 56,373 – 43,052 – 69,048 – 6,339 – 174,813 –May ......................... 53,519 – 44,150 – 70,774 – 6,559 – 175,003 –June ........................ 59,955 – 49,454 – 73,037 – 6,714 – 189,160 –July ......................... 71,020 – 53,922 – 71,843 – 7,006 – 203,791 –August .................... 73,138 – 53,603 – 74,534 – 7,089 – 208,364 –September .............. 67,456 – 52,854 – 71,275 – 6,780 – 198,365 –October ................... 55,965 – 48,061 – 70,945 – 6,732 – 181,702 –November ............... 56,543 – 45,937 – 68,688 – 6,840 – 178,008 –December ............... 66,916 – 46,481 – 66,606 – 6,908 – 186,910 –Total ....................... 777,654 780,092 578,281 582,621 840,588 837,836 81,849 85,248 2,278,372 2,285,796
1985January ................... 77,242 – 49,634 – 67,219 – 7,270 – 201,364 –February ................. 78,011 – 49,406 – 66,582 – 7,046 – 201,045 –March ...................... 63,981 – 46,629 – 67,437 – 6,875 – 184,922 –April ........................ 56,025 – 45,826 – 68,445 – 7,049 – 177,345 –May ......................... 52,842 – 47,711 – 70,140 – 6,903 – 177,596 –June ........................ 60,652 – 51,521 – 70,091 – 6,848 – 189,112 –July ......................... 70,966 – 56,128 – 69,760 – 7,135 – 203,989 –August .................... 73,693 – 57,041 – 71,402 – 7,277 – 209,414 –September .............. 71,064 – 55,960 – 70,744 – 7,263 – 205,030 –October ................... 57,515 – 49,978 – 69,158 – 6,903 – 183,554 –November ............... 56,794 – 47,843 – 67,164 – 7,264 – 179,065 –December ............... 72,192 – 51,289 – 66,383 – 7,243 – 197,107 –Total ....................... 790,977 793,934 608,968 605,989 824,523 836,772 85,075 87,279 2,309,543 2,323,974
1986January ................... 82,755 – 53,377 – 65,400 – 7,246 – 208,779 –February ................. 70,949 – 50,481 – 65,373 – 6,863 – 193,665 –March ...................... 65,318 – 48,256 – 67,018 – 6,837 – 187,430 –April ........................ 56,647 – 47,243 – 66,783 – 6,275 – 176,949 –May ......................... 54,266 – 48,867 – 68,076 – 6,804 – 178,012 –June ........................ 63,986 – 57,121 – 67,973 – 6,872 – 195,953 –July ......................... 80,365 – 61,100 – 68,814 – 7,533 – 217,812 –August .................... 80,425 – 60,528 – 68,737 – 7,254 – 216,943 –September .............. 68,543 – 57,711 – 69,396 – 7,156 – 202,807 –October ................... 62,875 – 53,256 – 69,487 – 7,025 – 192,642 –November ............... 58,589 – 50,278 – 65,239 – 6,255 – 180,362 –December ............... 72,945 – 53,250 – 65,995 – 7,290 – 199,480 –Total ....................... 817,663 819,088 641,469 630,520 808,292 830,531 83,409 88,615 2,350,835 2,368,753
1987January ................... 82,132 – 54,503 – 65,528 – 7,435 – 209,598 –February ................. 73,435 – 52,216 – 65,259 – 7,157 – 198,066 –March ...................... 67,370 – 51,259 – 67,803 – 7,021 – 193,453 –April ........................ 60,014 – 49,706 – 67,962 – 6,854 – 184,536 –May ......................... 58,499 – 53,465 – 69,910 – 7,050 – 188,924 –June ........................ 68,859 – 59,265 – 72,365 – 7,308 – 207,798 –July ......................... 83,751 – 64,427 – 73,485 – 7,586 – 229,249 –August .................... 88,160 – 65,103 – 74,520 – 7,669 – 235,451 –September .............. 73,439 – 61,269 – 74,419 – 7,280 – 216,407 –October ................... 60,848 – 55,915 – 73,147 – 7,136 – 197,046 –November ............... 60,008 – 52,118 – 70,870 – 7,104 – 190,100 –December ............... 73,099 – 54,462 – 69,999 – 7,254 – 204,814 –Total ....................... 849,613 850,410 673,707 660,433 845,266 858,233 86,854 88,196 2,455,440 2,457,272
See footnotes at end of table.
Energy Information Administration/Historical Monthly Energy Review 1973-1992 221
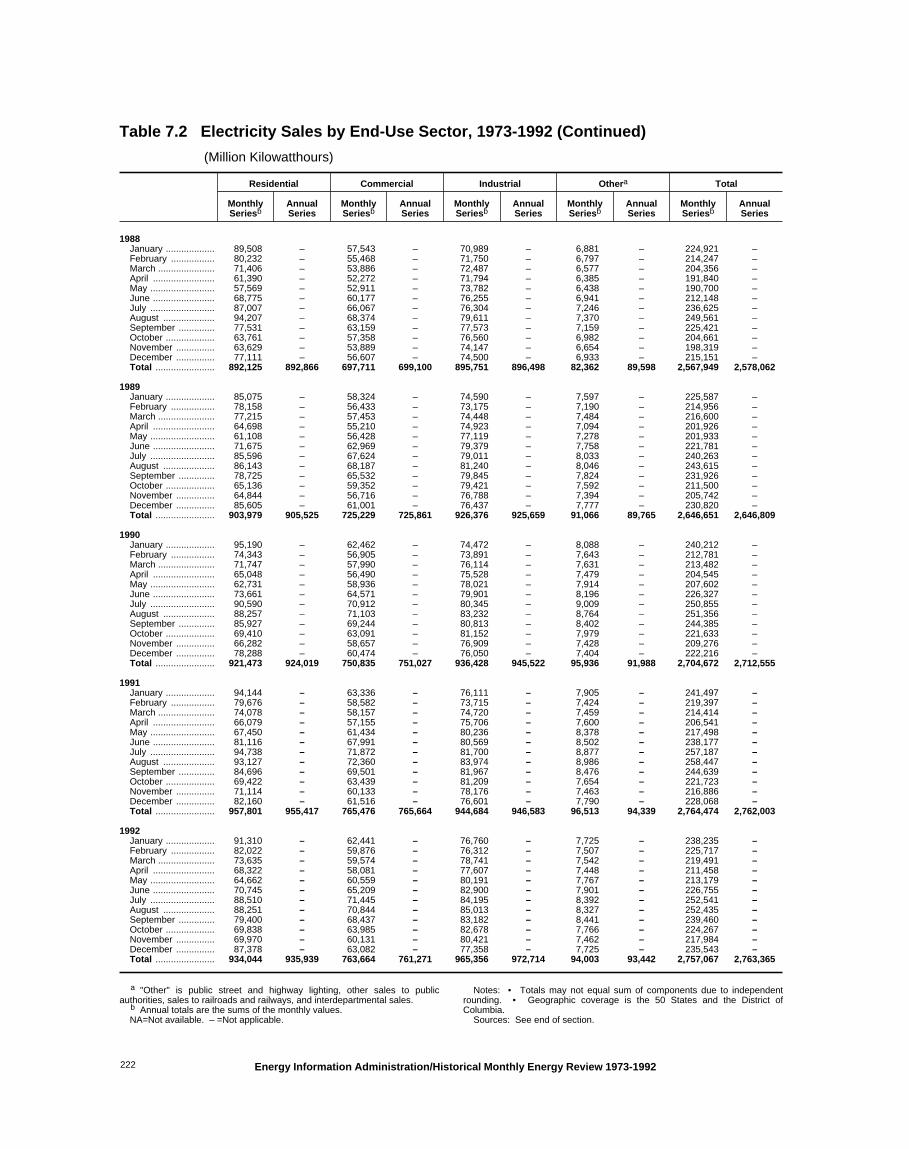
Table 7.2 Electricity Sales by End-Use Sector, 1973-1992 (Continued)
(Million Kilowatthours)
Residential Commercial Industrial Othera Total
MonthlySeriesb
AnnualSeries
MonthlySeriesb
AnnualSeries
MonthlySeriesb
AnnualSeries
MonthlySeriesb
AnnualSeries
MonthlySeriesb
AnnualSeries
1988January ................... 89,508 – 57,543 – 70,989 – 6,881 – 224,921 –February ................. 80,232 – 55,468 – 71,750 – 6,797 – 214,247 –March ...................... 71,406 – 53,886 – 72,487 – 6,577 – 204,356 –April ........................ 61,390 – 52,272 – 71,794 – 6,385 – 191,840 –May ......................... 57,569 – 52,911 – 73,782 – 6,438 – 190,700 –June ........................ 68,775 – 60,177 – 76,255 – 6,941 – 212,148 –July ......................... 87,007 – 66,067 – 76,304 – 7,246 – 236,625 –August .................... 94,207 – 68,374 – 79,611 – 7,370 – 249,561 –September .............. 77,531 – 63,159 – 77,573 – 7,159 – 225,421 –October ................... 63,761 – 57,358 – 76,560 – 6,982 – 204,661 –November ............... 63,629 – 53,889 – 74,147 – 6,654 – 198,319 –December ............... 77,111 – 56,607 – 74,500 – 6,933 – 215,151 –Total ....................... 892,125 892,866 697,711 699,100 895,751 896,498 82,362 89,598 2,567,949 2,578,062
1989January ................... 85,075 – 58,324 – 74,590 – 7,597 – 225,587 –February ................. 78,158 – 56,433 – 73,175 – 7,190 – 214,956 –March ...................... 77,215 – 57,453 – 74,448 – 7,484 – 216,600 –April ........................ 64,698 – 55,210 – 74,923 – 7,094 – 201,926 –May ......................... 61,108 – 56,428 – 77,119 – 7,278 – 201,933 –June ........................ 71,675 – 62,969 – 79,379 – 7,758 – 221,781 –July ......................... 85,596 – 67,624 – 79,011 – 8,033 – 240,263 –August .................... 86,143 – 68,187 – 81,240 – 8,046 – 243,615 –September .............. 78,725 – 65,532 – 79,845 – 7,824 – 231,926 –October ................... 65,136 – 59,352 – 79,421 – 7,592 – 211,500 –November ............... 64,844 – 56,716 – 76,788 – 7,394 – 205,742 –December ............... 85,605 – 61,001 – 76,437 – 7,777 – 230,820 –Total ....................... 903,979 905,525 725,229 725,861 926,376 925,659 91,066 89,765 2,646,651 2,646,809
1990January ................... 95,190 – 62,462 – 74,472 – 8,088 – 240,212 –February ................. 74,343 – 56,905 – 73,891 – 7,643 – 212,781 –March ...................... 71,747 – 57,990 – 76,114 – 7,631 – 213,482 –April ........................ 65,048 – 56,490 – 75,528 – 7,479 – 204,545 –May ......................... 62,731 – 58,936 – 78,021 – 7,914 – 207,602 –June ........................ 73,661 – 64,571 – 79,901 – 8,196 – 226,327 –July ......................... 90,590 – 70,912 – 80,345 – 9,009 – 250,855 –August .................... 88,257 – 71,103 – 83,232 – 8,764 – 251,356 –September .............. 85,927 – 69,244 – 80,813 – 8,402 – 244,385 –October ................... 69,410 – 63,091 – 81,152 – 7,979 – 221,633 –November ............... 66,282 – 58,657 – 76,909 – 7,428 – 209,276 –December ............... 78,288 – 60,474 – 76,050 – 7,404 – 222,216 –Total ....................... 921,473 924,019 750,835 751,027 936,428 945,522 95,936 91,988 2,704,672 2,712,555
1991January ................... 94,144 – 63,336 – 76,111 – 7,905 – 241,497 –February ................. 79,676 – 58,582 – 73,715 – 7,424 – 219,397 –March ...................... 74,078 – 58,157 – 74,720 – 7,459 – 214,414 –April ........................ 66,079 – 57,155 – 75,706 – 7,600 – 206,541 –May ......................... 67,450 – 61,434 – 80,236 – 8,378 – 217,498 –June ........................ 81,116 – 67,991 – 80,569 – 8,502 – 238,177 –July ......................... 94,738 – 71,872 – 81,700 – 8,877 – 257,187 –August .................... 93,127 – 72,360 – 83,974 – 8,986 – 258,447 –September .............. 84,696 – 69,501 – 81,967 – 8,476 – 244,639 –October ................... 69,422 – 63,439 – 81,209 – 7,654 – 221,723 –November ............... 71,114 – 60,133 – 78,176 – 7,463 – 216,886 –December ............... 82,160 – 61,516 – 76,601 – 7,790 – 228,068 –Total ....................... 957,801 955,417 765,476 765,664 944,684 946,583 96,513 94,339 2,764,474 2,762,003
1992January ................... 91,310 – 62,441 – 76,760 – 7,725 – 238,235 –February ................. 82,022 – 59,876 – 76,312 – 7,507 – 225,717 –March ...................... 73,635 – 59,574 – 78,741 – 7,542 – 219,491 –April ........................ 68,322 – 58,081 – 77,607 – 7,448 – 211,458 –May ......................... 64,662 – 60,559 – 80,191 – 7,767 – 213,179 –June ........................ 70,745 – 65,209 – 82,900 – 7,901 – 226,755 –July ......................... 88,510 – 71,445 – 84,195 – 8,392 – 252,541 –August .................... 88,251 – 70,844 – 85,013 – 8,327 – 252,435 –September .............. 79,400 – 68,437 – 83,182 – 8,441 – 239,460 –October ................... 69,838 – 63,985 – 82,678 – 7,766 – 224,267 –November ............... 69,970 – 60,131 – 80,421 – 7,462 – 217,984 –December ............... 87,378 – 63,082 – 77,358 – 7,725 – 235,543 –Total ....................... 934,044 935,939 763,664 761,271 965,356 972,714 94,003 93,442 2,757,067 2,763,365
a "Other" is public street and highway lighting, other sales to publicauthorities, sales to railroads and railways, and interdepartmental sales.
b Annual totals are the sums of the monthly values.NA=Not available. – =Not applicable.
Notes: • Totals may not equal sum of components due to independentrounding. • Geographic coverage is the 50 States and the District ofColumbia.
Sources: See end of section.
Energy Information Administration/Historical Monthly Energy Review 1973-1992222

Table 7.3 Electric Utility Consumption of Fossil Fuels To Generate Electricity, 1973-1992
Coal Petroleum
NaturalGasd
Anthra-cite
BituminousCoal Lignite Total
By Typeof Petroleum
By PrimeMover Type
TotalLiquids
PetroleumCoke
HeavyOila
LightOilb
SteamPlants GT/ICc
Thousand Short Tons Thousand BarrelsThousandShort Tons
MillionCubic Feet
1973January ................... 126 33,590 840 34,557 NA NA 50,195 5,607 55,803 42 224,100February ................. 101 29,921 875 30,897 NA NA 42,121 4,878 46,999 34 215,505March ...................... 116 29,785 824 30,725 NA NA 39,928 2,775 42,703 27 257,568April ........................ 100 28,342 729 29,170 NA NA 33,431 2,418 35,849 42 269,228May ......................... 126 28,520 983 29,629 NA NA 35,839 2,249 38,088 54 319,237June ........................ 135 30,811 956 31,902 NA NA 42,186 4,225 46,410 55 372,999July ......................... 128 33,682 1,011 34,821 NA NA 46,685 4,649 51,334 49 424,563August .................... 138 34,888 1,019 36,045 NA NA 49,367 5,999 55,366 54 420,584September .............. 111 31,799 882 32,793 NA NA 44,832 3,375 48,208 38 355,186October ................... 122 31,678 643 32,443 NA NA 44,715 3,474 48,189 33 329,418November ............... 125 31,108 900 32,133 NA NA 42,821 3,626 46,447 28 253,371December ............... 114 32,852 1,131 34,098 NA NA 41,070 3,782 44,852 50 218,411Total ....................... 1,443 376,975 10,794 389,212 NA NA 513,190 47,058 560,248 507 3,660,172
1974January ................... 123 33,210 1,214 34,547 NA NA 42,397 4,334 46,731 59 220,551February ................. 108 29,658 1,049 30,815 NA NA 36,319 4,344 40,662 48 203,255March ...................... 97 30,608 888 31,594 NA NA 35,232 4,405 39,638 51 255,601April ........................ 111 28,779 757 29,647 NA NA 32,025 3,933 35,958 36 260,121May ......................... 138 30,699 839 31,676 NA NA 36,280 4,541 40,821 30 307,547June ........................ 138 30,636 925 31,700 NA NA 37,271 3,968 41,239 26 347,802July ......................... 128 34,876 1,084 36,089 NA NA 44,168 6,001 50,168 31 405,425August .................... 136 34,259 1,136 35,531 NA NA 44,195 4,800 48,994 32 382,629September .............. 126 29,992 840 30,958 NA NA 40,764 3,820 44,583 30 314,007October ................... 138 31,120 777 32,034 NA NA 41,380 3,886 45,267 96 299,416November ............... 116 31,069 935 32,120 NA NA 44,028 4,536 48,563 98 239,721December ............... 137 33,737 1,225 35,099 NA NA 49,087 4,561 53,648 86 207,353Total ....................... 1,498 378,643 11,670 391,811 NA NA 483,146 53,128 536,274 625 3,443,428
1975January ................... 138 34,355 1,339 35,833 NA NA 48,767 5,281 54,048 11 205,095February ................. 121 30,780 1,190 32,091 NA NA 39,818 3,727 43,545 8 188,929March ...................... 110 31,560 1,119 32,789 NA NA 37,430 2,985 40,415 4 211,184April ........................ 115 29,419 1,009 30,543 NA NA 34,715 2,323 37,037 4 214,252May ......................... 144 29,271 1,156 30,571 NA NA 33,723 3,262 36,986 3 275,097June ........................ 129 32,015 1,306 33,451 NA NA 36,829 4,114 40,943 6 307,901July ......................... 119 34,942 1,499 36,560 NA NA 40,527 3,886 44,413 7 362,095August .................... 130 36,332 1,499 37,962 NA NA 44,597 4,722 49,320 5 360,199September .............. 119 31,470 1,014 32,603 NA NA 35,148 1,893 37,041 5 315,877October ................... 120 31,505 1,223 32,848 NA NA 36,150 1,881 38,030 5 275,335November ............... 118 31,597 1,612 33,327 NA NA 35,758 1,779 37,538 6 227,748December ............... 117 35,276 1,992 37,385 NA NA 43,760 3,054 46,814 6 213,957Total ....................... 1,480 388,523 15,960 405,962 NA NA 467,221 38,907 506,128 70 3,157,669
1976January ................... 113 37,786 2,082 39,981 NA NA 51,157 4,931 56,088 6 206,528February ................. 97 33,102 1,761 34,959 NA NA 40,456 2,672 43,128 5 199,441March ...................... 103 34,310 1,679 36,093 NA NA 41,158 2,797 43,955 6 222,765April ........................ 121 32,269 1,411 33,801 NA NA 37,685 2,467 40,152 4 227,825May ......................... 128 32,257 1,555 33,940 NA NA 35,653 2,219 37,871 5 266,631June ........................ 123 34,318 1,934 36,376 NA NA 40,097 3,542 43,639 5 313,367July ......................... 126 37,582 2,127 39,835 NA NA 43,262 3,966 47,228 6 337,639August .................... 131 38,027 2,167 40,324 NA NA 45,704 3,365 49,070 5 329,731September .............. 107 34,161 1,623 35,890 NA NA 38,305 2,466 40,771 5 295,064October ................... 91 35,221 1,462 36,774 NA NA 39,120 3,085 42,205 8 249,956November ............... 94 36,662 2,073 38,830 NA NA 47,432 4,877 52,309 7 217,272December ............... 116 39,511 1,942 41,568 NA NA 54,049 5,456 59,504 7 214,649Total ....................... 1,350 425,205 21,817 448,371 NA NA 514,077 41,843 555,920 68 3,080,868
1977January ................... 127 41,205 1,918 43,250 NA NA 66,379 9,518 75,896 5 205,074February ................. 114 35,828 1,718 37,660 NA NA 47,659 3,150 50,809 5 200,413March ...................... 100 35,420 1,718 37,238 NA NA 46,171 2,494 48,666 9 231,826April ........................ 120 32,117 1,802 34,039 NA NA 42,218 2,213 44,431 12 223,081May ......................... 127 34,859 2,165 37,151 NA NA 44,779 3,846 48,624 8 259,798June ........................ 129 37,626 2,384 40,139 NA NA 46,249 4,300 50,549 9 310,669July ......................... 123 42,592 2,247 44,962 NA NA 54,664 7,738 62,402 12 346,639August .................... 125 41,678 2,354 44,158 NA NA 51,950 4,641 56,590 11 350,718September .............. 137 37,872 2,146 40,155 NA NA 43,297 2,517 45,814 8 324,549October ................... 108 36,160 2,099 38,367 NA NA 38,071 1,895 39,966 6 284,788November ............... 109 36,624 1,976 38,709 NA NA 40,653 2,464 43,117 6 234,006December ............... 106 39,069 2,123 41,298 NA NA 52,780 4,061 56,841 7 219,639Total ....................... 1,425 451,051 24,650 477,126 NA NA 574,869 48,837 623,705 98 3,191,200
See footnotes at end of table.
Energy Information Administration/Historical Monthly Energy Review 1973-1992 223

Table 7.3 Electric Utility Consumption of Fossil Fuels To Generate Electricity, 1973-1992 (Continued)
Coal Petroleum
NaturalGasd
Anthra-cite
BituminousCoal Lignite Total
By Typeof Petroleum
By PrimeMover Type
TotalLiquids
PetroleumCoke
HeavyOila
LightOilb
SteamPlants GT/ICc
Thousand Short Tons Thousand BarrelsThousandShort Tons
MillionCubic Feet
1978January ................... 101 40,506 2,101 42,709 NA NA 61,271 8,257 69,528 10 229,188February ................. 88 33,556 2,189 35,833 NA NA 59,636 7,709 67,345 55 211,170March ...................... 100 31,276 2,629 34,005 NA NA 58,724 5,476 64,200 64 232,199April ........................ 83 32,129 2,406 34,618 NA NA 40,877 2,152 43,029 39 223,188May ......................... 73 34,902 2,224 37,199 NA NA 40,244 2,294 42,538 28 260,802June ........................ 91 38,250 2,453 40,794 NA NA 42,729 3,570 46,299 31 321,423July ......................... 85 40,906 3,127 44,118 NA NA 47,546 3,570 51,115 32 362,199August .................... 100 42,643 3,297 46,040 NA NA 52,637 3,564 56,201 31 340,299September .............. 86 39,835 2,725 42,646 NA NA 43,114 3,301 46,415 28 296,982October ................... 82 37,197 2,574 39,853 NA NA 42,253 1,824 44,077 25 262,880November ............... 88 36,982 2,681 39,751 NA NA 44,516 2,161 46,678 27 228,027December ............... 87 40,581 3,001 43,669 NA NA 54,771 3,643 58,414 30 220,005Total ....................... 1,064 448,763 31,407 481,235 NA NA 588,319 47,520 635,839 398 3,188,363
1979January ................... 89 43,791 3,021 46,902 NA NA 62,226 6,244 68,470 33 228,479February ................. 75 39,010 2,806 41,891 NA NA 51,655 4,959 56,615 32 226,896March ...................... 65 38,865 2,852 41,781 NA NA 36,371 1,872 38,243 22 260,351April ........................ 66 36,362 2,551 38,979 NA NA 33,800 1,682 35,482 15 260,974May ......................... 106 38,669 2,757 41,532 NA NA 35,285 2,053 37,338 23 277,318June ........................ 103 40,882 3,023 44,008 NA NA 39,258 2,314 41,572 25 320,196July ......................... 96 44,391 3,730 48,216 NA NA 41,895 2,413 44,308 23 369,318August .................... 97 44,553 3,899 48,549 NA NA 42,478 2,416 44,894 23 375,370September .............. 86 38,920 3,162 42,167 NA NA 36,768 1,747 38,516 17 338,308October ................... 75 39,634 3,261 42,970 NA NA 33,445 1,132 34,577 16 323,082November ............... 92 39,571 3,317 42,980 NA NA 37,822 1,954 39,775 18 260,982December ............... 96 43,480 3,499 47,075 NA NA 41,601 1,906 43,507 20 249,249Total ....................... 1,046 488,129 37,876 527,051 NA NA 492,606 30,691 523,297 268 3,490,523
1980January ................... 74 46,518 3,779 50,371 39,689 3,203 40,695 2,197 42,892 54 276,743February ................. 72 43,969 3,471 47,512 39,382 2,768 40,231 1,919 42,150 21 263,771March ...................... 83 43,244 3,357 46,685 32,589 2,196 33,406 1,379 34,785 13 283,945April ........................ 71 37,971 2,651 40,692 26,178 1,362 26,867 673 27,540 7 256,606May ......................... 86 38,116 3,262 41,464 26,307 1,524 26,991 840 27,831 11 281,886June ........................ 89 42,073 3,658 45,821 28,739 1,951 29,551 1,138 30,690 11 336,894July ......................... 93 49,815 3,746 53,655 36,260 3,828 37,297 2,791 40,088 11 420,339August .................... 80 49,077 4,057 53,214 38,836 4,016 40,019 2,833 42,852 15 405,343September .............. 84 44,487 3,342 47,913 28,505 2,149 29,367 1,286 30,654 11 357,286October ................... 73 41,819 3,200 45,092 25,530 1,428 26,269 689 26,958 8 301,266November ............... 56 42,379 3,263 45,698 31,792 2,310 32,782 1,320 34,103 7 255,559December ............... 89 47,212 3,856 51,157 37,357 2,316 38,387 1,285 39,672 9 241,957Total ....................... 951 526,680 41,642 569,274 391,163 29,051 401,863 18,351 420,214 179 3,681,595
1981January ................... 81 50,635 3,972 54,688 40,885 3,047 41,904 2,027 43,931 10 231,606February ................. 58 44,583 3,272 47,914 27,755 2,242 28,948 1,049 29,997 9 224,003March ...................... 75 45,168 3,155 48,398 27,862 1,405 28,492 775 29,267 9 273,431April ........................ 73 40,535 3,069 43,677 24,229 1,356 25,028 557 25,585 7 289,053May ......................... 91 41,405 3,503 44,999 23,130 1,795 23,958 967 24,925 14 316,310June ........................ 105 46,503 3,471 50,080 29,699 2,705 30,673 1,731 32,404 13 380,775July ......................... 102 51,705 4,337 56,144 31,628 2,615 32,577 1,666 34,243 11 410,666August .................... 133 50,010 4,339 54,483 25,760 1,422 26,598 584 27,182 13 389,564September .............. 98 44,557 3,828 48,483 25,137 1,145 25,762 520 26,282 13 324,828October ................... 115 44,161 3,524 47,800 26,078 1,123 26,646 556 27,201 15 301,670November ............... 141 43,032 3,841 47,014 22,042 1,139 22,749 432 23,181 12 258,811December ............... 148 48,487 4,481 53,116 25,593 1,319 26,345 567 26,912 12 239,436Total ....................... 1,221 550,784 44,792 596,797 329,798 21,313 339,680 11,431 351,111 139 3,640,154
1982January ................... 89 52,014 4,723 56,825 32,269 3,131 33,832 1,567 35,399 10 237,675February ................. 83 44,478 4,317 48,878 24,351 1,421 25,249 524 25,772 9 220,032March ...................... 73 43,751 4,060 47,884 21,617 1,304 22,371 550 22,921 4 246,550April ........................ 88 39,888 3,515 43,490 17,913 1,132 18,553 492 19,045 11 246,344May ......................... 98 41,845 3,678 45,622 15,939 991 16,614 316 16,930 12 257,848June ........................ 94 43,340 3,990 47,424 16,539 1,053 17,241 351 17,592 13 295,557July ......................... 108 50,769 4,371 55,248 21,550 1,360 22,192 718 22,910 11 352,818August .................... 95 50,283 4,460 54,838 18,873 1,053 19,508 418 19,926 13 361,351September .............. 67 44,431 3,916 48,414 16,544 921 17,146 318 17,464 9 293,232October ................... 81 42,598 3,650 46,330 15,990 870 16,547 313 16,860 17 273,003November ............... 100 43,756 3,943 47,799 14,908 1,007 15,591 325 15,916 18 226,477December ............... 99 46,192 4,622 50,914 17,940 1,094 18,694 341 19,035 22 214,630Total ....................... 1,075 543,346 49,245 593,666 234,434 15,337 243,537 6,234 249,771 149 3,225,518
See footnotes at end of table.
Energy Information Administration/Historical Monthly Energy Review 1973-1992224

Table 7.3 Electric Utility Consumption of Fossil Fuels To Generate Electricity, 1973-1992 (Continued)
Coal Petroleum
NaturalGasd
Anthra-cite
BituminousCoal Lignite Total
By Typeof Petroleum
By PrimeMover Type
TotalLiquids
PetroleumCoke
HeavyOila
LightOilb
SteamPlants GT/ICc
Thousand Short Tons Thousand BarrelsThousandShort Tons
MillionCubic Feet
1983January ................... 73 48,695 4,583 53,351 20,728 1,110 21,373 465 21,838 17 208,341February ................. 73 41,668 4,032 45,772 20,305 984 20,885 404 21,289 19 176,965March ...................... 75 43,165 3,870 47,110 20,174 945 20,728 392 21,119 16 208,013April ........................ 92 39,716 3,781 43,589 16,374 1,054 16,997 432 17,429 24 202,917May ......................... 104 41,002 4,585 45,691 14,360 937 14,968 330 15,297 30 218,184June ........................ 88 45,560 4,690 50,338 17,892 1,020 18,437 475 18,912 23 247,825July ......................... 89 55,082 5,219 60,390 23,383 1,433 23,927 888 24,815 25 314,357August .................... 92 58,475 5,200 63,767 23,622 1,543 24,166 999 25,165 24 352,031September .............. 86 49,745 4,381 54,212 18,021 1,507 18,532 996 19,529 25 298,517October ................... 91 46,263 4,335 50,689 15,993 870 16,518 345 16,863 22 251,151November ............... 86 46,883 4,216 51,185 14,690 1,075 15,336 430 15,766 17 214,275December ............... 88 53,854 5,176 59,117 23,440 4,034 25,978 1,496 27,474 21 218,191Total ....................... 1,036 570,108 54,067 625,211 228,984 16,512 237,845 7,652 245,497 261 2,910,767
1984January ................... 98 55,142 4,985 60,225 24,745 2,176 25,838 1,082 26,921 24 215,027February ................. 75 47,279 4,904 52,257 16,091 1,018 16,662 447 17,108 21 187,259March ...................... 69 49,921 4,543 54,534 17,274 1,016 17,881 410 18,290 18 206,171April ........................ 83 43,779 3,703 47,565 11,971 831 12,495 306 12,802 22 220,005May ......................... 99 45,115 4,294 49,507 13,327 1,010 13,896 441 14,337 23 264,522June ........................ 102 51,757 5,112 56,971 17,363 1,927 17,997 1,293 19,289 23 297,560July ......................... 100 54,928 5,331 60,359 16,453 1,259 17,085 627 17,712 22 348,848August .................... 97 58,026 5,273 63,396 20,337 1,522 20,957 902 21,859 20 349,878September .............. 81 49,288 4,675 54,045 12,235 996 12,795 436 13,231 21 290,595October ................... 83 50,091 4,578 54,753 12,450 965 13,019 396 13,415 19 269,629November ............... 91 49,595 4,543 54,229 14,543 1,326 15,177 692 15,870 17 244,637December ............... 93 51,418 5,050 56,560 12,499 1,146 13,247 398 13,645 20 217,210Total ....................... 1,070 606,339 56,990 664,399 189,289 15,190 197,050 7,429 204,479 252 3,111,342
1985January ................... 88 58,155 5,402 63,645 18,574 2,482 19,846 1,210 21,056 18 226,276February ................. 70 50,481 4,940 55,491 14,729 1,333 15,595 467 16,062 17 202,546March ...................... 78 49,793 4,913 54,784 11,323 980 11,966 337 12,303 16 207,286April ........................ 92 47,072 3,738 50,903 9,561 911 10,133 338 10,471 16 233,819May ......................... 98 49,890 4,607 54,595 11,046 962 11,604 403 12,008 13 236,220June ........................ 90 51,984 5,561 57,634 12,005 1,111 12,516 601 13,116 21 281,939July ......................... 92 58,327 5,833 64,252 13,238 1,109 13,840 507 14,347 20 336,535August .................... 96 57,304 5,676 63,076 15,730 1,338 16,272 795 17,067 19 354,653September .............. 74 52,031 4,675 56,780 11,994 979 12,485 488 12,972 24 274,868October ................... 85 50,265 4,619 54,969 12,060 969 12,646 383 13,029 23 249,579November ............... 83 49,315 4,913 54,311 10,925 1,021 11,584 362 11,946 23 229,943December ............... 86 57,270 6,046 63,402 17,595 1,440 18,355 680 19,035 20 210,417Total ....................... 1,033 631,885 60,923 693,841 158,779 14,635 166,842 6,572 173,414 231 3,044,083
1986January ................... 67 57,525 6,442 64,034 17,254 1,688 17,915 1,027 18,942 15 184,024February ................. 50 49,711 5,289 55,050 14,978 1,100 15,536 541 16,077 15 157,070March ...................... 88 48,737 5,073 53,898 16,090 928 16,585 433 17,018 23 169,697April ........................ 84 43,391 4,639 48,114 14,538 893 14,982 449 15,431 23 198,143May ......................... 68 46,629 4,723 51,420 16,386 1,209 16,933 662 17,595 25 231,041June ........................ 64 53,332 5,496 58,892 18,173 1,390 18,796 768 19,564 24 260,163July ......................... 67 61,669 6,285 68,021 25,839 1,727 26,373 1,193 27,567 26 300,870August .................... 64 55,331 6,314 61,709 24,633 1,150 25,104 678 25,782 31 276,163September .............. 47 50,574 5,916 56,536 17,102 1,107 17,500 709 18,209 31 246,674October ................... 57 48,151 5,907 54,116 15,714 869 16,194 390 16,584 26 216,738November ............... 84 48,451 5,623 54,158 16,656 1,076 17,171 561 17,731 34 186,605December ............... 88 52,634 6,386 59,108 18,794 1,189 19,410 572 19,983 38 175,181Total ....................... 829 616,134 68,093 685,056 216,156 14,326 222,500 7,983 230,482 313 2,602,370
1987January ................... 68 55,682 6,664 62,414 19,069 1,317 19,718 668 20,386 28 184,722February ................. 75 48,243 5,397 53,715 16,510 1,149 17,004 655 17,658 29 158,341March ...................... 79 49,428 5,140 54,647 15,741 1,227 16,335 633 16,968 28 190,893April ........................ 75 47,153 4,207 51,435 12,297 1,033 12,873 457 13,330 23 206,438May ......................... 91 51,415 4,977 56,484 12,420 1,183 13,017 586 13,603 31 242,615June ........................ 100 57,307 6,093 63,500 16,384 1,407 16,976 814 17,790 26 283,554July ......................... 105 64,203 6,428 70,736 19,193 2,075 19,754 1,513 21,268 28 319,239August .................... 95 63,456 6,524 70,075 17,470 1,648 17,948 1,170 19,118 31 338,646September .............. 72 53,338 5,850 59,259 12,015 924 12,441 498 12,939 31 268,080October ................... 66 51,572 5,479 57,117 10,538 891 11,108 321 11,429 35 238,185November ............... 60 50,095 5,805 55,961 14,995 1,307 15,651 651 16,302 27 216,781December ............... 85 55,930 6,535 62,551 17,380 1,207 17,994 593 18,587 30 196,556Total ....................... 972 647,824 69,098 717,894 184,011 15,367 190,818 8,560 199,378 348 2,844,051
See footnotes at end of table.
Energy Information Administration/Historical Monthly Energy Review 1973-1992 225

Table 7.3 Electric Utility Consumption of Fossil Fuels To Generate Electricity, 1973-1992 (Continued)
Coal Petroleum
NaturalGasd
Anthra-cite
BituminousCoal Lignite Total
By Typeof Petroleum
By PrimeMover Type
TotalLiquids
PetroleumCoke
HeavyOila
LightOilb
SteamPlants GT/ICc
Thousand Short Tons Thousand BarrelsThousandShort Tons
MillionCubic Feet
1988January ................... 77 60,602 7,171 67,850 24,801 2,299 25,545 1,556 27,101 24 167,607February ................. 85 55,053 6,263 61,401 18,382 1,137 18,951 567 19,518 27 169,688March ...................... 92 52,891 5,775 58,758 15,014 1,045 15,586 473 16,058 36 204,042April ........................ 87 48,791 5,258 54,135 11,632 805 12,113 325 12,438 33 199,394May ......................... 88 50,595 5,847 56,529 11,024 998 11,615 407 12,022 33 239,871June ........................ 74 58,495 6,774 65,343 14,783 1,857 15,332 1,308 16,640 42 280,490July ......................... 99 64,340 7,309 71,749 21,638 1,943 22,168 1,413 23,581 47 328,088August .................... 106 67,991 7,156 75,253 24,097 3,207 24,592 2,712 27,304 41 344,214September .............. 86 54,936 6,519 61,540 15,594 1,004 16,057 542 16,598 31 232,665October ................... 83 53,316 6,162 59,561 20,780 1,100 21,278 602 21,880 30 181,673November ............... 80 53,879 5,346 59,305 23,198 1,202 23,686 714 24,400 31 150,432December ............... 108 60,159 6,681 66,948 28,383 2,173 28,894 1,661 30,556 36 137,449Total ....................... 1,063 681,048 76,260 758,372 229,327 18,769 235,817 12,279 248,096 409 2,635,613
1989January ................... 98 59,707 6,962 66,767 23,425 2,055 24,273 1,206 25,479 47 147,141February ................. 75 56,764 5,945 62,784 27,056 2,427 27,981 1,502 29,483 33 172,379March ...................... 82 55,937 5,986 62,005 25,133 2,691 25,900 1,924 27,824 35 211,095April ........................ 96 50,259 5,789 56,144 18,144 1,045 18,652 538 19,190 38 234,726May ......................... 98 52,420 6,009 58,527 15,448 1,522 16,014 957 16,970 36 250,555June ........................ 75 56,841 6,719 63,635 19,253 2,070 19,832 1,490 21,322 38 259,941July ......................... 97 62,322 7,302 69,720 18,643 2,180 19,233 1,590 20,822 58 319,709August .................... 95 63,278 7,121 70,493 17,133 1,530 17,623 1,040 18,663 58 309,597September .............. 81 56,533 6,295 62,910 15,642 1,526 16,126 1,041 17,168 54 267,545October ................... 87 54,775 5,699 60,561 12,807 1,180 13,334 653 13,987 39 254,074November ............... 85 54,628 6,294 61,006 17,762 1,484 18,371 875 19,247 33 188,924December ............... 81 65,040 7,215 72,336 31,514 5,781 32,975 4,320 37,295 50 171,326Total ....................... 1,049 688,504 77,335 766,888 241,960 25,491 250,315 17,136 267,451 517 2,787,012
1990January ................... 92 59,129 7,220 66,441 18,291 1,237 18,900 628 19,528 40 145,649February ................. 85 51,715 6,313 58,112 14,769 974 15,194 549 15,743 62 131,592March ...................... 91 54,693 6,101 60,885 16,068 916 16,541 442 16,984 62 183,983April ........................ 81 52,480 5,376 57,937 15,882 1,035 16,364 554 16,917 61 198,994May ......................... 90 53,182 5,988 59,260 14,586 1,146 15,113 619 15,732 77 243,781June ........................ 90 58,357 6,892 65,340 20,619 1,555 21,145 1,028 22,174 66 297,036July ......................... 96 64,272 7,183 71,551 20,041 1,615 20,514 1,141 21,655 74 326,087August .................... 93 65,696 7,317 73,106 16,715 1,618 17,212 1,121 18,333 72 342,965September .............. 84 60,461 6,455 67,001 12,037 1,318 12,491 863 13,354 79 300,858October ................... 82 58,118 6,181 64,381 10,772 1,186 11,272 686 11,958 86 256,797November ............... 71 54,927 6,043 61,041 9,473 910 9,998 385 10,383 61 184,695December ............... 75 61,287 7,132 68,493 11,979 1,313 12,785 507 13,292 78 174,893Total ....................... 1,031 694,317 78,201 773,549 181,231 14,823 187,531 8,523 196,054 819 2,787,332
1991January ................... 74 63,779 7,553 71,406 14,264 1,187 14,911 541 15,452 74 173,138February ................. 68 52,090 6,456 58,614 13,595 804 14,021 377 14,398 57 146,266March ...................... 93 52,924 6,255 59,272 13,513 828 13,999 341 14,340 73 192,899April ........................ 92 50,131 5,219 55,443 12,142 1,019 12,641 519 13,161 72 215,659May ......................... 73 55,229 5,926 61,228 16,312 1,814 16,919 1,208 18,126 66 249,454June ........................ 72 58,455 7,290 65,817 17,325 1,122 17,845 602 18,447 50 260,153July ......................... 101 64,202 7,548 71,852 17,289 1,218 17,737 770 18,507 61 329,861August .................... 90 64,280 7,514 71,884 18,041 1,380 18,500 921 19,421 56 327,621September .............. 90 57,474 6,833 64,397 13,209 1,165 13,634 740 14,374 52 262,825October ................... 86 55,586 6,212 61,883 9,791 902 10,289 403 10,693 50 263,376November ............... 79 57,662 6,073 63,814 12,020 1,146 12,575 591 13,166 52 197,831December ............... 77 59,462 7,120 66,659 13,656 1,143 14,214 586 14,800 59 169,931Total ....................... 994 691,275 79,999 772,268 171,157 13,729 177,286 7,600 184,886 722 2,789,014
1992January ................... 80 60,881 7,304 68,264 15,811 1,103 16,332 582 16,915 71 169,125February ................. 80 53,687 6,415 60,183 12,730 806 13,093 444 13,536 76 170,293March ...................... 93 56,243 6,368 62,705 13,492 843 13,932 404 14,336 83 207,656April ........................ 73 53,314 5,407 58,794 9,929 811 10,335 404 10,740 66 229,012May ......................... 69 54,664 5,858 60,591 7,910 843 8,385 367 8,752 50 236,316June ........................ 84 57,179 6,859 64,122 11,372 1,077 11,881 568 12,449 66 265,882July ......................... 90 66,318 7,407 73,815 12,939 1,428 13,392 974 14,367 72 333,567August .................... 84 62,937 7,616 70,637 10,607 1,011 11,067 551 11,619 116 302,544September .............. 83 58,899 6,985 65,967 10,456 849 10,820 485 11,305 98 273,670October ................... 85 56,366 6,356 62,806 10,454 792 10,867 379 11,246 103 212,640November ............... 74 56,186 6,352 62,612 10,330 1,004 10,803 531 11,333 93 189,296December ............... 93 61,951 7,321 69,365 9,749 989 10,256 482 10,737 105 175,608Total ....................... 986 698,626 80,248 779,860 135,779 11,556 141,163 6,172 147,335 999 2,765,608
a Heavy oil includes fuel oil nos. 4, 5, and 6, and residual fuel oils.b Light oil includes fuel oil nos. 1 and 2, kerosene, and jet fuel.c GT/IC = Gas turbine and internal combustion plants.d Includes supplemental gaseous fuels.NA=Not available.
Notes: • Totals may not equal sum of components due to independentrounding. • Geographic coverage is the 50 States and the District ofColumbia.
Sources: See end of section.
Energy Information Administration/Historical Monthly Energy Review 1973-1992226
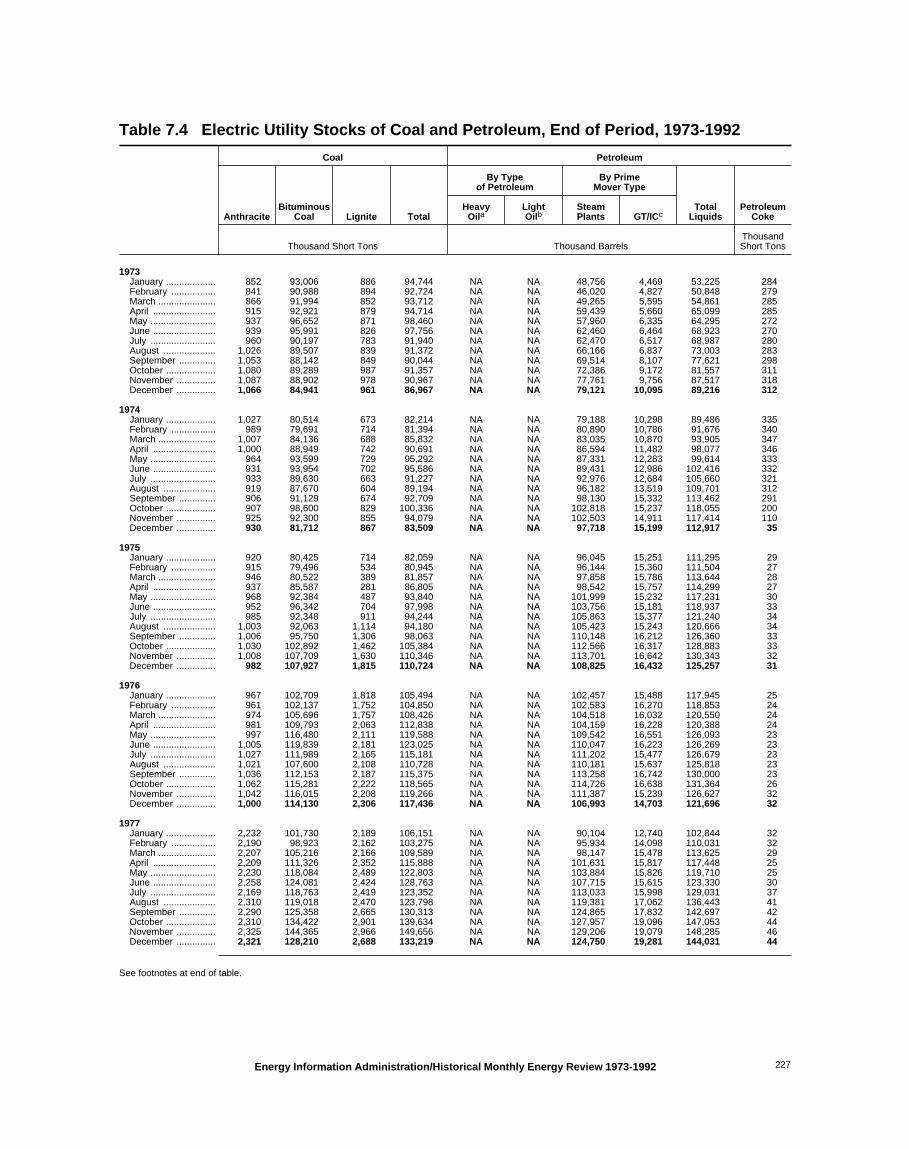
Table 7.4 Electric Utility Stocks of Coal and Petroleum, End of Period, 1973-1992
Coal Petroleum
AnthraciteBituminous
Coal Lignite Total
By Typeof Petroleum
By PrimeMover Type
TotalLiquids
PetroleumCoke
HeavyOila
LightOilb
SteamPlants GT/ICc
Thousand Short Tons Thousand BarrelsThousandShort Tons
1973January ................... 852 93,006 886 94,744 NA NA 48,756 4,469 53,225 284February ................. 841 90,988 894 92,724 NA NA 46,020 4,827 50,848 279March ...................... 866 91,994 852 93,712 NA NA 49,265 5,595 54,861 285April ........................ 915 92,921 879 94,714 NA NA 59,439 5,660 65,099 285May ......................... 937 96,652 871 98,460 NA NA 57,960 6,335 64,295 272June ........................ 939 95,991 826 97,756 NA NA 62,460 6,464 68,923 270July ......................... 960 90,197 783 91,940 NA NA 62,470 6,517 68,987 280August .................... 1,026 89,507 839 91,372 NA NA 66,166 6,837 73,003 283September .............. 1,053 88,142 849 90,044 NA NA 69,514 8,107 77,621 298October ................... 1,080 89,289 987 91,357 NA NA 72,386 9,172 81,557 311November ............... 1,087 88,902 978 90,967 NA NA 77,761 9,756 87,517 318December ............... 1,066 84,941 961 86,967 NA NA 79,121 10,095 89,216 312
1974January ................... 1,027 80,514 673 82,214 NA NA 79,188 10,298 89,486 335February ................. 989 79,691 714 81,394 NA NA 80,890 10,786 91,676 340March ...................... 1,007 84,136 688 85,832 NA NA 83,035 10,870 93,905 347April ........................ 1,000 88,949 742 90,691 NA NA 86,594 11,482 98,077 346May ......................... 964 93,599 729 95,292 NA NA 87,331 12,283 99,614 333June ........................ 931 93,954 702 95,586 NA NA 89,431 12,986 102,416 332July ......................... 933 89,630 663 91,227 NA NA 92,976 12,684 105,660 321August .................... 919 87,670 604 89,194 NA NA 96,182 13,519 109,701 312September .............. 906 91,129 674 92,709 NA NA 98,130 15,332 113,462 291October ................... 907 98,600 829 100,336 NA NA 102,818 15,237 118,055 200November ............... 925 92,300 855 94,079 NA NA 102,503 14,911 117,414 110December ............... 930 81,712 867 83,509 NA NA 97,718 15,199 112,917 35
1975January ................... 920 80,425 714 82,059 NA NA 96,045 15,251 111,295 29February ................. 915 79,496 534 80,945 NA NA 96,144 15,360 111,504 27March ...................... 946 80,522 389 81,857 NA NA 97,858 15,786 113,644 28April ........................ 937 85,587 281 86,805 NA NA 98,542 15,757 114,299 27May ......................... 968 92,384 487 93,840 NA NA 101,999 15,232 117,231 30June ........................ 952 96,342 704 97,998 NA NA 103,756 15,181 118,937 33July ......................... 985 92,348 911 94,244 NA NA 105,863 15,377 121,240 34August .................... 1,003 92,063 1,114 94,180 NA NA 105,423 15,243 120,666 34September .............. 1,006 95,750 1,306 98,063 NA NA 110,148 16,212 126,360 33October ................... 1,030 102,892 1,462 105,384 NA NA 112,566 16,317 128,883 33November ............... 1,008 107,709 1,630 110,346 NA NA 113,701 16,642 130,343 32December ............... 982 107,927 1,815 110,724 NA NA 108,825 16,432 125,257 31
1976January ................... 967 102,709 1,818 105,494 NA NA 102,457 15,488 117,945 25February ................. 961 102,137 1,752 104,850 NA NA 102,583 16,270 118,853 24March ...................... 974 105,696 1,757 108,426 NA NA 104,518 16,032 120,550 24April ........................ 981 109,793 2,063 112,838 NA NA 104,159 16,228 120,388 24May ......................... 997 116,480 2,111 119,588 NA NA 109,542 16,551 126,093 23June ........................ 1,005 119,839 2,181 123,025 NA NA 110,047 16,223 126,269 23July ......................... 1,027 111,989 2,165 115,181 NA NA 111,202 15,477 126,679 23August .................... 1,021 107,600 2,108 110,728 NA NA 110,181 15,637 125,818 23September .............. 1,036 112,153 2,187 115,375 NA NA 113,258 16,742 130,000 23October ................... 1,062 115,281 2,222 118,565 NA NA 114,726 16,638 131,364 26November ............... 1,042 116,015 2,208 119,266 NA NA 111,387 15,239 126,627 32December ............... 1,000 114,130 2,306 117,436 NA NA 106,993 14,703 121,696 32
1977January ................... 2,232 101,730 2,189 106,151 NA NA 90,104 12,740 102,844 32February ................. 2,190 98,923 2,162 103,275 NA NA 95,934 14,098 110,031 32March ...................... 2,207 105,216 2,166 109,589 NA NA 98,147 15,478 113,625 29April ........................ 2,209 111,326 2,352 115,888 NA NA 101,631 15,817 117,448 25May ......................... 2,230 118,084 2,489 122,803 NA NA 103,884 15,826 119,710 25June ........................ 2,258 124,081 2,424 128,763 NA NA 107,715 15,615 123,330 30July ......................... 2,169 118,763 2,419 123,352 NA NA 113,033 15,998 129,031 37August .................... 2,310 119,018 2,470 123,798 NA NA 119,381 17,062 136,443 41September .............. 2,290 125,358 2,665 130,313 NA NA 124,865 17,832 142,697 42October ................... 2,310 134,422 2,901 139,634 NA NA 127,957 19,096 147,053 44November ............... 2,325 144,365 2,966 149,656 NA NA 129,206 19,079 148,285 46December ............... 2,321 128,210 2,688 133,219 NA NA 124,750 19,281 144,031 44
See footnotes at end of table.
Energy Information Administration/Historical Monthly Energy Review 1973-1992 227

Table 7.4 Electric Utility Stocks of Coal and Petroleum, End of Period, 1973-1992 (Continued)
Coal Petroleum
AnthraciteBituminous
Coal Lignite Total
By Typeof Petroleum
By PrimeMover Type
TotalLiquids
PetroleumCoke
HeavyOila
LightOilb
SteamPlants GT/ICc
Thousand Short Tons Thousand BarrelsThousandShort Tons
1978January ................... 2,280 100,550 2,418 105,248 NA NA 114,175 16,240 130,415 40February ................. 2,112 80,094 2,349 84,555 NA NA 111,158 17,044 128,202 197March ...................... 2,091 72,369 2,556 77,016 NA NA 112,328 17,270 129,598 182April ........................ 2,083 83,285 2,612 87,980 NA NA 116,086 17,386 133,472 164May ......................... 2,145 95,701 2,782 100,628 NA NA 118,941 16,973 135,914 167June ........................ 2,215 105,613 2,923 110,752 NA NA 120,187 17,581 137,768 167July ......................... 2,241 104,609 2,849 109,699 NA NA 121,510 17,559 139,069 176August .................... 2,208 106,918 3,140 112,266 NA NA 119,359 17,380 136,739 173September .............. 2,224 109,751 3,187 115,162 NA NA 121,116 17,538 138,654 181October ................... 2,220 115,946 3,431 121,597 NA NA 117,682 17,355 135,037 189November ............... 2,199 124,061 3,118 129,379 NA NA 112,220 17,231 129,451 199December ............... 2,178 123,020 3,027 128,225 NA NA 102,402 16,386 118,788 198
1979January ................... 2,154 114,980 2,814 119,948 NA NA 89,583 15,635 105,219 181February ................. 2,136 109,532 2,726 114,394 NA NA 82,078 15,541 97,619 166March ...................... 2,170 113,669 2,704 118,542 NA NA 96,033 16,386 112,419 170April ........................ 2,220 120,876 2,680 125,776 NA NA 99,500 16,835 116,334 170May ......................... 2,231 128,962 2,600 133,793 NA NA 106,017 16,974 122,992 159June ........................ 2,233 131,898 2,495 136,627 NA NA 104,513 17,180 121,693 150July ......................... 2,290 126,328 2,478 131,095 NA NA 104,170 17,578 121,748 160August .................... 2,328 128,760 3,170 134,257 NA NA 103,965 17,910 121,875 163September .............. 2,385 133,605 3,139 139,129 NA NA 104,857 18,733 123,590 164October ................... 2,452 144,035 3,462 149,949 NA NA 109,590 19,410 129,000 170November ............... 2,496 151,848 3,393 157,737 NA NA 111,072 19,714 130,786 170December ............... 3,274 152,981 3,459 159,714 NA NA 111,121 20,301 131,422 183
1980January ................... 3,371 151,891 3,455 158,717 R 101,872 R 32,038 114,313 19,597 133,909 175February ................. 3,451 150,151 3,522 157,124 R 99,267 R 31,142 111,353 19,055 130,409 168March ...................... 3,488 151,022 3,116 157,625 R 104,096 R 31,084 116,246 18,933 135,180 154April ........................ 3,533 158,441 3,843 165,817 106,399 31,626 118,824 19,201 138,025 103May ......................... 3,725 166,325 3,980 174,029 111,201 31,328 123,043 19,485 142,529 69June ........................ 3,838 171,042 4,079 178,959 112,527 30,923 124,177 19,273 143,450 65July ......................... 3,955 161,159 3,691 168,806 109,844 30,432 121,596 18,680 140,276 65August .................... 4,098 163,756 4,036 171,891 106,468 30,196 118,514 18,150 136,664 63September .............. 4,291 166,515 4,262 175,067 110,140 30,164 122,240 18,064 140,304 61October ................... 4,481 173,411 4,153 182,045 112,311 30,133 124,046 18,398 142,445 60November ............... 4,661 175,489 3,983 184,133 108,137 29,778 119,863 18,051 137,915 53December ............... 4,741 174,154 4,115 183,010 105,351 30,023 117,227 18,147 135,374 52
1981January ................... 4,824 167,884 4,267 176,975 99,196 29,535 110,533 18,199 128,732 51February ................. 4,859 166,552 4,304 175,715 101,867 28,328 112,879 17,315 130,195 52March ...................... 4,951 174,554 4,478 183,983 100,178 28,732 111,490 17,421 128,911 52April ........................ 5,035 159,645 4,541 169,221 97,629 29,024 109,455 17,197 126,652 51May ......................... 5,008 143,500 4,907 153,415 101,574 27,671 112,172 17,073 129,245 52June ........................ 5,081 134,321 5,119 144,520 99,398 28,547 109,988 17,957 127,945 49July ......................... 5,269 129,684 5,171 140,124 99,603 27,728 110,476 16,856 127,332 48August .................... 5,337 132,072 4,909 142,318 103,104 27,714 114,016 16,801 130,817 47September .............. 5,428 138,808 5,290 149,526 102,104 27,403 112,992 16,515 129,506 46October ................... 5,512 148,952 5,213 159,676 100,008 27,055 110,900 16,164 127,063 44November ............... 5,548 156,360 5,094 167,002 100,301 26,715 110,939 16,077 127,016 43December ............... 5,537 158,258 5,098 168,893 102,042 26,094 112,380 15,756 128,136 42
1982January ................... 5,437 148,404 4,628 158,469 94,609 26,162 105,475 15,296 120,771 39February ................. 5,401 148,118 4,617 158,136 92,622 25,418 102,883 15,157 118,040 40March ...................... 5,488 154,724 4,305 164,518 97,706 25,136 108,142 14,699 122,842 43April ........................ 5,542 161,720 4,128 171,390 95,984 24,636 106,143 14,477 120,620 42May ......................... 5,569 167,805 4,088 177,461 96,607 24,796 106,701 14,702 121,403 41June ........................ 5,603 172,819 4,092 182,513 97,959 24,647 108,189 14,417 122,606 43July ......................... 5,658 164,688 4,157 174,503 96,085 25,008 106,170 14,923 121,093 43August .................... 5,791 165,182 4,221 175,194 96,345 24,193 106,438 14,100 120,538 42September .............. 5,896 165,065 4,264 175,225 98,160 24,225 108,177 14,208 122,385 47October ................... 5,992 170,281 4,298 180,571 96,920 23,595 106,701 13,813 120,515 36November ............... 6,060 171,832 4,476 182,368 96,618 23,553 106,361 13,809 120,171 42December ............... 6,080 170,480 4,573 181,132 95,515 23,369 105,287 13,597 118,884 41
See footnotes at end of table.
Energy Information Administration/Historical Monthly Energy Review 1973-1992228

Table 7.4 Electric Utility Stocks of Coal and Petroleum, End of Period, 1973-1992 (Continued)
Coal Petroleum
AnthraciteBituminous
Coal Lignite Total
By Typeof Petroleum
By PrimeMover Type
TotalLiquids
PetroleumCoke
HeavyOila
LightOilb
SteamPlants GT/ICc
Thousand Short Tons Thousand BarrelsThousandShort Tons
1983January ................... 6,107 168,287 4,210 178,604 91,523 23,183 101,394 13,312 114,706 54February ................. 6,104 168,635 4,362 179,101 85,847 22,665 95,459 13,053 108,512 53March ...................... 6,143 170,327 4,201 180,671 81,957 22,387 91,594 12,750 104,344 54April ........................ 6,120 170,815 4,436 181,371 81,243 21,967 90,667 12,544 103,211 47May ......................... 6,145 173,969 4,453 184,567 82,091 21,758 91,360 12,489 103,849 44June ........................ 6,230 173,483 4,524 184,236 80,197 21,471 89,283 12,384 101,667 52July ......................... 6,299 158,701 3,566 168,566 76,881 21,101 85,891 12,091 97,982 50August .................... 6,380 152,140 4,038 162,557 73,266 20,763 82,307 11,722 94,029 45September .............. 6,435 150,778 4,171 161,384 74,560 20,696 83,511 11,745 95,256 47October ................... 6,506 156,012 4,056 166,574 75,949 20,568 84,873 11,644 96,517 53November ............... 6,531 155,931 3,995 166,457 75,930 20,271 84,804 11,397 96,201 63December ............... 6,507 145,250 3,841 155,598 70,573 18,801 78,285 11,090 89,375 55
1984January ................... 6,500 139,026 3,877 149,403 68,679 19,369 76,756 11,292 88,048 43February ................. 6,510 143,731 5,352 155,593 72,339 19,227 80,404 11,163 91,566 41March ...................... 6,519 147,756 5,500 159,775 69,984 19,058 78,014 11,028 89,042 45April ........................ 6,515 153,300 5,777 165,592 68,771 18,849 76,721 10,899 87,620 47May ......................... 6,532 161,067 5,573 173,171 69,890 18,695 77,699 10,886 88,584 51June ........................ 6,541 162,426 5,188 174,155 68,098 19,807 76,126 11,780 87,906 51July ......................... 6,530 159,683 4,883 171,095 67,856 18,840 75,788 10,908 86,696 50August .................... 6,583 164,987 5,358 176,928 66,836 18,795 74,832 10,799 85,632 47September .............. 6,628 170,987 5,536 183,151 67,370 18,921 75,588 10,703 86,291 49October ................... 6,674 172,553 5,552 184,779 66,717 18,965 74,906 10,775 85,682 49November ............... 6,715 169,788 5,627 182,130 65,548 18,875 73,833 10,590 84,423 43December ............... 6,710 167,118 5,899 179,727 68,503 19,116 76,836 10,784 87,619 50
1985January ................... 6,719 155,067 5,806 167,592 63,546 18,518 71,528 10,536 82,064 57February ................. 6,736 150,077 5,717 162,531 62,094 18,088 70,088 10,094 80,182 50March ...................... 6,782 153,739 5,834 166,355 62,558 17,837 70,385 10,010 80,395 43April ........................ 6,836 158,218 6,641 171,695 60,889 17,398 68,651 9,636 78,286 31May ......................... 6,905 160,326 6,967 174,198 60,530 17,236 68,249 9,516 77,765 33June ........................ 6,991 160,595 6,959 174,545 59,629 17,218 67,529 9,317 76,846 33July ......................... 7,045 151,809 7,049 165,903 60,116 17,034 67,816 9,334 77,151 43August .................... 7,109 148,698 7,018 162,825 57,820 16,699 65,307 9,212 74,519 42September .............. 7,185 148,637 7,243 163,065 56,487 16,442 63,701 9,229 72,930 40October ................... 7,258 151,999 7,492 166,749 56,676 16,292 63,908 9,059 72,968 43November ............... 7,223 149,579 7,272 164,075 58,720 16,250 66,103 8,867 74,970 47December ............... 7,189 142,144 7,043 156,376 57,304 16,386 64,704 8,985 73,689 49
1986January ................... 7,182 138,077 6,819 152,078 55,797 16,147 63,043 8,901 71,943 52February ................. 7,172 136,944 7,042 151,157 56,956 16,020 64,134 8,842 72,976 50March ...................... 7,146 140,023 7,246 154,415 55,649 15,821 62,671 8,799 71,470 36April ........................ 7,127 146,639 7,310 161,076 54,556 15,793 61,758 8,591 70,350 28May ......................... 7,133 150,164 7,370 164,667 55,665 15,764 63,010 8,419 71,429 34June ........................ 7,148 148,686 7,075 162,909 57,611 16,319 65,115 8,816 73,930 36July ......................... 7,158 135,630 7,016 149,803 55,023 16,145 62,322 8,845 71,168 43August .................... 7,117 135,542 6,504 149,163 56,964 16,221 64,167 9,018 73,185 42September .............. 7,146 138,396 6,403 151,945 57,474 16,686 65,183 8,976 74,160 45October ................... 7,158 143,855 6,189 157,202 56,148 17,009 63,937 9,220 73,157 41November ............... 7,119 147,597 6,191 160,908 53,000 16,575 60,527 9,048 69,575 42December ............... 7,099 148,665 6,042 161,806 56,841 16,269 64,258 8,853 73,111 40
1987January ................... 7,091 144,044 5,926 157,061 53,789 16,365 61,042 9,111 70,153 35February ................. 7,087 145,206 6,030 158,322 52,847 16,085 59,907 9,025 68,932 34March ...................... 7,098 148,020 6,530 161,648 50,035 15,946 57,052 8,929 65,981 41April ........................ 7,103 151,205 6,795 165,103 51,201 15,970 58,250 8,921 67,171 35May ......................... 7,098 151,329 7,255 165,683 50,221 16,006 57,521 8,706 66,227 43June ........................ 7,098 149,394 6,868 163,361 48,047 15,822 55,063 8,806 63,869 55July ......................... 7,102 136,385 6,729 150,217 49,123 15,819 56,236 8,706 64,942 64August .................... 7,083 132,535 6,488 146,106 50,451 16,038 57,748 8,741 66,489 57September .............. 7,068 138,490 6,403 151,961 51,858 16,029 58,902 8,984 67,887 48October ................... 7,070 147,034 6,838 160,942 53,175 16,081 60,138 9,117 69,256 60November ............... 6,963 154,545 6,767 168,274 53,160 15,704 59,873 8,991 68,864 63December ............... 6,940 156,670 7,187 170,797 55,069 15,759 61,705 9,123 70,827 51
See footnotes at end of table.
Energy Information Administration/Historical Monthly Energy Review 1973-1992 229
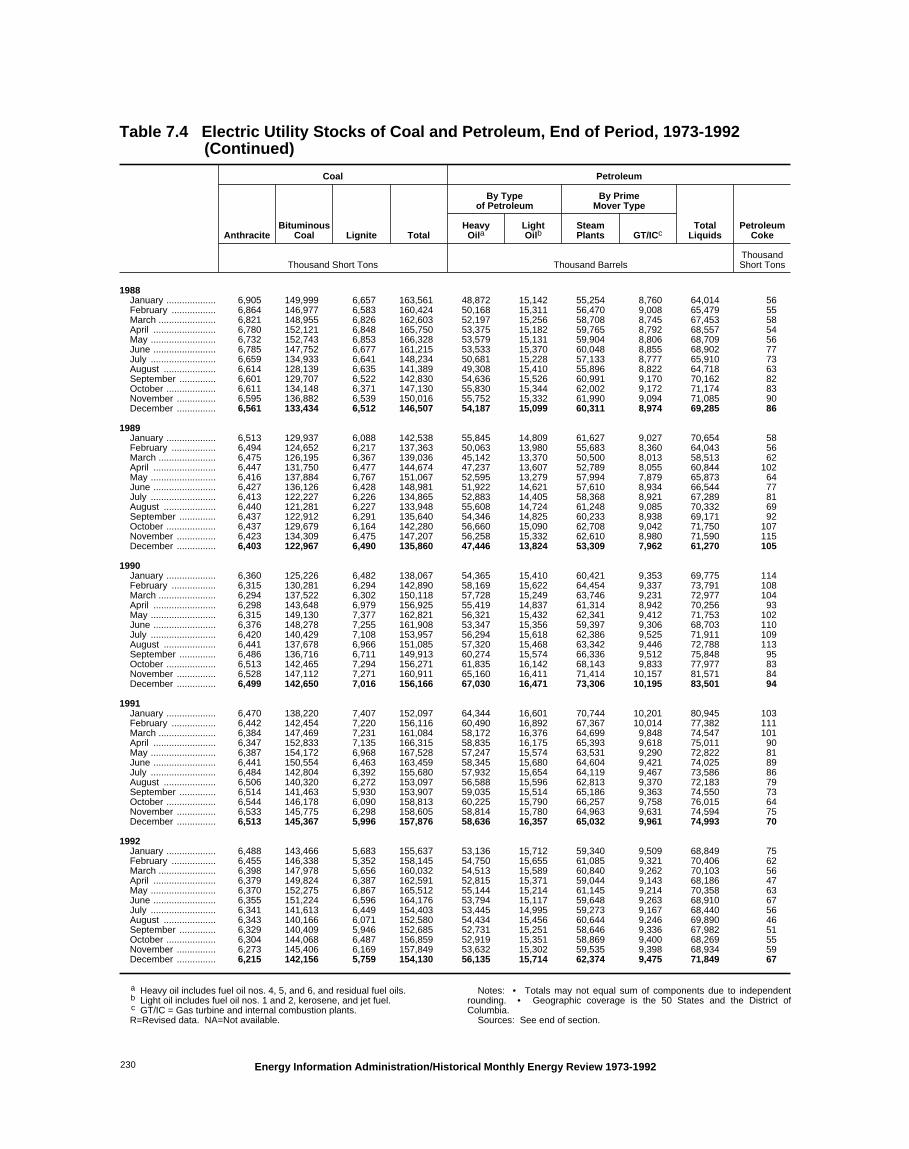
Table 7.4 Electric Utility Stocks of Coal and Petroleum, End of Period, 1973-1992 (Continued)
Coal Petroleum
AnthraciteBituminous
Coal Lignite Total
By Typeof Petroleum
By PrimeMover Type
TotalLiquids
PetroleumCoke
HeavyOila
LightOilb
SteamPlants GT/ICc
Thousand Short Tons Thousand BarrelsThousandShort Tons
1988January ................... 6,905 149,999 6,657 163,561 48,872 15,142 55,254 8,760 64,014 56February ................. 6,864 146,977 6,583 160,424 50,168 15,311 56,470 9,008 65,479 55March ...................... 6,821 148,955 6,826 162,603 52,197 15,256 58,708 8,745 67,453 58April ........................ 6,780 152,121 6,848 165,750 53,375 15,182 59,765 8,792 68,557 54May ......................... 6,732 152,743 6,853 166,328 53,579 15,131 59,904 8,806 68,709 56June ........................ 6,785 147,752 6,677 161,215 53,533 15,370 60,048 8,855 68,902 77July ......................... 6,659 134,933 6,641 148,234 50,681 15,228 57,133 8,777 65,910 73August .................... 6,614 128,139 6,635 141,389 49,308 15,410 55,896 8,822 64,718 63September .............. 6,601 129,707 6,522 142,830 54,636 15,526 60,991 9,170 70,162 82October ................... 6,611 134,148 6,371 147,130 55,830 15,344 62,002 9,172 71,174 83November ............... 6,595 136,882 6,539 150,016 55,752 15,332 61,990 9,094 71,085 90December ............... 6,561 133,434 6,512 146,507 54,187 15,099 60,311 8,974 69,285 86
1989January ................... 6,513 129,937 6,088 142,538 55,845 14,809 61,627 9,027 70,654 58February ................. 6,494 124,652 6,217 137,363 50,063 13,980 55,683 8,360 64,043 56March ...................... 6,475 126,195 6,367 139,036 45,142 13,370 50,500 8,013 58,513 62April ........................ 6,447 131,750 6,477 144,674 47,237 13,607 52,789 8,055 60,844 102May ......................... 6,416 137,884 6,767 151,067 52,595 13,279 57,994 7,879 65,873 64June ........................ 6,427 136,126 6,428 148,981 51,922 14,621 57,610 8,934 66,544 77July ......................... 6,413 122,227 6,226 134,865 52,883 14,405 58,368 8,921 67,289 81August .................... 6,440 121,281 6,227 133,948 55,608 14,724 61,248 9,085 70,332 69September .............. 6,437 122,912 6,291 135,640 54,346 14,825 60,233 8,938 69,171 92October ................... 6,437 129,679 6,164 142,280 56,660 15,090 62,708 9,042 71,750 107November ............... 6,423 134,309 6,475 147,207 56,258 15,332 62,610 8,980 71,590 115December ............... 6,403 122,967 6,490 135,860 47,446 13,824 53,309 7,962 61,270 105
1990January ................... 6,360 125,226 6,482 138,067 54,365 15,410 60,421 9,353 69,775 114February ................. 6,315 130,281 6,294 142,890 58,169 15,622 64,454 9,337 73,791 108March ...................... 6,294 137,522 6,302 150,118 57,728 15,249 63,746 9,231 72,977 104April ........................ 6,298 143,648 6,979 156,925 55,419 14,837 61,314 8,942 70,256 93May ......................... 6,315 149,130 7,377 162,821 56,321 15,432 62,341 9,412 71,753 102June ........................ 6,376 148,278 7,255 161,908 53,347 15,356 59,397 9,306 68,703 110July ......................... 6,420 140,429 7,108 153,957 56,294 15,618 62,386 9,525 71,911 109August .................... 6,441 137,678 6,966 151,085 57,320 15,468 63,342 9,446 72,788 113September .............. 6,486 136,716 6,711 149,913 60,274 15,574 66,336 9,512 75,848 95October ................... 6,513 142,465 7,294 156,271 61,835 16,142 68,143 9,833 77,977 83November ............... 6,528 147,112 7,271 160,911 65,160 16,411 71,414 10,157 81,571 84December ............... 6,499 142,650 7,016 156,166 67,030 16,471 73,306 10,195 83,501 94
1991January ................... 6,470 138,220 7,407 152,097 64,344 16,601 70,744 10,201 80,945 103February ................. 6,442 142,454 7,220 156,116 60,490 16,892 67,367 10,014 77,382 111March ...................... 6,384 147,469 7,231 161,084 58,172 16,376 64,699 9,848 74,547 101April ........................ 6,347 152,833 7,135 166,315 58,835 16,175 65,393 9,618 75,011 90May ......................... 6,387 154,172 6,968 167,528 57,247 15,574 63,531 9,290 72,822 81June ........................ 6,441 150,554 6,463 163,459 58,345 15,680 64,604 9,421 74,025 89July ......................... 6,484 142,804 6,392 155,680 57,932 15,654 64,119 9,467 73,586 86August .................... 6,506 140,320 6,272 153,097 56,588 15,596 62,813 9,370 72,183 79September .............. 6,514 141,463 5,930 153,907 59,035 15,514 65,186 9,363 74,550 73October ................... 6,544 146,178 6,090 158,813 60,225 15,790 66,257 9,758 76,015 64November ............... 6,533 145,775 6,298 158,605 58,814 15,780 64,963 9,631 74,594 75December ............... 6,513 145,367 5,996 157,876 58,636 16,357 65,032 9,961 74,993 70
1992January ................... 6,488 143,466 5,683 155,637 53,136 15,712 59,340 9,509 68,849 75February ................. 6,455 146,338 5,352 158,145 54,750 15,655 61,085 9,321 70,406 62March ...................... 6,398 147,978 5,656 160,032 54,513 15,589 60,840 9,262 70,103 56April ........................ 6,379 149,824 6,387 162,591 52,815 15,371 59,044 9,143 68,186 47May ......................... 6,370 152,275 6,867 165,512 55,144 15,214 61,145 9,214 70,358 63June ........................ 6,355 151,224 6,596 164,176 53,794 15,117 59,648 9,263 68,910 67July ......................... 6,341 141,613 6,449 154,403 53,445 14,995 59,273 9,167 68,440 56August .................... 6,343 140,166 6,071 152,580 54,434 15,456 60,644 9,246 69,890 46September .............. 6,329 140,409 5,946 152,685 52,731 15,251 58,646 9,336 67,982 51October ................... 6,304 144,068 6,487 156,859 52,919 15,351 58,869 9,400 68,269 55November ............... 6,273 145,406 6,169 157,849 53,632 15,302 59,535 9,398 68,934 59December ............... 6,215 142,156 5,759 154,130 56,135 15,714 62,374 9,475 71,849 67
a Heavy oil includes fuel oil nos. 4, 5, and 6, and residual fuel oils.b Light oil includes fuel oil nos. 1 and 2, kerosene, and jet fuel.c GT/IC = Gas turbine and internal combustion plants.R=Revised data. NA=Not available.
Notes: • Totals may not equal sum of components due to independentrounding. • Geographic coverage is the 50 States and the District ofColumbia.
Sources: See end of section.
Energy Information Administration/Historical Monthly Energy Review 1973-1992230

Electricity Sources
Table 7.1
• 1973-September 1977: Federal Power Commission(FPC), Form FPC-4, "Monthly Power Plant Report."
• October 1977-1981: Federal Energy RegulatoryCommission (FERC), Form FPC-4, "Monthly PowerPlant Report."
• 1982-1988: Energy Information Administration(EIA), Form EIA-759, "Monthly Power Plant Report."
• 1989-1992: EIA, Electric Power Monthly, Table 4, and(for geothermal energy and other) EIA, Form EIA-759,"Monthly Power Plant Report."
Table 7.2
• Annual Series: 1984-1992: EIA, Electric PowerMonthly, Table 51, March 1994.
• Monthly Series: 1973-September 1977: FPC, FormFPC-5, "Monthly Statement of Electric Operating Rev-enue and Income." October 1977-February 1980:FERC, Form FERC-5, "Electric Operating Revenue andIncome." March 1980-1982: FERC, Form FERC-5,"Electric Utility Company Monthly Statement." 1983-1986: EIA, Form EIA-826, "Electric Utility CompanyMonthly Statement." 1987 and 1988: EIA, Form EIA-826, "Monthly Electric Utility Sales and Revenue Re-port with State Distributions." Data for all months andyears reflect revisions received on subsequent form
submissions. 1989-1992: EIA, Electric Power Monthly,Table 51.
Table 7.3
• 1973-September 1977: FPC, Form FPC-4, "MonthlyPower Plant Report."
• October 1977-1981: FERC, Form FPC-4, "MonthlyPower Plant Report."
• 1982-1988: EIA, Form EIA-759, "Monthly Power PlantReport."
• 1989-1992: EIA, Electric Power Monthly (issues throughMarch 1994), Tables 17, 24 (for Petroleum Consumptionat Steam-Plants), and 26 (for Petroleum Consumptionat GT/IC Plants).
Table 7.4
• 1973-September 1977: FPC, Form FPC-4, "MonthlyPower Plant Report."
• October 1977-1981: FERC, Form FPC-4, "MonthlyPower Plant Report."
• 1982-1988: EIA, Form EIA-759, "Monthly Power PlantReport."
• 1989: EIA, Electric Power Monthly, Table 25, March1991, and (for Petroleum Stocks by Prime Mover Type)EIA, Form EIA-759, "Monthly Power Plant Report."
• 1990-1992: EIA, Electric Power Monthly (issues throughDecember 1993), Table 28 and (for Petroleum stocks byPrime Mover Type) EIA, Form EIA-759, "MonthlyPower Plant Report."
Energy Information Administration/Historical Monthly Energy Review 1973-1992 231

Section 8Nuclear Energy
Spent nuclear fuel rods are stockpiled in a storage pond.

Table 8.1 Nuclear Power Plant Operations, 1973-1992
OperableUnitsa,b
NuclearElectricity
NetGeneration
NuclearPortion ofDomesticElectricity
Net Generation
NetSummer
Capabilityof Operable
Unitsa,cCapacityFactord
NumberMillion
Kilowatthours PercentMillion
Kilowatts Percent
1973January ....................................... 29 6,246 3.9 14.533 57.8February ..................................... 29 5,928 4.1 14.533 60.7March .......................................... 30 6,649 4.5 15.314 58.4April ............................................ 30 5,876 4.2 15.314 53.4May ............................................. 31 5,697 3.9 16.174 47.3June ............................................ 34 6,784 4.2 18.729 50.3July ............................................. 34 6,960 4.0 18.729 50.0August ........................................ 35 7,785 4.4 19.205 54.5September .................................. 35 7,862 5.0 19.205 56.9October ....................................... 36 7,518 4.9 20.271 49.8November ................................... 36 8,142 5.5 20.271 55.8December ................................... 39 8,031 5.2 22.683 47.6Year ............................................ 39 83,479 4.5 22.683 53.5
1974January ....................................... 39 7,603 4.8 22.683 45.0February ..................................... 40 8,116 5.7 23.735 50.9March .......................................... 39 8,777 5.8 23.675 49.8April ............................................ 40 7,129 5.0 24.201 41.0May ............................................. 42 6,562 4.3 25.461 34.6June ............................................ 43 7,080 4.5 26.237 37.5July ............................................. 43 10,210 5.7 26.237 52.3August ........................................ 45 12,333 7.1 28.139 58.9September .................................. 47 11,010 7.2 30.032 50.9October ....................................... 48 10,864 7.1 30.905 47.7November ................................... 47 11,004 7.3 31.356 48.7December ................................... 48 13,288 8.3 31.867 56.0Year ............................................ 48 113,976 6.1 31.867 47.8
1975January ....................................... 49 13,938 8.5 32.692 57.3February ..................................... 51 12,733 8.7 34.516 54.9March .......................................... 51 14,882 9.6 34.516 58.0April ............................................ 52 13,327 9.1 35.306 52.4May ............................................. 52 13,764 9.0 35.306 52.4June ............................................ 52 12,744 7.8 35.306 50.1July ............................................. 52 15,372 8.7 35.306 58.5August ........................................ 52 15,880 8.8 35.306 60.5September .................................. 52 14,396 9.3 35.306 56.6October ....................................... 52 14,626 9.4 35.306 55.6November ................................... 53 14,164 9.3 36.163 54.4December ................................... 54 16,679 9.8 37.267 60.2Year ............................................ 54 172,505 9.0 37.267 55.9
1976January ....................................... 54 16,099 9.0 37.267 58.1February ..................................... 54 14,377 9.2 37.267 55.4March .......................................... 54 13,993 8.5 37.267 50.5April ............................................ 55 10,982 7.2 38.232 40.0May ............................................. 56 11,929 7.6 39.071 41.0June ............................................ 57 15,757 9.1 39.881 54.9July ............................................. 57 17,709 9.5 39.881 59.7August ........................................ 56 18,363 9.9 39.818 62.0September .................................. 57 17,290 10.5 40.884 58.7October ....................................... 57 17,355 10.6 40.884 57.0November ................................... 57 16,134 9.5 40.884 54.8December ................................... 61 21,115 11.5 43.822 64.8Year ............................................ 61 191,104 9.4 43.822 54.7
1977January ....................................... 62 22,152 11.3 44.559 66.8February ..................................... 62 19,601 12.0 44.559 65.5March .......................................... 62 20,672 12.2 44.559 62.4April ............................................ 62 19,867 12.7 44.559 62.0May ............................................. 62 20,599 12.2 44.559 62.1June ............................................ 62 21,517 11.9 44.559 67.1July ............................................. 62 21,825 11.0 44.559 65.8August ........................................ 64 22,750 11.6 46.303 66.2September .................................. 65 19,630 11.1 46.303 59.0October ....................................... 65 19,041 11.4 46.303 55.3November ................................... 65 19,458 11.6 46.303 58.5December ................................... 65 23,771 12.9 46.303 69.0Year ............................................ 65 250,883 11.8 46.303 63.3
See footnotes at end of table.
Energy Information Administration/Historical Monthly Energy Review 1973-1992 235

Table 8.1 Nuclear Power Plant Operations, 1973-1992 (Continued)
OperableUnitsa,b
NuclearElectricity
NetGeneration
NuclearPortion ofDomesticElectricity
Net Generation
NetSummer
Capabilityof Operable
Unitsa,cCapacityFactord
NumberMillion
Kilowatthours PercentMillion
Kilowatts Percent
1978January ....................................... 65 25,833 13.1 46.303 75.0February ..................................... 65 21,833 12.6 46.303 70.2March .......................................... 66 22,449 13.0 47.403 63.7April ............................................ 68 17,580 11.0 49.198 49.7May ............................................. 68 20,416 11.7 49.198 55.8June ............................................ 68 22,185 11.8 49.198 62.6July ............................................. 68 25,007 12.3 49.198 68.3August ........................................ 68 25,599 12.4 49.198 69.9September .................................. 69 22,189 12.0 49.966 61.7October ....................................... 69 22,997 13.1 49.966 60.9November ................................... 69 24,901 14.1 49.966 69.2December ................................... 70 25,415 13.2 50.824 67.2Year ............................................ 70 276,403 12.5 50.824 64.5
1979January ....................................... 69 27,792 13.3 50.627 73.8February ..................................... 69 25,911 13.9 50.627 76.2March .......................................... 68 24,335 13.3 49.747 65.7April ............................................ 68 18,418 10.8 49.747 51.6May ............................................. 68 15,025 8.4 49.747 40.6June ............................................ 68 16,065 8.6 49.747 44.9July ............................................. 68 20,825 10.3 49.747 56.3August ........................................ 68 24,204 11.8 49.747 65.4September .................................. 68 21,804 12.1 49.747 61.0October ....................................... 68 20,934 11.6 49.747 56.5November ................................... 68 19,255 10.8 49.747 53.9December ................................... 68 20,586 10.9 49.747 55.6Year ............................................ 68 255,155 11.4 49.747 58.4
1980January ....................................... 68 19,746 9.9 49.747 53.4February ..................................... 68 19,277 10.2 49.747 55.7March .......................................... 68 20,039 10.7 49.747 54.1April ............................................ 68 18,794 11.1 49.747 52.5May ............................................. 68 18,385 10.5 49.747 49.7June ............................................ 68 18,322 9.7 49.747 51.2July ............................................. 69 21,024 9.7 50.895 55.5August ........................................ 70 24,333 11.3 51.810 63.1September .................................. 70 23,572 12.3 51.810 63.2October ....................................... 70 24,510 13.7 51.810 63.5November ................................... 70 20,984 11.8 51.810 56.3December ................................... 70 22,130 11.3 51.810 57.4Year ............................................ 70 251,116 11.0 51.810 56.3
1981January ....................................... 70 23,779 11.5 51.810 61.7February ..................................... 70 21,595 12.0 51.810 62.0March .......................................... 70 22,004 11.9 51.810 57.1April ............................................ 70 20,646 12.0 51.810 55.4May ............................................. 71 19,723 11.1 52.638 50.4June ............................................ 72 21,166 10.4 53.744 54.7July ............................................. 72 23,080 10.5 53.744 57.7August ........................................ 72 26,946 12.8 53.744 67.4September .................................. 73 24,398 13.1 54.894 61.7October ....................................... 73 20,556 11.3 54.894 50.3November ................................... 73 22,783 13.0 54.894 57.6December ................................... 74 25,997 13.3 56.042 62.3Year ............................................ 74 272,674 11.9 56.042 58.2
1982January ....................................... 74 25,678 12.3 56.042 61.6February ..................................... 74 20,188 11.2 56.042 53.6March .......................................... 74 22,755 12.1 56.042 54.6April ............................................ 74 21,785 12.6 56.042 54.1May ............................................. 74 21,639 12.2 56.042 51.9June ............................................ 74 24,026 12.9 56.042 59.5July ............................................. 74 25,467 12.1 56.042 61.1August ........................................ 74 24,986 12.1 56.042 59.9September .................................. 76 25,391 14.1 58.160 60.6October ....................................... 75 23,248 13.4 58.100 53.7November ................................... 77 23,235 13.4 60.035 53.8December ................................... 77 24,376 13.2 60.035 54.6Year ............................................ 77 282,773 12.6 60.035 56.6
See footnotes at end of table.
Energy Information Administration/Historical Monthly Energy Review 1973-1992236
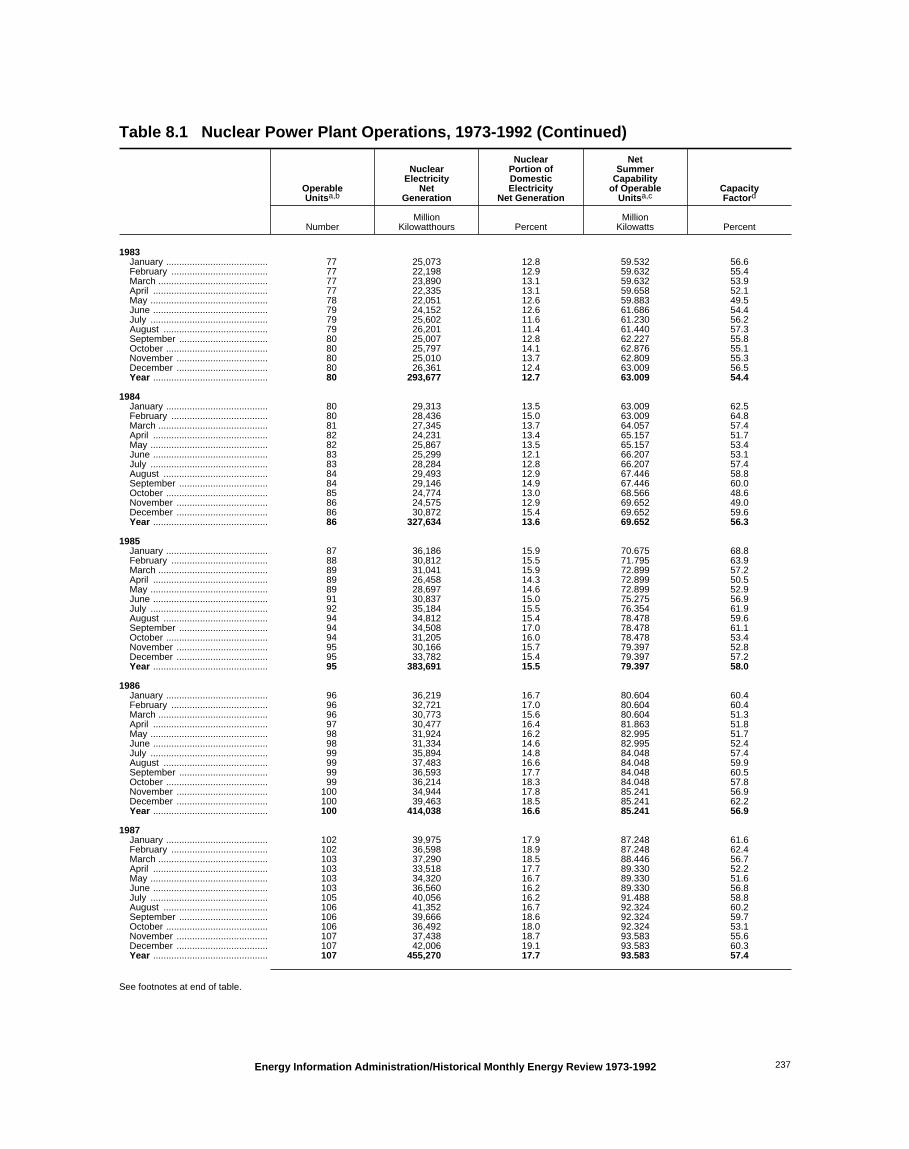
Table 8.1 Nuclear Power Plant Operations, 1973-1992 (Continued)
OperableUnitsa,b
NuclearElectricity
NetGeneration
NuclearPortion ofDomesticElectricity
Net Generation
NetSummer
Capabilityof Operable
Unitsa,cCapacityFactord
NumberMillion
Kilowatthours PercentMillion
Kilowatts Percent
1983January ....................................... 77 25,073 12.8 59.532 56.6February ..................................... 77 22,198 12.9 59.632 55.4March .......................................... 77 23,890 13.1 59.632 53.9April ............................................ 77 22,335 13.1 59.658 52.1May ............................................. 78 22,051 12.6 59.883 49.5June ............................................ 79 24,152 12.6 61.686 54.4July ............................................. 79 25,602 11.6 61.230 56.2August ........................................ 79 26,201 11.4 61.440 57.3September .................................. 80 25,007 12.8 62.227 55.8October ....................................... 80 25,797 14.1 62.876 55.1November ................................... 80 25,010 13.7 62.809 55.3December ................................... 80 26,361 12.4 63.009 56.5Year ............................................ 80 293,677 12.7 63.009 54.4
1984January ....................................... 80 29,313 13.5 63.009 62.5February ..................................... 80 28,436 15.0 63.009 64.8March .......................................... 81 27,345 13.7 64.057 57.4April ............................................ 82 24,231 13.4 65.157 51.7May ............................................. 82 25,867 13.5 65.157 53.4June ............................................ 83 25,299 12.1 66.207 53.1July ............................................. 83 28,284 12.8 66.207 57.4August ........................................ 84 29,493 12.9 67.446 58.8September .................................. 84 29,146 14.9 67.446 60.0October ....................................... 85 24,774 13.0 68.566 48.6November ................................... 86 24,575 12.9 69.652 49.0December ................................... 86 30,872 15.4 69.652 59.6Year ............................................ 86 327,634 13.6 69.652 56.3
1985January ....................................... 87 36,186 15.9 70.675 68.8February ..................................... 88 30,812 15.5 71.795 63.9March .......................................... 89 31,041 15.9 72.899 57.2April ............................................ 89 26,458 14.3 72.899 50.5May ............................................. 89 28,697 14.6 72.899 52.9June ............................................ 91 30,837 15.0 75.275 56.9July ............................................. 92 35,184 15.5 76.354 61.9August ........................................ 94 34,812 15.4 78.478 59.6September .................................. 94 34,508 17.0 78.478 61.1October ....................................... 94 31,205 16.0 78.478 53.4November ................................... 95 30,166 15.7 79.397 52.8December ................................... 95 33,782 15.4 79.397 57.2Year ............................................ 95 383,691 15.5 79.397 58.0
1986January ....................................... 96 36,219 16.7 80.604 60.4February ..................................... 96 32,721 17.0 80.604 60.4March .......................................... 96 30,773 15.6 80.604 51.3April ............................................ 97 30,477 16.4 81.863 51.8May ............................................. 98 31,924 16.2 82.995 51.7June ............................................ 98 31,334 14.6 82.995 52.4July ............................................. 99 35,894 14.8 84.048 57.4August ........................................ 99 37,483 16.6 84.048 59.9September .................................. 99 36,593 17.7 84.048 60.5October ....................................... 99 36,214 18.3 84.048 57.8November ................................... 100 34,944 17.8 85.241 56.9December ................................... 100 39,463 18.5 85.241 62.2Year ............................................ 100 414,038 16.6 85.241 56.9
1987January ....................................... 102 39,975 17.9 87.248 61.6February ..................................... 102 36,598 18.9 87.248 62.4March .......................................... 103 37,290 18.5 88.446 56.7April ............................................ 103 33,518 17.7 89.330 52.2May ............................................. 103 34,320 16.7 89.330 51.6June ............................................ 103 36,560 16.2 89.330 56.8July ............................................. 105 40,056 16.2 91.488 58.8August ........................................ 106 41,352 16.7 92.324 60.2September .................................. 106 39,666 18.6 92.324 59.7October ....................................... 106 36,492 18.0 92.324 53.1November ................................... 107 37,438 18.7 93.583 55.6December ................................... 107 42,006 19.1 93.583 60.3Year ............................................ 107 455,270 17.7 93.583 57.4
See footnotes at end of table.
Energy Information Administration/Historical Monthly Energy Review 1973-1992 237

Table 8.1 Nuclear Power Plant Operations, 1973-1992 (Continued)
OperableUnitsa,b
NuclearElectricity
NetGeneration
NuclearPortion ofDomesticElectricity
Net Generation
NetSummer
Capabilityof Operable
Unitsa,cCapacityFactord
NumberMillion
Kilowatthours PercentMillion
Kilowatts Percent
1988January ....................................... 107 44,658 18.8 93.583 64.1February ..................................... 106 42,246 19.5 92.743 65.4March .......................................... 107 43,912 20.5 93.982 62.8April ............................................ 107 40,067 20.4 93.982 59.3May ............................................. 108 40,650 19.5 95.089 57.5June ............................................ 108 44,079 18.9 95.089 64.4July ............................................. 108 49,828 19.4 94.695 70.7August ........................................ 108 49,035 18.3 94.695 69.5September .................................. 108 46,270 21.0 94.695 67.9October ....................................... 108 42,591 20.2 94.695 60.4November ................................... 108 39,583 18.9 94.695 58.0December ................................... 108 44,052 18.9 94.695 62.5Year ............................................ 108 526,973 19.5 94.695 63.5
1989January ....................................... 108 46,328 19.9 94.695 65.8February ..................................... 108 38,725 17.6 94.695 60.9March .......................................... 110 39,636 17.5 97.031 54.9April ............................................ 110 33,495 16.1 97.031 48.0May ............................................. 110 38,339 17.4 97.031 53.1June ............................................ 110 42,976 18.2 97.031 61.5July ............................................. 110 52,331 20.4 97.323 72.3August ........................................ 110 54,948 21.2 98.161 75.2September .................................. 110 44,837 19.7 98.161 63.4October ....................................... 110 43,558 19.8 98.161 59.6November ................................... 110 43,399 19.8 98.161 61.4December ................................... 110 50,784 19.6 98.161 69.5Year ............................................ 110 529,355 19.0 98.161 62.2
1990January ....................................... 110 55,119 23.2 98.161 75.5February ..................................... 110 49,963 23.5 98.161 75.7March .......................................... 111 46,087 20.4 99.311 62.4April ............................................ 112 38,516 18.2 100.461 53.3May ............................................. 112 42,945 19.3 100.461 57.5June ............................................ 112 46,332 18.6 100.461 64.1July ............................................. 112 53,645 20.1 100.497 71.7August ........................................ 112 55,758 20.8 100.497 74.6September .................................. 111 48,485 20.4 99.624 67.5October ....................................... 111 43,395 19.3 99.624 58.5November ................................... 111 45,034 21.1 99.624 62.8December ................................... 111 51,582 21.7 99.624 69.6Year ............................................ 111 576,862 20.5 99.624 66.0
1991January ....................................... 111 54,369 21.9 99.624 73.4February ..................................... 111 47,863 22.7 99.624 71.5March .......................................... 111 49,121 22.2 99.624 66.3April ............................................ 111 41,631 19.9 99.624 58.1May ............................................. 111 46,755 19.9 99.624 63.1June ............................................ 111 54,208 21.8 99.624 75.6July ............................................. 111 60,735 22.3 99.589 82.0August ........................................ 111 58,473 21.8 99.589 78.9September .................................. 111 51,874 22.2 99.589 72.3October ....................................... 111 47,653 21.3 99.589 64.2November ................................... 111 46,295 20.9 99.589 64.6December ................................... 111 53,589 22.9 99.589 72.3Year ............................................ 111 612,565 21.7 99.589 70.2
1992January ....................................... 111 57,849 23.7 99.589 78.1February ..................................... 110 52,804 24.2 99.421 76.3March .......................................... 110 45,835 20.4 99.421 62.0April ............................................ 110 42,268 20.0 99.421 59.1May ............................................. 110 45,627 20.7 99.421 61.7June ............................................ 110 51,185 21.6 99.421 71.5July ............................................. 110 56,049 21.1 99.421 75.8August ........................................ 110 58,656 23.0 99.421 79.3September .................................. 110 50,919 21.7 99.421 71.1October ....................................... 110 48,784 22.0 99.421 65.9November ................................... 110 50,726 22.9 99.421 70.9December ................................... 109 58,075 23.8 98.985 78.9Year ............................................ 109 618,776 22.1 98.985 70.9
a At end of period.b See Note 1 at end of section.c For the definition of "Net Summer Capability," see Note 3 at end of
section .d For an explanation of the method of calculating the capacity factor, see
Note 4 at end of section.Notes: • Nuclear electricity net generation totals may not equal sum of
components due to independent rounding. • Geographic coverage is the 50States and the District of Columbia.
Sources: See end of section.
Energy Information Administration/Historical Monthly Energy Review 1973-1992238
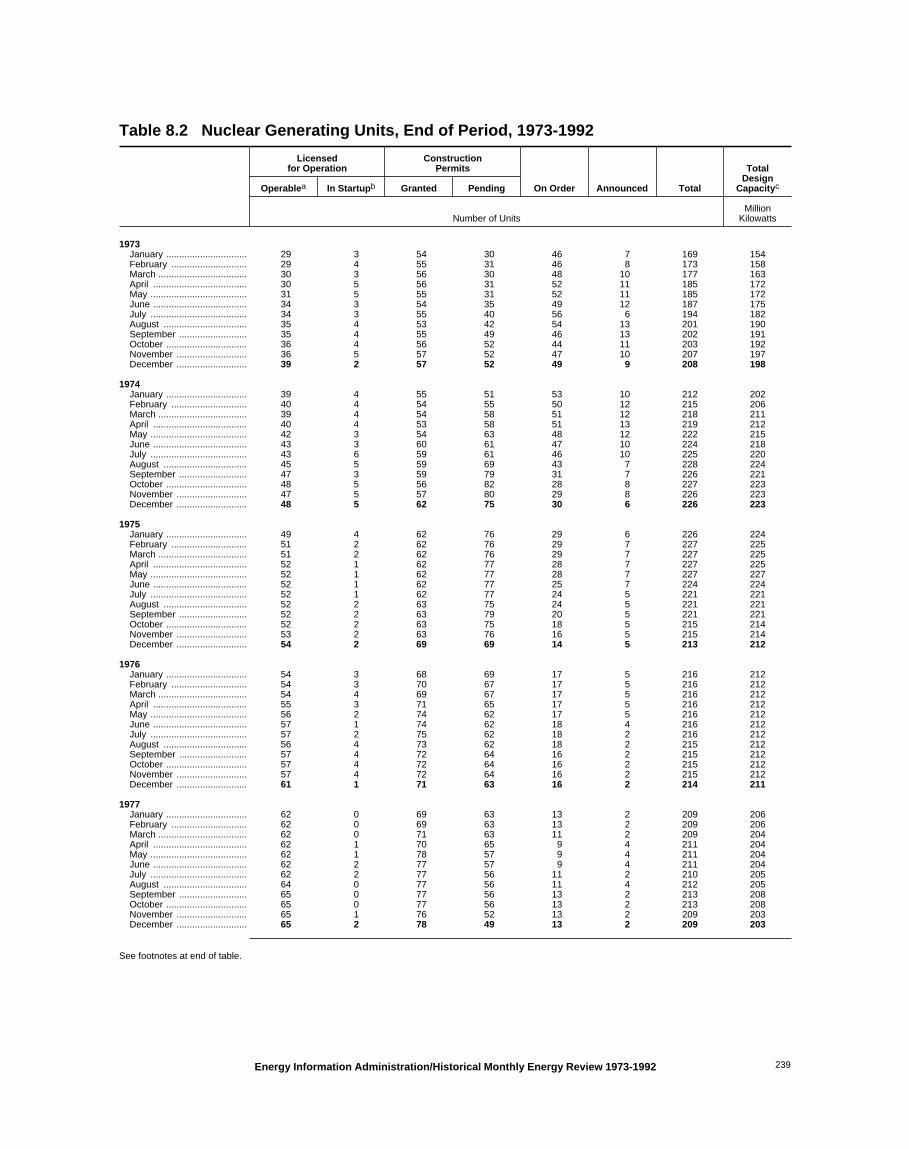
Table 8.2 Nuclear Generating Units, End of Period, 1973-1992
Licensedfor Operation
ConstructionPermits
On Order Announced Total
TotalDesign
CapacitycOperablea In Startupb Granted Pending
Number of UnitsMillion
Kilowatts
1973January ............................... 29 3 54 30 46 7 169 154February ............................. 29 4 55 31 46 8 173 158March .................................. 30 3 56 30 48 10 177 163April .................................... 30 5 56 31 52 11 185 172May ..................................... 31 5 55 31 52 11 185 172June .................................... 34 3 54 35 49 12 187 175July ..................................... 34 3 55 40 56 6 194 182August ................................ 35 4 53 42 54 13 201 190September .......................... 35 4 55 49 46 13 202 191October ............................... 36 4 56 52 44 11 203 192November ........................... 36 5 57 52 47 10 207 197December ........................... 39 2 57 52 49 9 208 198
1974January ............................... 39 4 55 51 53 10 212 202February ............................. 40 4 54 55 50 12 215 206March .................................. 39 4 54 58 51 12 218 211April .................................... 40 4 53 58 51 13 219 212May ..................................... 42 3 54 63 48 12 222 215June .................................... 43 3 60 61 47 10 224 218July ..................................... 43 6 59 61 46 10 225 220August ................................ 45 5 59 69 43 7 228 224September .......................... 47 3 59 79 31 7 226 221October ............................... 48 5 56 82 28 8 227 223November ........................... 47 5 57 80 29 8 226 223December ........................... 48 5 62 75 30 6 226 223
1975January ............................... 49 4 62 76 29 6 226 224February ............................. 51 2 62 76 29 7 227 225March .................................. 51 2 62 76 29 7 227 225April .................................... 52 1 62 77 28 7 227 225May ..................................... 52 1 62 77 28 7 227 227June .................................... 52 1 62 77 25 7 224 224July ..................................... 52 1 62 77 24 5 221 221August ................................ 52 2 63 75 24 5 221 221September .......................... 52 2 63 79 20 5 221 221October ............................... 52 2 63 75 18 5 215 214November ........................... 53 2 63 76 16 5 215 214December ........................... 54 2 69 69 14 5 213 212
1976January ............................... 54 3 68 69 17 5 216 212February ............................. 54 3 70 67 17 5 216 212March .................................. 54 4 69 67 17 5 216 212April .................................... 55 3 71 65 17 5 216 212May ..................................... 56 2 74 62 17 5 216 212June .................................... 57 1 74 62 18 4 216 212July ..................................... 57 2 75 62 18 2 216 212August ................................ 56 4 73 62 18 2 215 212September .......................... 57 4 72 64 16 2 215 212October ............................... 57 4 72 64 16 2 215 212November ........................... 57 4 72 64 16 2 215 212December ........................... 61 1 71 63 16 2 214 211
1977January ............................... 62 0 69 63 13 2 209 206February ............................. 62 0 69 63 13 2 209 206March .................................. 62 0 71 63 11 2 209 204April .................................... 62 1 70 65 9 4 211 204May ..................................... 62 1 78 57 9 4 211 204June .................................... 62 2 77 57 9 4 211 204July ..................................... 62 2 77 56 11 2 210 205August ................................ 64 0 77 56 11 4 212 205September .......................... 65 0 77 56 13 2 213 208October ............................... 65 0 77 56 13 2 213 208November ........................... 65 1 76 52 13 2 209 203December ........................... 65 2 78 49 13 2 209 203
See footnotes at end of table.
Energy Information Administration/Historical Monthly Energy Review 1973-1992 239

Table 8.2 Nuclear Generating Units, End of Period, 1973-1992 (Continued)
Licensedfor Operation
ConstructionPermits
On Order Announced Total
TotalDesign
CapacitycOperablea In Startupb Granted Pending
Number of UnitsMillion
Kilowatts
1978January ............................... 65 2 84 43 13 2 209 206February ............................. 65 3 85 41 13 2 209 206March .................................. 66 2 85 43 11 2 209 206April .................................... 68 0 88 40 10 2 208 204May ..................................... 68 0 88 36 10 2 204 201June .................................... 68 1 87 34 7 2 199 196July ..................................... 68 1 87 34 7 2 199 196August ................................ 68 1 87 34 7 2 199 196September .......................... 69 1 86 32 5 2 195 191October ............................... 69 1 86 32 5 2 195 191November ........................... 69 1 88 30 5 2 195 191December ........................... 70 0 88 32 5 0 195 191
1979January ............................... 69 0 90 30 5 0 194 191February ............................. 69 0 90 30 5 0 194 191March .................................. 68 0 90 29 5 0 192 189April .................................... 68 0 90 29 5 0 192 189May ..................................... 68 0 90 29 5 0 192 189June .................................... 68 0 90 26 5 0 189 185July ..................................... 68 0 90 24 5 0 187 183August ................................ 68 0 90 24 3 0 185 180September .......................... 68 0 90 24 3 0 185 180October ............................... 68 0 90 24 3 0 185 180November ........................... 68 0 90 24 3 0 185 180December ........................... 68 0 90 24 3 0 185 180
1980January ............................... 68 0 93 16 3 0 180 175February ............................. 68 1 91 16 3 0 179 174March .................................. 68 1 89 16 3 0 177 172April .................................... 68 3 87 16 3 0 177 172May ..................................... 68 3 87 16 3 0 177 172June .................................... 68 3 87 14 3 0 175 169July ..................................... 69 2 87 14 3 0 175 169August ................................ 70 1 87 14 3 0 175 169September .......................... 70 1 85 14 3 0 173 167October ............................... 70 2 84 14 3 0 173 167November ........................... 70 2 82 14 3 0 171 165December ........................... 70 1 82 12 3 0 168 162
1981January ............................... 70 3 81 12 3 0 169 163February ............................. 70 3 81 12 3 0 169 163March .................................. 70 3 81 12 3 0 169 163April .................................... 70 3 81 12 3 0 169 163May ..................................... 71 2 81 12 3 0 169 163June .................................... 72 2 80 12 3 0 169 163July ..................................... 72 2 80 12 3 0 169 163August ................................ 72 2 79 12 3 0 168 162September .......................... 73 1 79 11 3 0 167 161October ............................... 73 1 78 11 3 0 166 160November ........................... 73 1 79 11 2 0 166 160December ........................... 74 0 76 11 2 0 163 157
1982January ............................... 74 0 71 13 3 0 161 154February ............................. 74 1 70 8 3 0 156 148March .................................. 74 1 70 8 3 0 156 148April .................................... 74 2 69 8 3 0 156 148May ..................................... 74 2 69 8 3 0 156 148June .................................... 74 3 68 8 3 0 156 148July ..................................... 74 4 67 8 3 0 156 148August ................................ 74 5 66 5 2 0 152 143September .......................... 76 3 66 5 2 0 152 143October ............................... 75 3 64 3 2 0 147 138November ........................... 77 2 60 3 2 0 144 134December ........................... 77 2 60 3 2 0 144 134
See footnotes at end of table.
Energy Information Administration/Historical Monthly Energy Review 1973-1992240

Table 8.2 Nuclear Generating Units, End of Period, 1973-1992 (Continued)
Licensedfor Operation
ConstructionPermits
On Order Announced Total
TotalDesign
CapacitycOperablea In Startupb Granted Pending
Number of UnitsMillion
Kilowatts
1983January ............................... 77 2 60 3 2 0 144 135February ............................. 77 2 60 3 2 0 144 135March .................................. 77 3 59 3 2 0 144 135April .................................... 77 4 57 3 2 0 143 134May ..................................... 78 3 57 3 2 0 143 134June .................................... 79 2 57 3 2 0 143 134July ..................................... 79 2 57 3 2 0 143 134August ................................ 79 2 57 3 2 0 143 134September .......................... 80 1 57 3 2 0 143 134October ............................... 80 1 56 2 2 0 141 133November ........................... 80 1 56 0 2 0 139 131December ........................... 80 3 53 0 2 0 138 129
1984January ............................... 80 3 51 0 2 0 136 128February ............................. 80 3 51 0 2 0 136 128March .................................. 81 3 50 0 2 0 136 128April .................................... 82 3 49 0 2 0 136 128May ..................................... 82 3 49 0 2 0 136 128June .................................... 83 3 48 0 2 0 136 128July ..................................... 83 3 48 0 2 0 136 128August ................................ 84 2 44 0 2 0 132 123September .......................... 84 2 44 0 2 0 132 123October ............................... 85 3 42 0 2 0 132 123November ........................... 86 2 42 0 2 0 132 123December ........................... 86 6 38 0 2 0 132 123
1985January ............................... 87 5 38 0 2 0 132 123February ............................. 88 4 38 0 2 0 132 123March .................................. 89 5 36 0 2 0 132 123April .................................... 89 6 33 0 2 0 130 121May ..................................... 89 6 33 0 2 0 130 121June .................................... 91 4 33 0 2 0 130 121July ..................................... 92 3 33 0 2 0 130 121August ................................ 94 2 32 0 2 0 130 121September .......................... 94 2 32 0 2 0 130 121October ............................... 94 2 32 0 2 0 130 121November ........................... 95 2 31 0 2 0 130 121December ........................... 95 3 30 0 2 0 130 121
1986January ............................... 96 2 30 0 2 0 130 121February ............................. 96 3 29 0 2 0 130 121March .................................. 96 4 28 0 2 0 130 121April .................................... 97 4 27 0 2 0 130 121May ..................................... 98 3 27 0 2 0 130 121June .................................... 98 3 27 0 2 0 130 121July ..................................... 99 2 25 0 2 0 128 119August ................................ 99 2 25 0 2 0 128 119September .......................... 99 3 24 0 2 0 128 119October ............................... 99 7 20 0 2 0 128 119November ........................... 100 7 19 0 2 0 128 119December ........................... 100 7 19 0 2 0 128 119
1987January ............................... 102 6 18 0 2 0 128 119February ............................. 102 6 18 0 2 0 128 119March .................................. 103 6 17 0 2 0 128 119April .................................... 103 5 17 0 2 0 127 119May ..................................... 103 6 16 0 2 0 127 119June .................................... 103 6 16 0 2 0 127 119July ..................................... 105 4 16 0 2 0 127 119August ................................ 106 3 16 0 2 0 127 119September .......................... 106 4 15 0 2 0 127 119October ............................... 106 4 15 0 2 0 127 119November ........................... 107 3 15 0 2 0 127 119December ........................... 107 4 14 0 2 0 127 119
See footnotes at end of table.
Energy Information Administration/Historical Monthly Energy Review 1973-1992 241

Table 8.2 Nuclear Generating Units, End of Period, 1973-1992 (Continued)
Licensedfor Operation
ConstructionPermits
On Order Announced Total
TotalDesign
CapacitycOperablea In Startupb Granted Pending
Number of UnitsMillion
Kilowatts
1988January ............................... 107 4 14 0 2 0 127 119February ............................. 106 4 14 0 2 0 126 118March .................................. 107 3 14 0 2 0 126 118April .................................... 107 3 14 0 2 0 126 118May ..................................... 108 2 14 0 2 0 126 118June .................................... 108 2 14 0 2 0 126 118July ..................................... 108 2 14 0 2 0 126 118August ................................ 108 2 14 0 2 0 126 118September .......................... 108 2 14 0 d 0 0 124 116October ............................... 108 2 e 13 0 0 0 123 115November ........................... 108 2 13 0 0 0 123 115December ........................... 108 3 12 0 0 0 123 115
1989January ............................... 108 3 12 0 0 0 123 115February ............................. 108 3 12 0 0 0 123 115March .................................. 110 2 11 0 0 0 123 115April .................................... f 110 1 11 0 0 0 f 122 114May ..................................... 110 1 11 0 0 0 122 114June .................................... 110 1 11 0 0 0 122 114July ..................................... 110 2 10 0 0 0 122 114August ................................ 110 1 10 0 0 0 121 113September .......................... 110 1 10 0 0 0 121 113October ............................... 110 1 10 0 0 0 121 113November ........................... 110 1 10 0 0 0 121 113December ........................... 110 1 10 0 0 0 121 113
1990January ............................... 110 1 10 0 0 0 121 113February ............................. 110 2 9 0 0 0 121 113March .................................. 111 1 9 0 0 0 121 113April .................................... 112 0 9 0 0 0 121 113May ..................................... 112 0 9 0 0 0 121 113June .................................... 112 0 9 0 0 0 121 113July ..................................... 112 0 9 0 0 0 121 113August ................................ 112 0 9 0 0 0 121 113September .......................... g 111 0 9 0 0 0 g 120 113October ............................... 111 0 9 0 0 0 120 113November ........................... 111 0 9 0 0 0 120 113December ........................... 111 0 8 0 0 0 119 111
1991January ............................... 111 0 8 0 0 0 119 111February ............................. 111 0 8 0 0 0 119 111March .................................. 111 0 8 0 0 0 119 111April .................................... 111 0 8 0 0 0 119 111May ..................................... 111 0 8 0 0 0 119 111June .................................... 111 0 8 0 0 0 119 111July ..................................... 111 0 8 0 0 0 119 111August ................................ 111 0 8 0 0 0 119 111September .......................... 111 0 8 0 0 0 119 111October ............................... 111 0 8 0 0 0 119 111November ........................... 111 0 8 0 0 0 119 111December ........................... 111 0 8 0 0 0 119 111
1992January ............................... 111 0 8 0 0 0 119 111February ............................. 110 0 8 0 0 0 118 111March .................................. 110 0 8 0 0 0 118 111April .................................... 110 0 8 0 0 0 118 111May ..................................... 110 0 8 0 0 0 118 111June .................................... 110 0 8 0 0 0 118 111July ..................................... 110 0 8 0 0 0 118 111August ................................ 110 0 8 0 0 0 118 111September .......................... 110 0 8 0 0 0 118 111October ............................... 110 0 8 0 0 0 118 111November ........................... 110 0 8 0 0 0 118 111December ........................... 109 0 8 0 0 0 117 111
a See Note 1 at end of section.b See Note 2 at end of section.c Net design electrical rating (DER) is used because many of the units
were canceled prior to being assigned a net summer capability. See Note 3at end of section.
d On the December 31, 1988 Form EIA-254, "Semiannual Report onStatus of Reactor Construction," the two planned units were reportedcanceled as of September 1988.
e Seabrook 2 was deleted from this category because its constructionpermit expired in October 1988.
f Shoreham received a full-power license in April 1989. Because the unitwas not scheduled to operate, it was deleted from the total.
g As of September 1990, Rancho Seco was deleted from this category. Because the unit was not scheduled to operate, it was deleted from the total.
Note: Geographic coverage is the 50 States and the District of Columbia.Sources: See end of section.
Energy Information Administration/Historical Monthly Energy Review 1973-1992242

Nuclear Energy Notes and Sources
Notes:
1. Operable Units: Nuclear generating units that havebeen issued a full-power license by the Nuclear Regu-latory Commission (NRC).
Exceptions: The Shippingport (60 megawatts (MW))and the Hanford-N (840 MW) nuclear units were in-cluded in the operable units until 1982 and 1988, respec-tively. The Shippingport unit was excluded from theoperable category during March 1974-August 1977 dueto a major core modification outage. Hanford-N, anunlicensed unit used for defense materiel production,was included in the operable category because powerwas produced as a by-product and sold commercially.Three Mile Island 2 (880 MW) experienced a majoraccident in 1979 and, although that unit still retains itsoperating license and site cleanup continues, there is noplan to restart it. Therefore, it has not been included inthe operable category since March 1979. AlthoughShoreham received a full-power license in April 1989,the unit is not currently scheduled to operate and, there-fore, has not been included in the operable category.Rancho Seco (873 MW) was shut down by the Sacra-mento Municipal Utility District (SMUD) in June 1989following a referendum on its continued operation.Because there are currently no plans to operate it as anuclear unit, it is no longer included as an operable unitbut is identified as a unit shut down for an extendedperiod. The Department of Energy-operated Experi-mental Breeder Reactor 2 (EBR-2) unit is not a commer-cial reactor and is therefore not included in the operablecategory.
In addition, eight units have been retired and thereforeremoved from the operable category. Those units are:Peach Bottom 1 (40 MW) and Indian Point 1 (265 MW),both retired in 1974; Humboldt Bay (65 MW), officiallyretired in 1976; Dresden 1 (200 MW), retired in August1979; LaCrosse (51 MW), retired in May 1987; Fort SaintVrain (217 MW), retired in August 1989; Yankee Rowe1 (185 MW), retired in February 1992; and San Onofre 1(436 MW), retired in December 1992.
2. In Startup: The period of time between a nucleargenerating unit’s initial fuel loading date and theissuance of its full-power license. During that period,the unit is undergoing low-power testing and themaximum level of operation is 5 percent of the unit’sdesign thermal rating.
3. Capacity: Nuclear generating units may have morethan one type of net capacity rating, including the fol-lowing:
(a) Net Summer Capability—The steady hourly outputthat generating equipment is expected to supply tosystem load, exclusive of auxiliary power, as demon-strated by test at the time of summer peak demand.Auxiliary power of a typical nuclear power plant isabout 5 percent of gross generation.
(b) Net Design Capacity or Net Design Electrical Rating(DER)—The nominal net electrical output of a unit,specified by the utility and used for plant design.
4. Monthly Capacity Factors: The monthly capacityfactors are computed as the actual monthly generationdivided by the maximum possible generation for thatmonth. The maximum possible generation is the num-ber of hours in the month multiplied by the net summercapability at the end of the month. That fraction is thenmultiplied by 100 to obtain a percentage. Annual ca-pacity factors are averages of the monthly values forthat year.
Sources:
Table 8.1
• Operable Units: 1973-1982—U.S. Department of En-ergy (DOE), Office of Nuclear Programs, "U.S. CentralStation Nuclear Electric Generating Units: SignificantMilestones." 1983-1992—Nuclear Regulatory Commis-sion (NRC), "Licensed Operating Reactors" (NUREG-0020).
• Nuclear Electricity Net Generation: 1973-1992—Table 7.1.
• Nuclear Portion of Domestic Electricity Net Gener-ation: Calculated from data in Table 7.1.
• Net Summer Capability of Operable Units: 1973-1982—Compiled from various sources, primarily DOE,Office of Nuclear Reactor Programs, "U.S. Central Sta-tion Nuclear Electric Generating Units: SignificantMilestones." 1983-1992—Energy Information Admin-istration (EIA), Form EIA-860, "Annual Electric Gener-ation Report."
• Capacity Factor: EIA, Office of Coal, Nuclear, Electricand Alternate Fuels (CNEAF).
Table 8.2
• Licensed for Operation: 1973-1982—DOE, Office ofNuclear Programs, "U.S. Central Station Nuclear ElectricGenerating Units: Significant Milestones." 1983-1992—NRC,"Licensed Operating Reactors" (NUREG-0020).
• Construction Permits, On Order, and Announced:1973-1982—Compiled from various sources, primarilyDOE, Office of Nuclear Reactor Programs, "U.S. CentralStation Nuclear Electric Generating Units: Significant
Energy Information Administration/Historical Monthly Energy Review 1973-1992 243

Milestones"; EIA, CNEAF, "Nuclear Steam-ElectricUnits That Have Been in Operation as of 1957-1989";EIA, CNEAF, "Nuclear Plant Cancellations: Causes,Costs and Consequences"; and Utility Data Institute,Inc., "U.S. Nuclear Plant Statistics, 1987." 1983-1992—NRC, "Summary Information Report" (NUREG-0871);NRC, "Licensed Operating Reactors" (NUREG-0020);and various trade journals.
• Total Design Capacity: 1973-1982—Compiled fromvarious sources, primarily DOE, Office of Nuclear Re-actor Programs, "U.S. Central Station Nuclear Electric
Generating Units: Significant Milestones"; EIA,CNEAF, "Nuclear Steam-Electric Units That HaveBeen in Operation as of 1957-1987"; EIA, CNEAF,"Monthly Report for Electric Utilities—Power Gener-ation"; EIA, CNEAF, "Nuclear Plant Cancellations:Causes, Costs and Consequences"; and Utility DataInstitute, Inc., "U.S. Nuclear Plant Statistics, 1987."1983-1992—NRC, "Licensed Operating Reactors"(NUREG-0020); NRC, "Summary Information Report"(NUREG-0871); and EIA, Form EIA-860, "Annual ElectricGenerator Report."
Energy Information Administration/Historical Monthly Energy Review 1973-1992244

Section 9Energy Prices
Gasohol contains up to 10 percent ethanol, which can be produced from farm productssuch as corn or sugar.

Table 9.1 Crude Oil Price Summary, 1973-1992
(Dollars per Barrel)
Domestic FirstPurchase Priceb
F.O.B. Costof Importsc
Landed Costof Importsd
Refiner Acquisition Costa
Domestic Imported Composite
1973January ..................... NA NA NA NA NA NAFebruary ................... NA NA NA NA NA NAMarch ........................ NA NA NA NA NA NAApril .......................... NA NA NA NA NA NAMay ........................... NA NA NA NA NA NAJune .......................... NA NA NA NA NA NAJuly ........................... NA NA NA NA NA NAAugust ...................... NA NA NA NA NA NASeptember ................ NA NA NA NA NA NAOctober ..................... NA 4.24 5.60 NA NA NANovember ................. NA 5.28 6.36 NA NA NADecember ................. NA 6.34 7.57 NA NA NAAverage ................... 3.89 e 5.21 e 6.41 E 4.17 E 4.08 E 4.15
1974January ..................... 6.95 9.27 10.45 6.72 9.59 7.46February ................... 6.87 10.74 12.60 7.08 12.45 8.57March ........................ 6.77 10.83 12.57 7.05 12.73 8.68April .......................... 6.77 11.16 12.66 7.21 12.72 9.13May ........................... 6.87 11.25 12.70 7.26 13.02 9.44June .......................... 6.85 11.45 12.92 7.20 13.06 9.45July ........................... 6.80 10.96 12.37 7.19 12.75 9.30August ...................... 6.71 11.00 12.40 7.20 12.68 9.17September ................ 6.70 10.83 12.09 7.18 12.53 9.13October ..................... 6.97 10.85 12.08 7.26 12.44 9.22November ................. 6.97 10.96 12.17 7.46 12.53 9.41December ................. 7.09 10.87 12.30 7.39 12.82 9.28Average ................... 6.87 10.91 12.32 7.18 12.52 9.07
1975January ..................... 7.61 10.96 12.25 7.78 12.77 9.48February ................... 7.47 10.98 12.37 8.29 13.05 10.09March ........................ 7.57 11.10 12.46 8.38 13.28 9.91April .......................... 7.55 11.09 12.40 8.23 13.26 9.83May ........................... 7.52 11.05 12.47 8.33 13.27 9.79June .......................... 7.49 10.89 12.48 8.33 14.15 10.33July ........................... 7.75 10.84 12.49 8.37 14.03 10.57August ...................... 7.73 10.93 12.51 8.48 14.25 10.81September ................ 7.75 10.95 12.59 8.49 14.04 10.79October ..................... 7.83 11.40 13.20 8.68 14.66 10.85November ................. 7.80 11.79 13.49 8.67 15.04 11.05December ................. 7.93 11.93 13.37 8.66 14.81 10.98Average ................... 7.67 11.18 12.70 8.39 13.93 10.38
1976January ..................... 8.63 11.97 13.26 9.14 13.27 10.76February ................... 7.91 12.06 13.25 8.67 13.26 10.54March ........................ 7.78 12.04 13.27 8.48 13.51 10.44April .......................... 7.86 12.07 13.29 8.66 13.39 10.63May ........................... 7.89 12.03 13.22 8.62 13.41 10.66June .......................... 8.00 12.20 13.37 8.60 13.48 10.88July ........................... 8.04 12.15 13.29 8.72 13.51 10.97August ...................... 8.03 12.15 13.39 8.65 13.58 10.78September ................ 8.39 12.20 13.32 8.95 13.47 11.08October ..................... 8.46 12.22 13.32 9.13 13.49 11.20November ................. 8.61 12.26 13.38 9.23 13.58 11.26December ................. 8.62 12.37 13.46 9.25 13.71 11.32Average ................... 8.19 12.15 13.32 8.84 13.48 10.89
1977January ..................... 8.50 12.91 14.04 9.23 14.11 11.64February ................... 8.56 13.07 14.27 9.24 14.50 11.80March ........................ 8.45 13.17 14.34 9.32 14.54 11.88April .......................... 8.41 13.14 14.35 9.21 14.36 11.75May ........................... 8.49 13.28 14.43 9.21 14.62 11.87June .......................... 8.44 13.19 14.32 9.34 14.63 11.98July ........................... 8.47 13.28 14.39 9.32 14.44 11.90August ...................... 8.45 13.39 14.37 9.54 14.68 12.01September ................ 8.43 13.37 14.46 9.75 14.50 12.01October ..................... 8.72 13.37 14.43 9.95 14.56 12.12November ................. 8.69 13.41 14.43 10.17 14.61 12.18December ................. 8.81 13.41 14.48 10.15 14.76 12.27Average ................... 8.57 13.24 14.36 9.55 14.53 11.96
See footnotes at end of table.
Energy Information Administration/Historical Monthly Energy Review 1973-1992 247

Table 9.1 Crude Oil Price Summary, 1973-1992 (Continued)
(Dollars per Barrel)
Domestic FirstPurchase Priceb
F.O.B. Costof Importsc
Landed Costof Importsd
Refiner Acquisition Costa
Domestic Imported Composite
1978January ..................... 8.71 13.34 14.37 10.14 14.52 12.13February ................... 8.86 13.34 14.33 10.25 14.41 12.19March ........................ 8.80 13.34 14.32 10.46 14.57 12.23April .......................... 8.82 13.27 14.29 10.55 14.40 12.20May ........................... 8.81 13.24 14.23 10.60 14.51 12.35June .......................... 9.05 13.26 14.28 10.72 14.54 12.48July ........................... 8.96 13.23 14.23 10.58 14.49 12.45August ...................... 9.05 13.24 14.24 10.65 14.46 12.46September ................ 9.15 13.28 14.29 10.65 14.53 12.57October ..................... 9.17 13.26 14.37 10.78 14.63 12.62November ................. 9.20 13.30 14.49 10.87 14.74 12.76December ................. 9.47 13.42 14.62 11.00 14.94 12.93Average ................... 9.00 13.29 14.35 10.61 14.57 12.46
1979January ..................... 9.46 14.20 15.35 11.02 15.50 13.11February ................... 9.69 14.40 15.61 11.34 15.88 13.42March ........................ 9.83 14.94 16.15 11.45 16.41 13.70April .......................... 10.33 16.70 17.79 12.06 17.58 14.52May ........................... 10.71 17.69 18.83 12.41 19.00 15.40June .......................... 11.70 19.75 21.12 13.24 21.03 17.00July ........................... 13.39 21.66 22.89 14.61 23.09 18.58August ...................... 14.00 22.30 23.60 15.73 23.98 19.75September ................ 14.57 23.34 24.69 16.05 25.06 20.14October ..................... 15.06 23.41 24.78 16.93 25.05 20.68November ................. 15.52 26.25 27.69 17.65 27.02 22.04December ................. 17.00 27.13 28.71 18.84 28.91 23.63Average ................... 12.64 20.07 21.45 14.27 21.67 17.72
1980January ..................... 17.86 29.27 30.85 19.78 30.75 24.81February ................... 18.86 31.08 32.51 21.22 32.40 26.11March ........................ 19.33 31.26 32.48 22.07 33.42 26.88April .......................... 20.28 31.79 33.05 22.89 33.54 27.09May ........................... 21.05 32.41 33.60 23.63 34.33 27.85June .......................... 21.52 32.89 34.12 24.48 34.48 28.80July ........................... 22.31 33.24 34.48 25.05 34.51 28.73August ...................... 22.62 33.43 34.69 24.98 34.44 28.70September ................ 22.59 33.34 34.62 25.37 34.46 28.96October ..................... 23.23 33.14 34.33 26.21 34.63 29.56November ................. 23.99 34.15 35.27 26.51 35.09 29.79December ................. 25.83 34.11 35.53 28.55 35.63 31.39Average ................... 21.59 32.37 33.67 24.23 33.89 28.07
1981January ..................... 28.81 36.65 37.97 32.71 38.85 34.86February ................... 34.30 36.93 38.34 36.27 39.00 37.28March ........................ 34.59 36.74 38.05 36.97 38.31 37.48April .......................... 33.92 35.96 37.26 35.58 38.41 36.58May ........................... 32.73 35.72 36.95 35.21 37.84 36.11June .......................... 31.68 34.85 36.21 34.20 37.03 35.03July ........................... 31.10 33.89 35.30 33.76 36.58 34.70August ...................... 31.10 33.67 35.06 33.79 35.82 34.46September ................ 31.10 33.78 35.09 33.47 35.44 34.11October ..................... 30.98 33.85 35.10 33.48 35.43 34.07November ................. 30.97 34.46 35.71 33.49 36.21 34.33December ................. 30.80 34.56 35.82 33.51 35.95 34.33Average ................... 31.77 35.15 36.47 34.33 37.05 35.24
1982January ..................... 30.86 34.13 35.23 33.39 35.54 33.95February ................... 29.75 33.60 34.63 32.71 35.48 33.40March ........................ 28.30 32.08 33.31 31.08 34.07 31.81April .......................... 27.65 31.46 32.77 30.27 32.82 30.83May ........................... 27.67 31.54 32.70 30.37 32.78 31.02June .......................... 28.11 32.22 33.47 30.79 33.79 31.74July ........................... 28.35 32.09 33.31 30.92 33.44 31.74August ...................... 28.18 31.40 32.34 30.85 32.95 31.45September ................ 27.96 31.51 32.49 30.76 33.03 31.40October ..................... 28.75 31.88 33.01 31.38 33.28 31.98November ................. 28.69 31.73 32.86 31.57 33.09 32.07December ................. 28.04 31.09 32.32 30.80 32.85 31.29Average ................... 28.52 32.02 33.18 31.22 33.55 31.87
See footnotes at end of table.
Energy Information Administration/Historical Monthly Energy Review 1973-1992248

Table 9.1 Crude Oil Price Summary, 1973-1992 (Continued)
(Dollars per Barrel)
Domestic FirstPurchase Priceb
F.O.B. Costof Importsc
Landed Costof Importsd
Refiner Acquisition Costa
Domestic Imported Composite
1983January ..................... 27.22 29.56 30.62 30.55 31.40 30.73February ................... 26.41 27.98 29.08 29.16 30.76 29.49March ........................ 26.08 26.92 27.84 28.69 28.43 28.64April .......................... 25.85 27.28 28.24 28.45 27.95 28.33May ........................... 26.08 27.47 28.55 28.68 28.53 28.64June .......................... 25.98 27.80 29.00 28.67 29.23 28.85July ........................... 25.86 27.90 28.99 28.74 28.76 28.75August ...................... 26.03 27.96 29.22 28.58 29.50 28.88September ................ 26.08 28.05 29.24 28.69 29.54 28.97October ..................... 26.04 27.87 29.08 28.88 29.67 29.14November ................. 26.09 27.80 28.93 28.76 29.09 28.85December ................. 25.88 27.56 28.58 28.62 29.30 28.83Average ................... 26.19 27.81 28.93 28.87 29.30 28.99
1984January ..................... 25.93 27.70 28.59 28.62 28.80 28.67February ................... 26.06 27.92 28.95 28.76 28.91 28.81March ........................ 26.05 27.83 28.86 28.75 28.95 28.81April .......................... 25.93 27.92 28.97 28.63 29.11 28.77May ........................... 26.00 27.98 29.04 28.65 29.26 28.83June .......................... 26.09 27.90 29.00 28.58 29.19 28.77July ........................... 26.11 27.38 28.41 28.70 29.00 28.79August ...................... 26.02 27.48 28.41 28.59 28.92 28.69September ................ 25.97 27.36 28.26 28.56 28.70 28.60October ..................... 25.92 27.23 28.21 28.46 28.79 28.56November ................. 25.44 27.10 27.96 28.10 28.74 28.30December ................. 25.05 26.73 27.55 27.95 28.02 27.97Average ................... 25.88 27.60 28.54 28.53 28.88 28.63
1985January ..................... 24.26 26.34 27.02 26.89 27.49 27.02February ................... 23.64 26.23 26.86 26.35 26.99 26.49March ........................ 23.89 26.50 27.13 26.60 27.20 26.76April .......................... 24.19 26.75 27.51 26.79 27.59 27.03May ........................... 24.18 26.38 27.21 26.91 27.60 27.12June .......................... 24.07 25.71 26.49 26.60 27.25 26.76July ........................... 24.04 25.43 26.37 26.60 26.57 26.59August ...................... 23.99 25.51 26.26 26.46 26.61 26.50September ................ 23.96 25.56 26.48 26.41 26.56 26.45October ..................... 24.10 25.74 26.71 26.60 26.79 26.66November ................. 24.27 25.81 26.73 26.73 27.12 26.86December ................. 24.51 24.23 25.27 26.93 26.21 26.72Average ................... 24.09 25.84 26.67 26.66 26.99 26.75
1986January ..................... 23.12 21.46 22.88 25.91 24.93 25.63February ................... 17.65 15.11 16.23 20.31 18.11 19.76March ........................ 12.62 12.62 13.55 15.02 14.22 14.80April .......................... 10.68 11.60 12.45 13.01 13.15 13.05May ........................... 10.75 11.05 12.22 12.99 13.17 13.05June .......................... 10.68 10.85 11.90 13.12 12.25 12.83July ........................... 9.25 9.74 10.87 11.44 10.91 11.26August ...................... 9.77 10.59 11.51 11.97 11.87 11.93September ................ 11.09 11.78 12.70 13.29 12.85 13.13October ..................... 11.00 11.98 13.10 13.20 12.78 13.05November ................. 11.05 12.63 13.55 13.22 13.46 13.30December ................. 11.73 13.84 14.50 13.66 14.17 13.84Average ................... 12.51 12.52 13.49 14.82 14.00 14.55
1987January ..................... 13.79 15.30 16.16 16.01 16.45 16.16February ................... 14.51 15.95 16.86 16.77 16.98 16.83March ........................ 14.54 16.31 17.05 16.93 17.26 17.04April .......................... 14.95 16.79 17.53 17.21 17.89 17.44May ........................... 15.29 17.20 17.91 17.63 18.25 17.85June .......................... 15.95 17.53 18.34 18.33 18.71 18.47July ........................... 16.88 17.90 18.87 19.04 19.26 19.13August ...................... 17.06 17.72 18.88 19.39 19.32 19.36September ................ 16.25 17.09 18.04 18.57 18.57 18.57October ..................... 15.95 16.56 17.67 18.36 18.53 18.43November ................. 15.46 16.41 17.52 17.94 18.14 18.02December ................. 14.27 14.73 16.03 17.02 17.20 17.09Average ................... 15.40 16.69 17.65 17.76 18.13 17.90
See footnotes at end of table.
Energy Information Administration/Historical Monthly Energy Review 1973-1992 249
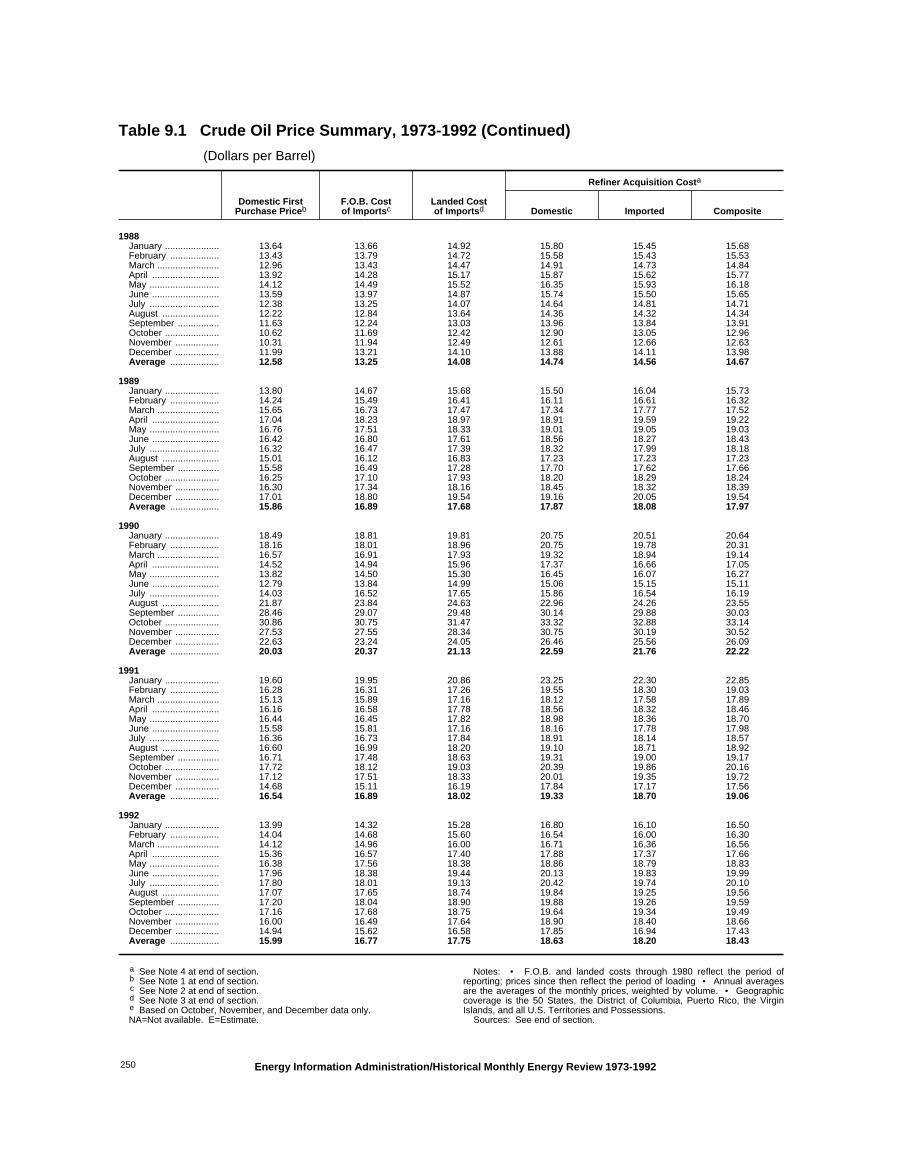
Table 9.1 Crude Oil Price Summary, 1973-1992 (Continued)
(Dollars per Barrel)
Domestic FirstPurchase Priceb
F.O.B. Costof Importsc
Landed Costof Importsd
Refiner Acquisition Costa
Domestic Imported Composite
1988January ..................... 13.64 13.66 14.92 15.80 15.45 15.68February ................... 13.43 13.79 14.72 15.58 15.43 15.53March ........................ 12.96 13.43 14.47 14.91 14.73 14.84April .......................... 13.92 14.28 15.17 15.87 15.62 15.77May ........................... 14.12 14.49 15.52 16.35 15.93 16.18June .......................... 13.59 13.97 14.87 15.74 15.50 15.65July ........................... 12.38 13.25 14.07 14.64 14.81 14.71August ...................... 12.22 12.84 13.64 14.36 14.32 14.34September ................ 11.63 12.24 13.03 13.96 13.84 13.91October ..................... 10.62 11.69 12.42 12.90 13.05 12.96November ................. 10.31 11.94 12.49 12.61 12.66 12.63December ................. 11.99 13.21 14.10 13.88 14.11 13.98Average ................... 12.58 13.25 14.08 14.74 14.56 14.67
1989January ..................... 13.80 14.67 15.68 15.50 16.04 15.73February ................... 14.24 15.49 16.41 16.11 16.61 16.32March ........................ 15.65 16.73 17.47 17.34 17.77 17.52April .......................... 17.04 18.23 18.97 18.91 19.59 19.22May ........................... 16.76 17.51 18.33 19.01 19.05 19.03June .......................... 16.42 16.80 17.61 18.56 18.27 18.43July ........................... 16.32 16.47 17.39 18.32 17.99 18.18August ...................... 15.01 16.12 16.83 17.23 17.23 17.23September ................ 15.58 16.49 17.28 17.70 17.62 17.66October ..................... 16.25 17.10 17.93 18.20 18.29 18.24November ................. 16.30 17.34 18.16 18.45 18.32 18.39December ................. 17.01 18.80 19.54 19.16 20.05 19.54Average ................... 15.86 16.89 17.68 17.87 18.08 17.97
1990January ..................... 18.49 18.81 19.81 20.75 20.51 20.64February ................... 18.16 18.01 18.96 20.75 19.78 20.31March ........................ 16.57 16.91 17.93 19.32 18.94 19.14April .......................... 14.52 14.94 15.96 17.37 16.66 17.05May ........................... 13.82 14.50 15.30 16.45 16.07 16.27June .......................... 12.79 13.84 14.99 15.06 15.15 15.11July ........................... 14.03 16.52 17.65 15.86 16.54 16.19August ...................... 21.87 23.84 24.63 22.96 24.26 23.55September ................ 28.46 29.07 29.48 30.14 29.88 30.03October ..................... 30.86 30.75 31.47 33.32 32.88 33.14November ................. 27.53 27.55 28.34 30.75 30.19 30.52December ................. 22.63 23.24 24.05 26.46 25.56 26.09Average ................... 20.03 20.37 21.13 22.59 21.76 22.22
1991January ..................... 19.60 19.95 20.86 23.25 22.30 22.85February ................... 16.28 16.31 17.26 19.55 18.30 19.03March ........................ 15.13 15.89 17.16 18.12 17.58 17.89April .......................... 16.16 16.58 17.78 18.56 18.32 18.46May ........................... 16.44 16.45 17.82 18.98 18.36 18.70June .......................... 15.58 15.81 17.16 18.16 17.78 17.98July ........................... 16.36 16.73 17.84 18.91 18.14 18.57August ...................... 16.60 16.99 18.20 19.10 18.71 18.92September ................ 16.71 17.48 18.63 19.31 19.00 19.17October ..................... 17.72 18.12 19.03 20.39 19.86 20.16November ................. 17.12 17.51 18.33 20.01 19.35 19.72December ................. 14.68 15.11 16.19 17.84 17.17 17.56Average ................... 16.54 16.89 18.02 19.33 18.70 19.06
1992January ..................... 13.99 14.32 15.28 16.80 16.10 16.50February ................... 14.04 14.68 15.60 16.54 16.00 16.30March ........................ 14.12 14.96 16.00 16.71 16.36 16.56April .......................... 15.36 16.57 17.40 17.88 17.37 17.66May ........................... 16.38 17.56 18.38 18.86 18.79 18.83June .......................... 17.96 18.38 19.44 20.13 19.83 19.99July ........................... 17.80 18.01 19.13 20.42 19.74 20.10August ...................... 17.07 17.65 18.74 19.84 19.25 19.56September ................ 17.20 18.04 18.90 19.88 19.26 19.59October ..................... 17.16 17.68 18.75 19.64 19.34 19.49November ................. 16.00 16.49 17.64 18.90 18.40 18.66December ................. 14.94 15.62 16.58 17.85 16.94 17.43Average ................... 15.99 16.77 17.75 18.63 18.20 18.43
a See Note 4 at end of section.b See Note 1 at end of section.c See Note 2 at end of section.d See Note 3 at end of section.e Based on October, November, and December data only.NA=Not available. E=Estimate.
Notes: • F.O.B. and landed costs through 1980 reflect the period ofreporting; prices since then reflect the period of loading • Annual averagesare the averages of the monthly prices, weighted by volume. • Geographiccoverage is the 50 States, the District of Columbia, Puerto Rico, the VirginIslands, and all U.S. Territories and Possessions.
Sources: See end of section.
Energy Information Administration/Historical Monthly Energy Review 1973-1992250

Table 9.2 F.O.B. Costs of Crude Oil Imports from Selected Countries, 1973-1992
(Dollars per Barrel)
Algeria Indonesia Iran Mexico NigeriaSaudiArabia
UnitedKingdom Venezuela
OtherCountries
ArabOPECa
TotalOPECb
1973January ............. NA NA NA NA NA NA NA NA NA NA NAFebruary ........... NA NA NA NA NA NA NA NA NA NA NAMarch ................ NA NA NA NA NA NA NA NA NA NA NAApril .................. NA NA NA NA NA NA NA NA NA NA NAMay ................... NA NA NA NA NA NA NA NA NA NA NAJune .................. NA NA NA NA NA NA NA NA NA NA NAJuly ................... NA NA NA NA NA NA NA NA NA NA NAAugust .............. NA NA NA NA NA NA NA NA NA NA NASeptember ........ NA NA NA NA NA NA NA NA NA NA NAOctober ............. 5.53 4.77 3.58 NA 6.00 3.06 NA 4.18 4.19 3.59 4.22November ......... 9.03 5.47 4.31 NA 7.84 3.67 NA 5.85 4.73 4.77 5.73December ......... W 6.23 4.61 NA 9.59 W NA 6.11 5.87 6.22 6.80Averagec .......... 7.23 5.67 4.24 NA 7.81 3.25 NA 5.39 4.84 4.06 5.43
1974January ............. W 10.64 8.62 NA 12.66 NA NA 10.89 7.02 W 10.76February ........... W 11.17 11.52 NA 13.12 NA NA 10.87 8.30 W 11.83March ................ W 11.81 11.22 NA 13.57 W NA 11.12 8.80 10.64 11.80April .................. 14.17 12.11 10.88 NA 13.27 9.86 NA 10.86 10.02 11.23 11.72May ................... 13.92 12.12 11.61 NA 13.08 10.08 NA 11.07 10.07 11.10 11.73June .................. 13.75 11.91 11.15 NA 13.12 9.98 NA 10.37 11.07 11.26 11.62July ................... 13.10 12.80 10.91 NA 12.05 9.97 NA 10.42 10.43 10.91 11.19August .............. 13.01 12.63 10.92 NA 12.13 9.90 NA 10.73 10.43 10.86 11.28September ........ 13.16 11.66 10.16 NA 11.62 10.01 NA 10.46 10.70 10.76 10.92October ............. 12.45 12.62 10.55 W 11.78 10.23 NA 10.46 10.54 10.65 11.01November ......... 12.44 12.43 10.74 W 11.72 10.66 NA 10.61 10.67 10.99 11.11December ......... 12.28 12.05 10.75 W 11.74 10.51 NA 10.90 10.32 10.91 11.11Average ........... 13.23 11.99 10.85 W 12.44 10.17 NA 10.71 10.02 10.96 11.33
1975January ............. 12.02 12.16 10.68 11.02 11.57 10.57 NA 10.77 10.66 11.07 11.16February ........... 11.90 12.40 10.69 11.25 11.68 10.73 NA 11.07 10.53 11.08 11.23March ................ 12.03 12.32 10.77 11.15 11.57 10.69 NA 11.13 10.80 11.19 11.22April .................. 11.78 W 10.75 11.14 11.53 10.77 NA 11.05 10.84 10.97 11.19May ................... 11.42 12.59 10.65 11.21 11.52 10.90 NA 10.92 10.62 11.00 11.21June .................. 11.40 12.48 10.61 11.20 11.55 10.48 NA 10.81 10.28 10.87 11.16July ................... 11.49 12.28 10.60 11.17 11.48 10.53 NA 10.81 10.64 10.82 10.97August .............. 11.59 12.51 10.66 11.20 11.49 10.55 NA 10.79 10.67 10.96 11.09September ........ 11.46 12.47 10.62 11.23 11.51 10.53 NA 10.78 10.68 10.88 11.11October ............. 12.51 12.75 10.76 11.79 12.33 11.00 NA 11.49 11.06 11.27 11.53November ......... 12.60 12.79 11.32 12.12 12.58 11.37 NA 11.58 11.57 11.75 11.91December ......... 12.74 12.76 11.52 12.19 12.66 11.49 NA 11.69 11.67 11.83 12.04Average ........... 11.93 12.55 10.81 11.44 11.82 10.87 NA 11.04 10.86 11.18 11.34
1976January ............. 12.88 12.72 11.61 12.17 12.83 11.61 NA 11.13 11.68 12.00 12.08February ........... 12.95 12.76 11.48 12.21 12.75 11.64 NA 11.74 11.70 11.96 12.16March ................ 13.02 12.77 11.46 12.16 13.00 11.64 NA 11.31 11.71 12.04 12.16April .................. 13.00 12.76 11.57 12.20 12.99 11.62 NA 11.21 11.82 12.04 12.15May ................... 13.01 12.76 11.61 12.17 13.00 11.61 NA 11.13 11.74 11.95 12.12June .................. 13.03 12.77 11.53 12.13 12.99 11.65 NA 11.22 11.93 12.09 12.27July ................... 13.06 12.79 11.70 12.17 13.09 11.59 d(� ) 11.23 11.96 12.05 12.22August .............. 13.06 12.75 11.69 12.16 13.13 11.56 NA 11.29 11.97 12.01 12.22September ........ 13.14 12.74 11.71 12.16 13.07 11.59 W 11.60 12.05 12.07 12.26October ............. 13.09 12.80 11.61 12.31 13.26 11.65 W 11.45 12.02 12.07 12.27November ......... 13.11 12.71 11.59 12.32 13.25 11.63 W 11.60 11.98 12.08 12.32December ......... 13.22 12.77 11.72 12.37 13.34 11.64 W 11.77 12.20 12.23 12.42Average ........... 13.05 12.76 11.61 12.22 13.08 11.62 W 11.39 11.92 12.06 12.23
1977January ............. 14.03 13.41 12.05 13.42 14.10 11.93 W 12.87 12.72 12.75 12.98February ........... 14.30 13.42 12.43 13.43 14.24 12.06 W 13.16 13.05 12.82 13.09March ................ 14.27 13.56 12.81 13.41 14.33 12.21 14.16 12.84 13.07 12.93 13.22April .................. 14.33 13.55 12.78 13.38 14.52 12.22 W 12.62 13.05 12.95 13.19May ................... 14.30 13.57 12.77 13.42 14.59 12.22 14.45 12.60 13.28 13.03 13.30June .................. 14.34 13.62 12.68 13.42 14.57 12.21 W 12.51 13.18 13.01 13.21July ................... 14.43 13.58 12.79 13.44 14.55 12.40 14.19 12.48 13.25 13.19 13.31August .............. 14.48 13.65 12.85 13.45 14.56 12.64 14.13 12.44 13.35 13.32 13.43September ........ 14.42 13.61 12.74 13.44 14.52 12.72 14.21 12.59 13.30 13.36 13.43October ............. 14.42 13.64 12.83 13.42 14.48 12.70 13.90 12.67 13.29 13.34 13.43November ......... 14.38 13.61 12.75 13.43 14.50 12.74 13.90 12.61 13.30 13.45 13.49December ......... 14.45 13.59 12.73 13.41 14.43 12.79 13.85 12.53 13.42 13.44 13.42Average ........... 14.35 13.57 12.68 13.42 14.44 12.38 14.11 12.63 13.19 13.13 13.29
See footnotes at end of table.
Energy Information Administration/Historical Monthly Energy Review 1973-1992 251

Table 9.2 F.O.B. Costs of Crude Oil Imports from Selected Countries, 1973-1992 (Continued)
(Dollars per Barrel)
Algeria Indonesia Iran Mexico NigeriaSaudiArabia
UnitedKingdom Venezuela
OtherCountries
ArabOPECa
TotalOPECb
1978January ............. 14.28 13.66 12.62 13.43 14.20 12.70 13.71 12.58 13.35 13.38 13.36February ........... 14.19 13.60 12.67 13.42 14.18 12.80 W 12.61 13.30 13.32 13.36March ................ 14.20 13.60 12.69 13.44 14.13 12.80 W 12.86 13.28 13.38 13.39April .................. 14.09 13.61 12.68 13.42 13.91 12.74 13.75 12.54 13.25 13.28 13.29May ................... 14.01 13.52 12.65 13.42 13.95 12.70 13.64 12.09 13.26 13.30 13.25June .................. 14.06 13.62 12.58 13.31 13.89 12.67 13.65 12.32 13.29 13.25 13.27July ................... 14.06 13.62 12.70 13.13 13.92 12.65 13.72 12.04 13.30 13.27 13.24August .............. 14.05 13.62 12.64 13.16 13.88 12.66 13.80 12.26 13.35 13.22 13.23September ........ 14.07 13.57 12.63 13.14 13.96 12.68 13.74 12.46 13.38 13.22 13.27October ............. 14.12 13.58 12.64 13.14 14.08 12.60 14.14 12.32 13.37 13.17 13.25November ......... 14.16 13.75 12.62 13.18 14.12 12.65 13.85 12.40 13.45 13.23 13.31December ......... 14.17 13.61 12.67 13.12 14.26 12.77 14.08 12.43 13.49 13.38 13.46Average ........... 14.12 13.61 12.65 13.24 14.05 12.70 13.82 12.38 13.35 13.28 13.31
1979January ............. 14.92 14.20 W 13.90 14.97 13.38 15.46 13.43 14.48 13.95 14.08February ........... 14.85 14.13 W 14.15 15.09 13.51 15.37 13.36 14.88 14.15 14.28March ................ 15.33 14.25 W 14.37 15.17 13.87 15.33 13.16 15.73 14.94 14.89April .................. 16.90 15.97 18.01 16.78 18.31 15.15 17.87 14.76 17.04 16.16 16.60May ................... 19.11 16.77 17.24 17.95 19.79 15.01 18.16 15.54 18.54 17.22 17.55June .................. 21.18 18.61 19.84 17.44 22.06 18.56 21.47 16.03 20.06 19.43 19.66July ................... 22.51 20.95 22.77 22.13 24.45 18.95 24.87 17.39 22.79 20.74 21.45August .............. 23.44 21.72 21.58 22.34 25.36 18.71 25.77 18.51 24.30 21.51 21.94September ........ 23.61 22.08 27.31 22.61 25.70 18.56 25.70 18.09 24.87 22.28 23.05October ............. 24.39 22.72 26.80 24.78 25.40 19.77 25.60 18.97 24.82 22.05 23.06November ......... 26.25 23.54 29.01 24.25 27.52 23.63 25.86 18.83 28.20 26.18 26.13December ......... 28.89 25.03 35.12 24.08 29.78 23.12 25.90 20.79 28.73 27.14 27.53Average ........... 20.53 19.03 22.93 20.27 21.69 17.28 21.70 16.90 21.10 19.27 19.88
1980January ............. 33.05 27.90 NA 28.91 31.67 24.77 30.39 25.46 31.51 28.66 29.07February ........... 35.29 30.76 W 31.87 34.20 25.57 31.94 25.33 33.25 30.14 30.78March ................ 36.92 31.32 W 30.45 35.25 26.14 33.74 23.02 33.60 30.10 30.97April .................. 36.79 32.07 d(� ) 30.27 36.03 27.65 34.70 23.74 33.50 30.51 31.66May ................... 37.07 32.44 d(� ) 30.58 36.90 27.75 34.21 23.43 34.22 31.24 32.33June .................. 37.66 32.88 d(� ) 30.76 36.89 28.60 36.29 25.31 34.79 32.29 32.77July ................... 38.30 33.32 d(� ) 31.72 37.69 28.39 36.27 24.62 35.54 32.00 32.94August .............. 37.29 33.08 d(� ) 31.86 36.81 29.54 34.82 24.49 36.04 32.97 33.29September ........ 37.21 32.97 d(� ) 31.50 36.47 29.86 35.31 25.02 35.14 32.72 33.20October ............. 37.40 32.48 d(� ) 31.34 36.69 30.05 35.76 21.92 35.52 32.78 33.07November ......... 37.18 32.79 d(� ) 31.62 37.13 31.46 35.51 26.67 35.75 34.31 34.27December ......... 37.47 33.53 d(� ) 31.99 36.92 31.99 W 27.17 35.62 34.11 34.23Average ........... 36.67 32.17 NA 31.06 35.93 28.17 34.36 24.81 34.34 31.57 32.21
1981January ............. 39.46 36.37 d(� ) 35.21 39.88 32.80 38.46 32.85 38.71 35.33 36.41February ........... 40.38 36.09 d(� ) 36.93 39.95 32.85 39.22 30.37 38.80 36.15 36.51March ................ 40.15 36.33 d(� ) 35.68 39.71 32.74 39.21 31.10 38.74 35.96 36.61April .................. 39.59 36.20 d(� ) 33.86 39.60 32.40 38.96 29.25 38.55 35.50 35.94May ................... 39.78 36.01 d(� ) 34.41 39.27 32.22 36.42 27.75 37.86 35.09 35.55June .................. 38.90 35.90 d(� ) 30.28 38.71 32.31 34.72 28.81 37.53 35.03 35.36July ................... 37.69 34.58 d(� ) 32.38 39.09 32.13 34.79 28.52 35.39 33.17 33.48August .............. 39.09 34.89 d(� ) 30.93 37.99 31.97 34.67 26.67 35.65 33.55 33.59September ........ 38.91 35.15 d(� ) 30.36 35.97 32.13 35.00 28.47 34.58 33.70 33.88October ............. 37.38 34.52 d(� ) 31.01 35.49 33.46 34.90 27.69 34.50 34.38 34.02November ......... 36.63 35.30 d(� ) 31.48 36.44 33.76 36.03 28.52 34.61 34.81 34.89December ......... 37.38 36.08 d(� ) 31.25 36.42 33.88 36.44 28.02 34.35 34.60 34.92Average ........... 39.08 35.62 d(� ) 33.01 38.31 32.60 36.06 28.95 36.69 34.79 35.17
1982January ............. 36.97 35.17 d(� ) 29.66 36.01 33.96 36.20 28.23 33.92 34.23 34.58February ........... 35.57 35.47 d(� ) 30.93 36.06 33.69 34.01 28.94 33.54 34.04 34.55March ................ W 35.55 d(� ) 27.87 35.41 34.13 31.11 21.04 31.62 34.29 33.96April .................. 30.54 35.33 d(� ) 26.96 33.81 33.85 W 21.65 30.62 33.70 33.15May ................... 32.93 34.60 W 28.21 35.11 33.33 32.18 22.60 31.74 33.23 33.14June .................. W 35.91 W 27.94 34.94 33.60 33.73 21.70 31.95 33.70 33.70July ................... 33.58 34.66 W 28.47 35.10 33.66 33.74 23.14 31.77 33.77 33.57August .............. 33.01 35.58 30.82 27.51 34.96 33.00 33.51 20.56 31.57 33.07 32.90September ........ 33.84 35.22 W 28.07 34.66 33.38 33.65 23.30 31.95 33.60 32.79October ............. 34.52 35.28 W 27.66 35.14 34.18 33.63 23.20 31.78 34.27 33.40November ......... 34.61 34.99 29.80 27.57 35.03 33.86 33.95 23.75 31.74 33.86 33.07December ......... 34.57 34.42 29.09 27.63 33.18 33.98 33.01 26.21 31.18 34.07 32.45Average ........... 34.20 35.11 30.97 28.08 35.13 33.73 33.42 23.74 31.96 33.84 33.48
See footnotes at end of table.
Energy Information Administration/Historical Monthly Energy Review 1973-1992252

Table 9.2 F.O.B. Costs of Crude Oil Imports from Selected Countries, 1973-1992 (Continued)
(Dollars per Barrel)
Algeria Indonesia Iran Mexico NigeriaSaudiArabia
UnitedKingdom Venezuela
OtherCountries
ArabOPECa
TotalOPECb
1983January ............. W 34.71 W 26.85 W W 32.65 21.58 30.00 31.93 31.30February ........... W 33.74 d(� ) 25.65 31.07 W 31.54 21.82 28.10 32.22 29.13March ................ 30.83 29.14 W 24.50 29.57 30.03 29.16 20.04 27.06 30.54 27.81April .................. 29.40 29.57 W 24.18 29.63 27.62 29.97 20.05 27.55 28.74 28.16May ................... 29.80 29.34 W 24.60 29.72 W 29.75 19.88 27.41 28.21 28.44June .................. 29.80 29.58 28.19 24.18 29.58 27.89 29.17 20.80 27.75 28.82 28.78July ................... 30.15 29.65 29.01 24.87 29.88 27.88 30.00 19.89 27.81 28.98 28.63August .............. 30.32 29.59 28.16 25.18 30.04 27.28 30.01 21.56 28.41 28.11 28.39September ........ 30.33 29.83 28.03 25.09 29.59 27.53 30.32 21.83 28.45 27.95 28.26October ............. 29.98 29.58 28.18 25.81 30.23 27.70 29.73 23.58 27.95 28.00 28.40November ......... 29.75 29.50 W 25.75 30.03 27.32 29.42 23.16 28.00 27.97 28.32December ......... 29.26 29.63 28.30 26.20 29.61 26.73 29.05 24.17 27.65 26.95 27.71Average ........... 30.09 29.92 28.39 25.20 29.81 27.53 29.91 21.48 27.96 28.28 28.46
1984January ............. 28.27 29.63 W 26.22 29.71 27.71 29.36 24.31 27.74 27.82 28.26February ........... 29.06 29.13 W 26.04 30.35 26.65 29.75 23.98 28.19 27.79 28.15March ................ 29.51 29.33 d(� ) 26.30 29.81 27.70 30.07 23.86 27.84 28.39 28.36April .................. 29.09 29.47 W 26.07 30.18 27.64 29.86 23.93 28.04 28.31 28.24May ................... 29.06 29.50 W 26.36 29.96 27.63 29.93 24.07 28.19 28.23 28.22June .................. 28.88 29.41 d(� ) 26.58 29.84 27.93 29.67 24.23 28.03 28.12 28.12July ................... 27.43 29.32 W 26.60 W W 28.96 24.03 27.81 27.33 27.04August .............. 26.97 29.30 W 26.71 29.02 W 28.14 23.91 27.67 27.68 27.45September ........ 26.90 29.11 W 26.34 29.24 27.99 27.99 24.74 27.66 27.20 27.48October ............. 27.42 28.68 W 26.44 28.31 W 28.50 24.60 27.48 27.04 27.14November ......... 26.50 28.70 d(� ) 26.67 28.32 d(� ) 27.61 24.43 27.14 26.79 27.05December ......... 25.13 28.03 d(� ) 26.43 27.86 d(� ) 27.85 24.32 26.77 25.73 26.60Average ........... 28.34 29.13 27.42 26.39 29.51 27.67 28.87 24.23 27.79 27.79 27.79
1985January ............. 25.47 27.43 d(� ) 26.43 27.22 W 27.70 24.32 26.11 26.22 26.15February ........... W 27.62 d(� ) 26.13 27.41 W W 24.36 26.08 26.53 26.48March ................ 26.50 27.01 W 26.45 28.20 d(� ) W 24.91 26.36 26.44 26.47April .................. 27.34 27.46 W 26.42 27.95 d(� ) 27.99 24.57 26.57 27.07 26.81May ................... W 27.30 W 26.34 27.81 d(� ) 27.37 24.51 26.17 W 26.29June .................. W 27.06 W 24.99 27.09 d(� ) 26.65 24.32 26.00 W 25.72July ................... W 27.44 W 24.49 27.86 d(� ) 26.51 23.13 25.50 W 25.71August .............. d(� ) 26.74 W 24.81 27.83 d(� ) 26.98 22.59 25.92 d(� ) 25.36September ........ W 25.29 W 24.72 27.97 W 27.60 22.49 25.97 W 25.29October ............. W 26.95 W 24.76 28.30 W 28.22 22.84 26.08 W 25.60November ......... W 27.24 W 24.57 28.67 W 28.69 23.08 26.67 24.40 25.68December ......... 27.97 27.49 W 23.57 29.19 18.48 28.08 22.78 25.86 19.80 23.29Average ........... 26.89 27.12 W 25.33 28.04 22.04 27.64 23.64 26.12 24.34 25.67
1986January ............. 25.21 26.68 d(� ) 19.96 26.17 12.75 25.15 21.40 23.21 14.74 21.02February ........... W W W 14.26 19.83 11.64 17.82 12.56 16.82 11.63 13.99March ................ W 13.32 W 11.60 15.78 11.95 15.62 10.45 13.43 12.15 12.53April .................. W 10.77 W 10.39 14.54 12.12 12.14 10.48 11.87 12.04 11.82May ................... 12.17 11.28 W 10.72 13.58 7.91 13.25 10.82 11.91 8.80 10.46June .................. W 11.84 W 9.93 12.31 8.54 12.91 9.54 11.88 9.03 10.33July ................... W 10.00 W 8.61 10.99 10.15 10.38 7.71 10.55 10.20 9.85August .............. W 9.82 W 10.55 11.44 9.35 10.45 9.96 11.52 9.80 10.36September ........ W 12.22 d(� ) 11.58 13.43 10.45 13.47 10.16 12.35 10.64 11.31October ............. W 12.47 W 11.40 13.86 11.34 13.65 10.26 12.64 11.45 11.81November ......... W 12.05 d(� ) 11.78 13.88 13.65 14.05 10.73 12.84 13.37 12.64December ......... W W W 12.73 15.04 15.15 15.26 12.68 13.80 14.98 14.13Average ........... 13.62 13.19 W 11.84 14.35 11.36 13.84 10.92 13.32 11.59 12.21
1987January ............. 16.30 15.22 W 15.55 17.38 14.51 17.42 13.75 15.72 14.81 14.92February ........... 16.00 17.75 W 15.34 18.07 W W 13.93 16.52 16.12 15.84March ................ W 16.91 W 16.02 17.72 W 17.36 14.76 16.31 16.37 16.34April .................. W 17.24 W 16.40 18.44 W 17.79 15.29 16.83 16.46 16.78May ................... W 17.28 W 17.68 18.68 16.77 18.36 15.65 17.14 16.83 16.92June .................. W 17.67 W 17.78 18.75 W 18.61 16.24 17.58 16.76 17.24July ................... W 17.89 W 18.75 18.93 16.43 19.33 16.49 18.07 16.72 17.35August .............. 18.09 18.46 W 17.54 19.58 W 19.55 15.70 18.18 17.03 17.35September ........ W 17.74 W 16.27 18.58 W 18.35 15.50 17.47 16.89 17.05October ............. W 17.66 W 16.64 18.69 12.74 18.40 15.69 17.39 14.22 16.01November ......... W 17.56 d(� ) 15.51 18.49 12.99 17.90 14.47 17.03 15.64 16.27December ......... W 16.28 d(� ) 12.72 17.61 12.35 W 13.23 15.99 13.29 14.50Average ........... 16.79 17.40 W 16.36 18.47 15.12 18.28 15.08 17.11 15.80 16.43
See footnotes at end of table.
Energy Information Administration/Historical Monthly Energy Review 1973-1992 253

Table 9.2 F.O.B. Costs of Crude Oil Imports from Selected Countries, 1973-1992 (Continued)
(Dollars per Barrel)
Algeria Indonesia Iran Mexico NigeriaSaudiArabia
UnitedKingdom Venezuela
OtherCountries
ArabOPECa
TotalOPECb
1988January ............. W 16.62 d(� ) 12.79 17.04 11.41 16.23 12.37 14.96 12.17 13.26February ........... W 16.16 d(� ) 12.91 15.80 12.78 W 12.31 14.59 13.16 13.73March ................ W 13.65 d(� ) 11.81 15.72 12.90 14.68 12.67 13.82 13.18 13.80April .................. W 14.59 d(� ) 13.65 16.10 12.77 15.20 13.44 14.70 13.37 14.23May ................... W 15.63 d(� ) 13.68 16.06 W 16.10 13.54 14.91 13.61 14.44June .................. W 15.26 d(� ) 12.82 15.60 12.75 15.32 13.80 14.17 13.23 14.12July ................... W 14.06 d(� ) 12.17 15.14 11.27 14.43 13.18 13.57 12.23 13.40August .............. W 13.58 d(� ) 12.37 14.93 10.15 14.86 12.65 13.07 11.57 12.72September ........ W 12.84 d(� ) 11.69 13.71 9.44 W 12.38 12.33 10.32 12.15October ............. W 11.47 d(� ) 10.00 13.66 W 12.69 12.93 11.51 11.36 12.32November ......... W 11.48 d(� ) 10.16 13.74 W W 12.45 11.80 12.92 12.80December ......... W W d(� ) 12.31 15.56 W 13.59 13.46 12.78 13.51 13.85Average ........... W 13.81 d(� ) 12.18 15.16 12.16 14.80 12.96 13.45 12.57 13.43
1989January ............. W 14.52 d(� ) 13.98 16.11 W W 13.10 15.05 14.91 14.77February ........... W 17.14 d(� ) 14.25 17.15 W 16.33 14.00 15.83 16.35 15.98March ................ W 17.05 d(� ) 14.98 18.37 W W 16.62 17.29 17.45 17.37April .................. W 17.78 d(� ) 17.44 19.81 W W 17.77 18.75 16.85 18.35May ................... W W d(� ) 16.95 18.60 W W 16.78 17.97 15.98 17.28June .................. W 17.78 d(� ) 16.62 17.68 15.54 W 15.42 17.12 16.01 16.49July ................... W 17.61 d(� ) 16.41 17.67 W 17.66 14.34 16.74 15.66 16.02August .............. W W d(� ) 15.22 17.25 W 17.11 15.82 16.08 15.91 16.36September ........ W 16.37 d(� ) 15.37 18.00 W 17.22 16.02 16.62 16.50 16.68October ............. W 16.35 d(� ) 16.12 18.99 W 17.78 15.45 17.37 17.05 17.20November ......... W 17.28 d(� ) 16.44 19.11 18.09 18.37 15.56 17.45 17.53 17.52December ......... W W d(� ) 17.74 19.93 W 19.57 19.32 18.43 18.70 19.24Average ........... W 17.01 d(� ) 15.96 18.31 16.29 17.89 16.09 17.12 16.72 17.06
1990January ............. W 19.25 d(� ) 18.04 21.22 W 21.00 16.73 19.13 17.96 18.67February ........... W 19.43 d(� ) 16.68 20.41 W W 16.01 18.36 16.64 18.11March ................ W 18.98 d(� ) 16.24 18.41 W W 15.95 16.82 14.98 16.85April .................. W 17.38 d(� ) 13.30 16.79 11.44 16.13 15.57 14.77 13.02 15.09May ................... W 16.19 d(� ) 12.11 16.50 12.97 15.69 14.60 14.19 12.42 14.67June .................. W 15.20 d(� ) 10.74 15.58 W W 13.11 13.89 14.56 14.59July ................... W 15.06 d(� ) 12.84 17.12 W 15.10 16.66 17.79 20.27 18.17August .............. W 19.12 d(� ) 21.16 25.65 31.09 21.18 24.33 22.63 28.97 25.44September ........ W W d(� ) 27.04 32.74 W 33.05 27.71 30.02 28.02 29.23October ............. W 35.41 d(� ) 29.15 37.31 28.73 32.53 26.39 33.13 29.85 30.39November ......... W W d(� ) 27.18 33.56 21.20 W 22.96 29.56 23.39 26.77December ......... W W d(� ) 22.58 29.38 14.41 W 20.41 25.32 16.17 21.87Average ........... W 21.29 d(� ) 19.26 22.46 20.36 23.43 19.55 19.88 18.84 20.40
1991January ............. W W d(� ) 19.39 24.68 12.69 W 17.04 21.24 16.04 19.45February ........... W 20.82 d(� ) 13.62 20.48 14.06 W 14.50 17.12 14.56 16.73March ................ W W d(� ) 13.59 19.44 W 24.50 14.90 16.18 15.24 16.48April .................. W 16.85 d(� ) 15.34 19.12 15.14 W 15.38 16.90 15.72 16.88May ................... W W W 15.24 19.35 15.15 W 14.68 16.95 15.71 16.71June .................. W 16.77 d(� ) 14.68 18.38 14.54 W 13.62 16.33 15.29 16.04July ................... W W W 15.24 19.44 W 19.45 14.85 17.41 15.86 16.86August .............. W W W 15.34 20.20 16.35 W 14.64 17.82 16.81 17.23September ........ W W W 15.40 21.10 15.85 20.24 15.53 18.79 16.76 17.57October ............. W 18.50 W 16.91 22.55 14.61 W 16.44 19.42 15.76 18.12November ......... W W d(� ) 16.30 21.63 13.33 21.67 14.77 18.97 15.02 17.03December ......... W W d(� ) 13.47 18.99 12.72 W 12.62 16.57 14.32 15.03Average ........... W 18.69 15.58 15.37 20.29 14.62 20.81 14.91 17.79 15.59 16.99
1992January ............. W W d(� ) 12.45 18.58 W d(� ) 12.32 15.44 14.07 14.50February ........... W W d(� ) 12.40 18.28 14.61 W 12.53 16.04 15.35 15.04March ................ d(� ) W d(� ) 12.68 18.10 14.87 W 12.45 16.01 15.20 15.28April .................. W 16.23 d(� ) 14.11 19.59 W W 14.38 17.10 17.26 17.25May ................... W W d(� ) 16.05 20.47 17.61 W 15.03 18.35 18.13 17.83June .................. W W d(� ) 17.09 21.42 W 20.14 15.33 19.20 17.95 18.44July ................... W W d(� ) 16.88 20.83 17.60 W 15.10 18.74 18.20 18.09August .............. W W d(� ) 16.36 20.33 W 20.00 15.38 18.43 17.99 17.69September ........ d(� ) W d(� ) 16.88 20.84 16.69 20.20 16.21 18.65 17.11 18.01October ............. d(� ) W d(� ) 16.90 20.76 W W 15.40 18.70 15.89 17.42November ......... d(� ) W d(� ) 15.78 20.00 14.62 19.82 13.82 17.57 15.12 15.97December ......... W W d(� ) 14.79 18.42 15.62 W 13.38 16.13 15.91 15.60Average ........... W 17.06 d(� ) 15.26 19.98 15.85 19.61 14.39 17.65 16.50 16.87
a The Arab members of OPEC are Algeria, Iraq, Kuwait, Libya, Qatar,Saudi Arabia, and the United Arab Emirates.
b "Total OPEC" consists of Ecuador, Gabon, Indonesia, Iran, Nigeria, andVenezuela, as well as the Arab members. The cost of imports from theNeutral Zone between Kuwait and Saudi Arabia is included in the cost ofimports from "Total OPEC."
c Based on October, November, and December data only.d No data reported.NA=Not available. W=Value withheld to avoid disclosure of individual
company data.Notes: • The Free on Board (F.O.B) cost at the country of origin excludes
all costs related to insurance and transportation. See Note 2 at end ofsection. • Prices through 1980 reflect the period of reporting; prices sincethen reflect the period of loading. • Annual averages are averages of themonthly prices, including prices not published, weighted by volume. • U.S.geographic coverage is the 50 States and the District of Columbia.
Sources: See end of section.
Energy Information Administration/Historical Monthly Energy Review 1973-1992254

Table 9.3 Landed Costs of Crude Oil Imports from Selected Countries, 1973-1992
(Dollars per Barrel)
Algeria Canada Indonesia Iran Mexico NigeriaSaudiArabia
UnitedKingdom Venezuela
OtherCountries
ArabOPECa
TotalOPECb
1973January ............. NA NA NA NA NA NA NA NA NA NA NA NAFebruary ........... NA NA NA NA NA NA NA NA NA NA NA NAMarch ................ NA NA NA NA NA NA NA NA NA NA NA NAApril .................. NA NA NA NA NA NA NA NA NA NA NA NAMay ................... NA NA NA NA NA NA NA NA NA NA NA NAJune .................. NA NA NA NA NA NA NA NA NA NA NA NAJuly ................... NA NA NA NA NA NA NA NA NA NA NA NAAugust .............. NA NA NA NA NA NA NA NA NA NA NA NASeptember ........ NA NA NA c(� ) NA NA NA NA NA NA NA NAOctober ............. 6.70 4.82 6.41 6.18 NA 7.46 5.28 NA 4.80 5.91 5.63 5.89November ......... 10.42 4.88 7.24 6.69 NA 9.01 5.54 NA 6.37 7.23 6.30 7.07December ......... W 6.39 7.62 6.52 NA 10.71 W NA 6.76 10.13 7.61 8.01Averaged .......... 8.39 5.33 7.22 6.48 NA 9.08 5.37 NA 5.99 6.99 5.92 6.85
1974January ............. W 6.91 11.83 10.56 NA 13.67 c(� ) NA 11.35 14.92 W 11.94February ........... W 11.13 12.35 13.49 NA 13.96 c(� ) NA 11.38 13.81 W 13.10March ................ W 11.11 13.07 13.06 NA 14.36 W NA 11.56 13.31 12.20 13.04April .................. 15.06 11.24 13.20 12.57 NA 14.20 11.69 NA 11.48 13.87 12.90 13.01May ................... 14.59 11.58 13.38 13.15 NA 14.02 11.48 NA 11.54 13.12 12.44 12.93June .................. 14.48 13.11 13.03 12.74 NA 13.93 11.69 NA 10.98 13.33 12.69 12.84July ................... 13.76 12.27 14.11 12.14 NA 12.87 11.56 NA 10.99 12.79 12.40 12.33August .............. 13.57 12.34 13.65 12.39 NA 12.86 11.21 NA 11.33 12.70 12.18 12.36September ........ 13.87 12.34 12.81 11.64 NA 12.35 11.32 NA 11.02 12.72 12.04 11.97October ............. 13.06 12.12 13.95 12.18 W 12.32 11.61 NA 11.06 12.32 12.04 12.10November ......... 13.09 12.24 13.95 12.13 W 11.97 11.91 NA 11.17 12.60 12.40 12.16December ......... 13.39 12.16 13.60 12.40 W 12.33 12.01 NA 11.34 12.56 12.45 12.34Average ........... 13.97 11.48 13.20 12.48 W 13.16 11.63 NA 11.25 12.93 12.39 12.49
1975January ............. 12.74 12.37 13.53 12.23 11.83 12.28 12.03 NA 11.18 12.38 12.45 12.30February ........... 12.85 12.28 13.72 12.30 12.13 12.41 12.02 NA 11.98 12.38 12.43 12.43March ................ 12.76 12.81 13.49 12.25 11.95 12.18 12.20 NA 12.27 12.63 12.60 12.41April .................. 12.29 12.84 W 12.32 12.15 12.14 12.19 NA 12.15 12.34 12.28 12.32May ................... 12.49 12.27 13.57 12.82 11.94 12.28 12.25 NA 12.21 12.51 12.51 12.53June .................. 12.36 12.32 13.64 12.78 12.31 12.56 11.70 NA 12.45 12.22 12.23 12.58July ................... 12.66 12.75 13.91 12.11 13.06 12.47 12.21 NA 12.41 12.44 12.45 12.46August .............. 12.69 12.46 13.94 12.28 12.71 12.45 12.49 NA 12.29 12.45 12.58 12.54September ........ 12.82 12.75 13.81 12.15 12.99 12.83 12.06 NA 12.36 12.47 12.41 12.58October ............. 13.21 13.33 14.10 12.53 13.07 13.39 13.06 NA 13.13 13.24 13.19 13.19November ......... 13.64 14.15 14.14 13.02 13.16 13.45 13.35 NA 13.23 13.42 13.50 13.42December ......... 13.71 13.93 14.11 13.40 13.01 13.55 12.98 NA 12.51 13.21 13.16 13.29Average ........... 12.86 12.84 13.83 12.51 12.61 12.70 12.50 NA 12.36 12.66 12.71 12.70
1976January ............. 13.79 12.97 13.91 13.05 12.64 13.57 13.17 NA 11.56 13.32 13.31 13.27February ........... 14.00 13.18 13.99 12.82 12.60 13.31 13.19 NA 12.18 13.24 13.32 13.25March ................ 13.89 13.15 13.96 12.83 12.61 13.68 13.19 NA 11.73 13.30 13.35 13.29April .................. 13.83 13.42 13.87 12.99 12.58 13.64 13.12 NA 11.61 13.33 13.30 13.26May ................... 13.52 13.50 13.79 12.88 12.52 13.69 13.03 NA 11.57 13.30 13.21 13.20June .................. 13.81 13.89 13.88 12.98 12.55 13.80 13.14 NA 11.77 13.22 13.30 13.35July ................... 13.94 13.22 13.81 12.80 12.66 13.88 12.94 W 11.81 13.44 13.26 13.28August .............. 13.94 13.50 13.86 13.13 12.70 13.92 13.06 c(� ) 11.95 13.42 13.33 13.38September ........ 14.04 13.44 13.79 12.82 12.57 13.84 12.90 W 12.07 13.40 13.30 13.32October ............. 13.87 13.49 13.89 12.78 12.77 14.01 12.91 W 12.00 13.39 13.26 13.32November ......... 13.92 13.32 13.80 12.63 12.71 13.99 13.09 W 12.15 13.46 13.36 13.39December ......... 14.18 13.30 13.75 12.83 12.76 14.16 13.11 W 12.21 13.43 13.43 13.46Average ........... 13.90 13.36 13.85 12.86 12.64 13.81 13.06 W 11.89 13.36 13.31 13.32
1977January ............. 14.89 13.64 14.49 13.25 13.82 14.98 13.33 W 13.24 14.14 13.97 14.05February ........... 15.23 13.69 14.57 13.73 14.00 15.20 13.54 W 13.50 14.41 14.12 14.27March ................ 15.11 14.03 14.61 13.95 13.84 15.24 13.60 14.83 13.27 14.59 14.18 14.33April .................. 15.25 14.02 14.71 14.03 13.79 15.42 13.53 W 13.20 14.60 14.19 14.33May ................... 15.28 14.91 14.61 14.13 13.79 15.48 13.55 15.21 13.14 14.60 14.24 14.41June .................. 15.37 14.41 14.66 13.94 13.83 15.39 13.45 W 13.04 14.59 14.19 14.28July ................... 15.31 14.00 14.75 13.93 13.87 15.40 13.72 15.02 13.01 14.62 14.34 14.38August .............. 15.38 14.10 14.64 13.79 13.84 15.32 13.79 14.93 12.88 14.62 14.36 14.34September ........ 15.31 14.24 14.62 13.85 13.75 15.32 14.05 14.87 13.08 14.65 14.53 14.46October ............. 15.43 14.02 14.70 13.85 13.82 15.34 13.90 14.54 13.11 14.61 14.46 14.43November ......... 15.14 14.29 14.75 13.90 13.84 15.26 13.92 14.52 13.00 14.57 14.43 14.44December ......... 15.25 14.47 14.64 13.98 13.72 15.19 14.08 14.56 12.95 14.68 14.57 14.48Average ........... 15.24 14.13 14.65 13.86 13.82 15.29 13.69 14.83 13.11 14.56 14.30 14.35
See footnotes at end of table.
Energy Information Administration/Historical Monthly Energy Review 1973-1992 255

Table 9.3 Landed Costs of Crude Oil Imports from Selected Countries, 1973-1992 (Continued)
(Dollars per Barrel)
Algeria Canada Indonesia Iran Mexico NigeriaSaudiArabia
UnitedKingdom Venezuela
OtherCountries
ArabOPECa
TotalOPECb
1978January ............. 15.02 14.12 14.75 13.98 13.77 14.95 13.94 14.39 12.97 14.53 14.39 14.37February ........... 14.93 13.84 14.61 13.74 13.71 14.91 14.07 W 12.93 14.46 14.36 14.33March ................ 14.86 13.58 14.54 13.91 13.66 14.89 13.94 W 13.22 14.51 14.34 14.33April .................. 14.91 14.02 14.64 13.99 13.66 14.67 13.94 14.28 12.89 14.45 14.29 14.29May ................... 14.71 14.39 14.51 13.94 13.66 14.74 13.90 14.35 12.44 14.40 14.29 14.24June .................. 14.80 15.07 14.58 13.92 13.51 14.61 13.86 14.19 12.73 14.46 14.27 14.24July ................... 14.83 14.64 14.75 13.93 13.35 14.64 13.81 14.29 12.41 14.47 14.28 14.23August .............. 14.83 14.78 14.64 13.76 13.52 14.59 13.82 14.48 12.74 14.58 14.27 14.22September ........ 14.77 13.92 14.58 13.83 13.46 14.78 13.99 14.53 13.03 14.53 14.33 14.30October ............. 14.94 14.71 14.68 13.89 13.42 15.03 13.89 14.85 12.78 14.71 14.34 14.35November ......... 15.32 14.72 14.85 13.89 13.63 15.08 14.05 14.81 13.02 14.78 14.50 14.48December ......... 15.31 14.96 14.84 13.80 13.55 15.32 14.04 15.00 13.05 14.93 14.61 14.63Average ........... 14.93 14.41 14.65 13.89 13.56 14.88 13.94 14.53 12.84 14.58 14.36 14.34
1979January ............. 16.01 15.32 15.50 W 14.49 16.02 14.74 16.50 14.06 15.62 15.20 15.29February ........... 16.16 15.90 15.57 W 14.76 16.22 14.87 16.09 13.95 16.16 15.49 15.55March ................ 16.46 16.41 15.78 W 15.02 16.33 15.42 16.39 13.72 16.95 16.31 16.17April .................. 18.00 17.45 17.37 19.14 17.17 19.30 16.34 18.97 15.32 18.39 17.36 17.73May ................... 20.21 18.65 18.03 18.36 18.37 20.93 16.29 19.50 16.45 19.95 18.50 18.75June .................. 22.23 19.13 20.08 21.90 17.72 23.40 20.05 22.52 16.78 21.60 20.83 21.13July ................... 23.91 20.23 22.44 23.92 22.41 25.82 20.26 26.32 18.32 24.58 22.05 22.71August .............. 24.95 23.07 23.19 22.80 22.72 26.69 20.14 27.45 19.33 26.20 22.91 23.26September ........ 24.89 25.64 23.68 28.48 22.62 27.01 20.08 27.17 18.81 26.80 23.81 24.48October ............. 25.99 23.54 24.28 27.84 25.34 26.73 21.24 26.42 19.81 26.79 23.58 24.48November ......... 27.73 26.03 25.23 30.63 24.85 29.34 25.61 30.36 19.70 29.81 27.61 27.64December ......... 30.65 26.52 26.94 36.28 24.91 31.11 25.25 27.08 21.86 31.19 28.54 28.89Average ........... 21.88 20.22 20.63 24.21 20.77 22.97 18.95 22.97 17.65 22.86 20.79 21.29
1980January ............. 34.82 27.99 29.71 NA 29.55 33.07 26.54 31.95 26.51 33.69 30.42 30.74February ........... 36.43 29.96 32.84 W 32.49 35.66 27.34 33.22 26.11 35.09 31.65 32.27March ................ 38.55 30.77 32.91 W 31.17 36.63 27.62 35.34 24.29 35.20 31.30 32.17April .................. 38.53 30.29 33.77 c(� ) 30.84 37.24 28.94 35.78 25.03 35.38 31.85 32.91May ................... 38.09 31.16 34.14 c(� ) 31.18 37.96 29.49 35.84 24.48 35.80 32.66 33.60June .................. 38.51 31.26 34.63 c(� ) 31.43 38.08 30.03 37.41 26.48 36.58 33.56 34.04July ................... 39.56 31.32 35.00 c(� ) 32.51 38.82 30.00 37.25 25.85 37.39 33.41 34.24August .............. 38.74 31.44 35.08 c(� ) 32.67 37.80 31.13 36.08 25.61 37.64 34.31 34.63September ........ 38.38 30.96 34.69 c(� ) 32.13 37.68 31.51 36.62 26.21 36.87 34.11 34.55October ............. 38.13 29.31 34.06 c(� ) 32.04 37.88 31.54 37.15 23.25 37.18 33.94 34.32November ......... 37.85 28.81 34.35 W 32.42 37.92 33.05 36.62 27.58 37.63 35.42 35.42December ......... 38.84 29.54 35.25 c(� ) 33.10 38.33 33.69 W 28.21 37.66 35.53 35.65Average ........... 37.92 30.11 33.92 NA 31.77 37.15 29.80 35.68 25.92 36.15 32.97 33.56
1981January ............. 41.19 34.73 38.31 c(� ) 36.18 41.45 34.32 40.12 33.81 40.72 36.72 37.83February ........... 41.87 33.70 38.07 c(� ) 37.49 41.58 34.49 40.59 31.33 40.84 37.62 38.07March ................ 41.60 33.97 38.16 c(� ) 36.43 40.99 34.28 40.72 31.89 40.68 37.29 37.98April .................. 40.96 33.74 38.04 c(� ) 34.36 40.97 34.11 40.41 30.29 40.27 36.82 37.37May ................... 40.83 32.76 37.78 c(� ) 34.89 40.18 33.77 37.46 28.80 39.63 36.38 36.90June .................. 40.21 32.82 37.80 c(� ) 31.00 40.08 33.75 36.36 29.66 39.10 36.36 36.78July ................... 39.14 31.32 36.16 c(� ) 33.07 40.27 33.80 36.19 29.50 37.18 34.75 35.03August .............. 40.85 30.44 36.53 c(� ) 31.60 39.00 33.68 35.74 27.80 37.25 35.18 35.19September ........ 40.86 30.78 36.94 c(� ) 30.83 37.29 33.71 35.98 29.39 36.19 35.24 35.38October ............. 38.16 31.30 36.17 c(� ) 31.50 36.71 34.94 36.01 28.71 36.20 35.78 35.41November ......... 37.65 30.86 36.71 c(� ) 32.18 37.62 35.06 36.88 29.39 36.82 36.10 36.16December ......... 38.16 31.41 37.32 c(� ) 31.82 37.68 35.39 37.32 29.04 36.26 36.05 36.26Average ........... 40.46 32.32 37.31 c(� ) 33.70 39.66 34.20 37.29 29.91 38.54 36.22 36.60
1982January ............. 38.33 31.18 36.94 c(� ) 30.15 37.25 34.78 36.79 29.14 35.82 35.26 35.74February ........... 37.09 29.02 36.84 c(� ) 31.48 37.18 34.58 35.04 30.21 35.60 34.94 35.52March ................ W 26.57 37.18 c(� ) 28.68 35.87 35.04 31.35 23.93 33.63 35.42 35.14April .................. 31.67 25.20 36.79 c(� ) 27.59 34.84 35.00 W 22.88 32.43 34.94 34.51May ................... 34.19 25.34 36.59 W 28.82 35.95 34.00 32.85 23.73 33.66 34.23 34.38June .................. 35.42 24.96 37.38 W 28.50 36.02 35.55 34.84 22.86 34.38 35.64 35.19July ................... 35.05 26.83 36.59 W 29.11 36.19 35.22 34.76 24.28 33.74 35.29 35.01August .............. 33.99 26.71 36.71 31.43 27.90 36.04 34.59 34.32 21.78 33.64 34.52 34.16September ........ 34.89 26.66 36.60 W 28.49 35.69 34.69 34.50 24.36 34.17 34.89 34.08October ............. 35.54 27.20 36.86 33.05 28.21 36.16 35.40 34.69 24.27 33.81 35.48 34.69November ......... 35.83 27.16 36.49 32.66 28.17 36.09 35.42 34.76 24.98 34.03 35.42 34.46December ......... 35.72 27.35 35.90 32.73 28.19 34.65 36.17 33.90 27.09 33.43 36.10 34.16Average ........... 35.35 27.15 36.70 32.46 28.63 36.16 34.99 34.25 24.93 34.03 35.15 34.81
See footnotes at end of table.
Energy Information Administration/Historical Monthly Energy Review 1973-1992256

Table 9.3 Landed Costs of Crude Oil Imports from Selected Countries, 1973-1992 (Continued)
(Dollars per Barrel)
Algeria Canada Indonesia Iran Mexico NigeriaSaudiArabia
UnitedKingdom Venezuela
OtherCountries
ArabOPECa
TotalOPECb
1983January ............. 33.20 27.60 36.12 W 27.44 W W 33.44 23.20 32.07 33.56 33.11February ........... 32.17 26.19 35.07 c(� ) 26.15 32.24 W 32.66 23.36 29.92 33.00 30.42March ................ 31.24 24.78 30.68 W 25.06 30.55 31.67 30.03 21.48 28.78 31.38 28.88April .................. 30.55 24.41 31.04 W 24.65 30.63 28.99 30.84 21.45 29.15 29.97 29.42May ................... 30.48 24.37 30.80 W 25.17 30.75 W 30.60 21.24 29.42 29.81 29.78June .................. 30.88 24.92 31.43 29.22 24.81 30.56 29.86 30.06 22.07 29.50 30.25 30.12July ................... 31.36 25.45 31.35 30.06 25.34 30.91 29.49 30.86 21.30 29.53 30.40 29.98August .............. 31.85 25.45 31.65 29.58 25.80 31.25 28.97 30.91 22.82 29.97 29.78 29.95September ........ 31.78 25.71 31.32 29.41 25.66 30.70 29.13 31.52 23.12 30.17 29.53 29.62October ............. 30.97 26.01 31.26 29.62 26.44 31.16 29.41 30.79 24.75 29.75 29.66 29.80November ......... 30.96 25.83 31.51 W 26.29 31.02 29.29 30.33 24.68 29.65 29.70 29.78December ......... 30.23 26.49 31.23 28.57 26.88 30.57 28.51 30.00 24.91 29.07 28.66 29.00Average ........... 31.26 25.63 31.57 29.81 25.78 30.85 29.27 30.87 22.94 29.68 29.87 29.84
1984January ............. 29.19 26.31 31.37 W 26.85 30.62 29.64 30.09 25.27 29.15 29.35 29.34February ........... 29.73 26.33 31.02 W 26.73 31.29 28.36 30.77 25.19 29.69 29.08 29.40March ................ 30.31 25.99 31.23 c(� ) 26.92 30.93 29.49 30.98 24.75 29.72 29.81 29.60April .................. 29.81 26.00 31.36 W 26.68 31.08 29.41 30.73 24.86 29.88 29.61 29.37May ................... 29.96 27.03 31.06 c(� ) 26.92 30.96 29.02 30.75 24.93 29.68 29.41 29.42June .................. 29.62 25.97 31.35 c(� ) 27.24 30.77 29.25 30.43 25.29 29.66 29.37 29.44July ................... 28.63 27.09 30.85 W 26.98 30.07 29.46 29.54 25.26 29.26 28.93 28.68August .............. 28.16 26.88 31.23 W 26.99 29.99 W 28.94 24.95 28.78 28.96 28.94September ........ 27.94 26.98 30.64 W 26.66 30.50 29.75 27.60 25.57 28.95 28.69 28.95October ............. 28.42 26.98 29.94 W 26.79 29.35 28.62 29.27 25.58 28.80 28.52 28.46November ......... 27.99 26.29 30.37 W 26.83 29.45 c(� ) 28.39 25.33 28.44 28.28 28.42December ......... 27.07 26.49 30.12 c(� ) 26.65 28.20 c(� ) 28.55 25.24 28.10 27.45 27.95Average ........... 29.06 26.56 30.87 28.70 26.85 30.36 29.20 29.45 25.19 29.21 29.10 29.06
1985January ............. 26.28 25.30 29.26 c(� ) 26.80 28.70 W 28.85 25.36 27.24 27.39 27.60February ........... 26.06 24.00 28.84 c(� ) 26.51 28.55 W 28.23 25.37 28.09 27.38 27.68March ................ 27.09 25.17 28.40 W 26.72 29.42 c(� ) W 25.73 28.16 27.40 27.60April .................. 28.18 26.14 28.99 W 26.67 28.99 W 28.70 25.44 28.03 27.87 27.95May ................... W 26.30 28.98 W 26.66 28.73 c(� ) 28.07 25.26 27.34 27.33 27.50June .................. W 26.24 28.73 24.55 25.29 27.81 c(� ) 27.54 25.13 26.68 26.25 26.63July ................... 27.35 25.97 28.95 24.33 24.76 28.56 W 27.60 23.81 26.57 26.86 26.87August .............. W 26.05 28.14 25.76 24.96 28.54 c(� ) 27.61 23.45 26.89 27.07 26.44September ........ W 25.94 26.79 26.47 25.00 28.76 W 28.23 23.38 27.13 27.26 26.61October ............. W 25.90 28.47 26.56 25.09 29.06 26.69 29.00 23.57 27.44 26.80 26.90November ......... W 25.91 29.00 27.00 24.91 29.61 24.72 29.45 23.80 28.00 25.52 26.82December ......... 28.92 25.56 28.82 W 23.94 30.38 21.09 28.78 23.53 26.46 21.86 24.74Average ........... 27.51 25.71 28.67 25.79 25.63 28.96 24.72 28.36 24.43 27.33 25.90 26.86
1986January ............. 24.69 23.89 28.45 c(� ) 20.33 27.73 14.54 25.36 22.21 24.95 17.57 22.68February ........... W 17.42 W W 14.61 21.18 13.80 18.22 13.27 17.58 13.88 15.40March ................ W 12.96 14.94 W 11.94 16.44 13.60 16.02 11.04 14.89 13.52 13.67April .................. W 11.69 12.29 W 10.74 15.02 13.66 13.00 11.13 13.20 13.44 12.97May ................... 13.27 12.11 12.74 W 11.06 14.22 10.68 14.17 11.44 13.21 11.43 11.98June .................. W 12.74 13.27 W 10.26 13.95 10.49 13.65 10.24 12.66 11.08 11.70July ................... W 11.19 11.72 W 8.93 12.11 11.33 11.83 8.45 11.34 11.45 11.14August .............. W 11.71 11.45 11.18 10.87 12.29 11.27 11.56 10.66 11.86 11.63 11.54September ........ 12.88 12.52 13.67 W 11.95 14.11 12.08 14.15 10.86 13.18 12.53 12.60October ............. W 12.47 14.18 W 11.74 14.64 12.84 14.76 10.87 13.91 13.00 13.15November ......... 13.19 12.51 13.96 c(� ) 12.13 14.64 14.63 14.65 11.24 14.21 14.39 13.72December ......... W 12.85 14.32 W 13.04 15.56 16.13 15.42 13.24 14.94 15.82 15.01Average ........... 14.82 13.43 14.63 12.38 12.17 15.29 12.84 14.63 11.52 14.25 13.14 13.46
1987January ............. 16.96 14.65 16.24 W 15.92 18.02 15.87 17.47 14.45 17.18 16.08 16.02February ........... 16.70 15.49 18.10 17.79 15.67 18.54 17.80 18.14 14.63 18.11 17.29 16.95March ................ W 15.72 18.19 17.78 16.32 18.30 17.61 18.02 15.27 17.75 17.49 17.25April .................. 18.06 16.31 18.32 17.87 16.71 18.96 17.69 18.19 16.03 18.06 17.55 17.69May ................... 18.51 17.11 18.38 18.00 18.02 19.29 17.66 19.04 16.24 18.36 17.82 17.82June .................. W 17.73 19.04 18.37 18.07 19.54 17.80 19.43 16.85 18.65 17.96 18.28July ................... W 18.61 19.10 18.69 19.08 19.95 17.69 20.38 17.09 19.13 18.02 18.53August .............. 19.05 19.00 19.69 19.00 17.89 20.63 18.01 20.41 16.53 19.45 18.36 18.73September ........ 18.26 17.81 19.18 18.67 16.61 19.38 17.93 18.96 16.14 18.54 18.11 18.14October ............. W 17.68 18.97 18.37 16.98 19.45 15.71 19.05 16.26 18.35 16.74 17.41November ......... 18.18 17.38 18.77 W 15.84 19.44 15.59 18.76 15.19 18.13 17.21 17.54December ......... W 16.13 17.75 c(� ) 13.09 18.50 14.79 17.99 13.90 17.15 15.46 16.05Average ........... 17.87 17.04 18.49 18.28 16.69 19.32 16.81 18.78 15.76 18.30 17.32 17.64
See footnotes at end of table.
Energy Information Administration/Historical Monthly Energy Review 1973-1992 257

Table 9.3 Landed Costs of Crude Oil Imports from Selected Countries, 1973-1992 (Continued)
(Dollars per Barrel)
Algeria Canada Indonesia Iran Mexico NigeriaSaudiArabia
UnitedKingdom Venezuela
OtherCountries
ArabOPECa
TotalOPECb
1988January ............. W 14.58 17.99 W 13.16 17.91 13.23 17.59 13.10 16.28 14.16 14.61February ........... W 14.37 17.44 c(� ) 13.30 16.59 14.00 16.70 13.05 15.91 14.23 14.59March ................ W 13.66 15.13 c(� ) 12.22 16.47 14.07 15.72 13.50 15.13 14.29 14.74April .................. W 14.39 16.30 c(� ) 13.97 16.88 14.12 16.11 14.18 15.77 14.70 15.27May ................... W 15.12 16.94 c(� ) 14.09 17.00 14.51 16.97 14.24 16.04 15.05 15.50June .................. W 14.67 16.40 c(� ) 13.21 16.59 13.91 16.29 14.32 15.20 14.31 15.00July ................... W 13.31 15.11 c(� ) 12.58 15.68 13.17 15.52 13.78 14.68 13.63 14.25August .............. W 13.13 14.90 c(� ) 12.77 15.55 12.44 15.72 13.28 14.07 13.12 13.69September ........ W 12.89 14.05 c(� ) 12.09 14.49 11.78 14.38 12.96 13.21 12.05 12.92October ............. W 11.73 12.60 c(� ) 10.42 14.32 11.93 13.33 13.58 12.66 11.99 12.74November ......... W 11.58 12.82 c(� ) 10.56 14.49 12.79 14.02 13.12 12.51 12.44 12.87December ......... W 12.57 14.05 c(� ) 12.81 16.31 14.62 15.12 14.34 13.97 14.44 14.67Average ........... W 13.50 15.15 W 12.58 15.88 13.37 15.82 13.66 14.45 13.60 14.18
1989January ............. W 14.47 16.30 c(� ) 14.48 17.54 15.90 17.17 14.05 15.88 15.73 15.98February ........... W 14.97 17.86 c(� ) 14.55 18.19 16.60 17.88 14.62 17.22 16.52 16.74March ................ W 15.88 18.67 c(� ) 15.37 19.32 17.00 17.90 17.30 18.34 17.33 17.80April .................. 22.13 17.42 19.11 c(� ) 17.78 20.53 18.95 20.00 18.45 19.36 18.90 19.23May ................... W 17.81 19.37 c(� ) 17.35 19.65 17.43 20.04 17.32 18.79 17.58 18.15June .................. W 17.69 18.92 c(� ) 16.99 18.90 16.84 18.74 16.13 17.96 17.01 17.45July ................... W 17.89 18.92 c(� ) 16.84 18.68 16.72 18.81 15.13 17.44 16.73 17.13August .............. W 16.62 W c(� ) 15.62 18.01 16.42 18.20 16.50 16.89 16.45 16.86September ........ W 17.00 17.82 c(� ) 15.76 18.72 16.84 18.11 16.67 17.54 16.97 17.29October ............. W 17.44 17.70 c(� ) 16.52 19.82 17.90 18.71 16.13 18.27 17.82 17.97November ......... 18.55 17.08 18.16 c(� ) 16.85 20.14 18.08 19.31 16.38 18.74 18.16 18.27December ......... W 17.49 19.20 c(� ) 18.01 20.98 19.28 20.32 20.16 19.84 19.52 19.93Average ........... 19.13 16.81 18.35 c(� ) 16.35 19.19 17.34 18.74 16.78 18.08 17.41 17.78
1990January ............. W 18.52 20.86 c(� ) 18.49 22.36 19.18 21.56 17.86 20.45 19.33 19.77February ........... W 18.52 21.21 c(� ) 17.13 21.46 18.32 W 16.69 19.56 18.27 18.98March ................ W 17.30 20.65 c(� ) 16.64 19.69 16.63 20.61 16.64 18.22 16.65 17.68April .................. W 15.65 18.98 c(� ) 13.79 18.06 14.50 17.92 16.30 16.18 14.68 15.83May ................... W 15.44 17.83 c(� ) 12.76 17.53 14.21 17.10 15.47 15.27 14.02 15.15June .................. W 14.00 16.43 c(� ) 11.29 16.62 16.31 17.24 14.00 15.21 15.53 15.53July ................... 17.67 15.01 15.96 c(� ) 13.37 18.04 19.89 16.68 17.40 18.57 19.85 19.01August .............. W 21.26 20.23 c(� ) 21.50 26.71 28.84 23.80 25.08 23.23 26.97 26.31September ........ W 27.80 26.88 c(� ) 27.38 33.41 30.06 30.26 28.56 29.46 30.10 30.27October ............. W 31.04 36.61 c(� ) 29.61 37.72 30.46 33.75 27.00 34.51 30.75 31.08November ......... W 28.60 W c(� ) 27.64 34.55 26.37 W 23.77 30.42 26.71 27.77December ......... W 23.60 28.53 c(� ) 23.00 30.45 20.92 W 21.30 27.59 21.35 23.26Average ........... W 20.48 22.50 c(� ) 19.64 23.33 21.82 22.65 20.31 20.52 20.64 21.23
1991January ............. W 20.81 W c(� ) 19.98 26.00 18.53 W 18.35 24.08 18.94 20.16February ........... W 17.05 22.61 c(� ) 14.23 21.66 16.18 W 15.76 19.42 16.29 17.43March ................ W 15.20 20.03 c(� ) 14.15 20.60 17.08 25.77 16.18 18.59 17.23 17.88April .................. W 16.26 18.85 c(� ) 15.85 20.31 17.54 20.56 16.35 18.77 17.65 18.17May ................... W 16.28 W W 15.81 20.50 17.34 20.21 15.74 19.53 17.49 17.98June .................. W 16.19 18.25 c(� ) 15.20 19.79 16.85 19.35 14.61 18.38 17.01 17.32July ................... W 17.14 17.76 17.56 15.89 20.73 17.48 20.47 15.92 18.82 17.61 17.96August .............. W 17.61 W W 15.78 21.29 18.04 20.71 15.64 19.30 18.17 18.40September ........ W 17.84 W W 15.82 22.13 18.19 21.16 16.44 20.35 18.42 18.70October ............. W 18.38 19.85 W 17.34 23.68 17.62 22.07 17.26 20.91 17.97 19.03November ......... W 17.53 21.05 c(� ) 16.53 22.71 16.46 22.71 15.66 21.04 16.90 17.95December ......... W 15.87 W c(� ) 13.96 19.96 15.03 20.29 13.46 18.67 15.49 15.94Average ........... W 17.16 20.20 17.54 15.89 21.39 17.22 21.37 15.92 19.73 17.45 18.08
1992January ............. W 14.83 W c(� ) 13.02 19.34 14.81 W 13.20 17.46 15.16 15.38February ........... W 15.57 W c(� ) 12.78 19.10 15.61 W 13.47 17.64 15.85 15.87March ................ c(� ) 15.68 W c(� ) 13.06 19.05 16.05 18.83 13.41 17.44 16.14 16.29April .................. W 16.42 17.76 c(� ) 14.40 20.32 18.01 18.97 15.06 18.10 18.11 18.07May ................... W 17.35 17.66 c(� ) 16.39 21.25 18.62 19.99 15.73 19.58 18.80 18.65June .................. W 18.40 19.60 c(� ) 17.41 22.11 19.49 20.85 16.01 20.93 19.60 19.57July ................... W 18.50 21.06 c(� ) 17.20 21.49 19.00 21.45 15.78 20.49 19.15 19.06August .............. W 18.28 21.26 c(� ) 16.74 21.05 18.45 21.37 16.10 20.10 18.79 18.70September ........ c(� ) 18.35 W c(� ) 17.34 21.57 18.45 20.72 16.89 20.12 18.51 18.83October ............. W 18.35 W c(� ) 17.26 21.60 17.96 21.17 16.14 20.09 18.08 18.56November ......... c(� ) 17.26 W c(� ) 16.18 20.79 17.02 21.00 14.51 19.25 17.05 17.28December ......... W 15.85 W c(� ) 15.12 19.32 16.64 19.46 14.07 17.80 16.69 16.62Average ........... W 17.04 18.76 c(� ) 15.60 20.78 17.48 20.63 15.13 19.25 17.63 17.81
a The Arab members of OPEC are Algeria, Iraq, Kuwait, Libya, Qatar,Saudi Arabia, and the United Arab Emirates.
b "Total OPEC" consists of Ecuador, Gabon, Indonesia, Iran, Nigeria, andVenezuela, as well as the Arab members. The cost of imports from theNeutral Zone between Kuwait and Saudi Arabia is included in the cost ofimports from "Total OPEC."
c No data reported.d Based on October, November, and December data only.
NA=Not available. W=Value withheld to avoid disclosure of individualcompany data.
Notes: • See Note 3 at end of section. • Prices through 1980 reflect theperiod of reporting; prices since then reflect the period of loading. • Annualaverages are averages of the monthly prices, including prices not published,weighted by volume. • U.S. geographic coverage is the 50 States and theDistrict of Columbia.
Sources: See end of section.
Energy Information Administration/Historical Monthly Energy Review 1973-1992258

Table 9.4 Motor Gasoline Retail Prices, U.S. City Average, 1973-1992
(Cents per Gallon, Including Taxes)
LeadedRegular
UnleadedRegular
UnleadedPremium All Typesa
1973January ....................................... NA NA NA NAFebruary ..................................... NA NA NA NAMarch .......................................... NA NA NA NAApril ............................................ NA NA NA NAMay ............................................. NA NA NA NAJune ............................................ NA NA NA NAJuly ............................................. NA NA NA NAAugust ........................................ NA NA NA NASeptember .................................. NA NA NA NAOctober ....................................... 40.2 NA NA NANovember ................................... 41.8 NA NA NADecember ................................... 43.7 NA NA NAAverage ..................................... b 38.8 NA NA NA
1974January ....................................... 46.5 NA NA NAFebruary ..................................... 49.1 NA NA NAMarch .......................................... 52.8 NA NA NAApril ............................................ 53.7 NA NA NAMay ............................................. 55.0 NA NA NAJune ............................................ 55.6 NA NA NAJuly ............................................. 55.8 NA NA NAAugust ........................................ 55.4 NA NA NASeptember .................................. 55.0 NA NA NAOctober ....................................... 53.4 NA NA NANovember ................................... 52.8 NA NA NADecember ................................... 52.8 NA NA NAAverage ..................................... 53.2 NA NA NA
1975January ....................................... 53.2 NA NA NAFebruary ..................................... 53.3 NA NA NAMarch .......................................... 53.4 NA NA NAApril ............................................ 54.0 NA NA NAMay ............................................. 55.0 NA NA NAJune ............................................ 56.7 NA NA NAJuly ............................................. 59.1 NA NA NAAugust ........................................ 59.5 NA NA NASeptember .................................. 59.7 NA NA NAOctober ....................................... 59.4 NA NA NANovember ................................... 58.9 NA NA NADecember ................................... 58.6 NA NA NAAverage ..................................... 56.7 NA NA NA
1976January ....................................... 58.4 60.5 NA NAFebruary ..................................... 57.8 60.0 NA NAMarch .......................................... 56.9 59.4 NA NAApril ............................................ 56.7 59.2 NA NAMay ............................................. 57.6 60.0 NA NAJune ............................................ 59.2 61.6 NA NAJuly ............................................. 59.9 62.3 NA NAAugust ........................................ 60.3 62.8 NA NASeptember .................................. 60.4 63.0 NA NAOctober ....................................... 60.3 62.9 NA NANovember ................................... 60.2 62.9 NA NADecember ................................... 60.0 62.6 NA NAAverage ..................................... 59.0 61.4 NA NA
1977January ....................................... 60.0 62.7 NA NAFebruary ..................................... 60.7 63.7 NA NAMarch .......................................... 61.2 64.3 NA NAApril ............................................ 61.9 65.1 NA NAMay ............................................. 62.6 65.9 NA NAJune ............................................ 63.0 66.5 NA NAJuly ............................................. 63.1 66.7 NA NAAugust ........................................ 63.0 66.7 NA NASeptember .................................. 62.9 66.6 NA NAOctober ....................................... 62.7 66.5 NA NANovember ................................... 62.6 66.4 NA NADecember ................................... 62.7 66.5 NA NAAverage ..................................... 62.2 65.6 NA NA
See footnotes at end of table.
Energy Information Administration/Historical Monthly Energy Review 1973-1992 259
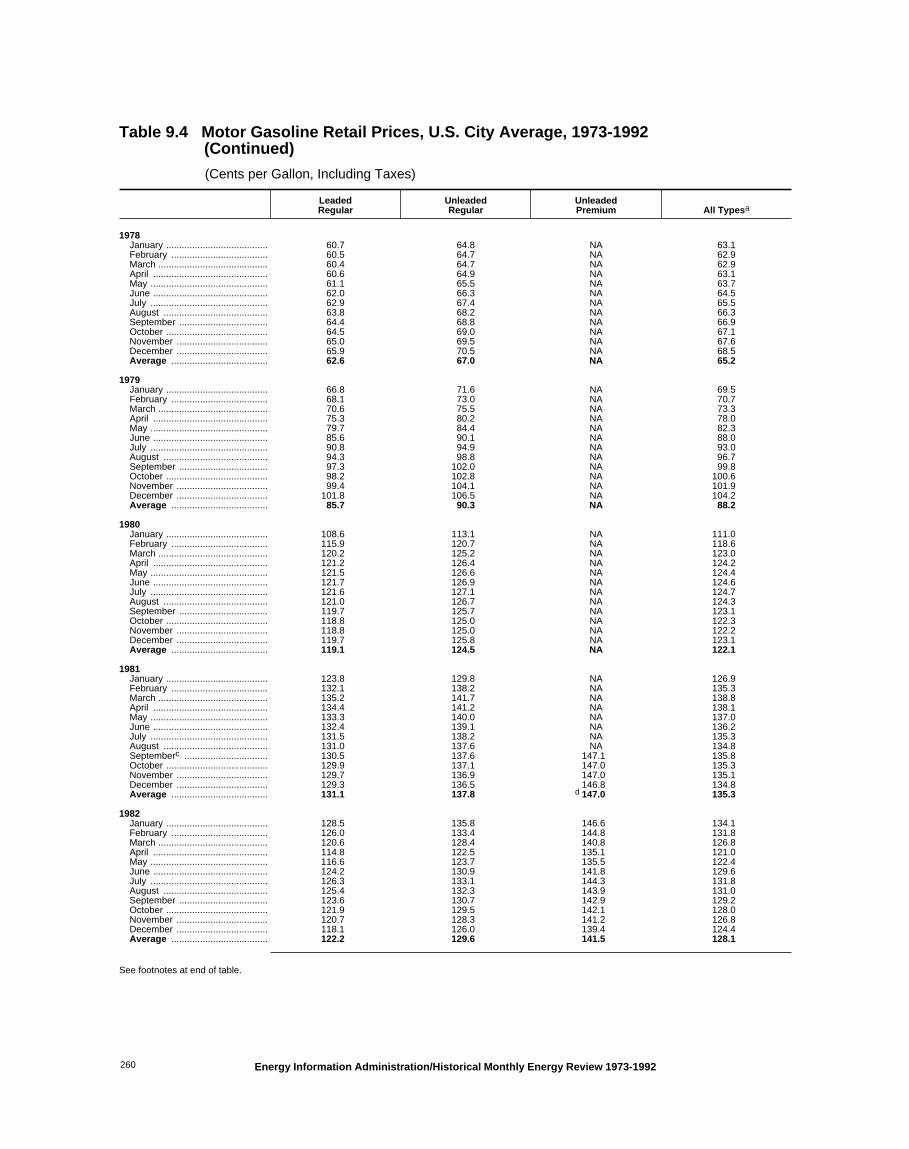
Table 9.4 Motor Gasoline Retail Prices, U.S. City Average, 1973-1992 (Continued)
(Cents per Gallon, Including Taxes)
LeadedRegular
UnleadedRegular
UnleadedPremium All Typesa
1978January ....................................... 60.7 64.8 NA 63.1February ..................................... 60.5 64.7 NA 62.9March .......................................... 60.4 64.7 NA 62.9April ............................................ 60.6 64.9 NA 63.1May ............................................. 61.1 65.5 NA 63.7June ............................................ 62.0 66.3 NA 64.5July ............................................. 62.9 67.4 NA 65.5August ........................................ 63.8 68.2 NA 66.3September .................................. 64.4 68.8 NA 66.9October ....................................... 64.5 69.0 NA 67.1November ................................... 65.0 69.5 NA 67.6December ................................... 65.9 70.5 NA 68.5Average ..................................... 62.6 67.0 NA 65.2
1979January ....................................... 66.8 71.6 NA 69.5February ..................................... 68.1 73.0 NA 70.7March .......................................... 70.6 75.5 NA 73.3April ............................................ 75.3 80.2 NA 78.0May ............................................. 79.7 84.4 NA 82.3June ............................................ 85.6 90.1 NA 88.0July ............................................. 90.8 94.9 NA 93.0August ........................................ 94.3 98.8 NA 96.7September .................................. 97.3 102.0 NA 99.8October ....................................... 98.2 102.8 NA 100.6November ................................... 99.4 104.1 NA 101.9December ................................... 101.8 106.5 NA 104.2Average ..................................... 85.7 90.3 NA 88.2
1980January ....................................... 108.6 113.1 NA 111.0February ..................................... 115.9 120.7 NA 118.6March .......................................... 120.2 125.2 NA 123.0April ............................................ 121.2 126.4 NA 124.2May ............................................. 121.5 126.6 NA 124.4June ............................................ 121.7 126.9 NA 124.6July ............................................. 121.6 127.1 NA 124.7August ........................................ 121.0 126.7 NA 124.3September .................................. 119.7 125.7 NA 123.1October ....................................... 118.8 125.0 NA 122.3November ................................... 118.8 125.0 NA 122.2December ................................... 119.7 125.8 NA 123.1Average ..................................... 119.1 124.5 NA 122.1
1981January ....................................... 123.8 129.8 NA 126.9February ..................................... 132.1 138.2 NA 135.3March .......................................... 135.2 141.7 NA 138.8April ............................................ 134.4 141.2 NA 138.1May ............................................. 133.3 140.0 NA 137.0June ............................................ 132.4 139.1 NA 136.2July ............................................. 131.5 138.2 NA 135.3August ........................................ 131.0 137.6 NA 134.8Septemberc ................................ 130.5 137.6 147.1 135.8October ....................................... 129.9 137.1 147.0 135.3November ................................... 129.7 136.9 147.0 135.1December ................................... 129.3 136.5 146.8 134.8Average ..................................... 131.1 137.8 d 147.0 135.3
1982January ....................................... 128.5 135.8 146.6 134.1February ..................................... 126.0 133.4 144.8 131.8March .......................................... 120.6 128.4 140.8 126.8April ............................................ 114.8 122.5 135.1 121.0May ............................................. 116.6 123.7 135.5 122.4June ............................................ 124.2 130.9 141.8 129.6July ............................................. 126.3 133.1 144.3 131.8August ........................................ 125.4 132.3 143.9 131.0September .................................. 123.6 130.7 142.9 129.2October ....................................... 121.9 129.5 142.1 128.0November ................................... 120.7 128.3 141.2 126.8December ................................... 118.1 126.0 139.4 124.4Average ..................................... 122.2 129.6 141.5 128.1
See footnotes at end of table.
Energy Information Administration/Historical Monthly Energy Review 1973-1992260

Table 9.4 Motor Gasoline Retail Prices, U.S. City Average, 1973-1992 (Continued)
(Cents per Gallon, Including Taxes)
LeadedRegular
UnleadedRegular
UnleadedPremium All Typesa
1983January ....................................... 115.0 123.0 137.6 121.4February ..................................... 109.9 118.7 133.8 117.0March .......................................... 106.4 115.2 130.8 113.5April ............................................ 113.1 121.5 136.0 119.8May ............................................. 117.7 125.9 139.7 124.3June ............................................ 119.7 127.7 141.1 126.1July ............................................. 120.7 128.8 142.1 127.2August ........................................ 120.3 128.5 141.9 126.9September .................................. 118.9 127.4 141.0 125.7October ....................................... 117.2 125.5 139.5 123.9November ................................... 115.6 124.1 138.4 122.4December ................................... 114.6 123.1 137.6 121.5Average ..................................... 115.7 124.1 138.3 122.5
1984January ....................................... 113.1 121.6 136.9 120.0February ..................................... 112.5 120.9 136.1 119.3March .......................................... 112.5 121.0 136.2 119.4April ............................................ 114.5 122.7 137.5 121.1May ............................................. 115.4 123.6 138.0 122.1June ............................................ 114.7 122.9 137.7 121.4July ............................................. 112.9 121.2 137.0 119.7August ........................................ 111.6 119.6 135.5 118.4September .................................. 112.0 120.3 136.0 118.9October ....................................... 112.7 120.9 136.5 119.5November ................................... 112.4 120.7 136.4 119.3December ................................... 110.9 119.3 135.4 117.9Average ..................................... 112.9 121.2 136.6 119.8
1985January ....................................... 106.0 114.8 130.4 114.5February ..................................... 104.1 113.1 129.0 112.8March .......................................... 107.1 115.9 131.0 115.5April ............................................ 111.9 120.5 134.0 119.9May ............................................. 114.4 123.1 136.0 122.3June ............................................ 115.3 124.1 137.1 123.3July ............................................. 115.4 124.2 136.7 123.3August ........................................ 114.3 122.9 135.9 122.2September .................................. 112.9 121.6 134.9 120.9October ....................................... 111.7 120.4 134.2 119.8November ................................... 112.3 120.7 133.9 120.1December ................................... 112.3 120.8 134.4 120.3Average ..................................... 111.5 120.2 134.0 119.6
1986January ....................................... 110.7 119.4 133.6 119.0February ..................................... 103.4 112.0 128.2 111.9March .......................................... 89.4 98.1 116.0 98.3April ............................................ 81.5 88.8 106.1 89.5May ............................................. 85.2 92.3 107.5 92.7June ............................................ 88.5 95.5 110.0 95.8July ............................................. 82.2 89.0 104.5 89.5August ........................................ 77.8 84.3 99.9 84.8September .................................. 79.7 86.0 101.0 86.4October ....................................... 77.1 83.1 98.7 83.7November ................................... 76.2 82.1 98.0 82.7December ................................... 76.4 82.3 98.4 83.0Average ..................................... 85.7 92.7 108.5 93.1
1987January ....................................... 80.6 86.2 100.7 86.8February ..................................... 84.8 90.5 104.7 91.1March .......................................... 85.6 91.2 105.2 91.8April ............................................ 87.9 93.4 107.3 94.0May ............................................. 88.8 94.1 107.9 94.8June ............................................ 90.6 95.8 109.8 96.6July ............................................. 92.1 97.1 111.5 98.0August ........................................ 94.6 99.5 113.9 100.4September .................................. 94.0 99.0 113.6 100.0October ....................................... 93.1 97.6 112.8 98.8November ................................... 92.8 97.6 112.5 98.7December ................................... 91.2 96.1 111.9 97.5Average ..................................... 89.7 94.8 109.3 95.7
See footnotes at end of table.
Energy Information Administration/Historical Monthly Energy Review 1973-1992 261
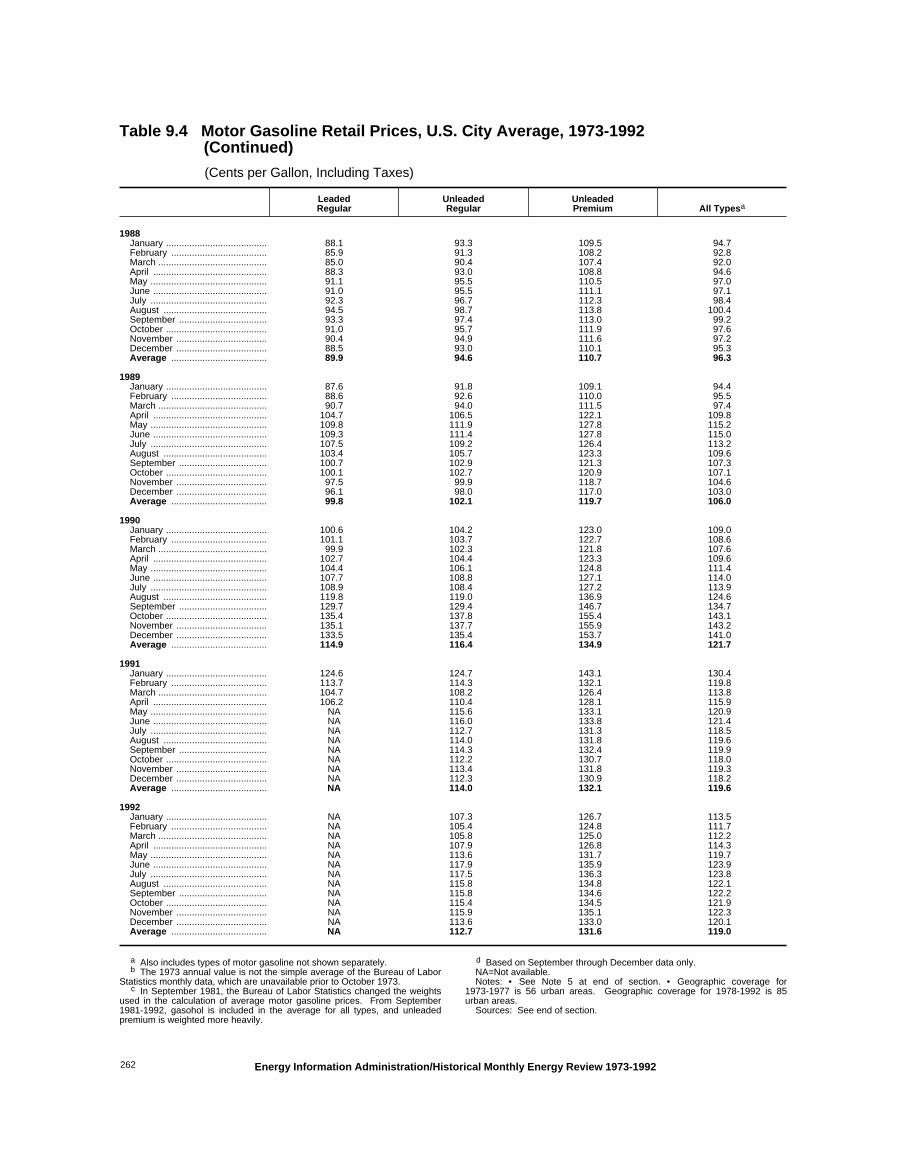
Table 9.4 Motor Gasoline Retail Prices, U.S. City Average, 1973-1992 (Continued)
(Cents per Gallon, Including Taxes)
LeadedRegular
UnleadedRegular
UnleadedPremium All Typesa
1988January ....................................... 88.1 93.3 109.5 94.7February ..................................... 85.9 91.3 108.2 92.8March .......................................... 85.0 90.4 107.4 92.0April ............................................ 88.3 93.0 108.8 94.6May ............................................. 91.1 95.5 110.5 97.0June ............................................ 91.0 95.5 111.1 97.1July ............................................. 92.3 96.7 112.3 98.4August ........................................ 94.5 98.7 113.8 100.4September .................................. 93.3 97.4 113.0 99.2October ....................................... 91.0 95.7 111.9 97.6November ................................... 90.4 94.9 111.6 97.2December ................................... 88.5 93.0 110.1 95.3Average ..................................... 89.9 94.6 110.7 96.3
1989January ....................................... 87.6 91.8 109.1 94.4February ..................................... 88.6 92.6 110.0 95.5March .......................................... 90.7 94.0 111.5 97.4April ............................................ 104.7 106.5 122.1 109.8May ............................................. 109.8 111.9 127.8 115.2June ............................................ 109.3 111.4 127.8 115.0July ............................................. 107.5 109.2 126.4 113.2August ........................................ 103.4 105.7 123.3 109.6September .................................. 100.7 102.9 121.3 107.3October ....................................... 100.1 102.7 120.9 107.1November ................................... 97.5 99.9 118.7 104.6December ................................... 96.1 98.0 117.0 103.0Average ..................................... 99.8 102.1 119.7 106.0
1990January ....................................... 100.6 104.2 123.0 109.0February ..................................... 101.1 103.7 122.7 108.6March .......................................... 99.9 102.3 121.8 107.6April ............................................ 102.7 104.4 123.3 109.6May ............................................. 104.4 106.1 124.8 111.4June ............................................ 107.7 108.8 127.1 114.0July ............................................. 108.9 108.4 127.2 113.9August ........................................ 119.8 119.0 136.9 124.6September .................................. 129.7 129.4 146.7 134.7October ....................................... 135.4 137.8 155.4 143.1November ................................... 135.1 137.7 155.9 143.2December ................................... 133.5 135.4 153.7 141.0Average ..................................... 114.9 116.4 134.9 121.7
1991January ....................................... 124.6 124.7 143.1 130.4February ..................................... 113.7 114.3 132.1 119.8March .......................................... 104.7 108.2 126.4 113.8April ............................................ 106.2 110.4 128.1 115.9May ............................................. NA 115.6 133.1 120.9June ............................................ NA 116.0 133.8 121.4July ............................................. NA 112.7 131.3 118.5August ........................................ NA 114.0 131.8 119.6September .................................. NA 114.3 132.4 119.9October ....................................... NA 112.2 130.7 118.0November ................................... NA 113.4 131.8 119.3December ................................... NA 112.3 130.9 118.2Average ..................................... NA 114.0 132.1 119.6
1992January ....................................... NA 107.3 126.7 113.5February ..................................... NA 105.4 124.8 111.7March .......................................... NA 105.8 125.0 112.2April ............................................ NA 107.9 126.8 114.3May ............................................. NA 113.6 131.7 119.7June ............................................ NA 117.9 135.9 123.9July ............................................. NA 117.5 136.3 123.8August ........................................ NA 115.8 134.8 122.1September .................................. NA 115.8 134.6 122.2October ....................................... NA 115.4 134.5 121.9November ................................... NA 115.9 135.1 122.3December ................................... NA 113.6 133.0 120.1Average ..................................... NA 112.7 131.6 119.0
a Also includes types of motor gasoline not shown separately.b The 1973 annual value is not the simple average of the Bureau of Labor
Statistics monthly data, which are unavailable prior to October 1973.c In September 1981, the Bureau of Labor Statistics changed the weights
used in the calculation of average motor gasoline prices. From September1981-1992, gasohol is included in the average for all types, and unleadedpremium is weighted more heavily.
d Based on September through December data only.NA=Not available. Notes: • See Note 5 at end of section. • Geographic coverage for
1973-1977 is 56 urban areas. Geographic coverage for 1978-1992 is 85urban areas.
Sources: See end of section.
Energy Information Administration/Historical Monthly Energy Review 1973-1992262

Table 9.5a Refiner Prices of Residual Fuel Oil: Wholesale and Retail, 1975-1982
(Cents per Gallon, Excluding Taxes)
Residual Fuel OilSulfur Content Less
Than or Equal to 0.3 Percent
Residual Fuel OilSulfur Content Greater
Than 0.3 Percent and LessThan or Equal to 1 Percent
Residual Fuel OilSulfur Content
Greater Than 1 Percent Average
Wholesale Retail Wholesale Retail Wholesale Retail Wholesale Retail
1975January ............... NA NA NA NA NA NA NA NAFebruary ............. NA NA NA NA NA NA NA NAMarch .................. NA NA NA NA NA NA NA NAApril .................... NA NA NA NA NA NA NA NAMay ..................... NA NA NA NA NA NA NA NAJune .................... NA NA NA NA NA NA NA NAJuly ..................... 27.5 30.6 26.0 28.7 24.4 25.2 25.4 27.9August ................ 27.5 31.5 25.8 29.4 23.1 25.1 25.0 28.3September .......... 28.0 30.8 25.3 27.7 23.5 25.0 25.0 27.4October ............... 27.4 30.9 24.7 28.8 23.2 24.7 24.5 27.8November ........... 29.1 30.9 24.6 28.6 23.6 24.6 24.9 27.8December ........... 28.3 30.6 24.7 28.2 23.0 24.0 24.4 27.2Average ............. NA NA NA NA NA NA NA NA
1976January ............... 28.9 29.5 25.3 27.6 22.8 24.4 25.1 27.0February ............. 29.6 30.4 25.9 28.2 23.1 24.6 25.5 27.4March .................. 29.4 30.5 26.3 28.1 22.8 24.3 25.6 27.2April .................... 27.2 29.4 25.9 28.0 22.7 24.5 24.7 27.2May ..................... 27.9 28.3 25.7 27.1 22.5 23.5 24.1 26.1June .................... 27.9 29.1 24.6 27.0 23.2 23.9 24.1 26.3July ..................... 27.9 28.9 24.3 27.0 23.4 23.9 24.4 26.3August ................ 28.2 29.3 24.9 27.3 22.9 24.3 24.3 26.7September .......... 28.2 29.8 24.6 27.5 23.9 24.5 24.6 26.9October ............... 28.5 30.6 26.4 28.5 23.8 25.5 25.6 28.1November ........... 29.5 31.3 27.5 29.1 24.8 26.2 26.6 28.5December ........... 31.4 31.6 28.1 30.4 26.3 27.3 28.3 29.6Average ............. 29.0 29.9 25.8 28.1 23.8 24.8 25.5 27.4
1977January ............... 33.5 34.1 30.5 32.6 27.4 29.3 29.6 31.7February ............. 33.3 34.8 30.7 33.5 28.7 30.3 30.2 32.6March .................. 33.3 34.7 32.1 34.5 27.7 30.2 30.2 33.0April .................... 30.7 34.8 31.1 33.6 26.8 29.8 28.7 32.4May ..................... 32.3 34.5 28.3 32.7 26.3 28.9 27.7 32.0June .................... 31.2 34.0 28.3 31.6 26.4 28.4 27.9 31.0July ..................... 31.7 34.2 27.9 31.2 26.2 28.7 27.7 31.0August ................ 31.7 33.7 28.2 31.1 28.3 28.6 28.7 31.0September .......... 31.8 34.1 28.1 31.2 28.0 29.0 28.6 30.8October ............... 31.9 34.0 27.8 31.3 27.9 29.4 28.8 31.3November ........... 30.6 33.9 27.8 30.8 27.2 28.9 28.0 30.9December ........... 30.6 33.2 27.1 30.0 25.6 28.5 26.9 30.2Average ............. 32.0 34.2 28.8 32.0 26.9 29.2 28.5 31.5
1978January ............... 30.3 33.8 27.5 30.2 25.5 28.6 27.0 30.5February ............. 29.0 33.5 27.7 29.6 25.2 28.0 26.8 29.8March .................. 30.3 33.3 28.4 30.4 25.0 27.9 27.0 30.1April .................... 30.3 34.5 29.2 30.8 25.8 28.2 27.5 30.6May ..................... 30.2 33.8 28.6 30.7 25.7 28.0 27.9 30.5June .................... 29.5 33.3 28.2 30.0 25.8 27.6 27.2 29.8July ..................... 26.8 33.2 26.9 28.6 25.0 27.3 25.9 29.1August ................ 27.2 33.5 26.8 28.5 24.9 27.5 25.5 29.4September .......... 29.3 33.8 27.3 29.3 25.5 27.1 26.8 29.6October ............... 32.0 34.8 28.7 31.0 25.8 28.1 28.0 31.0November ........... 33.6 37.0 31.6 32.8 25.9 27.5 29.4 31.8December ........... 34.9 38.0 31.4 33.6 26.3 28.1 29.9 32.7Average ............. 30.4 34.5 28.5 30.4 25.5 27.9 27.4 30.4
1979January ............... 36.1 38.4 32.6 35.2 26.2 28.4 30.4 33.6February ............. 38.4 41.1 35.7 36.4 26.9 29.2 32.7 35.0March .................. 38.3 43.0 37.9 40.3 32.1 33.3 35.3 38.0April .................... 42.4 45.5 38.9 41.5 32.6 34.7 36.9 39.5May ..................... 43.0 46.3 37.5 42.6 35.0 36.6 37.4 40.9June .................... 49.8 47.1 43.0 44.1 37.3 39.0 42.4 42.8July ..................... 52.0 54.9 50.6 48.7 39.6 42.5 45.7 47.4August ................ 50.1 53.9 46.4 50.7 42.2 43.6 45.2 48.4September .......... 51.9 54.6 50.0 51.6 41.7 45.1 46.7 49.8October ............... 56.7 55.5 54.7 53.2 43.6 46.5 49.7 51.4November ........... 63.5 60.8 57.3 57.9 46.0 46.5 52.4 54.3December ........... 64.5 66.1 61.5 59.5 49.7 50.1 56.1 58.2Average ............. 47.3 50.5 43.6 46.0 37.8 39.1 42.1 44.5
See footnotes at end of table.
Energy Information Administration/Historical Monthly Energy Review 1973-1992 263

Table 9.5a Refiner Prices of Residual Fuel Oil: Wholesale and Retail, 1975-1982 (Continued)
(Cents per Gallon, Excluding Taxes)
Residual Fuel OilSulfur Content Less
Than or Equal to 0.3 Percent
Residual Fuel OilSulfur Content Greater
Than 0.3 Percent and LessThan or Equal to 1 Percent
Residual Fuel OilSulfur Content
Greater Than 1 Percent Average
Wholesale Retail Wholesale Retail Wholesale Retail Wholesale Retail
1980January ............... 69.3 72.3 62.3 67.0 51.3 52.3 58.1 62.4February ............. 64.5 72.2 61.5 67.0 48.1 52.9 55.6 63.0March .................. 64.0 71.9 56.5 65.0 42.4 48.4 50.3 60.3April .................... 59.9 68.3 48.5 59.0 39.1 43.7 45.5 54.5May ..................... 60.7 75.5 54.1 61.4 42.2 43.0 48.1 56.5June .................... 55.1 74.7 53.2 60.6 42.2 45.9 48.7 57.4July ..................... 59.3 67.9 55.8 60.8 45.7 49.0 50.7 56.8August ................ 55.2 73.6 59.5 62.2 48.6 51.1 53.0 59.5September .......... 57.8 78.9 55.9 62.6 49.1 51.7 53.5 60.3October ............... 61.2 75.9 61.6 66.6 53.1 55.5 57.3 63.5November ........... 70.3 80.2 70.0 73.5 64.5 65.5 67.0 71.7December ........... 75.5 85.1 74.5 77.6 67.6 71.5 70.9 77.0Average ............. 62.9 74.1 59.3 65.7 49.5 52.6 55.1 62.1
1981January ............... 81.6 88.6 76.5 80.9 69.3 74.6 74.1 80.1February ............. 90.6 99.0 83.2 88.9 69.0 76.2 75.7 85.8March .................. 90.0 98.1 82.1 90.5 70.4 76.1 75.7 86.0April .................... 84.9 99.3 78.8 85.6 67.5 72.8 72.8 82.6May ..................... 80.0 97.8 77.5 85.6 68.5 73.0 72.4 81.2June .................... 66.7 91.2 63.6 77.1 60.3 64.7 61.8 73.9July ..................... 70.4 92.9 65.2 76.0 61.0 61.8 63.1 72.8August ................ 72.6 87.1 66.1 76.3 62.0 62.4 64.3 72.7September .......... 71.2 93.2 65.4 76.4 59.0 62.5 62.4 72.2October ............... 72.0 95.0 68.2 75.9 59.4 62.3 63.8 72.2November ........... 75.5 94.0 70.5 73.9 62.1 63.0 66.6 71.8December ........... 74.8 89.6 67.4 76.6 60.7 63.2 64.9 73.6Average ............. 78.5 93.6 72.8 80.2 64.5 68.0 68.7 77.4
1982January ............... 78.6 89.4 68.8 74.1 58.6 61.8 64.5 71.0February ............. 75.4 91.5 69.8 73.7 56.4 58.8 62.6 71.5March .................. 73.7 92.8 65.7 72.8 55.8 57.6 61.3 70.2April .................... 71.7 87.5 64.5 71.4 56.1 58.1 60.6 67.2May ..................... 72.3 90.4 66.4 71.5 59.9 61.8 63.1 68.9June .................... 66.6 92.7 67.3 73.5 60.4 63.2 63.4 70.5July ..................... 71.5 89.2 65.2 71.0 57.6 63.1 61.8 69.8August ................ 68.7 75.8 65.5 72.3 60.5 62.0 62.7 67.7September .......... 72.0 77.2 66.0 72.5 60.0 61.7 63.1 67.7October ............... 76.1 79.8 70.3 76.8 61.2 63.3 65.5 69.7November ........... 76.9 81.3 70.1 76.8 62.6 64.3 67.4 71.0December ........... 74.5 77.6 67.1 72.0 59.9 62.4 63.8 67.8Average ............. 73.6 86.5 67.3 73.1 59.0 61.5 63.2 69.2
NA=Not available. Notes: • Wholesale sales are those made to purchasers other than
ultimate consumers, as well as to bulk consumers (such as agriculture,industry, and electric utilities). Retail sales are those made directly toultimate consumers, but excluding bulk consumers (such as agriculture,
industry, and electric utilities). • Monthly prices were originally published indollars per barrel. • Annual averages are the averages of the monthly prices,weighted by volume. • Geographic coverage is the 50 States and the Districtof Columbia.
Sources: See end of section.
Energy Information Administration/Historical Monthly Energy Review 1973-1992264

Table 9.5b Refiner Prices of Residual Fuel Oil: Resale and End Users, 1978-1992
(Cents per Gallon, Excluding Taxes)
Residual Fuel OilSulfur Content Less
Than or Equal to 1 Percent
Residual Fuel OilSulfur Content
Greater Than 1 Percent Average
Sales forResale
Sales to End Users
Sales forResale
Sales to End Users
Sales forResale
Sales to End Users
1978January ....................... NA NA NA NA NA NAFebruary ..................... NA NA NA NA NA NAMarch .......................... NA NA NA NA NA NAApril ............................ NA NA NA NA NA NAMay ............................. NA NA NA NA NA NAJune ............................ NA NA NA NA NA NAJuly ............................. NA NA NA NA NA NAAugust ........................ NA NA NA NA NA NASeptember .................. NA NA NA NA NA NAOctober ....................... NA NA NA NA NA NANovember ................... NA NA NA NA NA NADecember ................... NA NA NA NA NA NAAverage ..................... 29.3 31.4 24.5 27.5 26.3 29.8
1979January ....................... NA NA NA NA NA NAFebruary ..................... NA NA NA NA NA NAMarch .......................... NA NA NA NA NA NAApril ............................ NA NA NA NA NA NAMay ............................. NA NA NA NA NA NAJune ............................ NA NA NA NA NA NAJuly ............................. NA NA NA NA NA NAAugust ........................ NA NA NA NA NA NASeptember .................. NA NA NA NA NA NAOctober ....................... NA NA NA NA NA NANovember ................... NA NA NA NA NA NADecember ................... NA NA NA NA NA NAAverage ..................... 45.0 46.8 36.6 38.9 39.9 43.6
1980January ....................... NA NA NA NA NA NAFebruary ..................... NA NA NA NA NA NAMarch .......................... NA NA NA NA NA NAApril ............................ NA NA NA NA NA NAMay ............................. NA NA NA NA NA NAJune ............................ NA NA NA NA NA NAJuly ............................. NA NA NA NA NA NAAugust ........................ NA NA NA NA NA NASeptember .................. NA NA NA NA NA NAOctober ....................... NA NA NA NA NA NANovember ................... NA NA NA NA NA NADecember ................... NA NA NA NA NA NAAverage ..................... 60.8 67.5 47.9 52.3 52.8 60.7
1981January ....................... NA NA NA NA NA NAFebruary ..................... NA NA NA NA NA NAMarch .......................... NA NA NA NA NA NAApril ............................ NA NA NA NA NA NAMay ............................. NA NA NA NA NA NAJune ............................ NA NA NA NA NA NAJuly ............................. NA NA NA NA NA NAAugust ........................ NA NA NA NA NA NASeptember .................. NA NA NA NA NA NAOctober ....................... NA NA NA NA NA NANovember ................... NA NA NA NA NA NADecember ................... NA NA NA NA NA NAAverage ..................... 74.8 82.9 62.2 67.3 66.3 75.6
1982January ....................... 71.8 77.7 57.0 60.7 62.0 68.8February ..................... 71.5 77.4 54.6 58.4 60.2 69.1March .......................... 68.4 75.6 54.1 57.1 59.1 67.4April ............................ 66.8 73.5 54.6 57.8 58.5 65.1May ............................. 68.4 74.0 58.0 61.5 61.0 66.7June ............................ 68.1 75.1 58.6 63.2 61.5 68.8July ............................. 67.9 72.7 56.3 62.9 60.1 68.1August ........................ 67.1 71.8 58.7 61.5 60.7 66.2September .................. 68.1 72.1 58.3 61.6 61.2 66.3October ....................... 72.6 75.9 59.5 62.9 63.5 68.1November ................... 72.6 76.3 60.7 64.1 65.3 70.0December ................... 69.2 72.0 58.2 61.9 61.7 66.4Average ..................... 69.5 74.7 57.2 61.1 61.2 67.6
See footnotes at end of table.
Energy Information Administration/Historical Monthly Energy Review 1973-1992 265

Table 9.5b Refiner Prices of Residual Fuel Oil: Resale and End Users, 1978-1992 (Continued)
(Cents per Gallon, Excluding Taxes)
Residual Fuel OilSulfur Content Less
Than or Equal to 1 Percent
Residual Fuel OilSulfur Content
Greater Than 1 Percent Average
Sales forResale
Sales to End Users
Sales forResale
Sales to End Users
Sales forResale
Sales to End Users
1983January ....................... 65.0 70.5 57.0 60.1 60.3 64.2February ..................... 63.0 66.0 55.7 58.5 58.5 62.0March .......................... 60.0 66.2 55.9 57.0 57.7 60.9April ............................ 60.1 64.3 56.5 58.7 57.7 61.0May ............................. 62.6 66.9 57.8 59.7 59.2 63.2June ............................ 63.2 69.2 58.5 60.1 60.2 64.7July ............................. 65.2 70.4 60.5 61.4 62.2 65.9August ........................ 66.7 71.6 62.0 63.2 63.8 67.7September .................. 67.0 72.6 63.3 65.3 64.6 69.0October ....................... 68.8 72.1 62.6 64.9 64.7 68.7November ................... 66.5 70.7 62.2 64.4 63.6 67.4December ................... 67.3 72.0 60.2 63.1 62.3 67.2Average ..................... 64.3 69.5 59.1 61.1 60.9 65.1
1984January ....................... 71.0 73.6 62.3 64.6 64.8 69.0February ..................... 71.4 75.1 65.7 65.8 67.5 70.4March .......................... 70.5 73.1 61.9 64.7 64.5 68.5April ............................ 69.2 73.1 64.7 66.5 66.2 69.1May ............................. 68.3 72.7 65.0 67.4 66.0 69.5June ............................ 69.8 73.2 66.1 68.9 67.2 71.0July ............................. 66.8 71.5 64.0 66.7 65.0 69.0August ........................ 65.6 69.5 62.7 65.0 63.6 67.1September .................. 65.9 70.0 63.8 64.9 64.5 67.5October ....................... 66.8 70.8 64.3 65.8 65.1 67.8November ................... 66.8 70.4 63.6 65.8 64.6 67.9December ................... 67.5 70.5 63.3 65.6 64.6 67.7Average ..................... 68.5 72.0 63.9 65.9 65.4 68.7
1985January ....................... 67.6 71.2 63.4 66.5 64.8 68.6February ..................... 67.6 71.1 63.4 66.0 65.0 68.6March .......................... 66.2 69.8 60.8 65.0 62.4 67.1April ............................ 63.0 67.5 58.8 61.9 60.3 64.1May ............................. 58.1 61.2 53.5 58.0 55.0 59.5June ............................ 54.9 59.9 50.6 52.7 52.4 55.6July ............................. 56.4 58.9 52.8 54.5 53.9 56.3August ........................ 55.2 57.1 52.0 53.8 53.2 55.6September .................. 60.1 62.8 53.1 54.8 56.1 58.6October ....................... 60.1 63.6 52.3 53.8 54.9 58.3November ................... 57.8 61.7 50.7 52.8 53.6 56.8December ................... 60.7 62.6 52.3 54.4 55.1 58.2Average ..................... 61.0 64.4 56.0 58.2 57.7 61.0
1986January ....................... 56.0 62.0 49.7 52.8 51.8 57.1February ..................... 43.0 49.0 36.5 42.7 38.7 45.8March .......................... 37.0 42.7 28.7 35.7 31.8 39.0April ............................ 31.0 36.8 26.0 30.1 28.0 33.0May ............................. 30.1 35.0 23.6 26.8 26.5 30.1June ............................ 29.9 32.3 23.1 26.8 26.2 29.8July ............................. 23.7 27.4 20.4 24.4 21.9 25.9August ........................ 26.5 29.3 21.7 23.2 23.4 26.5September .................. 29.7 31.5 26.6 28.2 28.1 29.8October ....................... 28.7 31.9 26.4 28.8 27.6 30.1November ................... 29.3 33.7 25.2 29.0 27.4 31.2December ................... 34.0 37.7 27.7 31.6 30.4 34.8Average ..................... 32.8 37.2 28.9 31.7 30.5 34.3
1987January ....................... 39.3 45.5 35.7 37.9 37.4 42.0February ..................... 40.0 43.8 34.4 38.3 37.1 41.2March .......................... 38.8 43.4 33.4 37.2 35.8 40.0April ............................ 39.7 43.9 35.5 39.9 37.1 42.0May ............................. 41.1 44.9 38.6 41.7 39.6 43.4June ............................ 43.7 45.8 40.6 43.5 42.0 44.8July ............................. 44.9 48.3 41.9 44.1 43.4 46.4August ........................ 44.6 46.0 41.4 44.0 42.9 45.0September .................. 41.4 44.0 36.8 39.7 39.1 41.7October ....................... 41.3 44.5 36.3 39.5 38.8 41.9November ................... 41.3 45.0 34.6 38.7 37.5 42.1December ................... 39.2 41.4 28.2 33.0 33.9 37.8Average ..................... 41.2 44.7 36.2 39.6 38.5 42.3
See footnotes at end of table.
Energy Information Administration/Historical Monthly Energy Review 1973-1992266
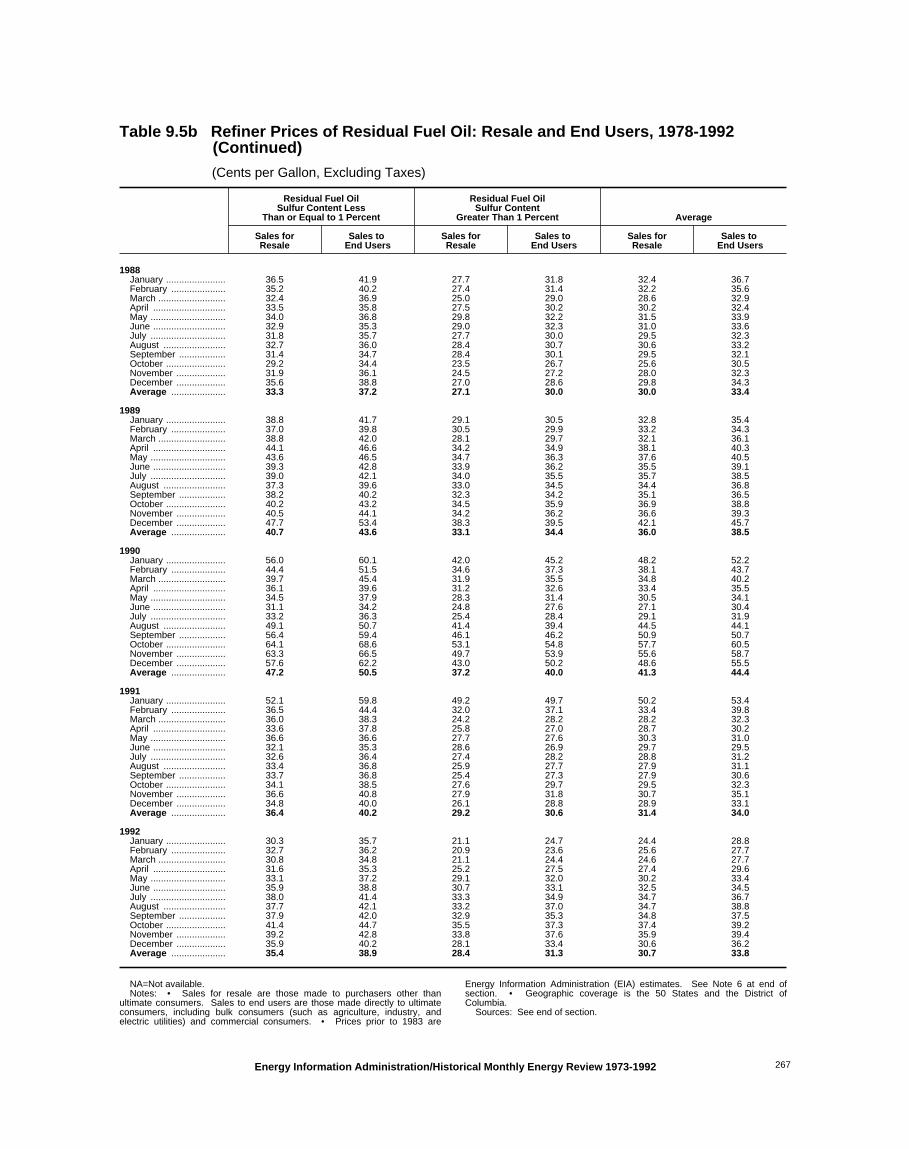
Table 9.5b Refiner Prices of Residual Fuel Oil: Resale and End Users, 1978-1992 (Continued)
(Cents per Gallon, Excluding Taxes)
Residual Fuel OilSulfur Content Less
Than or Equal to 1 Percent
Residual Fuel OilSulfur Content
Greater Than 1 Percent Average
Sales forResale
Sales to End Users
Sales forResale
Sales to End Users
Sales forResale
Sales to End Users
1988January ....................... 36.5 41.9 27.7 31.8 32.4 36.7February ..................... 35.2 40.2 27.4 31.4 32.2 35.6March .......................... 32.4 36.9 25.0 29.0 28.6 32.9April ............................ 33.5 35.8 27.5 30.2 30.2 32.4May ............................. 34.0 36.8 29.8 32.2 31.5 33.9June ............................ 32.9 35.3 29.0 32.3 31.0 33.6July ............................. 31.8 35.7 27.7 30.0 29.5 32.3August ........................ 32.7 36.0 28.4 30.7 30.6 33.2September .................. 31.4 34.7 28.4 30.1 29.5 32.1October ....................... 29.2 34.4 23.5 26.7 25.6 30.5November ................... 31.9 36.1 24.5 27.2 28.0 32.3December ................... 35.6 38.8 27.0 28.6 29.8 34.3Average ..................... 33.3 37.2 27.1 30.0 30.0 33.4
1989January ....................... 38.8 41.7 29.1 30.5 32.8 35.4February ..................... 37.0 39.8 30.5 29.9 33.2 34.3March .......................... 38.8 42.0 28.1 29.7 32.1 36.1April ............................ 44.1 46.6 34.2 34.9 38.1 40.3May ............................. 43.6 46.5 34.7 36.3 37.6 40.5June ............................ 39.3 42.8 33.9 36.2 35.5 39.1July ............................. 39.0 42.1 34.0 35.5 35.7 38.5August ........................ 37.3 39.6 33.0 34.5 34.4 36.8September .................. 38.2 40.2 32.3 34.2 35.1 36.5October ....................... 40.2 43.2 34.5 35.9 36.9 38.8November ................... 40.5 44.1 34.2 36.2 36.6 39.3December ................... 47.7 53.4 38.3 39.5 42.1 45.7Average ..................... 40.7 43.6 33.1 34.4 36.0 38.5
1990January ....................... 56.0 60.1 42.0 45.2 48.2 52.2February ..................... 44.4 51.5 34.6 37.3 38.1 43.7March .......................... 39.7 45.4 31.9 35.5 34.8 40.2April ............................ 36.1 39.6 31.2 32.6 33.4 35.5May ............................. 34.5 37.9 28.3 31.4 30.5 34.1June ............................ 31.1 34.2 24.8 27.6 27.1 30.4July ............................. 33.2 36.3 25.4 28.4 29.1 31.9August ........................ 49.1 50.7 41.4 39.4 44.5 44.1September .................. 56.4 59.4 46.1 46.2 50.9 50.7October ....................... 64.1 68.6 53.1 54.8 57.7 60.5November ................... 63.3 66.5 49.7 53.9 55.6 58.7December ................... 57.6 62.2 43.0 50.2 48.6 55.5Average ..................... 47.2 50.5 37.2 40.0 41.3 44.4
1991January ....................... 52.1 59.8 49.2 49.7 50.2 53.4February ..................... 36.5 44.4 32.0 37.1 33.4 39.8March .......................... 36.0 38.3 24.2 28.2 28.2 32.3April ............................ 33.6 37.8 25.8 27.0 28.7 30.2May ............................. 36.6 36.6 27.7 27.6 30.3 31.0June ............................ 32.1 35.3 28.6 26.9 29.7 29.5July ............................. 32.6 36.4 27.4 28.2 28.8 31.2August ........................ 33.4 36.8 25.9 27.7 27.9 31.1September .................. 33.7 36.8 25.4 27.3 27.9 30.6October ....................... 34.1 38.5 27.6 29.7 29.5 32.3November ................... 36.6 40.8 27.9 31.8 30.7 35.1December ................... 34.8 40.0 26.1 28.8 28.9 33.1Average ..................... 36.4 40.2 29.2 30.6 31.4 34.0
1992January ....................... 30.3 35.7 21.1 24.7 24.4 28.8February ..................... 32.7 36.2 20.9 23.6 25.6 27.7March .......................... 30.8 34.8 21.1 24.4 24.6 27.7April ............................ 31.6 35.3 25.2 27.5 27.4 29.6May ............................. 33.1 37.2 29.1 32.0 30.2 33.4June ............................ 35.9 38.8 30.7 33.1 32.5 34.5July ............................. 38.0 41.4 33.3 34.9 34.7 36.7August ........................ 37.7 42.1 33.2 37.0 34.7 38.8September .................. 37.9 42.0 32.9 35.3 34.8 37.5October ....................... 41.4 44.7 35.5 37.3 37.4 39.2November ................... 39.2 42.8 33.8 37.6 35.9 39.4December ................... 35.9 40.2 28.1 33.4 30.6 36.2Average ..................... 35.4 38.9 28.4 31.3 30.7 33.8
NA=Not available. Notes: • Sales for resale are those made to purchasers other than
ultimate consumers. Sales to end users are those made directly to ultimateconsumers, including bulk consumers (such as agriculture, industry, andelectric utilities) and commercial consumers. • Prices prior to 1983 are
Energy Information Administration (EIA) estimates. See Note 6 at end ofsection. • Geographic coverage is the 50 States and the District ofColumbia.
Sources: See end of section.
Energy Information Administration/Historical Monthly Energy Review 1973-1992 267

Table 9.6a Refiner Prices of Petroleum Products: Wholesale, 1975-1982
(Cents per Gallon, Excluding Taxes)
FinishedAviationGasoline
Kerosene-Type
Jet Fuel Kerosene
No. 2FuelOil
No. 2DieselFuel Propane
1975January ....................... NA NA NA NA NA NAFebruary ..................... NA NA NA NA NA NAMarch .......................... NA NA NA NA NA NAApril ............................ NA NA NA NA NA NAMay ............................. NA NA NA NA NA NAJune ............................ NA NA NA NA NA NAJuly ............................. 40.6 29.8 30.1 28.6 29.7 17.9August ........................ 41.3 32.1 30.6 29.4 30.1 18.8September .................. 41.2 31.5 30.9 30.0 30.7 19.8October ....................... 41.1 31.7 31.9 30.9 31.3 19.9November ................... 39.7 31.6 32.3 31.2 31.6 20.2December ................... 40.9 31.9 33.0 31.3 31.6 20.6Average ..................... NA NA NA NA NA 19.7
1976January ....................... 41.4 30.6 32.8 31.2 31.7 21.2February ..................... 41.2 31.1 32.6 31.2 31.7 21.0March .......................... 41.1 31.2 31.8 30.5 31.2 20.1April ............................ 41.2 31.9 31.2 30.0 31.1 19.4May ............................. 42.1 33.0 31.3 30.2 31.3 19.0June ............................ 42.6 32.1 31.4 30.5 31.7 19.5July ............................. 43.6 32.9 31.9 30.8 31.7 19.9August ........................ 43.7 32.1 31.7 31.0 32.0 20.2September .................. 43.6 32.5 32.6 31.1 32.1 20.6October ....................... 43.6 32.5 33.0 31.8 32.3 20.9November ................... 43.4 33.4 34.0 32.6 32.8 21.4December ................... 43.5 34.7 34.8 33.7 33.5 22.1Average ..................... 42.4 32.5 NA 32.6 31.9 20.6
1977January ....................... 43.4 34.6 36.0 34.8 34.3 22.9February ..................... 44.7 37.1 36.9 35.8 35.3 24.0March .......................... 45.0 35.9 37.1 36.1 35.9 23.7April ............................ 46.0 35.9 36.5 35.9 36.1 23.6May ............................. 46.6 36.3 36.6 35.8 36.5 24.5June ............................ 46.7 36.8 36.3 35.7 36.3 24.5July ............................. 47.0 37.1 36.1 35.7 36.2 24.9August ........................ 47.9 36.6 36.9 35.6 36.2 25.5September .................. 47.9 37.1 36.5 35.6 36.2 25.9October ....................... 48.1 37.3 38.0 35.9 36.5 26.8November ................... 48.3 37.9 37.7 36.4 36.7 26.5December ................... 47.8 37.2 38.6 36.7 36.6 26.7Average ..................... 46.7 36.7 37.0 36.9 36.1 25.0
1978January ....................... 47.8 37.9 39.1 38.1 36.6 27.0February ..................... 48.3 38.3 38.8 37.8 36.6 26.5March .......................... 49.1 37.8 38.6 37.6 36.7 25.6April ............................ 49.5 38.1 38.2 37.6 36.5 24.4May ............................. 50.1 38.3 38.2 37.6 36.6 23.7June ............................ 50.4 38.9 38.7 37.7 36.7 23.3July ............................. 51.4 39.0 37.7 37.7 36.4 23.0August ........................ 52.0 38.9 38.2 37.9 36.6 22.7September .................. 52.6 39.2 39.3 38.6 37.1 22.6October ....................... 52.5 39.7 40.1 39.6 37.7 22.5November ................... 53.4 40.2 41.5 40.5 38.6 22.1December ................... 53.2 40.6 42.2 41.3 39.2 22.1Average ..................... 51.0 38.9 39.4 38.7 37.1 24.0
1979January ....................... 54.1 42.2 42.9 42.1 39.7 22.4February ..................... 54.6 44.3 45.4 44.5 41.8 21.8March .......................... 56.6 54.8 49.7 47.0 44.5 21.2April ............................ 58.2 60.1 56.6 49.3 47.7 22.0May ............................. 60.6 58.1 61.4 52.6 53.4 24.2June ............................ 64.8 59.9 74.1 56.9 58.7 27.9July ............................. 70.0 67.1 74.0 61.1 62.4 29.3August ........................ 74.2 71.4 70.7 64.6 66.0 30.8September .................. 78.2 73.1 73.3 67.8 69.0 33.3October ....................... 79.8 80.6 72.9 68.1 71.1 35.2November ................... 81.3 83.4 74.4 69.0 70.3 37.6December ................... 84.1 83.2 74.6 70.8 73.0 40.4Average ..................... 68.5 66.5 60.8 53.0 58.2 29.5
See footnotes at end of table.
Energy Information Administration/Historical Monthly Energy Review 1973-1992268

Table 9.6a Refiner Prices of Petroleum Products: Wholesale, 1975-1982 (Continued)
(Cents per Gallon, Excluding Taxes)
FinishedAviationGasoline
Kerosene-Type
Jet Fuel Kerosene
No. 2FuelOil
No. 2DieselFuel Propane
1980January ....................... 90.6 83.4 77.3 75.2 76.0 41.8February ..................... 98.5 86.2 81.3 79.0 78.3 42.7March .......................... 102.9 86.4 83.4 80.4 79.8 41.0April ............................ 104.8 88.4 84.2 81.0 80.4 41.2May ............................. 106.2 89.0 85.2 81.4 80.5 41.7June ............................ 107.7 86.1 85.1 82.5 81.7 41.2July ............................. 109.3 88.3 81.7 83.0 81.9 40.8August ........................ 110.2 86.2 81.9 82.9 81.6 40.6September .................. 110.8 86.4 82.9 83.0 80.3 41.4October ....................... 110.9 87.6 85.7 83.7 81.5 43.2November ................... 112.4 89.9 89.0 86.1 83.6 45.1December ................... 115.1 91.4 93.2 91.3 87.5 46.5Average ..................... 107.2 87.5 84.2 82.2 81.2 42.4
1981January ....................... 118.9 97.1 100.0 98.6 92.5 46.5February ..................... 121.3 103.6 108.0 106.0 99.5 48.2March .......................... 127.2 104.8 108.9 106.3 101.7 48.3April ............................ 117.5 103.8 105.7 105.2 101.3 49.3May ............................. 120.7 104.4 103.4 104.0 100.8 48.6June ............................ 116.5 102.3 101.8 103.0 99.5 46.0July ............................. 120.1 100.5 101.0 102.7 98.8 46.0August ........................ 120.0 101.4 101.7 102.2 97.8 47.2September .................. 121.0 103.0 101.3 101.6 97.6 47.7October ....................... 117.2 99.9 103.0 101.1 97.4 47.3November ................... 114.4 101.9 105.0 102.3 98.3 47.5December ................... 116.8 101.9 105.8 102.6 98.3 45.5Average ..................... 118.8 102.0 103.9 102.6 98.5 47.2
1982January ....................... 122.4 101.3 105.8 101.5 98.0 43.1February ..................... 122.0 100.0 103.6 98.3 94.8 38.3March .......................... 117.0 97.6 97.4 91.3 90.2 35.7April ............................ 113.4 93.0 92.7 90.0 86.6 34.9May ............................. 109.6 91.7 93.1 95.1 89.1 35.4June ............................ 114.7 94.1 95.0 98.5 93.5 36.9July ............................. 120.4 94.3 94.6 98.6 93.4 39.7August ........................ 117.7 95.0 94.5 96.7 92.3 43.8September .................. 115.7 95.5 98.1 97.7 92.4 49.5October ....................... 116.6 98.4 103.0 102.0 95.7 51.0November ................... 118.4 98.2 102.7 101.5 97.3 53.2December ................... 119.6 93.7 95.7 95.9 91.2 49.5Average ..................... 116.7 96.1 99.2 97.4 92.7 43.3
NA=Not available. Notes: • Wholesale sales are those made to purchasers other than
ultimate consumers, as well as to bulk consumers (such as agriculture,industry, and electric utilities). • Annual averages are the averages of the
monthly prices, weighted by volume. • Geographic coverage is the 50 Statesand the District of Columbia.
Sources: See end of section.
Energy Information Administration/Historical Monthly Energy Review 1973-1992 269

Table 9.6b Refiner Prices of Petroleum Products for Resale, 1978-1992
(Cents per Gallon, Excluding Taxes)
FinishedMotor
Gasolinea
FinishedAviationGasoline
Kerosene-Type
Jet Fuel Kerosene
No. 2FuelOil
No. 2DieselFuel
Propane(Consumer
Grade)
1978January ............................. NA NA NA NA NA NA NAFebruary ........................... NA NA NA NA NA NA NAMarch ................................ NA NA NA NA NA NA NAApril .................................. NA NA NA NA NA NA NAMay ................................... NA NA NA NA NA NA NAJune .................................. NA NA NA NA NA NA NAJuly ................................... NA NA NA NA NA NA NAAugust .............................. NA NA NA NA NA NA NASeptember ........................ NA NA NA NA NA NA NAOctober ............................. NA NA NA NA NA NA NANovember ......................... NA NA NA NA NA NA NADecember ......................... NA NA NA NA NA NA NAAverage ........................... 43.4 53.7 38.6 40.4 36.9 36.5 23.7
1979January ............................. NA NA NA NA NA NA NAFebruary ........................... NA NA NA NA NA NA NAMarch ................................ NA NA NA NA NA NA NAApril .................................. NA NA NA NA NA NA NAMay ................................... NA NA NA NA NA NA NAJune .................................. NA NA NA NA NA NA NAJuly ................................... NA NA NA NA NA NA NAAugust .............................. NA NA NA NA NA NA NASeptember ........................ NA NA NA NA NA NA NAOctober ............................. NA NA NA NA NA NA NANovember ......................... NA NA NA NA NA NA NADecember ......................... NA NA NA NA NA NA NAAverage ........................... 63.7 72.1 66.0 62.4 56.9 57.4 29.1
1980January ............................. NA NA NA NA NA NA NAFebruary ........................... NA NA NA NA NA NA NAMarch ................................ NA NA NA NA NA NA NAApril .................................. NA NA NA NA NA NA NAMay ................................... NA NA NA NA NA NA NAJune .................................. NA NA NA NA NA NA NAJuly ................................... NA NA NA NA NA NA NAAugust .............................. NA NA NA NA NA NA NASeptember ........................ NA NA NA NA NA NA NAOctober ............................. NA NA NA NA NA NA NANovember ......................... NA NA NA NA NA NA NADecember ......................... NA NA NA NA NA NA NAAverage ........................... 94.1 112.8 86.8 86.4 80.3 80.1 41.5
1981January ............................. NA NA NA NA NA NA NAFebruary ........................... NA NA NA NA NA NA NAMarch ................................ NA NA NA NA NA NA NAApril .................................. NA NA NA NA NA NA NAMay ................................... NA NA NA NA NA NA NAJune .................................. NA NA NA NA NA NA NAJuly ................................... NA NA NA NA NA NA NAAugust .............................. NA NA NA NA NA NA NASeptember ........................ NA NA NA NA NA NA NAOctober ............................. NA NA NA NA NA NA NANovember ......................... NA NA NA NA NA NA NADecember ......................... NA NA NA NA NA NA NAAverage ........................... 106.4 125.0 101.2 106.6 97.6 97.2 46.6
1982January ............................. 102.3 128.8 100.5 108.5 98.0 96.7 42.4February ........................... 98.9 128.4 99.2 106.3 93.9 93.5 37.8March ................................ 92.6 123.1 96.8 99.9 86.6 89.0 35.3April .................................. 89.6 119.3 92.2 95.1 83.3 85.4 34.4May ................................... 94.1 115.3 91.0 95.5 86.5 87.9 34.9June .................................. 100.5 120.7 93.3 97.4 89.8 92.2 36.4July ................................... 101.7 126.7 93.5 97.0 91.0 92.1 39.2August .............................. 101.0 123.9 94.2 96.9 90.3 91.0 43.2September ........................ 99.6 121.8 94.7 100.6 92.0 91.1 48.8October ............................. 98.4 122.7 97.6 105.7 96.5 94.4 50.4November ......................... 96.4 124.6 97.3 105.3 97.3 96.1 52.5December ......................... 92.4 125.9 92.9 98.2 89.5 90.0 48.9Average ........................... 97.3 122.8 95.3 101.8 91.4 91.4 42.7
See footnotes at end of table.
Energy Information Administration/Historical Monthly Energy Review 1973-1992270

Table 9.6b Refiner Prices of Petroleum Products for Resale, 1978-1992 (Continued)
(Cents per Gallon, Excluding Taxes)
FinishedMotor
Gasolinea
FinishedAviationGasoline
Kerosene-Type
Jet Fuel Kerosene
No. 2FuelOil
No. 2DieselFuel
Propane(Consumer
Grade)
1983January ............................. 88.5 124.8 91.8 94.2 85.7 85.5 47.0February ........................... 85.4 123.7 89.9 90.0 80.1 80.7 46.7March ................................ 82.9 121.2 84.5 83.1 76.0 75.2 47.4April .................................. 86.5 120.0 82.9 84.2 78.9 76.8 50.0May ................................... 90.4 120.2 84.3 87.7 80.9 80.2 50.5June .................................. 91.5 115.0 84.1 84.6 80.9 80.3 50.9July ................................... 92.3 115.2 84.8 85.2 81.7 80.8 50.7August .............................. 91.5 114.7 85.4 86.7 83.4 81.7 49.8September ........................ 90.2 113.7 86.3 91.9 85.1 83.5 50.1October ............................. 88.1 118.9 86.4 90.8 83.5 83.0 49.9November ......................... 86.6 118.7 84.4 90.4 82.6 82.0 47.3December ......................... 83.8 118.8 83.6 88.6 80.7 80.1 45.4Average ........................... 88.2 117.8 85.4 89.2 81.5 80.8 48.4
1984January ............................. 83.2 116.7 86.4 95.9 87.5 82.6 47.7February ........................... 83.8 116.5 86.5 100.4 89.2 84.5 47.4March ................................ 84.7 117.1 84.6 91.5 81.3 81.0 45.3April .................................. 86.9 116.8 84.2 90.7 82.8 80.8 44.6May ................................... 86.6 117.1 84.3 90.9 83.2 81.9 44.4June .................................. 84.5 116.8 84.2 88.1 82.4 81.9 44.1July ................................... 81.7 117.2 82.8 87.6 79.4 79.3 42.3August .............................. 81.1 116.7 81.0 86.0 77.8 77.7 43.2September ........................ 82.8 116.8 81.7 88.8 80.0 78.4 44.8October ............................. 83.6 116.4 82.9 88.9 80.8 80.0 46.1November ......................... 81.9 114.8 81.4 88.0 79.4 79.0 45.6December ......................... 78.0 114.0 80.1 86.4 77.1 77.0 43.0Average ........................... 83.2 116.5 83.0 91.6 82.1 80.3 45.0
1985January ............................. 75.2 114.5 79.6 85.8 75.7 74.9 40.1February ........................... 76.4 114.0 79.5 86.5 75.2 74.2 39.3March ................................ 81.1 113.6 78.9 85.7 76.1 75.6 38.0April .................................. 86.0 112.6 79.4 84.7 79.3 79.2 37.9May ................................... 87.5 113.2 78.2 80.4 76.5 78.9 38.1June .................................. 87.7 113.7 76.1 75.9 72.9 75.5 37.0July ................................... 87.3 113.6 75.2 76.9 70.3 72.3 36.3August .............................. 85.0 113.3 76.8 79.7 72.1 72.5 36.5September ........................ 83.2 113.0 79.2 85.9 77.0 76.3 37.6October ............................. 83.1 113.0 81.6 90.1 81.7 80.5 39.7November ......................... 84.7 112.6 83.6 93.6 84.9 84.3 43.0December ......................... 83.0 108.1 83.1 92.7 83.2 82.1 46.8Average ........................... 83.5 113.0 79.4 87.4 77.6 77.2 39.8
1986January ............................. 76.7 111.0 77.9 83.8 73.6 73.3 44.0February ........................... 65.1 108.9 67.7 67.1 56.4 56.1 35.4March ................................ 52.4 105.1 58.6 60.8 51.9 47.4 29.2April .................................. 51.8 97.8 50.0 52.2 45.9 46.3 27.3May ................................... 57.9 95.6 47.5 50.1 45.2 44.2 28.5June .................................. 54.4 91.7 44.5 49.3 40.0 39.6 28.3July ................................... 45.7 86.3 40.1 41.1 34.8 34.0 25.3August .............................. 47.9 83.7 39.8 47.8 40.0 38.8 24.6September ........................ 48.6 81.6 42.5 49.1 41.6 41.8 24.8October ............................. 46.1 82.9 43.4 47.9 41.0 40.9 25.1November ......................... 47.1 81.7 43.7 51.3 42.4 41.9 24.3December ......................... 47.4 81.4 45.2 53.4 44.2 43.4 23.6Average ........................... 53.1 91.2 49.5 60.6 48.6 45.2 29.0
1987January ............................. 53.3 82.9 49.0 59.2 50.6 49.5 25.0February ........................... 55.1 84.9 49.7 56.6 49.3 49.6 24.4March ................................ 56.3 83.6 49.1 54.2 49.0 48.7 23.6April .................................. 57.8 84.1 50.2 55.6 49.4 49.7 24.4May ................................... 59.5 85.2 51.6 55.6 51.5 52.1 24.0June .................................. 60.8 86.9 52.7 55.4 52.6 53.1 23.6July ................................... 62.5 86.6 55.3 57.0 54.9 55.1 24.4August .............................. 63.6 86.9 57.0 59.0 55.1 57.1 25.6September ........................ 60.6 86.8 55.9 58.6 53.3 56.0 26.1October ............................. 60.5 86.9 58.0 62.7 56.7 58.1 26.8November ......................... 59.9 87.2 58.6 63.5 57.0 57.9 27.1December ......................... 55.3 86.3 55.6 60.7 54.2 53.8 26.0Average ........................... 58.9 85.9 53.8 59.2 52.7 53.4 25.2
See footnotes at end of table.
Energy Information Administration/Historical Monthly Energy Review 1973-1992 271

Table 9.6b Refiner Prices of Petroleum Products for Resale, 1978-1992 (Continued)
(Cents per Gallon, Excluding Taxes)
FinishedMotor
Gasolinea
FinishedAviationGasoline
Kerosene-Type
Jet Fuel Kerosene
No. 2FuelOil
No. 2DieselFuel
Propane(Consumer
Grade)
1988January ............................. 53.4 85.9 53.2 59.2 52.0 51.0 26.8February ........................... 53.8 84.2 52.4 57.1 48.9 49.0 26.6March ................................ 53.9 84.2 50.4 54.3 47.6 49.2 25.6April .................................. 58.6 84.2 50.4 54.2 50.7 51.9 25.2May ................................... 59.9 85.0 51.4 53.3 50.1 51.3 24.9June .................................. 59.3 85.1 51.0 50.0 46.6 47.9 24.3July ................................... 62.4 86.1 47.5 48.3 43.3 44.0 21.8August .............................. 61.4 86.7 47.9 48.9 44.3 45.0 22.1September ........................ 58.0 85.7 46.9 49.8 43.3 44.7 22.5October ............................. 57.3 83.8 45.2 49.4 41.9 42.0 22.1November ......................... 58.1 83.5 46.4 52.8 45.1 44.6 22.1December ......................... 54.9 83.7 50.1 57.8 49.9 48.0 22.9Average ........................... 57.7 85.0 49.5 54.9 47.3 47.3 24.0
1989January ............................. 56.3 84.8 56.2 63.1 53.2 51.1 24.0February ........................... 57.4 86.0 55.4 59.5 51.1 52.8 22.7March ................................ 61.2 86.6 56.5 61.3 54.4 56.0 22.5April .................................. 74.0 94.2 59.5 60.3 56.5 59.5 22.7May ................................... 76.3 101.8 56.6 55.9 52.6 54.0 22.1June .................................. 73.8 101.3 54.4 53.8 49.6 50.8 21.4July ................................... 69.0 100.9 53.5 57.0 50.4 50.5 20.7August .............................. 62.7 97.7 54.5 59.9 51.2 52.4 21.7September ........................ 65.7 96.2 58.6 63.6 56.4 58.5 23.1October ............................. 64.2 93.3 63.2 67.5 60.1 62.2 24.4November ......................... 61.4 92.5 63.4 68.5 60.4 62.0 24.3December ......................... 61.6 92.8 67.3 81.7 72.8 68.4 36.4Average ........................... 65.4 95.0 58.3 66.9 56.5 56.7 24.7
1990January ............................. 69.2 96.8 76.6 87.1 73.8 69.3 54.4February ........................... 67.2 95.0 66.7 67.9 57.8 57.1 34.1March ................................ 66.3 93.8 61.6 64.8 57.9 57.6 27.1April .................................. 69.7 96.4 59.5 62.4 57.4 57.6 25.2May ................................... 72.7 97.4 57.1 59.2 54.5 55.4 24.0June .................................. 72.3 99.5 54.6 53.9 49.4 50.5 24.9July ................................... 70.6 100.2 55.5 57.1 51.9 52.0 27.3August .............................. 85.5 110.4 71.4 80.7 72.1 73.7 36.3September ........................ 94.9 122.2 92.9 100.4 85.3 87.2 43.5October ............................. 98.6 127.9 114.7 115.7 95.0 99.4 53.5November ......................... 95.4 126.2 107.0 106.6 90.6 93.6 50.5December ......................... 80.2 116.1 90.1 92.6 80.9 79.8 44.6Average ........................... 78.6 106.3 77.3 83.9 69.7 69.4 38.6
1991January ............................. 76.2 111.2 82.0 88.0 76.6 75.5 42.2February ........................... 68.0 104.2 74.0 76.1 67.9 67.4 31.6March ................................ 67.3 97.4 62.4 66.2 59.6 57.7 31.3April .................................. 70.7 97.8 58.9 63.0 57.2 57.4 31.8May ................................... 74.2 100.3 60.8 61.4 56.0 57.2 31.9June .................................. 70.5 99.5 58.8 59.0 54.0 54.5 29.3July ................................... 69.1 98.9 59.4 62.6 56.7 57.1 27.6August .............................. 72.7 100.2 63.3 67.1 60.6 61.9 29.6September ........................ 69.1 99.9 65.9 68.9 62.1 62.9 34.9October ............................. 68.8 98.8 67.1 73.5 66.3 65.6 40.2November ......................... 69.9 99.5 68.2 74.6 66.6 66.5 43.0December ......................... 62.9 97.3 60.1 62.6 55.9 55.6 37.7Average ........................... 69.9 100.1 65.0 72.2 62.2 61.5 34.9
1992January ............................. 60.0 94.9 53.9 59.9 51.9 51.4 30.9February ........................... 61.7 93.1 55.2 62.0 54.0 54.1 30.2March ................................ 62.7 92.5 54.6 59.1 53.7 54.0 29.5April .................................. 66.6 96.4 56.9 61.6 56.5 57.0 29.0May ................................... 71.5 100.5 60.8 62.1 58.8 60.1 29.4June .................................. 74.2 101.5 63.3 63.7 61.7 62.7 31.6July ................................... 71.0 102.0 64.8 65.7 61.3 61.8 31.5August .............................. 70.6 102.6 63.9 64.2 60.1 60.4 32.9September ........................ 71.0 102.3 64.3 68.8 62.7 63.3 35.4October ............................. 70.4 100.5 66.0 70.1 64.6 65.5 36.6November ......................... 68.1 99.7 61.5 64.5 58.8 60.4 36.2December ......................... 63.8 97.6 58.9 62.8 55.7 56.4 36.3Average ........................... 67.7 99.1 60.4 63.2 57.9 59.0 32.8
a See Note 5 at end of section.NA=Not available. Notes: • Sales for resale are those made to purchasers other than
ultimate consumers. Sales to end users are those made directly to ultimateconsumers, including bulk consumers (such as agriculture, industry, and
electric utilities) and residential and commercial consumers. • Prices prior to1983 are Energy Information Administration (EIA) estimates. See Note 6 atend of section. • Geographic coverage is the 50 States and the District ofColumbia.
Sources: See end of section.
Energy Information Administration/Historical Monthly Energy Review 1973-1992272
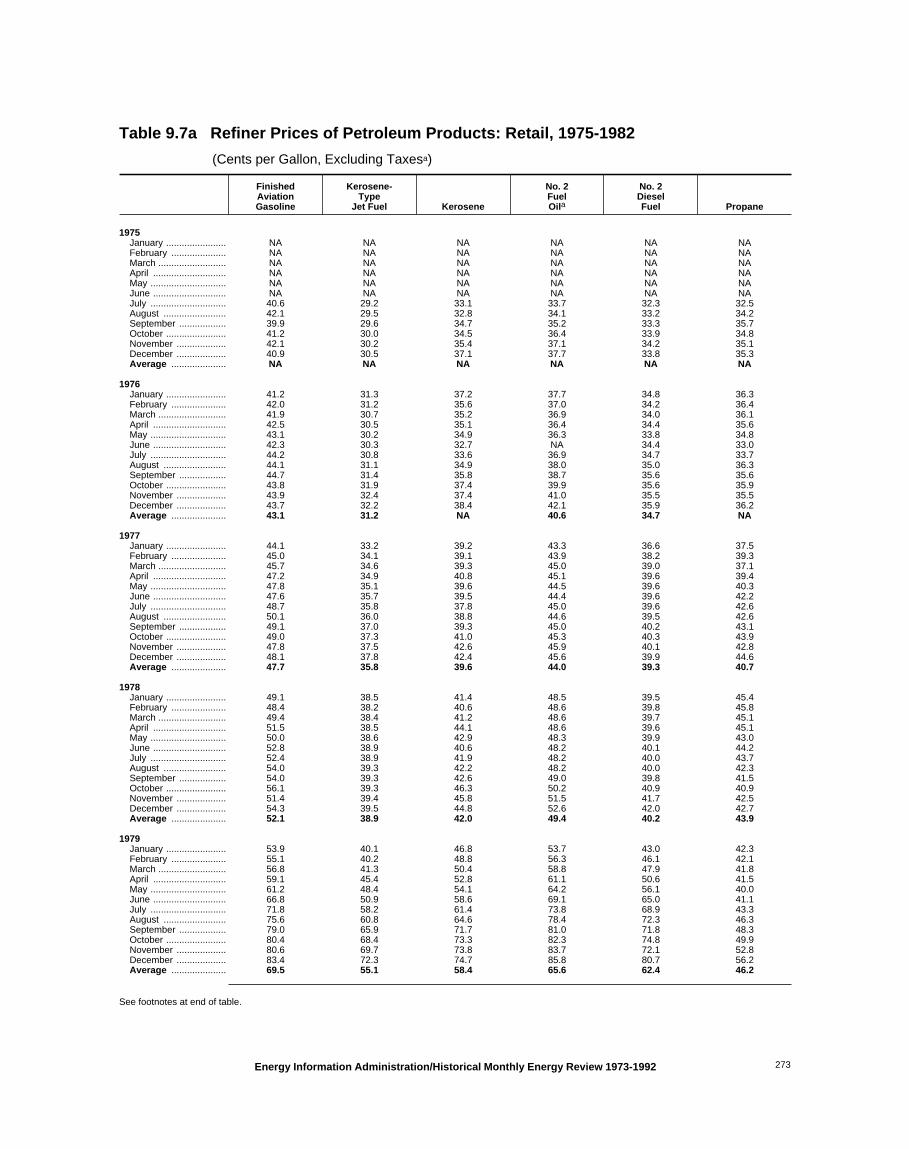
Table 9.7a Refiner Prices of Petroleum Products: Retail, 1975-1982
(Cents per Gallon, Excluding Taxesa)
FinishedAviationGasoline
Kerosene-Type
Jet Fuel Kerosene
No. 2FuelOila
No. 2DieselFuel Propane
1975January ....................... NA NA NA NA NA NAFebruary ..................... NA NA NA NA NA NAMarch .......................... NA NA NA NA NA NAApril ............................ NA NA NA NA NA NAMay ............................. NA NA NA NA NA NAJune ............................ NA NA NA NA NA NAJuly ............................. 40.6 29.2 33.1 33.7 32.3 32.5August ........................ 42.1 29.5 32.8 34.1 33.2 34.2September .................. 39.9 29.6 34.7 35.2 33.3 35.7October ....................... 41.2 30.0 34.5 36.4 33.9 34.8November ................... 42.1 30.2 35.4 37.1 34.2 35.1December ................... 40.9 30.5 37.1 37.7 33.8 35.3Average ..................... NA NA NA NA NA NA
1976January ....................... 41.2 31.3 37.2 37.7 34.8 36.3February ..................... 42.0 31.2 35.6 37.0 34.2 36.4March .......................... 41.9 30.7 35.2 36.9 34.0 36.1April ............................ 42.5 30.5 35.1 36.4 34.4 35.6May ............................. 43.1 30.2 34.9 36.3 33.8 34.8June ............................ 42.3 30.3 32.7 NA 34.4 33.0July ............................. 44.2 30.8 33.6 36.9 34.7 33.7August ........................ 44.1 31.1 34.9 38.0 35.0 36.3September .................. 44.7 31.4 35.8 38.7 35.6 35.6October ....................... 43.8 31.9 37.4 39.9 35.6 35.9November ................... 43.9 32.4 37.4 41.0 35.5 35.5December ................... 43.7 32.2 38.4 42.1 35.9 36.2Average ..................... 43.1 31.2 NA 40.6 34.7 NA
1977January ....................... 44.1 33.2 39.2 43.3 36.6 37.5February ..................... 45.0 34.1 39.1 43.9 38.2 39.3March .......................... 45.7 34.6 39.3 45.0 39.0 37.1April ............................ 47.2 34.9 40.8 45.1 39.6 39.4May ............................. 47.8 35.1 39.6 44.5 39.6 40.3June ............................ 47.6 35.7 39.5 44.4 39.6 42.2July ............................. 48.7 35.8 37.8 45.0 39.6 42.6August ........................ 50.1 36.0 38.8 44.6 39.5 42.6September .................. 49.1 37.0 39.3 45.0 40.2 43.1October ....................... 49.0 37.3 41.0 45.3 40.3 43.9November ................... 47.8 37.5 42.6 45.9 40.1 42.8December ................... 48.1 37.8 42.4 45.6 39.9 44.6Average ..................... 47.7 35.8 39.6 44.0 39.3 40.7
1978January ....................... 49.1 38.5 41.4 48.5 39.5 45.4February ..................... 48.4 38.2 40.6 48.6 39.8 45.8March .......................... 49.4 38.4 41.2 48.6 39.7 45.1April ............................ 51.5 38.5 44.1 48.6 39.6 45.1May ............................. 50.0 38.6 42.9 48.3 39.9 43.0June ............................ 52.8 38.9 40.6 48.2 40.1 44.2July ............................. 52.4 38.9 41.9 48.2 40.0 43.7August ........................ 54.0 39.3 42.2 48.2 40.0 42.3September .................. 54.0 39.3 42.6 49.0 39.8 41.5October ....................... 56.1 39.3 46.3 50.2 40.9 40.9November ................... 51.4 39.4 45.8 51.5 41.7 42.5December ................... 54.3 39.5 44.8 52.6 42.0 42.7Average ..................... 52.1 38.9 42.0 49.4 40.2 43.9
1979January ....................... 53.9 40.1 46.8 53.7 43.0 42.3February ..................... 55.1 40.2 48.8 56.3 46.1 42.1March .......................... 56.8 41.3 50.4 58.8 47.9 41.8April ............................ 59.1 45.4 52.8 61.1 50.6 41.5May ............................. 61.2 48.4 54.1 64.2 56.1 40.0June ............................ 66.8 50.9 58.6 69.1 65.0 41.1July ............................. 71.8 58.2 61.4 73.8 68.9 43.3August ........................ 75.6 60.8 64.6 78.4 72.3 46.3September .................. 79.0 65.9 71.7 81.0 71.8 48.3October ....................... 80.4 68.4 73.3 82.3 74.8 49.9November ................... 80.6 69.7 73.8 83.7 72.1 52.8December ................... 83.4 72.3 74.7 85.8 80.7 56.2Average ..................... 69.5 55.1 58.4 65.6 62.4 46.2
See footnotes at end of table.
Energy Information Administration/Historical Monthly Energy Review 1973-1992 273

Table 9.7a Refiner Prices of Petroleum Products: Retail, 1975-1982 (Continued)
(Cents per Gallon, Excluding Taxesa)
FinishedAviationGasoline
Kerosene-Type
Jet Fuel Kerosene
No. 2FuelOila
No. 2DieselFuel Propane
1980January ....................... 90.0 77.0 79.1 90.8 82.2 57.7February ..................... 97.8 83.0 83.6 95.3 85.0 61.1March .......................... 107.0 86.3 89.1 97.1 87.8 62.0April ............................ 109.6 87.4 88.8 97.4 88.0 60.4May ............................. 109.7 87.6 89.2 97.2 87.8 60.6June ............................ 111.4 88.6 90.3 97.9 88.6 61.6July ............................. 113.4 89.7 88.8 97.9 87.6 62.5August ........................ 112.9 90.7 88.9 97.9 86.9 61.8September .................. 113.4 88.8 91.0 98.1 86.6 62.0October ....................... 113.0 88.7 91.8 98.7 85.9 62.0November ................... 113.0 91.0 97.6 101.1 88.9 65.4December ................... 117.2 91.6 102.3 106.5 92.4 68.4Average ..................... 109.4 87.4 90.1 97.8 87.3 62.4
1981January ....................... 121.6 95.7 106.6 114.4 100.9 69.7February ..................... 128.1 101.6 118.3 123.4 106.1 70.6March .......................... 131.1 106.3 119.1 125.5 108.8 72.0April ............................ 131.3 106.4 117.8 123.9 107.7 72.5May ............................. 133.5 106.2 113.7 122.7 106.8 72.9June ............................ 132.1 104.8 111.1 120.9 106.6 73.1July ............................. 133.4 103.8 110.3 121.0 103.8 71.6August ........................ 132.5 103.3 113.4 119.4 105.9 71.0September .................. 133.5 103.3 113.9 119.7 104.8 70.0October ....................... 134.5 101.1 112.6 118.8 105.3 66.2November ................... 133.2 102.6 112.2 120.8 105.2 70.1December ................... 131.9 102.2 111.9 122.0 105.1 74.1Average ..................... 131.5 103.1 112.1 120.5 106.2 71.0
1982January ....................... 133.2 101.6 111.0 122.0 105.3 72.4February ..................... 134.0 101.0 110.5 120.7 103.2 71.1March .......................... 134.8 99.6 112.0 115.3 98.0 68.1April ............................ 132.7 96.8 102.9 113.2 96.1 67.7May ............................. 132.7 95.5 104.9 114.3 97.6 66.8June ............................ 132.5 95.3 109.2 116.2 102.2 67.1July ............................. 134.4 95.3 108.8 115.8 101.1 62.0August ........................ 132.6 95.4 101.7 115.9 99.3 64.5September .................. 130.0 95.1 102.5 115.2 99.8 72.3October ....................... 131.5 95.8 107.5 119.6 102.1 75.2November ................... 131.7 96.4 113.7 121.6 104.5 77.8December ................... 130.3 95.6 108.1 119.6 100.3 80.2Average ..................... 132.4 96.9 108.7 118.6 100.5 71.9
a Taxes are excluded except for No. 2 fuel oil, which includes some taxes. Data collection form instructions for No. 2 fuel oil specifically directed that allFederal, State, and local taxes paid by consumers be included; however,inspection of the data indicates that tax information was frequently excludedby the reporting distributors.
NA=Not available.
Notes: • Retail sales are those made directly to ultimate consumers, butexcluding bulk consumers (such as agriculture, industry, and electric utilities).• Annual averages are the averages of the monthly prices, weighted byvolume. • Geographic coverage is the 50 States and the District ofColumbia.
Sources: See end of section.
Energy Information Administration/Historical Monthly Energy Review 1973-1992274

Table 9.7b Refiner Prices of Petroleum Products: To End Users, 1978-1992
(Cents per Gallon, Excluding Taxes)
FinishedMotor
Gasolinea
FinishedAviationGasoline
Kerosene-Type
Jet Fuel Kerosene
No. 2FuelOil
No. 2DieselFuel
Propane(Consumer
Grade)
1978January ............................. NA NA NA NA NA NA NAFebruary ........................... NA NA NA NA NA NA NAMarch ................................ NA NA NA NA NA NA NAApril .................................. NA NA NA NA NA NA NAMay ................................... NA NA NA NA NA NA NAJune .................................. NA NA NA NA NA NA NAJuly ................................... NA NA NA NA NA NA NAAugust .............................. NA NA NA NA NA NA NASeptember ........................ NA NA NA NA NA NA NAOctober ............................. NA NA NA NA NA NA NANovember ......................... NA NA NA NA NA NA NADecember ......................... NA NA NA NA NA NA NAAverage ........................... 48.4 51.6 38.7 42.1 40.0 37.7 33.5
1979January ............................. NA NA NA NA NA NA NAFebruary ........................... NA NA NA NA NA NA NAMarch ................................ NA NA NA NA NA NA NAApril .................................. NA NA NA NA NA NA NAMay ................................... NA NA NA NA NA NA NAJune .................................. NA NA NA NA NA NA NAJuly ................................... NA NA NA NA NA NA NAAugust .............................. NA NA NA NA NA NA NASeptember ........................ NA NA NA NA NA NA NAOctober ............................. NA NA NA NA NA NA NANovember ......................... NA NA NA NA NA NA NADecember ......................... NA NA NA NA NA NA NAAverage ........................... 71.3 68.9 54.7 58.5 51.6 58.5 35.7
1980January ............................. NA NA NA NA NA NA NAFebruary ........................... NA NA NA NA NA NA NAMarch ................................ NA NA NA NA NA NA NAApril .................................. NA NA NA NA NA NA NAMay ................................... NA NA NA NA NA NA NAJune .................................. NA NA NA NA NA NA NAJuly ................................... NA NA NA NA NA NA NAAugust .............................. NA NA NA NA NA NA NASeptember ........................ NA NA NA NA NA NA NAOctober ............................. NA NA NA NA NA NA NANovember ......................... NA NA NA NA NA NA NADecember ......................... NA NA NA NA NA NA NAAverage ........................... 103.5 108.4 86.8 90.2 78.8 81.8 48.2
1981January ............................. NA NA NA NA NA NA NAFebruary ........................... NA NA NA NA NA NA NAMarch ................................ NA NA NA NA NA NA NAApril .................................. NA NA NA NA NA NA NAMay ................................... NA NA NA NA NA NA NAJune .................................. NA NA NA NA NA NA NAJuly ................................... NA NA NA NA NA NA NAAugust .............................. NA NA NA NA NA NA NASeptember ........................ NA NA NA NA NA NA NAOctober ............................. NA NA NA NA NA NA NANovember ......................... NA NA NA NA NA NA NADecember ......................... NA NA NA NA NA NA NAAverage ........................... 114.7 130.3 102.4 112.3 91.4 99.5 56.5
1982January ............................. 110.8 132.0 101.0 111.2 94.4 98.7 57.8February ........................... 108.6 132.8 100.4 110.7 95.0 96.7 57.7March ................................ 102.2 133.6 99.0 112.2 90.6 91.9 57.3April .................................. 98.3 131.5 96.2 103.1 85.0 90.1 57.3May ................................... 102.1 131.5 94.9 105.1 84.4 91.5 57.8June .................................. 109.3 131.3 94.7 109.4 85.1 95.8 57.7July ................................... 110.4 133.2 94.7 109.0 83.6 94.8 55.1August .............................. 108.9 131.4 94.8 101.9 86.3 93.1 56.7September ........................ 107.7 128.8 94.5 102.7 86.2 93.5 59.9October ............................. 106.4 130.3 95.2 107.7 89.8 95.7 60.7November ......................... 105.1 129.5 95.8 113.7 94.2 97.7 63.2December ......................... 102.2 129.1 95.0 108.3 93.9 94.0 64.2Average ........................... 106.0 131.2 96.3 108.9 90.5 94.2 59.2
See footnotes at end of table.
Energy Information Administration/Historical Monthly Energy Review 1973-1992 275

Table 9.7b Refiner Prices of Petroleum Products: To End Users, 1978-1992 (Continued)
(Cents per Gallon, Excluding Taxes)
FinishedMotor
Gasolinea
FinishedAviationGasoline
Kerosene-Type
Jet Fuel Kerosene
No. 2FuelOil
No. 2DieselFuel
Propane(Consumer
Grade)
1983January ............................. 97.1 129.2 94.5 104.5 100.9 89.2 72.7February ........................... 92.5 127.2 92.6 101.4 97.0 84.0 71.7March ................................ 89.8 126.6 90.6 97.1 93.0 78.0 68.1April .................................. 94.7 125.2 88.8 93.4 89.1 78.8 68.6May ................................... 96.6 125.4 87.8 93.8 89.5 81.8 72.2June .................................. 97.8 125.6 86.3 90.0 87.3 81.5 67.3July ................................... 98.8 125.1 85.6 89.0 85.1 82.0 66.4August .............................. 98.4 125.9 85.5 90.8 86.1 83.0 68.9September ........................ 96.9 124.2 86.1 92.7 88.0 84.8 74.9October ............................. 95.4 124.7 86.0 98.9 89.0 84.2 69.6November ......................... 93.9 124.5 85.8 100.0 90.1 83.5 72.8December ......................... 92.4 124.4 85.5 96.6 92.1 82.2 76.4Average ........................... 95.4 125.5 87.8 96.1 91.6 82.6 70.9
1984January ............................. 90.6 123.9 85.8 106.8 97.7 84.4 76.8February ........................... 90.2 123.7 86.5 117.9 104.6 87.4 76.3March ................................ 90.7 123.8 85.6 111.3 94.7 83.2 76.4April .................................. 92.9 124.4 85.1 105.8 91.9 82.4 76.5May ................................... 93.4 123.9 85.2 102.4 90.9 83.2 70.4June .................................. 92.5 124.6 84.5 94.3 86.9 84.0 70.6July ................................... 90.4 124.3 84.1 90.6 84.3 81.3 69.6August .............................. 89.2 123.2 83.4 92.8 82.8 79.7 71.9September ........................ 89.7 123.7 83.1 99.2 84.3 80.2 73.4October ............................. 90.5 123.3 83.2 102.7 87.3 81.6 74.1November ......................... 89.9 119.3 82.4 106.1 87.7 80.7 73.8December ......................... 88.0 121.9 82.2 101.4 88.1 79.4 70.0Average ........................... 90.7 123.4 84.2 103.6 91.6 82.3 73.7
1985January ............................. 84.6 121.7 81.4 105.9 87.4 77.6 78.7February ........................... 83.6 121.1 80.9 103.7 86.8 76.7 76.1March ................................ 87.1 121.4 80.4 103.1 86.0 77.0 74.6April .................................. 92.4 121.2 80.1 101.0 85.8 79.9 68.4May ................................... 94.4 121.9 79.5 94.1 82.2 79.7 70.5June .................................. 95.2 121.7 78.6 88.2 77.8 77.2 66.8July ................................... 95.4 120.2 78.5 86.0 72.3 74.5 62.9August .............................. 94.0 118.9 77.7 89.9 74.7 73.8 62.8September ........................ 91.9 119.5 78.1 96.1 81.2 78.1 63.8October ............................. 90.8 118.9 78.8 100.6 85.2 81.6 72.4November ......................... 91.7 118.3 80.1 106.8 91.3 85.5 74.0December ......................... 91.9 117.0 80.9 111.5 92.3 85.6 77.0Average ........................... 91.2 120.1 79.6 103.0 84.9 78.9 71.7
1986January ............................. 89.3 116.2 80.4 104.7 86.9 78.1 83.3February ........................... 80.5 117.2 77.8 93.0 69.8 61.5 80.9March ................................ 65.4 111.5 68.9 84.9 62.9 51.2 80.1April .................................. 59.1 104.3 57.3 79.5 54.9 48.5 75.9May ................................... 63.8 102.2 51.9 67.6 50.0 46.4 73.1June .................................. 64.9 101.0 48.2 51.6 44.3 42.0 73.5July ................................... 58.0 98.2 43.4 48.2 38.4 36.5 70.3August .............................. 55.5 94.9 41.0 60.5 43.8 40.5 68.4September ........................ 56.2 93.2 41.5 73.7 46.1 43.3 70.4October ............................. 53.2 91.2 41.6 69.5 44.8 41.9 69.8November ......................... 53.2 87.2 42.4 74.5 48.3 43.2 69.6December ......................... 54.2 88.8 43.0 76.8 51.5 45.0 72.0Average ........................... 62.4 101.1 52.9 79.0 56.0 47.8 74.5
1987January ............................. 59.7 87.9 45.9 82.8 58.3 50.7 73.3February ........................... 62.1 89.7 49.2 80.4 58.9 51.7 74.1March ................................ 62.7 90.3 50.0 82.0 55.1 51.0 72.5April .................................. 64.9 89.8 51.0 78.2 55.0 51.5 71.4May ................................... 66.3 90.6 52.4 66.8 54.7 53.3 71.2June .................................. 67.7 91.3 53.4 59.8 54.7 54.3 65.8July ................................... 69.6 91.5 55.7 60.4 56.6 56.3 64.6August .............................. 71.6 92.4 58.2 60.2 57.9 58.1 67.4September ........................ 70.5 91.9 58.3 77.0 56.3 57.0 66.6October ............................. 69.7 91.4 59.5 78.8 60.7 59.5 65.4November ......................... 69.4 91.0 59.9 83.1 63.2 60.4 71.1December ......................... 67.4 90.0 58.2 87.9 63.0 57.3 71.7Average ........................... 66.9 90.7 54.3 77.0 58.1 55.1 70.1
See footnotes at end of table.
Energy Information Administration/Historical Monthly Energy Review 1973-1992276
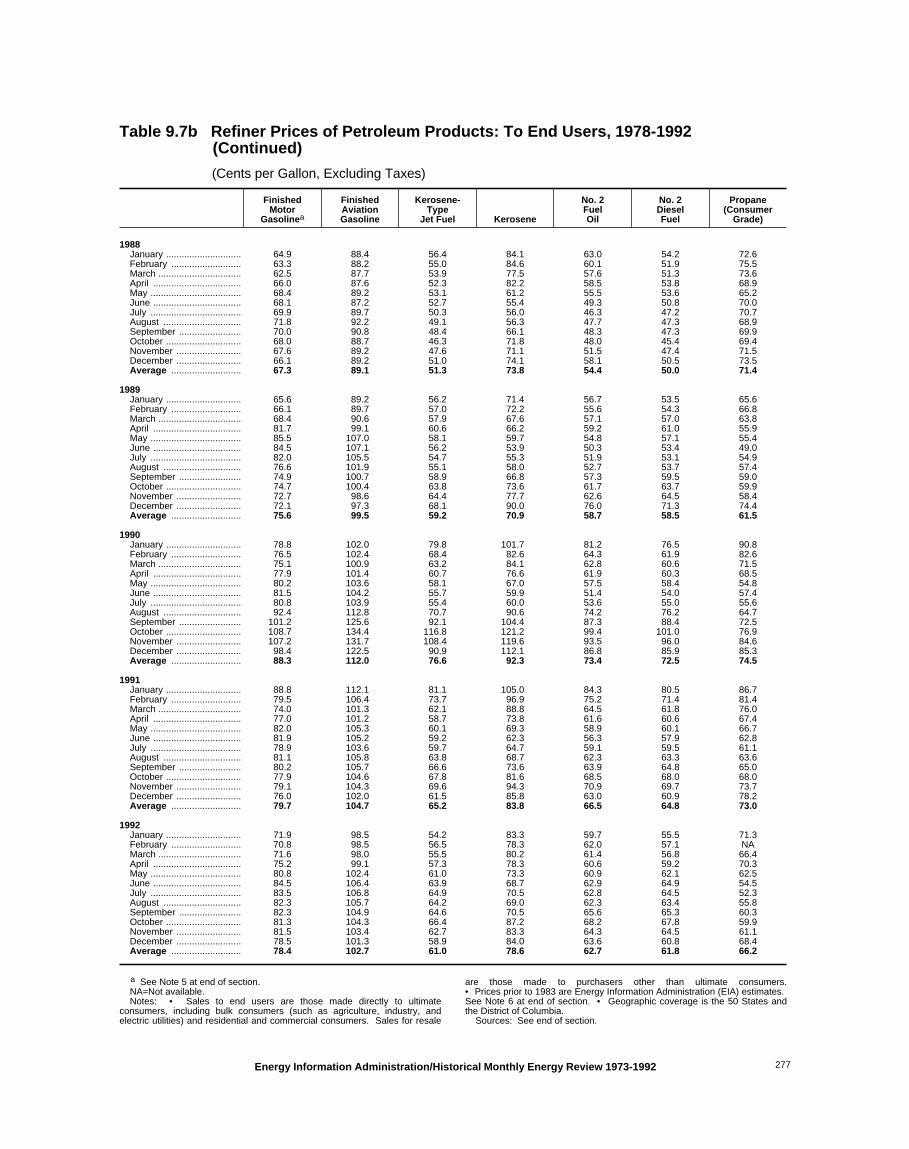
Table 9.7b Refiner Prices of Petroleum Products: To End Users, 1978-1992 (Continued)
(Cents per Gallon, Excluding Taxes)
FinishedMotor
Gasolinea
FinishedAviationGasoline
Kerosene-Type
Jet Fuel Kerosene
No. 2FuelOil
No. 2DieselFuel
Propane(Consumer
Grade)
1988January ............................. 64.9 88.4 56.4 84.1 63.0 54.2 72.6February ........................... 63.3 88.2 55.0 84.6 60.1 51.9 75.5March ................................ 62.5 87.7 53.9 77.5 57.6 51.3 73.6April .................................. 66.0 87.6 52.3 82.2 58.5 53.8 68.9May ................................... 68.4 89.2 53.1 61.2 55.5 53.6 65.2June .................................. 68.1 87.2 52.7 55.4 49.3 50.8 70.0July ................................... 69.9 89.7 50.3 56.0 46.3 47.2 70.7August .............................. 71.8 92.2 49.1 56.3 47.7 47.3 68.9September ........................ 70.0 90.8 48.4 66.1 48.3 47.3 69.9October ............................. 68.0 88.7 46.3 71.8 48.0 45.4 69.4November ......................... 67.6 89.2 47.6 71.1 51.5 47.4 71.5December ......................... 66.1 89.2 51.0 74.1 58.1 50.5 73.5Average ........................... 67.3 89.1 51.3 73.8 54.4 50.0 71.4
1989January ............................. 65.6 89.2 56.2 71.4 56.7 53.5 65.6February ........................... 66.1 89.7 57.0 72.2 55.6 54.3 66.8March ................................ 68.4 90.6 57.9 67.6 57.1 57.0 63.8April .................................. 81.7 99.1 60.6 66.2 59.2 61.0 55.9May ................................... 85.5 107.0 58.1 59.7 54.8 57.1 55.4June .................................. 84.5 107.1 56.2 53.9 50.3 53.4 49.0July ................................... 82.0 105.5 54.7 55.3 51.9 53.1 54.9August .............................. 76.6 101.9 55.1 58.0 52.7 53.7 57.4September ........................ 74.9 100.7 58.9 66.8 57.3 59.5 59.0October ............................. 74.7 100.4 63.8 73.6 61.7 63.7 59.9November ......................... 72.7 98.6 64.4 77.7 62.6 64.5 58.4December ......................... 72.1 97.3 68.1 90.0 76.0 71.3 74.4Average ........................... 75.6 99.5 59.2 70.9 58.7 58.5 61.5
1990January ............................. 78.8 102.0 79.8 101.7 81.2 76.5 90.8February ........................... 76.5 102.4 68.4 82.6 64.3 61.9 82.6March ................................ 75.1 100.9 63.2 84.1 62.8 60.6 71.5April .................................. 77.9 101.4 60.7 76.6 61.9 60.3 68.5May ................................... 80.2 103.6 58.1 67.0 57.5 58.4 54.8June .................................. 81.5 104.2 55.7 59.9 51.4 54.0 57.4July ................................... 80.8 103.9 55.4 60.0 53.6 55.0 55.6August .............................. 92.4 112.8 70.7 90.6 74.2 76.2 64.7September ........................ 101.2 125.6 92.1 104.4 87.3 88.4 72.5October ............................. 108.7 134.4 116.8 121.2 99.4 101.0 76.9November ......................... 107.2 131.7 108.4 119.6 93.5 96.0 84.6December ......................... 98.4 122.5 90.9 112.1 86.8 85.9 85.3Average ........................... 88.3 112.0 76.6 92.3 73.4 72.5 74.5
1991January ............................. 88.8 112.1 81.1 105.0 84.3 80.5 86.7February ........................... 79.5 106.4 73.7 96.9 75.2 71.4 81.4March ................................ 74.0 101.3 62.1 88.8 64.5 61.8 76.0April .................................. 77.0 101.2 58.7 73.8 61.6 60.6 67.4May ................................... 82.0 105.3 60.1 69.3 58.9 60.1 66.7June .................................. 81.9 105.2 59.2 62.3 56.3 57.9 62.8July ................................... 78.9 103.6 59.7 64.7 59.1 59.5 61.1August .............................. 81.1 105.8 63.8 68.7 62.3 63.3 63.6September ........................ 80.2 105.7 66.6 73.6 63.9 64.8 65.0October ............................. 77.9 104.6 67.8 81.6 68.5 68.0 68.0November ......................... 79.1 104.3 69.6 94.3 70.9 69.7 73.7December ......................... 76.0 102.0 61.5 85.8 63.0 60.9 78.2Average ........................... 79.7 104.7 65.2 83.8 66.5 64.8 73.0
1992January ............................. 71.9 98.5 54.2 83.3 59.7 55.5 71.3February ........................... 70.8 98.5 56.5 78.3 62.0 57.1 NAMarch ................................ 71.6 98.0 55.5 80.2 61.4 56.8 66.4April .................................. 75.2 99.1 57.3 78.3 60.6 59.2 70.3May ................................... 80.8 102.4 61.0 73.3 60.9 62.1 62.5June .................................. 84.5 106.4 63.9 68.7 62.9 64.9 54.5July ................................... 83.5 106.8 64.9 70.5 62.8 64.5 52.3August .............................. 82.3 105.7 64.2 69.0 62.3 63.4 55.8September ........................ 82.3 104.9 64.6 70.5 65.6 65.3 60.3October ............................. 81.3 104.3 66.4 87.2 68.2 67.8 59.9November ......................... 81.5 103.4 62.7 83.3 64.3 64.5 61.1December ......................... 78.5 101.3 58.9 84.0 63.6 60.8 68.4Average ........................... 78.4 102.7 61.0 78.6 62.7 61.8 66.2
a See Note 5 at end of section.NA=Not available. Notes: • Sales to end users are those made directly to ultimate
consumers, including bulk consumers (such as agriculture, industry, andelectric utilities) and residential and commercial consumers. Sales for resale
are those made to purchasers other than ultimate consumers.• Prices prior to 1983 are Energy Information Administration (EIA) estimates. See Note 6 at end of section. • Geographic coverage is the 50 States andthe District of Columbia.
Sources: See end of section.
Energy Information Administration/Historical Monthly Energy Review 1973-1992 277

Table 9.8a No. 2 Distillate Prices to Residences, 1978-1992: Northeastern States
(Cents per Gallon, Excluding Taxes)
MaineNew
Hampshire Vermont MassachusettsRhodeIsland Connecticut
NewYork
NewJersey Pennsylvania
1978January ................. NA NA NA NA NA NA NA NA NAFebruary ............... NA NA NA NA NA NA NA NA NAMarch .................... NA NA NA NA NA NA NA NA NAApril ...................... NA NA NA NA NA NA NA NA NAMay ....................... NA NA NA NA NA NA NA NA NAJune ...................... NA NA NA NA NA NA NA NA NAJuly ....................... NA NA NA NA NA NA NA NA NAAugust .................. NA NA NA NA NA NA NA NA NASeptember ............ NA NA NA NA NA NA NA NA NAOctober ................. NA NA NA NA NA NA NA NA NANovember ............. NA NA NA NA NA NA NA NA NADecember ............. NA NA NA NA NA NA NA NA NAAverage ............... 48.6 50.3 50.8 48.8 50.7 50.1 50.1 49.6 48.8
1979January ................. NA NA NA NA NA NA NA NA NAFebruary ............... NA NA NA NA NA NA NA NA NAMarch .................... NA NA NA NA NA NA NA NA NAApril ...................... NA NA NA NA NA NA NA NA NAMay ....................... NA NA NA NA NA NA NA NA NAJune ...................... NA NA NA NA NA NA NA NA NAJuly ....................... NA NA NA NA NA NA NA NA NAAugust .................. NA NA NA NA NA NA NA NA NASeptember ............ NA NA NA NA NA NA NA NA NAOctober ................. NA NA NA NA NA NA NA NA NANovember ............. NA NA NA NA NA NA NA NA NADecember ............. NA NA NA NA NA NA NA NA NAAverage ............... 68.8 72.5 72.5 70.9 72.8 72.0 71.2 71.0 69.8
1980January ................. NA NA NA NA NA NA NA NA NAFebruary ............... NA NA NA NA NA NA NA NA NAMarch .................... NA NA NA NA NA NA NA NA NAApril ...................... NA NA NA NA NA NA NA NA NAMay ....................... NA NA NA NA NA NA NA NA NAJune ...................... NA NA NA NA NA NA NA NA NAJuly ....................... NA NA NA NA NA NA NA NA NAAugust .................. NA NA NA NA NA NA NA NA NASeptember ............ NA NA NA NA NA NA NA NA NAOctober ................. NA NA NA NA NA NA NA NA NANovember ............. NA NA NA NA NA NA NA NA NADecember ............. NA NA NA NA NA NA NA NA NAAverage ............... 96.3 100.4 101.5 97.8 101.1 98.3 98.2 97.9 96.4
1981January ................. NA NA NA NA NA NA NA NA NAFebruary ............... NA NA NA NA NA NA NA NA NAMarch .................... NA NA NA NA NA NA NA NA NAApril ...................... NA NA NA NA NA NA NA NA NAMay ....................... NA NA NA NA NA NA NA NA NAJune ...................... NA NA NA NA NA NA NA NA NAJuly ....................... NA NA NA NA NA NA NA NA NAAugust .................. NA NA NA NA NA NA NA NA NASeptember ............ NA NA NA NA NA NA NA NA NAOctober ................. NA NA NA NA NA NA NA NA NANovember ............. NA NA NA NA NA NA NA NA NADecember ............. NA NA NA NA NA NA NA NA NAAverage ............... 120.4 123.7 125.4 121.3 123.8 121.7 123.2 121.5 118.1
1982January ................. 120.0 123.3 126.2 123.8 125.8 122.6 125.4 122.0 119.5February ............... 118.8 121.2 125.0 121.9 123.0 120.3 124.0 120.0 118.3March .................... 111.3 116.8 120.5 116.7 116.5 114.8 119.5 115.7 109.5April ...................... 108.6 112.3 115.3 113.7 114.7 110.6 114.4 113.4 111.0May ....................... 113.2 114.3 116.0 115.1 115.9 112.4 117.6 113.8 110.8June ...................... 114.9 117.2 118.5 114.7 117.9 115.9 118.4 116.3 112.8July ....................... 115.8 116.7 118.2 114.4 119.2 116.4 118.2 116.4 110.5August .................. 116.7 115.4 113.3 115.4 118.7 118.3 118.6 116.6 111.5September ............ 116.7 115.8 118.8 115.4 120.0 119.5 119.1 115.7 106.4October ................. 117.6 116.7 121.1 118.8 123.9 122.6 122.4 120.0 117.3November ............. 117.9 121.2 124.5 121.5 124.5 123.6 124.4 121.3 119.5December ............. 114.7 118.3 124.1 119.5 121.0 122.4 123.8 117.7 117.1Average ............... 115.5 117.4 120.1 117.6 120.1 118.3 120.5 117.4 113.7
See footnotes at end of table.
Energy Information Administration/Historical Monthly Energy Review 1973-1992278

Table 9.8a No. 2 Distillate Prices to Residences, 1978-1992: Northeastern States (Continued)
(Cents per Gallon, Excluding Taxes)
MaineNew
Hampshire Vermont MassachusettsRhodeIsland Connecticut
NewYork
NewJersey Pennsylvania
1983January ................. 109.0 111.6 121.5 116.3 116.2 119.5 120.6 115.7 113.7February ............... 103.7 105.5 116.9 113.2 112.2 115.8 117.6 110.4 109.6March .................... 97.4 100.8 109.6 105.4 106.8 108.3 110.2 104.6 104.0April ...................... 99.5 100.9 110.6 104.4 108.8 104.5 106.9 104.4 101.8May ....................... 101.6 102.6 111.2 107.0 109.6 105.9 108.2 105.5 103.3June ...................... 102.6 101.2 112.8 105.9 112.0 104.3 110.5 104.6 102.2July ....................... 102.6 104.3 112.3 105.3 109.1 104.2 109.9 104.5 101.3August .................. 105.6 103.5 111.7 105.4 107.9 103.8 110.0 105.5 101.6September ............ 103.8 104.0 111.0 106.2 108.1 103.8 110.5 106.1 102.8October ................. 102.9 103.1 109.4 105.6 108.0 104.3 110.3 105.4 103.3November ............. 101.8 101.5 109.8 106.1 108.7 104.1 110.2 104.6 103.7December ............. 102.2 103.7 110.0 108.1 109.4 105.6 110.9 106.7 104.6Average ............... 102.8 104.1 112.9 109.1 110.5 109.1 112.1 107.9 105.8
1984January ................. 110.2 114.0 116.6 114.4 113.7 115.7 118.3 114.1 112.9February ............... 112.6 117.8 118.9 119.7 117.5 121.7 124.3 119.5 117.4March .................... 103.3 108.8 115.1 113.1 111.7 114.5 117.0 113.5 110.9April ...................... 103.3 107.7 113.3 112.4 110.7 113.4 116.0 110.6 107.8May ....................... 102.7 108.8 112.2 112.5 111.4 112.5 114.5 109.1 105.8June ...................... 103.7 104.5 112.8 110.5 110.8 110.6 115.0 107.1 103.3July ....................... 102.5 101.9 108.6 107.3 109.3 107.4 112.8 104.9 99.7August .................. 98.0 98.6 108.0 105.5 106.0 104.7 110.2 103.6 99.6September ............ 99.1 101.0 106.9 106.0 105.9 105.4 109.3 104.3 100.9October ................. 101.9 102.2 108.0 106.9 107.4 106.2 111.9 105.7 101.5November ............. 100.6 102.7 107.5 107.2 106.5 107.2 111.7 105.2 102.9December ............. 97.9 103.1 106.4 107.0 107.1 106.4 111.3 104.9 103.2Average ............... 103.9 108.4 111.9 111.6 111.4 112.1 115.5 111.0 107.9
1985January ................. 97.9 100.7 106.9 107.2 108.1 106.9 111.3 105.0 102.9February ............... 98.5 102.7 107.3 107.1 106.9 107.2 112.0 105.7 103.2March .................... 100.6 103.3 107.9 107.3 106.2 106.8 111.3 105.1 102.1April ...................... 101.5 102.3 106.5 106.6 106.8 107.0 111.0 105.2 101.0May ....................... 99.4 99.9 105.4 104.5 102.1 106.2 109.8 103.3 99.7June ...................... 95.4 94.4 103.7 101.0 98.6 103.5 108.1 99.6 94.9July ....................... 91.4 91.2 101.4 98.3 97.4 100.6 105.3 97.4 92.1August .................. 90.5 91.8 101.4 96.2 95.9 99.6 105.5 97.5 92.5September ............ 94.0 97.6 104.7 100.7 101.0 100.5 104.5 101.3 96.8October ................. 99.5 102.3 106.7 104.6 104.4 106.6 107.1 103.3 98.6November ............. 103.7 108.0 111.1 110.7 111.6 111.4 114.4 109.3 105.5December ............. 105.5 108.9 113.0 111.1 110.9 114.2 115.0 112.0 109.0Average ............... 99.7 102.4 107.7 107.0 106.7 108.0 111.3 105.9 102.3
1986January ................. 101.1 103.7 109.0 105.9 101.8 111.5 111.5 107.7 104.7February ............... 90.9 88.6 100.2 90.6 93.4 99.5 102.7 98.3 95.3March .................... 86.5 84.3 95.6 85.8 84.6 93.5 96.3 91.5 87.2April ...................... 77.9 75.2 89.0 76.8 79.7 86.2 87.6 84.8 78.1May ....................... 74.5 70.7 84.7 74.2 76.6 80.7 85.0 80.1 72.6June ...................... 68.5 65.4 78.9 68.7 69.0 77.6 81.4 75.6 66.0July ....................... 59.4 63.3 70.8 65.6 69.2 68.5 72.3 75.8 63.6August .................. 58.5 63.3 68.8 65.0 69.1 66.9 71.3 72.4 62.6September ............ 58.2 63.0 69.4 67.8 69.6 68.4 73.7 73.4 63.6October ................. 58.7 64.3 69.5 68.2 68.7 68.9 73.9 74.7 64.1November ............. 59.3 65.3 70.5 69.3 71.6 70.2 76.0 74.6 66.1December ............. 66.3 69.5 72.4 72.6 74.6 72.5 78.8 76.7 68.2Average ............... 74.4 75.9 86.6 82.1 82.8 89.0 91.1 90.2 81.4
1987January ................. 72.7 76.2 78.2 80.5 79.8 80.0 84.0 83.5 75.2February ............... 73.1 75.4 79.5 80.3 81.5 83.4 85.0 84.7 76.0March .................... 74.2 74.0 79.1 79.6 81.5 82.2 84.4 83.0 74.6April ...................... 75.0 73.5 78.4 79.0 81.4 82.4 84.3 82.6 74.1May ....................... 74.9 74.7 79.8 79.9 80.8 82.8 84.9 82.0 73.2June ...................... 74.1 74.4 79.9 78.6 79.5 81.6 83.5 82.1 70.8July ....................... 74.5 74.3 80.8 78.7 80.5 82.2 82.7 82.4 72.6August .................. 74.8 75.7 80.3 77.2 79.4 82.0 83.4 81.8 73.9September ............ 74.7 76.0 81.1 78.9 80.5 82.5 82.8 82.5 74.8October ................. 73.4 78.0 83.5 81.0 83.0 84.3 85.3 84.2 77.7November ............. 75.2 79.3 84.3 83.1 86.2 87.3 87.4 86.3 80.8December ............. 79.1 81.9 84.9 83.7 87.1 87.8 88.0 87.2 81.7Average ............... 74.7 76.5 81.1 80.6 82.5 83.4 85.2 84.3 76.9
See footnotes at end of table.
Energy Information Administration/Historical Monthly Energy Review 1973-1992 279

Table 9.8a No. 2 Distillate Prices to Residences, 1978-1992: Northeastern States (Continued)
(Cents per Gallon, Excluding Taxes)
MaineNew
Hampshire Vermont MassachusettsRhodeIsland Connecticut
NewYork
NewJersey Pennsylvania
1988January ................. 80.3 82.5 85.9 85.6 87.1 88.9 89.1 88.1 82.9February ............... 79.7 81.6 85.9 84.1 86.4 89.0 88.4 87.7 82.0March .................... 79.2 80.3 85.0 83.3 84.7 87.4 87.3 86.8 81.1April ...................... 78.7 79.0 85.0 83.2 85.4 88.1 86.7 85.8 80.5May ....................... 77.6 78.3 84.4 82.3 85.1 87.6 84.9 85.4 79.1June ...................... 75.4 79.3 83.8 78.3 81.4 86.4 83.5 82.5 74.6July ....................... 73.3 76.6 81.3 77.1 76.3 83.5 81.7 80.9 71.1August .................. 75.7 73.8 80.3 74.2 79.7 81.9 78.0 78.6 63.9September ............ 71.7 73.3 78.5 80.0 78.4 80.8 83.0 76.3 68.6October ................. 69.0 71.5 77.0 77.7 75.5 79.9 81.7 77.8 69.5November ............. 72.0 72.3 77.8 77.9 79.7 80.5 83.3 78.8 70.9December ............. 80.2 77.3 81.6 82.8 83.4 84.4 87.8 84.0 76.5Average ............... 77.7 78.2 82.6 82.1 83.6 85.3 86.3 84.8 77.8
1989January ................. 85.6 83.0 86.0 87.1 87.5 88.4 91.0 87.3 81.6February ............... 87.4 83.8 86.9 86.3 88.3 88.7 92.2 87.0 82.2March .................... 88.3 84.8 87.8 88.1 90.0 89.8 93.4 88.9 83.2April ...................... 87.4 83.2 87.5 87.8 89.9 89.4 93.8 87.8 83.2May ....................... 81.0 83.1 86.4 86.8 88.8 88.1 92.9 87.2 82.2June ...................... 73.5 79.5 84.3 83.4 87.6 85.6 92.0 83.0 77.6July ....................... 72.1 77.8 82.9 81.1 85.4 84.9 90.9 82.3 74.1August .................. 70.0 78.2 82.0 81.1 84.1 84.6 90.1 80.1 72.6September ............ 74.6 79.4 82.6 84.9 86.5 85.2 86.6 81.8 74.2October ................. 82.7 83.2 85.3 88.5 90.3 88.9 91.0 87.3 78.9November ............. 86.7 87.5 86.1 91.1 92.3 90.3 93.7 89.7 81.6December ............. 106.0 112.1 109.8 115.2 114.0 112.5 113.0 108.5 103.1Average ............... 89.4 89.3 90.5 92.6 93.9 92.9 95.8 91.8 85.1
1990January ................. 116.1 118.5 121.5 117.0 122.5 120.0 122.2 117.3 113.7February ............... 85.4 96.2 98.7 99.8 98.5 100.8 103.2 99.5 93.4March .................... 84.0 93.2 95.6 98.7 97.3 97.7 101.6 98.5 90.3April ...................... 83.2 90.1 94.2 95.1 95.9 96.3 100.2 96.5 87.6May ....................... 81.2 87.0 91.7 92.4 93.9 92.7 98.9 94.4 84.4June ...................... 76.7 82.8 87.2 88.9 89.1 87.1 94.5 88.6 78.3July ....................... 74.2 80.7 85.4 88.0 86.9 85.4 93.0 85.4 74.3August .................. 97.7 99.2 97.4 102.3 102.3 104.1 102.3 102.1 92.5September ............ 118.4 110.9 114.4 118.1 118.8 114.7 117.9 117.2 108.7October ................. 126.0 119.8 124.2 126.8 120.1 128.2 130.2 129.4 122.3November ............. 116.4 116.2 123.7 122.8 119.5 128.1 129.6 126.8 122.5December ............. 113.4 111.2 119.6 120.0 115.3 124.7 126.6 122.2 119.3Average ............... 98.9 102.8 107.0 108.4 108.6 109.8 112.5 108.7 102.6
1991January ................. 114.4 107.2 117.7 118.1 113.3 122.5 124.6 119.6 117.7February ............... 105.9 100.7 111.3 111.3 109.5 116.0 120.2 113.2 110.9March .................... 95.4 90.5 104.4 102.6 101.8 109.0 112.8 104.3 101.8April ...................... 87.1 83.9 98.5 96.1 94.7 101.4 106.7 98.6 95.5May ....................... 81.9 79.4 93.5 91.7 89.7 96.5 101.2 94.4 89.9June ...................... 79.6 77.3 91.3 88.9 87.1 92.7 98.1 90.3 85.7July ....................... 82.3 77.6 88.1 88.5 88.8 90.0 93.9 88.5 80.8August .................. 83.4 80.6 88.6 88.7 88.7 89.7 93.0 89.0 81.8September ............ 87.3 84.2 91.9 90.9 90.3 92.0 98.7 92.2 83.4October ................. 91.3 87.8 93.9 94.9 94.9 96.3 103.3 96.9 88.8November ............. 95.1 90.1 95.7 97.5 95.8 99.8 108.1 100.7 93.6December ............. 89.3 88.8 94.1 95.8 93.4 98.3 105.7 96.6 93.1Average ............... 96.0 91.6 101.9 103.0 99.9 106.2 111.3 104.0 99.7
1992January ................. 87.7 88.1 92.4 93.2 90.7 96.4 103.4 95.6 91.4February ............... 88.2 86.5 92.8 92.5 91.7 95.5 103.8 95.1 91.5March .................... 86.4 83.3 92.2 91.5 90.9 94.0 102.1 93.5 90.1April ...................... 85.5 81.8 91.7 91.4 90.4 93.3 101.1 92.9 89.4May ....................... 85.5 81.7 91.5 91.0 90.9 93.1 101.1 89.2 88.6June ...................... 87.1 82.9 90.7 91.3 89.7 91.8 101.7 90.4 86.5July ....................... 87.7 82.3 89.1 90.4 89.9 93.1 100.7 90.3 83.0August .................. 87.8 81.8 89.4 89.6 89.4 90.5 99.0 88.1 81.7September ............ 86.8 83.0 91.6 90.7 89.8 91.8 99.7 90.8 84.4October ................. 89.3 87.6 92.0 93.5 92.7 94.9 102.7 94.0 87.5November ............. 88.3 87.6 92.6 93.8 92.5 95.8 104.7 94.6 89.6December ............. 85.7 87.7 92.9 93.5 91.5 95.2 104.3 95.4 89.3Average ............... 87.1 85.6 92.2 92.4 91.2 94.7 102.8 93.9 88.9
NA=Not available. Notes: • States are grouped in Tables 9.8a, 9.8b, and 9.8c by geographic
region of the country. • Prices prior to 1983 are Energy Information
Administration (EIA) estimates. See Note 6 at end of section.Sources: See end of section.
Energy Information Administration/Historical Monthly Energy Review 1973-1992280
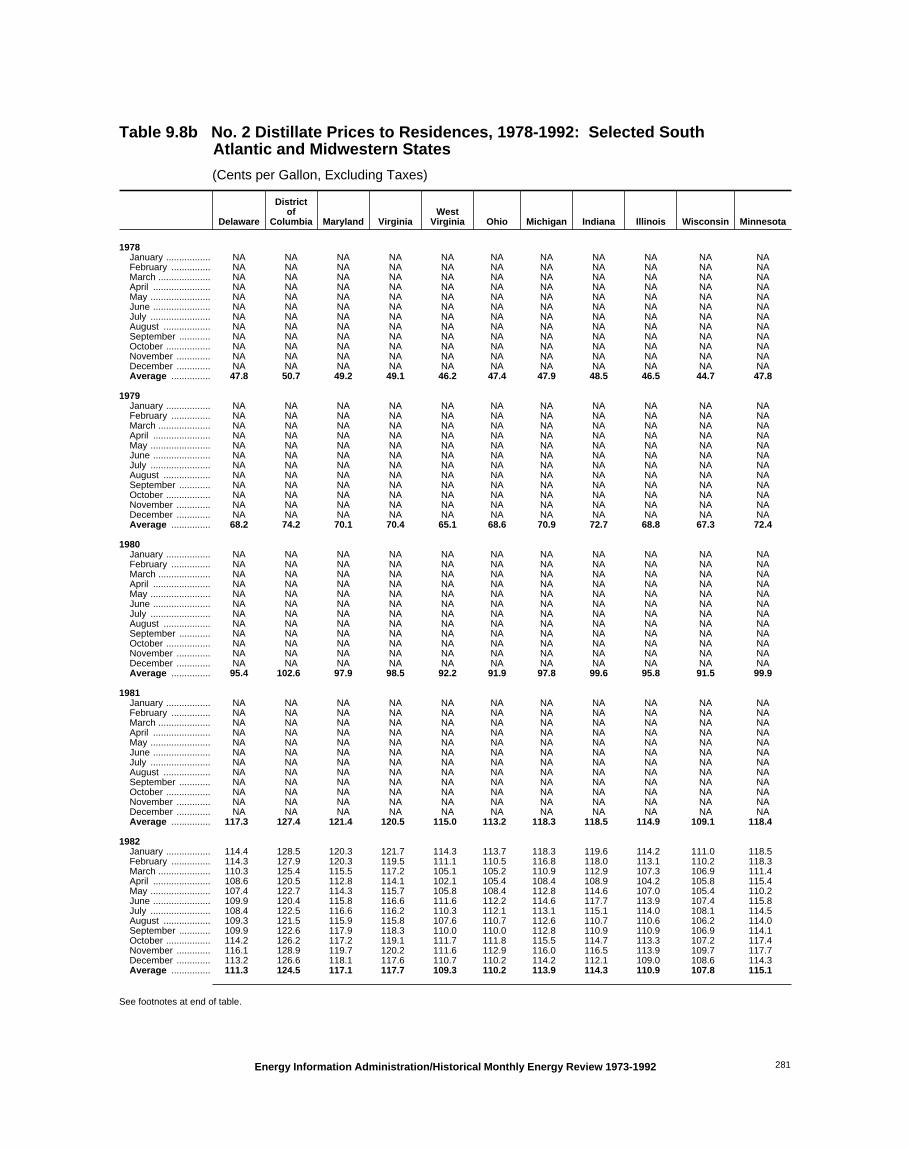
Table 9.8b No. 2 Distillate Prices to Residences, 1978-1992: Selected South Atlantic and Midwestern States
(Cents per Gallon, Excluding Taxes)
Delaware
Districtof
Columbia Maryland VirginiaWest
Virginia Ohio Michigan Indiana Illinois Wisconsin Minnesota
1978January ................. NA NA NA NA NA NA NA NA NA NA NAFebruary ............... NA NA NA NA NA NA NA NA NA NA NAMarch .................... NA NA NA NA NA NA NA NA NA NA NAApril ...................... NA NA NA NA NA NA NA NA NA NA NAMay ....................... NA NA NA NA NA NA NA NA NA NA NAJune ...................... NA NA NA NA NA NA NA NA NA NA NAJuly ....................... NA NA NA NA NA NA NA NA NA NA NAAugust .................. NA NA NA NA NA NA NA NA NA NA NASeptember ............ NA NA NA NA NA NA NA NA NA NA NAOctober ................. NA NA NA NA NA NA NA NA NA NA NANovember ............. NA NA NA NA NA NA NA NA NA NA NADecember ............. NA NA NA NA NA NA NA NA NA NA NAAverage ............... 47.8 50.7 49.2 49.1 46.2 47.4 47.9 48.5 46.5 44.7 47.8
1979January ................. NA NA NA NA NA NA NA NA NA NA NAFebruary ............... NA NA NA NA NA NA NA NA NA NA NAMarch .................... NA NA NA NA NA NA NA NA NA NA NAApril ...................... NA NA NA NA NA NA NA NA NA NA NAMay ....................... NA NA NA NA NA NA NA NA NA NA NAJune ...................... NA NA NA NA NA NA NA NA NA NA NAJuly ....................... NA NA NA NA NA NA NA NA NA NA NAAugust .................. NA NA NA NA NA NA NA NA NA NA NASeptember ............ NA NA NA NA NA NA NA NA NA NA NAOctober ................. NA NA NA NA NA NA NA NA NA NA NANovember ............. NA NA NA NA NA NA NA NA NA NA NADecember ............. NA NA NA NA NA NA NA NA NA NA NAAverage ............... 68.2 74.2 70.1 70.4 65.1 68.6 70.9 72.7 68.8 67.3 72.4
1980January ................. NA NA NA NA NA NA NA NA NA NA NAFebruary ............... NA NA NA NA NA NA NA NA NA NA NAMarch .................... NA NA NA NA NA NA NA NA NA NA NAApril ...................... NA NA NA NA NA NA NA NA NA NA NAMay ....................... NA NA NA NA NA NA NA NA NA NA NAJune ...................... NA NA NA NA NA NA NA NA NA NA NAJuly ....................... NA NA NA NA NA NA NA NA NA NA NAAugust .................. NA NA NA NA NA NA NA NA NA NA NASeptember ............ NA NA NA NA NA NA NA NA NA NA NAOctober ................. NA NA NA NA NA NA NA NA NA NA NANovember ............. NA NA NA NA NA NA NA NA NA NA NADecember ............. NA NA NA NA NA NA NA NA NA NA NAAverage ............... 95.4 102.6 97.9 98.5 92.2 91.9 97.8 99.6 95.8 91.5 99.9
1981January ................. NA NA NA NA NA NA NA NA NA NA NAFebruary ............... NA NA NA NA NA NA NA NA NA NA NAMarch .................... NA NA NA NA NA NA NA NA NA NA NAApril ...................... NA NA NA NA NA NA NA NA NA NA NAMay ....................... NA NA NA NA NA NA NA NA NA NA NAJune ...................... NA NA NA NA NA NA NA NA NA NA NAJuly ....................... NA NA NA NA NA NA NA NA NA NA NAAugust .................. NA NA NA NA NA NA NA NA NA NA NASeptember ............ NA NA NA NA NA NA NA NA NA NA NAOctober ................. NA NA NA NA NA NA NA NA NA NA NANovember ............. NA NA NA NA NA NA NA NA NA NA NADecember ............. NA NA NA NA NA NA NA NA NA NA NAAverage ............... 117.3 127.4 121.4 120.5 115.0 113.2 118.3 118.5 114.9 109.1 118.4
1982January ................. 114.4 128.5 120.3 121.7 114.3 113.7 118.3 119.6 114.2 111.0 118.5February ............... 114.3 127.9 120.3 119.5 111.1 110.5 116.8 118.0 113.1 110.2 118.3March .................... 110.3 125.4 115.5 117.2 105.1 105.2 110.9 112.9 107.3 106.9 111.4April ...................... 108.6 120.5 112.8 114.1 102.1 105.4 108.4 108.9 104.2 105.8 115.4May ....................... 107.4 122.7 114.3 115.7 105.8 108.4 112.8 114.6 107.0 105.4 110.2June ...................... 109.9 120.4 115.8 116.6 111.6 112.2 114.6 117.7 113.9 107.4 115.8July ....................... 108.4 122.5 116.6 116.2 110.3 112.1 113.1 115.1 114.0 108.1 114.5August .................. 109.3 121.5 115.9 115.8 107.6 110.7 112.6 110.7 110.6 106.2 114.0September ............ 109.9 122.6 117.9 118.3 110.0 110.0 112.8 110.9 110.9 106.9 114.1October ................. 114.2 126.2 117.2 119.1 111.7 111.8 115.5 114.7 113.3 107.2 117.4November ............. 116.1 128.9 119.7 120.2 111.6 112.9 116.0 116.5 113.9 109.7 117.7December ............. 113.2 126.6 118.1 117.6 110.7 110.2 114.2 112.1 109.0 108.6 114.3Average ............... 111.3 124.5 117.1 117.7 109.3 110.2 113.9 114.3 110.9 107.8 115.1
See footnotes at end of table.
Energy Information Administration/Historical Monthly Energy Review 1973-1992 281

Table 9.8b No. 2 Distillate Prices to Residences, 1978-1992: Selected South Atlantic and Midwestern States (Continued)
(Cents per Gallon, Excluding Taxes)
Delaware
Districtof
Columbia Maryland VirginiaWest
Virginia Ohio Michigan Indiana Illinois Wisconsin Minnesota
1983January ................. 110.5 122.8 115.4 116.0 105.6 107.9 110.6 105.7 103.8 108.5 107.8February ............... 108.2 119.7 112.6 112.0 104.7 104.4 108.5 102.8 99.5 104.5 101.6March .................... 103.9 115.3 108.2 106.9 99.2 98.2 103.7 95.7 96.6 96.8 96.5April ...................... 103.0 113.1 107.9 106.7 97.5 95.8 102.5 96.8 97.7 97.1 100.5May ....................... 104.6 112.9 108.6 107.2 96.1 96.5 102.7 98.2 100.3 98.7 101.9June ...................... 107.3 114.7 108.3 106.8 97.3 96.1 110.7 98.2 100.2 98.7 102.4July ....................... 107.8 112.8 107.2 107.4 94.9 97.3 105.3 99.4 99.6 99.0 102.6August .................. 102.5 113.3 107.0 107.7 96.1 95.2 102.2 98.9 100.7 99.2 104.4September ............ 103.5 113.9 108.1 108.1 100.7 101.2 103.9 101.4 102.5 100.7 103.7October ................. 103.5 113.4 108.7 104.8 100.6 100.2 105.8 101.5 101.0 101.8 104.8November ............. 103.7 113.5 108.8 104.9 100.5 101.0 105.4 100.7 100.8 100.4 104.4December ............. 105.5 114.7 109.2 105.2 101.5 102.1 106.8 101.1 99.6 100.5 104.2Average ............... 106.0 117.0 110.3 108.7 101.0 101.3 106.4 100.7 100.4 101.2 103.1
1984January ................. 114.8 122.0 115.6 111.4 108.5 104.6 107.3 106.0 104.7 101.5 106.6February ............... 118.4 128.6 121.9 117.5 109.9 105.7 108.0 107.3 105.9 102.8 102.8March .................... 111.1 122.6 116.2 112.6 104.9 101.7 105.6 100.6 102.3 101.7 105.1April ...................... 109.9 119.9 115.6 110.8 101.6 101.9 104.8 103.4 100.3 101.4 103.9May ....................... 109.0 119.5 113.0 111.1 98.9 103.1 105.2 102.4 102.3 101.0 105.3June ...................... 107.2 116.3 109.9 108.7 99.5 101.7 103.3 105.9 101.6 100.5 104.2July ....................... 103.7 116.5 109.0 107.2 96.2 101.8 102.6 101.4 99.4 100.5 105.1August .................. 103.7 109.8 105.2 105.2 96.6 99.5 101.8 100.3 98.9 100.0 104.5September ............ 102.1 109.9 106.7 105.9 96.9 100.1 103.2 100.7 98.6 98.8 103.5October ................. 103.5 111.8 107.5 106.7 98.3 101.2 103.0 100.9 97.1 100.7 103.0November ............. 103.3 111.9 108.2 107.1 99.6 100.8 103.5 102.3 95.8 101.0 103.1December ............. 102.8 112.9 107.1 107.7 99.2 99.3 103.2 100.9 94.4 99.0 102.8Average ............... 109.6 118.7 113.5 110.5 102.1 102.1 105.0 103.1 100.1 101.0 104.1
1985January ................. 103.8 112.1 107.5 106.2 98.4 98.3 102.1 98.6 95.2 97.3 99.5February ............... 104.0 117.1 108.6 106.8 98.3 98.7 101.0 97.8 94.4 96.2 99.8March .................... 104.6 115.9 108.3 105.8 98.1 97.9 101.3 96.3 94.5 96.4 101.0April ...................... 104.1 113.9 109.6 105.4 96.0 99.8 100.0 98.6 96.6 97.7 101.1May ....................... 100.7 112.4 108.2 105.9 93.8 99.6 98.3 97.4 96.4 99.5 103.8June ...................... 96.4 107.2 104.4 104.3 90.7 97.1 98.4 97.6 92.0 94.2 104.3July ....................... 96.2 107.3 101.2 99.3 90.3 92.9 97.4 93.3 89.7 93.0 100.5August .................. 97.5 105.5 98.9 98.9 88.6 91.8 97.2 92.9 90.6 93.0 100.1September ............ 98.8 107.1 103.3 101.9 96.2 95.6 99.1 96.5 95.6 94.9 98.7October ................. 102.7 109.9 106.2 105.6 98.7 97.9 101.8 101.2 100.1 99.1 101.1November ............. 107.0 114.4 111.9 108.4 104.4 104.4 103.5 105.3 104.0 102.0 105.7December ............. 110.5 117.2 112.7 109.9 104.7 105.9 107.1 105.3 103.4 103.2 105.2Average ............... 104.6 114.3 108.8 106.3 98.0 99.7 102.1 99.1 97.5 98.3 101.9
1986January ................. 102.3 116.5 112.2 106.9 99.8 100.7 102.6 99.9 97.6 96.5 100.5February ............... 93.9 105.5 99.9 98.2 87.8 91.9 91.9 85.0 82.9 83.9 86.2March .................... 87.0 97.6 93.9 90.8 79.6 80.8 80.6 75.6 74.7 75.9 80.2April ...................... 77.1 93.2 88.5 84.5 70.6 78.1 74.5 74.0 69.9 73.8 76.4May ....................... 74.3 87.9 84.9 75.1 67.4 75.2 72.4 67.2 72.9 71.8 79.5June ...................... 73.7 81.7 79.7 74.3 63.4 69.0 65.5 66.6 67.4 69.0 74.6July ....................... 65.5 74.7 71.4 69.5 53.9 62.3 67.2 60.1 NA 63.6 69.5August .................. 66.6 70.7 70.7 71.5 59.7 62.5 69.7 65.6 64.7 63.7 67.6September ............ 67.0 72.1 70.2 70.9 61.3 64.2 70.7 66.7 65.5 67.9 70.0October ................. 66.6 74.2 72.4 69.5 63.0 61.5 69.8 65.2 60.0 63.3 67.7November ............. 67.9 77.0 73.5 68.9 67.3 61.0 70.3 65.1 NA 66.0 68.0December ............. 71.2 80.8 77.1 70.6 71.7 64.8 72.5 68.5 NA 69.0 68.3Average ............... 85.0 93.1 91.4 86.6 74.6 77.7 81.0 74.8 NA 75.6 79.2
1987January ................. 78.1 87.3 82.0 75.8 75.6 71.1 76.6 73.0 76.9 72.6 71.8February ............... 79.4 92.6 84.8 79.6 77.6 73.3 76.7 72.3 78.1 73.9 71.7March .................... 79.4 91.9 85.4 80.1 75.2 71.9 76.1 71.2 78.3 74.0 71.6April ...................... 77.9 91.6 84.4 81.3 73.2 71.1 74.7 73.1 78.3 74.1 71.8May ....................... 78.4 91.0 83.7 79.6 74.8 70.9 75.1 75.8 80.1 71.6 72.4June ...................... 74.8 92.3 85.8 77.8 74.2 75.0 76.1 75.9 80.5 74.3 72.7July ....................... 74.7 90.2 87.2 78.5 74.2 76.5 77.1 76.7 79.9 73.5 75.5August .................. 74.8 92.4 87.1 77.9 75.6 73.4 77.4 77.1 83.7 74.5 75.9September ............ 76.2 91.4 87.3 78.8 74.2 74.6 77.4 77.1 79.4 74.3 74.4October ................. 78.8 92.1 88.4 81.0 74.9 76.9 78.1 79.4 87.3 77.5 78.9November ............. 82.4 93.5 90.4 82.9 78.3 79.1 80.9 80.8 88.2 79.3 79.7December ............. 82.5 95.3 90.6 82.5 80.5 78.7 80.2 79.6 85.2 78.4 77.0Average ............... 79.3 91.8 86.6 79.5 76.4 74.7 77.5 75.4 79.8 75.1 74.6
See footnotes at end of table.
Energy Information Administration/Historical Monthly Energy Review 1973-1992282

Table 9.8b No. 2 Distillate Prices to Residences, 1978-1992: Selected South Atlantic and Midwestern States (Continued)
(Cents per Gallon, Excluding Taxes)
Delaware
Districtof
Columbia Maryland VirginiaWest
Virginia Ohio Michigan Indiana Illinois Wisconsin Minnesota
1988January ................. 83.9 95.8 90.9 82.7 78.7 77.2 81.2 78.3 85.4 76.9 75.5February ............... 83.2 96.0 90.3 83.4 76.1 77.1 80.9 76.7 86.1 76.0 74.4March .................... 81.5 93.1 88.2 83.8 75.6 76.1 78.2 77.4 86.1 75.8 72.6April ...................... 82.5 91.8 89.1 83.0 74.6 77.1 78.8 79.0 87.4 77.7 73.1May ....................... 82.5 93.9 87.9 81.7 73.6 74.5 77.5 76.6 86.7 76.8 74.3June ...................... 80.9 89.7 86.8 79.1 71.8 71.9 73.7 80.1 82.9 74.6 73.5July ....................... 73.4 87.6 85.0 77.3 70.3 70.0 73.3 74.0 83.8 72.7 75.7August .................. 73.9 85.9 84.2 77.0 67.9 69.2 73.9 74.1 80.3 71.2 72.2September ............ 72.6 85.8 76.0 75.8 69.3 72.0 74.2 69.5 68.6 68.8 72.4October ................. 71.8 84.1 78.3 74.8 71.3 71.2 75.4 71.2 69.4 68.0 71.1November ............. 74.8 85.6 81.3 77.1 74.1 73.0 75.6 72.1 70.6 69.9 72.7December ............. 79.6 89.8 85.0 79.6 73.9 75.2 77.0 75.3 73.1 71.6 73.0Average ............... 80.1 91.6 87.0 80.5 74.2 74.7 77.5 75.4 77.6 73.9 73.5
1989January ................. 82.4 94.0 88.1 82.6 75.8 77.5 78.8 77.8 76.6 73.9 75.3February ............... 81.8 95.1 88.8 82.3 76.2 76.7 79.3 77.0 75.8 74.0 75.7March .................... 82.9 96.0 89.4 82.5 76.7 77.5 80.1 77.6 76.6 75.6 77.1April ...................... 84.8 95.4 90.3 82.1 77.0 79.4 81.5 79.7 79.8 76.3 82.3May ....................... 83.4 92.1 89.6 81.5 77.4 78.5 81.2 78.1 78.5 78.0 82.1June ...................... 80.3 92.0 88.4 79.6 80.9 79.3 80.1 76.5 77.0 78.0 81.0July ....................... 79.0 90.7 86.5 78.4 78.1 79.4 80.3 77.0 74.5 75.7 80.8August .................. 78.8 90.1 85.7 77.9 73.6 78.1 79.1 76.5 78.4 75.4 79.4September ............ 78.8 91.4 83.1 79.7 79.3 77.5 82.9 80.1 77.5 76.5 80.7October ................. 82.4 92.0 88.2 84.0 81.7 78.4 86.4 83.3 81.9 79.5 82.5November ............. 86.1 94.7 91.1 86.0 83.1 78.8 88.2 84.0 82.8 82.2 86.1December ............. 111.6 110.8 110.6 105.2 100.0 97.2 102.2 98.6 93.9 97.5 95.6Average ............... 88.2 98.6 93.8 87.0 83.0 81.6 85.3 83.2 80.9 81.1 82.4
1990January ................. 119.4 119.0 119.8 117.8 109.2 96.0 103.5 99.8 94.9 91.6 99.7February ............... 97.1 96.4 100.9 102.9 89.5 82.8 92.1 86.2 83.1 83.9 88.1March .................... 93.2 94.4 98.8 97.9 87.1 82.5 88.7 83.8 83.4 83.1 85.6April ...................... 91.8 93.1 97.5 94.9 83.7 82.3 86.5 84.1 82.2 82.9 85.6May ....................... 90.1 94.2 94.9 90.4 83.0 83.1 83.7 82.4 78.3 81.0 85.1June ...................... 83.2 93.2 89.4 88.0 83.4 82.6 81.1 72.8 73.8 79.5 80.3July ....................... 77.9 97.6 86.2 89.8 79.2 81.6 82.4 74.7 76.7 77.6 82.8August .................. 93.1 107.1 100.2 102.4 98.1 93.3 100.3 98.0 96.9 92.0 101.4September ............ 112.0 116.1 115.7 114.7 116.3 115.3 113.2 110.7 NA 107.1 111.6October ................. 119.8 134.3 130.8 128.3 124.4 120.9 124.1 123.3 116.9 117.2 120.7November ............. 118.8 133.3 130.4 125.6 121.7 117.0 121.2 117.8 113.1 114.4 119.8December ............. 113.7 128.4 125.3 122.8 113.1 111.8 113.5 111.3 104.9 108.3 111.2Average ............... 105.8 107.8 111.9 110.6 99.1 98.1 100.9 99.3 96.1 94.2 101.4
1991January ................. 113.0 124.1 122.0 117.2 110.5 105.5 109.8 105.9 102.5 102.4 105.4February ............... 105.4 118.6 116.1 110.3 101.5 94.6 98.5 95.4 92.9 92.4 93.5March .................... 98.4 112.3 107.7 102.4 90.8 85.7 91.5 87.9 86.5 87.8 87.2April ...................... 92.3 105.6 102.7 96.1 87.6 83.2 90.7 86.0 88.3 84.0 87.8May ....................... 91.5 101.1 98.7 90.7 85.8 83.1 88.1 86.3 88.5 82.9 88.1June ...................... 84.0 95.3 96.2 87.8 83.6 80.7 87.4 80.3 86.8 80.9 87.1July ....................... 81.5 98.6 93.7 86.9 81.7 79.6 83.3 78.8 82.2 78.0 84.4August .................. 86.0 98.6 94.0 87.5 82.4 81.1 84.4 85.5 86.5 78.8 86.3September ............ 87.3 101.7 96.8 90.4 84.8 84.8 86.8 85.5 87.3 82.7 84.0October ................. 92.8 104.0 100.1 93.6 89.7 88.7 89.5 86.7 88.4 85.7 86.8November ............. 96.9 107.3 103.2 97.0 91.8 91.8 92.8 87.8 92.4 89.9 89.2December ............. 94.9 107.7 102.6 95.2 89.0 86.0 89.9 83.3 89.9 85.4 84.4Average ............... 99.7 112.2 108.4 101.1 93.4 91.0 94.2 91.8 92.7 89.5 91.1
1992January ................. 94.4 107.3 101.6 94.3 85.5 82.0 86.6 77.8 85.2 80.1 79.4February ............... 92.7 107.3 100.9 93.7 86.9 83.0 86.5 78.7 85.6 79.8 79.6March .................... 92.4 105.3 100.3 93.7 86.6 82.5 86.6 79.5 88.1 79.2 79.7April ...................... 91.5 104.7 99.0 92.6 85.6 82.9 86.7 80.2 88.4 80.4 81.8May ....................... 90.2 102.3 97.2 91.7 84.2 83.5 86.4 81.2 89.0 81.5 83.9June ...................... 91.4 102.7 97.6 89.6 86.5 85.3 86.1 79.6 90.8 81.9 82.9July ....................... 90.6 102.0 95.7 90.2 82.3 81.7 85.0 82.4 87.9 81.1 84.5August .................. 89.5 101.9 95.2 88.4 81.4 82.3 85.7 83.1 86.4 80.6 84.1September ............ 90.3 101.2 95.7 89.4 85.4 84.7 88.2 84.8 88.9 83.6 85.0October ................. 93.7 104.0 98.8 91.9 88.3 86.4 90.0 85.8 90.8 84.1 87.1November ............. 92.8 105.7 100.4 92.1 88.0 84.6 88.2 82.7 90.4 83.7 86.0December ............. 90.9 105.4 100.4 93.3 89.0 84.5 87.9 81.8 88.2 84.3 83.1Average ............... 92.4 105.7 99.9 92.8 86.4 83.6 87.1 81.1 87.6 81.8 82.3
NA=Not available. Notes: • States are grouped in Tables 9.8a, 9.8b, and 9.8c by geographic
region of the country. • Prices prior to 1983 are Energy Information
Administration (EIA) estimates. See Note 6 at end of section.Sources: See end of section.
Energy Information Administration/Historical Monthly Energy Review 1973-1992 283
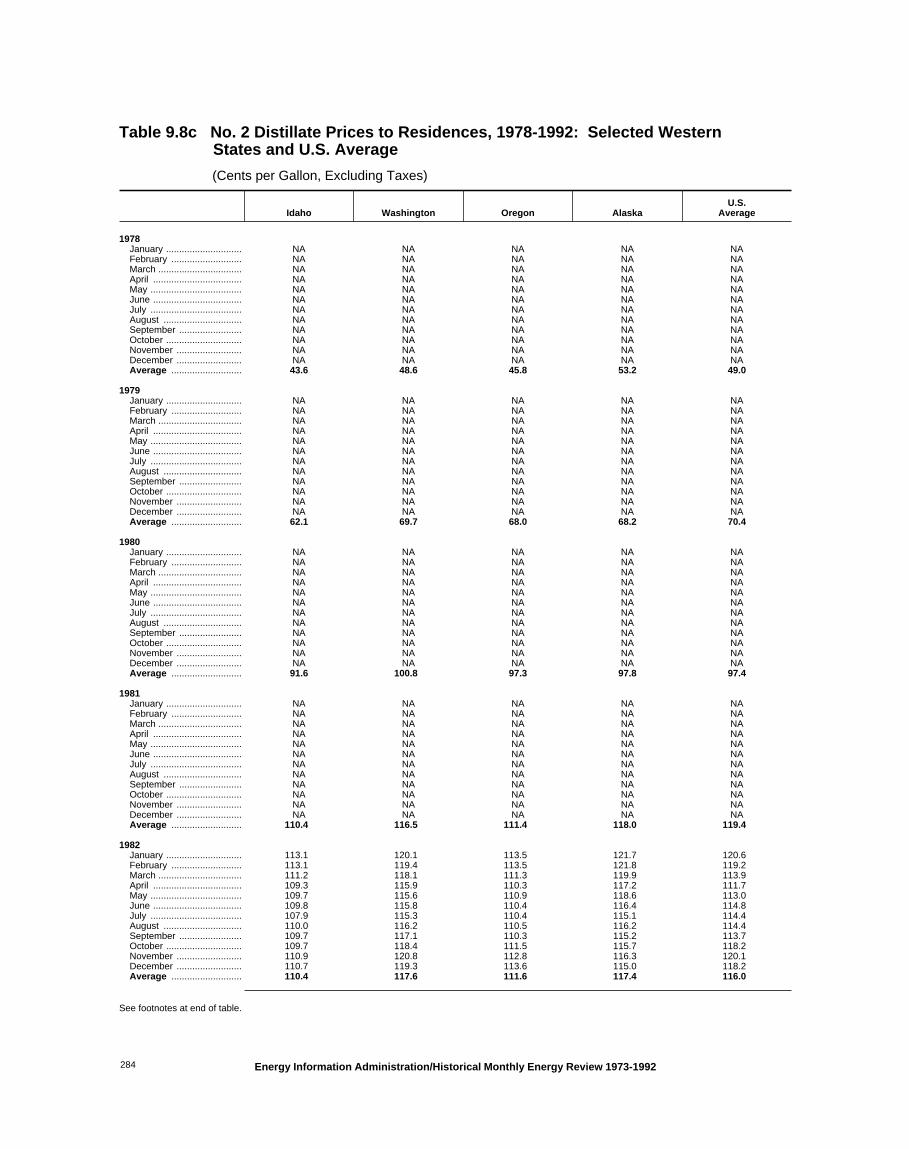
Table 9.8c No. 2 Distillate Prices to Residences, 1978-1992: Selected Western States and U.S. Average
(Cents per Gallon, Excluding Taxes)
Idaho Washington Oregon AlaskaU.S.
Average
1978January ............................. NA NA NA NA NAFebruary ........................... NA NA NA NA NAMarch ................................ NA NA NA NA NAApril .................................. NA NA NA NA NAMay ................................... NA NA NA NA NAJune .................................. NA NA NA NA NAJuly ................................... NA NA NA NA NAAugust .............................. NA NA NA NA NASeptember ........................ NA NA NA NA NAOctober ............................. NA NA NA NA NANovember ......................... NA NA NA NA NADecember ......................... NA NA NA NA NAAverage ........................... 43.6 48.6 45.8 53.2 49.0
1979January ............................. NA NA NA NA NAFebruary ........................... NA NA NA NA NAMarch ................................ NA NA NA NA NAApril .................................. NA NA NA NA NAMay ................................... NA NA NA NA NAJune .................................. NA NA NA NA NAJuly ................................... NA NA NA NA NAAugust .............................. NA NA NA NA NASeptember ........................ NA NA NA NA NAOctober ............................. NA NA NA NA NANovember ......................... NA NA NA NA NADecember ......................... NA NA NA NA NAAverage ........................... 62.1 69.7 68.0 68.2 70.4
1980January ............................. NA NA NA NA NAFebruary ........................... NA NA NA NA NAMarch ................................ NA NA NA NA NAApril .................................. NA NA NA NA NAMay ................................... NA NA NA NA NAJune .................................. NA NA NA NA NAJuly ................................... NA NA NA NA NAAugust .............................. NA NA NA NA NASeptember ........................ NA NA NA NA NAOctober ............................. NA NA NA NA NANovember ......................... NA NA NA NA NADecember ......................... NA NA NA NA NAAverage ........................... 91.6 100.8 97.3 97.8 97.4
1981January ............................. NA NA NA NA NAFebruary ........................... NA NA NA NA NAMarch ................................ NA NA NA NA NAApril .................................. NA NA NA NA NAMay ................................... NA NA NA NA NAJune .................................. NA NA NA NA NAJuly ................................... NA NA NA NA NAAugust .............................. NA NA NA NA NASeptember ........................ NA NA NA NA NAOctober ............................. NA NA NA NA NANovember ......................... NA NA NA NA NADecember ......................... NA NA NA NA NAAverage ........................... 110.4 116.5 111.4 118.0 119.4
1982January ............................. 113.1 120.1 113.5 121.7 120.6February ........................... 113.1 119.4 113.5 121.8 119.2March ................................ 111.2 118.1 111.3 119.9 113.9April .................................. 109.3 115.9 110.3 117.2 111.7May ................................... 109.7 115.6 110.9 118.6 113.0June .................................. 109.8 115.8 110.4 116.4 114.8July ................................... 107.9 115.3 110.4 115.1 114.4August .............................. 110.0 116.2 110.5 116.2 114.4September ........................ 109.7 117.1 110.3 115.2 113.7October ............................. 109.7 118.4 111.5 115.7 118.2November ......................... 110.9 120.8 112.8 116.3 120.1December ......................... 110.7 119.3 113.6 115.0 118.2Average ........................... 110.4 117.6 111.6 117.4 116.0
See footnotes at end of table.
Energy Information Administration/Historical Monthly Energy Review 1973-1992284

Table 9.8c No. 2 Distillate Prices to Residences, 1978-1992: Selected Western States and U.S. Average (Continued)
(Cents per Gallon, Excluding Taxes)
Idaho Washington Oregon AlaskaU.S.
Average
1983January ............................. 109.1 117.7 113.6 114.6 115.0February ........................... 104.8 114.3 107.8 NA 111.6March ................................ 99.6 109.0 101.4 110.7 105.1April .................................. 99.0 106.0 99.1 106.6 103.5May ................................... 99.2 105.5 99.0 106.0 104.8June .................................. 98.7 105.4 99.4 105.0 106.0July ................................... 99.3 105.2 97.8 105.8 105.0August .............................. 98.1 104.0 98.7 105.1 104.9September ........................ 98.9 105.6 100.5 106.2 105.7October ............................. 99.5 106.3 101.4 106.1 106.0November ......................... 99.5 106.4 102.1 105.5 106.0December ......................... 100.3 106.1 101.8 105.5 106.7Average ........................... 101.8 109.0 103.6 108.8 107.8
1984January ............................. 100.1 103.6 100.5 104.1 112.0February ........................... 101.3 103.8 100.9 106.5 116.9March ................................ 97.2 104.6 100.9 107.3 111.3April .................................. 96.2 105.0 100.6 107.3 109.8May ................................... 98.1 104.2 99.5 107.2 108.4June .................................. 93.8 103.3 98.2 107.8 107.2July ................................... 93.1 100.4 97.1 107.2 104.8August .............................. 97.4 99.7 94.9 107.3 103.3September ........................ 98.4 100.4 95.9 105.0 103.6October ............................. 99.4 100.9 96.5 107.8 104.9November ......................... 97.9 101.3 97.6 107.8 105.3December ......................... 98.8 100.5 97.4 107.5 104.8Average ........................... 98.5 102.6 99.3 106.9 109.1
1985January ............................. 97.4 100.6 97.0 108.6 104.9February ........................... 96.9 99.8 96.6 107.6 105.4March ................................ 96.6 100.3 95.7 112.8 105.0April .................................. 95.7 99.2 96.5 107.0 105.3May ................................... 96.0 98.1 96.7 106.9 103.6June .................................. 95.9 99.2 95.5 107.3 100.7July ................................... 94.8 97.3 95.3 108.4 98.0August .............................. 94.5 96.7 93.0 106.9 97.3September ........................ 94.3 97.6 93.4 109.2 99.6October ............................. 97.2 100.0 94.0 109.1 103.0November ......................... 97.9 104.4 98.8 106.1 108.6December ......................... 98.8 106.1 102.3 106.5 110.5Average ........................... 97.2 101.1 97.1 108.3 105.3
1986January ............................. 97.1 104.6 100.1 106.5 106.4February ........................... 91.2 90.4 83.5 103.7 95.8March ................................ 76.2 75.3 65.9 113.8 88.7April .................................. 69.9 74.9 62.5 95.6 81.2May ................................... 74.8 71.2 64.1 94.3 77.4June .................................. 66.9 65.3 60.0 89.0 72.8July ................................... 62.2 60.2 55.7 NA 67.0August .............................. 58.6 60.6 55.6 84.2 66.3September ........................ 59.4 66.9 61.9 89.2 68.1October ............................. 60.8 68.2 62.3 79.2 67.4November ......................... 62.1 68.8 62.6 80.1 68.2December ......................... 61.6 66.7 63.9 85.4 70.6Average ........................... 73.8 77.5 70.4 94.9 83.6
1987January ............................. 63.1 73.0 68.1 86.4 78.5February ........................... 65.1 75.9 71.4 86.9 79.9March ................................ 65.7 76.1 70.9 83.3 79.1April .................................. 65.4 75.9 70.3 76.5 78.7May ................................... 65.2 74.0 69.5 78.2 78.6June .................................. 70.0 74.2 67.6 84.6 77.8July ................................... 70.5 77.4 NA 87.5 78.7August .............................. 74.9 79.3 NA 88.7 78.8September ........................ 77.3 81.2 77.1 89.5 78.9October ............................. 76.3 82.8 75.1 92.6 81.2November ......................... 77.3 84.3 74.7 92.3 83.5December ......................... 76.8 84.8 75.8 90.6 84.0Average ........................... 68.8 79.5 72.5 86.5 80.3
See footnotes at end of table.
Energy Information Administration/Historical Monthly Energy Review 1973-1992 285

Table 9.8c No. 2 Distillate Prices to Residences, 1978-1992: Selected Western States and U.S. Average (Continued)
(Cents per Gallon, Excluding Taxes)
Idaho Washington Oregon AlaskaU.S.
Average
1988January ............................. 74.4 83.2 76.0 88.3 84.7February ........................... 71.7 82.1 74.9 85.6 83.9March ................................ 70.6 81.3 73.5 88.7 83.1April .................................. 73.3 82.1 75.0 86.6 83.1May ................................... 71.9 82.3 74.6 88.9 81.9June .................................. 70.5 78.0 73.9 88.1 79.1July ................................... 67.7 73.5 66.4 85.5 76.7August .............................. 64.3 70.1 64.3 85.7 73.7September ........................ 67.4 73.9 64.8 89.7 75.9October ............................. 66.8 71.0 62.4 86.2 75.5November ......................... 66.6 73.4 63.4 85.3 77.2December ......................... 66.9 75.7 64.2 85.6 81.4Average ........................... 68.8 78.5 70.9 86.9 81.3
1989January ............................. 68.1 76.9 66.3 86.7 84.9February ........................... 71.5 86.0 76.7 90.9 85.5March ................................ 78.3 92.8 84.2 96.0 87.1April .................................. 85.8 94.2 87.3 99.5 87.8May ................................... 83.5 87.3 79.6 100.1 86.6June .................................. 80.3 77.6 74.9 101.5 84.1July ................................... 77.3 74.7 71.1 105.8 82.1August .............................. 77.2 78.2 71.2 101.6 81.5September ........................ 80.3 83.9 81.5 96.0 81.5October ............................. 82.2 91.7 86.4 97.8 85.6November ......................... 84.9 93.4 86.4 97.9 88.3December ......................... 84.5 93.1 86.1 98.1 107.6Average ........................... 77.8 87.4 80.2 96.4 90.0
1990January ............................. 85.8 96.0 88.7 96.5 114.0February ........................... 80.9 89.0 83.9 97.4 96.5March ................................ 80.9 88.6 84.3 102.6 94.9April .................................. 81.7 90.0 85.0 96.5 93.2May ................................... 79.5 84.9 84.6 99.3 90.7June .................................. 74.8 85.0 81.9 100.5 86.4July ................................... 70.5 76.2 79.3 93.5 83.7August .............................. 90.7 89.5 95.3 113.7 98.8September ........................ 108.3 115.8 111.9 122.3 114.2October ............................. 121.0 133.3 128.1 129.7 125.8November ......................... 127.3 134.2 127.1 128.6 124.1December ......................... 119.9 121.9 109.2 128.2 119.7Average ........................... 97.4 102.9 97.0 110.1 106.3
1991January ............................. 110.8 118.4 108.4 129.3 117.1February ........................... 97.3 112.0 102.9 122.8 110.5March ................................ 84.0 95.3 88.8 109.5 102.6April .................................. 83.4 93.5 86.4 101.9 96.9May ................................... 84.4 94.9 86.5 101.3 92.5June .................................. 83.4 91.7 85.6 98.2 89.3July ................................... 80.0 85.5 83.6 98.6 86.6August .............................. 84.6 92.6 87.3 96.8 87.0September ........................ 87.4 93.5 90.8 92.4 89.7October ............................. 87.6 95.2 89.1 91.3 94.0November ......................... 93.3 99.5 90.6 96.0 98.0December ......................... 94.7 96.2 87.0 95.2 95.9Average ........................... 95.1 101.6 93.3 105.0 101.9
1992January ............................. 86.1 92.0 85.3 92.7 94.2February ........................... 79.2 90.9 83.5 91.1 94.2March ................................ 82.2 91.8 82.6 93.0 93.2April .................................. 84.2 92.0 85.5 92.1 92.5May ................................... 86.1 94.3 88.9 93.6 92.3June .................................. 84.6 90.6 89.2 93.9 92.0July ................................... 86.1 88.0 87.3 93.0 90.4August .............................. 79.4 84.0 84.0 96.8 88.6September ........................ 86.0 90.3 87.6 93.4 90.1October ............................. 89.6 94.5 91.7 96.8 93.7November ......................... 91.7 98.7 92.8 97.7 94.8December ......................... 86.8 99.7 91.5 95.8 94.5Average ........................... 85.7 94.3 87.8 94.0 93.4
NA=Not available. Notes: • States are grouped in Tables 9.8a, 9.8b, and 9.8c by geographic
region of the country. • Prices prior to 1983 are Energy Information
Administration (EIA) estimates. See Note 6 at end of section.Sources: See end of section.
Energy Information Administration/Historical Monthly Energy Review 1973-1992286

Table 9.9 Electricity Retail Prices, 1973-1992
(Cents per Kilowatthour)
Residential Commercial Industrial Othera Totalb
MonthlySeriesc
AnnualSeries
MonthlySeriesc
AnnualSeries
MonthlySeriesc
AnnualSeries
MonthlySeriesc
AnnualSeries
MonthlySeriesc
AnnualSeries
1973January ............................. – – – – – – – – – –February ........................... – – – – – – – – – –March ................................ – – – – – – – – – –April .................................. – – – – – – – – – –May ................................... – – – – – – – – – –June .................................. – – – – – – – – – –July ................................... – – – – – – – – – –August .............................. – – – – – – – – – –September ........................ – – – – – – – – – –October ............................. – – – – – – – – – –November ......................... – – – – – – – – – –December ......................... – – – – – – – – – –Average ........................... 2.5 NA 2.4 NA 1.3 NA 2.1 NA 2.0 NA
1974January ............................. – – – – – – – – – –February ........................... – – – – – – – – – –March ................................ – – – – – – – – – –April .................................. – – – – – – – – – –May ................................... – – – – – – – – – –June .................................. – – – – – – – – – –July ................................... – – – – – – – – – –August .............................. – – – – – – – – – –September ........................ – – – – – – – – – –October ............................. – – – – – – – – – –November ......................... – – – – – – – – – –December ......................... – – – – – – – – – –Average ........................... 3.1 NA 3.0 NA 1.7 NA 2.8 NA 2.5 NA
1975January ............................. – – – – – – – – – –February ........................... – – – – – – – – – –March ................................ – – – – – – – – – –April .................................. – – – – – – – – – –May ................................... – – – – – – – – – –June .................................. – – – – – – – – – –July ................................... – – – – – – – – – –August .............................. – – – – – – – – – –September ........................ – – – – – – – – – –October ............................. – – – – – – – – – –November ......................... – – – – – – – – – –December ......................... – – – – – – – – – –Average ........................... 3.5 NA 3.5 NA 2.1 NA 3.1 NA 2.9 NA
1976January ............................. – – – – – – – – – –February ........................... – – – – – – – – – –March ................................ – – – – – – – – – –April .................................. – – – – – – – – – –May ................................... – – – – – – – – – –June .................................. – – – – – – – – – –July ................................... 3.9 – 3.7 – 2.3 – 3.3 – 3.0 –August .............................. 3.7 – 3.6 – 2.2 – 3.2 – 3.0 –September ........................ 3.8 – 3.7 – 2.2 – 3.3 – 3.1 –October ............................. 3.9 – 3.8 – 2.2 – 3.4 – 3.2 –November ......................... 3.8 – 3.8 – 2.2 – 3.3 – 3.1 –December ......................... 3.6 – 3.7 – 2.3 – 3.3 – 3.1 –Average ........................... 3.7 NA 3.7 NA 2.2 NA 3.3 NA 3.1 NA
1977January ............................. 3.6 – 3.8 – 2.4 – 3.4 – 3.2 –February ........................... 3.7 – 3.9 – 2.4 – 3.5 – 3.3 –March ................................ 4.0 – 4.0 – 2.4 – 3.4 – 3.3 –April .................................. 4.1 – 4.0 – 2.4 – 3.5 – 3.3 –May ................................... 4.2 – 4.1 – 2.5 – 3.6 – 3.4 –June .................................. 4.2 – 4.1 – 2.5 – 3.6 – 3.4 –July ................................... 4.2 – 4.1 – 2.6 – 3.6 – 3.6 –August .............................. 4.4 – 4.4 – 2.6 – 3.7 – 3.7 –September ........................ 4.3 – 4.2 – 2.6 – 3.6 – 3.6 –October ............................. 4.3 – 4.3 – 2.6 – 3.5 – 3.5 –November ......................... 4.2 – 4.2 – 2.6 – 3.6 – 3.5 –December ......................... 4.0 – 4.1 – 2.5 – 3.3 – 3.4 –Average ........................... 4.1 NA 4.1 NA 2.5 NA 3.5 NA 3.4 NA
See footnotes at end of table.
Energy Information Administration/Historical Monthly Energy Review 1973-1992 287
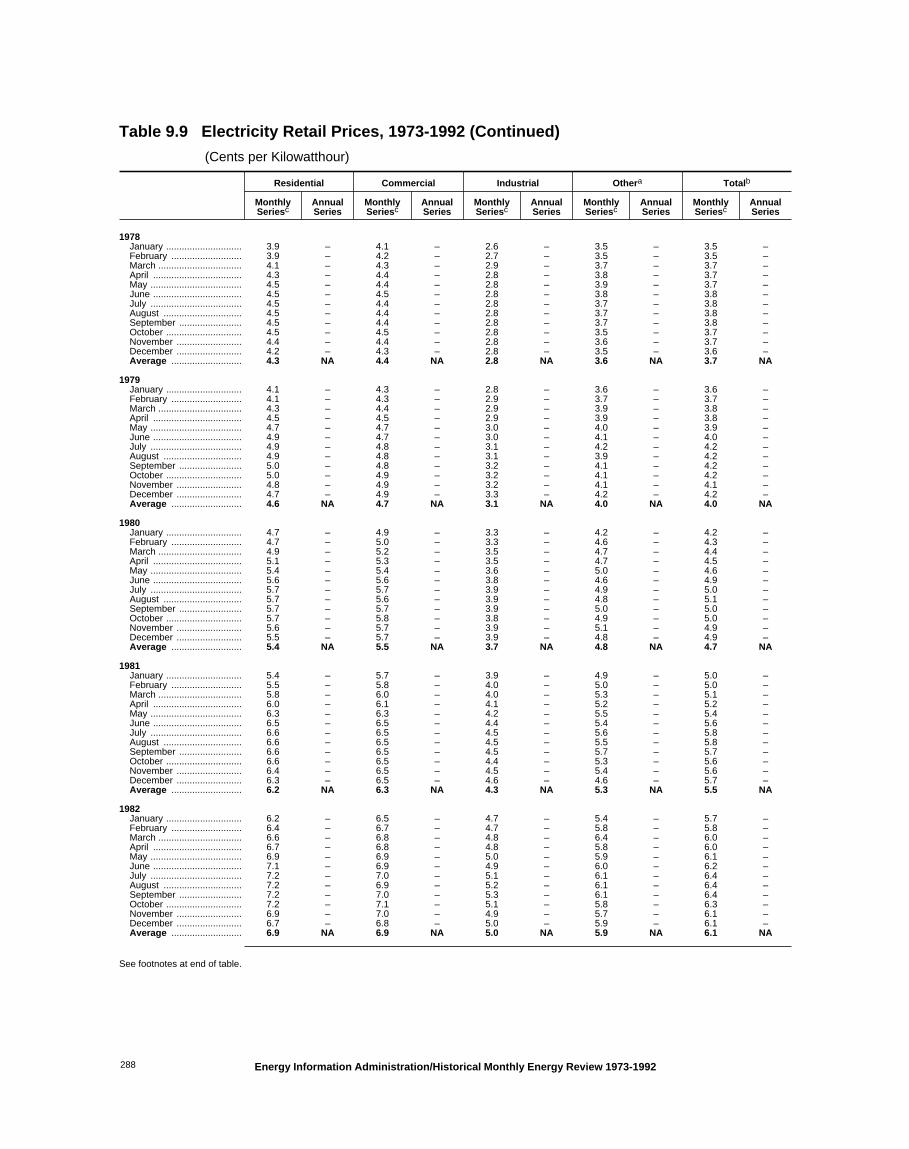
Table 9.9 Electricity Retail Prices, 1973-1992 (Continued)
(Cents per Kilowatthour)
Residential Commercial Industrial Othera Totalb
MonthlySeriesc
AnnualSeries
MonthlySeriesc
AnnualSeries
MonthlySeriesc
AnnualSeries
MonthlySeriesc
AnnualSeries
MonthlySeriesc
AnnualSeries
1978January ............................. 3.9 – 4.1 – 2.6 – 3.5 – 3.5 –February ........................... 3.9 – 4.2 – 2.7 – 3.5 – 3.5 –March ................................ 4.1 – 4.3 – 2.9 – 3.7 – 3.7 –April .................................. 4.3 – 4.4 – 2.8 – 3.8 – 3.7 –May ................................... 4.5 – 4.4 – 2.8 – 3.9 – 3.7 –June .................................. 4.5 – 4.5 – 2.8 – 3.8 – 3.8 –July ................................... 4.5 – 4.4 – 2.8 – 3.7 – 3.8 –August .............................. 4.5 – 4.4 – 2.8 – 3.7 – 3.8 –September ........................ 4.5 – 4.4 – 2.8 – 3.7 – 3.8 –October ............................. 4.5 – 4.5 – 2.8 – 3.5 – 3.7 –November ......................... 4.4 – 4.4 – 2.8 – 3.6 – 3.7 –December ......................... 4.2 – 4.3 – 2.8 – 3.5 – 3.6 –Average ........................... 4.3 NA 4.4 NA 2.8 NA 3.6 NA 3.7 NA
1979January ............................. 4.1 – 4.3 – 2.8 – 3.6 – 3.6 –February ........................... 4.1 – 4.3 – 2.9 – 3.7 – 3.7 –March ................................ 4.3 – 4.4 – 2.9 – 3.9 – 3.8 –April .................................. 4.5 – 4.5 – 2.9 – 3.9 – 3.8 –May ................................... 4.7 – 4.7 – 3.0 – 4.0 – 3.9 –June .................................. 4.9 – 4.7 – 3.0 – 4.1 – 4.0 –July ................................... 4.9 – 4.8 – 3.1 – 4.2 – 4.2 –August .............................. 4.9 – 4.8 – 3.1 – 3.9 – 4.2 –September ........................ 5.0 – 4.8 – 3.2 – 4.1 – 4.2 –October ............................. 5.0 – 4.9 – 3.2 – 4.1 – 4.2 –November ......................... 4.8 – 4.9 – 3.2 – 4.1 – 4.1 –December ......................... 4.7 – 4.9 – 3.3 – 4.2 – 4.2 –Average ........................... 4.6 NA 4.7 NA 3.1 NA 4.0 NA 4.0 NA
1980January ............................. 4.7 – 4.9 – 3.3 – 4.2 – 4.2 –February ........................... 4.7 – 5.0 – 3.3 – 4.6 – 4.3 –March ................................ 4.9 – 5.2 – 3.5 – 4.7 – 4.4 –April .................................. 5.1 – 5.3 – 3.5 – 4.7 – 4.5 –May ................................... 5.4 – 5.4 – 3.6 – 5.0 – 4.6 –June .................................. 5.6 – 5.6 – 3.8 – 4.6 – 4.9 –July ................................... 5.7 – 5.7 – 3.9 – 4.9 – 5.0 –August .............................. 5.7 – 5.6 – 3.9 – 4.8 – 5.1 –September ........................ 5.7 – 5.7 – 3.9 – 5.0 – 5.0 –October ............................. 5.7 – 5.8 – 3.8 – 4.9 – 5.0 –November ......................... 5.6 – 5.7 – 3.9 – 5.1 – 4.9 –December ......................... 5.5 – 5.7 – 3.9 – 4.8 – 4.9 –Average ........................... 5.4 NA 5.5 NA 3.7 NA 4.8 NA 4.7 NA
1981January ............................. 5.4 – 5.7 – 3.9 – 4.9 – 5.0 –February ........................... 5.5 – 5.8 – 4.0 – 5.0 – 5.0 –March ................................ 5.8 – 6.0 – 4.0 – 5.3 – 5.1 –April .................................. 6.0 – 6.1 – 4.1 – 5.2 – 5.2 –May ................................... 6.3 – 6.3 – 4.2 – 5.5 – 5.4 –June .................................. 6.5 – 6.5 – 4.4 – 5.4 – 5.6 –July ................................... 6.6 – 6.5 – 4.5 – 5.6 – 5.8 –August .............................. 6.6 – 6.5 – 4.5 – 5.5 – 5.8 –September ........................ 6.6 – 6.5 – 4.5 – 5.7 – 5.7 –October ............................. 6.6 – 6.5 – 4.4 – 5.3 – 5.6 –November ......................... 6.4 – 6.5 – 4.5 – 5.4 – 5.6 –December ......................... 6.3 – 6.5 – 4.6 – 4.6 – 5.7 –Average ........................... 6.2 NA 6.3 NA 4.3 NA 5.3 NA 5.5 NA
1982January ............................. 6.2 – 6.5 – 4.7 – 5.4 – 5.7 –February ........................... 6.4 – 6.7 – 4.7 – 5.8 – 5.8 –March ................................ 6.6 – 6.8 – 4.8 – 6.4 – 6.0 –April .................................. 6.7 – 6.8 – 4.8 – 5.8 – 6.0 –May ................................... 6.9 – 6.9 – 5.0 – 5.9 – 6.1 –June .................................. 7.1 – 6.9 – 4.9 – 6.0 – 6.2 –July ................................... 7.2 – 7.0 – 5.1 – 6.1 – 6.4 –August .............................. 7.2 – 6.9 – 5.2 – 6.1 – 6.4 –September ........................ 7.2 – 7.0 – 5.3 – 6.1 – 6.4 –October ............................. 7.2 – 7.1 – 5.1 – 5.8 – 6.3 –November ......................... 6.9 – 7.0 – 4.9 – 5.7 – 6.1 –December ......................... 6.7 – 6.8 – 5.0 – 5.9 – 6.1 –Average ........................... 6.9 NA 6.9 NA 5.0 NA 5.9 NA 6.1 NA
See footnotes at end of table.
Energy Information Administration/Historical Monthly Energy Review 1973-1992288
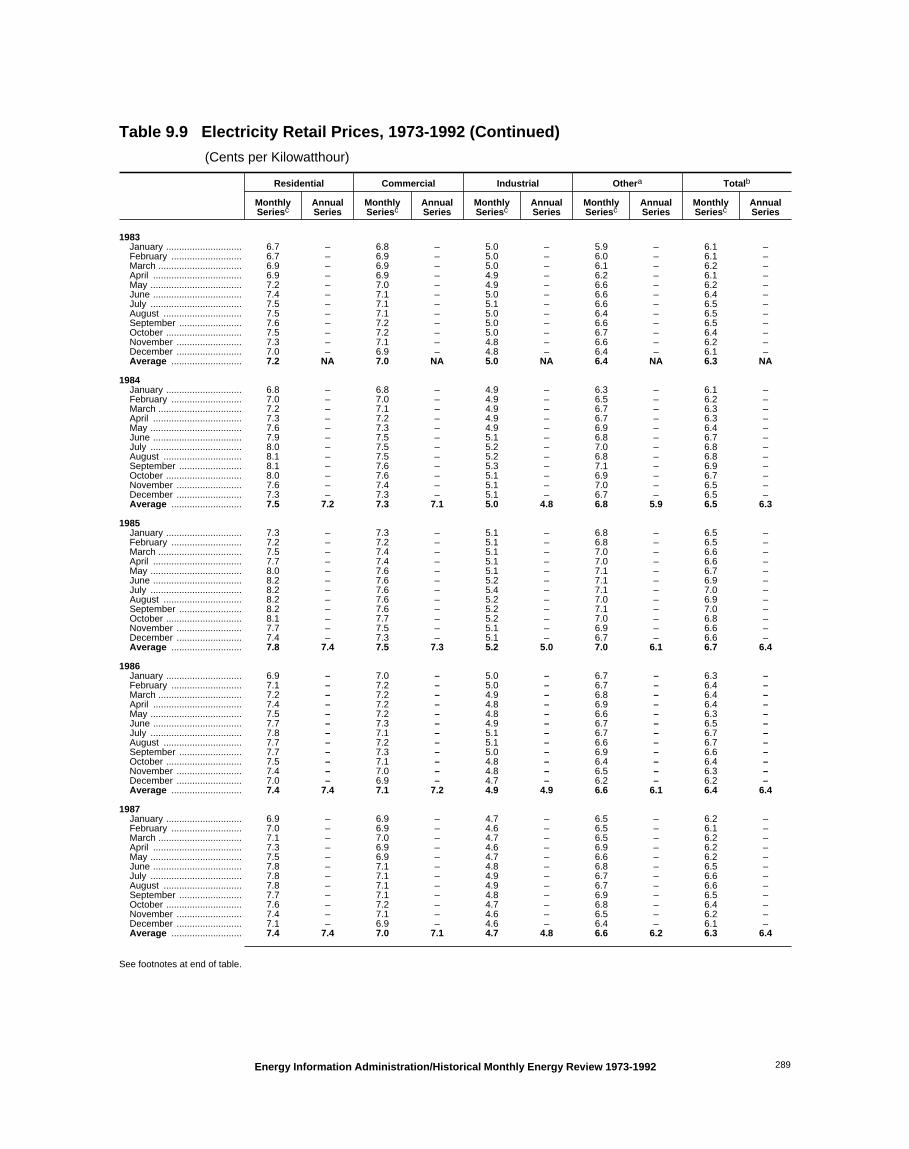
Table 9.9 Electricity Retail Prices, 1973-1992 (Continued)
(Cents per Kilowatthour)
Residential Commercial Industrial Othera Totalb
MonthlySeriesc
AnnualSeries
MonthlySeriesc
AnnualSeries
MonthlySeriesc
AnnualSeries
MonthlySeriesc
AnnualSeries
MonthlySeriesc
AnnualSeries
1983January ............................. 6.7 – 6.8 – 5.0 – 5.9 – 6.1 –February ........................... 6.7 – 6.9 – 5.0 – 6.0 – 6.1 –March ................................ 6.9 – 6.9 – 5.0 – 6.1 – 6.2 –April .................................. 6.9 – 6.9 – 4.9 – 6.2 – 6.1 –May ................................... 7.2 – 7.0 – 4.9 – 6.6 – 6.2 –June .................................. 7.4 – 7.1 – 5.0 – 6.6 – 6.4 –July ................................... 7.5 – 7.1 – 5.1 – 6.6 – 6.5 –August .............................. 7.5 – 7.1 – 5.0 – 6.4 – 6.5 –September ........................ 7.6 – 7.2 – 5.0 – 6.6 – 6.5 –October ............................. 7.5 – 7.2 – 5.0 – 6.7 – 6.4 –November ......................... 7.3 – 7.1 – 4.8 – 6.6 – 6.2 –December ......................... 7.0 – 6.9 – 4.8 – 6.4 – 6.1 –Average ........................... 7.2 NA 7.0 NA 5.0 NA 6.4 NA 6.3 NA
1984January ............................. 6.8 – 6.8 – 4.9 – 6.3 – 6.1 –February ........................... 7.0 – 7.0 – 4.9 – 6.5 – 6.2 –March ................................ 7.2 – 7.1 – 4.9 – 6.7 – 6.3 –April .................................. 7.3 – 7.2 – 4.9 – 6.7 – 6.3 –May ................................... 7.6 – 7.3 – 4.9 – 6.9 – 6.4 –June .................................. 7.9 – 7.5 – 5.1 – 6.8 – 6.7 –July ................................... 8.0 – 7.5 – 5.2 – 7.0 – 6.8 –August .............................. 8.1 – 7.5 – 5.2 – 6.8 – 6.8 –September ........................ 8.1 – 7.6 – 5.3 – 7.1 – 6.9 –October ............................. 8.0 – 7.6 – 5.1 – 6.9 – 6.7 –November ......................... 7.6 – 7.4 – 5.1 – 7.0 – 6.5 –December ......................... 7.3 – 7.3 – 5.1 – 6.7 – 6.5 –Average ........................... 7.5 7.2 7.3 7.1 5.0 4.8 6.8 5.9 6.5 6.3
1985January ............................. 7.3 – 7.3 – 5.1 – 6.8 – 6.5 –February ........................... 7.2 – 7.2 – 5.1 – 6.8 – 6.5 –March ................................ 7.5 – 7.4 – 5.1 – 7.0 – 6.6 –April .................................. 7.7 – 7.4 – 5.1 – 7.0 – 6.6 –May ................................... 8.0 – 7.6 – 5.1 – 7.1 – 6.7 –June .................................. 8.2 – 7.6 – 5.2 – 7.1 – 6.9 –July ................................... 8.2 – 7.6 – 5.4 – 7.1 – 7.0 –August .............................. 8.2 – 7.6 – 5.2 – 7.0 – 6.9 –September ........................ 8.2 – 7.6 – 5.2 – 7.1 – 7.0 –October ............................. 8.1 – 7.7 – 5.2 – 7.0 – 6.8 –November ......................... 7.7 – 7.5 – 5.1 – 6.9 – 6.6 –December ......................... 7.4 – 7.3 – 5.1 – 6.7 – 6.6 –Average ........................... 7.8 7.4 7.5 7.3 5.2 5.0 7.0 6.1 6.7 6.4
1986January ............................. 6.9 – 7.0 – 5.0 – 6.7 – 6.3 –February ........................... 7.1 – 7.2 – 5.0 – 6.7 – 6.4 –March ................................ 7.2 – 7.2 – 4.9 – 6.8 – 6.4 –April .................................. 7.4 – 7.2 – 4.8 – 6.9 – 6.4 –May ................................... 7.5 – 7.2 – 4.8 – 6.6 – 6.3 –June .................................. 7.7 – 7.3 – 4.9 – 6.7 – 6.5 –July ................................... 7.8 – 7.1 – 5.1 – 6.7 – 6.7 –August .............................. 7.7 – 7.2 – 5.1 – 6.6 – 6.7 –September ........................ 7.7 – 7.3 – 5.0 – 6.9 – 6.6 –October ............................. 7.5 – 7.1 – 4.8 – 6.4 – 6.4 –November ......................... 7.4 – 7.0 – 4.8 – 6.5 – 6.3 –December ......................... 7.0 – 6.9 – 4.7 – 6.2 – 6.2 –Average ........................... 7.4 7.4 7.1 7.2 4.9 4.9 6.6 6.1 6.4 6.4
1987January ............................. 6.9 – 6.9 – 4.7 – 6.5 – 6.2 –February ........................... 7.0 – 6.9 – 4.6 – 6.5 – 6.1 –March ................................ 7.1 – 7.0 – 4.7 – 6.5 – 6.2 –April .................................. 7.3 – 6.9 – 4.6 – 6.9 – 6.2 –May ................................... 7.5 – 6.9 – 4.7 – 6.6 – 6.2 –June .................................. 7.8 – 7.1 – 4.8 – 6.8 – 6.5 –July ................................... 7.8 – 7.1 – 4.9 – 6.7 – 6.6 –August .............................. 7.8 – 7.1 – 4.9 – 6.7 – 6.6 –September ........................ 7.7 – 7.1 – 4.8 – 6.9 – 6.5 –October ............................. 7.6 – 7.2 – 4.7 – 6.8 – 6.4 –November ......................... 7.4 – 7.1 – 4.6 – 6.5 – 6.2 –December ......................... 7.1 – 6.9 – 4.6 – 6.4 – 6.1 –Average ........................... 7.4 7.4 7.0 7.1 4.7 4.8 6.6 6.2 6.3 6.4
See footnotes at end of table.
Energy Information Administration/Historical Monthly Energy Review 1973-1992 289

Table 9.9 Electricity Retail Prices, 1973-1992 (Continued)
(Cents per Kilowatthour)
Residential Commercial Industrial Othera Totalb
MonthlySeriesc
AnnualSeries
MonthlySeriesc
AnnualSeries
MonthlySeriesc
AnnualSeries
MonthlySeriesc
AnnualSeries
MonthlySeriesc
AnnualSeries
1988January ............................. 6.9 – 6.8 – 4.5 – 6.4 – 6.1 –February ........................... 7.0 – 6.9 – 4.5 – 6.5 – 6.1 –March ................................ 7.1 – 6.9 – 4.5 – 6.4 – 6.1 –April .................................. 7.3 – 6.9 – 4.5 – 6.1 – 6.1 –May ................................... 7.6 – 7.0 – 4.5 – 5.9 – 6.1 –June .................................. 7.8 – 7.2 – 4.7 – 5.9 – 6.4 –July ................................... 7.9 – 7.2 – 4.9 – 5.5 – 6.6 –August .............................. 7.9 – 7.3 – 4.9 – 5.4 – 6.7 –September ........................ 7.8 – 7.3 – 4.8 – 5.9 – 6.6 –October ............................. 7.7 – 7.3 – 4.7 – 6.2 – 6.4 –November ......................... 7.5 – 7.0 – 4.5 – 6.3 – 6.2 –December ......................... 7.3 – 6.9 – 4.5 – 6.6 – 6.2 –Average ........................... 7.5 7.5 7.1 7.0 4.6 4.7 6.0 6.2 6.3 6.4
1989January ............................. 7.2 – 6.9 – 4.5 – 6.5 – 6.2 –February ........................... 7.2 – 7.0 – 4.6 – 6.7 – 6.2 –March ................................ 7.2 – 7.0 – 4.6 – 6.6 – 6.2 –April .................................. 7.5 – 7.1 – 4.6 – 6.5 – 6.3 –May ................................... 7.7 – 7.2 – 4.6 – 6.3 – 6.3 –June .................................. 8.0 – 7.4 – 4.8 – 5.7 – 6.6 –July ................................... 8.1 – 7.5 – 5.0 – 5.6 – 6.8 –August .............................. 8.1 – 7.5 – 5.0 – 5.6 – 6.8 –September ........................ 8.0 – 7.5 – 4.9 – 6.1 – 6.7 –October ............................. 7.9 – 7.5 – 4.7 – 6.5 – 6.5 –November ......................... 7.5 – 7.1 – 4.5 – 6.5 – 6.2 –December ......................... 7.3 – 7.0 – 4.6 – 6.6 – 6.3 –Average ........................... 7.6 7.6 7.2 7.2 4.7 4.7 6.2 6.2 6.4 6.5
1990January ............................. 7.2 – 6.9 – 4.6 – 5.8 – 6.3 –February ........................... 7.5 – 7.1 – 4.6 – 5.9 – 6.3 –March ................................ 7.6 – 7.2 – 4.6 – 6.0 – 6.4 –April .................................. 7.7 – 7.2 – 4.6 – 6.3 – 6.4 –May ................................... 8.0 – 7.3 – 4.6 – 6.2 – 6.5 –June .................................. 8.1 – 7.5 – 4.8 – 6.3 – 6.7 –July ................................... 8.2 – 7.5 – 5.0 – 6.3 – 6.9 –August .............................. 8.3 – 7.5 – 5.0 – 6.1 – 6.9 –September ........................ 8.2 – 7.5 – 5.0 – 6.3 – 6.9 –October ............................. 8.1 – 7.6 – 4.8 – 6.3 – 6.7 –November ......................... 7.8 – 7.3 – 4.6 – 6.3 – 6.5 –December ......................... 7.6 – 7.2 – 4.6 – 6.5 – 6.4 –Average ........................... 7.8 7.8 7.3 7.3 4.7 4.7 6.2 6.4 6.6 6.6
1991January ............................. 7.4 – 7.1 – 4.6 – 6.4 – 6.4 –February ........................... 7.6 – 7.3 – 4.7 – 6.5 – 6.5 –March ................................ 7.8 – 7.3 – 4.7 – 6.4 – 6.6 –April .................................. 8.0 – 7.3 – 4.7 – 6.4 – 6.5 –May ................................... 8.2 – 7.5 – 4.7 – 6.3 – 6.6 –June .................................. 8.3 – 7.6 – 5.0 – 6.4 – 6.9 –July ................................... 8.4 – 7.7 – 5.1 – 6.5 – 7.1 –August .............................. 8.4 – 7.7 – 5.1 – 6.4 – 7.1 –September ........................ 8.4 – 7.7 – 5.1 – 6.5 – 7.0 –October ............................. 8.3 – 7.8 – 4.9 – 6.6 – 6.9 –November ......................... 8.0 – 7.4 – 4.7 – 6.5 – 6.6 –December ......................... 7.8 – 7.3 – 4.7 – 6.4 – 6.6 –Average ........................... 8.1 8.0 7.5 7.5 4.8 4.8 6.4 6.5 6.8 6.7
1992January ............................. 7.7 – 7.3 – 4.7 – 6.5 – 6.6 –February ........................... 7.8 – 7.4 – 4.7 – 6.3 – 6.6 –March ................................ 8.0 – 7.4 – 4.7 – 6.5 – 6.6 –April .................................. 8.0 – 7.4 – 4.7 – 6.4 – 6.6 –May ................................... 8.4 – 7.6 – 4.8 – 6.5 – 6.7 –June .................................. 8.6 – 7.9 – 4.9 – 6.9 – 7.0 –July ................................... 8.6 – 7.9 – 5.1 – 6.9 – 7.2 –August .............................. 8.6 – 7.9 – 5.1 – 6.9 – 7.2 –September ........................ 8.6 – 8.0 – 5.1 – 6.9 – 7.2 –October ............................. 8.5 – 7.9 – 4.9 – 6.9 – 6.9 –November ......................... 8.2 – 7.5 – 4.7 – 6.7 – 6.6 –December ......................... 7.9 – 7.4 – 4.7 – 6.6 – 6.7 –Average ........................... 8.2 8.2 7.6 7.7 4.8 4.8 6.7 6.7 6.8 6.8
a "Other" is public street and highway lighting, other sales to publicauthorities, sales to railroads and railways, and interdepartmental sales.
b Average price for total sales to ultimate consumers.c Annual values are the sum of the monthly revenue divided by the sum of
the monthly sales. Data through 1979 cover privately owned electric utilitiesin Classes A and B. Data for 1980-1985 cover selected privately ownedelectric utilities in Class A whose electric operating revenue was $100 millionor more during the previous year. See Note 7 at end of section.
NA=Not available. – =Not applicable. Notes: • Prices are calculated by dividing revenue by sales. Revenue
may not correspond to sales for a particular month because of electric utilitybilling and accounting procedures. That lack of correspondence could resultin uncharacteristic increases or decreases in the monthly prices. See Note 7at end of section. • Geographic coverage is the 50 States and the District ofColumbia.
Sources: See end of section.
Energy Information Administration/Historical Monthly Energy Review 1973-1992290

Table 9.10 Quantity and Cost of Fossil-Fuel Receipts at Steam-Electric Utility Plants, 1973-1992
Coal Petroleum GasaAll Fossil
Fuelsb
Quantity(thousandshort tons)
Cost(cents per
million Btu)
Heavy Oilb Totalb,c
Quantity(million
cubic feet)
Cost(cents per
million Btu)
Cost(cents per million Btu)
Quantity(thousand
barrels)
Cost(cents per
million Btu)
Quantity(thousand
barrels)
Cost(cents per
million Btu)
1973January ................... 29,767 37.8 45,116 65.8 47,218 66.9 209,637 29.9 43.6February ................. 28,649 38.5 40,610 66.5 42,364 67.7 207,204 31.1 43.9March ...................... 31,115 38.9 43,179 67.8 44,326 68.4 243,389 31.9 44.1April ........................ 30,063 39.4 35,362 68.7 36,501 69.4 250,102 33.3 43.9May ......................... 34,125 39.5 38,148 70.2 39,559 71.0 295,689 33.7 44.0June ........................ 31,114 40.0 40,362 69.2 42,316 70.8 340,451 33.8 44.5July ......................... 29,017 39.8 45,696 71.7 47,980 72.8 385,183 33.7 45.3August .................... 34,870 39.8 48,608 74.9 51,260 76.9 382,413 33.9 46.1September .............. 31,267 40.8 47,561 79.4 50,205 81.8 326,367 34.9 48.8October ................... 33,573 41.9 43,128 86.1 45,473 88.5 302,647 35.5 50.2November ............... 31,194 44.0 43,954 102.3 46,091 104.0 236,521 35.7 56.3December ............... 30,088 45.5 40,926 118.5 42,568 120.4 203,073 36.3 61.2Average ................. 374,842 40.5 512,650 78.5 535,859 80.0 3,382,677 33.8 47.6
1974January ................... 30,328 51.4 41,096 157.1 43,399 161.4 207,423 37.3 74.4February ................. 29,660 56.9 36,105 183.4 37,864 185.4 192,223 39.8 81.5March ...................... 35,291 60.8 36,351 186.3 37,935 187.3 237,477 42.5 80.9April ........................ 33,604 64.0 33,284 184.6 34,255 184.9 240,124 43.6 81.1May ......................... 35,795 65.9 34,730 185.8 36,164 185.6 288,784 44.0 81.3June ........................ 31,524 69.7 37,400 192.4 38,750 192.9 317,110 47.9 87.5July ......................... 32,016 72.9 44,070 192.5 46,916 194.6 369,084 49.8 92.2August .................... 33,055 77.3 44,670 192.6 46,997 194.2 352,869 51.8 95.2September .............. 34,609 79.1 40,681 192.5 42,662 193.4 289,927 52.4 95.8October ................... 38,887 80.8 42,750 196.3 48,394 198.7 292,214 53.6 99.3November ............... 24,852 90.2 42,862 197.6 49,533 200.3 234,709 54.7 113.3December ............... 25,248 88.7 45,167 202.5 52,348 204.3 203,258 55.4 116.9Average ................. 384,868 70.9 479,166 189.0 515,217 191.0 3,225,203 48.2 91.4
1975January ................... 34,580 80.7 44,330 197.1 50,710 199.3 197,397 58.6 106.4February ................. 30,559 81.6 38,808 201.4 44,377 202.6 181,091 65.3 108.2March ...................... 33,339 80.5 39,153 203.7 43,219 204.4 202,681 66.5 105.5April ........................ 34,294 80.4 32,518 207.7 36,097 207.8 203,696 68.9 102.2May ......................... 37,056 81.8 34,459 204.4 38,709 204.8 262,429 72.6 102.1June ........................ 38,489 81.4 36,005 199.5 41,477 201.3 296,680 71.2 101.0July ......................... 32,532 80.8 40,651 198.5 45,307 200.4 346,886 74.0 103.9August .................... 37,491 82.1 42,817 200.2 48,131 202.7 347,378 78.8 105.6September .............. 36,787 82.1 37,928 199.9 41,926 202.3 308,214 83.5 104.9October ................... 40,248 81.5 35,692 196.5 38,214 198.9 268,475 85.2 102.1November ............... 38,241 81.7 34,266 200.6 37,183 203.4 219,400 83.5 103.7December ............... 37,911 82.2 40,954 198.5 45,000 201.7 200,479 86.2 108.2Average ................. 431,527 81.4 457,582 200.5 510,352 202.3 3,034,808 75.2 104.4
1976January ................... 35,111 80.2 42,991 193.8 48,722 198.6 196,797 87.6 109.7February ................. 34,953 81.4 40,393 195.3 44,240 198.6 192,179 92.4 109.2March ...................... 39,836 82.7 41,891 197.5 45,775 200.2 214,530 94.8 108.8April ........................ 38,147 83.7 35,980 196.9 39,479 199.6 219,003 97.2 107.6May ......................... 39,261 84.6 36,874 188.4 40,688 192.1 255,777 100.7 107.3June ........................ 39,523 84.7 38,961 187.5 42,873 191.5 295,631 104.0 108.4July ......................... 31,568 85.8 43,678 187.1 47,854 191.2 323,532 105.6 114.6August .................... 35,576 86.4 43,516 191.8 48,391 195.8 319,231 105.8 114.3September .............. 40,860 86.9 40,446 191.9 44,916 195.7 284,426 109.4 112.0October ................... 40,078 86.9 37,172 198.4 41,910 202.6 240,193 110.3 112.7November ............... 40,135 86.6 43,616 203.2 48,633 207.0 211,924 113.8 116.8December ............... 39,811 86.6 49,846 207.1 56,491 211.8 209,587 111.7 121.0Average ................. 454,858 84.8 495,363 195.2 549,973 199.0 2,962,811 103.4 111.9
1977January ................... 31,281 85.9 50,722 217.0 60,062 223.3 199,170 111.4 130.7February ................. 34,942 88.0 50,277 223.4 56,536 228.5 195,798 123.4 130.9March ...................... 44,459 90.0 47,854 227.9 53,528 232.3 225,084 121.0 125.4April ........................ 41,582 90.1 41,265 226.3 45,321 229.8 213,700 125.8 123.6May ......................... 44,193 91.8 45,445 222.7 50,920 227.4 252,971 125.3 125.2June ........................ 44,433 93.3 47,147 217.9 52,692 222.6 303,555 129.8 126.7July ......................... 38,076 96.2 54,232 217.1 64,423 224.8 335,582 130.6 136.4August .................... 45,305 94.3 55,230 217.0 62,479 222.7 343,152 133.8 131.4September .............. 45,862 98.0 45,710 218.0 50,873 222.7 319,962 136.8 129.7October ................... 46,733 100.5 39,679 220.0 43,315 223.8 274,626 138.2 128.4November ............... 48,264 101.7 38,653 216.5 42,077 220.7 228,094 133.4 126.5December ............... 25,285 106.8 47,470 214.5 53,330 220.7 214,709 129.1 146.1Average ................. 490,415 94.7 563,685 219.8 635,556 224.9 3,106,403 129.1 129.7
See footnotes at end of table.
Energy Information Administration/Historical Monthly Energy Review 1973-1992 291

Table 9.10 Quantity and Cost of Fossil-Fuel Receipts at Steam-Electric Utility Plants, 1973-1992 (Continued)
Coal Petroleum GasaAll Fossil
Fuelsb
Quantity(thousandshort tons)
Cost(cents per
million Btu)
Heavy Oilb Totalb,c
Quantity(million
cubic feet)
Cost(cents per
million Btu)
Cost(cents per million Btu)
Quantity(thousand
barrels)
Cost(cents per
million Btu)
Quantity(thousand
barrels)
Cost(cents per
million Btu)
1978January ................... 15,172 99.6 50,254 211.3 59,174 220.2 225,964 131.9 157.1February ................. 16,620 102.1 50,853 208.0 63,840 220.6 202,694 134.7 159.7March ...................... 26,209 113.4 54,081 209.8 64,755 219.6 227,625 139.3 154.9April ........................ 44,767 110.9 43,904 213.3 47,738 217.5 236,500 138.6 136.4May ......................... 50,743 110.6 41,878 213.9 45,267 217.8 252,618 141.4 133.8June ........................ 48,438 112.0 42,831 210.1 48,052 216.0 313,228 147.1 137.3July ......................... 43,883 110.2 45,727 205.3 50,818 211.3 355,586 148.0 138.3August .................... 48,602 110.0 48,580 205.8 53,379 211.1 333,052 147.7 137.0September .............. 44,435 111.4 42,315 208.6 47,251 215.0 286,982 145.1 137.4October ................... 46,339 114.0 40,853 218.0 43,526 221.5 256,202 145.5 138.3November ............... 47,153 115.6 40,422 223.0 43,372 227.4 230,069 139.7 138.9December ............... 43,805 115.9 44,498 226.1 48,867 232.0 220,135 138.3 143.2Average ................. 476,169 111.6 546,197 212.5 616,040 219.1 3,140,654 142.2 141.1
1979January ................... 39,377 115.8 49,368 228.3 52,479 232.0 217,154 150.2 148.3February ................. 36,651 114.6 43,723 240.6 47,357 245.6 210,327 159.1 151.8March ...................... 46,878 116.8 43,538 258.6 45,555 261.1 257,232 163.0 150.8April ........................ 45,759 120.1 34,951 264.4 37,806 271.7 244,055 163.7 151.6May ......................... 49,307 121.1 39,435 273.7 42,431 280.7 268,189 177.0 156.9June ........................ 47,135 121.9 36,338 288.6 39,777 303.0 313,281 178.7 161.6July ......................... 42,918 122.2 42,102 310.7 45,345 319.6 358,533 178.1 171.3August .................... 50,960 122.5 43,266 322.3 47,074 333.1 362,375 180.1 169.7September .............. 47,899 125.3 36,426 331.8 39,317 342.9 325,645 182.3 170.3October ................... 52,966 127.4 33,429 344.0 35,354 352.8 312,973 188.1 168.6November ............... 49,055 127.7 35,808 360.8 38,405 371.4 255,878 180.2 174.0December ............... 47,652 129.2 41,322 392.1 44,792 403.5 243,335 183.0 187.2Average ................. 556,558 122.4 479,705 298.8 515,695 307.2 3,368,976 174.9 163.9
1980January ................... 49,852 128.7 40,770 422.2 43,399 429.6 264,900 193.7 190.1February ................. 45,876 129.9 36,580 428.2 38,849 435.9 258,613 203.4 192.7March ...................... 48,520 130.1 34,932 408.6 36,569 415.1 274,236 206.5 186.1April ........................ 49,166 133.8 28,252 397.3 29,739 404.9 249,709 202.5 179.0May ......................... 50,027 133.4 29,862 402.2 31,240 409.3 277,381 210.3 181.9June ........................ 51,153 135.1 28,120 391.7 29,693 399.5 328,618 208.2 180.6July ......................... 44,043 137.4 35,612 393.5 38,688 406.6 413,027 228.1 202.6August .................... 53,780 137.9 36,831 404.0 40,267 417.8 392,652 236.4 198.9September .............. 50,885 138.9 31,260 409.9 33,184 418.6 348,947 236.4 195.2October ................... 52,162 138.1 27,767 449.2 29,344 456.4 291,767 243.0 194.1November ............... 48,233 139.3 29,570 494.9 31,409 500.9 250,172 229.4 202.4December ............... 50,297 137.8 34,604 520.0 36,760 526.8 238,791 224.2 209.3Average ................. 593,995 135.1 394,159 426.7 419,140 435.1 3,588,814 219.9 192.8
1981January ................... 51,021 142.7 37,955 541.1 40,591 550.1 229,106 243.4 223.1February ................. 47,374 146.3 28,155 575.4 30,160 584.0 220,473 257.9 221.6March ...................... 52,446 148.3 26,623 586.5 27,950 593.8 265,430 262.5 217.6April ........................ 29,969 146.9 23,405 571.8 24,350 578.0 284,010 271.6 244.8May ......................... 28,714 146.7 25,715 557.1 27,134 565.5 313,846 281.9 255.0June ........................ 41,383 152.7 29,080 510.9 31,630 526.3 373,926 285.2 239.2July ......................... 51,163 156.5 30,425 501.1 32,573 514.1 402,992 287.0 231.2August .................... 56,509 157.0 27,666 499.7 29,096 509.6 383,945 289.1 222.4September .............. 55,347 157.2 23,136 506.9 24,139 515.1 314,451 285.8 214.9October ................... 57,498 160.2 25,474 516.6 26,251 522.8 296,546 297.7 219.6November ............... 54,640 159.1 22,912 526.1 23,731 532.7 254,281 297.4 217.2December ............... 53,312 156.7 26,931 510.6 27,938 518.2 234,553 287.5 217.9Average ................. 579,374 153.2 327,477 533.4 345,544 542.5 3,573,558 280.5 225.6
1982January ................... 46,293 160.9 27,653 489.2 29,536 502.3 232,251 297.4 229.4February ................. 47,285 164.1 21,972 493.6 23,038 502.8 215,313 307.8 223.1March ...................... 54,158 165.7 25,015 477.1 25,778 482.8 242,071 314.2 221.9April ........................ 50,635 164.6 17,096 487.0 17,827 493.0 241,091 320.7 216.9May ......................... 51,338 165.1 15,552 494.2 16,285 501.9 252,417 327.6 217.7June ........................ 51,178 167.0 16,910 488.3 17,796 498.2 290,880 341.8 226.8July ......................... 45,767 164.5 20,598 477.8 21,548 487.3 345,233 353.3 241.0August .................... 54,847 164.7 19,154 467.1 19,947 475.5 355,387 353.4 230.2September .............. 48,777 165.9 17,186 475.3 17,863 483.0 287,404 354.7 229.4October ................... 51,801 164.9 14,444 490.2 15,047 498.9 267,840 355.9 222.2November ............... 49,551 165.3 14,749 501.0 15,679 512.1 221,869 349.8 220.8December ............... 49,795 162.9 17,870 461.9 18,768 471.9 209,593 352.5 218.8Average ................. 601,427 164.7 228,200 483.2 239,111 492.2 3,161,348 337.6 224.9
See footnotes at end of table.
Energy Information Administration/Historical Monthly Energy Review 1973-1992292
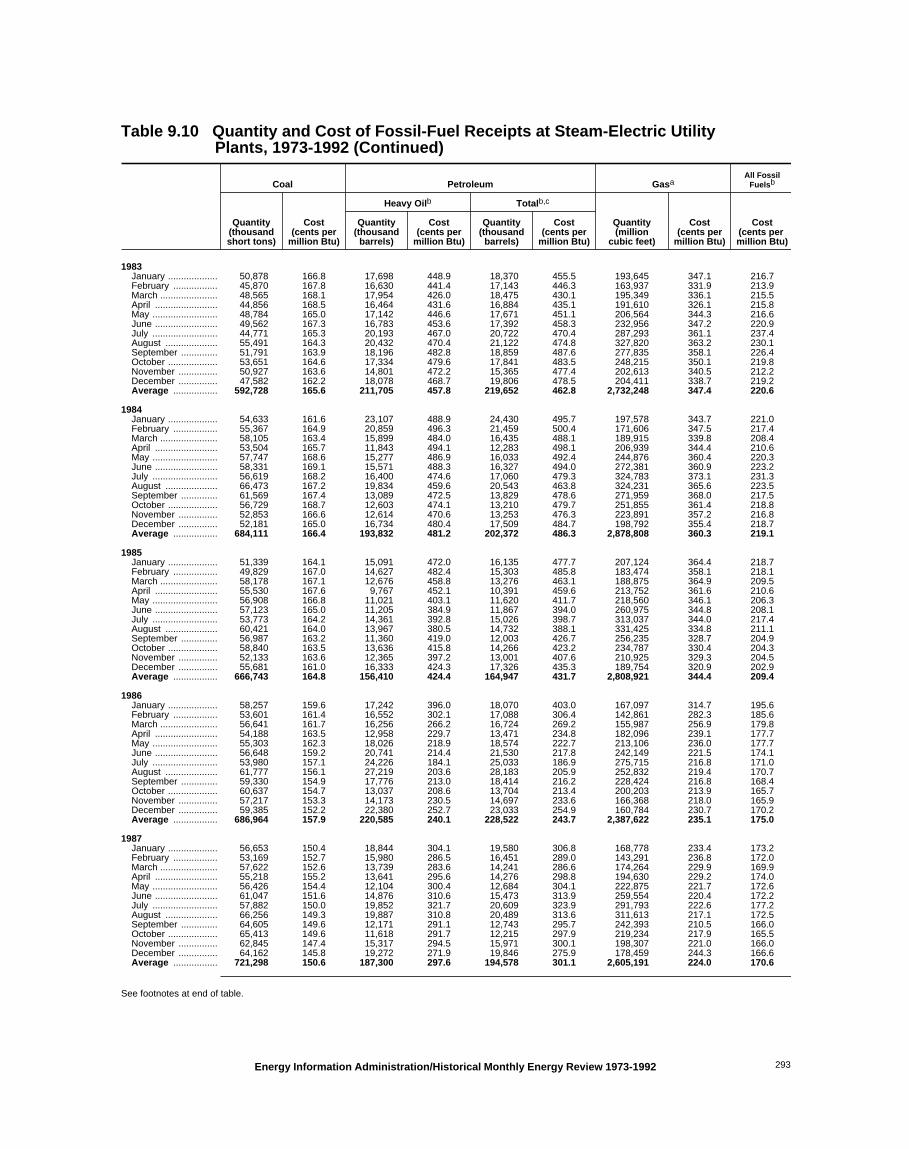
Table 9.10 Quantity and Cost of Fossil-Fuel Receipts at Steam-Electric Utility Plants, 1973-1992 (Continued)
Coal Petroleum GasaAll Fossil
Fuelsb
Quantity(thousandshort tons)
Cost(cents per
million Btu)
Heavy Oilb Totalb,c
Quantity(million
cubic feet)
Cost(cents per
million Btu)
Cost(cents per million Btu)
Quantity(thousand
barrels)
Cost(cents per
million Btu)
Quantity(thousand
barrels)
Cost(cents per
million Btu)
1983January ................... 50,878 166.8 17,698 448.9 18,370 455.5 193,645 347.1 216.7February ................. 45,870 167.8 16,630 441.4 17,143 446.3 163,937 331.9 213.9March ...................... 48,565 168.1 17,954 426.0 18,475 430.1 195,349 336.1 215.5April ........................ 44,856 168.5 16,464 431.6 16,884 435.1 191,610 326.1 215.8May ......................... 48,784 165.0 17,142 446.6 17,671 451.1 206,564 344.3 216.6June ........................ 49,562 167.3 16,783 453.6 17,392 458.3 232,956 347.2 220.9July ......................... 44,771 165.3 20,193 467.0 20,722 470.4 287,293 361.1 237.4August .................... 55,491 164.3 20,432 470.4 21,122 474.8 327,820 363.2 230.1September .............. 51,791 163.9 18,196 482.8 18,859 487.6 277,835 358.1 226.4October ................... 53,651 164.6 17,334 479.6 17,841 483.5 248,215 350.1 219.8November ............... 50,927 163.6 14,801 472.2 15,365 477.4 202,613 340.5 212.2December ............... 47,582 162.2 18,078 468.7 19,806 478.5 204,411 338.7 219.2Average ................. 592,728 165.6 211,705 457.8 219,652 462.8 2,732,248 347.4 220.6
1984January ................... 54,633 161.6 23,107 488.9 24,430 495.7 197,578 343.7 221.0February ................. 55,367 164.9 20,859 496.3 21,459 500.4 171,606 347.5 217.4March ...................... 58,105 163.4 15,899 484.0 16,435 488.1 189,915 339.8 208.4April ........................ 53,504 165.7 11,843 494.1 12,283 498.1 206,939 344.4 210.6May ......................... 57,747 168.6 15,277 486.9 16,033 492.4 244,876 360.4 220.3June ........................ 58,331 169.1 15,571 488.3 16,327 494.0 272,381 360.9 223.2July ......................... 56,619 168.2 16,400 474.6 17,060 479.3 324,783 373.1 231.3August .................... 66,473 167.2 19,834 459.6 20,543 463.8 324,231 365.6 223.5September .............. 61,569 167.4 13,089 472.5 13,829 478.6 271,959 368.0 217.5October ................... 56,729 168.7 12,603 474.1 13,210 479.7 251,855 361.4 218.8November ............... 52,853 166.6 12,614 470.6 13,253 476.3 223,891 357.2 216.8December ............... 52,181 165.0 16,734 480.4 17,509 484.7 198,792 355.4 218.7Average ................. 684,111 166.4 193,832 481.2 202,372 486.3 2,878,808 360.3 219.1
1985January ................... 51,339 164.1 15,091 472.0 16,135 477.7 207,124 364.4 218.7February ................. 49,829 167.0 14,627 482.4 15,303 485.8 183,474 358.1 218.1March ...................... 58,178 167.1 12,676 458.8 13,276 463.1 188,875 364.9 209.5April ........................ 55,530 167.6 9,767 452.1 10,391 459.6 213,752 361.6 210.6May ......................... 56,908 166.8 11,021 403.1 11,620 411.7 218,560 346.1 206.3June ........................ 57,123 165.0 11,205 384.9 11,867 394.0 260,975 344.8 208.1July ......................... 53,773 164.2 14,361 392.8 15,026 398.7 313,037 344.0 217.4August .................... 60,421 164.0 13,967 380.5 14,732 388.1 331,425 334.8 211.1September .............. 56,987 163.2 11,360 419.0 12,003 426.7 256,235 328.7 204.9October ................... 58,840 163.5 13,636 415.8 14,266 423.2 234,787 330.4 204.3November ............... 52,133 163.6 12,365 397.2 13,001 407.6 210,925 329.3 204.5December ............... 55,681 161.0 16,333 424.3 17,326 435.3 189,754 320.9 202.9Average ................. 666,743 164.8 156,410 424.4 164,947 431.7 2,808,921 344.4 209.4
1986January ................... 58,257 159.6 17,242 396.0 18,070 403.0 167,097 314.7 195.6February ................. 53,601 161.4 16,552 302.1 17,088 306.4 142,861 282.3 185.6March ...................... 56,641 161.7 16,256 266.2 16,724 269.2 155,987 256.9 179.8April ........................ 54,188 163.5 12,958 229.7 13,471 234.8 182,096 239.1 177.7May ......................... 55,303 162.3 18,026 218.9 18,574 222.7 213,106 236.0 177.7June ........................ 56,648 159.2 20,741 214.4 21,530 217.8 242,149 221.5 174.1July ......................... 53,980 157.1 24,226 184.1 25,033 186.9 275,715 216.8 171.0August .................... 61,777 156.1 27,219 203.6 28,183 205.9 252,832 219.4 170.7September .............. 59,330 154.9 17,776 213.0 18,414 216.2 228,424 216.8 168.4October ................... 60,637 154.7 13,037 208.6 13,704 213.4 200,203 213.9 165.7November ............... 57,217 153.3 14,173 230.5 14,697 233.6 166,368 218.0 165.9December ............... 59,385 152.2 22,380 252.7 23,033 254.9 160,784 230.7 170.2Average ................. 686,964 157.9 220,585 240.1 228,522 243.7 2,387,622 235.1 175.0
1987January ................... 56,653 150.4 18,844 304.1 19,580 306.8 168,778 233.4 173.2February ................. 53,169 152.7 15,980 286.5 16,451 289.0 143,291 236.8 172.0March ...................... 57,622 152.6 13,739 283.6 14,241 286.6 174,264 229.9 169.9April ........................ 55,218 155.2 13,641 295.6 14,276 298.8 194,630 229.2 174.0May ......................... 56,426 154.4 12,104 300.4 12,684 304.1 222,875 221.7 172.6June ........................ 61,047 151.6 14,876 310.6 15,473 313.9 259,554 220.4 172.2July ......................... 57,882 150.0 19,852 321.7 20,609 323.9 291,793 222.6 177.2August .................... 66,256 149.3 19,887 310.8 20,489 313.6 311,613 217.1 172.5September .............. 64,605 149.6 12,171 291.1 12,743 295.7 242,393 210.5 166.0October ................... 65,413 149.6 11,618 291.7 12,215 297.9 219,234 217.9 165.5November ............... 62,845 147.4 15,317 294.5 15,971 300.1 198,307 221.0 166.0December ............... 64,162 145.8 19,272 271.9 19,846 275.9 178,459 244.3 166.6Average ................. 721,298 150.6 187,300 297.6 194,578 301.1 2,605,191 224.0 170.6
See footnotes at end of table.
Energy Information Administration/Historical Monthly Energy Review 1973-1992 293

Table 9.10 Quantity and Cost of Fossil-Fuel Receipts at Steam-Electric Utility Plants, 1973-1992 (Continued)
Coal Petroleum GasaAll Fossil
Fuelsb
Quantity(thousandshort tons)
Cost(cents per
million Btu)
Heavy Oilb Totalb,c
Quantity(million
cubic feet)
Cost(cents per
million Btu)
Cost(cents per million Btu)
Quantity(thousand
barrels)
Cost(cents per
million Btu)
Quantity(thousand
barrels)
Cost(cents per
million Btu)
1988January ................... 58,626 146.5 19,517 260.0 20,190 264.1 151,366 250.4 167.1February ................. 56,871 148.7 19,473 260.5 19,943 263.2 153,286 247.7 169.0March ...................... 59,021 149.3 17,567 232.7 18,171 236.9 185,781 225.4 165.2April ........................ 56,136 149.8 12,418 231.6 12,761 235.8 179,872 212.8 162.7May ......................... 57,920 149.5 11,905 245.0 12,378 250.5 214,688 203.3 162.6June ........................ 59,337 146.3 14,642 236.2 15,238 241.1 251,104 209.2 162.2July ......................... 58,989 146.0 18,599 234.5 19,156 237.7 294,679 216.0 165.7August .................... 68,696 145.3 23,898 239.0 24,703 242.5 303,867 229.1 167.0September .............. 63,103 145.3 19,659 232.0 20,162 234.9 211,068 228.0 162.9October ................... 63,574 145.6 23,220 223.6 23,694 225.8 162,176 232.2 161.6November ............... 62,015 145.6 23,484 236.8 23,989 239.3 133,900 248.3 163.4December ............... 63,487 142.3 25,853 251.2 26,537 254.3 120,934 250.3 162.1Average ................. 727,775 146.6 230,234 240.5 236,924 243.9 2,362,721 226.3 164.3
1989January ................... 62,443 142.7 25,855 264.1 26,516 267.4 124,572 257.5 164.8February ................. 56,634 145.0 20,489 251.9 21,179 256.0 150,950 237.2 164.6March ...................... 63,218 144.4 22,427 271.8 23,199 276.0 180,668 225.7 165.0April ........................ 62,076 143.6 19,831 303.0 20,292 305.6 207,401 224.6 166.7May ......................... 64,796 145.3 20,569 307.2 21,211 310.1 226,859 232.0 169.7June ........................ 61,272 145.5 18,677 279.9 19,354 283.5 234,010 232.1 168.5July ......................... 55,429 144.1 19,778 275.6 20,364 278.6 285,117 233.3 172.2August .................... 70,147 144.7 19,701 264.2 20,563 268.9 282,481 230.6 166.6September .............. 64,539 146.0 14,967 264.8 15,609 270.6 239,696 225.4 164.9October ................... 66,578 145.4 15,779 289.1 16,495 295.6 230,629 231.6 166.1November ............... 65,570 144.2 16,862 288.0 17,602 294.5 162,361 248.1 164.9December ............... 60,515 142.8 22,734 350.2 24,040 359.0 147,763 275.4 176.7Average ................. 753,217 144.5 237,668 284.6 246,422 289.3 2,472,506 235.5 167.5
1990January ................... 67,636 144.6 26,481 403.9 27,415 409.6 126,806 293.8 182.3February ................. 62,296 146.6 19,190 338.2 19,683 340.7 113,552 269.3 171.2March ...................... 67,536 145.7 15,023 295.2 15,494 299.3 166,055 231.0 163.1April ........................ 63,888 147.3 13,521 254.7 13,977 260.4 181,153 221.7 162.1May ......................... 64,958 147.8 15,000 244.7 15,534 250.6 220,420 212.5 162.4June ........................ 63,649 146.6 18,068 219.4 18,612 224.1 267,995 209.3 161.9July ......................... 63,427 144.6 22,149 239.9 22,783 243.8 294,671 214.6 164.8August .................... 70,571 144.5 18,773 341.1 19,321 346.2 304,429 215.9 169.1September .............. 65,715 144.7 13,520 389.9 14,038 397.8 269,002 214.3 168.6October ................... 69,170 146.2 13,254 438.8 13,969 452.4 225,855 236.8 173.2November ............... 65,393 144.8 13,378 430.1 13,900 439.0 164,781 271.9 174.0December ............... 62,386 142.4 13,923 424.7 14,625 434.0 156,262 283.1 174.3Average ................. 786,627 145.5 202,281 331.9 209,350 338.4 2,490,979 232.1 168.9
1991January ................... 63,732 145.4 11,466 359.4 12,315 373.8 165,100 267.1 169.8February ................. 61,407 147.0 10,429 265.8 10,899 276.0 137,568 234.8 161.3March ...................... 63,825 145.5 11,269 244.2 11,672 251.3 182,853 220.0 159.3April ........................ 61,093 147.3 13,119 234.2 13,479 239.7 203,893 206.7 160.3May ......................... 63,259 148.3 14,711 233.1 15,256 240.1 233,667 198.2 160.8June ........................ 61,674 147.4 17,122 220.2 17,675 226.1 244,386 191.2 159.5July ......................... 65,105 142.7 17,169 227.2 17,703 233.1 310,738 184.6 156.0August .................... 69,794 143.1 16,831 226.7 17,323 232.6 306,418 192.7 156.6September .............. 65,273 143.3 15,590 241.4 16,063 247.7 248,899 215.4 160.2October ................... 66,445 143.6 9,658 238.6 10,287 253.1 251,458 231.0 160.9November ............... 62,779 142.8 11,289 253.9 11,835 264.8 186,722 240.7 160.4December ............... 65,538 140.0 14,453 252.2 15,120 260.3 159,115 262.0 159.5Average ................. 769,923 144.7 163,106 246.5 169,625 254.8 2,630,818 215.3 160.3
1992January ................... 64,678 139.6 12,039 223.2 12,539 230.0 159,815 247.1 155.2February ................. 61,603 142.1 13,634 209.8 14,107 216.1 160,328 201.7 152.7March ...................... 63,857 143.4 12,779 208.2 13,186 214.1 198,040 196.8 153.7April ........................ 60,661 142.7 10,144 217.8 10,555 225.7 218,468 202.6 154.8May ......................... 63,407 142.9 10,079 237.1 10,498 245.1 227,857 207.8 156.4June ........................ 63,704 141.9 10,888 251.4 11,352 260.0 254,025 213.6 158.3July ......................... 64,400 139.3 12,706 274.1 13,217 281.2 315,543 208.9 159.2August .................... 70,241 139.6 12,152 274.1 12,664 281.2 287,373 237.3 161.6September .............. 66,503 142.0 8,883 268.5 9,319 277.6 259,771 246.3 163.0October ................... 66,907 141.3 10,772 290.5 11,221 297.7 205,039 297.9 167.5November ............... 64,005 141.5 11,161 273.5 11,636 280.5 182,505 282.6 164.5December ............... 65,998 138.6 13,302 252.1 14,097 261.9 168,913 276.5 160.0Average ................. 775,963 141.2 138,537 247.5 144,390 255.1 2,637,678 232.8 159.0
a Includes supplemental gaseous fuels.b Heavy oil includes fuel oil nos. 4, 5, and 6, and topped crude oil. The
weighted averages for petroleum and all fossil fuels include both heavy andlight oil (fuel oil nos. 1 and 2, kerosene, and jet fuel) prices. Data do notinclude petroleum coke.
c Data for 1973-1982 do not include small quantities of rerefined motor oil,bunker oil, and liquefied petroleum gas.
Notes: • See Note 8 at end of section. • Geographic coverage is the 50States and the District of Columbia.
Sources: See end of section.
Energy Information Administration/Historical Monthly Energy Review 1973-1992294

Table 9.11 Natural Gas Prices, 1973-1992
(Dollars per Thousand Cubic Feet)
Wellhead
Major InterstatePipeline Companies
CityGate
Delivered to Consumersa,b
ImportsPurchases from
Producers Residential Commercial IndustrialElectricUtilitiesc
1973January ......................... NA NA NA NA NA NA NA NAFebruary ....................... NA NA NA NA NA NA NA NAMarch ............................ NA NA NA NA NA NA NA NAApril .............................. NA NA NA NA NA NA NA NAMay ............................... NA NA NA NA NA NA NA NAJune .............................. NA NA NA NA NA NA NA NAJuly ............................... NA NA NA NA NA NA NA NAAugust .......................... NA NA NA NA NA NA NA NASeptember .................... NA NA NA NA NA NA NA NAOctober ......................... NA NA NA NA NA NA NA NANovember ..................... NA NA NA NA NA NA NA NADecember ..................... NA NA NA NA NA NA NA NAAverage ....................... .22 NA NA NA 1.29 .94 .50 .38
1974January ......................... NA .43 .24 NA NA NA NA NAFebruary ....................... NA .43 .25 NA NA NA NA NAMarch ............................ NA .43 .26 NA NA NA NA NAApril .............................. NA .46 .26 NA NA NA NA NAMay ............................... NA .49 .26 NA NA NA NA NAJune .............................. NA .48 .26 NA NA NA NA NAJuly ............................... NA .59 .26 NA NA NA NA NAAugust .......................... NA .58 .26 NA NA NA NA NASeptember .................... NA .59 .27 NA NA NA NA NAOctober ......................... NA .59 .28 NA NA NA NA NANovember ..................... NA .71 .29 NA NA NA NA NADecember ..................... NA .75 .32 NA NA NA NA NAAverage ....................... .30 .59 .27 NA 1.43 1.07 .67 .51
1975January ......................... NA 1.04 .30 NA NA NA NA NAFebruary ....................... NA 1.06 .30 NA NA NA NA NAMarch ............................ NA 1.03 .34 NA NA NA NA NAApril .............................. NA 1.03 .33 NA NA NA NA NAMay ............................... NA 1.01 .35 NA NA NA NA NAJune .............................. NA .99 .35 NA NA NA NA NAJuly ............................... NA 1.01 .37 NA NA NA NA NAAugust .......................... NA 1.41 .36 NA NA NA NA NASeptember .................... NA 1.41 .37 NA NA NA NA NAOctober ......................... NA 1.40 .36 NA NA NA NA NANovember ..................... NA 1.63 .37 NA NA NA NA NADecember ..................... NA 1.62 .36 NA NA NA NA NAAverage ....................... .44 1.31 .37 NA 1.71 1.35 .96 .77
1976January ......................... .54 1.64 .38 NA NA NA NA NAFebruary ....................... .54 1.65 .40 NA NA NA NA NAMarch ............................ .54 1.65 .39 NA NA NA NA NAApril .............................. .55 1.64 .41 NA NA NA NA NAMay ............................... .55 1.65 .42 NA NA NA NA NAJune .............................. .58 1.67 .44 NA NA NA NA NAJuly ............................... .58 1.68 .44 NA NA NA NA NAAugust .......................... .60 1.68 .56 NA NA NA NA NASeptember .................... .60 1.84 .69 NA NA NA NA NAOctober ......................... .62 1.90 .58 NA NA NA NA NANovember ..................... .63 1.82 .53 NA NA NA NA NADecember ..................... .64 1.89 .54 NA NA NA NA NAAverage ....................... .58 1.73 .48 NA 1.98 1.64 1.24 1.06
1977January ......................... .67 2.02 .59 NA NA NA NA NAFebruary ....................... .71 2.00 .63 NA NA NA NA NAMarch ............................ .75 2.00 .70 NA NA NA NA NAApril .............................. .77 1.91 .65 NA NA NA NA NAMay ............................... .77 1.91 .69 NA NA NA NA NAJune .............................. .82 1.89 .69 NA NA NA NA NAJuly ............................... .83 1.88 .72 NA NA NA NA NAAugust .......................... .82 1.86 .71 NA NA NA NA NASeptember .................... .83 1.95 .72 NA NA NA NA NAOctober ......................... .84 2.12 .74 NA NA NA NA NANovember ..................... .83 2.14 .75 NA NA NA NA NADecember ..................... .84 2.17 .74 NA NA NA NA NAAverage ....................... .79 1.99 .70 NA 2.35 2.04 1.50 1.32
See footnotes at end of table.
Energy Information Administration/Historical Monthly Energy Review 1973-1992 295

Table 9.11 Natural Gas Prices, 1973-1992 (Continued)
(Dollars per Thousand Cubic Feet)
Wellhead
Major InterstatePipeline Companies
CityGate
Delivered to Consumersa,b
ImportsPurchases from
Producers Residential Commercial IndustrialElectricUtilitiesc
1978January ......................... 0.87 2.11 0.74 NA NA NA NA NAFebruary ....................... .88 2.11 .76 NA NA NA NA NAMarch ............................ .89 2.13 .79 NA NA NA NA NAApril .............................. .88 2.22 .81 NA NA NA NA NAMay ............................... .91 2.19 .81 NA NA NA NA NAJune .............................. .91 2.21 .83 NA NA NA NA NAJuly ............................... .89 2.23 .84 NA NA NA NA NAAugust .......................... .91 2.23 .84 NA NA NA NA NASeptember .................... .92 2.17 .88 NA NA NA NA NAOctober ......................... .92 2.25 .91 NA NA NA NA NANovember ..................... .93 2.19 .90 NA NA NA NA NADecember ..................... .96 2.15 .96 NA NA NA NA NAAverage ....................... .91 2.21 .83 NA 2.56 2.23 1.70 1.48
1979January ......................... 1.02 2.07 1.00 NA NA NA NA 1.55February ....................... 1.05 2.10 1.02 NA NA NA NA 1.65March ............................ 1.10 2.25 1.06 NA NA NA NA 1.69April .............................. 1.11 2.22 1.17 NA NA NA NA 1.70May ............................... 1.15 2.29 1.18 NA NA NA NA 1.82June .............................. 1.17 2.33 1.18 NA NA NA NA 1.84July ............................... 1.20 2.32 1.19 NA NA NA NA 1.84August .......................... 1.24 2.64 1.26 NA NA NA NA 1.87September .................... 1.24 2.74 1.31 NA NA NA NA 1.89October ......................... 1.28 2.84 1.36 NA NA NA NA 1.96November ..................... 1.29 3.41 1.41 NA NA NA NA 1.87December ..................... 1.31 3.54 1.35 NA NA NA NA 1.90Average ....................... 1.18 2.60 1.22 NA 2.98 2.73 1.99 1.81
1980January ......................... 1.37 3.43 1.43 NA NA NA NA 2.00February ....................... 1.42 3.69 1.44 NA NA NA NA 2.10March ............................ 1.46 4.21 1.46 NA NA NA NA 2.13April .............................. 1.51 4.84 1.53 NA NA NA NA 2.09May ............................... 1.56 4.76 1.58 NA NA NA NA 2.17June .............................. 1.57 4.79 1.70 NA NA NA NA 2.15July ............................... 1.64 4.56 1.65 NA NA NA NA 2.36August .......................... 1.64 4.68 1.67 NA NA NA NA 2.45September .................... 1.69 4.60 1.71 NA NA NA NA 2.45October ......................... 1.71 4.53 1.81 NA NA NA NA 2.52November ..................... 1.76 4.49 1.79 NA NA NA NA 2.37December ..................... 1.74 4.49 1.79 NA NA NA NA 2.31Average ....................... 1.59 4.42 1.63 NA 3.68 3.39 2.56 2.27
1981January ......................... 1.77 4.33 1.83 NA d 3.94 NA NA 2.51February ....................... 1.81 4.51 1.89 NA d 3.99 NA NA 2.67March ............................ 1.86 4.61 1.91 NA d 4.06 NA NA 2.71April .............................. 1.93 4.88 2.07 NA d 4.11 NA NA 2.81May ............................... 1.95 4.82 2.15 NA d 4.29 NA NA 2.92June .............................. 1.95 4.83 2.16 NA d 4.30 NA NA 2.95July ............................... 2.01 4.86 2.20 NA d 4.32 NA NA 2.97August .......................... 2.02 4.89 2.27 NA d 4.30 NA NA 2.99September .................... 2.08 4.88 2.26 NA d 4.47 NA NA 2.95October ......................... 2.11 5.00 2.31 NA d 4.50 NA NA 3.07November ..................... 2.15 5.01 2.38 NA d 4.53 NA NA 3.07December ..................... 2.16 4.97 2.36 NA d 4.55 NA NA 2.97Average ....................... 1.98 4.84 2.15 NA 4.29 4.00 3.14 2.89
1982January ......................... 2.23 4.94 2.47 NA d 4.65 NA NA 3.07February ....................... 2.30 4.96 2.50 NA d 4.69 NA NA 3.18March ............................ 2.35 4.94 2.52 NA d 4.78 NA NA 3.25April .............................. 2.40 4.94 2.54 NA d 4.86 NA NA 3.32May ............................... 2.45 4.93 2.68 NA d 5.17 NA NA 3.42June .............................. 2.45 4.86 2.83 NA d 5.20 NA NA 3.57July ............................... 2.47 5.00 2.79 NA d 5.23 NA NA 3.69August .......................... 2.53 5.07 2.86 NA d 5.23 NA NA 3.67September .................... 2.56 5.05 2.78 NA d 5.41 NA NA 3.67October ......................... 2.60 5.02 2.93 NA d 5.66 NA NA 3.68November ..................... 2.62 5.01 2.89 NA d 5.68 NA NA 3.61December ..................... 2.62 4.94 2.96 NA d 5.74 NA NA 3.64Average ....................... 2.46 4.94 2.72 NA 5.17 4.82 3.87 3.48
See footnotes at end of table.
Energy Information Administration/Historical Monthly Energy Review 1973-1992296

Table 9.11 Natural Gas Prices, 1973-1992 (Continued)
(Dollars per Thousand Cubic Feet)
Wellhead
Major InterstatePipeline Companies
CityGate
Delivered to Consumersa,b
ImportsPurchases from
Producers Residential Commercial IndustrialElectricUtilitiesc
1983January ......................... 2.66 5.03 3.06 NA d 5.86 NA NA 3.57February ....................... 2.66 5.09 3.15 NA d 5.87 NA NA 3.41March ............................ 2.58 5.01 3.01 NA d 6.00 NA NA 3.45April .............................. 2.53 4.58 2.90 NA d 6.06 NA NA 3.35May ............................... 2.53 4.40 2.98 NA d 6.22 NA NA 3.55June .............................. 2.59 4.41 2.95 NA d 6.20 NA NA 3.58July ............................... 2.52 4.31 2.96 NA d 6.21 NA NA 3.72August .......................... 2.58 3.93 2.90 NA d 6.18 NA NA 3.75September .................... 2.67 4.02 2.87 NA d 6.19 NA NA 3.70October ......................... 2.58 4.03 2.86 3.97 6.70 5.62 NA 3.62November ..................... 2.60 4.26 2.84 3.91 6.30 5.67 NA 3.54December ..................... 2.61 4.33 2.73 3.88 5.94 5.62 NA 3.49Average ....................... 2.59 4.51 2.93 NA 6.06 5.59 4.18 3.58
1984January ......................... 2.67 4.40 2.80 3.94 5.78 5.49 4.31 3.49February ....................... 2.71 4.37 2.82 4.02 5.84 5.54 4.29 3.55March ............................ 2.67 4.40 2.80 3.91 5.92 5.57 4.29 3.47April .............................. 2.64 4.23 2.95 3.96 5.96 5.52 4.19 3.53May ............................... 2.67 4.15 2.86 3.98 6.27 5.60 4.21 3.72June .............................. 2.70 4.25 2.89 4.02 6.76 5.67 4.11 3.73July ............................... 2.68 4.15 2.95 4.06 7.11 5.60 4.14 3.86August .......................... 2.69 4.12 2.95 e 3.69 7.23 5.47 4.15 3.80September .................... 2.62 4.34 2.84 4.02 7.17 5.53 4.24 3.80October ......................... 2.63 4.19 2.96 3.99 6.80 5.54 4.17 3.72November ..................... 2.61 3.43 3.13 3.92 6.31 5.56 4.21 3.72December ..................... 2.57 3.34 2.95 3.97 6.05 5.60 4.25 3.69Average ....................... 2.66 4.08 2.91 3.95 6.12 5.55 4.22 3.70
1985January ......................... 2.64 3.21 2.88 3.89 5.97 5.62 4.22 3.74February ....................... 2.71 3.11 2.87 3.94 5.86 5.53 4.26 3.68March ............................ 2.62 3.29 2.93 3.97 5.99 5.59 4.16 3.74April .............................. 2.64 3.39 2.86 3.91 6.11 5.65 4.01 3.72May ............................... 2.53 3.32 2.89 3.89 6.59 5.59 3.88 3.57June .............................. 2.58 3.40 2.99 3.86 6.96 5.65 3.78 3.56July ............................... 2.51 3.41 2.82 3.69 7.07 5.44 3.92 3.56August .......................... 2.47 3.35 2.70 3.70 7.21 5.42 3.94 3.46September .................... 2.42 3.28 2.92 3.68 7.06 5.37 3.84 3.40October ......................... 2.37 3.16 2.68 3.59 6.50 5.30 3.78 3.37November ..................... 2.36 2.87 2.90 3.46 6.13 5.39 3.84 3.38December ..................... 2.28 2.79 2.77 3.45 5.70 5.25 3.70 3.29Average ....................... 2.51 3.19 2.85 3.75 6.12 5.50 3.95 3.55
1986January ......................... 2.28 2.81 2.63 3.52 5.63 5.25 3.77 3.20February ....................... 2.26 2.79 2.61 3.52 5.67 5.28 3.77 2.85March ............................ 2.16 3.36 2.66 3.50 5.71 5.25 3.53 2.60April .............................. 2.10 3.14 2.37 3.33 5.89 5.23 3.35 2.44May ............................... 1.96 2.75 2.46 3.15 6.18 5.19 3.11 2.41June .............................. 1.85 2.56 2.56 3.11 6.67 5.09 3.05 2.27July ............................... 1.80 2.78 2.40 3.08 6.84 5.02 2.88 2.23August .......................... 1.77 2.59 2.24 3.04 6.94 4.90 2.81 2.22September .................... 1.78 2.26 2.05 3.02 6.83 4.93 2.92 2.22October ......................... 1.73 2.22 2.27 2.94 6.38 4.88 2.93 2.19November ..................... 1.77 1.84 2.07 2.90 5.66 4.74 3.01 2.23December ..................... 1.76 1.99 2.11 2.99 5.28 4.73 3.00 2.35Average ....................... 1.94 2.53 2.39 3.22 5.83 5.08 3.23 2.43
1987January ......................... 1.74 2.13 2.29 2.98 5.30 4.80 3.11 2.44February ....................... 1.73 2.21 2.29 3.03 5.34 4.79 3.30 2.46March ............................ 1.73 2.30 2.06 2.91 5.36 4.80 3.16 2.40April .............................. 1.69 2.25 2.05 2.86 5.46 4.90 2.99 2.38May ............................... 1.65 2.22 2.15 2.81 5.98 4.88 2.81 2.31June .............................. 1.65 2.26 2.04 2.84 6.55 4.87 2.76 2.30July ............................... 1.66 2.73 2.19 2.92 6.78 4.78 2.81 2.33August .......................... 1.63 2.17 1.64 2.89 6.84 4.77 2.74 2.26September .................... 1.56 2.36 2.17 2.83 6.64 4.60 2.75 2.19October ......................... 1.57 1.98 1.96 2.69 5.85 4.62 2.77 2.26November ..................... 1.64 1.94 2.06 2.76 5.42 4.66 2.89 2.28December ..................... 1.70 2.00 2.17 2.84 5.13 4.67 3.01 2.53Average ....................... 1.67 2.17 2.10 2.87 5.54 4.77 2.94 2.32
See footnotes at end of table.
Energy Information Administration/Historical Monthly Energy Review 1973-1992 297

Table 9.11 Natural Gas Prices, 1973-1992 (Continued)
(Dollars per Thousand Cubic Feet)
Wellhead
Major InterstatePipeline Companies
CityGate
Delivered to Consumersa,b
ImportsPurchases from
Producers Residential Commercial IndustrialElectricUtilitiesc
1988January ......................... 1.96 1.64 2.04 2.91 5.08 4.60 3.18 2.60February ....................... 1.84 2.03 2.22 2.95 5.09 4.69 3.22 2.56March ............................ 1.70 2.09 2.03 2.87 5.18 4.69 3.13 2.32April .............................. 1.59 2.01 2.12 2.79 5.35 4.71 2.97 2.20May ............................... 1.52 2.02 2.17 2.75 5.87 4.61 2.76 2.10June .............................. 1.53 1.98 2.05 2.87 6.50 4.53 2.67 2.16July ............................... 1.56 2.34 1.94 2.87 6.74 4.48 2.54 2.23August .......................... 1.62 1.88 2.09 2.92 6.92 4.37 2.66 2.36September .................... 1.53 2.00 2.13 3.05 6.79 4.41 2.70 2.36October ......................... 1.68 1.94 2.31 2.92 5.95 4.53 2.80 2.40November ..................... 1.76 1.98 2.19 2.98 5.56 4.69 3.00 2.58December ..................... 1.89 2.14 2.25 3.08 5.39 4.78 3.31 2.57Average ....................... 1.69 2.00 2.13 2.92 5.47 4.63 2.95 2.33
1989January ......................... 1.99 1.77 2.35 3.17 5.41 4.81 3.37 2.63February ....................... 1.81 2.20 2.16 3.10 5.38 4.80 3.31 2.44March ............................ 1.69 1.99 2.14 2.89 5.45 4.79 3.10 2.32April .............................. 1.56 2.01 2.19 2.83 5.54 4.77 2.89 2.31May ............................... 1.61 2.00 2.11 2.94 5.93 4.64 2.78 2.39June .............................. 1.65 2.04 2.05 2.98 6.58 4.57 2.67 2.40July ............................... 1.65 1.88 2.00 3.08 6.92 4.65 2.68 2.40August .......................... 1.61 2.27 2.11 3.04 7.07 4.61 2.69 2.38September .................... 1.55 2.02 2.08 2.99 6.80 4.67 2.66 2.33October ......................... 1.58 2.17 2.13 2.84 6.06 4.61 2.74 2.39November ..................... 1.66 2.13 2.23 2.98 5.56 4.71 2.96 2.56December ..................... 1.92 2.08 2.39 3.10 5.30 4.81 3.31 2.85Average ....................... 1.69 2.04 2.18 3.01 5.64 4.74 2.96 2.43
1990January ......................... 2.23 2.04 2.42 3.24 5.43 4.97 3.53 3.00February ....................... 1.85 2.25 2.17 3.10 5.65 5.05 3.41 2.76March ............................ 1.55 1.99 1.94 2.94 5.60 4.92 3.08 2.37April .............................. 1.49 2.00 2.17 2.83 5.64 4.82 2.85 2.28May ............................... 1.47 2.08 1.98 2.81 6.00 4.63 2.68 2.18June .............................. 1.48 1.91 2.18 3.00 6.56 4.56 2.58 2.16July ............................... 1.49 1.88 2.00 3.03 7.04 4.45 2.50 2.21August .......................... 1.51 1.93 1.86 2.91 7.08 4.55 2.52 2.23September .................... 1.56 1.89 1.93 2.92 6.90 4.55 2.60 2.21October ......................... 1.76 1.90 2.18 2.81 6.14 4.66 2.69 2.45November ..................... 1.94 2.21 2.45 3.14 5.69 4.81 3.02 2.79December ..................... 2.04 2.27 2.58 3.19 5.62 4.92 3.25 2.89Average ....................... 1.71 2.03 2.19 3.03 5.80 4.83 2.93 2.38
1991January ......................... 1.96 2.20 2.19 3.08 5.54 4.94 3.25 2.70February ....................... 1.62 2.10 1.93 2.94 5.56 4.94 2.97 2.35March ............................ 1.49 1.92 2.02 2.78 5.60 4.89 2.75 2.21April .............................. 1.50 2.03 1.87 2.74 5.90 4.87 2.68 2.10May ............................... 1.48 1.99 1.96 2.76 6.28 4.65 2.40 2.01June .............................. 1.43 2.03 1.75 2.86 6.97 4.80 2.34 1.94July ............................... 1.34 2.11 1.79 2.74 7.23 4.50 2.23 1.88August .......................... 1.43 1.71 1.71 2.78 7.36 4.73 2.29 1.96September .................... 1.59 1.84 1.76 2.91 6.92 4.57 2.40 2.19October ......................... 1.82 2.00 1.94 2.92 6.20 4.58 2.69 2.35November ..................... 1.89 2.20 2.02 2.92 5.51 4.71 2.84 2.43December ..................... 2.00 2.09 2.11 3.05 5.51 4.84 3.09 2.64Average ....................... 1.64 2.02 1.92 2.90 5.82 4.81 2.69 2.18
1992January ......................... 1.74 2.20 2.10 2.90 5.53 4.85 3.04 2.49February ....................... 1.26 1.98 1.70 2.70 5.54 5.03 2.78 2.03March ............................ 1.35 1.45 1.90 2.61 5.50 4.77 2.58 1.99April .............................. 1.42 2.01 1.73 2.74 5.62 4.77 2.54 2.07May ............................... 1.51 1.79 1.99 2.90 6.15 4.59 2.44 2.11June .............................. 1.62 2.03 2.16 3.00 6.84 4.72 2.53 2.18July ............................... 1.55 1.89 1.86 3.01 7.27 4.64 2.54 2.13August .......................... 1.84 1.85 2.14 3.18 7.45 4.73 2.71 2.42September .................... 1.92 2.05 2.13 3.23 7.15 4.69 2.82 2.51October ......................... 2.38 2.13 2.69 3.50 6.52 4.90 3.21 3.04November ..................... 2.13 2.32 2.33 3.33 6.02 5.12 3.26 2.87December ..................... 2.07 1.92 2.40 3.17 5.74 5.11 3.38 2.81Average ....................... 1.74 1.97 2.09 3.01 5.89 4.88 2.84 2.36
a Includes supplemental gaseous fuels.b See Note 9 at end of section.c See Note 8 at end of section.d Monthly values for "Residential" are estimated by proportioning the EIA
annual value by the ratios of monthly values reported by the Bureau of LaborStatistics, "Consumer Price Index for All Urban Consumers."
e The decline from the previous month was primarily the result of refundsin the form of reduced charges.
NA=Not available. Notes: • Prices shown on this page are intended to include all taxes. See
Note 9 at end of section. • Wellhead annual prices are simple averages ofthe monthly prices; all other annual prices are volume-weighted averages ofthe monthly prices. • Geographic coverage is the 50 States and the Districtof Columbia.
Sources: See end of section.
Energy Information Administration/Historical Monthly Energy Review 1973-1992298

Energy Prices Notes and Sources
Notes:1. The average domestic first purchase price representsthe average price at which all domestic crude oil ispurchased. Prior to February 1976, the price repre-sented an estimate of the average of posted prices;beginning with February 1976, the price represents anaverage of actual first purchase prices. The data serieswas previously called "Actual Domestic WellheadPrice."
2. F.O.B. literally means "Free on Board." It denotes atransaction whereby the seller makes the product avail-able with an agreement on a given port at a given price;it is the responsibility of the buyer to arrange for thetransportation and insurance.
3. The landed cost of imported crude oil from selectedcountries does not represent the total cost of all im-ported crude. Prior to March 1975, imported crudecosts to U.S. company-owned refineries in the Carib-bean were not included in the landed cost, and costs ofcrude oil from countries that export only small amountsto the United States were also excluded. Beginning inMarch 1975, however, coverage was expanded to in-clude U.S. company- owned refineries in the Caribbean.Landed costs do not include supplemental fees.
4. Beginning with January 1981, refiner acquisitioncosts of crude oil are from data collected on EnergyInformation Administration (EIA) Form EIA-14,"Refiners’ Monthly Cost Report." Those costs were pre-viously published from data collected on EconomicRegulatory Administration (ERA) Form ERA-49, "Do-mestic Crude Oil Entitlements Program RefinersMonthly Report." Form ERA-49 was discontinued withthe decontrol of crude oil on January 28, 1981. Crudeoil purchases and costs are defined for Form EIA-14 inaccordance with conventions used for Form ERA-49.The respondents for the two forms are also essentiallythe same. However, due to possible different interpre-tations of the filing requirements and a differentmethod for handling prior period adjustments, caremust be taken when comparing the data collected onthe two forms.
The refiner acquisition cost of crude oil is the averageprice paid by refiners for crude oil booked into theirrefineries in accordance with accounting proceduresgenerally accepted and consistently and historically ap-plied by the refiners concerned. Domestic crude oil isthat oil produced in the United States or from the outercontinental shelf as defined in 43 USC Section 1331.Imported crude oil is either that oil reported on FormERA-51, "Transfer Pricing Report," or any crude oil that
is not domestic oil. The composite cost is the weightedaverage of domestic and imported crude oil costs.
Crude oil costs and volumes reported on Form ERA-49excluded unfinished oils but included the Strategic Pe-troleum Reserve (SPR). Crude oil costs and volumesreported on Federal Energy Administration (FEA)Form FEA-P110-M-1, "Refiners’ Monthly Cost Alloca-tion Report," included unfinished oils but excludedSPR. Imported averages derived from Form ERA-49exclude oil purchased for SPR, whereas the compositeaverages derived from Form ERA-49 include SPR.None of the prices derived from Form EIA-14 includeeither unfinished oils or SPR.
5. Several different series of motor gasoline prices arepublished in this section. U.S. city average retail pricesof motor gasoline are calculated monthly by the Bureauof Labor Statistics during the development of the Con-sumer Price Index (CPI). These prices include all Fed-eral, State, and local taxes paid at the time of sale. From1974-1977, prices were collected in 56 urban areas.From 1978-1992, prices were collected from a new sam-ple of service stations in 85 urban areas selected torepresent all urban consumers – about 80 percent of thetotal U.S. population. The service stations are selectedinitially, and on a replacement basis, in such a way thatthey represent the purchasing habits of the CPI popu-lation. Service stations in the current sample includethose providing all types of service (i.e., full-, mini-, andself-serve).
Refiner prices of finished motor gasoline for resale andto end users are determined by the EIA in a monthlysurvey of refiners and gas plant operators (Form EIA-782A). The prices do not include any Federal, State, orlocal taxes paid at the time of sale. Estimates of pricesprior to January 1983 are based on Form FEA-P302-M-1/EIA-460, "Petroleum Industry Monthly Report forProduct Prices," and also exclude all Federal, State, orlocal taxes paid at the time of sale. Sales for resale arethose made to purchasers who are other-than-ultimateconsumers. Sales to end users are sales made directlyto the consumer of the product, including bulk consum-ers (such as agriculture, industry, and utilities) andresidential and commercial consumers.
6. Starting in January 1983, Form EIA-782, "MonthlyPetroleum Product Sales Report," replaced 10 previoussurveys. Every attempt was made to continue the mostimportant price series. However, prices publishedthrough December 1982 and those published since Jan-uary 1983 do not necessarily form continuous dataseries due to changes in survey forms, definitions, in-structions, populations, samples, processing systems,and statistical procedures. To provide historical data,continuous series were generated for annual data 1978-
Energy Information Administration/Historical Monthly Energy Review 1973-1992 299

1982 and for monthly data 1981 and 1982 by estimatingthe prices that would have been published had FormEIA-782 survey and system been in operation at thattime. This form of estimation was performed after de-tailed adjustment was made for product and sales typematching and for discontinuity due to other factors. Animportant difference between the previous and presentprices is the distinction between wholesale and resaleand between retail and end user. The resale categorycontinues to include sales among resellers. However,sales to bulk consumers such as agriculture, industry,and electric utilities, previously included in the whole-sale category, are now counted as made to end users.The end-user category continues to include retail salesthrough company owned and operated outlets, butalso includes sales to bulk consumers such as agricul-ture, industry, and electric utilities. Additional infor-mation may be found in "Estimated Historic TimeSeries for the EIA-782," a feature article reprinted fromthe December 1983 [3] Petroleum Marketing Monthly,published by EIA.
7. National average electricity prices are shown in twodata series. The "Annual Series" is based on data frommore than 3,000 publicly and privately owned electricutilities that report on Form EIA-861, "Annual ElectricUtility Report." The "Monthly Series" is based on datafrom approximately 250 utilities statistically chosen asa sample of the utilities that report on Form EIA-861.The selected utilities report monthly on Form EIA-826,"Monthly Electric Utility Sales and Revenue Reportwith State Distributions," formerly the "Electric UtilityCompany Monthly Statement." Annual values shownfor the monthly series are the sum of the monthlyrevenue divided by the sum of the monthly sales. Priorto January 1986, only privately owned utilities wereincluded in the monthly survey and the sample waschosen by using cut-off techniques; from January 1986through 1992, the sample was chosen using stratifica-tion techniques.
8. Data for 1973-1982 cover all electric generating plantsat which the generator nameplate capacity of all steam-electric units combined totaled 25 megawatts or greater.From 1974-1982, peaking units were included in thedata and counted towards the 25-megawatt-or-greatertotal. Data for 1983-1990 cover all electric generatingplants at which the generator nameplate capacity of allsteam-electric units combined totaled 50 megawatts orgreater. Data for 1991 and 1992 cover all electric gener-ating plants at which the generator nameplate capacityof all steam-electric units and combined-cycle unitstogether totaled 50 megawatts or greater.
9. Natural gas prices are intended to include all taxes.Instructions on the data collection forms specifically
direct that all Federal, State, and local taxes, surcharges,and/or adjustments billed to consumers are to be in-cluded. However, sales and other taxes itemized onconsumers’ bills are sometimes excluded by the report-ing utilities.
Delivered-to-consumers prices for 1987-1992 representnatural gas delivered and sold to residential, commer-cial, industrial, and electric utility consumers. They donot include the price of natural gas delivered to indus-trial and commercial consumers on behalf of third par-ties. Volumes of natural gas delivered on behalf of thirdparties are included in the consumption data shown inTable 4.4. Additional information is available in theEIA Natural Gas Monthly, Appendix C.
Sources:
Table 9.1
Annual data: • Domestic First Purchase Price, 1973-1976—U.S. Department of the Interior (DOI), Bureau ofMines (BOM), Minerals Yearbook, "Crude Petroleum andPetroleum Products" chapter. 1977—Federal EnergyAdministration (FEA), based on Form FEA-P124, "Do-mestic Crude Oil Purchaser’s Monthly Report." 1978-1992—Energy Information Administration (EIA),Petroleum Marketing Annual 1992, Table 1.
• F.O.B. and Landed Cost of Imports, 1973-1976—FEA, based on Form FEA-F701-M-0, "Transfer PricingReport." 1977—January-September—FEA, based onForm FEA-F701-M-0, "Transfer Pricing Report." Octo-ber-December—EIA, based on Form FEA-F701-M-0,"Transfer Pricing Report." 1978-1992—Petroleum Mar-keting Annual 1992, Table 1.
• Refiner Acquisition Cost, 1973—EIA estimates. Thedomestic price was derived by adding estimated trans-portation costs to the reported domestic first purchaseprice. The imported price was derived by adding anestimated ocean transport cost to the average "FreeAlongside Ship" value published by the U.S. Bureau ofthe Census. 1974-1976—DOI, BOM, Minerals Yearbook,"Crude Petroleum and Petroleum Products" chapter.1977—January-September—FEA, based on Form FEA-P110-M-1, "Refiners’ Monthly Cost Allocation Report."October-December—EIA, based on Form FEA-P110-M-1, "Refiners’ Monthly Cost Allocation Report."1978-1992—EIA, Petroleum Marketing Annual 1992,Table 1.
Monthly data: • Domestic First Purchase Price, 1974-January 1976—FEA, Form FEA-90, "Crude PetroleumProduction Monthly Report." February 1976-Septem-ber 1979—FEA, Form FEA-P124, "Domestic Crude OilPurchaser’s Monthly Report." October 1979-November1980—Economic Regulatory Administration (ERA),
Energy Information Administration/Historical Monthly Energy Review 1973-1992300

Form FEA-P124, "Domestic Crude Oil Purchaser’sMonthly Report." December 1980-1982—ERA, FormERA-182, "Domestic Crude Oil First Purchaser’s Re-port." 1983 and 1984—EIA, Form EIA-182, "DomesticCrude Oil First Purchase Report." 1985 and 1986—EIA,Petroleum Marketing Monthly, December 1987, Table 1.1987-1989—EIA, Petroleum Marketing Annual 1989,Table 1. 1990-1992—EIA, Petroleum Marketing Annual1992, Table 1.
• F.O.B. and Landed Cost of Imports, October 1973-September 1977—FEA, Form FEA-F701-M-0, "TransferPricing Report." October 1977-January 1979—EIA,Form FEA-F701-M-0, "Transfer Pricing Report." Febru-ary 1979-September 1982—EIA, Form ERA-51, "Trans-fer Pricing Report." October 1982-June 1984—EIA,Form EP-51, "Monthly Foreign Crude Oil TransactionReport." July-December 1984—EIA, Form EIA-856,"Monthly Foreign Crude Oil Acquisition Report." 1985and 1986—EIA, Petroleum Marketing Monthly, Decem-ber 1987, Table 1. 1987-1989—EIA, Petroleum MarketingAnnual 1989, Table 1. 1990-1992—EIA, Petroleum Mar-keting Annual 1992, Table 1.
• Refiner Acquisition Cost, 1974-January 1976—FEA,Form FEO-96, "Monthly Cost Allocation Report." Feb-ruary 1976-September 1977—FEA, Form FEA-P110-M-1, "Refiners’ Monthly Cost Allocation Report." October1977-June 1978—EIA, Form FEA-P110-M-1, "Refiners’Monthly Cost Allocation Report." July 1978-1980—EIA, Form ERA-49, "Domestic Crude Oil EntitlementsProgram Refiners Monthly Report." 1981-1984—EIA,Form EIA-14, "Refiners’ Monthly Cost Report." 1985and 1986—EIA, Petroleum Marketing Monthly, Decem-ber 1987, Table 1. 1987-1989—EIA, Petroleum MarketingAnnual 1989, Table 1. 1990-1992—EIA, Petroleum Mar-keting Annual 1992, Table 1.
Table 9.2
• Annual data: 1973-1977—Average of the monthlyprices, including withheld values, weighted by volume.1978-1992—EIA, Petroleum Marketing Annual 1992,Table 21.
• Monthly data: October 1973-September 1977—FEA,Form FEA-F701-M-0, "Transfer Pricing Report." Octo-ber 1977-January 1979—EIA, Form FEA-F701-M-0,"Transfer Pricing Report." February 1979-September1982—EIA, Form ERA-51, "Transfer Pricing Report."October 1982-June 1984—EIA, Form EP-51, "MonthlyForeign Crude Oil Transaction Report." July-Decem-ber 1984—EIA, Form EIA-856, "Monthly Foreign CrudeOil Acquisition Report." 1985 and 1986—EIA, Petro-leum Marketing Monthly, December 1987, Table 21.1987-1989—EIA, Petroleum Marketing Annual 1989,Table 21. 1990-1992—EIA, Petroleum Marketing Annual1992, Table 21.
Table 9.3
• Annual data: 1973-1977—Average of the monthlyprices, including withheld values, weighted by volume.1978-1992—EIA, Petroleum Marketing Annual 1992,Table 22.
• Monthly data: October 1973-September 1977—FEA,Form FEA-F701-M-0, "Transfer Pricing Report." Octo-ber 1977-January 1979—EIA, Form FEA-F701-M-0,"Transfer Pricing Report." February 1979-September1982—EIA, Form ERA-51, "Transfer Pricing Report."October 1982-June 1984—EIA, Form EP-51, "MonthlyForeign Crude Oil Transaction Report." July-Decem-ber 1984—EIA, Form EIA-856, "Monthly Foreign CrudeOil Acquisition Report." 1985 and 1986—EIA, Petro-leum Marketing Monthly, December 1987, Table 22.1987-1989—EIA, Petroleum Marketing Annual 1989,Table 22. 1990-1992—EIA, Petroleum Marketing Annual1992, Table 22.
Table 9.4
• Annual data: Leaded Regular, 1973—Platt’s Oil PriceHandbook and Oilmanac, 1974, 51st Edition. All Others:Calculated by the EIA as the simple averages ofmonthly data.
• Monthly data: U.S. Department of Labor, Bureau ofLabor Statistics (BLS), Consumer Prices: Energy,monthly, except for leaded regular prices in January1983; unleaded regular prices for September 1982, Jan-uary and March 1983, and September 1988; unleadedpremium for September 1981-December 1982; and alltypes prices for September 1982, January 1983, andOctober 1988, which include revisions from the BLSdatabase.
Table 9.5a
• Annual data: Averages of the monthly prices,weighted by volume.
• Monthly data: July 1975-June 1977—FEA, MonthlyPetroleum Product Price Report, Table 1. July 1977-1982—EIA, Monthly Petroleum Product Price Report, Table 3.
Table 9.5b
• Annual data: EIA, Petroleum Marketing Annual 1992,Table 17.
• Monthly data: 1982—EIA estimates; see Note 6. 1983and 1984—EIA, Form EIA-782A, "Refiners’/Gas PlantOperators’ Monthly Petroleum Product Sales Report."1985 and 1986—EIA, Petroleum Marketing Monthly, De-cember 1987, Table 17. 1987-1989—EIA, Petroleum Mar-keting Annual 1989, Table 17. 1990-1992—EIA,Petroleum Marketing Annual 1992, Table 17.
Energy Information Administration/Historical Monthly Energy Review 1973-1992 301

Table 9.6a
• Annual data: Averages of the monthly prices,weighted by volume.
• Monthly data: July 1975-June 1977—FEA, MonthlyPetroleum Product Price Report, Table 1. July 1977-1982—EIA, Monthly Petroleum Product Price Report, tables aslisted:
Series Table
Finished Aviation Gasoline 4Kerosene-Type Jet Fuel 4Kerosene 5No. 2 Fuel Oil 2No. 2 Diesel Fuel 2Propane 7
Table 9.6b
• Annual data: EIA, Petroleum Marketing Annual 1992,Table 4.
• Monthly data: 1982—EIA estimates; see Note 6. 1983and 1984—EIA, Form EIA-782A, "Refiners’/Gas PlantOperators’ Monthly Petroleum Product Sales Report."1985 and 1986—EIA, Petroleum Marketing Monthly, De-cember 1987, Table 4. 1987-1989—EIA, Petroleum Mar-keting Annual 1989, Table 4. 1990-1992—EIA, PetroleumMarketing Annual 1992, Table 4.
Table 9.7a
• Annual data: Averages of the monthly prices,weighted by volume.
• Monthly data: July 1975-June 1977—FEA, MonthlyPetroleum Product Price Report, Table 1. July 1977-1982—EIA, Monthly Petroleum Product Price Report, ta-bles as listed:
Series Table
Finished Aviation Gasoline 4Kerosene-Type Jet Fuel 4Kerosene 5No. 2 Fuel Oil 2No. 2 Diesel Fuel 2Propane 7
Table 9.7b
• Annual data: EIA, Petroleum Marketing Annual 1992,Table 2.
• Monthly data: 1982—EIA estimates; see Note 6. 1983and 1984—EIA, Form EIA-782A, "Refiners’/Gas PlantOperators’ Monthly Petroleum Product Sales Report."1985 and 1986—EIA, Petroleum Marketing Monthly, De-cember 1987, Table 4. 1987-1989—EIA, Petroleum Mar-keting Annual 1989, Table 2. 1990-1992— EIA, PetroleumMarketing Annual 1992, Table 2.
Table 9.8 (a,b, and c)
• Annual data: EIA, Petroleum Marketing Annual 1992,Table 16.
• Monthly data: 1982—EIA estimates using data fromForm FEA-302-M-1/EIA-460, "Petroleum Industry Re-port for Product Prices." See Note 6. 1983 and 1984—EIA, Form EIA-782A, "Refiners’/Gas Plant Operators’Monthly Petroleum Product Sales Report." 1985 and1986—EIA, Petroleum Marketing Monthly, December1987, Table 14. 1987-1989—EIA, Petroleum MarketingAnnual 1989, Table 16. 1990-1992—EIA, Petroleum Mar-keting Annual 1992, Table 16.
Table 9.9
• Annual Series: 1984-1987—EIA, Electric Power Annual1988, Table 18. 1988-1992—EIA, Electric Power Annual1992, Table 25.
• Monthly Series—Monthly data: July 1976-February1980—EIA, Energy Data Reports, "Financial Statistics ofElectric Utilities and Interstate Natural Gas PipelineCompanies." March 1980-October 1981—EIA, EnergyData Reports, "Sales, Revenue, and Income of ElectricUtilities." November 1981-1992—EIA, Electric PowerMonthly. Annual data: 1973-1975—EIA, "Statistics ofPrivately Owned Electric Utilities in the United States1976," Table 13. 1976-1992—Sum of the monthly reve-nue divided by the sum of the monthly sales.
Table 9.10
• Annual data: Quantity—Sum of unrounded monthlyvalues. Cost—Average of monthly values, weightedby quantities of Btu.
• Monthly data: 1973-May 1977—Federal Power Com-mission (FPC), Form FPC-423, "Monthly Report on Costand Quality of Fuels for Electric Utility Plants." June-December 1977—Federal Energy Regulatory Commis-sion (FERC), Form FERC-423, "Monthly Report on Costand Quality of Fuels for Electric Utility Plants." 1978-1982—EIA, Form FERC-423, "Monthly Report on Costand Quality of Fuels for Electric Utility Plants." 1983-1985—EIA, Electric Power Monthly, Table 1. 1986-1992—EIA, Electric Power Monthly, Table 2.
Table 9.11
• Annual Data: Wellhead, 1973-1987—EIA, NaturalGas Annual 1992, Volume 1, Table 95. Major InterstatePipeline Companies, 1974-1977—Calculated fromrevenue and sales data reported to the FPC on FormFPC-11, "Natural Gas Pipeline Company MonthlyStatement." Major Interstate Pipeline Companies,1978-1983—EIA, Natural Gas Monthly, December 1984,Table 10. Major Interstate Pipeline Companies, 1984-1987—EIA, Natural Gas Monthly, December 1989, Table
Energy Information Administration/Historical Monthly Energy Review 1973-1992302

4. City Gate, 1984-1987—EIA, Natural Gas Monthly,December 1989, Table 4. Delivered to Consumers—EIA, Natural Gas Annual 1992, Volume 1, Table 98. AllSeries, 1988-1992—EIA, Natural Gas Monthly, April1994, Table 4.
• Monthly Data: Wellhead, 1976-1979—Based on pre-liminary estimates reported by Mississippi, New Mex-ico, Oklahoma, and Texas and revised after publicationof the Natural Gas Annual. Major Interstate PipelineCompanies, 1974-1979—FPC, Form FPC-11, "NaturalGas Pipeline Company Monthly Statement." Residen-tial, 1981—EIA, Monthly Energy Review, December1983(1). Residential, January-September 1983—Natu-ral Gas Monthly, April 1985, Table 10. Electric Utili-ties, 1979—EIA, Form FPC-423, "Monthly Report ofCost and Quality of Fuels for Electric Plants." AllSeries, 1980-1992 (except Residential, 1981 and
January-September 1983, which are cited above)—EIA, Natural Gas Monthly, issues and tables as listed,and revisions from the Natural Gas Office data systems:
Data Issue Table
1980 April 1983 101981 November 1983 101982 January 1985 101983 December 1985 41984 December 1986 41985 January 1988 41986 January 1989 41987 January 1990 41988 March 1991 41989 December 1991 41990 December 1992 41991 June 1993 41992 April 1994 4
Energy Information Administration/Historical Monthly Energy Review 1973-1992 303

Section 10International Energy
An exploratory rig drills for oil at a wildcat well in Oman.
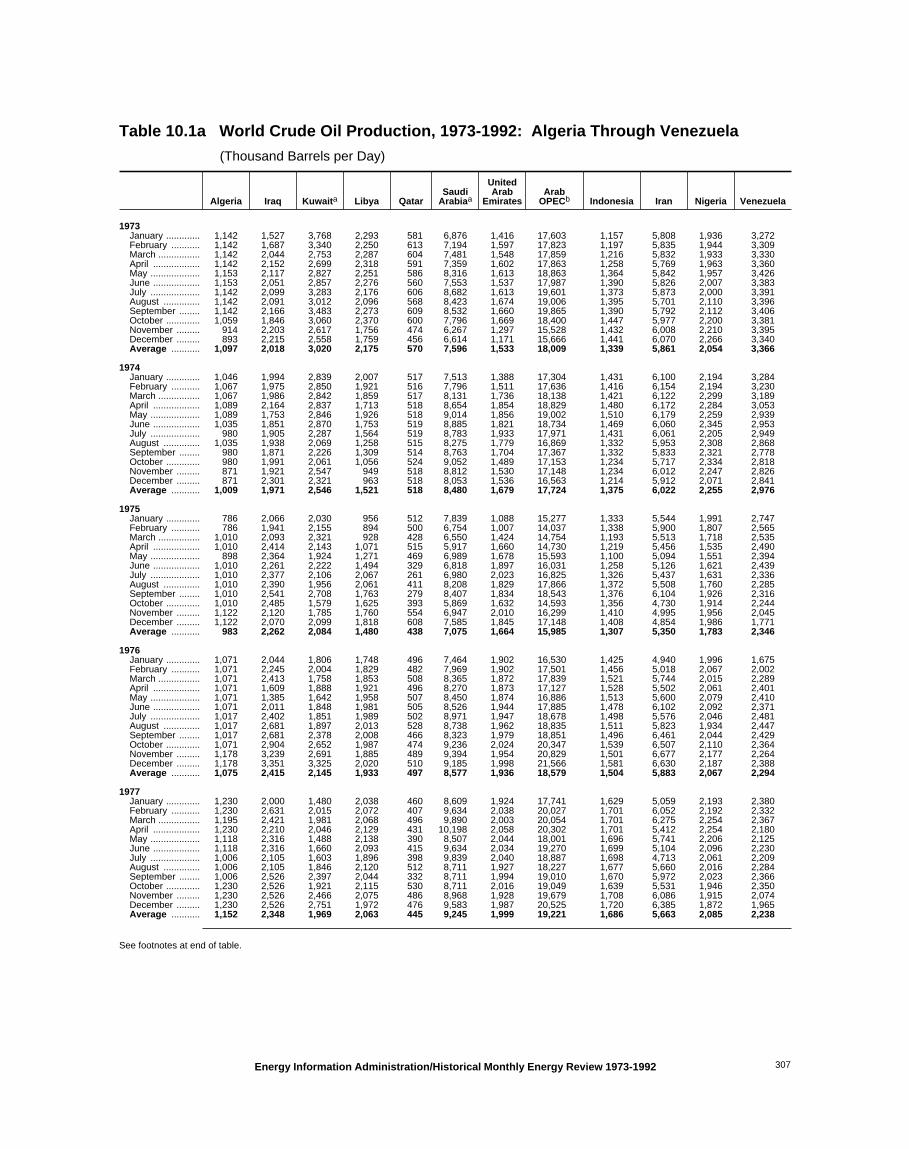
Table 10.1a World Crude Oil Production, 1973-1992: Algeria Through Venezuela
(Thousand Barrels per Day)
Algeria Iraq Kuwaita Libya QatarSaudi
Arabiaa
UnitedArab
EmiratesArab
OPECb Indonesia Iran Nigeria Venezuela
1973January ............. 1,142 1,527 3,768 2,293 581 6,876 1,416 17,603 1,157 5,808 1,936 3,272February ........... 1,142 1,687 3,340 2,250 613 7,194 1,597 17,823 1,197 5,835 1,944 3,309March ................ 1,142 2,044 2,753 2,287 604 7,481 1,548 17,859 1,216 5,832 1,933 3,330April .................. 1,142 2,152 2,699 2,318 591 7,359 1,602 17,863 1,258 5,769 1,963 3,360May ................... 1,153 2,117 2,827 2,251 586 8,316 1,613 18,863 1,364 5,842 1,957 3,426June .................. 1,153 2,051 2,857 2,276 560 7,553 1,537 17,987 1,390 5,826 2,007 3,383July ................... 1,142 2,099 3,283 2,176 606 8,682 1,613 19,601 1,373 5,873 2,000 3,391August .............. 1,142 2,091 3,012 2,096 568 8,423 1,674 19,006 1,395 5,701 2,110 3,396September ........ 1,142 2,166 3,483 2,273 609 8,532 1,660 19,865 1,390 5,792 2,112 3,406October ............. 1,059 1,846 3,060 2,370 600 7,796 1,669 18,400 1,447 5,977 2,200 3,381November ......... 914 2,203 2,617 1,756 474 6,267 1,297 15,528 1,432 6,008 2,210 3,395December ......... 893 2,215 2,558 1,759 456 6,614 1,171 15,666 1,441 6,070 2,266 3,340Average ........... 1,097 2,018 3,020 2,175 570 7,596 1,533 18,009 1,339 5,861 2,054 3,366
1974January ............. 1,046 1,994 2,839 2,007 517 7,513 1,388 17,304 1,431 6,100 2,194 3,284February ........... 1,067 1,975 2,850 1,921 516 7,796 1,511 17,636 1,416 6,154 2,194 3,230March ................ 1,067 1,986 2,842 1,859 517 8,131 1,736 18,138 1,421 6,122 2,299 3,189April .................. 1,089 2,164 2,837 1,713 518 8,654 1,854 18,829 1,480 6,172 2,284 3,053May ................... 1,089 1,753 2,846 1,926 518 9,014 1,856 19,002 1,510 6,179 2,259 2,939June .................. 1,035 1,851 2,870 1,753 519 8,885 1,821 18,734 1,469 6,060 2,345 2,953July ................... 980 1,905 2,287 1,564 519 8,783 1,933 17,971 1,431 6,061 2,205 2,949August .............. 1,035 1,938 2,069 1,258 515 8,275 1,779 16,869 1,332 5,953 2,308 2,868September ........ 980 1,871 2,226 1,309 514 8,763 1,704 17,367 1,332 5,833 2,321 2,778October ............. 980 1,991 2,061 1,056 524 9,052 1,489 17,153 1,234 5,717 2,334 2,818November ......... 871 1,921 2,547 949 518 8,812 1,530 17,148 1,234 6,012 2,247 2,826December ......... 871 2,301 2,321 963 518 8,053 1,536 16,563 1,214 5,912 2,071 2,841Average ........... 1,009 1,971 2,546 1,521 518 8,480 1,679 17,724 1,375 6,022 2,255 2,976
1975January ............. 786 2,066 2,030 956 512 7,839 1,088 15,277 1,333 5,544 1,991 2,747February ........... 786 1,941 2,155 894 500 6,754 1,007 14,037 1,338 5,900 1,807 2,565March ................ 1,010 2,093 2,321 928 428 6,550 1,424 14,754 1,193 5,513 1,718 2,535April .................. 1,010 2,414 2,143 1,071 515 5,917 1,660 14,730 1,219 5,456 1,535 2,490May ................... 898 2,364 1,924 1,271 469 6,989 1,678 15,593 1,100 5,094 1,551 2,394June .................. 1,010 2,261 2,222 1,494 329 6,818 1,897 16,031 1,258 5,126 1,621 2,439July ................... 1,010 2,377 2,106 2,067 261 6,980 2,023 16,825 1,326 5,437 1,631 2,336August .............. 1,010 2,390 1,956 2,061 411 8,208 1,829 17,866 1,372 5,508 1,760 2,285September ........ 1,010 2,541 2,708 1,763 279 8,407 1,834 18,543 1,376 6,104 1,926 2,316October ............. 1,010 2,485 1,579 1,625 393 5,869 1,632 14,593 1,356 4,730 1,914 2,244November ......... 1,122 2,120 1,785 1,760 554 6,947 2,010 16,299 1,410 4,995 1,956 2,045December ......... 1,122 2,070 2,099 1,818 608 7,585 1,845 17,148 1,408 4,854 1,986 1,771Average ........... 983 2,262 2,084 1,480 438 7,075 1,664 15,985 1,307 5,350 1,783 2,346
1976January ............. 1,071 2,044 1,806 1,748 496 7,464 1,902 16,530 1,425 4,940 1,996 1,675February ........... 1,071 2,245 2,004 1,829 482 7,969 1,902 17,501 1,456 5,018 2,067 2,002March ................ 1,071 2,413 1,758 1,853 508 8,365 1,872 17,839 1,521 5,744 2,015 2,289April .................. 1,071 1,609 1,888 1,921 496 8,270 1,873 17,127 1,528 5,502 2,061 2,401May ................... 1,071 1,385 1,642 1,958 507 8,450 1,874 16,886 1,513 5,600 2,079 2,410June .................. 1,071 2,011 1,848 1,981 505 8,526 1,944 17,885 1,478 6,102 2,092 2,371July ................... 1,017 2,402 1,851 1,989 502 8,971 1,947 18,678 1,498 5,576 2,046 2,481August .............. 1,017 2,681 1,897 2,013 528 8,738 1,962 18,835 1,511 5,823 1,934 2,447September ........ 1,017 2,681 2,378 2,008 466 8,323 1,979 18,851 1,496 6,461 2,044 2,429October ............. 1,071 2,904 2,652 1,987 474 9,236 2,024 20,347 1,539 6,507 2,110 2,364November ......... 1,178 3,239 2,691 1,885 489 9,394 1,954 20,829 1,501 6,677 2,177 2,264December ......... 1,178 3,351 3,325 2,020 510 9,185 1,998 21,566 1,581 6,630 2,187 2,388Average ........... 1,075 2,415 2,145 1,933 497 8,577 1,936 18,579 1,504 5,883 2,067 2,294
1977January ............. 1,230 2,000 1,480 2,038 460 8,609 1,924 17,741 1,629 5,059 2,193 2,380February ........... 1,230 2,631 2,015 2,072 407 9,634 2,038 20,027 1,701 6,052 2,192 2,332March ................ 1,195 2,421 1,981 2,068 496 9,890 2,003 20,054 1,701 6,275 2,254 2,367April .................. 1,230 2,210 2,046 2,129 431 10,198 2,058 20,302 1,701 5,412 2,254 2,180May ................... 1,118 2,316 1,488 2,138 390 8,507 2,044 18,001 1,696 5,741 2,206 2,125June .................. 1,118 2,316 1,660 2,093 415 9,634 2,034 19,270 1,699 5,104 2,096 2,230July ................... 1,006 2,105 1,603 1,896 398 9,839 2,040 18,887 1,698 4,713 2,061 2,209August .............. 1,006 2,105 1,846 2,120 512 8,711 1,927 18,227 1,677 5,660 2,016 2,284September ........ 1,006 2,526 2,397 2,044 332 8,711 1,994 19,010 1,670 5,972 2,023 2,366October ............. 1,230 2,526 1,921 2,115 530 8,711 2,016 19,049 1,639 5,531 1,946 2,350November ......... 1,230 2,526 2,466 2,075 486 8,968 1,928 19,679 1,708 6,086 1,915 2,074December ......... 1,230 2,526 2,751 1,972 476 9,583 1,987 20,525 1,720 6,385 1,872 1,965Average ........... 1,152 2,348 1,969 2,063 445 9,245 1,999 19,221 1,686 5,663 2,085 2,238
See footnotes at end of table.
Energy Information Administration/Historical Monthly Energy Review 1973-1992 307
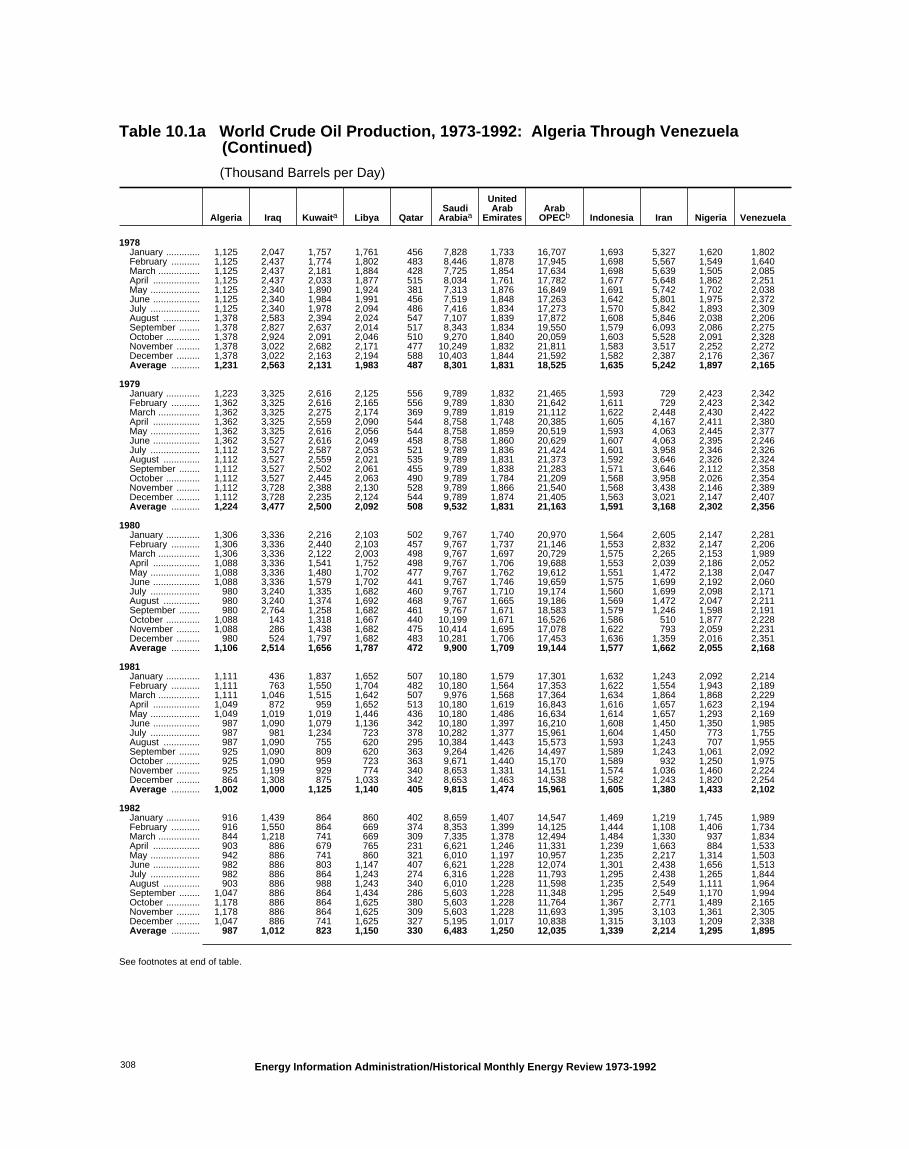
Table 10.1a World Crude Oil Production, 1973-1992: Algeria Through Venezuela (Continued)
(Thousand Barrels per Day)
Algeria Iraq Kuwaita Libya QatarSaudi
Arabiaa
UnitedArab
EmiratesArab
OPECb Indonesia Iran Nigeria Venezuela
1978January ............. 1,125 2,047 1,757 1,761 456 7,828 1,733 16,707 1,693 5,327 1,620 1,802February ........... 1,125 2,437 1,774 1,802 483 8,446 1,878 17,945 1,698 5,567 1,549 1,640March ................ 1,125 2,437 2,181 1,884 428 7,725 1,854 17,634 1,698 5,639 1,505 2,085April .................. 1,125 2,437 2,033 1,877 515 8,034 1,761 17,782 1,677 5,648 1,862 2,251May ................... 1,125 2,340 1,890 1,924 381 7,313 1,876 16,849 1,691 5,742 1,702 2,038June .................. 1,125 2,340 1,984 1,991 456 7,519 1,848 17,263 1,642 5,801 1,975 2,372July ................... 1,125 2,340 1,978 2,094 486 7,416 1,834 17,273 1,570 5,842 1,893 2,309August .............. 1,378 2,583 2,394 2,024 547 7,107 1,839 17,872 1,608 5,846 2,038 2,206September ........ 1,378 2,827 2,637 2,014 517 8,343 1,834 19,550 1,579 6,093 2,086 2,275October ............. 1,378 2,924 2,091 2,046 510 9,270 1,840 20,059 1,603 5,528 2,091 2,328November ......... 1,378 3,022 2,682 2,171 477 10,249 1,832 21,811 1,583 3,517 2,252 2,272December ......... 1,378 3,022 2,163 2,194 588 10,403 1,844 21,592 1,582 2,387 2,176 2,367Average ........... 1,231 2,563 2,131 1,983 487 8,301 1,831 18,525 1,635 5,242 1,897 2,165
1979January ............. 1,223 3,325 2,616 2,125 556 9,789 1,832 21,465 1,593 729 2,423 2,342February ........... 1,362 3,325 2,616 2,165 556 9,789 1,830 21,642 1,611 729 2,423 2,342March ................ 1,362 3,325 2,275 2,174 369 9,789 1,819 21,112 1,622 2,448 2,430 2,422April .................. 1,362 3,325 2,559 2,090 544 8,758 1,748 20,385 1,605 4,167 2,411 2,380May ................... 1,362 3,325 2,616 2,056 544 8,758 1,859 20,519 1,593 4,063 2,445 2,377June .................. 1,362 3,527 2,616 2,049 458 8,758 1,860 20,629 1,607 4,063 2,395 2,246July ................... 1,112 3,527 2,587 2,053 521 9,789 1,836 21,424 1,601 3,958 2,346 2,326August .............. 1,112 3,527 2,559 2,021 535 9,789 1,831 21,373 1,592 3,646 2,326 2,324September ........ 1,112 3,527 2,502 2,061 455 9,789 1,838 21,283 1,571 3,646 2,112 2,358October ............. 1,112 3,527 2,445 2,063 490 9,789 1,784 21,209 1,568 3,958 2,026 2,354November ......... 1,112 3,728 2,388 2,130 528 9,789 1,866 21,540 1,568 3,438 2,146 2,389December ......... 1,112 3,728 2,235 2,124 544 9,789 1,874 21,405 1,563 3,021 2,147 2,407Average ........... 1,224 3,477 2,500 2,092 508 9,532 1,831 21,163 1,591 3,168 2,302 2,356
1980January ............. 1,306 3,336 2,216 2,103 502 9,767 1,740 20,970 1,564 2,605 2,147 2,281February ........... 1,306 3,336 2,440 2,103 457 9,767 1,737 21,146 1,553 2,832 2,147 2,206March ................ 1,306 3,336 2,122 2,003 498 9,767 1,697 20,729 1,575 2,265 2,153 1,989April .................. 1,088 3,336 1,541 1,752 498 9,767 1,706 19,688 1,553 2,039 2,186 2,052May ................... 1,088 3,336 1,480 1,702 477 9,767 1,762 19,612 1,551 1,472 2,138 2,047June .................. 1,088 3,336 1,579 1,702 441 9,767 1,746 19,659 1,575 1,699 2,192 2,060July ................... 980 3,240 1,335 1,682 460 9,767 1,710 19,174 1,560 1,699 2,098 2,171August .............. 980 3,240 1,374 1,692 468 9,767 1,665 19,186 1,569 1,472 2,047 2,211September ........ 980 2,764 1,258 1,682 461 9,767 1,671 18,583 1,579 1,246 1,598 2,191October ............. 1,088 143 1,318 1,667 440 10,199 1,671 16,526 1,586 510 1,877 2,228November ......... 1,088 286 1,438 1,682 475 10,414 1,695 17,078 1,622 793 2,059 2,231December ......... 980 524 1,797 1,682 483 10,281 1,706 17,453 1,636 1,359 2,016 2,351Average ........... 1,106 2,514 1,656 1,787 472 9,900 1,709 19,144 1,577 1,662 2,055 2,168
1981January ............. 1,111 436 1,837 1,652 507 10,180 1,579 17,301 1,632 1,243 2,092 2,214February ........... 1,111 763 1,550 1,704 482 10,180 1,564 17,353 1,622 1,554 1,943 2,189March ................ 1,111 1,046 1,515 1,642 507 9,976 1,568 17,364 1,634 1,864 1,868 2,229April .................. 1,049 872 959 1,652 513 10,180 1,619 16,843 1,616 1,657 1,623 2,194May ................... 1,049 1,019 1,019 1,446 436 10,180 1,486 16,634 1,614 1,657 1,293 2,169June .................. 987 1,090 1,079 1,136 342 10,180 1,397 16,210 1,608 1,450 1,350 1,985July ................... 987 981 1,234 723 378 10,282 1,377 15,961 1,604 1,450 773 1,755August .............. 987 1,090 755 620 295 10,384 1,443 15,573 1,593 1,243 707 1,955September ........ 925 1,090 809 620 363 9,264 1,426 14,497 1,589 1,243 1,061 2,092October ............. 925 1,090 959 723 363 9,671 1,440 15,170 1,589 932 1,250 1,975November ......... 925 1,199 929 774 340 8,653 1,331 14,151 1,574 1,036 1,460 2,224December ......... 864 1,308 875 1,033 342 8,653 1,463 14,538 1,582 1,243 1,820 2,254Average ........... 1,002 1,000 1,125 1,140 405 9,815 1,474 15,961 1,605 1,380 1,433 2,102
1982January ............. 916 1,439 864 860 402 8,659 1,407 14,547 1,469 1,219 1,745 1,989February ........... 916 1,550 864 669 374 8,353 1,399 14,125 1,444 1,108 1,406 1,734March ................ 844 1,218 741 669 309 7,335 1,378 12,494 1,484 1,330 937 1,834April .................. 903 886 679 765 231 6,621 1,246 11,331 1,239 1,663 884 1,533May ................... 942 886 741 860 321 6,010 1,197 10,957 1,235 2,217 1,314 1,503June .................. 982 886 803 1,147 407 6,621 1,228 12,074 1,301 2,438 1,656 1,513July ................... 982 886 864 1,243 274 6,316 1,228 11,793 1,295 2,438 1,265 1,844August .............. 903 886 988 1,243 340 6,010 1,228 11,598 1,235 2,549 1,111 1,964September ........ 1,047 886 864 1,434 286 5,603 1,228 11,348 1,295 2,549 1,170 1,994October ............. 1,178 886 864 1,625 380 5,603 1,228 11,764 1,367 2,771 1,489 2,165November ......... 1,178 886 864 1,625 309 5,603 1,228 11,693 1,395 3,103 1,361 2,305December ......... 1,047 886 741 1,625 327 5,195 1,017 10,838 1,315 3,103 1,209 2,338Average ........... 987 1,012 823 1,150 330 6,483 1,250 12,035 1,339 2,214 1,295 1,895
See footnotes at end of table.
Energy Information Administration/Historical Monthly Energy Review 1973-1992308

Table 10.1a World Crude Oil Production, 1973-1992: Algeria Through Venezuela (Continued)
(Thousand Barrels per Day)
Algeria Iraq Kuwaita Libya QatarSaudi
Arabiaa
UnitedArab
EmiratesArab
OPECb Indonesia Iran Nigeria Venezuela
1983January ............. 1,005 850 780 1,130 255 4,950 1,062 10,032 1,188 2,716 880 2,098February ........... 855 850 895 925 200 3,510 1,062 8,297 984 2,414 675 1,791March ................ 855 900 965 925 170 3,910 1,037 8,762 1,144 2,213 905 2,093April .................. 1,005 950 880 1,030 260 3,930 1,147 9,202 1,358 2,012 1,150 1,726May ................... 855 1,000 1,030 1,130 275 4,725 1,177 10,192 1,358 2,313 1,625 1,695June .................. 1,005 1,000 920 1,130 300 4,620 1,182 10,157 1,358 2,514 1,535 1,700July ................... 1,005 1,050 1,086 1,130 300 5,536 1,177 11,284 1,445 2,816 1,710 1,705August .............. 1,005 1,100 1,181 1,130 265 5,931 1,187 11,799 1,445 2,514 1,300 1,741September ........ 1,005 1,050 1,376 1,180 310 6,026 1,187 12,134 1,425 2,716 1,220 1,736October ............. 1,005 1,100 1,305 1,180 320 6,005 1,167 12,082 1,474 2,414 1,290 1,750November ......... 1,005 1,150 1,265 1,180 460 5,915 1,197 12,172 1,513 2,313 1,245 1,781December ......... 1,005 1,050 1,075 1,180 420 5,825 1,197 11,752 1,396 2,313 1,310 1,786Average ........... 968 1,005 1,064 1,105 295 5,086 1,149 10,672 1,343 2,440 1,241 1,801
1984January ............. 1,033 1,100 1,080 1,100 445 5,130 1,200 11,088 1,415 2,200 1,335 1,825February ........... 954 1,000 1,240 1,100 315 5,040 1,200 10,849 1,515 2,300 1,530 1,800March ................ 954 1,200 1,293 1,100 440 4,843 1,205 11,035 1,505 2,400 1,525 1,800April .................. 954 1,200 1,250 1,200 400 5,150 1,205 11,359 1,512 2,200 1,270 1,800May ................... 1,033 1,200 1,200 1,200 400 5,000 1,200 11,233 1,415 1,700 1,270 1,825June .................. 1,113 1,200 1,200 1,250 500 5,450 1,225 11,938 1,465 2,200 1,370 1,790July ................... 1,033 1,200 1,110 1,100 430 5,010 1,090 10,973 1,340 2,400 1,175 1,845August .............. 1,033 1,300 1,220 1,000 400 4,520 990 10,463 1,360 1,800 1,125 1,805September ........ 1,033 1,300 1,183 1,000 480 4,133 1,110 10,239 1,350 1,900 1,370 1,835October ............. 1,033 1,200 1,129 1,000 380 4,129 1,060 9,931 1,375 2,100 1,565 1,785November ......... 1,033 1,300 990 1,000 280 3,990 1,060 9,653 1,300 2,400 1,565 1,710December ......... 954 1,300 990 1,000 260 3,590 1,210 9,304 1,395 2,500 1,565 1,755Average ........... 1,014 1,209 1,157 1,087 394 4,663 1,146 10,670 1,412 2,174 1,388 1,798
1985January ............. 1,032 1,250 1,118 1,000 270 3,510 1,100 9,280 1,380 1,942 1,423 1,673February ........... 1,064 1,250 1,133 1,000 290 4,025 1,160 9,922 1,401 2,147 1,718 1,678March ................ 1,112 1,200 1,092 1,000 315 3,835 1,215 9,770 1,369 2,249 1,728 1,683April .................. 1,048 1,370 977 1,000 260 3,470 1,215 9,340 1,369 2,351 1,626 1,678May ................... 1,048 1,300 946 1,100 290 2,590 1,160 8,435 1,264 2,045 1,474 1,688June .................. 967 1,370 926 980 300 2,420 1,100 8,064 1,106 2,249 1,118 1,673July ................... 967 1,450 946 910 320 2,740 1,155 8,489 1,369 2,249 1,016 1,673August .............. 967 1,400 946 910 320 2,340 1,200 8,084 1,369 2,453 1,220 1,673September ........ 1,048 1,600 987 1,100 295 2,980 1,285 9,295 1,264 2,249 1,474 1,673October ............. 1,048 1,650 1,062 1,200 320 3,910 1,255 10,446 1,327 2,351 1,728 1,673November ......... 1,096 1,700 1,057 1,200 300 4,200 1,250 10,803 1,369 2,249 1,789 1,678December ......... 1,048 1,650 1,087 1,300 335 4,680 1,225 11,326 1,317 2,453 1,646 1,683Average ........... 1,037 1,433 1,023 1,059 301 3,388 1,193 9,434 1,325 2,250 1,495 1,677
1986January ............. 1,023 1,650 1,115 1,100 333 4,310 1,179 10,711 1,458 2,275 1,197 1,730February ........... 866 1,650 1,315 900 301 4,551 1,369 10,952 1,335 2,166 1,397 1,730March ................ 944 1,650 1,516 900 324 3,972 1,321 10,627 1,335 1,950 1,597 1,730April .................. 944 1,500 1,521 900 167 4,556 1,274 10,862 1,376 2,166 1,697 1,730May ................... 944 1,710 1,511 1,100 333 4,208 1,416 11,223 1,463 2,275 1,597 1,730June .................. 944 1,800 1,651 1,200 398 5,068 1,511 12,572 1,386 2,275 1,536 1,755July ................... 944 1,800 1,806 1,150 371 5,700 1,511 13,281 1,381 2,220 1,552 1,770August .............. 944 1,800 1,734 1,150 371 6,209 1,539 13,747 1,461 1,841 1,761 2,115September ........ 944 1,800 1,118 990 259 4,651 1,274 11,037 1,345 1,625 1,297 1,760October ............. 944 1,800 1,130 1,000 278 4,855 1,283 11,291 1,360 1,625 1,322 1,750November ......... 944 1,605 1,350 1,000 278 5,164 1,132 11,474 1,406 1,841 1,322 1,780December ......... 944 1,510 1,250 1,000 278 5,164 1,151 11,298 1,365 2,166 1,322 1,855Average ........... 945 1,690 1,419 1,034 308 4,870 1,330 11,596 1,390 2,035 1,467 1,787
1987January ............. 1,010 1,650 1,456 950 275 4,004 1,235 10,581 1,311 2,463 1,291 1,671February ........... 1,010 1,670 1,357 950 241 3,868 1,215 10,312 1,281 2,368 1,191 1,671March ................ 1,010 1,700 1,287 850 193 3,300 1,195 9,536 1,296 2,368 1,281 1,807April .................. 1,010 1,900 1,310 925 145 4,030 1,235 10,556 1,311 2,179 1,183 1,701May ................... 1,010 1,900 1,269 930 270 4,197 1,265 10,842 1,332 2,463 1,348 1,726June .................. 1,010 2,000 1,374 950 338 4,238 1,435 11,346 1,332 2,368 1,413 1,766July ................... 1,085 1,950 2,063 1,100 434 4,602 1,605 12,841 1,362 2,368 1,413 1,887August .............. 1,085 2,200 2,063 1,200 405 4,755 1,855 13,565 1,485 2,558 1,401 1,796September ........ 1,085 2,300 2,026 900 319 4,653 1,995 13,279 1,342 1,989 1,351 1,746October ............. 1,085 2,500 1,601 1,000 309 4,638 1,895 13,029 1,352 2,273 1,401 1,751November ......... 1,085 2,550 1,619 950 290 4,248 1,895 12,637 1,352 2,084 1,451 1,746December ......... 1,085 2,600 1,572 950 290 4,612 1,645 12,755 1,352 2,084 1,351 1,746Average ........... 1,048 2,079 1,585 972 293 4,265 1,541 11,783 1,343 2,298 1,341 1,752
See footnotes at end of table.
Energy Information Administration/Historical Monthly Energy Review 1973-1992 309

Table 10.1a World Crude Oil Production, 1973-1992: Algeria Through Venezuela (Continued)
(Thousand Barrels per Day)
Algeria Iraq Kuwaita Libya QatarSaudi
Arabiaa
UnitedArab
EmiratesArab
OPECb Indonesia Iran Nigeria Venezuela
1988January ............. 990 2,588 1,373 1,147 363 4,155 1,174 11,791 1,278 2,082 1,360 1,853February ........... 1,030 2,639 1,239 1,147 427 4,322 1,028 11,833 1,278 1,983 1,410 1,853March ................ 1,050 2,689 1,244 1,147 318 4,332 1,223 12,005 1,329 2,082 1,360 1,853April .................. 1,010 2,689 1,342 1,086 318 4,470 1,389 12,305 1,379 2,181 1,415 1,853May ................... 1,040 2,639 1,249 1,147 318 4,484 1,369 12,247 1,379 2,181 1,465 1,853June .................. 1,040 2,740 1,456 1,147 323 4,582 1,369 12,659 1,379 2,082 1,465 1,853July ................... 1,040 2,639 1,420 1,147 323 4,641 1,394 12,604 1,379 2,280 1,410 1,853August .............. 1,040 2,639 1,621 1,147 323 5,177 1,857 13,804 1,379 2,280 1,460 1,853September ........ 1,040 2,740 1,714 1,203 323 5,314 1,915 14,250 1,278 2,380 1,515 1,928October ............. 1,040 2,740 1,704 1,259 373 6,336 1,949 15,401 1,379 2,380 1,515 1,928November ......... 1,080 2,740 1,807 1,259 373 6,532 2,047 15,838 1,278 2,479 1,465 2,078December ......... 1,080 2,740 1,725 1,259 373 6,655 2,047 15,879 1,379 2,479 1,560 2,078Average ........... 1,040 2,685 1,492 1,175 346 5,086 1,565 13,389 1,342 2,240 1,450 1,903
1989January ............. 1,085 2,720 1,237 1,102 389 4,918 1,647 13,098 1,401 2,748 1,474 1,862February ........... 1,085 2,720 1,336 1,102 408 4,673 1,566 12,889 1,401 2,797 1,474 1,862March ................ 1,085 2,720 1,375 1,102 330 4,515 1,590 12,718 1,401 3,141 1,626 1,862April .................. 1,085 2,823 1,677 1,154 321 4,914 1,618 13,592 1,401 2,846 1,677 1,862May ................... 1,085 2,823 1,984 1,154 398 5,022 1,618 14,084 1,401 2,454 1,677 1,862June .................. 1,085 2,772 2,083 1,154 408 4,825 1,875 14,201 1,401 2,748 1,778 1,913July ................... 1,105 2,926 1,885 1,154 389 4,923 1,823 14,204 1,384 2,748 1,879 1,875August .............. 1,105 3,080 1,885 1,154 389 5,022 1,861 14,494 1,434 2,945 1,778 1,926September ........ 1,105 2,977 1,885 1,154 389 5,219 2,046 14,774 1,384 2,797 1,778 1,926October ............. 1,105 3,080 1,885 1,154 389 5,317 2,141 15,070 1,434 2,896 1,677 1,977November ......... 1,105 3,028 2,073 1,207 369 5,701 2,236 15,718 1,434 2,748 1,879 1,977December ......... 1,105 3,080 2,068 1,207 384 5,696 2,283 15,821 1,434 2,846 1,879 1,977Average ........... 1,095 2,897 1,783 1,150 380 5,064 1,860 14,229 1,409 2,810 1,716 1,907
1990January ............. 1,160 2,946 2,003 1,222 390 5,537 2,052 15,312 1,306 2,700 1,731 1,990February ........... 1,160 2,946 2,003 1,375 401 5,636 2,027 15,549 1,306 3,000 1,731 2,140March ................ 1,160 2,946 2,184 1,324 422 5,765 2,052 15,853 1,411 3,000 1,731 2,040April .................. 1,160 2,997 1,958 1,273 422 5,888 2,097 15,796 1,463 2,900 1,830 2,040May ................... 1,160 3,150 1,958 1,273 385 5,394 2,107 15,427 1,411 3,200 1,731 2,040June .................. 1,160 3,251 1,762 1,273 385 5,398 2,047 15,277 1,411 3,100 1,731 2,040July ................... 1,160 3,454 1,858 1,273 390 5,394 2,047 15,576 1,442 3,050 1,731 2,040August .............. 1,160 1,016 100 1,426 422 5,789 1,648 11,561 1,516 3,300 1,830 2,090September ........ 1,190 508 100 1,426 422 7,660 2,197 13,503 1,536 3,300 1,880 2,290October ............. 1,210 457 75 1,579 422 7,729 2,307 13,779 1,542 3,000 1,929 2,275November ......... 1,210 432 75 1,528 422 8,224 2,372 14,263 1,568 3,200 1,929 2,320December ......... 1,210 432 75 1,528 390 8,481 2,447 14,563 1,620 3,300 1,929 2,340Average ........... 1,175 2,040 1,175 1,375 406 6,410 2,117 14,698 1,462 3,088 1,810 2,137
1991January ............. 1,230 256 51 1,500 366 8,075 2,448 13,925 1,608 3,179 1,906 2,396February ........... 1,230 0 0 1,500 407 8,134 2,472 13,743 1,608 3,278 1,906 2,396March ................ 1,230 0 0 1,450 407 7,936 2,496 13,519 1,608 3,378 1,906 2,396April .................. 1,230 205 0 1,450 407 7,341 2,496 13,129 1,608 3,278 1,906 2,346May ................... 1,230 358 0 1,450 407 7,341 2,301 13,088 1,608 3,278 1,906 2,346June .................. 1,230 358 76 1,450 407 8,085 2,301 13,908 1,608 3,278 1,858 2,346July ................... 1,230 410 167 1,450 407 8,407 2,301 14,373 1,658 3,378 1,858 2,346August .............. 1,230 410 198 1,450 407 8,397 2,301 14,393 1,608 3,378 1,906 2,346September ........ 1,230 410 304 1,500 407 8,332 2,292 14,475 1,559 3,278 1,906 2,346October ............. 1,230 410 436 1,500 407 8,382 2,379 14,744 1,510 3,278 1,809 2,396November ......... 1,230 410 507 1,550 386 8,372 2,443 14,898 1,559 3,278 1,906 2,396December ......... 1,230 410 527 1,550 324 8,571 2,409 15,020 1,559 3,477 1,930 2,446Average ........... 1,230 305 190 1,483 395 8,115 2,386 14,104 1,592 3,312 1,892 2,375
1992January ............. 1,230 450 565 1,550 350 8,790 2,435 15,370 1,580 3,500 1,975 2,390February ........... 1,230 450 630 1,550 325 8,640 2,425 15,250 1,605 3,500 1,925 2,340March ................ 1,230 450 735 1,450 375 8,260 2,300 14,800 1,630 3,350 1,900 2,190April .................. 1,230 450 863 1,500 375 8,213 2,300 14,930 1,605 3,250 1,925 2,190May ................... 1,210 450 915 1,450 375 8,265 2,300 14,965 1,530 3,250 1,925 2,290June .................. 1,210 450 1,015 1,450 375 8,315 2,275 15,090 1,560 3,250 1,925 2,290July ................... 1,210 450 1,080 1,450 400 8,350 2,300 15,240 1,550 3,300 1,975 2,290August .............. 1,210 450 1,130 1,425 425 8,400 2,330 15,370 1,540 3,450 2,000 2,340September ........ 1,210 450 1,200 1,475 425 8,450 2,320 15,530 1,550 3,450 2,025 2,390October ............. 1,210 450 1,280 1,500 440 8,505 2,310 15,695 1,550 3,650 2,050 2,440November ......... 1,210 450 1,375 1,500 440 8,500 2,305 15,780 1,550 3,650 2,050 2,440December ......... 1,210 450 1,550 1,500 440 8,575 2,305 16,030 1,550 3,550 2,100 2,415Average ........... 1,217 450 1,029 1,483 396 8,438 2,325 15,338 1,566 3,429 1,982 2,334
a Includes about one-half of the production in the Kuwait-Saudi ArabiaNeutral Zone from 1973-July 1990 and from June 1991 on. Kuwaiti NeutralZone output was discontinued following Iraq’s invasion of Kuwait on August 2,1990, but was resumed in June 1991. In 1992, Neutral Zone production byboth Kuwait and Saudi Arabia totaled about 336 thousand barrels per day.
b The Arab members of the Organization of Petroleum Exporting Countries(OPEC) are Algeria, Iraq, Kuwait, Libya, Qatar, Saudi Arabia, and the United
Arab Emirates. Production in the Neutral Zone between Kuwait and SaudiArabia is included in "Arab OPEC."
Notes: • Crude oil includes lease condensate but excludes natural gasplant liquids. • Annual averages may not equal average of months due toindependent rounding. • Data for countries may not sum to totals due toindependent rounding.
Sources: See end of section.
Energy Information Administration/Historical Monthly Energy Review 1973-1992310

Table 10.1b World Crude Oil Production, 1973-1992: Total OPEC, Ecuador Through Market Economies, and World
(Thousand Barrels per Day)
TotalOPECa Ecuadora
PersianGulf
Nationsb Canada China MexicoUnited
KingdomUnitedStates
FormerU.S.S.R. Otherc
MarketEcono-miesd World
1973January ....... R 29,915 230 20,051 1,778 1,012 453 2 9,176 R 7,985 3,837 44,928 R 54,389February ..... R 30,207 230 20,335 1,792 1,012 458 2 9,395 R 8,016 3,817 45,438 R 54,930March .......... R 30,329 230 20,332 1,826 1,012 458 2 9,272 R 8,055 3,810 45,469 R 54,995April ............ R 30,377 120 20,241 1,787 1,012 463 2 9,292 R 8,108 3,887 45,470 R 55,049May ............. R 31,595 160 21,369 1,721 1,012 468 2 9,262 R 8,195 3,907 46,657 R 56,323June ............ R 30,741 200 20,454 1,889 1,012 468 2 9,214 R 8,276 3,908 45,964 R 55,711July ............. R 32,390 220 22,224 1,803 1,062 463 2 9,217 R 8,358 3,904 47,541 R 57,420August ........ R 31,761 220 21,537 1,799 1,062 463 2 9,169 R 8,358 3,915 46,871 R 56,750September .. R 32,718 220 22,310 1,735 1,062 463 2 9,065 R 8,565 3,913 47,658 R 57,744October ....... R 31,563 220 21,019 1,802 1,180 473 2 9,224 R 8,591 3,558 46,384 R 56,614November ... R 28,731 220 18,936 1,821 1,180 473 2 9,161 R 8,661 3,616 43,566 R 53,866December ... R 28,942 240 19,154 1,825 1,450 473 2 9,063 R 8,700 3,581 43,663 R 54,277Average ..... R 30,779 209 20,668 1,798 1,090 465 2 9,208 R 8,324 3,804 45,805 R 55,679
1974January ....... R 30,495 240 20,420 1,676 1,165 497 2 8,934 R 8,701 3,765 45,146 R 55,474February ..... R 30,817 240 20,870 1,675 1,165 497 2 9,142 R 8,593 3,812 45,723 R 55,943March .......... R 31,363 250 21,401 1,709 1,165 533 2 8,965 R 8,701 3,688 46,047 R 56,375April ............ R 32,024 255 22,265 1,644 1,165 543 2 8,954 R 8,778 3,746 46,705 R 57,110May ............. R 32,073 240 22,231 1,573 1,219 543 2 8,911 R 8,884 3,834 46,714 R 57,279June ............ R 31,748 240 22,072 1,528 1,219 589 2 8,780 R 8,943 3,810 46,224 R 56,858July ............. R 30,790 100 21,554 1,522 1,219 615 2 8,780 R 8,952 3,786 45,122 R 55,765August ........ R 29,566 120 20,594 1,493 1,219 594 2 8,699 R 8,792 3,817 43,819 R 54,302September .. R 29,845 125 20,977 1,467 1,219 594 2 8,443 R 9,133 4,013 44,017 R 54,841October ....... R 29,468 105 20,901 1,451 1,625 615 2 8,611 R 9,110 4,026 43,806 R 55,013November ... R 29,673 70 21,406 1,334 1,625 615 2 8,569 R 9,180 4,020 43,811 R 55,088December ... R 28,818 145 20,707 1,544 1,761 615 2 8,527 R 9,159 4,026 43,204 R 54,596Average ..... R 30,552 177 21,282 1,551 1,315 571 2 8,774 R 8,912 3,862 45,021 R 55,716
1975January ....... R 27,103 140 19,145 1,558 1,335 660 1 8,455 R 9,199 3,969 41,409 R 52,420February ..... R 25,863 178 18,322 1,469 1,335 671 1 8,591 R 9,300 4,000 40,296 R 51,408March .......... R 25,929 25 18,397 1,352 1,335 673 1 8,493 R 9,381 4,137 40,133 R 51,326April ............ R 25,663 208 18,167 1,197 1,335 673 1 8,457 R 9,388 4,024 39,746 R 50,946May ............. R 25,965 143 18,580 1,197 1,335 693 1 8,379 R 9,426 4,042 39,943 R 51,181June ............ R 26,708 140 18,715 1,468 1,335 732 7 8,421 R 9,505 4,159 41,158 R 52,475July ............. R 27,770 145 19,246 1,468 1,591 781 12 8,336 R 9,496 4,257 42,292 R 53,856August ........ R 29,006 193 20,361 1,472 1,591 686 15 8,249 R 9,586 4,219 43,363 R 55,017September .. R 30,486 186 21,932 1,527 1,591 703 9 8,280 R 9,767 4,192 44,906 R 56,741October ....... R 25,059 181 16,746 1,434 1,694 712 10 8,324 R 9,683 4,292 39,535 R 51,389November ... R 26,926 204 18,468 1,451 1,694 732 12 8,278 R 9,717 4,178 41,304 R 53,192December ... R 27,388 192 19,118 1,571 1,694 742 71 8,254 R 9,816 4,188 41,929 R 53,916Average ..... R 26,994 161 18,934 1,430 1,490 705 12 8,375 R 9,523 4,139 41,338 R 52,828
1976January ....... R 26,777 175 18,710 1,288 1,667 774 117 8,232 R 9,742 4,361 41,242 R 53,133February ..... R 28,270 185 19,679 1,217 1,516 774 117 8,231 R 9,876 4,379 42,691 R 54,565March .......... R 29,632 215 20,719 1,203 1,541 774 127 8,232 R 9,970 4,233 43,934 R 55,927April ............ R 28,831 200 19,698 1,117 1,667 785 142 8,077 R 9,901 4,185 42,855 R 54,905May ............. R 28,697 205 19,519 1,328 1,667 805 188 8,125 R 9,948 4,177 43,043 R 55,140June ............ R 30,137 115 20,997 1,451 1,667 852 203 8,094 R 10,137 4,294 44,664 R 56,950July ............. R 30,509 115 21,309 1,259 1,667 857 259 8,127 R 10,039 4,461 45,105 R 57,293August ........ R 30,783 200 21,688 1,244 1,667 857 259 8,111 R 10,107 4,471 45,443 R 57,699September .. R 31,511 220 22,348 1,262 1,667 857 307 8,150 R 10,161 4,461 46,286 R 58,596October ....... R 33,099 200 23,859 1,360 1,768 878 330 8,063 R 10,244 4,449 47,897 R 60,391November ... R 33,680 215 24,506 1,347 1,768 878 406 8,080 R 10,254 4,327 48,451 R 60,955December ... R 34,581 210 25,061 1,683 1,768 878 482 8,061 R 10,336 4,463 49,876 R 62,462Average ..... R 30,549 188 21,514 1,314 1,670 831 245 8,132 R 10,060 4,355 45,132 R 57,344
1977January ....... R 29,226 220 19,589 1,289 1,841 886 532 7,854 R 10,349 4,636 44,154 R 56,833February ..... R 32,528 210 22,835 1,348 1,841 935 643 8,139 R 10,370 4,635 47,949 R 60,649March .......... R 32,875 160 23,123 1,329 1,841 935 720 8,090 R 10,532 4,662 48,287 R 61,144April ............ R 32,072 180 22,411 1,223 1,841 955 718 8,145 R 10,530 4,522 47,331 R 60,186May ............. R 29,994 180 20,542 1,312 1,841 965 836 8,075 R 10,555 4,504 45,382 R 58,262June ............ R 30,624 200 21,220 1,411 1,841 985 827 8,102 R 10,601 4,567 46,232 R 59,158July ............. R 29,788 155 20,754 1,162 1,852 983 768 8,105 R 10,624 4,591 45,068 R 58,028August ........ R 30,082 190 20,816 1,325 1,852 994 821 8,307 R 10,647 4,636 45,871 R 58,854September .. R 31,258 150 21,986 1,244 1,894 1,001 849 8,480 R 10,624 4,589 47,087 R 60,089October ....... R 30,737 180 21,289 1,242 1,947 1,018 840 8,573 R 10,761 4,663 46,769 R 59,961November ... R 31,684 180 22,516 1,431 1,947 1,044 806 8,579 R 10,791 4,651 47,891 R 61,113December ... R 32,693 200 23,764 1,541 1,947 1,068 851 8,487 R 10,833 4,730 49,081 R 62,350Average ..... R 31,115 183 21,725 1,321 1,874 981 768 8,245 R 10,603 4,616 46,745 R 59,707
See footnotes at end of table.
Energy Information Administration/Historical Monthly Energy Review 1973-1992 311

Table 10.1b World Crude Oil Production, 1973-1992: Total OPEC, Ecuador Through Market Economies, and World (Continued)
(Thousand Barrels per Day)
TotalOPECa Ecuadora
PersianGulf
Nationsb Canada China MexicoUnited
KingdomUnitedStates
FormerU.S.S.R. Otherc
MarketEcono-miesd World
1978January ....... R 27,357 175 19,202 1,254 2,009 1,108 885 8,360 R 10,811 4,747 43,411 R 56,705February ..... R 28,607 169 20,638 1,338 2,009 1,121 945 8,377 R 10,879 4,764 44,846 R 58,208March .......... R 28,769 192 20,317 1,333 2,009 1,101 874 8,720 R 10,902 4,818 45,332 R 58,717April ............ R 29,428 227 20,480 1,124 2,064 1,140 981 8,818 R 11,005 4,824 46,067 R 59,610May ............. R 28,230 205 19,593 1,179 2,064 1,152 1,108 8,825 R 11,017 4,817 45,041 R 58,596June ............ R 29,261 203 19,998 1,524 2,064 1,169 1,114 8,832 R 11,049 4,766 46,394 R 59,981July ............. R 29,095 227 19,945 1,160 2,064 1,207 1,092 8,756 R 11,130 4,825 45,887 R 59,555August ........ R 29,778 180 20,367 1,283 2,064 1,241 1,104 8,758 R 11,180 4,770 46,639 R 60,357September .. R 31,790 205 22,302 1,238 2,118 1,269 1,088 8,800 R 11,218 4,751 48,667 R 62,477October ....... R 31,816 207 22,214 1,363 2,172 1,299 1,156 8,820 R 11,331 4,742 48,929 R 62,906November ... R 31,642 226 21,830 1,490 2,172 1,327 1,282 8,741 R 11,380 4,794 49,028 R 63,054December ... R 30,312 207 20,457 1,512 2,172 1,368 1,350 8,662 R 11,345 4,764 47,700 R 61,691Average ..... R 29,673 202 20,606 1,316 2,082 1,209 1,082 8,707 R 11,105 4,782 46,497 R 60,158
1979January ....... R 28,767 235 18,896 1,437 2,093 1,395 1,499 8,475 R 11,329 4,918 46,262 R 60,148February ..... R 28,960 225 18,894 1,559 2,093 1,395 1,499 8,525 R 11,280 4,937 46,636 R 60,473March .......... R 30,245 225 20,074 1,544 2,093 1,399 1,334 8,601 R 11,280 4,912 47,796 R 61,633April ............ R 31,160 215 21,150 1,499 2,143 1,395 1,453 8,553 R 11,358 5,094 48,905 R 62,870May ............. R 31,210 220 21,214 1,451 2,093 1,400 1,636 8,601 R 11,037 5,019 49,073 R 62,667June ............ R 31,153 220 21,331 1,516 2,093 1,411 1,736 8,432 R 11,310 5,048 49,089 R 62,919July ............. R 31,865 175 22,267 1,507 2,093 1,436 1,699 8,364 R 11,341 5,072 49,691 R 63,552August ........ R 31,456 215 21,936 1,438 2,093 1,452 1,629 8,548 R 11,473 5,121 49,432 R 63,425September .. R 31,155 215 21,806 1,478 2,093 1,471 1,667 8,523 R 11,381 5,200 49,282 R 63,183October ....... R 31,301 215 22,042 1,534 2,192 1,509 1,609 8,621 R 11,541 5,107 49,469 R 63,629November ... R 31,272 210 21,786 1,513 2,192 1,615 1,514 8,761 R 11,595 5,282 49,740 R 63,954December ... R 30,734 200 21,241 1,532 2,192 1,652 1,538 8,615 R 11,679 5,348 49,192 R 63,490Average ..... R 30,784 214 21,066 1,500 2,122 1,461 1,568 8,552 R 11,384 5,089 48,725 R 62,674
1980January ....... R 29,740 215 20,217 1,507 2,095 1,721 1,609 8,675 R 11,570 5,259 48,302 R 62,391February ..... R 30,060 210 20,619 1,491 2,095 1,723 1,660 8,705 R 11,556 5,259 48,684 R 62,759March .......... R 28,884 175 19,735 1,513 2,095 1,829 1,686 8,698 R 11,599 5,211 47,572 R 61,690April ............ R 27,693 230 18,937 1,383 2,095 1,887 1,552 8,685 R 11,648 5,260 46,266 R 60,433May ............. R 26,996 210 18,344 1,468 2,095 1,910 1,627 8,635 R 11,706 5,173 45,595 R 59,820June ............ R 27,361 210 18,618 1,522 2,095 1,906 1,597 8,554 R 11,648 5,157 45,883 R 60,050July ............. R 26,874 205 18,261 1,502 2,145 2,014 1,587 8,547 R 11,774 5,002 45,307 R 59,650August ........ R 26,660 220 18,031 1,472 2,145 1,999 1,535 8,414 R 11,820 5,222 45,098 R 59,487September .. R 25,372 165 17,212 1,385 2,145 2,124 1,541 8,619 R 11,859 5,128 43,910 R 58,338October ....... R 22,903 210 14,327 1,271 2,120 2,182 1,574 8,532 R 11,823 5,266 41,514 R 55,881November ... R 23,960 205 15,147 1,388 2,120 1,901 1,734 8,495 R 11,745 5,160 42,419 R 56,708December ... R 24,988 195 16,196 1,322 2,120 2,027 1,762 8,606 R 11,716 5,352 43,828 R 58,088Average ..... R 26,781 204 17,961 1,435 2,114 1,936 1,622 8,597 R 11,706 5,204 45,355 R 59,599
1981January ....... R 24,638 215 15,829 1,391 2,020 2,220 1,755 8,540 R 11,826 5,314 43,643 R 57,919February ..... R 24,801 225 16,139 1,390 2,020 2,121 1,797 8,604 R 11,826 5,400 43,908 R 58,184March .......... R 25,098 220 16,522 1,282 2,020 2,367 1,887 8,613 R 11,875 5,475 44,512 R 58,837April ............ R 24,081 200 15,847 1,329 2,020 2,539 1,864 8,557 R 11,816 5,425 43,565 R 57,831May ............. R 23,516 200 15,844 1,250 2,020 2,546 1,727 8,501 R 11,826 5,435 42,745 R 57,021June ............ R 22,747 210 15,585 1,233 2,020 2,559 1,765 8,629 R 11,832 5,342 42,055 R 56,337July ............. R 21,697 200 15,746 1,272 2,010 2,098 1,750 8,500 R 11,846 5,669 40,756 R 55,042August ........ R 21,223 220 15,254 1,233 2,010 2,262 1,759 8,583 R 11,896 4,919 39,769 R 54,105September .. R 20,638 215 14,239 1,267 2,010 2,479 1,828 8,604 R 11,843 5,332 39,933 R 54,216October ....... R 21,073 220 14,502 1,119 2,000 2,489 1,847 8,563 R 11,873 5,398 40,279 R 54,582November ... R 20,602 210 13,535 1,281 2,000 2,091 1,842 8,586 R 11,865 5,531 39,713 R 54,008December ... R 21,595 200 13,931 1,379 2,000 1,982 1,913 8,585 R 11,873 5,448 40,672 R 54,975Average ..... R 22,632 211 15,245 1,285 2,012 2,313 1,811 8,572 R 11,850 5,390 41,784 R 56,076
1982January ....... R 21,126 200 14,036 1,252 2,045 2,314 1,907 8,509 R 11,776 5,594 40,448 R 54,724February ..... R 19,974 210 13,694 1,309 2,045 2,552 1,895 8,702 R 11,776 5,621 39,809 R 54,085March .......... R 18,233 215 12,356 1,214 2,045 2,544 1,969 8,667 R 11,873 5,501 37,889 R 52,262April ............ R 16,807 190 11,371 955 2,045 2,780 2,100 8,591 R 11,882 5,612 36,581 R 50,963May ............. R 17,394 200 11,417 1,171 2,045 2,713 2,081 8,683 R 11,882 5,639 37,427 R 51,809June ............ R 19,139 210 12,427 1,341 2,045 2,790 2,060 8,646 R 11,931 5,588 39,320 R 53,751July ............. R 18,792 220 12,050 1,265 2,045 2,788 2,087 8,658 R 11,878 5,597 38,953 R 53,331August ........ R 18,614 215 12,044 1,332 2,045 2,793 2,045 8,634 R 11,923 5,651 38,830 R 53,253September .. R 18,501 215 11,459 1,287 2,045 2,830 2,149 8,701 R 11,828 5,551 38,780 R 53,108October ....... R 19,713 220 11,774 1,340 2,045 2,900 2,181 8,701 R 12,038 5,686 40,287 R 54,825November ... R 20,014 220 12,035 1,456 2,045 2,939 2,143 8,697 R 12,038 5,861 40,876 R 55,414December ... R 18,955 215 11,311 1,334 2,045 3,027 2,153 8,598 R 12,106 5,845 39,673 R 54,279Average ..... R 18,934 211 12,156 1,271 2,045 2,748 2,065 8,649 R 11,912 5,646 39,069 R 53,481
See footnotes at end of table.
Energy Information Administration/Historical Monthly Energy Review 1973-1992312

Table 10.1b World Crude Oil Production, 1973-1992: Total OPEC, Ecuador Through Market Economies, and World (Continued)
(Thousand Barrels per Day)
TotalOPECa Ecuadora
PersianGulf
Nationsb Canada China MexicoUnited
KingdomUnitedStates
FormerU.S.S.R. Otherc
MarketEcono-miesd World
1983January ....... R 17,091 215 10,655 1,205 2,085 2,983 2,135 8,697 R 12,342 6,014 37,880 R 52,768February ..... R 14,318 230 8,973 1,333 2,110 2,298 2,315 8,758 R 12,342 6,112 34,904 R 49,817March .......... R 15,259 230 9,237 1,366 2,110 2,418 2,265 8,700 R 12,342 6,050 35,828 R 50,741April ............ R 15,615 230 9,221 1,234 2,120 2,673 2,170 8,776 R 11,937 6,208 36,446 R 50,964May ............. R 17,325 230 10,562 1,293 2,120 2,798 2,235 8,631 R 11,840 6,191 38,243 R 52,664June ............ R 17,441 225 10,578 1,475 2,120 2,778 2,045 8,667 R 11,840 6,282 38,453 R 52,874July ............. R 19,137 235 12,007 1,450 2,120 2,688 2,280 8,636 R 11,840 6,270 40,236 R 54,657August ........ R 18,966 250 12,220 1,392 2,130 2,778 2,290 8,679 R 11,840 6,178 40,073 R 54,504September .. R 19,368 250 12,707 1,406 2,130 2,738 2,385 8,784 R 11,840 6,256 40,727 R 55,158October ....... R 19,162 250 12,353 1,362 2,130 2,663 2,355 8,771 R 11,840 6,363 40,466 R 54,897November ... R 19,161 250 12,342 1,387 2,130 2,733 2,490 8,770 R 11,840 6,503 40,834 R 55,265December ... R 18,709 250 11,922 1,372 2,130 2,693 2,530 8,397 R 11,840 6,538 40,029 R 54,460Average ..... R 17,654 237 11,081 1,356 2,120 2,689 2,291 8,688 R 11,972 6,248 38,703 R 53,255
1984January ....... R 18,018 250 11,197 1,370 2,225 2,700 2,510 8,868 R 11,937 6,687 39,966 R 54,566February ..... R 18,139 250 11,137 1,445 2,225 2,785 2,585 8,874 R 11,937 6,676 40,317 R 54,917March .......... R 18,420 250 11,424 1,475 2,225 2,740 2,465 8,672 R 11,783 6,608 40,193 R 54,639April ............ R 18,296 260 11,447 1,430 2,250 2,800 2,460 8,862 R 11,783 6,696 40,367 R 54,838May ............. R 17,608 250 10,741 1,415 2,250 2,830 2,425 8,955 R 11,932 6,791 39,837 R 54,457June ............ R 18,923 260 11,817 1,470 2,250 2,850 2,335 8,852 R 11,932 6,861 41,114 R 55,734July ............. R 17,893 265 11,281 1,515 2,330 2,875 2,455 8,885 R 11,906 6,889 40,340 R 55,014August ........ R 16,703 265 10,269 1,435 2,330 2,710 2,285 8,809 R 11,906 6,892 38,662 R 53,336September .. R 16,854 265 10,147 1,330 2,365 2,735 2,420 8,993 R 11,824 7,008 39,168 R 53,795October ....... R 16,916 260 10,039 1,460 2,365 2,705 2,600 8,906 R 11,824 7,169 39,579 R 54,206November ... R 16,788 260 10,059 1,460 2,365 2,775 2,590 8,979 R 11,783 7,222 39,637 R 54,223December ... R 16,679 260 9,890 1,445 2,365 2,860 2,630 8,897 R 11,783 7,263 39,597 R 54,183Average ..... R 17,599 258 10,784 1,438 2,296 2,780 2,480 8,879 R 11,861 6,897 39,893 R 54,488
1985January ....... R 15,866 262 9,232 1,416 2,475 2,645 2,755 8,740 R 11,482 7,333 38,580 R 52,972February ..... R 17,033 273 10,046 1,462 2,475 2,695 2,625 9,025 R 11,482 7,373 40,050 R 54,442March .......... R 16,967 283 9,948 1,516 2,475 2,820 2,575 9,095 R 11,482 7,448 40,268 R 54,661April ............ R 16,533 283 9,686 1,415 2,505 2,835 2,610 9,043 R 11,482 7,530 39,813 R 54,235May ............. R 15,074 283 8,374 1,467 2,505 2,800 2,520 9,132 R 11,523 7,494 38,334 R 52,798June ............ R 14,378 252 8,407 1,463 2,505 2,565 2,430 9,022 R 11,461 7,264 36,937 R 51,339July ............. R 14,965 283 8,902 1,480 2,515 2,630 2,365 8,949 R 11,585 7,597 37,842 R 52,368August ........ R 14,968 283 8,703 1,447 2,515 2,805 2,195 8,803 R 11,626 7,589 37,664 R 52,231September .. R 16,127 293 9,437 1,448 2,515 2,825 2,575 8,954 R 11,688 7,686 39,482 R 54,111October ....... R 17,705 293 10,592 1,485 2,525 2,760 2,645 8,970 R 11,729 7,684 41,124 R 55,795November ... R 18,067 293 10,797 1,535 2,525 2,805 2,655 8,902 R 11,739 7,753 41,597 R 56,273December ... R 18,605 293 11,474 1,517 2,525 2,750 2,420 9,030 R 11,729 7,720 41,921 R 56,588Average ..... R 16,353 281 9,630 1,471 2,505 2,745 2,530 8,971 R 11,585 7,540 39,463 R 53,981
1986January ....... R 17,534 305 10,907 1,491 2,576 2,515 2,656 9,137 R 11,596 7,743 40,948 R 55,553February ..... R 17,743 305 11,395 1,399 2,576 2,129 2,715 9,173 R 11,658 7,865 40,895 R 55,563March .......... R 17,402 315 10,775 1,356 2,576 2,225 2,700 9,013 R 11,756 7,723 40,301 R 55,066April ............ R 17,993 320 11,225 1,392 2,576 2,365 2,571 8,864 R 11,807 7,283 40,354 R 55,170May ............. R 18,451 320 11,496 1,443 2,576 2,535 2,536 8,838 R 11,896 7,755 41,444 R 56,349June ............ R 19,699 320 12,745 1,559 2,576 2,555 2,190 8,623 R 11,906 7,693 42,209 R 57,120July ............. R 20,378 320 13,449 1,547 2,576 2,545 2,599 8,660 R 11,932 7,701 43,320 R 58,257August ........ R 21,099 280 13,538 1,534 2,576 2,575 2,589 8,374 R 11,983 7,900 43,921 R 58,910September .. R 17,217 235 10,774 1,519 2,641 2,380 2,549 8,328 R 12,003 8,010 39,808 R 54,882October ....... R 17,522 230 11,018 1,536 2,641 2,330 2,564 8,419 R 12,029 7,968 40,144 R 55,238November ... R 17,986 285 11,416 1,447 2,776 2,460 2,467 8,412 R 12,081 8,252 40,884 R 56,166December ... R 18,169 285 11,565 1,461 2,776 2,575 2,338 8,352 R 12,075 8,305 41,060 R 56,336Average ..... R 18,441 293 11,696 1,474 2,620 2,435 2,539 8,680 R 11,895 7,850 41,282 R 56,227
1987January ....... R 17,466 274 11,125 1,491 2,690 2,518 2,565 8,480 R 11,928 8,176 40,552 R 55,587February ..... R 16,971 264 10,761 1,475 2,690 2,548 2,497 8,389 R 11,902 8,155 39,879 R 54,891March .......... R 16,437 46 10,085 1,485 2,690 2,528 2,445 8,464 R 12,024 8,031 39,017 R 54,150April ............ 17,078 0 10,840 1,470 2,690 2,538 2,465 8,498 R 11,953 8,131 39,762 R 54,823May ............. R 17,859 41 11,408 1,501 2,690 2,563 2,464 8,336 R 11,953 8,220 40,566 R 55,627June ............ R 18,373 41 11,796 1,587 2,690 2,538 1,881 8,279 R 11,953 7,986 40,267 R 55,328July ............. R 20,030 51 13,067 1,607 2,690 2,528 2,416 8,251 R 12,009 8,308 42,772 R 57,890August ........ R 20,963 183 13,877 1,627 2,690 2,553 2,382 8,210 R 11,998 8,081 43,580 R 58,687September .. R 19,866 253 13,324 1,556 2,690 2,568 2,387 8,205 R 12,172 8,383 42,799 R 58,080October ....... R 19,966 314 13,260 1,536 2,690 2,563 2,430 8,364 R 11,998 8,414 43,168 R 58,275November ... R 19,429 314 12,727 1,516 2,690 2,568 2,460 8,397 R 11,928 8,511 42,776 R 57,813December ... R 19,462 314 12,845 1,562 2,690 2,568 2,474 8,318 R 11,998 8,501 42,779 R 57,887Average ..... R 18,672 174 12,103 1,535 2,690 2,548 2,406 8,349 R 11,985 8,242 41,507 R 56,601
See footnotes at end of table.
Energy Information Administration/Historical Monthly Energy Review 1973-1992 313

Table 10.1b World Crude Oil Production, 1973-1992: Total OPEC, Ecuador Through Market Economies, and World (Continued)
(Thousand Barrels per Day)
TotalOPECa Ecuadora
PersianGulf
Nationsb Canada China MexicoUnited
KingdomUnitedStates
FormerU.S.S.R. Otherc
MarketEcono-miesd World
1988January ....... R 18,524 293 11,778 1,533 2,712 2,566 2,524 8,250 R 12,000 8,702 42,003 R 57,104February ..... R 18,516 303 11,680 1,614 2,712 2,536 2,519 8,374 R 12,014 8,596 42,068 R 57,184March .......... R 18,787 303 11,931 1,639 2,712 2,521 2,519 8,374 R 11,954 8,736 42,490 R 57,545April ............ R 19,292 303 12,433 1,579 2,712 2,496 2,509 8,288 R 11,975 8,702 42,779 R 57,856May ............. R 19,285 303 12,284 1,608 2,692 2,531 2,367 8,229 R 11,975 8,584 42,516 R 57,573June ............ R 19,597 303 12,596 1,606 2,692 2,536 2,003 8,170 R 11,975 8,356 42,181 R 57,238July ............. R 19,686 303 12,740 1,649 2,692 2,536 2,087 8,040 R 11,975 8,695 42,601 R 57,662August ........ R 20,936 303 13,940 1,654 2,697 2,536 2,052 8,079 R 11,975 8,587 43,752 R 58,818September .. R 21,510 303 14,430 1,606 2,767 2,291 2,077 7,895 R 11,975 8,748 44,035 R 59,172October ....... R 22,762 303 15,527 1,637 2,792 2,536 2,033 8,023 R 11,975 8,794 45,693 R 60,855November ... R 23,297 303 16,022 1,654 2,792 2,516 2,057 8,023 R 11,975 8,698 46,153 R 61,314December ... R 23,534 303 16,063 1,615 2,792 2,536 2,047 7,942 R 11,975 8,817 46,399 R 61,561Average ..... R 20,483 302 13,457 1,616 2,730 2,512 2,232 8,140 R 11,978 8,669 43,562 R 58,662
1989January ....... 20,747 302 13,702 1,580 2,787 2,538 1,829 7,937 11,803 9,155 43,695 58,678February ..... 20,589 272 13,543 1,570 2,787 2,507 1,779 7,788 11,803 9,104 43,216 58,199March .......... 20,917 272 13,715 1,540 2,787 2,548 1,824 7,575 11,803 9,335 43,617 58,601April ............ 21,566 272 14,242 1,555 2,687 2,533 1,723 7,772 11,686 9,237 44,254 59,031May ............. 21,676 243 14,342 1,560 2,697 2,533 1,567 7,816 11,686 9,175 44,185 58,952June ............ 22,240 272 14,754 1,600 2,697 2,533 1,377 7,624 11,630 9,018 44,278 58,989July ............. 22,289 272 14,737 1,535 2,737 2,528 1,767 7,444 11,630 9,307 44,757 59,507August ........ 22,794 292 15,220 1,540 2,767 2,528 1,854 7,544 11,630 9,451 45,613 60,399September .. 22,876 292 15,355 1,580 2,801 2,462 1,965 7,548 11,517 9,440 45,773 60,482October ....... 23,317 292 15,749 1,525 2,826 2,523 2,061 7,453 11,441 9,614 46,390 61,052November ... 24,021 282 16,198 1,595 2,767 2,523 1,980 7,536 11,441 9,668 47,210 61,812December ... 24,204 282 16,400 1,545 2,742 2,482 1,890 7,337 11,441 9,533 46,878 61,455Average ..... 22,279 279 14,837 1,560 2,757 2,520 1,802 7,613 11,625 9,338 44,999 59,773
1990January ....... 23,293 280 15,673 1,483 2,805 2,520 1,918 7,546 11,470 9,579 46,297 60,895February ..... 23,990 280 16,055 1,503 2,785 2,520 1,818 7,497 11,101 9,656 46,944 61,153March .......... 24,309 280 16,411 1,610 2,755 2,510 1,943 7,433 11,470 9,745 47,507 62,056April ............ 24,303 280 16,304 1,554 2,755 2,510 1,923 7,407 11,280 9,767 47,420 61,779May ............. 24,053 280 16,235 1,534 2,755 2,485 1,893 7,328 11,108 9,775 47,021 61,212June ............ 23,823 280 15,987 1,514 2,765 2,465 1,838 7,106 10,932 9,660 46,364 60,383July ............. 24,104 280 16,235 1,549 2,725 2,485 1,750 7,173 10,843 9,578 46,597 60,488August ........ 20,561 300 12,318 1,549 2,760 2,535 1,630 7,287 10,723 9,596 43,140 56,941September .. 22,783 290 14,230 1,554 2,820 2,626 1,760 7,224 10,633 9,799 45,730 59,488October ....... 22,813 290 14,034 1,605 2,785 2,646 1,865 7,542 10,362 9,921 46,395 59,828November ... 23,573 290 14,767 1,575 2,810 2,666 1,827 7,387 10,309 10,211 47,239 60,646December ... 24,045 290 15,168 1,600 2,770 2,666 1,677 7,338 10,338 10,134 47,470 60,858Average ..... 23,465 285 15,278 1,553 2,774 2,553 1,820 7,355 10,880 9,785 46,505 60,471
1991January ....... 23,327 298 14,413 1,561 2,822 2,664 1,675 7,500 10,663 10,106 46,918 60,614February ..... 23,245 303 14,330 1,621 2,832 2,678 1,904 7,637 9,943 10,141 47,321 60,304March .......... 23,095 303 14,258 1,546 2,827 2,673 2,068 7,546 10,367 10,135 47,157 60,559April ............ 22,555 303 13,766 1,445 2,832 2,659 1,526 7,509 10,310 10,023 45,806 59,161May ............. 22,513 282 13,726 1,505 2,832 2,699 1,396 7,409 10,222 10,125 45,703 58,984June ............ 23,285 282 14,541 1,525 2,842 2,724 1,525 7,320 9,808 9,865 46,302 59,176July ............. 23,898 303 15,106 1,535 2,842 2,694 1,805 7,347 9,808 9,937 47,241 60,169August ........ 23,918 303 15,127 1,581 2,842 2,664 1,827 7,316 9,420 9,603 46,932 59,473September .. 23,852 303 15,061 1,551 2,837 2,679 1,896 7,368 9,886 10,142 47,486 60,511October ....... 24,035 303 15,329 1,505 2,837 2,684 1,990 7,437 9,492 10,184 47,862 60,467November ... 24,335 303 15,434 1,621 2,842 2,664 1,975 7,328 9,378 10,268 48,242 60,712December ... 24,730 303 15,755 1,586 2,837 2,679 1,979 7,299 9,347 10,361 48,690 61,120Average ..... 23,569 299 14,741 1,548 2,835 2,680 1,797 7,417 9,887 10,074 47,139 60,105
1992January ....... 25,100 295 16,130 1,585 2,830 2,675 1,920 7,361 9,115 10,526 49,137 61,407February ..... 24,880 295 16,010 1,560 2,865 2,665 1,905 7,389 8,650 10,375 48,744 60,584March .......... 24,170 315 15,510 1,620 2,835 2,680 1,755 7,348 8,760 10,429 47,995 59,912April ............ 24,205 315 15,487 1,535 2,855 2,680 1,835 7,293 9,025 10,523 48,059 60,265May ............. 24,265 315 15,592 1,510 2,835 2,660 1,700 7,169 8,455 10,251 47,546 59,160June ............ 24,420 315 15,716 1,560 2,830 2,680 1,545 7,167 8,440 10,443 47,806 59,400July ............. 24,660 320 15,916 1,630 2,825 2,660 1,780 7,131 8,365 10,498 48,351 59,869August ........ 25,005 330 16,220 1,675 2,815 2,685 1,825 6,922 8,130 10,472 48,585 59,858September .. 25,245 330 16,330 1,620 2,860 2,685 1,830 7,030 7,980 10,543 48,955 60,123October ....... 25,685 330 16,670 1,665 2,875 2,655 1,930 7,126 7,965 10,687 49,745 60,918November ... 25,770 330 16,755 1,640 2,845 2,640 1,945 7,024 7,910 10,517 49,533 60,621December ... 25,945 330 16,905 1,575 2,785 2,655 1,935 7,103 7,870 10,744 49,954 60,942Average ..... 24,947 318 16,104 1,598 2,838 2,668 1,825 7,171 8,388 10,501 48,702 60,255
a "Total OPEC" consists of Algeria, Gabon, Indonesia, Iran, Iraq, Kuwait,Libya, Nigeria, Qatar, Saudi Arabia, the United Arab Emirates, andVenezuela. Production from the Neutral Zone between Kuwait and SaudiArabia is included in "Total OPEC." See Note 4 at end of section.
b The Persian Gulf Nations are Bahrain, Iran, Iraq, Kuwait, Qatar, SaudiArabia, and the United Arab Emirates. Production from the Neutral Zonebetween Kuwait and Saudi Arabia is included in "Persian Gulf Nations."
c "Other" is a calculated total derived from the difference between "World"and the sum of production in "Total OPEC," Ecuador, Canada, China, Mexico,the United Kingdom, the United States, and the former U.S.S.R.
d World excluding Albania, Bulgaria, Cambodia, China, Cuba, formerCzechoslovakia, East Germany, Hungary, Laos, Mongolia, North Korea,Poland, Romania, former U.S.S.R., Vietnam, and former Yugoslavia.
R=Revised data. Notes: • Crude oil includes lease condensate but excludes natural gas
plant liquids. • Annual averages may not equal average of months due toindependent rounding. • Data for countries may not sum to World totals dueto independent rounding. • U.S. geographic coverage is the 50 States andthe District of Columbia.
Sources: See end of section.
Energy Information Administration/Historical Monthly Energy Review 1973-1992314
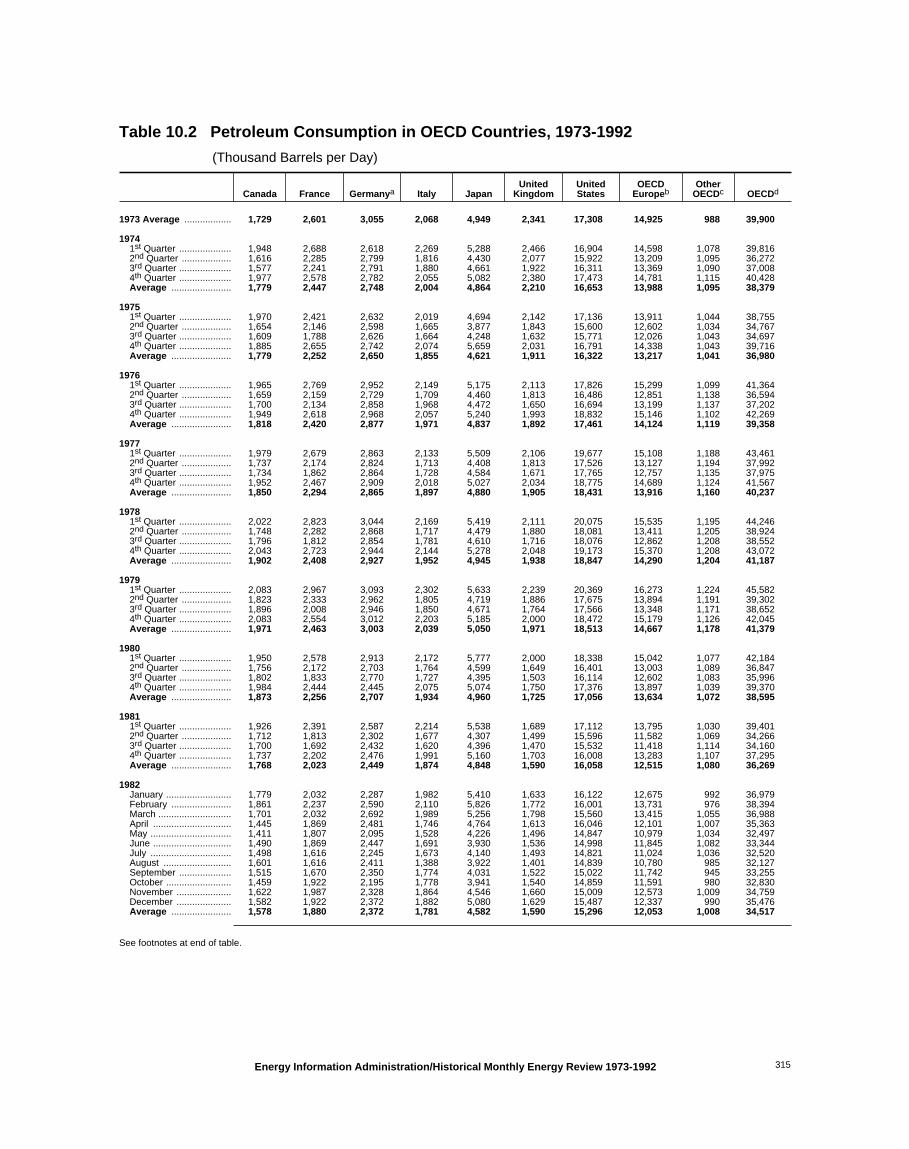
Table 10.2 Petroleum Consumption in OECD Countries, 1973-1992
(Thousand Barrels per Day)
Canada France Germanya Italy JapanUnited
KingdomUnitedStates
OECDEuropeb
OtherOECDc OECDd
1973 Average .................. 1,729 2,601 3,055 2,068 4,949 2,341 17,308 14,925 988 39,900
19741st Quarter .................... 1,948 2,688 2,618 2,269 5,288 2,466 16,904 14,598 1,078 39,8162nd Quarter ................... 1,616 2,285 2,799 1,816 4,430 2,077 15,922 13,209 1,095 36,2723rd Quarter .................... 1,577 2,241 2,791 1,880 4,661 1,922 16,311 13,369 1,090 37,0084th Quarter .................... 1,977 2,578 2,782 2,055 5,082 2,380 17,473 14,781 1,115 40,428Average ....................... 1,779 2,447 2,748 2,004 4,864 2,210 16,653 13,988 1,095 38,379
19751st Quarter .................... 1,970 2,421 2,632 2,019 4,694 2,142 17,136 13,911 1,044 38,7552nd Quarter ................... 1,654 2,146 2,598 1,665 3,877 1,843 15,600 12,602 1,034 34,7673rd Quarter .................... 1,609 1,788 2,626 1,664 4,248 1,632 15,771 12,026 1,043 34,6974th Quarter .................... 1,885 2,655 2,742 2,074 5,659 2,031 16,791 14,338 1,043 39,716Average ....................... 1,779 2,252 2,650 1,855 4,621 1,911 16,322 13,217 1,041 36,980
19761st Quarter .................... 1,965 2,769 2,952 2,149 5,175 2,113 17,826 15,299 1,099 41,3642nd Quarter ................... 1,659 2,159 2,729 1,709 4,460 1,813 16,486 12,851 1,138 36,5943rd Quarter .................... 1,700 2,134 2,858 1,968 4,472 1,650 16,694 13,199 1,137 37,2024th Quarter .................... 1,949 2,618 2,968 2,057 5,240 1,993 18,832 15,146 1,102 42,269Average ....................... 1,818 2,420 2,877 1,971 4,837 1,892 17,461 14,124 1,119 39,358
19771st Quarter .................... 1,979 2,679 2,863 2,133 5,509 2,106 19,677 15,108 1,188 43,4612nd Quarter ................... 1,737 2,174 2,824 1,713 4,408 1,813 17,526 13,127 1,194 37,9923rd Quarter .................... 1,734 1,862 2,864 1,728 4,584 1,671 17,765 12,757 1,135 37,9754th Quarter .................... 1,952 2,467 2,909 2,018 5,027 2,034 18,775 14,689 1,124 41,567Average ....................... 1,850 2,294 2,865 1,897 4,880 1,905 18,431 13,916 1,160 40,237
19781st Quarter .................... 2,022 2,823 3,044 2,169 5,419 2,111 20,075 15,535 1,195 44,2462nd Quarter ................... 1,748 2,282 2,868 1,717 4,479 1,880 18,081 13,411 1,205 38,9243rd Quarter .................... 1,796 1,812 2,854 1,781 4,610 1,716 18,076 12,862 1,208 38,5524th Quarter .................... 2,043 2,723 2,944 2,144 5,278 2,048 19,173 15,370 1,208 43,072Average ....................... 1,902 2,408 2,927 1,952 4,945 1,938 18,847 14,290 1,204 41,187
19791st Quarter .................... 2,083 2,967 3,093 2,302 5,633 2,239 20,369 16,273 1,224 45,5822nd Quarter ................... 1,823 2,333 2,962 1,805 4,719 1,886 17,675 13,894 1,191 39,3023rd Quarter .................... 1,896 2,008 2,946 1,850 4,671 1,764 17,566 13,348 1,171 38,6524th Quarter .................... 2,083 2,554 3,012 2,203 5,185 2,000 18,472 15,179 1,126 42,045Average ....................... 1,971 2,463 3,003 2,039 5,050 1,971 18,513 14,667 1,178 41,379
19801st Quarter .................... 1,950 2,578 2,913 2,172 5,777 2,000 18,338 15,042 1,077 42,1842nd Quarter ................... 1,756 2,172 2,703 1,764 4,599 1,649 16,401 13,003 1,089 36,8473rd Quarter .................... 1,802 1,833 2,770 1,727 4,395 1,503 16,114 12,602 1,083 35,9964th Quarter .................... 1,984 2,444 2,445 2,075 5,074 1,750 17,376 13,897 1,039 39,370Average ....................... 1,873 2,256 2,707 1,934 4,960 1,725 17,056 13,634 1,072 38,595
19811st Quarter .................... 1,926 2,391 2,587 2,214 5,538 1,689 17,112 13,795 1,030 39,4012nd Quarter ................... 1,712 1,813 2,302 1,677 4,307 1,499 15,596 11,582 1,069 34,2663rd Quarter .................... 1,700 1,692 2,432 1,620 4,396 1,470 15,532 11,418 1,114 34,1604th Quarter .................... 1,737 2,202 2,476 1,991 5,160 1,703 16,008 13,283 1,107 37,295Average ....................... 1,768 2,023 2,449 1,874 4,848 1,590 16,058 12,515 1,080 36,269
1982January ......................... 1,779 2,032 2,287 1,982 5,410 1,633 16,122 12,675 992 36,979February ....................... 1,861 2,237 2,590 2,110 5,826 1,772 16,001 13,731 976 38,394March ............................ 1,701 2,032 2,692 1,989 5,256 1,798 15,560 13,415 1,055 36,988April .............................. 1,445 1,869 2,481 1,746 4,764 1,613 16,046 12,101 1,007 35,363May ............................... 1,411 1,807 2,095 1,528 4,226 1,496 14,847 10,979 1,034 32,497June .............................. 1,490 1,869 2,447 1,691 3,930 1,536 14,998 11,845 1,082 33,344July ............................... 1,498 1,616 2,245 1,673 4,140 1,493 14,821 11,024 1,036 32,520August .......................... 1,601 1,616 2,411 1,388 3,922 1,401 14,839 10,780 985 32,127September .................... 1,515 1,670 2,350 1,774 4,031 1,522 15,022 11,742 945 33,255October ......................... 1,459 1,922 2,195 1,778 3,941 1,540 14,859 11,591 980 32,830November ..................... 1,622 1,987 2,328 1,864 4,546 1,660 15,009 12,573 1,009 34,759December ..................... 1,582 1,922 2,372 1,882 5,080 1,629 15,487 12,337 990 35,476Average ....................... 1,578 1,880 2,372 1,781 4,582 1,590 15,296 12,053 1,008 34,517
See footnotes at end of table.
Energy Information Administration/Historical Monthly Energy Review 1973-1992 315

Table 10.2 Petroleum Consumption in OECD Countries, 1973-1992 (Continued)
(Thousand Barrels per Day)
Canada France Germanya Italy JapanUnited
KingdomUnitedStates
OECDEuropeb
OtherOECDc OECDd
1983January ......................... 1,402 1,929 2,200 1,797 4,604 1,520 14,722 11,685 889 33,302February ....................... 1,534 2,228 2,408 1,992 5,135 1,684 14,792 13,011 929 35,401March ............................ 1,354 1,914 2,520 1,856 4,824 1,680 15,541 12,456 976 35,150April .............................. 1,273 2,025 2,242 1,654 4,093 1,543 14,692 11,658 921 32,637May ............................... 1,387 1,726 2,312 1,541 3,663 1,448 14,505 11,217 973 31,745June .............................. 1,435 1,652 2,381 1,591 3,919 1,474 15,289 11,264 964 32,870July ............................... 1,337 1,418 2,084 1,559 3,973 1,388 15,019 10,258 937 31,525August .......................... 1,517 1,595 2,225 1,477 4,225 1,457 15,480 10,974 990 33,187September .................... 1,476 1,637 2,340 1,789 4,219 1,537 15,506 11,501 945 33,647October ......................... 1,451 1,709 2,395 1,772 4,096 1,539 14,962 11,821 952 33,282November ..................... 1,541 2,015 2,397 1,968 4,646 1,562 15,500 12,608 998 35,293December ..................... 1,677 2,213 2,398 2,029 5,392 1,554 16,726 12,834 974 37,602Average ....................... 1,448 1,835 2,324 1,750 4,395 1,531 15,231 11,765 954 33,793
1984January ......................... 1,518 2,104 2,244 1,912 4,992 1,556 16,801 12,071 927 36,309February ....................... 1,504 2,164 2,401 1,924 5,729 1,647 15,437 12,790 1,014 36,474March ............................ 1,502 1,950 2,393 1,805 5,376 1,714 16,050 12,403 989 36,320April .............................. 1,340 1,701 2,233 1,513 4,332 1,675 15,568 11,294 878 33,412May ............................... 1,517 1,617 2,462 1,485 3,956 1,833 15,620 11,592 938 33,623June .............................. 1,426 1,674 2,212 1,440 4,002 1,881 15,709 11,199 945 33,281July ............................... 1,504 1,429 2,441 1,535 4,158 1,714 15,498 11,017 996 33,172August .......................... 1,501 1,430 2,346 1,375 4,350 1,924 16,116 11,133 1,022 34,122September .................... 1,357 1,629 2,341 1,659 4,085 1,923 15,247 11,607 971 33,267October ......................... 1,539 1,800 2,222 1,644 4,105 2,052 15,616 11,857 1,073 34,190November ..................... 1,539 1,751 2,414 1,721 4,625 2,198 15,627 12,322 1,073 35,186December ..................... 1,415 1,818 2,161 1,755 5,236 2,065 15,375 11,642 1,043 34,711Average ....................... 1,472 1,754 2,322 1,646 4,576 1,849 15,726 11,736 989 34,500
1985January ......................... 1,539 2,309 2,377 2,035 4,929 2,117 16,109 13,508 963 37,048February ....................... 1,510 1,997 2,204 2,008 5,280 2,290 16,121 13,076 1,005 36,991March ............................ 1,525 1,837 1,986 1,787 4,729 1,819 15,373 11,533 958 34,119April .............................. 1,354 1,676 2,297 1,531 4,009 1,525 15,472 11,155 1,020 33,009May ............................... 1,541 1,551 2,272 1,469 3,769 1,436 15,504 10,582 1,025 32,422June .............................. 1,360 1,598 2,377 1,473 3,755 1,391 15,483 10,682 956 32,236July ............................... 1,511 1,580 2,633 1,601 4,053 1,447 15,434 11,317 911 33,227August .......................... 1,529 1,486 2,696 1,380 4,201 1,463 16,060 11,138 935 33,863September .................... 1,488 1,727 2,286 1,703 4,022 1,545 15,099 11,482 949 33,040October ......................... 1,565 1,816 2,494 1,816 4,079 1,557 15,944 12,114 997 34,698November ..................... 1,512 1,880 2,206 1,833 4,541 1,620 15,503 11,928 991 34,475December ..................... 1,607 1,852 2,208 1,982 5,286 1,449 16,611 11,746 1,000 36,250Average ....................... 1,504 1,775 2,338 1,717 4,384 1,634 15,726 11,681 976 34,271
1986January ......................... 1,477 1,850 2,404 1,854 4,983 1,542 16,088 12,048 923 35,520February ....................... 1,572 2,285 2,758 1,971 5,263 1,763 16,186 13,465 925 37,411March ............................ 1,349 1,759 2,427 1,719 4,720 1,694 16,276 11,924 908 35,177April .............................. 1,403 1,957 2,969 1,595 4,120 1,712 15,945 12,754 954 35,176May ............................... 1,471 1,464 2,700 1,478 3,778 1,590 15,993 11,401 965 33,608June .............................. 1,533 1,626 2,778 1,523 3,787 1,595 16,049 11,770 975 34,114July ............................... 1,541 1,663 2,756 1,645 3,845 1,601 16,307 12,023 947 34,663August .......................... 1,500 1,635 2,348 1,467 4,091 1,584 16,618 11,505 934 34,648September .................... 1,523 1,714 2,194 1,727 4,121 1,797 15,909 12,045 993 34,591October ......................... 1,602 1,683 2,257 1,821 4,340 1,694 16,602 11,979 963 35,487November ..................... 1,493 1,673 2,123 1,914 4,794 1,608 16,221 11,538 936 34,981December ..................... 1,629 2,012 2,294 2,154 5,475 1,621 17,131 12,894 989 38,118Average ....................... 1,506 1,772 2,498 1,738 4,439 1,649 16,281 12,102 951 35,279
1987January ......................... 1,411 1,986 2,254 2,069 4,910 1,620 16,684 12,718 908 36,631February ....................... 1,552 1,972 2,427 1,992 5,128 1,663 16,908 12,861 930 37,379March ............................ 1,481 1,909 2,531 2,114 4,844 1,614 16,165 12,758 876 36,123April .............................. 1,490 1,705 2,374 1,732 4,193 1,553 16,524 11,678 1,025 34,909May ............................... 1,448 1,460 2,362 1,596 3,750 1,436 16,026 10,943 892 33,059June .............................. 1,580 1,738 2,478 1,717 3,976 1,534 16,830 11,974 1,003 35,362July ............................... 1,578 1,816 2,637 1,830 4,141 1,604 17,113 12,330 995 36,156August .......................... 1,510 1,537 2,510 1,671 4,217 1,510 16,346 11,650 909 34,631September .................... 1,598 1,679 2,482 1,887 4,279 1,674 16,670 12,408 958 35,913October ......................... 1,640 1,798 2,325 1,801 4,233 1,630 16,941 12,231 914 35,960November ..................... 1,630 1,839 2,302 1,880 4,664 1,686 16,343 12,457 1,038 36,133December ..................... 1,664 2,070 2,411 1,972 5,511 1,717 17,445 13,125 1,057 38,801Average ....................... 1,548 1,789 2,424 1,855 4,484 1,603 16,665 12,255 958 35,911
See footnotes at end of table.
Energy Information Administration/Historical Monthly Energy Review 1973-1992316

Table 10.2 Petroleum Consumption in OECD Countries, 1973-1992 (Continued)
(Thousand Barrels per Day)
Canada France Germanya Italy JapanUnited
KingdomUnitedStates
OECDEuropeb
OtherOECDc OECDd
1988January ......................... 1,596 1,697 2,135 1,811 4,874 1,580 17,403 11,468 821 36,163February ....................... 1,720 1,978 2,360 1,926 5,696 1,722 17,760 12,662 904 38,742March ............................ 1,678 1,968 2,546 1,834 5,249 1,797 17,612 13,156 1,032 38,728April .............................. 1,503 1,703 2,240 1,643 4,469 1,642 16,561 11,652 901 35,085May ............................... 1,637 1,560 2,256 1,663 3,964 1,591 16,197 11,293 965 34,055June .............................. 1,674 1,726 2,580 1,813 4,164 1,725 17,059 12,507 995 36,399July ............................... 1,624 1,677 2,528 1,787 4,228 1,584 16,695 12,001 946 35,494August .......................... 1,765 1,577 2,352 1,631 4,447 1,649 17,482 11,852 986 36,532September .................... 1,719 1,770 2,519 1,870 4,293 1,743 17,072 12,633 935 36,652October ......................... 1,708 1,772 2,384 1,892 4,374 1,720 17,580 12,436 934 37,032November ..................... 1,834 2,076 2,549 2,113 5,280 1,859 17,620 13,764 918 39,416December ..................... 1,853 2,039 2,622 2,059 6,017 1,762 18,365 13,731 928 40,895Average ....................... 1,693 1,797 2,422 1,836 4,752 1,697 17,283 12,427 939 37,093
1989January ......................... 1,690 1,924 1,880 2,029 5,225 1,702 17,269 12,204 915 37,303February ....................... 1,771 2,090 2,173 2,133 5,607 1,770 17,920 12,976 1,062 39,336March ............................ 1,701 1,946 2,256 1,929 5,571 1,796 17,989 12,848 970 39,079April .............................. 1,643 1,719 2,150 1,743 4,583 1,733 16,624 11,883 998 35,732May ............................... 1,692 1,623 2,129 1,782 4,361 1,651 16,546 11,713 1,045 35,358June .............................. 1,672 1,763 2,238 1,874 4,457 1,694 17,497 12,319 1,063 37,009July ............................... 1,652 1,669 2,326 1,655 4,570 1,602 16,453 11,625 1,007 35,307August .......................... 1,841 1,652 2,503 1,727 4,586 1,723 17,360 12,355 1,051 37,193September .................... 1,693 1,847 2,440 1,907 4,632 1,713 16,795 12,611 922 36,652October ......................... 1,741 1,956 2,439 2,049 4,747 1,780 17,304 13,021 948 37,761November ..................... 1,790 2,015 2,521 2,158 5,321 1,886 17,311 13,582 994 38,998December ..................... 1,908 2,096 2,306 2,194 6,162 1,808 18,858 13,230 1,003 41,161Average ....................... 1,733 1,857 2,280 1,930 4,983 1,738 17,325 12,531 998 37,570
1990January ......................... 1,659 2,026 2,208 2,148 5,541 1,735 16,964 12,905 967 38,037February ....................... 1,757 1,928 2,390 2,005 5,865 1,845 17,175 12,996 990 38,783March ............................ 1,696 1,872 2,343 1,823 5,491 1,933 17,087 12,673 1,078 38,024April .............................. 1,591 1,784 2,299 1,581 4,668 1,756 16,778 12,162 960 36,159May ............................... 1,671 1,608 2,382 1,747 4,476 1,781 16,915 12,181 1,034 36,277June .............................. 1,630 1,774 2,504 1,755 4,536 1,828 17,165 12,724 1,014 37,070July ............................... 1,708 1,860 2,688 1,832 4,960 1,841 17,084 13,135 1,007 37,894August .......................... 1,843 1,778 2,383 1,694 5,212 1,762 18,050 12,785 1,123 39,013September .................... 1,676 1,682 2,280 1,824 4,991 1,629 16,512 12,079 1,010 36,267October ......................... 1,760 1,698 2,320 1,946 4,909 1,600 16,934 12,293 1,045 36,941November ..................... 1,706 1,834 2,434 2,057 5,161 1,709 16,695 12,795 1,031 37,387December ..................... 1,586 1,971 2,353 2,054 5,903 1,614 16,494 12,831 1,065 37,880Average ....................... 1,690 1,818 2,382 1,872 5,140 1,752 16,988 12,629 1,027 37,475
1991January ......................... 1,599 2,294 2,998 2,185 5,852 1,819 16,893 14,564 1,067 39,975February ....................... 1,613 2,009 2,783 2,025 6,155 1,837 16,339 13,804 1,043 38,953March ............................ 1,484 1,759 2,858 1,660 5,789 1,725 16,212 12,609 1,096 37,190April .............................. 1,595 1,808 2,953 1,813 5,025 1,793 16,139 13,073 1,087 36,918May ............................... 1,637 1,773 2,912 1,722 4,880 1,799 16,189 12,965 1,108 36,780June .............................. 1,589 1,807 3,269 1,535 4,765 1,769 16,878 13,184 950 37,366July ............................... 1,707 1,989 2,272 1,665 5,000 1,853 16,971 12,648 1,005 37,330August .......................... 1,693 1,795 2,609 1,546 4,888 1,812 17,183 12,727 992 37,483September .................... 1,583 1,824 2,679 1,824 4,724 1,753 16,848 12,999 1,028 37,182October ......................... 1,693 2,075 2,919 2,126 4,848 1,864 16,996 14,178 1,117 38,831November ..................... 1,602 1,953 2,860 2,031 5,581 1,829 16,730 13,736 1,132 38,782December ..................... 1,662 2,132 2,829 2,231 5,952 1,765 17,145 14,228 1,047 40,033Average ....................... 1,622 1,935 2,828 1,863 5,284 1,801 16,714 13,391 1,056 38,067
1992January ......................... 1,627 2,211 2,968 2,237 5,768 1,833 17,012 14,459 1,014 39,880February ....................... 1,623 2,106 2,814 2,149 6,339 1,819 16,893 14,051 1,045 39,951March ............................ 1,595 1,937 2,809 1,886 5,865 1,818 16,825 13,681 1,055 39,021April .............................. 1,581 1,990 2,893 1,891 5,205 1,858 16,764 13,666 1,042 38,258May ............................... 1,589 1,629 2,588 1,671 4,838 1,695 16,485 12,346 1,003 36,261June .............................. 1,646 1,815 2,699 1,801 4,942 1,725 16,978 13,035 1,086 37,688July ............................... 1,642 1,926 3,029 1,900 5,117 1,804 17,143 13,661 1,028 38,590August .......................... 1,675 1,733 2,829 1,655 4,955 1,700 16,929 12,909 946 37,414September .................... 1,654 1,953 3,072 2,003 5,139 1,870 16,876 14,222 1,046 38,938October ......................... 1,705 1,939 2,752 1,930 5,303 1,825 17,448 13,474 1,014 38,944November ..................... 1,714 1,888 2,823 2,053 5,637 1,853 17,091 13,805 1,049 39,295December ..................... 1,670 1,999 2,841 2,077 6,277 1,839 17,928 13,989 1,104 40,968Average ....................... 1,643 1,926 2,843 1,937 5,446 1,803 17,033 13,605 1,036 38,763
a Through December 1990, the data for Germany are for the former WestGermany only. Beginning with January 1991, the data are for the unifiedGermany, i.e., the former East Germany and West Germany.
b "OECD Europe" consists of Austria, Belgium, Denmark, Finland, France,Germany, Greece, Iceland, Ireland, Italy, Luxembourg, the Netherlands,Norway, Portugal, Spain, Sweden, Switzerland, Turkey, and the UnitedKingdom.
c "Other OECD" consists of Australia, New Zealand, and the U.S.
Territories.d The Organization for Economic Cooperation and Development (OECD)
consists of Canada, Japan, the United States, "OECD Europe" and "OtherOECD."
Notes: • Totals may not equal sum of components due to independentrounding. • U.S. geographic coverage is the 50 States and the District ofColumbia.
Sources: See end of section.
Energy Information Administration/Historical Monthly Energy Review 1973-1992 317
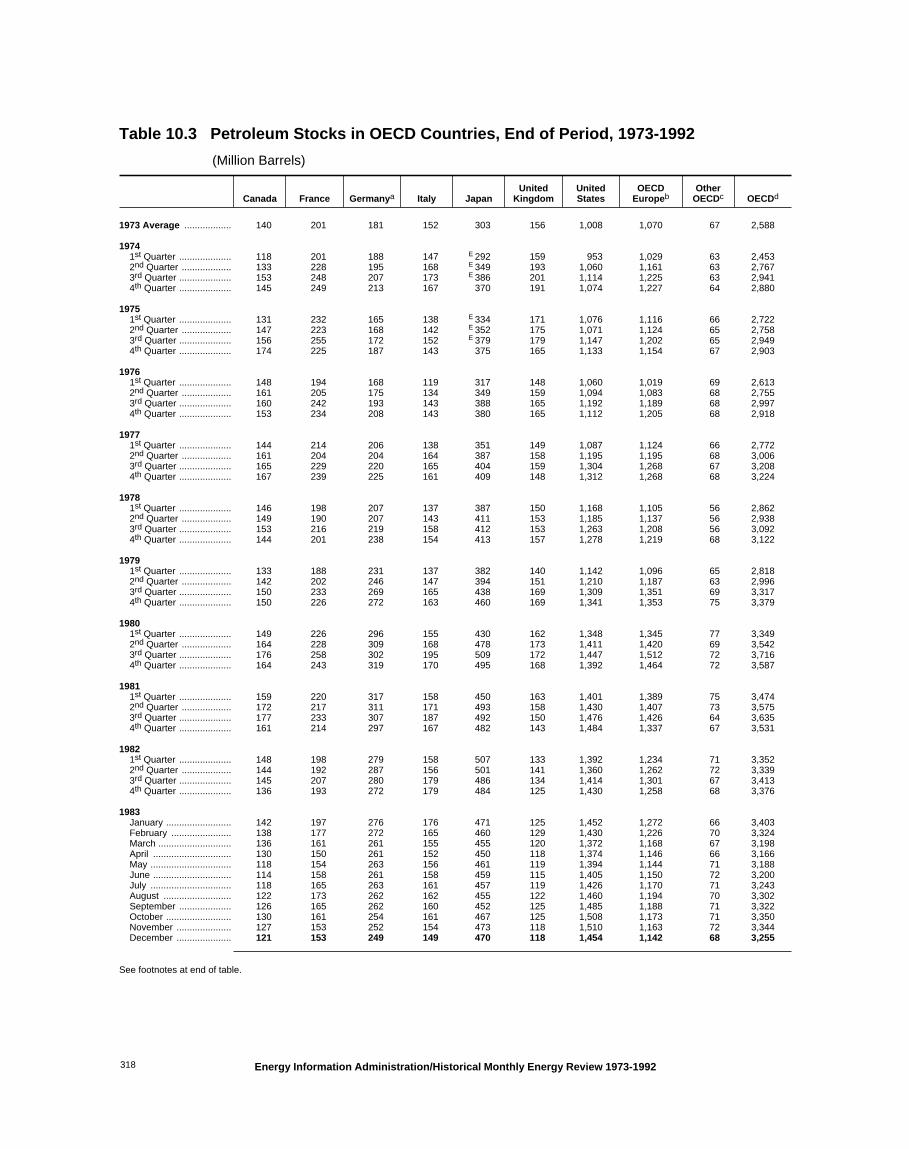
Table 10.3 Petroleum Stocks in OECD Countries, End of Period, 1973-1992
(Million Barrels)
Canada France Germanya Italy JapanUnited
KingdomUnitedStates
OECDEuropeb
OtherOECDc OECDd
1973 Average .................. 140 201 181 152 303 156 1,008 1,070 67 2,588
19741st Quarter .................... 118 201 188 147 E 292 159 953 1,029 63 2,4532nd Quarter ................... 133 228 195 168 E 349 193 1,060 1,161 63 2,7673rd Quarter .................... 153 248 207 173 E 386 201 1,114 1,225 63 2,9414th Quarter .................... 145 249 213 167 370 191 1,074 1,227 64 2,880
19751st Quarter .................... 131 232 165 138 E 334 171 1,076 1,116 66 2,7222nd Quarter ................... 147 223 168 142 E 352 175 1,071 1,124 65 2,7583rd Quarter .................... 156 255 172 152 E 379 179 1,147 1,202 65 2,9494th Quarter .................... 174 225 187 143 375 165 1,133 1,154 67 2,903
19761st Quarter .................... 148 194 168 119 317 148 1,060 1,019 69 2,6132nd Quarter ................... 161 205 175 134 349 159 1,094 1,083 68 2,7553rd Quarter .................... 160 242 193 143 388 165 1,192 1,189 68 2,9974th Quarter .................... 153 234 208 143 380 165 1,112 1,205 68 2,918
19771st Quarter .................... 144 214 206 138 351 149 1,087 1,124 66 2,7722nd Quarter ................... 161 204 204 164 387 158 1,195 1,195 68 3,0063rd Quarter .................... 165 229 220 165 404 159 1,304 1,268 67 3,2084th Quarter .................... 167 239 225 161 409 148 1,312 1,268 68 3,224
19781st Quarter .................... 146 198 207 137 387 150 1,168 1,105 56 2,8622nd Quarter ................... 149 190 207 143 411 153 1,185 1,137 56 2,9383rd Quarter .................... 153 216 219 158 412 153 1,263 1,208 56 3,0924th Quarter .................... 144 201 238 154 413 157 1,278 1,219 68 3,122
19791st Quarter .................... 133 188 231 137 382 140 1,142 1,096 65 2,8182nd Quarter ................... 142 202 246 147 394 151 1,210 1,187 63 2,9963rd Quarter .................... 150 233 269 165 438 169 1,309 1,351 69 3,3174th Quarter .................... 150 226 272 163 460 169 1,341 1,353 75 3,379
19801st Quarter .................... 149 226 296 155 430 162 1,348 1,345 77 3,3492nd Quarter ................... 164 228 309 168 478 173 1,411 1,420 69 3,5423rd Quarter .................... 176 258 302 195 509 172 1,447 1,512 72 3,7164th Quarter .................... 164 243 319 170 495 168 1,392 1,464 72 3,587
19811st Quarter .................... 159 220 317 158 450 163 1,401 1,389 75 3,4742nd Quarter ................... 172 217 311 171 493 158 1,430 1,407 73 3,5753rd Quarter .................... 177 233 307 187 492 150 1,476 1,426 64 3,6354th Quarter .................... 161 214 297 167 482 143 1,484 1,337 67 3,531
19821st Quarter .................... 148 198 279 158 507 133 1,392 1,234 71 3,3522nd Quarter ................... 144 192 287 156 501 141 1,360 1,262 72 3,3393rd Quarter .................... 145 207 280 179 486 134 1,414 1,301 67 3,4134th Quarter .................... 136 193 272 179 484 125 1,430 1,258 68 3,376
1983January ......................... 142 197 276 176 471 125 1,452 1,272 66 3,403February ....................... 138 177 272 165 460 129 1,430 1,226 70 3,324March ............................ 136 161 261 155 455 120 1,372 1,168 67 3,198April .............................. 130 150 261 152 450 118 1,374 1,146 66 3,166May ............................... 118 154 263 156 461 119 1,394 1,144 71 3,188June .............................. 114 158 261 158 459 115 1,405 1,150 72 3,200July ............................... 118 165 263 161 457 119 1,426 1,170 71 3,243August .......................... 122 173 262 162 455 122 1,460 1,194 70 3,302September .................... 126 165 262 160 452 125 1,485 1,188 71 3,322October ......................... 130 161 254 161 467 125 1,508 1,173 71 3,350November ..................... 127 153 252 154 473 118 1,510 1,163 72 3,344December ..................... 121 153 249 149 470 118 1,454 1,142 68 3,255
See footnotes at end of table.
Energy Information Administration/Historical Monthly Energy Review 1973-1992318
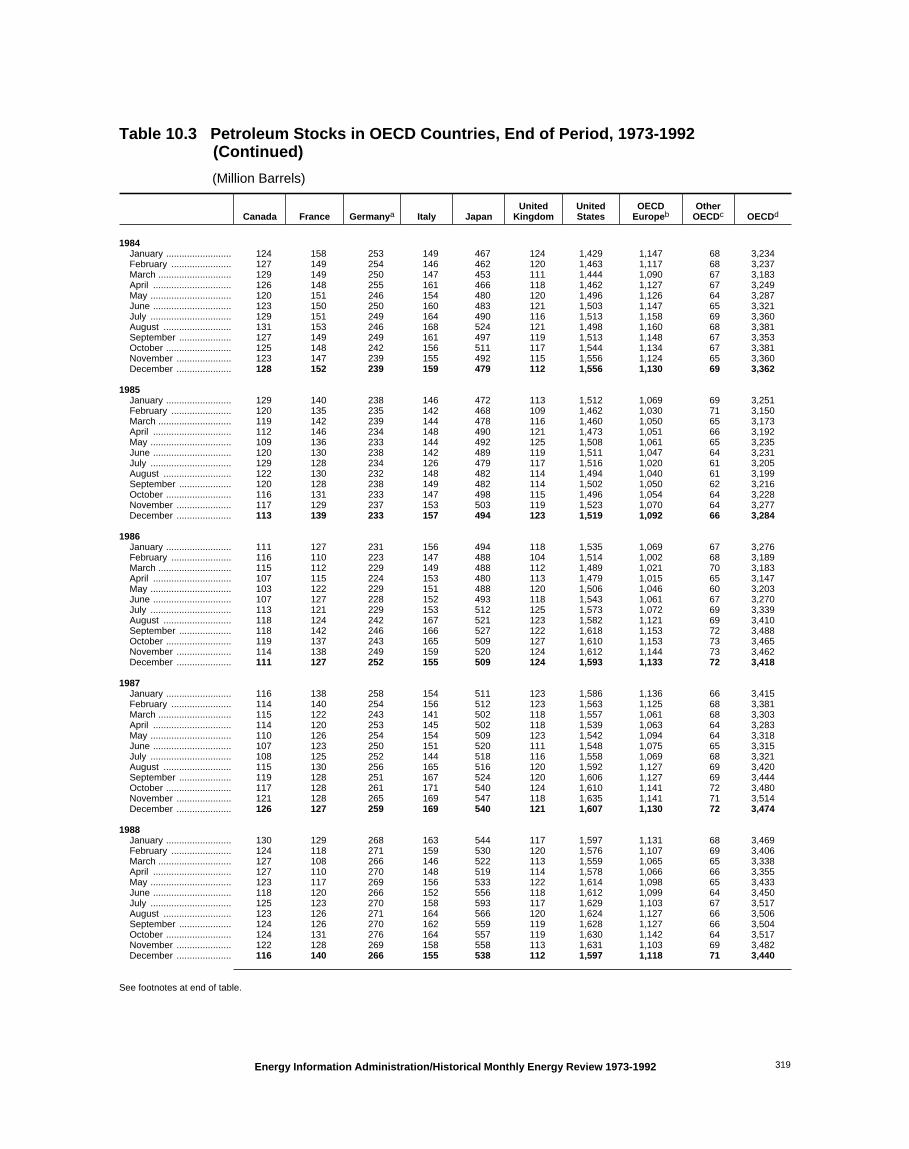
Table 10.3 Petroleum Stocks in OECD Countries, End of Period, 1973-1992 (Continued)
(Million Barrels)
Canada France Germanya Italy JapanUnited
KingdomUnitedStates
OECDEuropeb
OtherOECDc OECDd
1984January ......................... 124 158 253 149 467 124 1,429 1,147 68 3,234February ....................... 127 149 254 146 462 120 1,463 1,117 68 3,237March ............................ 129 149 250 147 453 111 1,444 1,090 67 3,183April .............................. 126 148 255 161 466 118 1,462 1,127 67 3,249May ............................... 120 151 246 154 480 120 1,496 1,126 64 3,287June .............................. 123 150 250 160 483 121 1,503 1,147 65 3,321July ............................... 129 151 249 164 490 116 1,513 1,158 69 3,360August .......................... 131 153 246 168 524 121 1,498 1,160 68 3,381September .................... 127 149 249 161 497 119 1,513 1,148 67 3,353October ......................... 125 148 242 156 511 117 1,544 1,134 67 3,381November ..................... 123 147 239 155 492 115 1,556 1,124 65 3,360December ..................... 128 152 239 159 479 112 1,556 1,130 69 3,362
1985January ......................... 129 140 238 146 472 113 1,512 1,069 69 3,251February ....................... 120 135 235 142 468 109 1,462 1,030 71 3,150March ............................ 119 142 239 144 478 116 1,460 1,050 65 3,173April .............................. 112 146 234 148 490 121 1,473 1,051 66 3,192May ............................... 109 136 233 144 492 125 1,508 1,061 65 3,235June .............................. 120 130 238 142 489 119 1,511 1,047 64 3,231July ............................... 129 128 234 126 479 117 1,516 1,020 61 3,205August .......................... 122 130 232 148 482 114 1,494 1,040 61 3,199September .................... 120 128 238 149 482 114 1,502 1,050 62 3,216October ......................... 116 131 233 147 498 115 1,496 1,054 64 3,228November ..................... 117 129 237 153 503 119 1,523 1,070 64 3,277December ..................... 113 139 233 157 494 123 1,519 1,092 66 3,284
1986January ......................... 111 127 231 156 494 118 1,535 1,069 67 3,276February ....................... 116 110 223 147 488 104 1,514 1,002 68 3,189March ............................ 115 112 229 149 488 112 1,489 1,021 70 3,183April .............................. 107 115 224 153 480 113 1,479 1,015 65 3,147May ............................... 103 122 229 151 488 120 1,506 1,046 60 3,203June .............................. 107 127 228 152 493 118 1,543 1,061 67 3,270July ............................... 113 121 229 153 512 125 1,573 1,072 69 3,339August .......................... 118 124 242 167 521 123 1,582 1,121 69 3,410September .................... 118 142 246 166 527 122 1,618 1,153 72 3,488October ......................... 119 137 243 165 509 127 1,610 1,153 73 3,465November ..................... 114 138 249 159 520 124 1,612 1,144 73 3,462December ..................... 111 127 252 155 509 124 1,593 1,133 72 3,418
1987January ......................... 116 138 258 154 511 123 1,586 1,136 66 3,415February ....................... 114 140 254 156 512 123 1,563 1,125 68 3,381March ............................ 115 122 243 141 502 118 1,557 1,061 68 3,303April .............................. 114 120 253 145 502 118 1,539 1,063 64 3,283May ............................... 110 126 254 154 509 123 1,542 1,094 64 3,318June .............................. 107 123 250 151 520 111 1,548 1,075 65 3,315July ............................... 108 125 252 144 518 116 1,558 1,069 68 3,321August .......................... 115 130 256 165 516 120 1,592 1,127 69 3,420September .................... 119 128 251 167 524 120 1,606 1,127 69 3,444October ......................... 117 128 261 171 540 124 1,610 1,141 72 3,480November ..................... 121 128 265 169 547 118 1,635 1,141 71 3,514December ..................... 126 127 259 169 540 121 1,607 1,130 72 3,474
1988January ......................... 130 129 268 163 544 117 1,597 1,131 68 3,469February ....................... 124 118 271 159 530 120 1,576 1,107 69 3,406March ............................ 127 108 266 146 522 113 1,559 1,065 65 3,338April .............................. 127 110 270 148 519 114 1,578 1,066 66 3,355May ............................... 123 117 269 156 533 122 1,614 1,098 65 3,433June .............................. 118 120 266 152 556 118 1,612 1,099 64 3,450July ............................... 125 123 270 158 593 117 1,629 1,103 67 3,517August .......................... 123 126 271 164 566 120 1,624 1,127 66 3,506September .................... 124 126 270 162 559 119 1,628 1,127 66 3,504October ......................... 124 131 276 164 557 119 1,630 1,142 64 3,517November ..................... 122 128 269 158 558 113 1,631 1,103 69 3,482December ..................... 116 140 266 155 538 112 1,597 1,118 71 3,440
See footnotes at end of table.
Energy Information Administration/Historical Monthly Energy Review 1973-1992 319

Table 10.3 Petroleum Stocks in OECD Countries, End of Period, 1973-1992 (Continued)
(Million Barrels)
Canada France Germanya Italy JapanUnited
KingdomUnitedStates
OECDEuropeb
OtherOECDc OECDd
1989January ......................... 117 138 277 159 547 121 1,620 1,133 69 3,486February ....................... 116 129 272 154 548 121 1,601 1,103 69 3,437March ............................ 111 123 270 148 552 115 1,568 1,085 68 3,384April .............................. 118 131 271 152 549 114 1,596 1,091 71 3,425May ............................... 117 132 272 152 553 121 1,623 1,111 73 3,476June .............................. 119 128 269 154 557 112 1,608 1,096 71 3,450July ............................... 125 133 270 155 557 119 1,649 1,120 70 3,521August .......................... 123 135 271 165 567 118 1,654 1,133 72 3,549September .................... 121 135 274 165 572 120 1,667 1,137 66 3,563October ......................... 117 134 272 165 580 117 1,658 1,121 70 3,547November ..................... 121 139 267 163 588 117 1,663 1,125 75 3,571December ..................... 114 138 271 164 577 118 1,581 1,133 71 3,476
1990January ......................... 112 133 273 162 574 119 1,630 1,128 68 3,513February ....................... 116 134 267 158 569 116 1,635 1,134 74 3,528March ............................ 121 131 268 163 581 121 1,642 1,126 71 3,542April .............................. 126 135 270 159 578 114 1,640 1,146 77 3,567May ............................... 121 146 268 155 590 125 1,672 1,174 77 3,634June .............................. 119 147 270 160 579 120 1,685 1,179 75 3,637July ............................... 117 149 271 155 578 119 1,709 1,169 71 3,645August .......................... 114 150 274 167 583 122 1,699 1,181 72 3,649September .................... 112 150 269 173 585 123 1,698 1,177 73 3,645October ......................... 113 148 268 172 592 119 1,674 1,184 76 3,640November ..................... 115 142 263 167 596 117 1,654 1,150 72 3,587December ..................... 121 140 265 172 590 112 1,621 1,163 73 3,568
1991January ......................... 116 133 278 174 591 116 1,587 1,164 73 3,531February ....................... 114 137 278 169 572 119 1,573 1,162 72 3,493March ............................ 117 142 280 178 593 124 1,558 1,178 75 3,521April .............................. 110 138 277 177 585 119 1,578 1,161 75 3,509May ............................... 107 138 279 174 586 113 1,626 1,157 75 3,551June .............................. 107 144 274 173 590 118 1,634 1,161 72 3,564July ............................... 118 145 285 169 594 113 1,635 1,170 73 3,590August .......................... 116 152 284 171 610 118 1,648 1,186 76 3,636September .................... 117 150 287 170 622 120 1,663 1,195 74 3,671October ......................... 118 148 286 165 625 119 1,644 1,190 71 3,649November ..................... 122 152 289 163 607 120 1,647 1,198 70 3,643December ..................... 119 153 288 160 607 119 1,617 1,182 65 3,589
1992January ......................... 117 149 293 167 600 116 1,610 1,167 68 3,563February ....................... 111 145 303 172 595 118 1,588 1,180 66 3,541March ............................ 111 142 303 169 585 115 1,571 1,161 66 3,494April .............................. 111 140 307 165 578 115 1,583 1,171 62 3,504May ............................... 108 147 311 171 587 115 1,602 1,189 63 3,550June .............................. 112 147 307 166 583 114 1,603 1,190 69 3,556July ............................... 110 146 299 166 585 120 1,620 1,181 67 3,563August .......................... 113 150 303 169 604 117 1,621 1,210 69 3,616September .................... 110 148 299 165 607 112 1,636 1,193 69 3,615October ......................... 108 148 302 166 613 112 1,640 1,200 69 3,630November ..................... 110 149 306 172 610 115 1,636 1,206 71 3,633December ..................... 107 146 310 174 603 113 1,592 1,219 67 3,588
a Through December 1990, the data for Germany are for the former WestGermany only. Beginning with January 1991, the data are for the unifiedGermany, i.e., the former East Germany and West Germany.
b "OECD Europe" consists of Austria, Belgium, Denmark, Finland, France,Germany, Greece, Iceland, Ireland, Italy, Luxembourg, the Netherlands,Norway, Portugal, Spain, Sweden, Switzerland, Turkey, and the UnitedKingdom.
c "Other OECD" consists of Australia, New Zealand, and the U.S.Territories.
d The Organization for Economic Cooperation and Development (OECD)consists of Canada, Japan, the United States, "OECD Europe" and "OtherOECD."
E=Estimate; see Note 3 at end of section. Notes: • Petroleum stocks include crude oil (including strategic reserves),
unfinished oils, natural gas plant liquids, and refined products. Petroleumstocks include all nonmilitary petroleum held for storage, regardless ofownership, within each country in bulk terminals, refinery tanks, pipelinetankage, intercoastal tankers, tankers in port, and inland ship bunkers. Dataexclude oil held in pipelines (except for those in the United States), rail andtruck cars, sea-going ships’ bunkers, service stations, retail stores, andtankers at sea. • In the United States in January 1975, 1981, and 1983,numerous respondents were added to bulk terminal and pipeline surveys,affecting subsequent stocks reported. New basis end-of-year U.S. stocks, inmillion barrels, would have been 1,121 in 1974, 1,425 in 1980, and 1,461 in1982. • Totals may not equal sum of components due to independentrounding. • U.S. geographic coverage is the 50 States and the District ofColumbia.
Sources: See end of section.
Energy Information Administration/Historical Monthly Energy Review 1973-1992320

Table 10.4a Nuclear Electricity Gross Generation, 1973-1992: Regions and Total
(Billion Kilowatthours)
North AmericaCentral and
South AmericaWesternEurope Far East Africa Totala
1973January ....................... 7.8 – 7.6 1.4 – 16.8February ..................... 7.5 – 7.4 1.2 – 16.0March .......................... 8.2 – 7.3 1.3 – 16.8April ............................ 7.6 – 6.0 1.0 – 14.6May ............................. 7.1 – 5.3 .7 – 13.1June ............................ 8.2 – 5.1 .6 – 14.0July ............................. 8.3 – 5.0 .9 – 14.2August ........................ 9.3 – 4.9 1.1 – 15.2September .................. 9.4 – 5.4 1.1 – 15.9October ....................... 9.3 – 5.7 1.1 – 16.1November ................... 10.0 – 6.8 .9 – 17.8December ................... 10.3 – 7.5 1.0 – 18.9Total ........................... 103.1 – 73.9 12.3 – 189.3
1974January ....................... 9.5 – 7.9 1.2 – 18.7February ..................... 10.1 – 7.6 1.4 – 19.1March .......................... 10.7 (s) 8.3 1.5 – 20.5April ............................ 8.9 .1 6.9 1.7 – 17.5May ............................. 8.6 .1 6.4 1.2 – 16.2June ............................ 9.7 .1 5.9 1.5 – 17.2July ............................. 12.4 .1 5.6 1.9 – 20.0August ........................ 14.7 .1 5.3 2.3 – 22.4September .................. 13.1 .2 6.2 2.1 – 21.6October ....................... 13.1 .0 7.0 1.7 – 21.8November ................... 13.6 .1 7.7 2.2 – 23.6December ................... 15.5 .2 9.0 2.5 – 27.2Total ........................... 139.7 1.0 83.9 21.4 – 246.0
1975January ....................... 16.1 .2 9.2 2.2 – 27.7February ..................... 14.6 (s) 8.7 1.7 – 25.0March .......................... 16.9 .2 9.7 1.5 – 28.3April ............................ 15.1 .2 9.1 1.2 – 25.6May ............................. 15.5 .2 8.4 1.9 – 26.0June ............................ 14.2 .2 6.9 1.6 – 22.9July ............................. 17.2 .2 8.3 1.9 – 27.7August ........................ 18.0 .3 8.4 2.2 – 29.0September .................. 16.4 .2 9.7 2.1 – 28.4October ....................... 16.5 .2 10.4 2.6 – 29.8November ................... 16.0 .2 10.9 2.9 – 30.0December ................... 18.9 .2 12.1 2.7 – 33.9Total ........................... 195.5 2.5 111.7 24.4 – 334.1
1976January ....................... 18.3 .2 11.2 3.2 – 32.9February ..................... 16.4 .2 11.2 2.9 – 30.7March .......................... 16.1 .2 11.6 2.8 – 30.8April ............................ 12.9 .2 10.5 3.2 – 26.8May ............................. 14.2 .2 9.8 3.9 – 28.1June ............................ 18.4 .2 8.6 3.2 – 30.4July ............................. 20.5 .2 8.6 3.5 – 32.8August ........................ 21.1 .3 9.2 3.8 – 34.3September .................. 19.6 .2 10.3 3.8 – 33.9October ....................... 19.8 .2 10.9 3.5 – 34.4November ................... 18.4 .2 10.2 3.2 – 32.0December ................... 24.3 .1 14.0 3.4 – 41.8Total ........................... 219.8 2.6 126.2 40.3 – 388.9
1977January ....................... 25.6 .0 12.2 2.3 – 40.1February ..................... 22.9 .0 11.5 2.0 – 36.5March .......................... 24.5 .0 14.3 2.1 – 40.9April ............................ 23.0 (s) 13.1 2.0 – 38.0May ............................. 23.8 .3 12.4 2.5 – 39.0June ............................ 24.3 .3 11.6 2.4 – 38.6July ............................. 25.8 .2 10.3 2.9 – 39.2August ........................ 24.9 .2 10.5 3.2 – 38.9September .................. 22.6 .2 11.4 2.7 – 37.0October ....................... 23.3 .1 11.8 2.6 – 37.8November ................... 22.5 .2 12.8 3.3 – 38.8December ................... 27.5 .2 16.0 3.5 – 47.3Total ........................... 290.8 1.6 148.1 31.5 – 472.0
See footnotes at end of table.
Energy Information Administration/Historical Monthly Energy Review 1973-1992 321

Table 10.4a Nuclear Electricity Gross Generation, 1973-1992: Regions and Total (Continued)
(Billion Kilowatthours)
North AmericaCentral and
South AmericaWesternEurope Far East Africa Totala
1978January ....................... 30.5 0.3 15.1 3.7 – 49.5February ..................... 25.8 .2 14.3 2.6 – 42.9March .......................... 25.8 .1 16.1 4.0 – 46.1April ............................ 21.2 .3 14.3 4.4 – 40.1May ............................. 23.7 .3 12.5 5.2 – 41.8June ............................ 26.0 .2 12.3 5.1 – 43.6July ............................. 29.7 .3 11.6 6.4 – 47.9August ........................ 29.7 .3 12.4 6.4 – 48.8September .................. 26.2 .3 13.3 5.6 – 45.3October ....................... 27.3 .3 14.0 5.3 – 47.0November ................... 29.0 .3 14.4 5.3 – 49.0December ................... 30.4 .2 16.6 6.6 – 53.8Total ........................... 325.4 2.9 166.9 60.6 – 555.9
1979January ....................... 33.0 .3 17.7 7.0 – 57.9February ..................... 30.3 .2 15.8 5.8 – 52.0March .......................... 28.4 .2 17.2 5.4 – 51.2April ............................ 22.4 .3 15.4 4.8 – 42.9May ............................. 18.5 .3 13.7 4.6 – 37.1June ............................ 20.3 .2 13.4 5.7 – 39.6July ............................. 26.3 .2 12.5 7.1 – 46.1August ........................ 29.0 .3 11.3 7.9 – 48.5September .................. 26.1 .1 14.1 6.6 – 46.9October ....................... 25.6 .2 16.5 7.3 – 49.6November ................... 23.2 .3 16.9 6.0 – 46.3December ................... 25.8 .2 19.9 6.6 – 52.5Total ........................... 309.0 2.7 184.3 74.7 – 570.7
1980January ....................... 24.7 .3 21.1 9.2 – 55.3February ..................... 24.4 .1 19.5 8.2 – 52.2March .......................... 24.7 .0 19.4 9.3 – 53.4April ............................ 23.0 .1 17.0 7.0 – 47.1May ............................. 22.1 .2 15.3 7.1 – 44.7June ............................ 22.5 .2 13.8 7.5 – 44.1July ............................. 25.9 .2 14.3 9.2 – 49.6August ........................ 29.6 .3 13.0 10.0 – 52.8September .................. 27.9 .3 16.5 8.5 – 53.2October ....................... 29.0 .3 17.2 7.4 – 53.9November ................... 25.3 .3 20.5 6.7 – 52.8December ................... 26.7 .3 26.5 7.3 – 60.7Total ........................... 305.8 2.3 214.2 97.4 – 619.8
1981January ....................... 28.9 .3 26.7 9.5 – 65.4February ..................... 26.2 .2 24.4 8.1 – 58.8March .......................... 27.0 .3 26.0 9.0 – 62.2April ............................ 25.0 .2 23.9 9.0 – 58.2May ............................. 24.3 .2 23.6 9.4 – 57.4June ............................ 26.1 .2 22.5 8.2 – 57.0July ............................. 28.8 .3 22.0 9.9 – 61.0August ........................ 32.4 .2 21.8 9.9 – 64.4September .................. 28.9 .3 22.6 7.7 – 59.5October ....................... 25.1 .2 23.7 7.4 – 56.3November ................... 27.6 .2 25.4 6.9 – 60.1December ................... 31.6 .2 30.8 7.9 – 70.6Total ........................... 331.8 2.8 293.4 102.9 – 730.9
1982January ....................... 31.2 .3 30.6 9.6 – 71.6February ..................... 24.5 .2 27.4 9.3 – 61.3March .......................... 27.4 .3 28.7 10.7 – 67.1April ............................ 26.5 .3 27.7 10.9 – 65.3May ............................. 26.0 .3 25.1 10.5 – 61.8June ............................ 28.6 .3 21.6 10.5 – 61.0July ............................. 30.4 .2 22.6 11.5 – 64.6August ........................ 30.3 .0 22.7 11.5 – 64.4September .................. 29.9 (s) 26.0 9.8 – 65.8October ....................... 29.4 .0 26.3 9.6 – 65.3November ................... 27.5 (s) 28.1 9.6 – 65.3December ................... 29.6 .2 35.1 10.1 – 75.0Total ........................... 341.2 1.9 321.8 123.6 – 788.5
See footnotes at end of table.
Energy Information Administration/Historical Monthly Energy Review 1973-1992322
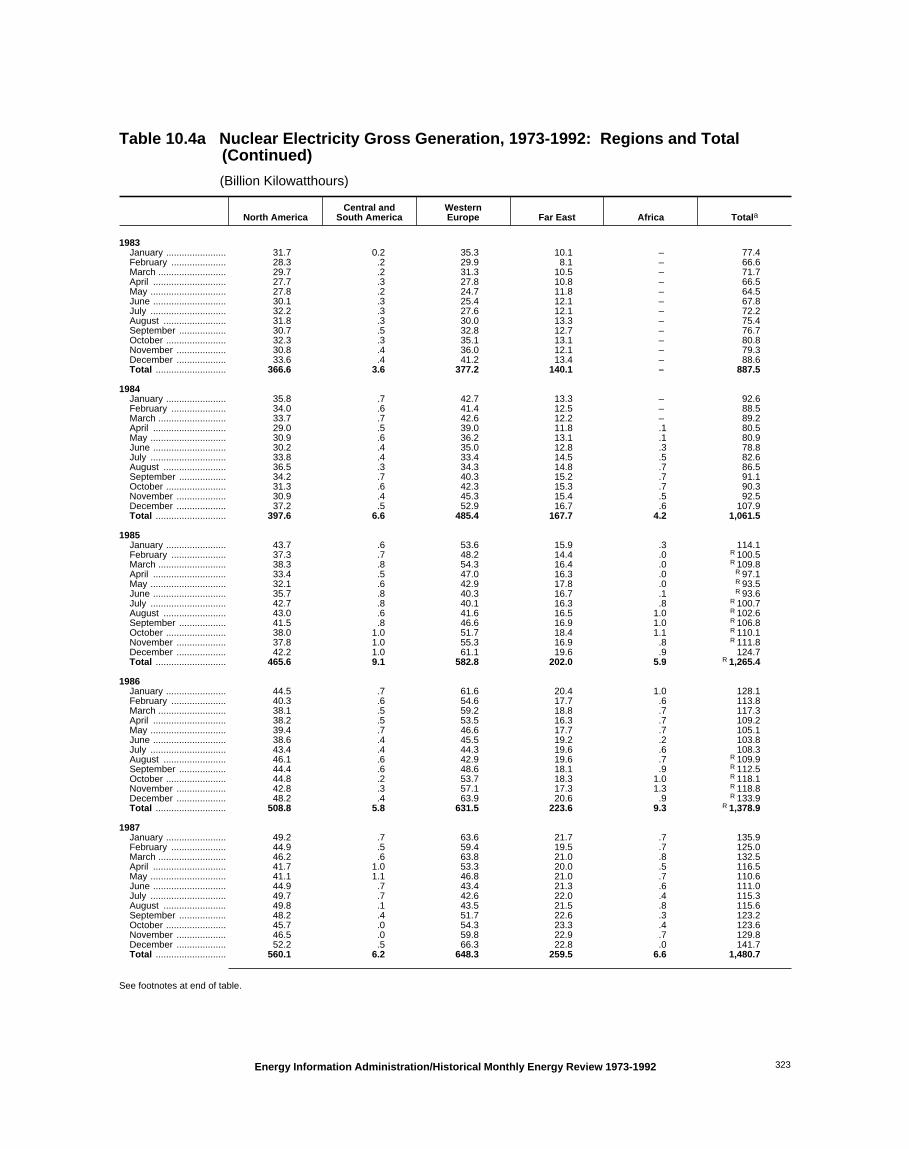
Table 10.4a Nuclear Electricity Gross Generation, 1973-1992: Regions and Total (Continued)
(Billion Kilowatthours)
North AmericaCentral and
South AmericaWesternEurope Far East Africa Totala
1983January ....................... 31.7 0.2 35.3 10.1 – 77.4February ..................... 28.3 .2 29.9 8.1 – 66.6March .......................... 29.7 .2 31.3 10.5 – 71.7April ............................ 27.7 .3 27.8 10.8 – 66.5May ............................. 27.8 .2 24.7 11.8 – 64.5June ............................ 30.1 .3 25.4 12.1 – 67.8July ............................. 32.2 .3 27.6 12.1 – 72.2August ........................ 31.8 .3 30.0 13.3 – 75.4September .................. 30.7 .5 32.8 12.7 – 76.7October ....................... 32.3 .3 35.1 13.1 – 80.8November ................... 30.8 .4 36.0 12.1 – 79.3December ................... 33.6 .4 41.2 13.4 – 88.6Total ........................... 366.6 3.6 377.2 140.1 – 887.5
1984January ....................... 35.8 .7 42.7 13.3 – 92.6February ..................... 34.0 .6 41.4 12.5 – 88.5March .......................... 33.7 .7 42.6 12.2 – 89.2April ............................ 29.0 .5 39.0 11.8 .1 80.5May ............................. 30.9 .6 36.2 13.1 .1 80.9June ............................ 30.2 .4 35.0 12.8 .3 78.8July ............................. 33.8 .4 33.4 14.5 .5 82.6August ........................ 36.5 .3 34.3 14.8 .7 86.5September .................. 34.2 .7 40.3 15.2 .7 91.1October ....................... 31.3 .6 42.3 15.3 .7 90.3November ................... 30.9 .4 45.3 15.4 .5 92.5December ................... 37.2 .5 52.9 16.7 .6 107.9Total ........................... 397.6 6.6 485.4 167.7 4.2 1,061.5
1985January ....................... 43.7 .6 53.6 15.9 .3 114.1February ..................... 37.3 .7 48.2 14.4 .0 R 100.5March .......................... 38.3 .8 54.3 16.4 .0 R 109.8April ............................ 33.4 .5 47.0 16.3 .0 R 97.1May ............................. 32.1 .6 42.9 17.8 .0 R 93.5June ............................ 35.7 .8 40.3 16.7 .1 R 93.6July ............................. 42.7 .8 40.1 16.3 .8 R 100.7August ........................ 43.0 .6 41.6 16.5 1.0 R 102.6September .................. 41.5 .8 46.6 16.9 1.0 R 106.8October ....................... 38.0 1.0 51.7 18.4 1.1 R 110.1November ................... 37.8 1.0 55.3 16.9 .8 R 111.8December ................... 42.2 1.0 61.1 19.6 .9 124.7Total ........................... 465.6 9.1 582.8 202.0 5.9 R 1,265.4
1986January ....................... 44.5 .7 61.6 20.4 1.0 128.1February ..................... 40.3 .6 54.6 17.7 .6 113.8March .......................... 38.1 .5 59.2 18.8 .7 117.3April ............................ 38.2 .5 53.5 16.3 .7 109.2May ............................. 39.4 .7 46.6 17.7 .7 105.1June ............................ 38.6 .4 45.5 19.2 .2 103.8July ............................. 43.4 .4 44.3 19.6 .6 108.3August ........................ 46.1 .6 42.9 19.6 .7 R 109.9September .................. 44.4 .6 48.6 18.1 .9 R 112.5October ....................... 44.8 .2 53.7 18.3 1.0 R 118.1November ................... 42.8 .3 57.1 17.3 1.3 R 118.8December ................... 48.2 .4 63.9 20.6 .9 R 133.9Total ........................... 508.8 5.8 631.5 223.6 9.3 R 1,378.9
1987January ....................... 49.2 .7 63.6 21.7 .7 135.9February ..................... 44.9 .5 59.4 19.5 .7 125.0March .......................... 46.2 .6 63.8 21.0 .8 132.5April ............................ 41.7 1.0 53.3 20.0 .5 116.5May ............................. 41.1 1.1 46.8 21.0 .7 110.6June ............................ 44.9 .7 43.4 21.3 .6 111.0July ............................. 49.7 .7 42.6 22.0 .4 115.3August ........................ 49.8 .1 43.5 21.5 .8 115.6September .................. 48.2 .4 51.7 22.6 .3 123.2October ....................... 45.7 .0 54.3 23.3 .4 123.6November ................... 46.5 .0 59.8 22.9 .7 129.8December ................... 52.2 .5 66.3 22.8 .0 141.7Total ........................... 560.1 6.2 648.3 259.5 6.6 1,480.7
See footnotes at end of table.
Energy Information Administration/Historical Monthly Energy Review 1973-1992 323

Table 10.4a Nuclear Electricity Gross Generation, 1973-1992: Regions and Total (Continued)
(Billion Kilowatthours)
North AmericaCentral and
South AmericaWesternEurope Far East Africa Totala
1988January ....................... 55.0 0.5 63.6 21.5 0.3 140.9February ..................... 52.0 .5 58.5 18.9 .7 130.5March .......................... 54.1 .5 59.8 20.7 1.1 136.1April ............................ 49.1 .2 55.0 20.8 1.3 126.3May ............................. 49.4 .2 50.8 21.2 1.4 123.0June ............................ 52.9 .2 50.7 21.2 1.3 126.4July ............................. 58.9 .7 50.2 22.7 1.3 133.8August ........................ 59.1 .5 50.5 22.9 .8 R 133.7September .................. 55.5 .5 58.2 20.6 .7 135.5October ....................... 51.1 .5 62.8 20.4 .7 135.5November ................... 48.4 .5 61.6 17.1 .7 128.4December ................... 54.1 .8 66.4 20.5 .9 142.7Total ........................... 639.7 5.5 688.1 248.5 11.1 R 1,592.8
1989January ....................... 56.8 .7 71.5 21.3 1.1 151.4February ..................... 47.7 .6 64.7 20.1 .5 133.7March .......................... 49.5 .7 68.2 22.6 .6 141.6April ............................ 42.6 .7 62.6 19.6 .7 126.2May ............................. 47.0 .5 55.2 20.1 .7 123.5June ............................ 50.9 .7 53.8 20.1 1.1 126.7July ............................. 62.3 .7 51.1 24.4 1.1 139.7August ........................ 64.6 (s) 52.2 26.1 1.1 144.0September .................. 53.6 .7 57.2 22.4 1.3 135.2October ....................... 52.3 .5 62.5 22.3 1.3 138.8November ................... 51.8 .5 63.9 21.5 1.2 138.8December ................... 60.9 .4 69.4 22.8 1.1 154.6Total ........................... 640.2 6.6 732.2 263.4 11.7 1,654.1
1990January ....................... 65.0 .6 71.2 22.0 .6 159.4February ..................... 58.0 .7 60.5 19.2 .5 138.8March .......................... 54.6 .7 64.2 22.5 .5 142.6April ............................ 46.3 .7 62.3 22.7 .6 132.7May ............................. 49.5 .8 56.8 23.9 1.2 132.3June ............................ 53.6 .9 51.9 23.8 1.2 131.4July ............................. 61.3 .8 52.5 27.8 1.1 143.5August ........................ 64.5 .9 53.1 28.2 .8 147.6September .................. 57.0 .6 58.3 23.5 .6 140.0October ....................... 53.3 .8 63.7 23.6 .6 142.0November ................... 54.8 1.0 65.3 21.7 .5 143.2December ................... 61.8 .9 74.1 23.7 .6 161.0Total ........................... 681.3 9.4 738.6 284.3 8.9 1,722.5
1991January ....................... 64.7 .7 76.9 24.9 .6 167.8February ..................... 58.0 .8 69.7 22.3 .5 151.3March .......................... 59.9 .9 69.5 23.6 1.1 154.9April ............................ 50.9 .9 61.1 19.8 .7 133.4May ............................. 56.9 1.0 58.0 20.0 .7 136.6June ............................ 64.4 .9 54.7 23.3 .6 143.9July ............................. 71.9 .9 57.1 28.6 .7 159.1August ........................ 70.3 .7 56.9 31.3 .7 160.0September .................. 61.1 .5 59.4 27.9 .8 149.7October ....................... 56.7 .7 65.0 27.7 1.2 151.4November ................... 55.3 .7 67.3 26.0 1.1 150.4December ................... 63.3 .5 74.1 27.8 1.1 166.8Total ........................... 733.4 9.2 769.7 303.3 9.7 1,825.2
1992January ....................... 68.0 .6 77.4 26.8 .9 173.7February ..................... 62.3 .7 70.9 23.8 .4 158.1March .......................... 56.2 .6 74.1 24.7 .4 156.1April ............................ 51.2 .6 64.5 23.5 .4 140.2May ............................. 53.4 .5 59.7 23.9 .7 138.2June ............................ 59.7 .7 56.2 24.9 1.2 142.7July ............................. 66.5 1.0 56.0 30.2 1.3 155.0August ........................ 68.6 1.2 55.9 32.7 1.0 159.5September .................. 60.2 1.1 58.8 25.2 1.1 146.4October ....................... 58.7 .4 65.5 24.7 1.0 150.3November ................... 61.0 .7 65.7 25.0 .6 153.1December ................... 69.5 .7 76.5 27.6 .8 175.1Total ........................... 735.2 8.8 783.9 315.2 9.9 1,852.9
a "Total" does not include Eastern Europe and the former U.S.S.R. SeeNote 5 at end of section.
R=Revised data. – =Not applicable. (s)=Less than 0.05 billionkilowatthours.
Notes: • Net figures are generally less than gross figures by about 5percent, the difference being the energy consumed by the generating plants
themselves. • Monthly data may not sum to annual totals due to independentrounding and because precommercial generation is included in some annualtotals but not in the monthly data. • Data for regions may not sum to totalsdue to independent rounding.
Source: See end of section.
Energy Information Administration/Historical Monthly Energy Review 1973-1992324
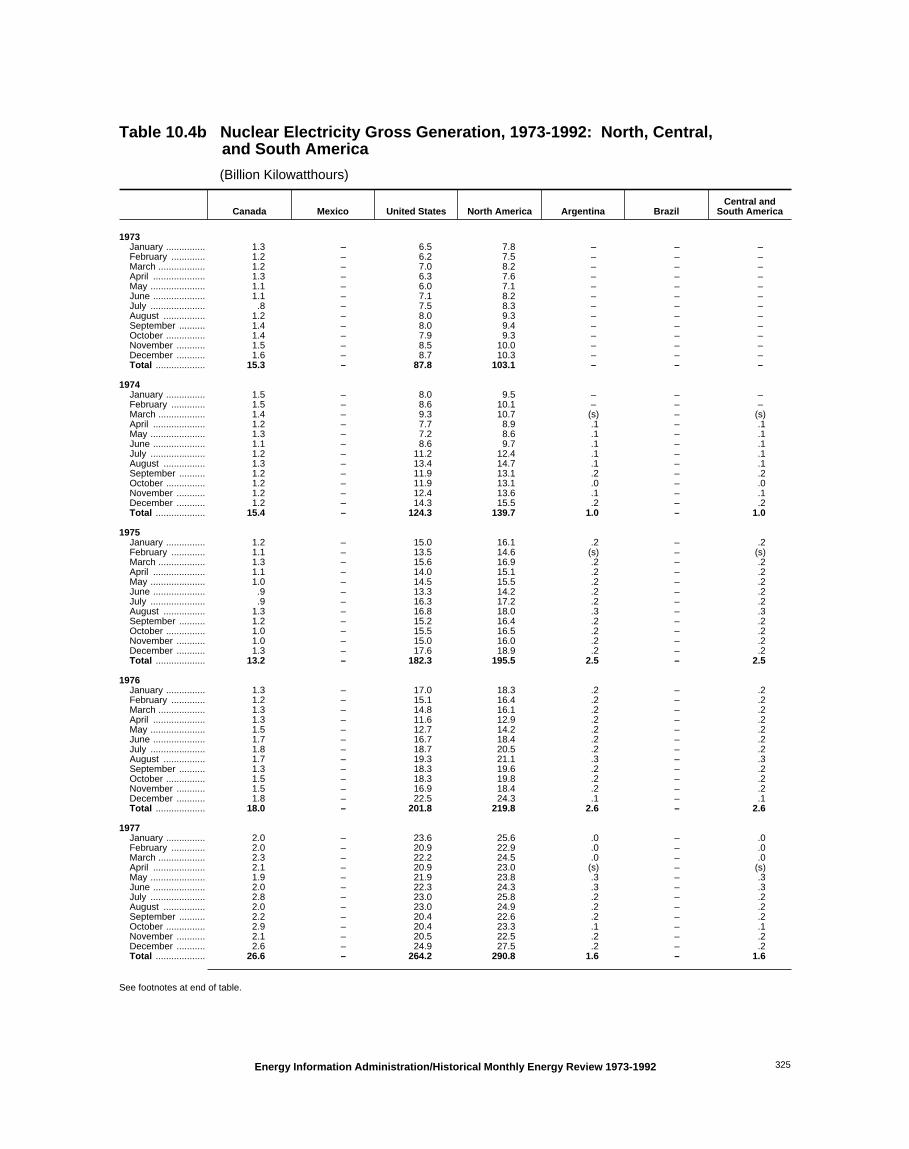
Table 10.4b Nuclear Electricity Gross Generation, 1973-1992: North, Central, and South America
(Billion Kilowatthours)
Canada Mexico United States North America Argentina BrazilCentral and
South America
1973January ............... 1.3 – 6.5 7.8 – – –February ............. 1.2 – 6.2 7.5 – – –March .................. 1.2 – 7.0 8.2 – – –April .................... 1.3 – 6.3 7.6 – – –May ..................... 1.1 – 6.0 7.1 – – –June .................... 1.1 – 7.1 8.2 – – –July ..................... .8 – 7.5 8.3 – – –August ................ 1.2 – 8.0 9.3 – – –September .......... 1.4 – 8.0 9.4 – – –October ............... 1.4 – 7.9 9.3 – – –November ........... 1.5 – 8.5 10.0 – – –December ........... 1.6 – 8.7 10.3 – – –Total ................... 15.3 – 87.8 103.1 – – –
1974January ............... 1.5 – 8.0 9.5 – – –February ............. 1.5 – 8.6 10.1 – – –March .................. 1.4 – 9.3 10.7 (s) – (s)April .................... 1.2 – 7.7 8.9 .1 – .1May ..................... 1.3 – 7.2 8.6 .1 – .1June .................... 1.1 – 8.6 9.7 .1 – .1July ..................... 1.2 – 11.2 12.4 .1 – .1August ................ 1.3 – 13.4 14.7 .1 – .1September .......... 1.2 – 11.9 13.1 .2 – .2October ............... 1.2 – 11.9 13.1 .0 – .0November ........... 1.2 – 12.4 13.6 .1 – .1December ........... 1.2 – 14.3 15.5 .2 – .2Total ................... 15.4 – 124.3 139.7 1.0 – 1.0
1975January ............... 1.2 – 15.0 16.1 .2 – .2February ............. 1.1 – 13.5 14.6 (s) – (s)March .................. 1.3 – 15.6 16.9 .2 – .2April .................... 1.1 – 14.0 15.1 .2 – .2May ..................... 1.0 – 14.5 15.5 .2 – .2June .................... .9 – 13.3 14.2 .2 – .2July ..................... .9 – 16.3 17.2 .2 – .2August ................ 1.3 – 16.8 18.0 .3 – .3September .......... 1.2 – 15.2 16.4 .2 – .2October ............... 1.0 – 15.5 16.5 .2 – .2November ........... 1.0 – 15.0 16.0 .2 – .2December ........... 1.3 – 17.6 18.9 .2 – .2Total ................... 13.2 – 182.3 195.5 2.5 – 2.5
1976January ............... 1.3 – 17.0 18.3 .2 – .2February ............. 1.2 – 15.1 16.4 .2 – .2March .................. 1.3 – 14.8 16.1 .2 – .2April .................... 1.3 – 11.6 12.9 .2 – .2May ..................... 1.5 – 12.7 14.2 .2 – .2June .................... 1.7 – 16.7 18.4 .2 – .2July ..................... 1.8 – 18.7 20.5 .2 – .2August ................ 1.7 – 19.3 21.1 .3 – .3September .......... 1.3 – 18.3 19.6 .2 – .2October ............... 1.5 – 18.3 19.8 .2 – .2November ........... 1.5 – 16.9 18.4 .2 – .2December ........... 1.8 – 22.5 24.3 .1 – .1Total ................... 18.0 – 201.8 219.8 2.6 – 2.6
1977January ............... 2.0 – 23.6 25.6 .0 – .0February ............. 2.0 – 20.9 22.9 .0 – .0March .................. 2.3 – 22.2 24.5 .0 – .0April .................... 2.1 – 20.9 23.0 (s) – (s)May ..................... 1.9 – 21.9 23.8 .3 – .3June .................... 2.0 – 22.3 24.3 .3 – .3July ..................... 2.8 – 23.0 25.8 .2 – .2August ................ 2.0 – 23.0 24.9 .2 – .2September .......... 2.2 – 20.4 22.6 .2 – .2October ............... 2.9 – 20.4 23.3 .1 – .1November ........... 2.1 – 20.5 22.5 .2 – .2December ........... 2.6 – 24.9 27.5 .2 – .2Total ................... 26.6 – 264.2 290.8 1.6 – 1.6
See footnotes at end of table.
Energy Information Administration/Historical Monthly Energy Review 1973-1992 325

Table 10.4b Nuclear Electricity Gross Generation, 1973-1992: North, Central, and South America (Continued)
(Billion Kilowatthours)
Canada Mexico United States North America Argentina BrazilCentral and
South America
1978January ............... 3.4 – 27.1 30.5 0.3 – 0.3February ............. 2.8 – 22.9 25.8 .2 – .2March .................. 2.0 – 23.8 25.8 .1 – .1April .................... 2.8 – 18.4 21.2 .3 – .3May ..................... 2.5 – 21.3 23.7 .3 – .3June .................... 2.7 – 23.3 26.0 .2 – .2July ..................... 3.4 – 26.3 29.7 .3 – .3August ................ 2.4 – 27.3 29.7 .3 – .3September .......... 2.5 – 23.7 26.2 .3 – .3October ............... 2.8 – 24.6 27.3 .3 – .3November ........... 2.7 – 26.4 29.0 .3 – .3December ........... 3.0 – 27.4 30.4 .2 – .2Total ................... 33.0 – 292.4 325.4 2.9 – 2.9
1979January ............... 3.8 – 29.2 33.0 .3 – .3February ............. 2.9 – 27.3 30.3 .2 – .2March .................. 2.9 – 25.5 28.4 .2 – .2April .................... 3.1 – 19.3 22.4 .3 – .3May ..................... 2.7 – 15.8 18.5 .3 – .3June .................... 3.2 – 17.1 20.3 .2 – .2July ..................... 3.8 – 22.5 26.3 .2 – .2August ................ 2.8 – 26.2 29.0 .3 – .3September .......... 3.0 – 23.2 26.1 .1 – .1October ............... 3.3 – 22.3 25.6 .2 – .2November ........... 2.9 – 20.3 23.2 .3 – .3December ........... 3.8 – 21.9 25.8 .2 – .2Total ................... 38.4 – 270.6 309.0 2.7 – 2.7
1980January ............... 3.6 – 21.1 24.7 .3 – .3February ............. 3.5 – 21.0 24.4 .1 – .1March .................. 3.7 – 21.0 24.7 .0 – .0April .................... 3.2 – 19.8 23.0 .1 – .1May ..................... 2.5 – 19.6 22.1 .2 – .2June .................... 3.1 – 19.4 22.5 .2 – .2July ..................... 3.6 – 22.4 25.9 .2 – .2August ................ 3.9 – 25.7 29.6 .3 – .3September .......... 3.1 – 24.8 27.9 .3 – .3October ............... 3.3 – 25.7 29.0 .3 – .3November ........... 3.4 – 21.9 25.3 .3 – .3December ........... 3.5 – 23.1 26.7 .3 – .3Total ................... 40.4 – 265.4 305.8 2.3 – 2.3
1981January ............... 3.2 – 25.7 28.9 .3 – .3February ............. 3.5 – 22.6 26.2 .2 – .2March .................. 3.9 – 23.1 27.0 .3 – .3April .................... 3.3 – 21.7 25.0 .2 – .2May ..................... 3.4 – 20.9 24.3 .2 – .2June .................... 3.6 – 22.5 26.1 .2 – .2July ..................... 4.0 – 24.8 28.8 .3 – .3August ................ 4.0 – 28.5 32.4 .2 – .2September .......... 3.3 – 25.6 28.9 .3 – .3October ............... 3.4 – 21.6 25.1 .2 – .2November ........... 3.5 – 24.0 27.6 .2 – .2December ........... 4.1 – 27.5 31.6 .2 – .2Total ................... 43.3 – 288.5 331.8 2.8 – 2.8
1982January ............... 4.1 – 27.1 31.2 .3 – .3February ............. 3.2 – 21.3 24.5 .2 – .2March .................. 3.5 – 24.0 27.4 .3 – .3April .................... 3.7 – 22.8 26.5 .3 (s) .3May ..................... 3.1 – 22.8 26.0 .3 (s) .3June .................... 3.3 – 25.3 28.6 .3 (s) .3July ..................... 3.6 – 26.8 30.4 .2 .0 .2August ................ 3.9 – 26.4 30.3 .0 .0 .0September .......... 3.2 – 26.7 29.9 (s) .0 (s)October ............... 4.0 – 25.4 29.4 .0 .0 .0November ........... 3.3 – 24.2 27.5 (s) .0 (s)December ........... 3.8 – 25.8 29.6 .2 .0 .2Total ................... 42.6 – 298.6 341.2 1.9 .1 1.9
See footnotes at end of table.
Energy Information Administration/Historical Monthly Energy Review 1973-1992326

Table 10.4b Nuclear Electricity Gross Generation, 1973-1992: North, Central, and South America (Continued)
(Billion Kilowatthours)
Canada Mexico United States North America Argentina BrazilCentral and
South America
1983January ............... 4.3 – 27.4 31.7 0.2 0.0 0.2February ............. 4.5 – 23.8 28.3 .2 .0 .2March .................. 4.6 – 25.1 29.7 .2 (s) .2April .................... 4.3 – 23.4 27.7 .2 (s) .3May ..................... 3.9 – 23.9 27.8 .2 .0 .2June .................... 4.4 – 25.7 30.1 .3 .0 .3July ..................... 4.8 – 27.3 32.2 .3 .0 .3August ................ 3.8 – 27.9 31.8 .3 .0 .3September .......... 4.4 – 26.3 30.7 .5 .0 .5October ............... 4.7 – 27.6 32.3 .3 .0 .3November ........... 4.3 – 26.6 30.8 .4 (s) .4December ........... 5.0 – 28.6 33.6 .4 .1 .4Total ................... 53.0 – 313.6 366.6 3.4 .2 3.6
1984January ............... 5.0 – 30.8 35.8 .7 (s) .7February ............. 4.6 – 29.4 34.0 .4 .2 .6March .................. 5.1 – 28.6 33.7 .6 .1 .7April .................... 4.3 – 24.7 29.0 .5 (s) .5May ..................... 3.6 – 27.3 30.9 .5 .1 .6June .................... 3.7 – 26.4 30.2 .4 .0 .4July ..................... 4.4 – 29.4 33.8 .4 .0 .4August ................ 4.7 – 31.8 36.5 .3 (s) .3September .......... 3.9 – 30.3 34.2 .4 .3 .7October ............... 4.5 – 26.8 31.3 .1 .5 .6November ........... 4.7 – 26.2 30.9 (s) .4 .4December ........... 5.1 – 32.0 37.2 .1 .4 .5Total ................... 53.8 – 343.8 397.6 4.5 2.1 6.6
1985January ............... 5.7 – 38.0 43.7 .2 .4 .6February ............. 5.0 – R 32.3 37.3 .4 .3 .7March .................. 5.9 – R 32.4 38.3 .5 .3 .8April .................... 5.2 – R 28.1 33.4 .4 .1 .5May ..................... 2.4 – R 29.7 32.1 .4 .2 .6June .................... 4.2 – R 31.6 35.7 .4 .4 .8July ..................... 5.7 – R 36.9 42.7 .5 .3 .8August ................ R 5.9 – R 37.1 43.0 .5 .1 .6September .......... 5.4 – R 36.1 41.5 .5 .3 .8October ............... 5.1 – R 32.9 38.0 .6 .4 1.0November ........... 5.8 – R 32.0 37.8 .7 .3 1.0December ........... 6.5 – 35.7 42.2 .7 .3 1.0Total ................... 62.9 – R 402.7 465.6 5.8 3.4 9.1
1986January ............... 6.5 – 38.1 44.5 .6 (s) .7February ............. 6.2 – 34.1 40.3 .6 .0 .6March .................. 7.0 – 31.2 38.1 .5 .0 .5April .................... 6.0 – 32.2 38.2 .5 .0 .5May ..................... 5.7 – 33.7 39.4 .7 .0 .7June .................... 5.4 – 33.2 38.6 .4 .0 .4July ..................... 5.3 – 38.0 43.4 .4 .0 .4August ................ 6.6 – R 39.4 46.1 .6 .0 .6September .......... 6.2 – R 38.2 44.4 .6 .0 .6October ............... 6.6 – R 38.1 44.8 .2 .0 .2November ........... 6.4 – R 36.4 42.8 .2 (s) .3December ........... 6.7 – R 41.5 48.2 .3 .1 .4Total ................... 74.6 – R 434.1 508.8 5.7 .1 5.8
1987January ............... 7.2 – 42.0 49.2 .7 .0 .7February ............. 6.7 – 38.2 44.9 .5 .0 .5March .................. 7.0 – 39.2 46.2 .6 (s) .6April .................... 6.7 – 35.0 41.7 .7 .3 1.0May ..................... 4.8 – 36.3 41.1 .6 .4 1.1June .................... 6.5 – 38.4 44.9 .4 .3 .7July ..................... 6.8 – 42.9 49.7 .7 .0 .7August ................ 6.5 – 43.2 49.8 .1 .0 .1September .......... 6.3 – 41.9 48.2 .4 .0 .4October ............... 7.4 – 38.3 45.7 .0 .0 .0November ........... 7.1 – 39.4 46.5 .0 .0 .0December ........... 7.5 – 44.7 52.2 .5 .0 .5Total ................... 80.6 – 479.5 560.1 5.2 1.0 6.2
See footnotes at end of table.
Energy Information Administration/Historical Monthly Energy Review 1973-1992 327

Table 10.4b Nuclear Electricity Gross Generation, 1973-1992: North, Central, and South America (Continued)
(Billion Kilowatthours)
Canada Mexico United States North America Argentina BrazilCentral and
South America
1988January ............... 7.7 – 47.4 55.0 0.5 0.0 0.5February ............. 7.5 – 44.5 52.0 .5 .0 .5March .................. 7.9 – 46.2 54.1 .5 .0 .5April .................... 6.9 – 42.2 49.1 .2 .0 .2May ..................... 6.7 – 42.7 49.4 .2 .0 .2June .................... 6.6 – 46.3 52.9 .2 .0 .2July ..................... 7.2 – 51.7 58.9 .7 .0 .7August ................ 7.4 – 51.7 59.1 .5 .0 .5September .......... 6.9 – 48.7 55.5 .5 .0 .5October ............... 6.6 – 44.6 51.1 .5 .0 .5November ........... 6.7 – 41.7 48.4 .5 .0 .5December ........... 7.7 – 46.4 54.1 .5 .3 .8Total ................... 85.6 – 554.1 639.7 5.1 .3 5.5
1989January ............... 8.1 – 48.7 56.8 .5 .2 .7February ............. 6.9 – 40.8 47.7 .4 .2 .6March .................. 7.7 – 41.8 49.5 .5 .2 .7April .................... 7.3 – 35.3 42.6 .4 .3 .7May ..................... 6.2 – 40.8 47.0 .5 (s) .5June .................... 5.8 – 45.1 50.9 .5 .2 .7July ..................... 7.1 – 55.2 62.3 .5 .2 .7August ................ 6.9 – 57.6 64.6 (s) .0 (s)September .......... 6.6 – 47.0 53.6 .5 .2 .7October ............... 6.6 – 45.7 52.3 .5 .0 .5November ........... 6.3 – 45.6 51.8 .5 .0 .5December ........... 7.6 – 53.3 60.9 .4 .0 .4Total ................... 83.2 – 557.0 640.2 5.0 1.6 6.6
1990January ............... 7.3 – 57.7 65.0 .5 .1 .6February ............. 5.8 – 52.3 58.0 .4 .2 .7March .................. 6.2 – 48.4 54.6 .7 .0 .7April .................... 5.8 – 40.6 46.3 .6 .1 .7May ..................... 4.4 – 45.1 49.5 .6 .2 .8June .................... 5.1 – 48.5 53.6 .7 .2 .9July ..................... 6.6 – 54.7 61.3 .7 .1 .8August ................ 6.2 .4 57.9 64.5 .7 .3 .9September .......... 5.5 .4 51.1 57.0 .5 .1 .6October ............... 7.1 .5 45.6 53.3 .6 .2 .8November ........... 7.0 .4 47.4 54.8 .7 .3 1.0December ........... 7.2 .4 54.2 61.8 .7 .2 .9Total ................... 75.8 2.1 603.4 681.3 7.4 2.0 9.4
1991January ............... 7.6 .5 56.6 64.7 .5 .2 .7February ............. 7.3 .4 50.2 58.0 .6 .2 .8March .................. 7.8 .5 51.6 59.9 .6 .2 .9April .................... 6.7 .5 43.8 50.9 .7 .2 .9May ..................... 7.2 .5 49.2 56.9 .7 .2 1.0June .................... 7.1 .4 56.9 64.4 .7 .2 .9July ..................... 7.7 .4 63.7 71.9 .7 .2 .9August ................ 8.6 .4 61.4 70.3 .7 .0 .7September .......... 6.7 .0 54.4 61.1 .5 .0 .5October ............... 6.6 .0 50.2 56.7 .7 .0 .7November ........... 6.3 .2 48.7 55.3 .7 .0 .7December ........... 6.5 .5 56.3 63.3 .5 .0 .5Total ................... 86.1 4.2 643.0 733.4 7.7 1.4 9.2
1992January ............... 6.9 .5 60.6 68.0 .6 .0 .6February ............. 6.4 .4 55.4 62.3 .7 .0 .7March .................. 7.4 .5 48.3 56.2 .6 .0 .6April .................... 6.4 .5 44.3 51.2 .6 .0 .6May ..................... 4.8 .5 48.1 53.4 .5 .0 .5June .................... 5.6 .3 53.7 59.7 .6 .1 .7July ..................... 7.2 .3 59.0 66.5 .7 .3 1.0August ................ 6.9 .2 61.6 68.6 .7 .4 1.2September .......... 6.9 .0 53.2 60.2 .7 .3 1.1October ............... 7.2 (s) 51.5 58.7 .3 .1 .4November ........... 7.4 .4 53.2 61.0 .4 .3 .7December ........... 8.0 .4 61.0 69.5 .6 .1 .7Total ................... 81.3 3.9 650.0 735.2 7.1 1.8 8.8
R=Revised data. – =Not applicable. (s)=Less than 0.05 billionkilowatthours.
Notes: • Net figures are generally less than gross figures by about 5percent, the difference being the energy consumed by the generating plantsthemselves. • Monthly data may not sum to annual totals due to independent
rounding and because precommercial generation is included in some annualtotals but not in the monthly data. • Data for countries may not sum toregional totals due to independent rounding. • U.S. geographic coverage isthe 50 States and the District of Columbia.
Source: See end of section.
Energy Information Administration/Historical Monthly Energy Review 1973-1992328

Table 10.4c Nuclear Electricity Gross Generation, 1973-1992: Western Europe
(Billion Kilowatthours)
Belgium Finland France Germanya Italyb Netherlands Spain Sweden SwitzerlandUnited
KingdomcWesternEurope
1973January ........................... – – 1.6 1.2 0.3 (s) 0.5 0.3 0.7 2.9 7.6February ......................... – – 1.5 1.2 .3 (s) .6 .3 .6 2.8 7.4March .............................. – – 1.5 1.1 .2 (s) .4 .3 .7 3.1 7.3April ................................ – – 1.4 1.1 .1 (s) .4 .1 .5 2.3 6.0May ................................. – – 1.1 .9 .1 .0 .6 (s) .5 2.0 5.3June ................................ – – .6 .9 .1 (s) .7 (s) .6 2.1 5.1July ................................. – – .8 .8 .2 (s) .7 .1 .6 1.8 5.0August ............................ – – .8 .9 .3 .1 .6 .0 .2 1.9 4.9September ...................... – – 1.2 .6 .3 .2 .3 .2 .3 2.3 5.4October ........................... – – 1.4 .8 .4 .2 .4 .3 .5 1.8 5.7November ....................... – – 1.4 1.1 .4 .2 .6 .3 .5 2.3 6.8December ....................... – – 1.4 1.3 .4 .1 .7 .1 .6 2.9 7.5Total ............................... – – 14.7 11.9 3.1 1.1 6.5 2.1 6.2 28.2 73.9
1974January ........................... – – 1.5 1.4 .4 .3 .5 .4 .5 3.0 7.9February ......................... – – 1.3 1.0 .4 .2 .6 .3 .7 3.0 7.6March .............................. – – 1.5 1.0 .4 .2 .6 .2 .7 3.7 8.3April ................................ – – 1.3 .9 .3 .2 .3 .3 .7 2.9 6.9May ................................. – – 1.0 .8 .4 .3 .4 .2 .6 2.7 6.4June ................................ – – 1.1 .4 .3 .3 .7 .0 .4 2.8 5.9July ................................. – – .8 .8 .2 .3 .7 .0 .4 2.2 5.6August ............................ (s) – .8 .8 .2 .3 .7 (s) .3 2.2 5.3September ...................... (s) – 1.1 1.0 .1 .2 .7 .0 .5 2.6 6.2October ........................... (s) – 1.5 1.3 .1 .2 .6 .1 .6 2.5 7.0November ....................... (s) – 1.3 1.3 .2 .3 .7 .3 .8 2.7 7.7December ....................... (s) – 1.5 1.4 .4 .3 .7 .5 .8 3.4 9.0Total ............................... .1 – 14.7 12.0 3.4 3.3 7.2 2.3 7.0 33.8 83.9
1975January ........................... .2 – 1.9 1.5 .4 .2 .7 .8 .8 2.8 9.2February ......................... .2 – 1.6 1.5 .3 (s) .7 .8 .7 2.8 8.7March .............................. .3 – 1.6 1.5 .4 (s) .5 1.0 .8 3.5 9.7April ................................ .3 – 1.4 1.9 .3 .3 .4 1.1 .8 2.6 9.1May ................................. .3 – 1.6 1.6 .3 .4 .5 1.0 .7 1.9 8.4June ................................ .2 – 1.1 1.2 .3 .4 .6 .4 .5 2.2 6.9July ................................. .5 – 1.5 2.0 .3 .4 .7 .7 .5 1.7 8.3August ............................ .9 – 1.5 2.0 .3 .3 .7 .5 .3 1.9 8.4September ...................... .8 – 1.4 2.1 .3 .3 .7 1.0 .6 2.5 9.7October ........................... .9 – 1.5 2.2 .2 .3 .7 1.5 .7 2.5 10.4November ....................... 1.1 – 1.5 2.0 .3 .4 .7 1.5 .7 2.7 10.9December ....................... 1.0 – 1.6 2.2 .3 .4 .6 1.9 .7 3.4 12.1Total ............................... 6.8 – 18.3 21.7 3.8 3.3 7.5 12.0 7.7 30.5 111.7
1976January ........................... 1.0 – 1.6 2.2 .4 .4 .7 1.5 .8 2.8 11.2February ......................... 1.1 – 1.7 2.2 .3 .2 .7 1.5 .7 2.8 11.2March .............................. .9 – 1.5 2.3 .3 (s) .7 1.3 .8 3.9 11.6April ................................ 1.0 – 1.5 1.9 .2 .3 .5 1.6 .7 2.8 10.5May ................................. 1.1 – 1.7 1.2 .2 .4 .4 1.5 .6 2.7 9.8June ................................ .9 – 1.3 1.4 .2 .4 .5 1.0 .3 2.7 8.6July ................................. 1.0 – 1.0 1.4 .4 .4 .8 .8 .5 2.2 8.6August ............................ .8 – 1.1 1.5 .4 .4 .8 1.1 .5 2.6 9.2September ...................... 1.1 – .9 1.9 .3 .4 .4 1.0 .7 3.5 10.3October ........................... .5 – 1.0 2.6 .4 .4 .7 1.4 .8 3.2 10.9November ....................... .3 – 1.1 2.2 .4 .4 .7 1.2 .7 3.2 10.2December ....................... .2 – 1.4 3.8 .4 .4 .8 2.0 .8 4.4 14.0Total ............................... 10.0 – 15.8 24.5 3.8 3.9 7.6 16.0 7.9 36.8 126.2
1977January ........................... .3 – 1.6 3.4 .4 .1 .6 1.9 .8 3.1 12.2February ......................... .3 (s) 1.5 3.1 .3 .1 .6 1.6 .7 3.4 11.5March .............................. .8 .2 1.5 3.7 .4 .3 .6 1.8 .8 4.1 14.3April ................................ 1.0 .2 1.5 3.5 .4 .3 .4 1.7 .8 3.2 13.1May ................................. 1.2 .3 1.4 3.7 .3 .4 .4 1.2 .7 2.7 12.4June ................................ 1.2 .2 1.2 3.3 .2 .4 .4 1.1 .5 3.3 11.6July ................................. 1.2 .3 1.1 2.7 .2 .4 .4 1.2 .4 2.5 10.3August ............................ 1.2 .3 1.0 2.4 .2 .4 .4 1.3 .3 3.1 10.5September ...................... 1.2 .3 1.4 1.6 .2 .4 .5 1.4 .7 3.7 11.4October ........................... 1.2 .3 1.9 2.0 .2 .4 .7 1.6 .8 2.7 11.8November ....................... .9 .3 1.9 3.1 .3 .2 .7 2.3 .8 2.3 12.8December ....................... 1.2 .3 2.1 3.6 .3 .3 .7 2.7 .8 4.0 16.0Total ............................... 11.9 2.7 17.9 36.0 3.4 3.7 6.5 19.9 8.1 38.1 148.1
See footnotes at end of table.
Energy Information Administration/Historical Monthly Energy Review 1973-1992 329

Table 10.4c Nuclear Electricity Gross Generation, 1973-1992: Western Europe (Continued)
(Billion Kilowatthours)
Belgium Finland France Germanya Italyb Netherlands Spain Sweden SwitzerlandUnited
KingdomcWesternEurope
1978January ........................... 0.9 0.3 2.5 3.3 0.3 0.4 0.7 2.6 0.8 3.3 15.1February ......................... .3 .1 2.5 3.5 .3 .3 .6 2.3 .7 3.5 14.3March .............................. .7 (s) 2.5 4.1 .3 .4 .7 2.5 .8 4.1 16.1April ................................ 1.1 .3 2.7 2.9 .4 .4 .6 2.0 .7 3.2 14.3May ................................. 1.3 .3 2.1 3.3 .4 .4 .1 1.5 .7 2.4 12.5June ................................ 1.2 .2 1.9 2.4 .4 .4 .5 1.7 .5 3.1 12.3July ................................. 1.2 .3 2.1 2.3 .5 .4 .8 1.1 .5 2.5 11.6August ............................ 1.3 .3 2.4 2.9 .5 .4 .7 1.0 .4 2.6 12.4September ...................... 1.2 .3 2.7 2.4 .3 .4 .7 1.8 .7 2.7 13.3October ........................... 1.2 .3 3.1 2.5 .3 .1 .7 2.3 .8 2.6 14.0November ....................... .9 .3 3.0 2.9 .4 .2 .7 2.3 .8 2.9 14.4December ....................... 1.2 .4 3.1 3.3 .5 .4 .7 2.6 .8 3.7 16.6Total ............................... 12.5 3.3 30.6 35.7 4.5 4.1 7.6 23.8 8.3 36.6 166.9
1979January ........................... .8 .5 3.8 4.2 .4 .4 .5 2.3 .8 3.8 17.7February ......................... .6 .5 3.5 3.4 .3 .4 .6 2.0 .8 3.8 15.8March .............................. .8 .5 3.2 3.8 .2 .4 .7 2.7 1.0 4.0 17.2April ................................ 1.0 .6 3.2 3.8 .3 .2 .6 1.4 1.0 3.2 15.4May ................................. 1.3 .5 3.3 3.5 .2 .3 .1 1.3 1.0 2.3 13.7June ................................ 1.2 .4 3.0 3.3 .1 .4 .3 1.0 .8 3.1 13.4July ................................. 1.0 .5 2.6 3.3 .0 .4 .3 1.0 .7 2.6 12.5August ............................ .6 .4 2.3 2.9 .1 .3 .7 1.1 .6 2.4 11.3September ...................... .8 .7 3.1 2.6 .2 .4 .7 1.4 1.1 3.1 14.1October ........................... 1.1 .8 3.8 3.7 .2 .3 .7 2.0 1.1 2.8 16.5November ....................... 1.0 .6 3.6 3.8 .2 (s) .7 2.3 1.4 3.3 16.9December ....................... 1.3 .7 4.6 4.1 .4 .1 .7 2.5 1.5 4.1 19.9Total ............................... 11.4 6.7 39.9 42.2 2.6 3.5 6.7 21.0 11.8 38.5 184.3
1980January ........................... 1.2 .8 5.5 4.7 .2 .4 .7 2.5 1.5 3.7 21.1February ......................... 1.0 .8 5.3 4.2 .4 .4 .3 2.4 1.2 3.4 19.5March .............................. 1.0 .8 5.1 3.4 .5 .4 .4 2.3 1.3 4.2 19.4April ................................ .5 .8 5.0 3.6 .4 .3 .4 1.9 1.4 2.7 17.0May ................................. .7 .3 4.2 3.5 .3 .3 .4 1.6 1.4 2.6 15.3June ................................ 1.1 .0 4.1 2.9 .1 .3 .3 1.6 .6 2.8 13.8July ................................. 1.3 .4 4.8 3.0 .1 .4 .3 1.4 .6 2.0 14.3August ............................ 1.3 .4 3.2 2.7 .1 .4 .4 1.3 .7 2.6 13.0September ...................... 1.1 .4 4.5 3.2 .1 .4 .4 2.1 1.3 3.1 16.5October ........................... .9 .5 5.1 3.1 .0 .3 .4 2.7 1.4 2.7 17.2November ....................... 1.1 .6 5.8 4.1 .0 .3 .5 3.4 1.4 3.2 20.5December ....................... 1.2 1.2 8.5 5.3 .0 .3 .7 3.6 1.5 4.2 26.5Total ............................... 12.5 7.0 61.2 43.7 2.2 4.2 5.2 26.7 14.3 37.2 214.2
1981January ........................... 1.2 1.3 9.3 5.0 .2 .1 .8 3.5 1.5 3.8 26.7February ......................... 1.0 .9 8.6 4.6 .3 (s) .6 3.6 1.4 3.4 24.4March .............................. .6 1.4 8.8 4.9 .1 .3 .7 3.7 1.5 4.2 26.0April ................................ .7 1.5 8.3 4.4 .6 .4 .6 3.3 1.4 2.8 23.9May ................................. 1.2 1.0 8.9 4.3 .3 .4 .8 2.8 1.4 2.5 23.6June ................................ 1.2 .7 8.3 4.1 .1 .4 .8 2.8 .7 3.3 22.5July ................................. 1.3 .8 8.4 5.2 .3 .4 1.1 1.4 .6 2.5 22.0August ............................ 1.2 1.4 7.7 3.9 .1 .4 1.0 2.6 1.0 2.5 21.8September ...................... .9 1.5 8.5 3.3 .1 .4 .6 3.0 1.3 3.1 22.6October ........................... 1.0 1.4 8.1 4.0 .1 .4 1.2 3.3 1.5 2.7 23.7November ....................... 1.3 1.3 9.3 4.3 .1 .4 .6 3.6 1.4 3.1 25.4December ....................... 1.3 1.2 11.0 5.4 .4 .3 .7 4.1 1.5 4.9 30.8Total ............................... 12.8 14.5 105.2 53.4 2.7 3.7 9.4 37.7 15.2 38.9 293.4
1982January ........................... 1.3 1.5 11.0 5.9 .6 .4 1.0 4.0 1.5 3.4 30.6February ......................... .8 1.5 10.0 5.4 .7 .1 .9 3.3 1.3 3.5 27.4March .............................. .5 1.7 10.6 5.3 .7 (s) .5 3.8 1.5 4.1 28.7April ................................ 1.0 1.6 10.1 5.3 .5 .3 .4 3.8 1.4 3.3 27.7May ................................. 1.3 1.3 9.0 5.6 .7 .4 .5 2.5 1.2 2.6 25.1June ................................ 1.3 .9 7.8 4.2 .6 .4 .7 2.0 .6 3.3 21.6July ................................. 1.5 1.2 8.3 4.5 .6 .4 .6 1.2 .9 3.3 22.6August ............................ 1.5 1.5 7.0 4.5 .4 .4 .7 2.0 1.0 3.7 22.7September ...................... 1.1 1.5 7.2 5.4 .6 .4 .7 3.7 1.2 4.2 26.0October ........................... 1.8 1.4 6.6 5.2 .6 .4 1.0 4.2 1.5 3.7 26.3November ....................... 1.8 1.3 8.3 5.8 .3 .4 .9 4.0 1.4 3.8 28.1December ....................... 1.8 1.3 13.0 6.5 .5 .4 .9 4.2 1.5 5.1 35.1Total ............................... 15.6 16.5 108.9 63.4 6.8 3.9 8.8 38.8 15.0 44.1 321.8
See footnotes at end of table.
Energy Information Administration/Historical Monthly Energy Review 1973-1992330
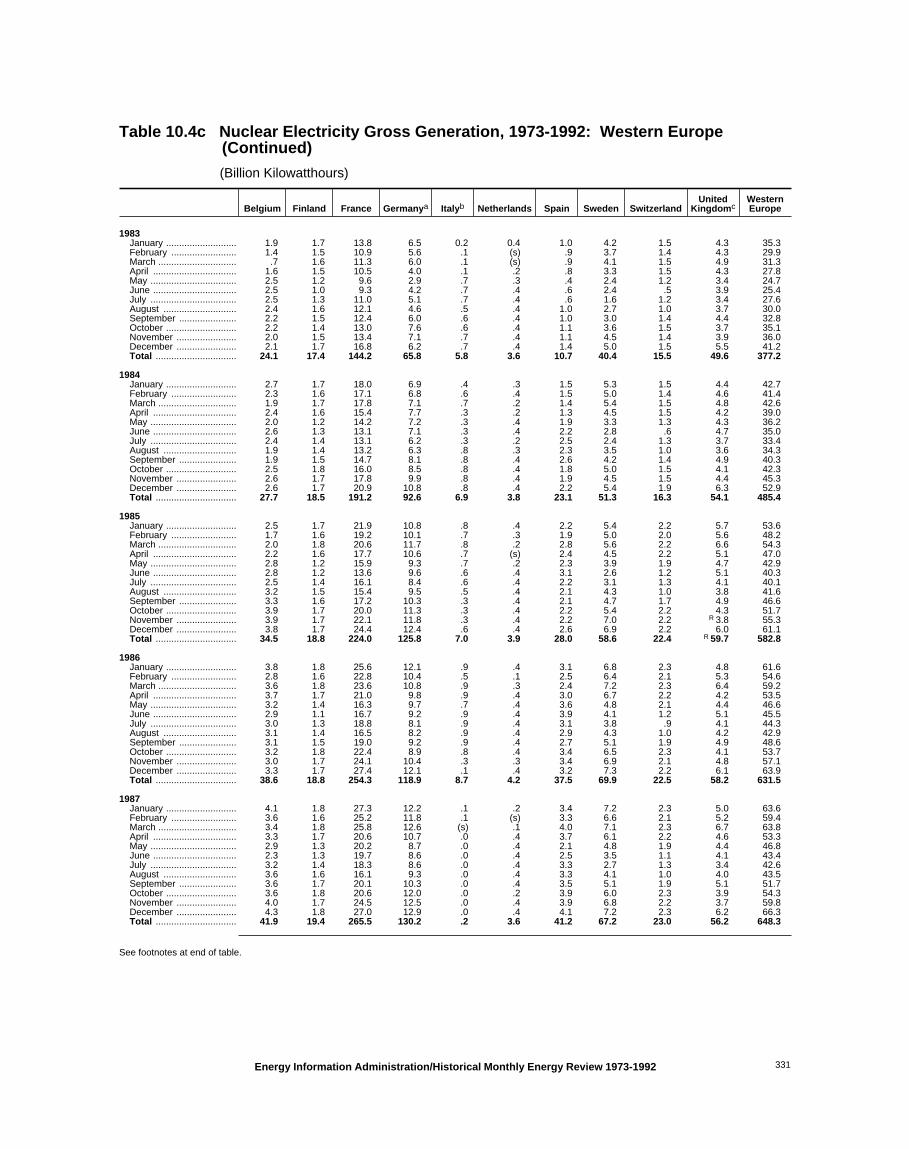
Table 10.4c Nuclear Electricity Gross Generation, 1973-1992: Western Europe (Continued)
(Billion Kilowatthours)
Belgium Finland France Germanya Italyb Netherlands Spain Sweden SwitzerlandUnited
KingdomcWesternEurope
1983January ........................... 1.9 1.7 13.8 6.5 0.2 0.4 1.0 4.2 1.5 4.3 35.3February ......................... 1.4 1.5 10.9 5.6 .1 (s) .9 3.7 1.4 4.3 29.9March .............................. .7 1.6 11.3 6.0 .1 (s) .9 4.1 1.5 4.9 31.3April ................................ 1.6 1.5 10.5 4.0 .1 .2 .8 3.3 1.5 4.3 27.8May ................................. 2.5 1.2 9.6 2.9 .7 .3 .4 2.4 1.2 3.4 24.7June ................................ 2.5 1.0 9.3 4.2 .7 .4 .6 2.4 .5 3.9 25.4July ................................. 2.5 1.3 11.0 5.1 .7 .4 .6 1.6 1.2 3.4 27.6August ............................ 2.4 1.6 12.1 4.6 .5 .4 1.0 2.7 1.0 3.7 30.0September ...................... 2.2 1.5 12.4 6.0 .6 .4 1.0 3.0 1.4 4.4 32.8October ........................... 2.2 1.4 13.0 7.6 .6 .4 1.1 3.6 1.5 3.7 35.1November ....................... 2.0 1.5 13.4 7.1 .7 .4 1.1 4.5 1.4 3.9 36.0December ....................... 2.1 1.7 16.8 6.2 .7 .4 1.4 5.0 1.5 5.5 41.2Total ............................... 24.1 17.4 144.2 65.8 5.8 3.6 10.7 40.4 15.5 49.6 377.2
1984January ........................... 2.7 1.7 18.0 6.9 .4 .3 1.5 5.3 1.5 4.4 42.7February ......................... 2.3 1.6 17.1 6.8 .6 .4 1.5 5.0 1.4 4.6 41.4March .............................. 1.9 1.7 17.8 7.1 .7 .2 1.4 5.4 1.5 4.8 42.6April ................................ 2.4 1.6 15.4 7.7 .3 .2 1.3 4.5 1.5 4.2 39.0May ................................. 2.0 1.2 14.2 7.2 .3 .4 1.9 3.3 1.3 4.3 36.2June ................................ 2.6 1.3 13.1 7.1 .3 .4 2.2 2.8 .6 4.7 35.0July ................................. 2.4 1.4 13.1 6.2 .3 .2 2.5 2.4 1.3 3.7 33.4August ............................ 1.9 1.4 13.2 6.3 .8 .3 2.3 3.5 1.0 3.6 34.3September ...................... 1.9 1.5 14.7 8.1 .8 .4 2.6 4.2 1.4 4.9 40.3October ........................... 2.5 1.8 16.0 8.5 .8 .4 1.8 5.0 1.5 4.1 42.3November ....................... 2.6 1.7 17.8 9.9 .8 .4 1.9 4.5 1.5 4.4 45.3December ....................... 2.6 1.7 20.9 10.8 .8 .4 2.2 5.4 1.9 6.3 52.9Total ............................... 27.7 18.5 191.2 92.6 6.9 3.8 23.1 51.3 16.3 54.1 485.4
1985January ........................... 2.5 1.7 21.9 10.8 .8 .4 2.2 5.4 2.2 5.7 53.6February ......................... 1.7 1.6 19.2 10.1 .7 .3 1.9 5.0 2.0 5.6 48.2March .............................. 2.0 1.8 20.6 11.7 .8 .2 2.8 5.6 2.2 6.6 54.3April ................................ 2.2 1.6 17.7 10.6 .7 (s) 2.4 4.5 2.2 5.1 47.0May ................................. 2.8 1.2 15.9 9.3 .7 .2 2.3 3.9 1.9 4.7 42.9June ................................ 2.8 1.2 13.6 9.6 .6 .4 3.1 2.6 1.2 5.1 40.3July ................................. 2.5 1.4 16.1 8.4 .6 .4 2.2 3.1 1.3 4.1 40.1August ............................ 3.2 1.5 15.4 9.5 .5 .4 2.1 4.3 1.0 3.8 41.6September ...................... 3.3 1.6 17.2 10.3 .3 .4 2.1 4.7 1.7 4.9 46.6October ........................... 3.9 1.7 20.0 11.3 .3 .4 2.2 5.4 2.2 4.3 51.7November ....................... 3.9 1.7 22.1 11.8 .3 .4 2.2 7.0 2.2 R 3.8 55.3December ....................... 3.8 1.7 24.4 12.4 .6 .4 2.6 6.9 2.2 6.0 61.1Total ............................... 34.5 18.8 224.0 125.8 7.0 3.9 28.0 58.6 22.4 R 59.7 582.8
1986January ........................... 3.8 1.8 25.6 12.1 .9 .4 3.1 6.8 2.3 4.8 61.6February ......................... 2.8 1.6 22.8 10.4 .5 .1 2.5 6.4 2.1 5.3 54.6March .............................. 3.6 1.8 23.6 10.8 .9 .3 2.4 7.2 2.3 6.4 59.2April ................................ 3.7 1.7 21.0 9.8 .9 .4 3.0 6.7 2.2 4.2 53.5May ................................. 3.2 1.4 16.3 9.7 .7 .4 3.6 4.8 2.1 4.4 46.6June ................................ 2.9 1.1 16.7 9.2 .9 .4 3.9 4.1 1.2 5.1 45.5July ................................. 3.0 1.3 18.8 8.1 .9 .4 3.1 3.8 .9 4.1 44.3August ............................ 3.1 1.4 16.5 8.2 .9 .4 2.9 4.3 1.0 4.2 42.9September ...................... 3.1 1.5 19.0 9.2 .9 .4 2.7 5.1 1.9 4.9 48.6October ........................... 3.2 1.8 22.4 8.9 .8 .4 3.4 6.5 2.3 4.1 53.7November ....................... 3.0 1.7 24.1 10.4 .3 .3 3.4 6.9 2.1 4.8 57.1December ....................... 3.3 1.7 27.4 12.1 .1 .4 3.2 7.3 2.2 6.1 63.9Total ............................... 38.6 18.8 254.3 118.9 8.7 4.2 37.5 69.9 22.5 58.2 631.5
1987January ........................... 4.1 1.8 27.3 12.2 .1 .2 3.4 7.2 2.3 5.0 63.6February ......................... 3.6 1.6 25.2 11.8 .1 (s) 3.3 6.6 2.1 5.2 59.4March .............................. 3.4 1.8 25.8 12.6 (s) .1 4.0 7.1 2.3 6.7 63.8April ................................ 3.3 1.7 20.6 10.7 .0 .4 3.7 6.1 2.2 4.6 53.3May ................................. 2.9 1.3 20.2 8.7 .0 .4 2.1 4.8 1.9 4.4 46.8June ................................ 2.3 1.3 19.7 8.6 .0 .4 2.5 3.5 1.1 4.1 43.4July ................................. 3.2 1.4 18.3 8.6 .0 .4 3.3 2.7 1.3 3.4 42.6August ............................ 3.6 1.6 16.1 9.3 .0 .4 3.3 4.1 1.0 4.0 43.5September ...................... 3.6 1.7 20.1 10.3 .0 .4 3.5 5.1 1.9 5.1 51.7October ........................... 3.6 1.8 20.6 12.0 .0 .2 3.9 6.0 2.3 3.9 54.3November ....................... 4.0 1.7 24.5 12.5 .0 .4 3.9 6.8 2.2 3.7 59.8December ....................... 4.3 1.8 27.0 12.9 .0 .4 4.1 7.2 2.3 6.2 66.3Total ............................... 41.9 19.4 265.5 130.2 .2 3.6 41.2 67.2 23.0 56.2 648.3
See footnotes at end of table.
Energy Information Administration/Historical Monthly Energy Review 1973-1992 331

Table 10.4c Nuclear Electricity Gross Generation, 1973-1992: Western Europe (Continued)
(Billion Kilowatthours)
Belgium Finland France Germanya Italyb Netherlands Spain Sweden SwitzerlandUnited
KingdomcWesternEurope
1988January ........................... 3.9 1.8 26.1 13.1 0.0 0.3 4.2 7.2 2.3 4.9 63.6February ......................... 3.2 1.6 24.5 12.4 .0 (s) 3.4 6.8 2.2 4.3 58.5March .............................. 3.7 1.8 26.0 13.5 .0 (s) 3.5 7.2 2.3 1.8 59.8April ................................ 3.4 1.7 21.0 11.4 .0 .2 3.7 6.8 2.2 4.5 55.0May ................................. 3.3 1.3 18.9 11.0 .0 .4 4.4 5.4 2.0 4.3 50.8June ................................ 2.7 1.4 20.1 10.6 .0 .4 4.4 4.3 1.2 5.7 50.7July ................................. 3.3 1.2 20.6 10.6 .0 .4 3.8 3.7 1.3 5.1 50.2August ............................ 3.8 1.5 20.9 10.0 .0 .4 R 4.0 3.6 1.0 5.3 50.5September ...................... 3.9 1.7 23.4 12.2 .0 .4 4.6 4.5 1.5 6.0 58.2October ........................... 3.9 1.8 24.0 13.7 .0 .4 4.9 6.6 2.3 5.3 62.8November ....................... 3.9 1.7 23.3 13.4 .0 .4 5.0 6.7 2.2 5.0 61.6December ....................... 4.1 1.8 26.1 13.2 .0 .4 4.6 6.7 2.3 7.2 66.4Total ............................... 43.1 19.3 274.9 145.2 .0 3.7 R 50.4 69.4 22.7 59.4 688.1
1989January ........................... 4.1 1.8 30.5 13.5 .0 .4 4.9 7.2 2.3 6.8 71.5February ......................... 3.4 1.6 27.1 13.5 .0 (s) 4.2 6.5 2.1 6.3 64.7March .............................. 3.6 1.8 27.8 14.8 .0 .2 4.2 6.7 2.3 6.7 68.2April ................................ 3.0 1.7 25.5 13.4 .0 .4 4.8 5.6 2.2 5.9 62.6May ................................. 3.0 1.2 23.2 11.1 .0 .4 4.7 3.9 2.0 5.7 55.2June ................................ 3.0 1.6 23.9 9.6 .0 .4 4.2 3.3 1.2 6.7 53.8July ................................. 3.2 1.4 23.7 8.7 .0 .4 5.4 2.6 1.1 4.8 51.1August ............................ 3.7 1.5 21.0 11.4 .0 .4 5.2 3.3 1.0 4.8 52.2September ...................... 3.3 1.3 22.6 11.4 .0 .4 4.6 5.0 1.9 6.6 57.2October ........................... 3.6 1.4 24.6 13.5 .0 .4 4.7 6.8 2.3 5.2 62.5November ....................... 3.6 1.7 24.9 14.2 .0 .4 4.6 7.0 2.2 5.3 63.9December ....................... 3.6 1.8 27.8 14.4 .0 .4 4.7 7.5 2.3 6.9 69.4Total ............................... 41.2 18.8 302.5 149.6 .0 4.0 56.1 65.6 22.8 71.6 732.2
1990January ........................... 3.9 1.8 28.7 15.4 .0 .3 5.4 7.4 2.3 6.0 71.2February ......................... 3.5 1.6 23.5 12.8 .0 (s) 4.5 6.6 2.1 5.8 60.5March .............................. 4.2 1.7 25.8 13.2 .0 (s) 4.5 6.4 2.3 6.2 64.2April ................................ 3.6 1.7 26.6 12.8 .0 (s) 4.8 5.4 2.2 5.2 62.3May ................................. 2.9 1.3 23.9 12.2 .0 .4 4.1 4.8 2.1 5.2 56.8June ................................ 2.9 1.3 23.3 9.8 .0 .3 3.5 4.3 1.3 5.2 51.9July ................................. 3.5 1.6 23.9 10.0 .0 .4 4.4 2.7 1.7 4.2 52.5August ............................ 3.7 1.2 23.3 9.3 .0 .4 5.0 4.2 1.0 4.9 53.1September ...................... 3.3 1.4 26.5 9.6 .0 .4 4.1 5.2 1.9 5.9 58.3October ........................... 3.4 1.8 27.6 13.0 .0 .4 3.9 6.7 2.3 4.8 63.7November ....................... 3.6 1.7 25.8 13.9 .0 .4 4.7 7.0 2.2 6.0 65.3December ....................... 4.3 1.8 30.4 15.2 .0 .4 5.4 7.4 2.3 6.9 74.1Total ............................... 42.7 18.9 314.1 147.2 .0 3.4 54.3 68.2 23.6 66.1 738.6
1991January ........................... 4.2 1.8 33.5 15.2 .0 .3 5.3 7.6 2.3 6.6 76.9February ......................... 3.9 1.6 30.0 13.6 .0 .2 4.6 6.9 2.1 6.8 69.7March .............................. 4.2 1.8 28.4 14.3 .0 .1 4.3 7.6 2.3 6.7 69.5April ................................ 3.5 1.4 25.3 12.5 .0 .2 4.2 6.9 2.2 5.0 61.1May ................................. 3.4 1.5 25.3 10.6 .0 .4 4.8 5.7 2.0 4.5 58.0June ................................ 2.9 1.6 23.6 10.0 .0 .4 4.4 4.7 1.1 6.1 54.7July ................................. 3.5 1.7 23.9 11.7 .0 .4 4.7 4.6 1.5 5.1 57.1August ............................ 3.8 1.4 24.5 10.0 .0 .4 5.2 5.2 1.0 5.4 56.9September ...................... 3.0 1.3 25.8 10.8 .0 .1 4.5 5.5 1.8 6.6 59.4October ........................... 3.2 1.7 28.4 11.7 .0 (s) 4.7 7.2 2.3 5.9 65.0November ....................... 3.3 1.7 29.8 12.9 .0 .4 4.4 7.3 2.2 5.2 67.3December ....................... 4.0 1.7 32.8 14.2 .0 .4 4.7 7.6 2.3 6.6 74.1Total ............................... 42.9 19.2 331.4 147.3 .0 3.3 55.6 76.8 22.9 70.4 769.7
1992January ........................... 4.3 1.8 33.5 15.6 .0 .4 5.4 7.6 2.3 6.5 77.4February ......................... 4.0 1.7 29.8 15.2 .0 .3 4.6 6.8 2.1 6.3 70.9March .............................. 4.0 1.8 30.7 15.8 .0 .1 4.2 7.1 2.2 8.3 74.1April ................................ 3.4 1.7 28.0 14.1 .0 .1 3.6 6.7 1.9 5.0 64.5May ................................. 3.8 1.3 25.6 11.8 .0 .3 4.3 4.7 1.9 6.0 59.7June ................................ 3.6 1.4 22.4 11.8 .0 .3 4.5 3.9 1.3 7.0 56.2July ................................. 3.1 1.6 23.7 12.0 .0 .4 5.0 3.6 1.7 4.9 56.0August ............................ 3.4 1.4 24.6 10.9 .0 .4 5.2 3.5 1.1 5.5 55.9September ...................... 3.1 1.3 25.6 11.6 .0 .4 4.2 3.9 2.0 6.9 58.8October ........................... 3.6 1.6 28.5 13.2 .0 .4 5.0 5.2 2.3 5.7 65.5November ....................... 3.3 1.7 29.5 13.0 .0 .4 4.4 5.2 2.2 6.1 65.7December ....................... 3.9 1.8 33.1 13.8 .0 .4 5.4 5.4 2.3 10.4 76.5Total ............................... 43.5 19.0 337.6 158.8 .0 3.8 55.8 63.5 23.4 78.5 783.9
a Through December 1990, the data for Germany are for the former WestGermany only. Beginning with January 1991, the data are for the unifiedGermany, i.e., the former East Germany and West Germany.
b In 1987, Italy’s citizens voted for a nuclear power moratorium, which shutdown their nuclear power plants indefinitely.
c Monthly data for the United Kingdom are totals for 4- or 5-week reportingperiods, not calendar months.
R=Revised data. – =Not applicable. (s)=Less than 0.05 billion
kilowatthours. Notes: • Net figures are generally less than gross figures by about 5
percent, the difference being the energy consumed by the generating plantsthemselves. • Monthly data may not sum to annual totals due to independentrounding and because precommercial generation is included in some annualtotals but not in the monthly data. • Data for countries may not sum toregional totals due to independent rounding.
Source: See end of section.
Energy Information Administration/Historical Monthly Energy Review 1973-1992332

Table 10.4d Nuclear Electricity Gross Generation, 1973-1992: Far East and Africa
(Billion Kilowatthours)
India Japan PakistanSouthKorea Taiwan Far East
SouthAfricaa
1973January ............................. 0.2 1.2 (s) – – 1.4 –February ........................... .2 1.0 (s) – – 1.2 –March ................................ .2 1.1 (s) – – 1.3 –April .................................. .2 .8 (s) – – 1.0 –May ................................... .2 .5 .1 – – .7 –June .................................. .2 .4 (s) – – .6 –July ................................... .2 .6 (s) – – .9 –August .............................. .2 .8 .1 – – 1.1 –September ........................ .2 .8 .1 – – 1.1 –October ............................. .3 .8 (s) – – 1.1 –November ......................... .2 .7 (s) – – .9 –December ......................... .2 .7 .0 – – 1.0 –Total ................................. 2.5 9.4 .5 – – 12.3 –
1974January ............................. .2 1.0 .0 – – 1.2 –February ........................... .2 1.2 (s) – – 1.4 –March ................................ .1 1.3 (s) – – 1.5 –April .................................. .1 1.5 .1 – – 1.7 –May ................................... .1 1.0 .1 – – 1.2 –June .................................. .1 1.3 .1 – – 1.5 –July ................................... .1 1.8 (s) – – 1.9 –August .............................. .2 2.1 .1 – – 2.3 –September ........................ .1 2.0 .1 – – 2.1 –October ............................. .2 1.5 .1 – – 1.7 –November ......................... .3 1.9 (s) – – 2.2 –December ......................... .2 2.2 .1 – – 2.5 –Total ................................. 1.9 18.9 .6 – – 21.4 –
1975January ............................. .2 1.9 .1 – – 2.2 –February ........................... .2 1.4 .1 – – 1.7 –March ................................ .2 1.2 (s) – – 1.5 –April .................................. .2 .9 .1 – – 1.2 –May ................................... .3 1.5 (s) – – 1.9 –June .................................. .3 1.2 .0 – – 1.6 –July ................................... .2 1.7 (s) – – 1.9 –August .............................. .1 2.1 (s) – – 2.2 –September ........................ .1 1.9 (s) – – 2.1 –October ............................. .1 2.4 .1 – – 2.6 –November ......................... .1 2.7 (s) – – 2.9 –December ......................... .4 2.2 .1 – – 2.7 –Total ................................. 2.5 21.3 .5 – – 24.4 –
1976January ............................. .3 2.8 .1 – – 3.2 –February ........................... .2 2.6 (s) – – 2.9 –March ................................ .2 2.6 (s) – – 2.8 –April .................................. .2 2.9 .1 – – 3.2 –May ................................... .4 3.4 .1 – – 3.9 –June .................................. .3 2.8 .1 – – 3.2 –July ................................... .3 3.2 (s) – – 3.5 –August .............................. .2 3.5 .0 – – 3.8 –September ........................ .2 3.6 .0 – – 3.8 –October ............................. .3 3.3 (s) – – 3.5 –November ......................... .4 2.8 .1 – – 3.2 –December ......................... .3 3.1 (s) – – 3.4 –Total ................................. 3.2 36.6 .5 – – 40.3 –
1977January ............................. .3 1.9 .1 – – 2.3 –February ........................... .3 1.7 (s) – – 2.0 –March ................................ .3 1.8 (s) – – 2.1 –April .................................. .1 1.8 (s) – – 2.0 –May ................................... .3 2.2 (s) – – 2.5 –June .................................. .3 2.0 (s) (s) – 2.4 –July ................................... .3 2.6 (s) (s) – 2.9 –August .............................. .2 3.0 (s) (s) – 3.2 –September ........................ .2 2.5 (s) (s) – 2.7 –October ............................. .2 2.4 .0 (s) – 2.6 –November ......................... .2 3.1 .0 (s) (s) 3.3 –December ......................... .1 3.3 .0 (s) .1 3.5 –Total ................................. 2.8 28.2 .3 .1 .1 31.5 –
See footnotes at end of table.
Energy Information Administration/Historical Monthly Energy Review 1973-1992 333

Table 10.4d Nuclear Electricity Gross Generation, 1973-1992: Far East and Africa (Continued)
(Billion Kilowatthours)
India Japan PakistanSouthKorea Taiwan Far East
SouthAfricaa
1978January ............................. 0.1 3.3 0.0 0.2 0.2 3.7 –February ........................... .1 2.3 (s) .2 .1 2.6 –March ................................ .2 3.5 (s) .2 .1 4.0 –April .................................. .2 3.8 (s) .3 .2 4.4 –May ................................... .2 4.5 (s) .3 .2 5.2 –June .................................. .2 4.4 (s) .3 .2 5.1 –July ................................... .1 5.7 (s) .3 .3 6.4 –August .............................. .1 5.7 .0 .2 .3 6.4 –September ........................ .2 4.7 .0 .3 .3 5.6 –October ............................. .3 4.5 (s) .2 .2 5.3 –November ......................... .3 4.8 (s) .0 .2 5.3 –December ......................... .3 5.9 (s) .0 .4 6.6 –Total ................................. 2.3 53.1 .2 2.3 2.7 60.6 –
1979January ............................. .4 5.9 (s) .3 .4 7.0 –February ........................... .2 4.8 (s) .4 .3 5.8 –March ................................ .2 4.4 .0 .3 .5 5.4 –April .................................. .2 3.8 .0 .3 .6 4.8 –May ................................... .2 3.7 .0 .2 .5 4.6 –June .................................. .3 4.4 .0 .3 .6 5.7 –July ................................... .3 5.8 .0 .3 .7 7.1 –August .............................. .3 6.6 .0 .4 .6 7.9 –September ........................ .2 5.3 .0 .4 .6 6.6 –October ............................. .3 6.2 .0 .3 .5 7.3 –November ......................... .3 5.4 .0 .0 .3 6.0 –December ......................... .2 5.9 .0 .0 .6 6.6 –Total ................................. 3.2 62.0 (s) 3.2 6.3 74.7 –
1980January ............................. .2 8.0 .0 .1 .9 9.2 –February ........................... .1 7.4 .0 (s) .7 8.2 –March ................................ .2 8.0 .0 .4 .8 9.3 –April .................................. .3 5.6 .0 .4 .7 7.0 –May ................................... .3 6.0 .0 .4 .4 7.1 –June .................................. .2 6.7 .0 .1 .5 7.5 –July ................................... .2 7.8 (s) .4 .8 9.2 –August .............................. .3 8.6 (s) .3 .8 10.0 –September ........................ .3 7.0 (s) .4 .8 8.5 –October ............................. .2 6.0 .0 .4 .8 7.4 –November ......................... .3 5.4 (s) .4 .6 6.7 –December ......................... .2 6.3 (s) .3 .5 7.3 –Total ................................. 2.9 82.8 .1 3.5 8.2 97.4 –
1981January ............................. .2 8.2 (s) .3 .8 9.5 –February ........................... .2 7.1 (s) .0 .7 8.1 –March ................................ .3 7.8 .0 .0 .8 9.0 –April .................................. .3 7.9 .0 .0 .8 9.0 –May ................................... .4 8.0 (s) .2 .8 9.4 –June .................................. .3 6.7 (s) .4 .8 8.2 –July ................................... .3 8.3 (s) .4 .8 9.9 –August .............................. .2 8.5 (s) .4 .8 9.9 –September ........................ .2 6.4 (s) .3 .8 7.7 –October ............................. .2 5.6 (s) .3 1.2 7.4 –November ......................... .2 5.3 (s) .3 1.0 6.9 –December ......................... .3 6.1 (s) .4 1.1 7.9 –Total ................................. 3.1 86.0 .2 2.9 10.7 102.9 –
1982January ............................. .2 8.1 (s) .4 .8 9.6 –February ........................... .2 7.7 (s) .4 1.0 9.3 –March ................................ .2 9.2 .0 .4 1.0 10.7 –April .................................. .2 9.7 .0 .2 .8 10.9 –May ................................... .2 9.5 .0 .0 .8 10.5 –June .................................. .1 9.5 .0 (s) 1.0 10.5 –July ................................... .1 9.8 .0 .3 1.2 11.5 –August .............................. .2 9.7 (s) .4 1.2 11.5 –September ........................ .1 8.0 (s) .4 1.3 9.8 –October ............................. .2 7.5 (s) .4 1.4 9.6 –November ......................... .3 7.8 .0 .4 1.1 9.6 –December ......................... .2 8.1 (s) .4 1.4 10.1 –Total ................................. 2.2 104.5 .1 3.8 13.1 123.6 –
See footnotes at end of table.
Energy Information Administration/Historical Monthly Energy Review 1973-1992334
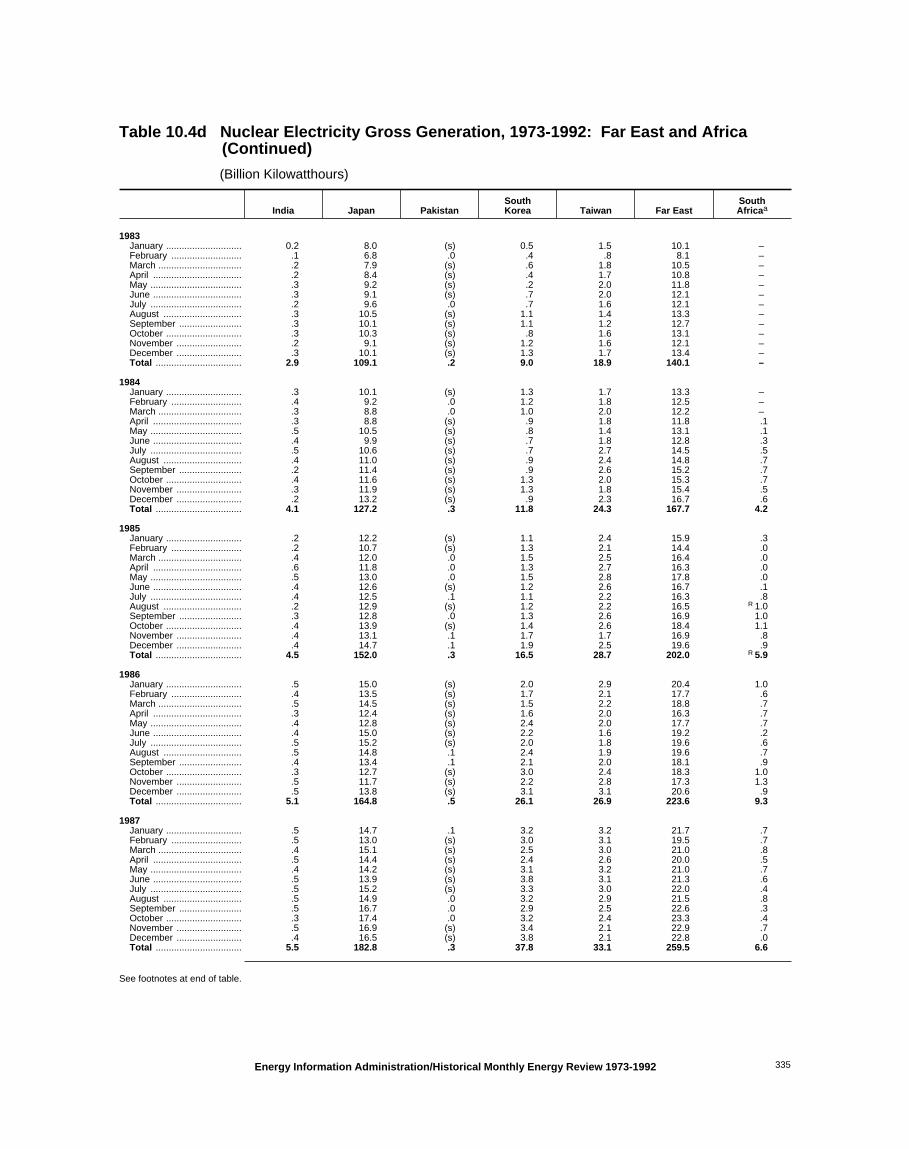
Table 10.4d Nuclear Electricity Gross Generation, 1973-1992: Far East and Africa (Continued)
(Billion Kilowatthours)
India Japan PakistanSouthKorea Taiwan Far East
SouthAfricaa
1983January ............................. 0.2 8.0 (s) 0.5 1.5 10.1 –February ........................... .1 6.8 .0 .4 .8 8.1 –March ................................ .2 7.9 (s) .6 1.8 10.5 –April .................................. .2 8.4 (s) .4 1.7 10.8 –May ................................... .3 9.2 (s) .2 2.0 11.8 –June .................................. .3 9.1 (s) .7 2.0 12.1 –July ................................... .2 9.6 .0 .7 1.6 12.1 –August .............................. .3 10.5 (s) 1.1 1.4 13.3 –September ........................ .3 10.1 (s) 1.1 1.2 12.7 –October ............................. .3 10.3 (s) .8 1.6 13.1 –November ......................... .2 9.1 (s) 1.2 1.6 12.1 –December ......................... .3 10.1 (s) 1.3 1.7 13.4 –Total ................................. 2.9 109.1 .2 9.0 18.9 140.1 –
1984January ............................. .3 10.1 (s) 1.3 1.7 13.3 –February ........................... .4 9.2 .0 1.2 1.8 12.5 –March ................................ .3 8.8 .0 1.0 2.0 12.2 –April .................................. .3 8.8 (s) .9 1.8 11.8 .1May ................................... .5 10.5 (s) .8 1.4 13.1 .1June .................................. .4 9.9 (s) .7 1.8 12.8 .3July ................................... .5 10.6 (s) .7 2.7 14.5 .5August .............................. .4 11.0 (s) .9 2.4 14.8 .7September ........................ .2 11.4 (s) .9 2.6 15.2 .7October ............................. .4 11.6 (s) 1.3 2.0 15.3 .7November ......................... .3 11.9 (s) 1.3 1.8 15.4 .5December ......................... .2 13.2 (s) .9 2.3 16.7 .6Total ................................. 4.1 127.2 .3 11.8 24.3 167.7 4.2
1985January ............................. .2 12.2 (s) 1.1 2.4 15.9 .3February ........................... .2 10.7 (s) 1.3 2.1 14.4 .0March ................................ .4 12.0 .0 1.5 2.5 16.4 .0April .................................. .6 11.8 .0 1.3 2.7 16.3 .0May ................................... .5 13.0 .0 1.5 2.8 17.8 .0June .................................. .4 12.6 (s) 1.2 2.6 16.7 .1July ................................... .4 12.5 .1 1.1 2.2 16.3 .8August .............................. .2 12.9 (s) 1.2 2.2 16.5 R 1.0September ........................ .3 12.8 .0 1.3 2.6 16.9 1.0October ............................. .4 13.9 (s) 1.4 2.6 18.4 1.1November ......................... .4 13.1 .1 1.7 1.7 16.9 .8December ......................... .4 14.7 .1 1.9 2.5 19.6 .9Total ................................. 4.5 152.0 .3 16.5 28.7 202.0 R 5.9
1986January ............................. .5 15.0 (s) 2.0 2.9 20.4 1.0February ........................... .4 13.5 (s) 1.7 2.1 17.7 .6March ................................ .5 14.5 (s) 1.5 2.2 18.8 .7April .................................. .3 12.4 (s) 1.6 2.0 16.3 .7May ................................... .4 12.8 (s) 2.4 2.0 17.7 .7June .................................. .4 15.0 (s) 2.2 1.6 19.2 .2July ................................... .5 15.2 (s) 2.0 1.8 19.6 .6August .............................. .5 14.8 .1 2.4 1.9 19.6 .7September ........................ .4 13.4 .1 2.1 2.0 18.1 .9October ............................. .3 12.7 (s) 3.0 2.4 18.3 1.0November ......................... .5 11.7 (s) 2.2 2.8 17.3 1.3December ......................... .5 13.8 (s) 3.1 3.1 20.6 .9Total ................................. 5.1 164.8 .5 26.1 26.9 223.6 9.3
1987January ............................. .5 14.7 .1 3.2 3.2 21.7 .7February ........................... .5 13.0 (s) 3.0 3.1 19.5 .7March ................................ .4 15.1 (s) 2.5 3.0 21.0 .8April .................................. .5 14.4 (s) 2.4 2.6 20.0 .5May ................................... .4 14.2 (s) 3.1 3.2 21.0 .7June .................................. .5 13.9 (s) 3.8 3.1 21.3 .6July ................................... .5 15.2 (s) 3.3 3.0 22.0 .4August .............................. .5 14.9 .0 3.2 2.9 21.5 .8September ........................ .5 16.7 .0 2.9 2.5 22.6 .3October ............................. .3 17.4 .0 3.2 2.4 23.3 .4November ......................... .5 16.9 (s) 3.4 2.1 22.9 .7December ......................... .4 16.5 (s) 3.8 2.1 22.8 .0Total ................................. 5.5 182.8 .3 37.8 33.1 259.5 6.6
See footnotes at end of table.
Energy Information Administration/Historical Monthly Energy Review 1973-1992 335
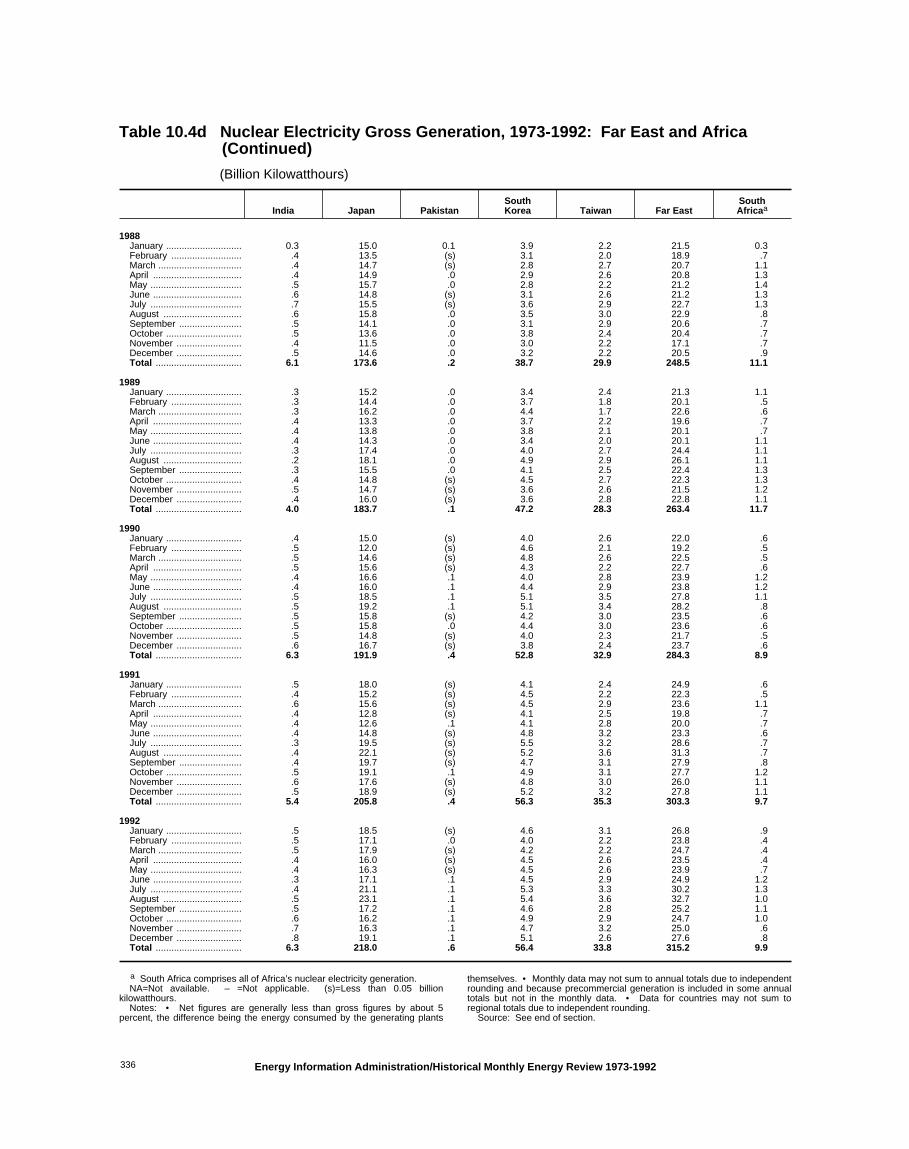
Table 10.4d Nuclear Electricity Gross Generation, 1973-1992: Far East and Africa (Continued)
(Billion Kilowatthours)
India Japan PakistanSouthKorea Taiwan Far East
SouthAfricaa
1988January ............................. 0.3 15.0 0.1 3.9 2.2 21.5 0.3February ........................... .4 13.5 (s) 3.1 2.0 18.9 .7March ................................ .4 14.7 (s) 2.8 2.7 20.7 1.1April .................................. .4 14.9 .0 2.9 2.6 20.8 1.3May ................................... .5 15.7 .0 2.8 2.2 21.2 1.4June .................................. .6 14.8 (s) 3.1 2.6 21.2 1.3July ................................... .7 15.5 (s) 3.6 2.9 22.7 1.3August .............................. .6 15.8 .0 3.5 3.0 22.9 .8September ........................ .5 14.1 .0 3.1 2.9 20.6 .7October ............................. .5 13.6 .0 3.8 2.4 20.4 .7November ......................... .4 11.5 .0 3.0 2.2 17.1 .7December ......................... .5 14.6 .0 3.2 2.2 20.5 .9Total ................................. 6.1 173.6 .2 38.7 29.9 248.5 11.1
1989January ............................. .3 15.2 .0 3.4 2.4 21.3 1.1February ........................... .3 14.4 .0 3.7 1.8 20.1 .5March ................................ .3 16.2 .0 4.4 1.7 22.6 .6April .................................. .4 13.3 .0 3.7 2.2 19.6 .7May ................................... .4 13.8 .0 3.8 2.1 20.1 .7June .................................. .4 14.3 .0 3.4 2.0 20.1 1.1July ................................... .3 17.4 .0 4.0 2.7 24.4 1.1August .............................. .2 18.1 .0 4.9 2.9 26.1 1.1September ........................ .3 15.5 .0 4.1 2.5 22.4 1.3October ............................. .4 14.8 (s) 4.5 2.7 22.3 1.3November ......................... .5 14.7 (s) 3.6 2.6 21.5 1.2December ......................... .4 16.0 (s) 3.6 2.8 22.8 1.1Total ................................. 4.0 183.7 .1 47.2 28.3 263.4 11.7
1990January ............................. .4 15.0 (s) 4.0 2.6 22.0 .6February ........................... .5 12.0 (s) 4.6 2.1 19.2 .5March ................................ .5 14.6 (s) 4.8 2.6 22.5 .5April .................................. .5 15.6 (s) 4.3 2.2 22.7 .6May ................................... .4 16.6 .1 4.0 2.8 23.9 1.2June .................................. .4 16.0 .1 4.4 2.9 23.8 1.2July ................................... .5 18.5 .1 5.1 3.5 27.8 1.1August .............................. .5 19.2 .1 5.1 3.4 28.2 .8September ........................ .5 15.8 (s) 4.2 3.0 23.5 .6October ............................. .5 15.8 .0 4.4 3.0 23.6 .6November ......................... .5 14.8 (s) 4.0 2.3 21.7 .5December ......................... .6 16.7 (s) 3.8 2.4 23.7 .6Total ................................. 6.3 191.9 .4 52.8 32.9 284.3 8.9
1991January ............................. .5 18.0 (s) 4.1 2.4 24.9 .6February ........................... .4 15.2 (s) 4.5 2.2 22.3 .5March ................................ .6 15.6 (s) 4.5 2.9 23.6 1.1April .................................. .4 12.8 (s) 4.1 2.5 19.8 .7May ................................... .4 12.6 .1 4.1 2.8 20.0 .7June .................................. .4 14.8 (s) 4.8 3.2 23.3 .6July ................................... .3 19.5 (s) 5.5 3.2 28.6 .7August .............................. .4 22.1 (s) 5.2 3.6 31.3 .7September ........................ .4 19.7 (s) 4.7 3.1 27.9 .8October ............................. .5 19.1 .1 4.9 3.1 27.7 1.2November ......................... .6 17.6 (s) 4.8 3.0 26.0 1.1December ......................... .5 18.9 (s) 5.2 3.2 27.8 1.1Total ................................. 5.4 205.8 .4 56.3 35.3 303.3 9.7
1992January ............................. .5 18.5 (s) 4.6 3.1 26.8 .9February ........................... .5 17.1 .0 4.0 2.2 23.8 .4March ................................ .5 17.9 (s) 4.2 2.2 24.7 .4April .................................. .4 16.0 (s) 4.5 2.6 23.5 .4May ................................... .4 16.3 (s) 4.5 2.6 23.9 .7June .................................. .3 17.1 .1 4.5 2.9 24.9 1.2July ................................... .4 21.1 .1 5.3 3.3 30.2 1.3August .............................. .5 23.1 .1 5.4 3.6 32.7 1.0September ........................ .5 17.2 .1 4.6 2.8 25.2 1.1October ............................. .6 16.2 .1 4.9 2.9 24.7 1.0November ......................... .7 16.3 .1 4.7 3.2 25.0 .6December ......................... .8 19.1 .1 5.1 2.6 27.6 .8Total ................................. 6.3 218.0 .6 56.4 33.8 315.2 9.9
a South Africa comprises all of Africa’s nuclear electricity generation.NA=Not available. – =Not applicable. (s)=Less than 0.05 billion
kilowatthours. Notes: • Net figures are generally less than gross figures by about 5
percent, the difference being the energy consumed by the generating plants
themselves. • Monthly data may not sum to annual totals due to independentrounding and because precommercial generation is included in some annualtotals but not in the monthly data. • Data for countries may not sum toregional totals due to independent rounding.
Source: See end of section.
Energy Information Administration/Historical Monthly Energy Review 1973-1992336

International Energy Notes and Sources
Notes:1. Crude Oil Production: For 1973-1980, the sourcesused for non-U.S. data were Petroleum IntelligenceWeekly (PIW) and Oil and Gas Journal (OGJ). PIW waschosen over OGJ as the source for members of theOrganization of Petroleum Exporting Countries(OPEC), 1973-1976, when the average of the PIWmonthly values was closer to the annual value reportedin OPEC’s Annual Statistical Bulletin. All other datawere taken from OGJ. Where data were not availablefor a country, they were "straight-lined" from the an-nual value. Monthly data for each country and yearwere then adjusted by multiplying them by the ratio ofthe annual value to the weighted average of themonthly values for that country and year.
2. Petroleum Consumption: For 1974-1981, non-U.S.quarterly data were derived from data in the Interna-tional Energy Agency (IEA) Quarterly Oil Statistics.Data were converted from units of thousand metric tonsto thousand barrels per day by using conversion factorslisted in the Energy Information Administration (EIA)International Energy Annual 1989. Where the first threequarters of data were not available for a country, theywere "straight-lined" from the fourth-quarter value.Quarterly data for each country and year were thenadjusted by multiplying them by the ratio of the annualvalue to the weighted average of the quarterly valuesfor that country and year.
3. Petroleum Stocks: For 1974-1982, non-U.S. quarterlydata were derived from data in the IEA Quarterly OilStatistics. Data were converted from units of thousandmetric tons to million barrels by using conversion fac-tors listed in the EIA International Energy Annual 1989.Where the first three quarters of data were not availablefor a country, they were "straight-lined" from thefourth-quarter value.
Data for Japan in the first three quarters of 1974 and 1975are estimates. Quarterly Oil Statistics is missing data forLPG stocks and refinery feedstocks for Japan in thistime period. Fourth-quarter values for LPG stocks andrefinery feedstocks were calculated by using stockchange figures in the IEA Energy Statistics 1970/1985.Stock values for LPG and refinery feedstocks in the firstthree quarters of these two years were "straight-lined"from the fourth-quarter values. Total petroleum stockswere then calculated by adding the stock values of allrefined products, crude oil, and refinery feedstocks.
4. OPEC and Ecuador: Although Ecuador belonged tothe Organization of Petroleum Exporting Countries
(OPEC) from November 19, 1973, until December 31,1992, when it formally withdrew, it is not included in"Total OPEC" in Table 10.1b.
5. Nuclear Electricity Generation: The following areestimated 1992 values (in billion kilowatthours) for nu-clear electricity gross generation in Eastern Europe andthe former U.S.S.R.:
Bulgaria 12.2 Russia 125.6Czech Republic 12.9 Slovakia 11.7Hungary 13.8 Slovenia 4.0Kazakhstan 0.5 Ukraine 74.6Lithuania 16.4
Total Eastern Europe: 271.5
Sources:
Tables 10.1a and 10.1b• Annual Data: United States—Table 3.1a. All OtherSeries, 1973-1976—Energy Information Administra-tion (EIA), International Energy Annual 1983, Table 8 andEIA revisions. All Other Series, 1977-1979—EIA, Inter-national Energy Annual 1987, Table 1. All Other Series,1980-1982—EIA, International Energy Annual 1989,Table 1. All Other Series, 1983-1992—EIA, InternationalEnergy Annual 1992, Table 1 and EIA revisions.
• Monthly Data: United States—Table 3.1a. All OtherSeries, 1973-1980—Petroleum Intelligence Weekly, Oil andGas Journal, and EIA adjustments to data; see Note 1.All Other Series, 1981-1992—Petroleum IntelligenceWeekly, Oil and Gas Journal, and other industry sources.
Table 10.2• Annual Data: United States—Table 3.1a. All OtherSeries, 1973-1977—International Energy Agency (IEA),Oil Statistics. All Other Series, 1978 and 1979—IEA,Annual Oil and Gas Statistics. All Other Series, 1980-1982—EIA, International Energy Annual 1989, Table 8.All Other Series, 1983-1992—EIA, International EnergyAnnual 1992, Table 8 and EIA revisions.
• Quarterly Data: United States, 1974-1981—Table3.1a. All Other Series, 1974-1981—IEA, Quarterly OilStatistics, and EIA adjustments to data; see Note 2.
• Monthly Data: United States, 1982-1992—Table 3.1a.All Other Series, 1982-1988—IEA, quarterly andmonthly computer tapes supporting Quarterly Oil andGas Statistics. 1988-1992—IEA, quarterly and monthlycomputer tapes supporting Quarterly Oil Statistics andEnergy Balances.
Table 10.3• United States—Table 3.1a.
Energy Information Administration/Historical Monthly Energy Review 1973-1992 337

• All Other Series, 1973-1982—IEA, Quarterly Oil Sta-tistics and Energy Statistics 1970/1985; see Note 3. 1983-1988—IEA, quarterly and monthly computer tapessupporting Quarterly Oil and Gas Statistics. 1988-1992—IEA, quarterly and monthly computer tapes supportingQuarterly Oil Statistics and Energy Balances.
Table 10.4 (a,b,c and d)McGraw-Hill Publishing Company, Nucleonics Week.
Energy Information Administration/Historical Monthly Energy Review 1973-1992338

The thermal conversion factors presented in the follow-ing eight tables can be used to estimate the heat contentin British thermal units (Btu) of a given amount ofenergy measured in physical units, such as barrels orcubic feet. For example, 10 barrels of asphalt have aheat content of approximately 66.36 million Btu (10barrels x 6.636 million Btu/barrel = 66.36 million Btu).
Thermal conversion factors for hydrocarbon mixes (TableA1) are weighted averages of the thermal conversion
factors for each hydrocarbon included in the mix. Forexample, in calculating the thermal conversion factorfor a 60-40 butane-propane mixture, the thermalconversion factor for butane is weighted 1.5 timesmore heavily than the thermal conversion factor forpropane.
The source of each factor is described in the sectionentitled "Thermal Conversion Factor Source Documen-tation," which follows Table A8 in this appendix.
a 60 percent butane and 40 percent propane.b 70 percent ethane and 30 percent propane.Source: See “Thermal Conversion Factor Source Documentation,” which follows Table A8.
Petroleum Product Petroleum Product
Asphalt 6.636 Petrochemical FeedstocksAviation Gasoline 5.048 Naphtha Less Than 401o F 5.248Butane 4.326 Other Oils Equal to or Greater Than 401o F 5.825Butane-Propane Mixturea 4.130 Still Gas 6.000Distillate Fuel Oil 5.825 Petroleum Coke 6.024Ethane 3.082 Plant Condensate 5.418Ethane-Propane Mixtureb 3.308 Propane 3.836Isobutane 3.974 Residual Fuel Oil 6.287Jet Fuel, Kerosene Type 5.670 Road Oil 6.636Jet Fuel, Naphtha Type 5.355 Special Naphthas 5.248Kerosene 5.670 Still Gas 6.000Lubricants 6.065 Unfinished Oils 5.825Motor Gasoline 5.253 Unfractionated Stream 5.418Natural Gasoline and Isopentane 4.620 Waxes 5.537Pentanes Plus 4.620 Miscellaneous 5.796
Heat ContentHeat Content
Table A1. Approximate Heat Content of Petroleum Products
(Million Btu per Barrel)
Appendix A. Thermal Conversion Factors
Energy Information Administration/Historical Monthly Energy Review 1973-1992 339

Table A2. Approximate Heat Content of Crude Oil, Crude Oil and Products, and Natural Gas Plant Liquids, 1973-1992 (Million Btu per Barrel)
Crude Oil Crude Oil and Products Natural GasPlant LiquidsProductionProduction Imports Exports Imports Exports
1973 ................................ 5.800 5.817 5.800 5.897 5.752 4.0491974 ................................ 5.800 5.827 5.800 5.884 5.774 4.0111975 ................................ 5.800 5.821 5.800 5.858 5.748 3.9841976 ................................ 5.800 5.808 5.800 5.856 5.745 3.9641977 ................................ 5.800 5.810 5.800 5.834 5.797 3.9411978 ................................ 5.800 5.802 5.800 5.839 5.808 3.9251979 ................................ 5.800 5.810 5.800 5.810 5.832 3.9551980 ................................ 5.800 5.812 5.800 5.796 5.820 3.9141981 ................................ 5.800 5.818 5.800 5.775 5.821 3.9301982 ................................ 5.800 5.826 5.800 5.775 5.820 3.8721983 ................................ 5.800 5.825 5.800 5.774 5.800 3.8391984 ................................ 5.800 5.823 5.800 5.745 5.850 3.8121985 ................................ 5.800 5.832 5.800 5.736 5.814 3.8151986 ................................ 5.800 5.903 5.800 5.808 5.832 3.7971987 ................................ 5.800 5.901 5.800 5.820 5.858 3.8041988 ................................ 5.800 5.900 5.800 5.820 5.840 3.8001989 ................................ 5.800 5.906 5.800 5.833 5.857 3.8261990 ................................ 5.800 5.934 5.800 5.849 5.833 3.8221991 ................................ 5.800 5.948 5.800 5.873 5.823 3.8071992 ................................ 5.800 5.953 5.800 5.877 5.777 3.804
Note: Crude oil includes lease condensate.Source: See "Thermal Conversion Factor Source Documentation," which follows Table A8.
Table A3. Approximate Heat Content of Petroleum Products, Weighted Averages, 1973-1992 (Million Btu per Barrel)
Consumption
Imports ExportsLPG
Consumption
Residentialand
Commercial Industrial TransportationElectricUtilities Total
1973 ........................ 5.387 5.568 5.395 6.245 5.515 5.983 5.752 3.7461974 ........................ 5.377 5.538 5.394 6.238 5.504 5.959 5.773 3.7301975 ........................ 5.358 5.528 5.392 6.250 5.494 5.935 5.747 3.7151976 ........................ 5.383 5.538 5.395 6.251 5.504 5.980 5.743 3.7111977 ........................ 5.389 5.555 5.400 6.249 5.518 5.908 5.796 3.6771978 ........................ 5.382 5.553 5.404 6.251 5.519 5.955 5.814 3.6691979 ........................ 5.471 5.418 5.428 6.258 5.494 5.811 5.864 3.6801980 ........................ 5.468 5.376 5.440 6.254 5.479 5.748 5.841 3.6741981 ........................ 5.409 5.313 5.432 6.258 5.448 5.659 5.837 3.6431982 ........................ 5.392 5.263 5.422 6.258 5.415 5.664 5.829 3.6151983 ........................ 5.286 5.273 5.415 6.255 5.406 5.677 5.800 3.6141984 ........................ R 5.384 R 5.223 R 5.422 6.251 5.395 5.613 5.867 3.5991985 ........................ R 5.326 R 5.221 R 5.423 6.247 5.387 5.572 5.819 3.6031986 ........................ R 5.357 R 5.286 R 5.427 6.257 5.418 5.624 5.839 3.6401987 ........................ R 5.316 R 5.253 R 5.430 6.249 5.403 5.599 5.860 3.6591988 ........................ R 5.320 R 5.248 R 5.434 6.250 5.410 5.618 5.842 3.6521989 ........................ 5.257 5.233 5.440 6.241 5.410 5.641 5.869 3.6831990 ........................ 5.208 5.272 5.445 6.247 5.411 5.614 5.838 3.6251991 ........................ 5.163 5.192 5.442 6.248 5.384 5.636 5.827 3.6141992 ........................ 5.169 5.188 5.445 6.243 5.378 5.623 5.774 3.624
R=Revised data.Note: Weighted averages of the products included in each category are calculated by using heat content values shown in Table A1.Source: See "Thermal Conversion Factor Source Documentation," which follows Table A8.
Energy Information Administration/Historical Monthly Energy Review 1973-1992340

Table A5. Approximate Heat Content of Coal, 1973-1992 (Million Btu per Short Ton)
Production
Consumption
Imports Exports
Residentialand
CommercialCokePlants
OtherIndustriala
ElectricUtilitiesb Total
1973 ........................ 23.376 22.831 26.780 22.586 22.246 23.057 25.000 26.5961974 ........................ 23.072 22.479 26.778 22.419 21.781 22.677 25.000 26.7001975 ........................ 22.897 22.261 26.782 22.436 21.642 22.506 25.000 26.5621976 ........................ 22.855 22.774 26.781 22.530 21.679 22.498 25.000 26.6011977 ........................ 22.597 22.919 26.787 22.322 21.508 22.265 25.000 26.5481978 ........................ 22.248 22.466 26.789 22.207 21.275 22.017 25.000 26.4781979 ........................ 22.454 22.242 26.788 22.452 21.364 22.100 25.000 26.5481980 ........................ 22.415 22.543 26.790 22.690 21.295 21.947 25.000 26.3841981 ........................ 22.308 22.474 26.794 22.585 21.085 21.713 25.000 26.1601982 ........................ 22.239 22.695 26.797 22.712 21.194 21.674 25.000 26.2231983 ........................ 22.052 22.775 26.798 22.691 21.133 21.576 25.000 26.2911984 ........................ 22.010 22.844 26.799 22.543 21.101 21.573 25.000 26.4021985 ........................ 21.870 22.646 26.798 22.020 20.959 21.366 25.000 26.3071986 ........................ 21.913 22.947 26.798 22.198 21.084 21.462 25.000 26.2921987 ........................ 21.922 23.404 26.799 22.381 21.136 21.517 25.000 26.2911988 ........................ 21.823 23.571 26.799 22.360 20.900 21.328 25.000 26.2991989 ........................ 21.765 23.650 26.800 22.347 20.848 21.272 25.000 26.1601990 ........................ 21.822 23.137 26.799 22.457 20.929 21.331 25.000 26.2021991 ........................ 21.681 23.114 26.799 22.460 20.755 21.146 25.000 26.1881992 ........................ 21.646 23.105 26.799 22.250 20.787 21.143 25.000 26.161
a Includes transportation.b Data shown in this column are not the same as those shown in the Electric Power Monthly (EPM). The EPM data report coal receipts; the data shown here
represent coal consumption.Source: See "Thermal Conversion Factor Source Documentation," which follows Table A8.
Table A4. Approximate Heat Content of Natural Gas, 1973-1992 (Btu per Cubic Foot)
Production Consumption
Imports ExportsDryMarketed
(Wet)
Sectors OtherThan Electric
UtilitiesElectricUtilities Total
1973 ........................ 1,021 1,093 1,020 1,024 1,021 1,026 1,0231974 ........................ 1,024 1,097 1,024 1,022 1,024 1,027 1,0161975 ........................ 1,021 1,095 1,020 1,026 1,021 1,026 1,0141976 ........................ 1,020 1,093 1,019 1,023 1,020 1,025 1,0131977 ........................ 1,021 1,093 1,019 1,029 1,021 1,026 1,0131978 ........................ 1,019 1,088 1,016 1,034 1,019 1,030 1,0131979 ........................ 1,021 1,092 1,018 1,035 1,021 1,037 1,0131980 ........................ 1,026 1,098 1,024 1,035 1,026 1,022 1,0131981 ........................ 1,027 1,103 1,025 1,035 1,027 1,014 1,0111982 ........................ 1,028 1,107 1,026 1,036 1,028 1,018 1,0111983 ........................ 1,031 1,115 1,031 1,030 1,031 1,024 1,0101984 ........................ 1,031 1,109 1,030 1,035 1,031 1,005 1,0101985 ........................ 1,032 1,112 1,031 1,038 1,032 1,002 1,0111986 ........................ 1,030 1,110 1,029 1,034 1,030 997 1,0081987 ........................ 1,031 1,112 1,031 1,032 1,031 999 1,0111988 ........................ 1,029 1,109 1,029 1,028 1,029 1,002 1,0181989 ........................ 1,031 1,107 1,031 1,030 1,031 1,004 1,0191990 ........................ 1,031 1,105 1,030 1,034 1,031 1,012 1,0181991 ........................ 1,030 1,108 1,031 1,024 1,030 1,014 1,0221992 ........................ 1,030 1,110 1,031 1,022 1,030 1,011 1,018
Source: See "Thermal Conversion Factor Source Documentation," which follows Table A8.
Energy Information Administration/Historical Monthly Energy Review 1973-1992 341

Table A7. Approximate Heat Content of Anthracite and Coal Coke, 1973-1992 (Million Btu per Short Ton)
Anthracite
Coal CokeImports
andExportsProduction
Consumption
Importsand
Exports
Sectors OtherThan Electric
Utilities Electric Utilities Total
1973 ................................ 22.132 22.674 17.920 21.464 25.400 24.8001974 ................................ 21.711 22.330 17.200 20.919 25.400 24.8001975 ................................ 21.582 22.272 17.064 20.762 25.400 24.8001976 ................................ 22.045 22.618 17.526 21.254 25.400 24.8001977 ................................ 22.661 24.101 17.244 22.066 25.400 24.8001978 ................................ 23.079 24.388 17.104 22.398 25.400 24.8001979 ................................ 23.170 24.272 17.454 22.069 25.400 24.8001980 ................................ 22.869 22.719 17.652 21.405 25.400 24.8001981 ................................ 23.291 23.749 18.168 22.080 25.400 24.8001982 ................................ 23.289 24.578 18.160 22.518 25.400 24.8001983 ................................ 22.734 24.536 16.516 21.583 25.400 24.8001984 ................................ 23.107 25.128 17.018 22.322 25.400 24.8001985 ................................ 22.428 23.031 16.784 20.817 25.400 24.8001986 ................................ 23.084 24.399 15.578 21.512 25.400 24.8001987 ................................ 23.108 26.293 15.962 22.435 25.400 24.8001988 ................................ 23.266 26.021 17.312 22.423 25.400 24.8001989 ................................ 23.385 27.196 16.310 22.623 25.400 24.8001990 ................................ 22.574 25.199 16.140 21.668 25.400 24.8001991 ................................ 22.573 25.268 15.858 21.410 25.400 24.8001992 ................................ 22.572 24.617 16.944 21.423 25.400 24.800
Source: See "Thermal Conversion Factor Source Documentation," which follows Table A8.
Table A6. Approximate Heat Content of Bituminous Coal and Lignite, 1973-1992 (Million Btu per Short Ton)
Production
Consumption
Imports Exports
Residentialand
CommercialCokePlants
OtherIndustriala
ElectricUtilities Total
1973 ........................ 23.391 22.887 26.800 22.585 22.262 23.073 25.000 26.6121974 ........................ 23.087 22.523 26.800 22.420 21.799 22.694 25.000 26.7161975 ........................ 22.910 22.258 26.800 22.439 21.659 22.522 25.000 26.5731976 ........................ 22.863 22.819 26.800 22.528 21.692 22.509 25.000 26.6131977 ........................ 22.597 22.594 26.800 22.290 21.521 22.266 25.000 26.5611978 ........................ 22.242 22.078 26.800 22.175 21.284 22.014 25.000 26.5011979 ........................ 22.449 21.884 26.800 22.436 21.372 22.100 25.000 26.5701980 ........................ 22.411 22.488 26.800 22.690 21.301 21.950 25.000 26.4041981 ........................ 22.301 22.010 26.800 22.572 21.091 21.710 25.000 26.1761982 ........................ 22.233 22.226 26.800 22.695 21.200 21.670 25.000 26.2311983 ........................ 22.048 22.438 26.800 22.680 21.141 21.576 25.000 26.3001984 ........................ 22.005 22.406 26.800 22.525 21.108 21.570 25.000 26.4101985 ........................ 21.867 22.568 26.800 22.013 20.965 21.368 25.000 26.3201986 ........................ 21.908 22.669 26.800 22.185 21.091 21.462 25.000 26.3081987 ........................ 21.918 22.800 26.800 22.360 21.143 21.514 25.000 26.3041988 ........................ 21.817 23.135 26.800 22.341 20.905 21.324 25.000 26.3081989 ........................ 21.759 22.917 26.800 22.324 20.854 21.268 25.000 26.1661990 ........................ 21.819 22.678 26.800 22.444 20.935 21.330 25.000 26.2071991 ........................ 21.678 22.635 26.800 22.448 20.761 21.146 25.000 26.1921992 ........................ 21.643 22.768 26.800 22.242 20.792 21.142 25.000 26.165
a Includes transportation.Source: See "Thermal Conversion Factor Source Documentation," which follows Table A8.
Energy Information Administration/Historical Monthly Energy Review 1973-1992342

Table A8. Approximate Heat Rates for Electricity, 1973-1992 (Btu per Kilowatthour)
Electricity Generation
ElectricityConsumption
Fossil-FueledSteam-Electric
Plantsa
NuclearSteam-Electric
Plants
GeothermalEnergyPlants
1973 ................................................ 10,389 10,903 21,674 3,4121974 ................................................ 10,442 11,161 21,674 3,4121975 ................................................ 10,406 11,013 21,611 3,4121976 ................................................ 10,373 11,047 21,611 3,4121977 ................................................ 10,435 10,769 21,611 3,4121978 ................................................ 10,361 10,941 21,611 3,4121979 ................................................ 10,353 10,879 21,545 3,4121980 ................................................ 10,388 10,908 21,639 3,4121981 ................................................ 10,453 11,030 21,639 3,4121982 ................................................ 10,454 11,073 21,629 3,4121983 ................................................ 10,520 10,905 21,290 3,4121984 ................................................ R 10,440 10,843 21,303 3,4121985 ................................................ R 10,447 10,813 21,263 3,4121986 ................................................ R 10,446 10,799 21,263 3,4121987 ................................................ R 10,419 10,776 21,263 3,4121988 ................................................ R 10,324 10,743 21,096 3,4121989 ................................................ 10,317 10,724 21,096 3,4121990 ................................................ 10,335 10,680 21,096 3,4121991 ................................................ 10,352 10,740 20,997 3,4121992b .............................................. 10,302 10,678 20,955 3,412
a This thermal conversion factor is used for hydroelectric power generation and for biomass fuels, wind, photovoltaic, and solar thermal energy consumed atelectric utilities.
b Preliminary.R=Revised data.Source: See "Thermal Conversion Factor Source Documentation," which follows this table.
Thermal Conversion FactorSource Documentation
Approximate Heat Content of Petroleumand Natural Gas Plant Liquids
Asphalt. The Energy Information Administration(EIA) adopted the thermal conversion factor of 6.636million British thermal units (Btu) per barrel as esti-mated by the Bureau of Mines and first published in thePetroleum Statement, Annual, 1956.
Aviation Gasoline. EIA adopted the Bureau of Minesthermal conversion factor of 5.048 million Btu per barrelfor “Gasoline, Aviation” as published by the TexasEastern Transmission Corporation in Appendix V ofCompetition and Growth in American Energy Markets1947-1985, a 1968 release of historical and projectedstatistics.
Butane. EIA adopted the Bureau of Mines thermalconversion factor of 4.326 million Btu per barrel in theCalifornia Oil World and Petroleum Industry, First Issue,April 1942.
Butane-Propane Mixture. EIA adopted the Bureau ofMines calculation of 4.130 million Btu per barrel basedon an assumed mixture of 60 percent butane and 40percent propane. See Butane and Propane.
Crude Oil, Exports. Assumed by EIA to be 5.800 mil-lion Btu per barrel or equal to the thermal conversion
factor for crude oil produced in the United States. SeeCrude Oil and Lease Condensate, Production.
Crude Oil, Imports. Calculated annually by EIA byweighting the thermal conversion factor of each type ofcrude oil imported by the quantity imported. Thermalconversion factors for each type were calculated on aforeign country basis, by determining the averageAmerican Petroleum Institute (API) gravity of crudeimported from each foreign country from Form ERA-60in 1977 and converting average API gravity to averageBtu content by using National Bureau of Standards,Miscellaneous Publication No. 97, Thermal Properties ofPetroleum Products, 1933.
Crude Oil and Lease Condensate, Production. EIAadopted the thermal conversion factor of 5.800 millionBtu per barrel as reported in a Bureau of Mines internalmemorandum, “Bureau of Mines Standard AverageHeating Values of Various Fuels, Adopted January 3,1950.”
Crude Oil and Petroleum Products, Exports. Calcu-lated annually by EIA as the average of the thermalconversion factors for each petroleum product ex-ported and crude oil exported weighted by the quantityof each petroleum product and crude oil exported. SeeCrude Oil, Exports and Petroleum Products, Exports.
Crude Oil and Petroleum Products, Imports. Calcu-lated annually by EIA as the average of the thermalconversion factors for each petroleum product and eachtype of crude oil imported weighted by the quantity of
Energy Information Administration/Historical Monthly Energy Review 1973-1992 343

each petroleum product and each type of crude oilimported. See Crude Oil, Imports and PetroleumProducts, Imports.
Distillate Fuel Oil. EIA adopted the Bureau of Minesthermal conversion factor of 5.825 million Btu per barrelas reported in a Bureau of Mines internal memoran-dum, “Bureau of Mines Standard Average HeatingValue of Various Fuels, Adopted January 3, 1950.”
Ethane. EIA adopted the Bureau of Mines thermalconversion factor of 3.082 million Btu per barrel in theCalifornia Oil World and Petroleum Industry, First Issue,April 1942.
Ethane-Propane Mixture. EIA calculated 3.308 millionBtu per barrel based on an assumed mixture of 70percent ethane and 30 percent propane. See Ethane andPropane.
Isobutane. EIA adopted the Bureau of Mines thermalconversion factor of 3.974 million Btu per barrel in theCalifornia Oil World and Petroleum Industry, First Issue,April 1942.
Jet Fuel, Kerosene Type. EIA adopted the Bureau ofMines thermal conversion factor of 5.670 million Btuper barrel for “Jet Fuel, Commercial” as published bythe Texas Eastern Transmission Corporation in Appen-dix V of Competition and Growth in American EnergyMarkets 1947-1985, a 1968 release of historical and pro-jected statistics.
Jet Fuel, Naphtha Type. EIA adopted the Bureau ofMines thermal conversion factor of 5.355 million Btuper barrel for “Jet Fuel, Military” as published by theTexas Eastern Transmission Corporation in AppendixV of Competition and Growth in American Energy Markets1947-1985, a 1968 release of historical and projectedstatistics.
Kerosene. EIA adopted the Bureau of Mines thermalconversion factor of 5.670 million Btu per barrel asreported in a Bureau of Mines internal memorandum,“Bureau of Mines Standard Average Heating Values ofVarious Fuels, Adopted January 3, 1950.”
Liquefied Petroleum Gases (LPG) Consumption. Cal-culated annually by EIA as the average of the thermalconversion factors of each liquefied petroleum gas con-sumed, weighted by the quantity of each liquefied pe-troleum gas consumed.
Lubricants. EIA adopted the thermal conversion factorof 6.065 million Btu per barrel as estimated by theBureau of Mines and first published in the PetroleumStatement, Annual, 1956.
Miscellaneous Products. EIA adopted the thermalconversion factor of 5.796 million Btu per barrel as
estimated by the Bureau of Mines and first published inthe Petroleum Statement, Annual, 1956.
Motor Gasoline. EIA adopted the Bureau of Minesthermal conversion factor of 5.253 million Btu per barrelfor “Gasoline, Motor Fuel” by the Texas Eastern Trans-mission Corporation in Appendix V of Competition andGrowth in American Energy Markets 1947-1985, a 1968release of historical and projected statistics.
Natural Gas Plant Liquids, Production. Calculatedannually by EIA as the average of the thermal conver-sion factors of each natural gas plant liquid produced,weighted by the quantity of each natural gas plantliquid produced.
Natural Gasoline. EIA adopted the thermal conver-sion factor of 4.620 million Btu per barrel as estimatedby the Bureau of Mines and first published in the Petro-leum Statement, Annual, 1956.
Pentanes Plus. EIA assumed the thermal conversionfactor to be 4.620 million Btu per barrel or equal to thatfor natural gasoline. See Natural Gasoline.
Petrochemical Feedstocks, Naphtha Less Than 401Degrees Fahrenheit. Assumed by EIA to be 5.248 mil-lion Btu per barrel, equal to the thermal conversionfactor for special naphthas. See Special Naphthas.
Petrochemical Feedstocks, Oils Equal to or GreaterThan 401 Degrees Fahrenheit. Assumed by EIA to be5.825 million Btu per barrel, equal to the thermal con-version factor for distillate fuel oil. See Distillate FuelOil.
Petrochemical Feedstocks, Still Gas. Assumed by EIAto be 6.000 million Btu per barrel, equal to the thermalconversion factor for still gas. See Still Gas.
Petroleum Coke. EIA adopted the thermal conversionfactor of 6.024 million Btu per barrel as reported in Btuper short ton in the Bureau of Mines internal memoran-dum, “Bureau of Mines Standard Average HeatingValue of Various Fuels, Adopted January 3, 1950.” TheBureau of Mines calculated this factor by dividing30,120,000 Btu per short ton, as given in the referencedBureau of Mines internal memorandum, by 5.0 barrelsper short ton, as given in the Bureau of Mines Form6-1300-M and successor EIA forms.
Petroleum Products, Total Consumption. Calculatedannually by EIA as the average of the thermal conver-sion factors for all petroleum products consumed,weighted by the quantity of each petroleum productconsumed.
Petroleum Products, Consumption by Electric Utili-ties. Calculated annually by EIA as the average of thethermal conversion factors for all petroleum productsconsumed at electric utilities, weighted by the quantity
Energy Information Administration/Historical Monthly Energy Review 1973-1992344

of each petroleum product consumed at electric utili-ties. The quantity of petroleum consumed is estimatedin the State Energy Data System as documented in theState Energy Data Report.
Petroleum Products, Consumption by IndustrialUsers. Calculated annually by EIA as the average of thethermal conversion factors for all petroleum productsconsumed in the industrial sector, weighted by theestimated quantity of each petroleum product con-sumed in the industrial sector. The quantity of petro-leum products consumed is estimated in the StateEnergy Data System as documented in the State EnergyData Report.
Petroleum Products, Consumption by Residentialand Commercial Users. Calculated annually by EIA asthe average of the thermal conversion factors for allpetroleum products consumed by the residential andcommercial sector, weighted by the estimated quantityof each petroleum product consumed in the residentialand commercial sector. The quantity of petroleumproducts consumed is estimated in the State EnergyData System as documented in the State Energy DataReport.
Petroleum Products, Consumption by TransportationUsers. Calculated annually by EIA as the average of thethermal conversion factor for all petroleum productsconsumed in the transportation sector, weighted by theestimated quantity of each petroleum product con-sumed in the transportation sector. The quantity ofpetroleum products consumed is estimated in the StateEnergy Data System as documented in the State EnergyData Report.
Petroleum Products, Exports. Calculated annually byEIA as the average of the thermal conversion factors foreach petroleum product, weighted by the quantity ofeach petroleum product exported.
Petroleum Products, Imports. Calculated annually byEIA as the average of the thermal conversion factors foreach petroleum product imported, weighted by thequantity of each petroleum product imported.
Plant Condensate. Estimated to be 5.418 million Btuper barrel by EIA from data provided by McClanahanConsultants, Inc., Houston, Texas.
Propane. EIA adopted the Bureau of Mines thermalconversion factor of 3.836 million Btu per barrel in theCalifornia Oil World and Petroleum Industry, First Issue,April 1942.
Residual Fuel Oil. EIA adopted the thermal conver-sion factor of 6.287 million Btu per barrel as reported inthe Bureau of Mines internal memorandum, “Bureau ofMines Standard Average Heating Values of VariousFuels, Adopted January 3, 1950.”
Road Oil. EIA adopted the Bureau of Mines thermalconversion factor of 6.636 million Btu per barrel, whichwas assumed to be equal to that of asphalt (see Asphalt)and was first published by the Bureau of Mines in thePetroleum Statement, Annual, 1970.
Special Naphthas. EIA adopted the Bureau of Minesthermal conversion factor of 5.248 million Btu per bar-rel, which was assumed to be equal to that of totalgasoline (aviation and motor) factor and was first pub-lished in the Petroleum Statement, Annual, 1970.
Still Gas. EIA adopted the Bureau of Mines estimatedthermal conversion factor of 6.000 million Btu per barreland first published in the Petroleum Statement, Annual,1970.
Unfinished Oil. EIA assumed the thermal conversionfactor to be 5.825 million Btu per barrel or equal to thatfor distillate fuel oil (see Distillate Fuel Oil) and firstpublished in the Annual Report to Congress, Volume 3,1977.
Unfractionated Stream. EIA assumed the thermal con-version factor to be 5.418 million Btu per barrel or equalto that for plant condensate (see Plant Condensate) andfirst published in the Annual Report to Congress, Volume2, 1981.
Waxes. EIA adopted the thermal conversion factor of5.537 million Btu per barrel as estimated by the Bureauof Mines and first published in the Petroleum Statement,Annual, 1956.
Approximate Heat Content of Natural Gas
Natural Gas, Total Consumption. 1973-1979: EIAadopted the thermal conversion factor calculated annu-ally by the American Gas Association (AGA) and pub-lished in Gas Facts, an AGA annual publication. 1980forward: Calculated annually by EIA by dividing thetotal heat content of natural gas consumed by the totalquantity of natural gas consumed. The heat contentand quantity consumed are from Form EIA-176. Pub-lished sources are: 1980-1989: EIA, Natural Gas Annual1992, Volume 2, Table 15. 1990-1992: EIA, Natural GasAnnual 1992, Volume 2, Table 16.
Natural Gas, Consumption by Electric Utilities. Cal-culated annually by EIA by dividing the total heatcontent of natural gas received at electric utilities by thetotal quantity received at electric utilities. The heatcontents and receipts are from Form FERC-423 andpredecessor forms.
Natural Gas, Consumption by Sectors Other ThanElectric Utilities. Calculated annually by EIA by divid-ing the heat content of all natural gas consumed less theheat content of natural gas consumed at electric utilities
Energy Information Administration/Historical Monthly Energy Review 1973-1992 345

by the quantity of all natural gas consumed less thequantity of natural gas consumed at electric utilities.Data are from Forms EIA-176, FERC-423, EIA-759, andpredecessor forms.
Natural Gas, Exports. Calculated annually by EIA bydividing the heat content of exported natural gas by thequantity of natural gas exported, both reported onForm FPC-14.
Natural Gas, Imports. Calculated annually by EIA bydividing the heat content of imported natural gas by thequantity of natural gas imported, both reported onForm FPC-14.
Natural Gas Production, Dry. Assumed by EIA to beequal to the thermal conversion factor for the consump-tion of dry natural gas. See Natural Gas Total Con-sumption.
Natural Gas Production, Marketed (Wet). Calculatedannually by EIA by adding the heat content of drynatural gas production and the total heat content ofnatural gas plant liquids production and dividing thissum by the total quantity of marketed (wet) natural gasproduction.
Approximate Heat Content of Coal andCoal Coke
Anthracite, Total Consumption. Calculated annuallyby EIA by dividing the sum of the heat content ofanthracite consumed by electric utilities and all othersectors combined by the total quantity of anthraciteconsumed.
Anthracite, Consumption by Electric Utilities. Calcu-lated annually by EIA by dividing the heat content ofanthracite receipts at electric utilities by the quantity ofanthracite received at electric utilities. Heat contentsand receipts are from Form FERC-423 and predecessorforms.
Anthracite, Consumption by Sectors Other Than Elec-tric Utilities. Calculated annually by EIA by dividingthe heat content of anthracite production less the heatcontent of the anthracite consumed at electric utilities,net exports, and shipments to U.S. Armed Forces over-seas by the quantity of anthracite consumed by sectorsother than electric utilities less the quantity of anthra-cite stock changes, losses, and “unaccounted for.”
Anthracite, Imports and Exports. EIA assumed theanthracite imports and exports to be freshly minedanthracite having an estimated heat content of 25.40million Btu per short ton.
Anthracite, Production. Calculated annually by EIAby dividing the sum of the heat content of freshly mined
anthracite (estimated to have an average heat contentof 25.400 million Btu per short ton) and the heat contentof anthracite recovered from culm banks and riverdredging (estimated to have a heat content of 17.500million Btu per short ton) by the total quantity of an-thracite production.
Bituminous Coal and Lignite, Total Consumption.Calculated annually by EIA by dividing the sum of theheat content of bituminous coal and lignite consumed byelectric utilities, coal coke plants, other industrial plants,the residential and commercial sector, and the transpor-tation sector by the sum of their respective tonnages.
Bituminous Coal and Lignite, Consumption by CokePlants. Estimated by EIA to be 26.800 million Btu pershort ton on the basis of an input/output analysis ofcoal carbonization.
Bituminous Coal and Lignite, Consumption by Elec-tric Utilities. Calculated annually by EIA by dividingthe total heat content of bituminous coal and lignitereceived at electric utilities by the total quantity re-ceived at electric utilities. Heat contents and receiptsare from Form FERC-423 and predecessor forms.
Bituminous Coal and Lignite, Consumption by OtherIndustrial and Transportation Users. 1973: Calcu-lated by EIA through regression analysis measuring thedifference between the average Btu value of coal con-sumed by other industrial users and that of coal con-sumed at electric utilities in the 1974-1982 period.1974-1992: Calculated annually by EIA by assumingthat the bituminous coal and lignite delivered to otherindustrial users from each coal-producing area (re-ported on Form EIA-6 and predecessor Bureau of MinesForm 6-1419-Q) contained a heat value equal to that ofbituminous coal and lignite received at electric utilitiesfrom each of the same coal-producing areas (reportedon Form FERC-423). The average Btu value of coal bycoal-producing area was applied to the volume of de-liveries to other industrial users from each coal-produc-ing area, and the sum total of the heat content wasdivided by the total volume of deliveries. Coal-produc-ing areas are the Bureau of Mines coal-producing dis-tricts for 1974 through 1989 and coal-producing Statesfor 1990-1992.
Bituminous Coal and Lignite, Consumption by Resi-dential and Commercial Users. 1973: Calculated byEIA through regression analysis measuring the differ-ence between the average Btu value of coal consumedby residential and commercial users and that of coalconsumed by electric utilities in the 1974-1982 period.1974-1992: Calculated annually by EIA by assuming thatthe bituminous coal and lignite delivered to residentialand commercial users from each coal-producing area(reported on Form EIA-6 and predecessor Bureau ofMines Form 6-1419-Q) contained a heat value equal to
Energy Information Administration/Historical Monthly Energy Review 1973-1992346
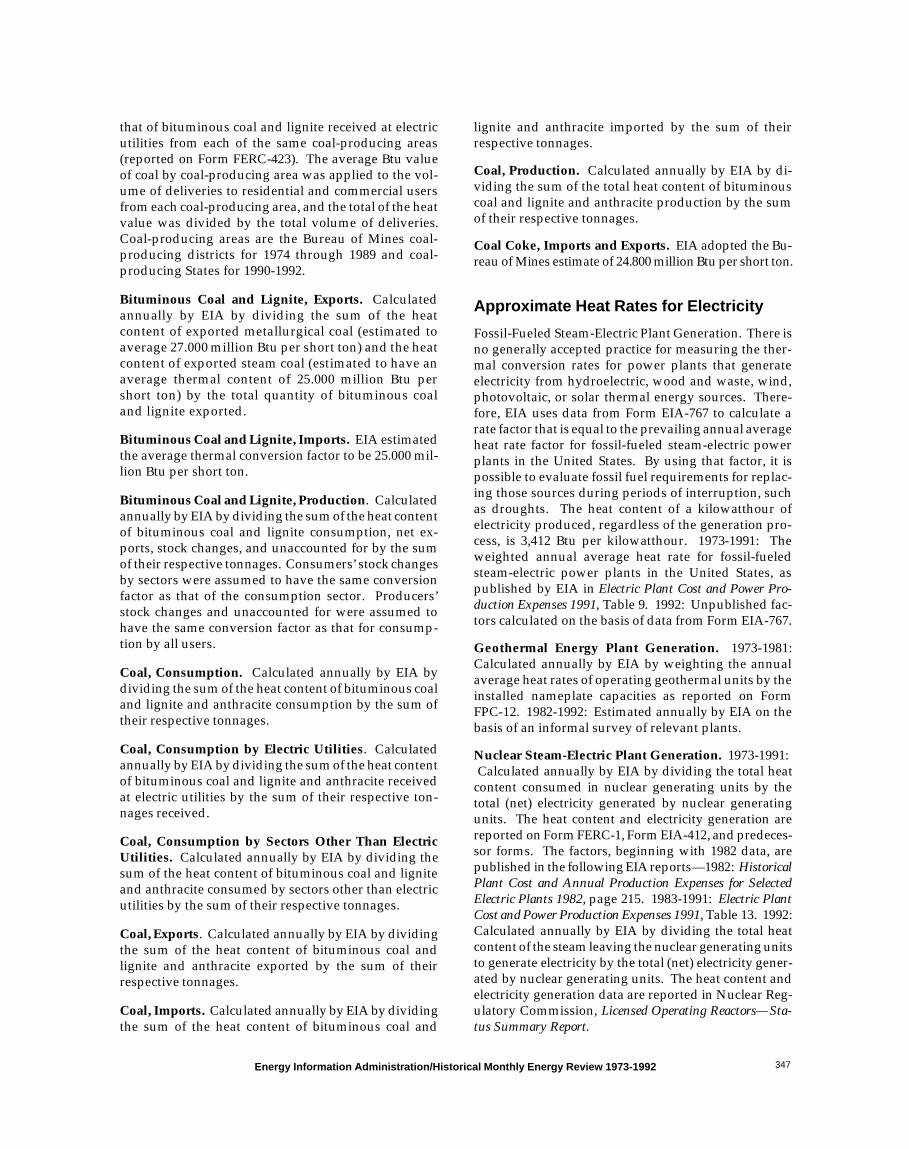
that of bituminous coal and lignite received at electricutilities from each of the same coal-producing areas(reported on Form FERC-423). The average Btu valueof coal by coal-producing area was applied to the vol-ume of deliveries to residential and commercial usersfrom each coal-producing area, and the total of the heatvalue was divided by the total volume of deliveries.Coal-producing areas are the Bureau of Mines coal-producing districts for 1974 through 1989 and coal-producing States for 1990-1992.
Bituminous Coal and Lignite, Exports. Calculatedannually by EIA by dividing the sum of the heatcontent of exported metallurgical coal (estimated toaverage 27.000 million Btu per short ton) and the heatcontent of exported steam coal (estimated to have anaverage thermal content of 25.000 million Btu pershort ton) by the total quantity of bituminous coaland lignite exported.
Bituminous Coal and Lignite, Imports. EIA estimatedthe average thermal conversion factor to be 25.000 mil-lion Btu per short ton.
Bituminous Coal and Lignite, Production. Calculatedannually by EIA by dividing the sum of the heat contentof bituminous coal and lignite consumption, net ex-ports, stock changes, and unaccounted for by the sumof their respective tonnages. Consumers’ stock changesby sectors were assumed to have the same conversionfactor as that of the consumption sector. Producers’stock changes and unaccounted for were assumed tohave the same conversion factor as that for consump-tion by all users.
Coal, Consumption. Calculated annually by EIA bydividing the sum of the heat content of bituminous coaland lignite and anthracite consumption by the sum oftheir respective tonnages.
Coal, Consumption by Electric Utilities. Calculatedannually by EIA by dividing the sum of the heat contentof bituminous coal and lignite and anthracite receivedat electric utilities by the sum of their respective ton-nages received.
Coal, Consumption by Sectors Other Than ElectricUtilities. Calculated annually by EIA by dividing thesum of the heat content of bituminous coal and ligniteand anthracite consumed by sectors other than electricutilities by the sum of their respective tonnages.
Coal, Exports. Calculated annually by EIA by dividingthe sum of the heat content of bituminous coal andlignite and anthracite exported by the sum of theirrespective tonnages.
Coal, Imports. Calculated annually by EIA by dividingthe sum of the heat content of bituminous coal and
lignite and anthracite imported by the sum of theirrespective tonnages.
Coal, Production. Calculated annually by EIA by di-viding the sum of the total heat content of bituminouscoal and lignite and anthracite production by the sumof their respective tonnages.
Coal Coke, Imports and Exports. EIA adopted the Bu-reau of Mines estimate of 24.800 million Btu per short ton.
Approximate Heat Rates for Electricity
Fossil-Fueled Steam-Electric Plant Generation. There isno generally accepted practice for measuring the ther-mal conversion rates for power plants that generateelectricity from hydroelectric, wood and waste, wind,photovoltaic, or solar thermal energy sources. There-fore, EIA uses data from Form EIA-767 to calculate arate factor that is equal to the prevailing annual averageheat rate factor for fossil-fueled steam-electric powerplants in the United States. By using that factor, it ispossible to evaluate fossil fuel requirements for replac-ing those sources during periods of interruption, suchas droughts. The heat content of a kilowatthour ofelectricity produced, regardless of the generation pro-cess, is 3,412 Btu per kilowatthour. 1973-1991: Theweighted annual average heat rate for fossil-fueledsteam-electric power plants in the United States, aspublished by EIA in Electric Plant Cost and Power Pro-duction Expenses 1991, Table 9. 1992: Unpublished fac-tors calculated on the basis of data from Form EIA-767.
Geothermal Energy Plant Generation. 1973-1981:Calculated annually by EIA by weighting the annualaverage heat rates of operating geothermal units by theinstalled nameplate capacities as reported on FormFPC-12. 1982-1992: Estimated annually by EIA on thebasis of an informal survey of relevant plants.
Nuclear Steam-Electric Plant Generation. 1973-1991: Calculated annually by EIA by dividing the total heatcontent consumed in nuclear generating units by thetotal (net) electricity generated by nuclear generatingunits. The heat content and electricity generation arereported on Form FERC-1, Form EIA-412, and predeces-sor forms. The factors, beginning with 1982 data, arepublished in the following EIA reports—1982: HistoricalPlant Cost and Annual Production Expenses for SelectedElectric Plants 1982, page 215. 1983-1991: Electric PlantCost and Power Production Expenses 1991, Table 13. 1992:Calculated annually by EIA by dividing the total heatcontent of the steam leaving the nuclear generating unitsto generate electricity by the total (net) electricity gener-ated by nuclear generating units. The heat content andelectricity generation data are reported in Nuclear Reg-ulatory Commission, Licensed Operating Reactors—Sta-tus Summary Report.
Energy Information Administration/Historical Monthly Energy Review 1973-1992 347

Data presented in the Historical Monthly Energy Reviewand in other Energy Information Administration pub-lications are expressed predominately in units thathistorically have been used in the United States, suchas British thermal units, barrels, cubic feet, and shorttons. However, because U.S. commerce involvesother nations, most of which use metric units of mea-sure, the U.S. Government is committed to the transi-tion to the metric system, as stated in the MetricConversion Act of 1975 (Public Law 94–168),amended by the Omnibus Trade and CompetitivenessAct of 1988 (Public Law 100–418), and ExecutiveOrder 12770 of July 25, 1991.
The metric conversion factors presented in Table B1can be used to calculate the metric-unit equivalentsof values expressed in U.S. customary units. For
example, 500 short tons are the equivalent of 453.6metric tons (500 short tons x 0.9071847 metrictons/short ton = 453.6 metric tons).
In the metric system of weights and measures, thenames of multiples and subdivisions of any unit maybe derived by combining the name of the unit withprefixes, such as deka, hecto, and kilo, meaning, re-spectively, 10, 100, 1,000, and deci, centi, and milli,meaning, respectively, one-tenth, one-hundredth,and one-thousandth. Common metric prefixes can befound in Table B2.
The conversion factors presented in Table B3 can beused to calculate equivalents in various physical unitscommonly used in energy analyses. For example, 10barrels are the equivalent of 420 U.S. gallons (10 bar-rels x 42 gallons/barrel = 420 gallons).
Appendix B. Metric and Other Physical Conversion Factors
Energy Information Administration/Historical Monthly Energy Review 1973-1992 349
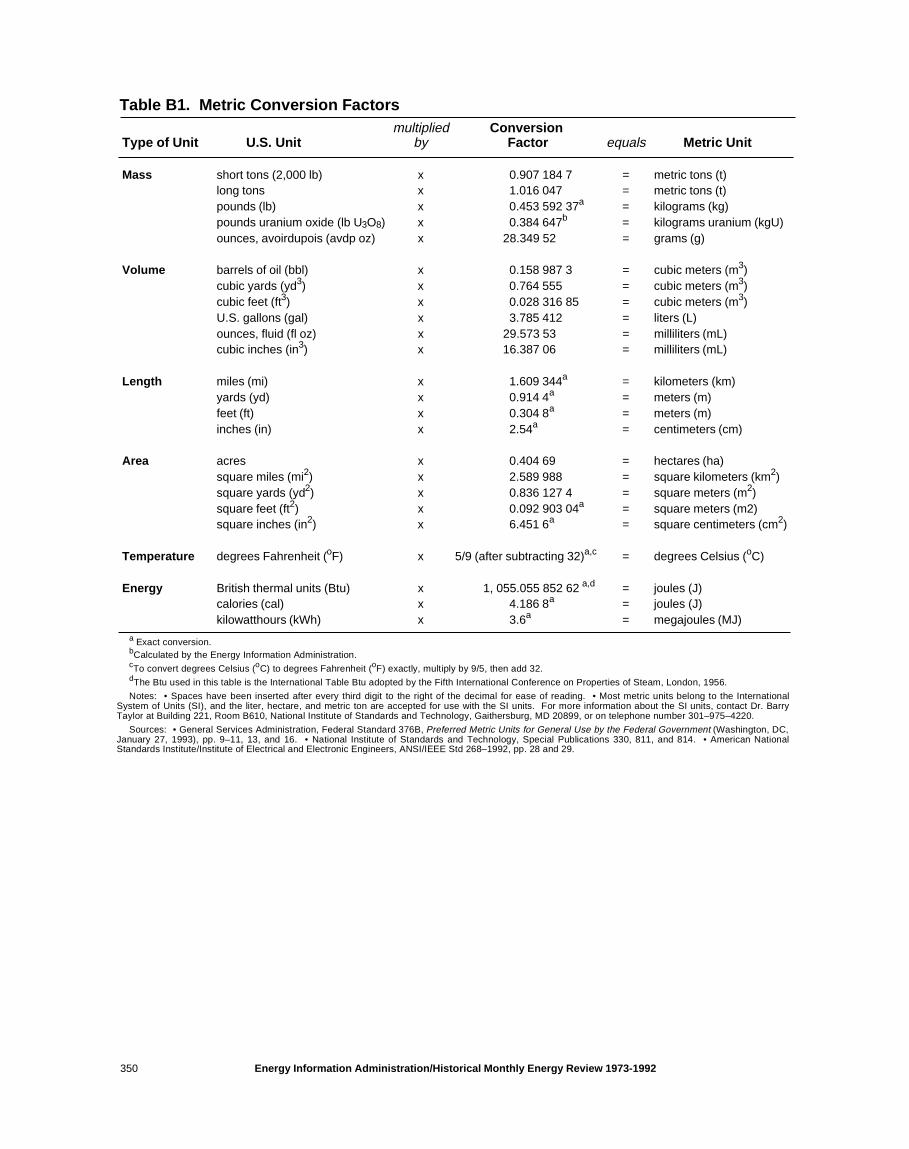
Type of Unit U.S. Unitmultiplied
byConversion
Factor equals Metric Unit
Mass short tons (2,000 lb) x 0.907 184 7 = metric tons (t) long tons x 1.016 047 = metric tons (t)pounds (lb) x 0.453 592 37a = kilograms (kg)pounds uranium oxide (lb U3O8) x 0.384 647b = kilograms uranium (kgU)ounces, avoirdupois (avdp oz) x 28.349 52 = grams (g)
Volume barrels of oil (bbl) x 0.158 987 3 = cubic meters (m3)cubic yards (yd3) x 0.764 555 = cubic meters (m3)cubic feet (ft3) x 0.028 316 85 = cubic meters (m3)U.S. gallons (gal) x 3.785 412 = liters (L)ounces, fluid (fl oz) x 29.573 53 = milliliters (mL)cubic inches (in3) x 16.387 06 = milliliters (mL)
Length miles (mi) x 1.609 344a = kilometers (km) yards (yd) x 0.914 4a = meters (m)feet (ft) x 0.304 8a = meters (m)inches (in) x 2.54a = centimeters (cm)
Area acres x 0.404 69 = hectares (ha)square miles (mi2) x 2.589 988 = square kilometers (km2)square yards (yd2) x 0.836 127 4 = square meters (m2)square feet (ft2) x 0.092 903 04a = square meters (m2)square inches (in2) x 6.451 6a = square centimeters (cm2)
Temperature degrees Fahrenheit (oF) x 5/9 (after subtracting 32)a,c = degrees Celsius (oC)
Energy British thermal units (Btu) x 1, 055.055 852 62 a,d = joules (J)calories (cal) x 4.186 8a = joules (J) kilowatthours (kWh) x 3.6a = megajoules (MJ)
Table B1. Metric Conversion Factors
a Exact conversion.bCalculated by the Energy Information Administration.cTo convert degrees Celsius (oC) to degrees Fahrenheit (oF) exactly, multiply by 9/5, then add 32.dThe Btu used in this table is the International Table Btu adopted by the Fifth International Conference on Properties of Steam, London, 1956.
Notes: • Spaces have been inserted after every third digit to the right of the decimal for ease of reading. • Most metric units belong to the InternationalSystem of Units (SI), and the liter, hectare, and metric ton are accepted for use with the SI units. For more information about the SI units, contact Dr. BarryTaylor at Building 221, Room B610, National Institute of Standards and Technology, Gaithersburg, MD 20899, or on telephone number 301–975–4220.
Sources: • General Services Administration, Federal Standard 376B, Preferred Metric Units for General Use by the Federal Government (Washington, DC,January 27, 1993), pp. 9–11, 13, and 16. • National Institute of Standards and Technology, Special Publications 330, 811, and 814. • American NationalStandards Institute/Institute of Electrical and Electronic Engineers, ANSI/IEEE Std 268–1992, pp. 28 and 29.
Energy Information Administration/Historical Monthly Energy Review 1973-1992350

Energy Source Original Unitmultiplied
byConversion
Factor equals Final Unit
Petroleum barrels (bbl) x 42a = U.S. gallons (gal)
Coal short tons x 2,000a = pounds (lb)long tons x 2,240a = pounds (lb)metric tons (t) x 1,000a = kilograms (kg)
Wood cords (cd) x 1.25b = short tonscords (cd) x 128a = cubic feet (ft3)
Table B3. Other Physical Conversion Factors
aExact conversion.bCalculated by the Energy Information Administration.Source: U.S. Department of Commerce, National Institute of Standards and Technology, Specifications, Tolerances, and Other Technical Requirements for
Weighing and Measuring Devices, NIST Handbook 44, 1994 Edition (Washington, DC, October 1993), pp. B–10, C–17 and C–21.
UnitMultiple Prefix Symbol
UnitSubdivision Prefix Symbol
101
deka da 10-1
deci d10
2hecto h 10
-2centi c
103
kilo k 10-3
milli m10
6mega M 10
-6micro µ
109
giga G 10-9
nano n10
12tera T 10
-12pico p
1015
peta P 10-15
femto f10
18exa E 10
-18atto a
1021
zetta Z 10-21
zepto z10
24yotta Y 10
-24yocto y
Source: U.S. Department of Commerce, National Institute of Standards and Technology, The International System of Units (SI), NIST Special Publication330, 1991 Edition (Washington, DC, August 1991), p. 10.
Table B2. Metric Prefixes
Energy Information Administration/Historical Monthly Energy Review 1973-1992 351
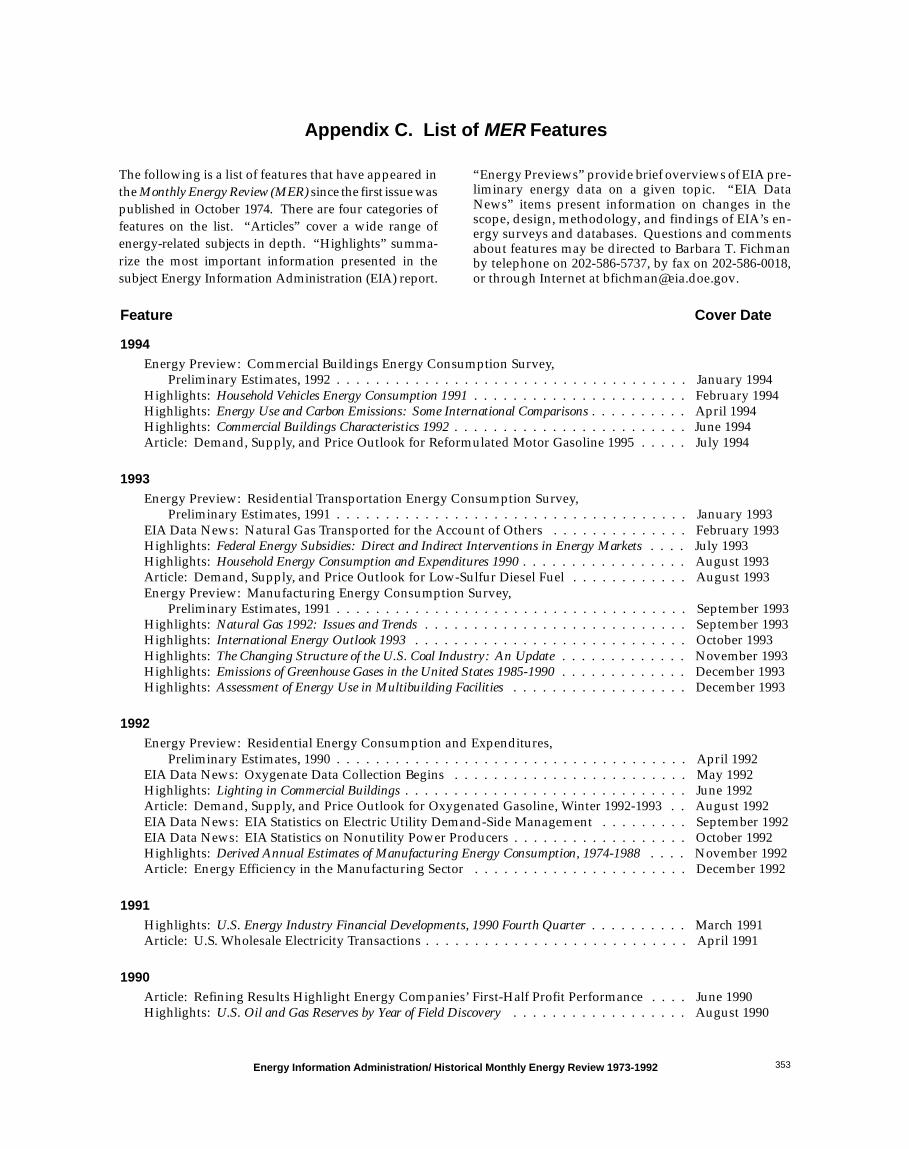
Feature Cover Date
1994Energy Preview: Commercial Buildings Energy Consumption Survey,
Preliminary Estimates, 1992 . . . . . . . . . . . . . . . . . . . . . . . . . . . . . . . . . . . . January 1994Highlights: Household Vehicles Energy Consumption 1991 . . . . . . . . . . . . . . . . . . . . . . February 1994Highlights: Energy Use and Carbon Emissions: Some International Comparisons . . . . . . . . . . April 1994Highlights: Commercial Buildings Characteristics 1992 . . . . . . . . . . . . . . . . . . . . . . . . June 1994Article: Demand, Supply, and Price Outlook for Reformulated Motor Gasoline 1995 . . . . . July 1994
1993Energy Preview: Residential Transportation Energy Consumption Survey,
Preliminary Estimates, 1991 . . . . . . . . . . . . . . . . . . . . . . . . . . . . . . . . . . . . January 1993EIA Data News: Natural Gas Transported for the Account of Others . . . . . . . . . . . . . . February 1993Highlights: Federal Energy Subsidies: Direct and Indirect Interventions in Energy Markets . . . . July 1993Highlights: Household Energy Consumption and Expenditures 1990 . . . . . . . . . . . . . . . . . August 1993Article: Demand, Supply, and Price Outlook for Low-Sulfur Diesel Fuel . . . . . . . . . . . . August 1993Energy Preview: Manufacturing Energy Consumption Survey,
Preliminary Estimates, 1991 . . . . . . . . . . . . . . . . . . . . . . . . . . . . . . . . . . . . September 1993Highlights: Natural Gas 1992: Issues and Trends . . . . . . . . . . . . . . . . . . . . . . . . . . . September 1993Highlights: International Energy Outlook 1993 . . . . . . . . . . . . . . . . . . . . . . . . . . . . October 1993Highlights: The Changing Structure of the U.S. Coal Industry: An Update . . . . . . . . . . . . . November 1993Highlights: Emissions of Greenhouse Gases in the United States 1985-1990 . . . . . . . . . . . . . December 1993Highlights: Assessment of Energy Use in Multibuilding Facilities . . . . . . . . . . . . . . . . . . December 1993
1992Energy Preview: Residential Energy Consumption and Expenditures,
Preliminary Estimates, 1990 . . . . . . . . . . . . . . . . . . . . . . . . . . . . . . . . . . . . April 1992EIA Data News: Oxygenate Data Collection Begins . . . . . . . . . . . . . . . . . . . . . . . . May 1992Highlights: Lighting in Commercial Buildings . . . . . . . . . . . . . . . . . . . . . . . . . . . . . June 1992Article: Demand, Supply, and Price Outlook for Oxygenated Gasoline, Winter 1992-1993 . . August 1992EIA Data News: EIA Statistics on Electric Utility Demand-Side Management . . . . . . . . . September 1992EIA Data News: EIA Statistics on Nonutility Power Producers . . . . . . . . . . . . . . . . . . October 1992Highlights: Derived Annual Estimates of Manufacturing Energy Consumption, 1974-1988 . . . . November 1992Article: Energy Efficiency in the Manufacturing Sector . . . . . . . . . . . . . . . . . . . . . . December 1992
1991Highlights: U.S. Energy Industry Financial Developments, 1990 Fourth Quarter . . . . . . . . . . March 1991Article: U.S. Wholesale Electricity Transactions . . . . . . . . . . . . . . . . . . . . . . . . . . . April 1991
1990Article: Refining Results Highlight Energy Companies’ First-Half Profit Performance . . . . June 1990Highlights: U.S. Oil and Gas Reserves by Year of Field Discovery . . . . . . . . . . . . . . . . . . August 1990
Appendix C. List of MER Features
The following is a list of features that have appeared inthe Monthly Energy Review (MER) since the first issue waspublished in October 1974. There are four categories offeatures on the list. “Articles” cover a wide range ofenergy-related subjects in depth. “Highlights” summa-rize the most important information presented in thesubject Energy Information Administration (EIA) report.
“Energy Previews” provide brief overviews of EIA pre-liminary energy data on a given topic. “EIA DataNews” items present information on changes in thescope, design, methodology, and findings of EIA’s en-ergy surveys and databases. Questions and commentsabout features may be directed to Barbara T. Fichmanby telephone on 202-586-5737, by fax on 202-586-0018,or through Internet at [email protected].
Energy Information Administration/ Historical Monthly Energy Review 1973-1992 353
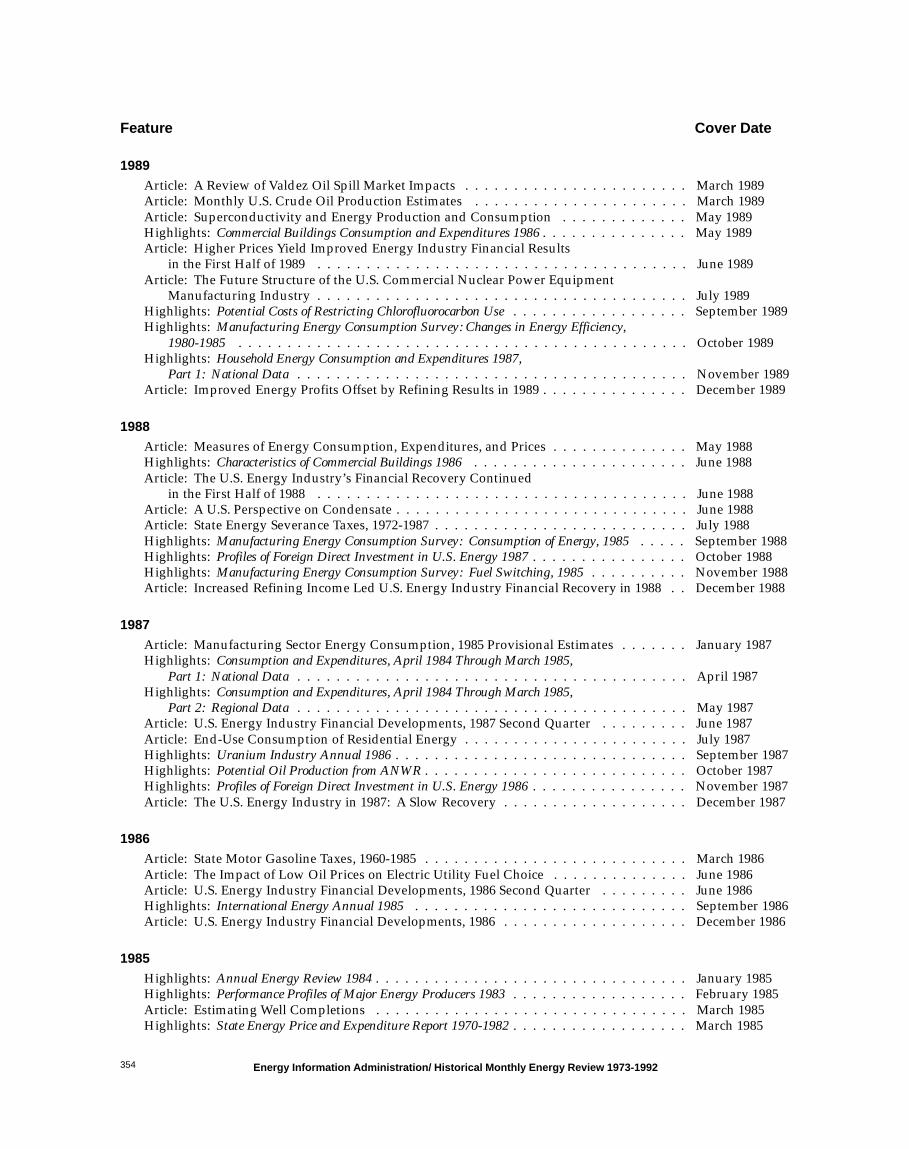
Feature Cover Date
1989
Article: A Review of Valdez Oil Spill Market Impacts . . . . . . . . . . . . . . . . . . . . . . . March 1989Article: Monthly U.S. Crude Oil Production Estimates . . . . . . . . . . . . . . . . . . . . . . March 1989Article: Superconductivity and Energy Production and Consumption . . . . . . . . . . . . . May 1989Highlights: Commercial Buildings Consumption and Expenditures 1986 . . . . . . . . . . . . . . . May 1989Article: Higher Prices Yield Improved Energy Industry Financial Results
in the First Half of 1989 . . . . . . . . . . . . . . . . . . . . . . . . . . . . . . . . . . . . . . June 1989Article: The Future Structure of the U.S. Commercial Nuclear Power Equipment
Manufacturing Industry . . . . . . . . . . . . . . . . . . . . . . . . . . . . . . . . . . . . . . July 1989Highlights: Potential Costs of Restricting Chlorofluorocarbon Use . . . . . . . . . . . . . . . . . . September 1989Highlights: Manufacturing Energy Consumption Survey: Changes in Energy Efficiency,
1980-1985 . . . . . . . . . . . . . . . . . . . . . . . . . . . . . . . . . . . . . . . . . . . . . . October 1989Highlights: Household Energy Consumption and Expenditures 1987,
Part 1: National Data . . . . . . . . . . . . . . . . . . . . . . . . . . . . . . . . . . . . . . . . November 1989Article: Improved Energy Profits Offset by Refining Results in 1989 . . . . . . . . . . . . . . . December 1989
1988
Article: Measures of Energy Consumption, Expenditures, and Prices . . . . . . . . . . . . . . May 1988Highlights: Characteristics of Commercial Buildings 1986 . . . . . . . . . . . . . . . . . . . . . . June 1988Article: The U.S. Energy Industry’s Financial Recovery Continued
in the First Half of 1988 . . . . . . . . . . . . . . . . . . . . . . . . . . . . . . . . . . . . . . June 1988Article: A U.S. Perspective on Condensate . . . . . . . . . . . . . . . . . . . . . . . . . . . . . . June 1988Article: State Energy Severance Taxes, 1972-1987 . . . . . . . . . . . . . . . . . . . . . . . . . . July 1988Highlights: Manufacturing Energy Consumption Survey: Consumption of Energy, 1985 . . . . . September 1988Highlights: Profiles of Foreign Direct Investment in U.S. Energy 1987 . . . . . . . . . . . . . . . . October 1988Highlights: Manufacturing Energy Consumption Survey: Fuel Switching, 1985 . . . . . . . . . . November 1988Article: Increased Refining Income Led U.S. Energy Industry Financial Recovery in 1988 . . December 1988
1987
Article: Manufacturing Sector Energy Consumption, 1985 Provisional Estimates . . . . . . . January 1987Highlights: Consumption and Expenditures, April 1984 Through March 1985,
Part 1: National Data . . . . . . . . . . . . . . . . . . . . . . . . . . . . . . . . . . . . . . . . April 1987 Highlights: Consumption and Expenditures, April 1984 Through March 1985,
Part 2: Regional Data . . . . . . . . . . . . . . . . . . . . . . . . . . . . . . . . . . . . . . . . May 1987Article: U.S. Energy Industry Financial Developments, 1987 Second Quarter . . . . . . . . . June 1987Article: End-Use Consumption of Residential Energy . . . . . . . . . . . . . . . . . . . . . . . July 1987Highlights: Uranium Industry Annual 1986 . . . . . . . . . . . . . . . . . . . . . . . . . . . . . . September 1987Highlights: Potential Oil Production from ANWR . . . . . . . . . . . . . . . . . . . . . . . . . . . October 1987Highlights: Profiles of Foreign Direct Investment in U.S. Energy 1986 . . . . . . . . . . . . . . . . November 1987Article: The U.S. Energy Industry in 1987: A Slow Recovery . . . . . . . . . . . . . . . . . . . December 1987
1986
Article: State Motor Gasoline Taxes, 1960-1985 . . . . . . . . . . . . . . . . . . . . . . . . . . . March 1986Article: The Impact of Low Oil Prices on Electric Utility Fuel Choice . . . . . . . . . . . . . . June 1986Article: U.S. Energy Industry Financial Developments, 1986 Second Quarter . . . . . . . . . June 1986Highlights: International Energy Annual 1985 . . . . . . . . . . . . . . . . . . . . . . . . . . . . September 1986Article: U.S. Energy Industry Financial Developments, 1986 . . . . . . . . . . . . . . . . . . . December 1986
1985
Highlights: Annual Energy Review 1984 . . . . . . . . . . . . . . . . . . . . . . . . . . . . . . . . January 1985Highlights: Performance Profiles of Major Energy Producers 1983 . . . . . . . . . . . . . . . . . . February 1985Article: Estimating Well Completions . . . . . . . . . . . . . . . . . . . . . . . . . . . . . . . . March 1985Highlights: State Energy Price and Expenditure Report 1970-1982 . . . . . . . . . . . . . . . . . . March 1985
Energy Information Administration/ Historical Monthly Energy Review 1973-1992354
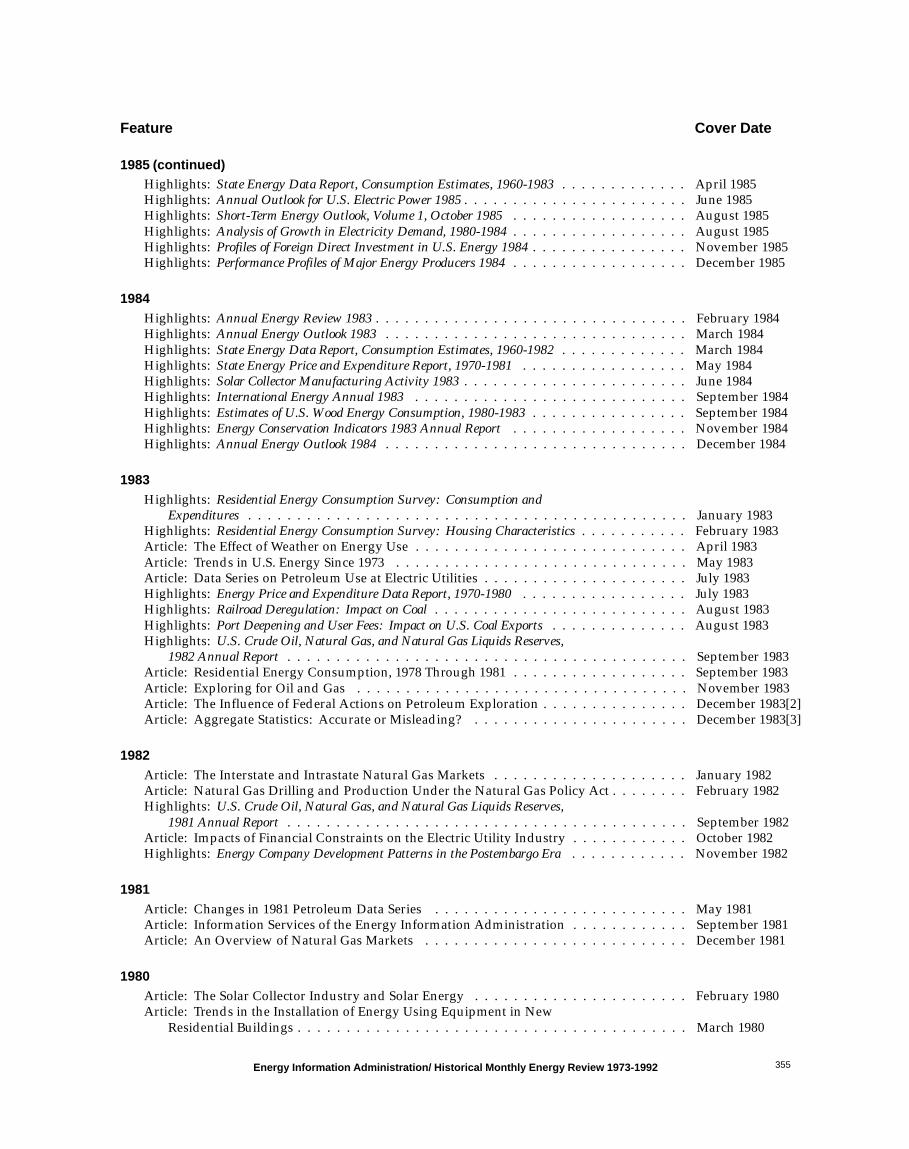
Feature Cover Date
1985 (continued)Highlights: State Energy Data Report, Consumption Estimates, 1960-1983 . . . . . . . . . . . . . April 1985Highlights: Annual Outlook for U.S. Electric Power 1985 . . . . . . . . . . . . . . . . . . . . . . . June 1985Highlights: Short-Term Energy Outlook, Volume 1, October 1985 . . . . . . . . . . . . . . . . . . August 1985Highlights: Analysis of Growth in Electricity Demand, 1980-1984 . . . . . . . . . . . . . . . . . . August 1985Highlights: Profiles of Foreign Direct Investment in U.S. Energy 1984 . . . . . . . . . . . . . . . . November 1985Highlights: Performance Profiles of Major Energy Producers 1984 . . . . . . . . . . . . . . . . . . December 1985
1984Highlights: Annual Energy Review 1983 . . . . . . . . . . . . . . . . . . . . . . . . . . . . . . . . February 1984Highlights: Annual Energy Outlook 1983 . . . . . . . . . . . . . . . . . . . . . . . . . . . . . . . March 1984Highlights: State Energy Data Report, Consumption Estimates, 1960-1982 . . . . . . . . . . . . . March 1984Highlights: State Energy Price and Expenditure Report, 1970-1981 . . . . . . . . . . . . . . . . . May 1984Highlights: Solar Collector Manufacturing Activity 1983 . . . . . . . . . . . . . . . . . . . . . . . June 1984Highlights: International Energy Annual 1983 . . . . . . . . . . . . . . . . . . . . . . . . . . . . September 1984Highlights: Estimates of U.S. Wood Energy Consumption, 1980-1983 . . . . . . . . . . . . . . . . September 1984Highlights: Energy Conservation Indicators 1983 Annual Report . . . . . . . . . . . . . . . . . . November 1984Highlights: Annual Energy Outlook 1984 . . . . . . . . . . . . . . . . . . . . . . . . . . . . . . . December 1984
1983 Highlights: Residential Energy Consumption Survey: Consumption and
Expenditures . . . . . . . . . . . . . . . . . . . . . . . . . . . . . . . . . . . . . . . . . . . . . January 1983Highlights: Residential Energy Consumption Survey: Housing Characteristics . . . . . . . . . . . February 1983Article: The Effect of Weather on Energy Use . . . . . . . . . . . . . . . . . . . . . . . . . . . . April 1983Article: Trends in U.S. Energy Since 1973 . . . . . . . . . . . . . . . . . . . . . . . . . . . . . . May 1983Article: Data Series on Petroleum Use at Electric Utilities . . . . . . . . . . . . . . . . . . . . . July 1983Highlights: Energy Price and Expenditure Data Report, 1970-1980 . . . . . . . . . . . . . . . . . July 1983Highlights: Railroad Deregulation: Impact on Coal . . . . . . . . . . . . . . . . . . . . . . . . . . August 1983Highlights: Port Deepening and User Fees: Impact on U.S. Coal Exports . . . . . . . . . . . . . . August 1983Highlights: U.S. Crude Oil, Natural Gas, and Natural Gas Liquids Reserves,
1982 Annual Report . . . . . . . . . . . . . . . . . . . . . . . . . . . . . . . . . . . . . . . . . September 1983Article: Residential Energy Consumption, 1978 Through 1981 . . . . . . . . . . . . . . . . . . September 1983Article: Exploring for Oil and Gas . . . . . . . . . . . . . . . . . . . . . . . . . . . . . . . . . . November 1983Article: The Influence of Federal Actions on Petroleum Exploration . . . . . . . . . . . . . . . December 1983[2]Article: Aggregate Statistics: Accurate or Misleading? . . . . . . . . . . . . . . . . . . . . . . December 1983[3]
1982Article: The Interstate and Intrastate Natural Gas Markets . . . . . . . . . . . . . . . . . . . . January 1982Article: Natural Gas Drilling and Production Under the Natural Gas Policy Act . . . . . . . . February 1982Highlights: U.S. Crude Oil, Natural Gas, and Natural Gas Liquids Reserves,
1981 Annual Report . . . . . . . . . . . . . . . . . . . . . . . . . . . . . . . . . . . . . . . . . September 1982Article: Impacts of Financial Constraints on the Electric Utility Industry . . . . . . . . . . . . October 1982Highlights: Energy Company Development Patterns in the Postembargo Era . . . . . . . . . . . . November 1982
1981Article: Changes in 1981 Petroleum Data Series . . . . . . . . . . . . . . . . . . . . . . . . . . May 1981Article: Information Services of the Energy Information Administration . . . . . . . . . . . . September 1981Article: An Overview of Natural Gas Markets . . . . . . . . . . . . . . . . . . . . . . . . . . . December 1981
1980Article: The Solar Collector Industry and Solar Energy . . . . . . . . . . . . . . . . . . . . . . February 1980Article: Trends in the Installation of Energy Using Equipment in New
Residential Buildings . . . . . . . . . . . . . . . . . . . . . . . . . . . . . . . . . . . . . . . . March 1980
Energy Information Administration/ Historical Monthly Energy Review 1973-1992 355

Feature Cover Date
1980 (continued)Article: The Energy Information Administration’s Oil and Gas Reserves
Program—The First Year’s Report . . . . . . . . . . . . . . . . . . . . . . . . . . . . . . . . June 1980Article: Energy From Urban Waste . . . . . . . . . . . . . . . . . . . . . . . . . . . . . . . . . . August 1980Article: Natural Gas Liquids: Revisions to 1979 Data . . . . . . . . . . . . . . . . . . . . . . . October 1980Article: EIA Weekly Petroleum Data: Data Collection and Methods of Estimation . . . . . . November 1980Article: The Department of Energy Disclosure Policy for Individually Identifiable
Information Maintained by the Energy Information Administration . . . . . . . . . . . . December 1980
1979Article: The Energy Requirements of U.S. Agriculture . . . . . . . . . . . . . . . . . . . . . . . July 1979Article: Three Mile Island—Possible Regulatory Responses and Their Impacts
on the Nation’s Short-Term Electric Utility Fuel Outlook . . . . . . . . . . . . . . . . . . . October 1979Article: Reduction in Natural Gas Requirements Due to Fuel Switching . . . . . . . . . . . . December 1979
1978Article: Short-Term Petroleum Supply and Demand . . . . . . . . . . . . . . . . . . . . . . . . May 1978
1977Article: Crude Oil Entitlements Program . . . . . . . . . . . . . . . . . . . . . . . . . . . . . . January 1977Article: Motor Gasoline Supply and Demand . . . . . . . . . . . . . . . . . . . . . . . . . . . . July 1977
1976 Article: Curtailments of Natural Gas Service . . . . . . . . . . . . . . . . . . . . . . . . . . . . January 1976Article: Home Heating Conservation Alternatives and the Solar Collector Industry . . . . . March 1976 Article: Trends in United States Petroleum Imports . . . . . . . . . . . . . . . . . . . . . . . . September 1976
1975Article: Energy Consumption . . . . . . . . . . . . . . . . . . . . . . . . . . . . . . . . . . . . . March 1975Article: Nuclear Power . . . . . . . . . . . . . . . . . . . . . . . . . . . . . . . . . . . . . . . . . April 1975Article: The Price of Crude Oil . . . . . . . . . . . . . . . . . . . . . . . . . . . . . . . . . . . . June 1975Article: U.S. Coal Resources and Reserves . . . . . . . . . . . . . . . . . . . . . . . . . . . . . . July 1975Article: Propane—A National Energy Resource . . . . . . . . . . . . . . . . . . . . . . . . . . . September 1975Article: Short-Term Energy Supply and Demand Forecasting at FEA . . . . . . . . . . . . . . October 1975
Energy Information Administration/ Historical Monthly Energy Review 1973-1992356

Appendix D. Electronic Publishing System (EPUB)
User Instructions
EPUB is an electronic publishing system maintained by the Energy Information Administration of the U.S. Depart-ment of Energy. EPUB allows public access to selected energy data from many of EIA’s statistical reports. The systemis a menu-driven, bulletin board type system with extensive online help capabilities that can be accessed free of charge24 hours a day by using a terminal or PC with an asynchronous modem. (EPUB will be taken down briefly at midnightfor backup.)
Configuring your PC communications software
PC users must provide the following information to their communications software in order to successfully accessthe EPUB system:
BAUD RATE: 300 - 2400 bpsDATA BITS: 8STOP BITS: 1PARITY: NONEDUPLEX: FULLTERMINAL TYPE: examples: ANSI, ANSI-BBS, VT100
Access phone number
After configuring your software, dial (202) 586-2557 to access EPUB.
Using EPUB
Many users may find that the menu-driven instructions and the online help capabilities will provide enoughinformation to effectively use EPUB. If needed, more extensive information may be found in the EPUB Users Guide,available online from the EPUB system or from the:
National Energy Information Center, EI-231Energy Information AdministrationForrestal Building, Room 1F-048Washington, DC 20585(202) 586-8800, 9 a.m. to 5 p.m. eastern time, M-F
TTY: For people who are deaf or hard of hearing: (202) 586-1181Internet: [email protected]
EPUB assistance
For communications or technical assistance, call (202) 586-8959, 8 a.m. to 5 p.m. eastern time, M-F.For questions about the content of EPUB reports, call (202) 586-8800, 9 a.m. to 5 p.m. eastern time, M-F.
EPUB provides data and statistical information from the following EIA publications:
• Heating fuel data (April through September), updated the 2nd week of the month• Oxygenate data, updated approximately 15 working days after the end of the report month• Weekly Petroleum Status Report, updated on Wednesdays (Thursday in event of a holiday) at 9 a.m.• Petroleum Supply Monthly, updated between the 23rd and 26th of the month• Petroleum Marketing Monthly, updated on the 20th of the month• Winter Fuels Report, propane inventory data updated Wednesdays at 5 p.m. All other data updated on Thursdays (Friday in event of a holiday) at 5 p.m. (October through March)• Natural Gas Monthly, updated on the 20th of the month• Weekly Coal Production, updated on Fridays at 5 p.m.• Quarterly Coal Report, updated 60 days after the end of the quarter• Electric Power Monthly, updated on the 1st of the month• Short Term Energy Outlook, updated 60 days after the end of the quarter• Monthly Energy Review, updated the last week of the month• Historical Monthly Energy Review, monthly data for 1973-1992
Energy Information Administration/Historical Monthly Energy Review 1973-1992 357

Anthracite: A hard, black, lustrous coal containing ahigh percentage of fixed carbon and a low percentageof volatile matter. Often referred to as hard coal. Itconforms to ASTM Specification D388-84 for anthracite,meta-anthracite, and semianthracite.
Asphalt: A dark brown to black cement-like materialcontaining bitumens as the predominant constituentsobtained by petroleum processing. The definition in-cludes crude asphalt as well as the following finishedproducts: cements, fluxes, the asphalt content of emul-sions (exclusive of water), and petroleum distillatesblended with asphalt to make cutback asphalts.
ASTM: The American Society for Testing and Materials.
Aviation Gasoline Blending Components: Naphthasthat are used for blending or compounding into fin-ished aviation gasoline (e.g., straight-run gasoline, al-kylate, and reformate). Excludes oxygenates (alcoholsand ethers), butane, and pentanes plus.
Aviation Gasoline, Finished: All special grades of gas-oline for use in aviation reciprocating engines, as givenin ASTM Specification D910 and Military SpecificationMIL-G-5572. Excludes blending components that willbe used in blending or compounding into finished avi-ation gasoline.
Barrel (petroleum): A unit of volume equal to 42 U.S.gallons.
Base (Cushion) Gas: The volume of gas needed as apermanent inventory to maintain adequate under-ground storage reservoir pressures and deliverabilityrates throughout the withdrawal season. All native gasis included in the base gas volume.
Bituminous Coal: A dense black coal, often with well-defined bands of bright and dull material, with a mois-ture content usually less than 20 percent. Often referredto as soft coal. It is the most common coal and is usedprimarily for generating electricity, making coke, andspace heating. It conforms to ASTM Specification D388-84 for bituminous coal. In this report, bituminous coalincludes subbituminous coal.
British Thermal Unit (Btu): The quantity of heatneeded to raise the temperature of 1 pound of water by1o F at or near 39.2o F. See Heat Content of a Quantityof Fuel, Gross and Heat Content of a Quantity of Fuel,Net.
Butane: A normally gaseous straight-chain orbranched-chain hydrocarbon (C4H10). It is extractedfrom natural gas or refinery gas streams. It includesisobutane and normal butane and is designated in
ASTM Specification D1835 and Gas Processors Associ-ation Specifications for commercial butane.
• Isobutane: A normally gaseous branched-chainhydrocarbon. It is a colorless paraffinic gas thatboils at a temperature of 10.9o F. It is extractedfrom natural gas or refinery gas streams.
• Normal Butane: A normally gaseous straight-chainhydrocarbon. It is a colorless paraffinic gas thatboils at a temperature of 31.1o F. It is extractedfrom natural gas or refinery gas streams.
Butylene: An olefinic hydrocarbon (C4H8) recoveredfrom refinery processes.
Capacity Factor: The ratio of the electrical energy pro-duced by a generating unit for a given period of timeto the electrical energy that could have been producedat continuous full-power operation during the sameperiod.
CIF: See Cost, Insurance, Freight.
City Gate: A point or measuring station at which adistribution gas utility receives gas from a natural gaspipeline company or transmission system.
Coal: A black or brownish-black solid, combustiblesubstance formed by the partial decomposition of veg-etable matter without access to air. The rank of coal,which includes anthracite, bituminous coal, sub-bituminous coal, and lignite, is based on fixed carbon,volatile matter, and heating value. Coal rank indicatesthe progressive alteration, or coalification, from ligniteto anthracite. Lignite contains approximately 9 to 17million Btu per ton. The heat contents of subbituminousand bituminous coal range from 16 to 24 million Btu perton, and from 19 to 30 million Btu per ton, respectively.Anthracite contains approximately 22 to 28 million Btuper ton.
Coal Coke: A hard, porous product made from bakingbituminous coal in ovens at temperatures as high as2,000o F. It is used both as a fuel and as a reducing agentin smelting iron ore in a blast furnace.
Commercial Sector: The commercial sector, as definedeconomically, consists of business establishments thatare not engaged in transportation or in manufacturingor other types of industrial activity (agriculture, min-ing, or construction). Commercial establishments in-clude hotels, motels, restaurants, wholesale businesses,retail stores, laundries, and other service enterprises;religious and nonprofit organizations; health, social,and educational institutions; and Federal, State, andlocal governments. Street lights, pumps, bridges, andpublic services are also included if the establishmentoperating them is considered commercial.
Glossary
Energy Information Administration/ Historical Monthly Energy Review 1973-1992 359

Completion: The installation of permanent equipmentfor the production of oil or gas. If a well is equipped toproduce only oil or gas from one zone or reservoir, thedefinition of a well (classified as an oil well or gas well)and the definition of a completion are identical. How-ever, if a well is equipped to produce oil and/or gasseparately from more than one reservoir, a well is notsynonymous with a completion.
Conversion Factor: A number that translates units ofone system into corresponding values of another sys-tem. Conversion factors can be used to translate physi-cal units of measure for various fuels into Btuequivalents.
Cost, Insurance, Freight (CIF): A type of sale in whichthe buyer of the product agrees to pay a unit price thatincludes the f.o.b. value of the product at the point oforigin plus all costs of insurance and transportation.This type of transaction differs from a “delivered” pur-chase in that the buyer accepts the quantity as deter-mined at the loading port (as certified by the Bill ofLoading and Quality Report) rather than pay on thebasis of the quantity and quality ascertained at theunloading port. It is similar to the terms of an f.o.b. sale,except that the seller, as a service for which he is com-pensated, arranges for transportation and insurance.
Crude Oil f.o.b. Price: The crude oil price actuallycharged at the oil-producing country’s port of loading.Includes deductions for any rebates and discounts oradditions of premiums, where applicable. It is the ac-tual price paid with no adjustment for credit terms.
Crude Oil (Including Lease Condensate): A mixture ofhydrocarbons that exists in liquid phase in under-ground reservoirs and remains liquid at atmosphericpressure after passing through surface separating facil-ities. Included are lease condensate and liquid hydro-carbons produced from tar sands, gilsonite, and oilshale. Drip gases are also included, but topped crudeoil (residual oil) and other unfinished oils are excluded.Where identifiable, liquids produced at natural gasprocessing plants and mixed with crude oil are likewiseexcluded.
Crude Oil Landed Cost: The price of crude oil at theport of discharge, including charges associated withthe purchase, transporting, and insuring of a cargofrom the purchase point to the port of discharge. Thecost does not include charges incurred at the dischargeport (e.g., import tariffs or fees, wharfage charges, anddemurrage).
Crude Oil Refinery Input: The total crude oil put intoprocessing units at refineries.
Crude Oil Stocks: Stocks of crude oil and lease conden-sate held at refineries, in pipelines, at pipeline termi-nals, and on leases.
Crude Oil Used Directly: Crude oil consumed as fuelby crude oil pipelines and on crude oil leases.
Cubic Foot (natural gas): A unit of volume equal to 1cubic foot at a pressure base of 14.73 pounds standard persquare inch absolute and a temperature base of 60o F.
Degree-Day Normals: Simple arithmetic averages ofmonthly or annual degree-days over a long period oftime (usually the 30-year period 1961-1990). The aver-ages may be simple degree-day normals or population-weighted degree-day normals.
Degree-Days, Cooling (CDD): The number of degreesper day that the daily average temperature is above 65o
F. The daily average temperature is the mean of themaximum and minimum temperatures for a 24-hourperiod.
Degree-Days, Heating (HDD): The number of degreesper day that the daily average temperature is below 65o
F. The daily average temperature is the mean of themaximum and minimum temperatures for a 24-hourperiod.
Degree-Days, Population-Weighted: Heating or cool-ing degree-days weighted by the population of the areain which the degree-days are recorded. To computeState population-weighted degree-days, each State isdivided into from one to nine climatically homoge-neous divisions, which are assigned weights based onthe ratio of the population of the division to the totalpopulation of the State. Degree-day readings for eachdivision are multiplied by the corresponding popula-tion weight for each division and those products arethen summed to arrive at the State population-weighteddegree-day figure. To compute national population-weighted degree-days, the Nation is divided into nineCensus regions comprised of from three to eight States,which are assigned weights based on the ratio of thepopulation of the region to the total population of theNation. Degree-day readings for each region are multi-plied by the corresponding population weight for eachregion and those products are then summed to arriveat the national population-weighted degree-day figure.
Design Electrical Rating, Net: The nominal net electri-cal output of a nuclear unit as specified by the electricutility for the purpose of plant design.
Development Well: A well drilled within the provedarea of an oil or gas reservoir to the depth of a strati-graphic horizon known to be productive.
Distillate Fuel Oil: A general classification for one ofthe petroleum fractions produced in conventionaldistillation operations. Included are products known asNo. 1, No. 2, and No. 4 fuel oils and No. 1, No. 2, andNo. 4 diesel fuels. It is used primarily for space heating,on- and off-highway diesel engine fuel (including rail-
Energy Information Administration/ Historical Monthly Energy Review 1973-1992360

road engine fuel and fuel for agricultural machinery),and electric power generation.
Dry Hole: An exploratory or development well foundto be incapable of producing either oil or gas in suffi-cient quantities to justify completion as an oil or gaswell.
Dry Natural Gas Production (as a decrement from gasreserves): The volume of natural gas withdrawn fromreservoirs during the report year less (1) the volumereturned to such reservoirs in cycling, repressuring ofoil reservoirs, and conservation operations; (2) shrink-age resulting from the removal of lease condensate andplant liquids; and (3) nonhydrocarbon gases, wherethey occur in sufficient quantity to render the gas un-marketable. Volumes of gas withdrawn from gas stor-age reservoirs and native gas that has been transferredto the storage category are not considered production.This is not the same as marketed production, since thelatter also excludes vented and flared gas but containsliquids.
Dry Natural Gas Production (as an increment to gassupply): Gross withdrawals from production reser-voirs less gas used in reservoir repressuring, amountsvented and flared, nonhydrocarbons removed, andvarious natural gas constituents, such as ethane, pro-pane, and butane, removed at natural gas processingplants. The parameters for measurement are 60o F and14.73 pounds standard per square inch absolute.
Electrical System Energy Losses: The amount of en-ergy lost during generation, transmission, and distribu-tion of electricity, including plant and unaccounted-foruses.
Electricity Generation: The process of producing elec-tric energy or transforming other forms of energy intoelectric energy. Also the amount of electric energy pro-duced or expressed in watthours (Wh).
Electricity Generation, Gross: The total amount of elec-tric energy produced by the generating station or sta-tions, measured at the generator terminals.
Electricity Generation, Net: Gross generation less elec-tricity consumed at the generating plant for station use.Electricity required for pumping at pumped-storageplants is regarded as plant use and is deducted fromgross generation.
Electricity Production: Net electricity (gross electricityoutput measured at generator terminals minus powerplant use) generated by publicly and privately ownedelectric utilities. Excludes industrial electricity genera-tion (except autogeneration of hydroelectric power).
Electricity Sales: The amount of kilowatthours sold ina given period of time; usually grouped by classes ofservice, such as residential, commercial, industrial, and
other. “Other” sales include sales for public street andhighway lighting and other sales to public authorities,sales to railroads and railways, and interdepartmentalsales.
Electric Power Plant: A station containing prime mov-ers, electric generators, and auxiliary equipment forconverting mechanical, chemical, and/or fission en-ergy into electric energy.
Electric Utility: A corporation, person, agency, author-ity, or other legal entity or instrumentality that ownsand/or operates facilities for the generation, transmis-sion, distribution, or sale of electric energy, primarilyfor use by the public, and that files forms listed in theCode of Federal Regulations, Title 18, Part 141. Facilitiesthat qualify as cogenerators or small power producersunder the Public Utility Regulatory Policies Act are notconsidered electric utilities.
Electric Utility Sector: The electric utility sector con-sists of privately and publicly owned establishmentsthat generate, transmit, distribute, or sell electricity pri-marily for use by the public and that meet the definitionof an electric utility. Nonutility power producers arenot included in the electric utility sector.
End-Use Sectors: The residential, commercial, indus-trial, and transportation sectors of the economy.
Energy: The capacity for doing work as measured bythe capability of doing work (potential energy) or theconversion of this capability to motion (kinetic energy).Energy has several forms, some of which are easilyconvertible and can be changed to another form usefulfor work. Most of the world’s convertible energy comesfrom fossil fuels that are burned to produce heat that isthen used as a transfer medium to mechanical or othermeans in order to accomplish tasks. Electrical energy isusually measured in kilowatthours, while heat energyis usually measured in British thermal units.
Energy Consumption: The use of energy as a source ofheat or power or as an input in the manufacturingprocess.
Energy Consumption, End-Use: Primary end-use energyconsumption is the sum of fossil fuel consumption by thefour end-use sectors (residential, commercial, indus-trial, and transportation) and generation of hydroelec-tric power by nonelectric utilities. Net end-use energyconsumption includes electric utility sales to those sec-tors but excludes electrical system energy losses. Totalend-use energy consumption includes both electric utilitysales to the four end-use sectors and electrical systemenergy losses.
Energy Consumption, Total: The sum of fossil fuelconsumption by the five sectors (residential, commer-cial, industrial, transportation, and electric utility) plushydroelectric power, nuclear electric power, net im-
Energy Information Administration/ Historical Monthly Energy Review 1973-1992 361

ports of coal coke, and electricity generated for distri-bution from wood, waste, geothermal, wind, photovol-taic, and solar thermal energy.
Energy Source: A substance, such as petroleum, naturalgas, or coal, that supplies heat or power. In EnergyInformation Administration reports, electricity and re-newable forms of energy, such as biomass, geothermal,wind, and solar, are considered to be energy sources.
Ethane: A normally gaseous straight-chain hydrocar-bon (C2H6). It is a colorless, paraffinic gas that boils ata temperature of -127.48o F. It is extracted from naturalgas and refinery gas streams.
Ethylene: An olefinic hydrocarbon (C2H4) recoveredfrom refinery processes or petrochemical processes.
Exploratory Well: A well drilled to find and produceoil or gas in an unproved area, to find a new reservoirin a field previously found to be productive of oil or gasin another reservoir, or to extend the limit of a knownoil or gas reservoir.
Exports: Shipments of goods from the 50 States and theDistrict of Columbia to foreign countries and to PuertoRico, the Virgin Islands, and other U.S. possessions andterritories.
f.a.s.: See Free Alongside Ship.
Federal Energy Regulatory Commission (FERC): TheFederal agency with jurisdiction over interstate electric-ity sales, wholesale electric rates, hydroelectric licens-ing, natural gas pricing, oil pipeline rates, and gaspipeline certification. FERC is an independent regula-tory agency within the Department of Energy and is thesuccessor to the Federal Power Commission.
Federal Power Commission (FPC): The predecessoragency of the Federal Energy Regulatory Commission.The Federal Power Commission was created by an Actof Congress under the Federal Water Power Act on June10, 1920. It was charged originally with regulating theelectric power and natural gas industries. It was abol-ished on September 30, 1977, when the Department ofEnergy was created. Its functions were divided be-tween the Department of Energy and the Federal En-ergy Regulatory Commission, an independentregulatory agency.
First Purchase Price: The marketed first sales price ofdomestic crude oil, consistent with the removal pricedefined by the provisions of the Windfall Profits Tax onDomestic Crude Oil (Public Law 96-223, Sec. 4998 (c)).
Flared Natural Gas: Natural gas burned in flares on thebase site or at gas processing plants.
f.o.b.: See Free on Board.
Footage Drilled: Total footage for wells in various cat-egories, as reported for any specified period, includes(1) the deepest total depth (length of well bores) of allwells drilled from the surface, (2) the total of all by-passed footage drilled in connection with reportedwells, and (3) all new footage drilled for directionalsidetrack wells. Footage reported for directional side-track wells does not include footage in the commonbore, which is reported as footage for the original well.In the case of old wells drilled deeper, the reportedfootage is that which was drilled below the total depthof the old well.
Former U.S.S.R.: See U.S.S.R.
Fossil Fuel: Any naturally occurring organic fuel, suchas petroleum, coal, and natural gas.
Fossil Fuel Steam-Electric Power Plant: An electricitygeneration plant in which the prime mover is a turbinerotated by high-pressure steam produced in a boiler byheat from burning fossil fuels.
Free Alongside Ship (f.a.s.): The value of a commodityat the port of exportation, generally including the pur-chase price, plus all charges incurred in placing thecommodity alongside the carrier at the port of exporta-tion.
Free on Board (f.o.b.): A transaction whereby the sellermakes the product available within an agreed-on periodat a given port at a given price. It is the responsibility ofthe buyer to arrange for the transportation and insurance.
Fuel Ethanol: An anhydrous, denatured aliphatic alco-hol (C2H5OH) intended for motor gasoline blending.
Full-Power Operation: Operation of a nuclear generat-ing unit at 100 percent of its design capacity. Full-poweroperation precedes commercial operation.
Gasohol: A blend of finished motor gasoline (leaded orunleaded) and alcohol (generally ethanol but some-times methanol) limited to 10 percent by volume ofalcohol. Gasohol is included in finished leaded andunleaded motor gasoline.
Gas-Turbine Electric Power Plant: A plant in which theprime mover is a gas turbine. A gas turbine typicallyconsists of an axial-flow air compressor, one or morecombustion chambers where liquid or gaseous fuel isburned and the hot gases expand to drive the generatorand then are used to run the compressor.
Gas Well: A well completed for the production of nat-ural gas from one or more gas zones or reservoirs.(Wells producing both crude oil and natural gas areclassified as oil wells.)
Energy Information Administration/ Historical Monthly Energy Review 1973-1992362

Geothermal Energy: Energy from the internal heat ofthe Earth, which may be residual heat, friction heat, ora result of radioactive decay. The heat is found in rocksand fluids at various depths and can be extracted bydrilling and/or pumping.
Geothermal Energy (as used at electric utilities): Hotwater or steam extracted from geothermal reservoirs inthe Earth’s crust and supplied to steam turbines at elec-tric utilities that drive generators to produce electricity.
Gross Domestic Product (GDP): The total value ofgoods and services produced by labor and propertylocated in the United States. As long as the labor andproperty are located in the United States, the supplier(that is, the workers and, for property, the owners) maybe either U.S. residents or residents of foreign countries.
Heat Content of a Quantity of Fuel, Gross: The totalamount of heat released when a fuel is burned. Coal,crude oil, and natural gas all include chemical com-pounds of carbon and hydrogen. When those fuels areburned, the carbon and hydrogen combine with oxygenin the air to produce carbon dioxide and water. Someof the energy released in burning goes into transform-ing the water into steam and is usually lost. The amountof heat spent in transforming the water into steam iscounted as part of gross heat content but is not countedas part of net heat content. Also referred to as the higherheating value. Btu conversion factors typically used inEIA represent gross heat content.
Heat Content of a Quantity of Fuel, Net: The amountof usable heat energy released when a fuel is burnedunder conditions similar to those in which it is normallyused. Also referred to as the lower heating value. Btuconversion factors typically used in EIA represent grossheat content.
Heavy Oil: The fuel oils remaining after the lighter oilshave been distilled off during the refining process. Ex-cept for start-up and flame stabilization, virtually allpetroleum used in steam-electric power plants is heavyoil.
Hydrocarbon: An organic chemical compound of hy-drogen and carbon in the gaseous, liquid, or solidphase. The molecular structure of hydrocarbon com-pounds varies from the simplest (methane, the primaryconstituent of natural gas) to the very heavy and verycomplex.
Hydroelectric Power: The production of electricityfrom the kinetic energy of falling water.
Hydroelectric Power Plant: A plant in which the tur-bine generators are driven by falling water.
Imports: Receipts of goods into the 50 States and theDistrict of Columbia from foreign countries and from
Puerto Rico, the Virgin Islands, and other U.S. posses-sions and territories.
Industrial Sector: The industrial sector comprises man-ufacturing industries, which make up the largest partof this sector, along with mining, construction, agricul-ture, fisheries, and forestry. Establishments in this sec-tor range from steel mills, to small farms, to companiesassembling electronic components.
Internal Combustion Electric Power Plant: A powerplant in which the prime mover is an internal combus-tion engine. Diesel or gas-fired engines are the principaltypes used in electric power plants. The plant is usuallyoperated during periods of high demand for electricity.
Jet Fuel: The term includes kerosene-type jet fuel andnaphtha-type jet fuel. Kerosene-type jet fuel is a kero-sene-quality product used primarily for commercialturbojet and turboprop aircraft engines. Naphtha-typejet fuel is a fuel in the heavy naphthas range usedprimarily for military turbojet and turboprop aircraftengines.
Kerosene: A petroleum distillate that has a maximumdistillation temperature of 401o F at the 10-percent re-covery point, a final boiling point of 572o F, and aminimum flash point of 100o F. Included are the twogrades designated in ASTM D3699 (No. 1-K and No.2-K) and all grades of kerosene called range or stove oil.Kerosene is used in space heaters, cook stoves, andwater heaters; it is suitable for use as an illuminantwhen burned in wick lamps.
Lease and Plant Fuel: Natural gas used in well, field,and lease operations (such as gas used in drilling oper-ations, heaters, dehydrators, and field compressors),and as fuel in natural gas processing plants.
Lease Condensate: A natural gas liquid recoveredfrom gas well gas (associated and non-associated) inlease separators or natural gas field facilities. Leasecondensate consists primarily of pentanes and heavierhydrocarbons.
Light Oil: Lighter fuel oils distilled off during the refin-ing process. Virtually all petroleum used in internalcombustion and gas-turbine engines is light oil.
Lignite: A brownish-black coal of low rank with a highcontent of moisture and volatile matter. Often referredto as brown coal. It is used almost exclusively for elec-tric power generation. It conforms to ASTM Specifica-tion D388-84 for lignite.
Liquefied Natural Gas (LNG): Natural gas (primarilymethane) that has been liquefied by reducing its tem-perature to -260o F at atmospheric pressure.
Energy Information Administration/ Historical Monthly Energy Review 1973-1992 363

Liquefied Petroleum Gases (LPG): Ethane, ethylene,propane, propylene, normal butane, butylene, andisobutane produced at refineries or natural gas process-ing plants, including plants that fractionate new naturalgas plant liquids.
Low-Power Testing: The period of time between anuclear generating unit’s initial fuel loading date andthe issuance of its operating (full-power) license. Themaximum level of operation during that period is 5percent of the unit’s design thermal rating.
Lubricants: Substances used to reduce friction betweenbearing surfaces or as process materials either incorpo-rated into other materials used as processing aids in themanufacturing of other products or as carriers of othermaterials. Petroleum lubricants may be produced ei-ther from distillates or residues. Other substances maybe added to impart or improve certain required prop-erties. Excluded are byproducts of lubricating oil refin-ing, such as aromatic extracts derived from solventextraction or tars derived from deasphalting. Includedare all grades of lubricating oils from spindle oil tocylinder oil and those used in greases. Lubricant cate-gories are paraffinic and naphthenic.
Marketed Production: Gross withdrawals less gas usedfor repressuring, quantities vented and flared, and non-hydrocarbon gases removed in treating or processingoperations. Includes all quantities of gas used in fieldand processing operations.
Methanol: A light, volatile alcohol (CH3OH) eligiblefor motor gasoline blending.
Miscellaneous Petroleum Products: All finished petro-leum products not classified elsewhere—for example,petrolatum, lube refining byproducts (aromatic ex-tracts and tars), absorption oils, ram-jet fuel, petroleumrocket fuels, synthetic natural gas feedstocks, and spe-cialty oils.
Motor Gasoline Blending Components: Naphthasthat will be used for blending or compounding intofinished motor gasoline (e.g., straight-run gasoline, al-kylate, reformate, benzene, toluene, and zylene). Ex-cluded are oxygenates (alcohols and ethers), butane,and pentanes plus.
Motor Gasoline, Finished: A complex mixture of rela-tively volatile hydrocarbons, with or without smallquantities of additives, that has been blended to form afuel suitable for use in spark-ignition engines. Motorgasoline, as given in ASTM Specification D439 or Fed-eral Specification VV-G-1690B, includes a range in dis-tillation temperatures from 122 to 158o F at the10-percent recovery point and from 365 to 374o F at the90-percent recovery point. Motor gasoline includes fin-ished leaded gasoline, finished unleaded gasoline, andgasohol. Blendstock is excluded until blending has been
completed. Alcohol that is to be used in the blending ofgasohol is also excluded.
Motor Gasoline, Finished Gasohol: A blend of fin-ished motor gasoline (leaded or unleaded) and alcohol(generally ethanol, but sometimes methanol) in which10 percent or more of the product is alcohol.
Motor Gasoline, Finished Leaded: Motor gasoline thatcontains more than 0.05 gram of lead per gallon or morethan 0.005 gram of phosphorus per gallon. Premiumand regular grades are included, depending on theoctane rating. Includes leaded gasohol. Blendstock isexcluded until blending has been completed. Alcoholthat is to be used in the blending of gasohol is alsoexcluded.
Motor Gasoline, Finished Leaded Premium: Motorgasoline having an antiknock index, calculated as(R+M)/2, greater than 90 and containing more than 0.05gram of lead per gallon or more than 0.005 gram ofphosphorus per gallon.
Motor Gasoline, Finished Leaded Regular: Motor gas-oline having an antiknock index, calculated as(R+M)/2, greater than or equal to 87 and less than orequal to 90 and containing more than 0.05 gram of leador 0.005 gram of phosphorus per gallon.
Motor Gasoline, Finished Unleaded: Motor gasolinecontaining not more than 0.05 gram of lead per gallonand not more than 0.005 gram of phosphorus per gal-lon. Premium and regular grades are included, depend-ing on the octane rating. Includes unleaded gasohol.Blendstock is excluded until blending has been com-pleted. Alcohol that is to be used in the blending ofgasohol is also excluded.
Motor Gasoline, Finished Unleaded Midgrade: Motorgasoline having an antiknock index, calculated as(R+M)/2, greater than or equal to 88 and less than orequal to 90 and containing not more than 0.05 gram ofphosphorus per gallon.
Motor Gasoline, Finished Unleaded Premium: Motorgasoline having an antiknock index, calculated as(R+M)/2, greater than 90 and containing not more than0.05 gram of lead or 0.005 gram of phosphorus pergallon.
Motor Gasoline, Finished Unleaded Regular: Motorgasoline having an antiknock index, calculated as(R+M)/2, of 87 containing not more than 0.05 gram oflead per gallon and not more than 0.005 gram of phos-phorus per gallon.
Motor Gasoline Retail Prices: Motor gasoline pricescalculated each month by the Bureau of Labor Statistics(BLS) in conjunction with the construction of the Con-sumer Price Index (CPI). Those prices are collected in85 urban areas selected to represent all urban consum-
Energy Information Administration/ Historical Monthly Energy Review 1973-1992364
ers—about 80 percent of the total U.S. population. Theservice stations are selected initially, and on a replace-ment basis, in such a way that they represent the pur-chasing habits of the CPI population. Service stations inthe current sample include those providing all types ofservice (i.e., full-, mini-, and self-service).
Motor Gasoline, Total: Includes finished leaded motorgasoline (premium and regular), finished unleadedmotor gasoline (premium, midgrade, and regular),motor gasoline blending components, and gasohol.
MTBE (Methyl Tertiary Butyl Ether): An ether,(CH3)3COCH3, intended for motor gasoline blending.
Naphtha: A genetic term applied to a petroleum frac-tion with an approximate boiling range between 122and 400o F.
Natural Gas: A mixture of hydrocarbons (principallymethane) and small quantities of various non-hydrocarbons existing in the gaseous phase or in solu-tion with crude oil in underground reservoirs.
Natural Gas, Dry: The marketable portion of naturalgas production, which is obtained by subtracting ex-traction losses, including natural gas liquids removedat natural gas processing plants, from total production.
Natural Gas Marketed Production: Gross withdrawalsof natural gas from production reservoirs, less gas usedfor reservoir repressuring; nonhydrocarbon gases re-moved in treating and processing operations; andquantities vented and flared.
Natural Gas Plant Liquids (NGPL): Natural gas liq-uids recovered from natural gas in processing plantsand, in some situations, from natural gas field facilities,as well as those extracted by fractionators. Natural gasplant liquids are defined according to the publishedspecifications of the Gas Processors Association and theAmerican Society for Testing and Materials as follows:ethane, propane, normal butane, isobutane, pentanesplus, and other products from natural gas processingplants (i.e., products meeting the standards for finishedpetroleum products produced at natural gas processingplants, such as finished motor gasoline, finished avia-tion gasoline, special naphthas, kerosene, distillate fueloil, and miscellaneous products).
Natural Gas Wellhead Price: The wellhead price ofnatural gas is calculated by dividing the total reportedvalue at the wellhead by the total quantity producedas reported by the appropriate agencies of individualproducing States and the U.S. Minerals ManagementService. The price includes all costs prior to shipmentfrom the lease, including gathering and compressioncosts, in addition to State production, severance, andsimilar charges.
Natural Gas, Wet: Natural gas prior to the extraction ofliquids and other miscellaneous products.
Net Consumption: See Energy Consumption, End-Use.
Nonhydrocarbon Gases: Typical nonhydrocarbongases that may be present in reservoir natural gas arecarbon dioxide, helium, hydrogen sulfide, and nitrogen.
Nuclear Electric Power: Electricity generated by anelectric power plant whose turbines are driven bysteam generated in a reactor by heat from the fissioningof nuclear fuel.
Nuclear Electric Power Plant: A single-unit or multi-unit facility in which heat produced in one or morereactors by the fissioning of nuclear fuel is used to driveone or more steam turbines.
Nuclear Reactor: An apparatus in which the nuclearfission chain can be initiated, maintained, and controlledso that energy is released at a specific rate. The reactorincludes fissionable material (fuel), such as uranium orplutonium; fertile material; moderating material (unlessit is a fast reactor); a heavy-walled pressure vessel;shielding to protect personnel; provision for heat re-moval; and control elements and instrumentation.
Offshore: That geographic area that lies seaward of thecoastline. In general, the coastline is the line of ordinarylow water along with that portion of the coast that is indirect contact with the open sea or the line marking theseaward limit of inland water.
Oil: See Crude Oil (Including Lease Condensate).
Oil Well: A well completed for the production of crudeoil from one or more oil zones or reservoirs. Wellsproducing both crude oil and natural gas are classifiedas oil wells.
Operable (nuclear): A U.S. nuclear generating unit isconsidered operable after it completes low-power test-ing and is issued a full-power operating license by theNuclear Regulatory Commission. A foreign nucleargenerating unit is considered operable once it has gen-erated electricity to the grid.
Organization for Economic Cooperation and Devel-opment (OECD): Current members are Australia, Aus-tria, Belgium, Canada, Denmark, Finland, France,Greece, Iceland, Ireland, Italy, Japan, Luxembourg, theNetherlands, New Zealand, Norway, Portugal, Spain,Sweden, Switzerland, Turkey, the United Kingdom, theUnited States and its territories (Guam, Puerto Rico,and the Virgin Islands), and Germany.
Organization of Petroleum Exporting Countries(OPEC): Countries that have organized for the purpose
Energy Information Administration/ Historical Monthly Energy Review 1973-1992 365

of negotiating with oil companies on matters of oilproduction, prices, and future concession rights. Cur-rent members are Algeria, Gabon, Indonesia, Iran, Iraq,Kuwait, Libya, Nigeria, Qatar, Saudi Arabia, the UnitedArab Emirates, and Venezuela.
Pentanes Plus: A mixture of hydrocarbons, mostly pen-tanes and heavier, extracted from natural gas. Includesisopentane, natural gasoline, and plant condensate.
Petrochemical Feedstocks: Chemical feedstocks de-rived from petroleum principally for the manufactureof chemicals, synthetic rubber, and a variety of plastics.
Petroleum: A generic term applied to oil and oil prod-ucts in all forms, such as crude oil, lease condensate,unfinished oils, petroleum products, natural gas plantliquids, and nonhydrocarbon compounds blended intofinished petroleum products.
Petroleum Coke: A residue that is the final product ofthe condensation process in cracking. The product iseither marketable petroleum coke or catalyst petroleumcoke.
Petroleum Coke, Catalyst: The carbonaceous residuethat is deposited on and deactivates the catalyst used inmany catalytic operations (e.g., catalytic cracking). Car-bon is deposited on the catalyst, thus deactivating thecatalyst. The catalyst is reactivated by burning off thecarbon, which is used as a fuel in the refining process.That carbon or coke is not recoverable in a concentratedform.
Petroleum Coke, Marketable: Those grades of cokeproduced in delayed or fluid cokers that may be recov-ered as relatively pure carbon. Marketable petroleumcoke may be sold as is or further purified by calcining.
Petroleum Consumption: The sum of all refined petro-leum products supplied. For each refined petroleumproduct, the amount supplied is calculated by addingproduction and imports, then subtracting changes inprimary stocks (net withdrawals are a plus quantityand net additions are a minus quantity) and exports.
Petroleum Imports: Imports of petroleum into the 50States and the District of Columbia from foreign coun-tries and from Puerto Rico, the Virgin Islands, and otherU.S. territories and possessions. Included are importsfor the Strategic Petroleum Reserve and withdrawalsfrom bonded warehouses for onshore consumption,offshore bunker use, and military use. Excluded arereceipts of foreign petroleum into bonded warehousesand into U.S. territories and U.S. Foreign Trade Zones.
Petroleum Products: Products obtained from the pro-cessing of crude oil (including lease condensate), natu-ral gas, and other hydrocarbon compounds. Petroleumproducts include unfinished oils, liquefied petroleumgases, pentanes plus, aviation gasoline, motor gasoline,
naphtha-type jet fuel, kerosene-type jet fuel, kerosene,distillate fuel oil, residual fuel oil, petrochemical feed-stocks, special naphthas, lubricants, waxes, petroleumcoke, asphalt, road oil, still gas, and miscellaneousproducts.
Petroleum Products Supplied: See Petroleum Con-sumption.
Petroleum Stocks, Primary: For individual products,quantities that are held at refineries, in pipelines, and atbulk terminals that have a capacity of 50,000 barrels ormore, or that are in transit thereto. Stocks held byproduct retailers and resellers, as well as tertiary stocksheld at the point of consumption, are excluded. Stocksof individual products held at gas processing plants areexcluded from individual product estimates but areincluded in other oils estimates and total.
Photovoltaic and Solar Thermal Energy (as used atelectric utilities): Energy radiated by the sun as electro-magnetic waves (electromagnetic radiation) that is con-verted at electric utilities into electricity by means ofsolar (photovoltaic) cells or concentrating (focusing)collectors.
Pipeline Fuel: Gas consumed in the operation of pipe-lines, primarily in compressors.
Primary Consumption: See Energy Consumption,End-Use.
Propane: A normally gaseous straight-chain hydrocar-bon (C3H8). It is a colorless paraffinic gas that boils at atemperature of -43.67o F. It is extracted from natural gasor refinery gas streams. It includes all products desig-nated in ASTM Specification D1835 and Gas ProcessorsAssociation Specifications for commercial propane andHD-5 propane.
Propylene: An olefinic hydrocarbon (C3H6) recoveredfrom refinery or petrochemical processes.
Refiner Acquisition Cost of Crude Oil: The cost ofcrude oil to the refiner, including transportation andfees. The composite cost is the weighted average ofdomestic and imported crude oil costs.
Refinery (petroleum): An installation that manufac-tures finished petroleum products from crude oil, un-finished oils, natural gas liquids, other hydrocarbons,and alcohol.
Renewable Energy: Energy obtained from sources thatare essentially inexhaustible (unlike, for example, thefossil fuels, of which there is a finite supply). Renewablesources of energy include wood, waste, photovoltaic,and solar thermal energy.
Energy Information Administration/ Historical Monthly Energy Review 1973-1992366

Repressuring: The injection of a pressurized fluid (suchas air, gas, or water) into oil and gas reservoir forma-tions to effect greater ultimate recovery.
Residential Sector: The residential sector is consideredto consist of all private residences, whether occupied orvacant, owned or rented, including single-familyhomes, multifamily housing units, and mobile homes.Secondary homes, such as summer homes, are alsoincluded. Institutional housing, such as school dormi-tories, hospitals, and military barracks, generally arenot included in the residential sector; they are includedin the commercial sector.
Residual Fuel Oil: The heavier oils that remain after thedistillate fuel oils and lighter hydrocarbons are distilledaway in refinery operations and that conform to ASTMSpecifications D396 and 975. Included are No. 5, a re-sidual fuel oil of medium viscosity; Navy Special, foruse in steam-powered vessels in government serviceand in shore power plants; and No. 6, which includesBunker C fuel oil and is used for commercial and indus-trial heating, electricity generation, and to power ships.Imports of residual fuel oil include imported crude oilburned as fuel.
Road Oil: Any heavy petroleum oil, including residualasphaltic oil used as a dust palliative and surface treat-ment on roads and highways. It is generally producedin six grades, from 0, the most liquid, to 5, the mostviscous.
Rotary Rig: A machine used for drilling wells thatemploys a rotating tube attached to a bit for boringholes through rock.
Short Ton (coal): A unit of weight equal to 2,000pounds.
SIC: See Standard Industrial Classification.
Solar Energy: The radiant energy of the sun, which canbe converted into other forms of energy, such as heat orelectricity.
Standard Industrial Classification (SIC): A set ofcodes developed by the Office of Management andBudget which categorizes industries into groups withsimilar economic activities.
Startup Test Phase of Nuclear Power Plant: A nuclearpower plant that has been licensed by the NuclearRegulatory Commission to operate but is still in theinitial testing phase, during which the production ofelectricity may not be continuous. In general, when theelectric utility is satisfied with the plant’s performance,it formally accepts the plant from the manufacturerand places it in commercial operation status. A requestis then submitted to the appropriate utility rate com-mission to include the power plant in the rate basecalculation.
Steam-Electric Power Plant: A plant in which the primemover is a steam turbine. The steam used to drive theturbine is produced in a boiler where fossil fuels areburned.
Strategic Petroleum Reserve (SPR): Petroleum stocksmaintained by the Federal Government for use duringperiods of major supply interruption.
Subbituminous Coal: A dull, black coal of rank inter-mediate between lignite and bituminous coal. It con-forms to ASTM Specification D388-84 forsubbituminous coal.
Supplemental Gaseous Fuels: Any gaseous substancethat, introduced into or commingled with natural gas,increases the volume available for disposition. Suchsubstances include, but are not limited to, propane-air,refinery gas, coke oven gas, still gas, manufacturedgas, biomass gas, or air or inert gases added for Btustabilization.
Synthetic Natural Gas (SNG): A manufactured prod-uct chemically similar in most respects to natural gas,resulting from the conversion or reforming of petro-leum hydrocarbons. It may easily be substituted for, orinterchanged with, pipeline quality natural gas. Alsoreferred to as substitute natural gas.
Total Consumption: See Energy Consumption, End-Use.
Transportation Sector: The transportation sector con-sists of private and public vehicles that move peopleand commodities. Included are automobiles, trucks,buses, motorcycles, railroads and railways (includingstreetcars), aircraft, ships, barges, and natural gas pipe-lines.
Unaccounted-for Crude Oil: Arithmetic difference be-tween the calculated supply and the calculated dispo-sition of crude oil. The calculated supply is the sum ofcrude oil production and imports, less changes in crudeoil stocks. The calculated disposition of crude oil is thesum of crude oil input to refineries, crude oil exports,crude oil burned as fuel, and crude oil losses.
Underground Storage: The storage of natural gas inunderground reservoirs at a different location fromwhich it was produced.
United States: Unless otherwise noted, “UnitedStates” in this publication means the 50 States and theDistrict of Columbia. U.S. exports include shipmentsto U.S. territories, and imports include receipts fromU.S. territories.
U.S.S.R.: The Union of Soviet Socialist Republics con-sisted of 15 constituent republics: Armenia, Azerbaijan,Belarus, Estonia, Georgia, Kazakhstan, Kyrgyzstan,
Energy Information Administration/ Historical Monthly Energy Review 1973-1992 367
Latvia, Lithuania, Moldova, Russia, Tajikistan,Turkmenistan, Ukraine, and Uzbekistan. As a politicalentity, the U.S.S.R. ceased to exist as of December 31,1991.
Vented Natural Gas: Gas released into the air on thebase site or at processing plants.
Wellhead Price: The value of crude oil or natural gas atthe mouth of the well.
Well Servicing Unit: Truck-mounted equipment gen-erally used for downhole services after a well is drilled.Services include well completions and recompletions,maintenance, repairs, workovers, and well pluggingand abandonments. Jobs range from minor operations,such as pulling the rods and rod pumps out of an oilwell, replacing the pump and rerunning the assem-blage into the well, to major workovers, such as millingout and repairing collapsed casing. Well depth andcharacteristics determine the type of equipment used.
Wind Energy (as used at electric utilities): The kineticenergy of wind converted at electric utilities into me-chanical energy by wind turbines (i.e., blades rotatingfrom a hub) that drive generators to produce electricityfor distribution.
Wood and Waste (as used at electric utilities): Woodenergy, garbage, bagasse, sewerage gas, and other in-dustrial, agricultural, and urban refuse used to generateelectricity for distribution.
Wood Energy: Wood and wood products used as fuel,including round wood (cord wood), limb wood, woodchips, bark, sawdust, forest residues, charcoal, pulpwaste, and spent pulping liquor.
Working Gas: The gas in a reservoir that is in additionto the base (cushion) gas. It may or may not be com-pletely withdrawn during any particular withdrawalseason. Conditions permitting, the total working capacitycould be used more than once during any given season.
Energy Information Administration/ Historical Monthly Energy Review 1973-1992368

Historical Integrated Energy Data Reportsfrom the Energy Information Administration
The Monthly Energy Review* (DOE/EIA–0035) presents current monthly data on production, consumption, stocks,imports, exports, and prices of the principal energy commodities in the United States. Also included are data oninternational production of crude oil, consumption of petroleum products, petroleum stocks, and production ofelectricity from nuclear-powered facilities.
The Historical Monthly Energy Review* (DOE/EIA–0035(73–92)) presents monthly data from January 1973 throughDecember 1992 for most of the series that are published for current months only in the Monthly Energy Review.
The Annual Energy Review* (DOE/EIA–0384) presents long-term historical annual energy data. Most series beginin 1949. U.S. energy consumption, production, trade, and prices are included. Major sections of the report are energyoverview, consumption indicators, financial indicators, energy resources, petroleum, natural gas, coal, electricity,nuclear energy, renewable energy, and international energy.
The State Energy Data Report* (DOE/EIA–0214) presents estimates of annual energy consumption at the State andnational levels by major sector (i.e., residential, commercial, industrial, transportation, and electric utilities) and byprincipal energy type for selected years. The base year is 1960. The report includes documentation of the consump-tion estimates for each source of energy, the sources of all data, and a summary of changes made to historical datain the report since its previous release.
The State Energy Price and Expenditure Report* (DOE/EIA–0376) presents annual energy price and expenditureestimates at the State and national levels for selected years. The base year is 1970. The estimates are presented byenergy source (e.g., petroleum, natural gas, coal, and electricity) and by major sector (i.e., residential, commercial,industrial, transportation, and electric utilities). The report includes documentation of the price estimates for eachtype of energy, the sources of all data, and a summary of any changes made to historical data in the report since itsprevious release
The International Energy Annual (DOE/EIA–0219) presents annual data for production, consumption, imports, andexports of primary energy commodities in more than 190 countries, dependencies, and areas of special sovereignty.Also included are prices of crude oil and petroleum products in selected countries. The data presented are derivedlargely from national publications, international organizations, and other authoritative sources. The data areconverted to units of measurement and thermal values familiar to the American public.
The International Petroleum Statistics Report (DOE/EIA–0520) presents current monthly international petroleumdata on production, consumption, imports, and stocks. Included are oil consumption and stocks for specific countriesin the Organization for Economic Cooperation and Development (OECD). Also provided are the oil supply-consumption balances for the world in quarterly intervals and oil imports by OECD countries.
*Data for this report are also available on computer diskettes
For further information, contact the: National Energy Information Center, EI-231 Energy Information Administration Forrestal Building, Room 1F-048 Washington, DC 20585 202-586-8800, 9 a.m. to 5 p.m., eastern time, M-F Internet: [email protected]
TTY: For people who are deaf or hard of hearing: 202-586-1181