Historical Disturbance and Contemporary Floodplain ...
23
Full Terms & Conditions of access and use can be found at https://www.tandfonline.com/action/journalInformation?journalCode=tphy20 Physical Geography ISSN: 0272-3646 (Print) 1930-0557 (Online) Journal homepage: https://www.tandfonline.com/loi/tphy20 Historical Disturbance and Contemporary Floodplain Development along an Ozark River, Southwest Missouri Marc R. Owen , Robert T. Pavlowsky & Patrick J. Womble To cite this article: Marc R. Owen , Robert T. Pavlowsky & Patrick J. Womble (2011) Historical Disturbance and Contemporary Floodplain Development along an Ozark River, Southwest Missouri, Physical Geography, 32:5, 423-444, DOI: 10.2747/0272-3646.32.5.423 To link to this article: https://doi.org/10.2747/0272-3646.32.5.423 Published online: 15 May 2013. Submit your article to this journal Article views: 96 View related articles Citing articles: 7 View citing articles
Transcript of Historical Disturbance and Contemporary Floodplain ...
Full Terms & Conditions of access and use can be found athttps://www.tandfonline.com/action/journalInformation?journalCode=tphy20
Physical Geography
ISSN: 0272-3646 (Print) 1930-0557 (Online) Journal homepage: https://www.tandfonline.com/loi/tphy20
Historical Disturbance and ContemporaryFloodplain Development along an Ozark River,Southwest Missouri
Marc R. Owen , Robert T. Pavlowsky & Patrick J. Womble
To cite this article: Marc R. Owen , Robert T. Pavlowsky & Patrick J. Womble (2011) HistoricalDisturbance and Contemporary Floodplain Development along an Ozark River, SouthwestMissouri, Physical Geography, 32:5, 423-444, DOI: 10.2747/0272-3646.32.5.423
To link to this article: https://doi.org/10.2747/0272-3646.32.5.423
Published online: 15 May 2013.
Submit your article to this journal
Article views: 96
View related articles
Citing articles: 7 View citing articles
423
Physical Geography, 2011, 32, 5, pp. 423–444. http://dx.doi.org/10.2747/0272-3646.32.5.423Copyright © 2011 by Bellwether Publishing, Ltd. All rights reserved.
HISTORICAL DISTURBANCE AND CONTEMPORARY FLOODPLAIN DEVELOPMENT ALONG AN OZARK RIVER, SOUTHWEST MISSOURI
Marc R. Owen and Robert T. PavlowskyOzarks Environmental and Water Resources Institute
Missouri State University 901 S. National Avenue
Springfield, Missouri 65897
Patrick J. WombleSierra Nevada Research Institute University of California, Merced
5200 North Lake Road Merced, California 95343
Abstract: The James River Basin (3,770 km2) in the Ozark Plateaus of Missouri was largely settled by the 1850s. However, little is known about how it responded to and recov-ered from early land disturbance. This study characterizes the distribution and thickness of historical overbank sedimentation along the upper James River through topographic surveys, subsurface floodplain sediment sampling, and historical aerial photo analysis. Stratigraphic markers used for this study include buried soils, metal tracers from mining operations, and cesium-137. Between 0.5 and 1 m of overbank deposition occurred on floodplains since settlement, with the highest rates coinciding with peak corn production in the late 1800s. A contemporary shelf has been developing in disturbance reaches since the 1880s. However, aerial photo records show that much of the channel has been stable since the 1950s. Current channel capacity at the floodplain stage is near the Q1.5 year flood, suggesting that it is adjusted to the current flood regime. However, the shelf forming below the floodplain stage in disturbance reaches may indicate that channels are still recovering from past disturbance. Apparently, Ozark rivers responded quickly to land disturbance, but recovery has lagged, perhaps due to decreased sediment loads following agricultural con-version to pasture and implementation of soil conservation practices. [Key words: Ozark Plateaus, floodplain deposition, mining pollution.]
INTRODUCTION
Human activities have changed the hydrologic and sediment delivery dynamics of streams in the Ozark Plateaus (referred to hereafter as the Ozarks) during histori-cal time. Land clearing, timber harvest, cultivation, and overgrazing between 1880 and 1920 increased erosion rates on uplands, hillslopes, and along the valley bot-tom in the Ozarks, releasing chert gravel and fine-grained sediment to the channel network (Jacobson and Primm, 1997). Excessive chert gravel deposition was the primary cause of dramatic channel planform changes described as sedimentation zones by Saucier (1983) and later called disturbance reaches by McKenney et al. (1995). Jacobson and Gran (1999) suggest that disturbance reaches form where the
424 OWEN ET AL.
channel meets the bluff, and flow and sediment transport are reduced during flood events, causing gravel deposition. While extensive chert gravel bars are known to be a key indicator of channel disturbance in Ozark streams, fine-grained sediment was also eroded from the uplands during historical time due to cultivation (Jacobson and Primm 1997). However, little is known of its fate due to both limited data on histori-cal floodplain stratigraphy and the lack of suspended sediment data in the Ozarks (Jacobson, 2004).
Historical floodplain deposits store both fine and coarse sediment and tend to con-tain a record of lateral and vertical channel adjustments to changes in environmen-tal conditions (Jacobson and Coleman, 1986; Walling, 1999; Lecce and Pavlowsky, 2001). Floodplain sediment dating techniques that determine relative age have been used to identify historical deposition patterns (e.g., Raab et al., 2010), including identification of buried soils (Knox, 1977; Magilligan, 1985), geochemical identi-fication of historical mining sediment (Knox, 1987; Lecce and Pavlowsky, 2001), and 137Cs fallout from nuclear weapons testing beginning in the 1950s (Walling et al., 1992; Faulkner and McIntyre, 1996; Stam, 1999). In the Ozarks, trace metal and 137Cs studies have been used to document historical floodplain sedimentation in lower valleys of small tributaries, but little is known about historical main valley floodplain deposition in the region (Carlson, 1999; Trimble, 2001; Rodgers, 2005; Womble, 2009).
The purpose of this study is to characterize historical floodplain deposition and explain its relationship to present-day channel morphology in the James River near Springfield, Missouri. The study area was chosen because floodplain deposits could be dated by historical mining contaminants and discharge records are available from a nearby USGS gaging station. The objectives of this study are to: (1) characterize present-day floodplain morphology, stratigraphy, and hydrology; and (2) determine historical floodplain sedimentation (post-1850) patterns and rates using buried A horizons, mining contamination, 137Cs profiles, and historical aerial photography.
STUDY AREA
Physiographic Setting
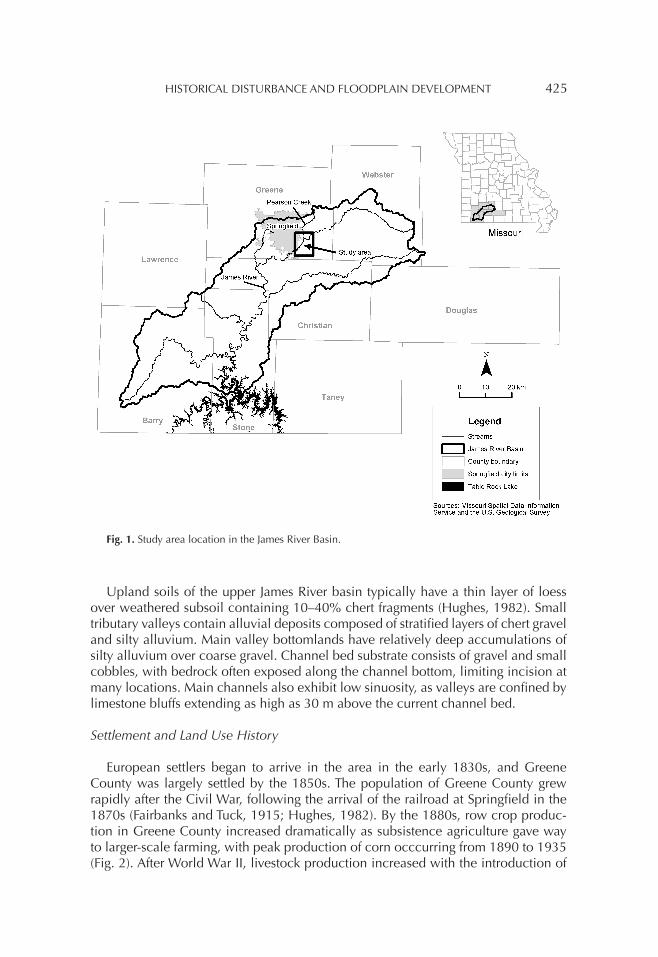
The study area is located in the upper James River valley east of Springfield, Missouri along a 12 km segment of the river from near the confluence with Pearson Creek to Springfield Lake (Fig. 1). The Ozarks are a region of generally higher relief than the surrounding areas in southern Missouri, northern Arkansas, northeast Oklahoma, and southeast Kansas (Rafferty, 2001; see also Shepherd et al., 2011). The James River lies on the border of the Salem and Springfield Plateaus physiographic regions in southwest Missouri. The Salem Plateau, to the east, is a steeper, more highly dis-sected landscape that had oak-hickory forest as the dominant pre-settlement land cover (Bretz, 1965; Jacobson and Primm, 1997). The Springfield Plateau, located in the western Missouri Ozarks, is dominated by younger Mississippian-age cherty limestone, is less dissected, and was covered by an upland prairie prior to settlement (Sauer, 1920).
HISTORICAL DISTURBANCE AND FLOODPLAIN DEVELOPMENT 425
Upland soils of the upper James River basin typically have a thin layer of loess over weathered subsoil containing 10–40% chert fragments (Hughes, 1982). Small tributary valleys contain alluvial deposits composed of stratified layers of chert gravel and silty alluvium. Main valley bottomlands have relatively deep accumulations of silty alluvium over coarse gravel. Channel bed substrate consists of gravel and small cobbles, with bedrock often exposed along the channel bottom, limiting incision at many locations. Main channels also exhibit low sinuosity, as valleys are confined by limestone bluffs extending as high as 30 m above the current channel bed.
Settlement and Land Use History
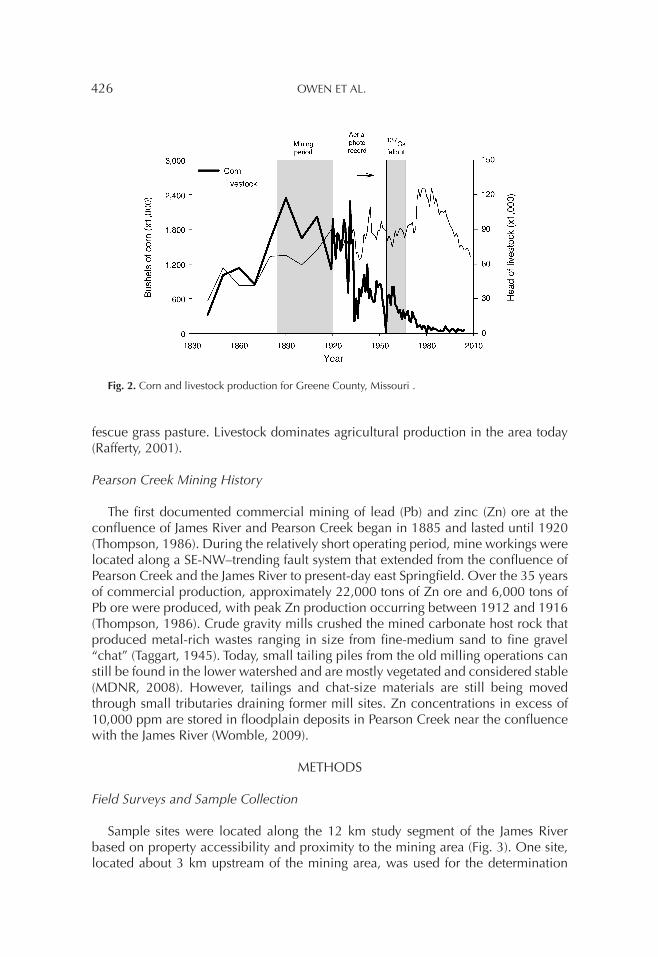
European settlers began to arrive in the area in the early 1830s, and Greene County was largely settled by the 1850s. The population of Greene County grew rapidly after the Civil War, following the arrival of the railroad at Springfield in the 1870s (Fairbanks and Tuck, 1915; Hughes, 1982). By the 1880s, row crop produc-tion in Greene County increased dramatically as subsistence agriculture gave way to larger-scale farming, with peak production of corn occcurring from 1890 to 1935 (Fig. 2). After World War II, livestock production increased with the introduction of
Fig. 1. Study area location in the James River Basin.
426 OWEN ET AL.
fescue grass pasture. Livestock dominates agricultural production in the area today (Rafferty, 2001).
Pearson Creek Mining History
The first documented commercial mining of lead (Pb) and zinc (Zn) ore at the confluence of James River and Pearson Creek began in 1885 and lasted until 1920 (Thompson, 1986). During the relatively short operating period, mine workings were located along a SE-NW–trending fault system that extended from the confluence of Pearson Creek and the James River to present-day east Springfield. Over the 35 years of commercial production, approximately 22,000 tons of Zn ore and 6,000 tons of Pb ore were produced, with peak Zn production occurring between 1912 and 1916 (Thompson, 1986). Crude gravity mills crushed the mined carbonate host rock that produced metal-rich wastes ranging in size from fine-medium sand to fine gravel “chat” (Taggart, 1945). Today, small tailing piles from the old milling operations can still be found in the lower watershed and are mostly vegetated and considered stable (MDNR, 2008). However, tailings and chat-size materials are still being moved through small tributaries draining former mill sites. Zn concentrations in excess of 10,000 ppm are stored in floodplain deposits in Pearson Creek near the confluence with the James River (Womble, 2009).
METHODS
Field Surveys and Sample Collection
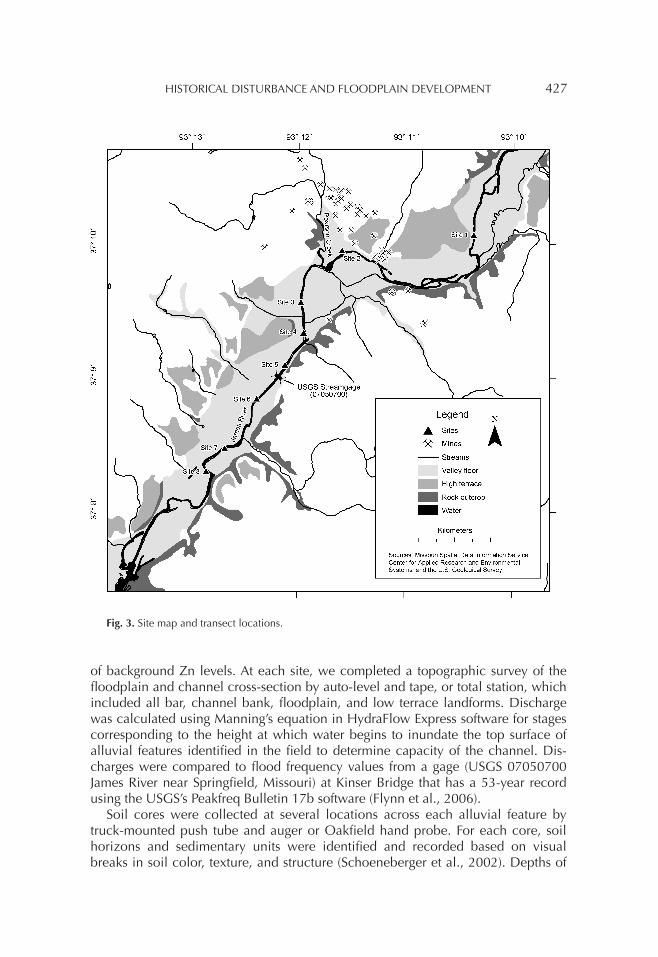
Sample sites were located along the 12 km study segment of the James River based on property accessibility and proximity to the mining area (Fig. 3). One site, located about 3 km upstream of the mining area, was used for the determination
Fig. 2. Corn and livestock production for Greene County, Missouri .
HISTORICAL DISTURBANCE AND FLOODPLAIN DEVELOPMENT 427
of background Zn levels. At each site, we completed a topographic survey of the floodplain and channel cross-section by auto-level and tape, or total station, which included all bar, channel bank, floodplain, and low terrace landforms. Discharge was calculated using Manning’s equation in HydraFlow Express software for stages corresponding to the height at which water begins to inundate the top surface of alluvial features identified in the field to determine capacity of the channel. Dis-charges were compared to flood frequency values from a gage (USGS 07050700 James River near Springfield, Missouri) at Kinser Bridge that has a 53-year record using the USGS’s Peakfreq Bulletin 17b software (Flynn et al., 2006).
Soil cores were collected at several locations across each alluvial feature by truck-mounted push tube and auger or Oakfield hand probe. For each core, soil horizons and sedimentary units were identified and recorded based on visual breaks in soil color, texture, and structure (Schoeneberger et al., 2002). Depths of
Fig. 3. Site map and transect locations.
428 OWEN ET AL.
the fined-grained overbank units were determined by tube refusal at the contact with sand and fine gravel deposits. A hand-held tile probe or truck-mounted auger was used to determine depth to coarse gravel deposits below the sand and fine gravel. Samples from selected cores were bagged in 10 to 20 cm increments within horizon boundaries.
Dating Methods
This study uses a combination of relative floodplain sediment dating techniques, including the identification of buried soils, historical mining sediment deposits, and presence of 137Cs. Each technique involves analysis of stratigraphic layers within floodplain deposits.
In the Upper Midwest, buried soils can be identified visually in floodplain soils (Magilligan, 1985; Faulkner, 1998). Typically, a dark, mollic A horizon separates a soil that exhibits the structure of a mature soil from lighter, massive historical sedi-ment deposited above (Beach, 1994). The distinctive dark A horizon is due to the accumulation of organic material on the stable pre-settlement surface and acts as a benchmark for post-settlement sedimentation (Knox, 1987; Fitzpatrick et al., 1999). In the Missouri Ozarks, buried A horizons are typically not as distinct as those found in nearby regions to the north and west. However, organic carbon peaks can also be used to identify a buried A horizon in floodplain soils where visual evidence is not present.
Contamination from lead, zinc, gold, and copper mining operations can be used to date post-settlement floodplain deposition (Marron, 1992; Brewer and Taylor, 1997; Lecce et al., 2008). Downstream of large mining areas, down-core increases in metal content in floodplain deposits above background can be correlated to the beginning, peak, and end of mining production by the presence of sharp inflec-tions in concentrations caused by variations in tailing supply (Lecce and Pavlowsky, 2001). In the United States, mining often occurred during periods of high-intensity land clearing and cultivation, so contaminated mining sediment was deposited in floodplain area as a trace constituent in association with larger sediment yields of eroded upland soil material (Knox, 1987). For this study, the year 1915 was used to date the peak Zn concentration in the core that represents the peak production of the Pearson Creek mines from 1912 to when they were closed in 1920.
Identification of 137Cs in floodplain deposits can be used to document contem-porary sedimentation since the mid-1950s. Nuclear weapons testing from begin-ning in the mid-1950s emitted the radioactive isotope 137Cs into the atmosphere that was spread around the world as fallout (Walling et al., 1992). Therefore, the pres-ence of 137Cs in sediments provides a contemporary marker in the deposition record (Faulkner and McIntyre, 1996). In floodplain sediments, the mobility of 137Cs by bio-turbation or translocation through the soil profile can cause errors in identification of the initial fallout in the mid-1950s (Walling and He, 1993). However, the subsurface 137Cs peak can be used to approximate the landform surface in 1963, the year of maximum fallout (Walling and He, 1994). Others have used 137Cs to date floodplain and reservoir sediments in the region (Licher, 2003; Rodgers, 2005).
HISTORICAL DISTURBANCE AND FLOODPLAIN DEVELOPMENT 429
Laboratory Analysis
Soil samples were dried in a 60oC oven, ground with mortar and pestle, and passed through a 2 mm sieve. Laser diffraction was used for determining particle-size distribution in the sample using standard Phi sizes (OEWRI, 2008). Total carbon content was determined using a high-temperature decomposition procedure with average precision of <4% relative percent difference (RPD) (OEWRI, 2007a). Inor-ganic carbon content was analyzed in a similar manner as total carbon; however, sediment samples were pretreated in a 450o C muffle furnace for six hours to remove the organic component. Organic carbon was then calculated by subtracting the inor-ganic carbon from the total carbon.
Zinc concentrations in the fine-grained fraction (<2 mm) were analyzed in a labo-ratory using a X-Ray Florescence (XRF) Analyzer (Oxford X-MET3000TXS) specifi-cally calibrated for determining the geochemistry of soil. The detection limit for Zn is 8 ppm, with minimum acceptable accuracy and precision of <20% (OEWRI, 2007b). Average accuracy for sets of samples (n = 31) analyzed was <5% RPD compared to the USGS standard (Jasperoid, GXR-1). Average precision of duplicate analysis was <11% RPD (n = 29). Selected samples (n = 40) were sent to ALS Chemex Labs (Sparks, Nevada) for aqua-regia digestion and ICP analysis for comparison of XRF results. Concentrations of Zn plot near the 1:1 line, are within one standard devia-tion of the mean, and have an R2 value of 0.98 using linear regression analysis.
Concentrations of 137Cs in the sediment samples were determined using gamma spectrometry. Approximately 200–500 g of sediment was collected from soil pits or truck-mounted push tubes in 10–20 cm increments at selected sites (Stam, 1999; Loughran et al., 2002). Gamma ray emission data were collected for 20 hours per sample using a co-axial germanium detector (OEWRI, 2009). Method detection lim-its for this procedure is 0.1 Bq/kg, with minimum acceptable accuracy of ± 10% and precision of ± 20%.
Historical Aerial Photographs
Aerial photos from 2005 were used as the base for rectification of the 1955 and 1975 historical aerial photography datasets using a second-order polynomial trans-formation of between 8 and 12 ground control points per image (Hughes et al., 2006). Root mean square error was <1 m for all photos and average test point error was <8 m. The wetted channel was digitized for each of the three years and col-lapsed to a centerline in ArcGIS for overlay analysis. Channel planform changes since 1955 were identified by overlay analysis of center lines, using the highest aver-age test point values as an error buffer. However, the difference between unstable and stable channel reaches was usually obvious by visual inspection.
RESULTS AND DISCUSSION
Site Description
Eight sites were chosen for this study: two were located above Pearson Creek, three between Pearson Creek and Kinser Bridge, and three below Kinser Bridge.
430 OWEN ET AL.
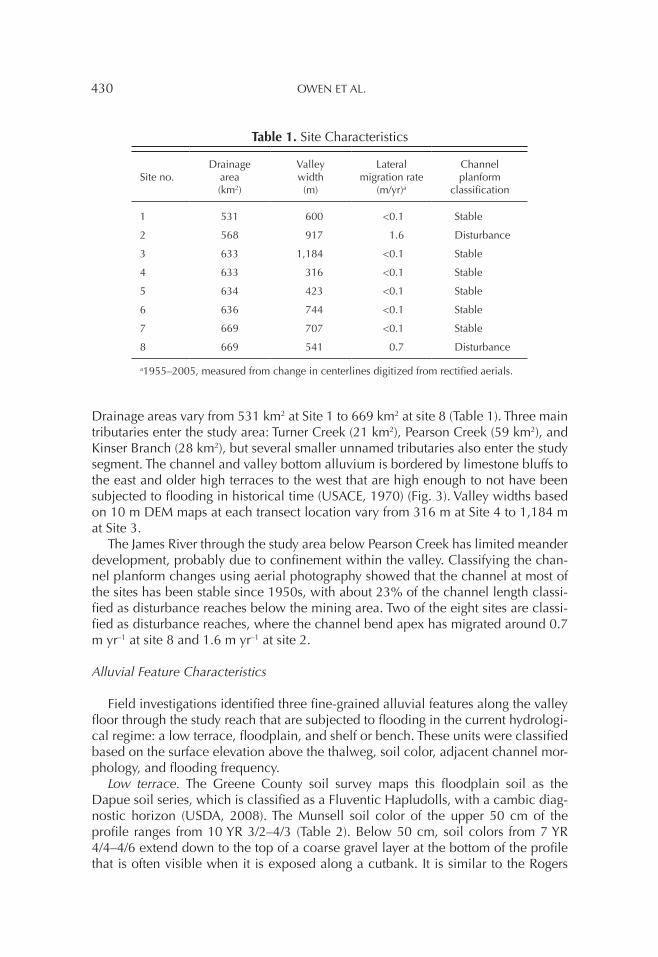
Drainage areas vary from 531 km2 at Site 1 to 669 km2 at site 8 (Table 1). Three main tributaries enter the study area: Turner Creek (21 km2), Pearson Creek (59 km2), and Kinser Branch (28 km2), but several smaller unnamed tributaries also enter the study segment. The channel and valley bottom alluvium is bordered by limestone bluffs to the east and older high terraces to the west that are high enough to not have been subjected to flooding in historical time (USACE, 1970) (Fig. 3). Valley widths based on 10 m DEM maps at each transect location vary from 316 m at Site 4 to 1,184 m at Site 3.
The James River through the study area below Pearson Creek has limited meander development, probably due to confinement within the valley. Classifying the chan-nel planform changes using aerial photography showed that the channel at most of the sites has been stable since 1950s, with about 23% of the channel length classi-fied as disturbance reaches below the mining area. Two of the eight sites are classi-fied as disturbance reaches, where the channel bend apex has migrated around 0.7 m yr–1 at site 8 and 1.6 m yr–1 at site 2.
Alluvial Feature Characteristics
Field investigations identified three fine-grained alluvial features along the valley floor through the study reach that are subjected to flooding in the current hydrologi-cal regime: a low terrace, floodplain, and shelf or bench. These units were classified based on the surface elevation above the thalweg, soil color, adjacent channel mor-phology, and flooding frequency.
Low terrace. The Greene County soil survey maps this floodplain soil as the Dapue soil series, which is classified as a Fluventic Hapludolls, with a cambic diag-nostic horizon (USDA, 2008). The Munsell soil color of the upper 50 cm of the profile ranges from 10 YR 3/2–4/3 (Table 2). Below 50 cm, soil colors from 7 YR 4/4–4/6 extend down to the top of a coarse gravel layer at the bottom of the profile that is often visible when it is exposed along a cutbank. It is similar to the Rogers
Table 1. Site Characteristics
Site no.Drainage
area(km2)
Valleywidth(m)
Lateralmigration rate
(m/yr)a
Channelplanform
classification
1 531 600 <0.1 Stable
2 568 917 1.6 Disturbance
3 633 1,184 <0.1 Stable
4 633 316 <0.1 Stable
5 634 423 <0.1 Stable
6 636 744 <0.1 Stable
7 669 707 <0.1 Stable
8 669 541 0.7 Disturbance
a1955–2005, measured from change in centerlines digitized from rectified aerials.

HISTORICAL DISTURBANCE AND FLOODPLAIN DEVELOPMENT 431
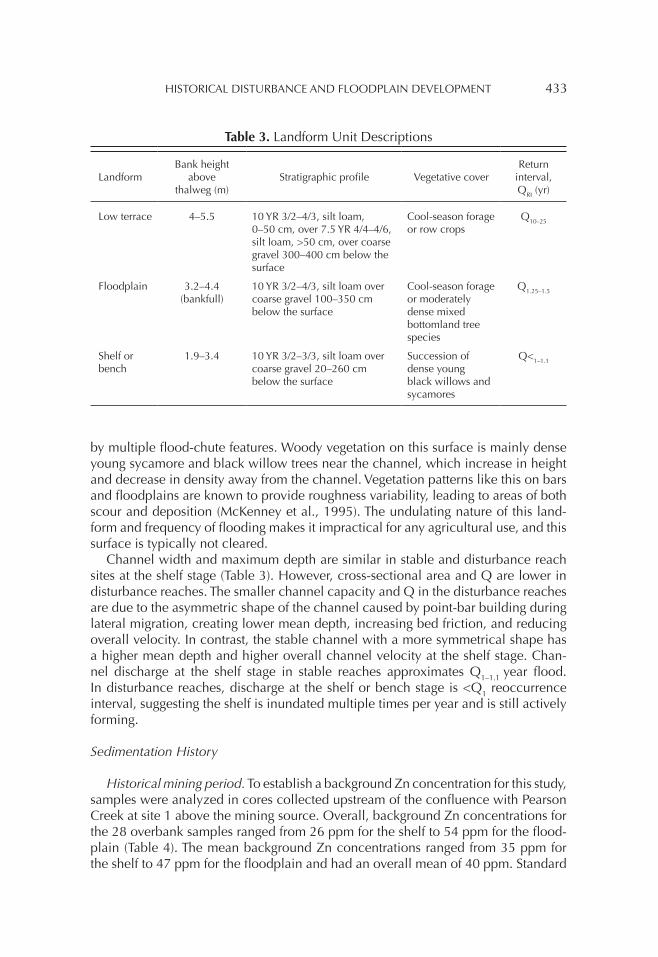
formation described by Brakenridge (1981) on the Pomme De Terre River, which was 14C-dated back to the early-mid Holocene (10,530 ±650–1,680±100 yr bp). It has been described along larger rivers in the Ozarks and is particularly significant for archeologists in the region, where important cultural sites have been discovered dating back over 12,000 yr bp (Hajic et al., 2007). The terrace surface is nearly level, but grades to a backswamp or flood channel in some locations. It is typically either cultivated or established in cool-season grasses used for livestock forage. The top of the low terrace is typically between 4 and 6 m above the channel thalweg. Floods that inundate this landform are between the Q10 and Q25 year recurrence intervals (Table 3).
Floodplain. The unit is also mapped within the Dapue soil series in the Greene County Soil Survey, probably because it is difficult to map these younger units spe-cifically, because they occupy a relatively narrow extent of the valley floor. Down-stream on the James River, a more detailed floodplain soil series has been mapped; this unit has characteristics similar to those of the Jamesfin soil series from Stone County (USDA, 2008). The Jamesfin series is classified as a Dystric Fluventic Eutrud-ept, indicating a recent fluvial origin. This unit has a silt loam texture, and Munsell color ranges from 10 YR 3/2 near the top of the profile to 10 YR 4/3 deeper in the profile (Table 3). This younger floodplain soil has a weak structure that appears to coincide with the Pippens formation, with oldest basal 14C dates of 840 ± 60 yr BP (Brakenridge, 1981). The upper silt-loam overbank unit typically ranges from 1 to 3 m in thickness and overtops a coarse gravel layer at the bottom of the profile. The surface of the floodplain is fairly level, but grades to a backswamp or flood chute at some locations. Land cover on the floodplain surface is either cool-season grass or young riparian forest, indicating that this surface was once farmed and more recently allowed to go fallow.
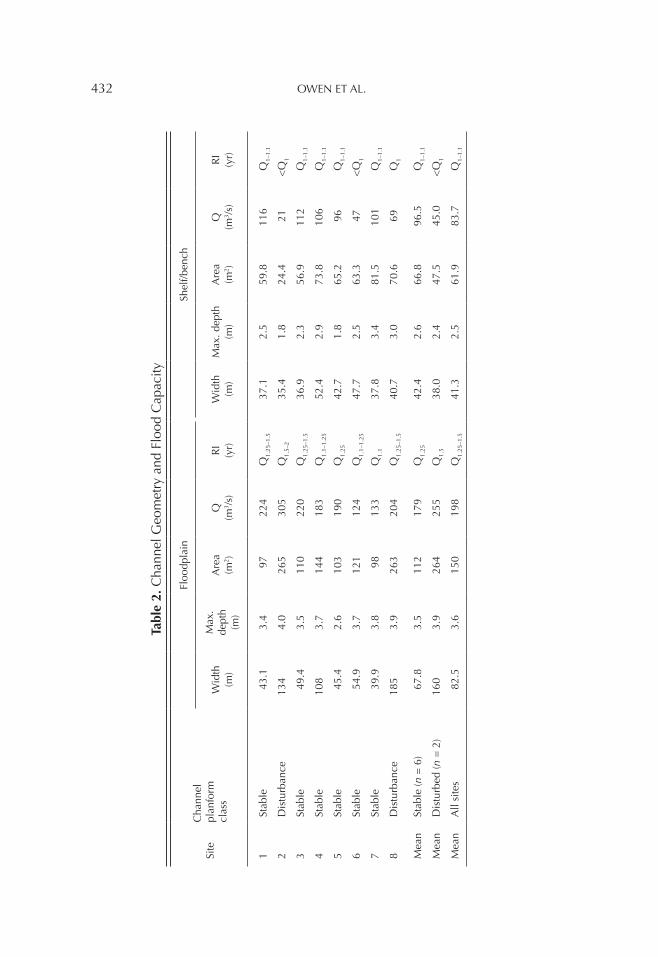
The top surface of the floodplain typically ranges from 3 to 4 m above the channel thalweg. Channel area is slightly larger in disturbance reaches compared to stable reaches at the floodplain stage (Table 3). This is due to historical lateral migration that has rapidly increased the size of the meander-belt flood capacity. However, channel discharge is similar between disturbed and stable reaches. While the chan-nel area is much greater, dense vegetation growth increases flow resistance on the leading edge of the shelf, which is described below (McKenney et al., 1995). At the top floodplain stage, discharge capacity is approximately the Q1.25–1.5 year flood, and so is also interpreted as the bankfull stage.
Shelf or bench. This alluvial feature is similar to the adjacent floodplain unit described above, but the top surface is a meter or less lower in elevation. Both “shelf” and “bench” have been used to describe a fine-grained depositional feature that is lower than the floodplain elevation (Osterkamp and Hupp, 1984, Royall et al., 2010). Here, the term “shelf” will be used to refer to a relatively wide feature (>5 m) and “bench” used to describe a similar narrow feature (<5 m). This relatively recent deposit has a silt-loam texture and the fine-grained fraction has a color ranging from 10 YR 3/2 to 3/3 that overtops coarse-gravel at the bottom of the profile (Table 3). This landform is present at both stable and disturbance reaches, but is often subtle or very narrow in stable reaches. This deposit has a very uneven surface, with scroll features and areas of scour and deposition common, and it is typically dissected
432 OWEN ET AL.
Tabl
e 2.
Cha
nnel
Geo
met
ry a
nd F
lood
Cap
acity
Site
Cha
nnel
pl
anfo
rmcl
ass
Floo
dpla
inSh
elf/b
ench
Wid
th(m
)
Max
.de
pth
(m)
Are
a(m
2 )Q
(m3 /
s)R
I(y
r)W
idth
(m)
Max
. dep
th(m
)A
rea
(m2 )
Q(m
3 /s)
RI
(yr)
1St
able
43
.13.
4 9
722
4Q
1.25
–1.5
37.1
2.5
59.8
11
6 Q
1–1.
1
2D
istu
rban
ce
134
4.0
265
305
Q1.
5–2
35.4
1.8
24.4
21
<Q
1
3St
able
49
.43.
511
022
0Q
1.25
–1.5
36.9
2.3
56.9
11
2 Q
1–1.
1
4St
able
10
83.
714
418
3Q
1.1–
1.25
52.4
2.9
73.8
10
6 Q
1–1.
1
5St
able
45
.42.
610
319
0Q
1.25
42.7
1.8
65.2
96
Q1–
1.1
6St
able
54
.93.
712
112
4Q
1.1–
1.25
47.7
2.5
63.3
47
<Q
1
7St
able
39
.93.
8 9
813
3Q
1.1
37.8
3.4
81.5
10
1 Q
1–1.
1
8D
istu
rban
ce
185
3.9
263
204
Q1.
25–1
.540
.73.
070
.6
69 Q
1
Mea
nSt
able
(n =
6)
67
.83.
511
217
9Q
1.25
42.4
2.6
66.8
96
.5 Q
1–1.
1
Mea
nD
istu
rbed
(n =
2)
16
03.
926
425
5Q
1.5
38.0
2.4
47.5
45
.0<
Q1
Mea
nA
ll si
tes
82
.53.
615
019
8Q
1.25
–1.5
41.3
2.5
61.9
83
.7 Q
1–1.
1
HISTORICAL DISTURBANCE AND FLOODPLAIN DEVELOPMENT 433
by multiple flood-chute features. Woody vegetation on this surface is mainly dense young sycamore and black willow trees near the channel, which increase in height and decrease in density away from the channel. Vegetation patterns like this on bars and floodplains are known to provide roughness variability, leading to areas of both scour and deposition (McKenney et al., 1995). The undulating nature of this land-form and frequency of flooding makes it impractical for any agricultural use, and this surface is typically not cleared.
Channel width and maximum depth are similar in stable and disturbance reach sites at the shelf stage (Table 3). However, cross-sectional area and Q are lower in disturbance reaches. The smaller channel capacity and Q in the disturbance reaches are due to the asymmetric shape of the channel caused by point-bar building during lateral migration, creating lower mean depth, increasing bed friction, and reducing overall velocity. In contrast, the stable channel with a more symmetrical shape has a higher mean depth and higher overall channel velocity at the shelf stage. Chan-nel discharge at the shelf stage in stable reaches approximates Q1–1.1 year flood. In disturbance reaches, discharge at the shelf or bench stage is <Q1 reoccurrence interval, suggesting the shelf is inundated multiple times per year and is still actively forming.
Sedimentation History
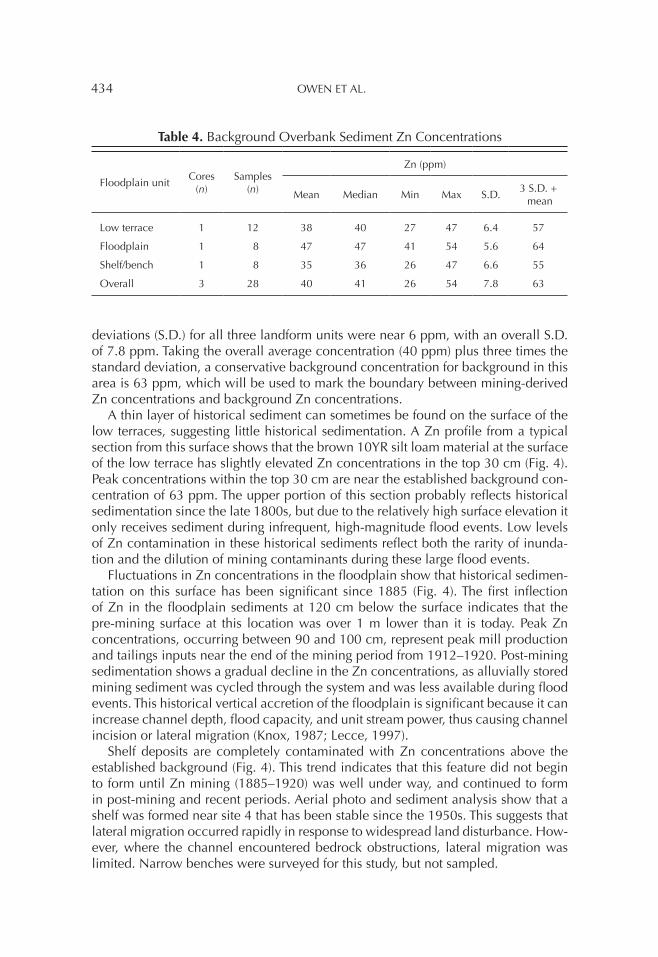
Historical mining period. To establish a background Zn concentration for this study, samples were analyzed in cores collected upstream of the confluence with Pearson Creek at site 1 above the mining source. Overall, background Zn concentrations for the 28 overbank samples ranged from 26 ppm for the shelf to 54 ppm for the flood-plain (Table 4). The mean background Zn concentrations ranged from 35 ppm for the shelf to 47 ppm for the floodplain and had an overall mean of 40 ppm. Standard
Table 3. Landform Unit Descriptions
LandformBank height
abovethalweg (m)
Stratigraphic profile Vegetative coverReturn
interval,QRI (yr)
Low terrace 4–5.5 10 YR 3/2–4/3, silt loam, 0–50 cm, over 7.5 YR 4/4–4/6, silt loam, >50 cm, over coarse gravel 300–400 cm below the surface
Cool-season forage or row crops
Q10–25
Floodplain 3.2–4.4(bankfull)
10 YR 3/2–4/3, silt loam over coarse gravel 100–350 cm below the surface
Cool-season forageor moderately dense mixed bottomland tree species
Q1.25–1.5
Shelf or bench
1.9–3.4 10 YR 3/2–3/3, silt loam over coarse gravel 20–260 cm below the surface
Succession of dense young black willows and sycamores
Q<1–1.1
434 OWEN ET AL.
deviations (S.D.) for all three landform units were near 6 ppm, with an overall S.D. of 7.8 ppm. Taking the overall average concentration (40 ppm) plus three times the standard deviation, a conservative background concentration for background in this area is 63 ppm, which will be used to mark the boundary between mining-derived Zn concentrations and background Zn concentrations.
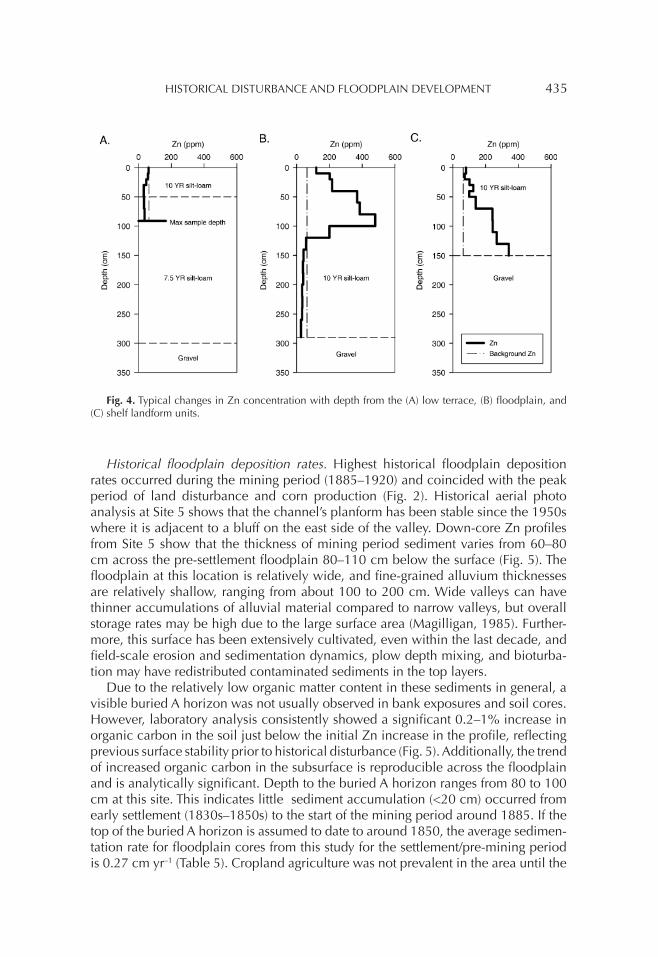
A thin layer of historical sediment can sometimes be found on the surface of the low terraces, suggesting little historical sedimentation. A Zn profile from a typical section from this surface shows that the brown 10YR silt loam material at the surface of the low terrace has slightly elevated Zn concentrations in the top 30 cm (Fig. 4). Peak concentrations within the top 30 cm are near the established background con-centration of 63 ppm. The upper portion of this section probably reflects historical sedimentation since the late 1800s, but due to the relatively high surface elevation it only receives sediment during infrequent, high-magnitude flood events. Low levels of Zn contamination in these historical sediments reflect both the rarity of inunda-tion and the dilution of mining contaminants during these large flood events.
Fluctuations in Zn concentrations in the floodplain show that historical sedimen-tation on this surface has been significant since 1885 (Fig. 4). The first inflection of Zn in the floodplain sediments at 120 cm below the surface indicates that the pre-mining surface at this location was over 1 m lower than it is today. Peak Zn concentrations, occurring between 90 and 100 cm, represent peak mill production and tailings inputs near the end of the mining period from 1912–1920. Post-mining sedimentation shows a gradual decline in the Zn concentrations, as alluvially stored mining sediment was cycled through the system and was less available during flood events. This historical vertical accretion of the floodplain is significant because it can increase channel depth, flood capacity, and unit stream power, thus causing channel incision or lateral migration (Knox, 1987; Lecce, 1997).
Shelf deposits are completely contaminated with Zn concentrations above the established background (Fig. 4). This trend indicates that this feature did not begin to form until Zn mining (1885–1920) was well under way, and continued to form in post-mining and recent periods. Aerial photo and sediment analysis show that a shelf was formed near site 4 that has been stable since the 1950s. This suggests that lateral migration occurred rapidly in response to widespread land disturbance. How-ever, where the channel encountered bedrock obstructions, lateral migration was limited. Narrow benches were surveyed for this study, but not sampled.
Table 4. Background Overbank Sediment Zn Concentrations
Floodplain unitCores
(n)Samples
(n)
Zn (ppm)
Mean Median Min Max S.D.3 S.D. + mean
Low terrace 1 12 38 40 27 47 6.4 57
Floodplain 1 8 47 47 41 54 5.6 64
Shelf/bench 1 8 35 36 26 47 6.6 55
Overall 3 28 40 41 26 54 7.8 63
HISTORICAL DISTURBANCE AND FLOODPLAIN DEVELOPMENT 435
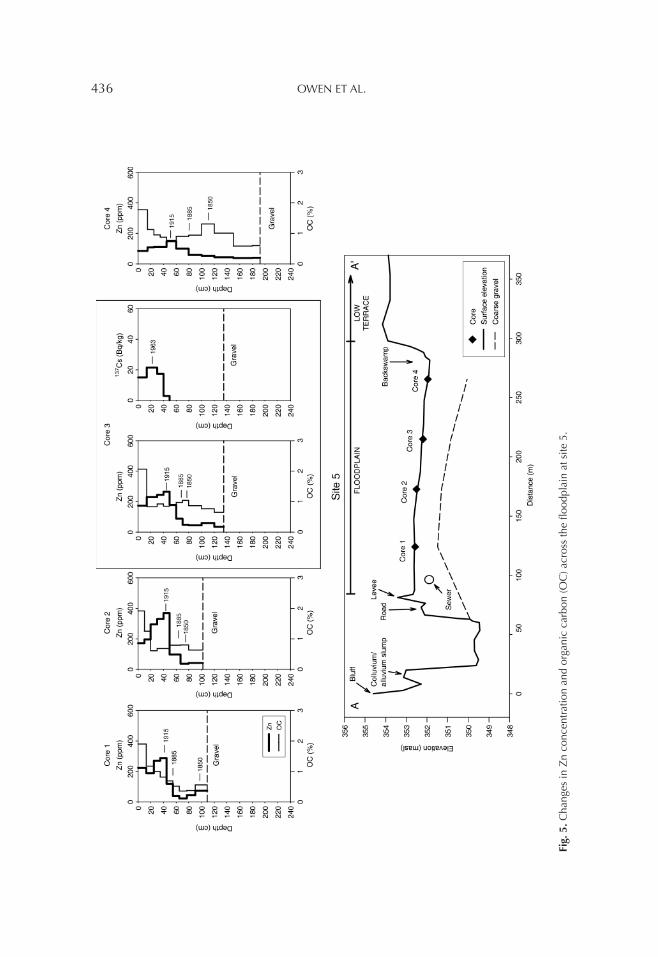
Historical floodplain deposition rates. Highest historical floodplain deposition rates occurred during the mining period (1885–1920) and coincided with the peak period of land disturbance and corn production (Fig. 2). Historical aerial photo analy sis at Site 5 shows that the channel’s planform has been stable since the 1950s where it is adjacent to a bluff on the east side of the valley. Down-core Zn profiles from Site 5 show that the thickness of mining period sediment varies from 60–80 cm across the pre-settlement floodplain 80–110 cm below the surface (Fig. 5). The floodplain at this location is relatively wide, and fine-grained alluvium thicknesses are relatively shallow, ranging from about 100 to 200 cm. Wide valleys can have thinner accumulations of alluvial material compared to narrow valleys, but overall storage rates may be high due to the large surface area (Magilligan, 1985). Further-more, this surface has been extensively cultivated, even within the last decade, and field-scale erosion and sedimentation dynamics, plow depth mixing, and bioturba-tion may have redistributed contaminated sediments in the top layers.
Due to the relatively low organic matter content in these sediments in general, a visible buried A horizon was not usually observed in bank exposures and soil cores. However, laboratory analysis consistently showed a significant 0.2–1% increase in organic carbon in the soil just below the initial Zn increase in the profile, reflecting previous surface stability prior to historical disturbance (Fig. 5). Additionally, the trend of increased organic carbon in the subsurface is reproducible across the floodplain and is analytically significant. Depth to the buried A horizon ranges from 80 to 100 cm at this site. This indicates little sediment accumulation (<20 cm) occurred from early settlement (1830s–1850s) to the start of the mining period around 1885. If the top of the buried A horizon is assumed to date to around 1850, the average sedimen-tation rate for floodplain cores from this study for the settlement/pre-mining period is 0.27 cm yr–1 (Table 5). Cropland agriculture was not prevalent in the area until the
Fig. 4. Typical changes in Zn concentration with depth from the (A) low terrace, (B) floodplain, and (C) shelf landform units.
436 OWEN ET AL.
Fig.
5. C
hang
es in
Zn
conc
entr
atio
n an
d or
gani
c ca
rbon
(OC
) acr
oss
the
flood
plai
n at
site
5.
HISTORICAL DISTURBANCE AND FLOODPLAIN DEVELOPMENT 437
railroad was brought to Springfield in 1870 (Rafferty, 2001). This may account for the lower sedimentation rates prior to the mining period starting in 1885.
Peak Zn concentrations vary from 300 to 400 ppm for Core 1 and 2 near the chan-nel to <200 ppm in Core 4. Depth of the peak Zn concentration is fairly consistent, near 40–50 cm in all four cores. Assuming that the peak Zn concentration in the core coincides with the peak mining production (1915), the average sedimentation rate from all floodplain cores for the mining period was 0.55 cm yr–1. Thus, increased sed-imentation along the floodplain, beginning in the late 1800s, was probably related to increased soil disturbance and runoff from crop production and widespread land clearing and other settlement-derived disturbances, as indicated by the peak corn production at that time (Fig. 2). While land disturbance from mining activities likely contributed to erosion, mining operations covered at most 10 km2 of land, or <2% of the upstream drainage area. This suggests that sedimentation on the floodplain and the shelf can be attributed to upstream mining activity. Additionally, tailings piles contain approximately 18.1% calcium (Ca), and the average Ca concentration found in post-1885 alluvium is <0.5%, with background concentrations at 0.2% Ca. Using the Ca signal, a simple dilution calculation shows that <1% of the historical floodplain sediment is from mining sources.
The 137Cs profile in core 3 shows about 20–25 cm of contemporary sedimentation since 1963. This stratigraphic marker splits the post-mining sedimentation thickness in half, suggesting the sedimentation rates from 1915 to 1963 are similar to the sedimentation rates from 1963–2009. Average post-mining sedimentation rates over the last 90 years for all floodplain cores are near the settlement/pre-mining period rates of around 0.30 cm yr–1 from 1920 to 1963 and about 0.34 cm yr–1 post-1963. Again, the reduction in crop production, notably corn, and possibly the introduc-tion of conservation practices in the 1930s apparently had an impact in reducing the fine-grained sediment load to this portion of the upper valley that has also been documented in the Upper Midwest (Trimble and Lund, 1982; Knox, 1987). Below the fine-grained overbank unit lies a coarser gravel layer. The elevation of the top of the gravel along the cross-section is 1–2 m higher in elevation compared to the current channel bed, suggesting that the channel may have incised at this location or that gravel bar deposits were more extensive at this channel location in the past. However, local disturbances by road construction, sewer line installation, and an artificial levee make it difficult to evaluate channel bed history.
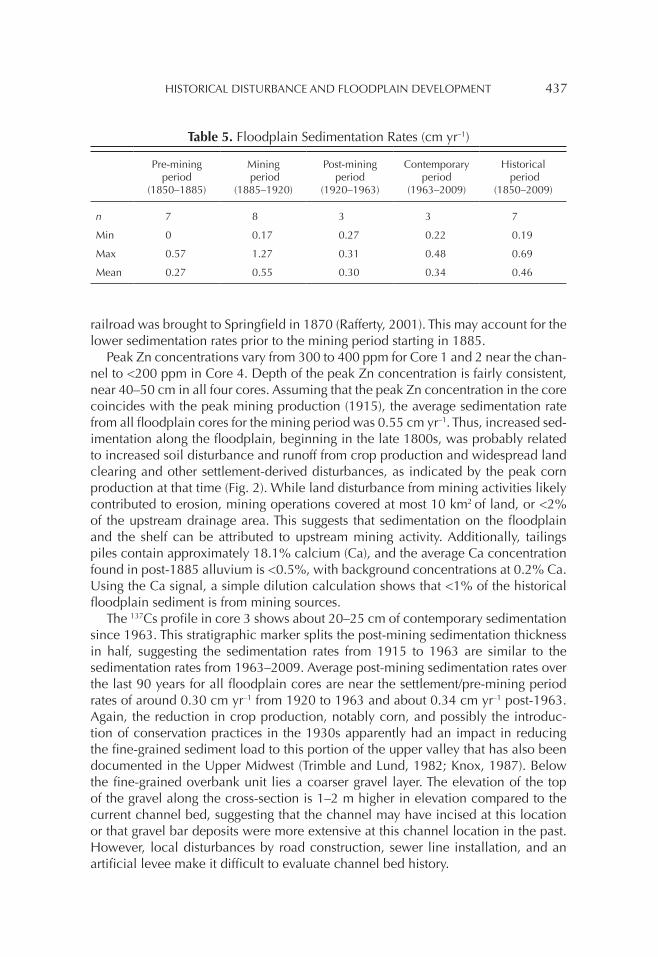
Table 5. Floodplain Sedimentation Rates (cm yr–1)
Pre-mining period
(1850–1885)
Mining period
(1885–1920)
Post-mining period
(1920–1963)
Contemporary period
(1963–2009)
Historical period
(1850–2009)
n 7 8 3 3 7
Min 0 0.17 0.27 0.22 0.19
Max 0.57 1.27 0.31 0.48 0.69
Mean 0.27 0.55 0.30 0.34 0.46
438 OWEN ET AL.
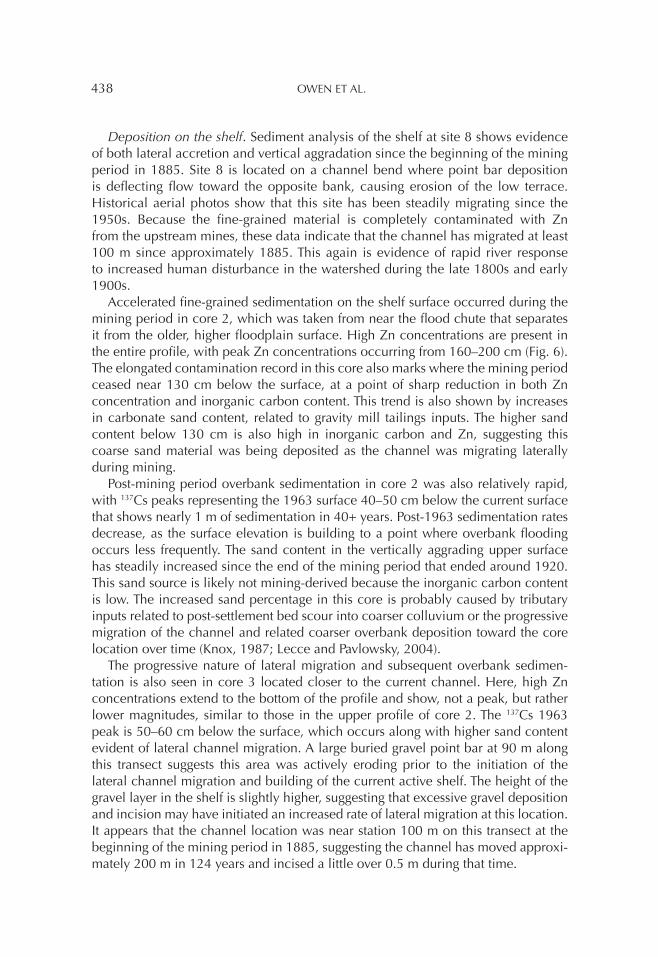
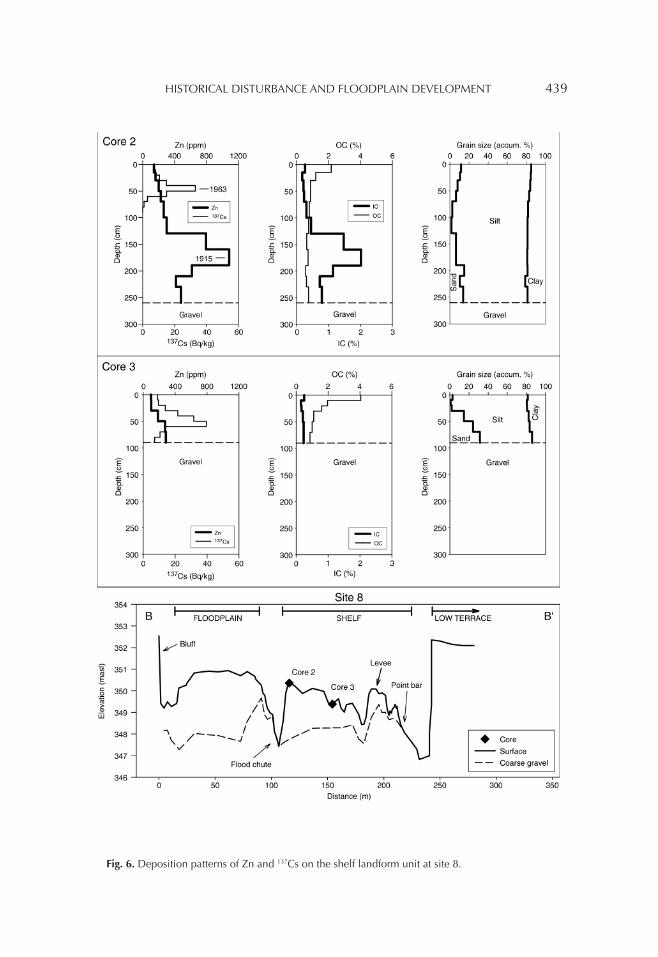
Deposition on the shelf. Sediment analysis of the shelf at site 8 shows evidence of both lateral accretion and vertical aggradation since the beginning of the mining period in 1885. Site 8 is located on a channel bend where point bar deposition is deflecting flow toward the opposite bank, causing erosion of the low terrace. Historical aerial photos show that this site has been steadily migrating since the 1950s. Because the fine-grained material is completely contaminated with Zn from the upstream mines, these data indicate that the channel has migrated at least 100 m since approximately 1885. This again is evidence of rapid river response to increased human disturbance in the watershed during the late 1800s and early 1900s.
Accelerated fine-grained sedimentation on the shelf surface occurred during the mining period in core 2, which was taken from near the flood chute that separates it from the older, higher floodplain surface. High Zn concentrations are present in the entire profile, with peak Zn concentrations occurring from 160–200 cm (Fig. 6). The elongated contamination record in this core also marks where the mining period ceased near 130 cm below the surface, at a point of sharp reduction in both Zn concentration and inorganic carbon content. This trend is also shown by increases in carbonate sand content, related to gravity mill tailings inputs. The higher sand content below 130 cm is also high in inorganic carbon and Zn, suggesting this coarse sand material was being deposited as the channel was migrating laterally during mining.
Post-mining period overbank sedimentation in core 2 was also relatively rapid, with 137Cs peaks representing the 1963 surface 40–50 cm below the current surface that shows nearly 1 m of sedimentation in 40+ years. Post-1963 sedimentation rates decrease, as the surface elevation is building to a point where overbank flooding occurs less frequently. The sand content in the vertically aggrading upper surface has steadily increased since the end of the mining period that ended around 1920. This sand source is likely not mining-derived because the inorganic carbon content is low. The increased sand percentage in this core is probably caused by tributary inputs related to post-settlement bed scour into coarser colluvium or the progressive migration of the channel and related coarser overbank deposition toward the core location over time (Knox, 1987; Lecce and Pavlowsky, 2004).
The progressive nature of lateral migration and subsequent overbank sedimen-tation is also seen in core 3 located closer to the current channel. Here, high Zn concentrations extend to the bottom of the profile and show, not a peak, but rather lower magnitudes, similar to those in the upper profile of core 2. The 137Cs 1963 peak is 50–60 cm below the surface, which occurs along with higher sand content evident of lateral channel migration. A large buried gravel point bar at 90 m along this transect suggests this area was actively eroding prior to the initiation of the lateral channel migration and building of the current active shelf. The height of the gravel layer in the shelf is slightly higher, suggesting that excessive gravel deposition and incision may have initiated an increased rate of lateral migration at this location. It appears that the channel location was near station 100 m on this transect at the beginning of the mining period in 1885, suggesting the channel has moved approxi-mately 200 m in 124 years and incised a little over 0.5 m during that time.
HISTORICAL DISTURBANCE AND FLOODPLAIN DEVELOPMENT 439
Fig. 6. Deposition patterns of Zn and 137Cs on the shelf landform unit at site 8.
440 OWEN ET AL.
CONCLUSIONS
This study has implications for understanding how Ozark rivers have responded to land use changes. Analysis of overbank deposits shows that in the late 1800s, during high agricultural production, channels were more active and floodplain sedi-mentation rates were higher than today. Over 100 years later, channels appear to still be adjusting at disturbance reaches where younger shelf features are being formed around 1 m lower than the present floodplain, even though channel capacity at the floodplain stage appears to be adjusted to the bankfull flood regime. Jacobson (1995) showed that gravel waves generated from initial land clearing moved through watersheds of this size prior to the 1950s, but that floodplain recovery appears to be much slower. This is perhaps a result of conservation practices and agricultural con-version to pasture that has decreased the fine-sediment supply from the watershed. The rate of recovery, particularly in disturbance reaches, has been slow as the shelf is slowly reconnecting to the floodplain. Present suspended sediment loads are rela-tively low in the James River and the ability to construct new alluvial features may be limited (Hutchison, 2010). In addition, bedrock control and valley confinement may cause floodplain recovery to lag, because the ability of channels to widen laterally to form new floodplain platforms is limited.
Acknowledgments: This project was partially funded by United States Environmental Protection Agency Region 7 Start-up Funding for the Ozarks Environmental and Water Resources Institute at Mis-souri State University (Federal Assistance Grant number (X7)98772501). The authors would like to thank the Hopkins and Crighton families for access to their property.
REFERENCES
Beach, T. (1994) The fate of eroded soil: Sediment sinks and sediment budgets of agrarian landscapes in southern Minnesota, 1851–1988. Annals of the Associa-tion of American Geographers, Vol. 84, 5–28.
Brakenridge, G. R. (1981) Late Quaternary floodplain sedimentation along the Pomme de Terre River, southern Missouri. Quaternary Research, Vol. 15, 62–76.
Bretz, J. H. (1965) Geomorphic History of the Ozarks of Missouri. Rolla, MO: Missouri Department of Business and Administration, Division of Geological Survey and Water Resources.
Brewer, P. A., and Taylor, M. P. (1997) The spatial distribution of heavy metal con-taminated sediment across terraced floodplains. Catena, Vol. 30, 229–249.
Carlson, J. (1999) Zinc Mining Contamination and Sedimentation Rates of Historical Overbank Deposits, Honey Creek Watershed, Southwest Missouri. Unpublished master’s thesis, Department of Geography, Geology, and Planning, Missouri State University, Springfield, MO.
Fairbanks, J. and Tuck, C. E. (1915) Past and Present of Greene County: Early and Recent History and Genealogical Records of Many of the Representative Citizens. Indianapolis, IN: Bowen.
HISTORICAL DISTURBANCE AND FLOODPLAIN DEVELOPMENT 441
Faulkner, D. J. (1998) Spatially variable historical alluviation and channel incision in West-Central Wisconsin. Annals of the Association of American Geographers, Vol. 88, 666–685.
Faulkner, D. L. and McIntyre, S. (1996) Persisting sediment yields and sediment delivery changes. Water Resources Bulletin, Vol. 32, 817–829.
Fitzpatrick, F. A., Knox, J. C., and Whitman, H. E. (1999) Effects of Historical Land Cover Changes on Flooding and Sedimentation, North Fish Creek, Wisconsin. Middleton, WI: U.S. Geological Survey, Water-Resources Investigation Report 99-4083.
Flynn, K. M., Kirby, W. H., and Hummel, P. R. (2006) User’s Manual for Program PeakFQ, Annual Flood-Frequency Analysis Using Bulletin 17B Gridlines. Reston, VA: U. S. Geological Survey Techniques and Methods 4-B4.
Hajic, E. R., Mandel, R. D., Ray, J. H., and Lopinot, N. H. (2007) Geoarchaeology of stratified paleoindian deposits at the Big Eddy Site, southwest Missouri, U.S.A. Geoarchaeology, Vol. 22, 891–934.
Hughes, H. E. (1982) Soil Survey of Greene and Lawrence Counties, Missouri. Wash-ington, DC: U.S. Government Printing Office, U. S. Department of Agriculture, Soil Conservation Service.
Hughes, M. L., McDowell, P. F., and Marcus, W. A., (2006) Accuracy assessment of georectified aerial photographs: Implications for measuring lateral channel move-ment in a GIS. Geomorphology, Vol. 74, 1–16.
Hutchison, E. C. (2010) Mass Transport of Suspended Sediment, Dissolved Solids, Nutrients, and Anions in the James River, SW Missouri. Unpublished master’s thesis, Department of Geography, Geology, and Planning, Missouri State Univer-sity, Springfield, MO.
Jacobson, R. B. (1995) Spatial controls on patterns of land use–induced stream dis-turbance at the drainage-basin scale—an example from gravel-bed streams of the Ozark Plateaus, Missouri. In J. E. Costa, A. J. Miller, K. W. Potter, and P. R. Wilcock, eds., American Geophysical Union Geophysical Monograph 89, The Wolman Volume. Washington, DC: American Geophysical Union, 219–239.
Jacobson, R. B. (2004) Downstream Effects of Timber Harvest in the Ozarks of Missouri. Toward Sustainability for Missouri Forests. St. Paul, MN: North Central Research Station, Forest Service, U. S. Department of Agriculture Forest, General Technical Report NC-239, 106–128.
Jacobson, R. B. and Coleman, D. J. (1986) Stratigraphy and recent evolution of Maryland Piedmont flood plains. American Journal of Science, Vol. 286, 617–637.
Jacobson, R. B. and Gran, K. B. (1999) Gravel sediment routing from widespread, low-intensity landscape disturbance, Current River Basin, Missouri. Earth Surface Processes and Landforms, Vol. 24, 897–917.
Jacobson, R. B. and Primm, A. T. (1997) Historical Land-Use Changes and Potential Effects on Stream Disturbance in the Ozarks Plateaus, Missouri. Rolla, MO: U.S. Geological Survey Water-Supply Paper 2484.
Knox, J. C. (1977) Human impacts on Wisconsin stream channels. Annals of the Association of American Geographers, Vol. 67, 323–342.
442 OWEN ET AL.
Knox, J. C. (1987) Historical valley floor sedimentation in the Upper Mississippi Valley. Annals of the Association of American Geographers, Vol. 77, 224–244.
Lecce, S. A. (1997) Spatial patterns of historical overbank sedimentation and flood-plain evolution, Blue River, Wisconsin. Geomorphology, Vol. 18, 265–277.
Leece, S. A. and Pavlowsky, R. T. (2001) Use of mining contaminated sediment trac-ers to investigate the timing and rates of historical flood plain sedimentation. Geomorphology, Vol. 38, 85–108.
Lecce, S. A. and Pavlowsky, R. T. (2004) Spatial and temporal variations in the grain-size characteristics of historical flood plain deposits, Blue River, Wisconsin, USA. Geomorphology, Vol. 61, 361–371.
Lecce, S. A., Pavlowsky, R. T., and Schlomer, G. (2008) Mercury contamination of active sediment and floodplain deposits from historic gold mining at Gold Hill, North Carolina, USA. Environmental Geology, Vol. 55, 113–121.
Licher, S.S. (2003) History of Sedimentation and Contamination in Valley Mill Reservoir, Springfield, Missouri. Unpublished master’s thesis, Department of Geography, Geology, and Planning, Missouri State University, Springfield, MO.
Loughran, R. J., Wallbrink, P. J., Walling, D. E., and Appleby, P. G. (2002) Chapter 3. Sampling methods. In F. Zapata, ed., Handbook for Assessment of Soil Erosion and Sedimentation Using Environmental Radionuclides. Dordrecht, The Netherlands: Kluwer Academic Publishers, 41–57.
Magilligan, F. J. (1985) Historical floodplain sedimentation in the Galena River Basin, Wisconsin and Illinois. Annals of the Association of American Geographers, Vol. 75, 583–594.
Marron, D. C. (1992) Floodplain storage of mine tailings in the Belle Fourche River System: A sediment budget approach. Earth Surface Processes and Landforms, Vol. 17, 675–685.
McKenney, R., Jacobson, R. B., and Wertheimer, R. C. (1995) Woody vegetation and channel morphogenesis in low-gradient, gravel-bed streams in the Ozark Plateaus, Missouri and Arkansas. Geomorphology, Vol. 13, 175–198.
Osterkamp, W. R. and Hupp, C. R. (1984) Geomorphic and vegetative characteris-tics along three northern Virginia streams. Geological Society of America Bulletin, Vol. 95, 1093–1101.
Ozarks Environmental and Water Resources Institute (OEWRI) (2007a) Standard Operating Procedure for: Vario EL III CHNOS Elemental Analyzer Operation. Springfield, MO: Missouri State University.
Ozarks Environmental and Water Resources Institute (OEWRI) (2007b) Standard Operating Procedure for: X-MET3000TXS+ Handheld XRF Analyzer. Springfield, MO: Missouri State University.
Ozarks Environmental and Water Resources Institute (OEWRI) (2008) Standard Oper-ating Procedure for: LS 13 320 Laser Diffraction Particle Size Analyzer Operation. Springfield, MO: Missouri State University.
Ozarks Environmental and Water Resources Institute (OEWRI) (2009) Standard Operating Procedure for: GC4020 GE Co-Axial Detector and DSA 1000 Digital Spectrum Analyzer with 747 Series Lead Shield. Springfield, MO: Missouri State University.
HISTORICAL DISTURBANCE AND FLOODPLAIN DEVELOPMENT 443
Raab, T., Hürkamp, K., and Völkel, J. (2010) Stratigraphy and chronology of Late Quaternary floodplain sediments in a historic mining area, Vils River Valley, East Bavaria, Germany. Physical Geography, Vol. 31, 357–384.
Rafferty, M. D. (2001) The Ozarks Land and Life, 2nd ed. Fayetteville, AR: University of Arkansas Press.
Rodgers, W. E. (2005) Mercury Contamination of Channel and Floodplain Sediments in Wilson Creek Watershed, Southwest Missouri. Unpublished master’s thesis, Department of Geography, Geology, and Planning, Missouri State University, Springfield, MO.
Royall, D., Davis, L., and Kimbrow, D. B. (2010) In-channel benches in small water-sheds: Examples from the southern Piedmont. Southeastern Geographer, Vol. 50, 445–467.
Saucier, R. T. (1983) Historic changes in current river meander regime. In Proceed-ings of the Conference, Rivers ‘83, American Society of Engineers, 180–190.
Sauer, C. O. (1920) The Geography of the Ozark Highland of Missouri. New York, NY: Greenwood Press.
Schoenebeger, P. J., Wysocki, D. A., Benham, E. C., and Broderson, W. D., eds., (2002) Field Book for Describing and Sampling Soils, version 2.0. Lincoln, NE: National Soil Survey Center, Natural Resources Conservation Service.
Shepherd, S. L., J. C. Dixon, and R. K. Davis (2011) Are Ozark streams underfit? Using GIS to re-examine Dury’s theory of underfit streams. Physical Geography, Vol. 32, 179–194.
Stam, M. H. (1999) The dating of fluvial deposits with heavy metals, 210Pb, and 137Cs in the Guel Catchment (The Netherlands). Physics and Chemistry of the Earth, Vol. 24, 155–160.
Taggart, A.F. (1945) Handbook of Mineral Dressing: Ores and Industrial Minerals. New York, NY: John Wiley and Sons.
Thompson, K.C. (1986) Geology of Greene County Missouri. Springfield, MO: Watershed Management Coordinating Committee.
Trimble, J. T. (2001) Spatial Patterns and Fluvial Sediment Contributions of Mining Related Contaminants in Chat Creek Watershed, Southwest Missouri. Unpub-lished master’s thesis, Department of Geography, Geology, and Planning, Missouri State University, Springfield, MO.
Trimble, S.W. and Lund, S.W. (1982) Soil Conservation and the Reduction of Erosion and Sedimentation in the Coon Creek Basin, Wisconsin. Washington, DC: United States Government Printing Office, U.S. Geological Survey Professional Paper 1234.
United States Army Corps of Engineers (USACE) (1970) Flood Plain Information, James River and Tributaries, Springfield, Missouri, Part II. Little Rock, AR: U.S. Army. Prepared for City Utilities of Springfield.
United States Department of Agriculture (USDA) (2008) Soil Survey Geographic Data Base. National Resources Conservation Service. Retrieved July 29, 2010 from the CARES website at http://www.cares.missouri.edu
Walling, D. E. (1999) Linking land use, erosion, and sediment yields in river basins. Hydrobiologia, Vol. 410, 223–240.
444 OWEN ET AL.
Walling, D. E. and He, Q. (1993) Use of cesium-137 as a tracer in the study of rates and patterns of floodplain sedimentation. In Tracers in Hydrology, Proceedings of the Yokohama Symposium, July 1993, 319–328.
Walling, D. E. and He, Q. (1994) Rates of overbank sedimentation on the flood plains of several British rivers during the past 100 years. In Variability in Stream Erosion and Transport, Proceedings of the Canberra Symposium, December 1994, 203–210.
Walling, D. E., Quine, T. A., and He, Q. (1992) Investigating contemporary rates of floodplain sedimentation. In P. A. Carling and G. E. Petts, eds., Lowland Flood-plain Rivers: Geomorphological Perspectives. Chichester, UK: John Wiley & Sons Ltd., 165–184.
Womble, P. J. (2009) Historical Mining Contamination and Floodplain Evolu-tion Along Lower Pearson Creek, SW Missouri. Unpublished master’s thesis, Department of Geography, Geology, and Planning, Missouri State University, Springfield, MO.