Historical and current status of cockle and mussel stocks ...
87
Historical and current status of cockle and mussel stocks in The Wash P.J. Dare, M.C. Bell, P. Walker and R.C.A. Bannister
Transcript of Historical and current status of cockle and mussel stocks ...
Historical and current status of cockle and mussel stocks in The Wash
P.J. Dare, M.C. Bell, P. Walker and R.C.A. Bannister
1
CENTRE FOR ENVIRONMENT, FISHERIES AND AQUACULTURE SCIENCE
Historical and current status of cockle and mussel stocks in The Wash
P.J. Dare, M.C. Bell, P. Walker and R.C.A. Bannister
Report funded under Defra Contract MB001
LOWESTOFT2004
2
This report should be cited as: Dare, P.J., Bell, M.C., Walker, P. and Bannister, R.C.A., 2004. Historical and current status of cockle and mussel stocks in The Wash. CEFAS Lowestoft, 85pp.
Picture credits: Close up photographs of mussels and cockles on the back cover courtesy of the Eastern Sea Fisheries Joint Committee. All other photographs, CEFAS.
© Crown copyright, 2004Requests for reproduction of material contained within this report should be addressed to CEFAS
3
CONTENTS ........................................................................................Page
continued:/
EXECUTIVE SUMMARY ............................................................................................................................5
1. INTRODUCTION ..............................................................................................................................9 1.1 Background ............................................................................................................................9 1.2 Objectives ............................................................................................................................11 1.3 Information sources .............................................................................................................11 1.4 Review format ......................................................................................................................11 1.5 Acknowledgements ..............................................................................................................12
2. THE WASH ENVIRONMENT .........................................................................................................13 2.1 Circulation ............................................................................................................................13 2.2 Sedimentation ......................................................................................................................13 2.3 Sea temperatures ................................................................................................................14
3. COCKLE AND MUSSEL POPULATION BIOLOGY .....................................................................15 3.1 Population structure and distribution ....................................................................................16 3.2 Growth and biomass ............................................................................................................16 3.3 Ecosystem role ....................................................................................................................16 3.4 Life-history strategies ...........................................................................................................16 3.5 Fecundity .............................................................................................................................17 3.6 Spawning seasons ...............................................................................................................17 3.7 Larval dispersal and settlement ...........................................................................................18 3.8 Recruitment to beds .............................................................................................................18 3.9 The relationship between stock size and recruitment ..........................................................19 3.10 Predation mortality ...............................................................................................................20 3.11 Parasites ..............................................................................................................................21 3.12 Weather-related mortality .....................................................................................................22
4. MOLLUSC FISHERIES OF THE WASH: A BRIEF HISTORY OF FISHING, TECHNICAL CHANGES AND MANAGEMENT .......................................................23 4.1 Pre-1970 ..............................................................................................................................23 4.2 Post-1970 .............................................................................................................................23 4.3 Spatial fishing patterns .........................................................................................................24 4.4 Fishing success ...................................................................................................................25
5. CHANGES IN STOCK ABUNDANCE ...........................................................................................26 5.1 Survey methods ...................................................................................................................26 5.1.1 Mussels ....................................................................................................................26 5.1.2 Cockles ....................................................................................................................26 5.2 Changes in stock biomass and distribution ..........................................................................27 5.2.1 Mussels ....................................................................................................................27 5.2.2 Cockles ....................................................................................................................31 5.3 Exploitation rates .................................................................................................................32 5.3.1 Mussels ....................................................................................................................32 5.3.2 Cockles ....................................................................................................................32
6. STATUS OF STOCKS AND FISHERIES ELSEWHERE ..............................................................36 6.1 Mussels in England and Wales ............................................................................................36 6.2 Mussels in the Dutch Wadden Sea ......................................................................................37 6.3 Cockles in England and Wales ............................................................................................37 6.4 Cockles in the Dutch Wadden Sea ......................................................................................38
7. RECRUITMENT: ANNUAL VARIABILITY OF SPATFALL SETTLEMENTS AND THEIR SURVIVAL .................................................................40 7.1 Spatfalls in The Wash ..........................................................................................................41 7.2 Spatial distribution of spatfalls .............................................................................................42 7.3 Spatfalls in other areas ........................................................................................................42 7.4 Survival of spatfalls ..............................................................................................................43
4
8. RECRUITMENT: FACTORS CONTRIBUTING TO ANNUAL VARIATION ...................................................................................................................45 8.1 Sea temperature and spawning stock size ..........................................................................45 8.2 Larval dispersal ....................................................................................................................45 8.2.1 External sources of larvae .......................................................................................45 8.2.2 Larval dispersal from The Wash ..............................................................................46 8.3 Mortality of larvae .................................................................................................................47 8.4 Environmental and stock influences on recruitment - a new analysis ..................................47 8.4.1 Spatfall, stock and environmental variables ............................................................47 8.4.2 Statistical analyses of spatfall success ....................................................................48 8.4.3 Results of analyses ..................................................................................................49 8.4.4 Conclusions from the analysis - how well do the models predict recent spatfalls? ....51 8.5 Predation ..............................................................................................................................54 8.5.1 Starfish .....................................................................................................................54 8.5.2 Shrimps ....................................................................................................................54 8.5.3 Shore crab ...............................................................................................................55 8.5.4 Shorebirds ...............................................................................................................55 8.6 Mortality events ....................................................................................................................56
9. IMPACTS OF MECHANISED HARVESTING ...............................................................................57 9.1 Effects of dredging on settlement and survival of cockles ...................................................57 9.2 Effects of dredging on settlement and survival of mussels ..................................................58 9.3 Summary and conclusions about dredging impacts ............................................................59
10. OVERVIEW AND CONCLUSIONS ................................................................................................60 10.1 Conclusions about mussels .................................................................................................60 10.2 Conclusions about cockles ..................................................................................................61
11. DIRECTIONS FOR FUTURE SCIENTIFIC WORK UNDERPINNING FISHERY MANAGEMENT .............................................................................................................................64 11.1 Stock identity ........................................................................................................................64 11.2 Mussel recruitment ecology .................................................................................................64 11.3 Impacts of suction dredging on cockle settlement and survival ...........................................64 11.4 Bird predation, fishing and other sources of mortality ..........................................................64 11.5 Fishery models and stock-recruitment relationships ............................................................65 11.6 Collation and integration of data resources .........................................................................65 11.7 Fishery management ...........................................................................................................65 11.7.1 Stock reserves .........................................................................................................66 11.7.2 Spatio-temporal controls ..........................................................................................67 11.7.3 Stock culture and enhancement ..............................................................................67 11.7.4 Technical measures .................................................................................................67
12. REFERENCES ...............................................................................................................................69
ABBREVIATIONS ....................................................................................................................................74
APPENDIX I. WASH FISHERIES DEVELOPMENTS AND MANAGEMENT MEASURES .................75
APPENDIX II. STATISTICAL ANALYSIS OF SPATFALL FREQUENCY DATA .................................76
APPENDIX III. STATISTICAL ANALYSIS OF SPATFALL SUCCESS IN RELATION TO STOCK AND ENVIRONMENTAL FACTORS .............................................................................80
5
EXECUTIVE SUMMARY
Introduction
1. Since 1970, previously artisanal fisheries for cockles and mussels in The Wash have been transformed by the rapid introduction of more powerful fishing gears and vessels and the modernisation of processing plant to service increased demand. This has increased the fishing pressure on stocks. The stocks are managed by the Eastern Sea Fisheries Joint Committee using a combination of byelaws and Regulating Order provisions.
2. Since the late 1980s the increased fishing pressure has coincided with declining stock abundance of both mussels and cockles, with negligible spatfall and recruitment of intertidal mussels. Wash bivalve stocks and fisheries were previously among the largest in Britain.
3. This report was initiated under the Wash Forum to determine whether these cockle and mussel stock declines fall within the range of natural long-term fluctuations or if they indicate that the ecosystem has changed from either natural or anthropogenic causes.
Fisheries
4. Technical developments in the fisheries and fluctuating international markets have placed increasing pressure on cockle and mussel stocks in The Wash. In the 1970s, trade developed in undersized mussels for relaying abroad, and this was accommodated by a reduction in the minimum legal size in 1982. Subsequently, relaying and dredging of mussels also increased to service markets for both bait and human consumption. Hydraulic suction dredging for cockles was introduced in 1986. This fishery subsequently expanded rapidly without a cockle minimum legal size until 1993.
Stock biology and changes in abundance
5. Although the location of mussel and cockle beds in The Wash is similar, the life history, reproduction and population dynamics of the two species show important differences that are relevant to their management. The report provides a summary of the known biology of the two species.
6. In the dynamic environment of The Wash, bivalve stocks are vulnerable to periodic damage from extreme conditions, such as strong tides, northerly storms in winter and occasional cold periods severe enough to produce ice on the intertidal flats. The various beds can be ranked according the risks that they face from these factors.
7. The abundance of mussels in The Wash was surveyed intermittently from 1920 to the mid-1950s, and from the 1980s to the present. Over this period there have been four or five major episodes of change in abundance, commencing with a high stock biomass of more than 35,000 tonnes in the 1920s, a post-war high stock biomass of 20,000 tonnes in the early 1980s, and most recently the unprecedented low period of the 1990s. Since 1977 the number of productive beds fell from more than 14 to zero by 1992.
8. The abundance of cockles in The Wash was surveyed in a few years in the 1920s and 1930s, once in the late 1960s, and in all the years since 1992. The largest measured stock biomass, in 1967, exceeded 60,000 tonnes at densities of more than 100 per square metre, whereas in the 1990s the stocks were generally below 10,000 tonnes and usually at very low densities. The most useful information on cockle stock trends is a long-term index of relative abundance derived by assigning a numerical score to records of the visual reports of fishery officers published in Eastern Sea Fisheries Committee reports since 1894. These cockle stock indices have cycled in a more or less regular manner, with approximately twelve peaks of above average stocks since 1894 separated by troughs of typically 2-3 years duration. Since 1985, stock levels have been low for an unprecedented duration, despite a temporary and incomplete recovery in 1991-94.
9. The proportion of the mussel stock taken by harvesting increased from approximately 25% before 1970 to 50% or more after 1982. For cockles, incomplete data and low survey precision mean that the long term trend in exploitation rate cannot be estimated accurately, even in the most recent period. However, since the introduction of suction dredging it is likely that the exploitation rate has exceeded that in the Thames Estuary suction dredge fishery (around 35%) or the hand raking fishery in the Burry Inlet (20-30%).
6
Recruitment variability
10. It is likely that Wash mussel and cockle stocks normally receive little recruitment from other sources and should be regarded as discrete stocks for management purposes.
11. A cockle spatfall large enough to cause periodic stock increases has occurred once every 6-7 years, whereas mussel spatfalls have been much more irregular. The pattern of cockle spatfalls is unchanged in recent years, but there has been an unprecedented sequence of poor or insignificant mussel spatfalls since the late 1980s.
12. Despite the unchanged pattern of spatfalls, recruitment of cockles to the fishable stock has been poor owing to low survival, particularly over the first winter. First winter survival of cockle spat over recent years was less than 10% in The Wash, compared with over 25% in the Thames Estuary and over 40% in the Burry Inlet. It is not known whether or not this high mortality is a recent phenomenon.
13. The sustained period of low cockle and mussel stock levels has been unique to The Wash. Although the Dutch Wadden Sea experienced a serious spatfall failure for mussels in 1988-91 and for cockles in 1993-96, there has since been good recruitment in both species.
14. Analysis of historical spatfall data shows that dispersal of both cockle and mussel larvae from The Wash is affected by wind-forcing. Higher retention and more successful settlement is associated with above average frequency of easterly winds, especially in June.
15. The likelihood of a good mussel spatfall occurring in The Wash appears to be significantly higher when the winter preceding spawning is colder than usual. It has been postulated that slower metabolism in colder winters reduces the depletion of body reserves, leading to increased fecundity in spring. Cold winters may also reduce the level of predation on spat by crustaceans. The opposite direction of effect is apparent in cockles, for which spatfall success can be higher after relatively warm winters, perhaps because of increased reproductive output. However, cockle spatfall is also enhanced after exceptionally severe winters that have killed most of the adult cockles. This could be related to a combination of reduced predation and reduced competition for space and food between spat and adult cockles.
16. Good mussel spatfalls in The Wash also appear to be more likely when significant adult stocks are present, presumably because established beds act as a settlement site for spat. A good cockle spatfall is more likely when adult stocks are low, probably because of reduced competition for space and food between spat and adults.
17. Environmental conditions have not favoured mussel spatfall success in The Wash over recent years, but it is the low level of the adult stock which appears to be the key factor behind the complete absence of heavy spatfalls. The unchanged pattern of cockle spatfalls over recent years was expected given environmental and stock influences. Warmer winters and low adult stock levels appear to have had a positive effect on cockle spatfall, but this was balanced against a decreased frequency of the wind conditions that favour retention of larvae in The Wash.
18. The most likely predators on cockles and mussels immediately after settlement are shore crabs and brown shrimps. Starfish can also quickly eliminate sub-tidal beds of young mussels. Knot predation on cockle spat could contribute to their low first winter survival. Oystercatcher predation on second year cockles may further reduce their recruitment to the fishable stock. Although these factors can affect year-class strength, there is as yet no evidence that they were a primary cause of stock declines.
Dredging impacts
19. Conflicting evidence is presented on the effects of hydraulic suction dredging on cockle stocks. In the Thames Estuary, suction dredging for cockles has been sustained for over 30 years, and a study in the early 1970s found no impact of one-off dredging events on subsequent spatfall. A study in the Dutch Wadden Sea, however, concluded that suction dredging has long-term negative impacts on spatfall of cockles and other bivalves, primarily because of changes in sediment characteristics. Repeated dredging in the Thames Estuary was shown to reduce survival of young cockles in the early 1970s, but changes in gear technology mean that this finding is not necessarily applicable to modern suction dredging operations in The Wash. There have been no specific studies in The Wash, but as a precaution it has been customary for fishery managers to close beds that are predominantly of undersized cockles, likely to be stressed or damaged by discarding or dredge impacts.
7
20. Less information is available on dredge impacts on mussels than on cockles. Dredging per se appears not to inhibit settlement, since spatfall occurred on dredged beds up until the late 1980s. Given the importance of adult stock as a substrate for settlement of spat, however, recovery or re-establishment of mussel beds could become more difficult if dredging reduces bed area and degrades their physical structure.
Conclusions
21. The most likely cause of the current mussel stock and fisheries problems is the high exploitation rates during the late 1980s and early 1990s combined with the innate variability of mussel spatfall in The Wash. The dependence of spatfall on the presence of adult mussel stocks as a settlement surface means that, once these beds have become depleted, it is difficult for them to re-establish. Establishment of a new mussel bed in The Wash is a rare event. Moreover, environmental conditions in recent years have been unfavourable for mussel spatfall – there have been no cold winters to promote high reproductive output, and there has been a low frequency of the wind conditions that favour larval retention. Natural recovery of mussel stocks is likely to be slow under current stock and environmental conditions.
22. Cockle stocks have also been depleted by high exploitation rates in the early 1990s. Unlike mussels, however, the failure to replace depleted stocks has not been a result of unusually poor spatfalls. Low recruitment to the fishable stock has resulted from high post-settlement mortality of young cockles, particularly over the first winter. It is unclear whether this is a recent phenomenon or simply a natural population dynamic feature that makes Wash cockles particularly vulnerable to depletion.
Future directions
23. Future research could shed further light on the causes of cockle and mussel stock declines in The Wash and be used to underpin the management of sustainable fisheries in future. Some important directions for research include:• clarifying the genetic identity of cockle and mussel stocks in The Wash, to determine whether they are
self-sustaining;• investigating the recruitment ecology of mussels in The Wash, to determine which life-history stages are
limiting and to identify possible management actions to promote recruitment;• a Wash-specific study of the impact of modern hydraulic suction dredging operations on cockles and
their environment;• resolving cockle and mussel mortality into components from fishing, bird predation and other sources;• construction of life-history models to allow the effects of management scenarios to be explored;• collation of historic and current data on Wash fisheries, ecology and environment into a single GIS
framework.
24. Management of The Wash cockle and mussel fisheries needs to be viewed in the context of objectives agreed for the fisheries and for the site (Special Area of Conservation) as a whole. The report sets out some of the options for management, including:• setting aside stock reserves to safeguard spawning, insure against future recruitment failure and provide
ecosystem functions such as food for shorebirds;• spatio-temporal controls on fishing effort, including closed areas and closed seasons;• stock culture and enhancement, especially the relaying of mussel seed taken from sub-tidal areas and
other sites;• technical measures such as minimum legal sizes and maximum breakage rates.

8
9
1. INTRODUCTION1.1 Background
The Wash has supported important shellfisheries for cockles (Cerastoderma edule) and mussels (Mytilus edulis) for more than a century. Mussel cultivation, through transplanting stocks onto ‘lays’ on the lower shore, has also been carried out since the early 1900s. Local fishing activities have been managed by the Eastern Sea Fisheries Joint Committee (ESFJC) since 1894. Management measures have been defined under a set of Several and Regulating Orders and byelaws approved by Defra and its predecessors. In 1992, these management tools were combined under the Wash Fishery Order 1992. By this time the traditional artisanal fishing practices had been transformed by the advent of new and more powerful fishing gears and vessels, and by major investment in modern processing plant to supply new markets.
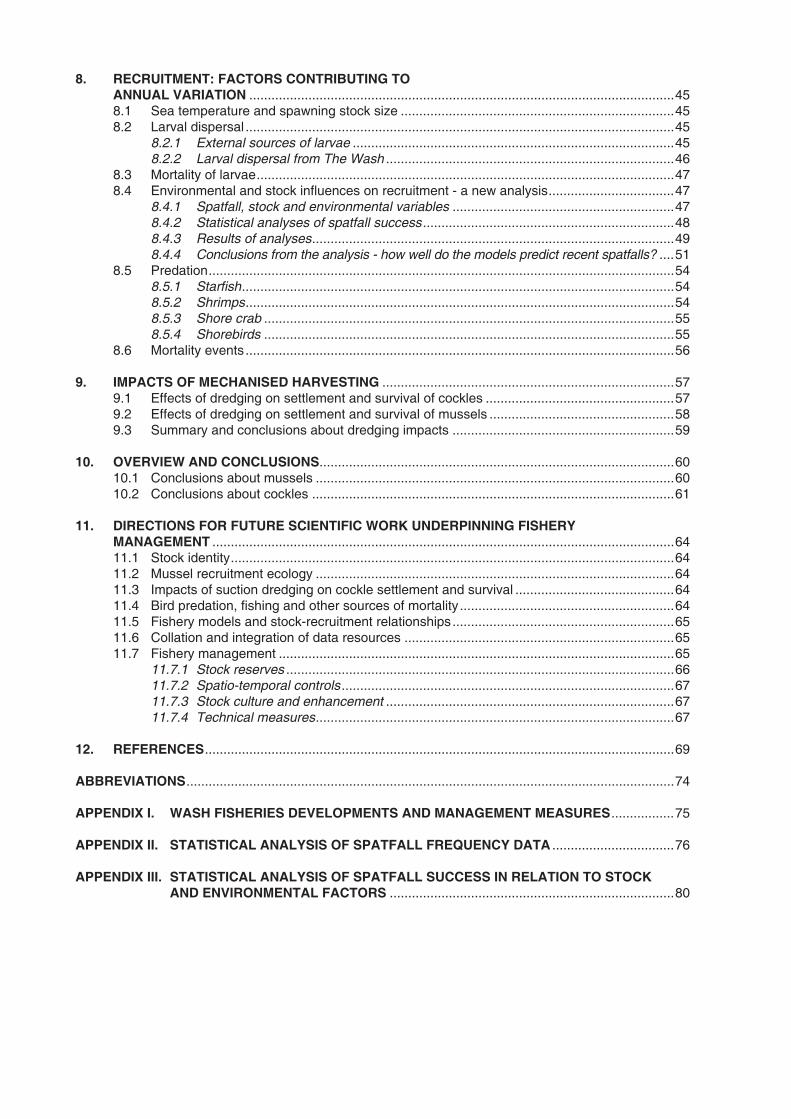
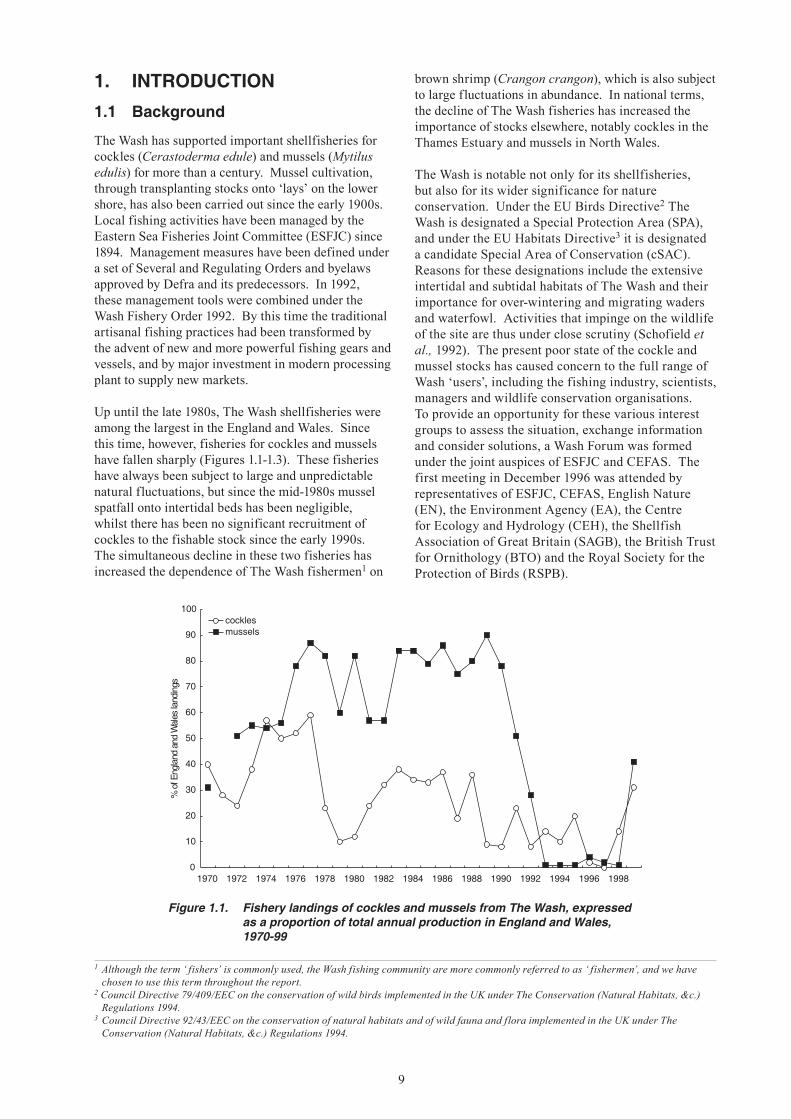
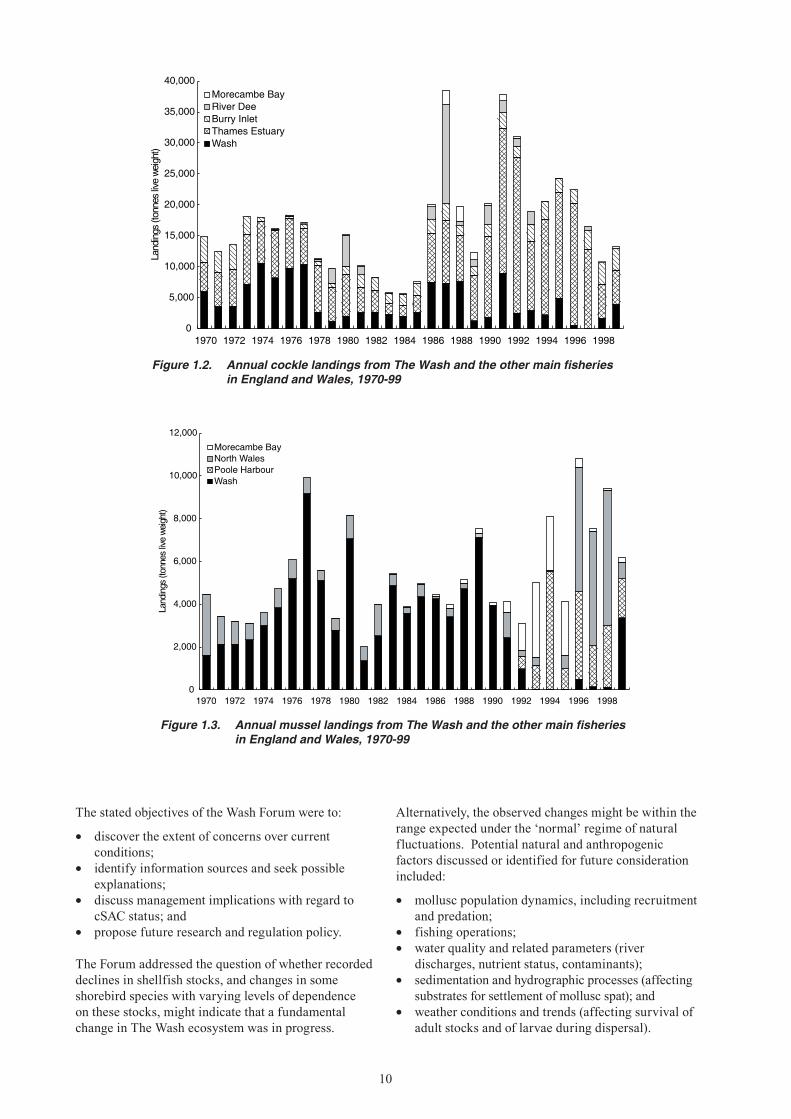
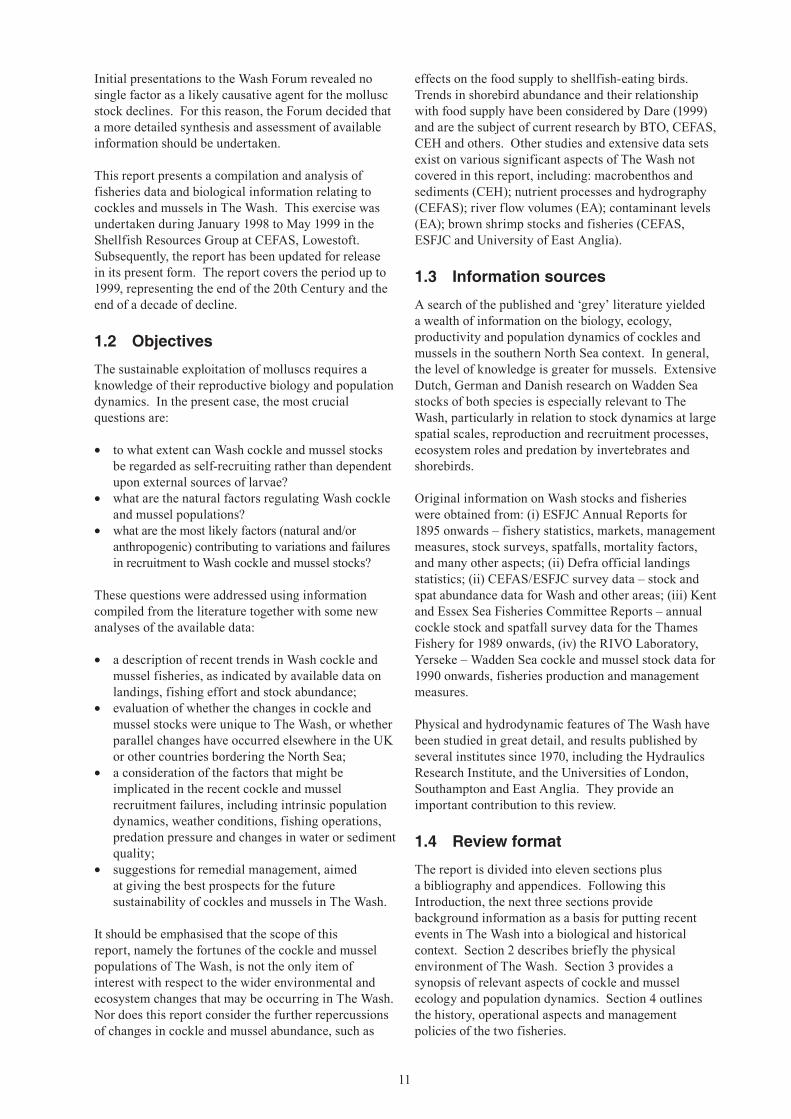
Up until the late 1980s, The Wash shellfisheries were among the largest in the England and Wales. Since this time, however, fisheries for cockles and mussels have fallen sharply (Figures 1.1-1.3). These fisheries have always been subject to large and unpredictable natural fluctuations, but since the mid-1980s mussel spatfall onto intertidal beds has been negligible, whilst there has been no significant recruitment of cockles to the fishable stock since the early 1990s. The simultaneous decline in these two fisheries has increased the dependence of The Wash fishermen1 on
brown shrimp (Crangon crangon), which is also subject to large fluctuations in abundance. In national terms, the decline of The Wash fisheries has increased the importance of stocks elsewhere, notably cockles in the Thames Estuary and mussels in North Wales.
The Wash is notable not only for its shellfisheries, but also for its wider significance for nature conservation. Under the EU Birds Directive2 The Wash is designated a Special Protection Area (SPA), and under the EU Habitats Directive3 it is designated a candidate Special Area of Conservation (cSAC). Reasons for these designations include the extensive intertidal and subtidal habitats of The Wash and their importance for over-wintering and migrating waders and waterfowl. Activities that impinge on the wildlife of the site are thus under close scrutiny (Schofield et al., 1992). The present poor state of the cockle and mussel stocks has caused concern to the full range of Wash ‘users’, including the fishing industry, scientists, managers and wildlife conservation organisations. To provide an opportunity for these various interest groups to assess the situation, exchange information and consider solutions, a Wash Forum was formed under the joint auspices of ESFJC and CEFAS. The first meeting in December 1996 was attended by representatives of ESFJC, CEFAS, English Nature (EN), the Environment Agency (EA), the Centre for Ecology and Hydrology (CEH), the Shellfish Association of Great Britain (SAGB), the British Trust for Ornithology (BTO) and the Royal Society for the Protection of Birds (RSPB).
1 Although the term ‘ fishers’ is commonly used, the Wash fishing community are more commonly referred to as ‘ fishermen’, and we have chosen to use this term throughout the report.
2 Council Directive 79/409/EEC on the conservation of wild birds implemented in the UK under The Conservation (Natural Habitats, &c.) Regulations 1994.
3 Council Directive 92/43/EEC on the conservation of natural habitats and of wild fauna and flora implemented in the UK under The Conservation (Natural Habitats, &c.) Regulations 1994.
0
10
20
30
40
50
60
70
80
90
100
1970 1972 1974 1976 1978 1980 1982 1984 1986 1988 1990 1992 1994 1996 1998
%ofEnglandandWaleslandings
cocklesmussels
Figure 1.1. Fishery landings of cockles and mussels from The Wash, expressed as a proportion of total annual production in England and Wales, 1970-99
10
The stated objectives of the Wash Forum were to:
• discover the extent of concerns over current conditions;
• identify information sources and seek possible explanations;
• discuss management implications with regard to cSAC status; and
• propose future research and regulation policy.
The Forum addressed the question of whether recorded declines in shellfish stocks, and changes in some shorebird species with varying levels of dependence on these stocks, might indicate that a fundamental change in The Wash ecosystem was in progress.
Figure 1.2. Annual cockle landings from The Wash and the other main fisheries in England and Wales, 1970-99
Figure 1.3. Annual mussel landings from The Wash and the other main fisheries in England and Wales, 1970-99
Alternatively, the observed changes might be within the range expected under the ‘normal’ regime of natural fluctuations. Potential natural and anthropogenic factors discussed or identified for future consideration included:
• mollusc population dynamics, including recruitment and predation;
• fishing operations;• water quality and related parameters (river
discharges, nutrient status, contaminants);• sedimentation and hydrographic processes (affecting
substrates for settlement of mollusc spat); and• weather conditions and trends (affecting survival of
adult stocks and of larvae during dispersal).
0
5,000
10,000
15,000
20,000
25,000
30,000
35,000
40,000
1970 1972 1974 1976 1978 1980 1982 1984 1986 1988 1990 1992 1994 1996 1998
Landings(tonnesliveweight)
Morecambe BayRiver DeeBurry InletThames EstuaryWash
0
2,000
4,000
6,000
8,000
10,000
12,000
1970 1972 1974 1976 1978 1980 1982 1984 1986 1988 1990 1992 1994 1996 1998
Landings(tonnesliveweight)
Morecambe BayNorth WalesPoole HarbourWash
11
Initial presentations to the Wash Forum revealed no single factor as a likely causative agent for the mollusc stock declines. For this reason, the Forum decided that a more detailed synthesis and assessment of available information should be undertaken.
This report presents a compilation and analysis of fisheries data and biological information relating to cockles and mussels in The Wash. This exercise was undertaken during January 1998 to May 1999 in the Shellfish Resources Group at CEFAS, Lowestoft. Subsequently, the report has been updated for release in its present form. The report covers the period up to 1999, representing the end of the 20th Century and the end of a decade of decline.
1.2 Objectives
The sustainable exploitation of molluscs requires a knowledge of their reproductive biology and population dynamics. In the present case, the most crucial questions are:
• to what extent can Wash cockle and mussel stocks be regarded as self-recruiting rather than dependent upon external sources of larvae?
• what are the natural factors regulating Wash cockle and mussel populations?
• what are the most likely factors (natural and/or anthropogenic) contributing to variations and failures in recruitment to Wash cockle and mussel stocks?
These questions were addressed using information compiled from the literature together with some new analyses of the available data:
• a description of recent trends in Wash cockle and mussel fisheries, as indicated by available data on landings, fishing effort and stock abundance;
• evaluation of whether the changes in cockle and mussel stocks were unique to The Wash, or whether parallel changes have occurred elsewhere in the UK or other countries bordering the North Sea;
• a consideration of the factors that might be implicated in the recent cockle and mussel recruitment failures, including intrinsic population dynamics, weather conditions, fishing operations, predation pressure and changes in water or sediment quality;
• suggestions for remedial management, aimed at giving the best prospects for the future sustainability of cockles and mussels in The Wash.
It should be emphasised that the scope of this report, namely the fortunes of the cockle and mussel populations of The Wash, is not the only item of interest with respect to the wider environmental and ecosystem changes that may be occurring in The Wash. Nor does this report consider the further repercussions of changes in cockle and mussel abundance, such as
effects on the food supply to shellfish-eating birds. Trends in shorebird abundance and their relationship with food supply have been considered by Dare (1999) and are the subject of current research by BTO, CEFAS, CEH and others. Other studies and extensive data sets exist on various significant aspects of The Wash not covered in this report, including: macrobenthos and sediments (CEH); nutrient processes and hydrography (CEFAS); river flow volumes (EA); contaminant levels (EA); brown shrimp stocks and fisheries (CEFAS, ESFJC and University of East Anglia).
1.3 Information sources
A search of the published and ‘grey’ literature yielded a wealth of information on the biology, ecology, productivity and population dynamics of cockles and mussels in the southern North Sea context. In general, the level of knowledge is greater for mussels. Extensive Dutch, German and Danish research on Wadden Sea stocks of both species is especially relevant to The Wash, particularly in relation to stock dynamics at large spatial scales, reproduction and recruitment processes, ecosystem roles and predation by invertebrates and shorebirds.
Original information on Wash stocks and fisheries were obtained from: (i) ESFJC Annual Reports for 1895 onwards – fishery statistics, markets, management measures, stock surveys, spatfalls, mortality factors, and many other aspects; (ii) Defra official landings statistics; (ii) CEFAS/ESFJC survey data – stock and spat abundance data for Wash and other areas; (iii) Kent and Essex Sea Fisheries Committee Reports – annual cockle stock and spatfall survey data for the Thames Fishery for 1989 onwards, (iv) the RIVO Laboratory, Yerseke – Wadden Sea cockle and mussel stock data for 1990 onwards, fisheries production and management measures.
Physical and hydrodynamic features of The Wash have been studied in great detail, and results published by several institutes since 1970, including the Hydraulics Research Institute, and the Universities of London, Southampton and East Anglia. They provide an important contribution to this review.
1.4 Review format
The report is divided into eleven sections plus a bibliography and appendices. Following this Introduction, the next three sections provide background information as a basis for putting recent events in The Wash into a biological and historical context. Section 2 describes briefly the physical environment of The Wash. Section 3 provides a synopsis of relevant aspects of cockle and mussel ecology and population dynamics. Section 4 outlines the history, operational aspects and management policies of the two fisheries.
12
The remaining sections describe the major trends and their possible causes. Recorded changes in stock abundance during this century are described in Section 5, with emphasis upon recent trends in relation to harvests and fishing patterns. A comparison with the status of fisheries elsewhere in the country and in the Netherlands is made in Section 6. The variability of annual recruitment to Wash cockle and mussel populations is analysed in Section 7 and examined for similarities with populations elsewhere.
Sections 8 and 9 assess various biological, fishery and environmental factors which could have contributed to the recent stock declines. Finally, Section 10 provides a brief overview and conclusions, while Section 11 sets out possible directions for future research and for the management of these two fisheries.
1.5 Acknowledgements
The authors are indebted to many people for individual assistance and discussions. At CEFAS we thank Dr Julian Addison, Derek Eaton and Dave Palmer for comments on the text, Andy Lawler for information on shrimps and environmental conditions in The Wash, Dr Emma Young for modelling larval dispersal and Dr Vardis Tsontos for comments on cockle dynamics. At ESFJC, Chris Amos and Matt Mander provided additional fisheries and stock survey information. Special thanks go to Dutch colleagues Dr Aad Smaal and Dr Marnix van Stralen at RIVO for information on Wadden Sea stocks and Dr Pieter Honkoop at NIOZ for information on the relationships of fecundity with temperature. Dr Mick Yates (CEH) discussed benthos trends in The Wash, and Helen Vine (EN) provided a marine nature conservation perspective. We would also like to thank the CEFAS Publications and Graphics Team for drawing many of the figures and preparing this report for publication.
13
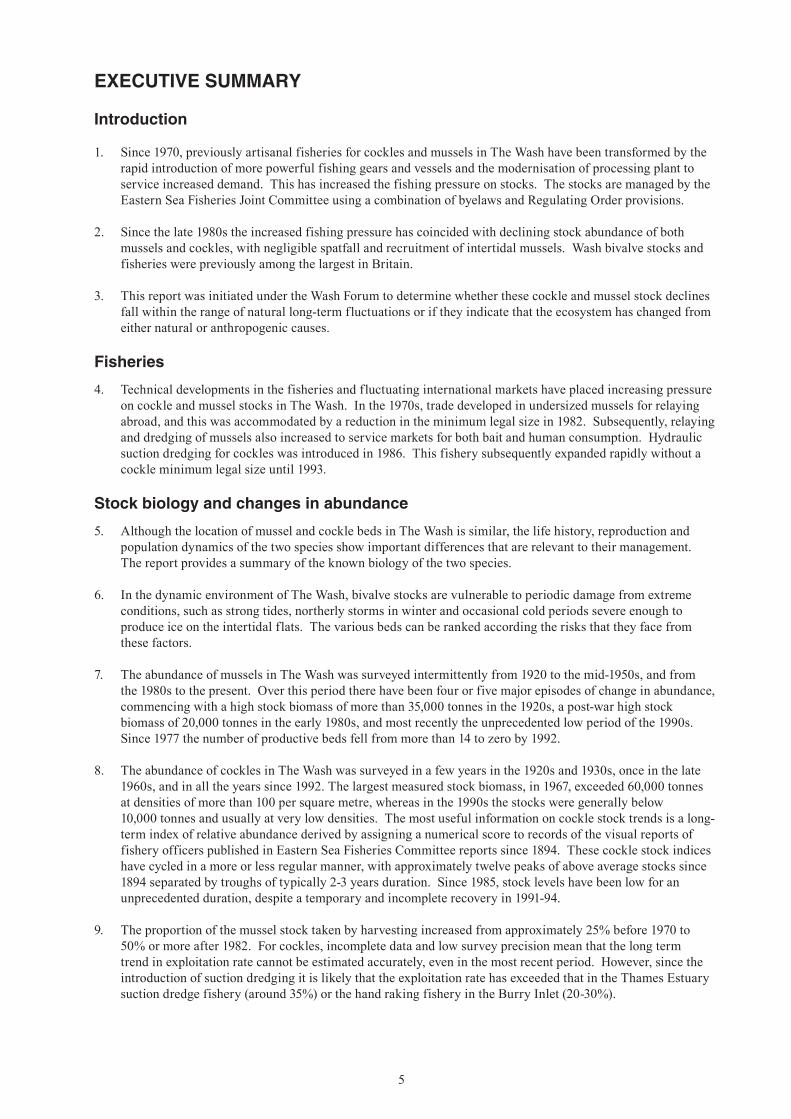
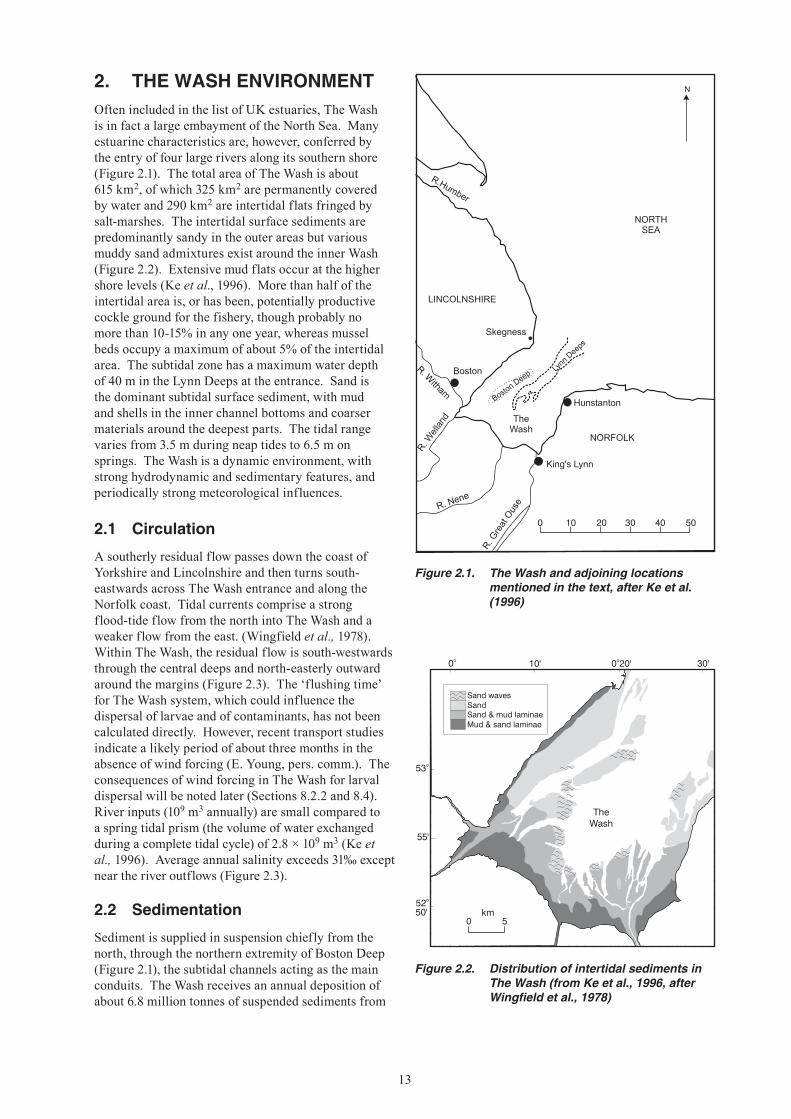
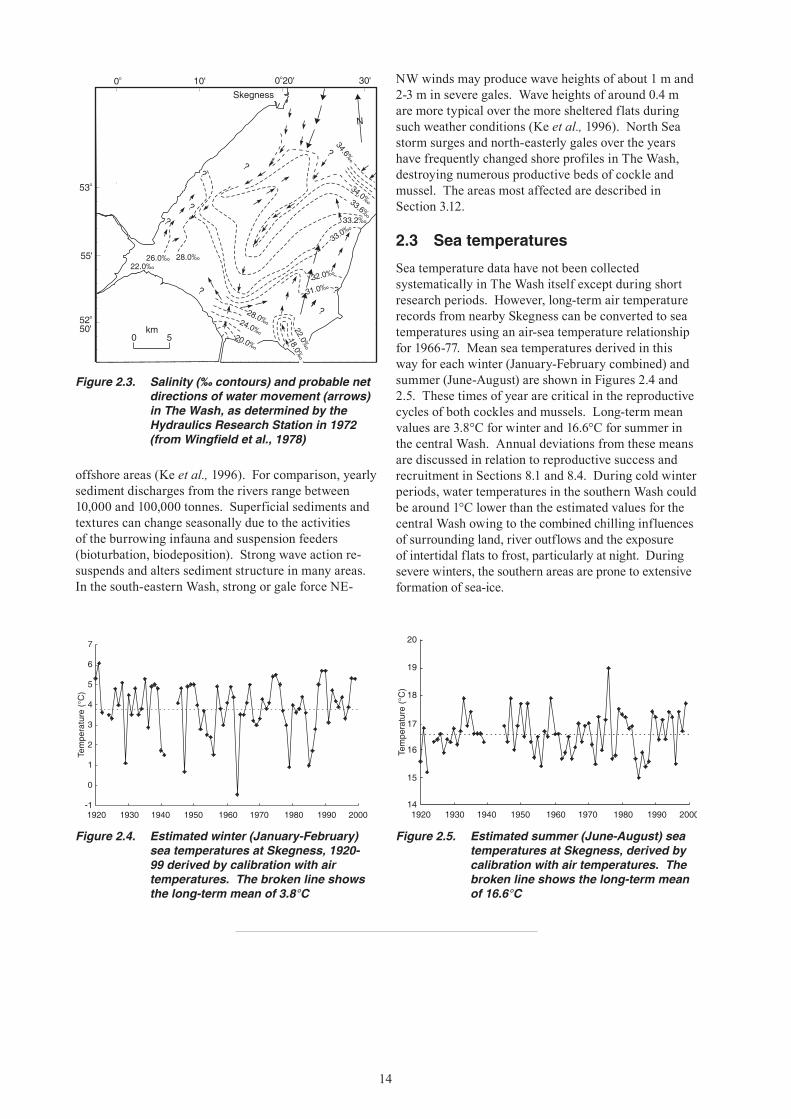
Figure 2.2. Distribution of intertidal sediments in The Wash (from Ke et al., 1996, after Wingfield et al., 1978)
53o
0o 0 20'o
52o
50'
55'
10' 30'
TheWash
Sand wavesSandSand & mud laminaeMud & sand laminae
0 5km
Figure 2.1. The Wash and adjoining locations mentioned in the text, after Ke et al. (1996)
TheWash
LINCOLNSHIRE
R.Humber
NORTHSEA
NORFOLK
Hunstanton
King's Lynn
Boston
Skegness
R. Nene
R. Wel
land
R. G
reat
Ous
e
Boston Deep
Lynn
Deeps
N
R. Witham
0 10 20 30 40 50
2. THE WASH ENVIRONMENTOften included in the list of UK estuaries, The Wash is in fact a large embayment of the North Sea. Many estuarine characteristics are, however, conferred by the entry of four large rivers along its southern shore (Figure 2.1). The total area of The Wash is about 615 km2, of which 325 km2 are permanently covered by water and 290 km2 are intertidal flats fringed by salt-marshes. The intertidal surface sediments are predominantly sandy in the outer areas but various muddy sand admixtures exist around the inner Wash (Figure 2.2). Extensive mud flats occur at the higher shore levels (Ke et al., 1996). More than half of the intertidal area is, or has been, potentially productive cockle ground for the fishery, though probably no more than 10-15% in any one year, whereas mussel beds occupy a maximum of about 5% of the intertidal area. The subtidal zone has a maximum water depth of 40 m in the Lynn Deeps at the entrance. Sand is the dominant subtidal surface sediment, with mud and shells in the inner channel bottoms and coarser materials around the deepest parts. The tidal range varies from 3.5 m during neap tides to 6.5 m on springs. The Wash is a dynamic environment, with strong hydrodynamic and sedimentary features, and periodically strong meteorological influences.
2.1 Circulation
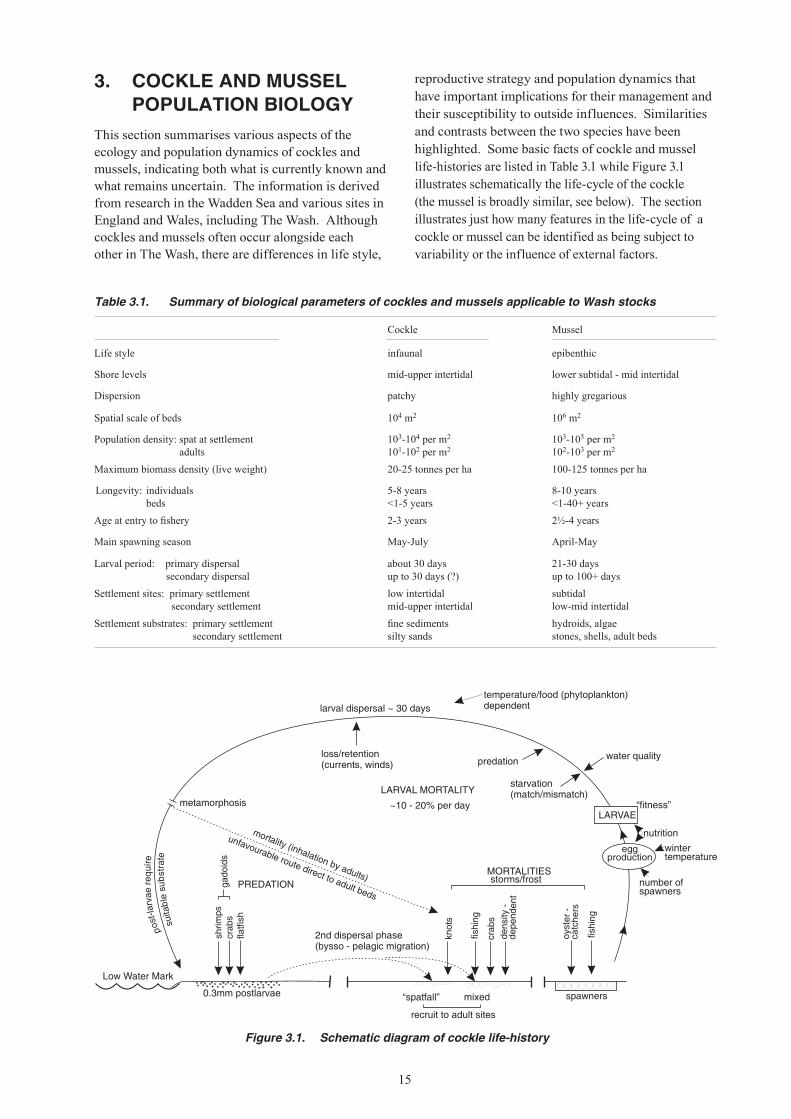
A southerly residual flow passes down the coast of Yorkshire and Lincolnshire and then turns south-eastwards across The Wash entrance and along the Norfolk coast. Tidal currents comprise a strong flood-tide flow from the north into The Wash and a weaker flow from the east. (Wingfield et al., 1978). Within The Wash, the residual flow is south-westwards through the central deeps and north-easterly outward around the margins (Figure 2.3). The ‘flushing time’ for The Wash system, which could influence the dispersal of larvae and of contaminants, has not been calculated directly. However, recent transport studies indicate a likely period of about three months in the absence of wind forcing (E. Young, pers. comm.). The consequences of wind forcing in The Wash for larval dispersal will be noted later (Sections 8.2.2 and 8.4). River inputs (109 m3 annually) are small compared to a spring tidal prism (the volume of water exchanged during a complete tidal cycle) of 2.8 × 10⁹ m3 (Ke et al., 1996). Average annual salinity exceeds 31‰ except near the river outflows (Figure 2.3).
2.2 Sedimentation
Sediment is supplied in suspension chiefly from the north, through the northern extremity of Boston Deep (Figure 2.1), the subtidal channels acting as the main conduits. The Wash receives an annual deposition of about 6.8 million tonnes of suspended sediments from
14
offshore areas (Ke et al., 1996). For comparison, yearly sediment discharges from the rivers range between 10,000 and 100,000 tonnes. Superficial sediments and textures can change seasonally due to the activities of the burrowing infauna and suspension feeders (bioturbation, biodeposition). Strong wave action re-suspends and alters sediment structure in many areas. In the south-eastern Wash, strong or gale force NE-
Figure 2.3. Salinity (‰ contours) and probable net directions of water movement (arrows) in The Wash, as determined by the Hydraulics Research Station in 1972 (from Wingfield et al., 1978)
53o
0o 0 20'o
52o
50'
55'
10' 30'
N
Skegness
??
?
34.0‰
34.6‰
33.6‰33.2‰
33.0‰
28.0‰24.0‰
32.0‰
31.0‰ ?
?
?
26.0‰ 28.0‰22.0‰
22.0‰18.0‰
?
?
20.0‰0 5
km
Figure 2.4. Estimated winter (January-February) sea temperatures at Skegness, 1920-99 derived by calibration with air temperatures. The broken line shows the long-term mean of 3.8°C
Figure 2.5. Estimated summer (June-August) sea temperatures at Skegness, derived by calibration with air temperatures. The broken line shows the long-term mean of 16.6°C
1920 1930 1940 1950 1960 1970 1980 1990 2000
20
19
18
17
16
15
14
Temperature(°C)
NW winds may produce wave heights of about 1 m and 2-3 m in severe gales. Wave heights of around 0.4 m are more typical over the more sheltered flats during such weather conditions (Ke et al., 1996). North Sea storm surges and north-easterly gales over the years have frequently changed shore profiles in The Wash, destroying numerous productive beds of cockle and mussel. The areas most affected are described in Section 3.12.
2.3 Sea temperatures
Sea temperature data have not been collected systematically in The Wash itself except during short research periods. However, long-term air temperature records from nearby Skegness can be converted to sea temperatures using an air-sea temperature relationship for 1966-77. Mean sea temperatures derived in this way for each winter (January-February combined) and summer (June-August) are shown in Figures 2.4 and 2.5. These times of year are critical in the reproductive cycles of both cockles and mussels. Long-term mean values are 3.8°C for winter and 16.6°C for summer in the central Wash. Annual deviations from these means are discussed in relation to reproductive success and recruitment in Sections 8.1 and 8.4. During cold winter periods, water temperatures in the southern Wash could be around 1°C lower than the estimated values for the central Wash owing to the combined chilling influences of surrounding land, river outflows and the exposure of intertidal flats to frost, particularly at night. During severe winters, the southern areas are prone to extensive formation of sea-ice.
1920 1930 1940 1950 1960 1970 1980 1990 2000
7
6
5
4
3
2
1
0
-1
Temperature(°C)
15
3. COCKLE AND MUSSEL POPULATION BIOLOGY
This section summarises various aspects of the ecology and population dynamics of cockles and mussels, indicating both what is currently known and what remains uncertain. The information is derived from research in the Wadden Sea and various sites in England and Wales, including The Wash. Although cockles and mussels often occur alongside each other in The Wash, there are differences in life style,
Cockle Mussel
Life style infaunal epibenthic
Shore levels mid-upper intertidal lower subtidal - mid intertidal
Dispersion patchy highly gregarious
Spatial scale of beds 104 m2 106 m2
Population density: spat at settlement adults
103-104 per m2
101-102 per m2103-105 per m2
102-103 per m2
Maximum biomass density (live weight) 20-25 tonnes per ha 100-125 tonnes per ha
Longevity: individuals beds
5-8 years<1-5 years
8-10 years<1-40+ years
Age at entry to fishery 2-3 years 2½-4 years
Main spawning season May-July April-May
Larval period: primary dispersal secondary dispersal
about 30 daysup to 30 days (?)
21-30 daysup to 100+ days
Settlement sites: primary settlement secondary settlement
low intertidalmid-upper intertidal
subtidallow-mid intertidal
Settlement substrates: primary settlement secondary settlement
fine sedimentssilty sands
hydroids, algaestones, shells, adult beds
Table 3.1. Summary of biological parameters of cockles and mussels applicable to Wash stocks
reproductive strategy and population dynamics that have important implications for their management and their susceptibility to outside influences. Similarities and contrasts between the two species have been highlighted. Some basic facts of cockle and mussel life-histories are listed in Table 3.1 while Figure 3.1 illustrates schematically the life-cycle of the cockle (the mussel is broadly similar, see below). The section illustrates just how many features in the life-cycle of a cockle or mussel can be identified as being subject to variability or the influence of external factors.
0.3mm postlarvae
PREDATION
post-larvae
require
shrim
psgadoids
crabs
knots
fishing
crabs
fishing
density
-dependent
oyster-
catchers
flatfish
Low Water Mark
storms/frostMORTALITIES
spawnersmixed
recruit to adult sites
“spatfall”
2nd dispersal phase(bysso - pelagic migration)
mortality (inhalation by adults)
unfavourable route direct to adult beds
metamorphosis
loss/retention(currents, winds)
LARVAL MORTALITY
~10 - 20% per day
predation
starvation(match/mismatch)
water quality
nutritionwintertemperature
number ofspawners
LARVAE“fitness”
eggproduction
larval dispersal ~ 30 daystemperature/food (phytoplankton)dependent
suitablesubstrate
Figure 3.1. Schematic diagram of cockle life-history
16
3.1 Population structure and distribution
Cockles are dispersed unevenly at lower densities and over greater areas than mussels and in peak years they have occupied virtually the entire intertidal zone of muddy sands in The Wash. Population turnover is rapid. Each dense patch (‘bed’) often comprises one dominant year-class of cockles, reflecting annual and spatial variability in spatfall and formation of new beds. The cockle fishery in The Wash targets the fastest growing patches first. Exploitable grounds may cover up to 10-15% of the intertidal zone in good years. Adult cockles often surface at night and re-distribute themselves with the aid of water currents (Richardson et al., 1993). They can also extricate themselves, in aquaria, from beneath an extra sediment overload of 5 cm, and sometimes from beneath 10 cm (Jackson & James, 1979; Chambers, 1991).
Mussels form distinctive raised beds (biogenic reefs) in which animals embyss together to form dense clumps, attached initially to firm, rough substrates (stones, shells, live mussels or cockles). In The Wash, mussel beds have occurred at about 75 sites in the past 100 years but the population has generally been aggregated into 15-30 sites. Some sites have been occupied for many decades, especially at higher and unfished levels. The development of a mature mussel bed is a comparatively rare event. Other beds, especially subtidal ones, are ephemeral (<1-3 years) owing to predation or wave/storm action. Most established mussel beds comprise a range of year-classes. The Wash mussel fishery primarily targets the faster-growing stocks at lower shore levels which yield the best quality meats and highest catch rates. Traditionally, the poorer quality mussel stocks at higher shore levels have been used only for transplanting to culture plots (‘lays’) lower on the shore.
3.2 Growth and biomass
Growth of cockles and mussels is highly variable between sites and years, depending strongly on shore-level, which governs feeding time (Seed & Suchanek, 1992 for mussels; Ivell, 1981, Jensen, 1992 for cockles). Growth is also related to population density, with slowest growth where the population is densest (Dare & Edwards, 1976 for mussels; Hancock, 1969, 1973, Ivell, 1981, Jensen, 1993 for cockles). Typically, the standing stock biomass and production rates per unit area are much greater for mussels than for cockles (Dare, 1976). In The Wash the average biomass densities (live weight) on good mussel beds since 1982 have ranged from 7-10 kg/m2, with 18-20 kg/m2 on the mussel mounds themselves. On the better adult cockle beds (around 200 cockles/m2) biomass densities tend to be much lower, in the range 1-1.5 kg/m2.
3.3 Ecosystem role
Cockles and mussels are suspension feeders, filtering phytoplankton, small organic particles and inorganic particles down to 3 µm size. A large and dense mussel bed is a powerful filtration system which in a day can process up to 1-3 m3 of sea water per m2 of bed area and around 3,000 m3 of water per tonne live weight (Dankers & Koolemaij, 1989). In the Wadden Sea and the Oosterschelde, where cockles and mussels dominate the benthos, the combined biomass of both species in high stock years is capable of filtering the entire water volume in a single week (Dankers & Koolemaij, 1989). Inter-specific competition for food is likely to occur, and mussel beds adjoining and upstream of cockles can deplete the seston content sufficiently to reduce cockle growth (Kamermans, 1993). Mussel beds alone can consume around 30% of the local primary production (Dankers & Koolemaij, 1989). Surplus food particles and inorganic silt are ejected by mussels as pseudofaeces and then deposited as ‘mussel mud’ which accretes between and beneath the mussels. The rapid build-up in summer of a soft, unstable layer (up to 0.5 m thick) renders beds in exposed sites vulnerable to being swept away by strong currents and storm waves (Dare, 1976). Beds may enhance primary production by releasing large amounts of dissolved nutrients (ammonia, phosphates), and stimulate remineralisation from biodeposits (Kautsky & Evans, 1987; Dankers & Koolemaij, 1989). Beds may also play a significant role in coastal sedimentation processes by acting as major sinks for particulates (Dame & Dankers, 1988). As efficient biological filters, they also remove faecal pathogens from contaminated river and waste discharges.
3.4 Life-history strategies
Cockles and mussels mature quickly, have a high fecundity (see below), are relatively short-lived and have very variable recruitment and population size. This combination of life-history traits is characteristic of organisms whose populations are controlled more by their capacity to reproduce than the capacity of the environment to support them (Krebs, 1978). Populations of such organisms tend to be unstable over time, varying widely in response to favourable or unfavourable environmental conditions. A consequence for cockles and mussels is that mortality, including fishing mortality, should not necessarily be considered as the dominant factor controlling recruitment success (Dankers, 1993). In the extreme case of ephemeral young beds of mussels in subtidal channels, or of settlements of cockles in exposed locations, at high risk of complete loss to storms, exploitation rates of up to 100% could be applied without affecting the natural processes of population regulation.
17
When considered in aggregate, mussels in certain locations display much more stable population characteristics. Dankers (1993) regarded long-established beds of mussels in the Wadden Sea as ‘super-organisms’ – such beds are stable over time, although the individual year-classes that contribute to the bed are themselves very variable (McGrorty et al., 1990; Dankers 1993). These stable, long-lived beds can be destabilised by even moderate fishing pressures and, if lost to fishing, may seldom re-establish (Dankers, 1993). For the Wadden Sea, there appears to be an increasing consensus of opinion among ecologists for complete protection of established intertidal beds as special ecosystem features in their own right, which also serve as spawning stocks for fisheries and as vital food resources for shorebirds.
The mussel is a classic pioneer coloniser of rough, hard substrates on exposed coasts as well as of firm coastal sediments in estuaries, and has a very extended larval dispersal (Seed & Suchanek, 1992). In a North Sea context, self-recruitment within estuaries is not essential for its success. The cockle, by contrast, is more restricted by its requirement for soft sandy sediments and is largely confined to estuaries and sheltered bays. A greater degree of larval retention within a system (self-recruitment) would be advantageous for cockles and is perhaps reflected by its shorter dispersal phase.
3.5 Fecundity
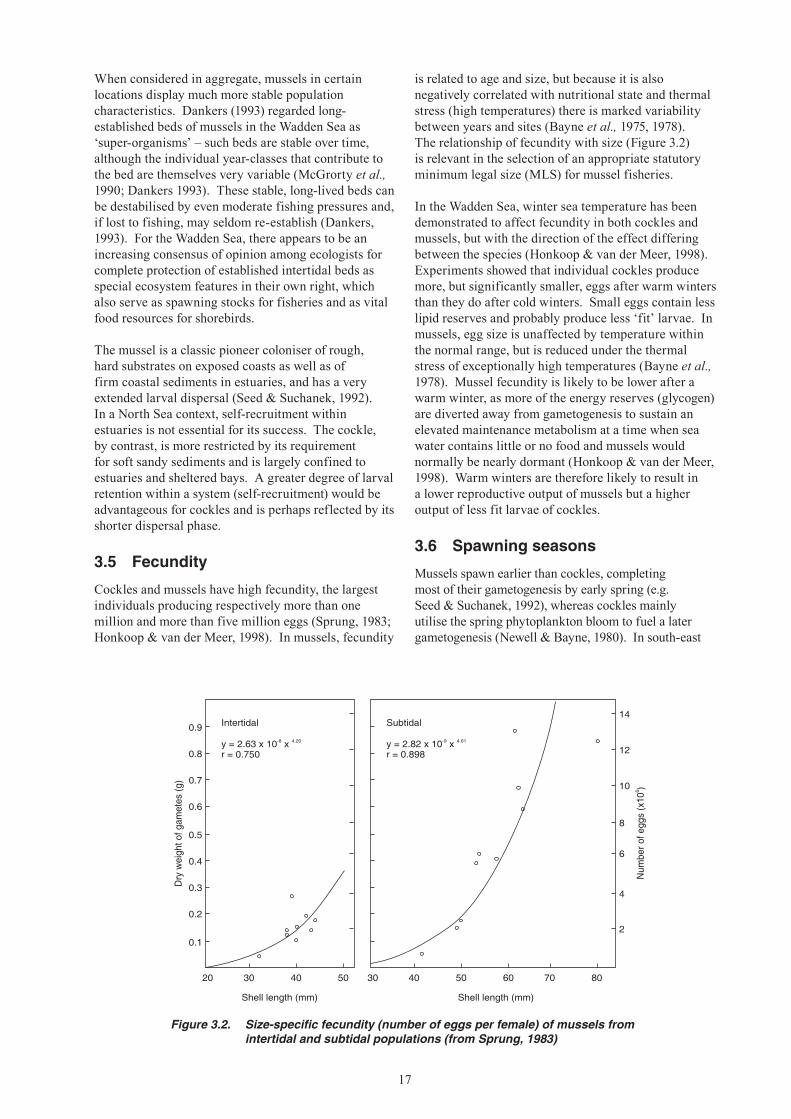
Cockles and mussels have high fecundity, the largest individuals producing respectively more than one million and more than five million eggs (Sprung, 1983; Honkoop & van der Meer, 1998). In mussels, fecundity
is related to age and size, but because it is also negatively correlated with nutritional state and thermal stress (high temperatures) there is marked variability between years and sites (Bayne et al., 1975, 1978). The relationship of fecundity with size (Figure 3.2) is relevant in the selection of an appropriate statutory minimum legal size (MLS) for mussel fisheries.
In the Wadden Sea, winter sea temperature has been demonstrated to affect fecundity in both cockles and mussels, but with the direction of the effect differing between the species (Honkoop & van der Meer, 1998). Experiments showed that individual cockles produce more, but significantly smaller, eggs after warm winters than they do after cold winters. Small eggs contain less lipid reserves and probably produce less ‘fit’ larvae. In mussels, egg size is unaffected by temperature within the normal range, but is reduced under the thermal stress of exceptionally high temperatures (Bayne et al., 1978). Mussel fecundity is likely to be lower after a warm winter, as more of the energy reserves (glycogen) are diverted away from gametogenesis to sustain an elevated maintenance metabolism at a time when sea water contains little or no food and mussels would normally be nearly dormant (Honkoop & van der Meer, 1998). Warm winters are therefore likely to result in a lower reproductive output of mussels but a higher output of less fit larvae of cockles.
3.6 Spawning seasons
Mussels spawn earlier than cockles, completing most of their gametogenesis by early spring (e.g. Seed & Suchanek, 1992), whereas cockles mainly utilise the spring phytoplankton bloom to fuel a later gametogenesis (Newell & Bayne, 1980). In south-east
Figure 3.2. Size-specific fecundity (number of eggs per female) of mussels from intertidal and subtidal populations (from Sprung, 1983)
Intertidal
y = 2.63 x 10 xr = 0.750
-8 4.20
0.1
0.2
0.3
0.4
0.5
0.6
0.7
0.8
0.9
Dryweightofgam
etes
(g)
20 30 40 50
Shell length (mm)
Num
berofeggs(x10
)6
Subtidal
y = 2.82 x 10 xr = 0.898
-9 4.61
2
4
6
8
10
12
14
30 40 50 60
Shell length (mm)
8070
18
England (probably including The Wash) mussels spawn mostly in April/May and cockles from May to June/July and sometimes until August (Boyden, 1971). Mussels may have a secondary spawning season in early autumn following summer deposition of new glycogen reserves (Seed & Suchanek, 1992; Dare & Edwards, 1975).
3.7 Larval dispersal and settlement
Cockle and mussel larvae are exposed to tidal currents, normally for 21-30 days in mussels and around 30 days in cockles, before metamorphosing and settling to the seabed as postlarvae (around 280 µm). Mussel larvae may however delay metamorphosis for several weeks when environmental conditions are not optimal (Bayne, 1965). Mortality during this dispersal period is very high, e.g. about 13% per day in the Limfjord (Denmark), mainly due to predation and food scarcity (Jørgensen, 1981). The duration of the larval period (and hence the overall mortality rate) depends on temperature. Warm spring sea temperatures should enhance growth and development, reduce mortality, and favour better recruitment (Widdows, 1991). Larval dispersal from an estuary will be related to the flushing rate of the system, coupled in The Wash with wind forcing. Analysis of spatfall success in The Wash suggests that onshore winds (between E and N) in June improve retention of cockle larvae, whilst hydrodynamic modelling suggests that strong offshore (S-W) winds would accelerate dispersal (loss) of bivalve larvae from The Wash (Young et al., 1996, 1998, and see Sections 8.2 and 8.4). Mussel larvae are known to have been drifted into the central North Sea from the north-east coast of England and east coast of Scotland (Rees, 1954). Such dispersal potential and the residual tidal flow down the coast to the offshore Wash area (Section 2.1) suggest that larvae might occasionally reach The Wash from mussel stocks north of Flamborough Head (about 100 km away) or from cockles in the Humber Estuary (about 40 km away). Conversely, larval recruitment is much less likely to come from small stocks east or south-east of The Wash.
Initial settlement of postlarvae occurs in different tidal zones from those occupied by spawners. Mussel postlarvae (also termed primary spat) actively select filamentous ‘host’ substrates and typically attach (embyss) to subtidal hydroid colonies and filamentous algae (Bayne, 1964; Puhlfrich, 1996). Cockles, in contrast, settle onto finer sediments along the lower intertidal flats at densities of up to 105/m2, apparently by passive deposition under hydrodynamic/sedimentation processes (Baggerman, 1953, Armonies 1992, 1994a, 1994b). In The Wash, mussels settle in June-July, and large annual variations in abundance on collectors are recorded (Dare et al., 1983). Newly settled animals of both species remain briefly in their initial habitats before actively initiating a second dispersal/migration, by re-suspending themselves
in the water column and drifting with the aid of a specially secreted and very long, fine byssal thread (Lane et al., 1985; Armonies 1992). There is recent evidence (Lutz & Kennish, 1992) that primary mussel spat may attach directly onto adult beds in some areas (e.g. the west coast of Ireland), thus avoiding a second dispersal phase and providing wider settlement options.
In a secondary dispersal phase, 0.5-3.5 mm (secondary) spat of both species are transported to their final settlement habitats where they may establish new populations or recruit to existing stocks. Cockle spat disperse gradually upshore within an estuary, and over relatively short distance and time scales. In the Wadden Sea they move mainly in June-July, some as late as September, and show migratory rhythms, moving mainly at night and during spring tides (Baggerman, 1953; Armonies, 1992). Turnover rates at any point are high, with cockle spat residing only a few days at one site in the Wadden Sea (Armonies, 1994a, 1994b). Mussel spat are capable of prolonged drifting over greater, inter-estuarine, distances, and for 1-2 months, before they recruit at 1-2 mm onto established beds, or form pioneer settlements on bare, rough substrates (Lane et al., 1985; McGrorty et al., 1990; Seed & Suchanek, 1992). Winter spatfalls on such substrates in Morecambe Bay derive from early autumn spawnings and initial settlement offshore (Dare, 1976). In The Wash and the Wadden Sea, the mussel spatfall season is in summer, suggesting a shorter-range dispersal from nearby subtidal locations (Dare et al., 1983; Verwey, 1952).
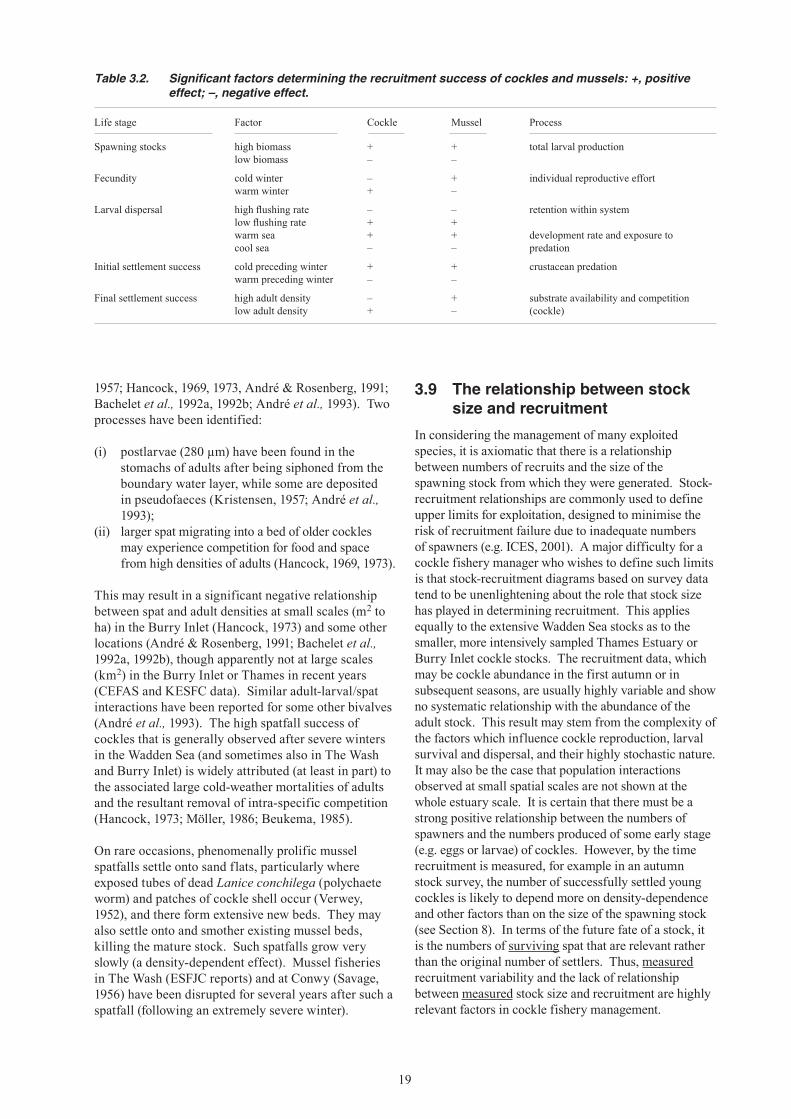
3.8 Recruitment to beds
Significant factors influencing recruitment of cockles and mussels are listed in Table 3.2. Studies have identified contrasting density-dependent recruitment processes in these two species. On quasi-permanent, unfished mussel beds in the Exe Estuary, highly variable initial spat abundance is regulated during the first winter by strong negative density-dependent mortality (average 68%), so that spring densities of surviving spat become positively correlated with adult density (McGrorty et al., 1990). The overwinter mortality is due to competition among spat for limited secure niches among adult byssi (to avoid crab predation) and is not due to direct competition with the adults themselves. The latter’s densities are regulated at the individual mussel bed level by their own strongly density-dependent mortality such that adult mussel stock abundance varies by only ± 50% between years (McGrorty & Goss-Custard, 1993).
Unlike mussels, the survival of cockle spat recruiting onto established beds can be negatively affected by the density of older cockles. Evidence for this comes from survey data, field manipulation experiments and laboratory studies in five countries (e.g. Kristensen
19
1957; Hancock, 1969, 1973, André & Rosenberg, 1991; Bachelet et al., 1992a, 1992b; André et al., 1993). Two processes have been identified:
(i) postlarvae (280 µm) have been found in the stomachs of adults after being siphoned from the boundary water layer, while some are deposited in pseudofaeces (Kristensen, 1957; André et al., 1993);
(ii) larger spat migrating into a bed of older cockles may experience competition for food and space from high densities of adults (Hancock, 1969, 1973).
This may result in a significant negative relationship between spat and adult densities at small scales (m2 to ha) in the Burry Inlet (Hancock, 1973) and some other locations (André & Rosenberg, 1991; Bachelet et al., 1992a, 1992b), though apparently not at large scales (km2) in the Burry Inlet or Thames in recent years (CEFAS and KESFC data). Similar adult-larval/spat interactions have been reported for some other bivalves (André et al., 1993). The high spatfall success of cockles that is generally observed after severe winters in the Wadden Sea (and sometimes also in The Wash and Burry Inlet) is widely attributed (at least in part) to the associated large cold-weather mortalities of adults and the resultant removal of intra-specific competition (Hancock, 1973; Möller, 1986; Beukema, 1985).
On rare occasions, phenomenally prolific mussel spatfalls settle onto sand flats, particularly where exposed tubes of dead Lanice conchilega (polychaete worm) and patches of cockle shell occur (Verwey, 1952), and there form extensive new beds. They may also settle onto and smother existing mussel beds, killing the mature stock. Such spatfalls grow very slowly (a density-dependent effect). Mussel fisheries in The Wash (ESFJC reports) and at Conwy (Savage, 1956) have been disrupted for several years after such a spatfall (following an extremely severe winter).
3.9 The relationship between stock size and recruitment
In considering the management of many exploited species, it is axiomatic that there is a relationship between numbers of recruits and the size of the spawning stock from which they were generated. Stock-recruitment relationships are commonly used to define upper limits for exploitation, designed to minimise the risk of recruitment failure due to inadequate numbers of spawners (e.g. ICES, 2001). A major difficulty for a cockle fishery manager who wishes to define such limits is that stock-recruitment diagrams based on survey data tend to be unenlightening about the role that stock size has played in determining recruitment. This applies equally to the extensive Wadden Sea stocks as to the smaller, more intensively sampled Thames Estuary or Burry Inlet cockle stocks. The recruitment data, which may be cockle abundance in the first autumn or in subsequent seasons, are usually highly variable and show no systematic relationship with the abundance of the adult stock. This result may stem from the complexity of the factors which influence cockle reproduction, larval survival and dispersal, and their highly stochastic nature. It may also be the case that population interactions observed at small spatial scales are not shown at the whole estuary scale. It is certain that there must be a strong positive relationship between the numbers of spawners and the numbers produced of some early stage (e.g. eggs or larvae) of cockles. However, by the time recruitment is measured, for example in an autumn stock survey, the number of successfully settled young cockles is likely to depend more on density-dependence and other factors than on the size of the spawning stock (see Section 8). In terms of the future fate of a stock, it is the numbers of surviving spat that are relevant rather than the original number of settlers. Thus, measured recruitment variability and the lack of relationship between measured stock size and recruitment are highly relevant factors in cockle fishery management.
Table 3.2. Significant factors determining the recruitment success of cockles and mussels: +, positive effect; –, negative effect.
Life stage Factor Cockle Mussel Process
Spawning stocks high biomasslow biomass
+–
+–
total larval production
Fecundity cold winterwarm winter
–+
+–
individual reproductive effort
Larval dispersal high flushing ratelow flushing ratewarm seacool sea
–++–
–++–
retention within system
development rate and exposure to predation
Initial settlement success cold preceding winterwarm preceding winter
+–
+–
crustacean predation
Final settlement success high adult densitylow adult density
–+
+–
substrate availability and competition (cockle)
20
For mussels in The Wash, similar general principles and problems apply. It is possible that the density-dependent relationships that have been described above (Section 3.8) for mussel beds in the Exe Estuary (McGrorty et al., 1990) are applicable to the older beds in The Wash, but interpretation of population processes is handicapped by the virtual absence of quantitative data owing to the failure of recruitment since 1986. There is no information available on the population dynamics of mussels elsewhere in Britain or in the Wadden Sea.
3.10 Predation mortality
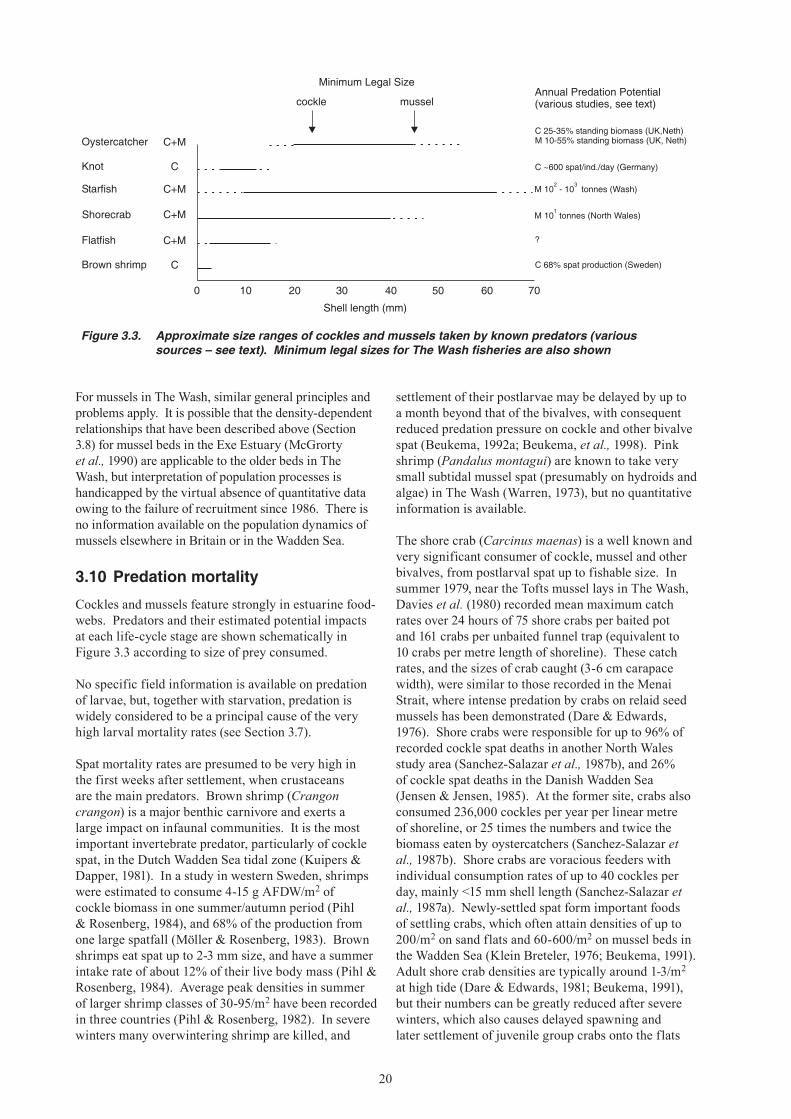
Cockles and mussels feature strongly in estuarine food-webs. Predators and their estimated potential impacts at each life-cycle stage are shown schematically in Figure 3.3 according to size of prey consumed.
No specific field information is available on predation of larvae, but, together with starvation, predation is widely considered to be a principal cause of the very high larval mortality rates (see Section 3.7).
Spat mortality rates are presumed to be very high in the first weeks after settlement, when crustaceans are the main predators. Brown shrimp (Crangon crangon) is a major benthic carnivore and exerts a large impact on infaunal communities. It is the most important invertebrate predator, particularly of cockle spat, in the Dutch Wadden Sea tidal zone (Kuipers & Dapper, 1981). In a study in western Sweden, shrimps were estimated to consume 4-15 g AFDW/m2 of cockle biomass in one summer/autumn period (Pihl & Rosenberg, 1984), and 68% of the production from one large spatfall (Möller & Rosenberg, 1983). Brown shrimps eat spat up to 2-3 mm size, and have a summer intake rate of about 12% of their live body mass (Pihl & Rosenberg, 1984). Average peak densities in summer of larger shrimp classes of 30-95/m2 have been recorded in three countries (Pihl & Rosenberg, 1982). In severe winters many overwintering shrimp are killed, and
settlement of their postlarvae may be delayed by up to a month beyond that of the bivalves, with consequent reduced predation pressure on cockle and other bivalve spat (Beukema, 1992a; Beukema, et al., 1998). Pink shrimp (Pandalus montagui) are known to take very small subtidal mussel spat (presumably on hydroids and algae) in The Wash (Warren, 1973), but no quantitative information is available.
The shore crab (Carcinus maenas) is a well known and very significant consumer of cockle, mussel and other bivalves, from postlarval spat up to fishable size. In summer 1979, near the Tofts mussel lays in The Wash, Davies et al. (1980) recorded mean maximum catch rates over 24 hours of 75 shore crabs per baited pot and 161 crabs per unbaited funnel trap (equivalent to 10 crabs per metre length of shoreline). These catch rates, and the sizes of crab caught (3-6 cm carapace width), were similar to those recorded in the Menai Strait, where intense predation by crabs on relaid seed mussels has been demonstrated (Dare & Edwards, 1976). Shore crabs were responsible for up to 96% of recorded cockle spat deaths in another North Wales study area (Sanchez-Salazar et al., 1987b), and 26% of cockle spat deaths in the Danish Wadden Sea (Jensen & Jensen, 1985). At the former site, crabs also consumed 236,000 cockles per year per linear metre of shoreline, or 25 times the numbers and twice the biomass eaten by oystercatchers (Sanchez-Salazar et al., 1987b). Shore crabs are voracious feeders with individual consumption rates of up to 40 cockles per day, mainly <15 mm shell length (Sanchez-Salazar et al., 1987a). Newly-settled spat form important foods of settling crabs, which often attain densities of up to 200/m2 on sand flats and 60-600/m2 on mussel beds in the Wadden Sea (Klein Breteler, 1976; Beukema, 1991). Adult shore crab densities are typically around 1-3/m2 at high tide (Dare & Edwards, 1981; Beukema, 1991), but their numbers can be greatly reduced after severe winters, which also causes delayed spawning and later settlement of juvenile group crabs onto the flats
Figure 3.3. Approximate size ranges of cockles and mussels taken by known predators (various sources – see text). Minimum legal sizes for The Wash fisheries are also shown
0 10 20 30 40 50 60 70
Knot C
C+MStarfish
Oystercatcher C+M
C+MShorecrab
C+MFlatfish
CBrown shrimp
Annual Predation Potential(various studies, see text)
Minimum Legal Size
cockle mussel
C 25-35% standing biomass (UK,Neth)M 10-55% standing biomass (UK, Neth)
C ~600 spat/ind./day (Germany)
M 10 - 10 tonnes (Wash)2 3
M 10 tonnes (North Wales)1
?
C 68% spat production (Sweden)
Shell length (mm)
21
(Beukema, 1991). Reduced/delayed crab predation pressure is generally considered to be an important factor contributing to high reproductive success of cockle and mussel following ‘ice winters’ in the Wadden Sea (Beukema, 1991).
The common starfish (Asterias rubens) is a large opportunist predator and scavenger. Starfish are major predators of cockles and, particularly, mussels in The Wash, but they are of sporadic summer occurrence and confined to the subtidal and lowest intertidal zones (ESFJC reports, G. Davies and J. Loose, pers. comm.). In some years, individuals aggregate into large, dense swarms which move into the central Wash and sometimes to parts of the inner Wash, especially via the Boston Deeps channel. Starfish are the most serious threat to the subtidal and low intertidal mussel beds during summer, and also occasionally to cockle beds on the low shore just above low water of spring tides (ESFJC reports). In 1896, some 2,000 t of mussel seed on the Old South Middle bed was destroyed by a swarm weighing 30 t (measured by removal). In one summer, up to 3,000 t of starfish were removed by hand from The Wash, where densities of 300-800/m2 have been recorded. In Morecambe Bay a 2.25 ha (60 t) swarm (up to 400 starfish/m2) cleared about 50 ha of a new seed mussel bed that would have produced 4,000 t by autumn (Dare, 1982). Starfish swarms have devastated intertidal mussel beds and lays in The Wash in the past, but this has not been recorded since 1980. Stocks on the Boston side of The Wash have always been attacked more frequently than those off King’s Lynn, perhaps because of the lower salinities (<30‰) in the latter sector (Figure 2.3). The Hunstanton mussel scalp at the entrance to The Wash is particularly prone to starfish attack (J. Loose, pers. comm.). Starfish could be the main destructive agent of subtidal mussel settlements each year.
Three species of adult flatfish have been recorded as taking 5-15 mm mussel spat in Morecambe Bay: plaice (Pleuronectes platessa), dab (Limanda limanda) and flounder (Platichthys flesus) (Dare, 1976). Sampled flatfish stomachs contained up to 570 spat per fish. Flounder take cockle spat in the Burry Inlet (Hancock & Urquhart, 1965), while 0-group plaice eat many cockle spat, an important food for them, in the Wadden Sea (Berghahn, 1987). Gadoids, particularly cod (Gadus morhua), have also been recorded in The Wash with “many tiny mussels” in their stomachs (ESFJC reports, 1894-97). It is worth noting, however, that all these fish species are also known predators of brown shrimp and shore crab.
The knot (Calidris canutus) is one of two shorebird species that overwinter in The Wash in very large numbers and depend upon cockle and mussel resources, though knot also feed heavily on Baltic tellins (Macoma balthica). Knot have been observed to consume 5-15 mm cockle spat in The Wash (Goss-Custard et al., 1977), and mussel spat (≤5 mm) in Morecambe Bay
(Prater, 1972). Knot consumption of cockles thus precedes oystercatcher predation (see below). In The Wash, a large bed of cockle spat at Heacham was heavily preyed upon by around 4,000 knot during autumn 1990 and had disappeared by winter (P. Walker and P.J. Dare, pers. obs.). Predation by knot on Wash cockle spat is known to be intense at times (CEH data), and the potential consumption of the knot population has been estimated by Dare (1999) to exceed the total numbers of cockle spat in The Wash in recent years. However, the availability of other prey species, and the existence of many beds of spat below the threshold density for profitable foraging by knot, mean that it is unlikely for this potential ever to be realised (Dare, 1999).
The oystercatcher (Haematopus ostralegus) is a noted specialist predator of second-winter and older cockles, and of juvenile and large mussels, generally of 15-50 mm shell length (Goss-Custard et al., 1996). Many field estimates of predation demonstrate its efficiency in consuming significant proportions of stocks. Estimates of annual/winter consumption by oystercatchers include:
(a) Oosterschelde – 20% of total standing biomass of cockle and mussel combined, including up to 55% and 70% respectively from mussel and cockle study plots (Meire et al., 1994);
(b) Exe Estuary and the Wadden Sea – 25-40% of large mussels from unfished beds (Zwarts & Drent, 1981; Goss-Custard et al., 1996);
(c) North Wales – 10% of relaid seed mussels (Potts & Dare, 1969);
(d) Burry Inlet and other estuaries – 20-36% of autumn cockle stock (e.g. Goss-Custard et al., 1996; Bell et al., 2001).
In the Burry Inlet, the normal wintering oystercatcher population has the potential to remove the total stock of second winter cockles in poor recruitment years (Horwood & Goss-Custard, 1977). The total annual consumption of Wadden Sea flocks has been estimated to be 3,000 t mussel and 8,000 t cockle meats, equivalent probably to not less than 15,000 t and 50,000 t live weight respectively (Dankers, 1993).
3.11 Parasites
A large number of trematode and other parasites are known to infect cockles (e.g. Carballal et al., 2001). In many cases such infections are relatively harmless under normal environmental conditions (e.g. Wegeberg & Jensen, 2003). However, the trematode parasite Cercaria cerastodermae was implicated in a mass mortality of cockles observed in Sweden, where infected animals were found lying on the surface in summer (Jonsson & André, 1992). The parasite occurred in about 20% of cockles, causing severe damage to the tissues of the foot, probably impairing burrowing ability. The severity of the episode resembled an oxygen deficiency or pollution event.
22
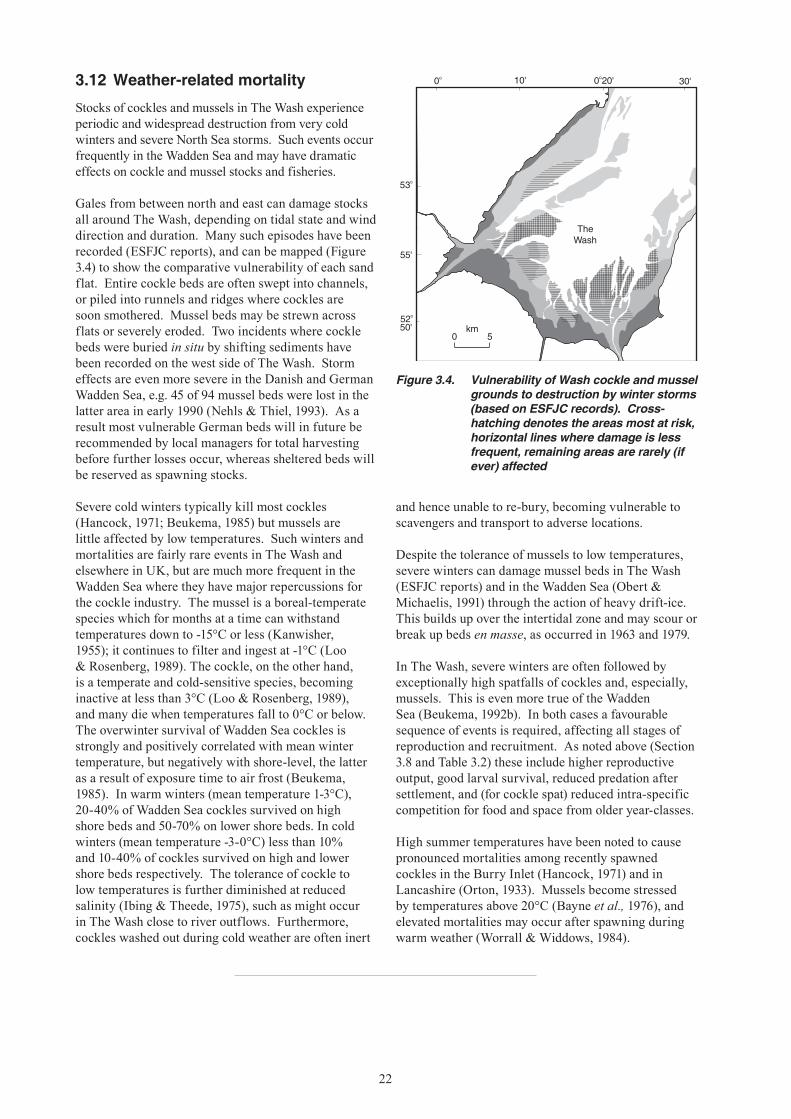
3.12 Weather-related mortality
Stocks of cockles and mussels in The Wash experience periodic and widespread destruction from very cold winters and severe North Sea storms. Such events occur frequently in the Wadden Sea and may have dramatic effects on cockle and mussel stocks and fisheries.
Gales from between north and east can damage stocks all around The Wash, depending on tidal state and wind direction and duration. Many such episodes have been recorded (ESFJC reports), and can be mapped (Figure 3.4) to show the comparative vulnerability of each sand flat. Entire cockle beds are often swept into channels, or piled into runnels and ridges where cockles are soon smothered. Mussel beds may be strewn across flats or severely eroded. Two incidents where cockle beds were buried in situ by shifting sediments have been recorded on the west side of The Wash. Storm effects are even more severe in the Danish and German Wadden Sea, e.g. 45 of 94 mussel beds were lost in the latter area in early 1990 (Nehls & Thiel, 1993). As a result most vulnerable German beds will in future be recommended by local managers for total harvesting before further losses occur, whereas sheltered beds will be reserved as spawning stocks.
Severe cold winters typically kill most cockles (Hancock, 1971; Beukema, 1985) but mussels are little affected by low temperatures. Such winters and mortalities are fairly rare events in The Wash and elsewhere in UK, but are much more frequent in the Wadden Sea where they have major repercussions for the cockle industry. The mussel is a boreal-temperate species which for months at a time can withstand temperatures down to -15°C or less (Kanwisher, 1955); it continues to filter and ingest at -1°C (Loo & Rosenberg, 1989). The cockle, on the other hand, is a temperate and cold-sensitive species, becoming inactive at less than 3°C (Loo & Rosenberg, 1989), and many die when temperatures fall to 0°C or below. The overwinter survival of Wadden Sea cockles is strongly and positively correlated with mean winter temperature, but negatively with shore-level, the latter as a result of exposure time to air frost (Beukema, 1985). In warm winters (mean temperature 1-3°C), 20-40% of Wadden Sea cockles survived on high shore beds and 50-70% on lower shore beds. In cold winters (mean temperature -3-0°C) less than 10% and 10-40% of cockles survived on high and lower shore beds respectively. The tolerance of cockle to low temperatures is further diminished at reduced salinity (Ibing & Theede, 1975), such as might occur in The Wash close to river outflows. Furthermore, cockles washed out during cold weather are often inert
and hence unable to re-bury, becoming vulnerable to scavengers and transport to adverse locations.
Despite the tolerance of mussels to low temperatures, severe winters can damage mussel beds in The Wash (ESFJC reports) and in the Wadden Sea (Obert & Michaelis, 1991) through the action of heavy drift-ice. This builds up over the intertidal zone and may scour or break up beds en masse, as occurred in 1963 and 1979.
In The Wash, severe winters are often followed by exceptionally high spatfalls of cockles and, especially, mussels. This is even more true of the Wadden Sea (Beukema, 1992b). In both cases a favourable sequence of events is required, affecting all stages of reproduction and recruitment. As noted above (Section 3.8 and Table 3.2) these include higher reproductive output, good larval survival, reduced predation after settlement, and (for cockle spat) reduced intra-specific competition for food and space from older year-classes.
High summer temperatures have been noted to cause pronounced mortalities among recently spawned cockles in the Burry Inlet (Hancock, 1971) and in Lancashire (Orton, 1933). Mussels become stressed by temperatures above 20°C (Bayne et al., 1976), and elevated mortalities may occur after spawning during warm weather (Worrall & Widdows, 1984).
Figure 3.4. Vulnerability of Wash cockle and mussel grounds to destruction by winter storms (based on ESFJC records). Cross-hatching denotes the areas most at risk, horizontal lines where damage is less frequent, remaining areas are rarely (if ever) affected
53o
0o 0 20'o
52o
50'
55'
10' 30'
TheWash
0 5km
23
4. MOLLUSC FISHERIES OF THE WASH: A BRIEF HISTORY OF FISHING, TECHNICAL CHANGES AND MANAGEMENT
The annual reports of ESFJC extend back to 1894 and contain a unique and often detailed record of biological observations and events concerning all aspects of the fisheries and their management. For cockles and mussels, descriptions of spatfalls each year and estimates (either survey or anecdotal) of fishable stock abundance are given most years, together with accounts of unusual weather-related or predation mortalities. To set recent trends in perspective, this brief overview concentrates on changes occurring since 1970.
4.1 Pre-1970
Before 1970, the cockle and mussel fisheries were essentially artisanal and, particularly in the 1960s, often constrained by poor market demand and intermittent concerns over bacteriological contamination from sewage effluents. From early this century, Boston mussels were being cultivated by transplanting (relaying) stocks from poor-growing beds at high shore levels onto lays marked out at around low water of spring tides. Mussels were the major fishery and, even as early as about 1900, concerns were expressed about possible over-exploitation of the often prolific beds. After about 1940, landings went mainly to canning (later bottling) plants nearby, or were sent fresh in-shell to markets locally and further afield. A traditional outlet for quality live mussels was the long-line bait trade along the north-east coast, but this was declining by the 1960s.
In the early ESFJC reports the numbers and sizes of vessels and the specifications of their gears were seldom recorded, but in more recent decades the number of licences issued under the different Several and Regulating Orders are given. Licences do not provide an accurate measure of fleet or effort changes, however, because more than one may be granted to a single vessel during the course of a year. Nonetheless, the long-term trends are indicative. In 1896, there were 100-140 boats plus several horse-drawn carts working the fishery. In 1898, the Wash fleet (all fisheries) totalled 288 sail and row boats, of which 61 were Boston mussel boats, and were crewed by a total of 830 men (and boys). By 1940, the 43 mussel and 17 cockle vessels were all powered. Few changes occurred through the 1950s and 1960s except for the introduction of Baird mussel dredges. Otherwise, both fisheries depended upon hand-gathering, and activities rotated seasonally between mussel fishing in the colder months, relaying of mussels in spring, cockle fishing in the warmer months, and shrimp fishing mainly in autumn depending upon abundance and markets.
Throughout this period, ESFJC was actively involved in organising annual mussel relaying and in the 1960s (with MAFF) in testing new grounds. Mussel stocks were surveyed annually from 1921 to 1955, and cockles for a time in the 1920s and 1930s.
4.2 Post-1970
The early 1970s saw a rapidly accelerating modernisation of the fleet, fishing gears and onshore infrastructure in both fisheries as new markets abroad developed and UK sales expanded. Live mussels were sent to France for relaying, cockles were processed for the continental European market, and depurated mussels were sold fresh for home consumption. Advances in processing technology brought large capital investment in plant, including depuration systems.
These developments are chronicled in Appendix I, but the most significant fisheries developments were:
(i) Early 1970s: introduction of the ‘blowing’ technique, using ships’ propellers to wash cockles out of the sand into large piles for easier gathering by hand at low-tide.
(ii) 1975-82: French export trade for relaying mussel stock; by 1979, as stocks were being depleted, local industry began pressing ESFJC to lower the minimum legal size (MLS) of 50 mm length to the French limit of 45 mm.
(iii) 1982: MLS reduction to 45 mm was approved as a ‘temporary’ measure (not yet revoked); quantities of unsorted mussels and shell debris were shipped to France until buyers stopped the trade; wholesale removal of material could have caused severe structural damage to some beds.
(iv) 1983: first mussel depuration plant opened at Boston.
(v) 1986: introduction of hydraulic suction dredging for cockles, and rapid expansion in fleet capacity to 32 dredgers by 1988.
(vi) 1986-87: installation of 2 modern plants for rapid freezing of cockle meats for Holland.
(vii) 1989: modern mussel depuration recirculation system built indoors at a King’s Lynn factory.
(viii) 1991: new export trade to Spain and Holland for small cockle meats, previously unacceptable to local processors.
Though mostly desirable in themselves, these developments placed increased pressure on stocks and their management. The fishery was also being driven increasingly by international trade which fluctuated rapidly depending upon the state of the large Dutch cockle and mussel fisheries. Periodically, prices to the cockle fishermen could rise steeply and make it economic to dredge at previously uneconomic low stock densities. Overall trends in the unit value of landings at first-sale (quay-side) are shown in Figure 4.1. Mussels values were similar to cockle values up to
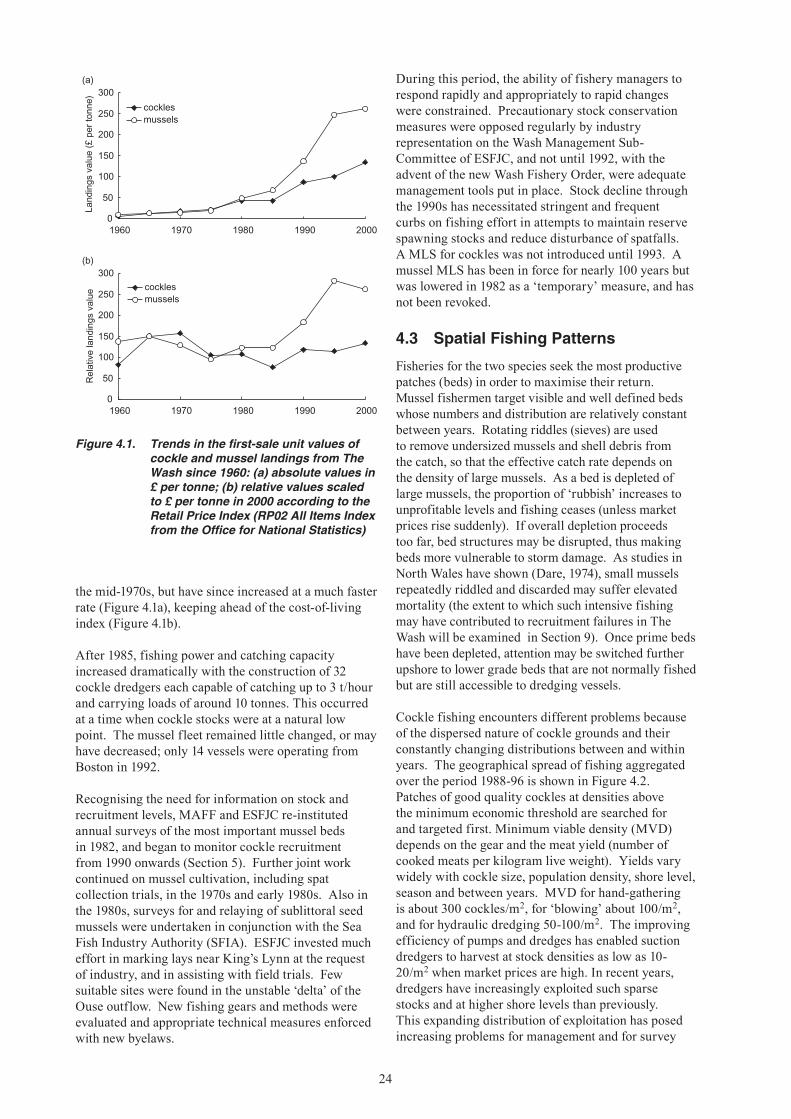
24
During this period, the ability of fishery managers to respond rapidly and appropriately to rapid changes were constrained. Precautionary stock conservation measures were opposed regularly by industry representation on the Wash Management Sub-Committee of ESFJC, and not until 1992, with the advent of the new Wash Fishery Order, were adequate management tools put in place. Stock decline through the 1990s has necessitated stringent and frequent curbs on fishing effort in attempts to maintain reserve spawning stocks and reduce disturbance of spatfalls. A MLS for cockles was not introduced until 1993. A mussel MLS has been in force for nearly 100 years but was lowered in 1982 as a ‘temporary’ measure, and has not been revoked.
4.3 Spatial Fishing Patterns
Fisheries for the two species seek the most productive patches (beds) in order to maximise their return. Mussel fishermen target visible and well defined beds whose numbers and distribution are relatively constant between years. Rotating riddles (sieves) are used to remove undersized mussels and shell debris from the catch, so that the effective catch rate depends on the density of large mussels. As a bed is depleted of large mussels, the proportion of ‘rubbish’ increases to unprofitable levels and fishing ceases (unless market prices rise suddenly). If overall depletion proceeds too far, bed structures may be disrupted, thus making beds more vulnerable to storm damage. As studies in North Wales have shown (Dare, 1974), small mussels repeatedly riddled and discarded may suffer elevated mortality (the extent to which such intensive fishing may have contributed to recruitment failures in The Wash will be examined in Section 9). Once prime beds have been depleted, attention may be switched further upshore to lower grade beds that are not normally fished but are still accessible to dredging vessels.
Cockle fishing encounters different problems because of the dispersed nature of cockle grounds and their constantly changing distributions between and within years. The geographical spread of fishing aggregated over the period 1988-96 is shown in Figure 4.2. Patches of good quality cockles at densities above the minimum economic threshold are searched for and targeted first. Minimum viable density (MVD) depends on the gear and the meat yield (number of cooked meats per kilogram live weight). Yields vary widely with cockle size, population density, shore level, season and between years. MVD for hand-gathering is about 300 cockles/m2, for ‘blowing’ about 100/m2, and for hydraulic dredging 50-100/m2. The improving efficiency of pumps and dredges has enabled suction dredgers to harvest at stock densities as low as 10-20/m2 when market prices are high. In recent years, dredgers have increasingly exploited such sparse stocks and at higher shore levels than previously. This expanding distribution of exploitation has posed increasing problems for management and for survey
0
50
100
150
200
250
300
1960 1970 1980 1990 2000
cocklesmussels
(a)
0
50
100
150
200
250
300
1960 1970 1980 1990 2000
cocklesmussels
(b)
Rel
ativ
ela
ndin
gsva
lue
Land
ings
valu
e(£
per
tonn
e)
Figure 4.1. Trends in the first-sale unit values of cockle and mussel landings from The Wash since 1960: (a) absolute values in £ per tonne; (b) relative values scaled to £ per tonne in 2000 according to the Retail Price Index (RP02 All Items Index from the Office for National Statistics)
the mid-1970s, but have since increased at a much faster rate (Figure 4.1a), keeping ahead of the cost-of-living index (Figure 4.1b).
After 1985, fishing power and catching capacity increased dramatically with the construction of 32 cockle dredgers each capable of catching up to 3 t/hour and carrying loads of around 10 tonnes. This occurred at a time when cockle stocks were at a natural low point. The mussel fleet remained little changed, or may have decreased; only 14 vessels were operating from Boston in 1992.
Recognising the need for information on stock and recruitment levels, MAFF and ESFJC re-instituted annual surveys of the most important mussel beds in 1982, and began to monitor cockle recruitment from 1990 onwards (Section 5). Further joint work continued on mussel cultivation, including spat collection trials, in the 1970s and early 1980s. Also in the 1980s, surveys for and relaying of sublittoral seed mussels were undertaken in conjunction with the Sea Fish Industry Authority (SFIA). ESFJC invested much effort in marking lays near King’s Lynn at the request of industry, and in assisting with field trials. Few suitable sites were found in the unstable ‘delta’ of the Ouse outflow. New fishing gears and methods were evaluated and appropriate technical measures enforced with new byelaws.
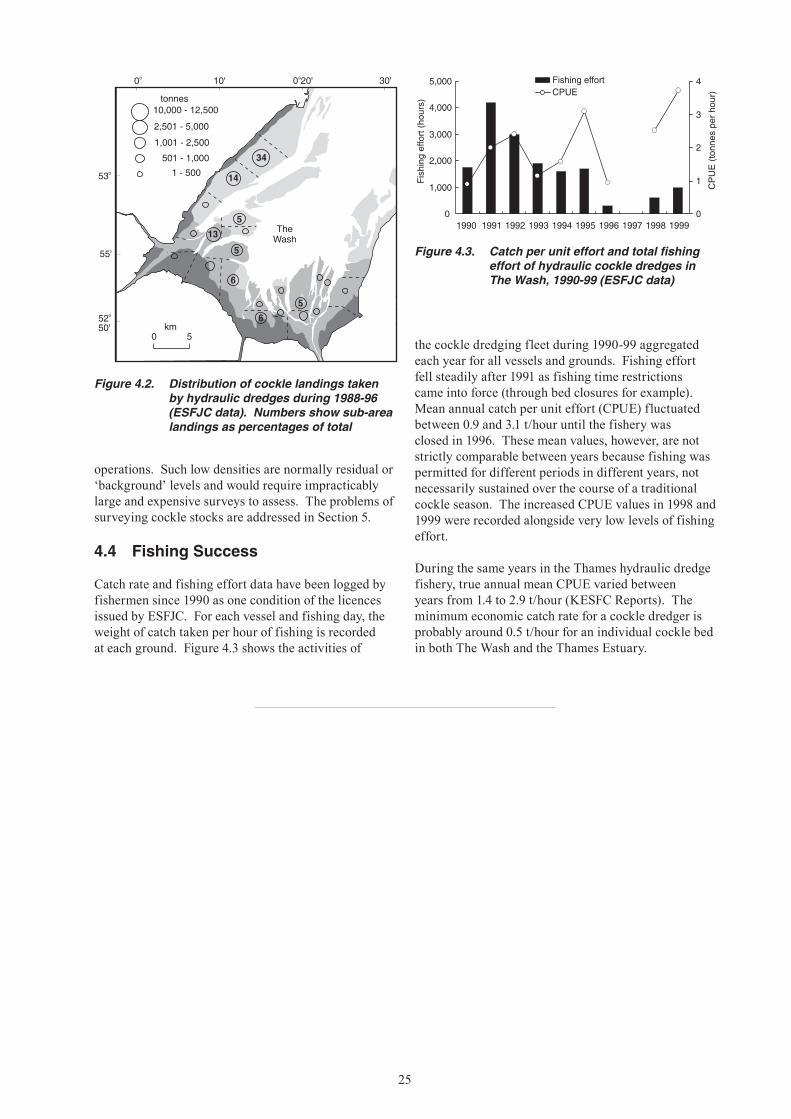
25
operations. Such low densities are normally residual or ‘background’ levels and would require impracticably large and expensive surveys to assess. The problems of surveying cockle stocks are addressed in Section 5.
4.4 Fishing Success
Catch rate and fishing effort data have been logged by fishermen since 1990 as one condition of the licences issued by ESFJC. For each vessel and fishing day, the weight of catch taken per hour of fishing is recorded at each ground. Figure 4.3 shows the activities of
the cockle dredging fleet during 1990-99 aggregated each year for all vessels and grounds. Fishing effort fell steadily after 1991 as fishing time restrictions came into force (through bed closures for example). Mean annual catch per unit effort (CPUE) fluctuated between 0.9 and 3.1 t/hour until the fishery was closed in 1996. These mean values, however, are not strictly comparable between years because fishing was permitted for different periods in different years, not necessarily sustained over the course of a traditional cockle season. The increased CPUE values in 1998 and 1999 were recorded alongside very low levels of fishing effort.
During the same years in the Thames hydraulic dredge fishery, true annual mean CPUE varied between years from 1.4 to 2.9 t/hour (KESFC Reports). The minimum economic catch rate for a cockle dredger is probably around 0.5 t/hour for an individual cockle bed in both The Wash and the Thames Estuary.
Figure 4.3. Catch per unit effort and total fishing effort of hydraulic cockle dredges in The Wash, 1990-99 (ESFJC data)
0
1,000
2,000
3,000
4,000
5,000
1990 1991 1992 1993 1994 1995 1996 1997 1998 1999
Fishing
effort(hours)
0
1
2
3
4
CPUE(tonnesperhour)
Fishing effortCPUE
Figure 4.2. Distribution of cockle landings taken by hydraulic dredges during 1988-96 (ESFJC data). Numbers show sub-area landings as percentages of total
53o
0o 0 20'o
52o
50'
55'
10' 30'
TheWash
0 5
34
14
5
5
13
6
65
km
tonnes10,000 - 12,500
2,501 - 5,000
1,001 - 2,500
501 - 1,000
1 - 500
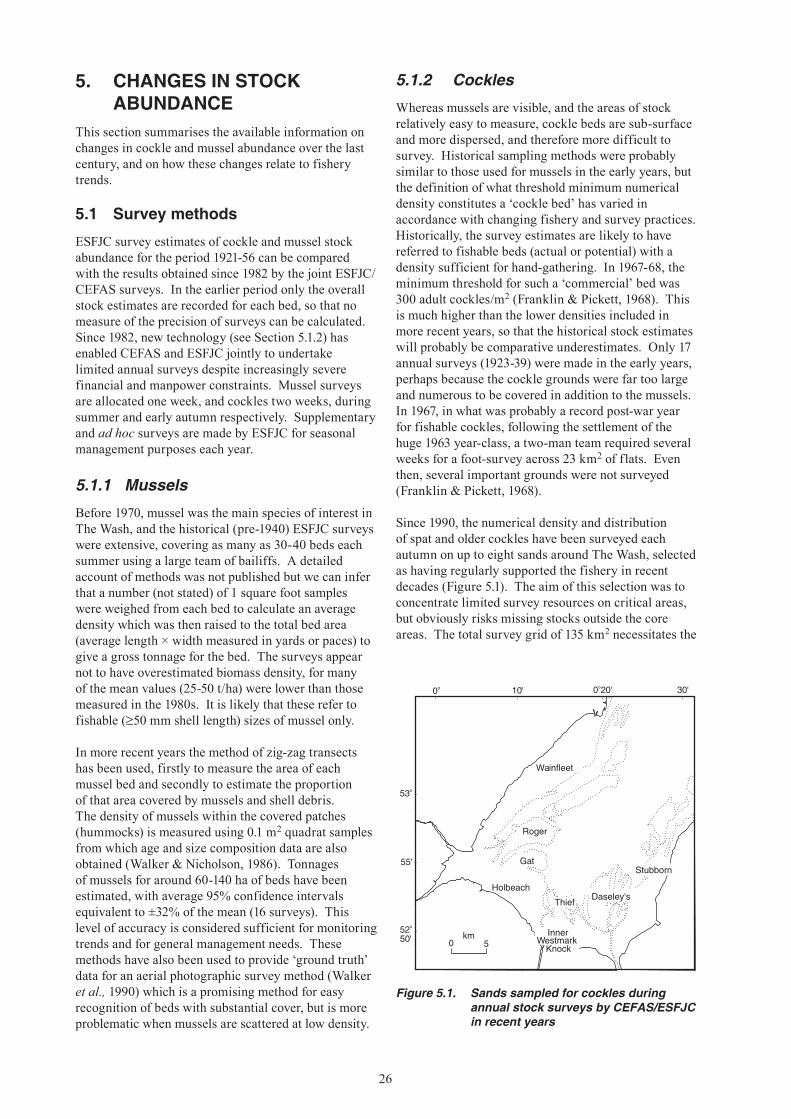
26
5. CHANGES IN STOCK ABUNDANCE
This section summarises the available information on changes in cockle and mussel abundance over the last century, and on how these changes relate to fishery trends.
5.1 Survey methods
ESFJC survey estimates of cockle and mussel stock abundance for the period 1921-56 can be compared with the results obtained since 1982 by the joint ESFJC/CEFAS surveys. In the earlier period only the overall stock estimates are recorded for each bed, so that no measure of the precision of surveys can be calculated. Since 1982, new technology (see Section 5.1.2) has enabled CEFAS and ESFJC jointly to undertake limited annual surveys despite increasingly severe financial and manpower constraints. Mussel surveys are allocated one week, and cockles two weeks, during summer and early autumn respectively. Supplementary and ad hoc surveys are made by ESFJC for seasonal management purposes each year.
5.1.1 Mussels
Before 1970, mussel was the main species of interest in The Wash, and the historical (pre-1940) ESFJC surveys were extensive, covering as many as 30-40 beds each summer using a large team of bailiffs. A detailed account of methods was not published but we can infer that a number (not stated) of 1 square foot samples were weighed from each bed to calculate an average density which was then raised to the total bed area (average length × width measured in yards or paces) to give a gross tonnage for the bed. The surveys appear not to have overestimated biomass density, for many of the mean values (25-50 t/ha) were lower than those measured in the 1980s. It is likely that these refer to fishable (≥50 mm shell length) sizes of mussel only.
In more recent years the method of zig-zag transects has been used, firstly to measure the area of each mussel bed and secondly to estimate the proportion of that area covered by mussels and shell debris. The density of mussels within the covered patches (hummocks) is measured using 0.1 m2 quadrat samples from which age and size composition data are also obtained (Walker & Nicholson, 1986). Tonnages of mussels for around 60-140 ha of beds have been estimated, with average 95% confidence intervals equivalent to ±32% of the mean (16 surveys). This level of accuracy is considered sufficient for monitoring trends and for general management needs. These methods have also been used to provide ‘ground truth’ data for an aerial photographic survey method (Walker et al., 1990) which is a promising method for easy recognition of beds with substantial cover, but is more problematic when mussels are scattered at low density.
5.1.2 Cockles
Whereas mussels are visible, and the areas of stock relatively easy to measure, cockle beds are sub-surface and more dispersed, and therefore more difficult to survey. Historical sampling methods were probably similar to those used for mussels in the early years, but the definition of what threshold minimum numerical density constitutes a ‘cockle bed’ has varied in accordance with changing fishery and survey practices. Historically, the survey estimates are likely to have referred to fishable beds (actual or potential) with a density sufficient for hand-gathering. In 1967-68, the minimum threshold for such a ‘commercial’ bed was 300 adult cockles/m2 (Franklin & Pickett, 1968). This is much higher than the lower densities included in more recent years, so that the historical stock estimates will probably be comparative underestimates. Only 17 annual surveys (1923-39) were made in the early years, perhaps because the cockle grounds were far too large and numerous to be covered in addition to the mussels. In 1967, in what was probably a record post-war year for fishable cockles, following the settlement of the huge 1963 year-class, a two-man team required several weeks for a foot-survey across 23 km2 of flats. Even then, several important grounds were not surveyed (Franklin & Pickett, 1968).
Since 1990, the numerical density and distribution of spat and older cockles have been surveyed each autumn on up to eight sands around The Wash, selected as having regularly supported the fishery in recent decades (Figure 5.1). The aim of this selection was to concentrate limited survey resources on critical areas, but obviously risks missing stocks outside the core areas. The total survey grid of 135 km2 necessitates the
Figure 5.1. Sands sampled for cockles during annual stock surveys by CEFAS/ESFJC in recent years
53o
0o 0 20'o
52o
50'
55'
10' 30'
Wainfleet
Roger
Gat
Holbeach
InnerWestmark
Daseley's
Knock
Stubborn
0 5km
Thief
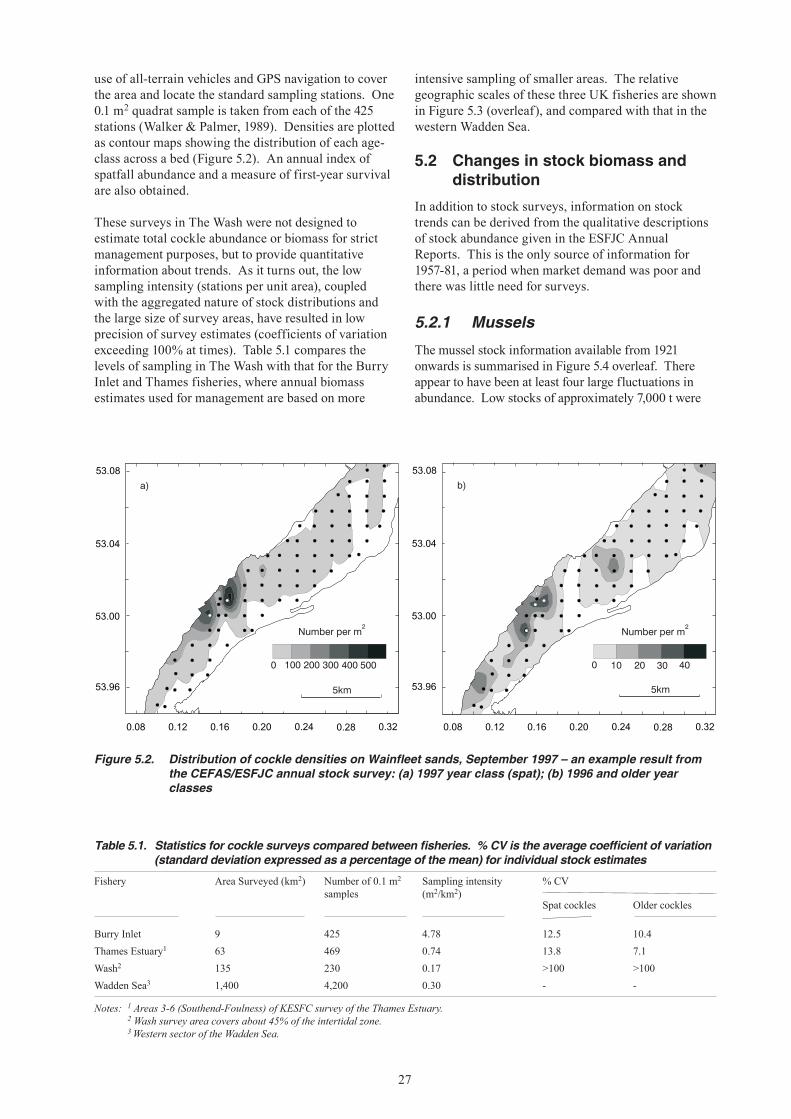
27
use of all-terrain vehicles and GPS navigation to cover the area and locate the standard sampling stations. One 0.1 m2 quadrat sample is taken from each of the 425 stations (Walker & Palmer, 1989). Densities are plotted as contour maps showing the distribution of each age-class across a bed (Figure 5.2). An annual index of spatfall abundance and a measure of first-year survival are also obtained.
These surveys in The Wash were not designed to estimate total cockle abundance or biomass for strict management purposes, but to provide quantitative information about trends. As it turns out, the low sampling intensity (stations per unit area), coupled with the aggregated nature of stock distributions and the large size of survey areas, have resulted in low precision of survey estimates (coefficients of variation exceeding 100% at times). Table 5.1 compares the levels of sampling in The Wash with that for the Burry Inlet and Thames fisheries, where annual biomass estimates used for management are based on more
intensive sampling of smaller areas. The relative geographic scales of these three UK fisheries are shown in Figure 5.3 (overleaf), and compared with that in the western Wadden Sea.
5.2 Changes in stock biomass and distribution
In addition to stock surveys, information on stock trends can be derived from the qualitative descriptions of stock abundance given in the ESFJC Annual Reports. This is the only source of information for 1957-81, a period when market demand was poor and there was little need for surveys.
5.2.1 Mussels
The mussel stock information available from 1921 onwards is summarised in Figure 5.4 overleaf. There appear to have been at least four large fluctuations in abundance. Low stocks of approximately 7,000 t were
Figure 5.2. Distribution of cockle densities on Wainfleet sands, September 1997 – an example result from the CEFAS/ESFJC annual stock survey: (a) 1997 year class (spat); (b) 1996 and older year classes
Table 5.1. Statistics for cockle surveys compared between fisheries. % CV is the average coefficient of variation (standard deviation expressed as a percentage of the mean) for individual stock estimates
Fishery Area Surveyed (km2) Number of 0.1 m2
samplesSampling intensity (m2/km2)
% CV
Spat cockles Older cockles
Burry Inlet 9 425 4.78 12.5 10.4Thames Estuary1 63 469 0.74 13.8 7.1Wash2 135 230 0.17 >100 >100Wadden Sea3 1,400 4,200 0.30 - -
Notes: 1 Areas 3-6 (Southend-Foulness) of KESFC survey of the Thames Estuary. 2 Wash survey area covers about 45% of the intertidal zone. 3 Western sector of the Wadden Sea.
0.08
53.08
53.04
53.00
53.96
0.12 0.16 0.20 0.24 0.28 0.32
b)
5km
0 10 20 30 40
53.08
53.04
53.00
53.96
a)
5km
0 100 200 300 400 500
Number per m2 Number per m2
0.08 0.12 0.16 0.20 0.24 0.28 0.32
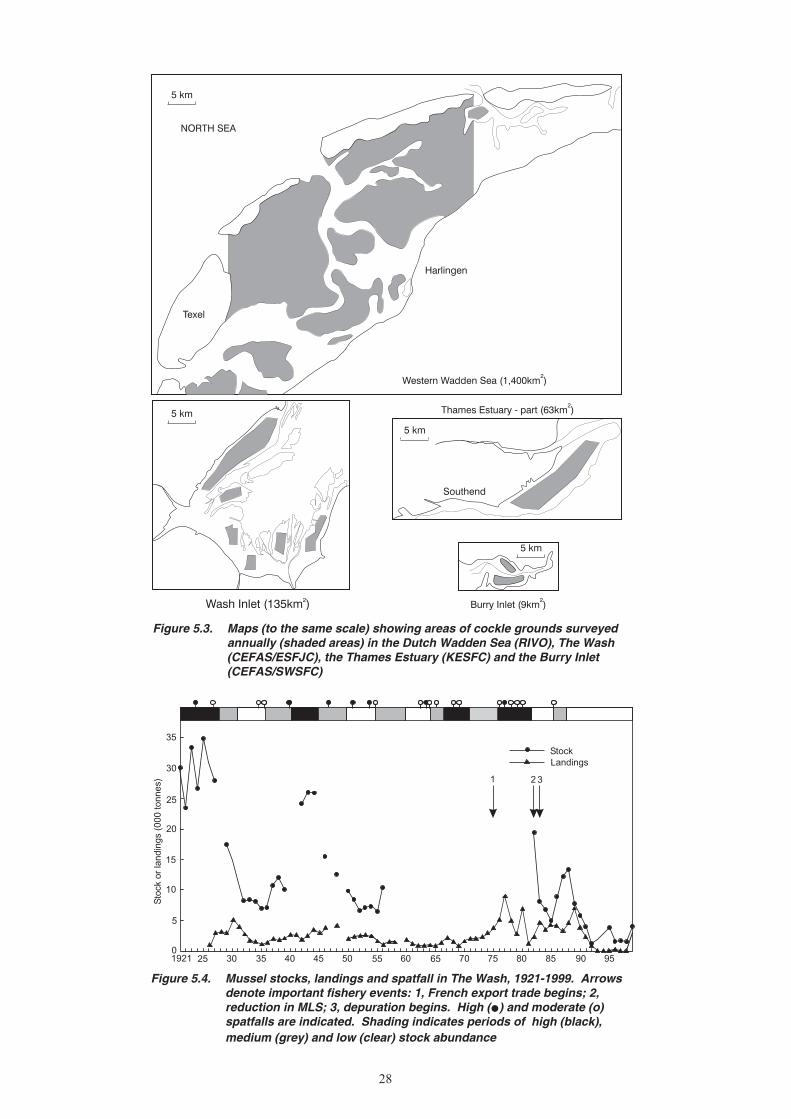
28
Figure 5.3. Maps (to the same scale) showing areas of cockle grounds surveyed annually (shaded areas) in the Dutch Wadden Sea (RIVO), The Wash (CEFAS/ESFJC), the Thames Estuary (KESFC) and the Burry Inlet (CEFAS/SWSFC)
NORTH SEA
Harlingen
Western Wadden Sea (1,400km )2
Southend
Thames Estuary - part (63km )2
Burry Inlet (9km )2Wash Inlet (135km )2
Texel
5 km
5 km
5 km
5 km
Figure 5.4. Mussel stocks, landings and spatfall in The Wash, 1921-1999. Arrows denote important fishery events: 1, French export trade begins; 2, reduction in MLS; 3, depuration begins. High (•) and moderate (o) spatfalls are indicated. Shading indicates periods of high (black), medium (grey) and low (clear) stock abundance
1921 25 30 35 40 45 50 55 60 65 70 75 80 85 90 95
StockLandings
1 2 3
35
30
25
20
15
10
5
0
Sto
ckor
land
ings
(000
tonn
es)
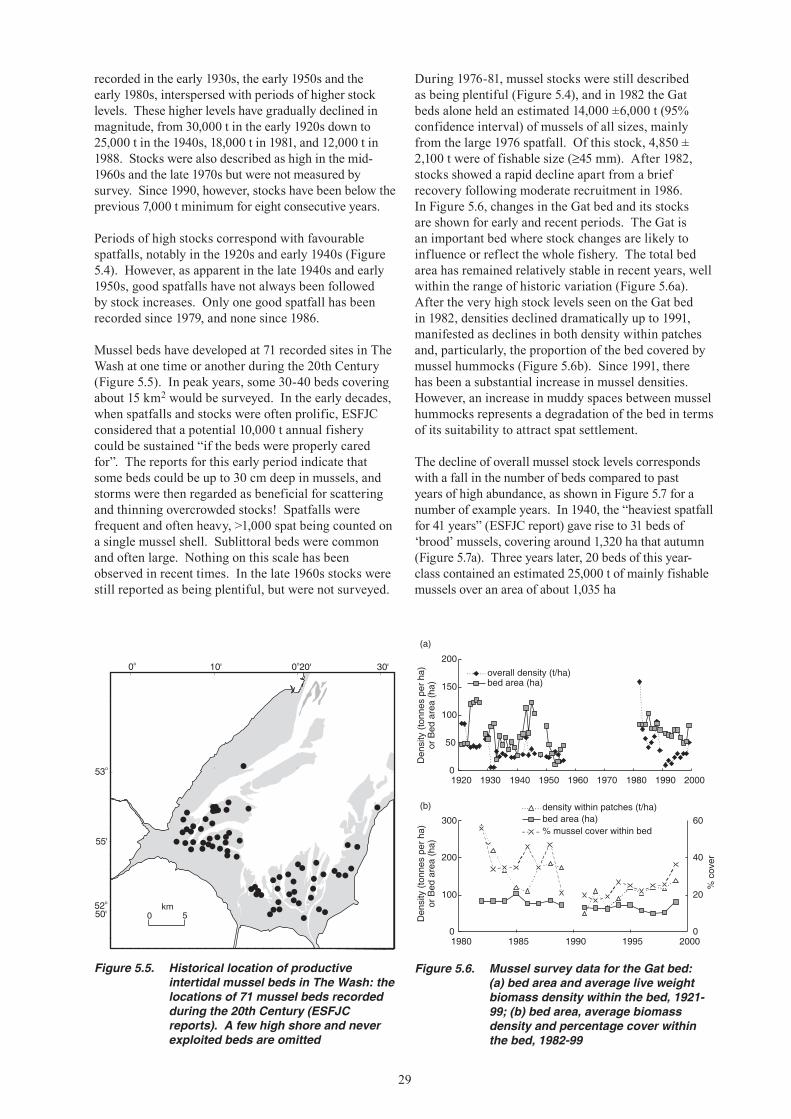
29
recorded in the early 1930s, the early 1950s and the early 1980s, interspersed with periods of higher stock levels. These higher levels have gradually declined in magnitude, from 30,000 t in the early 1920s down to 25,000 t in the 1940s, 18,000 t in 1981, and 12,000 t in 1988. Stocks were also described as high in the mid-1960s and the late 1970s but were not measured by survey. Since 1990, however, stocks have been below the previous 7,000 t minimum for eight consecutive years.
Periods of high stocks correspond with favourable spatfalls, notably in the 1920s and early 1940s (Figure 5.4). However, as apparent in the late 1940s and early 1950s, good spatfalls have not always been followed by stock increases. Only one good spatfall has been recorded since 1979, and none since 1986.
Mussel beds have developed at 71 recorded sites in The Wash at one time or another during the 20th Century (Figure 5.5). In peak years, some 30-40 beds covering about 15 km2 would be surveyed. In the early decades, when spatfalls and stocks were often prolific, ESFJC considered that a potential 10,000 t annual fishery could be sustained “if the beds were properly cared for”. The reports for this early period indicate that some beds could be up to 30 cm deep in mussels, and storms were then regarded as beneficial for scattering and thinning overcrowded stocks! Spatfalls were frequent and often heavy, >1,000 spat being counted on a single mussel shell. Sublittoral beds were common and often large. Nothing on this scale has been observed in recent times. In the late 1960s stocks were still reported as being plentiful, but were not surveyed.
During 1976-81, mussel stocks were still described as being plentiful (Figure 5.4), and in 1982 the Gat beds alone held an estimated 14,000 ±6,000 t (95% confidence interval) of mussels of all sizes, mainly from the large 1976 spatfall. Of this stock, 4,850 ± 2,100 t were of fishable size (≥45 mm). After 1982, stocks showed a rapid decline apart from a brief recovery following moderate recruitment in 1986. In Figure 5.6, changes in the Gat bed and its stocks are shown for early and recent periods. The Gat is an important bed where stock changes are likely to influence or reflect the whole fishery. The total bed area has remained relatively stable in recent years, well within the range of historic variation (Figure 5.6a). After the very high stock levels seen on the Gat bed in 1982, densities declined dramatically up to 1991, manifested as declines in both density within patches and, particularly, the proportion of the bed covered by mussel hummocks (Figure 5.6b). Since 1991, there has been a substantial increase in mussel densities. However, an increase in muddy spaces between mussel hummocks represents a degradation of the bed in terms of its suitability to attract spat settlement.
The decline of overall mussel stock levels corresponds with a fall in the number of beds compared to past years of high abundance, as shown in Figure 5.7 for a number of example years. In 1940, the “heaviest spatfall for 41 years” (ESFJC report) gave rise to 31 beds of ‘brood’ mussels, covering around 1,320 ha that autumn (Figure 5.7a). Three years later, 20 beds of this year-class contained an estimated 25,000 t of mainly fishable mussels over an area of about 1,035 ha
Figure 5.6. Mussel survey data for the Gat bed: (a) bed area and average live weight biomass density within the bed, 1921-99; (b) bed area, average biomass density and percentage cover within the bed, 1982-99
0
50
100
150
200
1920 1930 1940 1950 1960 1970 1980 1990 2000
overall density (t/ha)bed area (ha)
(a)
0
100
200
300
1980 1985 1990 1995 20000
20
40
60density within patches (t/ha)bed area (ha)% mussel cover within bed
(b)
Density(tonnes
perha)
orBed
area
(ha)
Density(tonnes
perha)
orBed
area
(ha)
%cover
Figure 5.5. Historical location of productive intertidal mussel beds in The Wash: the locations of 71 mussel beds recorded during the 20th Century (ESFJC reports). A few high shore and never exploited beds are omitted
53o
0o 0 20'o
52o
50'
55'
10' 30'
0 5km
0
50
100
150
200
1920 1930 1940 1950 1960 1970 1980 1990 2000
overall density (t/ha)bed area (ha)
(a)
0
100
200
300
1980 1985 1990 1995 20000
20
40
60density within patches (t/ha)bed area (ha)% mussel cover within bed
(b)
Density(tonnes
perha)
orBed
area
(ha)
Density(tonnes
perha)
orBed
area
(ha)
%cover
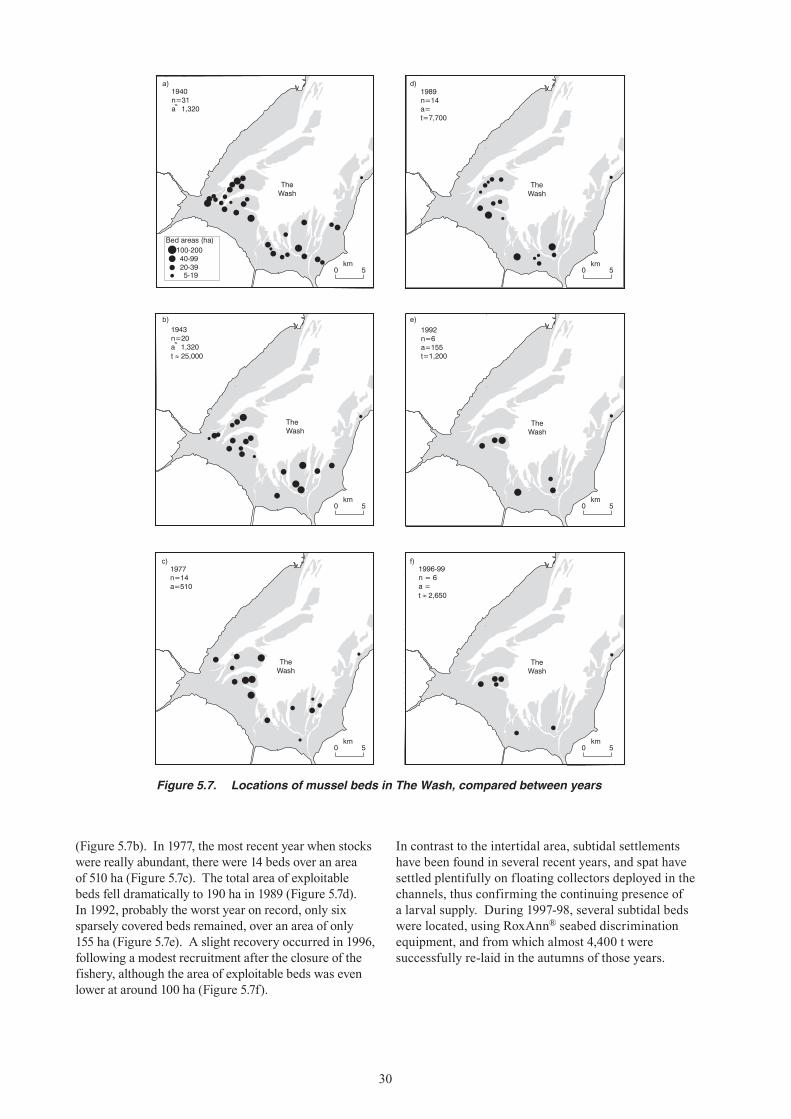
30
Figure 5.7. Locations of mussel beds in The Wash, compared between years
TheWash
19991943n=20a 1,320t 25,000
~~
TheWash
19991977n=14a=510
TheWash
199919991989n=14a=t=7,700
TheWash
199919991992n=6a=155t=1,200
TheWash
1996-99n = 6a =t 2,650
TheWash
1940n=31a 1,320~~
100-20040-9920-395-19
Bed areas (ha)
1989n=14a=t=7,700
0 5km
a)
0 5km
d)
0 5km
b)
0 5km
e)
0 5km
c)
0 5km
f)
(Figure 5.7b). In 1977, the most recent year when stocks were really abundant, there were 14 beds over an area of 510 ha (Figure 5.7c). The total area of exploitable beds fell dramatically to 190 ha in 1989 (Figure 5.7d). In 1992, probably the worst year on record, only six sparsely covered beds remained, over an area of only 155 ha (Figure 5.7e). A slight recovery occurred in 1996, following a modest recruitment after the closure of the fishery, although the area of exploitable beds was even lower at around 100 ha (Figure 5.7f).
In contrast to the intertidal area, subtidal settlements have been found in several recent years, and spat have settled plentifully on floating collectors deployed in the channels, thus confirming the continuing presence of a larval supply. During 1997-98, several subtidal beds were located, using RoxAnn® seabed discrimination equipment, and from which almost 4,400 t were successfully re-laid in the autumns of those years.
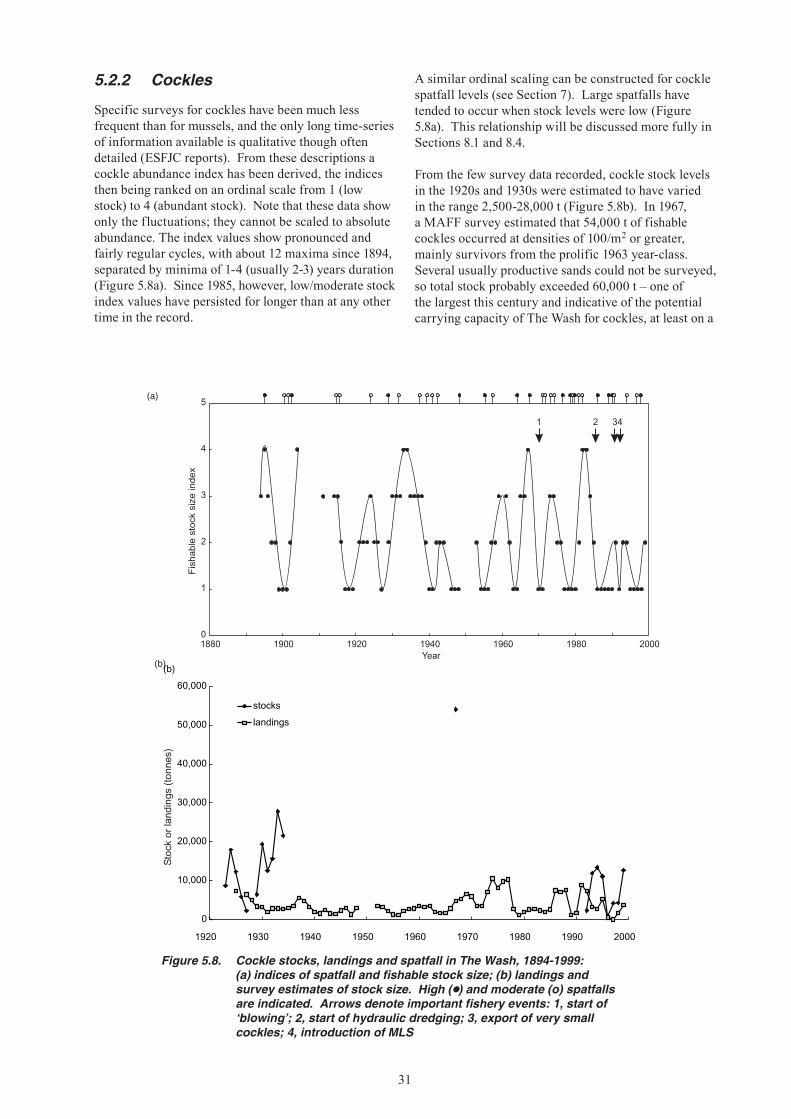
31
5.2.2 Cockles
Specific surveys for cockles have been much less frequent than for mussels, and the only long time-series of information available is qualitative though often detailed (ESFJC reports). From these descriptions a cockle abundance index has been derived, the indices then being ranked on an ordinal scale from 1 (low stock) to 4 (abundant stock). Note that these data show only the fluctuations; they cannot be scaled to absolute abundance. The index values show pronounced and fairly regular cycles, with about 12 maxima since 1894, separated by minima of 1-4 (usually 2-3) years duration (Figure 5.8a). Since 1985, however, low/moderate stock index values have persisted for longer than at any other time in the record.
A similar ordinal scaling can be constructed for cockle spatfall levels (see Section 7). Large spatfalls have tended to occur when stock levels were low (Figure 5.8a). This relationship will be discussed more fully in Sections 8.1 and 8.4.
From the few survey data recorded, cockle stock levels in the 1920s and 1930s were estimated to have varied in the range 2,500-28,000 t (Figure 5.8b). In 1967, a MAFF survey estimated that 54,000 t of fishable cockles occurred at densities of 100/m2 or greater, mainly survivors from the prolific 1963 year-class. Several usually productive sands could not be surveyed, so total stock probably exceeded 60,000 t – one of the largest this century and indicative of the potential carrying capacity of The Wash for cockles, at least on a
(a)
(b)
0
10,000
20,000
30,000
40,000
50,000
60,000
1920 1930 1940 1950 1960 1970 1980 1990 2000
stocks
landings
(b)
Sto
ckor
land
ings
(ton
nes)
Figure 5.8. Cockle stocks, landings and spatfall in The Wash, 1894-1999: (a) indices of spatfall and fishable stock size; (b) landings and
survey estimates of stock size. High (•) and moderate (o) spatfalls are indicated. Arrows denote important fishery events: 1, start of ‘blowing’; 2, start of hydraulic dredging; 3, export of very small cockles; 4, introduction of MLS
0
1
2
3
4
5
1880 1900 1920 1940 1960 1980 2000Year
Fis
habl
est
ock
size
inde
x
1 2 34
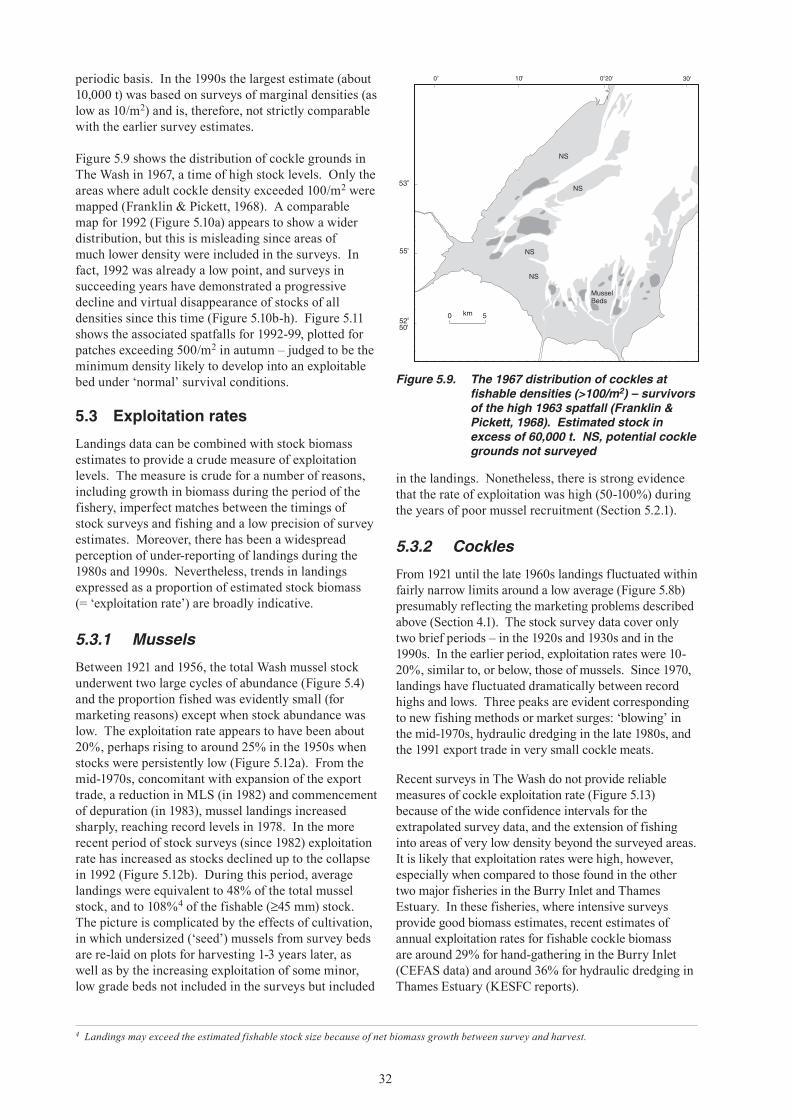
32
Figure 5.9. The 1967 distribution of cockles at fishable densities (>100/m2) – survivors of the high 1963 spatfall (Franklin & Pickett, 1968). Estimated stock in excess of 60,000 t. NS, potential cockle grounds not surveyed
53o
0o 0 20'o
52o
50'
55'
10' 30'
MusselBeds
NS
NS
NS
NS
km0 5
periodic basis. In the 1990s the largest estimate (about 10,000 t) was based on surveys of marginal densities (as low as 10/m2) and is, therefore, not strictly comparable with the earlier survey estimates.
Figure 5.9 shows the distribution of cockle grounds in The Wash in 1967, a time of high stock levels. Only the areas where adult cockle density exceeded 100/m2 were mapped (Franklin & Pickett, 1968). A comparable map for 1992 (Figure 5.10a) appears to show a wider distribution, but this is misleading since areas of much lower density were included in the surveys. In fact, 1992 was already a low point, and surveys in succeeding years have demonstrated a progressive decline and virtual disappearance of stocks of all densities since this time (Figure 5.10b-h). Figure 5.11 shows the associated spatfalls for 1992-99, plotted for patches exceeding 500/m2 in autumn – judged to be the minimum density likely to develop into an exploitable bed under ‘normal’ survival conditions.
5.3 Exploitation rates
Landings data can be combined with stock biomass estimates to provide a crude measure of exploitation levels. The measure is crude for a number of reasons, including growth in biomass during the period of the fishery, imperfect matches between the timings of stock surveys and fishing and a low precision of survey estimates. Moreover, there has been a widespread perception of under-reporting of landings during the 1980s and 1990s. Nevertheless, trends in landings expressed as a proportion of estimated stock biomass (= ‘exploitation rate’) are broadly indicative.
5.3.1 Mussels
Between 1921 and 1956, the total Wash mussel stock underwent two large cycles of abundance (Figure 5.4) and the proportion fished was evidently small (for marketing reasons) except when stock abundance was low. The exploitation rate appears to have been about 20%, perhaps rising to around 25% in the 1950s when stocks were persistently low (Figure 5.12a). From the mid-1970s, concomitant with expansion of the export trade, a reduction in MLS (in 1982) and commencement of depuration (in 1983), mussel landings increased sharply, reaching record levels in 1978. In the more recent period of stock surveys (since 1982) exploitation rate has increased as stocks declined up to the collapse in 1992 (Figure 5.12b). During this period, average landings were equivalent to 48% of the total mussel stock, and to 108%4 of the fishable (≥45 mm) stock. The picture is complicated by the effects of cultivation, in which undersized (‘seed’) mussels from survey beds are re-laid on plots for harvesting 1-3 years later, as well as by the increasing exploitation of some minor, low grade beds not included in the surveys but included
in the landings. Nonetheless, there is strong evidence that the rate of exploitation was high (50-100%) during the years of poor mussel recruitment (Section 5.2.1).
5.3.2 Cockles
From 1921 until the late 1960s landings fluctuated within fairly narrow limits around a low average (Figure 5.8b) presumably reflecting the marketing problems described above (Section 4.1). The stock survey data cover only two brief periods – in the 1920s and 1930s and in the 1990s. In the earlier period, exploitation rates were 10-20%, similar to, or below, those of mussels. Since 1970, landings have fluctuated dramatically between record highs and lows. Three peaks are evident corresponding to new fishing methods or market surges: ‘blowing’ in the mid-1970s, hydraulic dredging in the late 1980s, and the 1991 export trade in very small cockle meats.
Recent surveys in The Wash do not provide reliable measures of cockle exploitation rate (Figure 5.13) because of the wide confidence intervals for the extrapolated survey data, and the extension of fishing into areas of very low density beyond the surveyed areas. It is likely that exploitation rates were high, however, especially when compared to those found in the other two major fisheries in the Burry Inlet and Thames Estuary. In these fisheries, where intensive surveys provide good biomass estimates, recent estimates of annual exploitation rates for fishable cockle biomass are around 29% for hand-gathering in the Burry Inlet (CEFAS data) and around 36% for hydraulic dredging in Thames Estuary (KESFC reports).
4 Landings may exceed the estimated fishable stock size because of net biomass growth between survey and harvest.
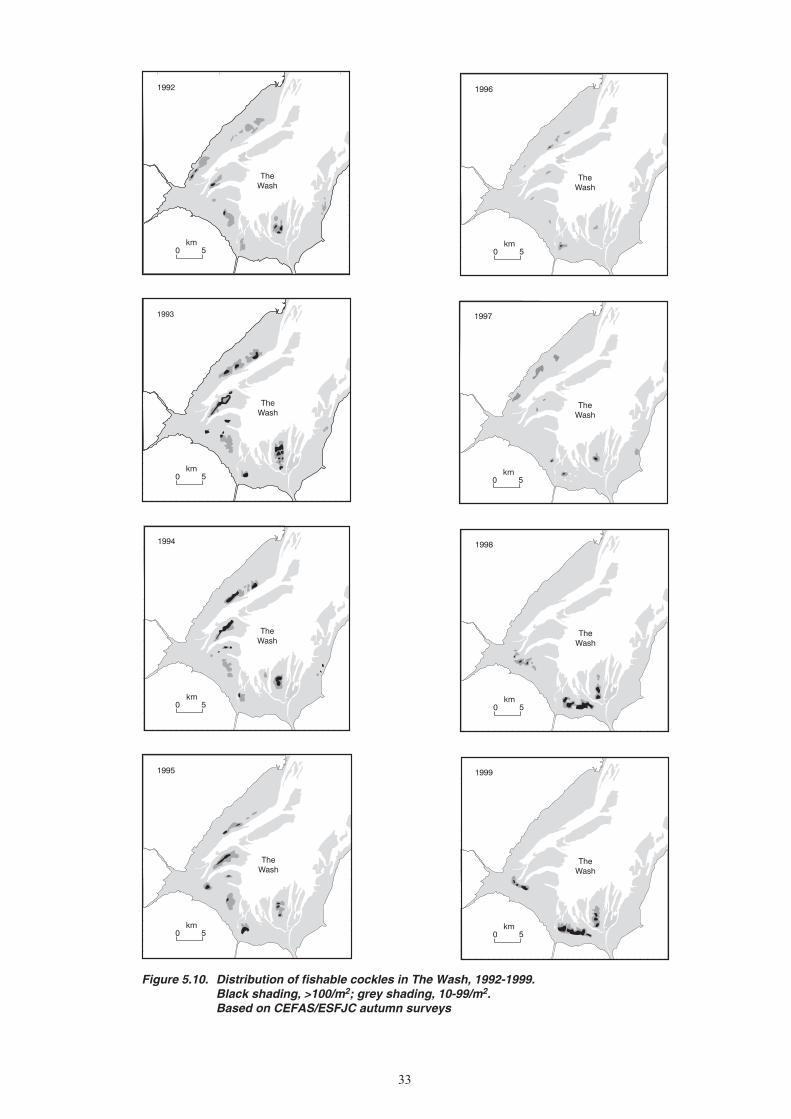
33
Figure 5.10. Distribution of fishable cockles in The Wash, 1992-1999. Black shading, >100/m2; grey shading, 10-99/m2. Based on CEFAS/ESFJC autumn surveys
TheWash
1992
TheWash
1993
TheWash
1994
TheWash
1995
TheWash
1996
TheWash
1997
TheWash
1998
TheWash
1999
0 5km
0 5km
0 5km
0 5km
0 5km
0 5km
0 5km
0 5km
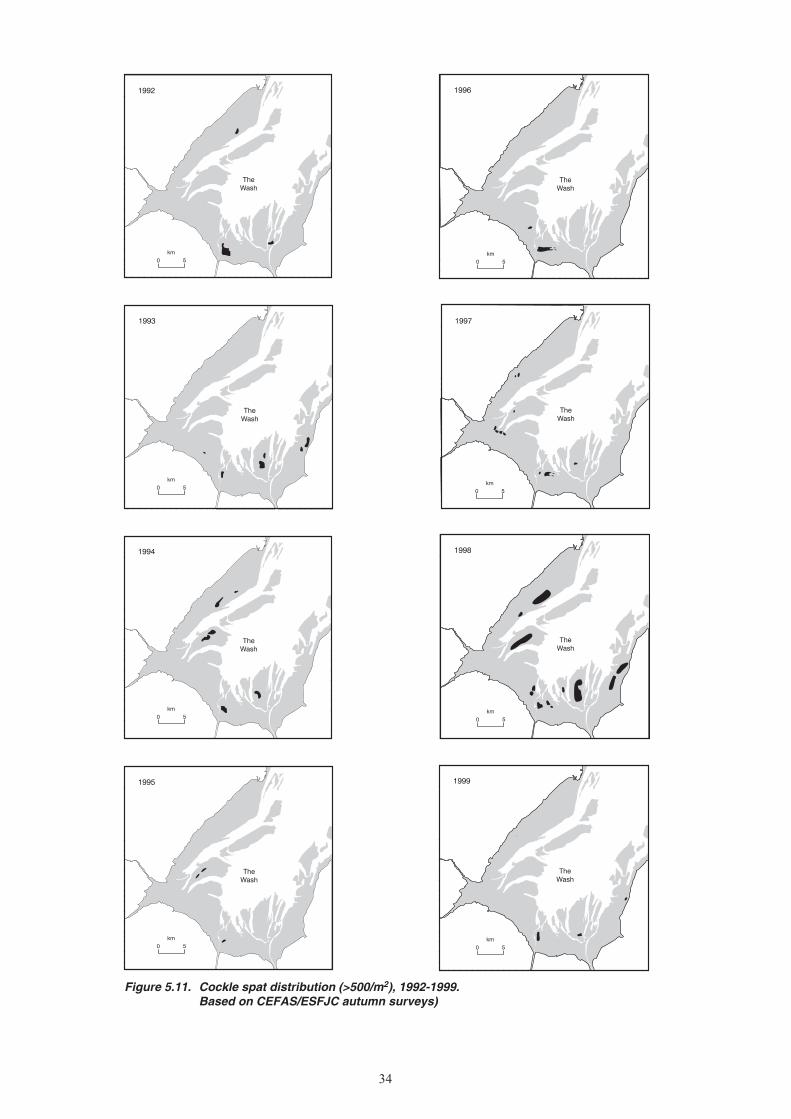
34
Figure 5.11. Cockle spat distribution (>500/m2), 1992-1999. Based on CEFAS/ESFJC autumn surveys)
TheWash
1996
TheWash
1997
TheWash
1998
TheWash
1999
TheWash
1992
TheWash
1993
TheWash
1994
TheWash
1995
0 5km
0 5km
0 5km
0 5km
0 5km
0 5km
0 5km
0 5km
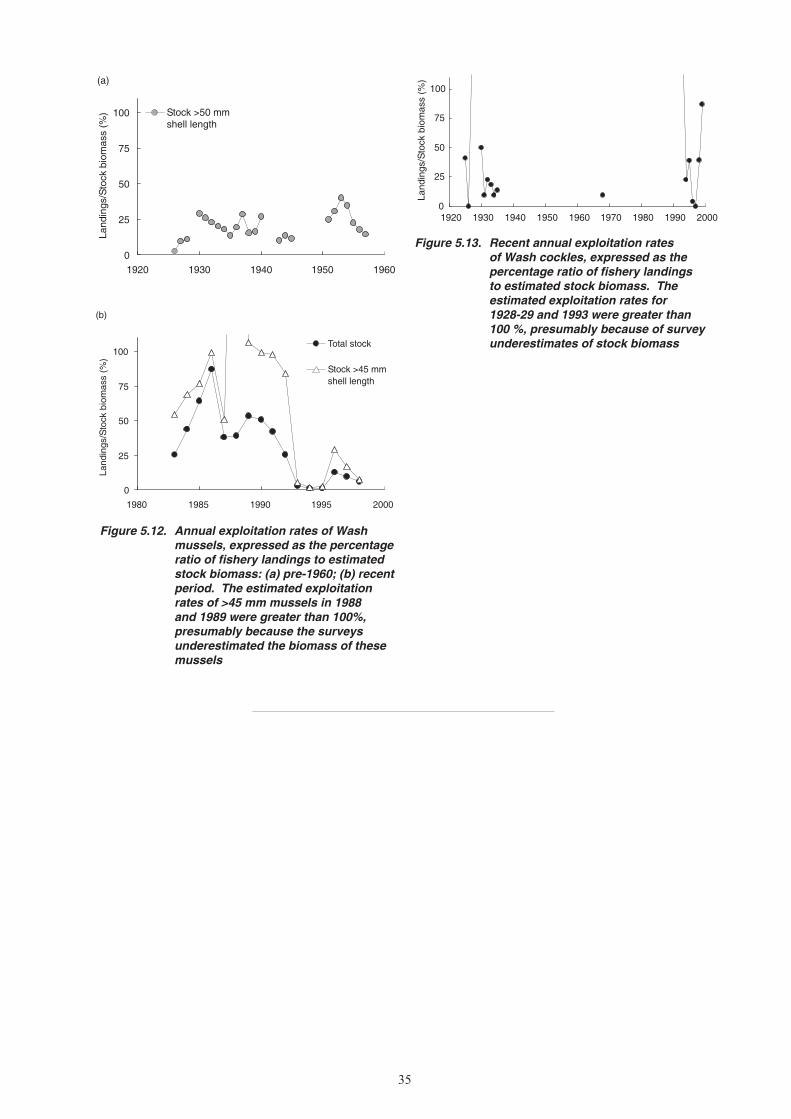
35
Figure 5.12. Annual exploitation rates of Wash mussels, expressed as the percentage ratio of fishery landings to estimated stock biomass: (a) pre-1960; (b) recent period. The estimated exploitation rates of >45 mm mussels in 1988 and 1989 were greater than 100%, presumably because the surveys underestimated the biomass of these mussels
0
25
50
75
100
1920 1930 1940 1950 1960
Landings/Stock
biom
ass(%
) Stock >50 mmshell length
(a)
0
25
50
75
100
1980 1985 1990 1995 2000
Landings/Stock
biom
ass(%
)
Total stock
Stock >45 mmshell length
(b)
Figure 5.13. Recent annual exploitation rates of Wash cockles, expressed as the percentage ratio of fishery landings to estimated stock biomass. The estimated exploitation rates for 1928-29 and 1993 were greater than 100 %, presumably because of survey underestimates of stock biomass
0
25
50
75
100
1920 1930 1940 1950 1960 1970 1980 1990 2000
Landings/Stock
biom
ass(%
)
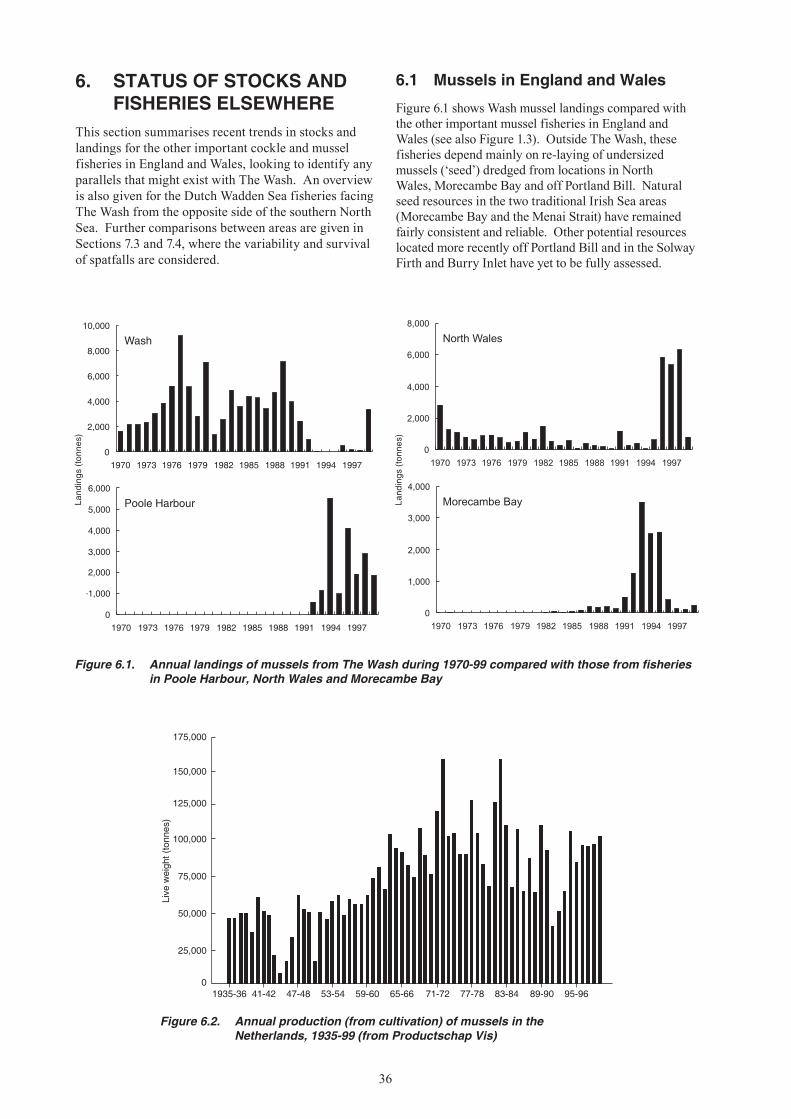
36
Figure 6.2. Annual production (from cultivation) of mussels in the Netherlands, 1935-99 (from Productschap Vis)
175,000
150,000
125,000
100,000
75,000
50,000
25,000
01935-36 41-42 47-48 53-54 59-60 65-66 71-72 77-78 83-84 89-90 95-96
Live
weight(tonnes)
Figure 6.1. Annual landings of mussels from The Wash during 1970-99 compared with those from fisheries in Poole Harbour, North Wales and Morecambe Bay
Wash
0
2,000
4,000
6,000
8,000
10,000
1970 1973 1976 1979 1982 1985 1988 1991 1994 1997
Poole Harbour
0
1,000
2,000
3,000
4,000
5,000
6,000
1970 1973 1976 1979 1982 1985 1988 1991 1994 1997
North Wales
0
2,000
4,000
6,000
8,000
1970 1973 1976 1979 1982 1985 1988 1991 1994 1997
Morecambe Bay
0
1,000
2,000
3,000
4,000
1970 1973 1976 1979 1982 1985 1988 1991 1994 1997
Landings
(tonnes)
Wash
0
2,000
4,000
6,000
8,000
10,000
1970 1973 1976 1979 1982 1985 1988 1991 1994 1997
Poole Harbour
0
1,000
2,000
3,000
4,000
5,000
6,000
1970 1973 1976 1979 1982 1985 1988 1991 1994 1997
North Wales
0
2,000
4,000
6,000
8,000
1970 1973 1976 1979 1982 1985 1988 1991 1994 1997
Morecambe Bay
0
1,000
2,000
3,000
4,000
1970 1973 1976 1979 1982 1985 1988 1991 1994 1997
Land
ings
(ton
nes)
Land
ings
(to
nnes
)
Land
ings
(to
nnes
)
6. STATUS OF STOCKS AND FISHERIES ELSEWHERE
This section summarises recent trends in stocks and landings for the other important cockle and mussel fisheries in England and Wales, looking to identify any parallels that might exist with The Wash. An overview is also given for the Dutch Wadden Sea fisheries facing The Wash from the opposite side of the southern North Sea. Further comparisons between areas are given in Sections 7.3 and 7.4, where the variability and survival of spatfalls are considered.
6.1 Mussels in England and Wales
Figure 6.1 shows Wash mussel landings compared with the other important mussel fisheries in England and Wales (see also Figure 1.3). Outside The Wash, these fisheries depend mainly on re-laying of undersized mussels (‘seed’) dredged from locations in North Wales, Morecambe Bay and off Portland Bill. Natural seed resources in the two traditional Irish Sea areas (Morecambe Bay and the Menai Strait) have remained fairly consistent and reliable. Other potential resources located more recently off Portland Bill and in the Solway Firth and Burry Inlet have yet to be fully assessed.
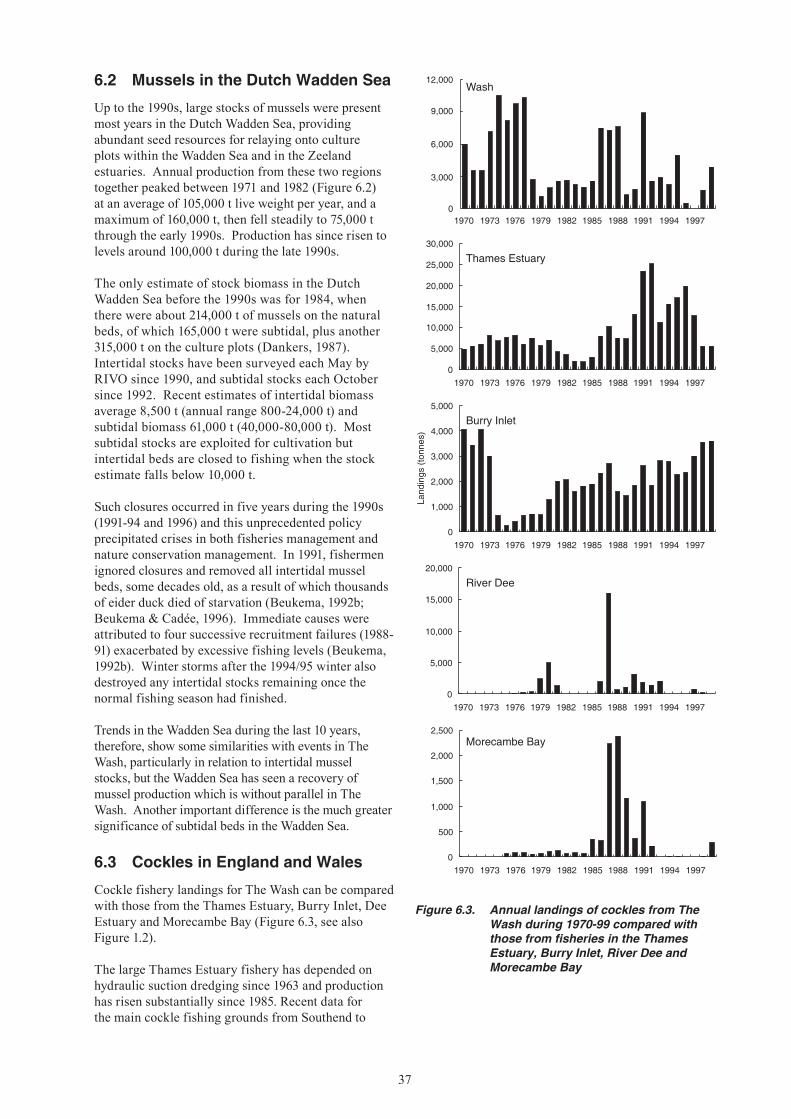
37
6.2 Mussels in the Dutch Wadden Sea
Up to the 1990s, large stocks of mussels were present most years in the Dutch Wadden Sea, providing abundant seed resources for relaying onto culture plots within the Wadden Sea and in the Zeeland estuaries. Annual production from these two regions together peaked between 1971 and 1982 (Figure 6.2) at an average of 105,000 t live weight per year, and a maximum of 160,000 t, then fell steadily to 75,000 t through the early 1990s. Production has since risen to levels around 100,000 t during the late 1990s.
The only estimate of stock biomass in the Dutch Wadden Sea before the 1990s was for 1984, when there were about 214,000 t of mussels on the natural beds, of which 165,000 t were subtidal, plus another 315,000 t on the culture plots (Dankers, 1987). Intertidal stocks have been surveyed each May by RIVO since 1990, and subtidal stocks each October since 1992. Recent estimates of intertidal biomass average 8,500 t (annual range 800-24,000 t) and subtidal biomass 61,000 t (40,000-80,000 t). Most subtidal stocks are exploited for cultivation but intertidal beds are closed to fishing when the stock estimate falls below 10,000 t.
Such closures occurred in five years during the 1990s (1991-94 and 1996) and this unprecedented policy precipitated crises in both fisheries management and nature conservation management. In 1991, fishermen ignored closures and removed all intertidal mussel beds, some decades old, as a result of which thousands of eider duck died of starvation (Beukema, 1992b; Beukema & Cadée, 1996). Immediate causes were attributed to four successive recruitment failures (1988-91) exacerbated by excessive fishing levels (Beukema, 1992b). Winter storms after the 1994/95 winter also destroyed any intertidal stocks remaining once the normal fishing season had finished.
Trends in the Wadden Sea during the last 10 years, therefore, show some similarities with events in The Wash, particularly in relation to intertidal mussel stocks, but the Wadden Sea has seen a recovery of mussel production which is without parallel in The Wash. Another important difference is the much greater significance of subtidal beds in the Wadden Sea.
6.3 Cockles in England and Wales
Cockle fishery landings for The Wash can be compared with those from the Thames Estuary, Burry Inlet, Dee Estuary and Morecambe Bay (Figure 6.3, see also Figure 1.2).
The large Thames Estuary fishery has depended on hydraulic suction dredging since 1963 and production has risen substantially since 1985. Recent data for the main cockle fishing grounds from Southend to
Figure 6.3. Annual landings of cockles from The Wash during 1970-99 compared with those from fisheries in the Thames Estuary, Burry Inlet, River Dee and Morecambe Bay
Thames Estuary
0
5,000
10,000
15,000
20,000
25,000
30,000
1970 1973 1976 1979 1982 1985 1988 1991 1994 1997
Burry Inlet
0
1,000
2,000
3,000
4,000
5,000
1970 1973 1976 1979 1982 1985 1988 1991 1994 1997
River Dee
0
5,000
10,000
15,000
20,000
1970 1973 1976 1979 1982 1985 1988 1991 1994 1997
Morecambe Bay
0
500
1,000
1,500
2,000
2,500
1970 1973 1976 1979 1982 1985 1988 1991 1994 1997
Landings
(tonnes)
1970 1973 1976 1979 1982 1985 1988 1991 1994 19970
3,000
6,000
9,000
12,000Wash
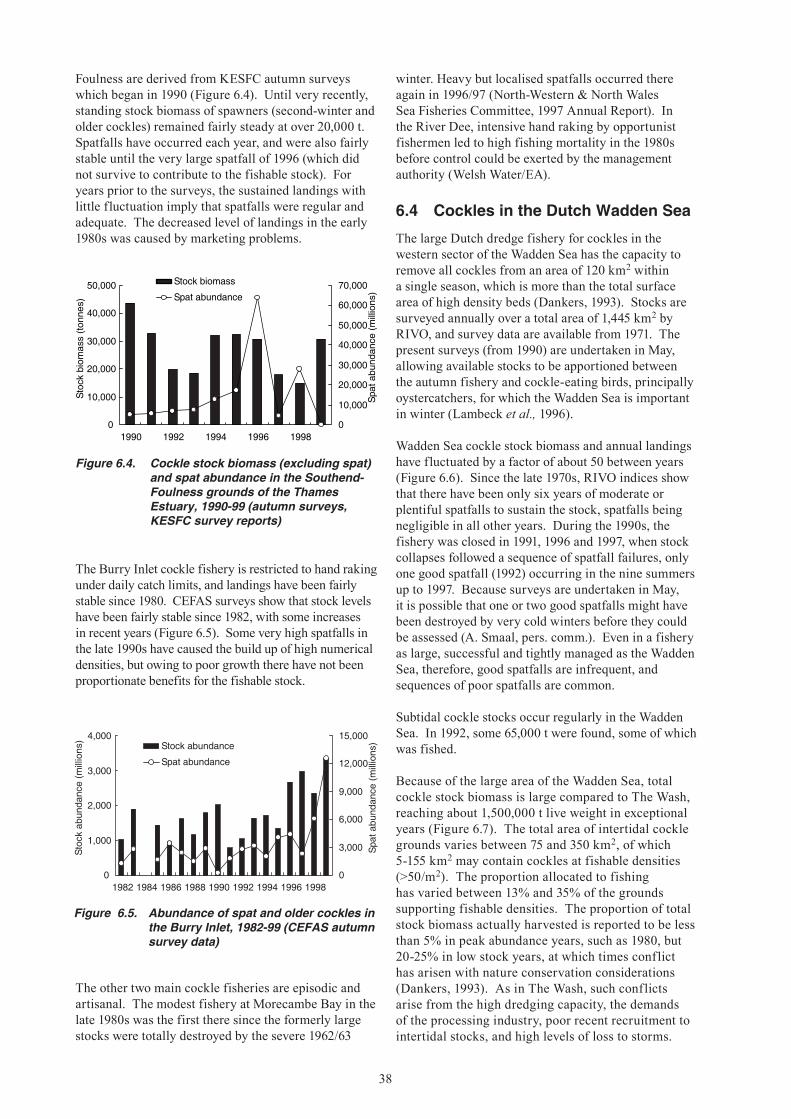
38
Foulness are derived from KESFC autumn surveys which began in 1990 (Figure 6.4). Until very recently, standing stock biomass of spawners (second-winter and older cockles) remained fairly steady at over 20,000 t. Spatfalls have occurred each year, and were also fairly stable until the very large spatfall of 1996 (which did not survive to contribute to the fishable stock). For years prior to the surveys, the sustained landings with little fluctuation imply that spatfalls were regular and adequate. The decreased level of landings in the early 1980s was caused by marketing problems.
Figure 6.4. Cockle stock biomass (excluding spat) and spat abundance in the Southend-Foulness grounds of the Thames Estuary, 1990-99 (autumn surveys, KESFC survey reports)
0
10,000
20,000
30,000
40,000
50,000
1990 1992 1994 1996 1998
Stock
biom
ass(tonnes)
0
10,000
20,000
30,000
40,000
50,000
60,000
70,000
Spatabundance
(millions)
Stock biomass
Spat abundance
Figure 6.5. Abundance of spat and older cockles in the Burry Inlet, 1982-99 (CEFAS autumn survey data)
0
1,000
2,000
3,000
4,000
1982 1984 1986 1988 1990 1992 1994 1996 1998
Stock
abundance(millions)
0
3,000
6,000
9,000
12,000
15,000
Spatabundance
(millions)Stock abundance
Spat abundance
The Burry Inlet cockle fishery is restricted to hand raking under daily catch limits, and landings have been fairly stable since 1980. CEFAS surveys show that stock levels have been fairly stable since 1982, with some increases in recent years (Figure 6.5). Some very high spatfalls in the late 1990s have caused the build up of high numerical densities, but owing to poor growth there have not been proportionate benefits for the fishable stock.
winter. Heavy but localised spatfalls occurred there again in 1996/97 (North-Western & North Wales Sea Fisheries Committee, 1997 Annual Report). In the River Dee, intensive hand raking by opportunist fishermen led to high fishing mortality in the 1980s before control could be exerted by the management authority (Welsh Water/EA).
6.4 Cockles in the Dutch Wadden Sea
The large Dutch dredge fishery for cockles in the western sector of the Wadden Sea has the capacity to remove all cockles from an area of 120 km2 within a single season, which is more than the total surface area of high density beds (Dankers, 1993). Stocks are surveyed annually over a total area of 1,445 km2 by RIVO, and survey data are available from 1971. The present surveys (from 1990) are undertaken in May, allowing available stocks to be apportioned between the autumn fishery and cockle-eating birds, principally oystercatchers, for which the Wadden Sea is important in winter (Lambeck et al., 1996).
Wadden Sea cockle stock biomass and annual landings have fluctuated by a factor of about 50 between years (Figure 6.6). Since the late 1970s, RIVO indices show that there have been only six years of moderate or plentiful spatfalls to sustain the stock, spatfalls being negligible in all other years. During the 1990s, the fishery was closed in 1991, 1996 and 1997, when stock collapses followed a sequence of spatfall failures, only one good spatfall (1992) occurring in the nine summers up to 1997. Because surveys are undertaken in May, it is possible that one or two good spatfalls might have been destroyed by very cold winters before they could be assessed (A. Smaal, pers. comm.). Even in a fishery as large, successful and tightly managed as the Wadden Sea, therefore, good spatfalls are infrequent, and sequences of poor spatfalls are common.
Subtidal cockle stocks occur regularly in the Wadden Sea. In 1992, some 65,000 t were found, some of which was fished.
Because of the large area of the Wadden Sea, total cockle stock biomass is large compared to The Wash, reaching about 1,500,000 t live weight in exceptional years (Figure 6.7). The total area of intertidal cockle grounds varies between 75 and 350 km2, of which 5-155 km2 may contain cockles at fishable densities (>50/m2). The proportion allocated to fishing has varied between 13% and 35% of the grounds supporting fishable densities. The proportion of total stock biomass actually harvested is reported to be less than 5% in peak abundance years, such as 1980, but 20-25% in low stock years, at which times conflict has arisen with nature conservation considerations (Dankers, 1993). As in The Wash, such conflicts arise from the high dredging capacity, the demands of the processing industry, poor recent recruitment to intertidal stocks, and high levels of loss to storms.
The other two main cockle fisheries are episodic and artisanal. The modest fishery at Morecambe Bay in the late 1980s was the first there since the formerly large stocks were totally destroyed by the severe 1962/63
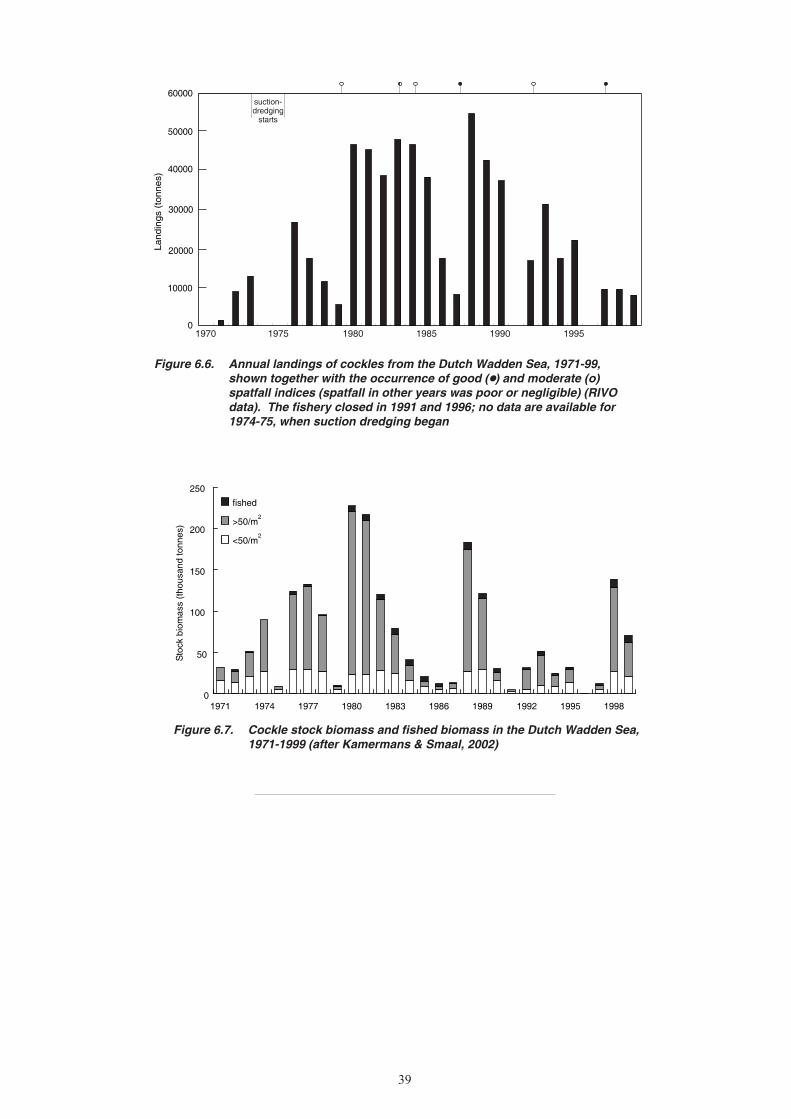
39
Figure 6.6. Annual landings of cockles from the Dutch Wadden Sea, 1971-99, shown together with the occurrence of good (•) and moderate (o) spatfall indices (spatfall in other years was poor or negligible) (RIVO data). The fishery closed in 1991 and 1996; no data are available for 1974-75, when suction dredging began
0
10000
20000
30000
40000
50000
60000
Landings
(tonnes)
suction-dredgingstarts
1970 1975 1980 1985 1990 1995
0
50
100
150
200
250
1971 1974 1977 1980 1983 1986 1989 1992 1995 1998
Stock
biom
ass(thousandtonnes)
fished
>50/m2
<50/m2
Figure 6.7. Cockle stock biomass and fished biomass in the Dutch Wadden Sea, 1971-1999 (after Kamermans & Smaal, 2002)
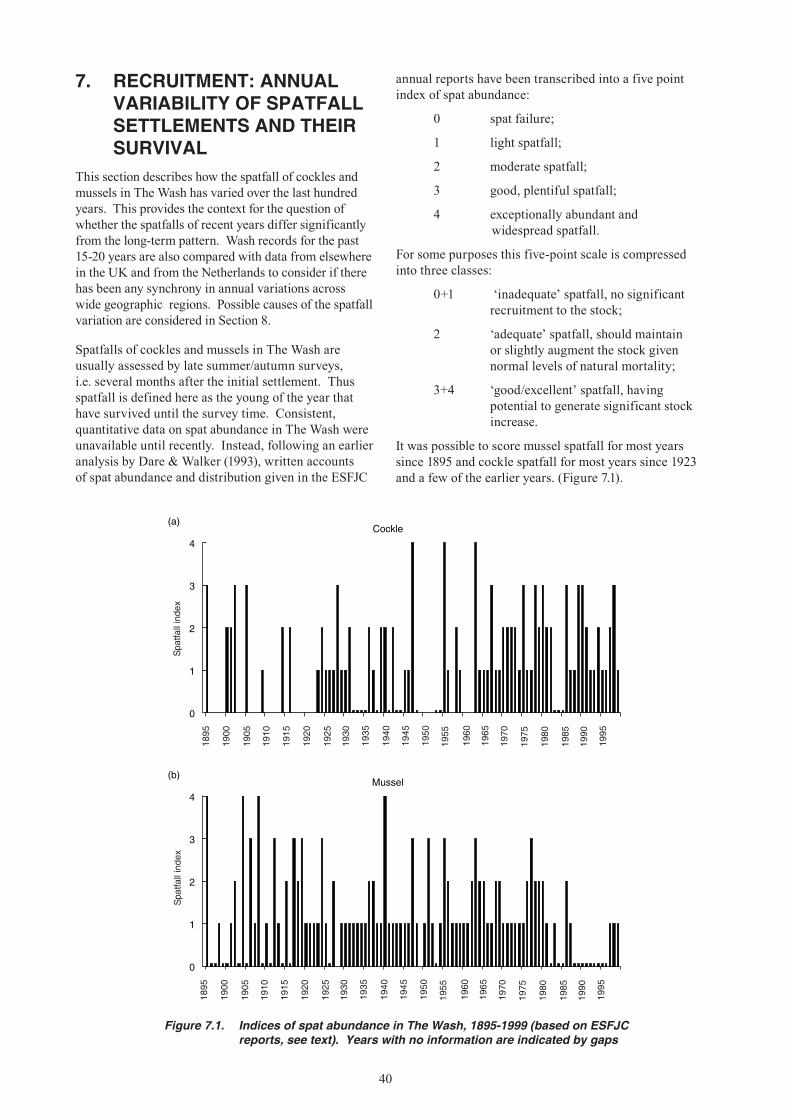
40
7. RECRUITMENT: ANNUAL VARIABILITY OF SPATFALL SETTLEMENTS AND THEIR SURVIVAL
This section describes how the spatfall of cockles and mussels in The Wash has varied over the last hundred years. This provides the context for the question of whether the spatfalls of recent years differ significantly from the long-term pattern. Wash records for the past 15-20 years are also compared with data from elsewhere in the UK and from the Netherlands to consider if there has been any synchrony in annual variations across wide geographic regions. Possible causes of the spatfall variation are considered in Section 8.
Spatfalls of cockles and mussels in The Wash are usually assessed by late summer/autumn surveys, i.e. several months after the initial settlement. Thus spatfall is defined here as the young of the year that have survived until the survey time. Consistent, quantitative data on spat abundance in The Wash were unavailable until recently. Instead, following an earlier analysis by Dare & Walker (1993), written accounts of spat abundance and distribution given in the ESFJC
annual reports have been transcribed into a five point index of spat abundance:
0 spat failure;
1 light spatfall;
2 moderate spatfall;
3 good, plentiful spatfall;
4 exceptionally abundant and widespread spatfall.
For some purposes this five-point scale is compressed into three classes:
0+1 ‘inadequate’ spatfall, no significant recruitment to the stock;
2 ‘adequate’ spatfall, should maintain or slightly augment the stock given normal levels of natural mortality;
3+4 ‘good/excellent’ spatfall, having potential to generate significant stock increase.
It was possible to score mussel spatfall for most years since 1895 and cockle spatfall for most years since 1923 and a few of the earlier years. (Figure 7.1).
Figure 7.1. Indices of spat abundance in The Wash, 1895-1999 (based on ESFJC reports, see text). Years with no information are indicated by gaps
Cockle
0
1
2
3
4
(a)
Mussel
0
1
2
3
4
(b)
Spatfallindex
Spat fallindex
1895
1900
1905
1910
1915
1920
1925
1930
1935
1940
1945
1950
1955
1960
1965
1975
1970
1980
1985
1990
1995
1895
1900
1905
1910
1915
1920
1925
1930
1935
1940
1945
1950
1955
1960
1965
1975
1970
1980
1985
1990
1995
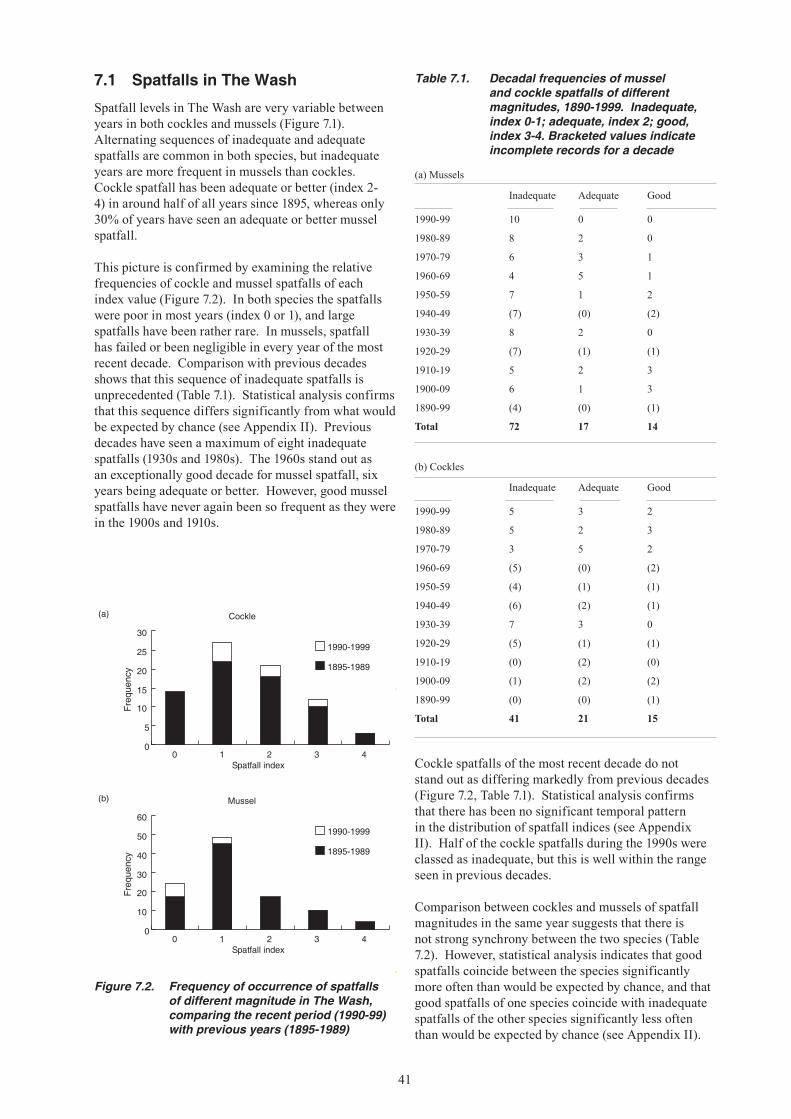
41
Mussel
0
10
20
30
40
50
60
0 1 2 3 4Spatfall index
1990-1999
1895-1989
(b)
Cockle
0
5
10
15
20
25
30
0 1 2 3 4Spatfall index
1990-1999
1895-1989
(a)
Frequency
Frequency
Figure 7.2. Frequency of occurrence of spatfalls of different magnitude in The Wash, comparing the recent period (1990-99) with previous years (1895-1989)
Cockle spatfalls of the most recent decade do not stand out as differing markedly from previous decades (Figure 7.2, Table 7.1). Statistical analysis confirms that there has been no significant temporal pattern in the distribution of spatfall indices (see Appendix II). Half of the cockle spatfalls during the 1990s were classed as inadequate, but this is well within the range seen in previous decades.
Comparison between cockles and mussels of spatfall magnitudes in the same year suggests that there is not strong synchrony between the two species (Table 7.2). However, statistical analysis indicates that good spatfalls coincide between the species significantly more often than would be expected by chance, and that good spatfalls of one species coincide with inadequate spatfalls of the other species significantly less often than would be expected by chance (see Appendix II).
7.1 Spatfalls in The Wash
Spatfall levels in The Wash are very variable between years in both cockles and mussels (Figure 7.1). Alternating sequences of inadequate and adequate spatfalls are common in both species, but inadequate years are more frequent in mussels than cockles. Cockle spatfall has been adequate or better (index 2-4) in around half of all years since 1895, whereas only 30% of years have seen an adequate or better mussel spatfall.
This picture is confirmed by examining the relative frequencies of cockle and mussel spatfalls of each index value (Figure 7.2). In both species the spatfalls were poor in most years (index 0 or 1), and large spatfalls have been rather rare. In mussels, spatfall has failed or been negligible in every year of the most recent decade. Comparison with previous decades shows that this sequence of inadequate spatfalls is unprecedented (Table 7.1). Statistical analysis confirms that this sequence differs significantly from what would be expected by chance (see Appendix II). Previous decades have seen a maximum of eight inadequate spatfalls (1930s and 1980s). The 1960s stand out as an exceptionally good decade for mussel spatfall, six years being adequate or better. However, good mussel spatfalls have never again been so frequent as they were in the 1900s and 1910s.
Table 7.1. Decadal frequencies of mussel and cockle spatfalls of different magnitudes, 1890-1999. Inadequate, index 0-1; adequate, index 2; good, index 3-4. Bracketed values indicate incomplete records for a decade
(a) Mussels
Inadequate Adequate Good
1990-99 10 0 0
1980-89 8 2 0
1970-79 6 3 1
1960-69 4 5 1
1950-59 7 1 2
1940-49 (7) (0) (2)
1930-39 8 2 0
1920-29 (7) (1) (1)
1910-19 5 2 3
1900-09 6 1 3
1890-99 (4) (0) (1)
Total 72 17 14
(b) Cockles
Inadequate Adequate Good
1990-99 5 3 2
1980-89 5 2 3
1970-79 3 5 2
1960-69 (5) (0) (2)
1950-59 (4) (1) (1)
1940-49 (6) (2) (1)
1930-39 7 3 0
1920-29 (5) (1) (1)
1910-19 (0) (2) (0)
1900-09 (1) (2) (2)
1890-99 (0) (0) (1)
Total 41 21 15
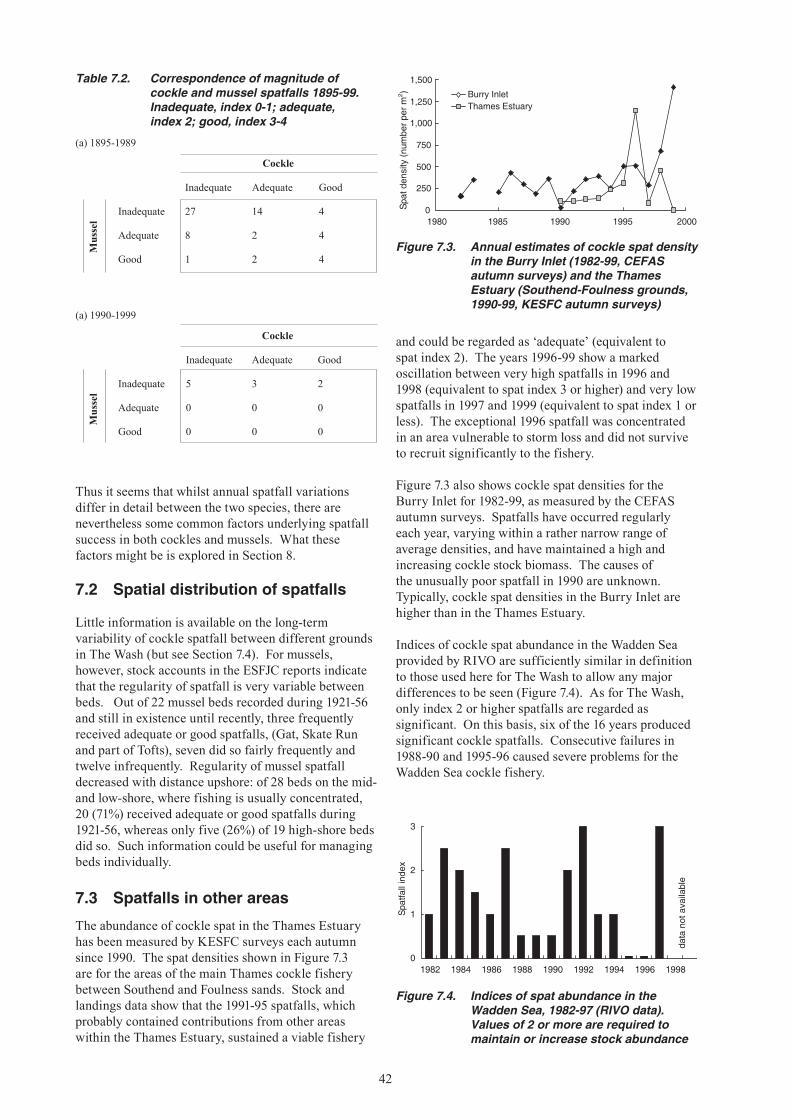
42
Thus it seems that whilst annual spatfall variations differ in detail between the two species, there are nevertheless some common factors underlying spatfall success in both cockles and mussels. What these factors might be is explored in Section 8.
7.2 Spatial distribution of spatfalls
Little information is available on the long-term variability of cockle spatfall between different grounds in The Wash (but see Section 7.4). For mussels, however, stock accounts in the ESFJC reports indicate that the regularity of spatfall is very variable between beds. Out of 22 mussel beds recorded during 1921-56 and still in existence until recently, three frequently received adequate or good spatfalls, (Gat, Skate Run and part of Tofts), seven did so fairly frequently and twelve infrequently. Regularity of mussel spatfall decreased with distance upshore: of 28 beds on the mid- and low-shore, where fishing is usually concentrated, 20 (71%) received adequate or good spatfalls during 1921-56, whereas only five (26%) of 19 high-shore beds did so. Such information could be useful for managing beds individually.
7.3 Spatfalls in other areas
The abundance of cockle spat in the Thames Estuary has been measured by KESFC surveys each autumn since 1990. The spat densities shown in Figure 7.3 are for the areas of the main Thames cockle fishery between Southend and Foulness sands. Stock and landings data show that the 1991-95 spatfalls, which probably contained contributions from other areas within the Thames Estuary, sustained a viable fishery
and could be regarded as ‘adequate’ (equivalent to spat index 2). The years 1996-99 show a marked oscillation between very high spatfalls in 1996 and 1998 (equivalent to spat index 3 or higher) and very low spatfalls in 1997 and 1999 (equivalent to spat index 1 or less). The exceptional 1996 spatfall was concentrated in an area vulnerable to storm loss and did not survive to recruit significantly to the fishery.
Figure 7.3 also shows cockle spat densities for the Burry Inlet for 1982-99, as measured by the CEFAS autumn surveys. Spatfalls have occurred regularly each year, varying within a rather narrow range of average densities, and have maintained a high and increasing cockle stock biomass. The causes of the unusually poor spatfall in 1990 are unknown. Typically, cockle spat densities in the Burry Inlet are higher than in the Thames Estuary.
Indices of cockle spat abundance in the Wadden Sea provided by RIVO are sufficiently similar in definition to those used here for The Wash to allow any major differences to be seen (Figure 7.4). As for The Wash, only index 2 or higher spatfalls are regarded as significant. On this basis, six of the 16 years produced significant cockle spatfalls. Consecutive failures in 1988-90 and 1995-96 caused severe problems for the Wadden Sea cockle fishery.
Table 7.2. Correspondence of magnitude of cockle and mussel spatfalls 1895-99. Inadequate, index 0-1; adequate,
index 2; good, index 3-4
(a) 1895-1989
Cockle
Inadequate Adequate Good
Mus
sel
Inadequate 27 14 4
Adequate 8 2 4
Good 1 2 4
(a) 1990-1999
Cockle
Inadequate Adequate Good
Mus
sel
Inadequate 5 3 2
Adequate 0 0 0
Good 0 0 0
0
250
500
750
1,000
1,250
1,500
1980 1985 1990 1995 2000
Burry InletThames Estuary
Spatdensity(num
berperm
)2
Figure 7.3. Annual estimates of cockle spat density in the Burry Inlet (1982-99, CEFAS autumn surveys) and the Thames Estuary (Southend-Foulness grounds, 1990-99, KESFC autumn surveys)
Figure 7.4. Indices of spat abundance in the Wadden Sea, 1982-97 (RIVO data). Values of 2 or more are required to maintain or increase stock abundance
0
1
2
3
1982 1984 1986 1988 1990 1992 1994 1996 1998
Spatfallindex
dat anot available
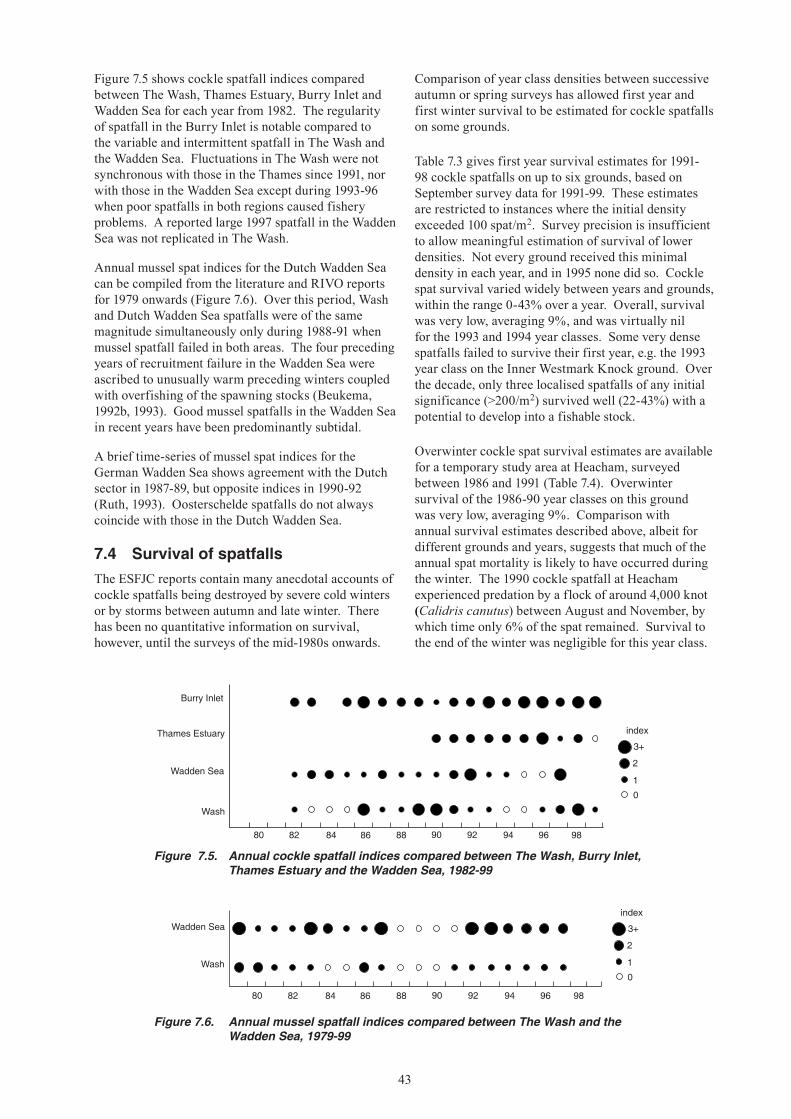
43
Figure 7.5 shows cockle spatfall indices compared between The Wash, Thames Estuary, Burry Inlet and Wadden Sea for each year from 1982. The regularity of spatfall in the Burry Inlet is notable compared to the variable and intermittent spatfall in The Wash and the Wadden Sea. Fluctuations in The Wash were not synchronous with those in the Thames since 1991, nor with those in the Wadden Sea except during 1993-96 when poor spatfalls in both regions caused fishery problems. A reported large 1997 spatfall in the Wadden Sea was not replicated in The Wash.
Annual mussel spat indices for the Dutch Wadden Sea can be compiled from the literature and RIVO reports for 1979 onwards (Figure 7.6). Over this period, Wash and Dutch Wadden Sea spatfalls were of the same magnitude simultaneously only during 1988-91 when mussel spatfall failed in both areas. The four preceding years of recruitment failure in the Wadden Sea were ascribed to unusually warm preceding winters coupled with overfishing of the spawning stocks (Beukema, 1992b, 1993). Good mussel spatfalls in the Wadden Sea in recent years have been predominantly subtidal.
A brief time-series of mussel spat indices for the German Wadden Sea shows agreement with the Dutch sector in 1987-89, but opposite indices in 1990-92 (Ruth, 1993). Oosterschelde spatfalls do not always coincide with those in the Dutch Wadden Sea.
7.4 Survival of spatfallsThe ESFJC reports contain many anecdotal accounts of cockle spatfalls being destroyed by severe cold winters or by storms between autumn and late winter. There has been no quantitative information on survival, however, until the surveys of the mid-1980s onwards.
Figure 7.5. Annual cockle spatfall indices compared between The Wash, Burry Inlet, Thames Estuary and the Wadden Sea, 1982-99
Figure 7.6. Annual mussel spatfall indices compared between The Wash and the Wadden Sea, 1979-99
index
3+
2
1
0
80 82 84 86 88 90 92 94 96 98
Burry Inlet
Thames Estuary
Wadden Sea
Wash
Wadden Sea
Wash
index
3+
2
1
0
80 82 84 86 88 90 92 94 96 98
Comparison of year class densities between successive autumn or spring surveys has allowed first year and first winter survival to be estimated for cockle spatfalls on some grounds.
Table 7.3 gives first year survival estimates for 1991-98 cockle spatfalls on up to six grounds, based on September survey data for 1991-99. These estimates are restricted to instances where the initial density exceeded 100 spat/m2. Survey precision is insufficient to allow meaningful estimation of survival of lower densities. Not every ground received this minimal density in each year, and in 1995 none did so. Cockle spat survival varied widely between years and grounds, within the range 0-43% over a year. Overall, survival was very low, averaging 9%, and was virtually nil for the 1993 and 1994 year classes. Some very dense spatfalls failed to survive their first year, e.g. the 1993 year class on the Inner Westmark Knock ground. Over the decade, only three localised spatfalls of any initial significance (>200/m2) survived well (22-43%) with a potential to develop into a fishable stock.
Overwinter cockle spat survival estimates are available for a temporary study area at Heacham, surveyed between 1986 and 1991 (Table 7.4). Overwinter survival of the 1986-90 year classes on this ground was very low, averaging 9%. Comparison with annual survival estimates described above, albeit for different grounds and years, suggests that much of the annual spat mortality is likely to have occurred during the winter. The 1990 cockle spatfall at Heacham experienced predation by a flock of around 4,000 knot (Calidris canutus) between August and November, by which time only 6% of the spat remained. Survival to the end of the winter was negligible for this year class.
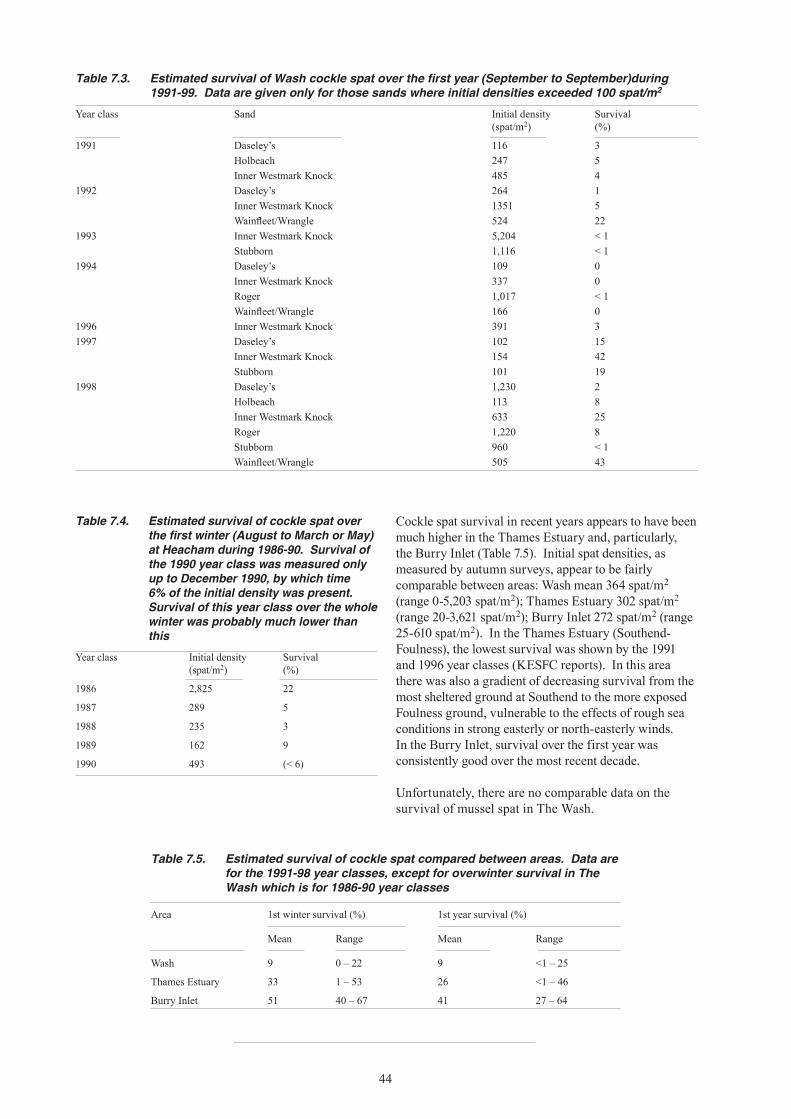
44
Cockle spat survival in recent years appears to have been much higher in the Thames Estuary and, particularly, the Burry Inlet (Table 7.5). Initial spat densities, as measured by autumn surveys, appear to be fairly comparable between areas: Wash mean 364 spat/m2 (range 0-5,203 spat/m2); Thames Estuary 302 spat/m2 (range 20-3,621 spat/m2); Burry Inlet 272 spat/m2 (range 25-610 spat/m2). In the Thames Estuary (Southend-Foulness), the lowest survival was shown by the 1991 and 1996 year classes (KESFC reports). In this area there was also a gradient of decreasing survival from the most sheltered ground at Southend to the more exposed Foulness ground, vulnerable to the effects of rough sea conditions in strong easterly or north-easterly winds. In the Burry Inlet, survival over the first year was consistently good over the most recent decade. Unfortunately, there are no comparable data on the survival of mussel spat in The Wash.
Table 7.3. Estimated survival of Wash cockle spat over the first year (September to September)during 1991-99. Data are given only for those sands where initial densities exceeded 100 spat/m2
Year class Sand Initial density(spat/m2)
Survival(%)
1991 Daseley’s 116 3Holbeach 247 5Inner Westmark Knock 485 4
1992 Daseley’s 264 1Inner Westmark Knock 1351 5Wainfleet/Wrangle 524 22
1993 Inner Westmark Knock 5,204 < 1Stubborn 1,116 < 1
1994 Daseley’s 109 0Inner Westmark Knock 337 0Roger 1,017 < 1Wainfleet/Wrangle 166 0
1996 Inner Westmark Knock 391 31997 Daseley’s 102 15
Inner Westmark Knock 154 42Stubborn 101 19
1998 Daseley’s 1,230 2Holbeach 113 8Inner Westmark Knock 633 25Roger 1,220 8Stubborn 960 < 1Wainfleet/Wrangle 505 43
Table 7.4. Estimated survival of cockle spat over the first winter (August to March or May) at Heacham during 1986-90. Survival of the 1990 year class was measured only up to December 1990, by which time 6% of the initial density was present. Survival of this year class over the whole winter was probably much lower than this
Year class Initial density(spat/m2)
Survival(%)
1986 2,825 22
1987 289 5
1988 235 3
1989 162 9
1990 493 (< 6)
Table 7.5. Estimated survival of cockle spat compared between areas. Data are for the 1991-98 year classes, except for overwinter survival in The Wash which is for 1986-90 year classes
Area 1st winter survival (%) 1st year survival (%)
Mean Range Mean Range
Wash 9 0 – 22 9 <1 – 25
Thames Estuary 33 1 – 53 26 <1 – 46
Burry Inlet 51 40 – 67 41 27 – 64
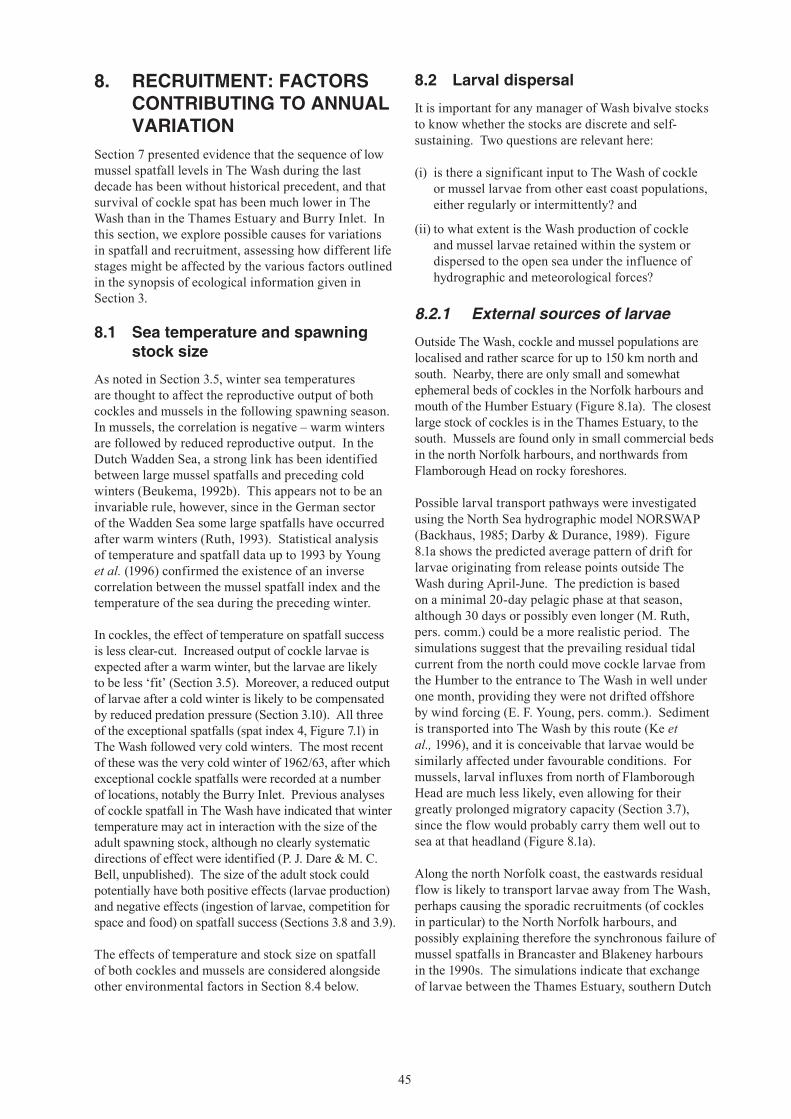
45
8. RECRUITMENT: FACTORS CONTRIBUTING TO ANNUAL VARIATION
Section 7 presented evidence that the sequence of low mussel spatfall levels in The Wash during the last decade has been without historical precedent, and that survival of cockle spat has been much lower in The Wash than in the Thames Estuary and Burry Inlet. In this section, we explore possible causes for variations in spatfall and recruitment, assessing how different life stages might be affected by the various factors outlined in the synopsis of ecological information given in Section 3.
8.1 Sea temperature and spawning stock size
As noted in Section 3.5, winter sea temperatures are thought to affect the reproductive output of both cockles and mussels in the following spawning season. In mussels, the correlation is negative – warm winters are followed by reduced reproductive output. In the Dutch Wadden Sea, a strong link has been identified between large mussel spatfalls and preceding cold winters (Beukema, 1992b). This appears not to be an invariable rule, however, since in the German sector of the Wadden Sea some large spatfalls have occurred after warm winters (Ruth, 1993). Statistical analysis of temperature and spatfall data up to 1993 by Young et al. (1996) confirmed the existence of an inverse correlation between the mussel spatfall index and the temperature of the sea during the preceding winter.
In cockles, the effect of temperature on spatfall success is less clear-cut. Increased output of cockle larvae is expected after a warm winter, but the larvae are likely to be less ‘fit’ (Section 3.5). Moreover, a reduced output of larvae after a cold winter is likely to be compensated by reduced predation pressure (Section 3.10). All three of the exceptional spatfalls (spat index 4, Figure 7.1) in The Wash followed very cold winters. The most recent of these was the very cold winter of 1962/63, after which exceptional cockle spatfalls were recorded at a number of locations, notably the Burry Inlet. Previous analyses of cockle spatfall in The Wash have indicated that winter temperature may act in interaction with the size of the adult spawning stock, although no clearly systematic directions of effect were identified (P. J. Dare & M. C. Bell, unpublished). The size of the adult stock could potentially have both positive effects (larvae production) and negative effects (ingestion of larvae, competition for space and food) on spatfall success (Sections 3.8 and 3.9).
The effects of temperature and stock size on spatfall of both cockles and mussels are considered alongside other environmental factors in Section 8.4 below.
8.2 Larval dispersal
It is important for any manager of Wash bivalve stocks to know whether the stocks are discrete and self-sustaining. Two questions are relevant here:
(i) is there a significant input to The Wash of cockle or mussel larvae from other east coast populations, either regularly or intermittently? and
(ii) to what extent is the Wash production of cockle and mussel larvae retained within the system or dispersed to the open sea under the influence of hydrographic and meteorological forces?
8.2.1 External sources of larvae
Outside The Wash, cockle and mussel populations are localised and rather scarce for up to 150 km north and south. Nearby, there are only small and somewhat ephemeral beds of cockles in the Norfolk harbours and mouth of the Humber Estuary (Figure 8.1a). The closest large stock of cockles is in the Thames Estuary, to the south. Mussels are found only in small commercial beds in the north Norfolk harbours, and northwards from Flamborough Head on rocky foreshores.
Possible larval transport pathways were investigated using the North Sea hydrographic model NORSWAP (Backhaus, 1985; Darby & Durance, 1989). Figure 8.1a shows the predicted average pattern of drift for larvae originating from release points outside The Wash during April-June. The prediction is based on a minimal 20-day pelagic phase at that season, although 30 days or possibly even longer (M. Ruth, pers. comm.) could be a more realistic period. The simulations suggest that the prevailing residual tidal current from the north could move cockle larvae from the Humber to the entrance to The Wash in well under one month, providing they were not drifted offshore by wind forcing (E. F. Young, pers. comm.). Sediment is transported into The Wash by this route (Ke et al., 1996), and it is conceivable that larvae would be similarly affected under favourable conditions. For mussels, larval influxes from north of Flamborough Head are much less likely, even allowing for their greatly prolonged migratory capacity (Section 3.7), since the flow would probably carry them well out to sea at that headland (Figure 8.1a).
Along the north Norfolk coast, the eastwards residual flow is likely to transport larvae away from The Wash, perhaps causing the sporadic recruitments (of cockles in particular) to the North Norfolk harbours, and possibly explaining therefore the synchronous failure of mussel spatfalls in Brancaster and Blakeney harbours in the 1990s. The simulations indicate that exchange of larvae between the Thames Estuary, southern Dutch
46
coast and The Wash are very unlikely (Figure 8.1b). The potential dispersal directions are all from west to east, and the distances too great to allow significant transport within the time scales of larval development. Studies of the genetic relatedness of these stocks would be needed to confirm this conclusion.
The overall conclusion is that the only likely external source of recruits to The Wash bivalve stocks is a small and irregular supply of cockle larvae from the Humber estuary. On a precautionary basis the stocks of both cockles and mussels should be regarded as discrete and self-recruiting and managed accordingly. This ‘precautionary approach’ has been applied by ESFJC since the Wash Order (1992) came into force.
8.2.2 Larval dispersal from The Wash
The NORSWAP model indicates that any losses or larvae from The Wash will occur in an easterly direction (Figure 8.1a). The proportion of larvae retained within The Wash in a particular year could depend on annual variations in wind-driven circulation patterns. This was demonstrated by Young et al. (1996) in a statistical analysis of climatic and Wash spatfall data up to 1993. This study showed that good cockle spatfalls were associated with the occurrence of easterly winds in the southern North Sea during April to July, particularly June. Easterly surface winds are thought to induce currents that retain larvae close to suitable settlement sites in The Wash. For mussels, years of good spatfalls were also associated with a high frequency of easterly winds in June, although, as noted above, there was also a stronger association with cold preceding winters.
The importance of wind-driven circulation patterns for retention of larvae within The Wash is supported by the results of hydrographic modelling by Young et al. (1998). Their hydrographic model of The Wash predicted that wind influences should be considerably more important in influencing the retention of bivalve larvae than tides or the sites of larval releases. Model simulations suggested that periods of combined northerly and easterly winds would enhance settlement. Conversely, periods of combined southerly and westerly winds would result in low settlement. Tests of the model, using actual spatfalls and weather data for certain years of high and low spatfalls, showed that results were highly dependent on knowing the true times of larval release in each year. The outcome is probably influenced also by unmeasured post-settlement processes, such as mortality and secondary dispersal operating in the weeks/months between the initial settlement phase (as modelled) and the time when spatfalls are assessed later in the year. This topic is considered further, alongside other factors influencing spatfall, in Section 8.4
54o
53o
1o 0o 1o
TheWash
NORSWAPAPRIL-JUNE20 day larval life
R.Humber
mussels
musselscockles
cockles
mussels?
50 km
54°
52°
2° 4°
Wadden Seacocklesmussels
cocklesmussels
Thamescockles
NORSWAPAPRIL-JUNE20 day larval life
3°
53°
50 km
Figure 8.1. Dispersal pathways for bivalve larvae predicted by the NORSWAP hydrographic model, calculated for a 20-day pelagic phase during April-June: (a) outside The Wash; (b) in the Southern Bight of the North Sea. Circles denote release points, arrows show length and direction of movement. Locations of major cockle and mussel stocks outside The Wash are shown
47
8.3 Mortality of larvae
Nothing is known about the annual variability of larval mortality rates. The mortality of planktonic larvae is inherently high. Daily mortality rates of 14% have been estimated in the only field study of mussel larvae (Jørgensen, 1981). Placing this value in perspective, this indicates that the 100,000 egg production calculated for a standard 25 mm mussel would be reduced to 1,000 larvae surviving after four weeks in the sea (Widdows, 1991). For a very large (80 mm) mussel the comparable figures would be 10,000,000 egg production and 1,000 larvae after 8½ weeks. Any factor that reduces growth rate of larvae (e.g. food shortage, low temperature), and thus extends the development period, will increase the total mortality over the course of larval development and reduce chances of surviving to the settlement stage (Widdows, 1991). Mussel (and cockle) larvae may spend 4-8 weeks in the plankton at average spring sea temperatures, though mussels can greatly prolong the planktonic phase in adverse conditions (Section 3.7). The effects of spring temperature anomalies exceeding 1°C could, therefore, have major consequences for settlement success.
8.4 Environmental and stock influences on recruitment – a new analysis
Young et al. (1996) analysed Wash cockle and mussel spatfall indices up to 1993 in relation to winter temperature and atmospheric circulation patterns. The results of these analyses emphasised the importance of larval retention, particularly for cockles, and of cold winters, particularly for mussels. As described above (Section 8.2.2), the importance of larval retention was confirmed by hydrographic modelling (Young et al., 1998). To what extent do these environmental influences account for recent patterns of bivalve recruitment in The Wash, in particular the series of very low mussel spatfalls?
In addressing this question, it is worthwhile to update the analysis of Young et al. (1996) with a further six years of data up to 1999. It is worthwhile also to consider the potential influence of adult stock size, since previous analyses have indicated its importance for cockles (P. J. Dare & M. C. Bell, unpublished). A new analysis of cockle and mussel spatfalls was thus attempted, using the variables listed below.
8.4.1 Spatfall, stock and environmental variables
(i) Spatfall indices. The dependent variables in the analysis were based on the spatfall indices presented in Section 7 (Figure 7.1). All available data were included from 1895 to 1999. Following Young et al. (1996), the five-point scale was
summarised into two types of binary division. Division A distinguishes between heavy and lesser spatfalls:
Division B distinguishes between inadequate and adequate or better spatfalls:
(ii) Adult stock indices. Indices of adult stock size have been compiled for The Wash in much the same way as for spatfall (see Section 5.2). Adult stock index values have been compiled for both species for most years from 1895-1999, and vary from 1 (low stock levels) up to 4 (very high stock levels) (Figure 8.2a,b and see Section 5.2.2). Preliminary analyses showed that a simplification of this scale to a simple binary distinction was appropriate:
Exploratory analyses showed that this classification performed better as an explanatory variable in models of spatfall success than the full four-point scale or any other two- or three-point classifications.
(iii) Winter temperature anomaly. Winter sea temperatures were represented as positive and negative differences (anomalies) from the long-term mean of 3.8°C for January and February at Skegness (Figure 8.2c). For years prior to 1966, when sea temperature was not recorded, sea temperature was estimated from a calibration between air and sea temperatures at Skegness, as described in Dare & Walker (1993) and Young et al. (1996) (see also Section 2.3).
(iv) Atmospheric circulation patterns. Young et al. (1996) established a relationship between the synoptic-scale daily weather map classification scheme of Lamb (1972) and the surface wind directions at Marham, Norfolk. The Lamb synoptic classification system categorises each day according to the atmospheric pressure patterns over the British Isles. Seven basic types
01234
0 - less than heavy spatfall
1 - heavy spatfall
01234
0 - inadequate spatfall
1 - inadequate or better spatfall
1234
0 - low stock levels
1 - moderate to very high stock levels
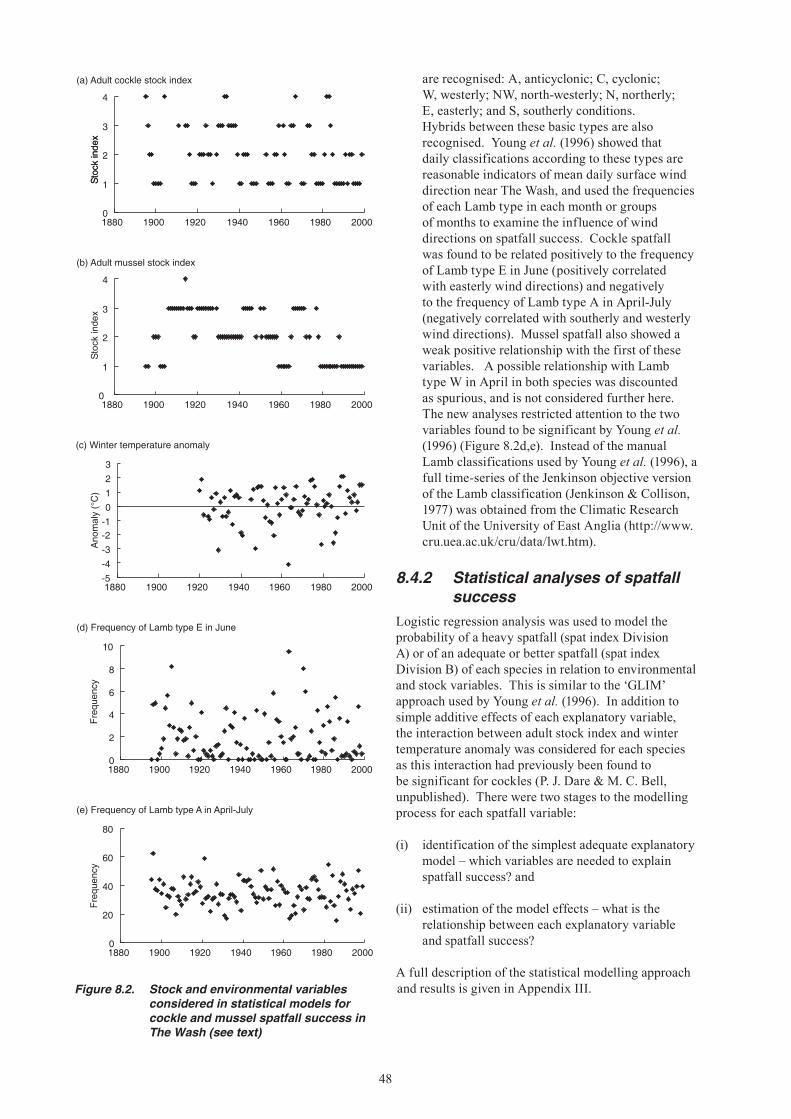
48
0
1
2
3
4
1880 1900 1920 1940 1960 1980 2000
(a) Adult cockle stock index
0
1
2
3
4
1880 1900 1920 1940 1960 1980 2000
(b) Adult mussel stock index
-5-4-3-2-10123
1880 1900 1920 1940 1960 1980 2000
(c) Winter temperature anomaly
0
2
4
6
8
10
1880 1900 1920 1940 1960 1980 2000
(d) Frequency of Lamb type E in June
0
20
40
60
80
1880 1900 1920 1940 1960 1980 2000
(e) Frequency of Lamb type A in April-July
Stock
index
Anomaly(°C)
Stock
index
Stock
index
Frequency
Frequency
Figure 8.2. Stock and environmental variables considered in statistical models for cockle and mussel spatfall success in The Wash (see text)
are recognised: A, anticyclonic; C, cyclonic; W, westerly; NW, north-westerly; N, northerly; E, easterly; and S, southerly conditions. Hybrids between these basic types are also recognised. Young et al. (1996) showed that daily classifications according to these types are reasonable indicators of mean daily surface wind direction near The Wash, and used the frequencies of each Lamb type in each month or groups of months to examine the influence of wind directions on spatfall success. Cockle spatfall was found to be related positively to the frequency of Lamb type E in June (positively correlated with easterly wind directions) and negatively to the frequency of Lamb type A in April-July (negatively correlated with southerly and westerly wind directions). Mussel spatfall also showed a weak positive relationship with the first of these variables. A possible relationship with Lamb type W in April in both species was discounted as spurious, and is not considered further here. The new analyses restricted attention to the two variables found to be significant by Young et al. (1996) (Figure 8.2d,e). Instead of the manual Lamb classifications used by Young et al. (1996), a full time-series of the Jenkinson objective version of the Lamb classification (Jenkinson & Collison, 1977) was obtained from the Climatic Research Unit of the University of East Anglia (http://www.cru.uea.ac.uk/cru/data/lwt.htm).
8.4.2 Statistical analyses of spatfall success
Logistic regression analysis was used to model the probability of a heavy spatfall (spat index Division A) or of an adequate or better spatfall (spat index Division B) of each species in relation to environmental and stock variables. This is similar to the ‘GLIM’ approach used by Young et al. (1996). In addition to simple additive effects of each explanatory variable, the interaction between adult stock index and winter temperature anomaly was considered for each species as this interaction had previously been found to be significant for cockles (P. J. Dare & M. C. Bell, unpublished). There were two stages to the modelling process for each spatfall variable:
(i) identification of the simplest adequate explanatory model – which variables are needed to explain spatfall success? and
(ii) estimation of the model effects – what is the relationship between each explanatory variable and spatfall success?
A full description of the statistical modelling approach and results is given in Appendix III.
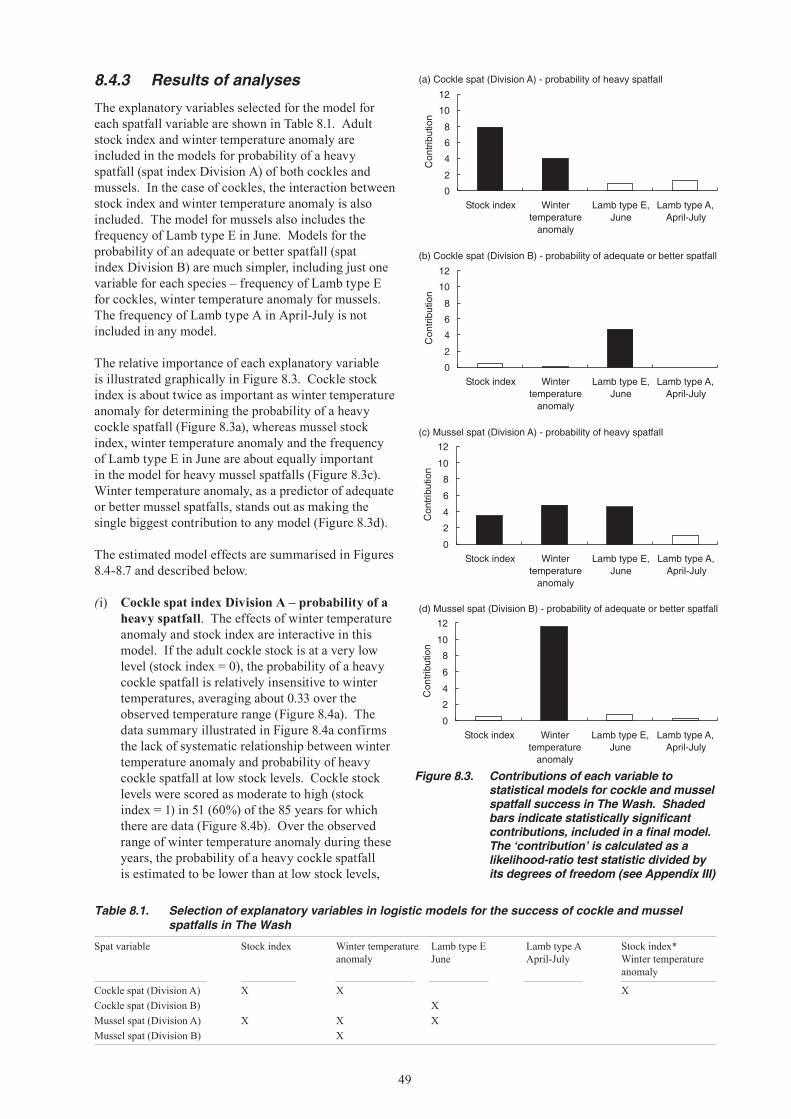
49
8.4.3 Results of analyses
The explanatory variables selected for the model for each spatfall variable are shown in Table 8.1. Adult stock index and winter temperature anomaly are included in the models for probability of a heavy spatfall (spat index Division A) of both cockles and mussels. In the case of cockles, the interaction between stock index and winter temperature anomaly is also included. The model for mussels also includes the frequency of Lamb type E in June. Models for the probability of an adequate or better spatfall (spat index Division B) are much simpler, including just one variable for each species – frequency of Lamb type E for cockles, winter temperature anomaly for mussels. The frequency of Lamb type A in April-July is not included in any model.
The relative importance of each explanatory variable is illustrated graphically in Figure 8.3. Cockle stock index is about twice as important as winter temperature anomaly for determining the probability of a heavy cockle spatfall (Figure 8.3a), whereas mussel stock index, winter temperature anomaly and the frequency of Lamb type E in June are about equally important in the model for heavy mussel spatfalls (Figure 8.3c). Winter temperature anomaly, as a predictor of adequate or better mussel spatfalls, stands out as making the single biggest contribution to any model (Figure 8.3d).
The estimated model effects are summarised in Figures 8.4-8.7 and described below.
(i) Cockle spat index Division A – probability of a heavy spatfall. The effects of winter temperature anomaly and stock index are interactive in this model. If the adult cockle stock is at a very low level (stock index = 0), the probability of a heavy cockle spatfall is relatively insensitive to winter temperatures, averaging about 0.33 over the observed temperature range (Figure 8.4a). The data summary illustrated in Figure 8.4a confirms the lack of systematic relationship between winter temperature anomaly and probability of heavy cockle spatfall at low stock levels. Cockle stock levels were scored as moderate to high (stock index = 1) in 51 (60%) of the 85 years for which there are data (Figure 8.4b). Over the observed range of winter temperature anomaly during these years, the probability of a heavy cockle spatfall is estimated to be lower than at low stock levels,
Table 8.1. Selection of explanatory variables in logistic models for the success of cockle and mussel spatfalls in The Wash
Spat variable Stock index Winter temperature anomaly
Lamb type EJune
Lamb type AApril-July
Stock index*Winter temperature anomaly
Cockle spat (Division A) X X XCockle spat (Division B) XMussel spat (Division A) X X XMussel spat (Division B) X
0
2
4
6
8
10
12
Stock index Wintertemperatureanomaly
Lamb type E,June
Lamb type A,April-July
Contribution
(a) Cockle spat (Division A) - probability of heavy spatfall
0
2
4
6
8
10
12
Stock index Wintertemperatureanomaly
Lamb type E,June
Lamb type A,April-July
Contribution
(b) Cockle spat (Division B) - probability of adequate or better spatfall
0
2
4
6
8
10
12
Stock index Wintertemperatureanomaly
Lamb type E,June
Lamb type A,April-July
Contribution
(c) Mussel spat (Division A) - probability of heavy spatfall
0
2
4
6
8
10
12
Stock index Wintertemperatureanomaly
Lamb type E,June
Lamb type A,April-July
Contribution
(d) Mussel spat (Division B) - probability of adequate or better spatfall
Figure 8.3. Contributions of each variable to statistical models for cockle and mussel spatfall success in The Wash. Shaded bars indicate statistically significant contributions, included in a final model. The ‘contribution’ is calculated as a likelihood-ratio test statistic divided by its degrees of freedom (see Appendix III)
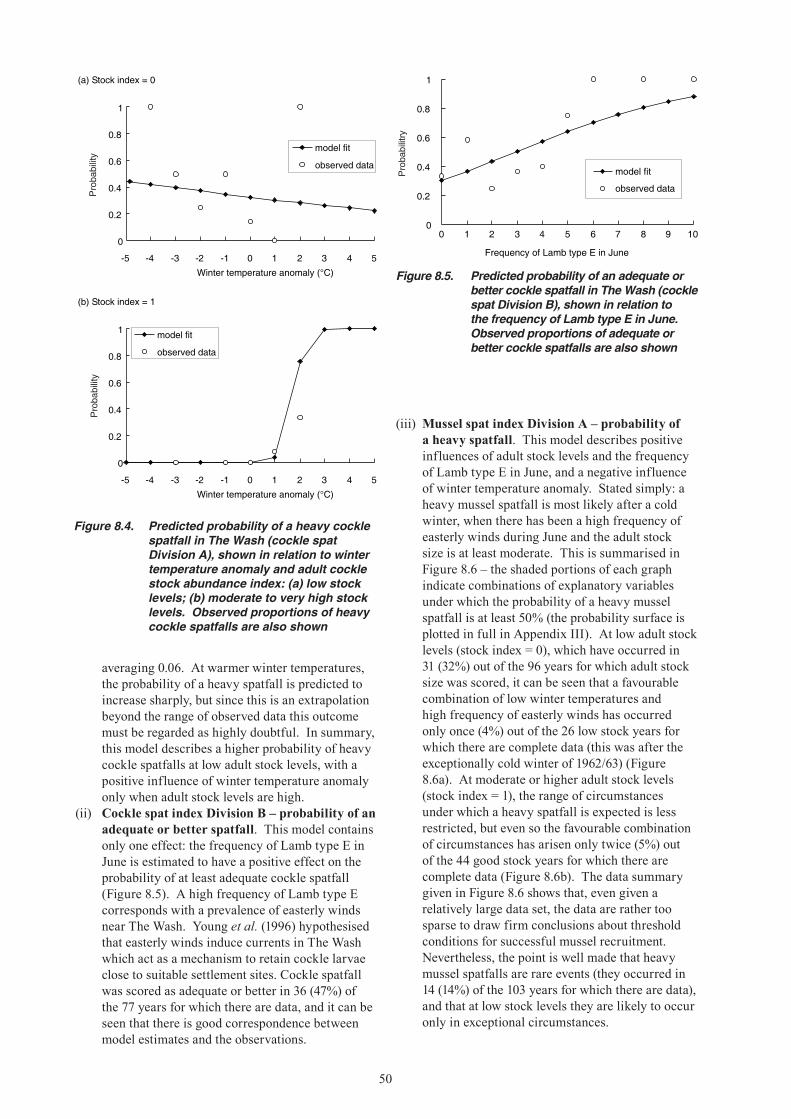
50
(iii) Mussel spat index Division A – probability of a heavy spatfall. This model describes positive influences of adult stock levels and the frequency of Lamb type E in June, and a negative influence of winter temperature anomaly. Stated simply: a heavy mussel spatfall is most likely after a cold winter, when there has been a high frequency of easterly winds during June and the adult stock size is at least moderate. This is summarised in Figure 8.6 – the shaded portions of each graph indicate combinations of explanatory variables under which the probability of a heavy mussel spatfall is at least 50% (the probability surface is plotted in full in Appendix III). At low adult stock levels (stock index = 0), which have occurred in 31 (32%) out of the 96 years for which adult stock size was scored, it can be seen that a favourable combination of low winter temperatures and high frequency of easterly winds has occurred only once (4%) out of the 26 low stock years for which there are complete data (this was after the exceptionally cold winter of 1962/63) (Figure 8.6a). At moderate or higher adult stock levels (stock index = 1), the range of circumstances under which a heavy spatfall is expected is less restricted, but even so the favourable combination of circumstances has arisen only twice (5%) out of the 44 good stock years for which there are complete data (Figure 8.6b). The data summary given in Figure 8.6 shows that, even given a relatively large data set, the data are rather too sparse to draw firm conclusions about threshold conditions for successful mussel recruitment. Nevertheless, the point is well made that heavy mussel spatfalls are rare events (they occurred in 14 (14%) of the 103 years for which there are data), and that at low stock levels they are likely to occur only in exceptional circumstances.
averaging 0.06. At warmer winter temperatures, the probability of a heavy spatfall is predicted to increase sharply, but since this is an extrapolation beyond the range of observed data this outcome must be regarded as highly doubtful. In summary, this model describes a higher probability of heavy cockle spatfalls at low adult stock levels, with a positive influence of winter temperature anomaly only when adult stock levels are high.
(ii) Cockle spat index Division B – probability of an adequate or better spatfall. This model contains only one effect: the frequency of Lamb type E in June is estimated to have a positive effect on the probability of at least adequate cockle spatfall (Figure 8.5). A high frequency of Lamb type E corresponds with a prevalence of easterly winds near The Wash. Young et al. (1996) hypothesised that easterly winds induce currents in The Wash which act as a mechanism to retain cockle larvae close to suitable settlement sites. Cockle spatfall was scored as adequate or better in 36 (47%) of the 77 years for which there are data, and it can be seen that there is good correspondence between model estimates and the observations.
Figure 8.4. Predicted probability of a heavy cockle spatfall in The Wash (cockle spat Division A), shown in relation to winter temperature anomaly and adult cockle stock abundance index: (a) low stock levels; (b) moderate to very high stock levels. Observed proportions of heavy cockle spatfalls are also shown
0
0.2
0.4
0.6
0.8
1
-5 -4 -3 -2 -1 0 1 2 3 4 5
Winter temperature anomaly (°C)
model fit
observed data
(a) Stock index = 0
0
0.2
0.4
0.6
0.8
1
-5 -4 -3 -2 -1 0 1 2 3 4 5
Winter temperature anomaly (°C)
model fit
observed data
(b) Stock index = 1
Probability
Probability
Figure 8.5. Predicted probability of an adequate or better cockle spatfall in The Wash (cockle spat Division B), shown in relation to the frequency of Lamb type E in June. Observed proportions of adequate or better cockle spatfalls are also shown
0
0.2
0.4
0.6
0.8
1
0 1 2 3 4 5 6 7 8 9 10
Frequency of Lamb type E in June
model fit
observed data
Probabilitry
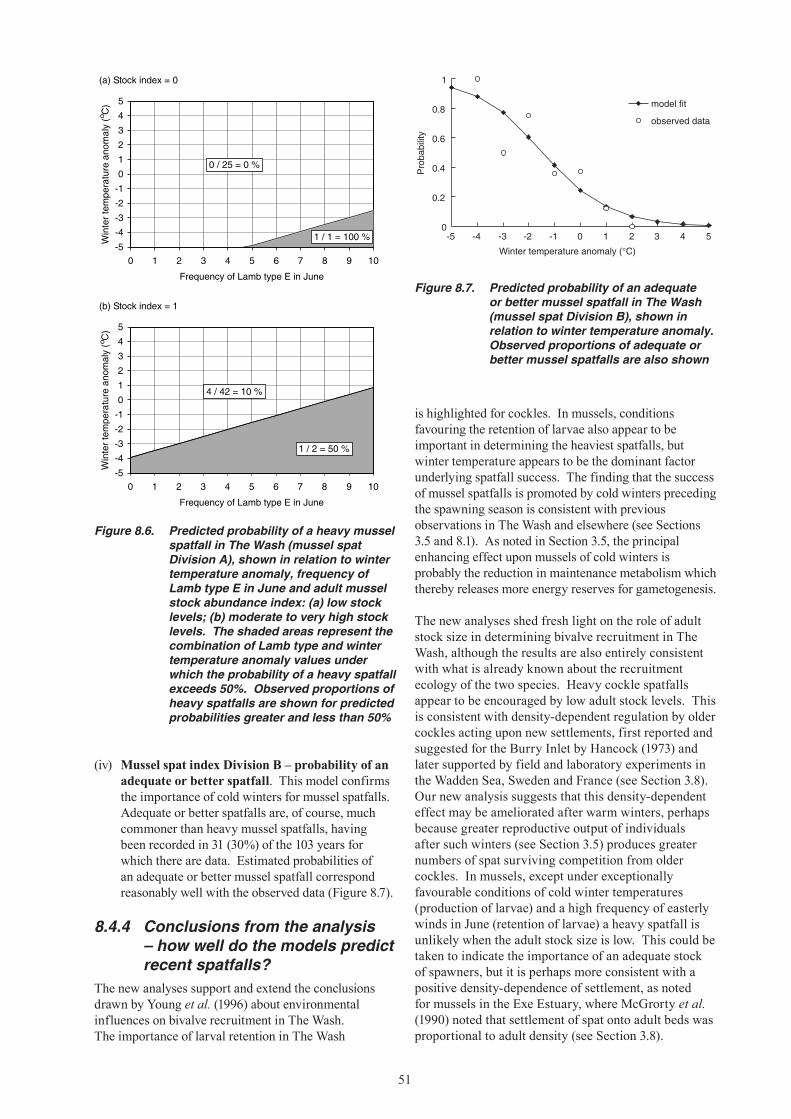
51
is highlighted for cockles. In mussels, conditions favouring the retention of larvae also appear to be important in determining the heaviest spatfalls, but winter temperature appears to be the dominant factor underlying spatfall success. The finding that the success of mussel spatfalls is promoted by cold winters preceding the spawning season is consistent with previous observations in The Wash and elsewhere (see Sections 3.5 and 8.1). As noted in Section 3.5, the principal enhancing effect upon mussels of cold winters is probably the reduction in maintenance metabolism which thereby releases more energy reserves for gametogenesis.
The new analyses shed fresh light on the role of adult stock size in determining bivalve recruitment in The Wash, although the results are also entirely consistent with what is already known about the recruitment ecology of the two species. Heavy cockle spatfalls appear to be encouraged by low adult stock levels. This is consistent with density-dependent regulation by older cockles acting upon new settlements, first reported and suggested for the Burry Inlet by Hancock (1973) and later supported by field and laboratory experiments in the Wadden Sea, Sweden and France (see Section 3.8). Our new analysis suggests that this density-dependent effect may be ameliorated after warm winters, perhaps because greater reproductive output of individuals after such winters (see Section 3.5) produces greater numbers of spat surviving competition from older cockles. In mussels, except under exceptionally favourable conditions of cold winter temperatures (production of larvae) and a high frequency of easterly winds in June (retention of larvae) a heavy spatfall is unlikely when the adult stock size is low. This could be taken to indicate the importance of an adequate stock of spawners, but it is perhaps more consistent with a positive density-dependence of settlement, as noted for mussels in the Exe Estuary, where McGrorty et al. (1990) noted that settlement of spat onto adult beds was proportional to adult density (see Section 3.8).
Figure 8.6. Predicted probability of a heavy mussel spatfall in The Wash (mussel spat Division A), shown in relation to winter temperature anomaly, frequency of Lamb type E in June and adult mussel stock abundance index: (a) low stock levels; (b) moderate to very high stock levels. The shaded areas represent the combination of Lamb type and winter temperature anomaly values under which the probability of a heavy spatfall exceeds 50%. Observed proportions of heavy spatfalls are shown for predicted probabilities greater and less than 50%
-5
-4
-3
-2
-1
0
1
2
3
4
5
0 1 2 3 4 5 6 7 8 9 10
Frequency of Lamb type E in June
Wintertem
peratureanom
aly( °C
)
0 / 25 = 0 %
1 / 1 = 100 %
(a) Stock index = 0
-5
-4
-3
-2
-1
0
1
2
3
4
5
0 1 2 3 4 5 6 7 8 9 10
Frequency of Lamb type E in June
Wintertem
peratureanom
aly( °C
)
4 / 42 = 10 %
1 / 2 = 50 %
(b) Stock index = 1
(iv) Mussel spat index Division B – probability of an adequate or better spatfall. This model confirms the importance of cold winters for mussel spatfalls. Adequate or better spatfalls are, of course, much commoner than heavy mussel spatfalls, having been recorded in 31 (30%) of the 103 years for which there are data. Estimated probabilities of an adequate or better mussel spatfall correspond reasonably well with the observed data (Figure 8.7).
8.4.4 Conclusions from the analysis – how well do the models predict recent spatfalls?
The new analyses support and extend the conclusions drawn by Young et al. (1996) about environmental influences on bivalve recruitment in The Wash. The importance of larval retention in The Wash
Figure 8.7. Predicted probability of an adequate or better mussel spatfall in The Wash (mussel spat Division B), shown in relation to winter temperature anomaly. Observed proportions of adequate or better mussel spatfalls are also shown
0
0.2
0.4
0.6
0.8
1
-5 -4 -3 -2 -1 0 1 2 3 4 5
Winter temperature anomaly (°C)
model fit
observed data
Probability
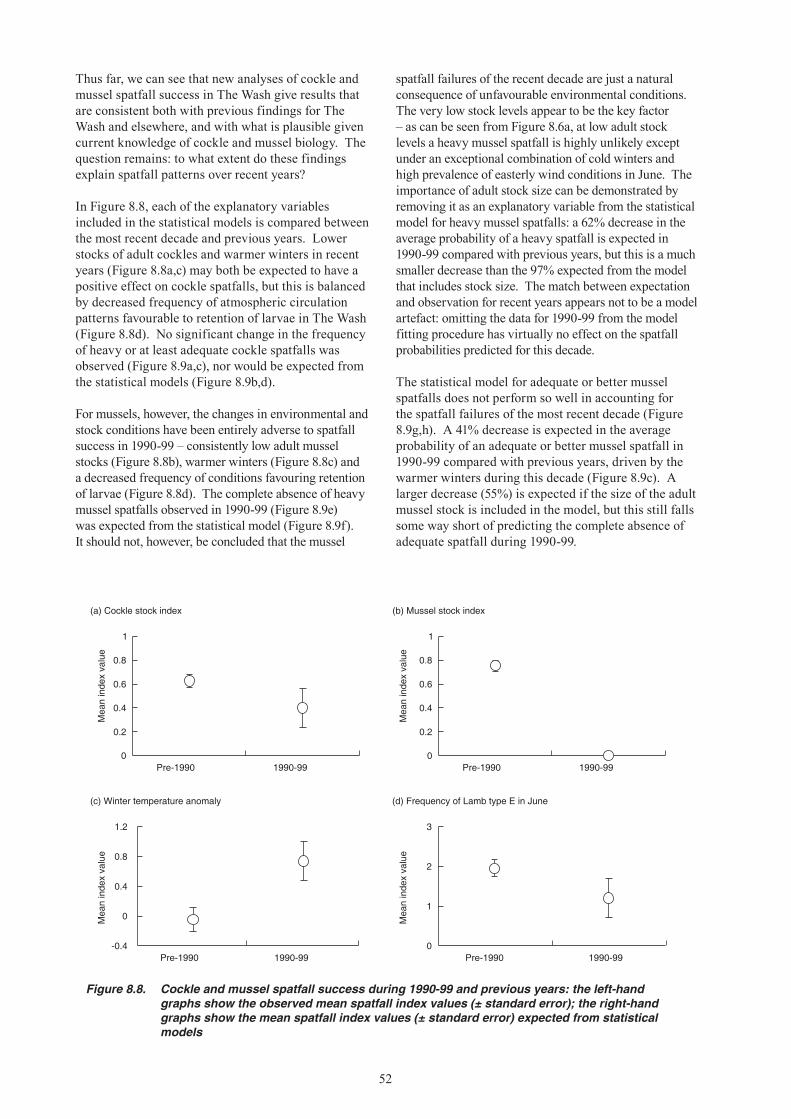
52
Thus far, we can see that new analyses of cockle and mussel spatfall success in The Wash give results that are consistent both with previous findings for The Wash and elsewhere, and with what is plausible given current knowledge of cockle and mussel biology. The question remains: to what extent do these findings explain spatfall patterns over recent years?
In Figure 8.8, each of the explanatory variables included in the statistical models is compared between the most recent decade and previous years. Lower stocks of adult cockles and warmer winters in recent years (Figure 8.8a,c) may both be expected to have a positive effect on cockle spatfalls, but this is balanced by decreased frequency of atmospheric circulation patterns favourable to retention of larvae in The Wash (Figure 8.8d). No significant change in the frequency of heavy or at least adequate cockle spatfalls was observed (Figure 8.9a,c), nor would be expected from the statistical models (Figure 8.9b,d).
For mussels, however, the changes in environmental and stock conditions have been entirely adverse to spatfall success in 1990-99 – consistently low adult mussel stocks (Figure 8.8b), warmer winters (Figure 8.8c) and a decreased frequency of conditions favouring retention of larvae (Figure 8.8d). The complete absence of heavy mussel spatfalls observed in 1990-99 (Figure 8.9e) was expected from the statistical model (Figure 8.9f). It should not, however, be concluded that the mussel
spatfall failures of the recent decade are just a natural consequence of unfavourable environmental conditions. The very low stock levels appear to be the key factor – as can be seen from Figure 8.6a, at low adult stock levels a heavy mussel spatfall is highly unlikely except under an exceptional combination of cold winters and high prevalence of easterly wind conditions in June. The importance of adult stock size can be demonstrated by removing it as an explanatory variable from the statistical model for heavy mussel spatfalls: a 62% decrease in the average probability of a heavy spatfall is expected in 1990-99 compared with previous years, but this is a much smaller decrease than the 97% expected from the model that includes stock size. The match between expectation and observation for recent years appears not to be a model artefact: omitting the data for 1990-99 from the model fitting procedure has virtually no effect on the spatfall probabilities predicted for this decade.
The statistical model for adequate or better mussel spatfalls does not perform so well in accounting for the spatfall failures of the most recent decade (Figure 8.9g,h). A 41% decrease is expected in the average probability of an adequate or better mussel spatfall in 1990-99 compared with previous years, driven by the warmer winters during this decade (Figure 8.9c). A larger decrease (55%) is expected if the size of the adult mussel stock is included in the model, but this still falls some way short of predicting the complete absence of adequate spatfall during 1990-99.
Figure 8.8. Cockle and mussel spatfall success during 1990-99 and previous years: the left-hand graphs show the observed mean spatfall index values (± standard error); the right-hand graphs show the mean spatfall index values (± standard error) expected from statistical models
0
0.2
0.4
0.6
0.8
1
Pre-1990 1990-99
(a) Cockle stock index
0
0.2
0.4
0.6
0.8
1
Pre-1990 1990-99
(b) Mussel stock index
-0.4
0
0.4
0.8
1.2
Pre-1990 1990-99
(c) Winter temperature anomaly
0
1
2
3
Pre-1990 1990-99
(d) Frequency of Lamb type E in June
Meanindexvalue
Meanindexvalue
Meanindexvalue
Meanindexvalue
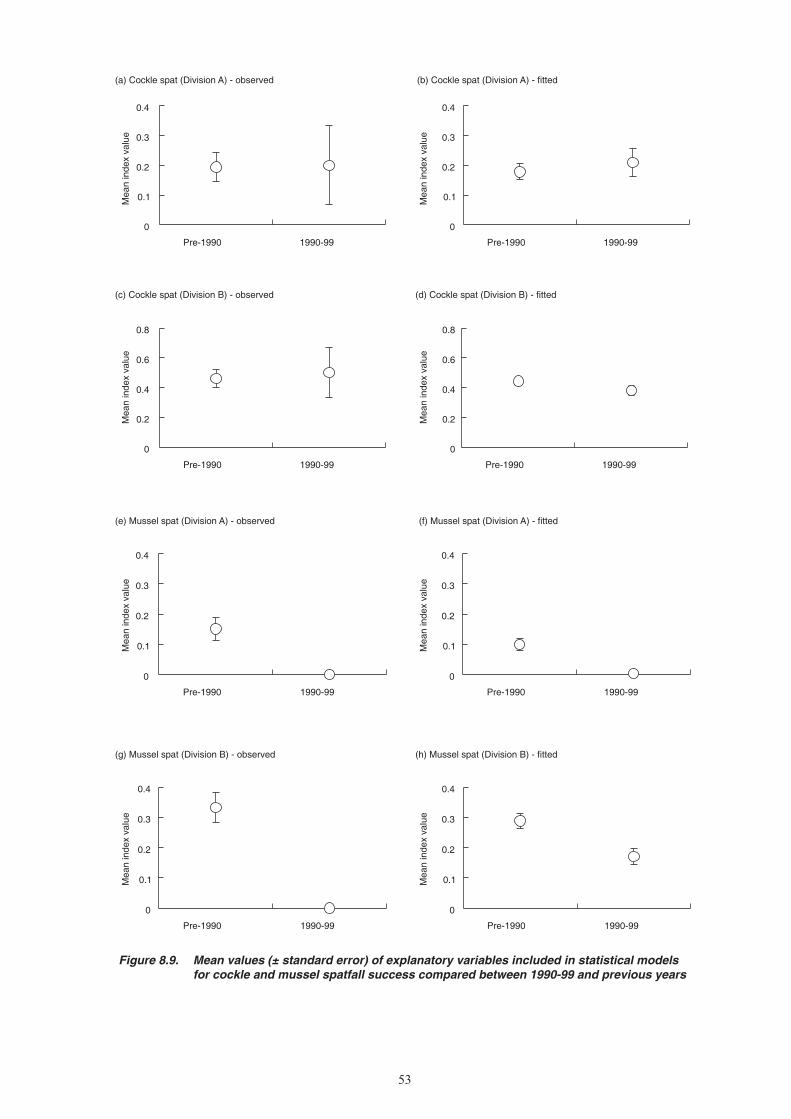
53
0
0.1
0.2
0.3
0.4
Pre-1990 1990-99
(a) Cockle spat (Division A) - observed
0
0.1
0.2
0.3
0.4
Pre-1990 1990-99
(b) Cockle spat (Division A) - fitted
0
0.2
0.4
0.6
0.8
Pre-1990 1990-99
(c) Cockle spat (Division B) - observed
0
0.2
0.4
0.6
0.8
Pre-1990 1990-99
(d) Cockle spat (Division B) - fitted
0
0.1
0.2
0.3
0.4
Pre-1990 1990-99
(e) Mussel spat (Division A) - observed
0
0.1
0.2
0.3
0.4
Pre-1990 1990-99
(f) Mussel spat (Division A) - fitted
0
0.1
0.2
0.3
0.4
Pre-1990 1990-99
(g) Mussel spat (Division B) - observed
0
0.1
0.2
0.3
0.4
Pre-1990 1990-99
(h) Mussel spat (Division B) - fitted
Meanindexvalue
Meanindexvalue
Meanindexvalue
Meanindexvalue
Meanindexvalue
Meanindexvalue
Meanindexvalue
Meanindexvalue
Figure 8.9. Mean values (± standard error) of explanatory variables included in statistical models for cockle and mussel spatfall success compared between 1990-99 and previous years
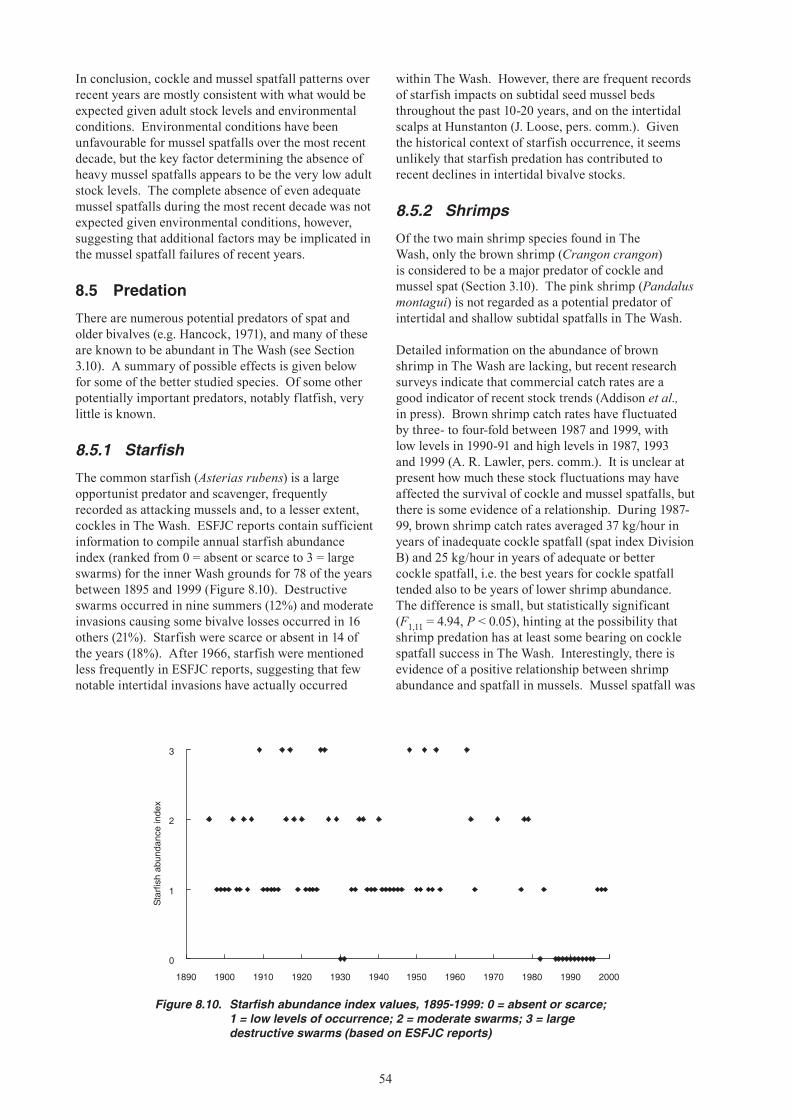
54
In conclusion, cockle and mussel spatfall patterns over recent years are mostly consistent with what would be expected given adult stock levels and environmental conditions. Environmental conditions have been unfavourable for mussel spatfalls over the most recent decade, but the key factor determining the absence of heavy mussel spatfalls appears to be the very low adult stock levels. The complete absence of even adequate mussel spatfalls during the most recent decade was not expected given environmental conditions, however, suggesting that additional factors may be implicated in the mussel spatfall failures of recent years.
8.5 Predation
There are numerous potential predators of spat and older bivalves (e.g. Hancock, 1971), and many of these are known to be abundant in The Wash (see Section 3.10). A summary of possible effects is given below for some of the better studied species. Of some other potentially important predators, notably flatfish, very little is known.
8.5.1 Starfish
The common starfish (Asterias rubens) is a large opportunist predator and scavenger, frequently recorded as attacking mussels and, to a lesser extent, cockles in The Wash. ESFJC reports contain sufficient information to compile annual starfish abundance index (ranked from 0 = absent or scarce to 3 = large swarms) for the inner Wash grounds for 78 of the years between 1895 and 1999 (Figure 8.10). Destructive swarms occurred in nine summers (12%) and moderate invasions causing some bivalve losses occurred in 16 others (21%). Starfish were scarce or absent in 14 of the years (18%). After 1966, starfish were mentioned less frequently in ESFJC reports, suggesting that few notable intertidal invasions have actually occurred
within The Wash. However, there are frequent records of starfish impacts on subtidal seed mussel beds throughout the past 10-20 years, and on the intertidal scalps at Hunstanton (J. Loose, pers. comm.). Given the historical context of starfish occurrence, it seems unlikely that starfish predation has contributed to recent declines in intertidal bivalve stocks.
8.5.2 Shrimps
Of the two main shrimp species found in The Wash, only the brown shrimp (Crangon crangon) is considered to be a major predator of cockle and mussel spat (Section 3.10). The pink shrimp (Pandalus montagui) is not regarded as a potential predator of intertidal and shallow subtidal spatfalls in The Wash.
Detailed information on the abundance of brown shrimp in The Wash are lacking, but recent research surveys indicate that commercial catch rates are a good indicator of recent stock trends (Addison et al., in press). Brown shrimp catch rates have fluctuated by three- to four-fold between 1987 and 1999, with low levels in 1990-91 and high levels in 1987, 1993 and 1999 (A. R. Lawler, pers. comm.). It is unclear at present how much these stock fluctuations may have affected the survival of cockle and mussel spatfalls, but there is some evidence of a relationship. During 1987-99, brown shrimp catch rates averaged 37 kg/hour in years of inadequate cockle spatfall (spat index Division B) and 25 kg/hour in years of adequate or better cockle spatfall, i.e. the best years for cockle spatfall tended also to be years of lower shrimp abundance. The difference is small, but statistically significant (F1,11 = 4.94, P < 0.05), hinting at the possibility that shrimp predation has at least some bearing on cockle spatfall success in The Wash. Interestingly, there is evidence of a positive relationship between shrimp abundance and spatfall in mussels. Mussel spatfall was
0
1
2
3
1890 1900 1910 1920 1930 1940 1950 1960 1970 1980 1990 2000
Starfishabundanceindex
Figure 8.10. Starfish abundance index values, 1895-1999: 0 = absent or scarce; 1 = low levels of occurrence; 2 = moderate swarms; 3 = large destructive swarms (based on ESFJC reports)
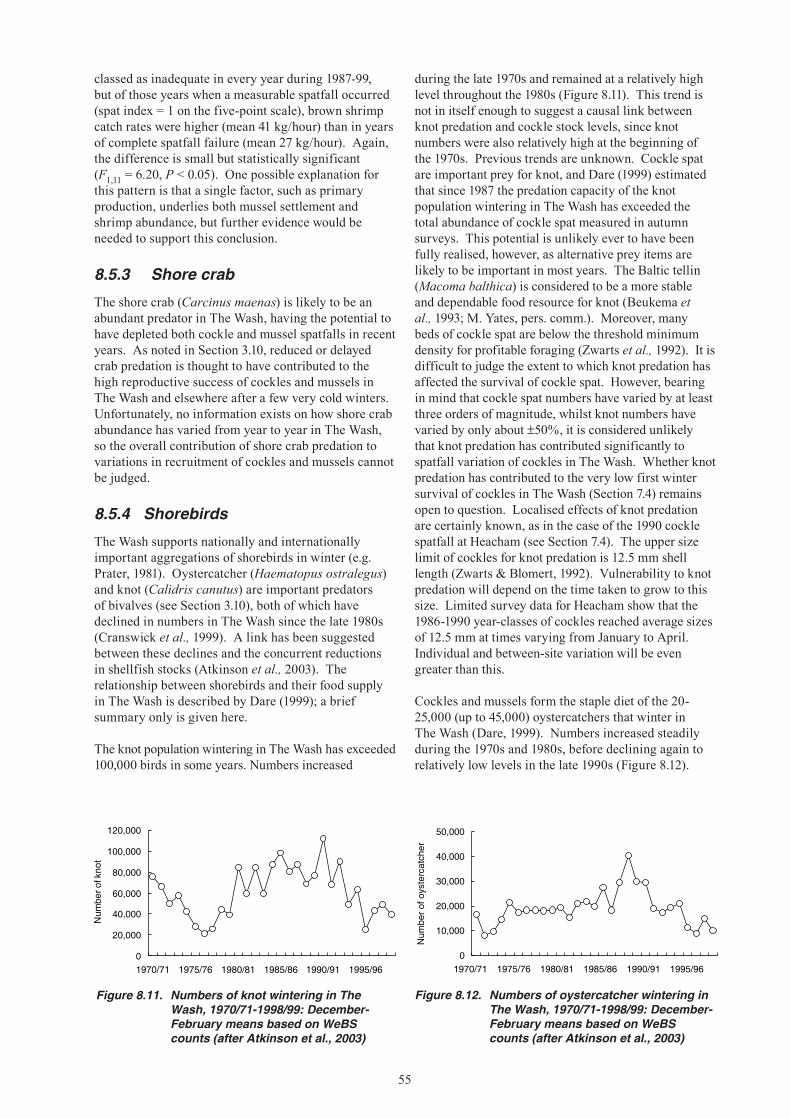
55
classed as inadequate in every year during 1987-99, but of those years when a measurable spatfall occurred (spat index = 1 on the five-point scale), brown shrimp catch rates were higher (mean 41 kg/hour) than in years of complete spatfall failure (mean 27 kg/hour). Again, the difference is small but statistically significant (F1,11 = 6.20, P < 0.05). One possible explanation for this pattern is that a single factor, such as primary production, underlies both mussel settlement and shrimp abundance, but further evidence would be needed to support this conclusion.
8.5.3 Shore crab
The shore crab (Carcinus maenas) is likely to be an abundant predator in The Wash, having the potential to have depleted both cockle and mussel spatfalls in recent years. As noted in Section 3.10, reduced or delayed crab predation is thought to have contributed to the high reproductive success of cockles and mussels in The Wash and elsewhere after a few very cold winters. Unfortunately, no information exists on how shore crab abundance has varied from year to year in The Wash, so the overall contribution of shore crab predation to variations in recruitment of cockles and mussels cannot be judged.
8.5.4 Shorebirds
The Wash supports nationally and internationally important aggregations of shorebirds in winter (e.g. Prater, 1981). Oystercatcher (Haematopus ostralegus) and knot (Calidris canutus) are important predators of bivalves (see Section 3.10), both of which have declined in numbers in The Wash since the late 1980s (Cranswick et al., 1999). A link has been suggested between these declines and the concurrent reductions in shellfish stocks (Atkinson et al., 2003). The relationship between shorebirds and their food supply in The Wash is described by Dare (1999); a brief summary only is given here.
The knot population wintering in The Wash has exceeded 100,000 birds in some years. Numbers increased
during the late 1970s and remained at a relatively high level throughout the 1980s (Figure 8.11). This trend is not in itself enough to suggest a causal link between knot predation and cockle stock levels, since knot numbers were also relatively high at the beginning of the 1970s. Previous trends are unknown. Cockle spat are important prey for knot, and Dare (1999) estimated that since 1987 the predation capacity of the knot population wintering in The Wash has exceeded the total abundance of cockle spat measured in autumn surveys. This potential is unlikely ever to have been fully realised, however, as alternative prey items are likely to be important in most years. The Baltic tellin (Macoma balthica) is considered to be a more stable and dependable food resource for knot (Beukema et al., 1993; M. Yates, pers. comm.). Moreover, many beds of cockle spat are below the threshold minimum density for profitable foraging (Zwarts et al., 1992). It is difficult to judge the extent to which knot predation has affected the survival of cockle spat. However, bearing in mind that cockle spat numbers have varied by at least three orders of magnitude, whilst knot numbers have varied by only about ±50%, it is considered unlikely that knot predation has contributed significantly to spatfall variation of cockles in The Wash. Whether knot predation has contributed to the very low first winter survival of cockles in The Wash (Section 7.4) remains open to question. Localised effects of knot predation are certainly known, as in the case of the 1990 cockle spatfall at Heacham (see Section 7.4). The upper size limit of cockles for knot predation is 12.5 mm shell length (Zwarts & Blomert, 1992). Vulnerability to knot predation will depend on the time taken to grow to this size. Limited survey data for Heacham show that the 1986-1990 year-classes of cockles reached average sizes of 12.5 mm at times varying from January to April. Individual and between-site variation will be even greater than this.
Cockles and mussels form the staple diet of the 20-25,000 (up to 45,000) oystercatchers that winter in The Wash (Dare, 1999). Numbers increased steadily during the 1970s and 1980s, before declining again to relatively low levels in the late 1990s (Figure 8.12).
0
10,000
20,000
30,000
40,000
50,000
1970/71 1975/76 1980/81 1985/86 1990/91 1995/96
Num
berofoystercatcher
Figure 8.12. Numbers of oystercatcher wintering in The Wash, 1970/71-1998/99: December-February means based on WeBS counts (after Atkinson et al., 2003)
0
20,000
40,000
60,000
80,000
100,000
120,000
1970/71 1975/76 1980/81 1985/86 1990/91 1995/96
Num
berofknot
Figure 8.11. Numbers of knot wintering in The Wash, 1970/71-1998/99: December-February means based on WeBS counts (after Atkinson et al., 2003)
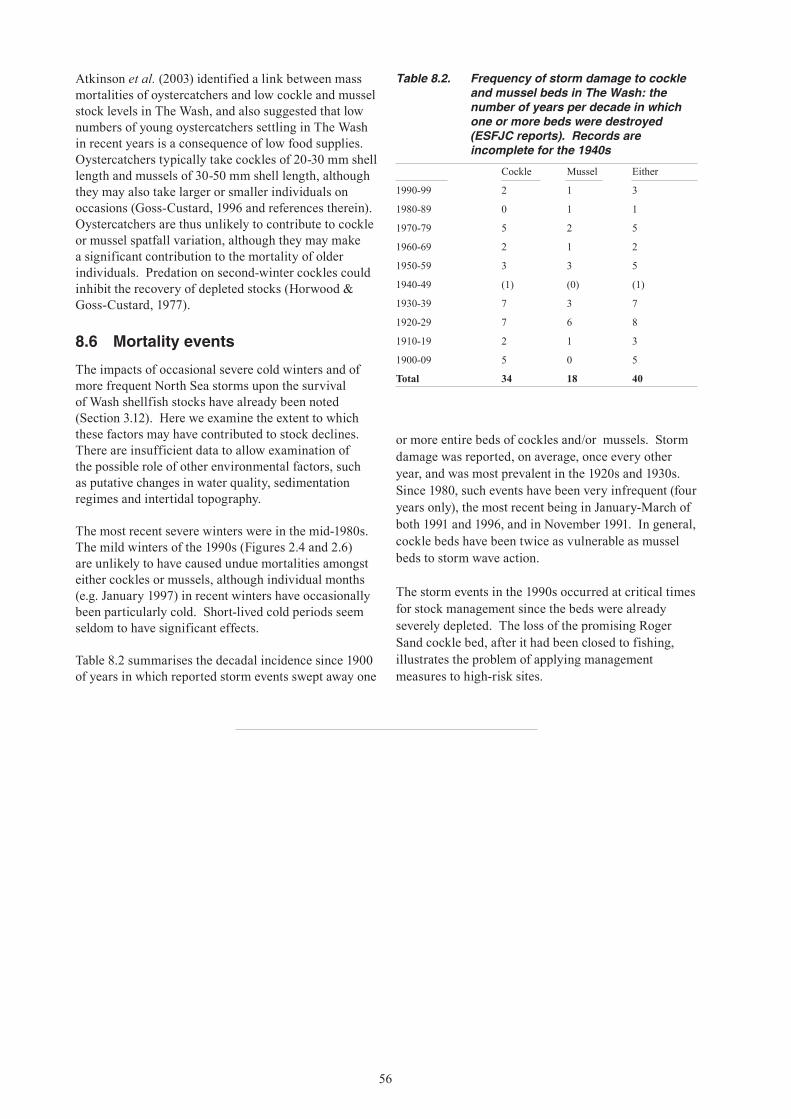
56
Table 8.2. Frequency of storm damage to cockle and mussel beds in The Wash: the number of years per decade in which one or more beds were destroyed (ESFJC reports). Records are incomplete for the 1940s
Cockle Mussel Either
1990-99 2 1 3
1980-89 0 1 1
1970-79 5 2 5
1960-69 2 1 2
1950-59 3 3 5
1940-49 (1) (0) (1)
1930-39 7 3 7
1920-29 7 6 8
1910-19 2 1 3
1900-09 5 0 5
Total 34 18 40
Atkinson et al. (2003) identified a link between mass mortalities of oystercatchers and low cockle and mussel stock levels in The Wash, and also suggested that low numbers of young oystercatchers settling in The Wash in recent years is a consequence of low food supplies. Oystercatchers typically take cockles of 20-30 mm shell length and mussels of 30-50 mm shell length, although they may also take larger or smaller individuals on occasions (Goss-Custard, 1996 and references therein). Oystercatchers are thus unlikely to contribute to cockle or mussel spatfall variation, although they may make a significant contribution to the mortality of older individuals. Predation on second-winter cockles could inhibit the recovery of depleted stocks (Horwood & Goss-Custard, 1977).
8.6 Mortality events
The impacts of occasional severe cold winters and of more frequent North Sea storms upon the survival of Wash shellfish stocks have already been noted (Section 3.12). Here we examine the extent to which these factors may have contributed to stock declines. There are insufficient data to allow examination of the possible role of other environmental factors, such as putative changes in water quality, sedimentation regimes and intertidal topography.
The most recent severe winters were in the mid-1980s. The mild winters of the 1990s (Figures 2.4 and 2.6) are unlikely to have caused undue mortalities amongst either cockles or mussels, although individual months (e.g. January 1997) in recent winters have occasionally been particularly cold. Short-lived cold periods seem seldom to have significant effects.
Table 8.2 summarises the decadal incidence since 1900 of years in which reported storm events swept away one
or more entire beds of cockles and/or mussels. Storm damage was reported, on average, once every other year, and was most prevalent in the 1920s and 1930s. Since 1980, such events have been very infrequent (four years only), the most recent being in January-March of both 1991 and 1996, and in November 1991. In general, cockle beds have been twice as vulnerable as mussel beds to storm wave action.
The storm events in the 1990s occurred at critical times for stock management since the beds were already severely depleted. The loss of the promising Roger Sand cockle bed, after it had been closed to fishing, illustrates the problem of applying management measures to high-risk sites.
57
9. IMPACTS OF MECHANISED HARVESTING
By definition, harvesting removes animals from the target population. Allowable harvest levels for UK cockle fisheries are commonly set at around 30% of the total fishable stock biomass – a rule-of-thumb for management, based on observations of apparently sustainable hand gathering of cockles in the Burry Inlet. There is some evidence that, in the Burry Inlet at least, fishing mortality of this order may to some extent be offset by reductions in mortality from other (unknown) sources (Bell et al., 2001). Whether similar compensatory mechanisms apply to mortality of cockles in other sites, such as The Wash, has not yet been tested rigorously.
Leaving aside the direct fishing mortality inflicted by removing animals from the population, it is at least as important to understand the indirect effects of fishing operations on the target organism. This can include both additional mortality of animals that do not form part of the retained catch, and longer term effects through habitat modifications that might affect settlement and survival. These are likely to be particularly important for mechanised fisheries, being more complex and intense than artisanal operations. Since 1986, Wash cockle fishermen have used suction dredges to harvest the beds, and various rotary riddles and screens to sort catches on deck and reject undersized shellfish and debris. Mussel dredges were introduced in about 1960, but mechanised sorting methods were introduced somewhat later. Prior to the advent of hydraulic suction dredging in 1986, the catch of cockles from hand-raking and from ‘blowing’ was sieved manually in situ, and the discards returned to their bed of origin. Despite ESFJC regulations, in situ sorting of mussels has not always been practised, notably during the period of bulk mussel exports to France in the late 1970s (Section 4.2).
The use of mechanised harvesting systems, particularly if operating standards vary, raises questions about whether they could:
(a) inhibit cockle and mussel spatfalls by altering settlement substrates;
(b) kill or disturb previously settled spat or juvenile stock;
(c) reduce the survival of discarded animals returned to the seabed;
(d) cause significant additional indirect fishing mortality along the dredge tracks; or
(e) damage the physical structure of mussel beds.
Information on these issues is somewhat fragmentary. For cockles, short-term field and experimental studies of the effects of mechanised harvesting have been reviewed by Rees (1996). None of these studies was carried out in The Wash, although there are some relevant data and anecdotal observations exist (ESFJC, pers. comm.).
9.1 Effects of dredging on settlement and survival of cockles
Hydraulic suction dredging for cockles in The Wash proceeds in a semi-random manner within a targeted area. Dredge tracks are approximately 5 cm deep and 60 cm wide, and weave and intersect in an irregular pattern. Even on an intensively worked area, not all the sediment surface is disturbed. On sand flats exposed to tidal forces or wave action, as in The Wash and the Thames Estuary, visible tracks persist for only a few days or weeks according to tidal and wave conditions and the stability of the sediment surface at the time of dredging (Rees, 1996). Hydraulic dredges that are set up and operated properly probably cause less physical disturbance to sediments than the ‘blowing’ method formerly used in The Wash (Franklin & Pickett, 1978). ‘Blowing’ can remove sand to depths of 12 cm or more, exposing the black anoxic (and toxic) layer beneath. The concentric rings of disturbed sediment created by blowing used to remain visible at ground level for 2-8 months, but from the air they were detectable for more than a year at some locations (Franklin & Pickett, 1978).
In The Wash, cockle spatfalls do occur on sands that have been regularly dredged for 10 years or more, and several substantial settlements have been recorded on previously dredged sands. On the Thames cockle grounds, where hydraulic dredges have operated for at least 30 years without obvious effects on the distribution or abundance of spat, field experiments were made in 1969-71 to assess the effect of dredging on subsequent spatfalls and their survival (Franklin & Pickett, 1978). Spatfall levels in experimentally dredged areas were similar to those in adjacent unfished areas, irrespective of whether the dredging was carried out in the autumn or spring before settlement. This result was taken to indicate rapid recovery of dredged grounds once fishing had ceased, and it was predicted that long-term recruitment to the cockle fishery should not be affected by hydraulic suction dredging. This prediction appears to be born out by the subsequent regularity of spatfall on the Thames Estuary cockle grounds.
This result applies, however, to settlement rather than survival of cockle spat. In a second set of experiments, Franklin & Pickett (1978) compared cockle spat densities and survival between commercially fished areas in the Thames Estuary and adjacent unfished areas. In contrast to the experimental dredging, the commercial dredging continued throughout the year rather than being a one-off operation. Compared with the unfished areas, numbers of spat surviving to the October following settlement in fished areas were reduced by 50% when fishing was at a ‘moderate’ level, and by 75% when fishing was more intense. Dredging therefore caused significant additional cockle spat mortality. For second year cockles, approaching minimum commercial size, mortality was similarly higher in the commercially dredged areas, resulting in a considerable loss of recruits
58
about to enter the fishery. Compared with the unfished populations, the number of survivors was reduced by 50% when fishing was moderate, and by 80% when fishing was more intense. Franklin & Pickett (1978) suggested that the increased mortality might be due to a combination of accumulated stress from repeated fishing over resettled cockles and the dredge rejection process itself. In laboratory experiments, the condition of cockles was compared between individuals taken in hydraulic dredges and individuals gathered by careful hand raking. The mechanically dredged cockles showed much lower rates of siphon extrusion on re-immersion in sea water (a measure of recovery), much lower water pumping rates and a 40% reduction in survival over 10 days. Low mortality in another mechanically fished sample, taken by ‘blowing’ rather than suction dredging, was taken to indicate that the most important stress factor was buffeting in the delivery pipe of hydraulic dredges.
The extent to which the results of the 1970s experiments in the Thames Estuary can be applied to present day suction dredging for cockles in The Wash is uncertain. Rees (1996) pointed out that much of the damage to cockles in early suction dredges may have been due to the high velocities with which cockles struck the Venturi jet and bends in the lift pipes. The application of the Venturi principle to generate the suction flow has now largely been superseded by the use of rotary solids handling pumps to lift cockles through the actual pump (Rees, 1996). Such advances in dredge and pump technology have resulted in a system that is thought to be much less damaging to cockles. Damage rates recorded in catches of cockles taken by solids handling pump delivery dredges (Cook, 1991) are lower than those recorded for the early Venturi lift dredges (Pickett, 1973). This could imply reduced mortality of undersized cockles, but there are no quantitative data to confirm this inference.
Even in modern hydraulic dredging gear, some level of damage and shock is likely among mechanically sorted and discarded cockles. Coffen-Smout (1995) (cited in Rees, 1996) subjected cockles to repeated impacts to simulate knocks incurred during commercial fishing operations. The re-burying response was significantly delayed after this treatment. In the field, this could lead to increased predation of discards and to ‘shocked’ cockles being rolled into unfavourable locations by tides and wave action. In addition to mortality of discards, dredging may also cause in situ damage to cockles in the dredge track. Based on limited data, Rees (1996) suggested that this mortality may be equivalent to 10-15% of the retained catch.
In The Wash, known areas of significant spatfall nowadays are usually closed to fishing disturbance. However, there remains the possibility that settlements could be affected before they have grown to a detectable size. Samples taken at Heacham in August 1986, in an area where hydraulic dredging was already underway, showed substantial stocks of fishable
cockles, as well as spat at a mean density of 2,825/m2 (CEFAS/ESFJC, unpublished data). Survival of spat from August to the following spring appeared to be relatively good (22%), despite quite intensive fishing by four vessels. In the following summer, a small spatfall (290/m2 in August) settled on the same ground. These results suggest that adequate settlement and survival of cockle spat are at least possible in dredged areas. No comparative data from unfished areas are available, however, to indicate what spatfall and survival might have been in the absence of dredging.
Piersma et al. (2001) presented evidence for long-term indirect effects of suction dredging for cockles in the Dutch Wadden Sea. Suction dredging close to the island of Griend in 1988 was followed by a loss of fine sediments. Sediment characteristics did not return to the pre-dredged state until eight years later. Reduced abundance of cockles (and other bivalves) coincided with the loss of silts. By drawing on comparisons with other fished and unfished areas in the Dutch Wadden Sea, Piersma et al. (2001) inferred that suction dredging caused long-lasting negative effects on recruitment of cockles and other bivalves to sandy areas. These effects appeared to result from the slowness with which fine sediments favourable to bivalve settlement re-accumulated. The conclusion that suction dredging can have long-term impacts on bivalve populations conflicts with the earlier finding of Franklin & Pickett (1978) that cockle grounds in the Thames Estuary recovered quickly after experimental dredging ceased (see above), and is also at variance with previous studies in the Wadden Sea (de Vlas, 1987). It is possible that long-term impacts differ according to sediment types, but the extent to which conclusions about long-term dredge impacts, or lack of them, can be generalised remains open to question. Regarding the effects of suction dredging on sediments in the Wadden Sea, Duiker et al. (1998) (cited in Ens et al., 2000) concluded from a literature review that there is still insufficient scientific evidence to draw firm conclusions. Current scientific investigations by Dutch scientists (the EVA II programme), aimed at underpinning an evaluation of Dutch shellfish management policy, may shed some light on this issue (Ens et al., 2000). The regularity of cockle spatfalls in the Thames Estuary, and the fact that recent cockle spatfall patterns in The Wash do not differ significantly from previous decades (Section 7.1), suggest that, at least at these sites, suction dredging has not had long-term negative effects on cockle spat settlement.
9.2 Effects of dredging on settlement and survival of mussels
Dredged mussel beds in The Wash continued to receive spatfalls until the late 1980s. In the early 1990s, however, the rapid decline of mussel stocks led to unusually intensive fishing on the few remaining beds, such as on the Gat, but it is not yet known for certain whether this has contributed to the absence of mussel spatfall in recent years.
59
Studies of mussels in the Exe Estuary indicate that ‘micro-niches’ between the adults serve to retain settled spat and assist their survival (Section 3.8). If this is universally true, then dredging for mussels could adversely affect settlement and survival of spat by reducing the areas of adult beds and breaking down the physical structure of the mussel hummocks in the remaining area.
In addition to direct physical impacts of dredges on the mussel beds themselves, mussel dredging also causes re-suspension of fine sediments. Studies in Denmark showed that about 1.5 kg dry weight of mud/m2 were temporarily re-suspended by mussel dredging (Rieman & Hoffman, 1991). Most of this was re-deposited in the first 30 minutes, however, and turbidity returned to background levels after one hour. It is significant to note that settling mussel require clean, i.e. not silty, surfaces for attachment (Dare, 1976; McGrorty et al., 1990). The effects on already settled spat are not known. Larger mussels (seed and adults) can cope with excessive silt disturbance, and can eliminate sand entering the mantle cavity (de Vooys, 1987). Comparable studies with spat have not been undertaken.
The Wash mussel fishing season (September-March) and relaying period (April-June) have both finished before mussel spat start settling in June-August. Although settlement occurs mostly during the closed season, the resumption of fishing in autumn could, unless regulated, adversely affect any spatfall which has occurred. Studies of mortality due to dredging have not been made for mussels, but research on the damage to mussels caused by rotary sorting and handling operations suggests that stress mortality is likely to occur. Studies of sorted and mechanically handled mussels in North Wales show that physical impacts caused significant mechanical soft tissue damage leading to delayed mortality after discards have been returned to the seabed (Dare, 1974; 1977). Subtidal mussels were more susceptible than intertidal mussels. Although these tests were made with larger (≥50 mm) mussels, similar effects for small mussels would be expected, and could be exacerbated where, as in The Wash, undersized mussels are repeatedly captured, riddled and discarded.
9.3 Summary and conclusions about dredging impacts
Is mechanised harvesting of cockles and mussels in The Wash a cause of recent stock declines? The evidence presented in this section does not allow a conclusive answer to this question. Different studies have reached conflicting conclusions, particularly with respect to hydraulic suction dredging for cockles. At present, mechanised harvesting of bivalves in The Wash cannot
unequivocally be blamed for recent low stock levels, but neither can it wholly be absolved.
As mentioned several times already in this section, the Thames Estuary cockle fishery has sustained hydraulic suction dredging for over 30 years. It should also be pointed out, however, that up until the late 1980s, Thames cockle landings were relatively low. Franklin & Pickett (1978) found no impact of one-off dredging events on subsequent cockle spatfall in the Thames Estuary. On the other hand, Piersma et al., (2001) concluded that dredging events have long-term negative effects on cockle spatfall in the Wadden Sea. In The Wash, low first-year survival of cockles (Section 7.4) appears to be more of a problem for the stock than initial spatfall levels (Section 7.1). Is this a consequence of dredging? In the absence of ‘before’ data or comparisons with unfished areas, it is impossible to say. Franklin & Pickett (1978) found that repeated dredging in the Thames Estuary caused low survival of young cockles, but this finding cannot automatically be applied to modern hydraulic dredging operations, which may well be less damaging than Thames cockle fishing in the early 1970s. Cockle dredging will certainly cause some degree of indirect fishing mortality. As Rees (1996) pointed out, this additional mortality should be included in any consideration of appropriate harvest levels for a fishery.
Less information is available on dredge impacts on mussels than on cockles. Indirect fishing mortality appears to be less important than in cockles, but the available information hints at the importance of settlement processes. In particular, the role of adult mussel beds in promoting settlement is highlighted. Dredging per se appears not to inhibit settlement, as evidenced by spatfall onto dredged beds in The Wash up until the late 1980s. If, however, dredging reduces bed area and breaks up the physical structure within the remaining beds, then recovery or re-establishment of mussel beds becomes much more difficult. Thrush et al. (1996), studying dynamic sandflat habitats in New Zealand, concluded that recovery from disturbance may be very slow when there has been removal of organisms with a role in maintaining habitat stability, particularly in dynamic soft sediment environments. Establishment of new mussel beds in The Wash is a very rare event (Section 3.1)
There is an urgent need for further research on the potential impacts of mechanised dredging on cockle and mussel stocks. In part, this may be fulfilled by the Dutch EVA II research initiative (Ens et al., 2000). Current research on mussel recruitment processes in The Wash may also shed some light on this matter. However, it is also clear that there is a need for site-specific studies involving current gear technology deployed according to current commercial fishing practices.
60
10. OVERVIEW AND CONCLUSIONS
The sustained low levels of cockle and mussel stocks in The Wash since 1986 have not been observed in other areas of the UK, despite the large interannual variations in recruitment and abundance that they experience. However, there have been stock collapses in the Dutch Wadden Sea which have led to fishery problems in the early 1990s, alongside dramatic effects on bird populations and on associated macrobenthos (Beukema, 1993; Beukema et al., 1996). In this case the collapses were associated with a succession of unusually warm winters together with gross overfishing (Beukema, 1993). However, the Wadden Sea stocks have proved to be more resilient than those in The Wash, producing several large spatfalls and recruitments that have allowed stocks to recover in the most recent years.
Why, then, has this recovery not happened in The Wash? The nature of the declines seems fairly clear – stocks have been depleted by fishing and other sources of mortality but they have not been replenished, either because spatfalls have been low or non-existent (mussels) or because the spat settlements have failed to recruit to the fishable stock (cockles). The following two sections draw together some conclusions and hypotheses about how this state of affairs has arisen in each species.
10.1 Conclusions about mussels
Mussel spatfall and recruitment to the adult stock are innately variable in The Wash. A combination of intensive exploitation and natural irregularity of spatfall means that periods of mussel stock depletion are inevitable. Normally, these periods are followed by a recovery when the next heavy spatfall occurs. In recent years recovery seems to have been seriously compromised by poor conditions for spat settlement. This was due to a lack of adult stock combined, possibly, with physical degradation of the beds. The effects of successive warm winters on reproductive output could also have limited the capacity for stock recovery.
Although the effects of winter temperature on larvae production and, to a lesser extent, wind conditions affecting retention of larvae have been identified as factors influencing the spatfall success of mussels in The Wash (Section 8.4.3), the recent spatfall failures do not appear to have been caused by an absence of larvae in the system. The recent occurrence of large subtidal
mussel settlements in The Wash suggests that larvae are present in sufficient numbers for significant settlement and that water quality is unlikely to be a significant factor in inhibiting settlements on intertidal areas. Are these larvae generated in The Wash? Do they settle preferentially in the subtidal zone, or are there intertidal settlements that do not survive long enough to be detected? These questions have still to be addressed in full, but current research by students at the Institute of Estuarine and Coastal Studies, University of Hull (‘The Wash Mussel Restoration Project’5) should shed some light on these and related issues. A scoping study in The Wash by Stirling Aquaculture (2000) has recently confirmed the presence of abundant larvae in the water column, so the obvious question is: why have these larvae not settled successfully in intertidal areas?
The importance of the adult stock in promoting mussel settlement has been highlighted at several points in this report (Sections 3.8, 8.4 and 9.2). It seems clear that the reduction in area of adults beds and, perhaps, physical degradation of the remaining beds has prevented the replenishment of depleted stocks. The statistical modelling described in Section 8.4.3 showed that a heavy mussel spatfall cannot be expected at current low adult stock levels, except under a highly unlikely combination of cold winters and wind conditions favouring retention of larvae in The Wash. Such favourable conditions have been increasingly rare over recent years, but this should not distract attention from the fact that the key factor behind the lack of intertidal settlement appears to be the paucity of established mussel beds on which to settle.
To what extent is mussel dredging implicated as a cause of low adult stock levels? The link between fishing and recruitment failure cannot absolutely be proven and it is certainly true that dredging per se does not necessarily inhibit settlement, since significant spatfalls have occurred on dredged beds in The Wash up to the late 1980s (Section 9.2). Moreover, fishing is not the only source of mussel mortality – predators such as starfish and oystercatchers may, on occasion, make significant inroads into stocks (Sections 3.10 and 8.5) and losses to storms can also occur (Sections 3.12 and 8.6). However, the co-incidence of a rapid mussel stock decline with exploitation rates in excess of 50% in the late 1980s and early 1990s (Section 5.3.1), coupled with a decrease in MLS in 1982, suggests that, at best, recent mussel fishing activities have not been beneficial. This is not to suggest that fishing is solely to blame for spatfall failure, merely that fishing has contributed to a negative feedback process that has produced low stock levels from which recovery is difficult (Figure 10.1).
5 A project arising out of the Wash Forum, co-funded by CEFAS, Ecomaris Ltd, EN, EA, ESFJC and John Lake Shellfish.
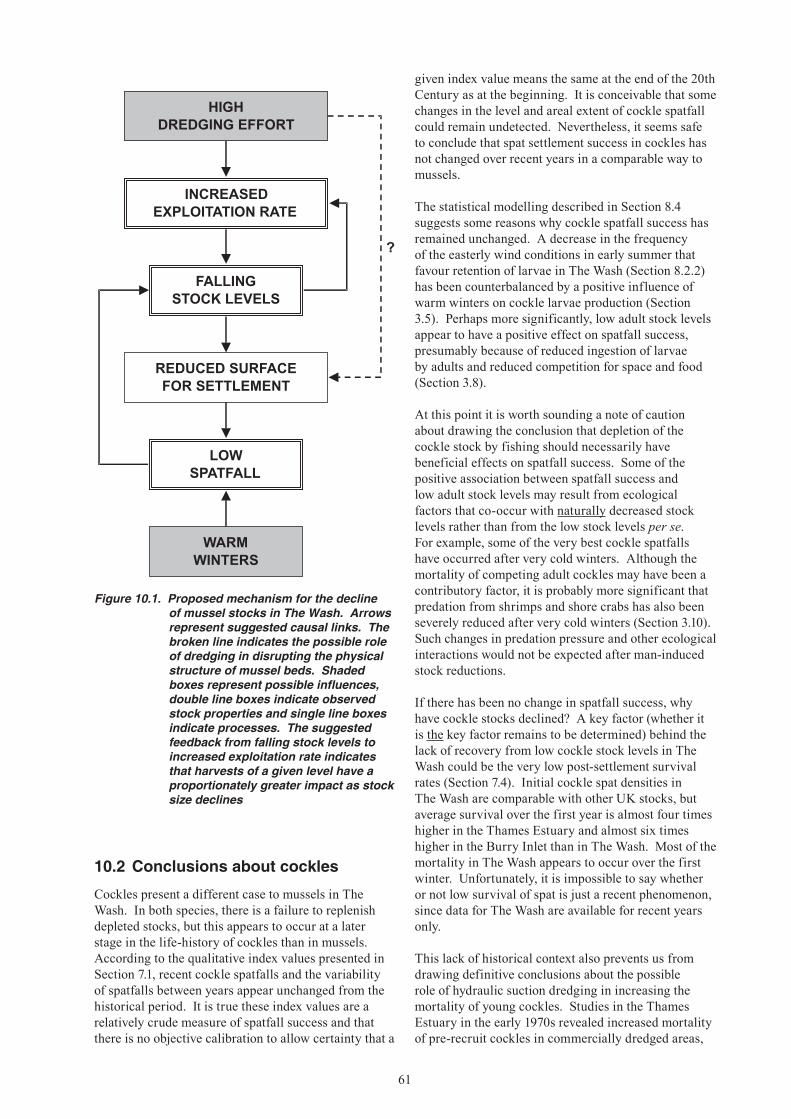
61
FALLINGSTOCK LEVELS
REDUCED SURFACEFOR SETTLEMENT
LOWSPATFALL
INCREASEDEXPLOITATION RATE
WARMWINTERS
HIGHDREDGING EFFORT
?
Figure 10.1. Proposed mechanism for the decline of mussel stocks in The Wash. Arrows represent suggested causal links. The broken line indicates the possible role of dredging in disrupting the physical structure of mussel beds. Shaded boxes represent possible influences, double line boxes indicate observed stock properties and single line boxes indicate processes. The suggested feedback from falling stock levels to increased exploitation rate indicates that harvests of a given level have a proportionately greater impact as stock size declines
given index value means the same at the end of the 20th Century as at the beginning. It is conceivable that some changes in the level and areal extent of cockle spatfall could remain undetected. Nevertheless, it seems safe to conclude that spat settlement success in cockles has not changed over recent years in a comparable way to mussels.
The statistical modelling described in Section 8.4 suggests some reasons why cockle spatfall success has remained unchanged. A decrease in the frequency of the easterly wind conditions in early summer that favour retention of larvae in The Wash (Section 8.2.2) has been counterbalanced by a positive influence of warm winters on cockle larvae production (Section 3.5). Perhaps more significantly, low adult stock levels appear to have a positive effect on spatfall success, presumably because of reduced ingestion of larvae by adults and reduced competition for space and food (Section 3.8).
At this point it is worth sounding a note of caution about drawing the conclusion that depletion of the cockle stock by fishing should necessarily have beneficial effects on spatfall success. Some of the positive association between spatfall success and low adult stock levels may result from ecological factors that co-occur with naturally decreased stock levels rather than from the low stock levels per se. For example, some of the very best cockle spatfalls have occurred after very cold winters. Although the mortality of competing adult cockles may have been a contributory factor, it is probably more significant that predation from shrimps and shore crabs has also been severely reduced after very cold winters (Section 3.10). Such changes in predation pressure and other ecological interactions would not be expected after man-induced stock reductions.
If there has been no change in spatfall success, why have cockle stocks declined? A key factor (whether it is the key factor remains to be determined) behind the lack of recovery from low cockle stock levels in The Wash could be the very low post-settlement survival rates (Section 7.4). Initial cockle spat densities in The Wash are comparable with other UK stocks, but average survival over the first year is almost four times higher in the Thames Estuary and almost six times higher in the Burry Inlet than in The Wash. Most of the mortality in The Wash appears to occur over the first winter. Unfortunately, it is impossible to say whether or not low survival of spat is just a recent phenomenon, since data for The Wash are available for recent years only.
This lack of historical context also prevents us from drawing definitive conclusions about the possible role of hydraulic suction dredging in increasing the mortality of young cockles. Studies in the Thames Estuary in the early 1970s revealed increased mortality of pre-recruit cockles in commercially dredged areas,
10.2 Conclusions about cockles
Cockles present a different case to mussels in The Wash. In both species, there is a failure to replenish depleted stocks, but this appears to occur at a later stage in the life-history of cockles than in mussels. According to the qualitative index values presented in Section 7.1, recent cockle spatfalls and the variability of spatfalls between years appear unchanged from the historical period. It is true these index values are a relatively crude measure of spatfall success and that there is no objective calibration to allow certainty that a
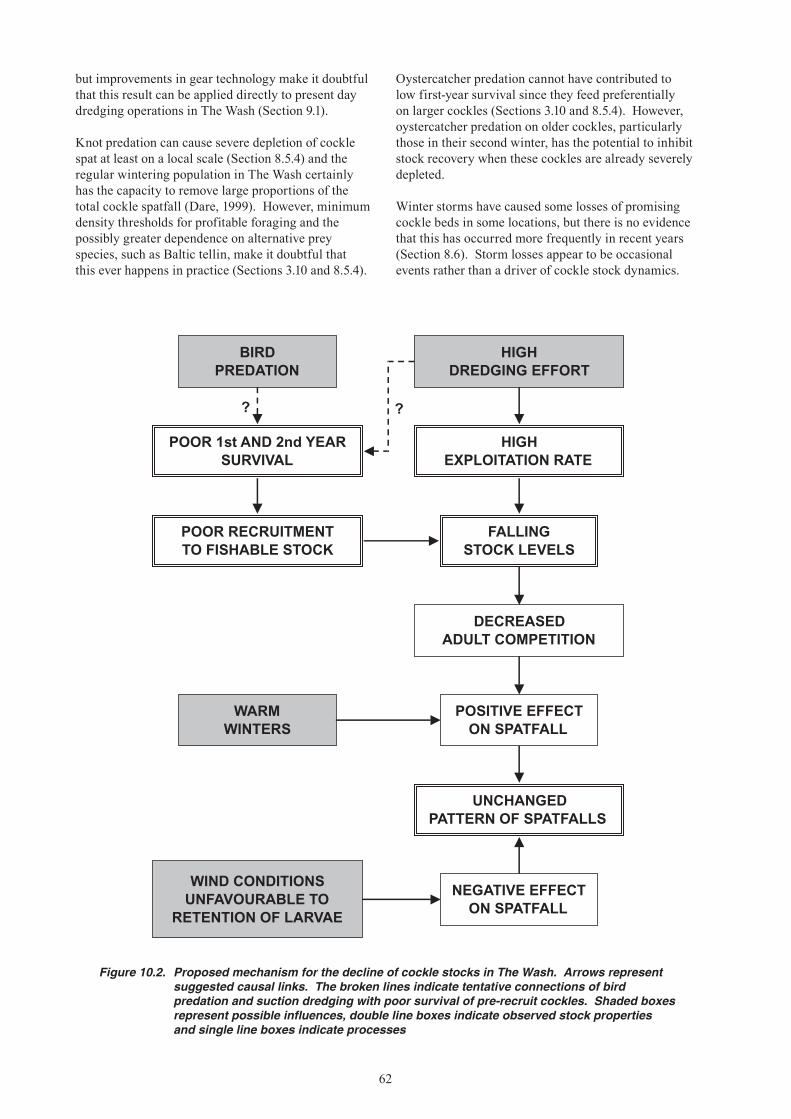
62
FALLINGSTOCK LEVELS
DECREASEDADULT COMPETITION
UNCHANGEDPATTERN OF SPATFALLS
POSITIVE EFFECTON SPATFALL
NEGATIVE EFFECTON SPATFALL
WIND CONDITIONSUNFAVOURABLE TO
RETENTION OF LARVAE
WARMWINTERS
HIGHEXPLOITATION RATE
POOR 1st AND 2nd YEARSURVIVAL
POOR RECRUITMENTTO FISHABLE STOCK
BIRDPREDATION
HIGHDREDGING EFFORT
??
Figure 10.2. Proposed mechanism for the decline of cockle stocks in The Wash. Arrows represent suggested causal links. The broken lines indicate tentative connections of bird predation and suction dredging with poor survival of pre-recruit cockles. Shaded boxes represent possible influences, double line boxes indicate observed stock properties and single line boxes indicate processes
but improvements in gear technology make it doubtful that this result can be applied directly to present day dredging operations in The Wash (Section 9.1).
Knot predation can cause severe depletion of cockle spat at least on a local scale (Section 8.5.4) and the regular wintering population in The Wash certainly has the capacity to remove large proportions of the total cockle spatfall (Dare, 1999). However, minimum density thresholds for profitable foraging and the possibly greater dependence on alternative prey species, such as Baltic tellin, make it doubtful that this ever happens in practice (Sections 3.10 and 8.5.4).
Oystercatcher predation cannot have contributed to low first-year survival since they feed preferentially on larger cockles (Sections 3.10 and 8.5.4). However, oystercatcher predation on older cockles, particularly those in their second winter, has the potential to inhibit stock recovery when these cockles are already severely depleted.
Winter storms have caused some losses of promising cockle beds in some locations, but there is no evidence that this has occurred more frequently in recent years (Section 8.6). Storm losses appear to be occasional events rather than a driver of cockle stock dynamics.
63
Thus far we have a picture of a cockle population in The Wash that generates adequate spatfalls, but which nevertheless suffers from poor recruitment to the fishable stock (Figure 10.2). It might seem obvious that low recruitment would be a cause of stock decline, but recruitment is only one of the factors that determine stock trends. Stock size will change if inputs (recruitment) are not exactly balanced by outputs (mortality). Recent recruitment has been low, but we cannot be certain that this represents a change from what occurred previously. On the other hand, we do know that there has been an increase in the mortality inflicted by fishing. High exploitation rates are inferred during the 1990s (Section 5.3.2), although specific values are not reliably calculable owing to problems with stock biomass estimation (Section 5.3.2). Exploitation rates were certainly higher than those measured over the same period both in the artisanal and apparently sustainable Burry Inlet fishery and in
the Thames Estuary suction dredge fishery. The Wash fishery, it should be noted, was also often exploiting cockles down to much lower densities (10-20 fishable cockles/m2) than in the other two areas.
Recruitment and fishing mortality are inextricably linked. Depletion of a stock to the point when each year’s fishery is dependent on a single recruiting year-class has strong implications for the level and stability of stocks and fishery yields. Clearly, it will be crucial to improve our understanding of the factors underlying the high mortality of cockles before recruitment to the fishery in The Wash in comparison with the Burry Inlet and Thames Estuary. Is suction dredging a contributory factor, or has there been a change in The Wash ecosystem that has caused increased natural mortality? Or else is high mortality before recruitment to the fishery simply a fact of life for Wash cockles, making them particularly vulnerable to depletion by fishing?
64
11. DIRECTIONS FOR FUTURE SCIENTIFIC WORK UNDERPINNING FISHERY MANAGEMENT
The foregoing sections have identified a lack of information in several important areas. In some instances, this lack is irremediable since we cannot travel back in time to make measurements of the past environment and ecology of The Wash. Thus, for example, unless fresh information sources come to light, we will never know whether cockle spat survival was higher in the 1970s and earlier than in recent years. In other cases, however, new research in The Wash and elsewhere could improve our understanding of the factors regulating bivalve stocks in The Wash and be used to inform fishery management and, indeed, site management within the context of The Wash cSAC. This section highlights some important issues for the future, setting out some possible directions for scientific studies that will underpin fishery management.
11.1 Stock identity
If cockle and mussel stocks in The Wash are effectively discrete populations this has major implications for their conservation and fisheries management. To resolve this question, more evidence is required from studies of coastal water movements and wind-forcing influences upon drift and dispersal of larvae, as well as from studies of genetic structure using such new tools as microsatellite markers (Wright & Bentzen, 1994). In the meantime, limited hydrographic and biogeographic information suggests that Wash mussel and cockle populations are most likely to be self-maintaining stocks, and should be managed on the assumption that significant recruitment from elsewhere will rarely, if ever, occur. Previous attempts to demonstrate that isolated cockle populations (including The Wash) are genetically distinct on the basis of allozyme variations have provided little or no support for such a hypothesis (Beaumont & Pether, 1996). It has been argued, however, that allozyme data showing relatively little genetic heterogeneity do not disprove that gene flow between populations is a common occurrence (Beaumont & Pether, 1996). Microsatellite techniques are claimed to provide finer resolution of genetic differences, facilitating separation or discrimination of reproductive units. Microsatellite markers for cockles are currently being isolated by researchers at Royal Holloway College, University of London, under a Defra-funded research project on the population genetics of shellfish in British waters.
11.2 Mussel recruitment ecology
A strong inference has been made that mussel spatfall success in The Wash has been limited by the lack of suitable substrates for settlement, particularly healthy
established beds of adults (e.g. Section 10.1). This needs to be verified in the context of a wider study of the factors affecting reproductive fitness of mussels, larvae production and choice of settlement substrates in The Wash. Such a study is already underway in the form of ‘The Wash Mussel Restoration Project’ (see Section 10.1). Establishment of a new mussel bed in the dynamic, soft-sediment environment of The Wash appears to be a rare event. It may be important for stock and site managers to understand the circumstances that lead to this rare event, so that favourable conditions can be promoted and actions leading to adverse conditions can be avoided. Mussels undoubtedly play an important role in creating and stabilising their own habitats. Fishery management could benefit from an improved understanding of time-scales and natural cycles in these processes.
11.3 Impacts of suction dredging on cockle settlement and survival
Section 9.1 presented conflicting information on the impacts of hydraulic suction dredging on settlement and survival of cockles. There is circumstantial evidence that dredging has not affected settlement in The Wash and Thames Estuary, but a Dutch study has suggested long-term negative effects in the Wadden Sea. A study of early suction dredging operations in the Thames Estuary demonstrated lower post-settlement survival of young cockles in dredged areas, but it is doubtful that this result can be applied to modern dredging operations in The Wash. The issue can only be resolved by carefully designed experiments using current gear technology and fishing practices in The Wash. Such a study would need replicated comparisons between fished and unfished areas and between ‘before’ and ‘after’ conditions within the fished areas – the so-called ‘BACI’ (before-after-control-impact) design of impact assessment studies (Smith et al., 1993). Interest in such a study is likely to extend beyond The Wash, but it is worth noting that the results would not necessarily be directly applicable to the environmental conditions and fishing practices at other sites. Parallel studies in other areas such as the Thames Estuary and Dutch Wadden Sea would be beneficial.
11.4 Bird predation, fishing and other sources of mortality
This report mentions various different sources of mortality in cockles and mussels, including fishing, predation, storm losses and parasites. However, overall mortality levels at each life-history stage are poorly known and, although Dare (1999) has estimated the predation potential of oystercatcher and knot in The Wash, there has been no attempt to resolve mortality of cockles or mussels into its components. A study of how fishing and bird predation contribute to cockle mortality in the Burry Inlet has indicated that not all mortality sources are additive – fishing and bird
65
predation may replace other (unknown) sources of mortality (Bell et al., 2001). It is highly desirable that similar studies be undertaken for cockles and mussels in The Wash. If it could be established that similar mechanisms of compensatory mortality exist, there is the potential to develop biological reference points6 for harvesting operations that mark the transition between fully additive and (partially) compensated fishing mortality. Even if such biological reference points cannot be determined, it will be enlightening for fisheries and conservation managers to find out what are the major contributions to overall cockle and mussel mortality. The levels and apportionment of mortality among its various sources are crucial elements underlying the capacity of the Wash bivalve stocks to support birds and fishing, and would be important inputs to the life-history models described in Section 11.5 below. Consideration of fishing mortality should not ignore the indirect elements – mortality of cockles and mussels that do not form part of the retained catch, including both discards and individuals in the dredge path which suffer impacts without being caught.
11.5 Fishery models and stock-recruitment relationships
Fishery management decisions typically rely on two sets of supporting information: (i) assessment of current stock status; and (ii) projections of future stock trends under various fishing scenarios. At present, the first of these requirements is at least partially fulfilled for cockles and mussels in The Wash, but there is a lack of tools and data to supply the second need. ‘Off-the-peg’ fishery methods, such as standard yield per recruit analysis and short-term forward projections (e.g. Gulland, 1983), are not suitable for cockles and mussels because their life-history characteristics differ markedly from those of a typical exploited fish species. In particular, natural mortality levels that are variable and as high as or higher than fishing mortality, extremely variable recruitment and the spatial characteristics of population and fishing processes mean that assumptions underlying standard methods applied to fin fish stocks are not met. Instead, a more tailored approach is necessary – life-history models for cockles and mussels, incorporating mortality and recruitment processes at the appropriate spatial scales. Various biological parameters (growth, maturity, fecundity, spawning cycles, flesh content, energy requirements of predators, etc.) and data (cockle or mussel numbers, size/age-composition and distribution, shorebird numbers, etc.) would be needed. Input to the model would be various scenarios for fishing activities and their management (levels of fishing effort, total allowable catch, MLS, fishing seasons, etc.), while output might measure performance against a number of management objectives (sustainable
fishery yield or revenue, minimum spawning stock biomass levels, numbers of shorebirds supported, etc.). Relationships between stock and recruitment at appropriate spatial scales would need to be specified, but since it is unlikely that there will ever be a truly effective predictive stock-recruitment model for cockles or mussels, statistical uncertainty would be a crucial element of this and other parts of the overall life-history model. Thus, rather than fixed, deterministic results, model outputs would be given in terms of probabilities and risks. There is probably enough information at present to formulate the structure of a life-history model for cockles or mussels in The Wash, but new research might be needed to generate crucial inputs of data or biological parameters. At least as important, such models would need to be shaped to fit the management strategies and objectives agreed by stakeholders in the fisheries and conservation of the site.
11.6 Collation and integration of data resources
This report has drawn together various data on the bivalve stocks, fisheries and ecology of The Wash. This represents only a small fraction of the historical and current data on The Wash environment, and new data are being collected all the time. Separate schemes exist for monitoring water and sediment chemistry, invertebrate communities, bird populations, shellfish stocks and fisheries, and other aspects of The Wash environment, ecology and economy. All these schemes are likely to generate information that is relevant to the management of The Wash as a whole, but cross-referencing between the different data sources is currently difficult because of differences in format and spatial points of reference. Integration of the various data resources under a single GIS framework would be an extremely valuable exercise. Such a system could serve both as a resource of historical and current data for managers and researchers, and as a framework of agreed standards of compatibility for future data collection. To preserve confidentiality and intellectual property rights, some elements of any information system may need to be held as pointers to the existence of some data resources rather than hold the actual data.
11.7 Fishery management
The indications that prolonged high exploitation rates played a major role in precipitating the stock collapses of cockles and, particularly, mussels should be judged in the context of an era when fishery managers lacked adequate legislation to conserve stocks, and were under industrial (and political) pressures not to unduly restrict fishing effort. This report benefits from hindsight in identifying the consequences of management decisions
6 A biological reference point is a particular value of a statistic for an exploited stock, such as stock size or fishing mortality, that is used as a target for management or as a limit aimed at protecting the stock from overfishing.
66
made up to 20 years ago. With the introduction of new regulatory powers in 1993, and the adoption of a precautionary approach, fishery managers are now better placed to control these fisheries on a more sustainable basis in future once recovery of the stocks has taken place.
The scientific principles underlying a sustainable fishery are simple:
(i) after the impacts of fishing operations, including direct fishing mortality and indirect effects on the stock and its habitat, the remaining stock should be in a condition that allows current stock levels to be replaced by the addition of new recruits;
(ii) if, for reasons outside fishery control, recruitment is insufficient to replace current stock levels, there should be sufficient remaining stock to allow a fishery in the next season; and
(iii) adequate margin for error should be allowed, to minimise the risk of (i) or (ii) not being achieved.
Any management system will need to be based on the best scientific information, but it is important to recognise that it is often difficult or impossible to derive universally applicable thresholds and criteria based on analysis of real scientific data. The most important features of any management rules are that they should be transparent, based on measurable criteria and agreed by all stakeholders. The exact form of any management controls will depend on the objectives set for the fishery and for the site as a whole, and this is a matter for agreement between stakeholders rather than a scientific issue. This section outlines some of the main considerations for fishery managers. The aim is not to be prescriptive, but to set out the scientific principles underpinning some of the choices that could be made. The future research directions suggested in Sections 11.1-11.6 could provide an improved basis for management.
11.7.1 Stock reserves
There are three obvious reasons why a fishery should not remove all the fishable biomass in a single season. First, the generation of future recruits depends upon the existence of a spawning stock. Although there are many uncertainties about stock-recruitment relationships of cockles and mussels in The Wash, and production of larvae currently does not appear to be the limiting factor in either species, it is precautionary to assume that there is a minimum stock level below which the production of larvae is compromised. For mussels, even if we disregard the need for spawners, we can see that it is necessary to leave more-or-less intact beds of adults to act as settlement sites for spat.
Second, given that recruitment can vary greatly between years, the fishable stock of the current year could be the main or even only basis for the fishable stock in the next year, with any addition of biomass
being due more to growth than to recruitment. This risk should be judged in the context of the ability to predict recruitment. For cockles and mussels in The Wash, it is unlikely that it will ever be possible reliably to predict spatfalls in advance, but the number of older sub-legal animals on existing beds should provide some advance warning of the likely levels of immediate recruitment to the fishable stocks.
The third reason for a fishery to leave a reserve of remaining stock is that the target species is likely to have ecosystem roles that are wider than just supporting the fishery. Cockles and mussels are the prey of shorebirds and other predators, and may play other roles in maintaining habitats and productivity within the Wash ecosystem (see Section 3). Management of the Wash SAC is likely to pay particular attention to the food requirements of oystercatchers. Shellfish stocks in the Dutch Wadden Sea are currently managed under the condition that bird populations should be maintained at average levels of the 1980s (CWSS, 2002). Wadden Sea stocks corresponding to 60-70% of the average total food requirement of shellfish-eating birds are reserved for birds. Other approaches to safeguarding food for birds include biological reference points for additive fishing mortality (see above, Section 11.4), and calculations based on models of foraging behaviour that predict the conditions under which oystercatcher mortality will be increased by starvation (Stillman et al., 2003).
There are various possible approaches to leaving stock reserves. Choice will depend on management objectives and levels of risk considered to be acceptable, but most approaches will be more-or-less compatible with all three reserve functions. Area closures (see below, Section 11.7.2) are one obvious approach, although the effectiveness may depend on factors such as local stock dynamics and the distribution of bird feeding grounds. A more common approach is simply to set an upper limit to the total allowable catch. Upper limits for cockle harvesting in the Burry Inlet are set at around 30% of the estimated fishable biomass. This is based on the observation that an apparently sustainable fishery had operated within this limit for a number of years. Recent research has confirmed that harvesting at this level or less should minimise fishery impacts on cockle stock dynamics in the Burry Inlet (Bell et al., 2001). Similar harvest levels have been adopted as a reasonable rule-of-thumb for other cockle fisheries, although further research along the lines suggested in Section 11.4 would be needed to determine whether the same justification applies. It is worth noting that the setting of harvest levels is affected by the precision of survey estimates of fishable biomass – for a large and complex site such as The Wash, precision is likely to be fairly low at realistic levels of survey effort (see Section 5.1). At present, it is not clear what level of stock reserve would be appropriate to meet the needs for spawning stocks, insurance against future recruitment failure or
67
conservation objectives, but the pre-decline stock levels seen in the 1970s could be taken as a first indicator.
11.7.2 Spatio-temporal controls
Spatial management of fishing effort is increasingly recognised as a valuable tool for controlling access to exploited marine resources (National Research Council, 2001). Such management includes temporary, rotational and permanent closures of parts of fishing grounds, and is recognised as particularly applicable to sedentary stocks such as benthic shellfish (Orensanz & Jamieson, 1998). A concomitant benefit of closures is that they may allow recovery of impacted environments and biological communities (Collie et al., 1997).
The application of area closures to creating stock reserves has already been mentioned. In the Dutch Wadden Sea 30% of the intertidal area is closed to fishing, partly as an additional set-aside for bird food requirements (see above, Section 11.7.1) and as a safeguard for some other features of conservation importance, and partly to exclude fishing from the areas with the best chance to develop stable mussel beds (CWSS, 2002). There are various other possible motivations for closing areas to cockle and mussel fishing in The Wash, such as the current policy of protecting good beds of sub-legal cockles from dredge damage and disturbance. Vulnerability to storms is a very important consideration in selecting areas for closure, since there is little to be gained from excluding fishing from beds at high risk of being lost. Vulnerability to predation might be considered in the same light, unless the predators (e.g. shorebirds) were themselves the focus of a management objective.
Temporal controls could be considered alongside spatial management. Most obviously these would be closed seasons, aimed at protecting spawners, preventing disturbance during the settling season or maximising yield. Preventing disturbance to birds at vulnerable times of the year might be a consideration in some fisheries, but since the mechanised fishing for cockles and mussels is undertaken when the beds are submerged and inaccessible to wading shorebirds, this is not necessarily an important consideration in The Wash. Aside from seasons of complete fishery closure, bed-specific temporal controls could be applied to prevent intensive impacts at particular locations. This could, for example, be used to prevent repeated riddling of undersized mussels on individual beds, thus reducing pre-recruit mortality and minimising disruption to the physical structure of beds.
11.7.3 Stock culture and enhancement
Relaying of undersized mussels (seed) is now seen as the main hope for Wash mussel production in the near future. Seed is taken from sublittoral areas within The Wash, where it is otherwise vulnerable to loss from scouring, and is also imported from other areas.
Aside from the obvious economic benefits, mussel seed relaid into intertidal areas of The Wash could provide additional spawning biomass and new areas attractive to settling spat. Although a commercial shellfish grower might have mixed feelings on the subject, it is also significant that mussel lays can be a valuable resource for wintering oystercatchers in The Wash (Atkinson et al., 2003). Relaying of mussels generally occurs during the cooler autumn months, when mussels are presumably less physiologically ‘challenged’. It is most successful in the most sheltered locations, predominantly in the Boston sector of The Wash.
There would appear to be less scope for relaying of undersized cockles, although small-scale trials have been made in the Thames Estuary and in the Netherlands (Drinkwaard, 1984). It is questionable whether cockles would be as physiologically robust to translocation as mussels. Location of a convenient and unexploited source stock of cockles might also pose problems. The best justification for attempting to translocate cockles might be the occurrence of heavy spat settlements in areas at high risk of storm losses.
11.7.4 Technical measures
Specifying minimum legal sizes (MLS) and minimum standards for certain aspects of gear performance could play an important part in ensuring the sustainability of fishing operations for cockles and mussels in The Wash. The primary motive for setting an MLS is usually to avoid harvesting animals before they have had a chance to reproduce, but this is not the only possible reason. Bearing in mind the trade-off between growth and mortality, an MLS could be used to maximise fishery yield, although the economic benefits might depend on the markets for animals of a given size. If shorebird conservation is an important management objective, it might be appropriate to consider setting an MLS that is high with respect to the preferred prey size range. MLS are currently set for both cockles and mussels in The Wash. Fishery and predation modelling, as described in Sections 11.4 and 11.5, would be needed to assess the performance of these choices of MLS against any given management objective. Such modelling would, for example, allow managers to judge whether it was appropriate to raise the MLS for mussels from the current 45 mm shell length to the level of 50 mm shell length that was applied before 1982.
Mechanised fishing for cockles and mussels inevitably involves sorting and discarding of undersized individuals. It is clear that the benefits of any choice of MLS must depend on the level of indirect fishing mortality inflicted by these operations. High breakage rates and mortality of discards could serve to cancel out the potential gains from setting an MLS. It is thus important to be aware of the levels of indirect fishing mortality involved in current fishing operations. Setting realistic minimum standards for breakage
68
rates and other aspects of gear performance could be a valuable and relatively painless management tool, although there would need to be a significant investment in monitoring effort. It would be worth investigating whether there might also be other aspects of gear performance that could usefully be regulated to
minimise impacts on target and non-target organisms and the Wash environment as a whole. Fishermen are quick to adopt new developments in fishing technology that improve the efficiency of their operations. Such developments may also be relevant to particular management objectives.
69
12. REFERENCESADDISON, J.T., LAWLER, A.R. & NICHOLSON, M.D., in
press. Adjusting for variable catchability of brown shrimps (Crangon crangon) in research surveys. Fisheries Research.
ANDRÉ, C. & ROSENBERG, R., 1991. Adult-larval interactions in suspension-feeding bivalves Cerastoderma edule and Mya arenaria. Marine Ecology Progress Series, 71, 227-234.
ANDRÉ, C., JONSSON, P.R. & LINDEGARTH, M., 1993. Predation on settling bivalve larvae by benthic suspension feeders: the role of hydrodynamics and larval behaviour. Marine Ecology Progress Series, 97, 183-192.
ARMONIES, W., 1992. Migratory rhythms of drifting juvenile molluscs in tidal waters of the Wadden Sea. Marine Ecology Progress Series, 83, 197-206.
ARMONIES, W., 1994a. Turnover of postlarval bivalves in sediments of tidal flats in Königshafen (German Wadden Sea). Helgoländer Meeresuntersuchungen, 48, 291-297.
ARMONIES, W., 1994b. Drifting and macrobenthic invertebrates on tidal flats in Königshafen: a review. Helgoländer Meeresuntersuchungen, 48, 299-320.
ATKINSON, P.W., CLARK, N.A., BELL, M.C., DARE, P.J., CLARK, J.A. & IRELAND, P.L., 2003. Changes in commercially fished shellfish stocks and shorebird populations in the Wash, England. Biological Conservation, 114, 127-141.
BACHELET, G., DESPREZ, M., DUCROTOY, J-P., GUILLOU, J., LABOURG, P-J., RYBARCZYK, H., SAURIAU, P-G., ELKAÏM, B. & GLÉMAREC, M., 1992a. Rôle de la compétition intraspécifique dans la régulation du recrutement chez la coque, Cerastoderma edule (L). Annales de l’Institut Océanographique, Paris, 68, 75-87.
BACHELET, G., GUILLOU, J. & LABOURG, P.J., 1992b. Adult-larval and juvenile interactions in the suspension-feeding bivalve, Cerastoderma edule: field observations and experiments. pp. 175-182, in: Columbo, G. Ferrari, I., Ceccherelli, V. U. & Rossi, R. (eds.) Marine Eutrophication and Population Dynamics. Olsen & Olsen, Fredensborg.
BACKHAUS, J.O., 1985. A three-dimensional model for the simulation of shelf sea dynamics. Deutsche Hydrographische Zeitschrift, 38, 165-187.
BAGGERMAN, B., 1953. Spatfall and transport of Cardium edule. Archives néerlandaises de Zoologie, 10, 315-342.
BAYNE, B.L., 1964. Primary and secondary settlement in Mytilus edulis L. (Mollusca). Journal of Animal Ecology, 33, 513-523.
BAYNE, B.L., 1965. Growth and delay of metamorphosis of the larvae of Mytilus edulis L. Ophelia, 2, 1-47.
BAYNE, B.L., GABBOTT, P.A. & WIDDOWS, J., 1975. Some effects of stress in the adult on the eggs and larvae of Mytilus edulis L. Journal of the Marine Biological Association of the United Kingdom, 55, 675-689.
BAYNE, B.L., WIDDOWS, J. & THOMPSON, R.J., 1976. Physiological Integrations. pp. 261-291 in: Bayne, B. L. (ed.) Marine Mussels: their Ecology and Physiology. Cambridge University Press, Cambridge.
BAYNE, B.L., HOLLAND, D.L., MOORE, M.N., LOWE, D.M. & WIDDOWS, J., 1978. Further studies on the effects of stress in the adult on the eggs of Mytilus edulis. Journal of the Marine Biological Association of the United Kingdom, 58, 825-841.
BEAUMONT, A.R. & PETHER, S.M.J., 1996. Allozyme variation and gene flow between cockle Cerastoderma edule populations in the southern United Kingdom. Fisheries Research, 28, 263-275.
BELL, M.C., BANNISTER, R.C.A., WALKER, P., ATKINSON, P.W. & CLARK, N.A., 2001. Fisheries and bird predation as components of cockle (Cerastoderma edule) mortality in the Burry Inlet, South Wales. ICES CM 2001/J:01 (mimeo).
BERGHAHN, R., 1987. The Wadden Sea as a nursery for fish and crustacean species. Proceedings of the 5th International Wadden Sea Symposium, Esbjerg, 1986, 69-86.
BEUKEMA, J.J., 1985. Benthos survival during severe winters in high and low tidal flats in the Dutch Wadden Sea. pp. 351-361 in: Gray, J. S. & Christiansen, M. E. (eds.) Marine Biology of Polar Regions and Effects of Stress on Marine Organisms. John Wiley, Chichester.
BEUKEMA, J.J., 1991. The abundance of shore crabs Carcinus maenas (L). on a tidal flat in the Wadden Sea after cold and mild winters. Journal of Experimental Marine Biology and Ecology, 153, 97-113.
BEUKEMA, J.J., 1992a. Dynamics of juvenile shrimp Crangon crangon in a tidal-flat nursery of the Wadden Sea after mild and cold winters. Marine Ecology Progress Series, 83, 157-165.
BEUKEMA, J.J., 1992b. Expected changes in the Wadden Sea benthos in a warmer world: lessons from periods with mild winters. Netherlands Journal of Sea Research, 30, 73-79.
BEUKEMA, J.J., 1993. Increased mortality in alternative bivalve prey during a period when the tidal flats of the Dutch Wadden Sea were devoid of mussels. Netherlands Journal of Sea Research, 31, 395-406.
BEUKEMA, J.J. & CADÉE, G.C., 1996. Consequences of the sudden removal of nearly all mussels and cockles from the Dutch Wadden Sea. Marine Ecology, 17, 279-289.
BEUKEMA, J. J., ESSINK, K., MICHAELIS, H. & ZWARTS, L., 1993. Year-to-year variability in the biomass of macrobenthic animals on tidal flats of the Wadden Sea: how predictable is this food source for birds? Netherlands Journal for Sea Research, 31, 319-330.
BEUKEMA, J.J., HONKOOP, P.J.C. & DEKKER, R., 1998. Recruitment in Macoma balthica after mild and cold winters and its possible control by egg production and shrimp predation. Hydrobiologia, 375/376, 23-34.
BOYDEN, C.R., 1971. A comparative study of the reproductive cycles of the cockles Cerastoderma edule and C. glaucum. Journal of the Marine Biological Association of the United Kingdom, 51, 605-622.
CARBALLAL, M. J.,IGLESIAS, D., SANTAMARINA, J., FERRO-SOTO, B. & VILLALBA, A., 2001. Parasites and pathologic conditions of the cockle Cerastoderma edule populations of the coast of Galicia (NW Spain). Journal of Invertebrate Pathology, 78, 87-97.
70
CHAMBERS, K., 1991. Burrowing and emergence rates of the cockle Cerastoderma edule. Undergraduate Honours Project Report, University of Wales, Swansea.
COFFEN-SMOUT, S., 1995. Shell damage and behaviour in the cockle Cerastoderma edule L. under simulated harvesting experiments at Traeth Lafan, North Wales. MSc Thesis, University of Wales, Bangor.
COLLIE, J.S., ESCANAERO, G.A. & VALENTINE, P.C., 1997. Effects of bottom fishing on the benthic megafauna of Georges Bank. Marine Ecology Progress Series, 155, 159-172.
COOK, W., 1991. Studies on the effects of hydraulic dredging on cockle and other macroinvertebrate populations, 1989-90. North Western and North Wales Sea Fisheries Committee, Lancaster.
CRANSWICK, P. , POLLITT, M. , MUSGROVE, A. & HUGHES, B., 1999. The Wetland Bird Survey 1997-98: Wildfowl and Wader Counts. BTO/WWT/RSPB/JNCC, Slimbridge.
CWSS, 2002. Shellfish Fisheries: An overview of Policies for Shellfish Fishing in the Wadden Sea. Common Wadden Sea Secretariat, Wilhelmshaven.
DAME, R.F. & DANKERS, N., 1988. Uptake and release of materials by a Wadden Sea mussel bed. Journal of Experimental Marine Biology and Ecology, 118, 207-216.
DANKERS, N., 1987. Some ecological effects of the mussel culture in the Dutch Wadden Sea. Proceedings of the 5th International Wadden Sea Symposium, Esbjerg, 1986, 201-214.
DANKERS, N., 1993. Integrated estuarine management: obtaining a sustainable yield of bivalve resources while maintaining environmental quality. pp. 479-511 in: Dame, R. F. (ed.) Bivalve Filter Feeders in Estuarine and Coastal Ecosystem Processes. Springer Verlag, Berlin.
DANKERS, N., & KOELEMAIJ, K., 1989. Variations in the mussel population of the Dutch Wadden Sea in relation to monitoring of other ecological parameters. Helgoländer Meeresuntersuchungen, 43, 529-535.
DARBY, C.D. & DURANCE, J.A., 1989. Use of the North Sea water parcel following model (NORSWAP) to investigate the relationship of larval source to recruitment for scallop (Pecten maximus) stocks of England and Wales. ICES CM 1989/K:28 (mimeo).
DARE, P. J., 1974. Damage caused to mussels (Mytilus edulis L.) by dredging and mechanised sorting. Journal du Conseil Internationale pour l’Exploration de la Mer, 35, 296-299.
DARE, P.J., 1976. Settlement, growth and production of the mussel Mytilus edulis in Morecambe Bay, England. Fisheries Investigations, London (Series 2), 28, 1-25.
DARE, P.J., 1977. Damage to mussels (Mytilus edulis) caused by dropping during handling operations. Fisheries Research Technical Report, MAFF Directorate of Fisheries Research, Lowestoft, 34, 6 pp.
DARE, P.J., 1982. Notes on the swarming behaviour and population density of Asterias rubens L. (Echinodermata: Asteroidea) feeding on the mussel Mytilus edulis L. Journal du Conseil Internationale pour l’Exploration de la Mer, 40, 112-118.
DARE, P.J., 1999. Health of the Wash ecosystem: Shorebird population trends, food supplies and possible shellfisheries interactions in the Wash, 1972-1997. Report to English Nature, 96 pp.
DARE, P.J. & EDWARDS, D.B., 1975. Seasonal changes in flesh weight and biochemical composition of mussels (Mytilus edulis L.) in the Conwy Estuary, North Wales. Journal of Experimental Marine Biology and Ecology, 18, 89-97.
DARE, P.J. & EDWARDS, D.B., 1976. Experiments on the survival, growth and yield of relaid seed mussels (Mytilus edulis L.) in the Menai Straits, North Wales. Journal du Conseil Internationale pour l’Exploration de la Mer, 37, 16-28.
DARE, P.J. & EDWARDS, D.B., 1981. Underwater television observations on the intertidal movements of shore crabs, Carcinus maenas, across a mudflat. Journal of the Marine Biological Association of the United Kingdom, 61, 107-116.
DARE, P.J., EDWARDS, D.B. & DAVIES, G., 1983. Experimental collection and handling of spat mussels (Mytilus edulis L.) on ropes for intertidal culture. Fisheries Research Technical Report, MAFF Directorate of Fisheries Research, Lowestoft, 74, 23 pp.
DARE, P.J. & WALKER, P., 1993. Spatfalls of cockles and mussels in the Wash in relation to preceding winter temperatures and possible effects of spring wind regimes upon larval dispersal: a preliminary analysis. pp. 15-18 in: Dijkema, R. (ed.) Spatfall and recruitment of mussels (Mytilus edulis) and cockles (Cerastoderma edule) on different locations along the European coast. ICES CM 1993/K:62 (mimeo).
DAVIES, G., DARE, P.J. & EDWARDS, D.B., 1980. Fenced enclosures for the protection of seed mussels (Mytilus edulis L.) from predation by shore-crabs (Carcinus maenas (L.)). Fisheries Research Technical Report, MAFF Directorate of Fisheries Research, Lowestoft, 56, 14 pp.
DRINKWAARD, A.C., 1984. Lines of thinking and working in the Dutch cockle fishery. Proceedings of the 12th Annual Shellfish Conference, SAGB, 1-22.
DUIKER, J.M.C., NOMDEN, E. & SMAAL, A., 1998. De invloed van mechanische schelpdiervisserij op de sedimenthuishouding van der Waddenzee. Instituut voor Marien en Atmosferisch Onderzoek Utrecht, Report R 98-01.
ENS, B.J., LANTERS, R. & SMAAL, A., 2000. EVA II: Evaluating the Dutch policy of shellfish fishing in 2003. Wadden Sea Newsletter, 2000-2, 22-24.
FRANKLIN, A. & PICKETT, G.D., 1968. Cockle resources of the Wash, 1967-68. Shellfish Information Leaflet No. 11, MAFF Directorate of Fisheries Research, Burnham-on-Crouch, 17pp.
FRANKLIN, A. & PICKETT, G.D., 1978. Studies on the indirect effects of fishing on stocks of cockles, Cardium edule, in the Thames Estuary and Wash. Fisheries Research Technical Report, MAFF Directorate of Fisheries Research, Lowestoft, 42, 9 pp.
GOSS-CUSTARD, J.D., (ED.) 1996. The Oystercatcher: From Individuals to Populations. Oxford University Press, Oxford.
71
GOSS-CUSTARD, J.D., JONES, R.E. & NEWBERRY, P.E., 1977. The ecology of the Wash. I. Distribution and diet of wading birds (Charadrii). Journal of Applied Ecology, 14, 681-700.
GOSS-CUSTARD, J.D., MCGRORTY, S. & DURELL, S.E.A. LE V DIT., 1996. The effect of oystercatchers Haematopus ostralegus on shellfish populations. Ardea, 84A, 453-468.
GULLAND, J.A., 1983. Fish Stock Assessment: A Manual of Basic Methods. FAO/Wiley Series on Food and Agriculture, Volume 1. Wiley, Chichester.
HANCOCK, D.A., 1969. An experiment with overcrowded cockles (Cardium edule). Proceedings of Symposium on Mollusca, Cochin, 1968, Symposium Series 3, Part II, Marine Biological Association, India, Mandepam Camp 1969: 396-402.
HANCOCK, D.A., 1971. The role of predators and parasites in a fishery for the mollusc Cardium edule L. pp. 419-439 in den Boer, P. J. & Gradwell, G. R. (eds.) Dynamics of Populations. Proceedings of the Advanced Study Institute on ‘Dynamics of Numbers in Populations’, Oosterbeek, Netherlands.
HANCOCK, D.A., 1973. The relationship between stock and recruitment in exploited invertebrates. Rapports et Procès-verbaux des Réunions du Conseil International pour l’Exploration de la Mer, 164, 113-131.
HANCOCK, D.A. & URQUHART, A.E., 1965. The determination of natural mortality and its causes in an exploited population of cockles (Cardium edule L.). Fisheries Investigations, London (Series 2), 24, 1-40.
HONKOOP, P.J.C. & VAN DER MEER, J., 1998. Experimentally induced effects of water temperature and immersion time on reproductive output of bivalves in the Wadden Sea. Journal of Experimental Marine Biology and Ecology, 220, 227-246.
HORWOOD, J.W. & GOSS-CUSTARD, J.D., 1977. Predation by the oystercatcher, Haematopus ostralegus (L.) in relation to the cockle Cerastoderma edule (L.) fishery in the Burry Inlet, South Wales. Journal of Applied Ecology, 14, 139-158.
IBING, J. & THEEDE, H., 1975. Zur Gefrierresistenz litoraler Mollusken von der deutschen Nordseeküste. Kieler Meeresforschungen, 31, 44-48.
ICES, 2001. Report of the Study Group on the Further Development of the Precautionary Approach to Fishery management. ICES, CM 2001/ACFM:11 (mimeo).
IVELL, R., 1981. A quantitative study of a Cerastoderma-Nephthys community in the Limfjord, Denmark, with special reference to production of Cerastoderma edule. Journal of Molluscan Studies, 47, 147-170.
JACKSON, M.J. & JAMES, R., 1979. The influence of bait digging on cockle, Cerastoderma edule, populations in north Norfolk. Journal of Applied Ecology, 16, 671-679.
JENKINSON, A.F. & COLLISON, F.P., 1977. An initial climatology of gales over the North Sea. Synoptic Climatology Branch Memorandum No. 62. Meteorological Office, Bracknell.
JENSEN, K.T., 1992. Dynamics and growth of the cockle, Cerastoderma edule, on an inter-tidal mudflat in the Danish Wadden Sea: effects of submersion time and density. Netherlands Journal of Sea Research, 28, 335-345.
JENSEN, K.T., 1993. Density-dependent growth in cockles (Cerastoderma edule): evidence from interannual comparisons. Journal of the Marine Biological Association of the United Kingdom, 73, 333-342.
JENSEN, K.T. & JENSEN, J.N., 1985. The importance of some epibenthic predators on the density of juvenile benthic macrofauna in the Danish Wadden Sea. Journal of Experimental Marine Biology and Ecology, 89, 157-174.
JONSSON, P.R. & ANDRÉ, C., 1992. Mass mortality of the bivalve Cerastoderma edule on the Swedish west coast caused by infestation with the digenean trematode Cercaria cerastodermae. Ophelia, 36, 151-157.
JØRGENSEN, C.B., 1981. Mortality, growth and grazing impact of a cohort of bivalve larvae, Mytilus edulis L. Ophelia, 20, 185-192.
KAMERMANS, P., 1993. Food limitation in cockles (Cerastoderma edule (L.)): influences of location on tidal flat and nearby presence of mussel beds. Netherlands Journal of Sea Research, 31, 71-81.
KAMERMANS, P. & SMAAL, A.C., 2002. Mussel culture and cockle fisheries in the Netherlands: finding a balance between economy and ecology. Journal of Shellfish Research, 21, 509-517.
KANWISHER, J.W., 1955. Freezing in intertidal animals. Biological Bulletin, 109, 56-63.
KAUTSKY, N. & EVANS, S., 1987. Role of biodeposition by Mytilus edulis in the circulation of matter and nutrients in a Baltic coastal ecosystem. Marine Ecology Progress Series, 38, 201-212.
KE, X., EVANS, G. & COLLINS, M.B., 1996. Hydrodynamics and sediment dynamics of The Wash embayment, eastern England. Sedimentology, 43, 157-174.
KLEIN BRETELER, W.C.M., 1976. Settlement, growth and production of the shore crab, Carcinus maenas, on tidal flats in the Dutch Wadden Sea. Netherlands Journal of Sea Research, 10, 354-376.
KREBS, C.J., 1978. Ecology: The Experimental Analysis of Distribution and Abundance. Harper & Row, New York.
KRISTENSEN, I., 1957. Differences in density and growth in a cockle population in the Dutch Wadden Sea. Archives néerlandaises de Zoologie, 12, 351-453.
KUIPERS, B.R. & DAPPER, R., 1981. Production of Crangon crangon in the tidal zone of the Dutch Wadden Sea. Netherlands Journal of Sea Research, 15, 33-53.
LAMB, H.H., 1972. British Isles weather types and a register of the daily sequence of circulation patterns 1861-1971. Geophysical Memoir No. 116. HMSO, London.
LAMBECK, R.H.D., GOSS-CUSTARD, J.D. & TRIPLET, P., 1996. Oystercatchers and man in the coastal zone. pp. 289-326 in: Goss-Custard, J. D. (ed.) The Oystercatcher: From Individuals to Populations. Oxford University Press, Oxford.
72
LANE, D.J.W., BEAUMONT, A.R. & HUNTER, J.R., 1985. Byssus drifting and the drifting threads of the young post larval mussel (Mytilus edulis). Marine Biology, 84, 301-308.
LOO, L.O. & ROSENBERG, R., 1989. Bivalve suspension-feeding dynamics and benthic-pelagic coupling in an eutrophicated marine bay. Journal of Experimental Marine Biology and Ecology, 130, 253-276.
LUTZ, R.A. & KENNISH, M.J., 1992. Ecology and morphology of larval and early postlarval mussels. pp. 53-86 in: Gosling, E. (ed) The mussel Mytilus: ecology, physiology, genetics and culture. Elsevier, Amsterdam.
MCGRORTY, S., CLARKE, R.T., READING, C.J. & GOSS-CUSTARD, J.D., 1990. Population dynamics of the mussel Mytilus edulis: density changes and regulation of the population in the Exe estuary, Devon. Marine Ecology Progress Series, 67, 157-169.
MCGRORTY, S. & GOSS-CUSTARD, J.D., 1993. Population dynamics of the mussel Mytilus edulis along environmental gradients: spatial variations in density-dependent mortalities. Journal of Animal Ecology, 62, 415-427.
MEIRE, P.M., SCHEKKERMAN, H. & MEININGER, P., 1994. Consumption of benthic invertebrates by waterbirds in the Oosterschelde estuary, SW Netherlands. Hydrobiologia, 282/283, 525-546.
MÖLLER, P., 1986. Physical factors an biological interactions regulating infauna in shallow boreal areas. Marine Ecology Progress Series, 30, 33-47.
MÖLLER, P. & ROSENBERG, R., 1983. Recruitment, abundance and production of Mya arenaria and Cardium edule in marine shallow waters, western Sweden. Ophelia, 22, 23-55.
NATIONAL RESEARCH COUNCIL, 2001. Marine Protected Areas. Tools for Sustaining Ocean Ecosystems. National Academy Press, Washington.
NEHLS, G. & THIEL, M., 1993. Large-scale distribution patterns of the mussel Mytilus edulis in the Wadden Sea of Schleswig-Holstein: do storms structure the ecosystem? Netherlands Journal of Sea Research, 31, 181-187.
NEWELL, R.I.E. & BAYNE, B.L., 1980. Seasonal changes in the physiology, reproductive condition and carbohydrate content of the cockle Cardium (=Cerastoderma) edule (Bivalvia : Cardiidae). Marine Biology, 56, 11-19.
OBERT, B. & MICHAELIS, H., 1991. History and ecology of the mussel beds (Mytilus edulis L.) in the catchment area of a Wadden Sea tidal inlet. pp. 185-194 in: Elliott, M. & Ducrotoy, J. P. (eds.) Estuaries and Coasts: Spatial and Temporal Intercomparisons. ECSA Symposium, University of Caen, 1989. Olsen & Olsen, Fredensborg.
ORENSANZ, J.M & JAMIESON, G.S., 1998. The assessment and management of spatially structured stocks: An overview of the north Pacific symposium on invertebrate stock assessment and management. Canadian Special Publication of Fisheries and Aquatic Sciences, 125, 441-459.
ORTON, J.H., 1933. Summer mortality of cockles on some Lancashire and Cheshire Dee beds in 1933. Nature, London, 132, 314-315.
PICKETT, G.D., 1973. The impact of mechanical harvesting on the Thames Estuary cockle fishery. Laboratory Leaflet (new series) No. 29, MAFF Directorate of Fisheries Research Lowestoft, 21 pp.
PIERSMA, T., KOOLHAAS, A., DEKINGA, A., BEUKEMA, J. J., DEKKER, R. & ESSINK, K., 2001. Long-term indirect effects of mechanical cockle-dredging on intertidal bivalve stocks in the Wadden Sea. Journal of Applied Ecology, 38, 976-990.
PIHL, L. & ROSENBERG, R., 1982. Production, abundance and biomass of mobile epibenthic marine fauna in shallow waters, western Sweden. Journal of Experimental Marine Biology and Ecology, 57, 273-301.
PIHL, L. & ROSENBERG, R., 1984. Food selection and consumption of the shrimp Crangon crangon in some shallow marine areas in western Sweden. Marine Ecology Progress Series, 15, 159-168.
POTTS, M. & DARE, P. J., 1969. Predation of seed mussels by Oystercatchers at Bangor, 1968-69 winter. MAFF Directorate of Fisheries Research Conwy (unpublished report).
PRATER, A.J., 1972. The ecology of Morecambe Bay. III. The food and feeding habits of Knot (Calidris canutus) in Morecambe Bay. Journal of Applied Ecology, 9, 179-194.
PRATER, A.J., 1981. Estuary Birds of Britain and Ireland. T. & A. D. Poyser, Calton.
PULFRICH, A., 1996. Attachment and settlement of post-larval mussels (Mytilus edulis L.) in the Schleswig-Holstein Wadden Sea. Journal of Sea Research, 36, 239-250.
REES, C.B., 1954. Continuous plankton records: the distribution of lamellibranch larvae in the North Sea. Bulletin of Marine Ecology, 4, 21-46.
REES, E.I.S., 1996. Environmental effects of mechanised cockle fisheries: a review of research data. Report to MAFF Marine Environmental Protection Division, 41 pp.
RICHARDSON, C.A., IBARROLA, I. & INGHAM, R.J., 1993. Emergence pattern and spatial distribution of the common cockle Cerastoderma edule. Marine Ecology Progress Series, 99, 71-81.
RIEMANN, B. & HOFFMANN, E., 1991. Biological consequences of dredging and bottom trawling in the Limfjord, Denmark. Marine Ecology Progress Series, 69, 171-178.
RUTH, M. 1993. Research into parental stock, larval abundance and spatfall of mussels in the German Wadden Sea. pp. 18-20 in: Dijkema, R. (ed.) Spatfall and recruitment of mussels (Mytilus edulis) and cockles (Cerastoderma edule) on different locations along the European coast. ICES CM 1993/K:62 (mimeo).
SANCHEZ-SALAZAR, M.E., GRIFFITHS, C.L. & SEED, R., 1987a. The effect of size and temperature on the predation of cockles Cerastoderma edule (L.) by the shore crab Carcinus maenas (L.). Journal of Experimental Marine Biology and Ecology, 111, 181-193.
73
SANCHEZ-SALAZAR, M.E., GRIFFITHS, C.L. & SEED, R., 1987b. The interactive roles of predation and tidal elevation in structuring populations of the edible cockle, Cerastoderma edule. Estuarine, Coastal and Shelf Science, 25, 245-260.
SAVAGE, R.E., 1956. The great spatfall of mussels in the River Conway estuary in spring 1940. Fishery Investigations, London (Series 3), 20, 1-21.
SCHOFIELD, J.M., LABERN, M.V., LORD, R.M. & MASSEY, M.E., 1992. The Wash, England and a developing nature conservation strategy. Netherlands Institute for Sea Research, Publication Series No. 20, 105-111.
SEED, R. & SUCHANEK, T.H., 1992. Population and community ecology of Mytilus. pp. 87-169 in: Gosling, E. (ed) The mussel Mytilus: ecology, physiology, genetics and culture. Elsevier, Amsterdam.
SMITH, E.P., ORVOS, D.R. & CAIRNS, J., 1993. Impact assessment using the before-after-control-impact (BACI) model: concerns and comments. Canadian Journal of Fisheries and Aquatic Sciences, 50, 627-637.
SPRUNG, M., 1983. Reproduction and fecundity of the mussel Mytilus edulis at Helgoland (North Sea). Helgoländer wissenschaft Meeresuntersuchungen, 36, 243-255.
STILLMAN, R.A., WEST, A.D., GOSS-CUSTARD, J.D., CALDOW, R.W.G., MCGRORTY, S., DURELL, S.E.A. LE V. DIT, YATES, M.G., ATKINSON, P.W., CLARK, N.A., BELL, M.C., DARE, P.J. & MANDER, M., 2003. An individual behaviour-based model can predict shorebird mortality using routinely collected shellfishery data. Journal of Applied Ecology, 40, 1090-1101.
STIRLING AQUACULTURE, 2000. The mussel fishery of the Wash: a scoping study of factors affecting its re-establishment. Report to the King’s Lynn Fishing Industry Co-operative Ltd, Stirling Aquaculture, University of Stirling.
THRUSH, S.F., WHITLATCH, R.B., PRIDMORE, R.D., HEWITT, J.E., CUMMINGS, V.J. & WILKINSON, M.R., 1996. Scale-dependent recolonization: the role of sediment stability in a dynamic sandflat habitat. Ecology, 77, 2472-2487.
VERWEY, J., 1952. On the ecology of distribution of cockle and mussels in the Dutch Waddensea, their role in sedimentation and the source of their food supply. Archives néerlandaises de Zoologie, 10, 172-239.
VLAS, J. de, 1987. Effects of cockle fisheries on the macrobenthos in the Wadden Sea. Proceedings of the 5th International. Wadden Sea Symposium, Esbjerg, 1986, 215-227.
VOOYS, C.G.N. de, 1987. Elimination of sand in the blue mussel, Mytilus edulis. Netherlands Journal of Sea Research, 21, 75-78.
WALKER, P. & NICHOLSON, M.D., 1986. The precision of estimates of mussel biomass by zig-zag survey. ICES, CM 1986/K:6 (mimeo).
WALKER, P. & PALMER, D.W., 1989. A survey of cockle stocks on the upper shore of the Wash, April 1989. Shellfish Resources Group Report No. 3, MAFF Directorate of Fisheries Research, Lowestoft, 25 pp.
WALKER, P., DARE, P.J. & CLARK, E., 1990. The potential of aerial photography for estimating intertidal stocks of mussels (Mytilus edulis) in the Wash, England. ICES, CM. 1990/K:14 (mimeo).
WARREN, P.J., 1973. The fishery for the pink shrimp Pandalus montagui in the Wash. Laboratory Leaflet No. 28, MAFF Directorate of Fisheries Research Lowestoft, 46 pp.
WEGEBERG, A.M. & JENSEN, K.T., 2003. In situ growth of juvenile cockles, Cerastoderma edule, experimentally infected with larval trematodes (Himasthla interrupta). Journal of Sea Research, 50, 37-43.
WIDDOWS, J., 1991. Physiological ecology of mussel larvae. Aquaculture, 94, 147-163.
WINGFIELD, R.T.R., EVANS, C.D.R., DEEGAN, S.E. & FLOYD, R., 1978. Geological and Geophysical Survey of the Wash. Report 78/18, Insititute of Geological Sciences. HMSO, London.
WORRALL, C.M. & WIDDOWS, J., 1984. Investigations of factors influencing mortality of Mytilus edulis L. Marine Biology Letters, 5, 85-97.
WRIGHT. J.M. & BENTZEN, P., 1994. Microsatellites: genetic markers for the future. Reviews in Fish Biology and Fisheries, 4, 384-388.
YOUNG, E.F., BIGG, G.R. & GRANT, A., 1996. A statistical study of environmental influences on bivalve recruitment in the Wash, England. Marine Ecology Progress Series, 143, 121-129.
YOUNG, E.F., BIGG, G.R., GRANT, A., WALKER, P. & BROWN, J., 1998. A modelling study of environmental influences on bivalve settlement in the Wash, England. Marine Ecology Progress Series, 172, 197-214.
ZWARTS, L. & BLOMERT, A.-M., 1992. Why Knot Calidris canutus take medium-sized Macoma balthica when six prey species are available. Marine Ecology Progress Series, 83, 113-128.
ZWARTS, L. & DRENT, R.H., 1981. Prey depletion and the regulation of predator density: oystercatchers (Haematopus ostralegus) feeding on mussels (Mytilus edulis). pp.193-216 in: Jones, N. V. & Wolff, W. J. (eds) Feeding and survival strategies of estuarine organisms. Plenum Press, New York.
ZWARTS, L., BLOMERT, A.-M. & WANINK, J.H., 1992. Annual and seasonal variation in the food supply harvestable by knot Calidris canutus staging in the Wadden Sea in late summer. Marine Ecology Progress Series, 83, 129-139.
74
ABBREVIATIONS
AFDW Ash free dry weight
BTO British Trust for Ornithology
CEFAS The Centre for Environment, Fisheries & Aquaculture Science
CEH Centre for Ecology & Hydrology (formerly ITE)
CPUE Catch per unit effort
cSAC Candidate Special Area of Conservation
Defra Department for Environment, Food and Rural Affairs (formerly MAFF)
EA Environment Agency
EN English Nature
ESFJC Eastern Sea Fisheries Joint Committee
EU European Union
GIS Geographical information system
ITE Institute of Terrestrial Ecology (now CEH)
KESFC Kent and Essex Sea Fisheries Committee
MAFF Ministry of Agriculture, Fisheries and Food (now Defra)
MLS Minimum legal size
MVD Minimum viable density
NIOZ Royal Netherlands Institute for Sea Research
RSPB Royal Society for the Protection of Birds
RIVO Netherlands Institute for Fisheries Research
SAC Special Area of Conservation
SAGB Shellfish Association of Great Britain
WeBS Wetland Bird Survey
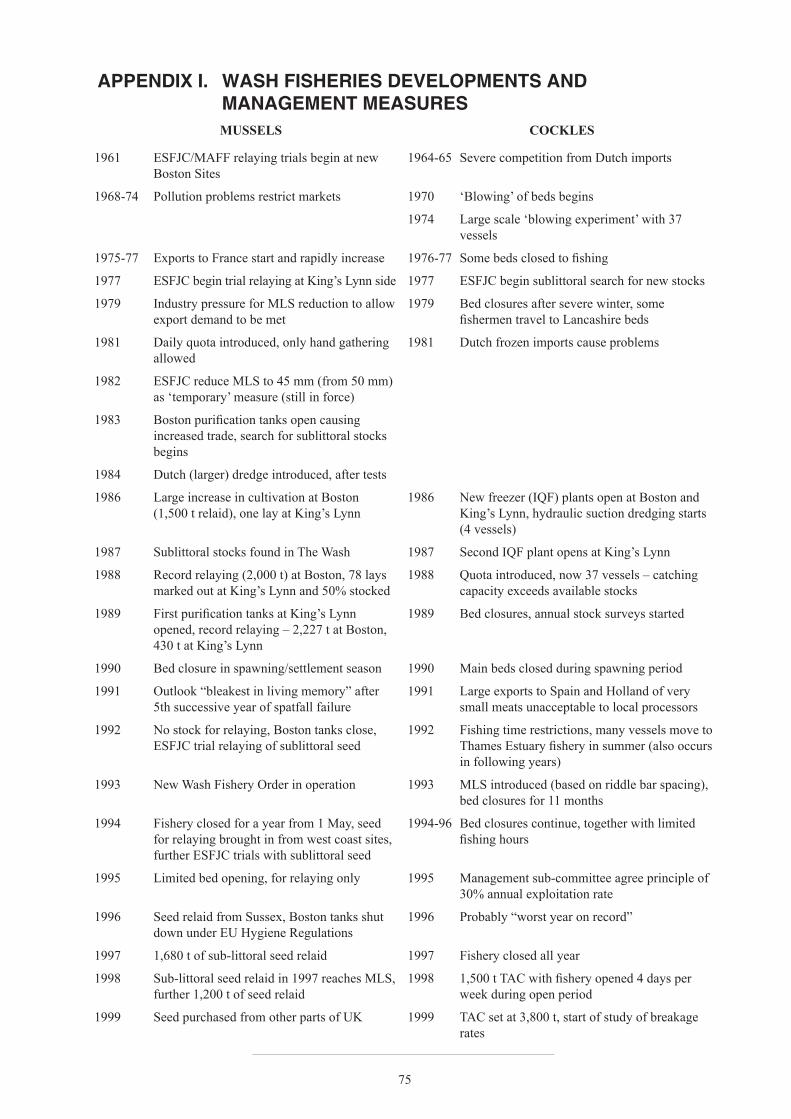
75
APPENDIX I. WASH FISHERIES DEVELOPMENTS AND MANAGEMENT MEASURESMUSSELS COCKLES
1961 ESFJC/MAFF relaying trials begin at new Boston Sites
1964-65 Severe competition from Dutch imports
1968-74 Pollution problems restrict markets 1970 ‘Blowing’ of beds begins
1974 Large scale ‘blowing experiment’ with 37 vessels
1975-77 Exports to France start and rapidly increase 1976-77 Some beds closed to fishing
1977 ESFJC begin trial relaying at King’s Lynn side 1977 ESFJC begin sublittoral search for new stocks
1979 Industry pressure for MLS reduction to allow export demand to be met
1979 Bed closures after severe winter, some fishermen travel to Lancashire beds
1981 Daily quota introduced, only hand gathering allowed
1981 Dutch frozen imports cause problems
1982 ESFJC reduce MLS to 45 mm (from 50 mm) as ‘temporary’ measure (still in force)
1983 Boston purification tanks open causing increased trade, search for sublittoral stocks begins
1984 Dutch (larger) dredge introduced, after tests
1986 Large increase in cultivation at Boston (1,500 t relaid), one lay at King’s Lynn
1986 New freezer (IQF) plants open at Boston and King’s Lynn, hydraulic suction dredging starts (4 vessels)
1987 Sublittoral stocks found in The Wash 1987 Second IQF plant opens at King’s Lynn
1988 Record relaying (2,000 t) at Boston, 78 lays marked out at King’s Lynn and 50% stocked
1988 Quota introduced, now 37 vessels – catching capacity exceeds available stocks
1989 First purification tanks at King’s Lynn opened, record relaying – 2,227 t at Boston, 430 t at King’s Lynn
1989 Bed closures, annual stock surveys started
1990 Bed closure in spawning/settlement season 1990 Main beds closed during spawning period
1991 Outlook “bleakest in living memory” after 5th successive year of spatfall failure
1991 Large exports to Spain and Holland of very small meats unacceptable to local processors
1992 No stock for relaying, Boston tanks close, ESFJC trial relaying of sublittoral seed
1992 Fishing time restrictions, many vessels move to Thames Estuary fishery in summer (also occurs in following years)
1993 New Wash Fishery Order in operation 1993 MLS introduced (based on riddle bar spacing), bed closures for 11 months
1994 Fishery closed for a year from 1 May, seed for relaying brought in from west coast sites, further ESFJC trials with sublittoral seed
1994-96 Bed closures continue, together with limited fishing hours
1995 Limited bed opening, for relaying only 1995 Management sub-committee agree principle of 30% annual exploitation rate
1996 Seed relaid from Sussex, Boston tanks shut down under EU Hygiene Regulations
1996 Probably “worst year on record”
1997 1,680 t of sub-littoral seed relaid 1997 Fishery closed all year
1998 Sub-littoral seed relaid in 1997 reaches MLS, further 1,200 t of seed relaid
1998 1,500 t TAC with fishery opened 4 days per week during open period
1999 Seed purchased from other parts of UK 1999 TAC set at 3,800 t, start of study of breakage rates
76
APPENDIX II. STATISTICAL ANALYSIS OF SPATFALL FREQUENCY DATA
Frequency of spatfalls of different magnitude
Randomization tests (Manly, 1997) were used to evaluate whether there have been any changes over time in the relative frequencies of cockle and mussel spatfalls of different magnitudes in The Wash. The data for this analysis were the decadal frequencies of ‘inadequate’ (spat index 0-1), ‘adequate’ (spat index 2) and ‘good’ (spat index 3-4) spatfalls shown in Table 7.1 of the main report. A chi-square contingency table analysis (Sokal & Rohlf, 1981) was used as the basis for the test. This analysis was based on the null hypothesis that there was no association between decade and spatfall magnitude, or in other words that there has been no significant change in the pattern of spatfalls over the decades. The usual parametric test of significance was considered invalid, because of the low expected frequencies in the table of decades by spatfall magnitude. Instead, the following procedure was used to test whether the data in each of Tables 7.1a and 7.1b departed significantly from expectation under the null hypothesis:
(i) format the data as a list of observed spatfall magnitudes labelled by decades;(ii) tabulate the data, and calculate the overall χ2 statistic for the contingency table and the individual χ2
contributions of each cell of the table;(iii) randomize the list of observed spatfall magnitudes among the decades, tabulate the randomized data and re-
calculate the overall and cell χ2 statistics;(iv) record whether the χ2 statistics for the randomized data are greater or smaller than those for the original data;(v) repeat steps (iii) to (iv) a large number of times.
If the observed χ2 statistics, overall or for individual cells, are large compared with the randomization χ2 statistics, then this indicates that the observed data differ significantly from what would be expected by chance. The proportions of randomization χ2 statistics that are as large or larger than the observed statistics can be interpreted in an analogous way to P-values in a standard statistical analysis.
The results of 1,000,000 randomizations are shown in Tables A2.1 and A2.2, for mussels and cockles respectively. The overall test for mussels was not statistically significant (χ2 = 25.9, d.f. = 20, randomization P = 16.1%), but two cells of the contingency table stand out as being significantly different from expectation. If mussel spatfall patterns have remained unchanged, there is only a 3% chance that as many as ten ‘inadequate’ spatfalls would have been recorded in the 1990s, and only a 1% chance that as many as five ‘adequate’ spatfalls would have been recorded in the 1960s (Table A2.1b). The overall test for cockles also was not significant (χ2 = 22.9, d.f. = 20, randomization P = 29.4%). In this case, no individual cell of the contingency table showed a significant departure from chance expectation (Table A2.2).
Correspondence between cockle and mussel spatfall magnitude
The same randomization approach was applied to test for association between cockles and mussels in the magnitude of their spatfall in The Wash (Table 7.2 of the main report). In this case, the observed mussel spatfall magnitudes were randomized with respect to the cockle spatfall magnitudes in each year.
The analysis was first applied to all available data, 1895-1999. The results of 1,000,000 randomizations are shown in Table A2.3. The overall test showed a significant departure from chance expectation (χ2 = 11.5, d.f. = 4, randomization P = 1.8%). The individual cell contributions to this statistic show that, under the null hypothesis of no association between cockle and mussel spatfall magnitude, there is only a 2% chance that as many as four years would show ‘good’ spatfalls coinciding between the two species, only a 1% chance that as few as six ‘inadequate’ mussel spatfalls would coincide with a ‘good’ cockle spatfall, and only a 4% chance that only one ‘inadequate’ cockle spatfall would coincide with a ‘good’ mussel spatfall. Thus, the results of the analysis indicate a significant positive association between cockles and mussels in the magnitude of their spatfall in The Wash.
To eliminate the possibility that this result may have been biased by changes in spatfall patterns during the most recent decade, the analysis was repeated using data for 1895-1989 only. The results of 1,000,000 randomizations, shown in Table A2.4, are essentially the same as for the full data set (overall χ2 = 12.3, d.f. = 4, randomization P = 1.3%).
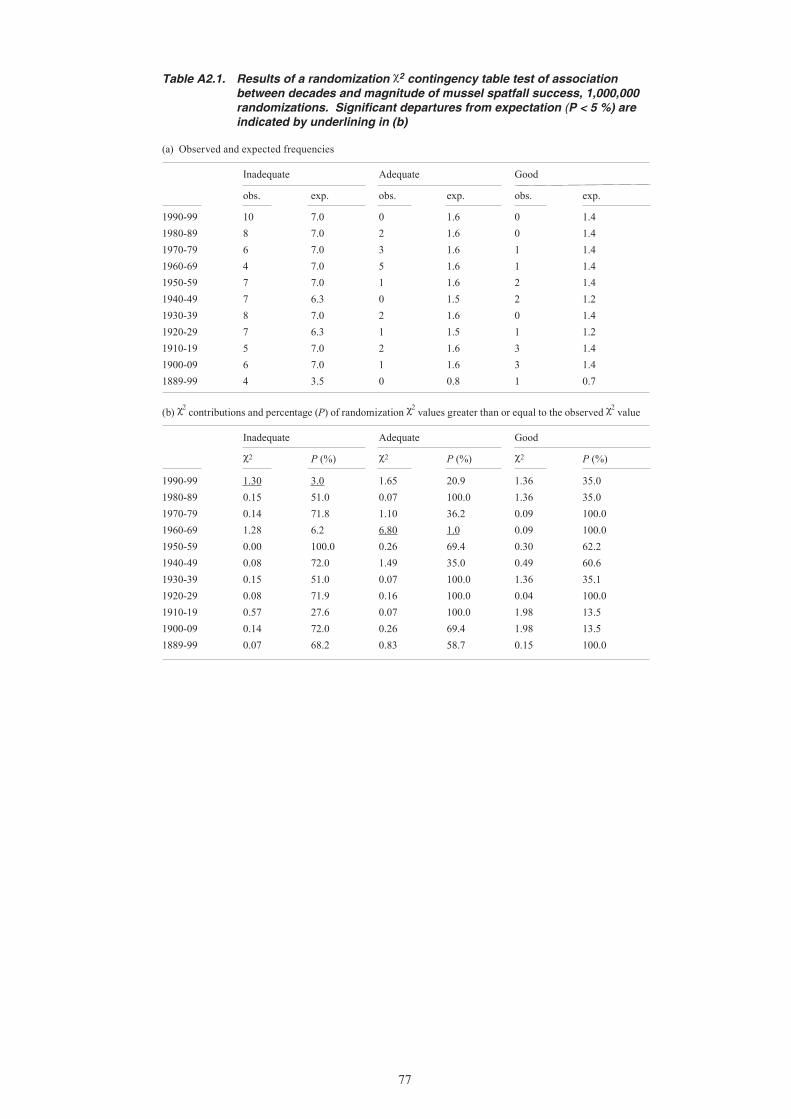
77
Table A2.1. Results of a randomization χ2 contingency table test of association between decades and magnitude of mussel spatfall success, 1,000,000 randomizations. Significant departures from expectation (P < 5 %) are indicated by underlining in (b)
(a) Observed and expected frequencies
Inadequate Adequate Good
obs. exp. obs. exp. obs. exp.
1990-99 10 7.0 0 1.6 0 1.41980-89 8 7.0 2 1.6 0 1.41970-79 6 7.0 3 1.6 1 1.41960-69 4 7.0 5 1.6 1 1.41950-59 7 7.0 1 1.6 2 1.41940-49 7 6.3 0 1.5 2 1.21930-39 8 7.0 2 1.6 0 1.41920-29 7 6.3 1 1.5 1 1.21910-19 5 7.0 2 1.6 3 1.41900-09 6 7.0 1 1.6 3 1.41889-99 4 3.5 0 0.8 1 0.7
(b) χ2 contributions and percentage (P) of randomization χ2 values greater than or equal to the observed χ2 value
Inadequate Adequate Good
χ2 P (%) χ2 P (%) χ2 P (%)
1990-99 1.30 3.0 1.65 20.9 1.36 35.01980-89 0.15 51.0 0.07 100.0 1.36 35.01970-79 0.14 71.8 1.10 36.2 0.09 100.01960-69 1.28 6.2 6.80 1.0 0.09 100.01950-59 0.00 100.0 0.26 69.4 0.30 62.21940-49 0.08 72.0 1.49 35.0 0.49 60.61930-39 0.15 51.0 0.07 100.0 1.36 35.11920-29 0.08 71.9 0.16 100.0 0.04 100.01910-19 0.57 27.6 0.07 100.0 1.98 13.51900-09 0.14 72.0 0.26 69.4 1.98 13.51889-99 0.07 68.2 0.83 58.7 0.15 100.0
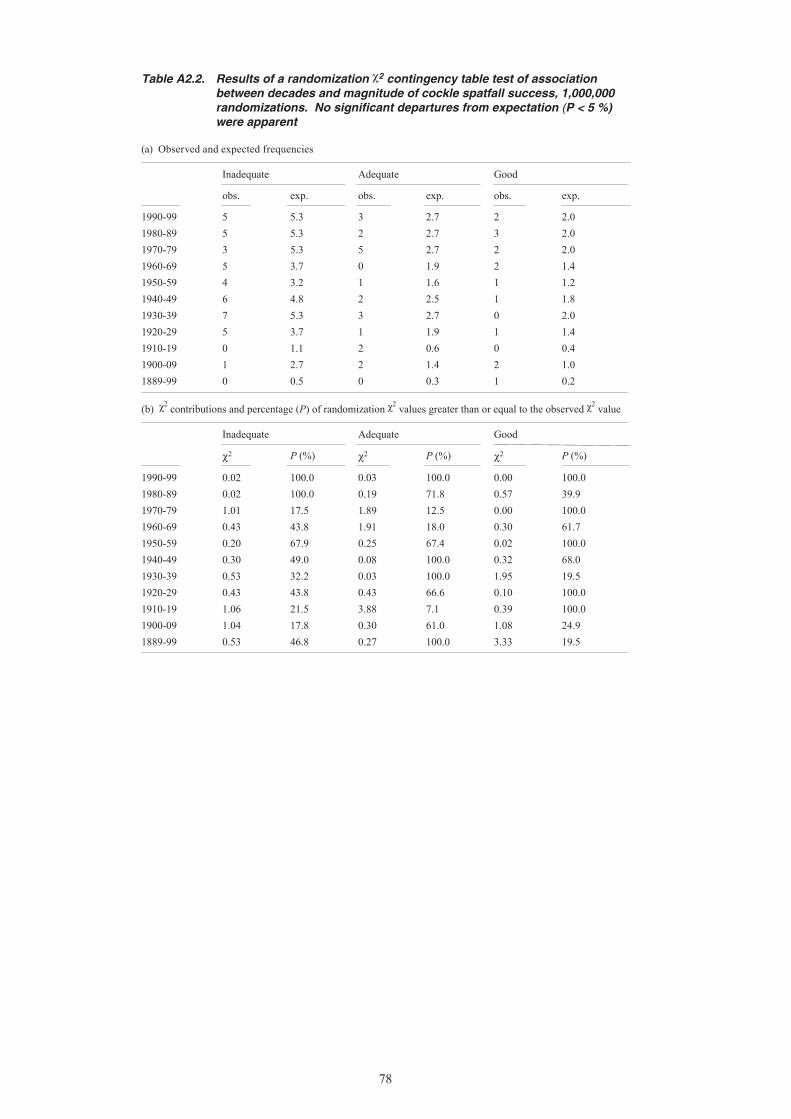
78
Table A2.2. Results of a randomization χ2 contingency table test of association between decades and magnitude of cockle spatfall success, 1,000,000 randomizations. No significant departures from expectation (P < 5 %) were apparent
(a) Observed and expected frequencies
Inadequate Adequate Good
obs. exp. obs. exp. obs. exp.
1990-99 5 5.3 3 2.7 2 2.01980-89 5 5.3 2 2.7 3 2.01970-79 3 5.3 5 2.7 2 2.01960-69 5 3.7 0 1.9 2 1.41950-59 4 3.2 1 1.6 1 1.21940-49 6 4.8 2 2.5 1 1.81930-39 7 5.3 3 2.7 0 2.01920-29 5 3.7 1 1.9 1 1.41910-19 0 1.1 2 0.6 0 0.41900-09 1 2.7 2 1.4 2 1.01889-99 0 0.5 0 0.3 1 0.2
(b) χ2 contributions and percentage (P) of randomization χ2 values greater than or equal to the observed χ2 value
Inadequate Adequate Good
χ2 P (%) χ2 P (%) χ2 P (%)
1990-99 0.02 100.0 0.03 100.0 0.00 100.01980-89 0.02 100.0 0.19 71.8 0.57 39.91970-79 1.01 17.5 1.89 12.5 0.00 100.01960-69 0.43 43.8 1.91 18.0 0.30 61.71950-59 0.20 67.9 0.25 67.4 0.02 100.01940-49 0.30 49.0 0.08 100.0 0.32 68.01930-39 0.53 32.2 0.03 100.0 1.95 19.51920-29 0.43 43.8 0.43 66.6 0.10 100.01910-19 1.06 21.5 3.88 7.1 0.39 100.01900-09 1.04 17.8 0.30 61.0 1.08 24.91889-99 0.53 46.8 0.27 100.0 3.33 19.5
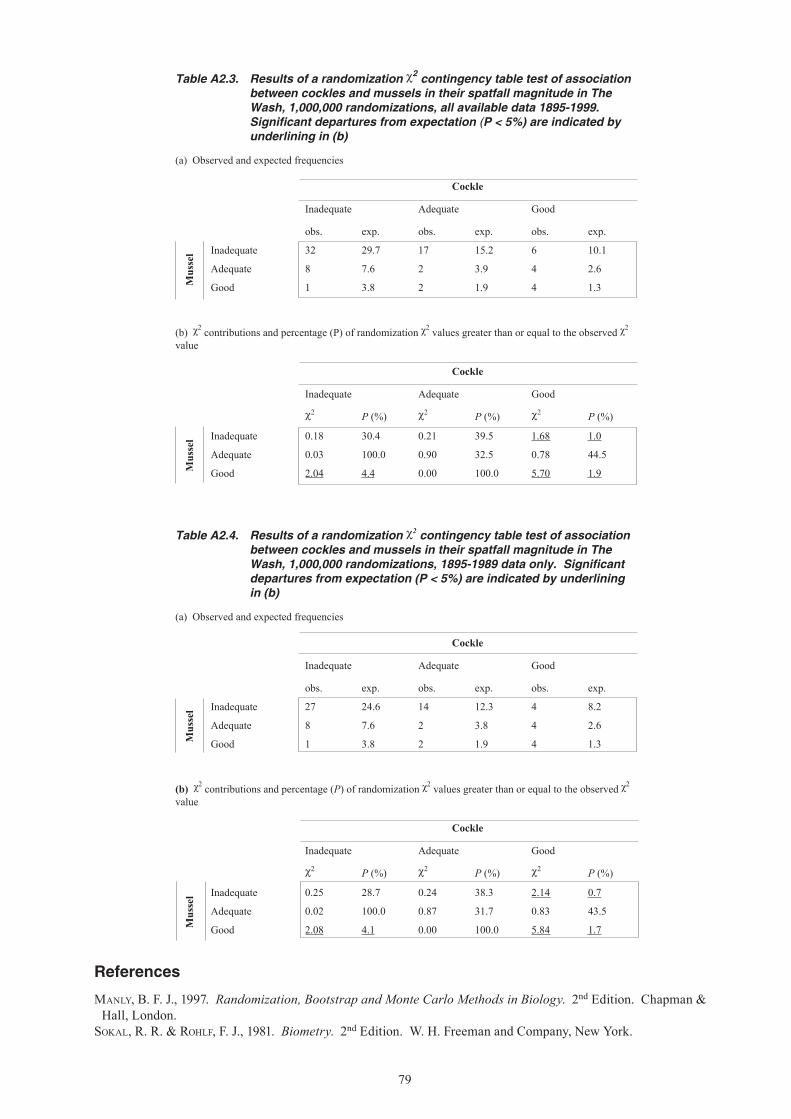
79
References
MANLY, B. F. J., 1997. Randomization, Bootstrap and Monte Carlo Methods in Biology. 2nd Edition. Chapman & Hall, London.
SOKAL, R. R. & ROHLF, F. J., 1981. Biometry. 2nd Edition. W. H. Freeman and Company, New York.
Table A2.3. Results of a randomization χ2 contingency table test of association between cockles and mussels in their spatfall magnitude in The Wash, 1,000,000 randomizations, all available data 1895-1999. Significant departures from expectation (P < 5%) are indicated by underlining in (b)
(a) Observed and expected frequencies
Cockle
Inadequate Adequate Good
obs. exp. obs. exp. obs. exp.
Mus
sel Inadequate 32 29.7 17 15.2 6 10.1
Adequate 8 7.6 2 3.9 4 2.6
Good 1 3.8 2 1.9 4 1.3
(b) χ2 contributions and percentage (P) of randomization χ2 values greater than or equal to the observed χ2 value
Cockle
Inadequate Adequate Good
χ2 P (%) χ2 P (%) χ2 P (%)
Mus
sel Inadequate 0.18 30.4 0.21 39.5 1.68 1.0
Adequate 0.03 100.0 0.90 32.5 0.78 44.5
Good 2.04 4.4 0.00 100.0 5.70 1.9
Table A2.4. Results of a randomization χ2 contingency table test of association between cockles and mussels in their spatfall magnitude in The Wash, 1,000,000 randomizations, 1895-1989 data only. Significant departures from expectation (P < 5%) are indicated by underlining in (b)
(a) Observed and expected frequencies
Cockle
Inadequate Adequate Good
obs. exp. obs. exp. obs. exp.
Mus
sel Inadequate 27 24.6 14 12.3 4 8.2
Adequate 8 7.6 2 3.8 4 2.6
Good 1 3.8 2 1.9 4 1.3
(b) χ2 contributions and percentage (P) of randomization χ2 values greater than or equal to the observed χ2 value
Cockle
Inadequate Adequate Good
χ2 P (%) χ2 P (%) χ2 P (%)
Mus
sel Inadequate 0.25 28.7 0.24 38.3 2.14 0.7
Adequate 0.02 100.0 0.87 31.7 0.83 43.5
Good 2.08 4.1 0.00 100.0 5.84 1.7
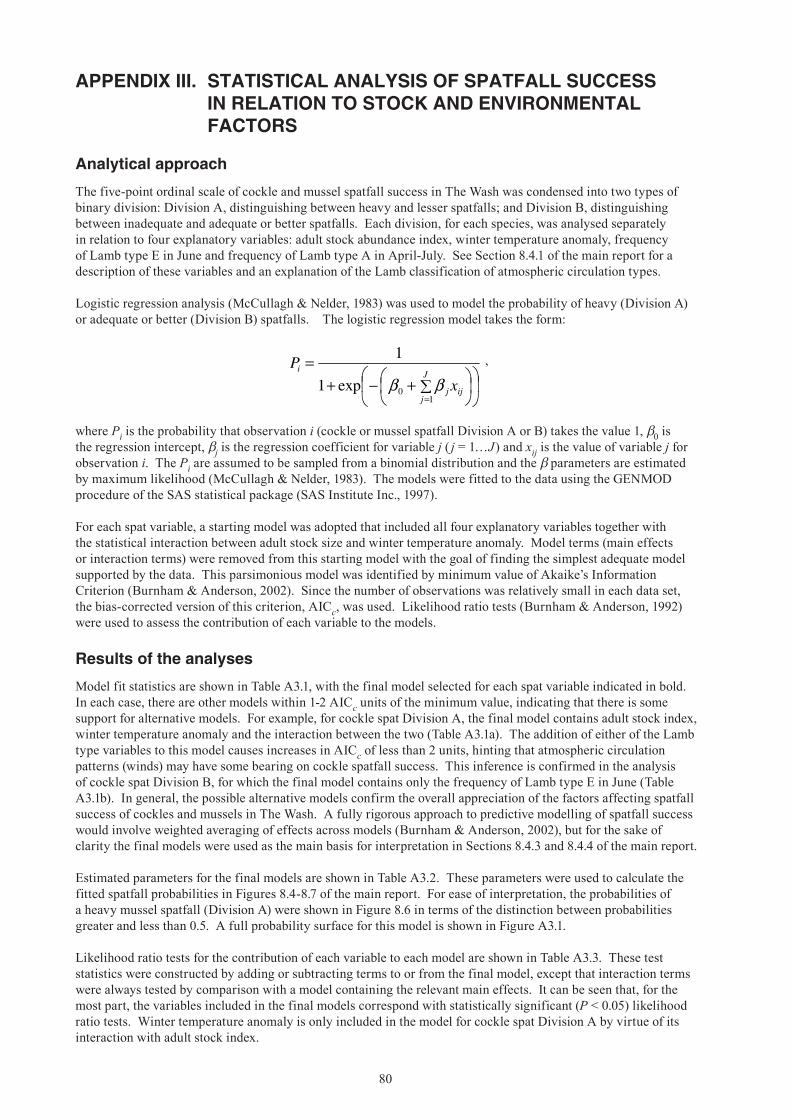
80
APPENDIX III. STATISTICAL ANALYSIS OF SPATFALL SUCCESS IN RELATION TO STOCK AND ENVIRONMENTAL FACTORS
Analytical approach
The five-point ordinal scale of cockle and mussel spatfall success in The Wash was condensed into two types of binary division: Division A, distinguishing between heavy and lesser spatfalls; and Division B, distinguishing between inadequate and adequate or better spatfalls. Each division, for each species, was analysed separately in relation to four explanatory variables: adult stock abundance index, winter temperature anomaly, frequency of Lamb type E in June and frequency of Lamb type A in April-July. See Section 8.4.1 of the main report for a description of these variables and an explanation of the Lamb classification of atmospheric circulation types.
Logistic regression analysis (McCullagh & Nelder, 1983) was used to model the probability of heavy (Division A) or adequate or better (Division B) spatfalls. The logistic regression model takes the form:
,
where Pi is the probability that observation i (cockle or mussel spatfall Division A or B) takes the value 1, β0 is the regression intercept, βj is the regression coefficient for variable j ( j = 1…J) and xij is the value of variable j for observation i. The Pi are assumed to be sampled from a binomial distribution and the β parameters are estimated by maximum likelihood (McCullagh & Nelder, 1983). The models were fitted to the data using the GENMOD procedure of the SAS statistical package (SAS Institute Inc., 1997).
For each spat variable, a starting model was adopted that included all four explanatory variables together with the statistical interaction between adult stock size and winter temperature anomaly. Model terms (main effects or interaction terms) were removed from this starting model with the goal of finding the simplest adequate model supported by the data. This parsimonious model was identified by minimum value of Akaike’s Information Criterion (Burnham & Anderson, 2002). Since the number of observations was relatively small in each data set, the bias-corrected version of this criterion, AICc, was used. Likelihood ratio tests (Burnham & Anderson, 1992) were used to assess the contribution of each variable to the models.
Results of the analyses
Model fit statistics are shown in Table A3.1, with the final model selected for each spat variable indicated in bold. In each case, there are other models within 1-2 AICc units of the minimum value, indicating that there is some support for alternative models. For example, for cockle spat Division A, the final model contains adult stock index, winter temperature anomaly and the interaction between the two (Table A3.1a). The addition of either of the Lamb type variables to this model causes increases in AICc of less than 2 units, hinting that atmospheric circulation patterns (winds) may have some bearing on cockle spatfall success. This inference is confirmed in the analysis of cockle spat Division B, for which the final model contains only the frequency of Lamb type E in June (Table A3.1b). In general, the possible alternative models confirm the overall appreciation of the factors affecting spatfall success of cockles and mussels in The Wash. A fully rigorous approach to predictive modelling of spatfall success would involve weighted averaging of effects across models (Burnham & Anderson, 2002), but for the sake of clarity the final models were used as the main basis for interpretation in Sections 8.4.3 and 8.4.4 of the main report.
Estimated parameters for the final models are shown in Table A3.2. These parameters were used to calculate the fitted spatfall probabilities in Figures 8.4-8.7 of the main report. For ease of interpretation, the probabilities of a heavy mussel spatfall (Division A) were shown in Figure 8.6 in terms of the distinction between probabilities greater and less than 0.5. A full probability surface for this model is shown in Figure A3.1.
Likelihood ratio tests for the contribution of each variable to each model are shown in Table A3.3. These test statistics were constructed by adding or subtracting terms to or from the final model, except that interaction terms were always tested by comparison with a model containing the relevant main effects. It can be seen that, for the most part, the variables included in the final models correspond with statistically significant (P < 0.05) likelihood ratio tests. Winter temperature anomaly is only included in the model for cockle spat Division A by virtue of its interaction with adult stock index.
∑+−+
=
=
J
jijj
i
x
P
10exp1
1
ββ
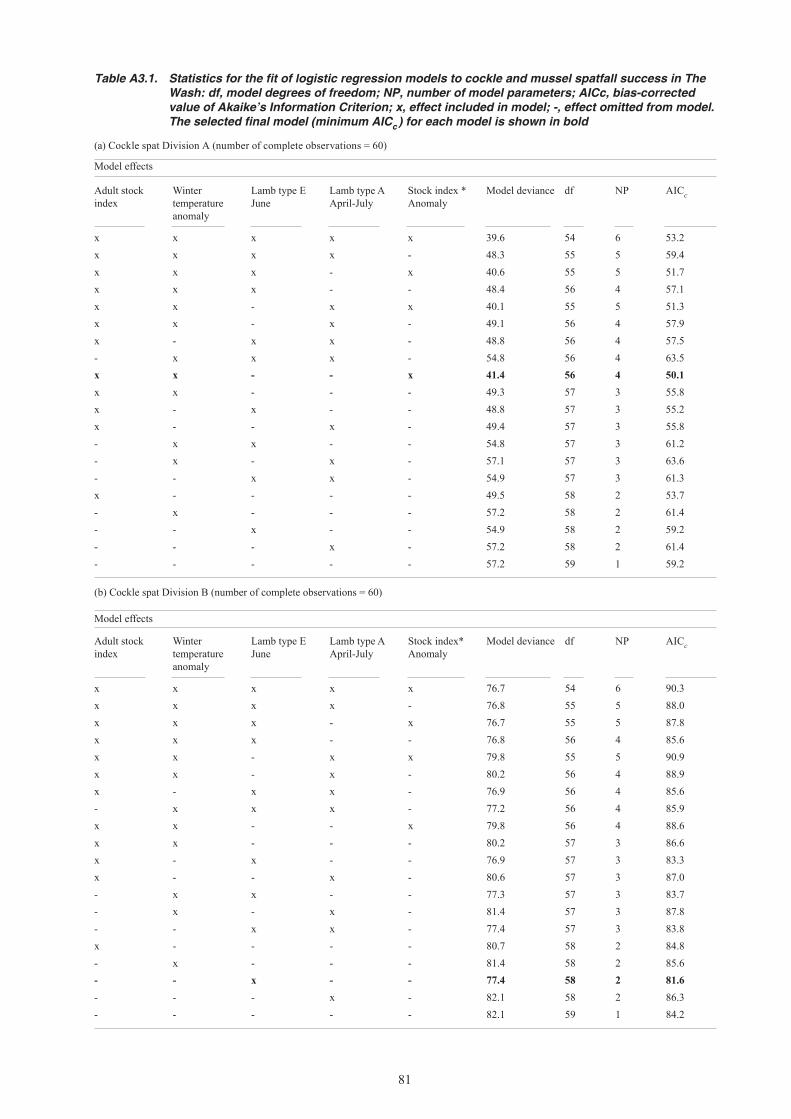
81
Table A3.1. Statistics for the fit of logistic regression models to cockle and mussel spatfall success in The Wash: df, model degrees of freedom; NP, number of model parameters; AICc, bias-corrected value of Akaike’s Information Criterion; x, effect included in model; -, effect omitted from model. The selected final model (minimum AICc ) for each model is shown in bold
(a) Cockle spat Division A (number of complete observations = 60)
Model effects
Adult stock index
Winter temperature anomaly
Lamb type E June
Lamb type A April-July
Stock index * Anomaly
Model deviance df NP AICc
x x x x x 39.6 54 6 53.2x x x x - 48.3 55 5 59.4x x x - x 40.6 55 5 51.7x x x - - 48.4 56 4 57.1x x - x x 40.1 55 5 51.3x x - x - 49.1 56 4 57.9x - x x - 48.8 56 4 57.5- x x x - 54.8 56 4 63.5x x - - x 41.4 56 4 50.1x x - - - 49.3 57 3 55.8x - x - - 48.8 57 3 55.2x - - x - 49.4 57 3 55.8- x x - - 54.8 57 3 61.2- x - x - 57.1 57 3 63.6- - x x - 54.9 57 3 61.3x - - - - 49.5 58 2 53.7- x - - - 57.2 58 2 61.4- - x - - 54.9 58 2 59.2- - - x - 57.2 58 2 61.4- - - - - 57.2 59 1 59.2
(b) Cockle spat Division B (number of complete observations = 60)
Model effects
Adult stock index
Winter temperature anomaly
Lamb type E June
Lamb type A April-July
Stock index* Anomaly
Model deviance df NP AICc
x x x x x 76.7 54 6 90.3x x x x - 76.8 55 5 88.0x x x - x 76.7 55 5 87.8x x x - - 76.8 56 4 85.6x x - x x 79.8 55 5 90.9x x - x - 80.2 56 4 88.9x - x x - 76.9 56 4 85.6- x x x - 77.2 56 4 85.9x x - - x 79.8 56 4 88.6x x - - - 80.2 57 3 86.6x - x - - 76.9 57 3 83.3x - - x - 80.6 57 3 87.0- x x - - 77.3 57 3 83.7- x - x - 81.4 57 3 87.8- - x x - 77.4 57 3 83.8x - - - - 80.7 58 2 84.8- x - - - 81.4 58 2 85.6- - x - - 77.4 58 2 81.6- - - x - 82.1 58 2 86.3- - - - - 82.1 59 1 84.2
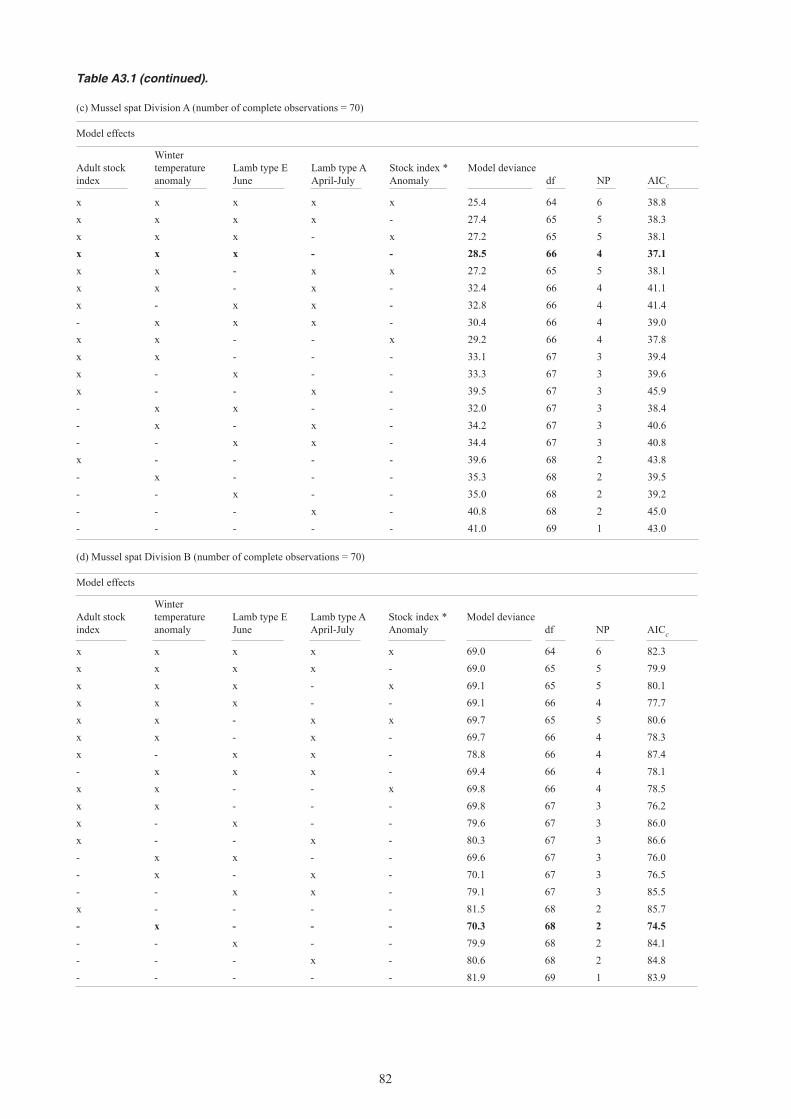
82
Table A3.1 (continued).
(c) Mussel spat Division A (number of complete observations = 70)
Model effects
Adult stock index
Winter temperature anomaly
Lamb type E June
Lamb type A April-July
Stock index * Anomaly
Model deviancedf NP AICc
x x x x x 25.4 64 6 38.8x x x x - 27.4 65 5 38.3x x x - x 27.2 65 5 38.1x x x - - 28.5 66 4 37.1x x - x x 27.2 65 5 38.1x x - x - 32.4 66 4 41.1x - x x - 32.8 66 4 41.4- x x x - 30.4 66 4 39.0x x - - x 29.2 66 4 37.8x x - - - 33.1 67 3 39.4x - x - - 33.3 67 3 39.6x - - x - 39.5 67 3 45.9- x x - - 32.0 67 3 38.4- x - x - 34.2 67 3 40.6- - x x - 34.4 67 3 40.8x - - - - 39.6 68 2 43.8- x - - - 35.3 68 2 39.5- - x - - 35.0 68 2 39.2- - - x - 40.8 68 2 45.0- - - - - 41.0 69 1 43.0
(d) Mussel spat Division B (number of complete observations = 70)
Model effects
Adult stock index
Winter temperature anomaly
Lamb type E June
Lamb type A April-July
Stock index * Anomaly
Model deviancedf NP AICc
x x x x x 69.0 64 6 82.3x x x x - 69.0 65 5 79.9x x x - x 69.1 65 5 80.1x x x - - 69.1 66 4 77.7x x - x x 69.7 65 5 80.6x x - x - 69.7 66 4 78.3x - x x - 78.8 66 4 87.4- x x x - 69.4 66 4 78.1x x - - x 69.8 66 4 78.5x x - - - 69.8 67 3 76.2x - x - - 79.6 67 3 86.0x - - x - 80.3 67 3 86.6- x x - - 69.6 67 3 76.0- x - x - 70.1 67 3 76.5- - x x - 79.1 67 3 85.5x - - - - 81.5 68 2 85.7- x - - - 70.3 68 2 74.5- - x - - 79.9 68 2 84.1- - - x - 80.6 68 2 84.8- - - - - 81.9 69 1 83.9
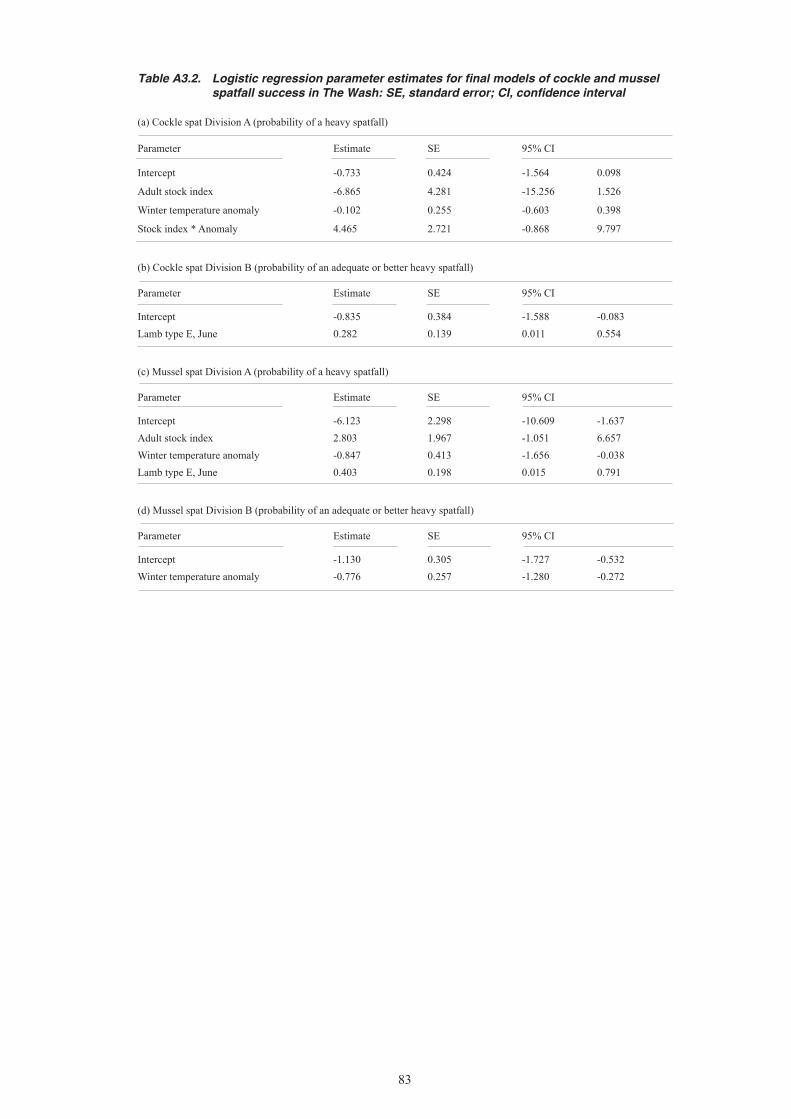
83
Table A3.2. Logistic regression parameter estimates for final models of cockle and mussel spatfall success in The Wash: SE, standard error; CI, confidence interval
(a) Cockle spat Division A (probability of a heavy spatfall)
Parameter Estimate SE 95% CI
Intercept -0.733 0.424 -1.564 0.098
Adult stock index -6.865 4.281 -15.256 1.526
Winter temperature anomaly -0.102 0.255 -0.603 0.398
Stock index * Anomaly 4.465 2.721 -0.868 9.797
(b) Cockle spat Division B (probability of an adequate or better heavy spatfall)
Parameter Estimate SE 95% CI
Intercept -0.835 0.384 -1.588 -0.083Lamb type E, June 0.282 0.139 0.011 0.554
(c) Mussel spat Division A (probability of a heavy spatfall)
Parameter Estimate SE 95% CI
Intercept -6.123 2.298 -10.609 -1.637Adult stock index 2.803 1.967 -1.051 6.657Winter temperature anomaly -0.847 0.413 -1.656 -0.038Lamb type E, June 0.403 0.198 0.015 0.791
(d) Mussel spat Division B (probability of an adequate or better heavy spatfall)
Parameter Estimate SE 95% CI
Intercept -1.130 0.305 -1.727 -0.532Winter temperature anomaly -0.776 0.257 -1.280 -0.272
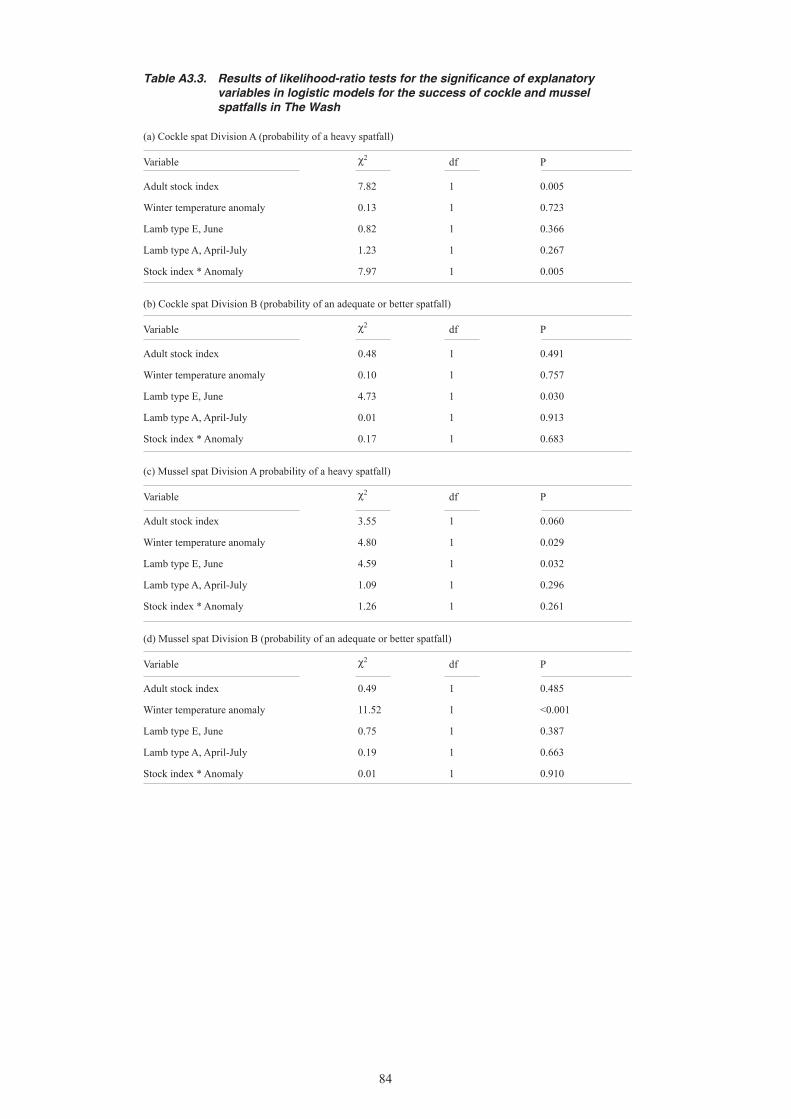
84
Table A3.3. Results of likelihood-ratio tests for the significance of explanatory variables in logistic models for the success of cockle and mussel spatfalls in The Wash
(a) Cockle spat Division A (probability of a heavy spatfall)
Variable χ2 df P
Adult stock index 7.82 1 0.005
Winter temperature anomaly 0.13 1 0.723
Lamb type E, June 0.82 1 0.366
Lamb type A, April-July 1.23 1 0.267
Stock index * Anomaly 7.97 1 0.005
(b) Cockle spat Division B (probability of an adequate or better spatfall)
Variable χ2 df P
Adult stock index 0.48 1 0.491
Winter temperature anomaly 0.10 1 0.757
Lamb type E, June 4.73 1 0.030
Lamb type A, April-July 0.01 1 0.913
Stock index * Anomaly 0.17 1 0.683
(c) Mussel spat Division A probability of a heavy spatfall)
Variable χ2 df P
Adult stock index 3.55 1 0.060
Winter temperature anomaly 4.80 1 0.029
Lamb type E, June 4.59 1 0.032
Lamb type A, April-July 1.09 1 0.296
Stock index * Anomaly 1.26 1 0.261
(d) Mussel spat Division B (probability of an adequate or better spatfall)
Variable χ2 df P
Adult stock index 0.49 1 0.485
Winter temperature anomaly 11.52 1 <0.001
Lamb type E, June 0.75 1 0.387
Lamb type A, April-July 0.19 1 0.663
Stock index * Anomaly 0.01 1 0.910
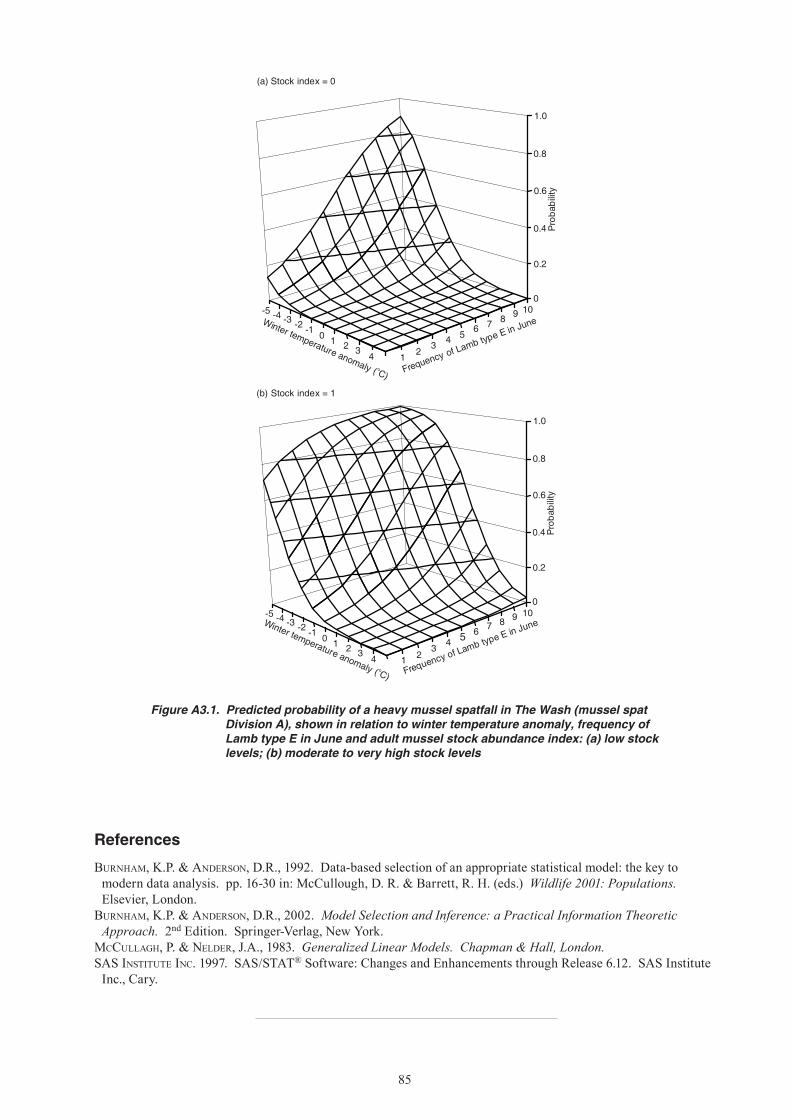
85
References
BURNHAM, K.P. & ANDERSON, D.R., 1992. Data-based selection of an appropriate statistical model: the key to modern data analysis. pp. 16-30 in: McCullough, D. R. & Barrett, R. H. (eds.) Wildlife 2001: Populations. Elsevier, London.
BURNHAM, K.P. & ANDERSON, D.R., 2002. Model Selection and Inference: a Practical Information Theoretic Approach. 2nd Edition. Springer-Verlag, New York.
MCCULLAGH, P. & NELDER, J.A., 1983. Generalized Linear Models. Chapman & Hall, London.SAS INSTITUTE INC. 1997. SAS/STAT® Software: Changes and Enhancements through Release 6.12. SAS Institute
Inc., Cary.
Figure A3.1. Predicted probability of a heavy mussel spatfall in The Wash (mussel spat Division A), shown in relation to winter temperature anomaly, frequency of Lamb type E in June and adult mussel stock abundance index: (a) low stock levels; (b) moderate to very high stock levels
1
0
0.2
Probability
0.4
0.6
1.0
23 4 5
Frequenc
y ofLam
b type E i
n June
1-1-2-3-4-5
02 3
4
Winter temperature anomaly ( C)o
6 7 8 9 10
0.8
(a) Stock index = 0
1
1-1-2-3-4-5
0
0
0.2
Probability
0.4
0.6
0.8
1.0
2 34 2
34 5
Frequenc
y ofLam
b type E in Ju
neWinter temperature anomaly ( C)o
6 7 8 9 10
(b) Stock index = 1
The Centre for Environment, Fisheries & Aquaculture ScienceLowestoft Laboratory, Pakefield Road,Lowestoft, Suffolk NR33 0HT UKTel: +44 (0) 1502 562244Fax: +44 (0) 1502 513865www.cefas.co.uk
Historical and current status of cockle and m
ussel stocks in The Wash
ISBN 0 907545 18 1