Hispanic Spend Trends Among Top 500...
14
1
Transcript of Hispanic Spend Trends Among Top 500...

1
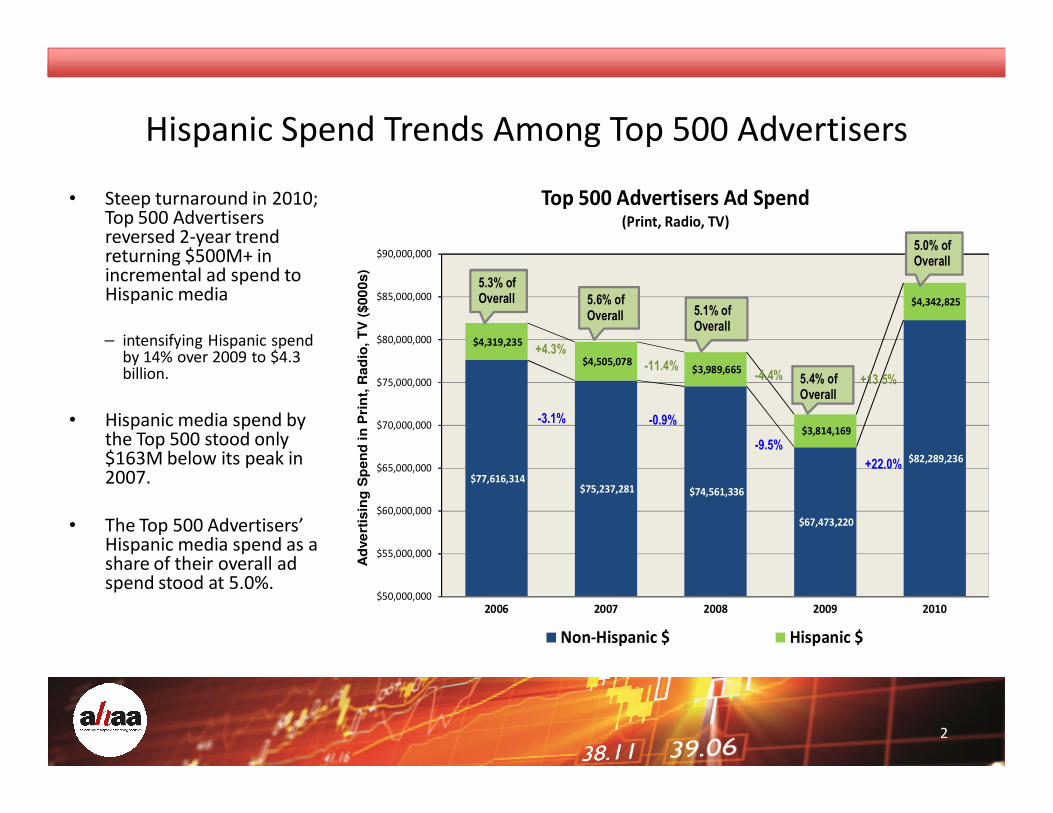
Hispanic Spend Trends Among Top 500 Advertisers
• Steep turnaround in 2010; Top 500 Advertisers reversed 2-year trend returning $500M+ in incremental ad spend to Hispanic media
– intensifying Hispanic spend by 14% over 2009 to $4.3 billion.
• Hispanic media spend by the Top 500 stood only $163M below its peak in 2007.
• The Top 500 Advertisers’ Hispanic media spend as a share of their overall ad spend stood at 5.0%.
2
$77,616,314 $75,237,281 $74,561,336
$67,473,220
$82,289,236
$4,319,235
$4,505,078 $3,989,665
$3,814,169
$4,342,825
$50,000,000
$55,000,000
$60,000,000
$65,000,000
$70,000,000
$75,000,000
$80,000,000
$85,000,000
$90,000,000
2006 2007 2008 2009 2010
Ad
ve
rtis
ing
Sp
en
d in
Pri
nt,
Rad
io, T
V (
$00
0s)
Top 500 Advertisers Ad Spend(Print, Radio, TV)
Non-Hispanic $ Hispanic $
+4.3%
-11.4%-4.4%
-3.1% -0.9%
-9.5%
5.3% of
Overall
5.4% of
Overall
5.1% of
Overall
5.6% of
Overall
+22.0%
+13.5%
5.0% of
Overall
2006-2010 Hispanic
Ad Spend Trends
3
Best-in-class
Leader
Follower
Laggard
Denial
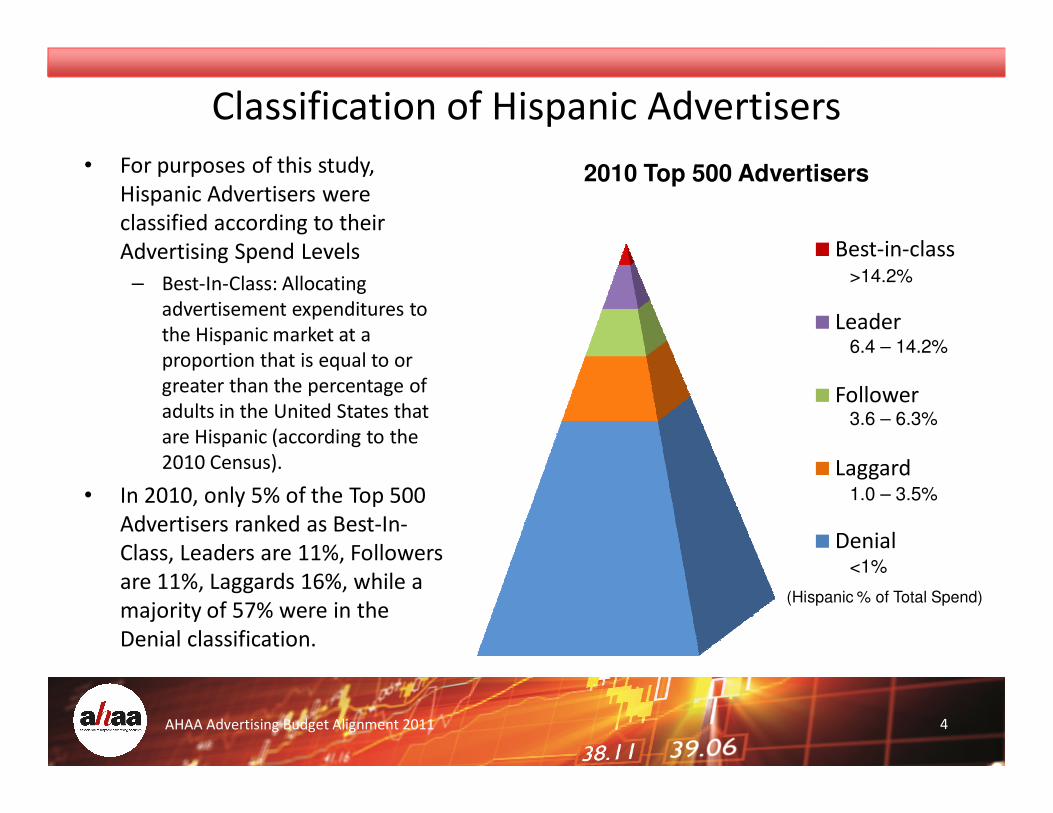
Classification of Hispanic Advertisers
AHAA Advertising Budget Alignment 2011 4
• For purposes of this study,
Hispanic Advertisers were
classified according to their
Advertising Spend Levels
– Best-In-Class: Allocating
advertisement expenditures to
the Hispanic market at a
proportion that is equal to or
greater than the percentage of
adults in the United States that
are Hispanic (according to the
2010 Census).
• In 2010, only 5% of the Top 500
Advertisers ranked as Best-In-
Class, Leaders are 11%, Followers
are 11%, Laggards 16%, while a
majority of 57% were in the
Denial classification.
2010 Top 500 Advertisers
>14.2%
6.4 – 14.2%
3.6 – 6.3%
1.0 – 3.5%
<1%
(Hispanic % of Total Spend)

Beer$151
Direct Consumer
Marketing$79
Financial Services-Tax
Prep & Other$91
Auto
Insurance$176
Media & Ent
Subsc TV/Radio$349
Restaurants
QSR$301
Retail-Mass Mer/Dept St$161
Telecom$502
Fitness-Sports$17
Govt & Lottery$99
Home Impr/Builder$96
$0 Insurance-Other
$20
$(100)
$(50)
$-
$50
$100
$150
$200
$250
$300
6% 8% 10% 12% 14% 16% 18% 20% 22% 24% 26%SP
EN
D $
DIF
FE
RE
NC
E 2
01
0 v
. 2
00
6
HISPANIC ALLOCATION OF OVERALL AD SPEND
Best In Class3 of 51 categories ranked as Best-
In-Class in 2010• Beer and Financial Services-Tax Prep
& Other increased spend by 21%
• Direct Consumer Marketing was the
only Best-In-Class category that
decreased its spending from pre-
recession levels
5
B-I-C & Leaders: 2010 v. 2006 Spending Allocation
Best-in-Class in red

Beer$151
Direct Consumer
Marketing$79
Financial Services-Tax
Prep & Other$91
Auto
Insurance$176
Media & Ent
Subsc TV/Radio$349
Restaurants
QSR$301
Retail-Mass Mer/Dept St$161
Telecom$502
Fitness-Sports$17
Govt & Lottery$99
Home Impr/Builder$96
$0 Insurance-Other
$20
$(100)
$(50)
$-
$50
$100
$150
$200
$250
$300
6% 8% 10% 12% 14% 16% 18% 20% 22% 24% 26%SP
EN
D $
DIF
FE
RE
NC
E 2
01
0 v
. 2
00
6
HISPANIC ALLOCATION OF OVERALL AD SPEND
6
B-I-C & Leaders: 2010 v. 2006 Spending Allocation
10 of 51 categories ranked as Leaders• Media & Entertainment –Subscription TV/Radio
category sky-rocketed the most, nearly $246M
or 238% since 2006.
• QSR category showed a significant increase of
30% or $70M in incremental investment
• Home Improvement & Builders category
rebounded from the recession dip increasing 6%
over its 2006 base of $91M.
• Only Government & Lottery and Retail Mass
Merchandisers/ Department Stores experienced
decreases in overall spending.
Leaders
Leaders in Black

2010 Category & Company HighlightsCategory Best-In-Class Leaders
Subscription TV Direct TV, Echostar, Time
Warner Cable
Auto Insurance State Farm, Allstate Nationwide
Financial Services/Tax
Preparation
H&R Block
Beer Grupo Modelo, SAB Miller Anheuser InBev
Direct Consumer
Marketing
Lexicon, Telebrands Green Bullion Financial,
Ideavillage
Telecom Deutsche Telekom, Vonage Leap Wireless, Metro PCS,
Sprint, Verizon, AT&T
QSR AFC Enterprises, Dominos,
McDonalds
Jack in the Box, Sonic
Home Improvement Ace Hardware, Lowes,
Home Depot
AHAA Advertising Budget Alignment 2011 7

2010 Category & Company Highlights
Category Best-in-Class Leader
Packaged Goods Colgate General Mills, Ralcorp,
Mars, Groupe Danone,
Clorox, Unilever, SC
Johnson
Auto Manufacturers Toyota
Media & Entertainment Televisa, Univision, Vivendi
Bank-Mortgage Wells Fargo
AHAA Advertising Budget Alignment 2011 8

Hispanic Allocation
& Overall Corporate Revenue
Growth
…Is There A Connection?
9
Absolutely!
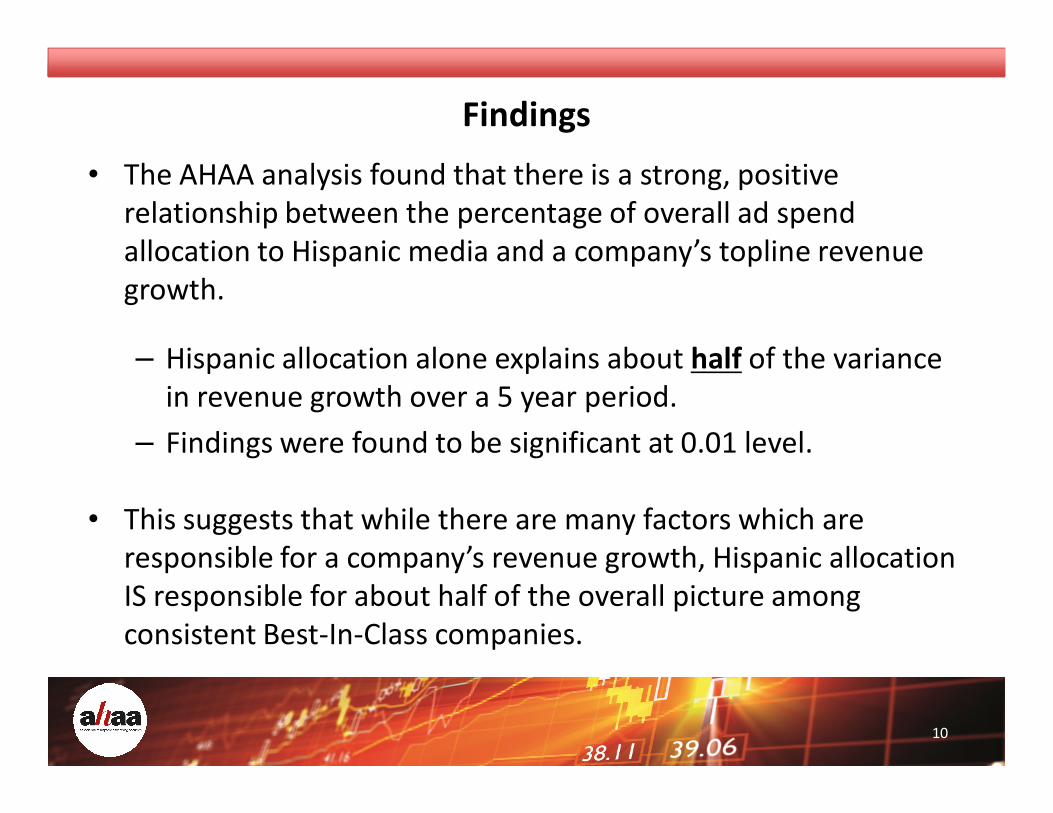
Findings
• The AHAA analysis found that there is a strong, positive
relationship between the percentage of overall ad spend
allocation to Hispanic media and a company’s topline revenue
growth.
– Hispanic allocation alone explains about half of the variance
in revenue growth over a 5 year period.
– Findings were found to be significant at 0.01 level.
• This suggests that while there are many factors which are
responsible for a company’s revenue growth, Hispanic allocation
IS responsible for about half of the overall picture among
consistent Best-In-Class companies.
10

Findings
• In other words, the AHAA study found that, in general, for consistent
Best-In-Class marketers…
– a 5 percentage point shift in ad spend allocation from non-Hispanic towards
Hispanic would yield between 1.1 and 6.6 percentage point increase in overall
corporate revenue.
– a 10 percentage point increase in Hispanic allocation will see between 2.2% and
11.2% acceleration in annual topline revenue growth rate.
That is, a Best-In-Class company allocating one quarter of its ad spend to Hispanic
media over five years, would generate annual revenue growth of about 6.7%.
• Findings were found with a confidence level of 99%.
11
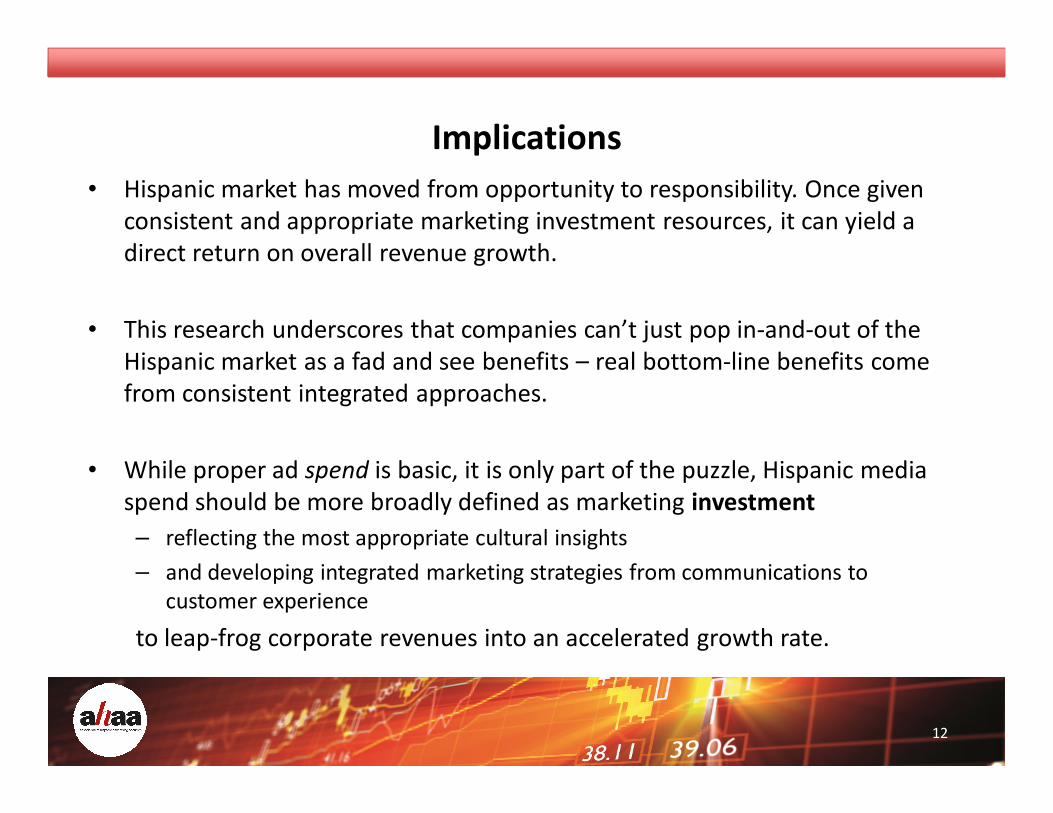
Implications
• Hispanic market has moved from opportunity to responsibility. Once given
consistent and appropriate marketing investment resources, it can yield a
direct return on overall revenue growth.
• This research underscores that companies can’t just pop in-and-out of the
Hispanic market as a fad and see benefits – real bottom-line benefits come
from consistent integrated approaches.
• While proper ad spend is basic, it is only part of the puzzle, Hispanic media
spend should be more broadly defined as marketing investment
– reflecting the most appropriate cultural insights
– and developing integrated marketing strategies from communications to
customer experience
to leap-frog corporate revenues into an accelerated growth rate.
12

Methodology• Started with 35,000 overall advertisers in Nielsen data, looked at the Top 500 Advertisers by
year and in aggregate, grouped them in five distinct levels of Hispanic allocation tiers, then
matched each parent company to available published revenue data, and calculate
compounded annual growth rates.
• 40 companies showed an aggregate Best-In-Class Hispanic allocation (above 14.2%).
• Companies which did not have consistent published financials such as venture capital firms,
companies which had restated their earnings, non-profit organizations and companies which
grew on acquisition sprees rather than consumer driven growth were eliminated from the
final regression set.
• Final set of Best-In-Class in analysis included 14 companies: AFC (Church’s, Popeye’s), Allstate,
AutoZone, Colgate-Palmolive, Collective Brands (Payless), DirecTV, Domino’s Pizza, EchoStar
Communications (Dish Network, Dish Latino), Heineken, JC Penney, Rent-A-Center, SAB Miller,
State Farm, and Vivendi.
• Ran nearly 100 regression analyses including: by tier, in tier combinations, by single year as
well as in aggregate looking to identify any correlation patterns between percentage of ad
spend allocation dedicated to Hispanic and overall revenue growth rates.
• Validated methodology, added new regressions and validated results with independent
academic advisor.
13
Thank you! ¡Gracias!
AHAA Advertising Budget Alignment 2011 14