PEW Hispanic Center A Portrait of Unauthorized Immigrants inthe United States
Upload
ricky-rangelCategory
view
31download
0
Econ.420 Hispanic Immigrants’ Academic 05/30/2014 Achievements By Nationality] 1
Luis Rangel
Hispanic Immigrants’ Academic Achievements by Nationality
Abstract: In this paper, we estimate the academic success of immigrant kids in middle and high schools from Miami, Ft. Lauderdale, and San Diego. The test studies the relationship between the student’s academic success (GPA) and their ethnicity, the families economic status, fathers education, number of siblings, if the student is US born, if the student speaks English, and hours per day spent on homework. In order to test the ethnicity, we broke it up into two groups, North America and South America. North America included Mexico, the Caribbean Islands and Central America. South America included everything south of Panama. Our results suggested that ethnicity does not play a role in the academic achievement of an individual. The key players in the academic success of a US immigrant of Hispanic descent are the family’s economic status and most importantly the amount of time the individual spent on homework. The model shows that the better the economic status of the family and the more time the student spends doing homework, on average the student will be more likely to be successful in his academics (in terms of a higher GPA).
1 Introduction A multitude of studies have been conducted to show the academic achievements of immigrants of Hispanic descent compared to the academic achievements of other immigrants and minority groups in the US. These studies show the educational disparity among Hispanics compared to other races and minorities. According to the 2003 U.S Census Only 11% of Hispanics over the age of 25 have higher education degrees compared with 17% of African Americans, 30% of Whites, and 49% of Asian Americans. My concern with these studies is that they are usually conducted by race and rarely by nationality. The current Hispanic immigration wave is one of the greatest trends in the US; the Hispanic population is the fastest growing minority group in the United States. Unfortunately the low rates of high school diplomas and higher education degrees amongst this vast group can be detrimental to our economy. The education level in the US is directly correlated with poverty, crime, and economic development. Aiding the Hispanic population to excel in academics will benefit the US economy by reducing its poverty rates. This will also help reduce the amount of people using government-sponsored programs. As people move from lower class neighborhoods the population in ghettos lessens; less ghettos translates to lower crime rates. Furthermore, as more people move up in socioeconomic status the economy is stimulated triggering job creation, and social and economic advances.
Econ.420 Hispanic Immigrants’ Academic 05/30/2014 Achievements By Nationality] 2
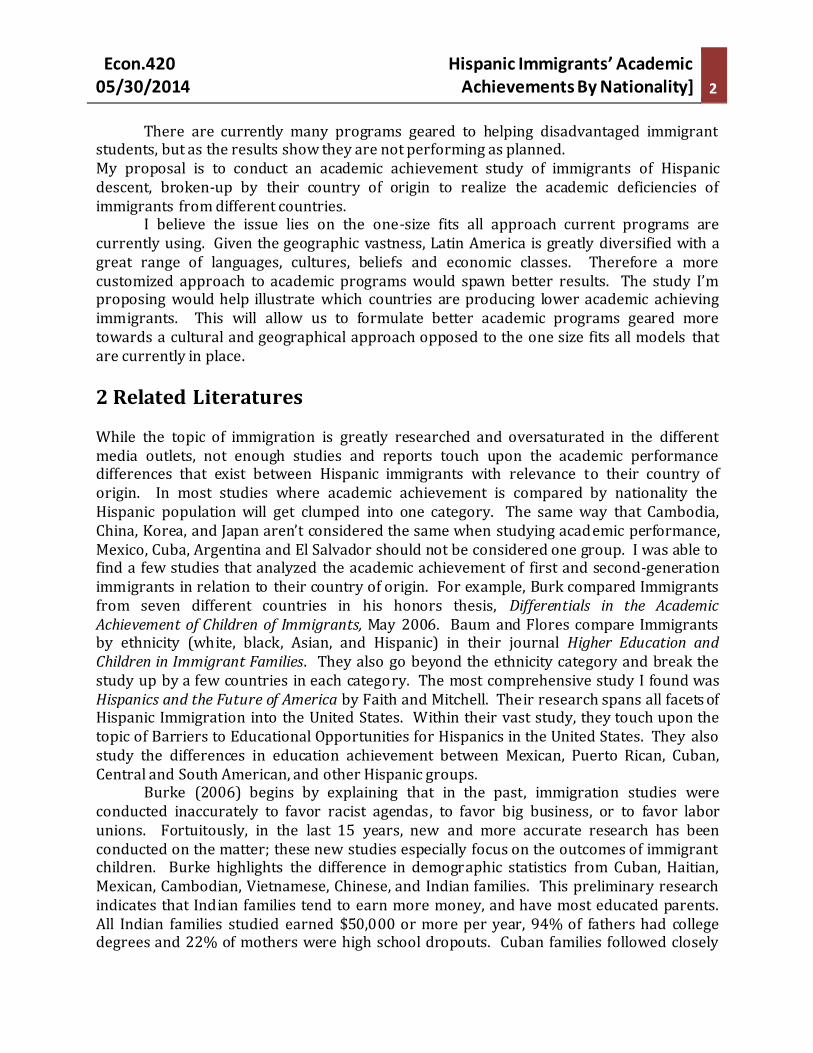
There are currently many programs geared to helping disadvantaged immigrant students, but as the results show they are not performing as planned. My proposal is to conduct an academic achievement study of immigrants of Hispanic descent, broken-up by their country of origin to realize the academic deficiencies of immigrants from different countries.
I believe the issue lies on the one-size fits all approach current programs are currently using. Given the geographic vastness, Latin America is greatly diversified with a great range of languages, cultures, beliefs and economic classes. Therefore a more customized approach to academic programs would spawn better results. The study I’m proposing would help illustrate which countries are producing lower academic achieving immigrants. This will allow us to formulate better academic programs geared more towards a cultural and geographical approach opposed to the one size fits all models that are currently in place.
2 Related Literatures While the topic of immigration is greatly researched and oversaturated in the different media outlets, not enough studies and reports touch upon the academic performance differences that exist between Hispanic immigrants with relevance to their country of origin. In most studies where academic achievement is compared by nationality the Hispanic population will get clumped into one category. The same way that Cambodia, China, Korea, and Japan aren’t considered the same when studying academic performance, Mexico, Cuba, Argentina and El Salvador should not be considered one group. I was able to find a few studies that analyzed the academic achievement of first and second-generation immigrants in relation to their country of origin. For example, Burk compared Immigrants from seven different countries in his honors thesis, Differentials in the Academic Achievement of Children of Immigrants, May 2006. Baum and Flores compare Immigrants by ethnicity (white, black, Asian, and Hispanic) in their journal Higher Education and Children in Immigrant Families. They also go beyond the ethnicity category and break the study up by a few countries in each category. The most comprehensive study I found was Hispanics and the Future of America by Faith and Mitchell. Their research spans all facets of Hispanic Immigration into the United States. Within their vast study, they touch upon the topic of Barriers to Educational Opportunities for Hispanics in the United States. They also study the differences in education achievement between Mexican, Puerto Rican, Cuban, Central and South American, and other Hispanic groups. Burke (2006) begins by explaining that in the past, immigration studies were conducted inaccurately to favor racist agendas, to favor big business, or to favor labor unions. Fortuitously, in the last 15 years, new and more accurate research has been conducted on the matter; these new studies especially focus on the outcomes of immigrant children. Burke highlights the difference in demographic statistics from Cuban, Haitian, Mexican, Cambodian, Vietnamese, Chinese, and Indian families. This preliminary research indicates that Indian families tend to earn more money, and have most educated parents. All Indian families studied earned $50,000 or more per year, 94% of fathers had college degrees and 22% of mothers were high school dropouts. Cuban families followed closely

Econ.420 Hispanic Immigrants’ Academic 05/30/2014 Achievements By Nationality] 3
with 22% of families earning less than $50,000, 29% of fathers had college degrees, and 25% of mothers were high school dropouts. Chinese families came in third place with 35% earning under $50,000, 40% of fathers had a higher education, and 32% of mothers were high school dropouts. In last place were Cambodian families with 82% making less than $50,000, only 10% of fathers had a higher education and 45% of mothers were high school dropouts.
Burke concludes that while parent’s education, family income, nationality, family stability and size may play a role in the academic achievement of immigrant children, they are not clear on whether these factors are responsible for the academic achievement in the different groups. There are other immeasurable factors to take into account like the importance parents put on academic achievement, the respect and manners taught to the kids at an early age, and a big question is do high achieving schools produce high achieving students or do high achieving students produce high achieving schools? Baum and Flores in Education and Children in Immigrant Families, (2011), attempt to explain the disparity between different ethnicities and nationalities given first and second generation, socioeconomic status, schools and the legal barriers that greet them in the United States. They began by comparing the academic achievement of Hispanic Immigrants and their children with US natives. After establishing that there was a difference in academic achievement, they looked at the different variables that could be causing the inequality. Some of the major variables were the country of origin, educational factors like infrastructure, community, quality of education, and legal barriers. According to their research, these characteristics explain most of the variation in academic success.
The 2009 research on the disparity between first and second generation immigrants between the ages of twenty-five and thirty-four, indicated that first generation immigrants were 19% more likely to have received less than a high school education, second generation students were 14% more likely to receive some college or associate’s degree, as well as 5% more likely to receive a Bachelor’s degree or higher. Baum and Flores explain that the issue equally affects native youths whose parents have no college education and are from low-income households. Therefore, the problem is not necessarily confined to immigrants, but there are other factors that affect immigrants that natives (Caucasians) don’t experience. Some of these differences include not having the information about college opportunities or how to access the information, cultural differences that might emphasize work over an education, and sometimes it can also be discrimination and other legal barriers that keep immigrants from completing high school and obtaining a higher education.
Another big issue is the polarity that exists in the US higher education system. There is a major divide between immigrants, the highly skilled professionals and the unskilled labor workers. The descendants of the highly skilled immigrants generally find the doors to US colleges wide open while descendants of low class unskilled immigrant workers will find closed doors. In order to narrow down on the gap between these two groups, we must improve the outlook for social and economic mobility on society as a whole. The problem rests upon the large number of immigrants that are not getting a college education. The size of the uneducated is much larger than the educated; this will have a vast negative impact on the US as the demand for skilled workers increases and
Econ.420 Hispanic Immigrants’ Academic 05/30/2014 Achievements By Nationality] 4
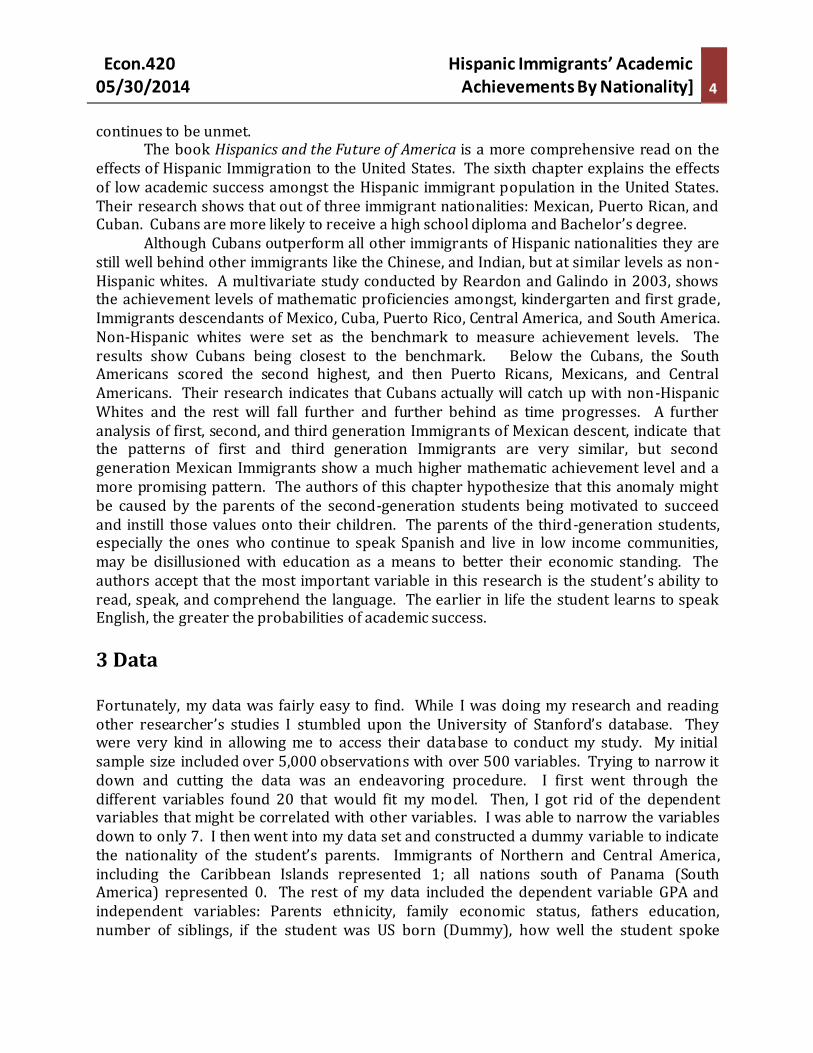
continues to be unmet. The book Hispanics and the Future of America is a more comprehensive read on the effects of Hispanic Immigration to the United States. The sixth chapter explains the effects of low academic success amongst the Hispanic immigrant population in the United States. Their research shows that out of three immigrant nationalities: Mexican, Puerto Rican, and Cuban. Cubans are more likely to receive a high school diploma and Bachelor’s degree.
Although Cubans outperform all other immigrants of Hispanic nationalities they are still well behind other immigrants like the Chinese, and Indian, but at similar levels as non-Hispanic whites. A multivariate study conducted by Reardon and Galindo in 2003, shows the achievement levels of mathematic proficiencies amongst, kindergarten and first grade, Immigrants descendants of Mexico, Cuba, Puerto Rico, Central America, and South America. Non-Hispanic whites were set as the benchmark to measure achievement levels. The results show Cubans being closest to the benchmark. Below the Cubans, the South Americans scored the second highest, and then Puerto Ricans, Mexicans, and Central Americans. Their research indicates that Cubans actually will catch up with non-Hispanic Whites and the rest will fall further and further behind as time progresses. A further analysis of first, second, and third generation Immigrants of Mexican descent, indicate that the patterns of first and third generation Immigrants are very similar, but second generation Mexican Immigrants show a much higher mathematic achievement level and a more promising pattern. The authors of this chapter hypothesize that this anomaly might be caused by the parents of the second-generation students being motivated to succeed and instill those values onto their children. The parents of the third-generation students, especially the ones who continue to speak Spanish and live in low income communities, may be disillusioned with education as a means to better their economic standing. The authors accept that the most important variable in this research is the student’s ability to read, speak, and comprehend the language. The earlier in life the student learns to speak English, the greater the probabilities of academic success.
3 Data Fortunately, my data was fairly easy to find. While I was doing my research and reading other researcher’s studies I stumbled upon the University of Stanford’s database. They were very kind in allowing me to access their database to conduct my study. My initial sample size included over 5,000 observations with over 500 variables. Trying to narrow it down and cutting the data was an endeavoring procedure. I first went through the different variables found 20 that would fit my model. Then, I got rid of the dependent variables that might be correlated with other variables. I was able to narrow the variables down to only 7. I then went into my data set and constructed a dummy variable to indicate the nationality of the student’s parents. Immigrants of Northern and Central America, including the Caribbean Islands represented 1; all nations south of Panama (South America) represented 0. The rest of my data included the dependent variable GPA and independent variables: Parents ethnicity, family economic status, fathers education, number of siblings, if the student was US born (Dummy), how well the student spoke

Econ.420 Hispanic Immigrants’ Academic 05/30/2014 Achievements By Nationality] 5
English, and hours spent on homework. Before running my analysis I cut my data from 5,000 to 200 observations. The descriptive statistics results can be found below in Table 1: Descriptive Statistics. The descriptive statistics results shows the GPA having a mean of 2.55, a standard deviation of 0.86 a range of 4.11 and a variance of 0.73. The GPA mean varied between 0.22 and 4.33. On average the students spent 2.35 hours per day doing homework, with a standard deviation of 1.34, a range of 5, and a variance of 1.79. The daily amount spent on homework ranged between zero and one hour to 6 hours. This variable is on a one to six scale. Zero to one hour of study time is signified by a one, anything over one to two is 2, everything over two up to three is 3, and so on. The average number of siblings was 1.61, a standard deviation of 1.29, range of 8, and variance of 1.66. The number of siblings in the sample size range was zero to eight siblings. The mean economic status was 2.74, a standard deviation of 0.95, a range of 5, and a variance of 0.89. The economic status varied between 1 and 5. This variable was on a one to five inverted scale, with the high economic status at a 1 and low economic status at a 5. Fathers’ education was on a zero to six scale with representation as follows: zero signifies unknown, one signifies elementary or less, two signifies middle school or less, three signifies some high school, four signifies high school graduate, 5 signifies some college, and 6 signifies college graduate or more. The mean was 3.66, a standard deviation of 2.10, a range of 6, and a variance of 4.42. The mean of father’s education level varied between 1 and 6. Lastly was the ability for the student to speak English. This was measured on a one to four scale: one being not at all , two not well, three well, and four very well. The mean was 3.84, the standard deviation was 0.41, the range was 3, and the variance was 0.17. The mean of ability to speak English varied between one and 4.
Table 1: Descriptive Statistics
Variable Mean Mode Median Range STD Variance Conf. Intrv. GPA 2.55 2.5 2.6 4.11 .86 .732 .222 4.33 Econ. Stat. 2.74 3 3 5 .95 .89 1 5 Fthr. Edu. 3.66 6 4.00 6 2.10 4.42 0 6 Num. Sib. 1.61 1 1.00 8 1.29 1.66 0 8 Engl. Speak 3.84 4 4.00 3 .408 .167 1 4 HWhrs/day 2.35 2 2.00 5 1.34 1.79 1 6
In order to test the accuracy of the variables I ran a correlation test on the data. With the exception of the variables English speaking and US born, all variables showed diminutive evidence of correlation. The reason I decided to keep these two variables in my model is because there were many instances where the immigrants refuse to learn or speak English. Only speaking Spanish in the household affects immigrants, first generation and sometimes second generation students; not understanding English translates to a

Econ.420 Hispanic Immigrants’ Academic 05/30/2014 Achievements By Nationality] 6
disadvantage in academics and therefore students who comprehend and speak English are more likely to have a higher grade point average.*
Another issue that we must look for in the data is pure and impure heteroskedasticity. “Heteroskedasticity is the violation of Classical Assumption V. This violation states that the observation of the error term is drawn from a distribution that has a constant variance.” This means that the variances of the different variables are not always realistic. For instance, if a model is explaining age, it is likely that error term observations associated with the age of a senior citizen would come from distributions with larger variances than those associated with the age of a baby. This violation can be caused by the correlation of two variables; this is known as pure correlation. Impure heteroskedasticity is caused by omitted variables.
In order to test for heteroskedasticity, I ran the Park test on each independent variable. There are four steps to conducting the park test. The first step is to log the dependent variable and all independent variables. The next step is to run a regression for each independent logged variable. Than a hypothesis is set up. We reject the HO if the computed 𝜎 = 0; if the computed 𝜎 ≠ 0 than we fail to reject the HO and accept the HA. The first test on economic status yielded a computed 𝜎-statistic of -0.67; the next test was the father’s education level. Shown below in Table 2: Parker Test, the results yielded a computed 𝜎-statistic of 1.13. We then tested the variable number of siblings. The results yielded a computed 𝜎-statistic of 1.00. Finally, we tested the number of hours spent on homework. The results yielded a computed 𝜎-statistic of -1.57. All variables tested under the Park test yielded computed 𝜎-statistic smaller than the critical 𝜎-statistic of 1.65. Therefore, we accepted the HO on all variables and concluded that neither of the variables violated the Classical Assumption V rule.
Table 2: Park Test Results
Variable 𝛽 STD. Error 𝜎-Statistic Significance HO
Ecnmic. Stat. -.270 .403 -.67 .504 Accept
Father’s Edu. .234 .207 1.134 .258 Accept
Num Siblings -.281 .288 1.002 .318 Accept
Englis. Speak -.502 .991 -.506 .613 Accept
Num Hrs. HW -.393 .251 -1.567 .119 Accept
* Reference the data in Table 2: Correlation Test in the Appendix
Statistics gathered from SPPS, the data was obtained from http://www.princeton.edu/cmd/data

Econ.420 Hispanic Immigrants’ Academic 05/30/2014 Achievements By Nationality] 7
4 Model To model the affects in the academic success of immigrants given , the parent’s ethnicity, economic status, the father’s education level, the number of siblings, the student’s ability to speak English, the nationality of the student, and the amount the student spends on homework, we developed a regression model and modified it multiple times to obtain the most accurate and significant coefficients. The model we decided to keep is listed below. The model includes the GPA signifying the academic achievement of each student observed,
b X1 is the economic status of the students family (on a scale of 1-5, 1 signifies a high
economic status 5 signifies a low economic status), b X2 is the father’s level of education, b
X3 is the number of siblings the student has, b X4 is a dummy variable (1 signifies that the
student was born in the US and 0 signifies otherwise), b X5 is another dummy variable (1
signifies if the student speaks English and 0 signifies otherwise), the final variable b X6 is
the amount of hours spent on homework, and e is the residual we cant account for.
GPAi = b0 -b1EconStat+b2FthrEdu-b3NumSib+b4USbrn+b5ENGspkX +b6HWhrs+ei
All of the coefficient’s signs, b1 - b6, resulted as expected. The dependent variable
GPA represents the academic success of each observation. The student’s GPA measured the academic success. The coefficient “ b1
” represents the student’s socioeconomic-status; this
variable was measured on a one to five scale with one being high economic-status and five a low economic-status. On average we can theorize that wealthier people, those on a higher economic bracket, have more resources and have the knowledge to access information about higher education than students in a low economic status; the reason this is a negative coefficient is because the measurement is inverted. Therefore, the closer the student is to a one on this scale, the more likely they are to succeed in academics. The coefficient “b2
” represents the father’s education level; theoretically speaking, educated
parents tend to comprehend the benefits of an education and these ideals are often passed on to their kids. For this reason we can see that as the education level of the father
increases, the chances for the students academic success also increase. The coefficient “ b3 ”
represents the number of siblings the student has. The reason we hypothesized this coefficient being negative is due to the theory of the distribution of resources; this includes tangible resources such as savings for a college education, food, clothes and other physical needs. Intangible needs would include needs like time and attention. In theory as the number of children increase in a household the less tangible and intangible resources an individual child will receive. Therefore, the more siblings a student has, the lower the chances of them excelling in academics. The coefficient “ b4
”is dummy variable signifying 1
as US native and 0 as immigrant student. Theoretically the longer a student is in the United States the greater the chances of acclamation, the better understanding of the education system and the opportunities available to them. The coefficient “b5” represents the ability
of a student to understand English, measured on a scale of 1-4; 1 signifies if the student

Econ.420 Hispanic Immigrants’ Academic 05/30/2014 Achievements By Nationality] 8
can’t understand English, 2 is if the student can understand a little, 3 is if the student understands English, and 4 is if the student understand it very well. The final and most
significant variable in a student’s academic success is b6; this coefficient represents hours
per day a student spends on homework. In most cases, the more time a student spends doing homework directly translates to a better academic outcome.
5 Estimation Results
GPAi = 0.34-b10.09+b20.10-b30.07+b40.19+b50.30+b60.30 From the Table 1: LOS Results, the regression test on these coefficients resulted on b1
=-
.094 a computed t-ratio of -1.31, b2=0.10 a computed t-ratio of 2.37, b3
=0.07 a computed
t-ratio of 1.38, b4=0.19 a computed t-ratio of 1.47, b5
=0.30 a computed t-ratio of 1.88, and
b6=0.29 a computed t-ratio of 6.33. The model as a whole produced an R2 of 27% and
computed f-ratio of 9.26. The critical t-ratio of 1.29 was computed at a 10% level of significance. As we can see all of our independent variables are significant factors to our dependent variable of GPA. The critical f-statistic of 2.8 was computed at 1% level of significance. Our model’s computed f-ratio was much higher than the critical f-statistic; therefore, we can conclude that our model as a whole is significant.
Table 1: LOS Results
Variables Model A Model B Model C Model D Model E
Constant .572
(.678) .336
(.482) .973
(1.93)* 1.490
(4.443)* 1.916 8.639
Parents Ethnicity .001
(.079) - .002
(.188) - -
Family Economic Stat. (Scale 1-5)
1 is high, 5 is low status.
-.123 (-1.539)*
-.094 (-1.305)*
-.099 (-1.242)
-.090 (-1.243)
-.067 (-1.145)
Fathers Education
.096 (1.986)*
.101 (2.369.)*
.095 (1.959)*
.111 (2.569)*
.036 (1.381)*
Number of Siblings
.094 (1.588)*
.068 (1.379)*
.094 (1.578)*
.049 (1.018)
-
Student US Born .242
(1.681)* .194
(1.470)* - .120
(.946) -
Student Speaks English
.247 (1.178)*
.297 (1.881)*
.149 (.733)
- -
Hours Spent on HW
.270 (5.092)*
.288 (6.334)*
.278 (5.266)*
.286 (6.238)*
.291 (7.091)*
R2 .254 .269 .238 .252 .221 F 6.281* 9.257* 6.762* 10.229* 17.845* : Numbers in parenthesis are computed t-ratios the * indicates significance at a 10% level.

Econ.420 Hispanic Immigrants’ Academic 05/30/2014 Achievements By Nationality] 9
Table 1: LOS Results shows the results computed by the five different models we
ran. Model B, highlighted in blue, signifies the model we decided was the most significant given the results. As you can see we decided to exclude the coefficient “Parents Ethnicity.” Initially this was the prime variable we were looking at, but after running the regression , the test estimated the coefficient at .00 with a t-ratio of 0.08. These variables are much too low, indicating that the variable is insignificant to the GPA of a student. I believe this is due to the fact that we combined the different countries into two groups. In the Related Literature I researched, they studied the academic performances of immigrants of the different countries of origins. These reports concluded that there was a difference in academic achievement between the academic achievements of immigrants from different Latin American countries. They weren’t unable to pinpoint what the exact causes for the discrepancies were, but they had some educated theories. In order to run a similar model involved a complex process that required skills that were beyond this class level and time frame.*
6 Conclusion Similarly to the related research I highlighted above, my research turned out inconclusive to the relationship between the country of origin of Hispanic immigrant and their academic success. My study did conclude that the most significant variables that separated the academic achievers from the dropouts were the amount of time per day they dedicated to their homework and the socioeconomic status of the student’s family. These variables are easy to explain. The first variable could be explained by the theory that hard work always pays off, but the latter should not be as simple to answer. In a first world country like the United State schools should be better equipped to handle the cultural differences they face with immigrants coming in from all over the world with various levels of needs in education. The United States should be a powerhouse when it comes to primary and secondary education; instead we have sat on the sidelines and watched as other countries surpass us in academic achievement. Many may say that the issue lays on the fact that we invest more on the prison system than on our education system, or that our political system is so divided they can’t even fix the education system. I would like to believe that the issue is much bigger and complicated than that, and for that reason the troubles that face our education system continue to be unresolved.
Regardless of the reasons for the problems in our education system, we cannot negate the fact that the longer these issues go unresolved the harder they are to correct. We are already seeing the consequences for not promptly responding to these issues. The demand for skilled workers in the US is so great that we have to outsource our work to India, China, and South Africa. There has also been an influx of immigration of skilled
* Reference the data in the Appendix for the LOS regression tables with results.
Statistics gathered from SPPS

Econ.420 Hispanic Immigrants’ Academic 05/30/2014 Achievements By Nationality]
1
0
workers like doctors and engineers that are coming in to meet the unsatisfied demand of these jobs. Projections show that these demands are on the rise, while manual labor positions are on a decline as companies look to outsource for cheaper labor costs. The continuation of this trend is having adverse consequences to our economy.
The research shows that in order to taper down the gap in the academic success of immigrants, we must address the lack of motivation students have toward school. We have to help students be enthusiastic about their future so that they see schoolwork as a future reward and not a task. We also have to address the differences that are evident between schools in rich suburbs to inner city schools. A single person cannot solve this issue; it requires the support of the community as a whole. If we can get pointed in the right direction and unite to battle in a common cause, I am confident this dilemma can be resolved.
References Baum, Sandy and Stella M. Flores. 2011. “Higher Education and Children in Immigrant
Families.” The Future of Children. 1:1. Spring. 171-193. Burke, M. David. 2006. “Differentials in the Academic Achievement of Children of Immigrants.” Honors Thesis in Economics, Stanford University. Cruz, Vanessa. 2009. “Educational Attainment of First and Second Generation Immigrant
Youth.” Summer Academy for Public Policy Analysis and Research. Urban Institute. Brief No.5.
Schneider, Barbara, Sylvia Martinez, and Ann Owens . 2006. “Barriers to Educational Opportunities for Hispanics in The United States.” Hispanics and the Future of America. Ch.6. 192-240.
Dronkers, and de Heus. 2012. “The Educational Performance of Children of Immigrants in Sixteen OECD Countries.” A World in Motion: Trends in Migration and Migration Policy. Oxford University Press.

Econ.420 Hispanic Immigrants’ Academic 05/30/2014 Achievements By Nationality]
1
1
Appendix
Table 1: Correlation Test
Table2: SPSS Results
Model Summary
Model R R Square
Adjusted R
Square
Std. Error of the
Estimate
1 .519a .269 .240
.773643076967
317
a. Predictors: (Constant), STD HRS HW, FAM ENMC SIT, STD ENG
SPK, FTHR EDU, # SBLNGS, STD US BORN
ANOVAa
Model Sum of Squares df Mean Square F Sig.
1 Regression 33.242 6 5.540 9.257 .000b
Residual 90.377 151 .599
Total 123.619 157
a. Dependent Variable: GPA

Econ.420 Hispanic Immigrants’ Academic 05/30/2014 Achievements By Nationality]
1
2
b. Predictors: (Constant), STD HRS HW, FAM ENMC SIT, STD ENG SPK, FTHR EDU, #
SBLNGS, STD US BORN
Coefficientsa
Model
Unstandardized Coefficients
Standardized
Coefficients
t Sig. B Std. Error Beta
1 (Constant) .336 .698 .482 .630
FAM ENMC SIT -.094 .072 -.093 -1.305 .194
FTHR EDU .101 .043 .170 2.369 .019
# SBLNGS .068 .049 .100 1.379 .170
STD US BORN .194 .132 .110 1.470 .144
STD ENG SPK .297 .158 .142 1.881 .062
STD HRS HW .288 .045 .447 6.334 .000
a. Dependent Variable: GPA