
Hiring Costs of Skilled Workers and the Supply of …ftp.iza.org/dp6344.pdfto hire many workers at...
31
DISCUSSION PAPER SERIES Forschungsinstitut zur Zukunft der Arbeit Institute for the Study of Labor Hiring Costs of Skilled Workers and the Supply of Firm-Provided Training IZA DP No. 6344 February 2012 Marc Blatter Samuel Muehlemann Samuel Schenker Stefan C. Wolter
Transcript of Hiring Costs of Skilled Workers and the Supply of …ftp.iza.org/dp6344.pdfto hire many workers at...

DI
SC
US
SI
ON
P
AP
ER
S
ER
IE
S
Forschungsinstitut zur Zukunft der ArbeitInstitute for the Study of Labor
Hiring Costs of Skilled Workers and theSupply of Firm-Provided Training
IZA DP No. 6344
February 2012
Marc BlatterSamuel MuehlemannSamuel SchenkerStefan C. Wolter

Hiring Costs of Skilled Workers and the Supply of Firm-Provided Training
Marc Blatter University of Bern
Samuel Muehlemann
University of Bern and IZA
Samuel Schenker
University of Bern
Stefan C. Wolter University of Bern,
CESifo and IZA
Discussion Paper No. 6344 February 2012
IZA
P.O. Box 7240 53072 Bonn
Germany
Phone: +49-228-3894-0 Fax: +49-228-3894-180
E-mail: [email protected]
Any opinions expressed here are those of the author(s) and not those of IZA. Research published in this series may include views on policy, but the institute itself takes no institutional policy positions. The Institute for the Study of Labor (IZA) in Bonn is a local and virtual international research center and a place of communication between science, politics and business. IZA is an independent nonprofit organization supported by Deutsche Post Foundation. The center is associated with the University of Bonn and offers a stimulating research environment through its international network, workshops and conferences, data service, project support, research visits and doctoral program. IZA engages in (i) original and internationally competitive research in all fields of labor economics, (ii) development of policy concepts, and (iii) dissemination of research results and concepts to the interested public. IZA Discussion Papers often represent preliminary work and are circulated to encourage discussion. Citation of such a paper should account for its provisional character. A revised version may be available directly from the author.

IZA Discussion Paper No. 6344 February 2012
ABSTRACT
Hiring Costs of Skilled Workers and the Supply of Firm-Provided Training*
This paper analyzes how the costs of hiring skilled workers from the external labor market affect a firm’s supply of training. Using administrative survey data with detailed information on hiring and training costs for Swiss firms, we find evidence for substantial and increasing marginal hiring costs. However, firms can invest in internal training of unskilled workers and thereby avoid costs for external hiring. Controlling for a firm’s training investment, we find that a one standard deviation increase in average external hiring costs increases the number of internal training positions by 0.7 standard deviations. JEL Classification: J23, J24, J32 Keywords: hiring costs, apprenticeship training, firm-sponsored training Corresponding author: Samuel Muehlemann University of Bern Department of Economics Schanzeneckstrasse 1 3001 Bern Switzerland E-mail: [email protected]
* This study is based on two administrative surveys from the years 2000 and 2004. The first survey was financed by the Commission for Technology and Innovation, and the second by the Swiss Federal Office for Professional Education and Technology (OPET), both with the assistance of the Swiss Federal Statistical Office. This research has partly been funded by the OPET through its Leading House on Economics of Education: ‘Firm Behavior and Training Policies’. We are grateful to Giorgio Brunello, Peter Cappelli, Winand Emons, Steve Machin, Georg Rich, Paul Ryan, Rainer Winkelmann, Ludger Wössmann, and participants at the annual congress of the EEA 2011 for helpful comments.
1 Introduction
A firm’s expenditures for hiring skilled workers constitute an important com-
ponent of non-wage labor costs. To find suitable job candidates, a firm typ-
ically has to post vacancies, screen resumes, and conduct interviews with
a number of potential candidates. Once a candidate is hired, it still takes
time and possibly some extra training for him or her to become fully pro-
ductive. Empirical studies show that hiring costs are substantial, averaging
between one and two quarters of wage payments (Blatter et al. 2012; Ejar-
que and Nilsen 2008; Manning 2006; Merz and Yashiv 2007). In addition,
these studies point towards a convex structure of hiring costs, i.e., marginal
hiring costs increase with the number of hires. Thus hiring from the external
labor market can be very expensive, especially if firms need to hire a large
number of workers in a particular period. However, firms have the possibil-
ity of reducing external hiring by training unskilled workers internally and
retaining them after training (Stevens, 1994). As long as the expected costs
of recruiting, training, and successfully retaining a trainee are smaller than
those of an external hire, internal training will be the more cost-effective
strategy.
Our empirical analysis uses representative Swiss establishment-level data
that includes detailed and direct measures of hiring costs and training costs.
While the idea that the structure of hiring costs affects a firm’s training
behavior can be applied to various types of training, we focus in our analysis
on a firm’s supply of apprenticeship training positions: Trainees accumulate
a substantial amount of human capital over three to four years, making
them viable substitutes for skilled workers hired externally. We carry out
our empirical estimations in a generalized Tobit model, accounting for (i)
truncation at zero in the supply of training, (ii) selectivity in the firm’s
training and hiring decisions, and (iii) simultaneity issues in observed hiring
and training costs.
We find that hiring costs are substantial and have a convex structure,
which means that firms hiring many workers each period will face higher av-
erage costs to fill a vacancy than firms with a low number of hires. Further-
1

more, we find that the structure of (net) training costs is concave, implying
that offering additional training positions reduces average net training costs.
Our analysis shows that firms facing high (potential) external hiring costs
supply more internal training positions, as training reduces or even elimi-
nates the need to hire externally. Thus firms can save future hiring costs for
skilled workers by recruiting and training young workers internally.
The paper is organized as follows: The next section gives a brief overview
of the literature on hiring and training costs. Section 3 introduces our the-
oretical model. Section 4 describes the data, and section 5 presents the
econometric modeling and the empirical results. Section 6 concludes.
2 Literature on hiring and training costs
Firms may supply training positions because they expect some future re-
turn from an initial net investment in training (Oatey, 1970; Lindley, 1975;
Merrilees, 1983). This idea was first formalized by Stevens (1994) in an in-
vestment model for a firm’s supply of training. While the costs associated
with internal training constitute the employer’s investment, returns on the
investment are given by reduced hiring costs for skilled workers. However,
given the lack of data on both hiring costs and net costs of training, Stevens
(1994) has to make strong assumptions about the structure of both types
of costs. For example, data on wages serves as a proxy for training costs,
whereas a variable indicating a shortage of skilled labor in the firm serves
as a proxy for hiring costs.
Before focusing on our own contribution, we first review the empirical
evidence on hiring and training costs.
2.1 Evidence on hiring costs
Few empirical studies contain direct data on hiring costs. In a first study,
Oi (1962) shows that hiring costs are equal to about three weeks of wage
payments in the U.S., whereas Barron et al. (1985) reports hiring costs of
one week’s pay. More recent estimates for the U.S. report average hiring
costs of $4,000 per vacancy (Dube et al., 2010). Blatter et al. (2012) show
2

that hiring costs in Switzerland range between 10 and 17 weeks of wage
payments.1
The magnitude of hiring costs is crucial for a firm’s supply of training.
If training costs exceed hiring costs, a firm will not supply any internal
training. However, it will offer training positions if training costs are lower
than hiring costs, and if it expects to retain a sufficiently high number of
trainees. Thus if training costs were sufficiently low, a firm would not hire
externally but instead only retain former trainees as skilled workers.
Depending on the structure of hiring costs, a firm may find it optimal
to hire externally and supply some training. This situation applies if hiring
costs are convex, i.e., if hiring more workers in a given period becomes in-
creasingly expensive. If hiring costs were concave, firms would find it cheaper
to hire many workers at once – making internal training less beneficial to the
firm. In a recent contribution, Blatter et al. (2012) show that hiring costs
ins Switzerland are convex. Manning (2006) provides evidence that hiring
costs are convex in the UK, and Pfann and Verspagen (1989) find increasing
marginal hiring costs for Dutch firms that increase their labor force signifi-
cantly. For France, Abowd and Kramarz (2003) report that hiring costs are
concave, whereas Kramarz and Michaud (2010) later find evidence for linear
hiring costs.
2.2 Evidence on training costs
Direct and detailed data on training costs are relatively scarce. Much of the
training literature focuses on a firm’s training decision rather than on its
training costs.
A series of surveys contains information on the costs and benefits of train-
ing apprentices in Germany and Switzerland, two countries with a long tra-
dition of apprenticeship training. While the costs of apprenticeship training
are outweighed by short-term training benefits for Swiss firms, apprentice-
ship training tends to be a net investment for German firms (Muehlemann
et al., 2010). A recent survey on apprenticeships, including both a detailed
1A recent survey on hiring costs appears in Manning (2011), with the earlier literature
summarized in Hamermesh and Pfann (1996).
3

treatment of cost-benefit analysis and the general features of apprenticeship
markets is provided by Wolter and Ryan (2011).
Without considering hiring costs, Muehlemann et al. (2007) find that
expected training costs are an important determinant of a firm’s decision to
train apprentices in Switzerland. Muehlemann et al. (2010) show that ex-
pected training costs are significantly higher in Switzerland for non-training
firms than for firms that offer training, whereas they find no significant
difference in Germany.
A number of studies attempt to indirectly assess post-training benefits
by analyzing retention rates of apprentices, tenure, or wages of movers and
stayers (e.g., Booth and Satchell, 1994; Cappelli, 2004; Dustmann et al.,
1997; Euwals and Winkelmann, 2002; Winkelmann, 1996).
In contrast to the literature on firm-sponsored training, we can carry
out our analysis using detailed and direct firm-level data on both hiring
and training costs. Thus our contribution is to simultaneously estimate the
effects of hiring costs and training costs on a firm’s supply of apprentices.
3 Model
In this section, we use a model for dynamic labor demand to formalize
the idea that firms can adjust their skilled labor force not only by hiring
skilled workers from the external labor market, but also by training unskilled
workers internally and retaining them after training. The incentives for
investment in costly training are given by lower hiring costs in the future.
The role of training in the decision-making process of the firm can be
illustrated by the following inter-temporal profit maximization problem,
where the firm’s hiring and training decision can be regarded as a prob-
lem of investment under uncertainty (Stevens 1994, Yashiv 2000).
maxRt,Nt,Lt
Π = Et
{
∞∑
i=0
βi [F (Nt+i) − wt+iNt+i − f(Rt+i, Nt+i) − g[Lt+i]]
}
subject to the constraint representing the law of motion for the firm’s number
4
of employees
Nt+1 = (1 − δt)Nt + Rt + (1 − γt)Lt−s
where Et is the expectation operator conditional on information in period
t. The firm’s production function F (N) depends on the number of skilled
workers N . The wage is denoted by w. Training lasts s periods, hence a
trainee recruited in period t−s may be employed as a skilled worker in period
t+1. Skilled workers and trainees have separation rates δ and γ respectively,
with 0 ≤ δ ≤ 1 and 0 ≤ γ ≤ 1. The trainees’ separation rate γ implies that
if Lt trainees are recruited in period t, there will remain (1 − γ)Lt trainees
at the end of their training. β is the discount factor. We represent the costs
of hiring by f(Rt+i, Nt+i). This function has as its arguments the number of
recruits R and the number of skilled workers N . At this point, we do not yet
specify a functional form of the hiring costs function. However, the results
in the empirical section indicate that the hiring cost function is convex in
the number of recruits.
Net costs of training are denoted by g(Lt+i). These costs are defined as
net of a trainee’s contribution to the firm’s output. Therefore, skilled labor
is the only production factor in our model.
The constraint representing the evolution of the firm’s number of em-
ployees illustrates the two possibilities of a firm to increase the number of
skilled workers N . The firm can expand its skilled workforce either by re-
cruiting skilled workers R on the labor market or by hiring trainees L and
retaining them as skilled workers after their training.
The solution to the dynamic optimization problem determines the firm’s
demand for trainees which we will estimate in the empirical analysis in
Section 6. Our results indicate that the demand for trainees is positively
related to the (potential) costs of hiring skilled workers from the external
labor market. Before turning to the econometric modeling, we first introduce
the data we use for our analysis.
5

4 Data
4.1 Survey design and data
We use data from two administrative and representative establishment-level
surveys conducted in Swiss firms in 2000 and 2004 by the Centre for Research
in Economics of Education at the University of Berne and the Swiss Federal
Statistical Office.2 Overall, we have information on 4486 Swiss firms, of
which have information on hiring costs for 4052 firms (434 firms did not hire
externally), as well as information on training costs for 2815 firms (1671
firms did not offer any internal training).3
The survey contains information on the number of skilled workers (in
this case with a vocational degree) that a firm hired in the preceding three
years. Management or the person in charge of human resources supplied
the information in a paper-based survey that the Swiss Federal Statistical
Office sent by regular mail.4 The survey contains information on the average
costs of hiring a skilled worker with a vocational degree from the external
labor market. For ease of comparison across firms, firms had to fill out the
survey for only one occupation. To avoid selectivity issues, the Swiss Federal
Statistical Office assigned each firm an occupation based on the occupation’s
relative importance, before sending out the survey.
4.2 Calculation of hiring costs
The calculation of hiring costs can be divided into two parts: the costs
of recruiting a worker, denoted by r, and the costs of the initial training
necessary for the worker’s adapting to the new job, denoted by a.
Recruiting costs ri consist of the costs for posting a vacancy vi and in-
terview costs Jicai, where Ji denotes the number of applicants per vacancy
2This data was originally collected for estimating total private sector expenditures on
vocational education and training in Switzerland, as those expenditures are part of official
OECD statistics on educational expenditures (OECD 2009).3We excluded public firms and non-profit organizations from the sample, as the prin-
ciple of profit-maximization does not fully apply to such firms.4The survey is a stratified random sample at the establishment level, where the two-
digit industry level and the firm size serve as strata.
6
invited for an interview, and cai denotes the costs of conducting an indi-
vidual interview, i.e., the product of interview time and the wage of the
interviewer(s).5 In addition, we denote the costs for external advisors or
placement agencies by ei. Summarizing, recruitment costs are
ri = vi + Jicai + ei
The second part of hiring costs arises because a newly employed skilled
worker is not immediately fully productive. In the survey, firms report for
how many days dai a new worker is less productive than an average skilled
worker in the firm. The relative productivity of a new recruit is denoted by
pi. There are several reasons for a new recruit being initially less productive.
One is firm-specific human capital, such as learning the firm culture, learning
production processes, and becoming acquainted with work colleagues.
Another reason for lower worker productivity is that new recruits receive
training outside the workplace. First, the firm has to pay the worker the
daily salary wdi during the number of training days dti. Second, there are
direct training costs cti for internal and external training personnel, travel
costs, or course fees. Thus adaptation costs ai can be written as
ai = dai(1 − pi)wdi + dtiwdi + cti
Total hiring costs H for filling a vacancy are the sum of recruitment and
adaptation costs
Hi = ri + ai
4.3 Calculation of the net costs of training apprentices
We define net costs of apprenticeship training as the difference between the
firm’s costs and the benefits of training. Training costs c consist of the
wages of apprentices wa and the costs of training personnel wT . We denote
5There are five job categories for interviewers: management, skilled workers with a
vocational degree (by the subcategories of administration, technical or social, or crafts),
and workers with no vocational degree (i.e., unskilled workers).
7
the remaining costs by x, which includes costs for materials, infrastructure,
external courses, hiring, and administrative tasks.
Thus the average training costs for firm i are
ci = wai + wT i + xi
Training benefits b are calculated by the type of work an apprentice
performs. An apprentice spends a fraction α of his work hours performing
unskilled tasks that require no formal qualifications. During the remaining
time (1−α), the apprentice carries out skilled tasks. While we assume that
the apprentice’s performance is equal to that of an unskilled worker (wu),
the apprentice’s performance in skilled tasks, ςw, is lower compared to that
of a skilled worker. Finally, we denote the wage of a skilled worker by w.
bi = αwui + (1 − α)ςwi
Thus, the average net costs of training C constitute the difference be-
tween the costs c and the benefits b of training, so that
Ci = ci − bi
4.4 Descriptive Statistics
In this section we provide descriptive statistics on the external and inter-
nal hiring process. Firms with internal training and external hiring activity
report the costs for internal training and external hiring for the same occu-
pation, facilitating the comparison of internal vs. external training costs.6
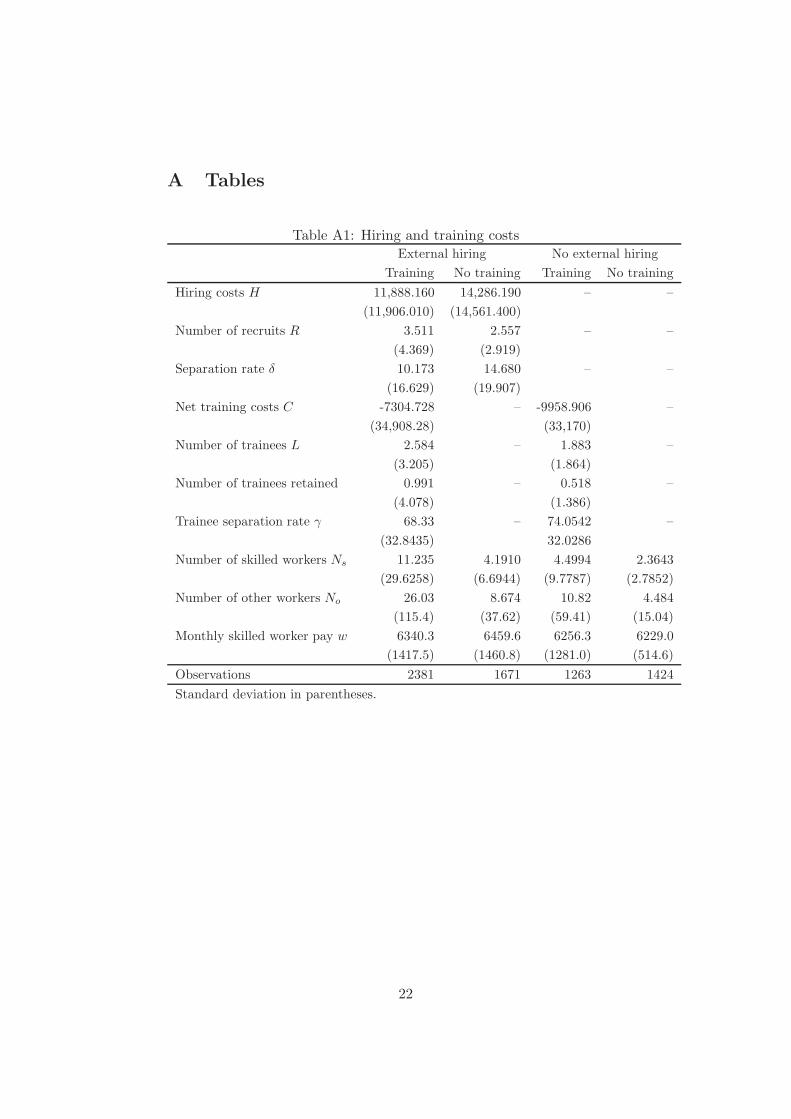
Table A1 shows that hiring costs are 11,888 Swiss francs (CHF7) in
firms that hire externally and also offer internal training. These firms hire
on average 3.5 new workers each period.8 Firms that solely hire externally
fill on average 2.6 vacancies each period at an average cost of CHF 14,286.
6Firms without internal training report hiring costs for the occupation in which they
would most likely offer internal training if they decided to do so.7At current exchange rates, 1 CHF = 0.9 $, and 1 CHF = 1.2 Euro.8We provide detailed descriptive statistics of the different components of hiring costs
in table A2.
8

Firms with both external hiring and internal training hire more workers
each period, however, the separation rate of skilled workers δ in these firms is
only 10.2%, while separation rate is 14.7% in firms without internal training.
These results seem surprising at first sight, as firms without internal training
even pay slightly higher wages to skilled worker (albeit this difference is not
statistically significant at the 5% level). However, firms without internal
training are typically much smaller than training firms, both in their number
of skilled workers in the occupation of interest, but also in the number of
other workers. Therefore, the observed differences in descriptive statistics
may be attributed to economies of scales in external hiring for large firms,
allowing large firms to achieve a better match quality at lower costs.9
Internal training results on average in a net benefit of CHF 7304 for firms
that also hire externally (Table A1). Firms that solely recruit my means of
internal training in our observation period generate on average a net benefit
of CHF 9959. However, about one third of all Swiss training firms bear
substantial net training costs. The separation rate of apprentices γ, i.e., the
fraction of trained apprentices who leave the firm within the first year after
training, is on average 68.3% for training firms that also hire externally, and
74.05% for training firms that do not hire externally.
A firm’s number of new hires consists of the number of external hires
as well as number of trainees that were taken on as skilled workers after
completion of training.10
The summary statistics for all other variables are provided in table A3.
9Idson (1993) provides evidence for lower turnover rates in large firms. Blatter et al.
(2012) also show that large firms find it less costly to hire a given number of new workers
than small firms. However, marginal hiring costs for large firms are convex if hiring is
above a firm’s expected hiring rate.10Alternatively, we defined a firm’s number of new hires by the number of external hires
and the average retention rate of trainees, multiplied with the current number of trainees
(rather than simply adding the number of trainees that were actually retained). For
firms that did neither hire externally nor retained any trainees we estimate their potential
number of hires by ordinary least squares, using firm size, wages, occupation and industry
as independent variables. Our main findings remain robust to alternative specifications of
the number of hires, and also if we drop observations of firms without new hires in the
period of observation. All results are available upon request.
9

Training firms are on average larger than non-training firms, are more likely
to have domestic owners and are located more frequently in the construction
and industry sector.
5 Econometric modeling and empirical results
Our aim in this section is to estimate the causal effect of hiring costs on
a firm’s supply of internal training positions. We are interested in testing
whether firms that face high potential costs of hiring all their skilled workers
externally supply more training.
We need to deal with two problems for which we need an econometric
solution: selectivity and endogeneity. We observe a firm’s hiring costs only
if that firm has hired skilled workers externally in the preceding three years.
We also observe training costs only for firms that actually train apprentices.
Furthermore, observed hiring costs differ from potential hiring costs for firms
that hire externally but also supply internal training. The reason is that
training firms need to hire fewer workers externally (because they retain
some trainees), and hiring fewer workers results in lower observed average
hiring costs due to the convex cost structure.
Endogeneity problems arise because firms can influence both hiring and
net training costs. A firm can influence its hiring costs by adjusting time and
effort for screening job applicants (thereby affecting the fluctuation rate). A
firm can also influence net training costs: While training regulations require
firms to enforce minimum training standards, it is always possible for a firm
to provide extra training. A final complication is that the dependent variable
of interest, the supply of training positions, is truncated at zero.
We use a type-4 Tobit model to account for selectivity, endogeneity of
hiring costs and training costs, and truncation of training supply at zero.
The following subsection describes the econometric model in detail.11
11For a classification of different types of Tobit models, see Amemiya (1985).
10
5.1 Econometric modeling
To estimate our econometric model, we assume that hiring costs can be
described as HT = h0RαNβ
s Nγo wδ (see, e.g., Manning, 2011). We thereby
account for the dependence of hiring costs H on the number of recruits
R and the number of employees Ns (skilled workers in the corresponding
occupation) and No (the number of other employees), as well as the wage of
skilled workers w. Our specification therefore captures the stylized fact that
larger firms typically hire more workers in a given period and pay higher
wages. Thus marginal hiring costs are given by
∂HT
∂R= αh0R
α−1Nβs Nγ
o wδ
In our data we observe average hiring costs, which are given by
H =HT
R= h0R
α−1Nβs Nγ
o wδ
Taking logs on both sides, we will estimate a regression model of the form
ln H = (α − 1) ln R + β ln Ns + γ ln No + δ ln w.12 Marginal hiring costs are
increasing if α > 0, and decreasing if α < 0.
The supply of training also depends on net training costs C. We estimate
a linear regression model, because net training costs can be negative (i.e.,
firms can generate a net benefit from training if the productive contribution
during training exceeds the training costs). Thus specifying ln C as the
dependent variable is not feasible.13
Consider the structural model of a firm’s supply of training positions.
ln H = x1β1 + ε1 (1)
C = x2β2 + ε2 (2)
L = max[0, x3β3 + αH + δC + ε3] (3)
12As noted in Manning (2011), marginal hiring costs can be described in terms of average
hiring costs, i.e., ∂HT
∂R= α
HT
R.
13We also estimate a model with interaction terms of firm size and the number of
trainees, as large firms offer more training positions. However, we find no statistically
significant effects. Results are available upon request.
11
where L denotes the number of trainees, H the average costs of hiring skilled
workers and C the average net costs of training.
We always observe (x,L), H is observed if L = 0, and C is observed if
L > 0. The error terms (ε1, ε2, ε3) are independent of x, with a zero-mean
trivariate normal distribution. The vector x1 contains firm characteristics,
including the number of recruits, the number of employees, skilled worker
wage, firm ownership, occupation and industry. Furthermore, x1 needs to
contain at least one element that is not in x3 but has a significant effect
on hiring costs. We use the binary variable “difficulties in finding skilled
workers” as a measure of the tightness of the labor market. As firms have
to spend more resources on the search of appropriate job candidates when
the labor market is tight, hiring costs increase. However, the firm’s sup-
ply of training positions is not directly related to labor market tightness,
conditional on other observed firm characteristics. Similarly, x2 must con-
tain at least one element that is not in x3 but that significantly affects net
training costs. We use the variable “population share of potential trainees”,
which is defined as the product of “local share of young people age 15-19”×
(1-“share of young people in grammar school”).14 Thus the variable “pop-
ulation share of potential trainees” captures the variation in the supply of
local trainees due to demographic and institutional differences across local
labor markets.15 A higher share of suitable candidates reduces the net costs
of training by increasing the probability that a firm finds a suitable trainee,
i.e., a good match. Compared to a situation in which a firm needs to hire a
less suitable candidate, a good match will reduce the firm’s required effort
for a trainee to reach the desired skill level.
The coefficients of interest are the structural parameters α and δ. For
14We follow Muehlemann and Wolter (2011), defining a local labor market as containing
all cities an individual can reach by car from the center of a local labor market within
30 minutes. The variable “share of young people in grammar school” is a lagged variable
that measures the local share of youth enrolled in grammar schools the year before firms
in our sample decided to offer internal training.15As a robustness check we have used each of the two variables separately as an indi-
vidual instrument. For both cases, the results remain qualitatively similar, but of slightly
lower statistical significance.
12

identification, we follow the procedure described in Wooldridge (2002).
The reduced form for equation (3) is
L = max[0, x3β3 + α(x1β1 + ε1) + δ(x2β2 + ε2) + ε3]
= max[0, xρ3 + αε1 + δε2 + ε3]
= max[0, xρ3 + u3] (4)
First, we regress L on x by a standard Tobit regression using all ob-
servations. Doing so enables us to generate a generalized residual (Vella,
1992):
u3i = −σ3(1 − Ii)φ(x3iβ3/σ3)(1 − Φ(x3iβ3/σ3))−1 + Ii(Li − x3iβ3)
where Ii is an indicator function denoting whether a firm offers training.
Second, we need a consistent estimate of u3i to obtain estimates of β1 and
β2, as
E(ln H|L = 0, x, u3) = x′
1β1 + E(ε1|x, u3) = x′
1β1 + E(ε1|u3) = x′
1β1 + γ1u3
and
E(C|L > 0, x, u3) = x′
2β2 + E(ε2|x, u3) = x′
2β2 + E(ε2|u3) = x′
2β2 + γ2u3
where u3 = αε1 + δε2 + ε3. We can use the coefficients γ1 and γ2 to test for
selectivity (Vella, 1992).
Using observations for firms that hire solely externally, we regress
ln Hi on xi1, u3i, (5)
yielding consistent estimates of β1 and allowing us to test for selectivity.
Similarly, using observations of training firms that do not hire externally,
we regress
Ci on xi2, u3i, (6)
yielding consistent estimates of β2 and again allowing us to test for selectiv-
ity.
13

Having obtained consistent estimates β1, β2 for β1, β2, we can estimate
β3, α and δ using the reduced form of L in terms of the following structural
parameters:
L = max[0, x3β3 + α(x1β1) + δ(x2β2) + u3]
Using our consistent estimates β1, β2, we can estimate the following Tobit
equation to obtain consistent estimates β3, α, and δ:
L = max[0, x3β3 + α(x1β1) + δ(x2β2) + error i] (7)
5.2 Results
Before turning to estimates of the structural coefficients of interest, we dis-
cuss the results of the reduced form Tobit equation, the hiring costs, and
the net training costs regression.
First, we estimate a reduced form Tobit regression to obtain the gener-
alized residual (table A4), which we need to obtain consistent estimates in
the hiring costs and net training costs equation.
Second, we estimate equation (5), i.e., we regress hiring costs on x1 and
the generalized residual (table A5). The number of recruits has a positive
and significant effect on average hiring costs, a finding that implies a convex
cost structure. The hiring costs’ elasticity with respect to the number of
recruits is 1.19. We further find that hiring costs increase with firm size, and
strongly depend on skilled workers’ pay. In addition, firms facing difficulties
in hiring skilled labor externally exhibit hiring costs 20.4% above average.
The coefficient on the generalized residual is not significantly different from
zero. Thus we find no evidence for a self-selection bias in the hiring costs
equation.
Third, we estimate equation (6), i.e., we regress the net costs of train-
ing C on x2 and the generalized residual (table A6). In contrast to hiring
costs, we find that the structure of net training costs is concave. Hiring an
additional trainee decreases average net training costs by CHF 180. This re-
sults is mainly due to economies of scale in instruction time (training several
trainees at the same time requires less time per trainee). Furthermore, the
14

result show that a 1 percentage point increase in the local share of potential
trainees decreases the net costs of training by CHF 4355. The explanation
for this result is that firms are more likely to find a good match if the supply
of suitable young people is high. Therefore, firms with a good match quality
can save on training costs compared to firms with a poorer match quality.
The coefficient on the generalized residual is negative and significantly dif-
ferent from zero, meaning that the expected net costs of training for firms
with L = 0 are significantly higher than those for firms with L > 0.
Having obtained consistent estimates of hiring costs and net training
costs, we estimate the structural effects of hiring costs H and net training
costs C on the firm’s supply of training positions L.
The results show that both variables have significant effects on the num-
ber of training positions L (table 1). A look at the entire sample reveals that
an increase in average hiring costs H by CHF 1000 increases the number
of training positions by 0.13, implying that an increase in average hiring
costs by CHF 8,000 induces a firm to hire one additional trainee. This effect
is economically substantial, as an increase of H by one standard deviation
(CHF 7174) increases a firm’s supply of training by 0.52 standard deviations
(0.93 training positions).
We then estimate the supply of training positions using only firms with
positive net costs (C > 0). We expect a stronger effect of hiring costs
on training supply for this sub-sample, as post-training benefits are crucial
for firms that made a net investment in training (table 1). We find that
an increase in average hiring costs H of CHF 1000 increases the supply
of training positions by 0.17 (third column, table 1). Put differently, an
increase in H by one standard deviation leads to a 0.6 standard deviations
(1.4 training positions) increase in the supply of training for firms with
C > 0. Including an interaction term of hiring costs and net training costs
(multiplied by (−1)), we find that the effect of hiring costs is inversely related
to the level of net training costs (last column, table 1). The coefficients
on the individual variables remain significant. Our results show that the
marginal effect of average hiring costs evaluated at the average of net training
costs (i.e., ∂L/∂H = 0.236 − 0.00321 ׯCi)) on the firm’s supply of training
15

Table 1: Determinants of the firm’s supply of training positions L
Dependent variable: Number of training positions L
all firms if C > 0
Hiring costs H (in 1000 CHF) 0.1265 0.1700 0.236
(0.0132) (0.0339) (0.0493)
Net training costs C (in 1000 CHF) -0.1341 -0.2338 -0.194
(0.0403) (0.0694) (0.0716)
H × (−1)C (in 1,000,000 CHF) 3.210
(1.040)
New hires (internal + external) 0.0705 0.2518 0.2474
(0.0386) (0.0959) (0.0883))
Number of skilled workers Ns 0.0554 0.0196 0.0185
(0.0078) (0.0087) (0.008)
Number of other workers No 0.0086 0.0086 0.0087
(0.0015) (0.0015) (0.0016)
Wage of skilled workers w (in CHF) -0.0058 -0.0011 -0.0011
(0.0001) (0.0002) (0.0002)
Foreign firm ownership -1.8801 -2.0506 -2.0616
(0.2526) (0.6222) (0.6309)
Aggregate cantonal (i.e., state) income 0.0142 0.001 0.0105
(in 1000 CHF) (0.0102) (0.0148) (0.0105)
Industry controls Yes Yes Yes
Job controls Yes Yes Yes
Constant -0.3487 2.348 2.0799
(0.4544) (1.0661) 1.0693
Log pseudolikelihood -427,207.90 -114,744.93 -114,457.59
Observations 6739 2114 2114
Cluster-robust standard errors in parentheses.
16

is 0.204. Thus an increase in H by one standard deviation leads to a 0.72
standard deviations (1.7 training positions) increase in the supply of training
for firms with C > 0.16
As expected, the net costs of training have a negative effect on a firm’s
supply of training. If the net costs C increase by CHF 1000, the number
of training positions L decreases by 0.13. Put differently, if C decreases by
one standard deviation (CHF 13,251), a firm’s number of internal training
positions will decrease by 0.93 standard deviations (1.8 training positions).
Considering only firms with C > 0, the coefficient on C is -0.23. Accounting
for the interdependence of hiring costs and net training costs, an in increase
in average net training costs (evaluated at average hiring costs) by CHF
1000 decreases a firm’s supply of training positions by 0.22, implying that a
one standard deviation increase in average net training costs leads to a 1.3
standard deviations decrease in training positions.
Furthermore, both the number of skilled workers and the number of other
employees within the firm have a positive effect on the supply of training L.
The wage of skilled workers w has a negative effect on L, possibly because
the wage is negatively related to the separation rate of trainees. Therefore,
a firm needs to train fewer apprentices to fill a given number of vacancies.
Finally, foreign-owned firms have a significantly lower supply of training. A
possible explanation for this result is that these firms might be less familiar
with the vocational training system or too small and specialized to provide
an entire training program.
16As a robustness check we re-estimate our model by excluding firms that offer internal
training but did not retain any trainees in the preceding three years. Our main results
remain qualitatively unchanged, although the effect of hiring costs becomes stronger. Ac-
counting for the interdependence of hiring costs and net training costs, we find that a one
standard deviation increase in average hiring costs increases a firm’s supply of training
positions by 1.1 standard deviations (last column, table A7).
17

6 Conclusions
Firm-sponsored training is an alternative hiring strategy, as opposed to
hiring skilled workers solely from the external labor market. A profit-
maximizing firm will offer internal training and subsequently retain some
workers if the corresponding costs are lower than the costs of external hir-
ing.
Using representative firm-level data that contains detailed measures of
hiring and training costs, we find that a one standard deviation increase
in average hiring costs is associated with a 0.7 standard deviation increase
in training positions. Conversely, we find that a one standard deviation
increase in average net training costs reduces a firm’s supply of training by
1.3 standard deviations. In monetary terms, a 10,000 Swiss franc increase
in average hiring costs increases a firm’s supply by two training positions,
whereas a 10,000 Swiss franc increase in average net training costs reduces
a firms supply by two training positions.
Our analysis contributes to the understanding of why firms are frequently
willing to make substantial investments in general training. The results
have important implications, as demographic change is expected to lead
to a shortage of skilled workers in the Swiss and many other Western la-
bor markets. As external hiring becomes increasingly expensive, our results
suggest that firms will offer more internal training positions to satisfy their
demand for skilled workers. However, demographic change will also reduce
the number of school leavers and thus a firm’s pool of potential trainees.
Consequently, firms that are confronted with less suitable training candi-
dates will have to invest more resources so that trainees still achieve the
desired skill level. Our results show that net training costs will increase
if the match quality decreases, which in turn has an adverse effect on a
firm’s supply of training. The challenge for policy makers is therefore to
design training regulations so that firms can provide training cost-efficiently
to ensure the young people’s future skill formation in firm-based training
programs.
18
References
Abowd, John M. and Francis Kramarz (2003). The costs of hiring and
separations. Labour Economics 10 (5), 499–530.
Amemiya, Takeshi (1985). Advanced Econometrics. Harvard University
Press, Cambridge, Massachusetts.
Barron, John M., John Bishop, and William C. Dunkelberg (1985). Em-
ployer Search: The Interviewing and Hiring of New Employees. The Re-
view of Economics and Statistics 67 (1), 43–52.
Blatter, Marc, Samuel Muehlemann, and Samuel Schenker (2012). The costs
of hiring skilled workers. European Economic Review 56 (1), 20–35.
Booth, Alison L. and Stephen E. Satchell (1994). Apprenticeships and Job
Tenure. Oxford Economic Papers 46 (4), 676–95.
Cappelli, Peter (2004). Why Do Employers Pay for College? Journal of
Econometrics 121 (1-2), 213–41.
Dube, Arindrajit, Eric Freeman, and Michael Reich (2010). Employee Re-
placement Costs. Institute for Research on Labor and Employment, Work-
ing Paper Series 1193228, Institute of Industrial Relations, UC Berkeley.
Dustmann, Christian, Rob Euwals, and Arthur van Soest (1997). Wages in
the First Job after Apprenticeship: Movers versus Stayers. Mitteilungen
aus der Arbeitsmarkt- und Berufsforschung 30 (3), 671–74.
Ejarque, Joao Miguel and Oivind Anti Nilsen (2008). Identifying Adjustment
Costs of Net and Gross Employment Changes. IZA Discussion Paper No.
3703.
Euwals, Rob and Rainer Winkelmann (2002). Mobility after Apprenticeship–
Evidence from Register Data. Applied Economics Quarterly 48 (3-4), 256–
78.
Hamermesh, Daniel S. and Gerard A. Pfann (1996). Adjustment Costs in
Factor Demand. Journal of Economic Literature 34 (3), 1264–1292.
19
Idson, Todd (1993). Employer Size and Labor Turnover. Columbia Univer-
sity Discussion Paper No. 673.
Kramarz, Francis and Marie-Laure Michaud (2010). The shape of hiring
and separation costs in France. Labour Economics 17 (1), 27–37.
Lindley, Robert M. (1975). The Demand for Apprentice Recruits by the En-
gineering Industry, 1951-71. Scottish Journal of Political Economy 22 (1),
1–24.
Manning, Alan (2006). A Generalised Model of Monopsony. Economic
Journal 116 (508), 84–100.
Manning, Alan (2011). Imperfect Competition in the Labor Market, Volume 4
of Handbook of Labor Economics, Chapter 11, pp. 973–1041. Elsevier.
Merrilees, William J. (1983). Alternative Models of Apprentice Recruitment:
With Special Reference to the British Engineering Industry. Applied Eco-
nomics 15 (1), 1–21.
Merz, Monika and Eran Yashiv (2007). Labor and the Market Value of the
Firm. American Economic Review 97 (4), 1419–1431.
Muehlemann, Samuel, Harald Pfeifer, Gunter Walden, Felix Wenzelmann,
and Stefan C. Wolter (2010). The Financing of Apprenticeship Training
in the Light of Labor Market Regulations. Labour Economics 17 (5), 799–
809.
Muehlemann, Samuel, Juerg Schweri, Rainer Winkelmann, and Stefan C.
Wolter (2007). An Empirical Analysis of the Decision to Train Appren-
tices. Labour 21 (3), 419–441.
Muehlemann, Samuel and Stefan C. Wolter (2011). Firm-sponsored Training
and Poaching Externalities in Regional Labor Markets. Regional Science
and Urban Economics 41 (6), 560–570.
Oatey, Michael (1970). The economics of training with respect to the firm.
British Journal of Industrial Relations 8 (1), 1–21.
20

OECD (2009). Education at a Glance 2009. OECD.
Oi, Walter Y. (1962). Labor as a Quasi-Fixed Factor. Journal of Political
Economy 70, 538.
Pfann, Gerard A. and Bart Verspagen (1989). The structure of adjust-
ment costs for labour in the Dutch manufacturing sector. Economics
Letters 29 (4), 365–371.
Stevens, Margaret (1994). An Investment Model for the Supply of Training
by Employers. Economic Journal 104 (424), 556–70.
Vella, Francis (1992). Simple Tests for Sample Selection Bias in Censored
and Discrete Choice Models. Journal of Applied Econometrics 7 (4), 413–
21.
Winkelmann, Rainer (1996). Employment Prospects and Skill Acquisition
of Apprenticeship-Trained Workers in Germany. Industrial and Labor Re-
lations Review 49 (4), 658–72.
Wolter, Stefan C. and Paul Ryan (2011). Apprenticeship. In
Eric A.Hanushek, Stephen Machin, and LudgerWoessmann (Eds.), Hand-
book of the Economics of Education, Volume 3, Chapter 11, pp. 521–576.
The Netherlands: North-Holland.
Wooldridge, Jeffrey M. (2002). Econometric analysis of cross section and
panel data. MIT Press.
Yashiv, Eran (2000). Hiring as Investment Behavior. Review of Economic
Dynamics 3 (3), 486–522.
21
A Tables
Table A1: Hiring and training costsExternal hiring No external hiring
Training No training Training No training
Hiring costs H 11,888.160 14,286.190 – –
(11,906.010) (14,561.400)
Number of recruits R 3.511 2.557 – –
(4.369) (2.919)
Separation rate δ 10.173 14.680 – –
(16.629) (19.907)
Net training costs C -7304.728 – -9958.906 –
(34,908.28) (33,170)
Number of trainees L 2.584 – 1.883 –
(3.205) (1.864)
Number of trainees retained 0.991 – 0.518 –
(4.078) (1.386)
Trainee separation rate γ 68.33 – 74.0542 –
(32.8435) 32.0286
Number of skilled workers Ns 11.235 4.1910 4.4994 2.3643
(29.6258) (6.6944) (9.7787) (2.7852)
Number of other workers No 26.03 8.674 10.82 4.484
(115.4) (37.62) (59.41) (15.04)
Monthly skilled worker pay w 6340.3 6459.6 6256.3 6229.0
(1417.5) (1460.8) (1281.0) (514.6)
Observations 2381 1671 1263 1424
Standard deviation in parentheses.
22
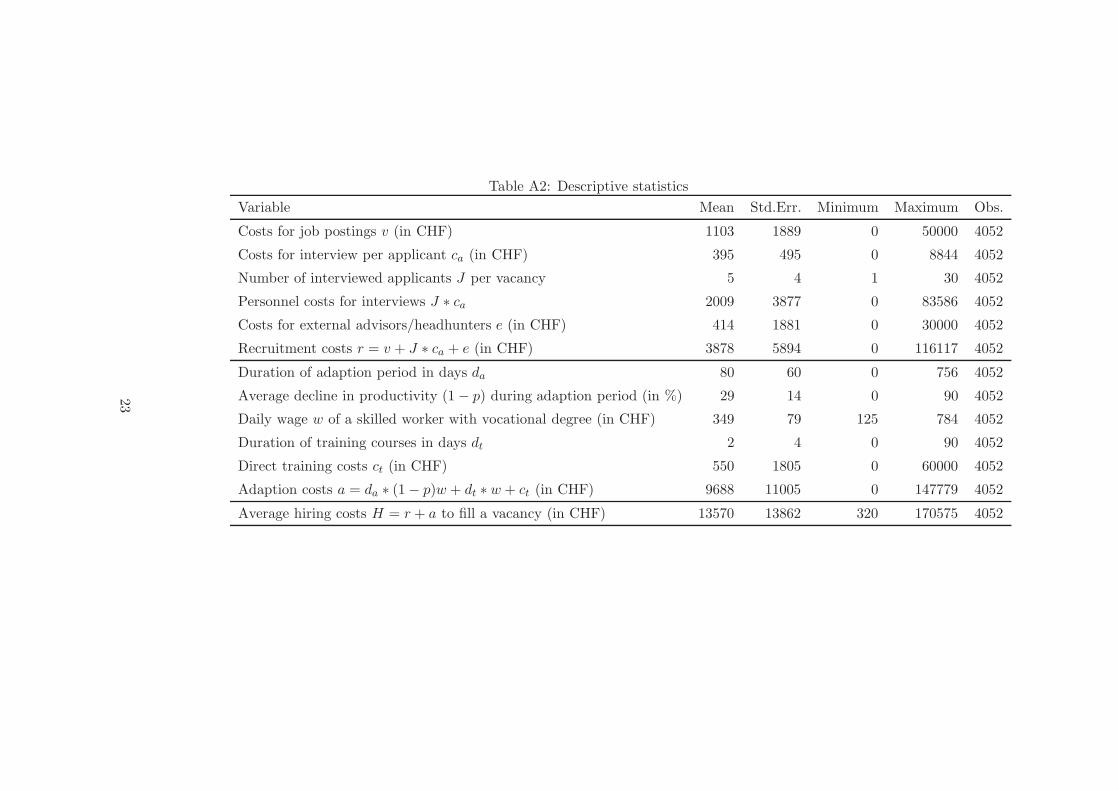
Table A2: Descriptive statistics
Variable Mean Std.Err. Minimum Maximum Obs.
Costs for job postings v (in CHF) 1103 1889 0 50000 4052
Costs for interview per applicant ca (in CHF) 395 495 0 8844 4052
Number of interviewed applicants J per vacancy 5 4 1 30 4052
Personnel costs for interviews J ∗ ca 2009 3877 0 83586 4052
Costs for external advisors/headhunters e (in CHF) 414 1881 0 30000 4052
Recruitment costs r = v + J ∗ ca + e (in CHF) 3878 5894 0 116117 4052
Duration of adaption period in days da 80 60 0 756 4052
Average decline in productivity (1 − p) during adaption period (in %) 29 14 0 90 4052
Daily wage w of a skilled worker with vocational degree (in CHF) 349 79 125 784 4052
Duration of training courses in days dt 2 4 0 90 4052
Direct training costs ct (in CHF) 550 1805 0 60000 4052
Adaption costs a = da ∗ (1 − p)w + dt ∗ w + ct (in CHF) 9688 11005 0 147779 4052
Average hiring costs H = r + a to fill a vacancy (in CHF) 13570 13862 320 170575 4052
23
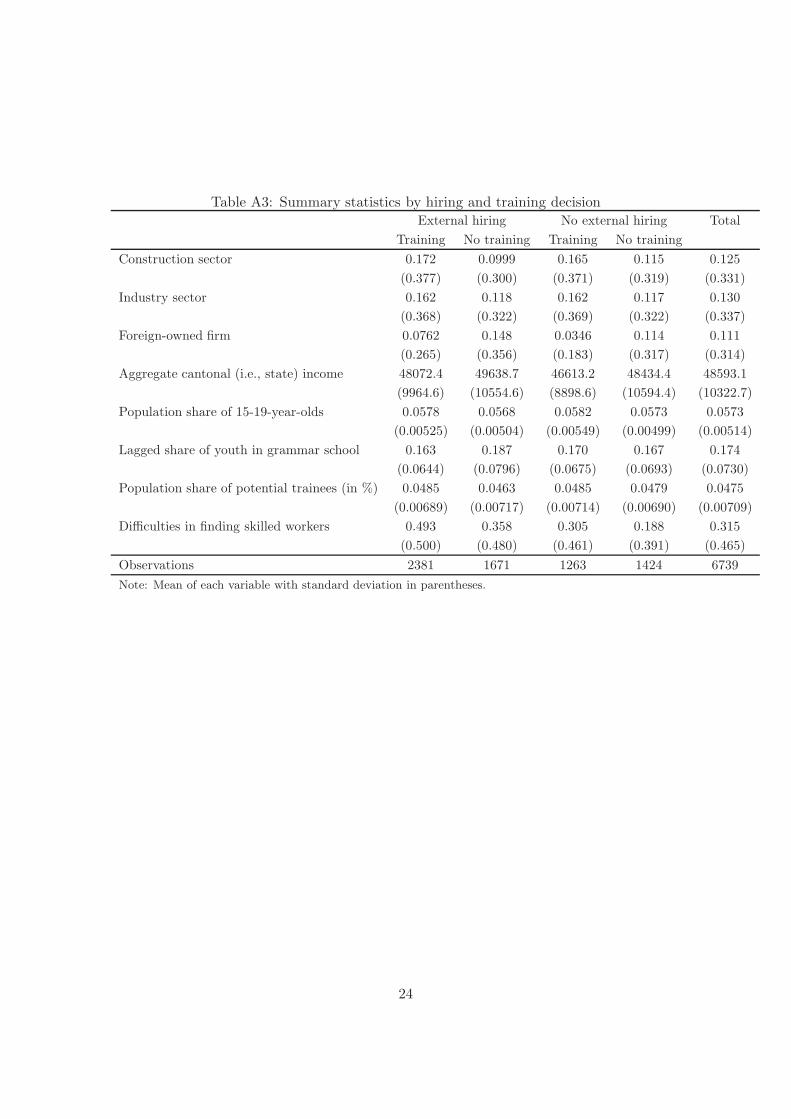
Table A3: Summary statistics by hiring and training decisionExternal hiring No external hiring Total
Training No training Training No training
Construction sector 0.172 0.0999 0.165 0.115 0.125
(0.377) (0.300) (0.371) (0.319) (0.331)
Industry sector 0.162 0.118 0.162 0.117 0.130
(0.368) (0.322) (0.369) (0.322) (0.337)
Foreign-owned firm 0.0762 0.148 0.0346 0.114 0.111
(0.265) (0.356) (0.183) (0.317) (0.314)
Aggregate cantonal (i.e., state) income 48072.4 49638.7 46613.2 48434.4 48593.1
(9964.6) (10554.6) (8898.6) (10594.4) (10322.7)
Population share of 15-19-year-olds 0.0578 0.0568 0.0582 0.0573 0.0573
(0.00525) (0.00504) (0.00549) (0.00499) (0.00514)
Lagged share of youth in grammar school 0.163 0.187 0.170 0.167 0.174
(0.0644) (0.0796) (0.0675) (0.0693) (0.0730)
Population share of potential trainees (in %) 0.0485 0.0463 0.0485 0.0479 0.0475
(0.00689) (0.00717) (0.00714) (0.00690) (0.00709)
Difficulties in finding skilled workers 0.493 0.358 0.305 0.188 0.315
(0.500) (0.480) (0.461) (0.391) (0.465)
Observations 2381 1671 1263 1424 6739
Note: Mean of each variable with standard deviation in parentheses.
24
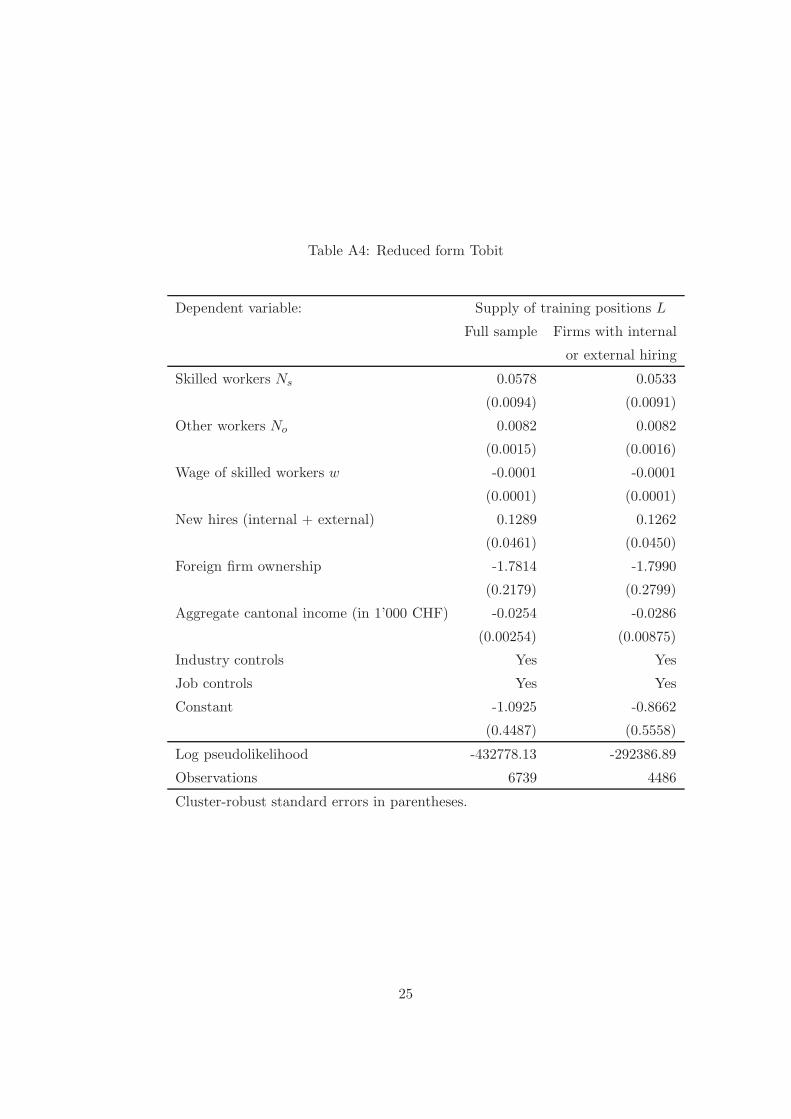
Table A4: Reduced form Tobit
Dependent variable: Supply of training positions L
Full sample Firms with internal
or external hiring
Skilled workers Ns 0.0578 0.0533
(0.0094) (0.0091)
Other workers No 0.0082 0.0082
(0.0015) (0.0016)
Wage of skilled workers w -0.0001 -0.0001
(0.0001) (0.0001)
New hires (internal + external) 0.1289 0.1262
(0.0461) (0.0450)
Foreign firm ownership -1.7814 -1.7990
(0.2179) (0.2799)
Aggregate cantonal income (in 1’000 CHF) -0.0254 -0.0286
(0.00254) (0.00875)
Industry controls Yes Yes
Job controls Yes Yes
Constant -1.0925 -0.8662
(0.4487) (0.5558)
Log pseudolikelihood -432778.13 -292386.89
Observations 6739 4486
Cluster-robust standard errors in parentheses.
25
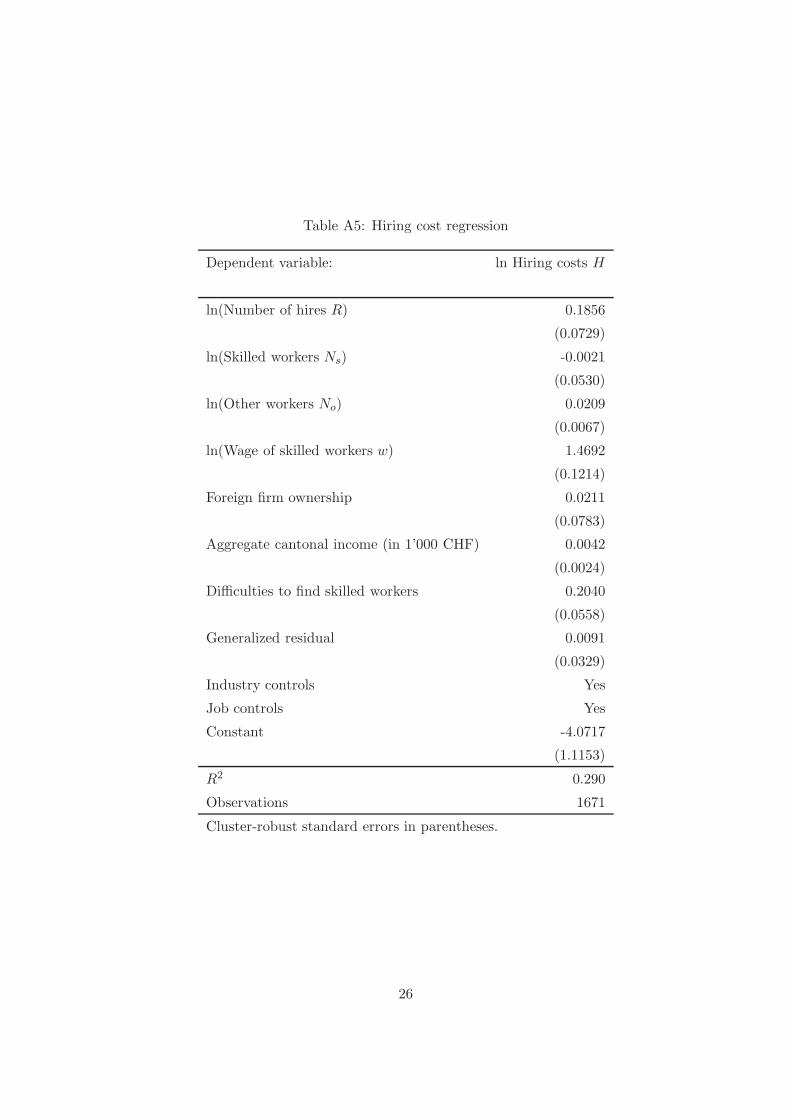
Table A5: Hiring cost regression
Dependent variable: ln Hiring costs H
ln(Number of hires R) 0.1856
(0.0729)
ln(Skilled workers Ns) -0.0021
(0.0530)
ln(Other workers No) 0.0209
(0.0067)
ln(Wage of skilled workers w) 1.4692
(0.1214)
Foreign firm ownership 0.0211
(0.0783)
Aggregate cantonal income (in 1’000 CHF) 0.0042
(0.0024)
Difficulties to find skilled workers 0.2040
(0.0558)
Generalized residual 0.0091
(0.0329)
Industry controls Yes
Job controls Yes
Constant -4.0717
(1.1153)
R2 0.290
Observations 1671
Cluster-robust standard errors in parentheses.
26

Table A6: Net cost regression
Dependent variable: Net training costs C
Number of trainees L -181.5957
(67.7274)
Skilled workers Ns 18.0259
(21.5736)
Number of other workers No 10.5812
(4.7449)
Wage of skilled workers w -1.8450
(1.0646)
Foreign firm ownership -264.1512
(3605.03)
Aggregate cantonal income (in 1’000 CHF) 133.7377
(83.1494)
Population share of potential trainees (in %) -4355.1560
(1403.5560)
Generalized residual -709.9584
(322.3683)
Industry controls Yes
Job controls Yes
Constant 18,963.62
(10114.16)
R2 0.1332
Observations 2381
Cluster-robust standard errors in parentheses.
27
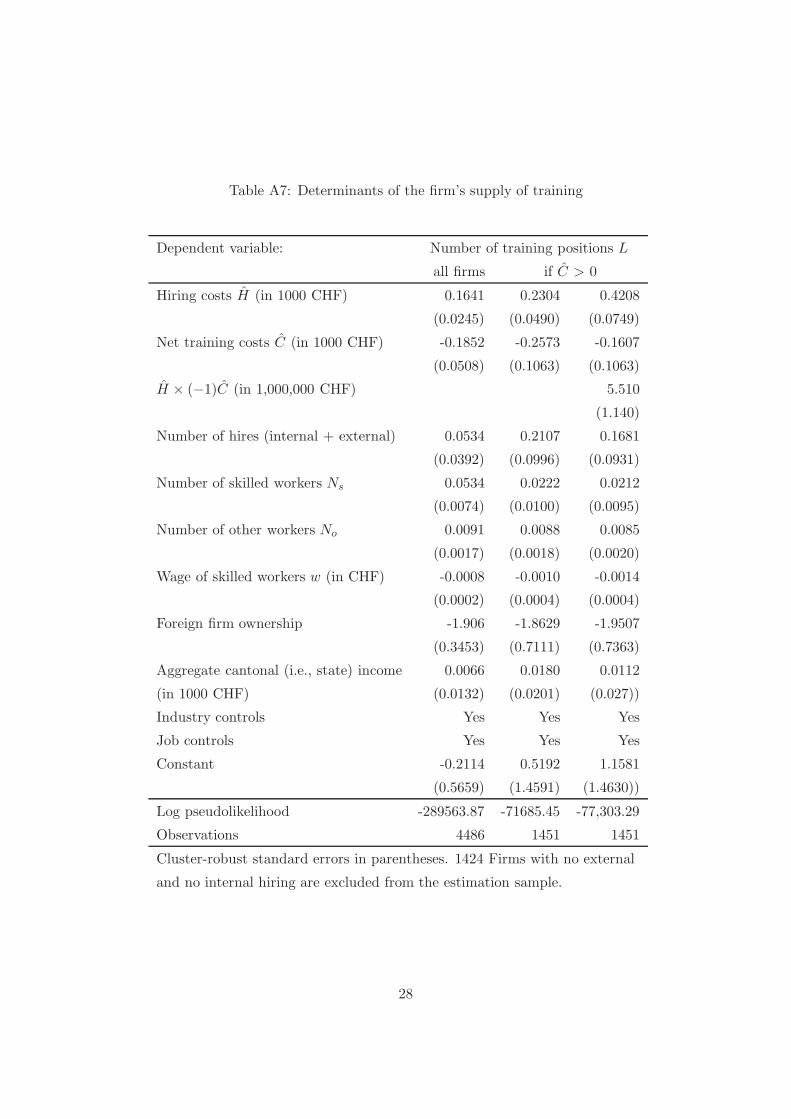
Table A7: Determinants of the firm’s supply of training
Dependent variable: Number of training positions L
all firms if C > 0
Hiring costs H (in 1000 CHF) 0.1641 0.2304 0.4208
(0.0245) (0.0490) (0.0749)
Net training costs C (in 1000 CHF) -0.1852 -0.2573 -0.1607
(0.0508) (0.1063) (0.1063)
H × (−1)C (in 1,000,000 CHF) 5.510
(1.140)
Number of hires (internal + external) 0.0534 0.2107 0.1681
(0.0392) (0.0996) (0.0931)
Number of skilled workers Ns 0.0534 0.0222 0.0212
(0.0074) (0.0100) (0.0095)
Number of other workers No 0.0091 0.0088 0.0085
(0.0017) (0.0018) (0.0020)
Wage of skilled workers w (in CHF) -0.0008 -0.0010 -0.0014
(0.0002) (0.0004) (0.0004)
Foreign firm ownership -1.906 -1.8629 -1.9507
(0.3453) (0.7111) (0.7363)
Aggregate cantonal (i.e., state) income 0.0066 0.0180 0.0112
(in 1000 CHF) (0.0132) (0.0201) (0.027))
Industry controls Yes Yes Yes
Job controls Yes Yes Yes
Constant -0.2114 0.5192 1.1581
(0.5659) (1.4591) (1.4630))
Log pseudolikelihood -289563.87 -71685.45 -77,303.29
Observations 4486 1451 1451
Cluster-robust standard errors in parentheses. 1424 Firms with no external
and no internal hiring are excluded from the estimation sample.
28


