HINO MOTORS, LTD. - marketscreener.com · tions in transportation systems, labor strikes, work...
40
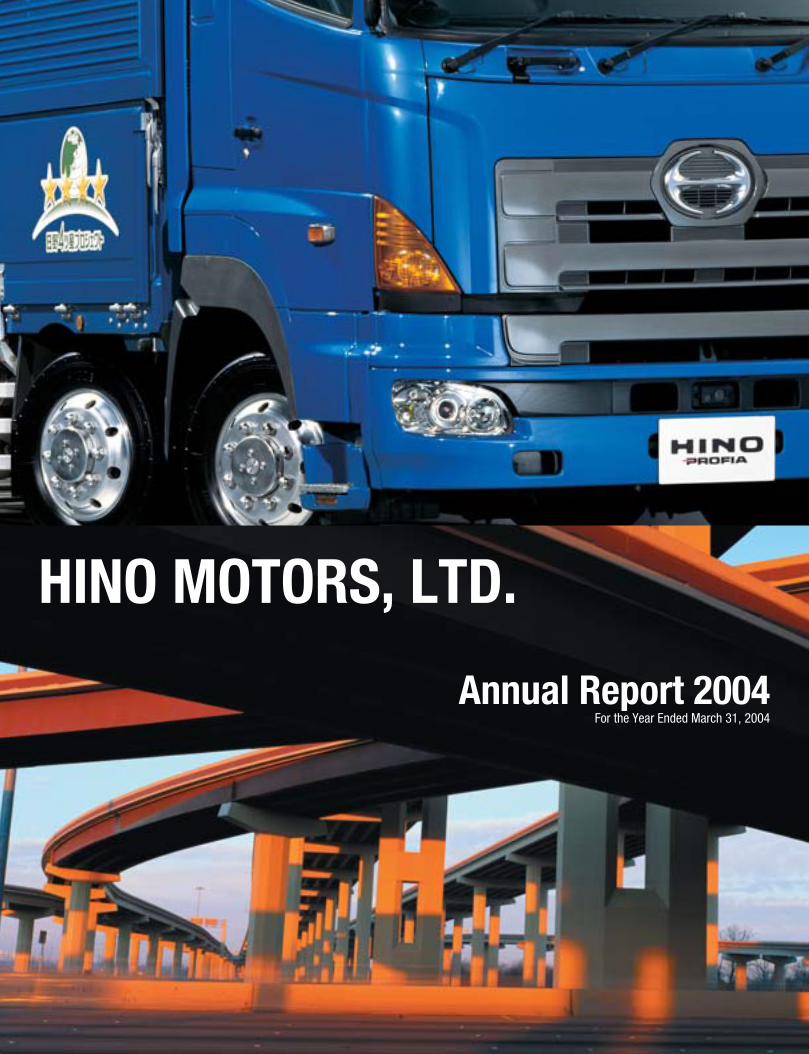
HINO MOTORS, LTD. Annual Report 2004 For the Year Ended March 31, 2004
Transcript of HINO MOTORS, LTD. - marketscreener.com · tions in transportation systems, labor strikes, work...
HINO MOTORS, LTD.
Annual Report 2004For the Year Ended March 31, 2004
Hino Motors, Ltd., was founded in 1942 and has a history of more than 60 years in manufacturing commercial vehicles. At
present, the Hino Group produces trucks, buses, various types of engines, and spare parts. The Group also undertakes
the commissioned production of compact commercial vehicles and passenger cars for Toyota Motor Corporation.
In its long-term vision for fiscal 2010, Hino Motors has set an objective of establishing a presence for the Hino
brand in markets worldwide, which will enable it to sell 150,000 vehicles annually and gain the fifth-leading position
in the global market. To attain this objective, Hino is implementing a medium-term management plan that has the
goals of “structural earnings reform,” “production reform,” “structural reform for Toyota business operations,” and
“further fixed cost reform.”
Cautionary Statement with Respect to Forward-Looking StatementsStatements contained in this annual report that are not historical facts are forward-looking statements that reflect our plans and expectations. These forward-looking statementsinvolve known and unknown risks, uncertainties, and other factors that may cause our actual results, performance, or achievements to differ materially from those anticipated inthese statements. These factors include (i) changes in economic conditions, currency exchange rates, laws, regulations, and government policies or political instability in ourmajor markets, (ii) circumstances relating to our ability to develop, in a timely manner, and achieve market acceptance of new products, and (iii) shortages of fuel or interrup-tions in transportation systems, labor strikes, work stoppages, or other interruptions or difficulties in the employment of labor in the major markets where we purchase materi-als, components, and supplies for the production of our products or where our products are produced, distributed, or sold.
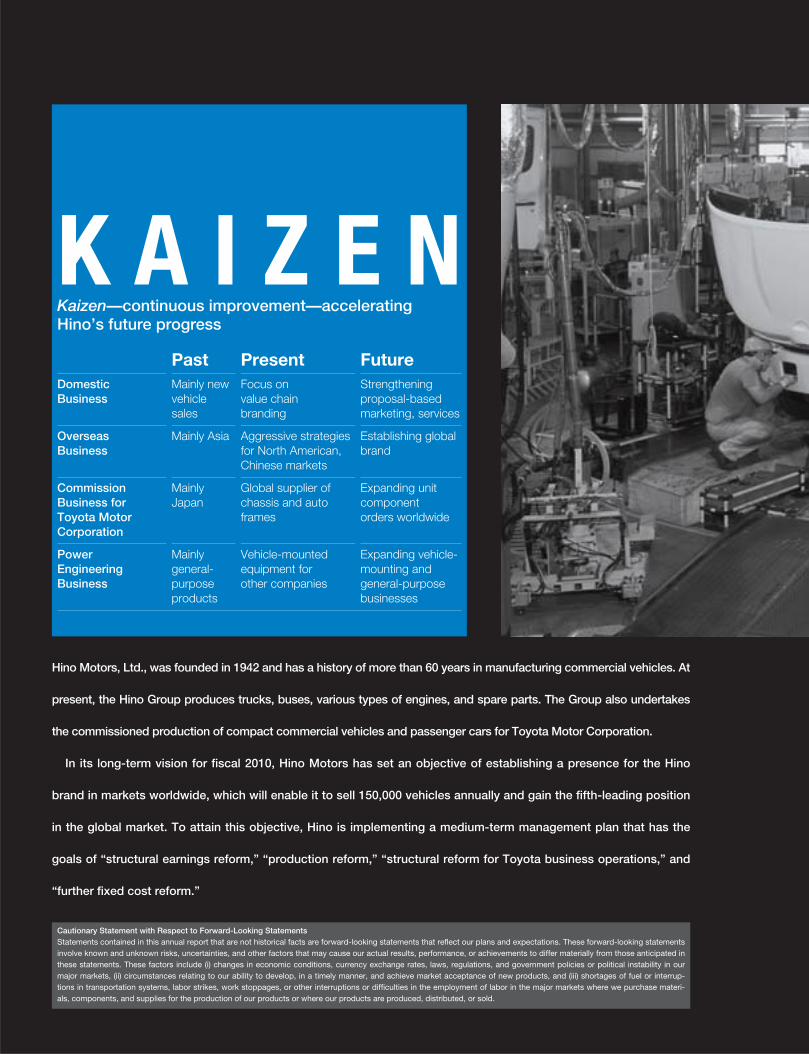
K A I Z E NKaizen—continuous improvement—acceleratingHino’s future progress
Past Present FutureDomestic Mainly new Focus on Strengthening Business vehicle value chain proposal-based
sales branding marketing, services
Overseas Mainly Asia Aggressive strategies Establishing globalBusiness for North American, brand
Chinese markets
Commission Mainly Global supplier of Expanding unit Business for Japan chassis and auto component Toyota Motor frames orders worldwideCorporation
Power Mainly Vehicle-mounted Expanding vehicle-Engineering general- equipment for mounting and Business purpose other companies general-purpose
products businesses

Contents
2 Message from the Management
10 Directors, Auditors, and Executive Officers
11 Corporate Social Responsibility
13 Five-Year Summary
14 Financial Review
18 Consolidated Financial Statements
23 Notes to Consolidated Financial Statements
35 Report of Independent Auditors
36 Stock Information
37 Consolidated Subsidiaries and Affiliates
The Sundial Production Method has been adopted for the manufacture of specified vehicles for the North American market.The method entails attaching the frame, engine, and seats to the vehicle from stations located around the outer edge of aturntable that rotates a full circle over the course of an hour. The method is symbolic of Hino’s unprecedented Kaizenapproach for consistently honing and improving production.
{At the Forefront of
Innovation
HINO MOTORS, LTD. 1
2 HINO MOTORS, LTD.
In fiscal 2003, ended March 31, 2004, Hino Motors, Ltd.’s
net sales rose 23.7% year on year, to ¥1,051,587 million
(US$9,950 million), breaching ¥1 trillion for the first time
on the back of sharply higher sales volumes in all three
business segments: domestic business, overseas busi-
ness, and Toyota businesses (commission business
for Toyota Motor Corporation (TMC)). Earnings reached
historically high levels, as operating profit increased
2.3 times, to ¥44,567 million (US$422 million), and net
income expanded 6.9 times, to ¥34,023 million (US$322
million).
Record sales and earnings were attributable to stricter
standards for diesel vehicles in the Tokyo metropolitan
area and the Automobile NOx/PM Law* in Japan, which
spurred replacement buying and sharply boosted sales
volume. Hino’s earnings soared thanks to the rewards
steadily yielded by structural reforms and overall cost-
cutting measures as well as initiatives to change the corporate
culture that have been implemented over the past three
years.
* The Law Concerning Special Measures for Total Emission Reductions toNitrogen Oxides and Particulate Matter
The Company enacted managerial changes to accelerate
its reform initiatives, appointing Tadaaki Jagawa (formerly
President) as the new Chairman of the Board and Shoji
Kondo (formerly Executive Vice-President) as President.
Hino is stepping up the pace of reform at all levels. Our
long-term vision for fiscal 2010 is to establish the Hino
brand in markets worldwide, with annual sales of 150,000
vehicles and the fifth-leading position in the global market.
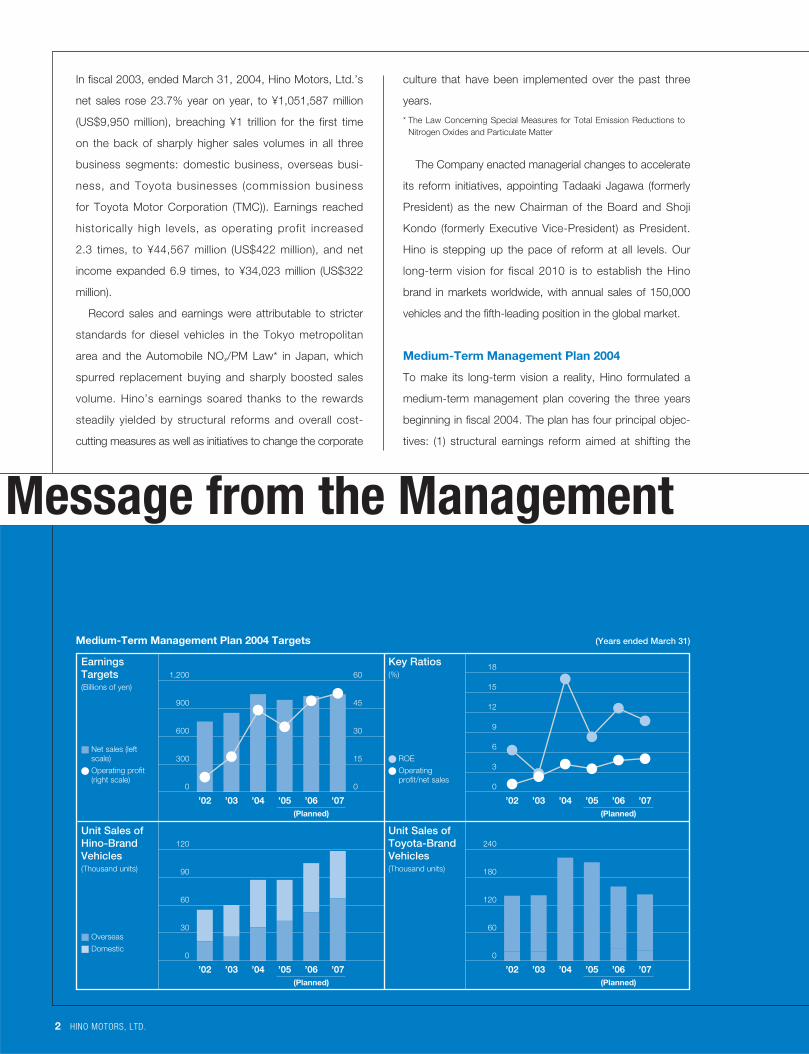
Medium-Term Management Plan 2004
To make its long-term vision a reality, Hino formulated a
medium-term management plan covering the three years
beginning in fiscal 2004. The plan has four principal objec-
tives: (1) structural earnings reform aimed at shifting the
Medium-Term Management Plan 2004 Targets (Years ended March 31)
0
15
30
45
60
0
300
600
900
1,200
0
3
6
9
12
15
18
0
30
60
90
120
0
60
120
180
240
’07’06(Planned)
’05’04’03’02 ’07’06(Planned)
’05’04’03’02
’07’06(Planned)
’05’04’03’02 ’07’06(Planned)
’05’04’03’02
Key Ratios(%)
� ROE
� Operating profit/net sales
EarningsTargets(Billions of yen)
� Net sales (leftscale)
� Operating profit(right scale)
Unit Sales ofToyota-BrandVehicles(Thousand units)
Unit Sales ofHino-BrandVehicles(Thousand units)
� Overseas
� Domestic
Message from the Management
HINO MOTORS, LTD. 3
earnings structure from Japan-centered operations to
overseas businesses, (2) production reform focused on
bolstering product capabilities and increasing price
competitiveness, (3) structural reform for Toyota business-
es to expand unit operations in overseas markets, and (4)
further fixed cost reform through a revamping of these
costs worldwide. In addit ion, from fiscal 2002 the
Company adopted a rolling method for revising its three-
year medium-term plans each year.
Our management plan covers two distinct areas: the
Hino brand business and the Toyota businesses.
Hino Brand Business
In the Hino Brand business, the Company aims to build a
formidable presence in global markets through separate
endeavors in domestic, overseas, and power engineering
(PE: diesel engines) fields.
In domestic business, the emphasis is on proposing and
delivering products and services that reduce costs for cus-
tomers over the long term while increasing benefits for cus-
tomers. In overseas business, the focus is on lowering costs
by boosting production in Asia, launching and starting the pro-
duction of trucks especially for the North American market,
quickly building a network capable of selling 10,000 vehicles a
year in North America through the renovation of the sales and
services network, and forging full-fledged expansion in China.
In the PE business, we are expanding unit sales of engines for
vehicle installation and construction machinery that incorporate
industry-leading technologies for eliminating exhaust fumes.
Toyota Businesses
In Toyota businesses, the Company aims to make further
contributions to the global production of the Toyota Group,
overseeing activities from product development to the
manufacture of the frames used in Toyota vehicles while
building a global supply network for its chassis.
Domestic Truck Market and a Full Lineup in the
Four-Star Truck Series
Conforming with strengthened regulations on exhaust
emissions for diesel trucks is one way that the truck manu-
facturing industry and the logistics industry are responding
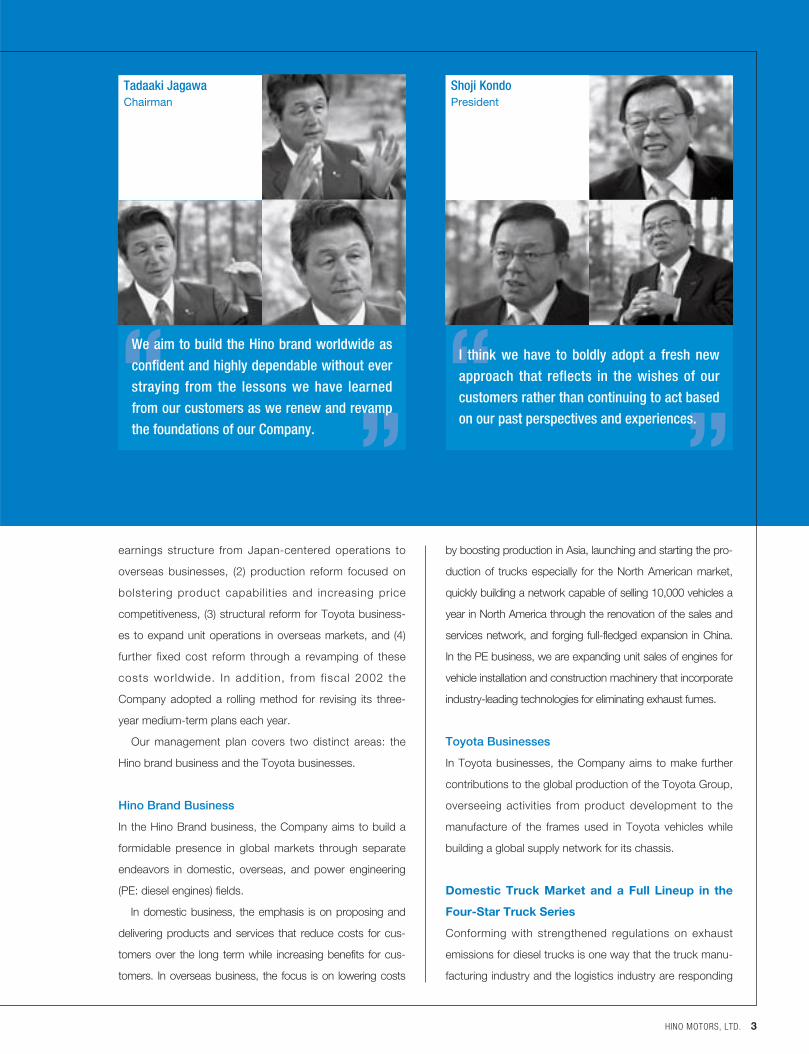
Tadaaki JagawaChairman
“ ”
We aim to build the Hino brand worldwide asconfident and highly dependable without everstraying from the lessons we have learnedfrom our customers as we renew and revampthe foundations of our Company.
Shoji Kondo President
“ ”
I think we have to boldly adopt a fresh newapproach that reflects in the wishes of ourcustomers rather than continuing to act basedon our past perspectives and experiences.
4 HINO MOTORS, LTD.
Truck Market in Japan
to environmental needs. Measures for curtailing harmful
diesel exhaust emissions are targeted separately at truck
manufacturers and truck users.
New regulations for manufacturers concerning nitrogen
oxides (NOx) and particulate matter (PM) in exhaust emis-
sions are applicable to newly registered models under the
New Short-Term Emissions Regulations enacted in
October 2003, as illustrated below left. In addition, New
Long-Term Emissions Regulations slated to take effect in
October 2005 aim to curtail NOx emissions another 41% to
50% and PM emissions another 75% to 85%. A new set of
long-term regulations is already under discussion.
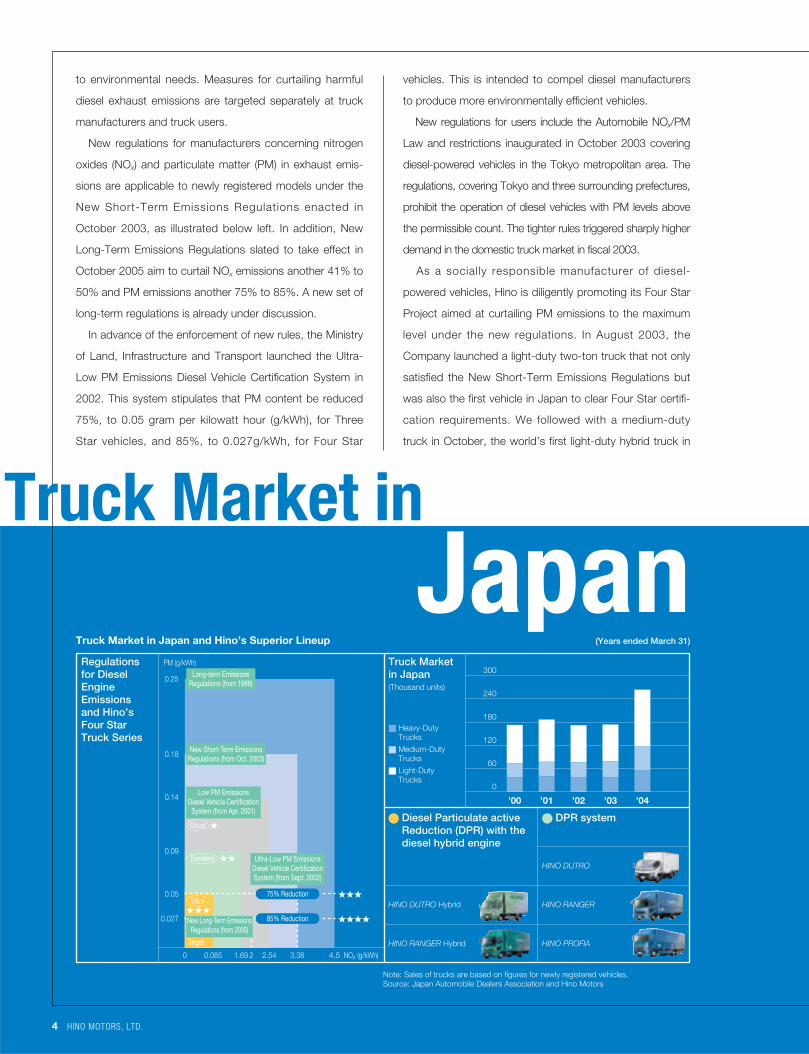
In advance of the enforcement of new rules, the Ministry
of Land, Infrastructure and Transport launched the Ultra-
Low PM Emissions Diesel Vehicle Certification System in
2002. This system stipulates that PM content be reduced
75%, to 0.05 gram per kilowatt hour (g/kWh), for Three
Star vehicles, and 85%, to 0.027g/kWh, for Four Star
vehicles. This is intended to compel diesel manufacturers
to produce more environmentally efficient vehicles.
New regulations for users include the Automobile NOx/PM
Law and restrictions inaugurated in October 2003 covering
diesel-powered vehicles in the Tokyo metropolitan area. The
regulations, covering Tokyo and three surrounding prefectures,
prohibit the operation of diesel vehicles with PM levels above
the permissible count. The tighter rules triggered sharply higher
demand in the domestic truck market in fiscal 2003.
As a socially responsible manufacturer of diesel-
powered vehicles, Hino is diligently promoting its Four Star
Project aimed at curtailing PM emissions to the maximum
level under the new regulations. In August 2003, the
Company launched a light-duty two-ton truck that not only
satisfied the New Short-Term Emissions Regulations but
was also the first vehicle in Japan to clear Four Star certifi-
cation requirements. We followed with a medium-duty
truck in October, the world’s first light-duty hybrid truck in
Truck Market in Japan and Hino’s Superior Lineup (Years ended March 31)
0
60
120
180
240
300
’04’03’02’01’00
NOx (g/kWh)
PM (g/kWh)
0.25
4.5
0.18
3.38
0.14
2.54
0.09
1.69
0.05
0.027
0.0850 2
Good ★
Excellent ★★
Ultra ★★★
Target
Long-term EmissionsRegulations (from 1988)
New Short-Term EmissionsRegulations (from Oct. 2003)
New Long-Term EmissionsRegulations (from 2005)
75% Reduction ★★★
★★★★85% Reduction
Low PM EmissionsDiesel Vehicle CertificationSystem (from Apr. 2001)
Ultra-Low PM EmissionsDiesel Vehicle CertificationSystem (from Sept. 2002)
Regulationsfor DieselEngineEmissionsand Hino’sFour StarTruck Series
Truck Marketin Japan(Thousand units)
� Heavy-DutyTrucks
� Medium-DutyTrucks
� Light-DutyTrucks
� Diesel Particulate activeReduction (DPR) with thediesel hybrid engine
HINO DUTRO Hybrid
HINO RANGER Hybrid
HINO DUTRO
HINO RANGER
HINO PROFIA
� DPR system
Note: Sales of trucks are based on figures for newly registered vehicles.Source: Japan Automobile Dealers Association and Hino Motors
HINO MOTORS, LTD. 5
November, and a heavy-duty truck in November, offering a
full lineup of vehicles meeting the strictest Four Star regula-
tions and pioneering the drive to meet PM standards under
the upcoming long-term regulations.
Looking ahead, as government authorities apply even
stricter exhaust regulations, Hino will strive to further
extend the life cycles of its products and alleviate the envi-
ronmental impact of its trucks as an innovator in the devel-
opment of environmentally sound vehicles.
Strengthening the Domestic Truck Sales Network,
Developing Superior Services
In the domestic truck market in fiscal 2003, stricter environ-
mental standards in the Tokyo metropolitan area and the
tightening of other environmental regulations temporarily
boosted demand. Overall demand surged 49.1%, to 117,362
vehicles, in the heavy-duty and medium-duty truck market
and 54.3%, to 146,886 vehicles, in the light-duty truck mar-
ket. A reactionary decline in demand is anticipated, and the
market faces uncertainty ahead in light of sluggishness in the
domestic cargo market and reforms to logistic practices.
In this environment, strengthening the sales foundations of
the Hino Group is essential and will be achieved especially by
reconstructing the sales company network. Hino is focusing on
creating a sales network capable of generating profits even
during downturns in new truck demand, such as that anticipat-
ed from 2007. To this end, the Company is working to improve
service quality at sales dealers. For example, it is proposing
marketing activities that first and foremost offer benefits for
Hino customers and providing DANTOTSU (“Much Superior”)
Services to strengthen its underlying earnings platform.
With regard to domestic sales, although Hino has held
the top position in the heavy-duty and medium-duty truck
market for 31 years since 1973, cultivating new customers
and boosting its share of the light-duty truck market remain
important priorities. Consequently, the Company focuses
on offering total logistics support as the linchpin of a
new business model for trucks. That is, in addition to relying
on revenues from new vehicle and parts sales and repair
services for earnings, we aim to increase value to our
customers through a plethora of services, including used
truck sales, insurance and lease financing, the supply of
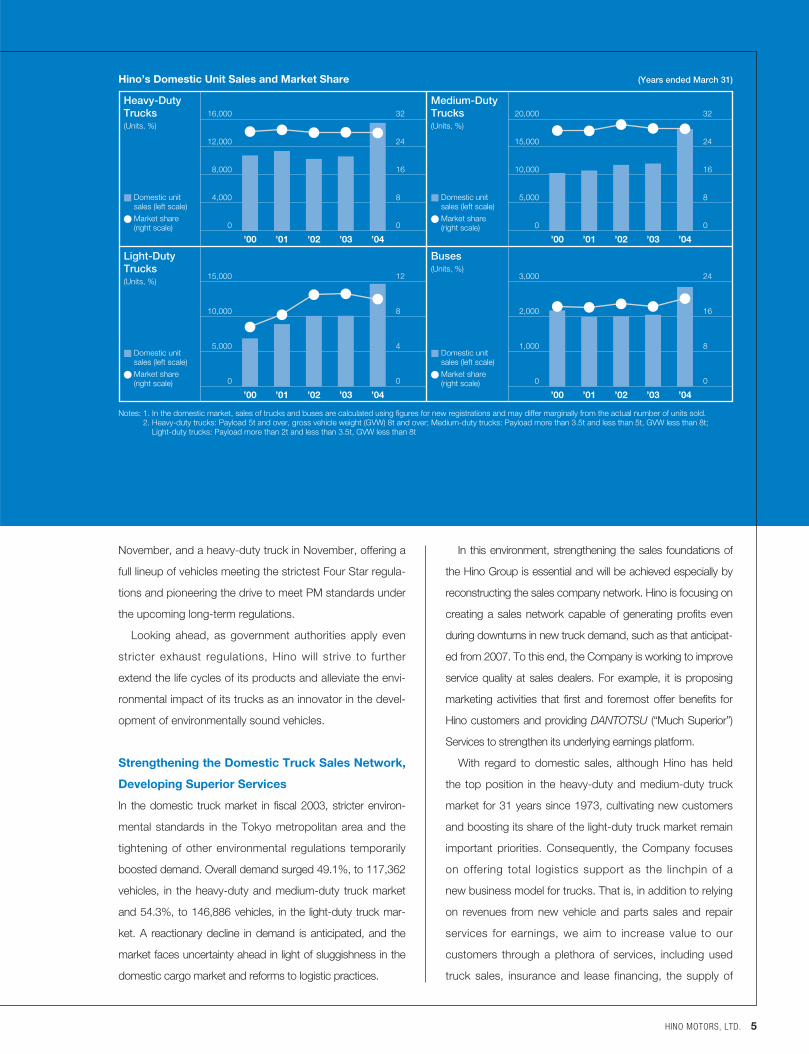
Notes: 1. In the domestic market, sales of trucks and buses are calculated using figures for new registrations and may differ marginally from the actual number of units sold.2. Heavy-duty trucks: Payload 5t and over, gross vehicle weight (GVW) 8t and over; Medium-duty trucks: Payload more than 3.5t and less than 5t, GVW less than 8t;
Light-duty trucks: Payload more than 2t and less than 3.5t, GVW less than 8t
Hino’s Domestic Unit Sales and Market Share (Years ended March 31)
0
8
16
24
32
0
8
16
24
32
0
4
8
12
0
8
16
24
0
4,000
8,000
12,000
16,000
0
5,000
10,000
15,000
20,000
0
5,000
10,000
15,000
0
1,000
2,000
3,000
’04’03’02’01’00 ’04’03’02’01’00
’04’03’02’01’00 ’04’03’02’01’00
Medium-DutyTrucks(Units, %)
� Domestic unitsales (left scale)
� Market share(right scale)
Heavy-DutyTrucks(Units, %)
� Domestic unitsales (left scale)
� Market share(right scale)
Buses(Units, %)
� Domestic unitsales (left scale)
� Market share(right scale)
Light-DutyTrucks(Units, %)
� Domestic unitsales (left scale)
� Market share(right scale)
6 HINO MOTORS, LTD.
mounting superstructures, and the provision of consultation
on ways to improve transportation businesses. To bolster
these new services, the Company has been focusing on
expanding the lineup of precautionary services it offers cus-
tomers. For example, it provides convenient vehicle checks,
quick insurance inspection and certification, around-the-
clock maintenance services, and maintenance leases.
Toyota Businesses: Future Expansion and Alliances
In Toyota businesses, Hino produces such Toyota models as
HILUX SURF and DYNA on commission in Japan and sup-
plies unit parts overseas to the automaker. To date, product
development and consignment production have mostly been
confined to Japan; however, the Company plans to shift to
the supply of chassis developed and produced globally. The
intention is to expand the Hino brand business by helping
TMC advance its global strategy and thereby further
strengthen the Company’s own business foundations.
Specifically, Hino is supplying unit parts for multipurpose
vehicles in Thailand starting in summer 2004 as part of
TMC’s IMV Project and for the new TACOMA pickup truck
introduced in the North American market.
Additionally, Hino is working to forge alliances with man-
ufacturers in Japan and abroad.
As a first step, the Company signed a cooperative
agreement with Scania AB, the Swedish manufacturer of
trucks and buses. The two companies have developed
HINO SCANIA, a heavy-duty tractor, which has been on
the market since September 2003. In bus manufacturing
operations, Hino and Isuzu Motors Limited established the
holding company J-Bus Ltd. through a transfer of their
equity in bus manufacturing subsidiaries. In its OEM agree-
ment to supply mid-range diesel engines to Nissan Diesel
Motor Co., Ltd., Hino began supplying the Hino J series
engine for medium-duty trucks to its partner in 2004.
The strategy of selectively consolidating resources
through tie-ups with other companies is crucial for Hino as
it focuses on rationalizing business operations and
expanding on a global scale.
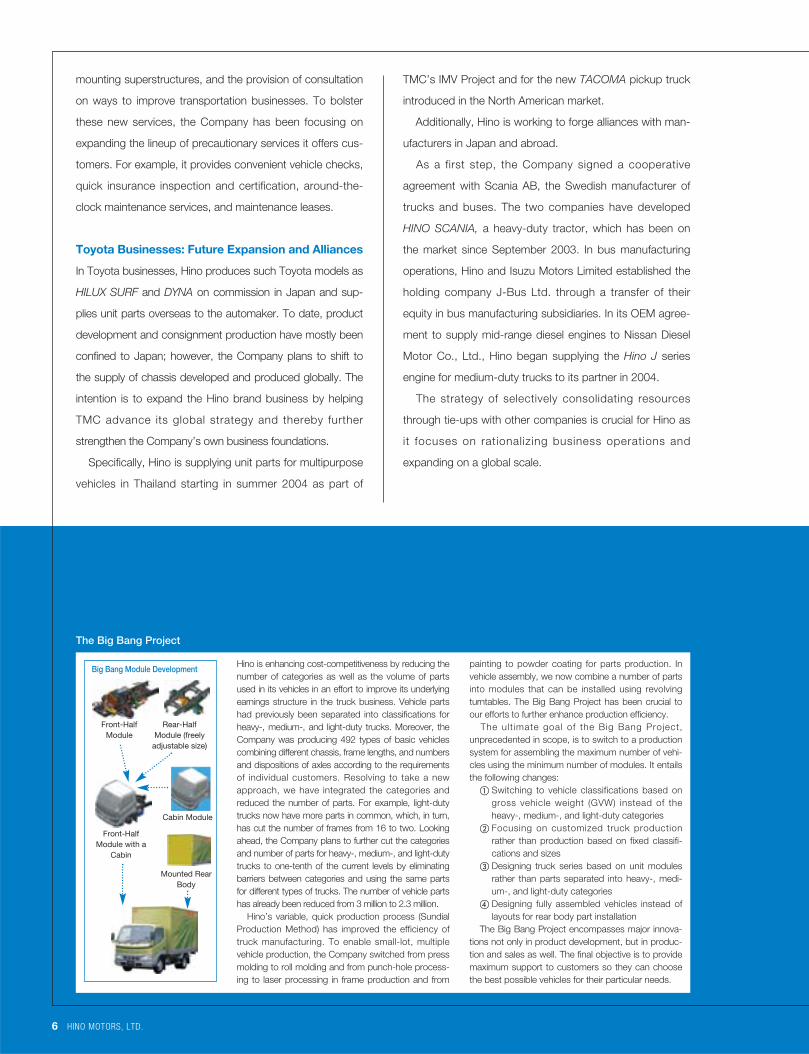
The Big Bang Project
Hino is enhancing cost-competitiveness by reducing thenumber of categories as well as the volume of partsused in its vehicles in an effort to improve its underlyingearnings structure in the truck business. Vehicle partshad previously been separated into classifications forheavy-, medium-, and light-duty trucks. Moreover, theCompany was producing 492 types of basic vehiclescombining different chassis, frame lengths, and numbersand dispositions of axles according to the requirementsof individual customers. Resolving to take a newapproach, we have integrated the categories andreduced the number of parts. For example, light-dutytrucks now have more parts in common, which, in turn,has cut the number of frames from 16 to two. Lookingahead, the Company plans to further cut the categoriesand number of parts for heavy-, medium-, and light-dutytrucks to one-tenth of the current levels by eliminatingbarriers between categories and using the same partsfor different types of trucks. The number of vehicle partshas already been reduced from 3 million to 2.3 million.
Hino’s variable, quick production process (SundialProduction Method) has improved the efficiency oftruck manufacturing. To enable small-lot, multiplevehicle production, the Company switched from pressmolding to roll molding and from punch-hole process-ing to laser processing in frame production and from
painting to powder coating for parts production. Invehicle assembly, we now combine a number of partsinto modules that can be installed using revolvingturntables. The Big Bang Project has been crucial toour efforts to further enhance production efficiency.
The ult imate goal of the Big Bang Project,unprecedented in scope, is to switch to a productionsystem for assembling the maximum number of vehi-cles using the minimum number of modules. It entailsthe following changes:
� Switching to vehicle classifications based ongross vehicle weight (GVW) instead of theheavy-, medium-, and light-duty categories
� Focusing on customized truck productionrather than production based on fixed classifi-cations and sizes
� Designing truck series based on unit modulesrather than parts separated into heavy-, medi-um-, and light-duty categories
� Designing fully assembled vehicles instead oflayouts for rear body part installation
The Big Bang Project encompasses major innova-tions not only in product development, but in produc-tion and sales as well. The final objective is to providemaximum support to customers so they can choosethe best possible vehicles for their particular needs.
Mounted RearBody
Front-HalfModule with a
Cabin
Front-HalfModule
Big Bang Module Development
Rear-HalfModule (freely
adjustable size)
Cabin Module
HINO MOTORS, LTD. 7
Overseas Business Development
United States
One goal of the new medium-term management plan is to
discard the previous earnings structure that relied almost
solely on Japan and replace it with a structure with multiple
earnings sources from overseas businesses.
In fiscal 2003, sales of Hino brand trucks totaled 51,242
units in Japan and 35,776 units overseas. The management
plan targets full-fledged expansion in North America and
China, with the overseas sales volume exceeding the domes-
tic sales volume in fiscal 2005 at the earliest. The Company
expects overseas sales to rise sharply to 67,000 units in fiscal
2006 even as domestic sales stay flat at 51,000.
Hino has significantly altered its strategy for North
America, which is likely to become its next core market.
First, in product strategies, Hino has revised specifications
for trucks developed in Japan for the niche cab-over-engine
truck market and launched them in North America, creating
trucks specifically for the region and expanding in earnest in
the mainstay Class 4-7 categories of conventional (bonnet-
type) trucks. The Company aims to sharply boost North
American sales from 2,000 trucks annually to 10,000 units in
2006 and 30,000 units in 2010. In line with the expansion
plans, we will stop supplying specialty trucks through the
export of complete built-up vehicles and shift output to TABC,
Inc., a U.S.-based Toyota Group company, in October 2004.
The Company has already reorganized sales companies for
auxiliary parts under Hino Motors Manufacturing USA, Inc.,
providing the means for local parts supply to TABC and for
the production of unit parts for Toyota vehicles.
Hino Motors Sales USA, Inc., has greatly enhanced
its sales capabilities through its alliance with Penske
Corporation. Sales in the United States had been concen-
trated in the East Coast and West Coast regions, which
Truck Market Overseas
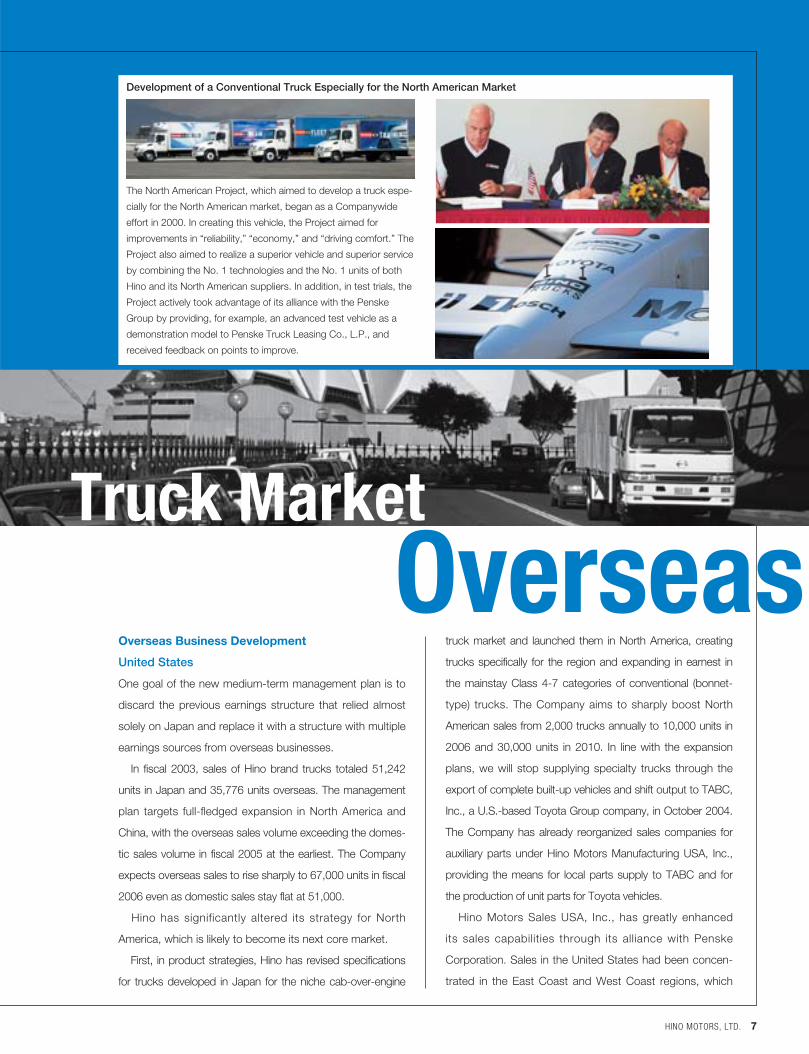
The North American Project, which aimed to develop a truck espe-
cially for the North American market, began as a Companywide
effort in 2000. In creating this vehicle, the Project aimed for
improvements in “reliability,” “economy,” and “driving comfort.” The
Project also aimed to realize a superior vehicle and superior service
by combining the No. 1 technologies and the No. 1 units of both
Hino and its North American suppliers. In addition, in test trials, the
Project actively took advantage of its alliance with the Penske
Group by providing, for example, an advanced test vehicle as a
demonstration model to Penske Truck Leasing Co., L.P., and
received feedback on points to improve.
Development of a Conventional Truck Especially for the North American Market
8 HINO MOTORS, LTD.
account for 30% of the country’s total demand. However,
we plan to tap into dealership networks in the middle of the
country through the tie-up. Thus far, sales have been
robust—1,800 trucks were sold in the United States and
500 in Canada at gatherings for launching new products
held in the United States and Canada in October 2003.
In addition, Hino has signed a sponsorship contract with
Penske Racing, Inc., for the Indianapolis 500 auto race in
an effort to boost its name recognition in the United States.
Asia and China
In Asia, Hino’s most important market after Japan, we are
striving to quickly turn profitable. The focus is on enhancing
the price competitiveness of medium- and light-duty trucks
and increasing sales. To these ends, the Company has
revamped its operating bases in Thailand and Indonesia,
separating production from sales activities. Production affili-
ates are working to increase local parts procurement ratios
and lower costs while aiming to launch new models at the
same time they are introduced in Japan. In the unit supplier
business, one objective is to expand operations through
unit production for TMC. Hino is also redoubling initiatives
to increase sales capabilities by improving management at
sales agencies and dealerships.
In China, high-speed transportation needs are surging as
a new highway network spreads across the country, and
the market is growing rapidly for large, high-performance
trucks with superior horsepower, speed, durability, and
environmental compatibility. To meet these needs, Hino
announced the formation of an engine production and
sales company in conjunction with Shanghai Diesel Engine
Co. in September 2003. Shanghai Hino Engine Co., the
50-50 joint venture thus created, is building a plant with
the capacity to produce 15,000 engines annually and is
slated to begin full-scale production and sales of large
engines mainly for Chinese truck makers in November
2004. The joint venture will be Hino’s first major base for
engine production and sales in China. Looking ahead, we
plan to expand operations with an eye on launching Hino
brand trucks in the Chinese market.
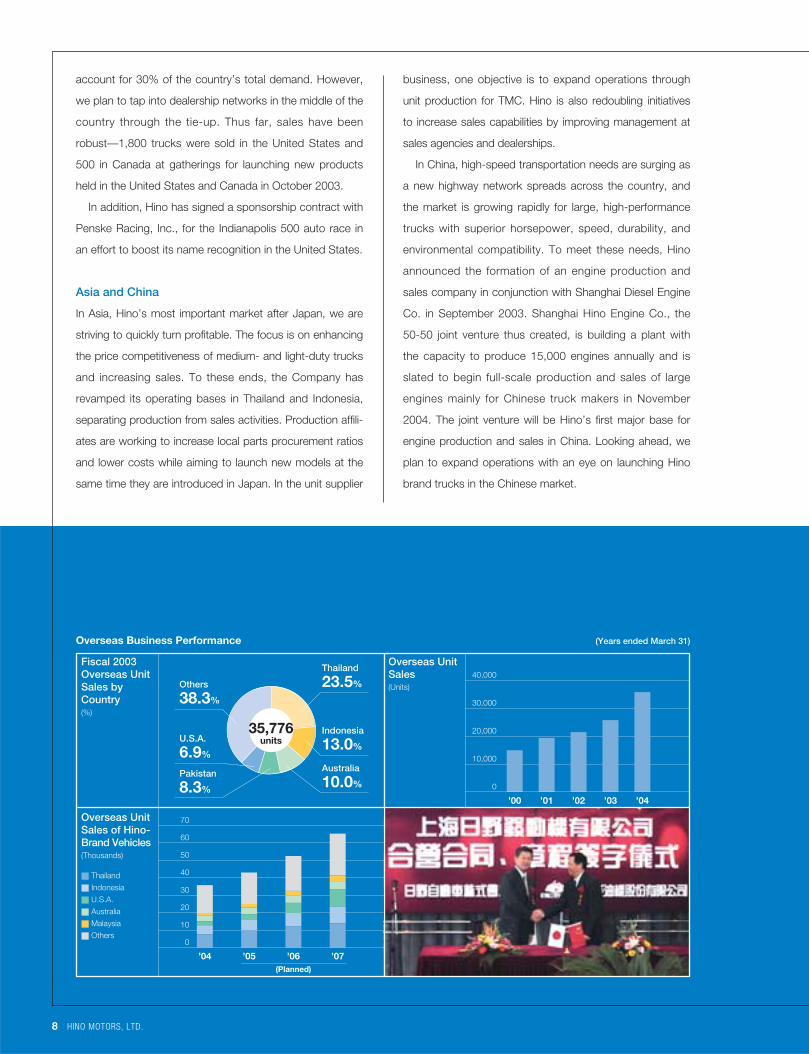
Overseas UnitSales of Hino-Brand Vehicles(Thousands)
Overseas Business Performance (Years ended March 31)
Overseas UnitSales(Units)
Fiscal 2003Overseas UnitSales byCountry(%)
� Thailand
� Indonesia
� U.S.A.
� Australia
� Malaysia
� Others
0
10,000
20,000
30,000
40,000
’04’03’02’01’00
0
10
20
30
40
50
60
70
Thailand
23.5%
Indonesia
13.0%
Australia
10.0%
Others
38.3%
U.S.A.
6.9%
Pakistan
8.3%
35,776units
’07’06(Planned)
’05’04
HINO MOTORS, LTD. 9
CorporateGovernance
In Conclusion
The Hino Motors Group has consistently worked to enhance
convenience and efficiency in transportation and the shipping
of merchandise—two areas vital to everyday life. Our goal is to
work together with those around us in a partnership that will
improve efficiency and create a more rewarding community life.
Our fundamental goal is to increase enterprise value for the
benefit of all our stakeholders, including shareholders, cus-
tomers, employees, and business partners, in harmony with
the surrounding environment and in co-existence with nature.
To this end, Hino has fully separated functions for policy
formation and execution and is further improving trans-
parency through the close monitoring of management
practices by general shareholders’ meetings, board of
directors’ meetings, and other means, and through the
executive board system. In addition, the Company has
devised the Hino Code to clarify appropriate conduct for
management and employees. A committee has been
established to ensure that personnel strictly observe the
code as we endeavor to further enhance compliance.
Looking ahead, we anticipate challenging business condi-
tions. However, the Hino Group will work concertedly on
building the solid earnings foundations that will afford the Hino
brand a stronger presence in all truck markets worldwide.
June 2004
Tadaaki Jagawa
Chairman
Shoji Kondo
President
Past Present FutureModel Changes Once every 12 years Flexibly introducing new New models fully attuned to
models customer needs
Technological In line with other Pioneer in environmental Front-runner in environmental Development companies technologies and safety areas
Manufacturing Mainly Japan Promoting production Globalizing productionworldwide
Parts Procurement Mainly Japan Local supply bases in Choosing the best possible North America suppliers worldwide
Earnings Structure Parent company in Global consolidation Turning profits from all vehicles Japan worldwide
Establishing the Hino Brand Worldwide
Chairman of the Board
Tadaaki Jagawa
President, Member of the Board
Shoji Kondo
Executive Vice-President, Member of the Board
Takayuki Suzuki, Hideaki Tobita
Senior Managing Director, Member of the Board
Takeshi Iida, Shinichiro Sugisaki, Narai Sugasawa,
Bunji Hagiwara, Kunihiko Susuki, Takahiko Yamamoto,
Michiaki Mori, Masakazu Ichikawa, Toshiki Inoue
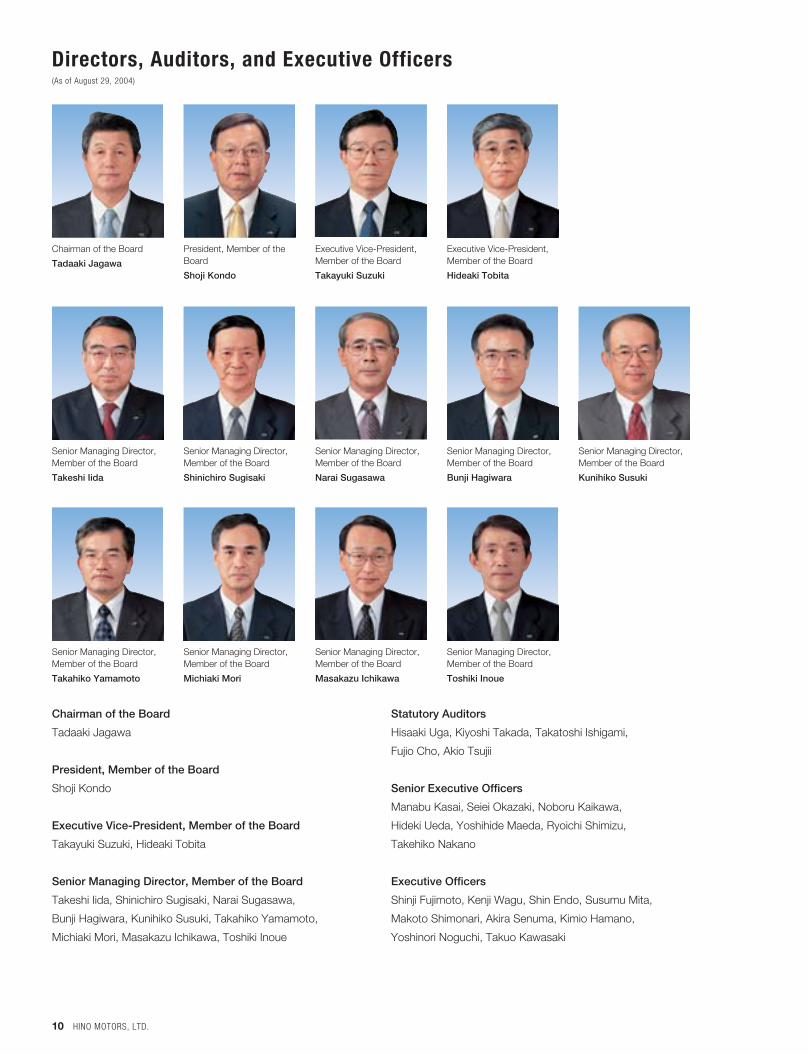
Statutory Auditors
Hisaaki Uga, Kiyoshi Takada, Takatoshi Ishigami,
Fujio Cho, Akio Tsujii
Senior Executive Officers
Manabu Kasai, Seiei Okazaki, Noboru Kaikawa,
Hideki Ueda, Yoshihide Maeda, Ryoichi Shimizu,
Takehiko Nakano
Executive Officers
Shinji Fujimoto, Kenji Wagu, Shin Endo, Susumu Mita,
Makoto Shimonari, Akira Senuma, Kimio Hamano,
Yoshinori Noguchi, Takuo Kawasaki
10 HINO MOTORS, LTD.
Directors, Auditors, and Executive Officers(As of August 29, 2004)
Chairman of the Board
Tadaaki Jagawa
President, Member of theBoard
Shoji Kondo
Executive Vice-President,Member of the Board
Takayuki Suzuki
Executive Vice-President,Member of the Board
Hideaki Tobita
Senior Managing Director,Member of the Board
Takeshi Iida
Senior Managing Director,Member of the Board
Shinichiro Sugisaki
Senior Managing Director,Member of the Board
Narai Sugasawa
Senior Managing Director,Member of the Board
Bunji Hagiwara
Senior Managing Director,Member of the Board
Kunihiko Susuki
Senior Managing Director,Member of the Board
Takahiko Yamamoto
Senior Managing Director,Member of the Board
Michiaki Mori
Senior Managing Director,Member of the Board
Masakazu Ichikawa
Senior Managing Director,Member of the Board
Toshiki Inoue
Corporate Social Responsibility
HINO MOTORS, LTD. 11
Basic Management Policy
Hino Group companies operate in business domains that are
essential for transporting people and goods and indispensable
for daily life. Group companies provide equipment and services
that are linchpins of the transport and transportation fields. All
members of the Group share a common focus on working to
make life more comfortable and rewarding for their customers,
associates, and the community at large.
Our corporate activities are geared toward enhancing value
for all our stakeholders, including shareholders, customers,
employees, and business associates. We work to ensure that
our business practices are in harmony with the environment.
Corporate Governance and Compliance Initiatives
Basic Corporate Governance Policies
In addition to the regular legal oversight of business exercised
by the general shareholders’ meeting, the board of directors,
and other established institutions, Hino is subject to the over-
sight of an executive board created to guarantee the separa-
tion of policymaking and policy execution and further improve
transparency. Moreover, the Company has devised the Hino
General Ethical Code of Conduct to clarify appropriate busi-
ness practices for managers and employees. The Ethics
Committee, chaired by the Company president, was created to
ensure that all employees practice sound ethical behavior.
Corporate Governance Practices
(1) Corporate Institutions
The Auditing Committee is composed of three standing audi-
tors and two outside auditors. In addition, the Company has
created management committees to report vital information on
key Companywide policies, policy debates, business manage-
ment, and other issues. These committees complement the
regular legal institutions overseeing corporate governance,
including the general shareholders’ meeting, the board of
directors, and the board of auditors.
(2) Internal Control and Risk Management Systems
Hino has operated an auditing office in the Accounting Division
for some time for inspecting the Company’s internal control
systems. The Hino General Ethical Code of Conduct specifi-
cally outlines proper ethical practices for the management
team and employees, and the Ethics Committee ensures that
ethical behavior is strictly obeyed as part of the Company’s
built-in compliance system. The Company plans to develop
ethical codes for its subsidiaries in order to strengthen the risk
management capabilities of the entire Hino Group.
Environmental Protection
In March 1993, the Company established the Hino Global
Environmental Charter to promote environmental protection
throughout its operations as well as the Hino Motor Voluntary
Plan for the Environment, which clarifies specific goals related
to environmental preservation. Also in 1993, the Hino
Environmental Committee was founded, with the Company
president as its chairman, to gather members from across
broad divisional lines and promote environmental protection.
The Product Environmental Committee and the Production
Environmental Committee, both working underneath the Hino
Environmental Committee, were formed to promote concrete
environmental policies based on the Voluntary Plan.
In March 2002, the Recycling Committee and the Sales
Company Environmental Committee were formed. The
Recycling Committee builds internal mechanisms in different
business areas for meeting new standards established under
the Auto Recycling Law. The Sales Company Environmental
Committee works to build and strengthen environmental man-
agement systems at sales companies.
Moreover, Hino aims to gain certification under the ISO
14001 environmental management system in additional cate-
gories and expand its use of the system. The Company is pro-
moting environmental protection not just internally, but
12 HINO MOTORS, LTD.
throughout the Hino Group, including among its affiliates in
Japan and abroad and sales companies.
In fiscal 2003, expenditures for environmental protection
amounted to ¥20.6 billion, equivalent to 2.4% of total sales.
From an economic perspective, the resulting reductions in
energy consumption pushed down energy costs by ¥31 mil-
lion.
Hino’s Low-Emission Technologies
Hino develops products in line with the basic concept that the
performance features of its vehicles should help improve the
environment. The Company inaugurated the Four Star Project
in line with this concept. The project is aimed at acquiring Four
Star ratings for its vehicles. This is the highest possible rating
under the Ministry of Land, Infrastructure and Transport’s certi-
fication system targeting minimum particulate matter (PM)
emissions from diesel fueled trucks and cars. In November
2003, the Company launched the large Hino FRONTIER truck
under the Four Star Project, creating a full truck lineup. The
Diesel Particulate active Reduction (DPR) system is Hino’s
leading low-emission technology. The system combines low-
emission diesel engines with the Company’s DPR Cleaner,
which boasts a 95% collection rate for emissions, to incinerate
and dispose of collected PM. Another important technology is
the Hybrid Inverter-controlled Motor & Retarder (HIMR) system,
the first commercialized hybrid diesel and electronic power
train, which was introduced in 1991. DUTRO light-duty trucks
combine a new diesel hybrid engine incorporating a high-per-
formance DPR system with the HIMR system. This greatly
reduces NOx emissions while cutting fuel costs 1.3 times in
comparison with currently marketed standard diesel trucks.
Diligent Focus on Customer Needs
Hino is making concerted efforts to boost product safety in all
aspects of its business operations, from product development
to after-sales services.
Rigorous Pursuit of Safety Technologies
The Company is striving to enhance the total safety of its vehi-
cles through both active and preventive measures. R&D
themes for safety are divided into four distinct categories:
� Preventing accidents before they happen by eliminating
driver fatigue
� Enhancing the operating, turning, and stopping perform-
ance of vehicles in order to prevent collisions, skidding, and
other accidents
� Protecting drivers and passengers during accidents
� Stopping injuries to pedestrians, motorcycle riders, and
other third parties during accidents
One aim of R&D is to enhance overall product safety. For
example, Hino is developing a safe driving support system for
preventing accidents before they can occur. The system mea-
sures the distance from the vehicle in which it is installed to
that directly in front of it. When the system-equipped vehicle
draws close to a slower vehicle travelling ahead of it, a scanner
cruise device automatically slows it, matching its speed to that
of the lead vehicle and thus preventing a collision. Also, the
Company is developing an alarm device that detects the lines
painted on the road. It is intended to warn distracted or
fatigued drivers when their vehicles veer across the centerline
of the road or when they begin to unintentionally change lanes.
After-Sales Service Program
Hino works diligently to provide customers with exhaustive
after-sales services, taking responsibility for products even
after they are out of its hands. The Company has created after-
sales service programs offering vehicle inspections, repair, and
other amenities that appeal to customers. We are offering
maintenance leases and annual maintenance contracts to
expand preventive maintenance services.
Answering Customer Inquiries
Hino is setting up consultation booths and building better
mechanisms for responding to customer inquiries, complaints,
and questions.
Recalls and Other Issues
Hino gathers market information from its dealerships worldwide.
If problems arise, data is compiled and forwarded to the Quality
Assurance Department for analysis. Local surveys are conduct-
ed when necessary and defective parts recalled and thoroughly
inspected. Afterward, relevant divisions develop strategies for
effectively correcting faulty parts and products. When the
Quality Assurance Department acknowledges problems and
understands the need to devise solutions, consumers are noti-
fied and reports issued, products are recalled, and damage
compensation or other forms of redress are provided.
HINO MOTORS, LTD. 13
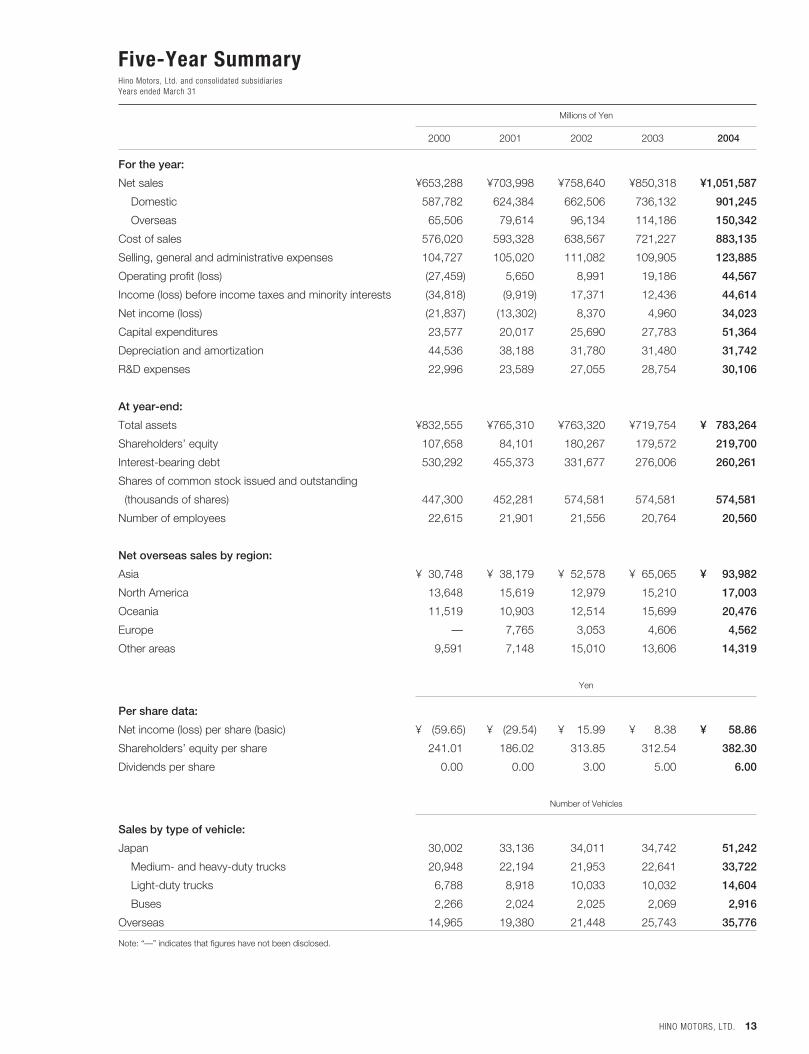
Five-Year SummaryHino Motors, Ltd. and consolidated subsidiariesYears ended March 31
Millions of Yen
2000 2001 2002 2003 2004
For the year:
Net sales ¥653,288 ¥703,998 ¥758,640 ¥850,318 ¥1,051,587
Domestic 587,782 624,384 662,506 736,132 901,245
Overseas 65,506 79,614 96,134 114,186 150,342
Cost of sales 576,020 593,328 638,567 721,227 883,135
Selling, general and administrative expenses 104,727 105,020 111,082 109,905 123,885
Operating profit (loss) (27,459) 5,650 8,991 19,186 44,567
Income (loss) before income taxes and minority interests (34,818) (9,919) 17,371 12,436 44,614
Net income (loss) (21,837) (13,302) 8,370 4,960 34,023
Capital expenditures 23,577 20,017 25,690 27,783 51,364
Depreciation and amortization 44,536 38,188 31,780 31,480 31,742
R&D expenses 22,996 23,589 27,055 28,754 30,106
At year-end:
Total assets ¥832,555 ¥765,310 ¥763,320 ¥719,754 ¥0,783,264
Shareholders’ equity 107,658 84,101 180,267 179,572 219,700
Interest-bearing debt 530,292 455,373 331,677 276,006 260,261
Shares of common stock issued and outstanding
(thousands of shares) 447,300 452,281 574,581 574,581 574,581
Number of employees 22,615 21,901 21,556 20,764 20,560
Net overseas sales by region:
Asia ¥030,748 ¥038,179 ¥052,578 ¥065,065 ¥0,093,982
North America 13,648 15,619 12,979 15,210 17,003
Oceania 11,519 10,903 12,514 15,699 20,476
Europe — 7,765 3,053 4,606 4,562
Other areas 9,591 7,148 15,010 13,606 14,319
Yen
Per share data:
Net income (loss) per share (basic) ¥0,(59.65) ¥0,(29.54) ¥0015.99 ¥0008.38 ¥0,0058.86
Shareholders’ equity per share 241.01 186.02 313.85 312.54 382.30
Dividends per share 0.00 0.00 3.00 5.00 6.00
Number of Vehicles
Sales by type of vehicle:
Japan 30,002 33,136 34,011 34,742 51,242
Medium- and heavy-duty trucks 20,948 22,194 21,953 22,641 33,722
Light-duty trucks 6,788 8,918 10,033 10,032 14,604
Buses 2,266 2,024 2,025 2,069 2,916
Overseas 14,965 19,380 21,448 25,743 35,776
Note: “—” indicates that figures have not been disclosed.
14 HINO MOTORS, LTD.
Financial Review
The Hino Group comprises Hino Motors, Ltd., 76 consolidat-
ed subsidiaries, and 17 equity-method affiliates. The Group’s
primary businesses are the manufacture and sale of trucks
and buses and the production of vehicles on commission for
Toyota Motor Corporation (TMC). In August 2001, Hino
became a consolidated subsidiary of TMC following the issue
of new shares through a private placement. Hino plays an
important role in commercial vehicle production for the
Toyota Group.
The exchange rate at the end of fiscal 2003, ended March
31, 2004, was ¥105.69 to the U.S. dollar, ¥14.51 higher than
at the end of the previous term.
BUSINESS OVERVIEW
Domestic Business
In the domestic truck market, demand for heavy-, medium-,
and light-duty trucks increased substantially in fiscal 2003.
Growth was attributable to the Automobile NOx/PM Law
enacted in October 2003 and to new regulations governing
diesel-powered vehicles in the Tokyo metropolitan area,
which spurred replacement buying.
In Japan, Hino’s core market, overall demand in the heavy-
and medium-duty truck market surged 49.1%, to 117,362
vehicles. Hino sold 33,640 vehicles, up 48.3%, maintaining
its leading market share for the 31st straight year. The
Japanese market for light-duty trucks increased 54.3%, to
146,886 vehicles. In Tokyo and the three surrounding
prefectures, where new environmental regulations for diesel
emissions are especially rigorous, demand more than dou-
bled to about 78,000 vehicles, from 35,000 in the previous
fiscal year.
Against this backdrop, Hino’s domestic sales volume of
trucks and buses increased 47.5%, to 51,242 units. Sales
rose 46.2%, to ¥325,585 million (US$3,081 million).
Sales of heavy-duty trucks increased 45.1%, to 15,456
vehicles, rising well above the 10,000 to 11,000 level seen
during the previous five fiscal years. Market share edged
down 0.2 percentage point, to 28.0%. For medium-duty
trucks, sales increased 51.1%, to 18,184 units, significantly
above the 11,000 to 12,000 level seen during the previous
five fiscal years. Hino’s market share in this category declined
0.1 percentage point, to 29.2%. Sales of light-duty trucks
came to 14,704 units, up 45.3%. The Company entered this
segment in earnest in 1999, and market share during the
year under review slipped, to 10.0%, maintaining the original
goal of a 10% share for the third year running.
Domestic sales of buses increased 38.8%, to 2,846 units,
and market share rose 1.8 percentage points, to 20.1%.
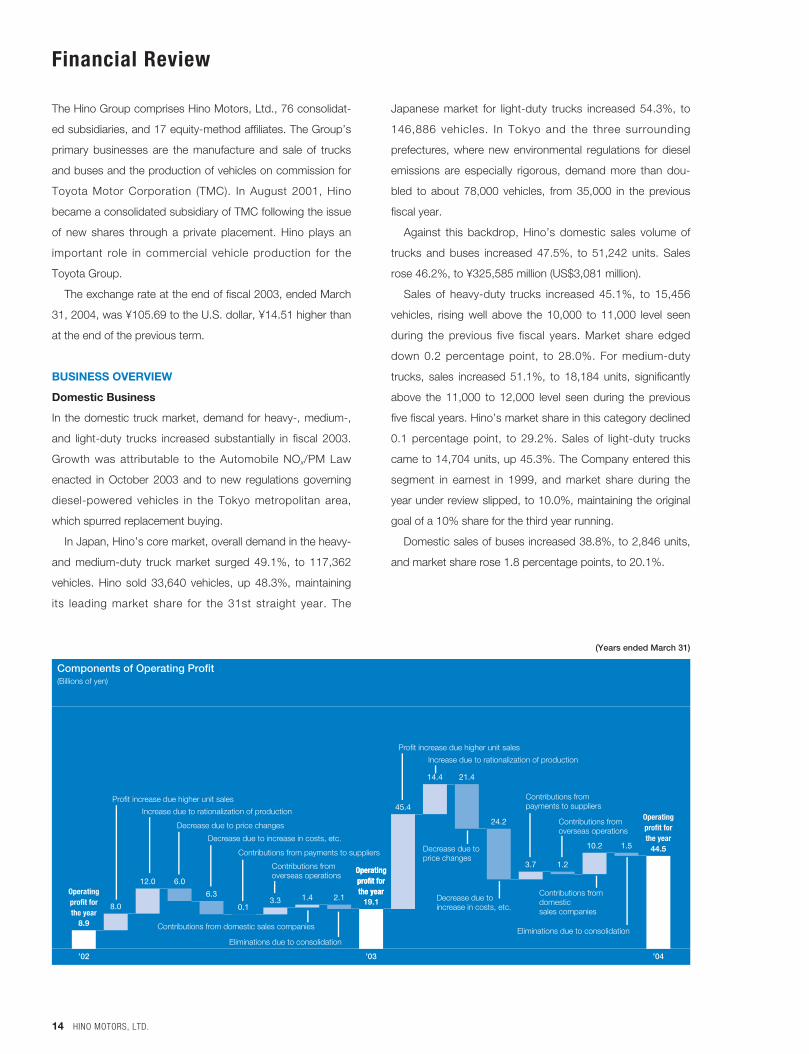
8.0
12.0 6.0
6.3
0.13.3 1.4 2.1
45.4
14.4 21.4
24.2
3.7 1.2
10.2 1.5
8.9
19.1
44.5
Profit increase due higher unit sales
Increase due to rationalization of production
Profit increase due higher unit sales
Increase due to rationalization of production
Decrease due to price changes
Decrease due to price changes
Decrease due to increase in costs, etc.
Decrease due to increase in costs, etc.
Contributions from payments to suppliers
Contributions from payments to suppliers
Contributions from overseas operations
Contributions from overseas operations
Eliminations due to consolidationEliminations due to consolidationContributions from domestic sales companies
Contributions from domestic sales companies
’04
Operatingprofit forthe year
’03
Operatingprofit forthe year
Operatingprofit forthe year
’02
Operatingprofit forthe year
Components of Operating Profit(Billions of yen)
(Years ended March 31)
HINO MOTORS, LTD. 15
Overseas Business
The volume of Hino trucks and buses sold overseas rose
39.0%, to 35,776 units, and sales increased 38.1%, to
¥121,656 million. Sales growth stemmed from growth in
mainstay Southeast Asian markets and, particularly, to the
launch of DUTRO, a light-duty truck in the Thai and Malaysian
markets.
Commission Business
Total production volume on commission for TMC increased
16.1%, to 222,676 vehicles, reflecting increased orders for
the DYNA and HYLUX SURF models. Sales, including parts
for overseas plants, rose 15.4%, to ¥354,181 mill ion
(US$3,351 million).
OPERATING RESULTS
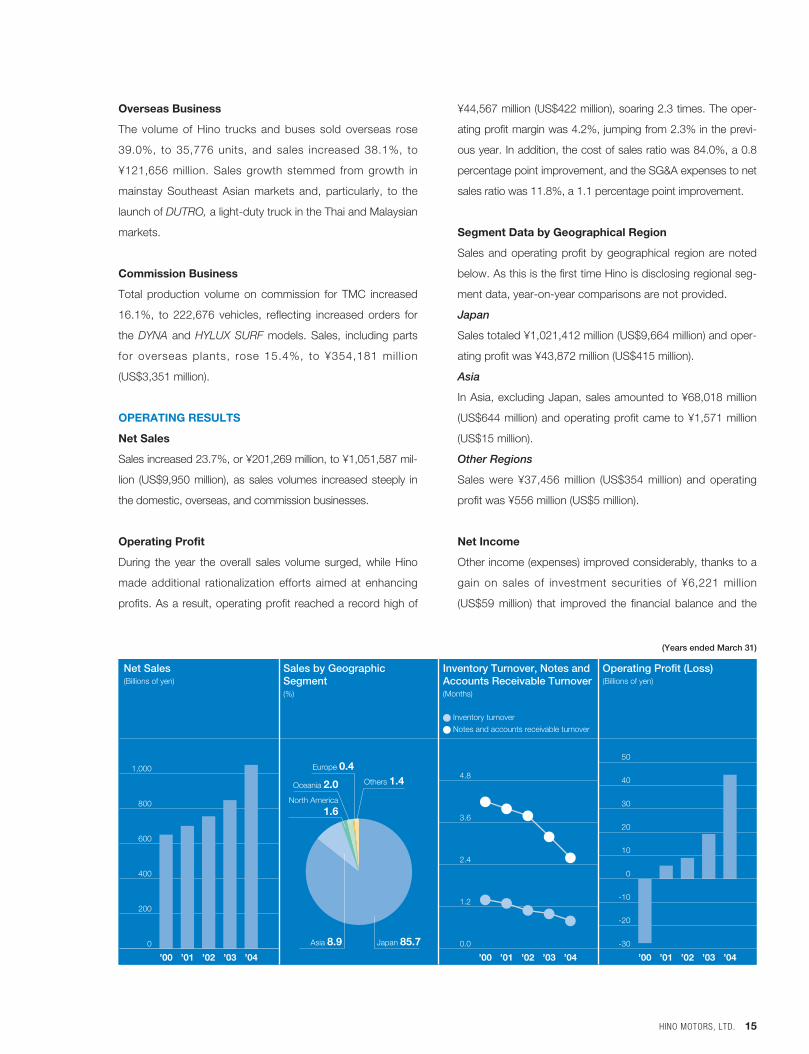
Net Sales
Sales increased 23.7%, or ¥201,269 million, to ¥1,051,587 mil-
lion (US$9,950 million), as sales volumes increased steeply in
the domestic, overseas, and commission businesses.
Operating Profit
During the year the overall sales volume surged, while Hino
made additional rationalization efforts aimed at enhancing
profits. As a result, operating profit reached a record high of
¥44,567 million (US$422 million), soaring 2.3 times. The oper-
ating profit margin was 4.2%, jumping from 2.3% in the previ-
ous year. In addition, the cost of sales ratio was 84.0%, a 0.8
percentage point improvement, and the SG&A expenses to net
sales ratio was 11.8%, a 1.1 percentage point improvement.
Segment Data by Geographical Region
Sales and operating profit by geographical region are noted
below. As this is the first time Hino is disclosing regional seg-
ment data, year-on-year comparisons are not provided.
Japan
Sales totaled ¥1,021,412 million (US$9,664 million) and oper-
ating profit was ¥43,872 million (US$415 million).
Asia
In Asia, excluding Japan, sales amounted to ¥68,018 million
(US$644 million) and operating profit came to ¥1,571 million
(US$15 million).
Other Regions
Sales were ¥37,456 million (US$354 million) and operating
profit was ¥556 million (US$5 million).
Net Income
Other income (expenses) improved considerably, thanks to a
gain on sales of investment securities of ¥6,221 million
(US$59 million) that improved the financial balance and the
0
200
400
600
800
1,000
-30
-20
-10
0
10
20
30
40
50
’04’03’02’01’00 ’04’03’02’01’00
0.0
1.2
2.4
3.6
4.8
’04’03’02’01’00
Others 1.4Europe 0.4
Oceania 2.0North America
1.6
Japan 85.7Asia 8.9
Net Sales(Billions of yen)
Sales by GeographicSegment(%)
Inventory Turnover, Notes andAccounts Receivable Turnover(Months)
� Inventory turnover
� Notes and accounts receivable turnover
Operating Profit (Loss)(Billions of yen)
(Years ended March 31)
16 HINO MOTORS, LTD.
considerable reduction in the loss on write-down of invest-
ment securities. Interest expense fell 38.7%, to ¥2,276 million
(US$22 million), on the back of a reduction in interest-bearing
debt and other factors. As a result, income before income taxes
and minority interests increased 3.6 times, to ¥44,614 million
(US$422 million).
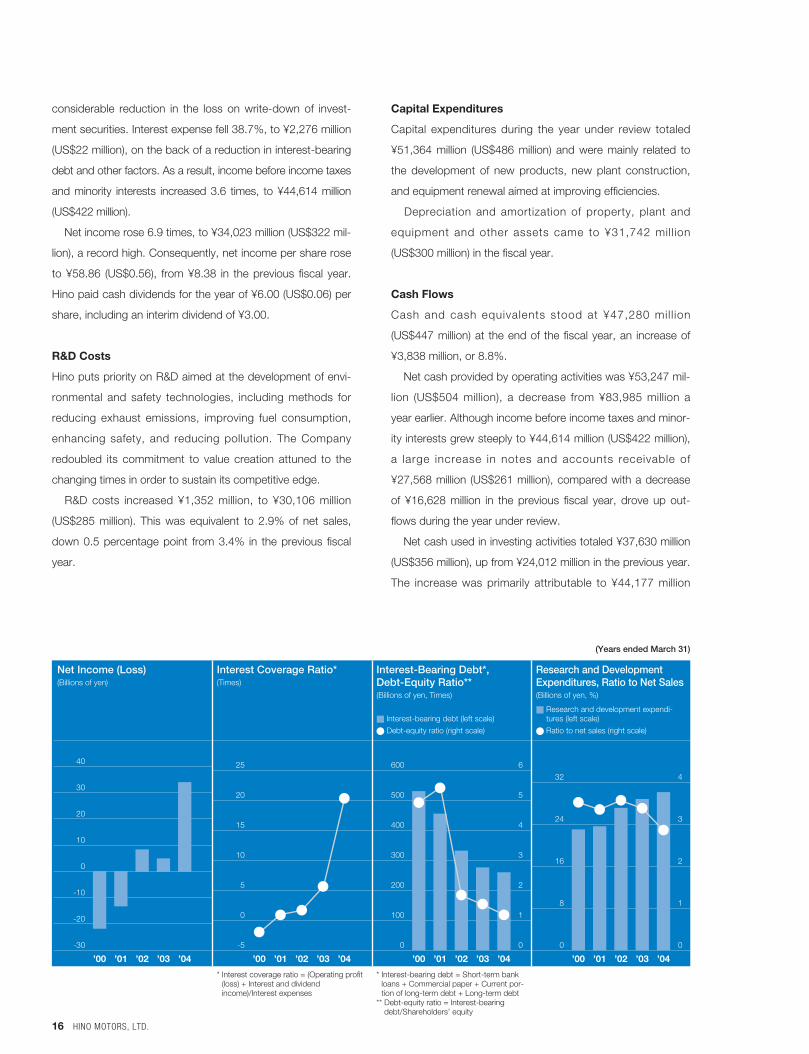
Net income rose 6.9 times, to ¥34,023 million (US$322 mil-
lion), a record high. Consequently, net income per share rose
to ¥58.86 (US$0.56), from ¥8.38 in the previous fiscal year.
Hino paid cash dividends for the year of ¥6.00 (US$0.06) per
share, including an interim dividend of ¥3.00.
R&D Costs
Hino puts priority on R&D aimed at the development of envi-
ronmental and safety technologies, including methods for
reducing exhaust emissions, improving fuel consumption,
enhancing safety, and reducing pollution. The Company
redoubled its commitment to value creation attuned to the
changing times in order to sustain its competitive edge.
R&D costs increased ¥1,352 million, to ¥30,106 million
(US$285 million). This was equivalent to 2.9% of net sales,
down 0.5 percentage point from 3.4% in the previous fiscal
year.
Capital Expenditures
Capital expenditures during the year under review totaled
¥51,364 million (US$486 million) and were mainly related to
the development of new products, new plant construction,
and equipment renewal aimed at improving efficiencies.
Depreciation and amortization of property, plant and
equipment and other assets came to ¥31,742 mill ion
(US$300 million) in the fiscal year.
Cash Flows
Cash and cash equivalents stood at ¥47,280 mil l ion
(US$447 million) at the end of the fiscal year, an increase of
¥3,838 million, or 8.8%.
Net cash provided by operating activities was ¥53,247 mil-
lion (US$504 million), a decrease from ¥83,985 million a
year earlier. Although income before income taxes and minor-
ity interests grew steeply to ¥44,614 million (US$422 million),
a large increase in notes and accounts receivable of
¥27,568 million (US$261 million), compared with a decrease
of ¥16,628 million in the previous fiscal year, drove up out-
flows during the year under review.
Net cash used in investing activities totaled ¥37,630 million
(US$356 million), up from ¥24,012 million in the previous year.
The increase was primarily attributable to ¥44,177 million
-30
-20
-10
0
10
20
30
40
0
100
200
300
400
500
600
-5
0
5
10
15
20
25
0
8
16
24
32
0
1
2
3
4
5
6
0
1
2
3
4
’04’03’02’01’00 ’04’03’02’01’00’04’03’02’01’00 ’04’03’02’01’00
Net Income (Loss)(Billions of yen)
Interest Coverage Ratio*(Times)
Interest-Bearing Debt*, Debt-Equity Ratio**(Billions of yen, Times)
� Interest-bearing debt (left scale)
� Debt-equity ratio (right scale)
Research and DevelopmentExpenditures, Ratio to Net Sales(Billions of yen, %)
� Research and development expendi-tures (left scale)
� Ratio to net sales (right scale)
* Interest coverage ratio = (Operating profit(loss) + Interest and dividendincome)/Interest expenses
* Interest-bearing debt = Short-term bankloans + Commercial paper + Current por-tion of long-term debt + Long-term debt
** Debt-equity ratio = Interest-bearingdebt/Shareholders’ equity
(Years ended March 31)
HINO MOTORS, LTD. 17
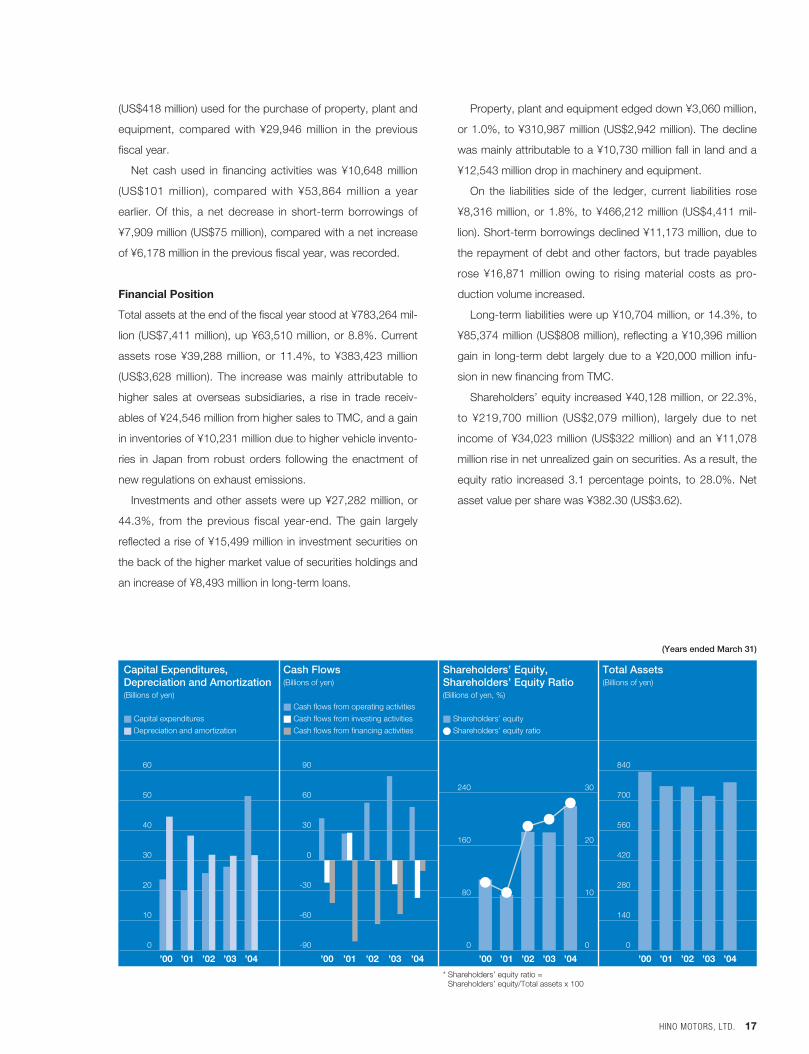
(US$418 million) used for the purchase of property, plant and
equipment, compared with ¥29,946 million in the previous
fiscal year.
Net cash used in financing activities was ¥10,648 million
(US$101 million), compared with ¥53,864 million a year
earlier. Of this, a net decrease in short-term borrowings of
¥7,909 million (US$75 million), compared with a net increase
of ¥6,178 million in the previous fiscal year, was recorded.
Financial Position
Total assets at the end of the fiscal year stood at ¥783,264 mil-
lion (US$7,411 million), up ¥63,510 million, or 8.8%. Current
assets rose ¥39,288 million, or 11.4%, to ¥383,423 million
(US$3,628 million). The increase was mainly attributable to
higher sales at overseas subsidiaries, a rise in trade receiv-
ables of ¥24,546 million from higher sales to TMC, and a gain
in inventories of ¥10,231 million due to higher vehicle invento-
ries in Japan from robust orders following the enactment of
new regulations on exhaust emissions.
Investments and other assets were up ¥27,282 million, or
44.3%, from the previous fiscal year-end. The gain largely
reflected a rise of ¥15,499 million in investment securities on
the back of the higher market value of securities holdings and
an increase of ¥8,493 million in long-term loans.
Property, plant and equipment edged down ¥3,060 million,
or 1.0%, to ¥310,987 million (US$2,942 million). The decline
was mainly attributable to a ¥10,730 million fall in land and a
¥12,543 million drop in machinery and equipment.
On the liabilities side of the ledger, current liabilities rose
¥8,316 million, or 1.8%, to ¥466,212 million (US$4,411 mil-
lion). Short-term borrowings declined ¥11,173 million, due to
the repayment of debt and other factors, but trade payables
rose ¥16,871 million owing to rising material costs as pro-
duction volume increased.
Long-term liabilities were up ¥10,704 million, or 14.3%, to
¥85,374 million (US$808 million), reflecting a ¥10,396 million
gain in long-term debt largely due to a ¥20,000 million infu-
sion in new financing from TMC.
Shareholders’ equity increased ¥40,128 million, or 22.3%,
to ¥219,700 million (US$2,079 million), largely due to net
income of ¥34,023 million (US$322 million) and an ¥11,078
million rise in net unrealized gain on securities. As a result, the
equity ratio increased 3.1 percentage points, to 28.0%. Net
asset value per share was ¥382.30 (US$3.62).
0
10
20
30
40
50
60
0
80
160
240
-90
-60
-30
0
30
60
90
0
140
280
420
560
700
840
0
10
20
30
’04’03’02’01’00 ’04’03’02’01’00 ’04’03’02’01’00’04’03’02’01’00
Capital Expenditures,Depreciation and Amortization(Billions of yen)
� Capital expenditures
� Depreciation and amortization
Cash Flows(Billions of yen)
� Cash flows from operating activities
� Cash flows from investing activities
� Cash flows from financing activities
Shareholders’ Equity,Shareholders’ Equity Ratio(Billions of yen, %)
� Shareholders’ equity
� Shareholders’ equity ratio
Total Assets(Billions of yen)
* Shareholders’ equity ratio =Shareholders’ equity/Total assets x 100
(Years ended March 31)
18 HINO MOTORS, LTD.
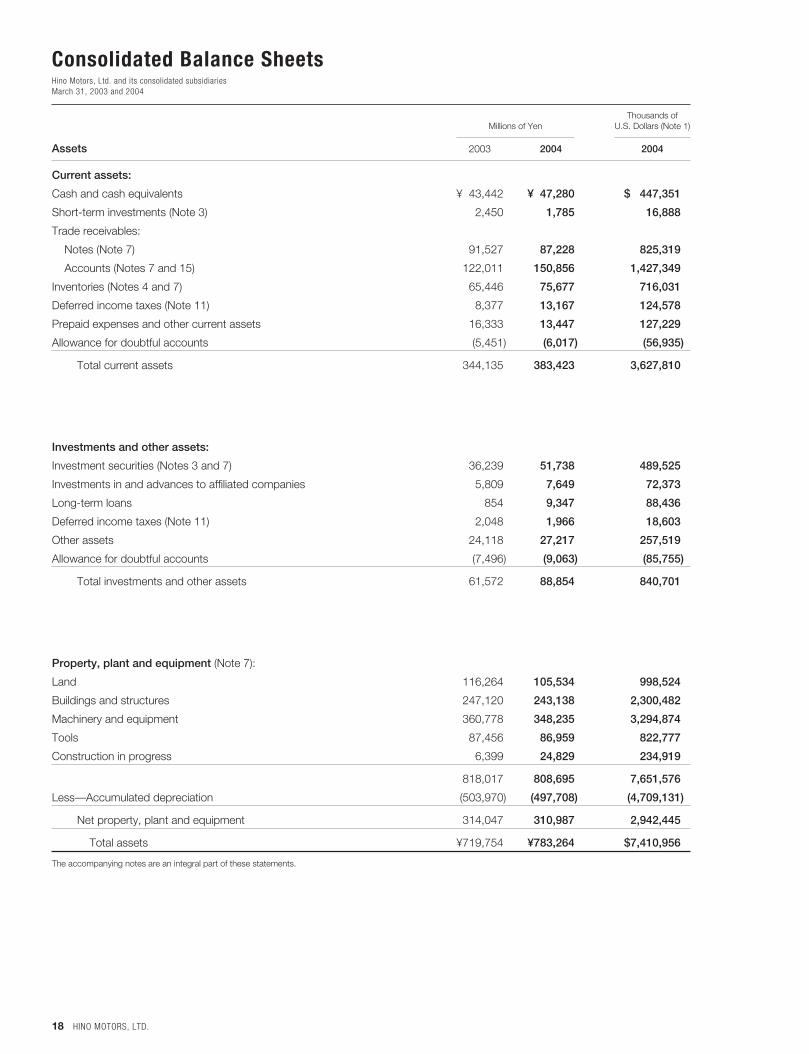
Consolidated Balance SheetsHino Motors, Ltd. and its consolidated subsidiariesMarch 31, 2003 and 2004
Thousands of Millions of Yen U.S. Dollars (Note 1)
Assets 2003 2004 2004
Current assets:
Cash and cash equivalents ¥043,442 ¥047,280 $0,447,351
Short-term investments (Note 3) 2,450 1,785 16,888
Trade receivables:
Notes (Note 7) 91,527 87,228 825,319
Accounts (Notes 7 and 15) 122,011 150,856 1,427,349
Inventories (Notes 4 and 7) 65,446 75,677 716,031
Deferred income taxes (Note 11) 8,377 13,167 124,578
Prepaid expenses and other current assets 16,333 13,447 127,229
Allowance for doubtful accounts (5,451) (6,017) (56,935)
Total current assets 344,135 383,423 3,627,810
Investments and other assets:
Investment securities (Notes 3 and 7) 36,239 51,738 489,525
Investments in and advances to affiliated companies 5,809 7,649 72,373
Long-term loans 854 9,347 88,436
Deferred income taxes (Note 11) 2,048 1,966 18,603
Other assets 24,118 27,217 257,519
Allowance for doubtful accounts (7,496) (9,063) (85,755)
Total investments and other assets 61,572 88,854 840,701
Property, plant and equipment (Note 7):
Land 116,264 105,534 998,524
Buildings and structures 247,120 243,138 2,300,482
Machinery and equipment 360,778 348,235 3,294,874
Tools 87,456 86,959 822,777
Construction in progress 6,399 24,829 234,919
818,017 808,695 7,651,576
Less—Accumulated depreciation (503,970) (497,708) (4,709,131)
Net property, plant and equipment 314,047 310,987 2,942,445
Total assets ¥719,754 ¥783,264 $7,410,956
The accompanying notes are an integral part of these statements.
HINO MOTORS, LTD. 19
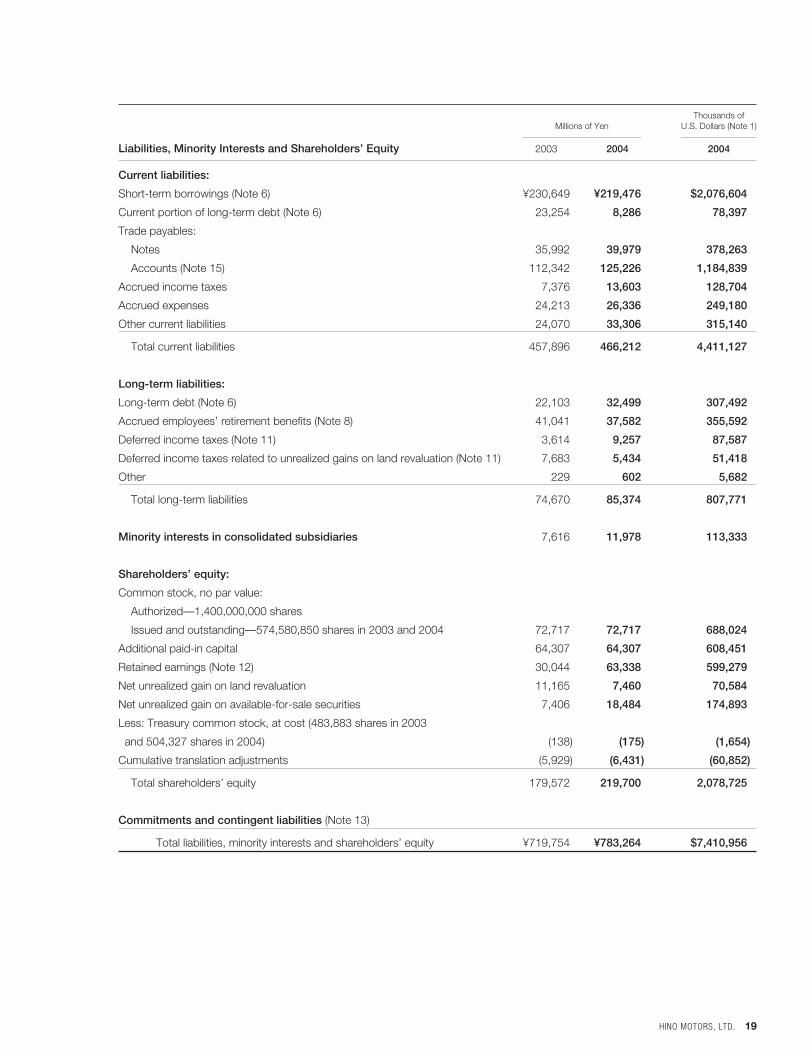
Thousands of Millions of Yen U.S. Dollars (Note 1)
Liabilities, Minority Interests and Shareholders’ Equity 2003 2004 2004
Current liabilities:
Short-term borrowings (Note 6) ¥230,649 ¥219,476 $2,076,604
Current portion of long-term debt (Note 6) 23,254 8,286 78,397
Trade payables:
Notes 35,992 39,979 378,263
Accounts (Note 15) 112,342 125,226 1,184,839
Accrued income taxes 7,376 13,603 128,704
Accrued expenses 24,213 26,336 249,180
Other current liabilities 24,070 33,306 315,140
Total current liabilities 457,896 466,212 4,411,127
Long-term liabilities:
Long-term debt (Note 6) 22,103 32,499 307,492
Accrued employees’ retirement benefits (Note 8) 41,041 37,582 355,592
Deferred income taxes (Note 11) 3,614 9,257 87,587
Deferred income taxes related to unrealized gains on land revaluation (Note 11) 7,683 5,434 51,418
Other 229 602 5,682
Total long-term liabilities 74,670 85,374 807,771
Minority interests in consolidated subsidiaries 7,616 11,978 113,333
Shareholders’ equity:
Common stock, no par value:
Authorized—1,400,000,000 shares
Issued and outstanding—574,580,850 shares in 2003 and 2004 72,717 72,717 688,024
Additional paid-in capital 64,307 64,307 608,451
Retained earnings (Note 12) 30,044 63,338 599,279
Net unrealized gain on land revaluation 11,165 7,460 70,584
Net unrealized gain on available-for-sale securities 7,406 18,484 174,893
Less: Treasury common stock, at cost (483,883 shares in 2003
and 504,327 shares in 2004) (138) (175) (1,654)
Cumulative translation adjustments (5,929) (6,431) (60,852)
Total shareholders’ equity 179,572 219,700 2,078,725
Commitments and contingent liabilities (Note 13)
Total liabilities, minority interests and shareholders’ equity ¥719,754 ¥783,264 $7,410,956
20 HINO MOTORS, LTD.
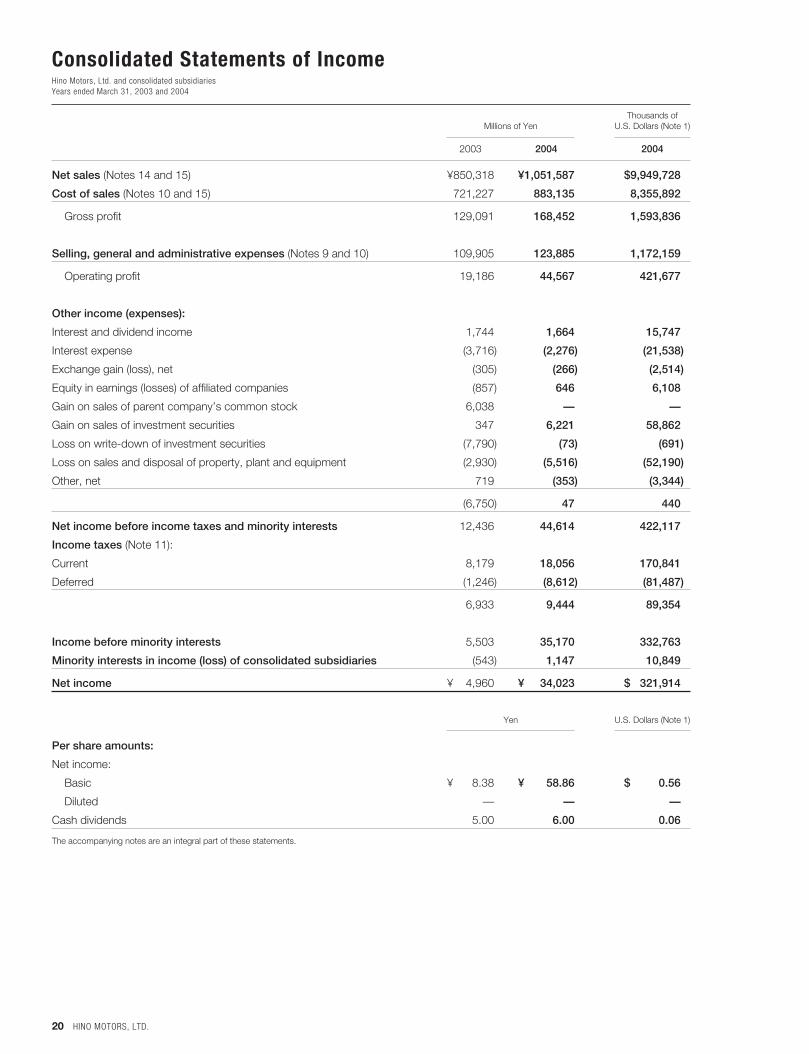
Consolidated Statements of IncomeHino Motors, Ltd. and consolidated subsidiariesYears ended March 31, 2003 and 2004
Thousands of Millions of Yen U.S. Dollars (Note 1)
2003 2004 2004
Net sales (Notes 14 and 15) ¥850,318 ¥1,051,587 $9,949,728
Cost of sales (Notes 10 and 15) 721,227 883,135 8,355,892
Gross profit 129,091 168,452 1,593,836
Selling, general and administrative expenses (Notes 9 and 10) 109,905 123,885 1,172,159
Operating profit 19,186 44,567 421,677
Other income (expenses):
Interest and dividend income 1,744 1,664 15,747
Interest expense (3,716) (2,276) (21,538)
Exchange gain (loss), net (305) (266) (2,514)
Equity in earnings (losses) of affiliated companies (857) 646 6,108
Gain on sales of parent company’s common stock 6,038 — —
Gain on sales of investment securities 347 6,221 58,862
Loss on write-down of investment securities (7,790) (73) (691)
Loss on sales and disposal of property, plant and equipment (2,930) (5,516) (52,190)
Other, net 719 (353) (3,344)
(6,750) 47 440
Net income before income taxes and minority interests 12,436 44,614 422,117
Income taxes (Note 11):
Current 8,179 18,056 170,841
Deferred (1,246) (8,612) (81,487)
6,933 9,444 89,354
Income before minority interests 5,503 35,170 332,763
Minority interests in income (loss) of consolidated subsidiaries (543) 1,147 10,849
Net income ¥004,960 ¥0,034,023 $0,321,914
Yen U.S. Dollars (Note 1)
Per share amounts:
Net income:
Basic ¥0008.38 ¥0,0058.86 $0,0000.56
Diluted — — —
Cash dividends 5.00 6.00 0.06
The accompanying notes are an integral part of these statements.
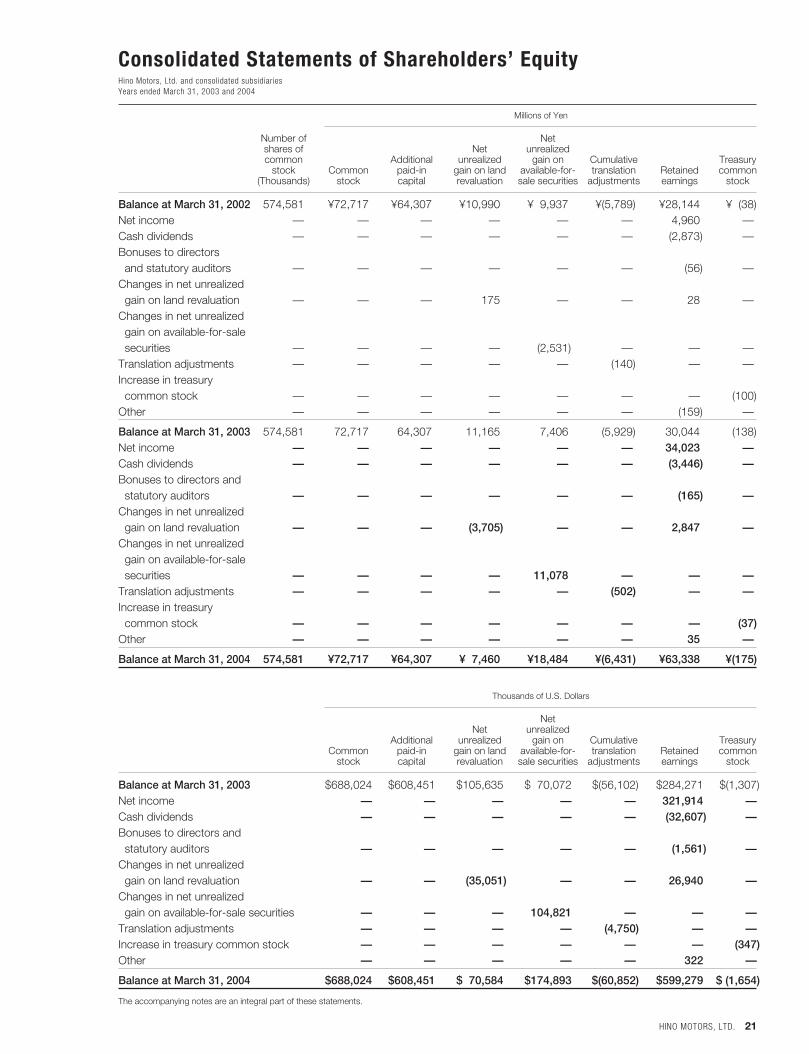
Consolidated Statements of Shareholders’ EquityHino Motors, Ltd. and consolidated subsidiariesYears ended March 31, 2003 and 2004
HINO MOTORS, LTD. 21
Millions of Yen
Number of Net shares of Net unrealized common Additional unrealized gain on Cumulative Treasury
stock Common paid-in gain on land available-for- translation Retained common(Thousands) stock capital revaluation sale securities adjustments earnings stock
Balance at March 31, 2002 574,581 ¥72,717 ¥64,307 ¥10,990 ¥09,937 ¥(5,789) ¥28,144 ¥0(38)Net income — — — — — — 4,960 —Cash dividends — — — — — — (2,873) —Bonuses to directors and statutory auditors — — — — — — (56) —
Changes in net unrealized gain on land revaluation — — — 175 — — 28 —
Changes in net unrealized gain on available-for-sale securities — — — — (2,531) — — —
Translation adjustments — — — — — (140) — —Increase in treasury common stock — — — — — — — (100)
Other — — — — — — (159) —
Balance at March 31, 2003 574,581 72,717 64,307 11,165 7,406 (5,929) 30,044 (138)Net income — — — — — — 34,023 —Cash dividends — — — — — — (3,446) —Bonuses to directors and statutory auditors — — — — — — (165) —
Changes in net unrealized gain on land revaluation — — — (3,705) — — 2,847 —
Changes in net unrealized gain on available-for-sale securities — — — — 11,078 — — —
Translation adjustments — — — — — (502) — —Increase in treasury common stock — — — — — — — (37)
Other — — — — — — 35 —
Balance at March 31, 2004 574,581 ¥72,717 ¥64,307 ¥07,460 ¥18,484 ¥(6,431) ¥63,338 ¥(175)
Thousands of U.S. Dollars
Net Net unrealized
Additional unrealized gain on Cumulative Treasury Common paid-in gain on land available-for- translation Retained common
stock capital revaluation sale securities adjustments earnings stock
Balance at March 31, 2003 $688,024 $608,451 $105,635 $070,072 $(56,102) $284,271 $(1,307)Net income — — — — — 321,914 —Cash dividends — — — — — (32,607) —Bonuses to directors and statutory auditors — — — — — (1,561) —
Changes in net unrealized gain on land revaluation — — (35,051) — — 26,940 —
Changes in net unrealized gain on available-for-sale securities — — — 104,821 — — —
Translation adjustments — — — — (4,750) — —Increase in treasury common stock — — — — — — (347)Other — — — — — 322 —
Balance at March 31, 2004 $688,024 $608,451 $070,584 $174,893 $(60,852) $599,279 $ (1,654)
The accompanying notes are an integral part of these statements.
22 HINO MOTORS, LTD.
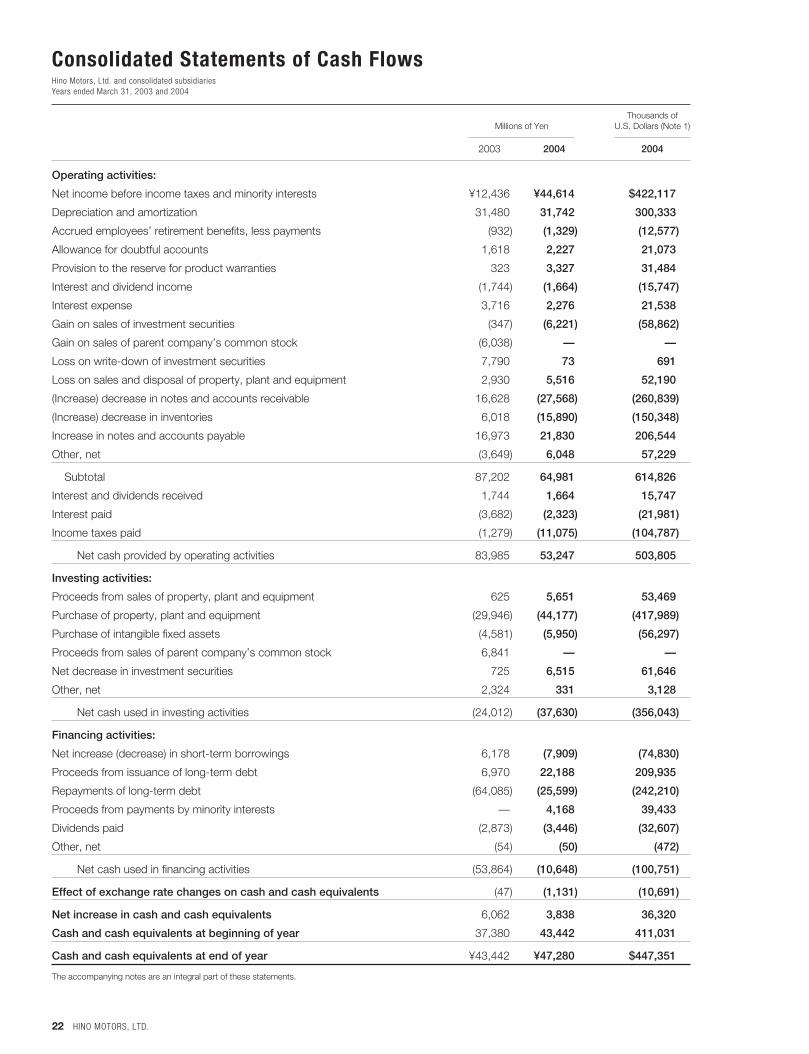
Consolidated Statements of Cash FlowsHino Motors, Ltd. and consolidated subsidiariesYears ended March 31, 2003 and 2004
Thousands of Millions of Yen U.S. Dollars (Note 1)
2003 2004 2004
Operating activities:
Net income before income taxes and minority interests ¥12,436 ¥44,614 $422,117
Depreciation and amortization 31,480 31,742 300,333
Accrued employees’ retirement benefits, less payments (932) (1,329) (12,577)
Allowance for doubtful accounts 1,618 2,227 21,073
Provision to the reserve for product warranties 323 3,327 31,484
Interest and dividend income (1,744) (1,664) (15,747)
Interest expense 3,716 2,276 21,538
Gain on sales of investment securities (347) (6,221) (58,862)
Gain on sales of parent company’s common stock (6,038) — —
Loss on write-down of investment securities 7,790 73 691
Loss on sales and disposal of property, plant and equipment 2,930 5,516 52,190
(Increase) decrease in notes and accounts receivable 16,628 (27,568) (260,839)
(Increase) decrease in inventories 6,018 (15,890) (150,348)
Increase in notes and accounts payable 16,973 21,830 206,544
Other, net (3,649) 6,048 57,229
Subtotal 87,202 64,981 614,826
Interest and dividends received 1,744 1,664 15,747
Interest paid (3,682) (2,323) (21,981)
Income taxes paid (1,279) (11,075) (104,787)
Net cash provided by operating activities 83,985 53,247 503,805
Investing activities:
Proceeds from sales of property, plant and equipment 625 5,651 53,469
Purchase of property, plant and equipment (29,946) (44,177) (417,989)
Purchase of intangible fixed assets (4,581) (5,950) (56,297)
Proceeds from sales of parent company’s common stock 6,841 — —
Net decrease in investment securities 725 6,515 61,646
Other, net 2,324 331 3,128
Net cash used in investing activities (24,012) (37,630) (356,043)
Financing activities:
Net increase (decrease) in short-term borrowings 6,178 (7,909) (74,830)
Proceeds from issuance of long-term debt 6,970 22,188 209,935
Repayments of long-term debt (64,085) (25,599) (242,210)
Proceeds from payments by minority interests — 4,168 39,433
Dividends paid (2,873) (3,446) (32,607)
Other, net (54) (50) (472)
Net cash used in financing activities (53,864) (10,648) (100,751)
Effect of exchange rate changes on cash and cash equivalents (47) (1,131) (10,691)
Net increase in cash and cash equivalents 6,062 3,838 36,320
Cash and cash equivalents at beginning of year 37,380 43,442 411,031
Cash and cash equivalents at end of year ¥43,442 ¥47,280 $447,351
The accompanying notes are an integral part of these statements.
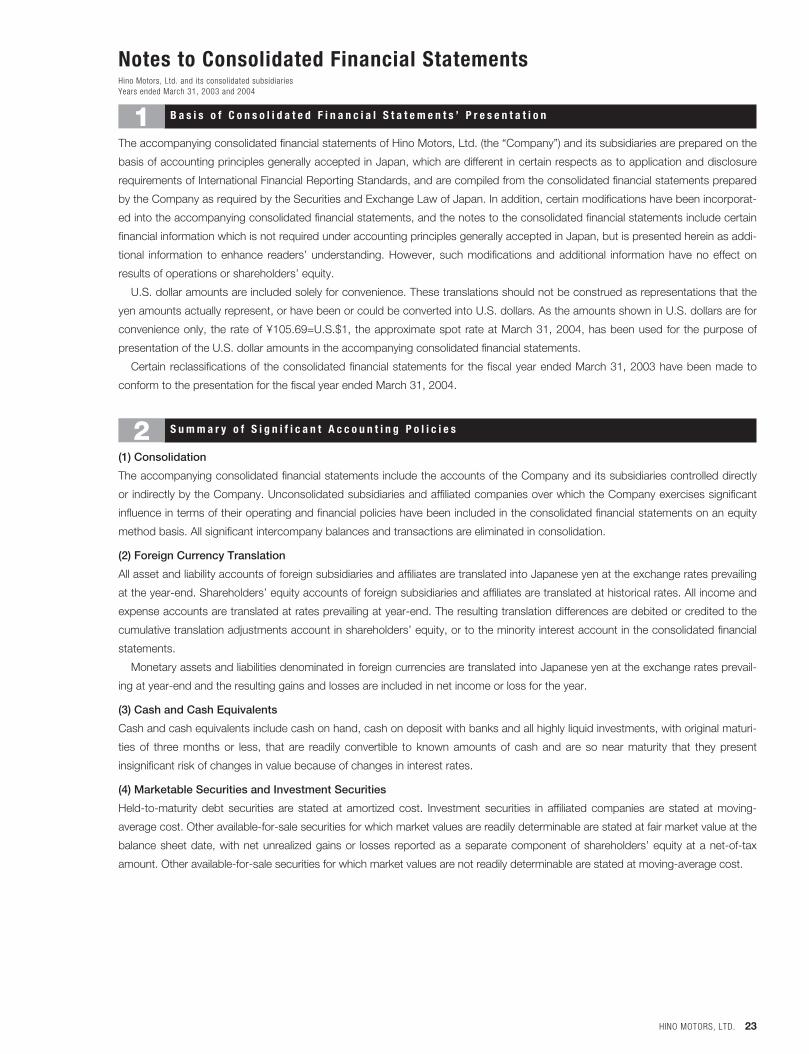
Notes to Consolidated Financial StatementsHino Motors, Ltd. and its consolidated subsidiariesYears ended March 31, 2003 and 2004
HINO MOTORS, LTD. 23
B a s i s o f C o n s o l i d a t e d F i n a n c i a l S t a t e m e n t s ’ P r e s e n t a t i o n
The accompanying consolidated financial statements of Hino Motors, Ltd. (the “Company”) and its subsidiaries are prepared on the
basis of accounting principles generally accepted in Japan, which are different in certain respects as to application and disclosure
requirements of International Financial Reporting Standards, and are compiled from the consolidated financial statements prepared
by the Company as required by the Securities and Exchange Law of Japan. In addition, certain modifications have been incorporat-
ed into the accompanying consolidated financial statements, and the notes to the consolidated financial statements include certain
financial information which is not required under accounting principles generally accepted in Japan, but is presented herein as addi-
tional information to enhance readers’ understanding. However, such modifications and additional information have no effect on
results of operations or shareholders’ equity.
U.S. dollar amounts are included solely for convenience. These translations should not be construed as representations that the
yen amounts actually represent, or have been or could be converted into U.S. dollars. As the amounts shown in U.S. dollars are for
convenience only, the rate of ¥105.69=U.S.$1, the approximate spot rate at March 31, 2004, has been used for the purpose of
presentation of the U.S. dollar amounts in the accompanying consolidated financial statements.
Certain reclassifications of the consolidated financial statements for the fiscal year ended March 31, 2003 have been made to
conform to the presentation for the fiscal year ended March 31, 2004.
S u m m a r y o f S i g n i f i c a n t A c c o u n t i n g P o l i c i e s
(1) Consolidation
The accompanying consolidated financial statements include the accounts of the Company and its subsidiaries controlled directly
or indirectly by the Company. Unconsolidated subsidiaries and affiliated companies over which the Company exercises significant
influence in terms of their operating and financial policies have been included in the consolidated financial statements on an equity
method basis. All significant intercompany balances and transactions are eliminated in consolidation.
(2) Foreign Currency Translation
All asset and liability accounts of foreign subsidiaries and affiliates are translated into Japanese yen at the exchange rates prevailing
at the year-end. Shareholders’ equity accounts of foreign subsidiaries and affiliates are translated at historical rates. All income and
expense accounts are translated at rates prevailing at year-end. The resulting translation differences are debited or credited to the
cumulative translation adjustments account in shareholders’ equity, or to the minority interest account in the consolidated financial
statements.
Monetary assets and liabilities denominated in foreign currencies are translated into Japanese yen at the exchange rates prevail-
ing at year-end and the resulting gains and losses are included in net income or loss for the year.
(3) Cash and Cash Equivalents
Cash and cash equivalents include cash on hand, cash on deposit with banks and all highly liquid investments, with original maturi-
ties of three months or less, that are readily convertible to known amounts of cash and are so near maturity that they present
insignificant risk of changes in value because of changes in interest rates.
(4) Marketable Securities and Investment Securities
Held-to-maturity debt securities are stated at amortized cost. Investment securities in affiliated companies are stated at moving-
average cost. Other available-for-sale securities for which market values are readily determinable are stated at fair market value at the
balance sheet date, with net unrealized gains or losses reported as a separate component of shareholders’ equity at a net-of-tax
amount. Other available-for-sale securities for which market values are not readily determinable are stated at moving-average cost.
2
1
24 HINO MOTORS, LTD.
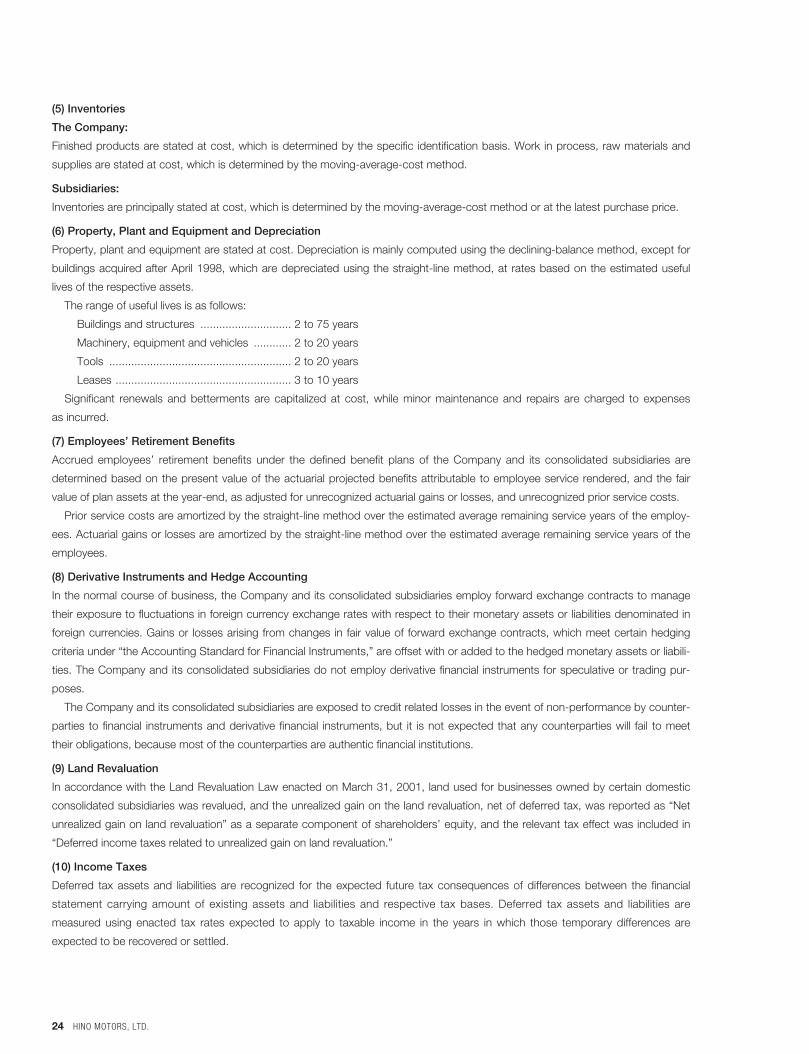
(5) Inventories
The Company:
Finished products are stated at cost, which is determined by the specific identification basis. Work in process, raw materials and
supplies are stated at cost, which is determined by the moving-average-cost method.
Subsidiaries:
Inventories are principally stated at cost, which is determined by the moving-average-cost method or at the latest purchase price.
(6) Property, Plant and Equipment and Depreciation
Property, plant and equipment are stated at cost. Depreciation is mainly computed using the declining-balance method, except for
buildings acquired after April 1998, which are depreciated using the straight-line method, at rates based on the estimated useful
lives of the respective assets.
The range of useful lives is as follows:
Buildings and structures ............................. 2 to 75 years
Machinery, equipment and vehicles ............ 2 to 20 years
Tools .......................................................... 2 to 20 years
Leases ........................................................ 3 to 10 years
Significant renewals and betterments are capitalized at cost, while minor maintenance and repairs are charged to expenses
as incurred.
(7) Employees’ Retirement Benefits
Accrued employees’ retirement benefits under the defined benefit plans of the Company and its consolidated subsidiaries are
determined based on the present value of the actuarial projected benefits attributable to employee service rendered, and the fair
value of plan assets at the year-end, as adjusted for unrecognized actuarial gains or losses, and unrecognized prior service costs.
Prior service costs are amortized by the straight-line method over the estimated average remaining service years of the employ-
ees. Actuarial gains or losses are amortized by the straight-line method over the estimated average remaining service years of the
employees.
(8) Derivative Instruments and Hedge Accounting
In the normal course of business, the Company and its consolidated subsidiaries employ forward exchange contracts to manage
their exposure to fluctuations in foreign currency exchange rates with respect to their monetary assets or liabilities denominated in
foreign currencies. Gains or losses arising from changes in fair value of forward exchange contracts, which meet certain hedging
criteria under “the Accounting Standard for Financial Instruments,” are offset with or added to the hedged monetary assets or liabili-
ties. The Company and its consolidated subsidiaries do not employ derivative financial instruments for speculative or trading pur-
poses.
The Company and its consolidated subsidiaries are exposed to credit related losses in the event of non-performance by counter-
parties to financial instruments and derivative financial instruments, but it is not expected that any counterparties will fail to meet
their obligations, because most of the counterparties are authentic financial institutions.
(9) Land Revaluation
In accordance with the Land Revaluation Law enacted on March 31, 2001, land used for businesses owned by certain domestic
consolidated subsidiaries was revalued, and the unrealized gain on the land revaluation, net of deferred tax, was reported as “Net
unrealized gain on land revaluation” as a separate component of shareholders’ equity, and the relevant tax effect was included in
“Deferred income taxes related to unrealized gain on land revaluation.”
(10) Income Taxes
Deferred tax assets and liabilities are recognized for the expected future tax consequences of differences between the financial
statement carrying amount of existing assets and liabilities and respective tax bases. Deferred tax assets and liabilities are
measured using enacted tax rates expected to apply to taxable income in the years in which those temporary differences are
expected to be recovered or settled.
HINO MOTORS, LTD. 25
(11) Net Income per Share
Net income per share is computed based on the average number of common shares outstanding during each period. From the fis-
cal year ended March 31, 2003, in accordance with the newly issued accounting standard for per share information, the amount of
proposed appropriation of retained earnings for bonuses to directors and statutory auditors is deducted from net income for the
computation of net income per share.
Information about diluted net income per share is not disclosed because no potential common shares exist.
(12) Leases
Periodic lease payments under financing lease contracts are charged to income as incurred. Under Japanese accounting princi-
ples, a financing lease that meets certain designated criteria can be either capitalized or accounted for as on operating lease with
appropriate footnote disclosure.
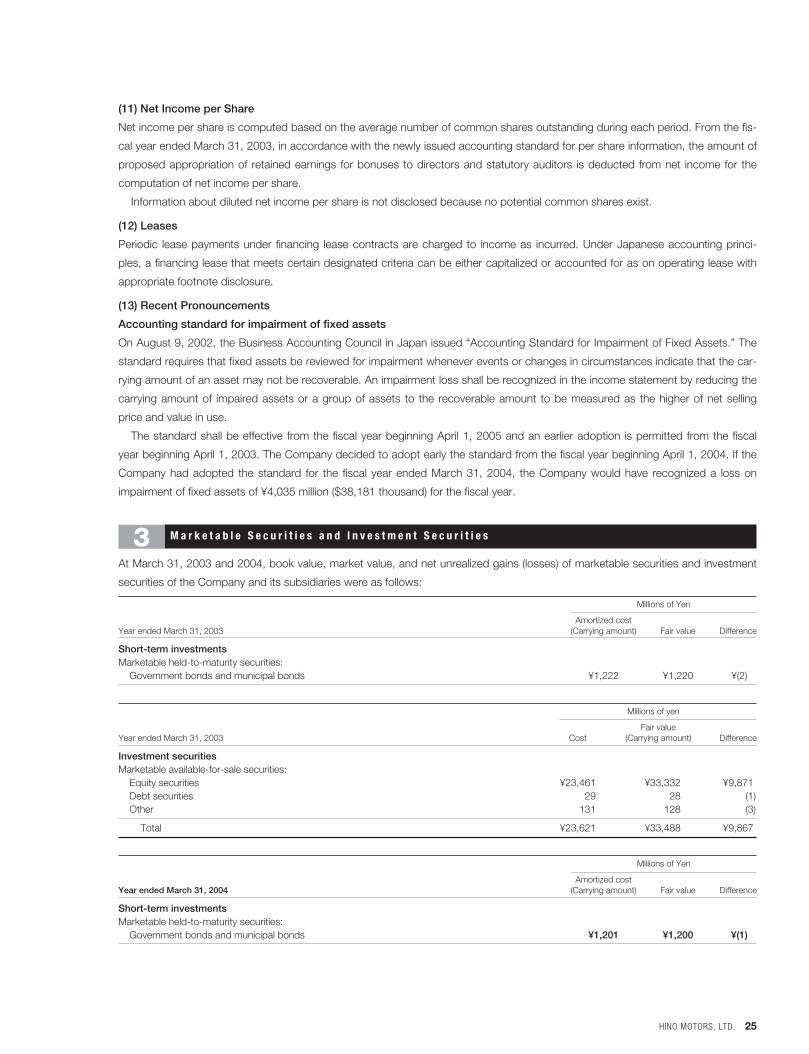
(13) Recent Pronouncements
Accounting standard for impairment of fixed assets
On August 9, 2002, the Business Accounting Council in Japan issued “Accounting Standard for Impairment of Fixed Assets.” The
standard requires that fixed assets be reviewed for impairment whenever events or changes in circumstances indicate that the car-
rying amount of an asset may not be recoverable. An impairment loss shall be recognized in the income statement by reducing the
carrying amount of impaired assets or a group of assets to the recoverable amount to be measured as the higher of net selling
price and value in use.
The standard shall be effective from the fiscal year beginning April 1, 2005 and an earlier adoption is permitted from the fiscal
year beginning April 1, 2003. The Company decided to adopt early the standard from the fiscal year beginning April 1, 2004. If the
Company had adopted the standard for the fiscal year ended March 31, 2004, the Company would have recognized a loss on
impairment of fixed assets of ¥4,035 million ($38,181 thousand) for the fiscal year.
M a r k e t a b l e S e c u r i t i e s a n d I n v e s t m e n t S e c u r i t i e s
At March 31, 2003 and 2004, book value, market value, and net unrealized gains (losses) of marketable securities and investment
securities of the Company and its subsidiaries were as follows:
Millions of Yen
Amortized cost Year ended March 31, 2003 (Carrying amount) Fair value Difference
Short-term investmentsMarketable held-to-maturity securities:
Government bonds and municipal bonds ¥1,222 ¥1,220 ¥(2)
Millions of yen
Fair valueYear ended March 31, 2003 Cost (Carrying amount) Difference
Investment securitiesMarketable available-for-sale securities:
Equity securities ¥23,461 ¥33,332 ¥9,871Debt securities 29 28 (1)Other 131 128 (3)
Total ¥23,621 ¥33,488 ¥9,867
Millions of Yen
Amortized cost Year ended March 31, 2004 (Carrying amount) Fair value Difference
Short-term investmentsMarketable held-to-maturity securities:
Government bonds and municipal bonds ¥1,201 ¥1,200 ¥(1)
3
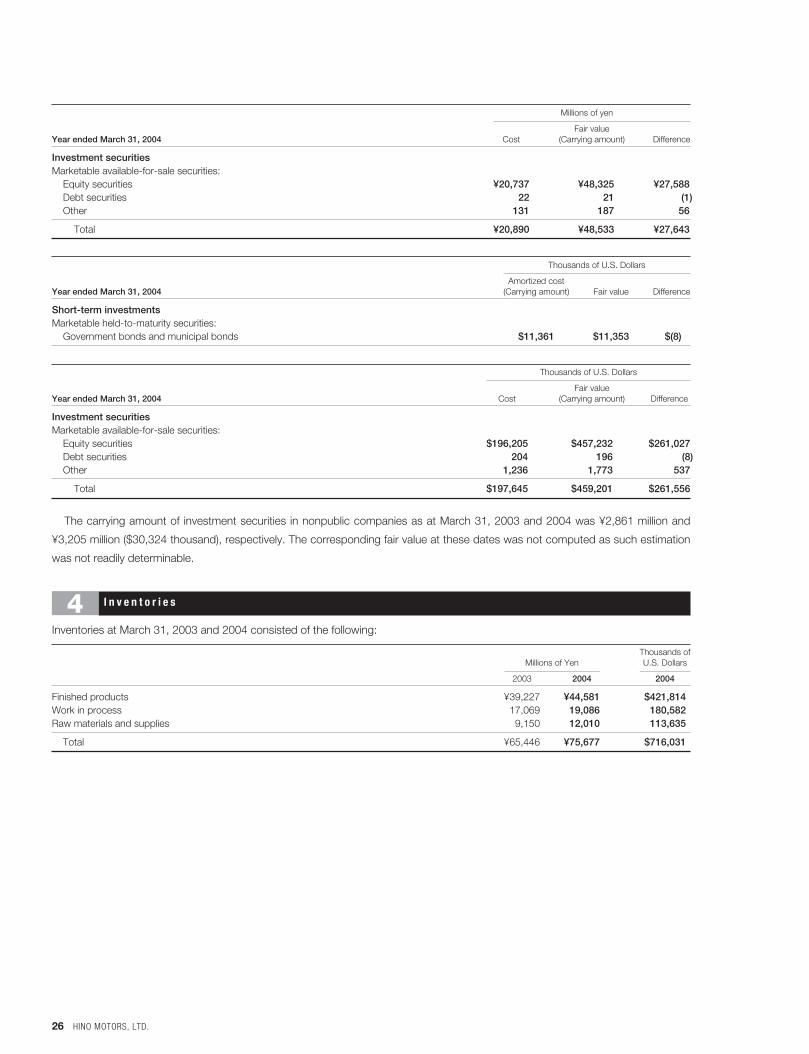
26 HINO MOTORS, LTD.
Millions of yen
Fair valueYear ended March 31, 2004 Cost (Carrying amount) Difference
Investment securitiesMarketable available-for-sale securities:
Equity securities ¥20,737 ¥48,325 ¥27,588Debt securities 22 21 (1)Other 131 187 56
Total ¥20,890 ¥48,533 ¥27,643
Thousands of U.S. Dollars
Amortized cost Year ended March 31, 2004 (Carrying amount) Fair value Difference
Short-term investmentsMarketable held-to-maturity securities:
Government bonds and municipal bonds $11,361 $11,353 $(8)
Thousands of U.S. Dollars
Fair valueYear ended March 31, 2004 Cost (Carrying amount) Difference
Investment securitiesMarketable available-for-sale securities:
Equity securities $196,205 $457,232 $261,027Debt securities 204 196 (8)Other 1,236 1,773 537
Total $197,645 $459,201 $261,556
The carrying amount of investment securities in nonpublic companies as at March 31, 2003 and 2004 was ¥2,861 million and
¥3,205 million ($30,324 thousand), respectively. The corresponding fair value at these dates was not computed as such estimation
was not readily determinable.
I n v e n t o r i e s
Inventories at March 31, 2003 and 2004 consisted of the following:
Thousands ofMillions of Yen U.S. Dollars
2003 2004 2004
Finished products ¥39,227 ¥44,581 $421,814Work in process 17,069 19,086 180,582Raw materials and supplies 9,150 12,010 113,635
Total ¥65,446 ¥75,677 $716,031
4
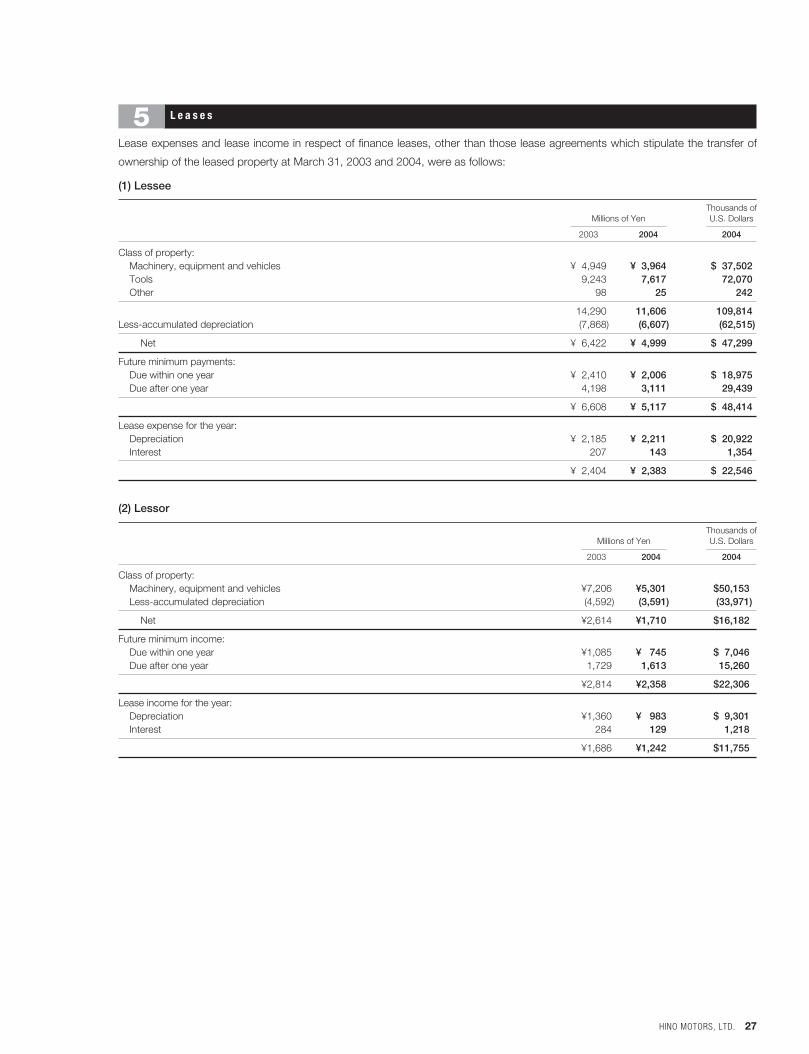
HINO MOTORS, LTD. 27
L e a s e s
Lease expenses and lease income in respect of finance leases, other than those lease agreements which stipulate the transfer of
ownership of the leased property at March 31, 2003 and 2004, were as follows:
(1) Lessee
Thousands ofMillions of Yen U.S. Dollars
2003 2004 2004
Class of property: Machinery, equipment and vehicles ¥04,949 ¥03,964 $037,502Tools 9,243 7,617 72,070Other 98 25 242
14,290 11,606 109,814Less-accumulated depreciation (7,868) (6,607) (62,515)
Net ¥06,422 ¥04,999 $047,299
Future minimum payments:Due within one year ¥02,410 ¥02,006 $018,975Due after one year 4,198 3,111 29,439
¥06,608 ¥05,117 $048,414
Lease expense for the year: Depreciation ¥02,185 ¥02,211 $020,922Interest 207 143 1,354
¥02,404 ¥02,383 $022,546
(2) Lessor
Thousands ofMillions of Yen U.S. Dollars
2003 2004 2004
Class of property: Machinery, equipment and vehicles ¥7,206 ¥5,301 $50,153Less-accumulated depreciation (4,592) (3,591) (33,971)
Net ¥2,614 ¥1,710 $16,182
Future minimum income: Due within one year ¥1,085 ¥0,745 $07,046Due after one year 1,729 1,613 15,260
¥2,814 ¥2,358 $22,306
Lease income for the year: Depreciation ¥1,360 ¥0,983 $09,301Interest 284 129 1,218
¥1,686 ¥1,242 $11,755
5
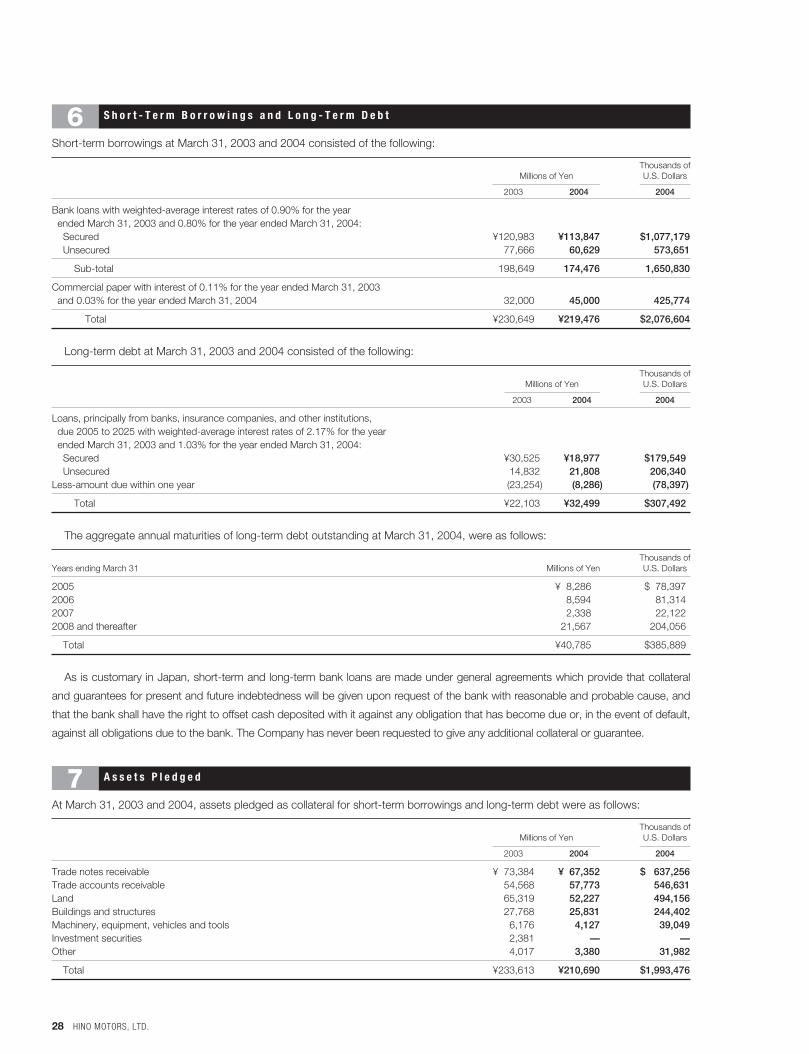
28 HINO MOTORS, LTD.
S h o r t - T e r m B o r r o w i n g s a n d L o n g - T e r m D e b t
Short-term borrowings at March 31, 2003 and 2004 consisted of the following:
Thousands ofMillions of Yen U.S. Dollars
2003 2004 2004
Bank loans with weighted-average interest rates of 0.90% for the year ended March 31, 2003 and 0.80% for the year ended March 31, 2004:
Secured ¥120,983 ¥113,847 $1,077,179Unsecured 77,666 60,629 573,651
Sub-total 198,649 174,476 1,650,830
Commercial paper with interest of 0.11% for the year ended March 31, 2003 and 0.03% for the year ended March 31, 2004 32,000 45,000 425,774
Total ¥230,649 ¥219,476 $2,076,604
Long-term debt at March 31, 2003 and 2004 consisted of the following:
Thousands ofMillions of Yen U.S. Dollars
2003 2004 2004
Loans, principally from banks, insurance companies, and other institutions, due 2005 to 2025 with weighted-average interest rates of 2.17% for the year ended March 31, 2003 and 1.03% for the year ended March 31, 2004:
Secured ¥30,525 ¥18,977 $179,549Unsecured 14,832 21,808 206,340
Less-amount due within one year (23,254) (8,286) (78,397)
Total ¥22,103 ¥32,499 $307,492
The aggregate annual maturities of long-term debt outstanding at March 31, 2004, were as follows:
Thousands ofYears ending March 31 Millions of Yen U.S. Dollars
2005 ¥08,286 $078,3972006 8,594 81,314 2007 2,338 22,1222008 and thereafter 21,567 204,056
Total ¥40,785 $385,889
As is customary in Japan, short-term and long-term bank loans are made under general agreements which provide that collateral
and guarantees for present and future indebtedness will be given upon request of the bank with reasonable and probable cause, and
that the bank shall have the right to offset cash deposited with it against any obligation that has become due or, in the event of default,
against all obligations due to the bank. The Company has never been requested to give any additional collateral or guarantee.
A s s e t s P l e d g e d
At March 31, 2003 and 2004, assets pledged as collateral for short-term borrowings and long-term debt were as follows:
Thousands ofMillions of Yen U.S. Dollars
2003 2004 2004
Trade notes receivable ¥073,384 ¥067,352 $0,637,256Trade accounts receivable 54,568 57,773 546,631Land 65,319 52,227 494,156Buildings and structures 27,768 25,831 244,402Machinery, equipment, vehicles and tools 6,176 4,127 39,049Investment securities 2,381 — —Other 4,017 3,380 31,982
Total ¥233,613 ¥210,690 $1,993,476
7
6
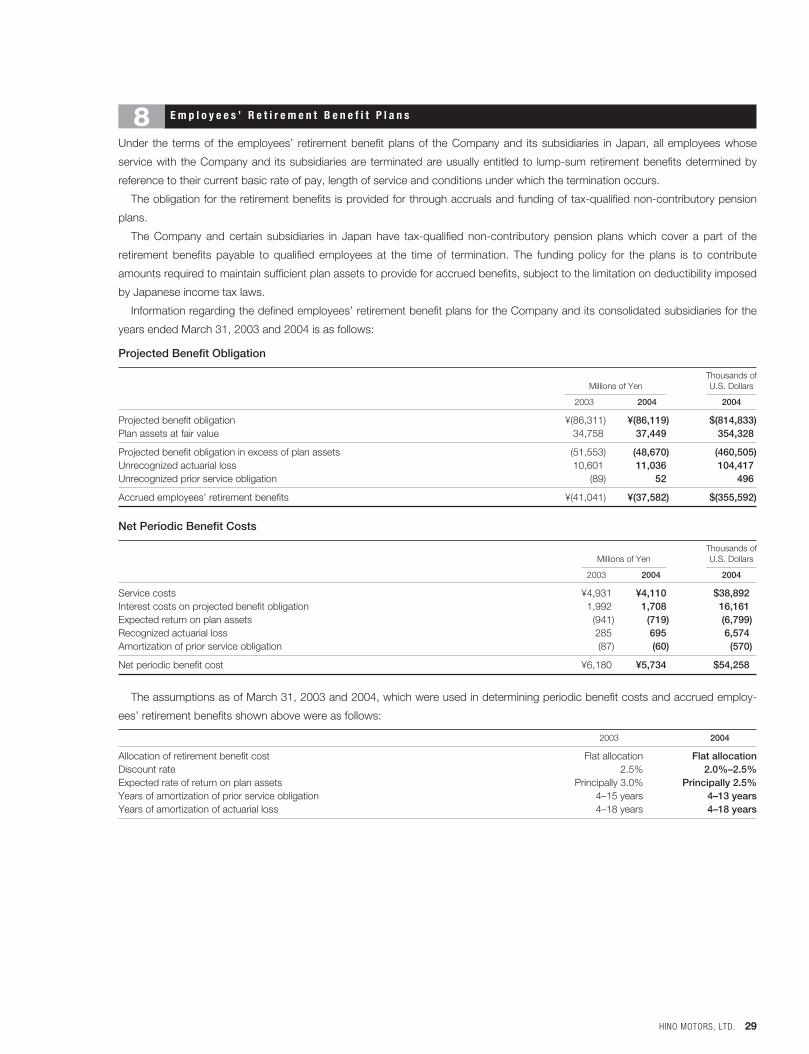
HINO MOTORS, LTD. 29
E m p l o y e e s ’ R e t i r e m e n t B e n e f i t P l a n s
Under the terms of the employees’ retirement benefit plans of the Company and its subsidiaries in Japan, all employees whose
service with the Company and its subsidiaries are terminated are usually entitled to lump-sum retirement benefits determined by
reference to their current basic rate of pay, length of service and conditions under which the termination occurs.
The obligation for the retirement benefits is provided for through accruals and funding of tax-qualified non-contributory pension
plans.
The Company and certain subsidiaries in Japan have tax-qualified non-contributory pension plans which cover a part of the
retirement benefits payable to qualified employees at the time of termination. The funding policy for the plans is to contribute
amounts required to maintain sufficient plan assets to provide for accrued benefits, subject to the limitation on deductibility imposed
by Japanese income tax laws.
Information regarding the defined employees’ retirement benefit plans for the Company and its consolidated subsidiaries for the
years ended March 31, 2003 and 2004 is as follows:
Projected Benefit Obligation
Thousands ofMillions of Yen U.S. Dollars
2003 2004 2004
Projected benefit obligation ¥(86,311) ¥(86,119) $(814,833)Plan assets at fair value 34,758 37,449 354,328
Projected benefit obligation in excess of plan assets (51,553) (48,670) (460,505)Unrecognized actuarial loss 10,601 11,036 104,417Unrecognized prior service obligation (89) 52 496
Accrued employees’ retirement benefits ¥(41,041) ¥(37,582) $(355,592)
Net Periodic Benefit Costs
Thousands ofMillions of Yen U.S. Dollars
2003 2004 2004
Service costs ¥4,931 ¥4,110 $38,892Interest costs on projected benefit obligation 1,992 1,708 16,161Expected return on plan assets (941) (719) (6,799)Recognized actuarial loss 285 695 6,574Amortization of prior service obligation (87) (60) (570)
Net periodic benefit cost ¥6,180 ¥5,734 $54,258
The assumptions as of March 31, 2003 and 2004, which were used in determining periodic benefit costs and accrued employ-
ees’ retirement benefits shown above were as follows:
2003 2004
Allocation of retirement benefit cost Flat allocation Flat allocationDiscount rate 2.5% 2.0%–2.5%Expected rate of return on plan assets Principally 3.0% Principally 2.5%Years of amortization of prior service obligation 4–15 years 4–13 yearsYears of amortization of actuarial loss 4–18 years 4–18 years
8
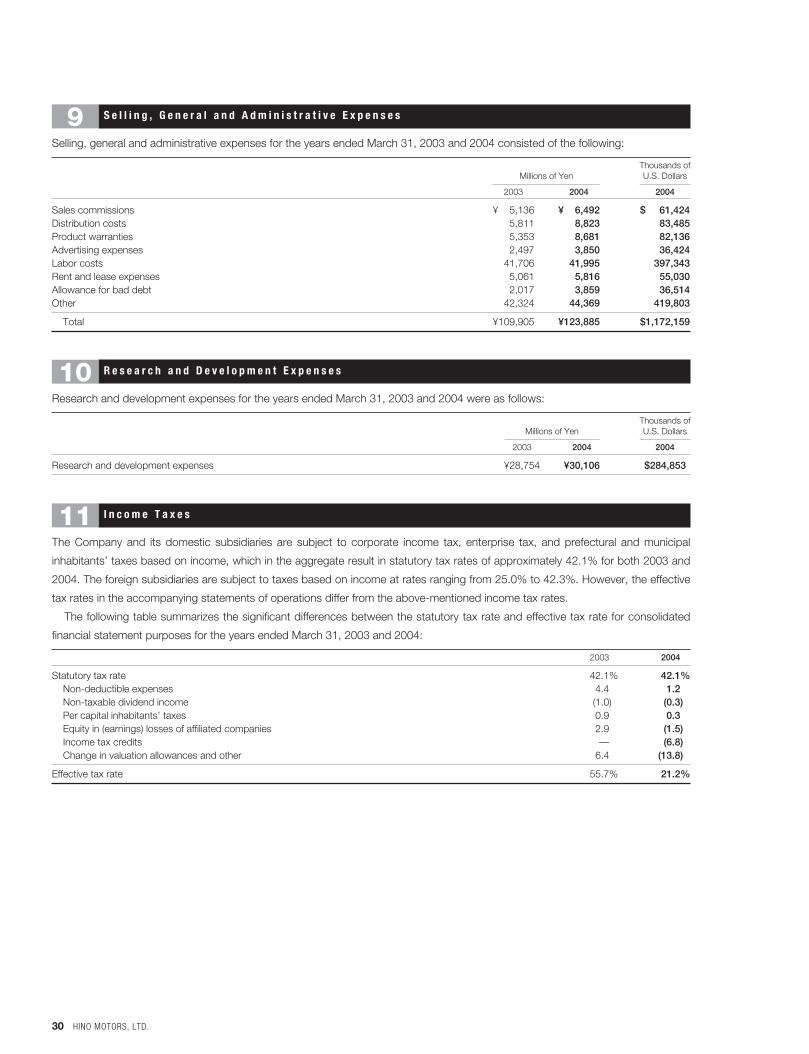
30 HINO MOTORS, LTD.
S e l l i n g , G e n e r a l a n d A d m i n i s t r a t i v e E x p e n s e s
Selling, general and administrative expenses for the years ended March 31, 2003 and 2004 consisted of the following:
Thousands ofMillions of Yen U.S. Dollars
2003 2004 2004
Sales commissions ¥005,136 ¥006,492 $0,061,424Distribution costs 5,811 8,823 83,485Product warranties 5,353 8,681 82,136Advertising expenses 2,497 3,850 36,424Labor costs 41,706 41,995 397,343Rent and lease expenses 5,061 5,816 55,030Allowance for bad debt 2,017 3,859 36,514Other 42,324 44,369 419,803
Total ¥109,905 ¥123,885 $1,172,159
R e s e a r c h a n d D e v e l o p m e n t E x p e n s e s
Research and development expenses for the years ended March 31, 2003 and 2004 were as follows:
Thousands ofMillions of Yen U.S. Dollars
2003 2004 2004
Research and development expenses ¥28,754 ¥30,106 $284,853
I n c o m e T a x e s
The Company and its domestic subsidiaries are subject to corporate income tax, enterprise tax, and prefectural and municipal
inhabitants’ taxes based on income, which in the aggregate result in statutory tax rates of approximately 42.1% for both 2003 and
2004. The foreign subsidiaries are subject to taxes based on income at rates ranging from 25.0% to 42.3%. However, the effective
tax rates in the accompanying statements of operations differ from the above-mentioned income tax rates.
The following table summarizes the significant differences between the statutory tax rate and effective tax rate for consolidated
financial statement purposes for the years ended March 31, 2003 and 2004:
2003 2004
Statutory tax rate 42.1% 42.1%Non-deductible expenses 4.4 1.2Non-taxable dividend income (1.0) (0.3)Per capital inhabitants’ taxes 0.9 0.3Equity in (earnings) losses of affiliated companies 2.9 (1.5)Income tax credits 0— (6.8)Change in valuation allowances and other 6.4 (13.8)
Effective tax rate 55.7% 21.2%
11
10
9
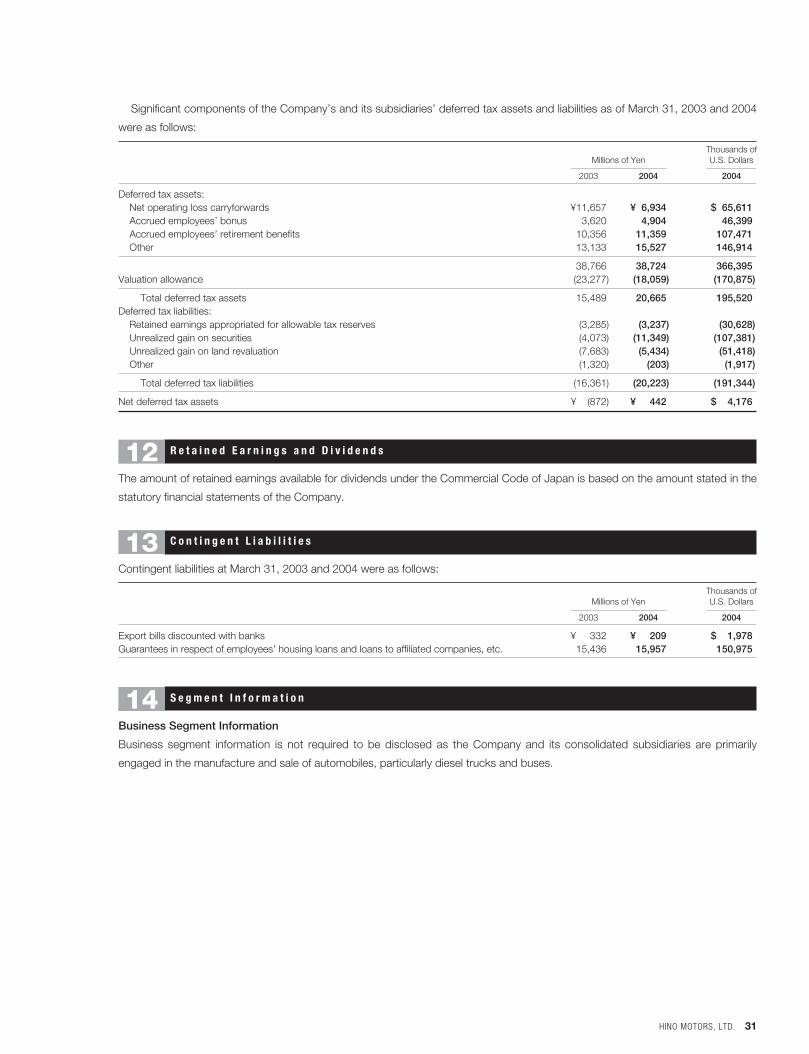
HINO MOTORS, LTD. 31
Significant components of the Company’s and its subsidiaries’ deferred tax assets and liabilities as of March 31, 2003 and 2004
were as follows:
Thousands ofMillions of Yen U.S. Dollars
2003 2004 2004
Deferred tax assets:Net operating loss carryforwards ¥11,657 ¥06,934 $065,611Accrued employees’ bonus 3,620 4,904 46,399Accrued employees’ retirement benefits 10,356 11,359 107,471Other 13,133 15,527 146,914
38,766 38,724 366,395Valuation allowance (23,277) (18,059) (170,875)
Total deferred tax assets 15,489 20,665 195,520Deferred tax liabilities:
Retained earnings appropriated for allowable tax reserves (3,285) (3,237) (30,628)Unrealized gain on securities (4,073) (11,349) (107,381)Unrealized gain on land revaluation (7,683) (5,434) (51,418)Other (1,320) (203) (1,917)
Total deferred tax liabilities (16,361) (20,223) (191,344)
Net deferred tax assets ¥00(872) ¥00,442 $004,176
R e t a i n e d E a r n i n g s a n d D i v i d e n d s
The amount of retained earnings available for dividends under the Commercial Code of Japan is based on the amount stated in the
statutory financial statements of the Company.
C o n t i n g e n t L i a b i l i t i e s
Contingent liabilities at March 31, 2003 and 2004 were as follows:
Thousands ofMillions of Yen U.S. Dollars
2003 2004 2004
Export bills discounted with banks ¥00,332 ¥00,209 $001,978Guarantees in respect of employees’ housing loans and loans to affiliated companies, etc. 15,436 15,957 150,975
S e g m e n t I n f o r m a t i o n
Business Segment Information
Business segment information is not required to be disclosed as the Company and its consolidated subsidiaries are primarily
engaged in the manufacture and sale of automobiles, particularly diesel trucks and buses.
14
13
12
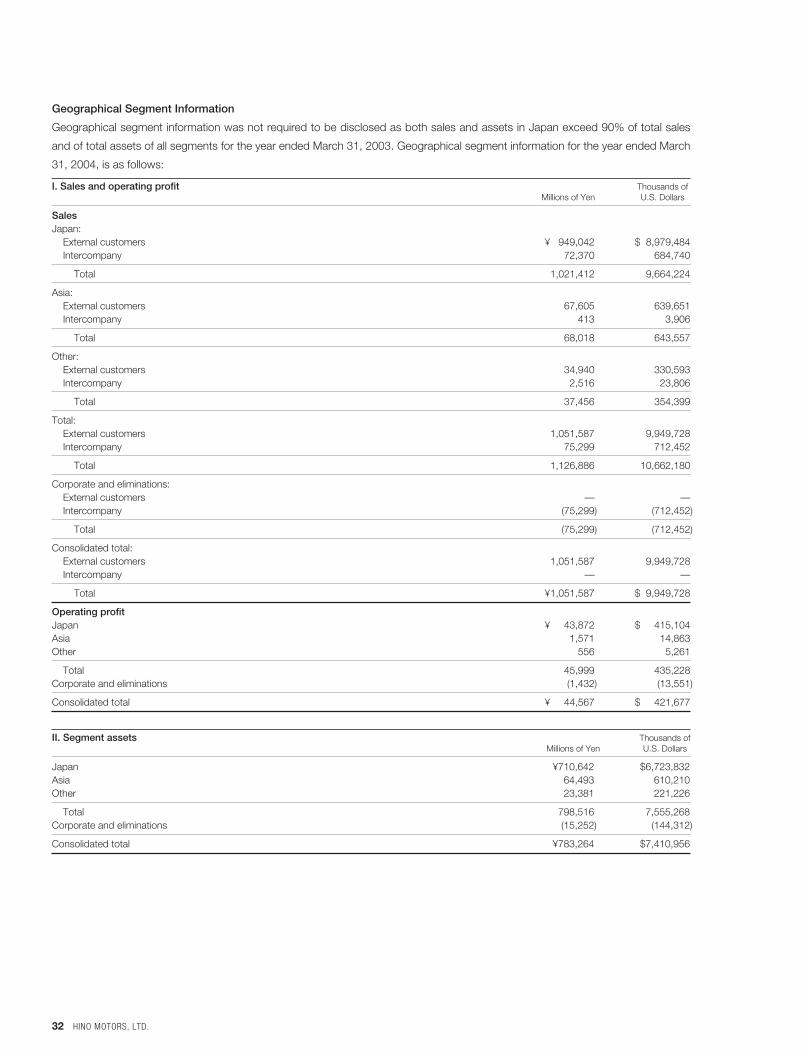
32 HINO MOTORS, LTD.
Geographical Segment Information
Geographical segment information was not required to be disclosed as both sales and assets in Japan exceed 90% of total sales
and of total assets of all segments for the year ended March 31, 2003. Geographical segment information for the year ended March
31, 2004, is as follows:
I. Sales and operating profit Thousands ofMillions of Yen U.S. Dollars
SalesJapan:
External customers ¥0,949,042 $08,979,484Intercompany 72,370 684,740
Total 1,021,412 9,664,224
Asia:External customers 67,605 639,651Intercompany 413 3,906
Total 68,018 643,557
Other:External customers 34,940 330,593Intercompany 2,516 23,806
Total 37,456 354,399
Total:External customers 1,051,587 9,949,728Intercompany 75,299 712,452
Total 1,126,886 10,662,180
Corporate and eliminations:External customers — —Intercompany (75,299) (712,452)
Total (75,299) (712,452)
Consolidated total:External customers 1,051,587 9,949,728Intercompany — —
Total ¥1,051,587 $09,949,728
Operating profitJapan ¥0,043,872 $00,415,104Asia 1,571 14,863Other 556 5,261
Total 45,999 435,228Corporate and eliminations (1,432) (13,551)
Consolidated total ¥0,044,567 $00,421,677
II. Segment assets Thousands ofMillions of Yen U.S. Dollars
Japan ¥710,642 $6,723,832Asia 64,493 610,210Other 23,381 221,226
Total 798,516 7,555,268Corporate and eliminations (15,252) (144,312)
Consolidated total ¥783,264 $7,410,956

HINO MOTORS, LTD. 33
Overseas Sales
Overseas sales, which represent total export sales of the Company and its consolidated subsidiaries in Japan and net sales of con-
solidated subsidiaries outside Japan, for the years ended March 31, 2003 and 2004 were as follows:
Thousands ofMillions of Yen U.S. Dollars
2003 2004 2004
Overseas sales (A) ¥114,186 ¥0,150,342 $1,422,478Consolidated sales (B) 850,318 1,051,587 9,949,728(A)/(B) 13.4% 14.3%
Overseas Sales by Geographic Area
Percentage ofYear ended March 31, 2003 consolidated sales Millions of Yen
Asia 7.7% ¥065,065North America 1.8 15,210Oceania 1.8 15,699Europe 0.5 4,606Other areas 1.6 13,606
Total 13.4% ¥114,186
Percentage of Thousands ofYear ended March 31, 2004 consolidated sales Millions of Yen U.S. Dollars
Asia 8.9% ¥093,982 $0,889,222North America 1.6 17,003 160,872Oceania 2.0 20,476 193,735Europe 0.4 4,562 43,164Other areas 1.4 14,319 135,485
Total 14.3% ¥150,342 $1,422,478
Note: Asia: Thailand, Indonesia, China and others; North America: the United States, Canada and others; Oceania: Australia, New Zealand and others; Europe: Ireland andothers; Other areas: South America, Central America and others
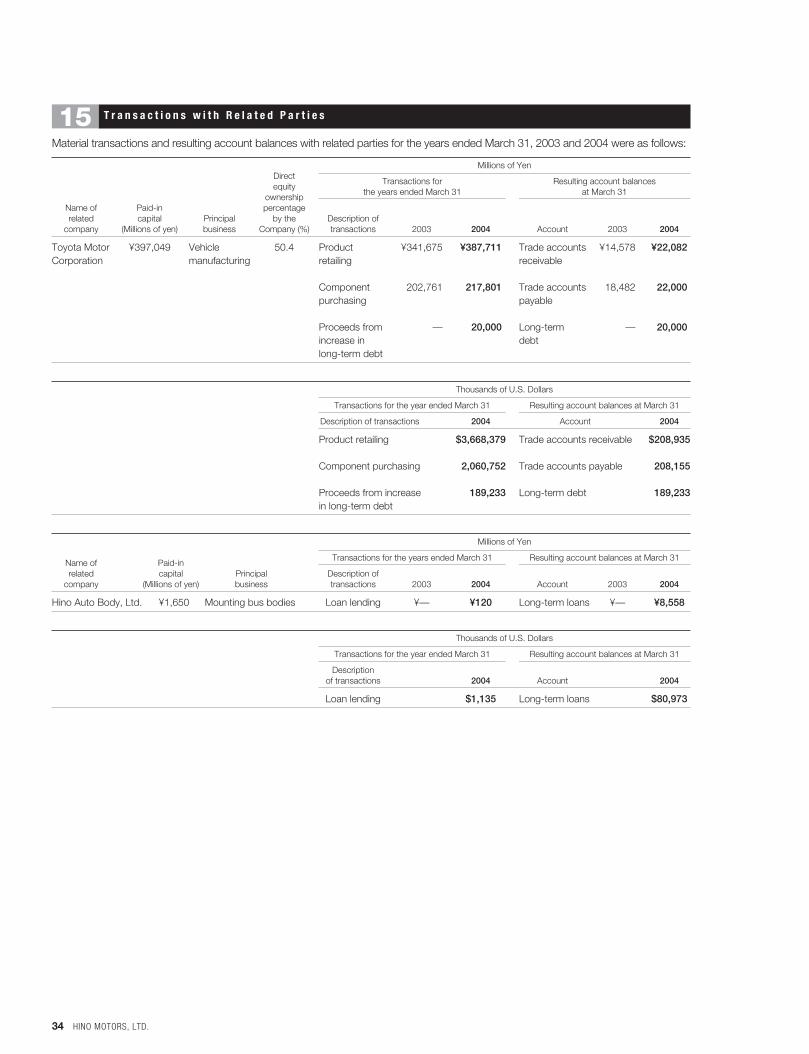
34 HINO MOTORS, LTD.
T r a n s a c t i o n s w i t h R e l a t e d P a r t i e s
Material transactions and resulting account balances with related parties for the years ended March 31, 2003 and 2004 were as follows:
DirectMillions of Yen
equityTransactions for Resulting account balances
ownership the years ended March 31 at March 31
Name of Paid-in percentage related capital Principal by the Description of
company (Millions of yen) business Company (%) transactions 2003 2004 Account 2003 2004
Toyota Motor ¥397,049 Vehicle 50.4 Product ¥341,675 ¥387,711 Trade accounts ¥14,578 ¥22,082Corporation manufacturing retailing receivable
Component 202,761 217,801 Trade accounts 18,482 22,000purchasing payable
Proceeds from — 20,000 Long-term ,— 20,000increase in debtlong-term debt
Thousands of U.S. Dollars
Transactions for the year ended March 31 Resulting account balances at March 31
Description of transactions 2004 Account 2004
Product retailing $3,668,379 Trade accounts receivable $208,935
Component purchasing 2,060,752 Trade accounts payable 208,155
Proceeds from increase 189,233 Long-term debt 189,233in long-term debt
Millions of Yen
Name of Paid-inTransactions for the years ended March 31 Resulting account balances at March 31
related capital Principal Description of company (Millions of yen) business transactions 2003 2004 Account 2003 2004
Hino Auto Body, Ltd. ¥1,650 Mounting bus bodies Loan lending ¥— ¥120 Long-term loans ¥— ¥8,558
Thousands of U.S. Dollars
Transactions for the year ended March 31 Resulting account balances at March 31
Descriptionof transactions 2004 Account 2004
Loan lending $1,135 Long-term loans $80,973
15
Report of Independent Auditors
HINO MOTORS, LTD. 35
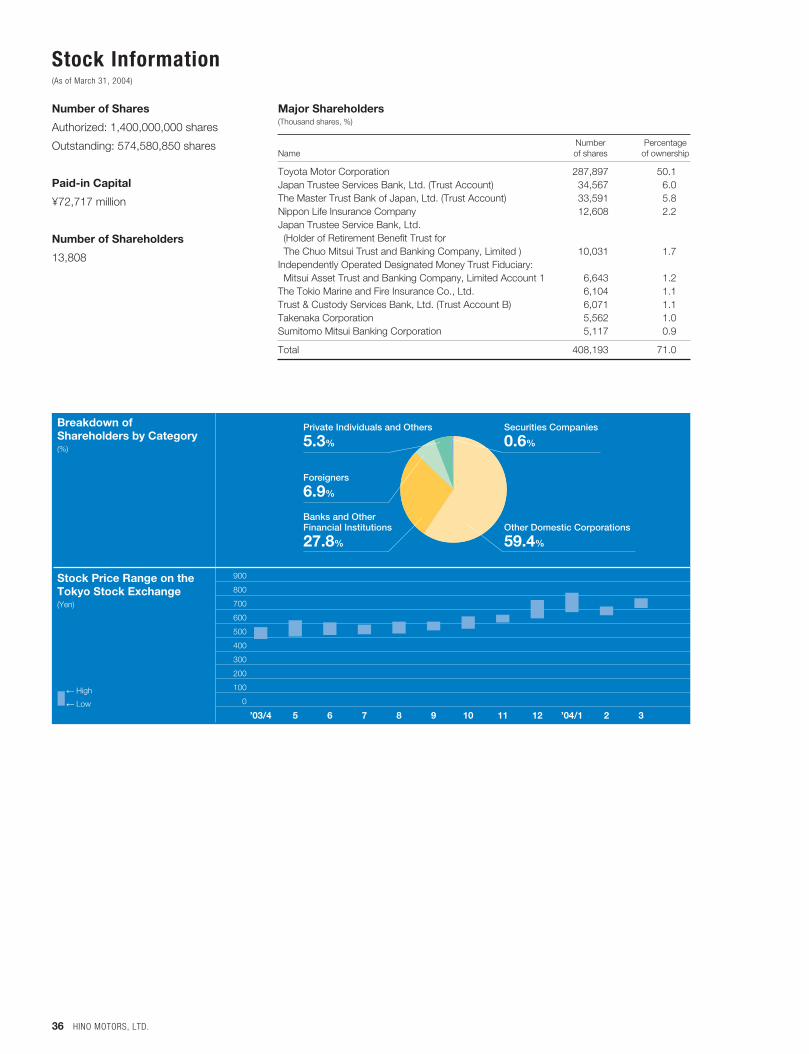
0
100
200
300
400
500
600
700
800
900
Securities Companies
0.6%
Other Domestic Corporations
59.4%
Private Individuals and Others
5.3%
Banks and Other Financial Institutions
27.8%
Foreigners
6.9%
32’04/112111098765’03/4
36 HINO MOTORS, LTD.
Stock Information(As of March 31, 2004)
Number of Shares
Authorized: 1,400,000,000 shares
Outstanding: 574,580,850 shares
Paid-in Capital
¥72,717 million
Number of Shareholders
13,808
Major Shareholders(Thousand shares, %)
Number Percentage Name of shares of ownership
Toyota Motor Corporation 287,897 50.1Japan Trustee Services Bank, Ltd. (Trust Account) 34,567 6.0The Master Trust Bank of Japan, Ltd. (Trust Account) 33,591 5.8Nippon Life Insurance Company 12,608 2.2Japan Trustee Service Bank, Ltd. (Holder of Retirement Benefit Trust for The Chuo Mitsui Trust and Banking Company, Limited ) 10,031 1.7
Independently Operated Designated Money Trust Fiduciary: Mitsui Asset Trust and Banking Company, Limited Account 1 6,643 1.2
The Tokio Marine and Fire Insurance Co., Ltd. 6,104 1.1Trust & Custody Services Bank, Ltd. (Trust Account B) 6,071 1.1Takenaka Corporation 5,562 1.0Sumitomo Mitsui Banking Corporation 5,117 0.9
Total 408,193 71.0
Stock Price Range on theTokyo Stock Exchange (Yen)
Breakdown of Shareholders by Category(%)
� High�� Low High
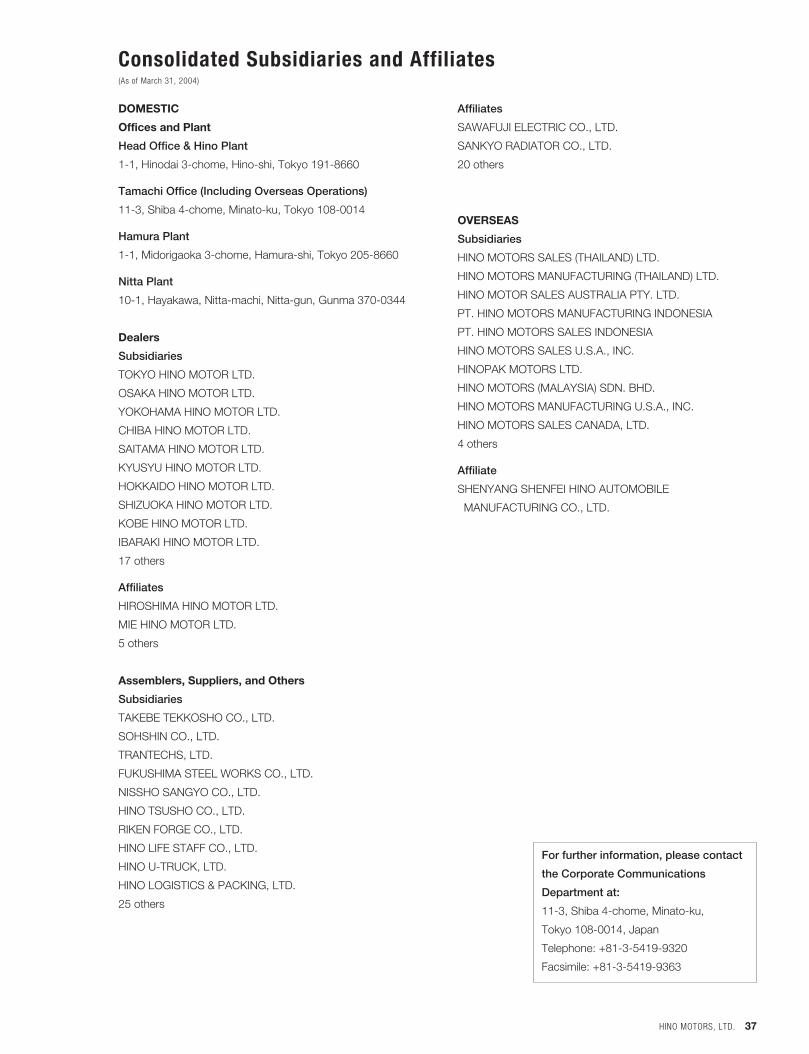
Consolidated Subsidiaries and Affiliates(As of March 31, 2004)
HINO MOTORS, LTD. 37
DOMESTIC
Offices and Plant
Head Office & Hino Plant
1-1, Hinodai 3-chome, Hino-shi, Tokyo 191-8660
Tamachi Office (Including Overseas Operations)
11-3, Shiba 4-chome, Minato-ku, Tokyo 108-0014
Hamura Plant
1-1, Midorigaoka 3-chome, Hamura-shi, Tokyo 205-8660
Nitta Plant
10-1, Hayakawa, Nitta-machi, Nitta-gun, Gunma 370-0344
Dealers
Subsidiaries
TOKYO HINO MOTOR LTD.
OSAKA HINO MOTOR LTD.
YOKOHAMA HINO MOTOR LTD.
CHIBA HINO MOTOR LTD.
SAITAMA HINO MOTOR LTD.
KYUSYU HINO MOTOR LTD.
HOKKAIDO HINO MOTOR LTD.
SHIZUOKA HINO MOTOR LTD.
KOBE HINO MOTOR LTD.
IBARAKI HINO MOTOR LTD.
17 others
Affiliates
HIROSHIMA HINO MOTOR LTD.
MIE HINO MOTOR LTD.
5 others
Assemblers, Suppliers, and Others
Subsidiaries
TAKEBE TEKKOSHO CO., LTD.
SOHSHIN CO., LTD.
TRANTECHS, LTD.
FUKUSHIMA STEEL WORKS CO., LTD.
NISSHO SANGYO CO., LTD.
HINO TSUSHO CO., LTD.
RIKEN FORGE CO., LTD.
HINO LIFE STAFF CO., LTD.
HINO U-TRUCK, LTD.
HINO LOGISTICS & PACKING, LTD.
25 others
Affiliates
SAWAFUJI ELECTRIC CO., LTD.
SANKYO RADIATOR CO., LTD.
20 others
OVERSEAS
Subsidiaries
HINO MOTORS SALES (THAILAND) LTD.
HINO MOTORS MANUFACTURING (THAILAND) LTD.
HINO MOTOR SALES AUSTRALIA PTY. LTD.
PT. HINO MOTORS MANUFACTURING INDONESIA
PT. HINO MOTORS SALES INDONESIA
HINO MOTORS SALES U.S.A., INC.
HINOPAK MOTORS LTD.
HINO MOTORS (MALAYSIA) SDN. BHD.
HINO MOTORS MANUFACTURING U.S.A., INC.
HINO MOTORS SALES CANADA, LTD.
4 others
Affiliate
SHENYANG SHENFEI HINO AUTOMOBILE
MANUFACTURING CO., LTD.
For further information, please contact
the Corporate Communications
Department at:
11-3, Shiba 4-chome, Minato-ku,
Tokyo 108-0014, Japan
Telephone: +81-3-5419-9320
Facsimile: +81-3-5419-9363

1-1, Hinodai 3-chome, Hino-shi, Tokyo 191-8660, Japanhttp//:www.hino.co.jp/
Printed in Japan
This annual report is printed on recycled paper using soy-based ink.